Billington Heights, NY Map & Demographics
Billington Heights Map
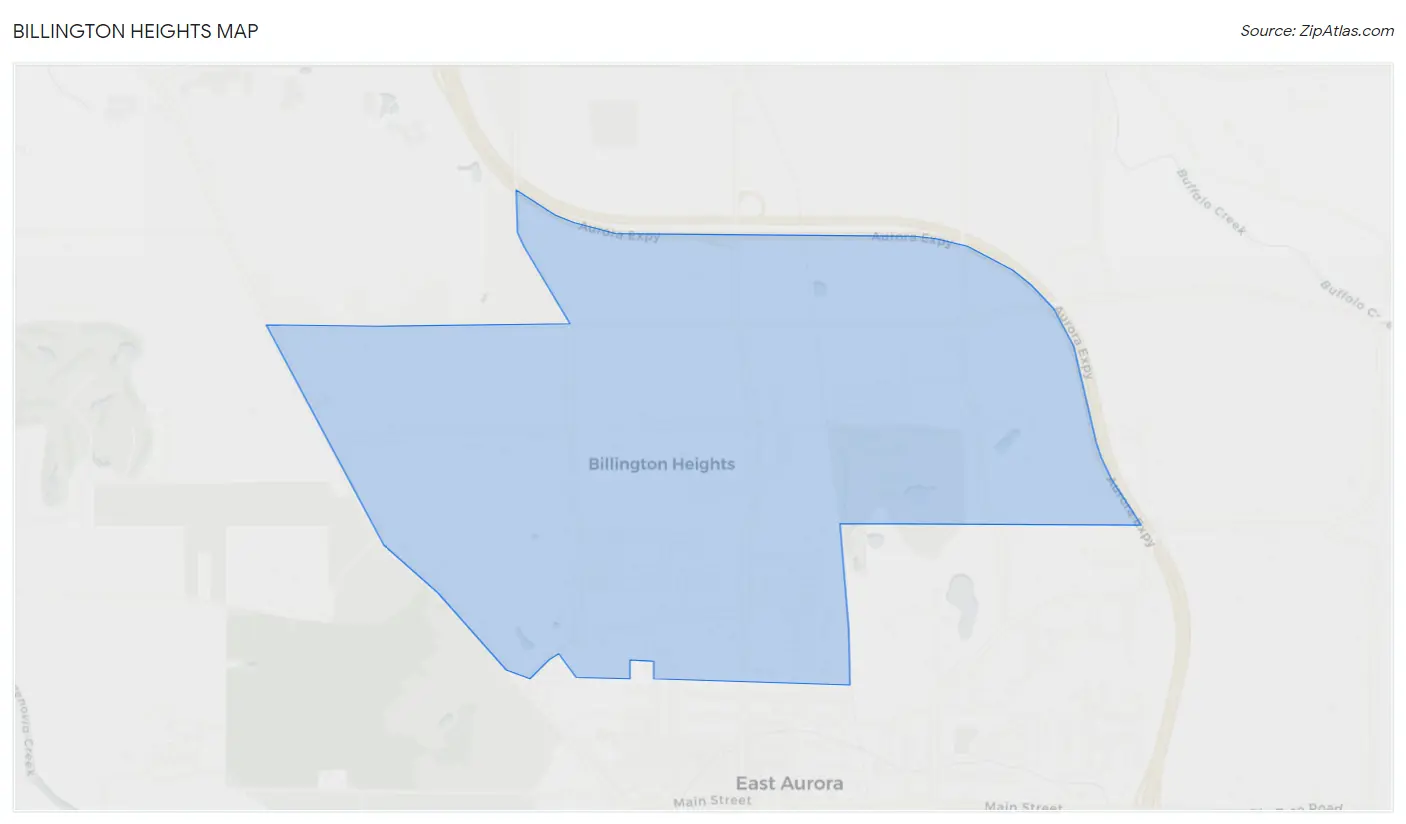
Billington Heights Overview
$55,235
PER CAPITA INCOME
$140,125
AVG FAMILY INCOME
$76,750
AVG HOUSEHOLD INCOME
0.49
INEQUALITY / GINI INDEX
1,965
TOTAL POPULATION
837
MALE POPULATION
1,128
FEMALE POPULATION
74.20
MALES / 100 FEMALES
134.77
FEMALES / 100 MALES
56.6
MEDIAN AGE
3.1
AVG FAMILY SIZE
2.2
AVG HOUSEHOLD SIZE
1,056
LABOR FORCE [ PEOPLE ]
63.3%
PERCENT IN LABOR FORCE
11.3%
UNEMPLOYMENT RATE
Income in Billington Heights
Income Overview in Billington Heights
Per Capita Income in Billington Heights is $55,235, while median incomes of families and households are $140,125 and $76,750 respectively.
| Characteristic | Number | Measure |
| Per Capita Income | 1,965 | $55,235 |
| Median Family Income | 456 | $140,125 |
| Mean Family Income | 456 | $163,533 |
| Median Household Income | 892 | $76,750 |
| Mean Household Income | 892 | $120,822 |
| Income Deficit | 456 | $0 |
| Wage / Income Gap (%) | 1,965 | 0.00% |
| Wage / Income Gap ($) | 1,965 | 100.00¢ per $1 |
| Gini / Inequality Index | 1,965 | 0.49 |
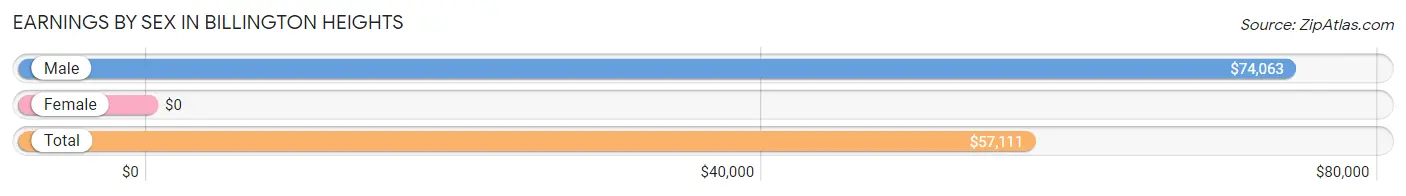
Earnings by Sex in Billington Heights
| Sex | Number | Average Earnings |
| Male | 636 (57.3%) | $74,063 |
| Female | 475 (42.7%) | $0 |
| Total | 1,111 (100.0%) | $57,111 |
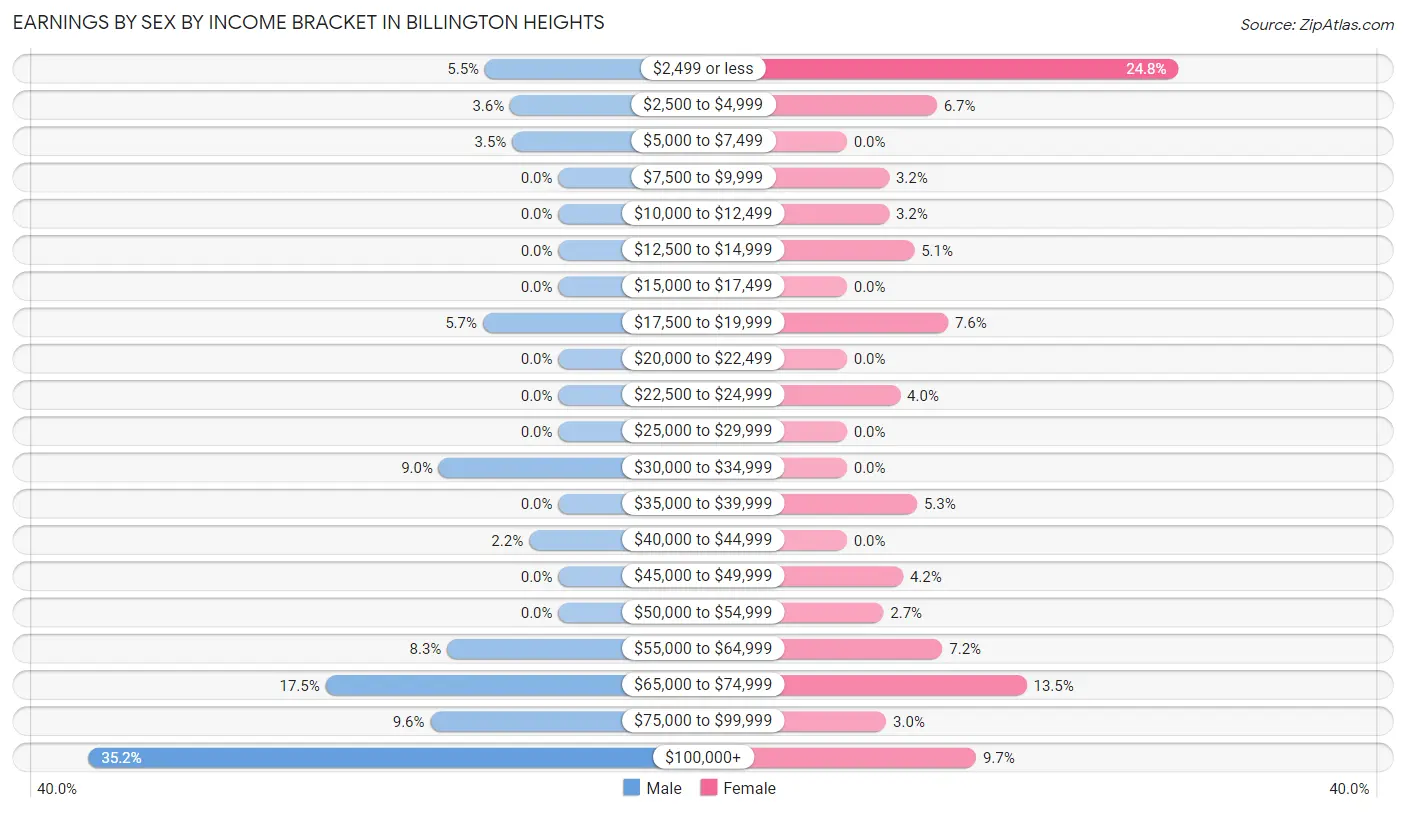
Earnings by Sex by Income Bracket in Billington Heights
The most common earnings brackets in Billington Heights are $100,000+ for men (224 | 35.2%) and $2,499 or less for women (118 | 24.8%).
| Income | Male | Female |
| $2,499 or less | 35 (5.5%) | 118 (24.8%) |
| $2,500 to $4,999 | 23 (3.6%) | 32 (6.7%) |
| $5,000 to $7,499 | 22 (3.5%) | 0 (0.0%) |
| $7,500 to $9,999 | 0 (0.0%) | 15 (3.2%) |
| $10,000 to $12,499 | 0 (0.0%) | 15 (3.2%) |
| $12,500 to $14,999 | 0 (0.0%) | 24 (5.1%) |
| $15,000 to $17,499 | 0 (0.0%) | 0 (0.0%) |
| $17,500 to $19,999 | 36 (5.7%) | 36 (7.6%) |
| $20,000 to $22,499 | 0 (0.0%) | 0 (0.0%) |
| $22,500 to $24,999 | 0 (0.0%) | 19 (4.0%) |
| $25,000 to $29,999 | 0 (0.0%) | 0 (0.0%) |
| $30,000 to $34,999 | 57 (9.0%) | 0 (0.0%) |
| $35,000 to $39,999 | 0 (0.0%) | 25 (5.3%) |
| $40,000 to $44,999 | 14 (2.2%) | 0 (0.0%) |
| $45,000 to $49,999 | 0 (0.0%) | 20 (4.2%) |
| $50,000 to $54,999 | 0 (0.0%) | 13 (2.7%) |
| $55,000 to $64,999 | 53 (8.3%) | 34 (7.2%) |
| $65,000 to $74,999 | 111 (17.4%) | 64 (13.5%) |
| $75,000 to $99,999 | 61 (9.6%) | 14 (2.9%) |
| $100,000+ | 224 (35.2%) | 46 (9.7%) |
| Total | 636 (100.0%) | 475 (100.0%) |
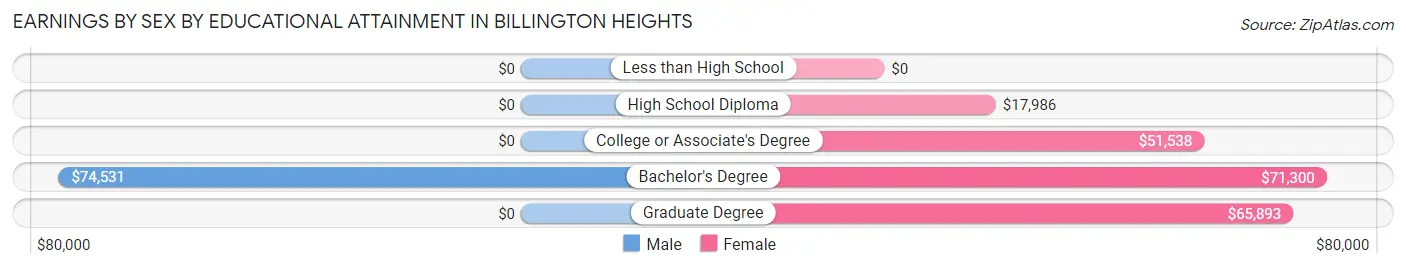
Earnings by Sex by Educational Attainment in Billington Heights
Average earnings in Billington Heights are $74,730 for men and $50,481 for women, a difference of 32.5%. Men with an educational attainment of bachelor's degree enjoy the highest average annual earnings of $74,531, while those with bachelor's degree education earn the least with $74,531. Women with an educational attainment of bachelor's degree earn the most with the average annual earnings of $71,300, while those with high school diploma education have the smallest earnings of $17,986.
| Educational Attainment | Male Income | Female Income |
| Less than High School | - | - |
| High School Diploma | - | - |
| College or Associate's Degree | - | - |
| Bachelor's Degree | $74,531 | $71,300 |
| Graduate Degree | - | - |
| Total | $74,730 | $50,481 |
Family Income in Billington Heights
Family Income Brackets in Billington Heights
According to the Billington Heights family income data, there are 185 families falling into the $200,000+ income range, which is the most common income bracket and makes up 40.6% of all families.
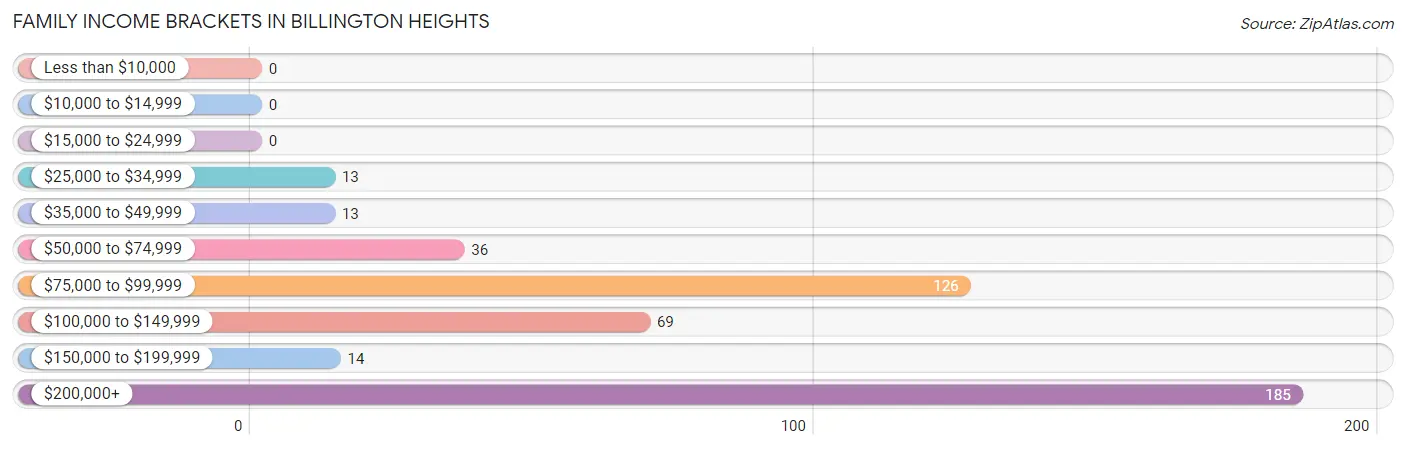
| Income Bracket | # Families | % Families |
| Less than $10,000 | 0 | 0.0% |
| $10,000 to $14,999 | 0 | 0.0% |
| $15,000 to $24,999 | 0 | 0.0% |
| $25,000 to $34,999 | 13 | 2.9% |
| $35,000 to $49,999 | 13 | 2.9% |
| $50,000 to $74,999 | 36 | 7.9% |
| $75,000 to $99,999 | 126 | 27.6% |
| $100,000 to $149,999 | 69 | 15.1% |
| $150,000 to $199,999 | 14 | 3.1% |
| $200,000+ | 185 | 40.6% |
Family Income by Famaliy Size in Billington Heights
5-person families (51 | 11.2%) account for the highest median family income in Billington Heights with $250,001 per family, while 5-person families (51 | 11.2%) have the highest median income of $50,000 per family member.
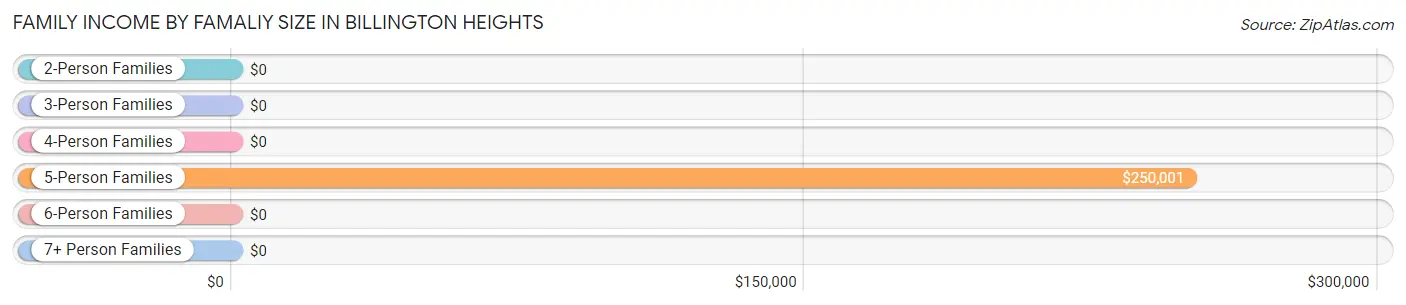
| Income Bracket | # Families | Median Income |
| 2-Person Families | 188 (41.2%) | $0 |
| 3-Person Families | 162 (35.5%) | $0 |
| 4-Person Families | 32 (7.0%) | $0 |
| 5-Person Families | 51 (11.2%) | $250,001 |
| 6-Person Families | 0 (0.0%) | $0 |
| 7+ Person Families | 23 (5.0%) | $0 |
| Total | 456 (100.0%) | $140,125 |
Family Income by Number of Earners in Billington Heights
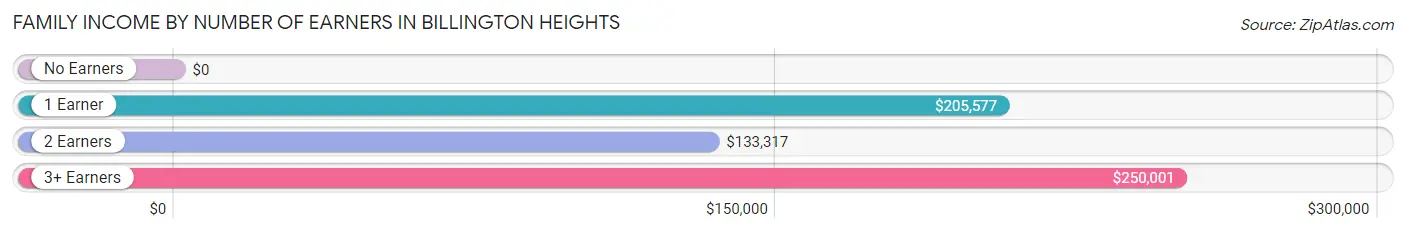
| Number of Earners | # Families | Median Income |
| No Earners | 52 (11.4%) | $0 |
| 1 Earner | 76 (16.7%) | $205,577 |
| 2 Earners | 265 (58.1%) | $133,317 |
| 3+ Earners | 63 (13.8%) | $250,001 |
| Total | 456 (100.0%) | $140,125 |
Household Income in Billington Heights
Household Income Brackets in Billington Heights
With 192 households falling in the category, the $200,000+ income range is the most frequent in Billington Heights, accounting for 21.5% of all households. In contrast, only 9 households (1.0%) fall into the $15,000 to $24,999 income bracket, making it the least populous group.
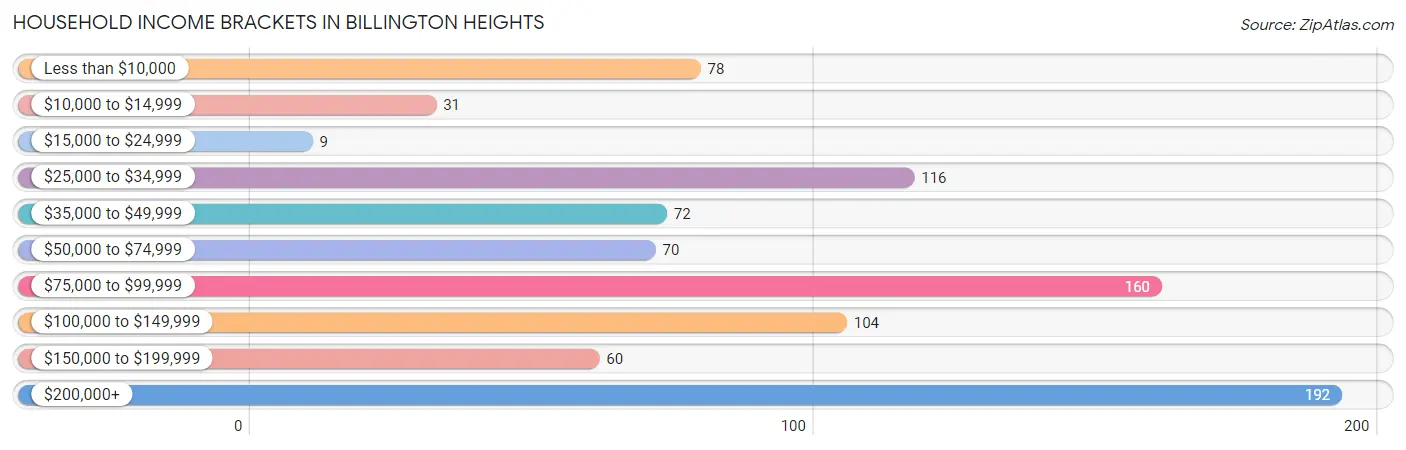
| Income Bracket | # Households | % Households |
| Less than $10,000 | 78 | 8.7% |
| $10,000 to $14,999 | 31 | 3.5% |
| $15,000 to $24,999 | 9 | 1.0% |
| $25,000 to $34,999 | 116 | 13.0% |
| $35,000 to $49,999 | 72 | 8.1% |
| $50,000 to $74,999 | 70 | 7.8% |
| $75,000 to $99,999 | 160 | 17.9% |
| $100,000 to $149,999 | 104 | 11.7% |
| $150,000 to $199,999 | 60 | 6.7% |
| $200,000+ | 192 | 21.5% |
Household Income by Householder Age in Billington Heights
The median household income in Billington Heights is $76,750, with the highest median household income of $137,500 found in the 25 to 44 years age bracket for the primary householder. A total of 136 households (15.2%) fall into this category.
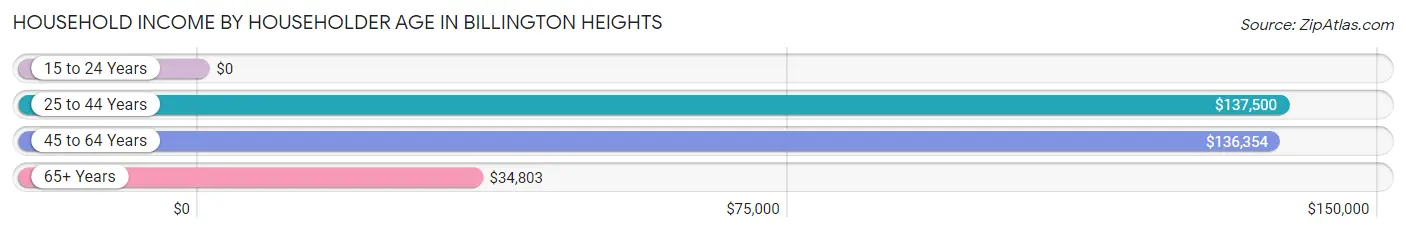
| Income Bracket | # Households | Median Income |
| 15 to 24 Years | 0 (0.0%) | $0 |
| 25 to 44 Years | 136 (15.2%) | $137,500 |
| 45 to 64 Years | 315 (35.3%) | $136,354 |
| 65+ Years | 441 (49.4%) | $34,803 |
| Total | 892 (100.0%) | $76,750 |
Poverty in Billington Heights
Income Below Poverty by Sex and Age in Billington Heights
With 1.7% poverty level for males and 8.6% for females among the residents of Billington Heights, 75 year old and over males and 75 year old and over females are the most vulnerable to poverty, with 13 males (17.6%) and 65 females (42.5%) in their respective age groups living below the poverty level.
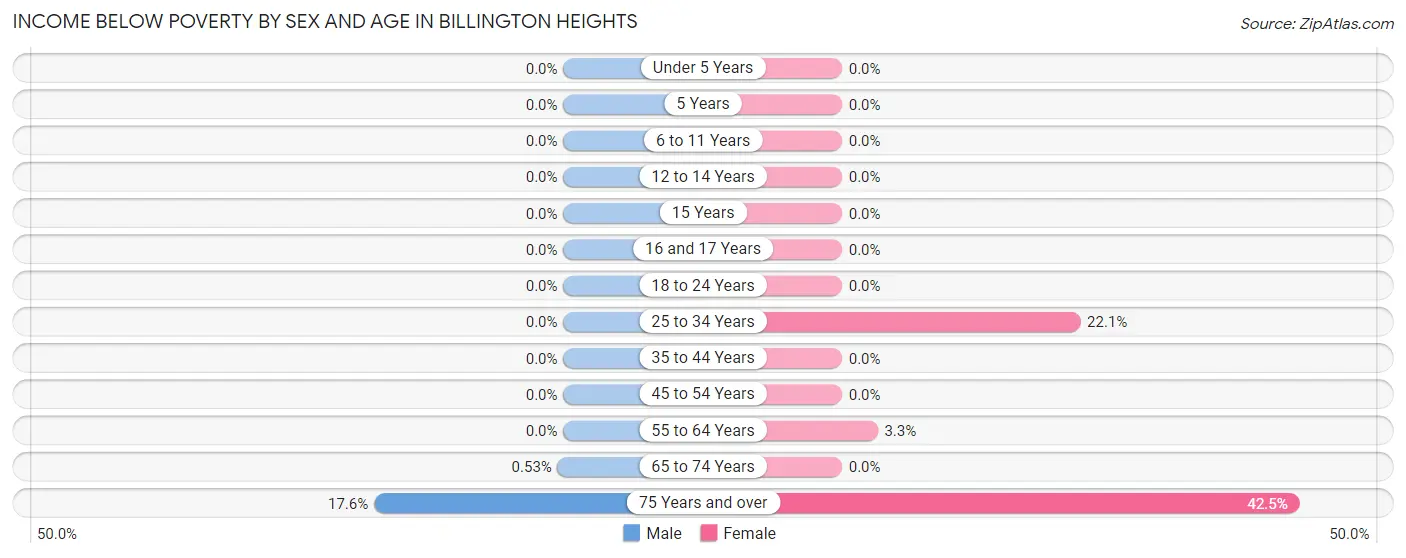
| Age Bracket | Male | Female |
| Under 5 Years | 0 (0.0%) | 0 (0.0%) |
| 5 Years | 0 (0.0%) | 0 (0.0%) |
| 6 to 11 Years | 0 (0.0%) | 0 (0.0%) |
| 12 to 14 Years | 0 (0.0%) | 0 (0.0%) |
| 15 Years | 0 (0.0%) | 0 (0.0%) |
| 16 and 17 Years | 0 (0.0%) | 0 (0.0%) |
| 18 to 24 Years | 0 (0.0%) | 0 (0.0%) |
| 25 to 34 Years | 0 (0.0%) | 23 (22.1%) |
| 35 to 44 Years | 0 (0.0%) | 0 (0.0%) |
| 45 to 54 Years | 0 (0.0%) | 0 (0.0%) |
| 55 to 64 Years | 0 (0.0%) | 9 (3.3%) |
| 65 to 74 Years | 1 (0.5%) | 0 (0.0%) |
| 75 Years and over | 13 (17.6%) | 65 (42.5%) |
| Total | 14 (1.7%) | 97 (8.6%) |
Income Above Poverty by Sex and Age in Billington Heights
According to the poverty statistics in Billington Heights, males aged under 5 years and females aged under 5 years are the age groups that are most secure financially, with 100.0% of males and 100.0% of females in these age groups living above the poverty line.
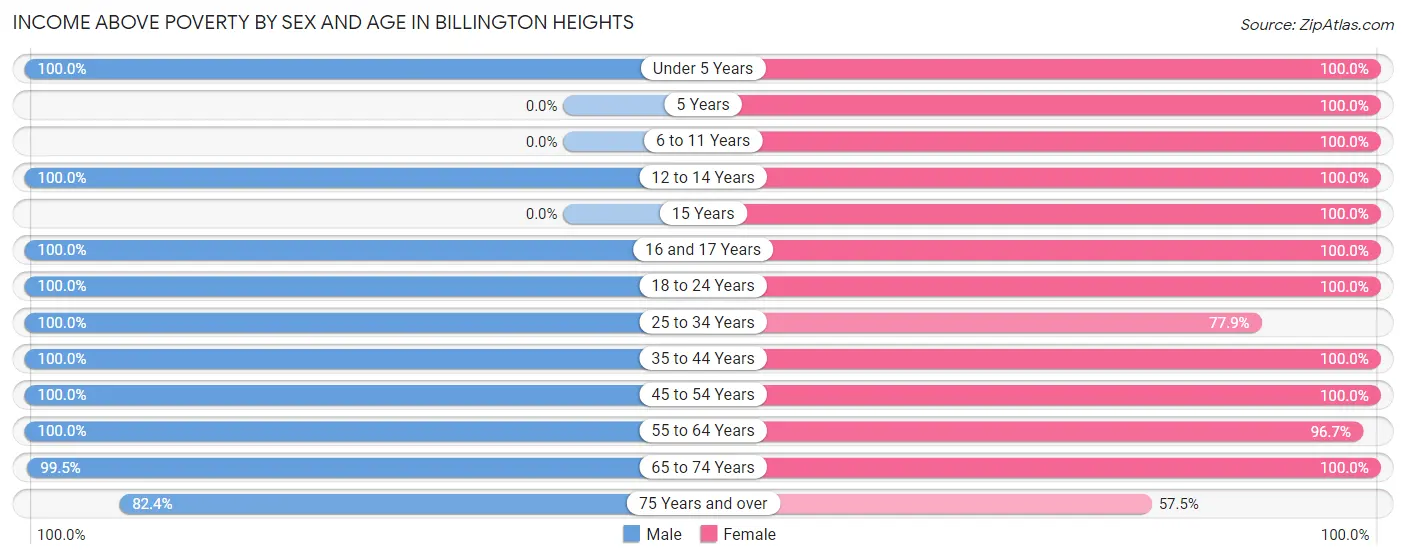
| Age Bracket | Male | Female |
| Under 5 Years | 10 (100.0%) | 46 (100.0%) |
| 5 Years | 0 (0.0%) | 18 (100.0%) |
| 6 to 11 Years | 0 (0.0%) | 98 (100.0%) |
| 12 to 14 Years | 42 (100.0%) | 73 (100.0%) |
| 15 Years | 0 (0.0%) | 9 (100.0%) |
| 16 and 17 Years | 38 (100.0%) | 24 (100.0%) |
| 18 to 24 Years | 9 (100.0%) | 114 (100.0%) |
| 25 to 34 Years | 66 (100.0%) | 81 (77.9%) |
| 35 to 44 Years | 73 (100.0%) | 57 (100.0%) |
| 45 to 54 Years | 98 (100.0%) | 26 (100.0%) |
| 55 to 64 Years | 238 (100.0%) | 263 (96.7%) |
| 65 to 74 Years | 188 (99.5%) | 134 (100.0%) |
| 75 Years and over | 61 (82.4%) | 88 (57.5%) |
| Total | 823 (98.3%) | 1,031 (91.4%) |
Income Below Poverty Among Married-Couple Families in Billington Heights
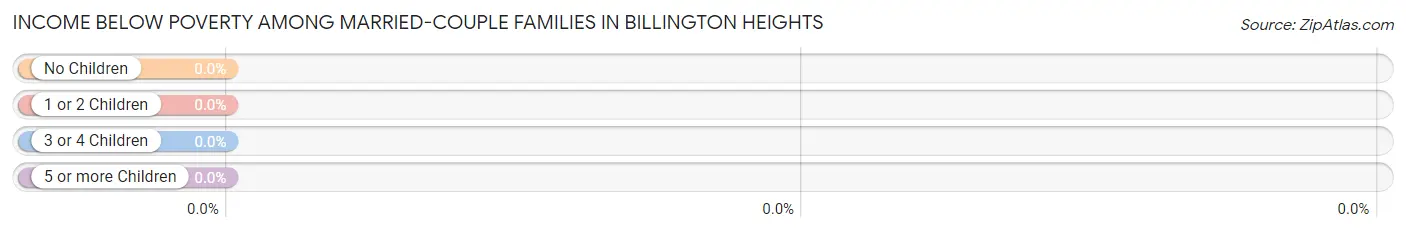
| Children | Above Poverty | Below Poverty |
| No Children | 278 (100.0%) | 0 (0.0%) |
| 1 or 2 Children | 71 (100.0%) | 0 (0.0%) |
| 3 or 4 Children | 14 (100.0%) | 0 (0.0%) |
| 5 or more Children | 23 (100.0%) | 0 (0.0%) |
| Total | 386 (100.0%) | 0 (0.0%) |
Income Below Poverty Among Single-Parent Households in Billington Heights
| Children | Single Father | Single Mother |
| No Children | 0 (0.0%) | 0 (0.0%) |
| 1 or 2 Children | 0 (0.0%) | 0 (0.0%) |
| 3 or 4 Children | 0 (0.0%) | 0 (0.0%) |
| 5 or more Children | 0 (0.0%) | 0 (0.0%) |
| Total | 0 (0.0%) | 0 (0.0%) |
Income Below Poverty Among Married-Couple vs Single-Parent Households in Billington Heights
| Children | Married-Couple Families | Single-Parent Households |
| No Children | 0 (0.0%) | 0 (0.0%) |
| 1 or 2 Children | 0 (0.0%) | 0 (0.0%) |
| 3 or 4 Children | 0 (0.0%) | 0 (0.0%) |
| 5 or more Children | 0 (0.0%) | 0 (0.0%) |
| Total | 0 (0.0%) | 0 (0.0%) |
Race in Billington Heights
The most populous races in Billington Heights are White / Caucasian (1,859 | 94.6%), Two or more Races (92 | 4.7%), and Black / African American (14 | 0.7%).
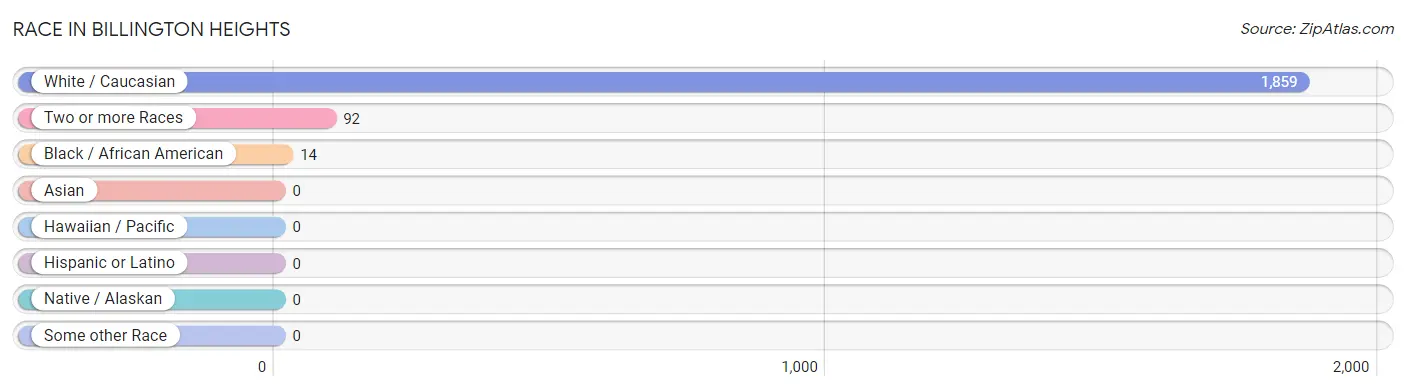
| Race | # Population | % Population |
| Asian | 0 | 0.0% |
| Black / African American | 14 | 0.7% |
| Hawaiian / Pacific | 0 | 0.0% |
| Hispanic or Latino | 0 | 0.0% |
| Native / Alaskan | 0 | 0.0% |
| White / Caucasian | 1,859 | 94.6% |
| Two or more Races | 92 | 4.7% |
| Some other Race | 0 | 0.0% |
| Total | 1,965 | 100.0% |
Ancestry in Billington Heights
The most populous ancestries reported in Billington Heights are German (731 | 37.2%), Irish (716 | 36.4%), English (461 | 23.5%), Polish (376 | 19.1%), and Italian (309 | 15.7%), together accounting for 132.0% of all Billington Heights residents.
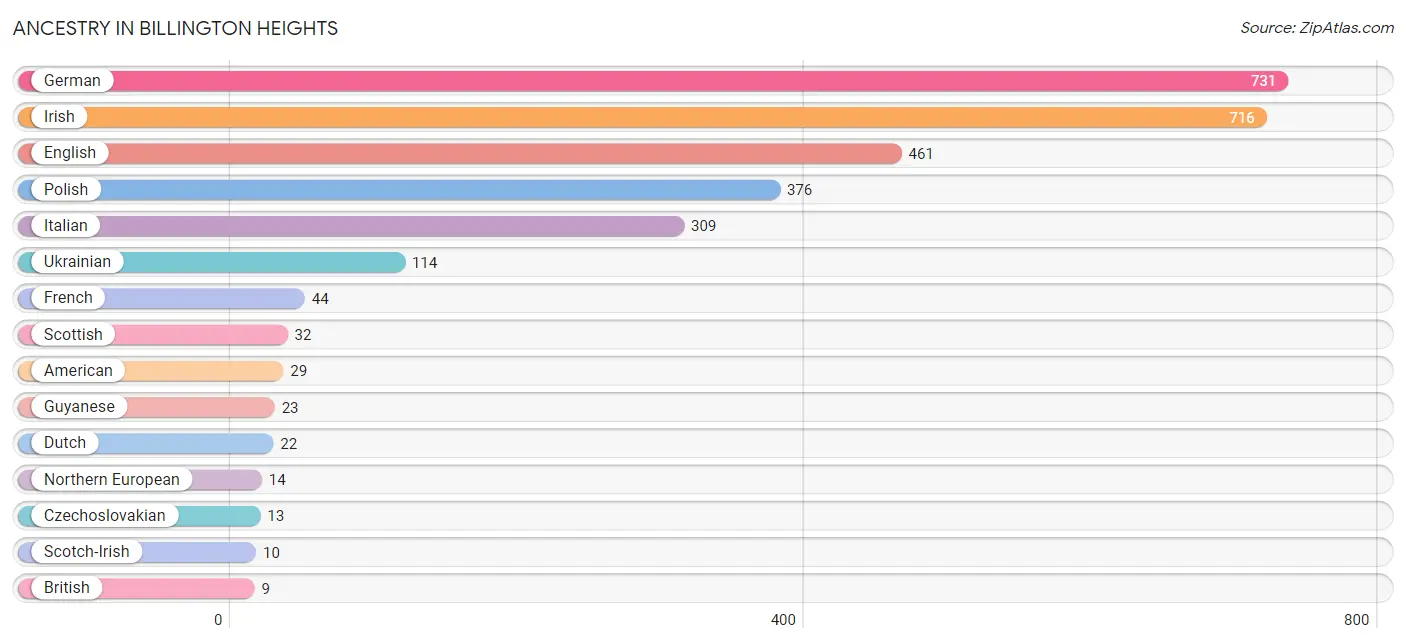
| Ancestry | # Population | % Population |
| American | 29 | 1.5% |
| Austrian | 2 | 0.1% |
| British | 9 | 0.5% |
| Czechoslovakian | 13 | 0.7% |
| Dutch | 22 | 1.1% |
| English | 461 | 23.5% |
| French | 44 | 2.2% |
| German | 731 | 37.2% |
| Guyanese | 23 | 1.2% |
| Irish | 716 | 36.4% |
| Italian | 309 | 15.7% |
| Northern European | 14 | 0.7% |
| Norwegian | 2 | 0.1% |
| Polish | 376 | 19.1% |
| Romanian | 8 | 0.4% |
| Scotch-Irish | 10 | 0.5% |
| Scottish | 32 | 1.6% |
| Ukrainian | 114 | 5.8% | View All 18 Rows |
Immigrants in Billington Heights
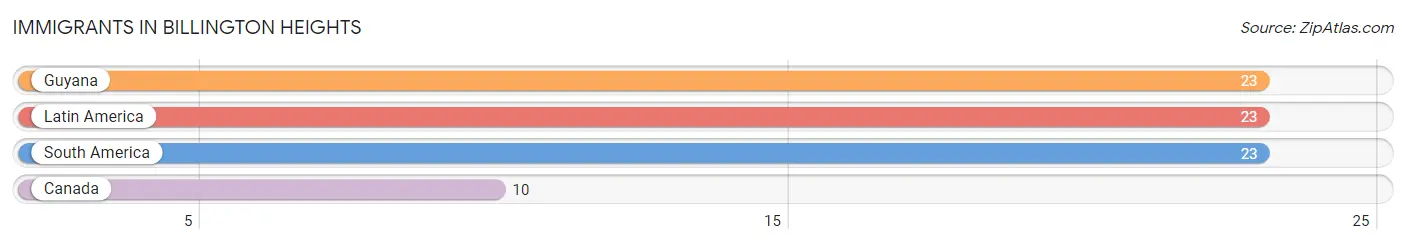
The most numerous immigrant groups reported in Billington Heights came from Guyana (23 | 1.2%), Latin America (23 | 1.2%), South America (23 | 1.2%), and Canada (10 | 0.5%), together accounting for 4.0% of all Billington Heights residents.
| Immigration Origin | # Population | % Population |
| Canada | 10 | 0.5% |
| Guyana | 23 | 1.2% |
| Latin America | 23 | 1.2% |
| South America | 23 | 1.2% | View All 4 Rows |
Sex and Age in Billington Heights
Sex and Age in Billington Heights
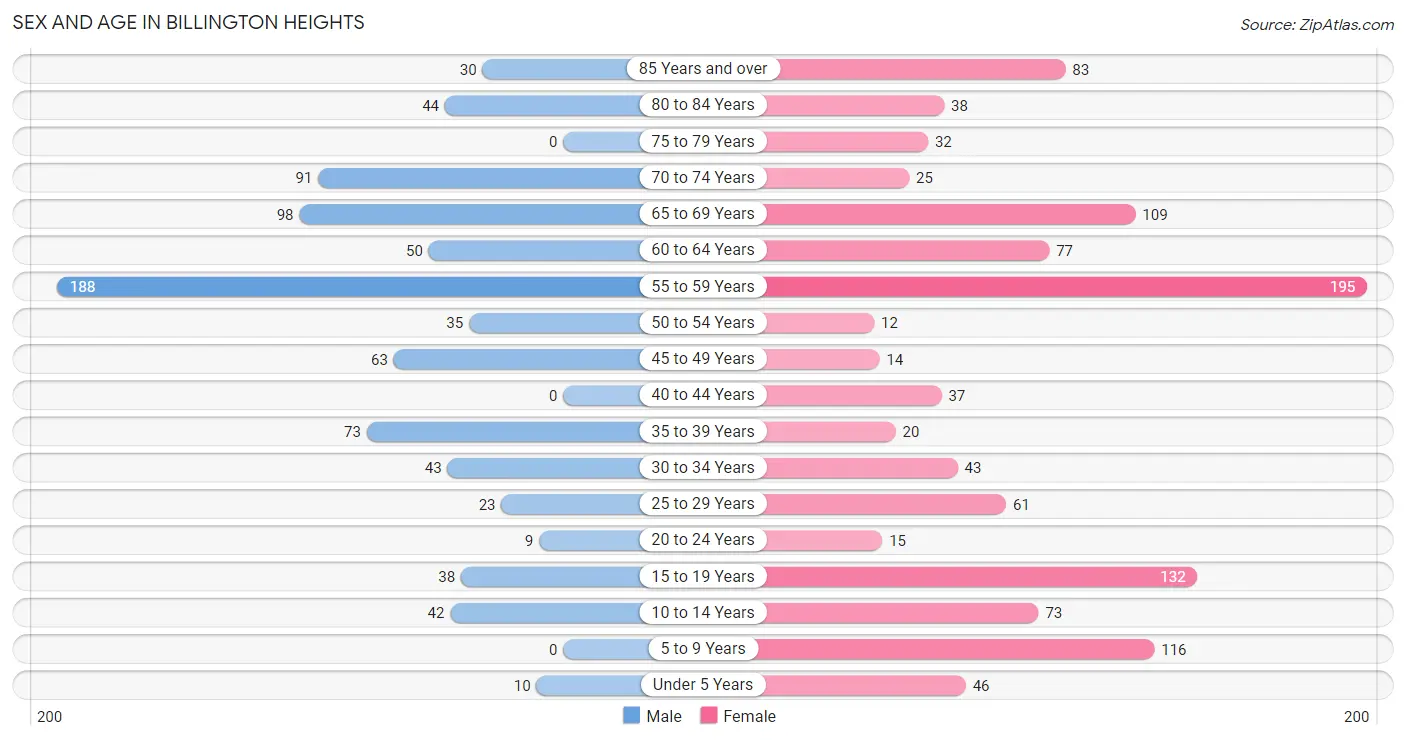
The most populous age groups in Billington Heights are 55 to 59 Years (188 | 22.5%) for men and 55 to 59 Years (195 | 17.3%) for women.
| Age Bracket | Male | Female |
| Under 5 Years | 10 (1.2%) | 46 (4.1%) |
| 5 to 9 Years | 0 (0.0%) | 116 (10.3%) |
| 10 to 14 Years | 42 (5.0%) | 73 (6.5%) |
| 15 to 19 Years | 38 (4.5%) | 132 (11.7%) |
| 20 to 24 Years | 9 (1.1%) | 15 (1.3%) |
| 25 to 29 Years | 23 (2.8%) | 61 (5.4%) |
| 30 to 34 Years | 43 (5.1%) | 43 (3.8%) |
| 35 to 39 Years | 73 (8.7%) | 20 (1.8%) |
| 40 to 44 Years | 0 (0.0%) | 37 (3.3%) |
| 45 to 49 Years | 63 (7.5%) | 14 (1.2%) |
| 50 to 54 Years | 35 (4.2%) | 12 (1.1%) |
| 55 to 59 Years | 188 (22.5%) | 195 (17.3%) |
| 60 to 64 Years | 50 (6.0%) | 77 (6.8%) |
| 65 to 69 Years | 98 (11.7%) | 109 (9.7%) |
| 70 to 74 Years | 91 (10.9%) | 25 (2.2%) |
| 75 to 79 Years | 0 (0.0%) | 32 (2.8%) |
| 80 to 84 Years | 44 (5.3%) | 38 (3.4%) |
| 85 Years and over | 30 (3.6%) | 83 (7.4%) |
| Total | 837 (100.0%) | 1,128 (100.0%) |
Families and Households in Billington Heights
Median Family Size in Billington Heights
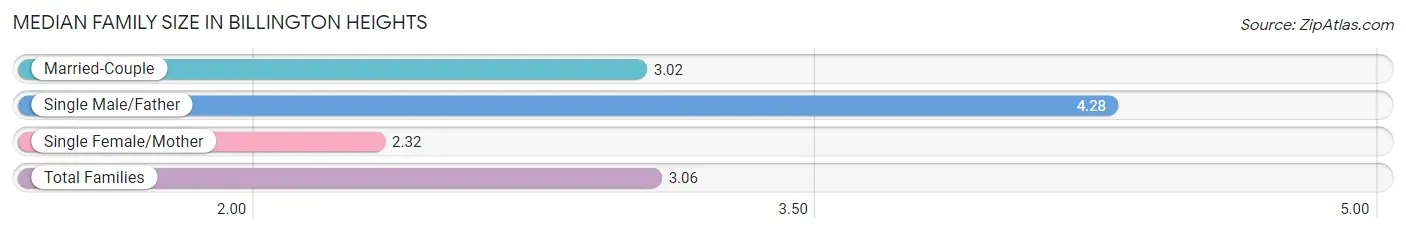
The median family size in Billington Heights is 3.06 persons per family, with single male/father families (36 | 7.9%) accounting for the largest median family size of 4.28 persons per family. On the other hand, single female/mother families (34 | 7.5%) represent the smallest median family size with 2.32 persons per family.
| Family Type | # Families | Family Size |
| Married-Couple | 386 (84.7%) | 3.02 |
| Single Male/Father | 36 (7.9%) | 4.28 |
| Single Female/Mother | 34 (7.5%) | 2.32 |
| Total Families | 456 (100.0%) | 3.06 |
Median Household Size in Billington Heights
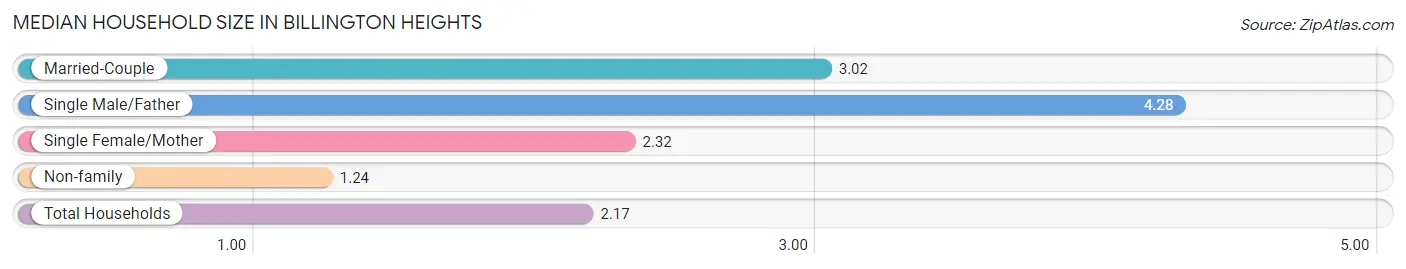
The median household size in Billington Heights is 2.17 persons per household, with single male/father households (36 | 4.0%) accounting for the largest median household size of 4.28 persons per household. non-family households (436 | 48.9%) represent the smallest median household size with 1.24 persons per household.
| Household Type | # Households | Household Size |
| Married-Couple | 386 (43.3%) | 3.02 |
| Single Male/Father | 36 (4.0%) | 4.28 |
| Single Female/Mother | 34 (3.8%) | 2.32 |
| Non-family | 436 (48.9%) | 1.24 |
| Total Households | 892 (100.0%) | 2.17 |
Household Size by Marriage Status in Billington Heights
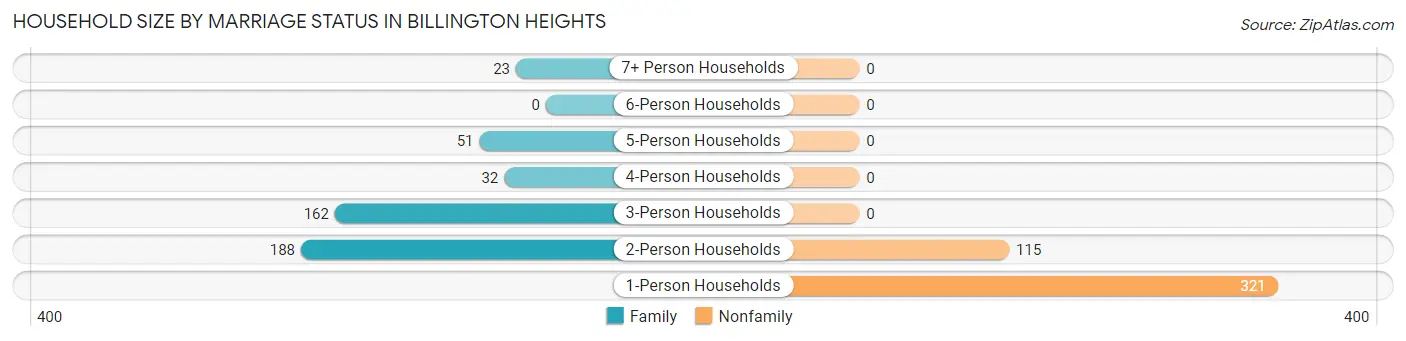
Out of a total of 892 households in Billington Heights, 456 (51.1%) are family households, while 436 (48.9%) are nonfamily households. The most numerous type of family households are 2-person households, comprising 188, and the most common type of nonfamily households are 1-person households, comprising 321.
| Household Size | Family Households | Nonfamily Households |
| 1-Person Households | - | 321 (36.0%) |
| 2-Person Households | 188 (21.1%) | 115 (12.9%) |
| 3-Person Households | 162 (18.2%) | 0 (0.0%) |
| 4-Person Households | 32 (3.6%) | 0 (0.0%) |
| 5-Person Households | 51 (5.7%) | 0 (0.0%) |
| 6-Person Households | 0 (0.0%) | 0 (0.0%) |
| 7+ Person Households | 23 (2.6%) | 0 (0.0%) |
| Total | 456 (51.1%) | 436 (48.9%) |
Female Fertility in Billington Heights
Fertility by Age in Billington Heights
| Age Bracket | Women with Births | Births / 1,000 Women |
| 15 to 19 years | 0 (0.0%) | 0.0 |
| 20 to 34 years | 0 (0.0%) | 0.0 |
| 35 to 50 years | 0 (0.0%) | 0.0 |
| Total | 0 (0.0%) | 0.0 |
Fertility by Age by Marriage Status in Billington Heights
| Age Bracket | Married | Unmarried |
| 15 to 19 years | 0 (0.0%) | 0 (0.0%) |
| 20 to 34 years | 0 (0.0%) | 0 (0.0%) |
| 35 to 50 years | 0 (0.0%) | 0 (0.0%) |
| Total | 0 (0.0%) | 0 (0.0%) |
Fertility by Education in Billington Heights
| Educational Attainment | Women with Births | Births / 1,000 Women |
| Less than High School | 0 (0.0%) | 0.0 |
| High School Diploma | 0 (0.0%) | 0.0 |
| College or Associate's Degree | 0 (0.0%) | 0.0 |
| Bachelor's Degree | 0 (0.0%) | 0.0 |
| Graduate Degree | 0 (0.0%) | 0.0 |
| Total | 0 (0.0%) | 0.0 |
Fertility by Education by Marriage Status in Billington Heights
| Educational Attainment | Married | Unmarried |
| Less than High School | 0 (0.0%) | 0 (0.0%) |
| High School Diploma | 0 (0.0%) | 0 (0.0%) |
| College or Associate's Degree | 0 (0.0%) | 0 (0.0%) |
| Bachelor's Degree | 0 (0.0%) | 0 (0.0%) |
| Graduate Degree | 0 (0.0%) | 0 (0.0%) |
| Total | 0 (0.0%) | 0 (0.0%) |
Employment Characteristics in Billington Heights
Employment by Class of Employer in Billington Heights
Among the 919 employed individuals in Billington Heights, private company employees (642 | 69.9%), state government employees (94 | 10.2%), and not-for-profit organizations (59 | 6.4%) make up the most common classes of employment.
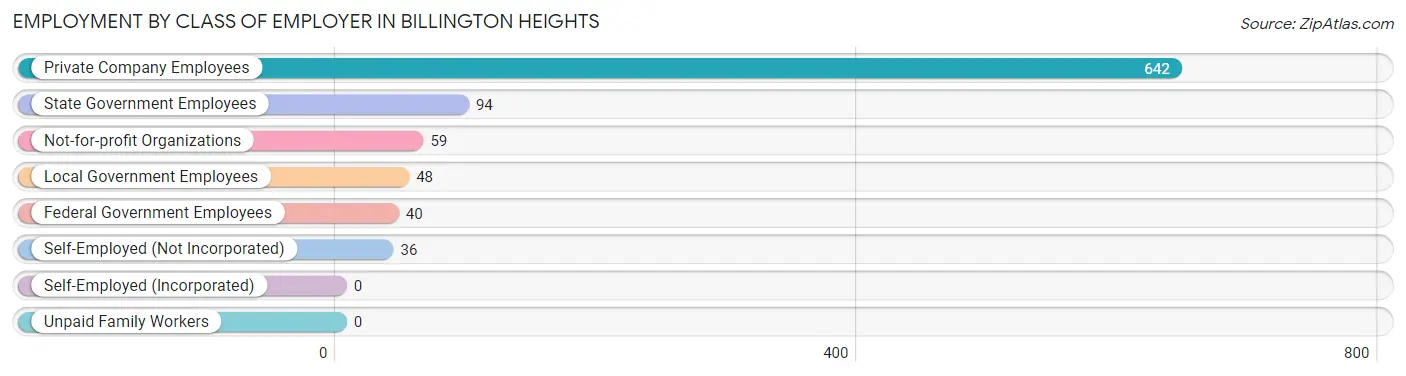
| Employer Class | # Employees | % Employees |
| Private Company Employees | 642 | 69.9% |
| Self-Employed (Incorporated) | 0 | 0.0% |
| Self-Employed (Not Incorporated) | 36 | 3.9% |
| Not-for-profit Organizations | 59 | 6.4% |
| Local Government Employees | 48 | 5.2% |
| State Government Employees | 94 | 10.2% |
| Federal Government Employees | 40 | 4.3% |
| Unpaid Family Workers | 0 | 0.0% |
| Total | 919 | 100.0% |
Employment Status by Age in Billington Heights
According to the labor force statistics for Billington Heights, out of the total population over 16 years of age (1,669), 63.3% or 1,056 individuals are in the labor force, with 11.3% or 119 of them unemployed. The age group with the highest labor force participation rate is 20 to 24 years, with 100.0% or 24 individuals in the labor force. Within the labor force, the 16 to 19 years age range has the highest percentage of unemployed individuals, with 67.8% or 99 of them being unemployed.
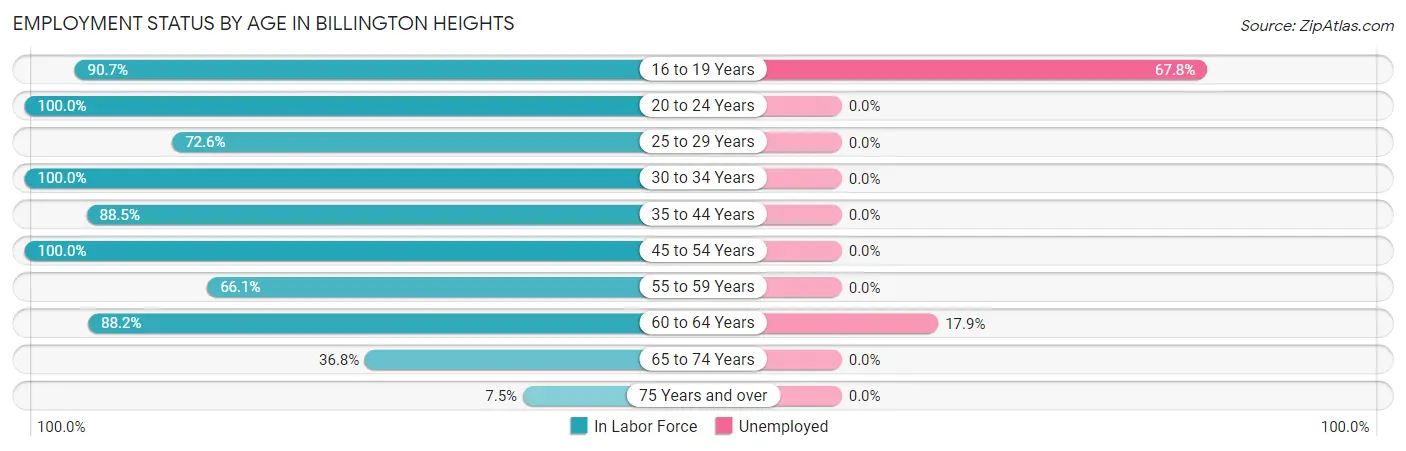
| Age Bracket | In Labor Force | Unemployed |
| 16 to 19 Years | 146 (90.7%) | 99 (67.8%) |
| 20 to 24 Years | 24 (100.0%) | 0 (0.0%) |
| 25 to 29 Years | 61 (72.6%) | 0 (0.0%) |
| 30 to 34 Years | 86 (100.0%) | 0 (0.0%) |
| 35 to 44 Years | 115 (88.5%) | 0 (0.0%) |
| 45 to 54 Years | 124 (100.0%) | 0 (0.0%) |
| 55 to 59 Years | 253 (66.1%) | 0 (0.0%) |
| 60 to 64 Years | 112 (88.2%) | 20 (17.9%) |
| 65 to 74 Years | 119 (36.8%) | 0 (0.0%) |
| 75 Years and over | 17 (7.5%) | 0 (0.0%) |
| Total | 1,056 (63.3%) | 119 (11.3%) |
Employment Status by Educational Attainment in Billington Heights
According to labor force statistics for Billington Heights, 80.4% of individuals (751) out of the total population between 25 and 64 years of age (934) are in the labor force, with 2.7% or 20 of them being unemployed. The group with the highest labor force participation rate are those with the educational attainment of bachelor's degree or higher, with 91.1% or 503 individuals in the labor force. Within the labor force, individuals with college / associate degree education have the highest percentage of unemployment, with 11.8% or 20 of them being unemployed.
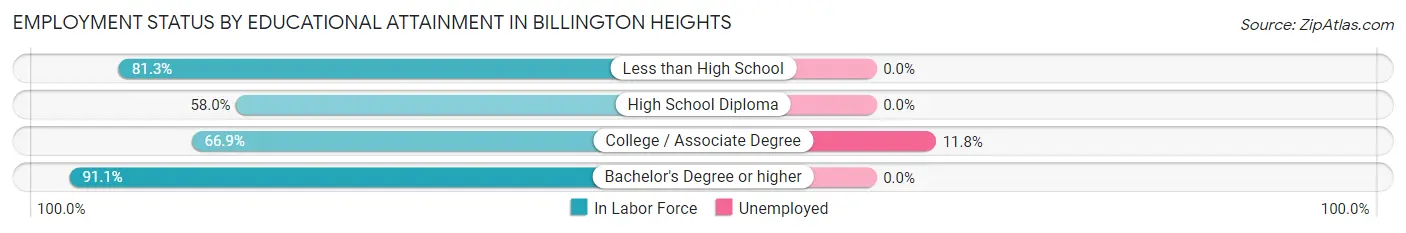
| Educational Attainment | In Labor Force | Unemployed |
| Less than High School | 13 (81.3%) | 0 (0.0%) |
| High School Diploma | 65 (58.0%) | 0 (0.0%) |
| College / Associate Degree | 170 (66.9%) | 30 (11.8%) |
| Bachelor's Degree or higher | 503 (91.1%) | 0 (0.0%) |
| Total | 751 (80.4%) | 25 (2.7%) |
Employment Occupations by Sex in Billington Heights
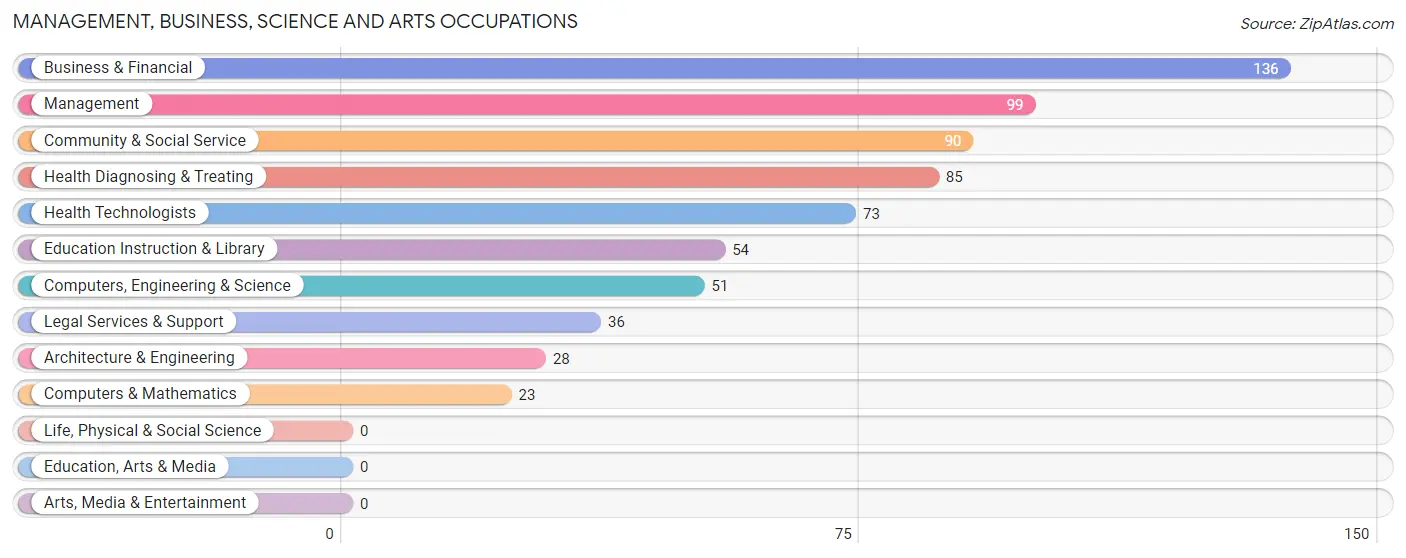
Management, Business, Science and Arts Occupations
The most common Management, Business, Science and Arts occupations in Billington Heights are Business & Financial (136 | 14.5%), Management (99 | 10.5%), Community & Social Service (90 | 9.6%), Health Diagnosing & Treating (85 | 9.1%), and Health Technologists (73 | 7.8%).
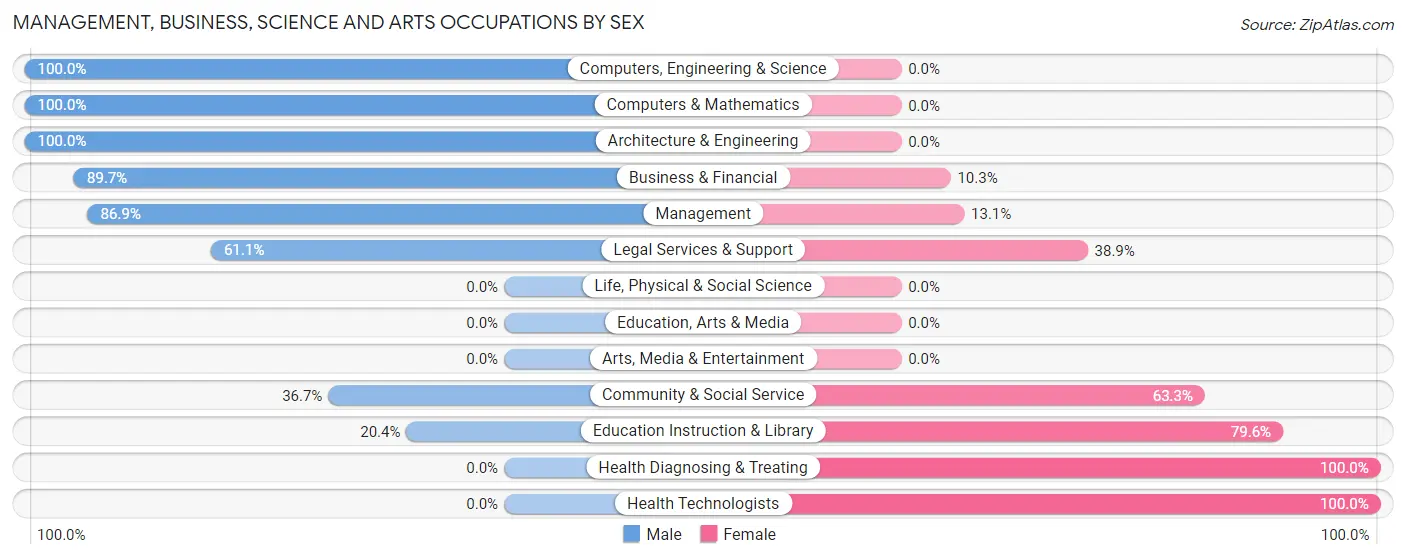
Management, Business, Science and Arts Occupations by Sex
Within the Management, Business, Science and Arts occupations in Billington Heights, the most male-oriented occupations are Computers, Engineering & Science (100.0%), Computers & Mathematics (100.0%), and Architecture & Engineering (100.0%), while the most female-oriented occupations are Health Diagnosing & Treating (100.0%), Health Technologists (100.0%), and Education Instruction & Library (79.6%).
| Occupation | Male | Female |
| Management | 86 (86.9%) | 13 (13.1%) |
| Business & Financial | 122 (89.7%) | 14 (10.3%) |
| Computers, Engineering & Science | 51 (100.0%) | 0 (0.0%) |
| Computers & Mathematics | 23 (100.0%) | 0 (0.0%) |
| Architecture & Engineering | 28 (100.0%) | 0 (0.0%) |
| Life, Physical & Social Science | 0 (0.0%) | 0 (0.0%) |
| Community & Social Service | 33 (36.7%) | 57 (63.3%) |
| Education, Arts & Media | 0 (0.0%) | 0 (0.0%) |
| Legal Services & Support | 22 (61.1%) | 14 (38.9%) |
| Education Instruction & Library | 11 (20.4%) | 43 (79.6%) |
| Arts, Media & Entertainment | 0 (0.0%) | 0 (0.0%) |
| Health Diagnosing & Treating | 0 (0.0%) | 85 (100.0%) |
| Health Technologists | 0 (0.0%) | 73 (100.0%) |
| Total (Category) | 292 (63.3%) | 169 (36.7%) |
| Total (Overall) | 589 (62.8%) | 349 (37.2%) |
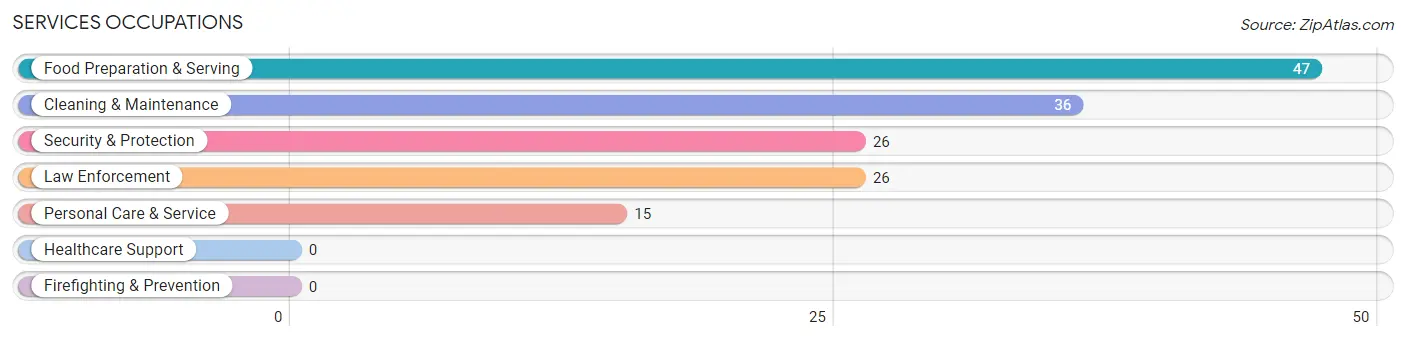
Services Occupations
The most common Services occupations in Billington Heights are Food Preparation & Serving (47 | 5.0%), Cleaning & Maintenance (36 | 3.8%), Security & Protection (26 | 2.8%), Law Enforcement (26 | 2.8%), and Personal Care & Service (15 | 1.6%).
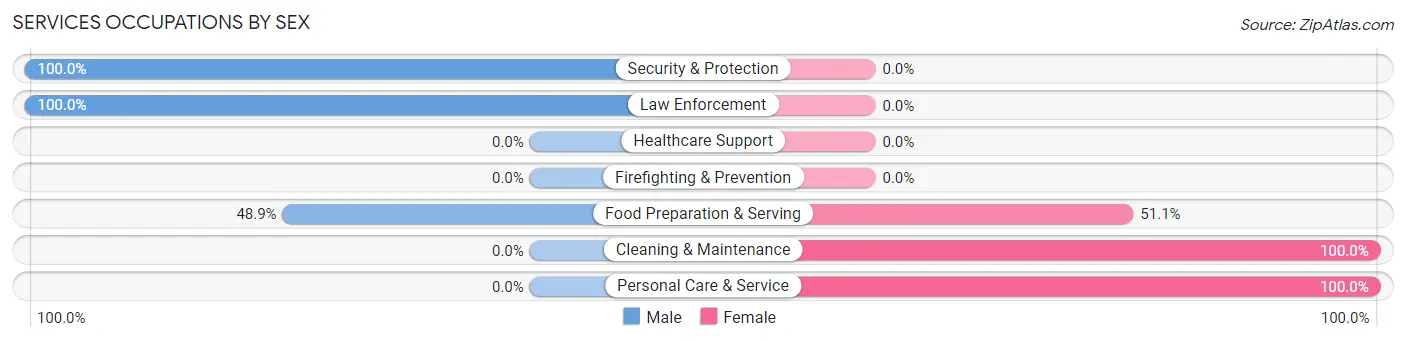
Services Occupations by Sex
Within the Services occupations in Billington Heights, the most male-oriented occupations are Security & Protection (100.0%), Law Enforcement (100.0%), and Food Preparation & Serving (48.9%), while the most female-oriented occupations are Cleaning & Maintenance (100.0%), Personal Care & Service (100.0%), and Food Preparation & Serving (51.1%).
| Occupation | Male | Female |
| Healthcare Support | 0 (0.0%) | 0 (0.0%) |
| Security & Protection | 26 (100.0%) | 0 (0.0%) |
| Firefighting & Prevention | 0 (0.0%) | 0 (0.0%) |
| Law Enforcement | 26 (100.0%) | 0 (0.0%) |
| Food Preparation & Serving | 23 (48.9%) | 24 (51.1%) |
| Cleaning & Maintenance | 0 (0.0%) | 36 (100.0%) |
| Personal Care & Service | 0 (0.0%) | 15 (100.0%) |
| Total (Category) | 49 (39.5%) | 75 (60.5%) |
| Total (Overall) | 589 (62.8%) | 349 (37.2%) |
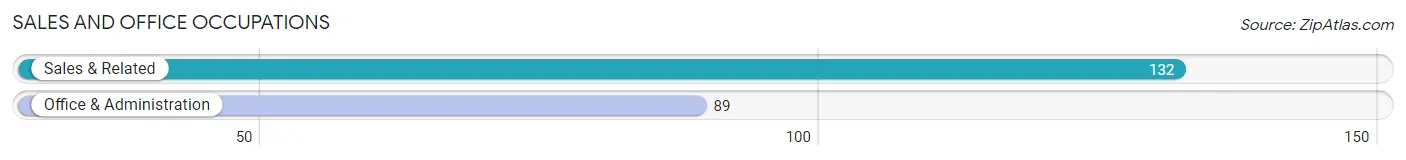
Sales and Office Occupations
The most common Sales and Office occupations in Billington Heights are Sales & Related (132 | 14.1%), and Office & Administration (89 | 9.5%).
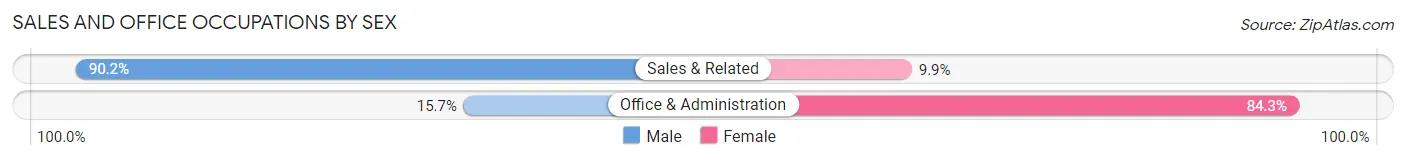
Sales and Office Occupations by Sex
| Occupation | Male | Female |
| Sales & Related | 119 (90.1%) | 13 (9.9%) |
| Office & Administration | 14 (15.7%) | 75 (84.3%) |
| Total (Category) | 133 (60.2%) | 88 (39.8%) |
| Total (Overall) | 589 (62.8%) | 349 (37.2%) |
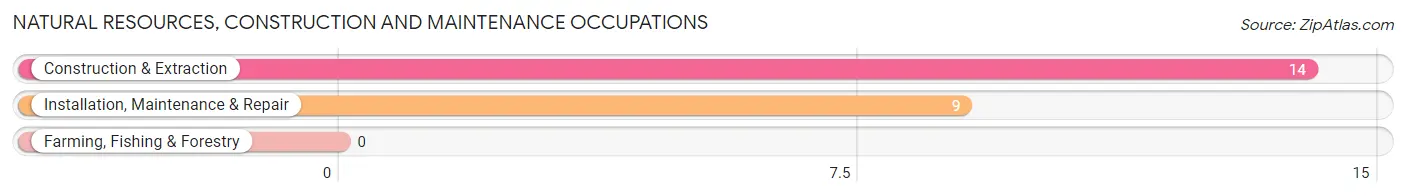
Natural Resources, Construction and Maintenance Occupations
The most common Natural Resources, Construction and Maintenance occupations in Billington Heights are Construction & Extraction (14 | 1.5%), and Installation, Maintenance & Repair (9 | 1.0%).
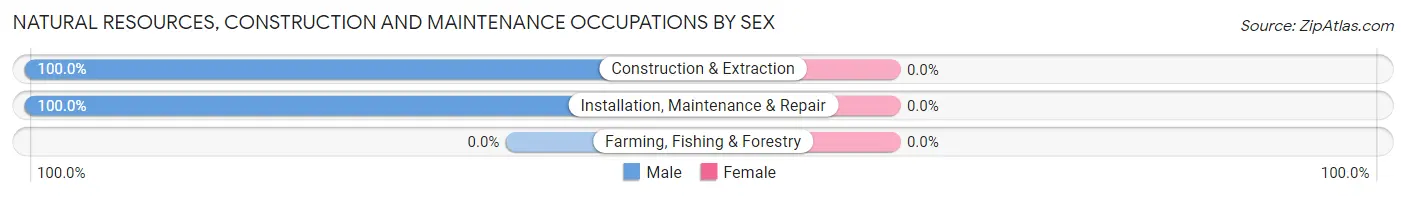
Natural Resources, Construction and Maintenance Occupations by Sex
| Occupation | Male | Female |
| Farming, Fishing & Forestry | 0 (0.0%) | 0 (0.0%) |
| Construction & Extraction | 14 (100.0%) | 0 (0.0%) |
| Installation, Maintenance & Repair | 9 (100.0%) | 0 (0.0%) |
| Total (Category) | 23 (100.0%) | 0 (0.0%) |
| Total (Overall) | 589 (62.8%) | 349 (37.2%) |
Production, Transportation and Moving Occupations
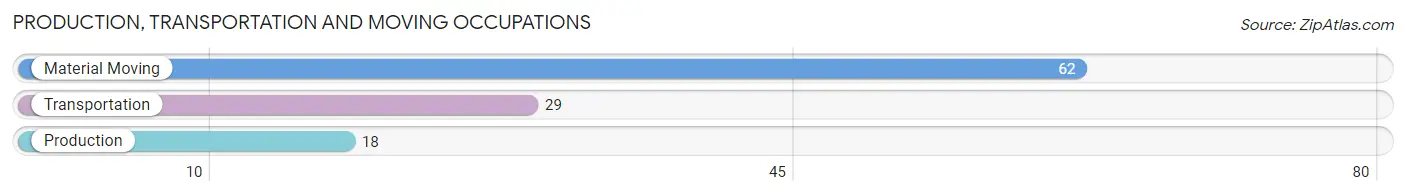
The most common Production, Transportation and Moving occupations in Billington Heights are Material Moving (62 | 6.6%), Transportation (29 | 3.1%), and Production (18 | 1.9%).
Production, Transportation and Moving Occupations by Sex
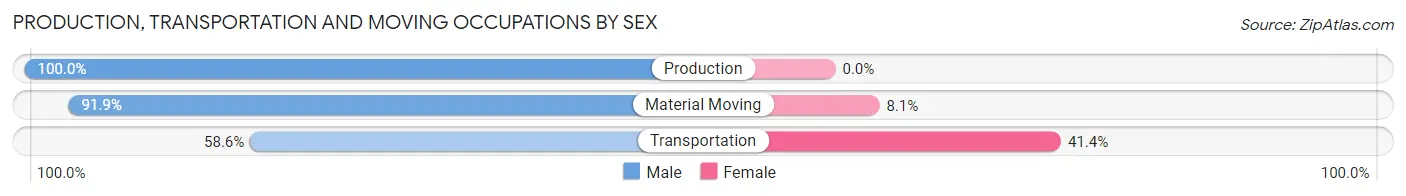
| Occupation | Male | Female |
| Production | 18 (100.0%) | 0 (0.0%) |
| Transportation | 17 (58.6%) | 12 (41.4%) |
| Material Moving | 57 (91.9%) | 5 (8.1%) |
| Total (Category) | 92 (84.4%) | 17 (15.6%) |
| Total (Overall) | 589 (62.8%) | 349 (37.2%) |
Employment Industries by Sex in Billington Heights
Employment Industries in Billington Heights
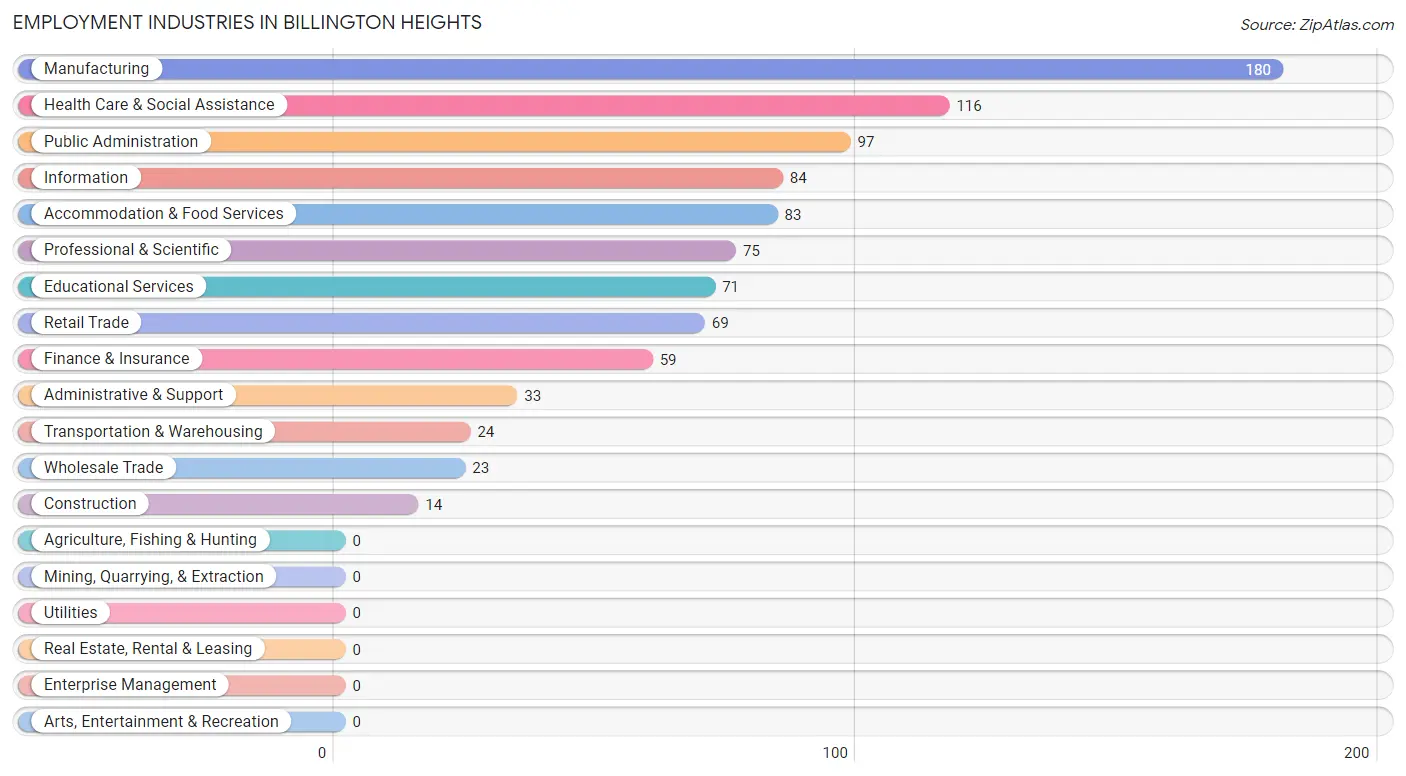
The major employment industries in Billington Heights include Manufacturing (180 | 19.2%), Health Care & Social Assistance (116 | 12.4%), Public Administration (97 | 10.3%), Information (84 | 9.0%), and Accommodation & Food Services (83 | 8.8%).
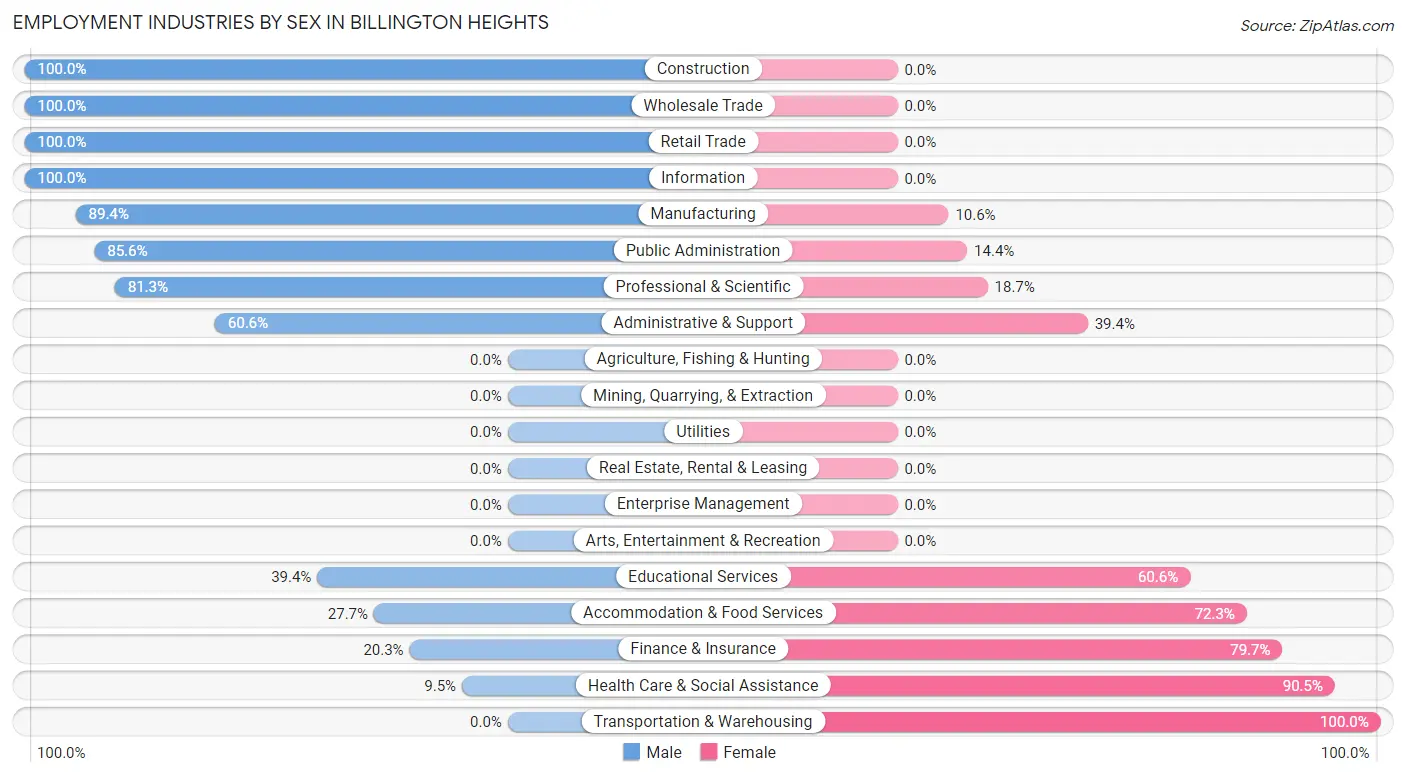
Employment Industries by Sex in Billington Heights
The Billington Heights industries that see more men than women are Construction (100.0%), Wholesale Trade (100.0%), and Retail Trade (100.0%), whereas the industries that tend to have a higher number of women are Transportation & Warehousing (100.0%), Health Care & Social Assistance (90.5%), and Finance & Insurance (79.7%).
| Industry | Male | Female |
| Agriculture, Fishing & Hunting | 0 (0.0%) | 0 (0.0%) |
| Mining, Quarrying, & Extraction | 0 (0.0%) | 0 (0.0%) |
| Construction | 14 (100.0%) | 0 (0.0%) |
| Manufacturing | 161 (89.4%) | 19 (10.6%) |
| Wholesale Trade | 23 (100.0%) | 0 (0.0%) |
| Retail Trade | 69 (100.0%) | 0 (0.0%) |
| Transportation & Warehousing | 0 (0.0%) | 24 (100.0%) |
| Utilities | 0 (0.0%) | 0 (0.0%) |
| Information | 84 (100.0%) | 0 (0.0%) |
| Finance & Insurance | 12 (20.3%) | 47 (79.7%) |
| Real Estate, Rental & Leasing | 0 (0.0%) | 0 (0.0%) |
| Professional & Scientific | 61 (81.3%) | 14 (18.7%) |
| Enterprise Management | 0 (0.0%) | 0 (0.0%) |
| Administrative & Support | 20 (60.6%) | 13 (39.4%) |
| Educational Services | 28 (39.4%) | 43 (60.6%) |
| Health Care & Social Assistance | 11 (9.5%) | 105 (90.5%) |
| Arts, Entertainment & Recreation | 0 (0.0%) | 0 (0.0%) |
| Accommodation & Food Services | 23 (27.7%) | 60 (72.3%) |
| Public Administration | 83 (85.6%) | 14 (14.4%) |
| Total | 589 (62.8%) | 349 (37.2%) |
Education in Billington Heights
School Enrollment in Billington Heights
The most common levels of schooling among the 463 students in Billington Heights are college / undergraduate (139 | 30.0%), middle school (100 | 21.6%), and high school (100 | 21.6%).
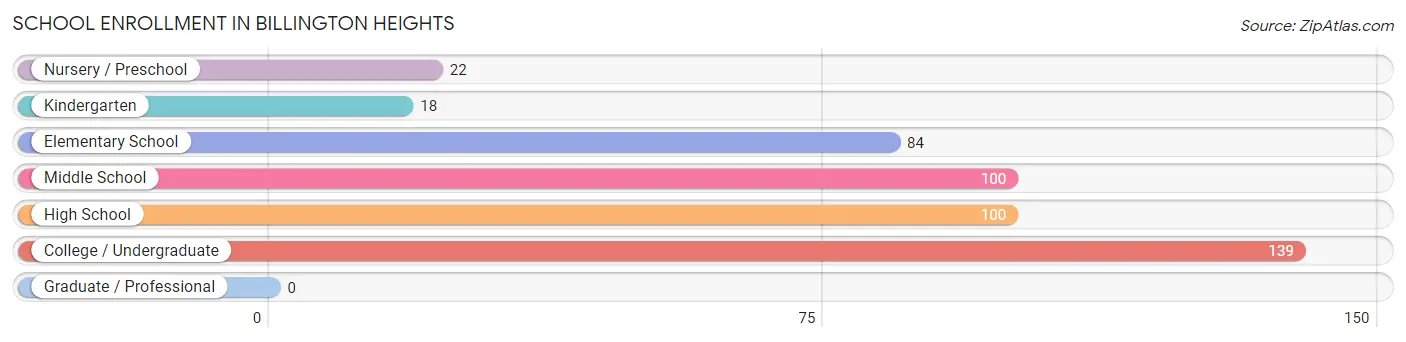
| School Level | # Students | % Students |
| Nursery / Preschool | 22 | 4.8% |
| Kindergarten | 18 | 3.9% |
| Elementary School | 84 | 18.1% |
| Middle School | 100 | 21.6% |
| High School | 100 | 21.6% |
| College / Undergraduate | 139 | 30.0% |
| Graduate / Professional | 0 | 0.0% |
| Total | 463 | 100.0% |
School Enrollment by Age by Funding Source in Billington Heights
Out of a total of 463 students who are enrolled in schools in Billington Heights, 62 (13.4%) attend a private institution, while the remaining 401 (86.6%) are enrolled in public schools. The age group of 3 to 4 year olds has the highest likelihood of being enrolled in private schools, with 22 (100.0% in the age bracket) enrolled. Conversely, the age group of 5 to 9 year old has the lowest likelihood of being enrolled in a private school, with 116 (100.0% in the age bracket) attending a public institution.
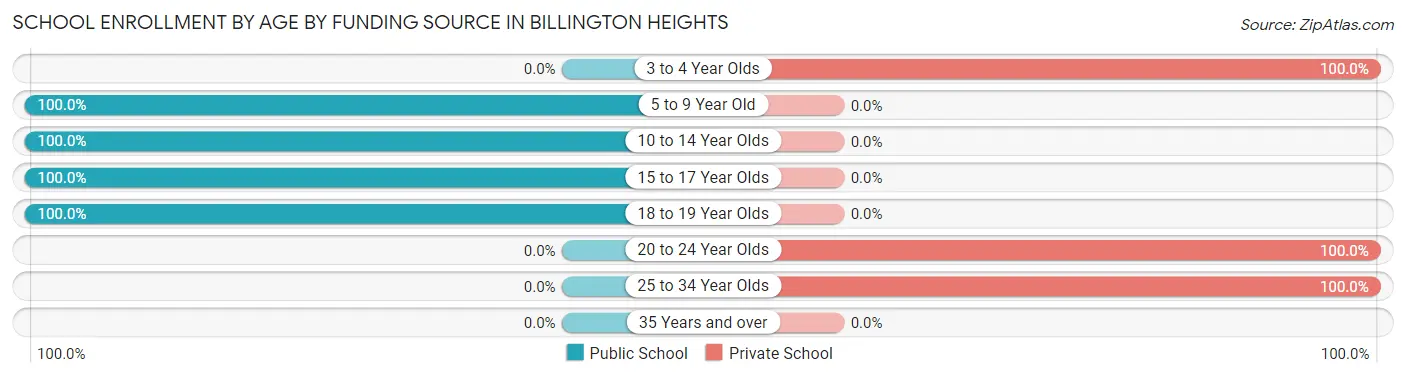
| Age Bracket | Public School | Private School |
| 3 to 4 Year Olds | 0 (0.0%) | 22 (100.0%) |
| 5 to 9 Year Old | 116 (100.0%) | 0 (0.0%) |
| 10 to 14 Year Olds | 115 (100.0%) | 0 (0.0%) |
| 15 to 17 Year Olds | 71 (100.0%) | 0 (0.0%) |
| 18 to 19 Year Olds | 99 (100.0%) | 0 (0.0%) |
| 20 to 24 Year Olds | 0 (0.0%) | 15 (100.0%) |
| 25 to 34 Year Olds | 0 (0.0%) | 25 (100.0%) |
| 35 Years and over | 0 (0.0%) | 0 (0.0%) |
| Total | 401 (86.6%) | 62 (13.4%) |
Educational Attainment by Field of Study in Billington Heights
Business (229 | 27.2%), science & technology (154 | 18.3%), engineering (72 | 8.6%), education (71 | 8.4%), and computers & mathematics (61 | 7.2%) are the most common fields of study among 841 individuals in Billington Heights who have obtained a bachelor's degree or higher.
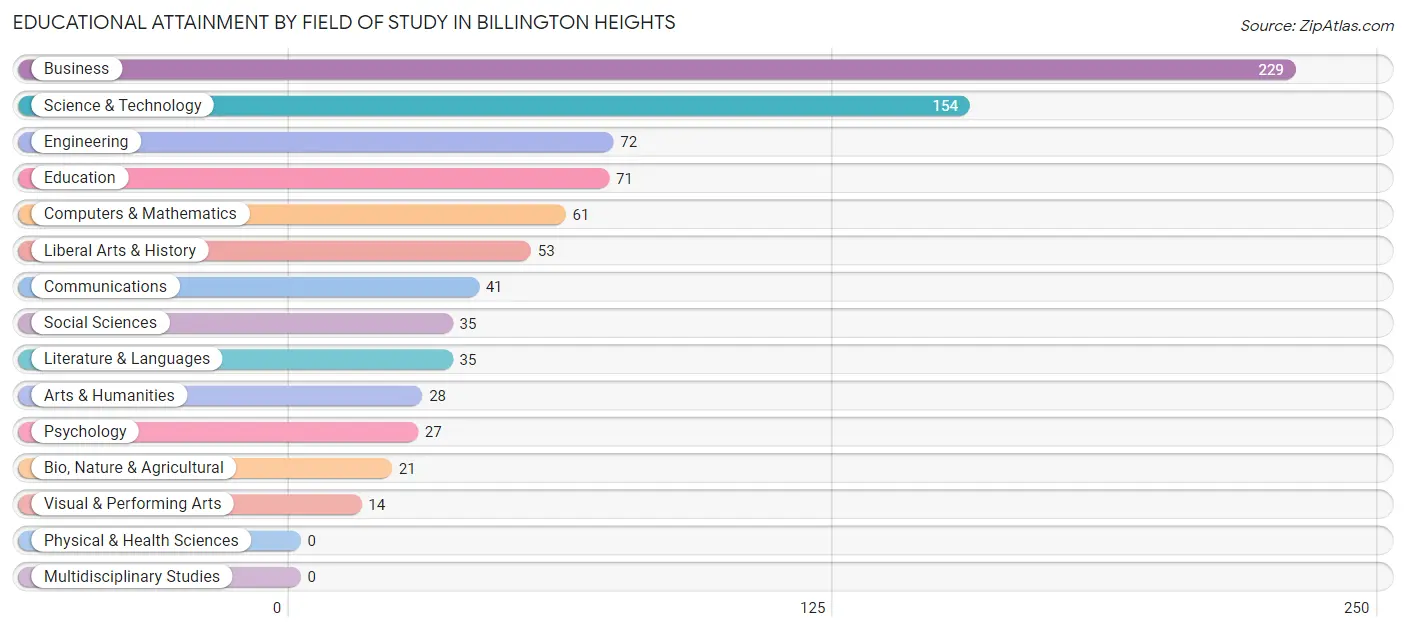
| Field of Study | # Graduates | % Graduates |
| Computers & Mathematics | 61 | 7.2% |
| Bio, Nature & Agricultural | 21 | 2.5% |
| Physical & Health Sciences | 0 | 0.0% |
| Psychology | 27 | 3.2% |
| Social Sciences | 35 | 4.2% |
| Engineering | 72 | 8.6% |
| Multidisciplinary Studies | 0 | 0.0% |
| Science & Technology | 154 | 18.3% |
| Business | 229 | 27.2% |
| Education | 71 | 8.4% |
| Literature & Languages | 35 | 4.2% |
| Liberal Arts & History | 53 | 6.3% |
| Visual & Performing Arts | 14 | 1.7% |
| Communications | 41 | 4.9% |
| Arts & Humanities | 28 | 3.3% |
| Total | 841 | 100.0% |
Transportation & Commute in Billington Heights
Vehicle Availability by Sex in Billington Heights
The most prevalent vehicle ownership categories in Billington Heights are males with 3 vehicles (323, accounting for 54.8%) and females with 3 vehicles (135, making up 99.4%).
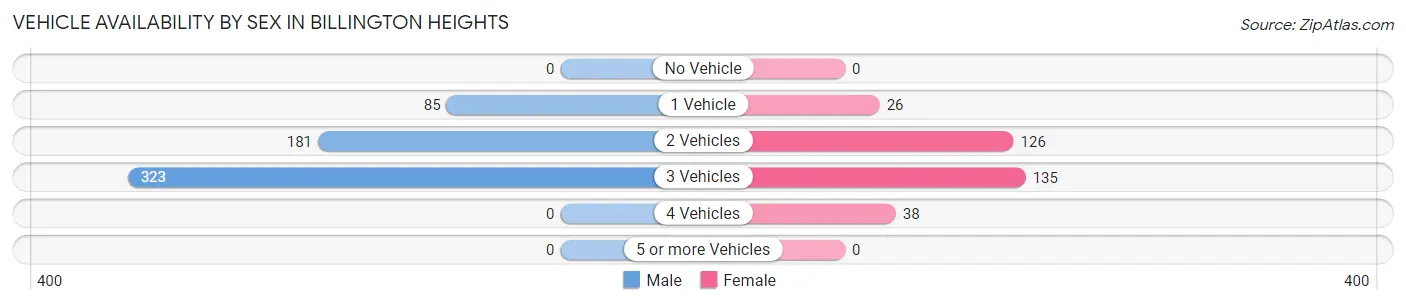
| Vehicles Available | Male | Female |
| No Vehicle | 0 (0.0%) | 0 (0.0%) |
| 1 Vehicle | 85 (14.4%) | 26 (8.0%) |
| 2 Vehicles | 181 (30.7%) | 126 (38.8%) |
| 3 Vehicles | 323 (54.8%) | 135 (41.5%) |
| 4 Vehicles | 0 (0.0%) | 38 (11.7%) |
| 5 or more Vehicles | 0 (0.0%) | 0 (0.0%) |
| Total | 589 (100.0%) | 325 (100.0%) |
Commute Time in Billington Heights
The most frequently occuring commute durations in Billington Heights are 5 to 9 minutes (214 commuters, 26.1%), 20 to 24 minutes (176 commuters, 21.5%), and 30 to 34 minutes (126 commuters, 15.4%).

| Commute Time | # Commuters | % Commuters |
| Less than 5 Minutes | 23 | 2.8% |
| 5 to 9 Minutes | 214 | 26.1% |
| 10 to 14 Minutes | 12 | 1.5% |
| 15 to 19 Minutes | 112 | 13.7% |
| 20 to 24 Minutes | 176 | 21.5% |
| 25 to 29 Minutes | 54 | 6.6% |
| 30 to 34 Minutes | 126 | 15.4% |
| 35 to 39 Minutes | 36 | 4.4% |
| 40 to 44 Minutes | 5 | 0.6% |
| 45 to 59 Minutes | 22 | 2.7% |
| 60 to 89 Minutes | 14 | 1.7% |
| 90 or more Minutes | 26 | 3.2% |
Commute Time by Sex in Billington Heights
The most common commute times in Billington Heights are 5 to 9 minutes (157 commuters, 30.0%) for males and 30 to 34 minutes (85 commuters, 28.6%) for females.
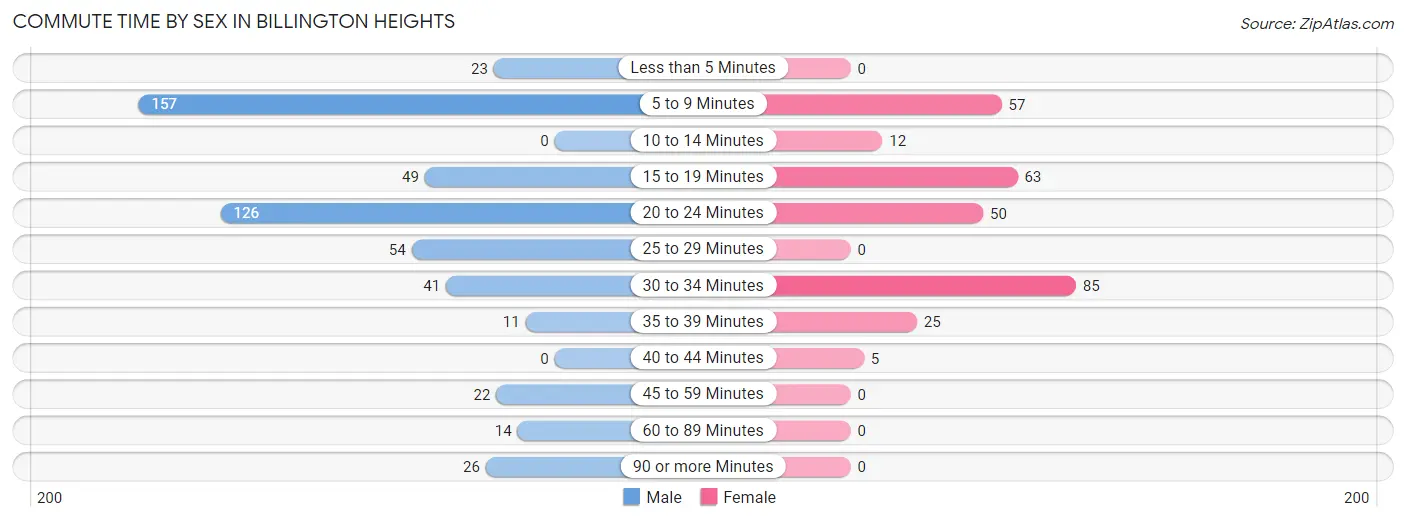
| Commute Time | Male | Female |
| Less than 5 Minutes | 23 (4.4%) | 0 (0.0%) |
| 5 to 9 Minutes | 157 (30.0%) | 57 (19.2%) |
| 10 to 14 Minutes | 0 (0.0%) | 12 (4.0%) |
| 15 to 19 Minutes | 49 (9.4%) | 63 (21.2%) |
| 20 to 24 Minutes | 126 (24.1%) | 50 (16.8%) |
| 25 to 29 Minutes | 54 (10.3%) | 0 (0.0%) |
| 30 to 34 Minutes | 41 (7.8%) | 85 (28.6%) |
| 35 to 39 Minutes | 11 (2.1%) | 25 (8.4%) |
| 40 to 44 Minutes | 0 (0.0%) | 5 (1.7%) |
| 45 to 59 Minutes | 22 (4.2%) | 0 (0.0%) |
| 60 to 89 Minutes | 14 (2.7%) | 0 (0.0%) |
| 90 or more Minutes | 26 (5.0%) | 0 (0.0%) |
Time of Departure to Work by Sex in Billington Heights
The most frequent times of departure to work in Billington Heights are 7:00 AM to 7:29 AM (134, 25.6%) for males and 10:00 AM to 10:59 AM (95, 32.0%) for females.
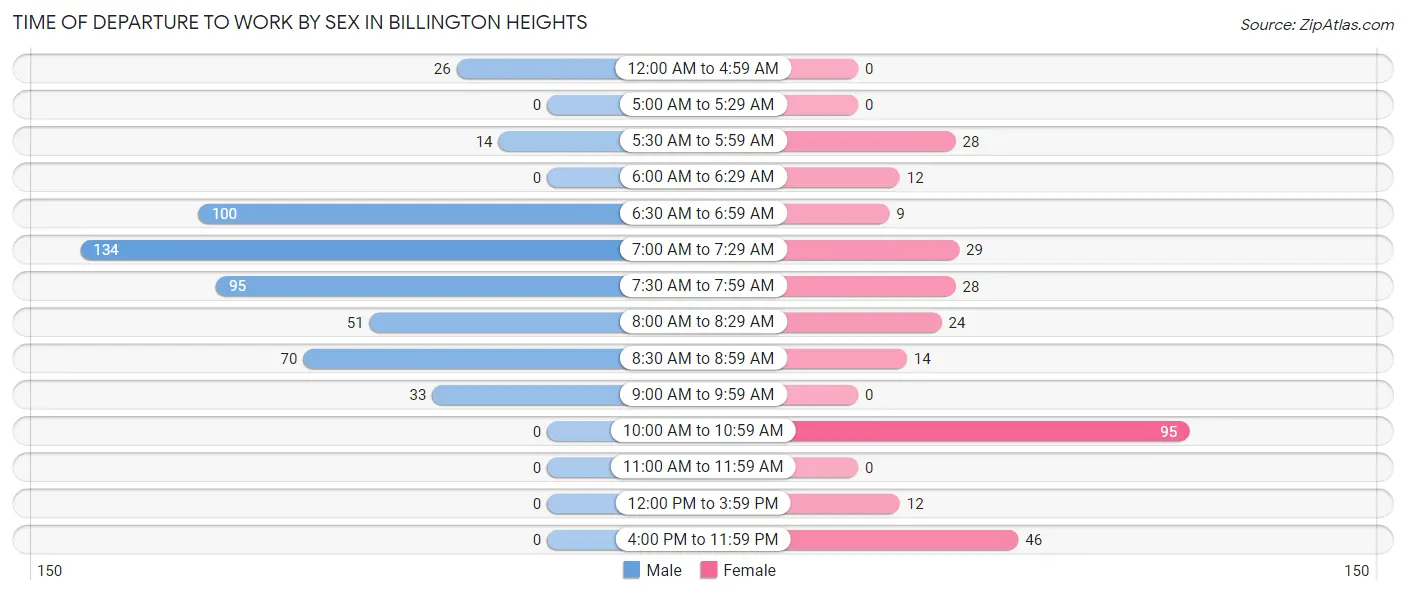
| Time of Departure | Male | Female |
| 12:00 AM to 4:59 AM | 26 (5.0%) | 0 (0.0%) |
| 5:00 AM to 5:29 AM | 0 (0.0%) | 0 (0.0%) |
| 5:30 AM to 5:59 AM | 14 (2.7%) | 28 (9.4%) |
| 6:00 AM to 6:29 AM | 0 (0.0%) | 12 (4.0%) |
| 6:30 AM to 6:59 AM | 100 (19.1%) | 9 (3.0%) |
| 7:00 AM to 7:29 AM | 134 (25.6%) | 29 (9.8%) |
| 7:30 AM to 7:59 AM | 95 (18.2%) | 28 (9.4%) |
| 8:00 AM to 8:29 AM | 51 (9.8%) | 24 (8.1%) |
| 8:30 AM to 8:59 AM | 70 (13.4%) | 14 (4.7%) |
| 9:00 AM to 9:59 AM | 33 (6.3%) | 0 (0.0%) |
| 10:00 AM to 10:59 AM | 0 (0.0%) | 95 (32.0%) |
| 11:00 AM to 11:59 AM | 0 (0.0%) | 0 (0.0%) |
| 12:00 PM to 3:59 PM | 0 (0.0%) | 12 (4.0%) |
| 4:00 PM to 11:59 PM | 0 (0.0%) | 46 (15.5%) |
| Total | 523 (100.0%) | 297 (100.0%) |
Housing Occupancy in Billington Heights
Occupancy by Ownership in Billington Heights
Of the total 892 dwellings in Billington Heights, owner-occupied units account for 842 (94.4%), while renter-occupied units make up 50 (5.6%).
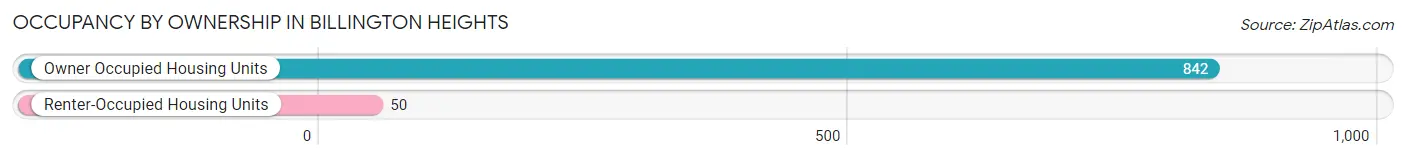
| Occupancy | # Housing Units | % Housing Units |
| Owner Occupied Housing Units | 842 | 94.4% |
| Renter-Occupied Housing Units | 50 | 5.6% |
| Total Occupied Housing Units | 892 | 100.0% |
Occupancy by Household Size in Billington Heights
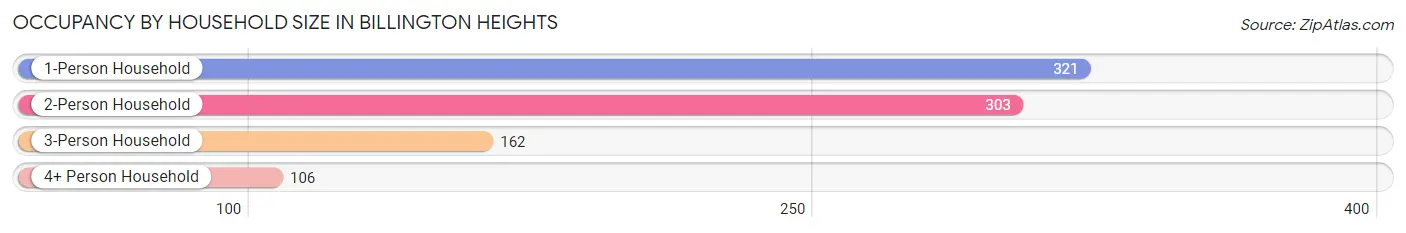
| Household Size | # Housing Units | % Housing Units |
| 1-Person Household | 321 | 36.0% |
| 2-Person Household | 303 | 34.0% |
| 3-Person Household | 162 | 18.2% |
| 4+ Person Household | 106 | 11.9% |
| Total Housing Units | 892 | 100.0% |
Occupancy by Ownership by Household Size in Billington Heights
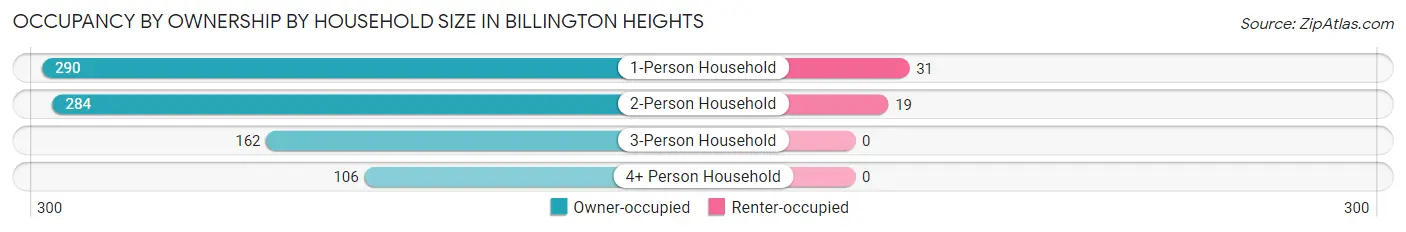
| Household Size | Owner-occupied | Renter-occupied |
| 1-Person Household | 290 (90.3%) | 31 (9.7%) |
| 2-Person Household | 284 (93.7%) | 19 (6.3%) |
| 3-Person Household | 162 (100.0%) | 0 (0.0%) |
| 4+ Person Household | 106 (100.0%) | 0 (0.0%) |
| Total Housing Units | 842 (94.4%) | 50 (5.6%) |
Occupancy by Educational Attainment in Billington Heights
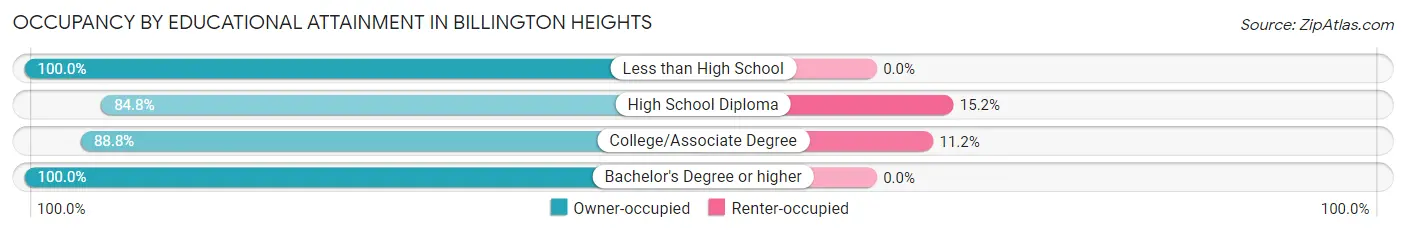
| Household Size | Owner-occupied | Renter-occupied |
| Less than High School | 13 (100.0%) | 0 (0.0%) |
| High School Diploma | 173 (84.8%) | 31 (15.2%) |
| College/Associate Degree | 151 (88.8%) | 19 (11.2%) |
| Bachelor's Degree or higher | 505 (100.0%) | 0 (0.0%) |
Occupancy by Age of Householder in Billington Heights
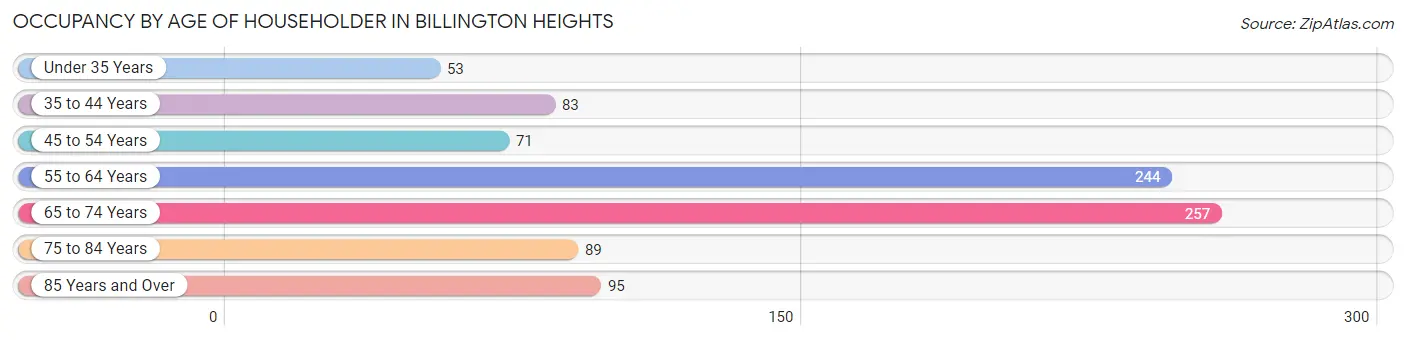
| Age Bracket | # Households | % Households |
| Under 35 Years | 53 | 5.9% |
| 35 to 44 Years | 83 | 9.3% |
| 45 to 54 Years | 71 | 8.0% |
| 55 to 64 Years | 244 | 27.4% |
| 65 to 74 Years | 257 | 28.8% |
| 75 to 84 Years | 89 | 10.0% |
| 85 Years and Over | 95 | 10.6% |
| Total | 892 | 100.0% |
Housing Finances in Billington Heights
Median Income by Occupancy in Billington Heights
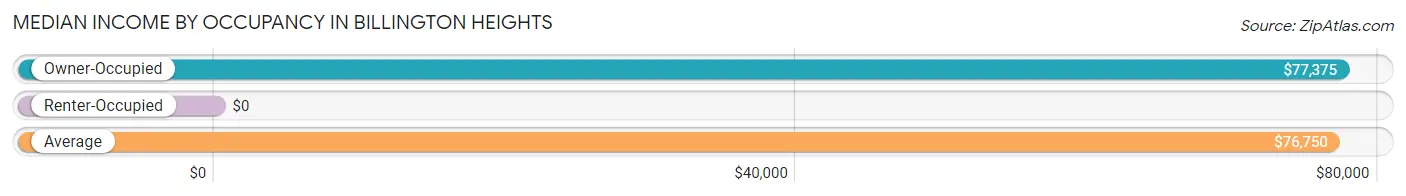
| Occupancy Type | # Households | Median Income |
| Owner-Occupied | 842 (94.4%) | $77,375 |
| Renter-Occupied | 50 (5.6%) | $0 |
| Average | 892 (100.0%) | $76,750 |
Occupancy by Householder Income Bracket in Billington Heights
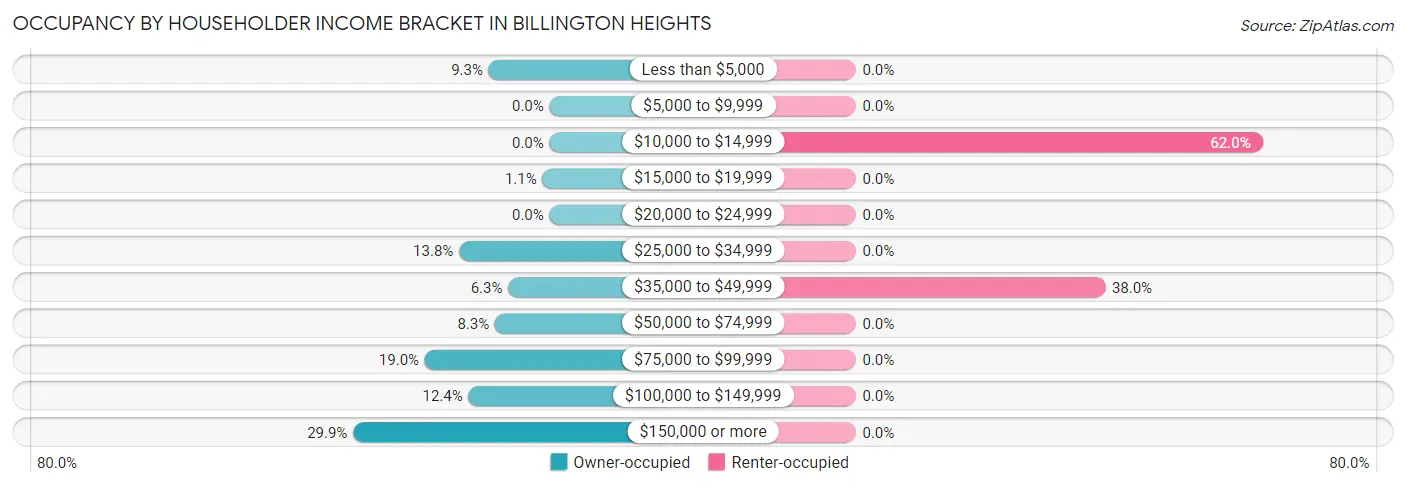
| Income Bracket | Owner-occupied | Renter-occupied |
| Less than $5,000 | 78 (9.3%) | 0 (0.0%) |
| $5,000 to $9,999 | 0 (0.0%) | 0 (0.0%) |
| $10,000 to $14,999 | 0 (0.0%) | 31 (62.0%) |
| $15,000 to $19,999 | 9 (1.1%) | 0 (0.0%) |
| $20,000 to $24,999 | 0 (0.0%) | 0 (0.0%) |
| $25,000 to $34,999 | 116 (13.8%) | 0 (0.0%) |
| $35,000 to $49,999 | 53 (6.3%) | 19 (38.0%) |
| $50,000 to $74,999 | 70 (8.3%) | 0 (0.0%) |
| $75,000 to $99,999 | 160 (19.0%) | 0 (0.0%) |
| $100,000 to $149,999 | 104 (12.3%) | 0 (0.0%) |
| $150,000 or more | 252 (29.9%) | 0 (0.0%) |
| Total | 842 (100.0%) | 50 (100.0%) |
Monthly Housing Cost Tiers in Billington Heights
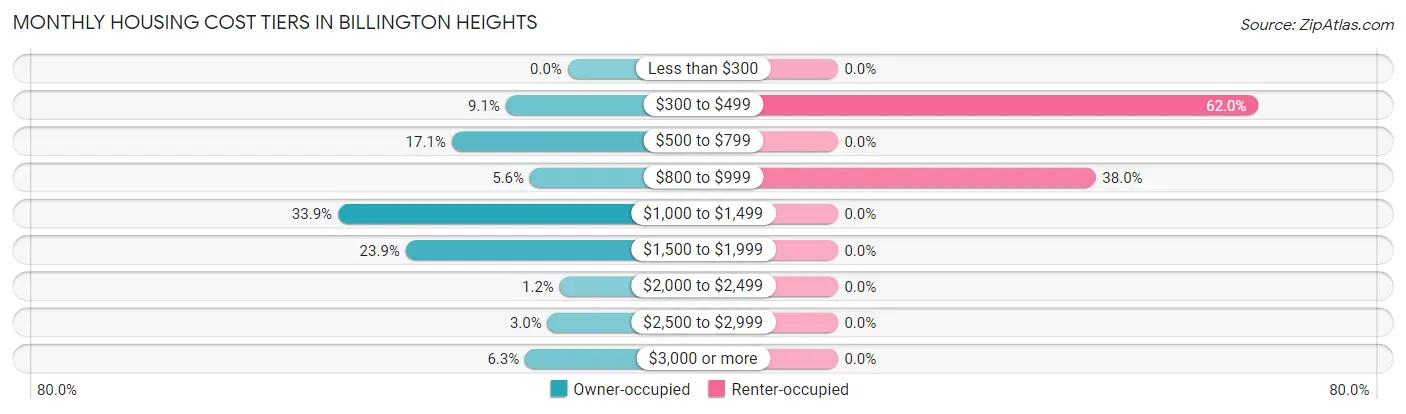
| Monthly Cost | Owner-occupied | Renter-occupied |
| Less than $300 | 0 (0.0%) | 0 (0.0%) |
| $300 to $499 | 77 (9.1%) | 31 (62.0%) |
| $500 to $799 | 144 (17.1%) | 0 (0.0%) |
| $800 to $999 | 47 (5.6%) | 19 (38.0%) |
| $1,000 to $1,499 | 285 (33.9%) | 0 (0.0%) |
| $1,500 to $1,999 | 201 (23.9%) | 0 (0.0%) |
| $2,000 to $2,499 | 10 (1.2%) | 0 (0.0%) |
| $2,500 to $2,999 | 25 (3.0%) | 0 (0.0%) |
| $3,000 or more | 53 (6.3%) | 0 (0.0%) |
| Total | 842 (100.0%) | 50 (100.0%) |
Physical Housing Characteristics in Billington Heights
Housing Structures in Billington Heights
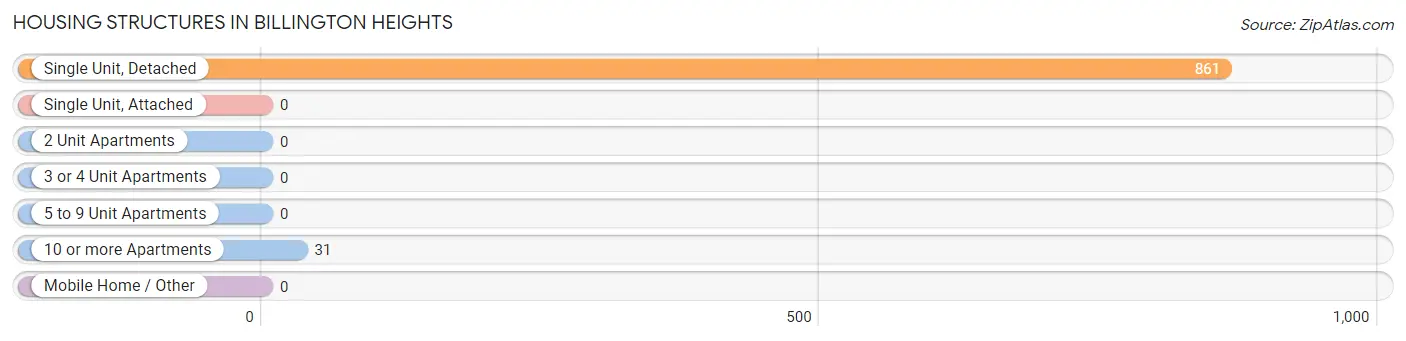
| Structure Type | # Housing Units | % Housing Units |
| Single Unit, Detached | 861 | 96.5% |
| Single Unit, Attached | 0 | 0.0% |
| 2 Unit Apartments | 0 | 0.0% |
| 3 or 4 Unit Apartments | 0 | 0.0% |
| 5 to 9 Unit Apartments | 0 | 0.0% |
| 10 or more Apartments | 31 | 3.5% |
| Mobile Home / Other | 0 | 0.0% |
| Total | 892 | 100.0% |
Housing Structures by Occupancy in Billington Heights
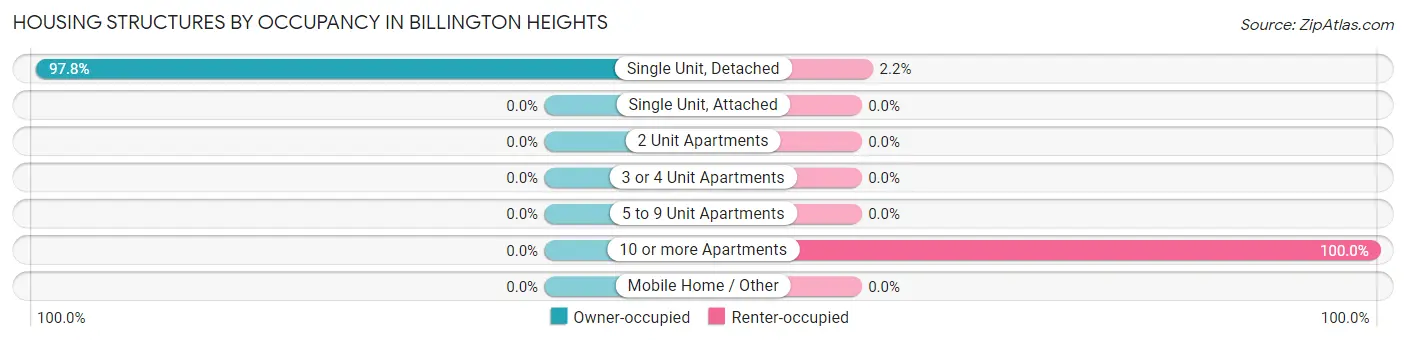
| Structure Type | Owner-occupied | Renter-occupied |
| Single Unit, Detached | 842 (97.8%) | 19 (2.2%) |
| Single Unit, Attached | 0 (0.0%) | 0 (0.0%) |
| 2 Unit Apartments | 0 (0.0%) | 0 (0.0%) |
| 3 or 4 Unit Apartments | 0 (0.0%) | 0 (0.0%) |
| 5 to 9 Unit Apartments | 0 (0.0%) | 0 (0.0%) |
| 10 or more Apartments | 0 (0.0%) | 31 (100.0%) |
| Mobile Home / Other | 0 (0.0%) | 0 (0.0%) |
| Total | 842 (94.4%) | 50 (5.6%) |
Housing Structures by Number of Rooms in Billington Heights
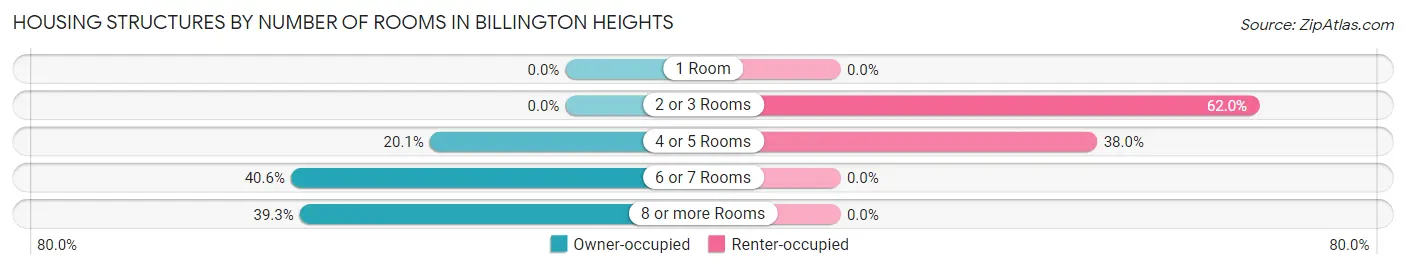
| Number of Rooms | Owner-occupied | Renter-occupied |
| 1 Room | 0 (0.0%) | 0 (0.0%) |
| 2 or 3 Rooms | 0 (0.0%) | 31 (62.0%) |
| 4 or 5 Rooms | 169 (20.1%) | 19 (38.0%) |
| 6 or 7 Rooms | 342 (40.6%) | 0 (0.0%) |
| 8 or more Rooms | 331 (39.3%) | 0 (0.0%) |
| Total | 842 (100.0%) | 50 (100.0%) |
Housing Structure by Heating Type in Billington Heights
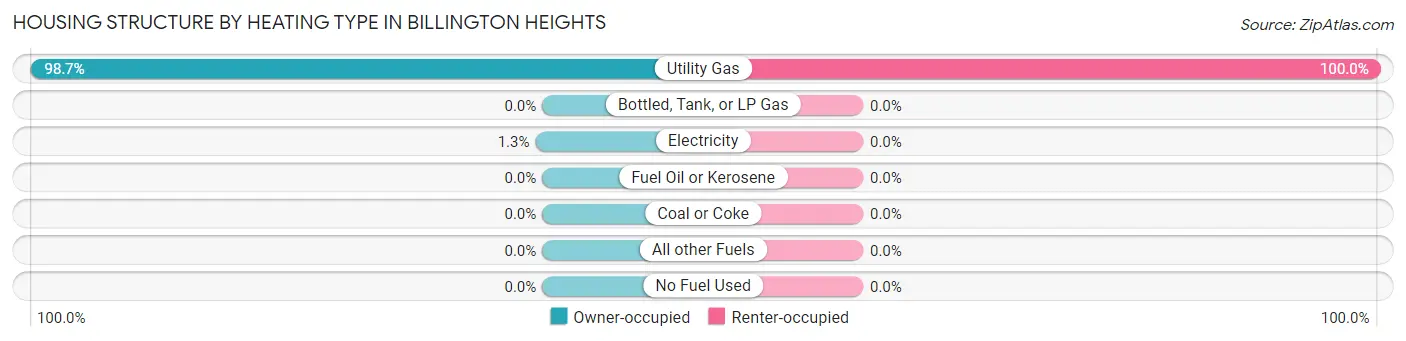
| Heating Type | Owner-occupied | Renter-occupied |
| Utility Gas | 831 (98.7%) | 50 (100.0%) |
| Bottled, Tank, or LP Gas | 0 (0.0%) | 0 (0.0%) |
| Electricity | 11 (1.3%) | 0 (0.0%) |
| Fuel Oil or Kerosene | 0 (0.0%) | 0 (0.0%) |
| Coal or Coke | 0 (0.0%) | 0 (0.0%) |
| All other Fuels | 0 (0.0%) | 0 (0.0%) |
| No Fuel Used | 0 (0.0%) | 0 (0.0%) |
| Total | 842 (100.0%) | 50 (100.0%) |
Household Vehicle Usage in Billington Heights
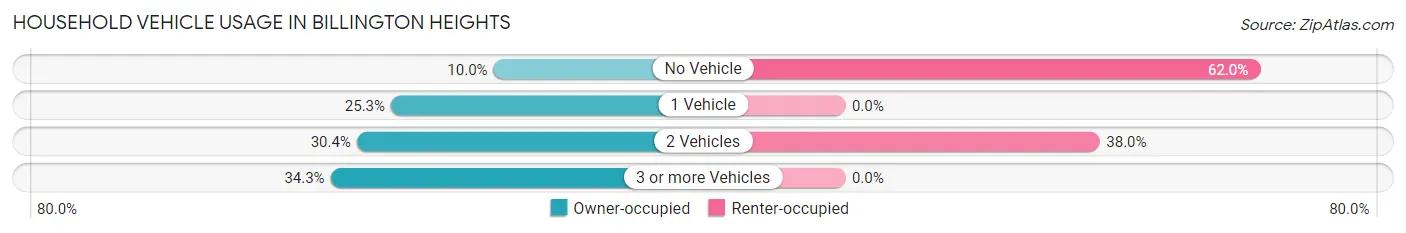
| Vehicles per Household | Owner-occupied | Renter-occupied |
| No Vehicle | 84 (10.0%) | 31 (62.0%) |
| 1 Vehicle | 213 (25.3%) | 0 (0.0%) |
| 2 Vehicles | 256 (30.4%) | 19 (38.0%) |
| 3 or more Vehicles | 289 (34.3%) | 0 (0.0%) |
| Total | 842 (100.0%) | 50 (100.0%) |
Real Estate & Mortgages in Billington Heights
Real Estate and Mortgage Overview in Billington Heights
| Characteristic | Without Mortgage | With Mortgage |
| Housing Units | 333 | 509 |
| Median Property Value | $310,700 | $284,200 |
| Median Household Income | $72,688 | $165 |
| Monthly Housing Costs | $675 | $53 |
| Real Estate Taxes | $4,713 | $0 |
Property Value by Mortgage Status in Billington Heights
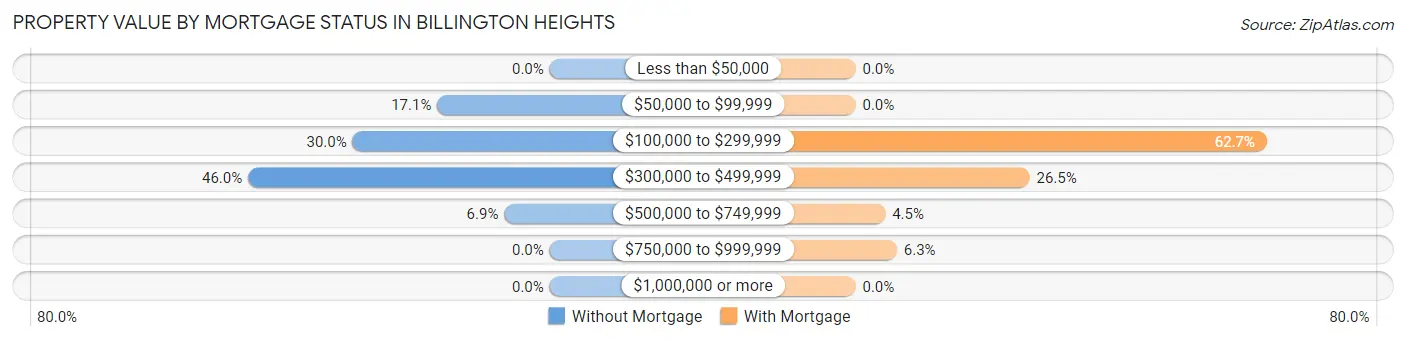
| Property Value | Without Mortgage | With Mortgage |
| Less than $50,000 | 0 (0.0%) | 0 (0.0%) |
| $50,000 to $99,999 | 57 (17.1%) | 0 (0.0%) |
| $100,000 to $299,999 | 100 (30.0%) | 319 (62.7%) |
| $300,000 to $499,999 | 153 (46.0%) | 135 (26.5%) |
| $500,000 to $749,999 | 23 (6.9%) | 23 (4.5%) |
| $750,000 to $999,999 | 0 (0.0%) | 32 (6.3%) |
| $1,000,000 or more | 0 (0.0%) | 0 (0.0%) |
| Total | 333 (100.0%) | 509 (100.0%) |
Household Income by Mortgage Status in Billington Heights
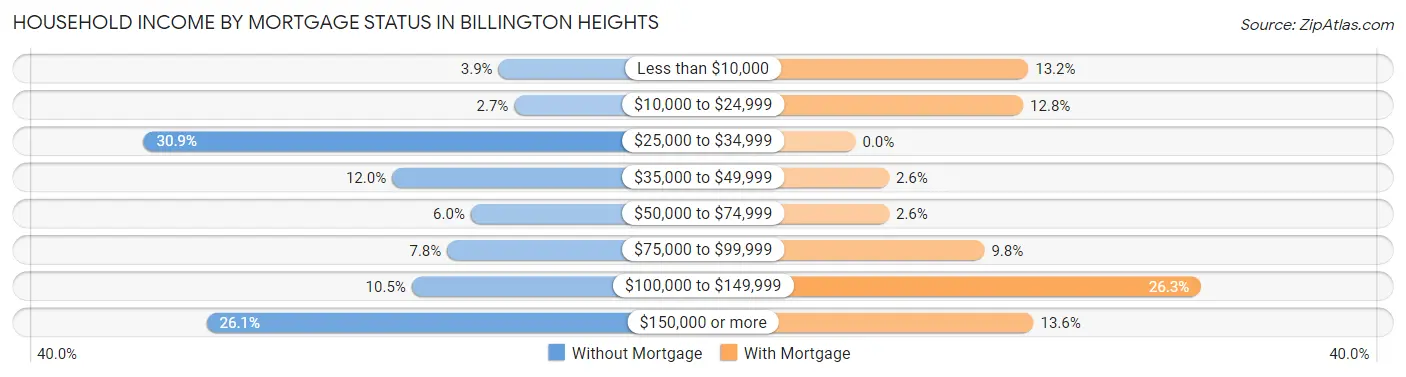
| Household Income | Without Mortgage | With Mortgage |
| Less than $10,000 | 13 (3.9%) | 67 (13.2%) |
| $10,000 to $24,999 | 9 (2.7%) | 65 (12.8%) |
| $25,000 to $34,999 | 103 (30.9%) | 0 (0.0%) |
| $35,000 to $49,999 | 40 (12.0%) | 13 (2.5%) |
| $50,000 to $74,999 | 20 (6.0%) | 13 (2.5%) |
| $75,000 to $99,999 | 26 (7.8%) | 50 (9.8%) |
| $100,000 to $149,999 | 35 (10.5%) | 134 (26.3%) |
| $150,000 or more | 87 (26.1%) | 69 (13.6%) |
| Total | 333 (100.0%) | 509 (100.0%) |
Property Value to Household Income Ratio in Billington Heights
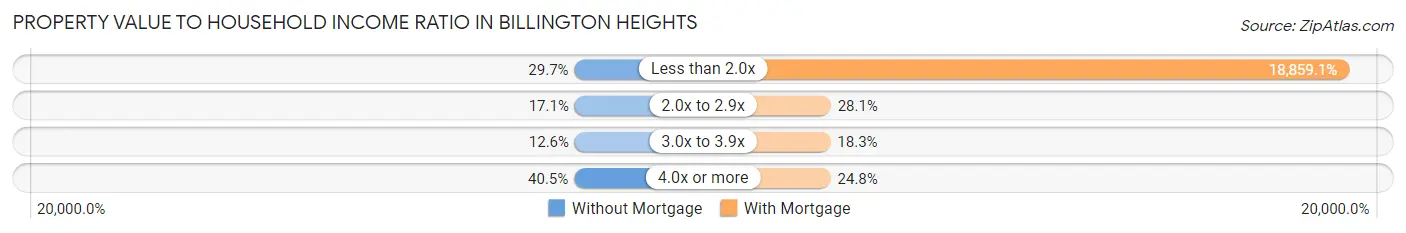
| Value-to-Income Ratio | Without Mortgage | With Mortgage |
| Less than 2.0x | 99 (29.7%) | 95,993 (18,859.1%) |
| 2.0x to 2.9x | 57 (17.1%) | 143 (28.1%) |
| 3.0x to 3.9x | 42 (12.6%) | 93 (18.3%) |
| 4.0x or more | 135 (40.5%) | 126 (24.7%) |
| Total | 333 (100.0%) | 509 (100.0%) |
Real Estate Taxes by Mortgage Status in Billington Heights
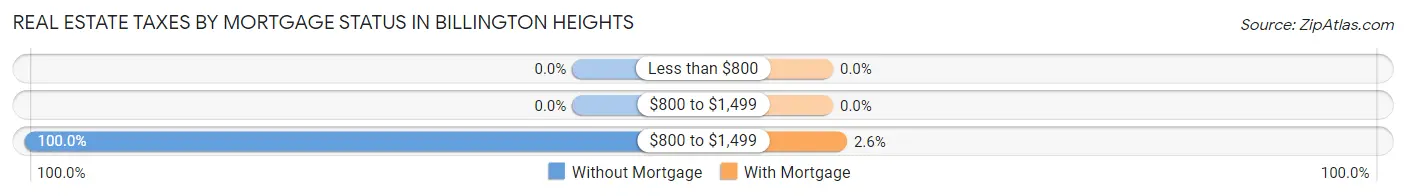
| Property Taxes | Without Mortgage | With Mortgage |
| Less than $800 | 0 (0.0%) | 0 (0.0%) |
| $800 to $1,499 | 0 (0.0%) | 0 (0.0%) |
| $800 to $1,499 | 333 (100.0%) | 13 (2.5%) |
| Total | 333 (100.0%) | 509 (100.0%) |
Health & Disability in Billington Heights
Health Insurance Coverage by Age in Billington Heights
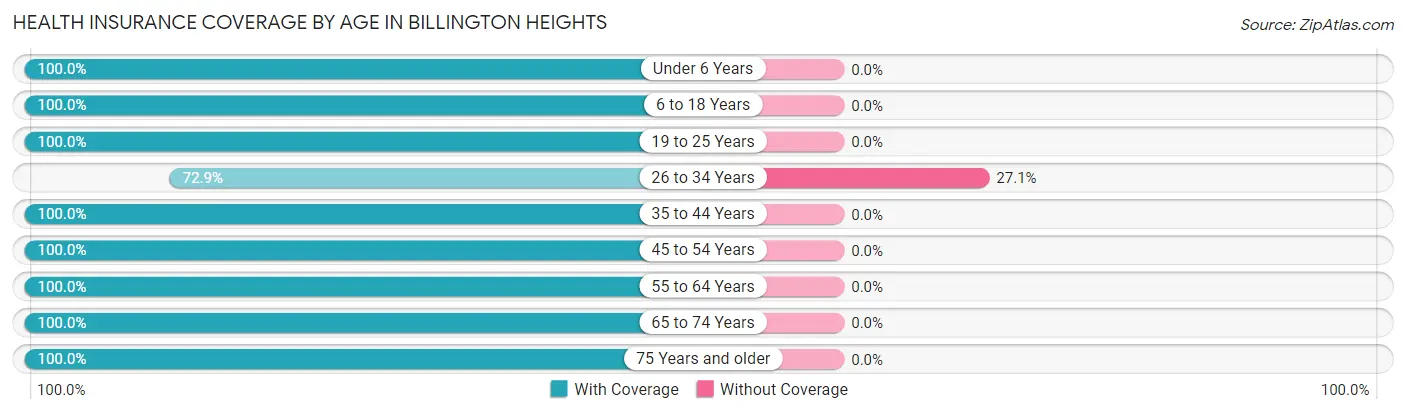
| Age Bracket | With Coverage | Without Coverage |
| Under 6 Years | 74 (100.0%) | 0 (0.0%) |
| 6 to 18 Years | 284 (100.0%) | 0 (0.0%) |
| 19 to 25 Years | 123 (100.0%) | 0 (0.0%) |
| 26 to 34 Years | 124 (72.9%) | 46 (27.1%) |
| 35 to 44 Years | 130 (100.0%) | 0 (0.0%) |
| 45 to 54 Years | 124 (100.0%) | 0 (0.0%) |
| 55 to 64 Years | 510 (100.0%) | 0 (0.0%) |
| 65 to 74 Years | 323 (100.0%) | 0 (0.0%) |
| 75 Years and older | 227 (100.0%) | 0 (0.0%) |
| Total | 1,919 (97.7%) | 46 (2.3%) |
Health Insurance Coverage by Citizenship Status in Billington Heights
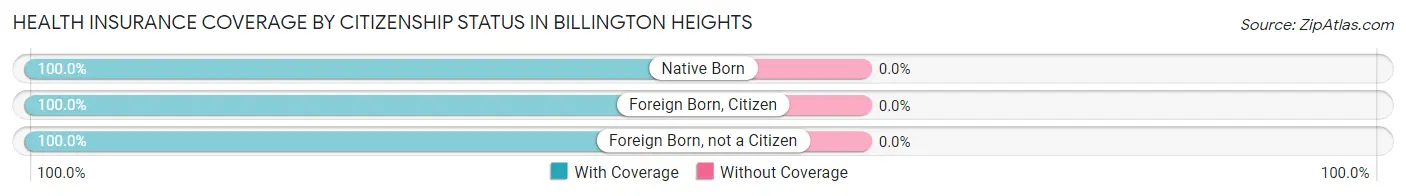
| Citizenship Status | With Coverage | Without Coverage |
| Native Born | 74 (100.0%) | 0 (0.0%) |
| Foreign Born, Citizen | 284 (100.0%) | 0 (0.0%) |
| Foreign Born, not a Citizen | 123 (100.0%) | 0 (0.0%) |
Health Insurance Coverage by Household Income in Billington Heights
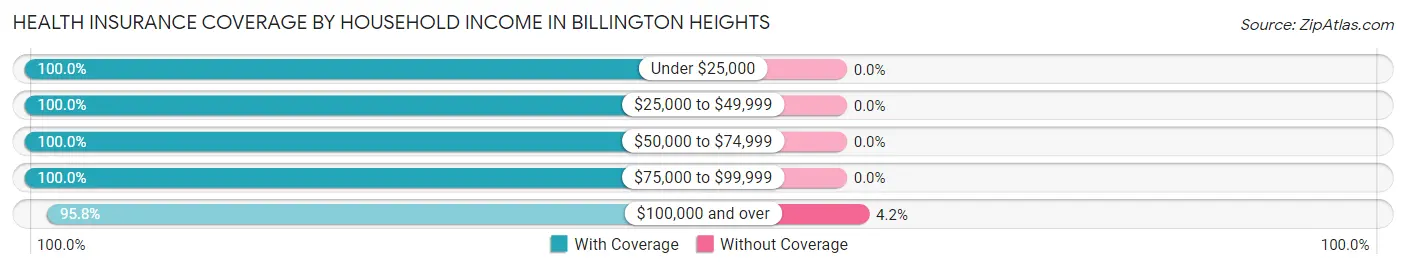
| Household Income | With Coverage | Without Coverage |
| Under $25,000 | 118 (100.0%) | 0 (0.0%) |
| $25,000 to $49,999 | 236 (100.0%) | 0 (0.0%) |
| $50,000 to $74,999 | 106 (100.0%) | 0 (0.0%) |
| $75,000 to $99,999 | 381 (100.0%) | 0 (0.0%) |
| $100,000 and over | 1,052 (95.8%) | 46 (4.2%) |
Public vs Private Health Insurance Coverage by Age in Billington Heights
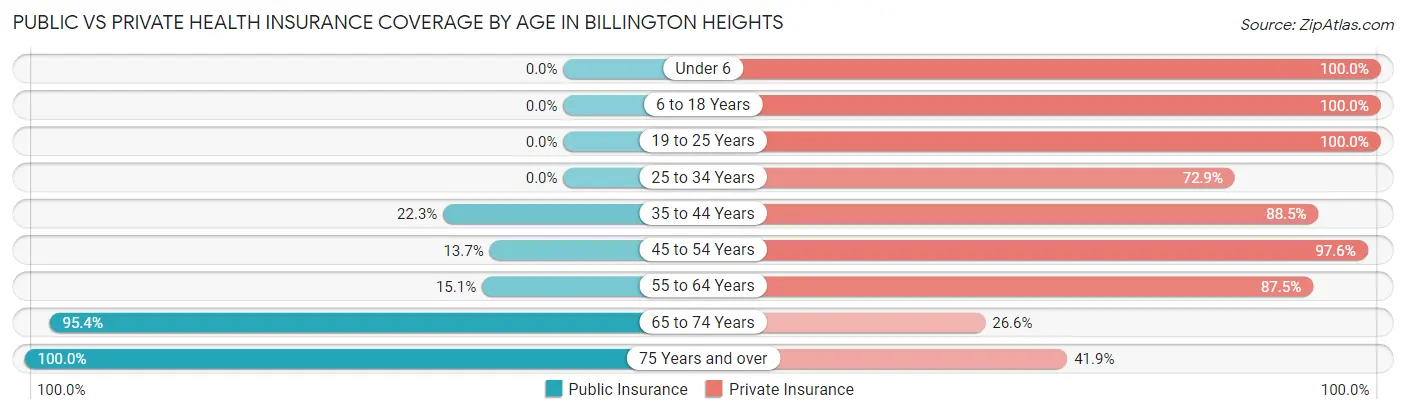
| Age Bracket | Public Insurance | Private Insurance |
| Under 6 | 0 (0.0%) | 74 (100.0%) |
| 6 to 18 Years | 0 (0.0%) | 284 (100.0%) |
| 19 to 25 Years | 0 (0.0%) | 123 (100.0%) |
| 25 to 34 Years | 0 (0.0%) | 124 (72.9%) |
| 35 to 44 Years | 29 (22.3%) | 115 (88.5%) |
| 45 to 54 Years | 17 (13.7%) | 121 (97.6%) |
| 55 to 64 Years | 77 (15.1%) | 446 (87.5%) |
| 65 to 74 Years | 308 (95.4%) | 86 (26.6%) |
| 75 Years and over | 227 (100.0%) | 95 (41.8%) |
| Total | 658 (33.5%) | 1,468 (74.7%) |
Disability Status by Sex by Age in Billington Heights
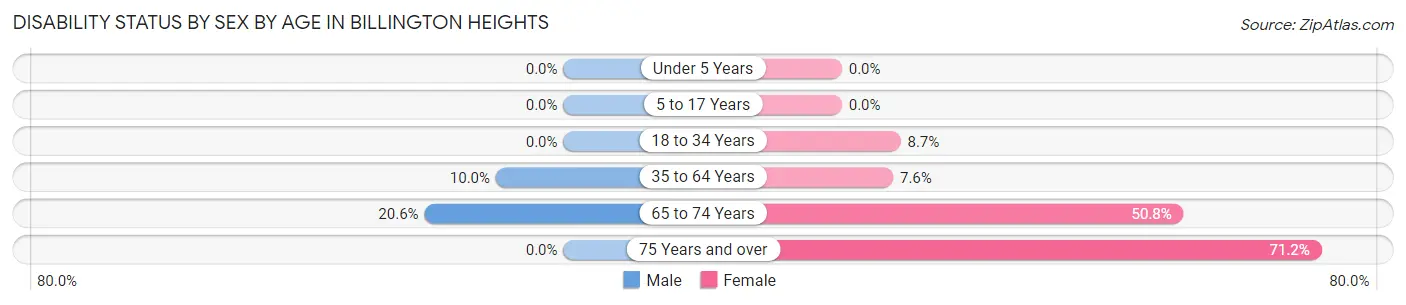
| Age Bracket | Male | Female |
| Under 5 Years | 0 (0.0%) | 0 (0.0%) |
| 5 to 17 Years | 0 (0.0%) | 0 (0.0%) |
| 18 to 34 Years | 0 (0.0%) | 19 (8.7%) |
| 35 to 64 Years | 41 (10.0%) | 27 (7.6%) |
| 65 to 74 Years | 39 (20.6%) | 68 (50.7%) |
| 75 Years and over | 0 (0.0%) | 109 (71.2%) |
Disability Class by Sex by Age in Billington Heights
Disability Class: Hearing Difficulty
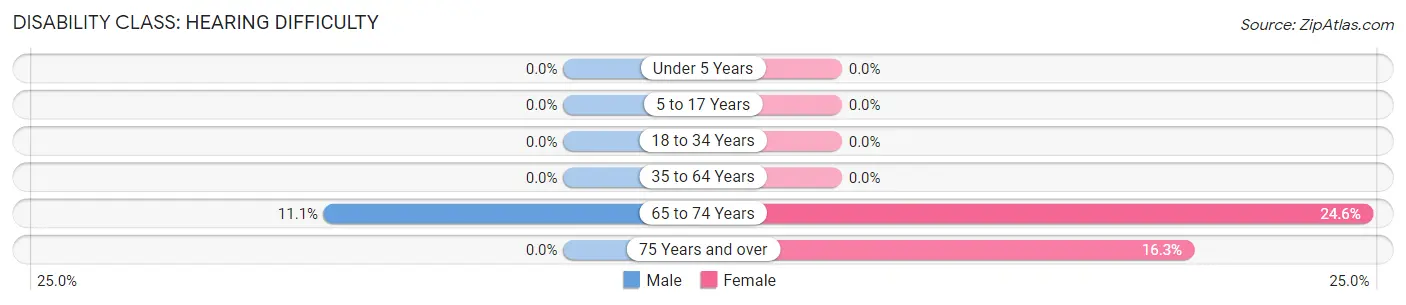
| Age Bracket | Male | Female |
| Under 5 Years | 0 (0.0%) | 0 (0.0%) |
| 5 to 17 Years | 0 (0.0%) | 0 (0.0%) |
| 18 to 34 Years | 0 (0.0%) | 0 (0.0%) |
| 35 to 64 Years | 0 (0.0%) | 0 (0.0%) |
| 65 to 74 Years | 21 (11.1%) | 33 (24.6%) |
| 75 Years and over | 0 (0.0%) | 25 (16.3%) |
Disability Class: Vision Difficulty
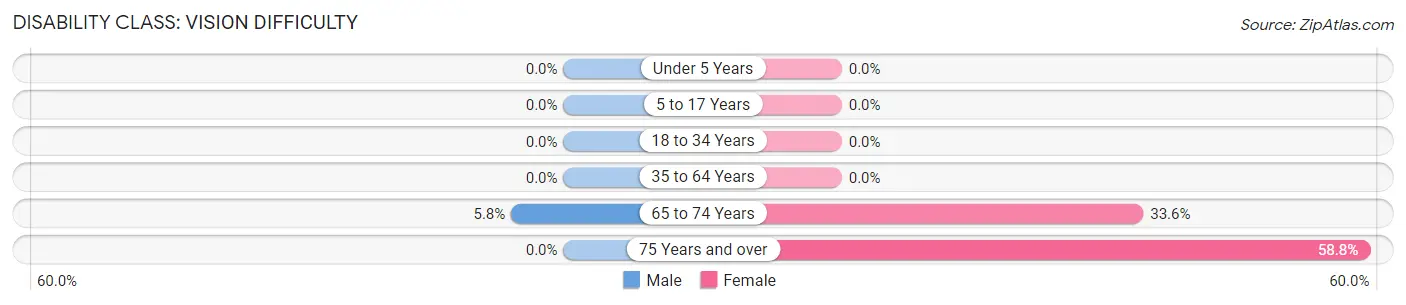
| Age Bracket | Male | Female |
| Under 5 Years | 0 (0.0%) | 0 (0.0%) |
| 5 to 17 Years | 0 (0.0%) | 0 (0.0%) |
| 18 to 34 Years | 0 (0.0%) | 0 (0.0%) |
| 35 to 64 Years | 0 (0.0%) | 0 (0.0%) |
| 65 to 74 Years | 11 (5.8%) | 45 (33.6%) |
| 75 Years and over | 0 (0.0%) | 90 (58.8%) |
Disability Class: Cognitive Difficulty
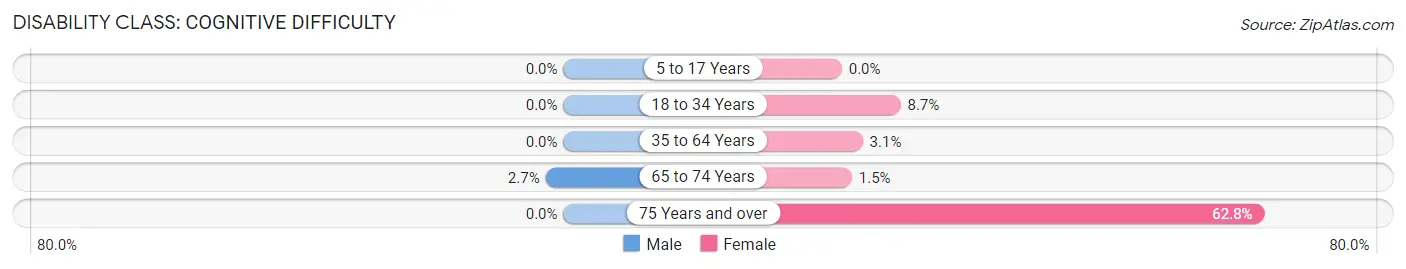
| Age Bracket | Male | Female |
| 5 to 17 Years | 0 (0.0%) | 0 (0.0%) |
| 18 to 34 Years | 0 (0.0%) | 19 (8.7%) |
| 35 to 64 Years | 0 (0.0%) | 11 (3.1%) |
| 65 to 74 Years | 5 (2.6%) | 2 (1.5%) |
| 75 Years and over | 0 (0.0%) | 96 (62.7%) |
Disability Class: Ambulatory Difficulty
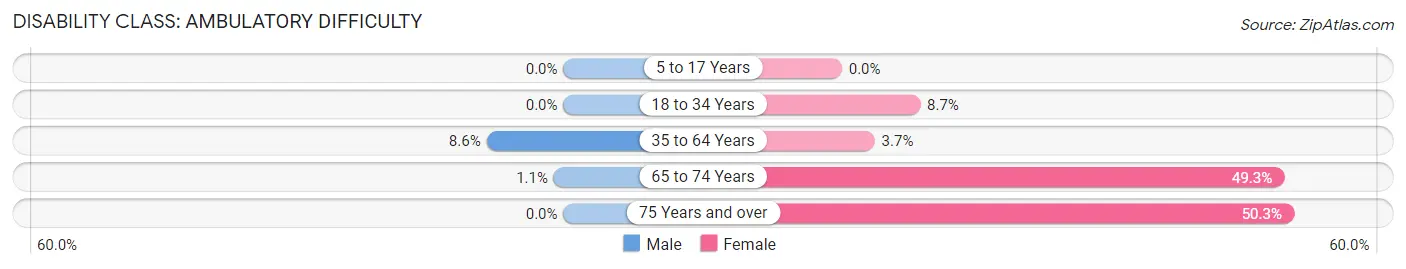
| Age Bracket | Male | Female |
| 5 to 17 Years | 0 (0.0%) | 0 (0.0%) |
| 18 to 34 Years | 0 (0.0%) | 19 (8.7%) |
| 35 to 64 Years | 35 (8.6%) | 13 (3.7%) |
| 65 to 74 Years | 2 (1.1%) | 66 (49.2%) |
| 75 Years and over | 0 (0.0%) | 77 (50.3%) |
Disability Class: Self-Care Difficulty
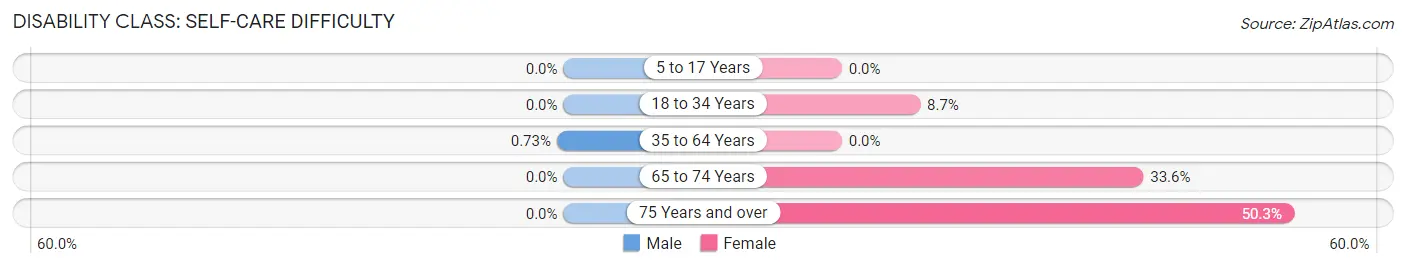
| Age Bracket | Male | Female |
| 5 to 17 Years | 0 (0.0%) | 0 (0.0%) |
| 18 to 34 Years | 0 (0.0%) | 19 (8.7%) |
| 35 to 64 Years | 3 (0.7%) | 0 (0.0%) |
| 65 to 74 Years | 0 (0.0%) | 45 (33.6%) |
| 75 Years and over | 0 (0.0%) | 77 (50.3%) |
Technology Access in Billington Heights
Computing Device Access in Billington Heights
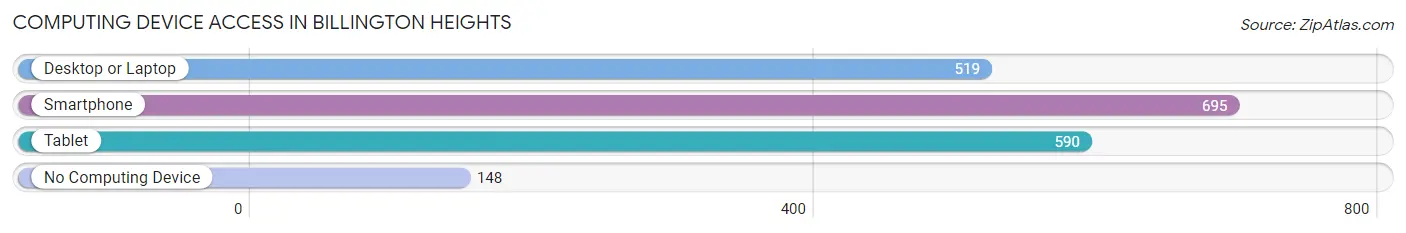
| Device Type | # Households | % Households |
| Desktop or Laptop | 519 | 58.2% |
| Smartphone | 695 | 77.9% |
| Tablet | 590 | 66.1% |
| No Computing Device | 148 | 16.6% |
| Total | 892 | 100.0% |
Internet Access in Billington Heights
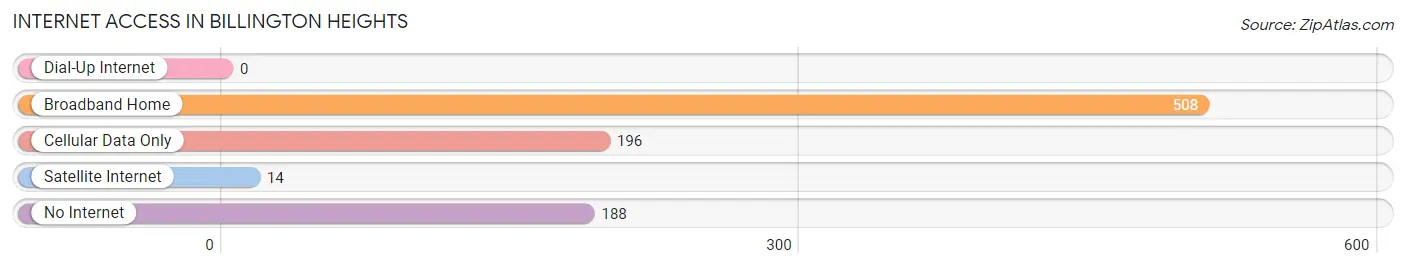
| Internet Type | # Households | % Households |
| Dial-Up Internet | 0 | 0.0% |
| Broadband Home | 508 | 57.0% |
| Cellular Data Only | 196 | 22.0% |
| Satellite Internet | 14 | 1.6% |
| No Internet | 188 | 21.1% |
| Total | 892 | 100.0% |
Billington Heights Summary
Billington Heights is a small hamlet located in the town of Islip in Suffolk County, New York. It is situated on the south shore of Long Island, approximately 50 miles east of New York City. The hamlet is bordered by the hamlets of Baywood, East Islip, and West Islip.
History
The area that is now Billington Heights was originally inhabited by the Secatogue Indians, a sub-tribe of the Montaukett Indians. The Secatogue Indians were a peaceful tribe that lived off the land, fishing and hunting. The first European settlers arrived in the area in the late 1600s. The area was originally known as “Billington’s Neck”, named after the Billington family who were among the first settlers. The Billington family owned a large tract of land in the area and operated a successful farm.
In the late 1800s, the area began to develop as a residential community. The first post office was established in 1891 and the hamlet was officially incorporated in 1895. The hamlet was named after the Billington family and the “Heights” was added to distinguish it from the nearby hamlet of Billington.
Geography
Billington Heights is located on the south shore of Long Island, approximately 50 miles east of New York City. The hamlet is bordered by the hamlets of Baywood, East Islip, and West Islip. The area is mostly flat with some rolling hills. The highest point in the hamlet is located at the intersection of Billington Heights Road and Old Country Road, which is approximately 100 feet above sea level.
The hamlet is located in the Town of Islip, which is part of Suffolk County. The town is bordered by the towns of Babylon, Brookhaven, Huntington, and Smithtown. The hamlet is located within the Islip School District.
Economy
The economy of Billington Heights is largely based on the service industry. The hamlet is home to a variety of restaurants, retail stores, and professional services. The hamlet is also home to a number of small businesses, including a local newspaper, a bakery, and a pet store.
The hamlet is also home to a number of corporate offices, including a regional office of a national insurance company and a regional office of a national bank. The hamlet is also home to a number of medical offices, including a dental office, a physical therapy office, and a chiropractic office.
Demographics
As of the 2010 census, the population of Billington Heights was 5,845. The population is largely white (90.2%) with a small percentage of African Americans (3.2%), Asians (2.3%), and Hispanics (2.2%). The median household income is $90,945 and the median home value is $400,000.
The hamlet is home to a variety of religious denominations, including Catholic, Protestant, Jewish, and Muslim. The hamlet is also home to a variety of cultural organizations, including a local theater group, a community orchestra, and a local art gallery.
Conclusion
Billington Heights is a small hamlet located in the town of Islip in Suffolk County, New York. It is situated on the south shore of Long Island, approximately 50 miles east of New York City. The hamlet is bordered by the hamlets of Baywood, East Islip, and West Islip. The area was originally inhabited by the Secatogue Indians and was later settled by the Billington family in the late 1600s. The hamlet was officially incorporated in 1895 and is now home to a population of 5,845. The economy of Billington Heights is largely based on the service industry and the hamlet is home to a variety of restaurants, retail stores, and professional services. The hamlet is also home to a number of corporate offices and medical offices. The population is largely white (90.2%) with a small percentage of African Americans (3.2%), Asians (2.3%), and Hispanics (2.2%). The median household income is $90,945 and the median home value is $400,000. The hamlet is home to a variety of religious denominations and cultural organizations.
Common Questions
What is Per Capita Income in Billington Heights?
Per Capita income in Billington Heights is $55,235.
What is the Median Family Income in Billington Heights?
Median Family Income in Billington Heights is $140,125.
What is the Median Household income in Billington Heights?
Median Household Income in Billington Heights is $76,750.
What is Inequality or Gini Index in Billington Heights?
Inequality or Gini Index in Billington Heights is 0.49.
What is the Total Population of Billington Heights?
Total Population of Billington Heights is 1,965.
What is the Total Male Population of Billington Heights?
Total Male Population of Billington Heights is 837.
What is the Total Female Population of Billington Heights?
Total Female Population of Billington Heights is 1,128.
What is the Ratio of Males per 100 Females in Billington Heights?
There are 74.20 Males per 100 Females in Billington Heights.
What is the Ratio of Females per 100 Males in Billington Heights?
There are 134.77 Females per 100 Males in Billington Heights.
What is the Median Population Age in Billington Heights?
Median Population Age in Billington Heights is 56.6 Years.
What is the Average Family Size in Billington Heights
Average Family Size in Billington Heights is 3.1 People.
What is the Average Household Size in Billington Heights
Average Household Size in Billington Heights is 2.2 People.
How Large is the Labor Force in Billington Heights?
There are 1,056 People in the Labor Forcein in Billington Heights.
What is the Percentage of People in the Labor Force in Billington Heights?
63.3% of People are in the Labor Force in Billington Heights.
What is the Unemployment Rate in Billington Heights?
Unemployment Rate in Billington Heights is 11.3%.