Belmont, NY Map & Demographics
Belmont Map
Belmont Overview
$31,618
PER CAPITA INCOME
$84,792
AVG FAMILY INCOME
$57,679
AVG HOUSEHOLD INCOME
14.2%
WAGE / INCOME GAP [ % ]
85.8¢/ $1
WAGE / INCOME GAP [ $ ]
0.46
INEQUALITY / GINI INDEX
865
TOTAL POPULATION
432
MALE POPULATION
433
FEMALE POPULATION
99.77
MALES / 100 FEMALES
100.23
FEMALES / 100 MALES
39.9
MEDIAN AGE
3.2
AVG FAMILY SIZE
2.4
AVG HOUSEHOLD SIZE
373
LABOR FORCE [ PEOPLE ]
56.7%
PERCENT IN LABOR FORCE
1.6%
UNEMPLOYMENT RATE
Belmont Zip Codes
Belmont Area Codes
Income in Belmont
Income Overview in Belmont
Per Capita Income in Belmont is $31,618, while median incomes of families and households are $84,792 and $57,679 respectively.
| Characteristic | Number | Measure |
| Per Capita Income | 865 | $31,618 |
| Median Family Income | 179 | $84,792 |
| Mean Family Income | 179 | $97,366 |
| Median Household Income | 344 | $57,679 |
| Mean Household Income | 344 | $73,735 |
| Income Deficit | 179 | $0 |
| Wage / Income Gap (%) | 865 | 14.18% |
| Wage / Income Gap ($) | 865 | 85.82¢ per $1 |
| Gini / Inequality Index | 865 | 0.46 |
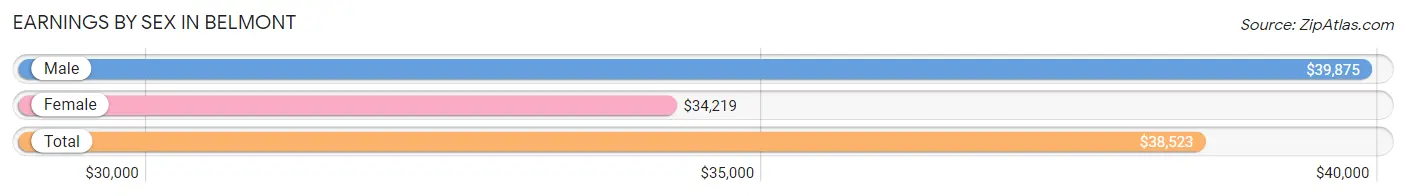
Earnings by Sex in Belmont
Average Earnings in Belmont are $38,523, $39,875 for men and $34,219 for women, a difference of 14.2%.
| Sex | Number | Average Earnings |
| Male | 210 (56.8%) | $39,875 |
| Female | 160 (43.2%) | $34,219 |
| Total | 370 (100.0%) | $38,523 |
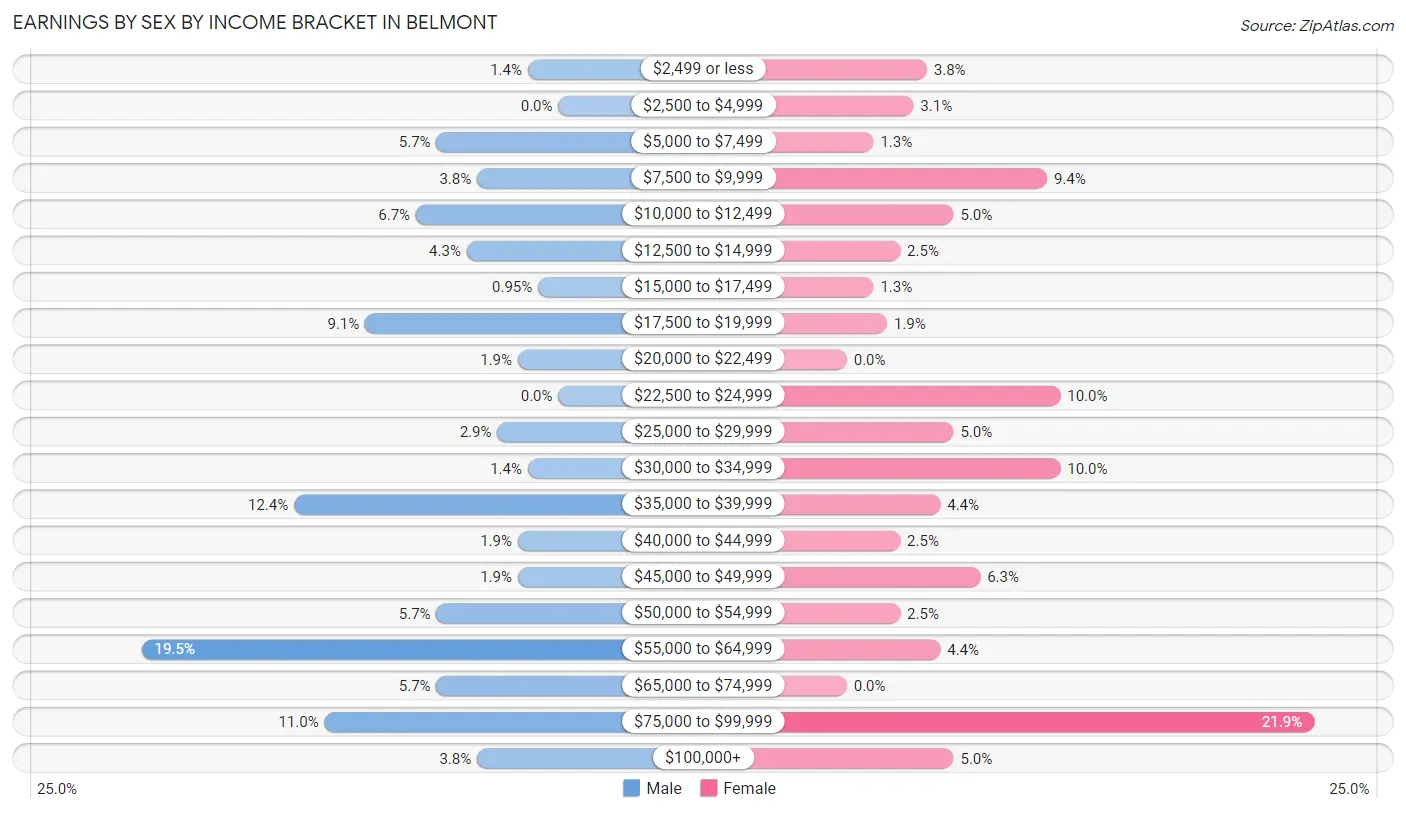
Earnings by Sex by Income Bracket in Belmont
The most common earnings brackets in Belmont are $55,000 to $64,999 for men (41 | 19.5%) and $75,000 to $99,999 for women (35 | 21.9%).
| Income | Male | Female |
| $2,499 or less | 3 (1.4%) | 6 (3.7%) |
| $2,500 to $4,999 | 0 (0.0%) | 5 (3.1%) |
| $5,000 to $7,499 | 12 (5.7%) | 2 (1.3%) |
| $7,500 to $9,999 | 8 (3.8%) | 15 (9.4%) |
| $10,000 to $12,499 | 14 (6.7%) | 8 (5.0%) |
| $12,500 to $14,999 | 9 (4.3%) | 4 (2.5%) |
| $15,000 to $17,499 | 2 (0.9%) | 2 (1.3%) |
| $17,500 to $19,999 | 19 (9.0%) | 3 (1.9%) |
| $20,000 to $22,499 | 4 (1.9%) | 0 (0.0%) |
| $22,500 to $24,999 | 0 (0.0%) | 16 (10.0%) |
| $25,000 to $29,999 | 6 (2.9%) | 8 (5.0%) |
| $30,000 to $34,999 | 3 (1.4%) | 16 (10.0%) |
| $35,000 to $39,999 | 26 (12.4%) | 7 (4.4%) |
| $40,000 to $44,999 | 4 (1.9%) | 4 (2.5%) |
| $45,000 to $49,999 | 4 (1.9%) | 10 (6.2%) |
| $50,000 to $54,999 | 12 (5.7%) | 4 (2.5%) |
| $55,000 to $64,999 | 41 (19.5%) | 7 (4.4%) |
| $65,000 to $74,999 | 12 (5.7%) | 0 (0.0%) |
| $75,000 to $99,999 | 23 (11.0%) | 35 (21.9%) |
| $100,000+ | 8 (3.8%) | 8 (5.0%) |
| Total | 210 (100.0%) | 160 (100.0%) |
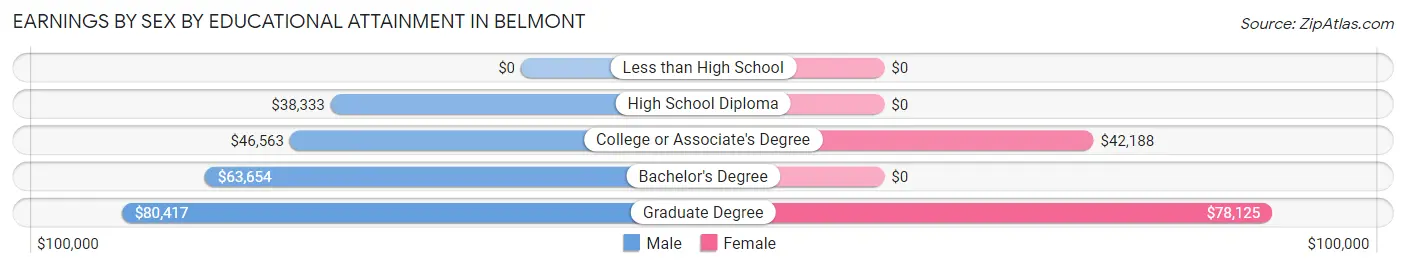
Earnings by Sex by Educational Attainment in Belmont
Average earnings in Belmont are $53,125 for men and $34,609 for women, a difference of 34.8%. Men with an educational attainment of graduate degree enjoy the highest average annual earnings of $80,417, while those with high school diploma education earn the least with $38,333. Women with an educational attainment of graduate degree earn the most with the average annual earnings of $78,125, while those with college or associate's degree education have the smallest earnings of $42,188.
| Educational Attainment | Male Income | Female Income |
| Less than High School | - | - |
| High School Diploma | $38,333 | $0 |
| College or Associate's Degree | $46,563 | $42,188 |
| Bachelor's Degree | $63,654 | $0 |
| Graduate Degree | $80,417 | $78,125 |
| Total | $53,125 | $34,609 |
Family Income in Belmont
Family Income Brackets in Belmont
According to the Belmont family income data, there are 38 families falling into the $50,000 to $74,999 income range, which is the most common income bracket and makes up 21.2% of all families. Conversely, the $25,000 to $34,999 income bracket is the least frequent group with only 3 families (1.7%) belonging to this category.
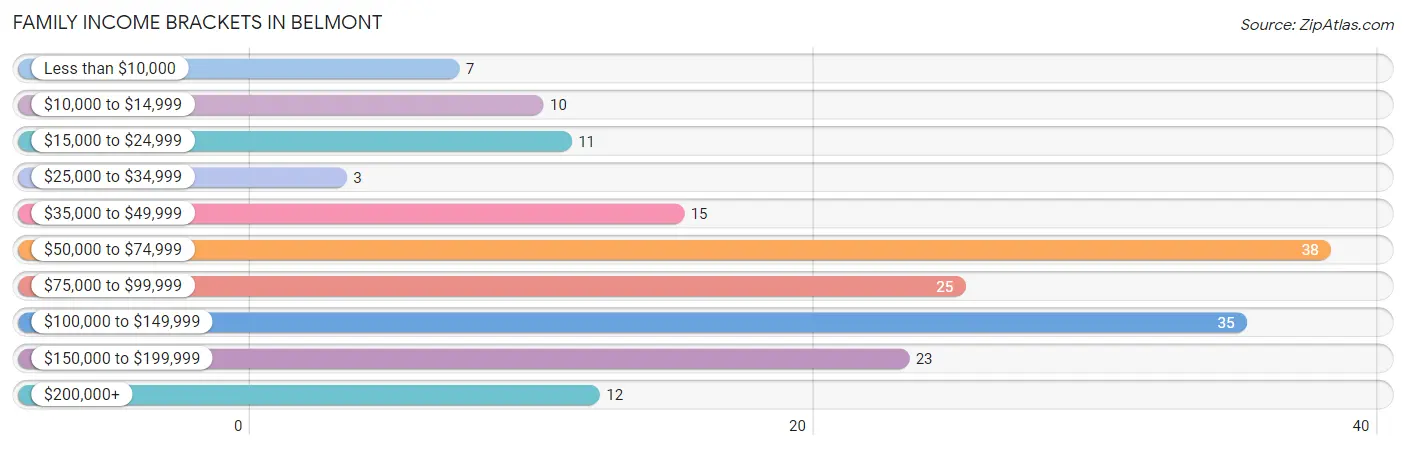
| Income Bracket | # Families | % Families |
| Less than $10,000 | 7 | 3.9% |
| $10,000 to $14,999 | 10 | 5.6% |
| $15,000 to $24,999 | 11 | 6.1% |
| $25,000 to $34,999 | 3 | 1.7% |
| $35,000 to $49,999 | 15 | 8.4% |
| $50,000 to $74,999 | 38 | 21.2% |
| $75,000 to $99,999 | 25 | 14.0% |
| $100,000 to $149,999 | 35 | 19.6% |
| $150,000 to $199,999 | 23 | 12.8% |
| $200,000+ | 12 | 6.7% |
Family Income by Famaliy Size in Belmont
3-person families (78 | 43.6%) account for the highest median family income in Belmont with $91,833 per family, while 2-person families (56 | 31.3%) have the highest median income of $31,875 per family member.
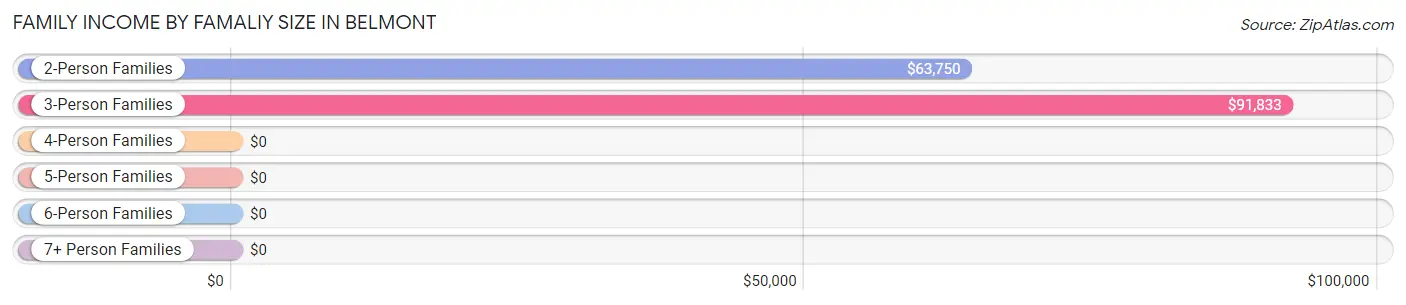
| Income Bracket | # Families | Median Income |
| 2-Person Families | 56 (31.3%) | $63,750 |
| 3-Person Families | 78 (43.6%) | $91,833 |
| 4-Person Families | 45 (25.1%) | $0 |
| 5-Person Families | 0 (0.0%) | $0 |
| 6-Person Families | 0 (0.0%) | $0 |
| 7+ Person Families | 0 (0.0%) | $0 |
| Total | 179 (100.0%) | $84,792 |
Family Income by Number of Earners in Belmont
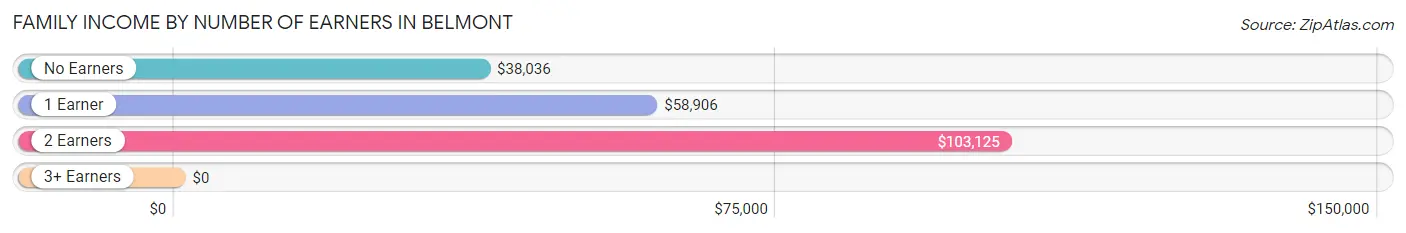
| Number of Earners | # Families | Median Income |
| No Earners | 35 (19.6%) | $38,036 |
| 1 Earner | 55 (30.7%) | $58,906 |
| 2 Earners | 75 (41.9%) | $103,125 |
| 3+ Earners | 14 (7.8%) | $0 |
| Total | 179 (100.0%) | $84,792 |
Household Income in Belmont
Household Income Brackets in Belmont
With 62 households falling in the category, the $50,000 to $74,999 income range is the most frequent in Belmont, accounting for 18.0% of all households. In contrast, only 12 households (3.5%) fall into the $10,000 to $14,999 income bracket, making it the least populous group.
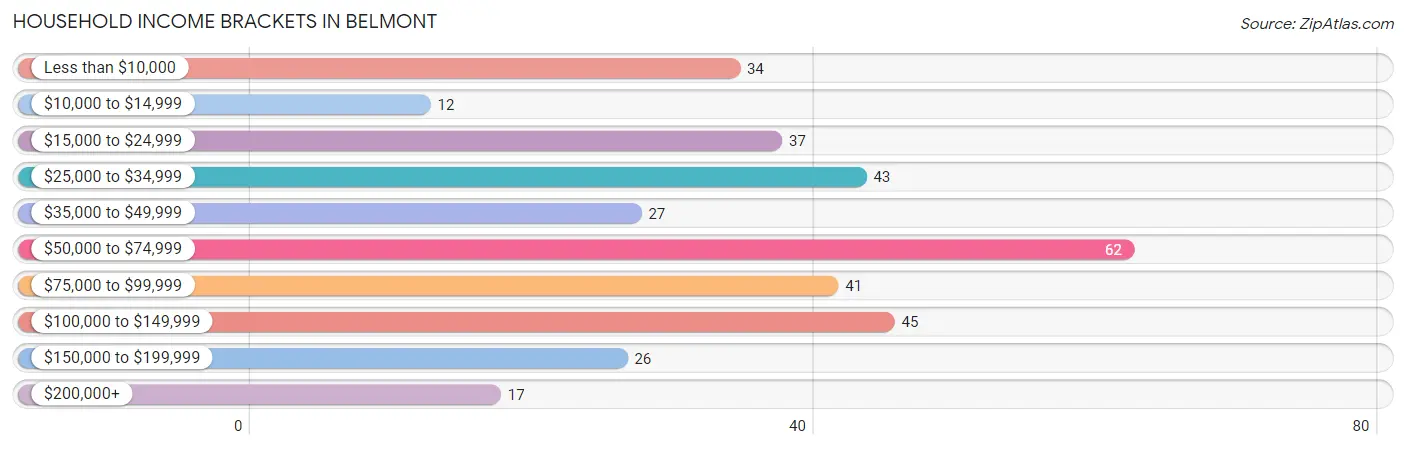
| Income Bracket | # Households | % Households |
| Less than $10,000 | 34 | 9.9% |
| $10,000 to $14,999 | 12 | 3.5% |
| $15,000 to $24,999 | 37 | 10.8% |
| $25,000 to $34,999 | 43 | 12.5% |
| $35,000 to $49,999 | 27 | 7.8% |
| $50,000 to $74,999 | 62 | 18.0% |
| $75,000 to $99,999 | 41 | 11.9% |
| $100,000 to $149,999 | 45 | 13.1% |
| $150,000 to $199,999 | 26 | 7.6% |
| $200,000+ | 17 | 4.9% |
Household Income by Householder Age in Belmont
The median household income in Belmont is $57,679, with the highest median household income of $92,206 found in the 25 to 44 years age bracket for the primary householder. A total of 92 households (26.7%) fall into this category. Meanwhile, the 15 to 24 years age bracket for the primary householder has the lowest median household income of $0, with 5 households (1.5%) in this group.
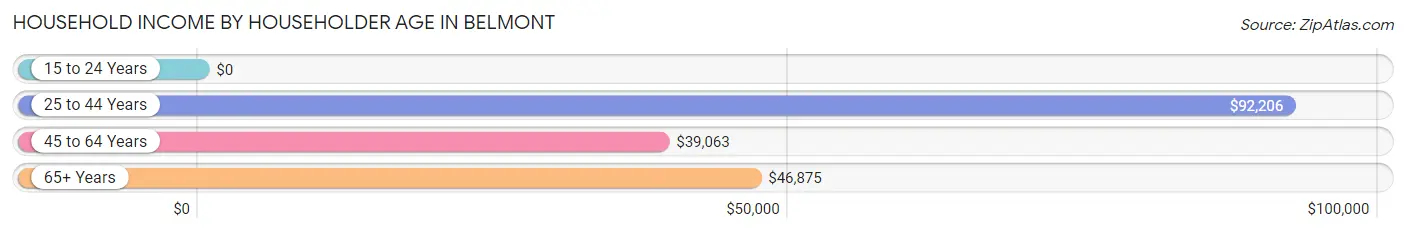
| Income Bracket | # Households | Median Income |
| 15 to 24 Years | 5 (1.5%) | $0 |
| 25 to 44 Years | 92 (26.7%) | $92,206 |
| 45 to 64 Years | 122 (35.5%) | $39,063 |
| 65+ Years | 125 (36.3%) | $46,875 |
| Total | 344 (100.0%) | $57,679 |
Poverty in Belmont
Income Below Poverty by Sex and Age in Belmont
With 14.6% poverty level for males and 27.9% for females among the residents of Belmont, 16 and 17 year old males and under 5 year old females are the most vulnerable to poverty, with 19 males (76.0%) and 9 females (100.0%) in their respective age groups living below the poverty level.
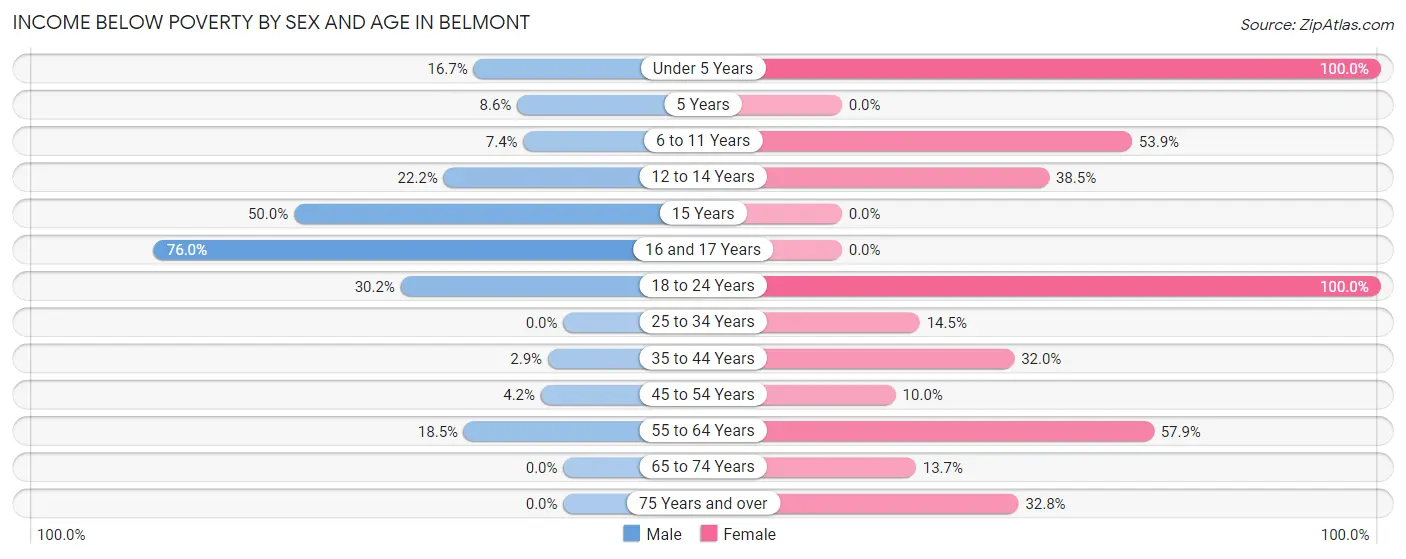
| Age Bracket | Male | Female |
| Under 5 Years | 3 (16.7%) | 9 (100.0%) |
| 5 Years | 3 (8.6%) | 0 (0.0%) |
| 6 to 11 Years | 2 (7.4%) | 7 (53.8%) |
| 12 to 14 Years | 2 (22.2%) | 10 (38.5%) |
| 15 Years | 2 (50.0%) | 0 (0.0%) |
| 16 and 17 Years | 19 (76.0%) | 0 (0.0%) |
| 18 to 24 Years | 16 (30.2%) | 5 (100.0%) |
| 25 to 34 Years | 0 (0.0%) | 11 (14.5%) |
| 35 to 44 Years | 1 (2.9%) | 8 (32.0%) |
| 45 to 54 Years | 2 (4.2%) | 6 (10.0%) |
| 55 to 64 Years | 12 (18.5%) | 22 (57.9%) |
| 65 to 74 Years | 0 (0.0%) | 7 (13.7%) |
| 75 Years and over | 0 (0.0%) | 20 (32.8%) |
| Total | 62 (14.6%) | 105 (27.9%) |
Income Above Poverty by Sex and Age in Belmont
According to the poverty statistics in Belmont, males aged 25 to 34 years and females aged 5 years are the age groups that are most secure financially, with 100.0% of males and 100.0% of females in these age groups living above the poverty line.
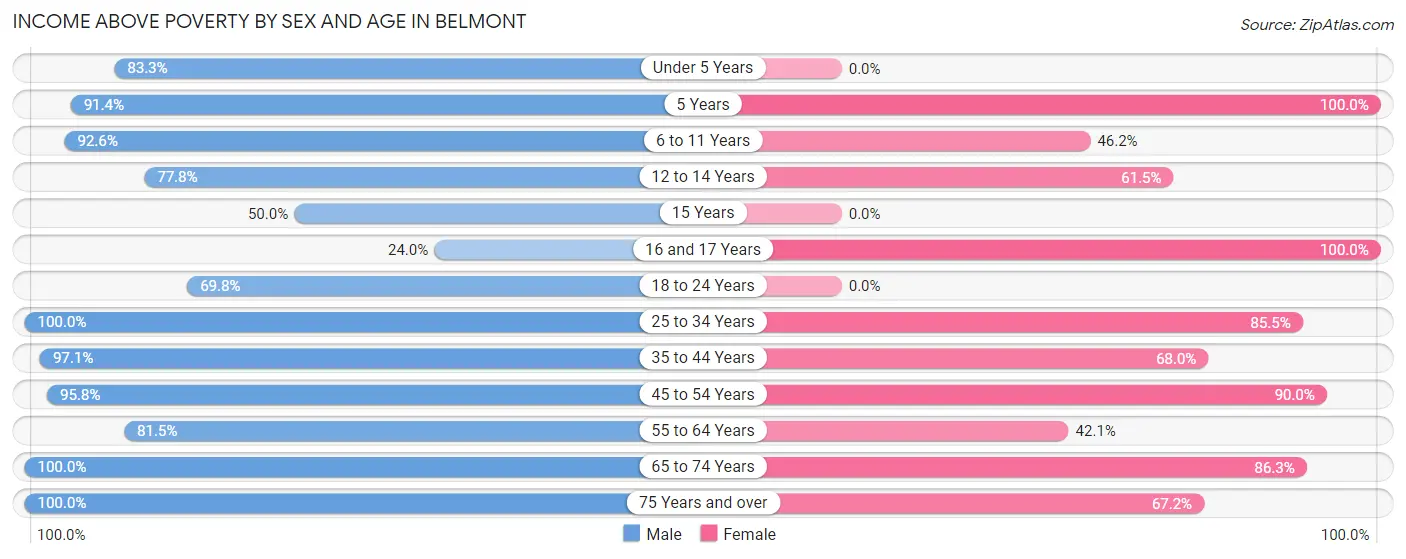
| Age Bracket | Male | Female |
| Under 5 Years | 15 (83.3%) | 0 (0.0%) |
| 5 Years | 32 (91.4%) | 2 (100.0%) |
| 6 to 11 Years | 25 (92.6%) | 6 (46.2%) |
| 12 to 14 Years | 7 (77.8%) | 16 (61.5%) |
| 15 Years | 2 (50.0%) | 0 (0.0%) |
| 16 and 17 Years | 6 (24.0%) | 11 (100.0%) |
| 18 to 24 Years | 37 (69.8%) | 0 (0.0%) |
| 25 to 34 Years | 31 (100.0%) | 65 (85.5%) |
| 35 to 44 Years | 34 (97.1%) | 17 (68.0%) |
| 45 to 54 Years | 46 (95.8%) | 54 (90.0%) |
| 55 to 64 Years | 53 (81.5%) | 16 (42.1%) |
| 65 to 74 Years | 37 (100.0%) | 44 (86.3%) |
| 75 Years and over | 37 (100.0%) | 41 (67.2%) |
| Total | 362 (85.4%) | 272 (72.2%) |
Income Below Poverty Among Married-Couple Families in Belmont
The poverty statistics for married-couple families in Belmont show that 0.7% or 1 of the total 133 families live below the poverty line. Families with no children have the highest poverty rate of 1.7%, comprising of 1 families. On the other hand, families with 1 or 2 children have the lowest poverty rate of 0.0%, which includes 0 families.
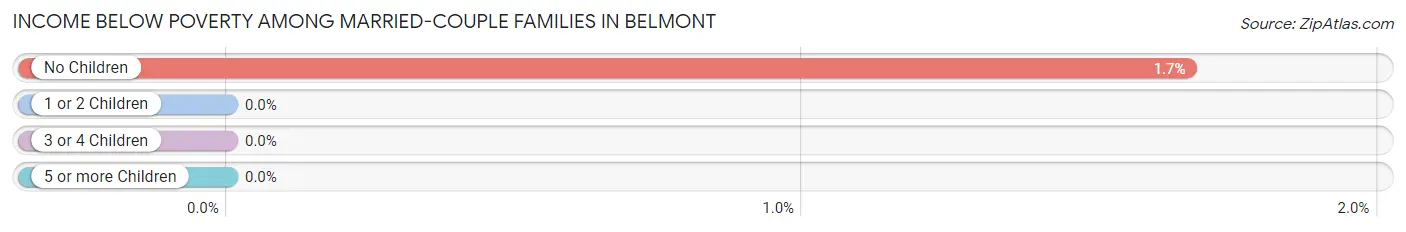
| Children | Above Poverty | Below Poverty |
| No Children | 59 (98.3%) | 1 (1.7%) |
| 1 or 2 Children | 73 (100.0%) | 0 (0.0%) |
| 3 or 4 Children | 0 (0.0%) | 0 (0.0%) |
| 5 or more Children | 0 (0.0%) | 0 (0.0%) |
| Total | 132 (99.3%) | 1 (0.7%) |
Income Below Poverty Among Single-Parent Households in Belmont
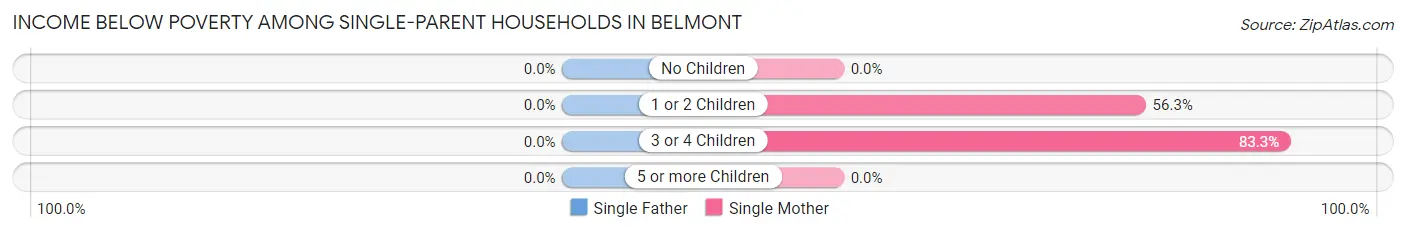
| Children | Single Father | Single Mother |
| No Children | 0 (0.0%) | 0 (0.0%) |
| 1 or 2 Children | 0 (0.0%) | 9 (56.2%) |
| 3 or 4 Children | 0 (0.0%) | 15 (83.3%) |
| 5 or more Children | 0 (0.0%) | 0 (0.0%) |
| Total | 0 (0.0%) | 24 (66.7%) |
Income Below Poverty Among Married-Couple vs Single-Parent Households in Belmont
The poverty data for Belmont shows that 1 of the married-couple family households (0.7%) and 24 of the single-parent households (52.2%) are living below the poverty level. Within the married-couple family households, those with no children have the highest poverty rate, with 1 households (1.7%) falling below the poverty line. Among the single-parent households, those with 3 or 4 children have the highest poverty rate, with 15 household (83.3%) living below poverty.
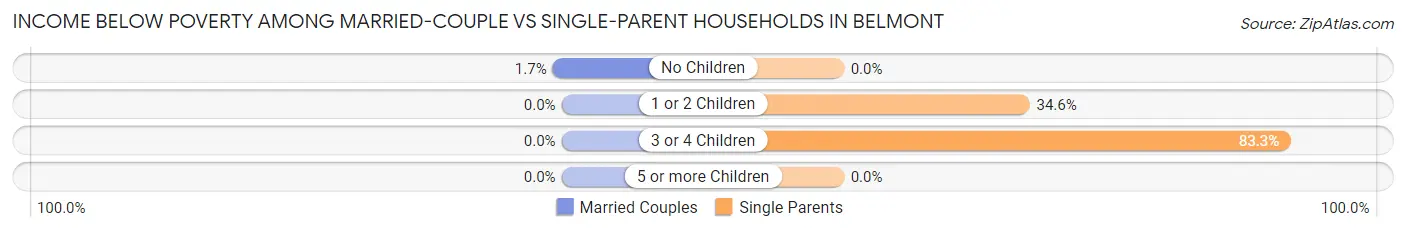
| Children | Married-Couple Families | Single-Parent Households |
| No Children | 1 (1.7%) | 0 (0.0%) |
| 1 or 2 Children | 0 (0.0%) | 9 (34.6%) |
| 3 or 4 Children | 0 (0.0%) | 15 (83.3%) |
| 5 or more Children | 0 (0.0%) | 0 (0.0%) |
| Total | 1 (0.7%) | 24 (52.2%) |
Race in Belmont
The most populous races in Belmont are White / Caucasian (854 | 98.7%), Two or more Races (11 | 1.3%), and Hispanic or Latino (6 | 0.7%).
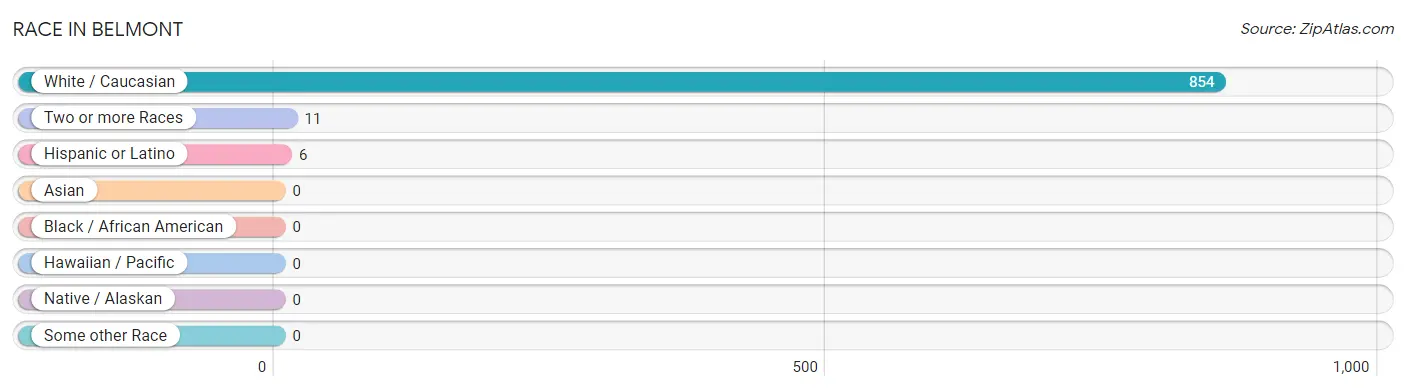
| Race | # Population | % Population |
| Asian | 0 | 0.0% |
| Black / African American | 0 | 0.0% |
| Hawaiian / Pacific | 0 | 0.0% |
| Hispanic or Latino | 6 | 0.7% |
| Native / Alaskan | 0 | 0.0% |
| White / Caucasian | 854 | 98.7% |
| Two or more Races | 11 | 1.3% |
| Some other Race | 0 | 0.0% |
| Total | 865 | 100.0% |
Ancestry in Belmont
The most populous ancestries reported in Belmont are German (267 | 30.9%), English (207 | 23.9%), Irish (168 | 19.4%), Italian (86 | 9.9%), and American (55 | 6.4%), together accounting for 90.5% of all Belmont residents.
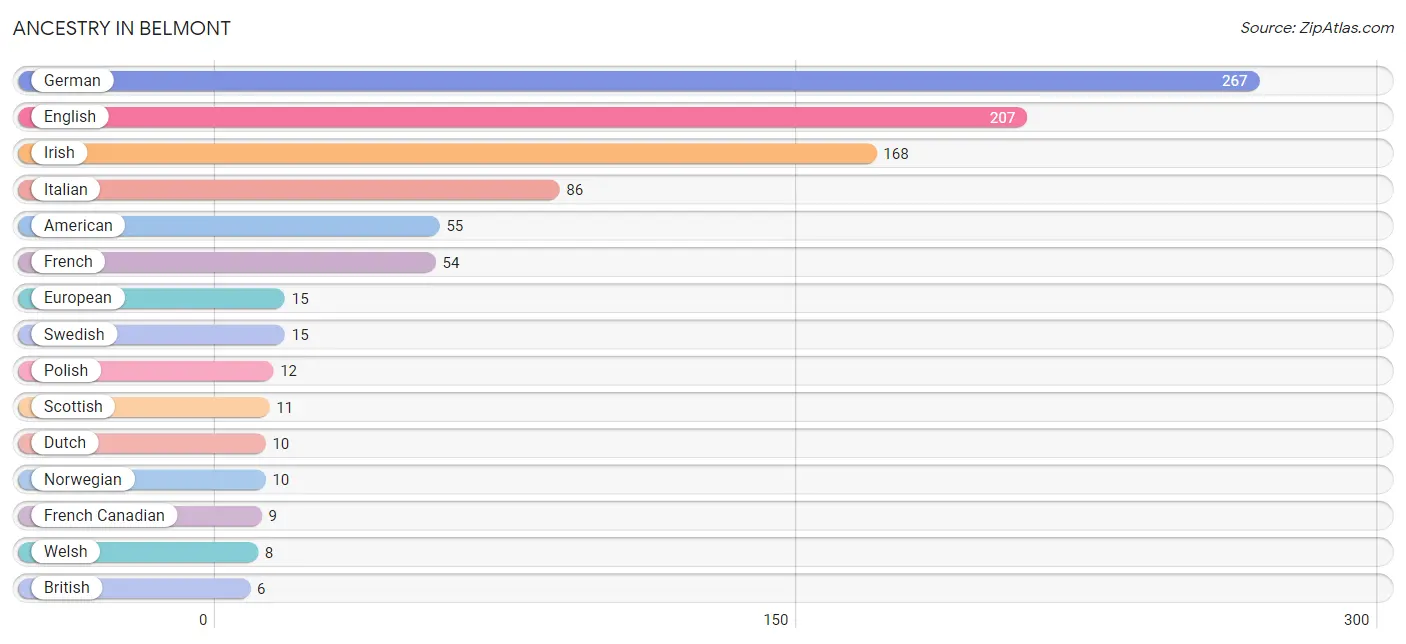
| Ancestry | # Population | % Population |
| American | 55 | 6.4% |
| British | 6 | 0.7% |
| Czech | 4 | 0.5% |
| Danish | 2 | 0.2% |
| Dutch | 10 | 1.2% |
| English | 207 | 23.9% |
| European | 15 | 1.7% |
| French | 54 | 6.2% |
| French Canadian | 9 | 1.0% |
| German | 267 | 30.9% |
| Hungarian | 3 | 0.4% |
| Irish | 168 | 19.4% |
| Italian | 86 | 9.9% |
| Norwegian | 10 | 1.2% |
| Pennsylvania German | 3 | 0.4% |
| Polish | 12 | 1.4% |
| Puerto Rican | 5 | 0.6% |
| Scottish | 11 | 1.3% |
| Slavic | 2 | 0.2% |
| Slovak | 2 | 0.2% |
| South American | 1 | 0.1% |
| Swedish | 15 | 1.7% |
| Venezuelan | 1 | 0.1% |
| Welsh | 8 | 0.9% | View All 24 Rows |
Immigrants in Belmont
The most numerous immigrant groups reported in Belmont came from England (5 | 0.6%), Europe (5 | 0.6%), Northern Europe (5 | 0.6%), Latin America (1 | 0.1%), and South America (1 | 0.1%), together accounting for 2.0% of all Belmont residents.
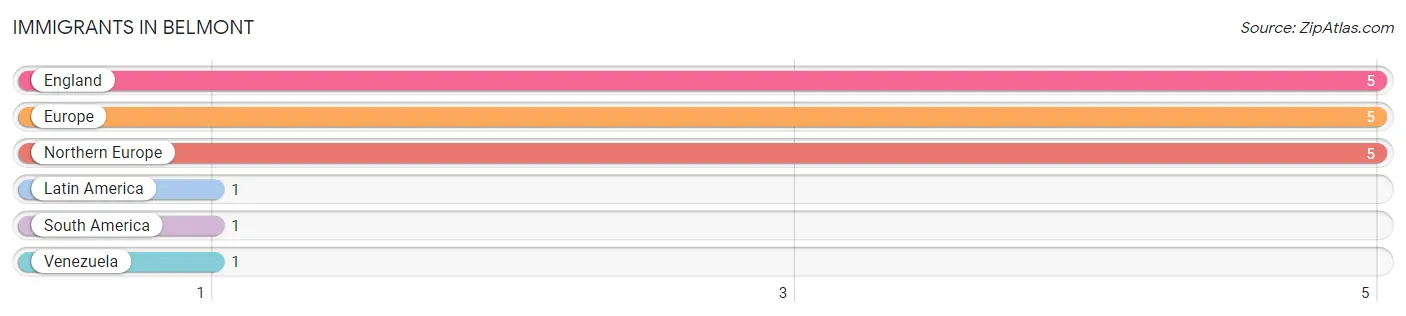
| Immigration Origin | # Population | % Population |
| England | 5 | 0.6% |
| Europe | 5 | 0.6% |
| Latin America | 1 | 0.1% |
| Northern Europe | 5 | 0.6% |
| South America | 1 | 0.1% |
| Venezuela | 1 | 0.1% | View All 6 Rows |
Sex and Age in Belmont
Sex and Age in Belmont
The most populous age groups in Belmont are 5 to 9 Years (44 | 10.2%) for men and Under 5 Years (58 | 13.4%) for women.
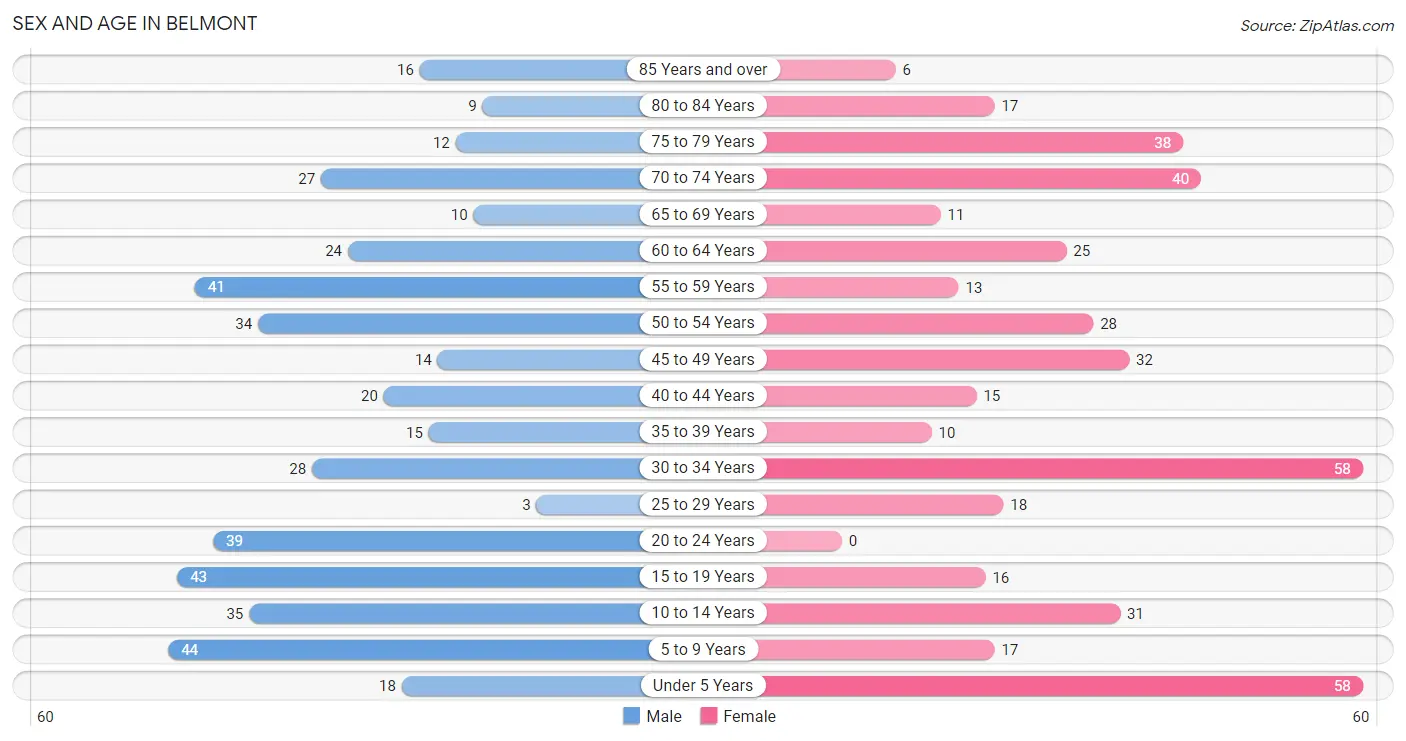
| Age Bracket | Male | Female |
| Under 5 Years | 18 (4.2%) | 58 (13.4%) |
| 5 to 9 Years | 44 (10.2%) | 17 (3.9%) |
| 10 to 14 Years | 35 (8.1%) | 31 (7.2%) |
| 15 to 19 Years | 43 (10.0%) | 16 (3.7%) |
| 20 to 24 Years | 39 (9.0%) | 0 (0.0%) |
| 25 to 29 Years | 3 (0.7%) | 18 (4.2%) |
| 30 to 34 Years | 28 (6.5%) | 58 (13.4%) |
| 35 to 39 Years | 15 (3.5%) | 10 (2.3%) |
| 40 to 44 Years | 20 (4.6%) | 15 (3.5%) |
| 45 to 49 Years | 14 (3.2%) | 32 (7.4%) |
| 50 to 54 Years | 34 (7.9%) | 28 (6.5%) |
| 55 to 59 Years | 41 (9.5%) | 13 (3.0%) |
| 60 to 64 Years | 24 (5.6%) | 25 (5.8%) |
| 65 to 69 Years | 10 (2.3%) | 11 (2.5%) |
| 70 to 74 Years | 27 (6.2%) | 40 (9.2%) |
| 75 to 79 Years | 12 (2.8%) | 38 (8.8%) |
| 80 to 84 Years | 9 (2.1%) | 17 (3.9%) |
| 85 Years and over | 16 (3.7%) | 6 (1.4%) |
| Total | 432 (100.0%) | 433 (100.0%) |
Families and Households in Belmont
Median Family Size in Belmont
The median family size in Belmont is 3.20 persons per family, with single male/father families (10 | 5.6%) accounting for the largest median family size of 4.1 persons per family. On the other hand, married-couple families (133 | 74.3%) represent the smallest median family size with 2.98 persons per family.
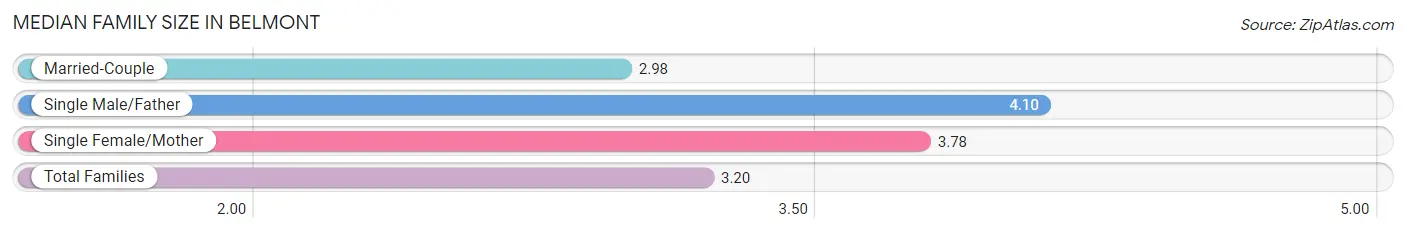
| Family Type | # Families | Family Size |
| Married-Couple | 133 (74.3%) | 2.98 |
| Single Male/Father | 10 (5.6%) | 4.10 |
| Single Female/Mother | 36 (20.1%) | 3.78 |
| Total Families | 179 (100.0%) | 3.20 |
Median Household Size in Belmont
The median household size in Belmont is 2.43 persons per household, with single female/mother households (36 | 10.5%) accounting for the largest median household size of 4.19 persons per household. non-family households (165 | 48.0%) represent the smallest median household size with 1.19 persons per household.
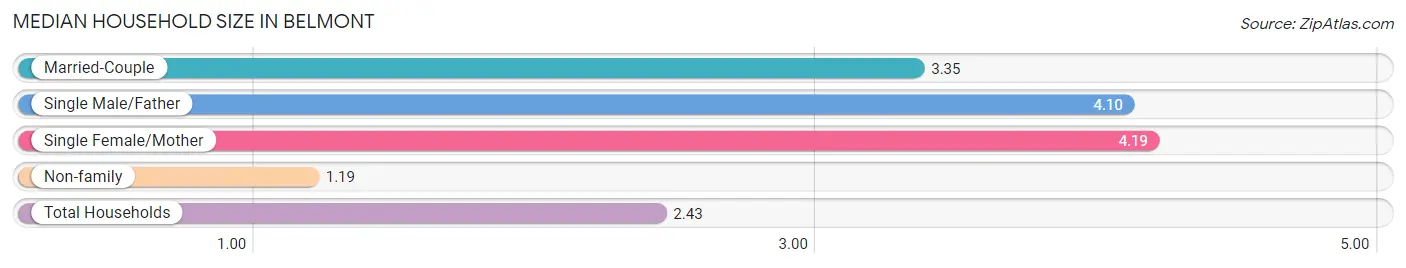
| Household Type | # Households | Household Size |
| Married-Couple | 133 (38.7%) | 3.35 |
| Single Male/Father | 10 (2.9%) | 4.10 |
| Single Female/Mother | 36 (10.5%) | 4.19 |
| Non-family | 165 (48.0%) | 1.19 |
| Total Households | 344 (100.0%) | 2.43 |
Household Size by Marriage Status in Belmont
Out of a total of 344 households in Belmont, 179 (52.0%) are family households, while 165 (48.0%) are nonfamily households. The most numerous type of family households are 3-person households, comprising 68, and the most common type of nonfamily households are 1-person households, comprising 139.
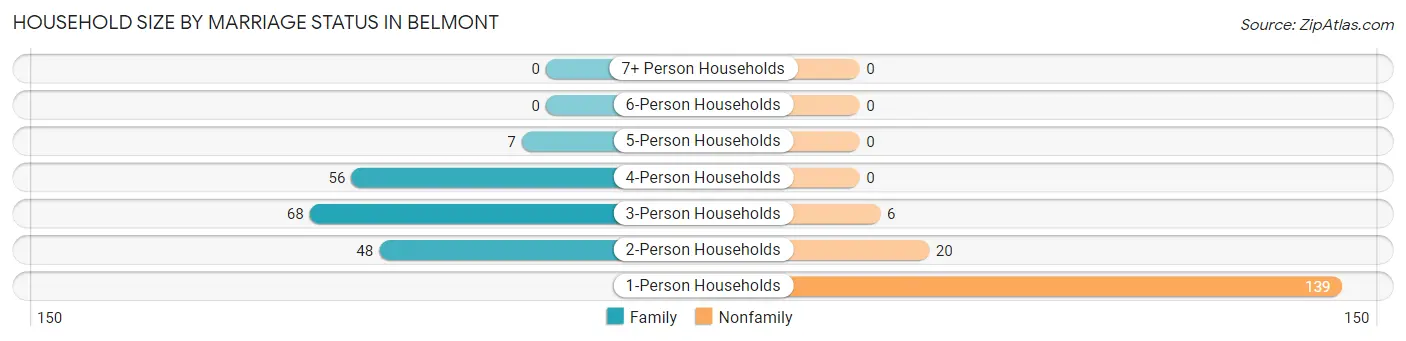
| Household Size | Family Households | Nonfamily Households |
| 1-Person Households | - | 139 (40.4%) |
| 2-Person Households | 48 (14.0%) | 20 (5.8%) |
| 3-Person Households | 68 (19.8%) | 6 (1.7%) |
| 4-Person Households | 56 (16.3%) | 0 (0.0%) |
| 5-Person Households | 7 (2.0%) | 0 (0.0%) |
| 6-Person Households | 0 (0.0%) | 0 (0.0%) |
| 7+ Person Households | 0 (0.0%) | 0 (0.0%) |
| Total | 179 (52.0%) | 165 (48.0%) |
Female Fertility in Belmont
Fertility by Age in Belmont
Average fertility rate in Belmont is 13.0 births per 1,000 women. Women in the age bracket of 20 to 34 years have the highest fertility rate with 26.0 births per 1,000 women. Women in the age bracket of 20 to 34 years acount for 100.0% of all women with births.
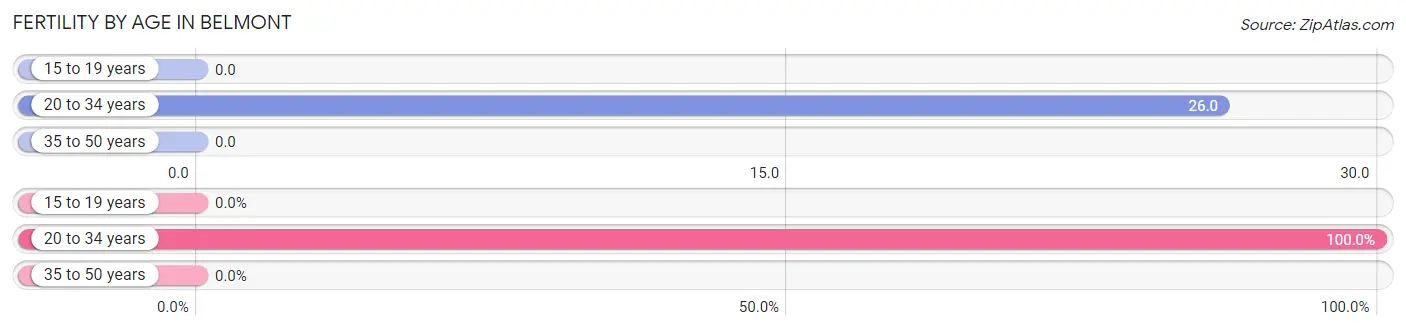
| Age Bracket | Women with Births | Births / 1,000 Women |
| 15 to 19 years | 0 (0.0%) | 0.0 |
| 20 to 34 years | 2 (100.0%) | 26.0 |
| 35 to 50 years | 0 (0.0%) | 0.0 |
| Total | 2 (100.0%) | 13.0 |
Fertility by Age by Marriage Status in Belmont
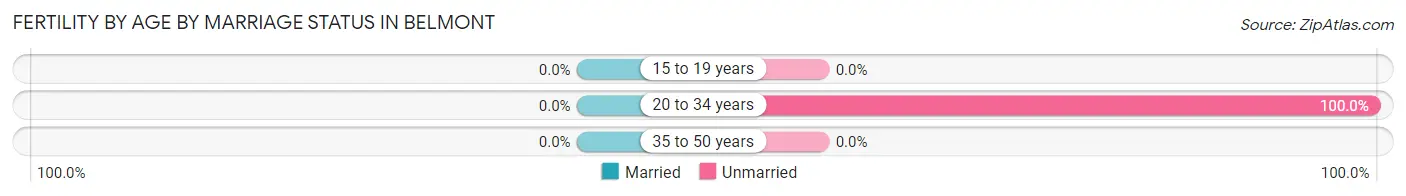
| Age Bracket | Married | Unmarried |
| 15 to 19 years | 0 (0.0%) | 0 (0.0%) |
| 20 to 34 years | 0 (0.0%) | 2 (100.0%) |
| 35 to 50 years | 0 (0.0%) | 0 (0.0%) |
| Total | 0 (0.0%) | 2 (100.0%) |
Fertility by Education in Belmont
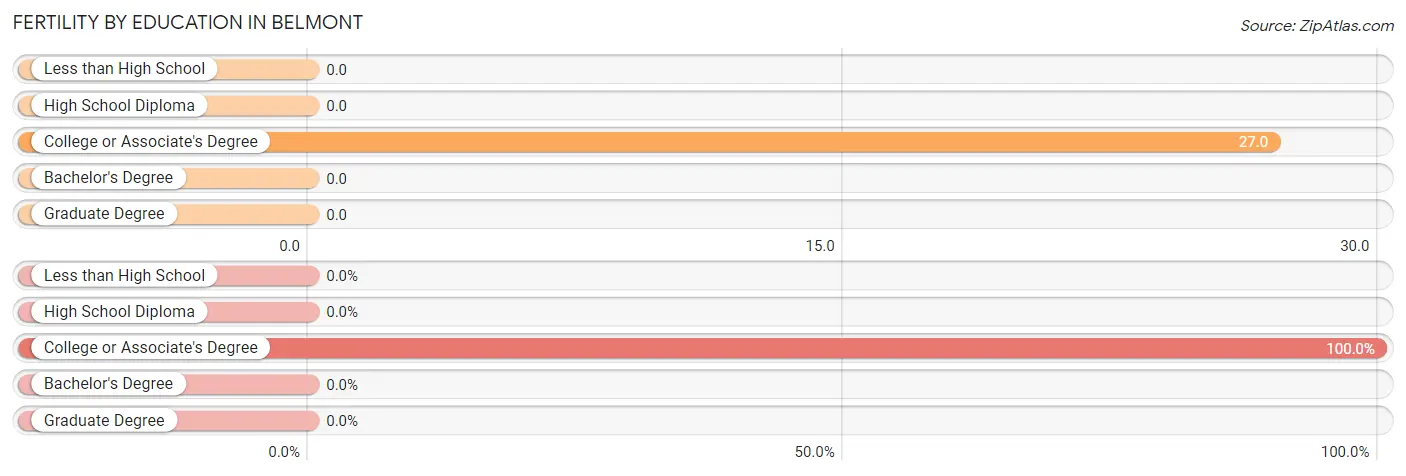
| Educational Attainment | Women with Births | Births / 1,000 Women |
| Less than High School | 0 (0.0%) | 0.0 |
| High School Diploma | 0 (0.0%) | 0.0 |
| College or Associate's Degree | 2 (100.0%) | 27.0 |
| Bachelor's Degree | 0 (0.0%) | 0.0 |
| Graduate Degree | 0 (0.0%) | 0.0 |
| Total | 2 (100.0%) | 13.0 |
Fertility by Education by Marriage Status in Belmont
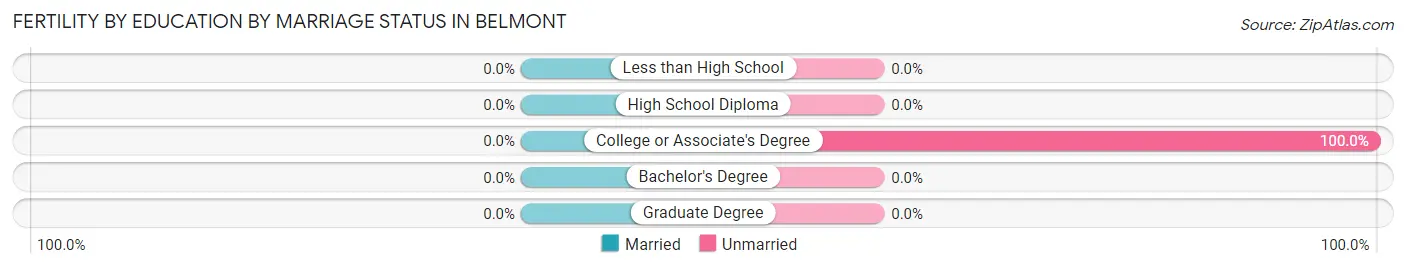
| Educational Attainment | Married | Unmarried |
| Less than High School | 0 (0.0%) | 0 (0.0%) |
| High School Diploma | 0 (0.0%) | 0 (0.0%) |
| College or Associate's Degree | 0 (0.0%) | 2 (100.0%) |
| Bachelor's Degree | 0 (0.0%) | 0 (0.0%) |
| Graduate Degree | 0 (0.0%) | 0 (0.0%) |
| Total | 0 (0.0%) | 2 (100.0%) |
Employment Characteristics in Belmont
Employment by Class of Employer in Belmont
Among the 360 employed individuals in Belmont, private company employees (161 | 44.7%), local government employees (96 | 26.7%), and state government employees (40 | 11.1%) make up the most common classes of employment.
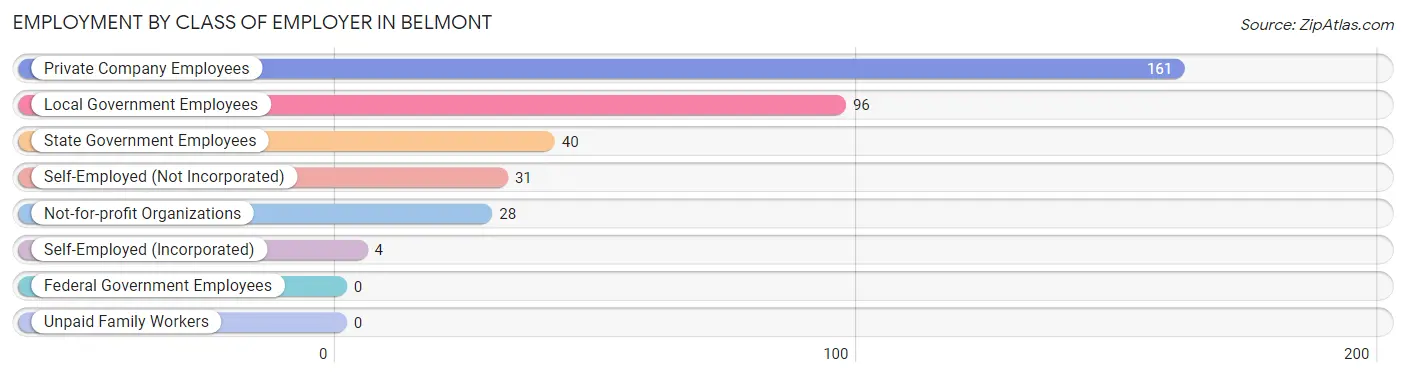
| Employer Class | # Employees | % Employees |
| Private Company Employees | 161 | 44.7% |
| Self-Employed (Incorporated) | 4 | 1.1% |
| Self-Employed (Not Incorporated) | 31 | 8.6% |
| Not-for-profit Organizations | 28 | 7.8% |
| Local Government Employees | 96 | 26.7% |
| State Government Employees | 40 | 11.1% |
| Federal Government Employees | 0 | 0.0% |
| Unpaid Family Workers | 0 | 0.0% |
| Total | 360 | 100.0% |
Employment Status by Age in Belmont
According to the labor force statistics for Belmont, out of the total population over 16 years of age (658), 56.7% or 373 individuals are in the labor force, with 1.6% or 6 of them unemployed. The age group with the highest labor force participation rate is 30 to 34 years, with 94.2% or 81 individuals in the labor force. Within the labor force, the 16 to 19 years age range has the highest percentage of unemployed individuals, with 13.6% or 3 of them being unemployed.
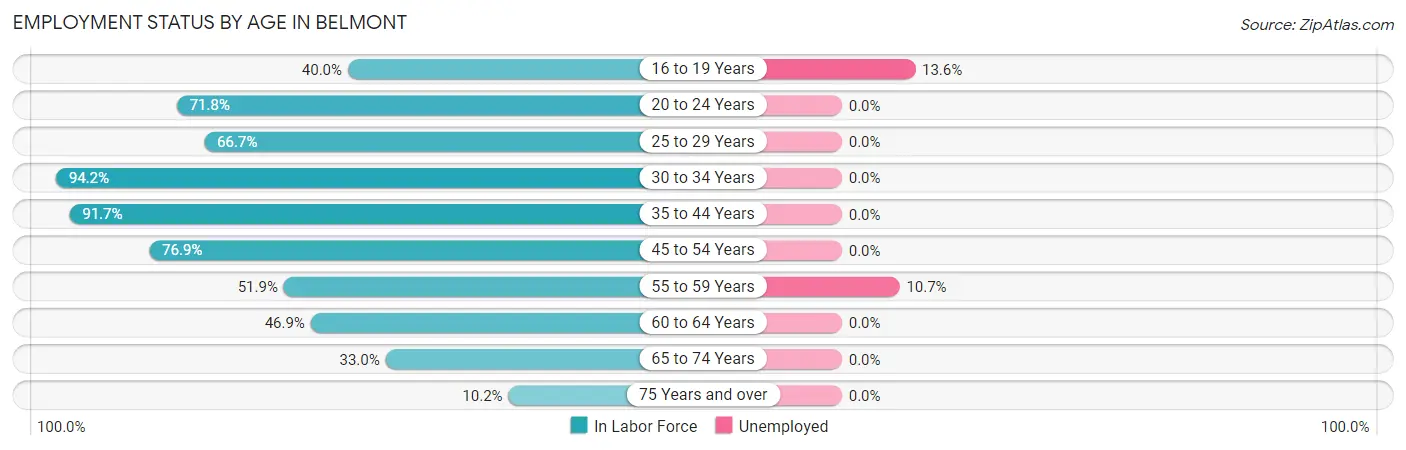
| Age Bracket | In Labor Force | Unemployed |
| 16 to 19 Years | 22 (40.0%) | 3 (13.6%) |
| 20 to 24 Years | 28 (71.8%) | 0 (0.0%) |
| 25 to 29 Years | 14 (66.7%) | 0 (0.0%) |
| 30 to 34 Years | 81 (94.2%) | 0 (0.0%) |
| 35 to 44 Years | 55 (91.7%) | 0 (0.0%) |
| 45 to 54 Years | 83 (76.9%) | 0 (0.0%) |
| 55 to 59 Years | 28 (51.9%) | 3 (10.7%) |
| 60 to 64 Years | 23 (46.9%) | 0 (0.0%) |
| 65 to 74 Years | 29 (33.0%) | 0 (0.0%) |
| 75 Years and over | 10 (10.2%) | 0 (0.0%) |
| Total | 373 (56.7%) | 6 (1.6%) |
Employment Status by Educational Attainment in Belmont
According to labor force statistics for Belmont, 75.1% of individuals (284) out of the total population between 25 and 64 years of age (378) are in the labor force, with 1.1% or 3 of them being unemployed. The group with the highest labor force participation rate are those with the educational attainment of bachelor's degree or higher, with 89.1% or 90 individuals in the labor force. Within the labor force, individuals with high school diploma education have the highest percentage of unemployment, with 4.0% or 3 of them being unemployed.
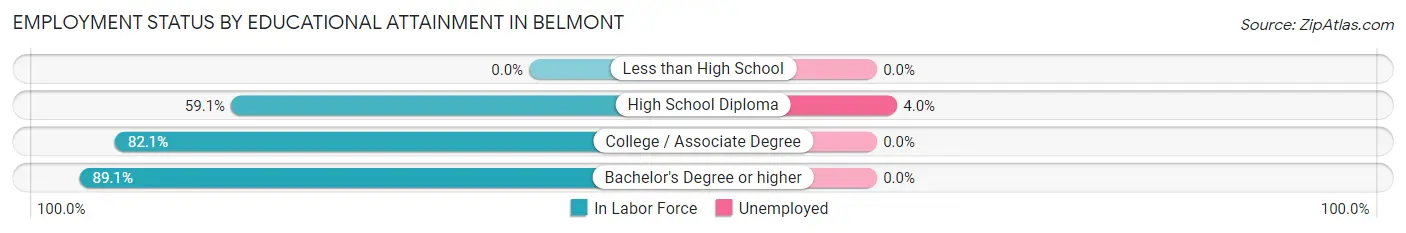
| Educational Attainment | In Labor Force | Unemployed |
| Less than High School | 0 (0.0%) | 0 (0.0%) |
| High School Diploma | 75 (59.1%) | 5 (4.0%) |
| College / Associate Degree | 119 (82.1%) | 0 (0.0%) |
| Bachelor's Degree or higher | 90 (89.1%) | 0 (0.0%) |
| Total | 284 (75.1%) | 4 (1.1%) |
Employment Occupations by Sex in Belmont
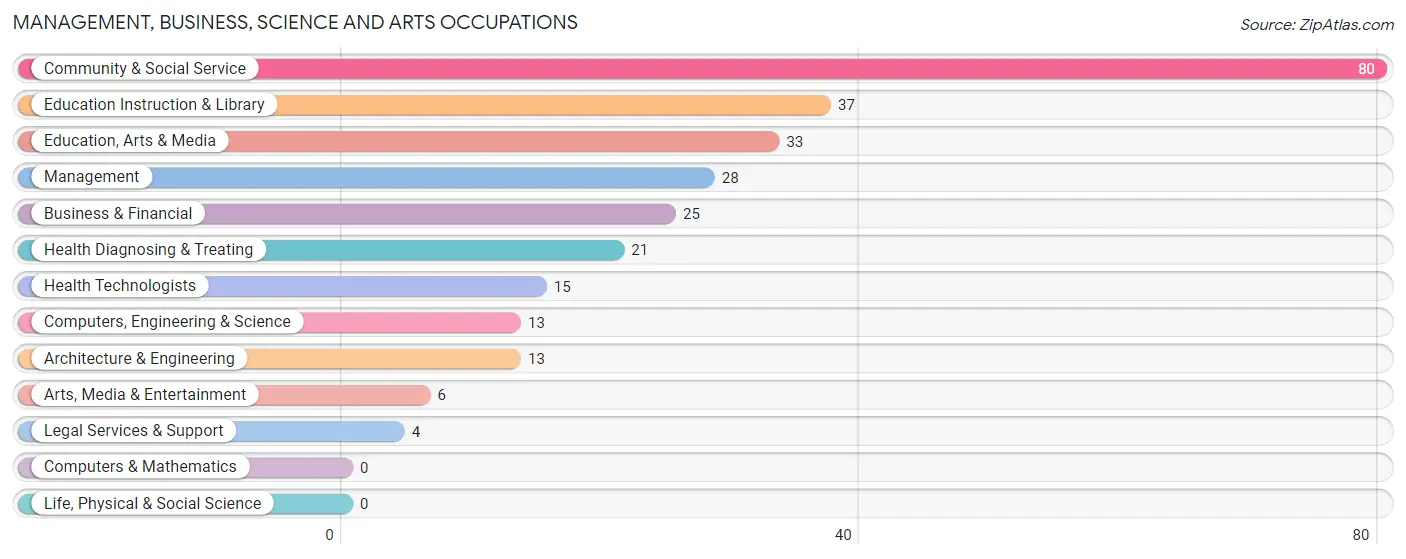
Management, Business, Science and Arts Occupations
The most common Management, Business, Science and Arts occupations in Belmont are Community & Social Service (80 | 21.8%), Education Instruction & Library (37 | 10.1%), Education, Arts & Media (33 | 9.0%), Management (28 | 7.6%), and Business & Financial (25 | 6.8%).
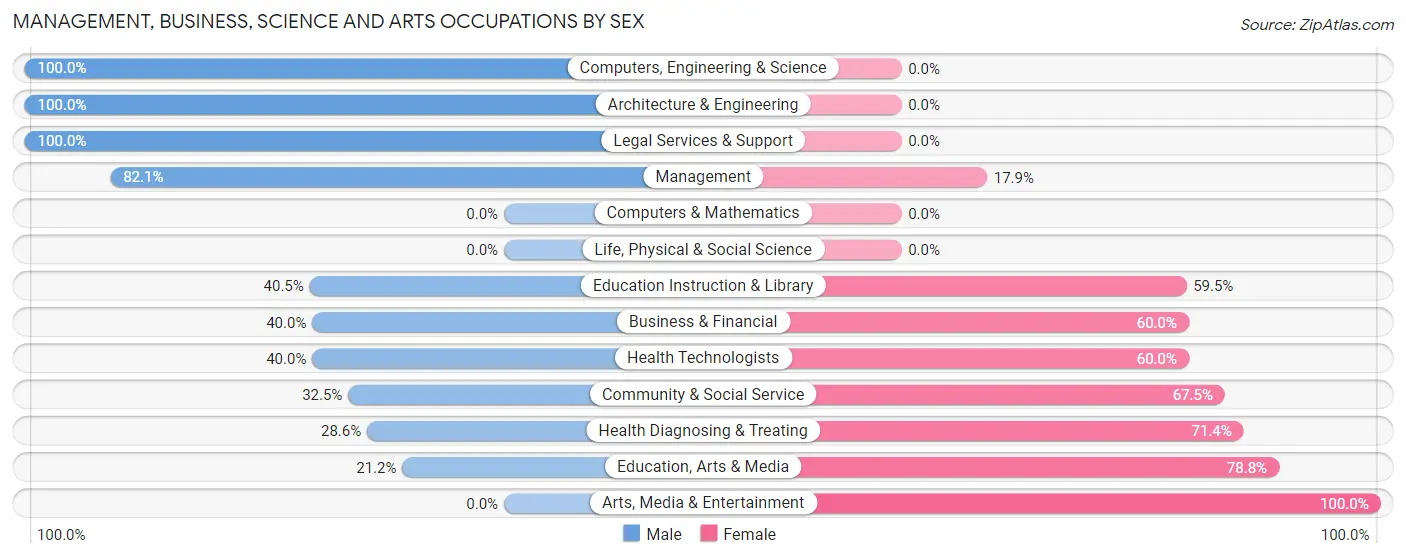
Management, Business, Science and Arts Occupations by Sex
Within the Management, Business, Science and Arts occupations in Belmont, the most male-oriented occupations are Computers, Engineering & Science (100.0%), Architecture & Engineering (100.0%), and Legal Services & Support (100.0%), while the most female-oriented occupations are Arts, Media & Entertainment (100.0%), Education, Arts & Media (78.8%), and Health Diagnosing & Treating (71.4%).
| Occupation | Male | Female |
| Management | 23 (82.1%) | 5 (17.9%) |
| Business & Financial | 10 (40.0%) | 15 (60.0%) |
| Computers, Engineering & Science | 13 (100.0%) | 0 (0.0%) |
| Computers & Mathematics | 0 (0.0%) | 0 (0.0%) |
| Architecture & Engineering | 13 (100.0%) | 0 (0.0%) |
| Life, Physical & Social Science | 0 (0.0%) | 0 (0.0%) |
| Community & Social Service | 26 (32.5%) | 54 (67.5%) |
| Education, Arts & Media | 7 (21.2%) | 26 (78.8%) |
| Legal Services & Support | 4 (100.0%) | 0 (0.0%) |
| Education Instruction & Library | 15 (40.5%) | 22 (59.5%) |
| Arts, Media & Entertainment | 0 (0.0%) | 6 (100.0%) |
| Health Diagnosing & Treating | 6 (28.6%) | 15 (71.4%) |
| Health Technologists | 6 (40.0%) | 9 (60.0%) |
| Total (Category) | 78 (46.7%) | 89 (53.3%) |
| Total (Overall) | 210 (57.2%) | 157 (42.8%) |
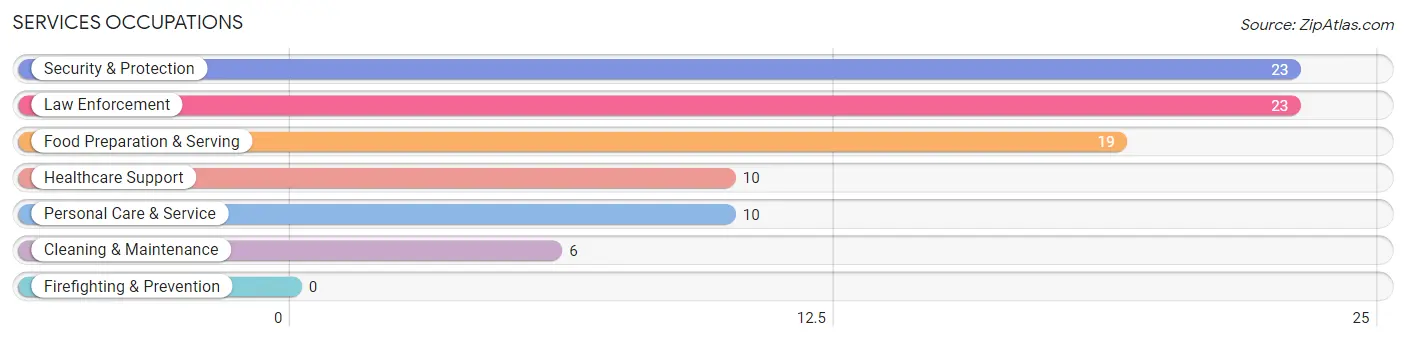
Services Occupations
The most common Services occupations in Belmont are Security & Protection (23 | 6.3%), Law Enforcement (23 | 6.3%), Food Preparation & Serving (19 | 5.2%), Healthcare Support (10 | 2.7%), and Personal Care & Service (10 | 2.7%).
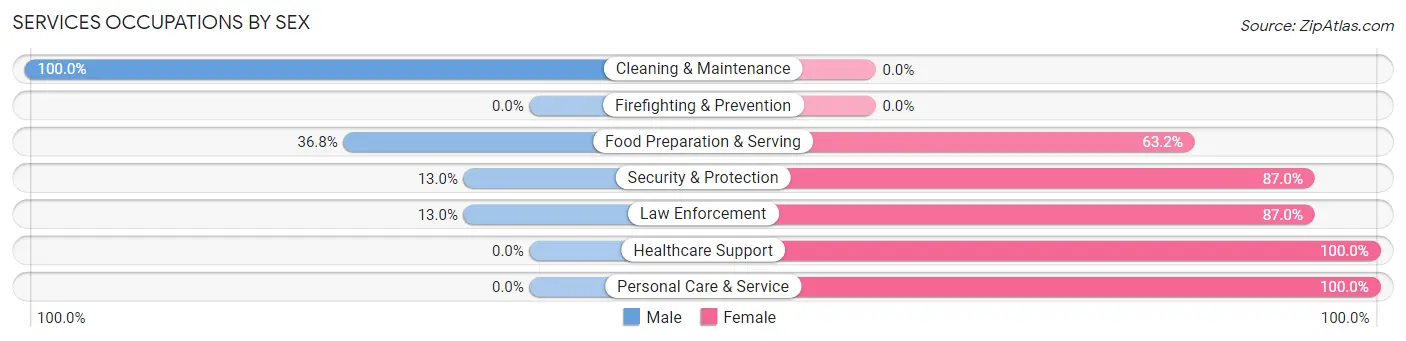
Services Occupations by Sex
Within the Services occupations in Belmont, the most male-oriented occupations are Cleaning & Maintenance (100.0%), Food Preparation & Serving (36.8%), and Security & Protection (13.0%), while the most female-oriented occupations are Healthcare Support (100.0%), Personal Care & Service (100.0%), and Security & Protection (87.0%).
| Occupation | Male | Female |
| Healthcare Support | 0 (0.0%) | 10 (100.0%) |
| Security & Protection | 3 (13.0%) | 20 (87.0%) |
| Firefighting & Prevention | 0 (0.0%) | 0 (0.0%) |
| Law Enforcement | 3 (13.0%) | 20 (87.0%) |
| Food Preparation & Serving | 7 (36.8%) | 12 (63.2%) |
| Cleaning & Maintenance | 6 (100.0%) | 0 (0.0%) |
| Personal Care & Service | 0 (0.0%) | 10 (100.0%) |
| Total (Category) | 16 (23.5%) | 52 (76.5%) |
| Total (Overall) | 210 (57.2%) | 157 (42.8%) |
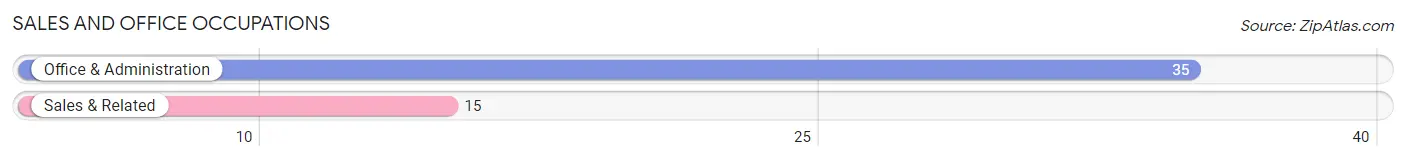
Sales and Office Occupations
The most common Sales and Office occupations in Belmont are Office & Administration (35 | 9.5%), and Sales & Related (15 | 4.1%).
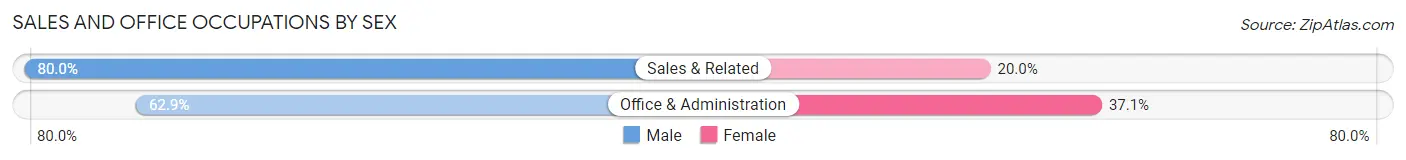
Sales and Office Occupations by Sex
| Occupation | Male | Female |
| Sales & Related | 12 (80.0%) | 3 (20.0%) |
| Office & Administration | 22 (62.9%) | 13 (37.1%) |
| Total (Category) | 34 (68.0%) | 16 (32.0%) |
| Total (Overall) | 210 (57.2%) | 157 (42.8%) |
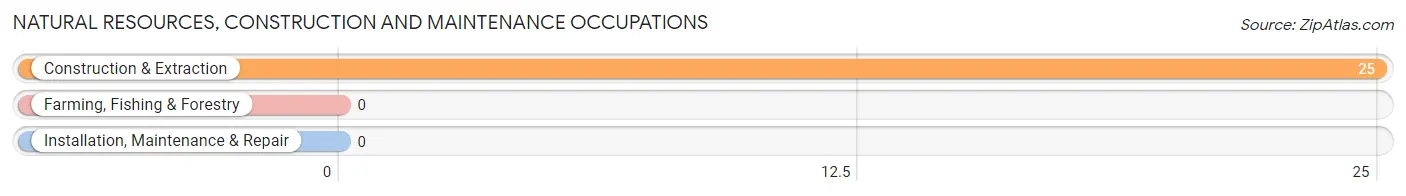
Natural Resources, Construction and Maintenance Occupations
The most common Natural Resources, Construction and Maintenance occupations in Belmont are , and Construction & Extraction (25 | 6.8%).
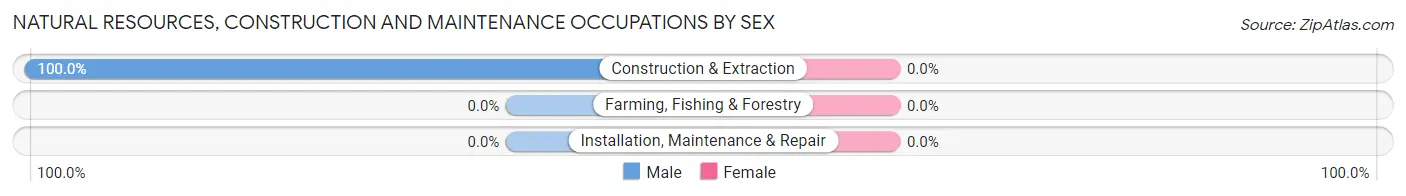
Natural Resources, Construction and Maintenance Occupations by Sex
| Occupation | Male | Female |
| Farming, Fishing & Forestry | 0 (0.0%) | 0 (0.0%) |
| Construction & Extraction | 25 (100.0%) | 0 (0.0%) |
| Installation, Maintenance & Repair | 0 (0.0%) | 0 (0.0%) |
| Total (Category) | 25 (100.0%) | 0 (0.0%) |
| Total (Overall) | 210 (57.2%) | 157 (42.8%) |
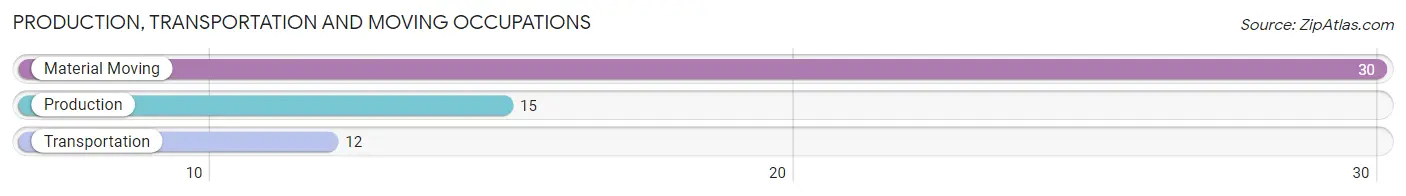
Production, Transportation and Moving Occupations
The most common Production, Transportation and Moving occupations in Belmont are Material Moving (30 | 8.2%), Production (15 | 4.1%), and Transportation (12 | 3.3%).
Production, Transportation and Moving Occupations by Sex
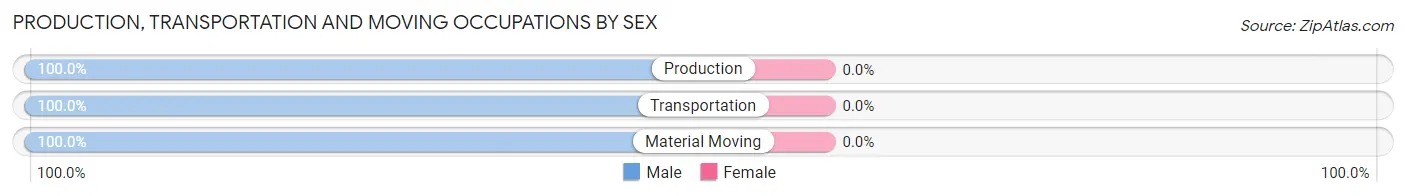
| Occupation | Male | Female |
| Production | 15 (100.0%) | 0 (0.0%) |
| Transportation | 12 (100.0%) | 0 (0.0%) |
| Material Moving | 30 (100.0%) | 0 (0.0%) |
| Total (Category) | 57 (100.0%) | 0 (0.0%) |
| Total (Overall) | 210 (57.2%) | 157 (42.8%) |
Employment Industries by Sex in Belmont
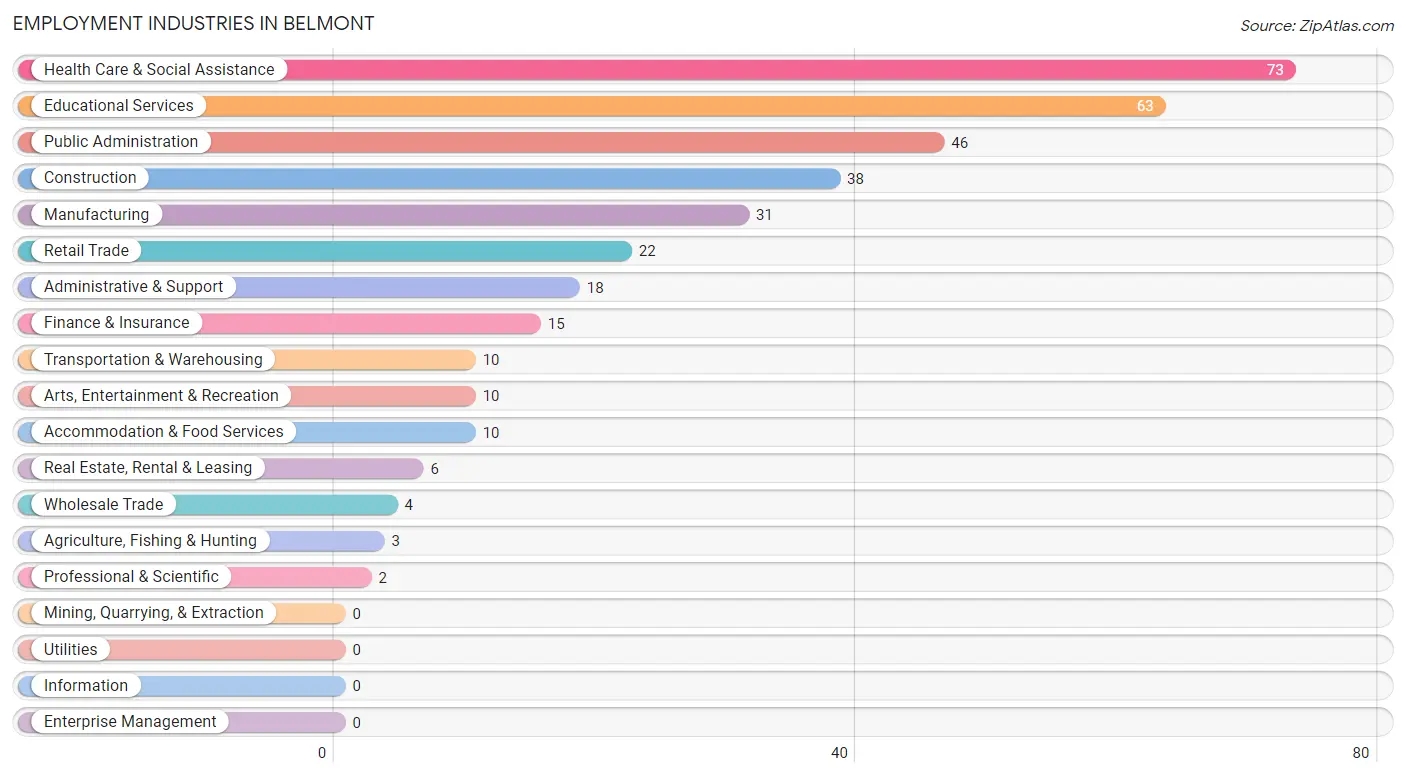
Employment Industries in Belmont
The major employment industries in Belmont include Health Care & Social Assistance (73 | 19.9%), Educational Services (63 | 17.2%), Public Administration (46 | 12.5%), Construction (38 | 10.3%), and Manufacturing (31 | 8.5%).
Employment Industries by Sex in Belmont
The Belmont industries that see more men than women are Construction (100.0%), Wholesale Trade (100.0%), and Real Estate, Rental & Leasing (100.0%), whereas the industries that tend to have a higher number of women are Agriculture, Fishing & Hunting (100.0%), Finance & Insurance (100.0%), and Professional & Scientific (100.0%).
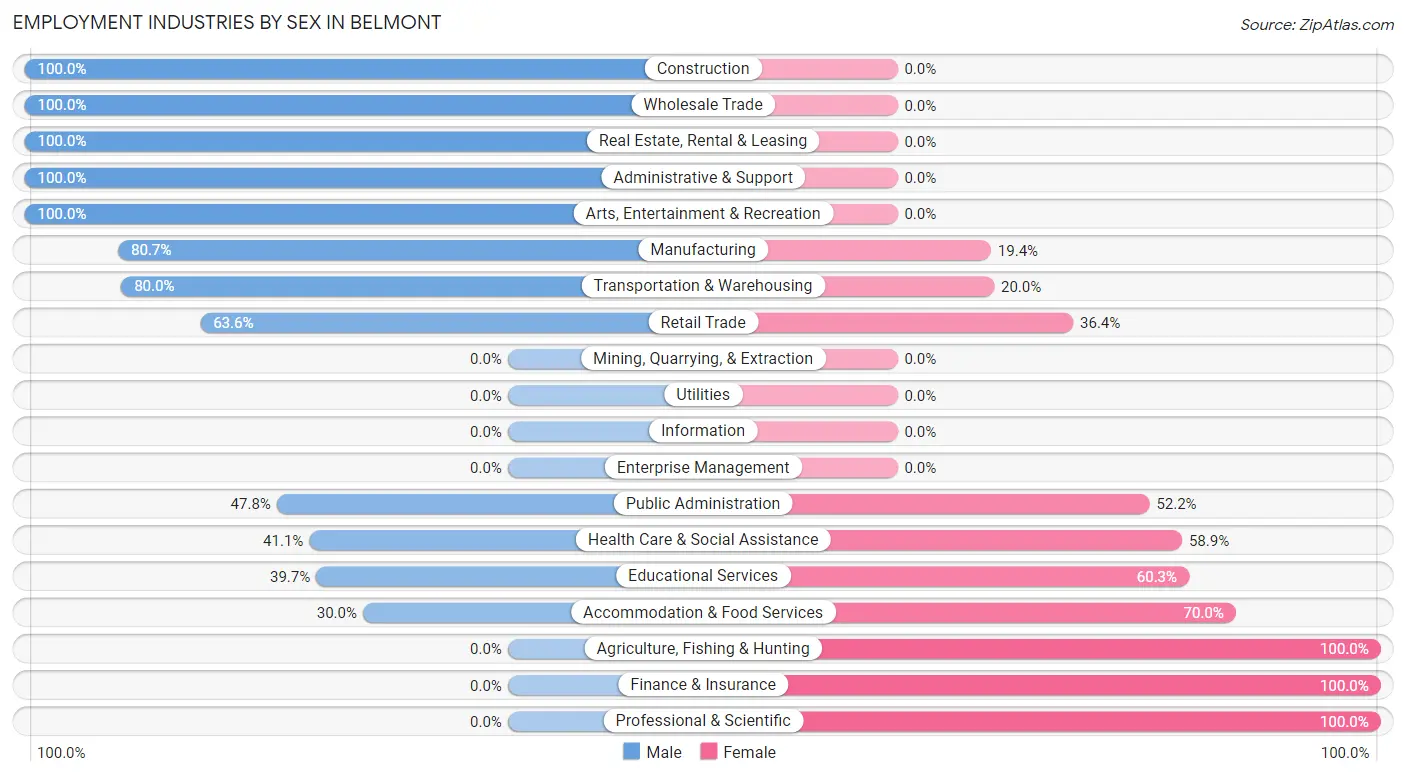
| Industry | Male | Female |
| Agriculture, Fishing & Hunting | 0 (0.0%) | 3 (100.0%) |
| Mining, Quarrying, & Extraction | 0 (0.0%) | 0 (0.0%) |
| Construction | 38 (100.0%) | 0 (0.0%) |
| Manufacturing | 25 (80.6%) | 6 (19.4%) |
| Wholesale Trade | 4 (100.0%) | 0 (0.0%) |
| Retail Trade | 14 (63.6%) | 8 (36.4%) |
| Transportation & Warehousing | 8 (80.0%) | 2 (20.0%) |
| Utilities | 0 (0.0%) | 0 (0.0%) |
| Information | 0 (0.0%) | 0 (0.0%) |
| Finance & Insurance | 0 (0.0%) | 15 (100.0%) |
| Real Estate, Rental & Leasing | 6 (100.0%) | 0 (0.0%) |
| Professional & Scientific | 0 (0.0%) | 2 (100.0%) |
| Enterprise Management | 0 (0.0%) | 0 (0.0%) |
| Administrative & Support | 18 (100.0%) | 0 (0.0%) |
| Educational Services | 25 (39.7%) | 38 (60.3%) |
| Health Care & Social Assistance | 30 (41.1%) | 43 (58.9%) |
| Arts, Entertainment & Recreation | 10 (100.0%) | 0 (0.0%) |
| Accommodation & Food Services | 3 (30.0%) | 7 (70.0%) |
| Public Administration | 22 (47.8%) | 24 (52.2%) |
| Total | 210 (57.2%) | 157 (42.8%) |
Education in Belmont
School Enrollment in Belmont
The most common levels of schooling among the 279 students in Belmont are nursery / preschool (79 | 28.3%), middle school (49 | 17.6%), and high school (46 | 16.5%).
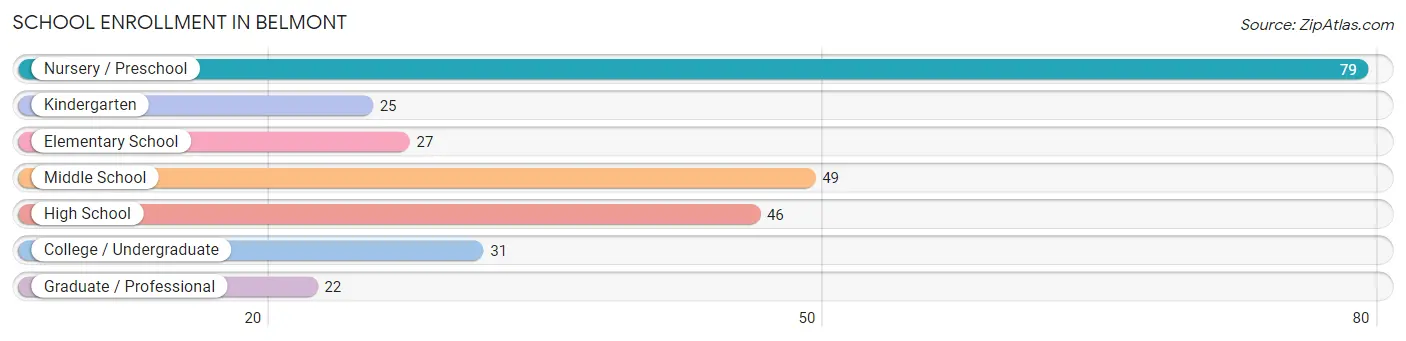
| School Level | # Students | % Students |
| Nursery / Preschool | 79 | 28.3% |
| Kindergarten | 25 | 9.0% |
| Elementary School | 27 | 9.7% |
| Middle School | 49 | 17.6% |
| High School | 46 | 16.5% |
| College / Undergraduate | 31 | 11.1% |
| Graduate / Professional | 22 | 7.9% |
| Total | 279 | 100.0% |
School Enrollment by Age by Funding Source in Belmont
Out of a total of 279 students who are enrolled in schools in Belmont, 27 (9.7%) attend a private institution, while the remaining 252 (90.3%) are enrolled in public schools. The age group of 25 to 34 year olds has the highest likelihood of being enrolled in private schools, with 17 (43.6% in the age bracket) enrolled. Conversely, the age group of 3 to 4 year olds has the lowest likelihood of being enrolled in a private school, with 58 (100.0% in the age bracket) attending a public institution.
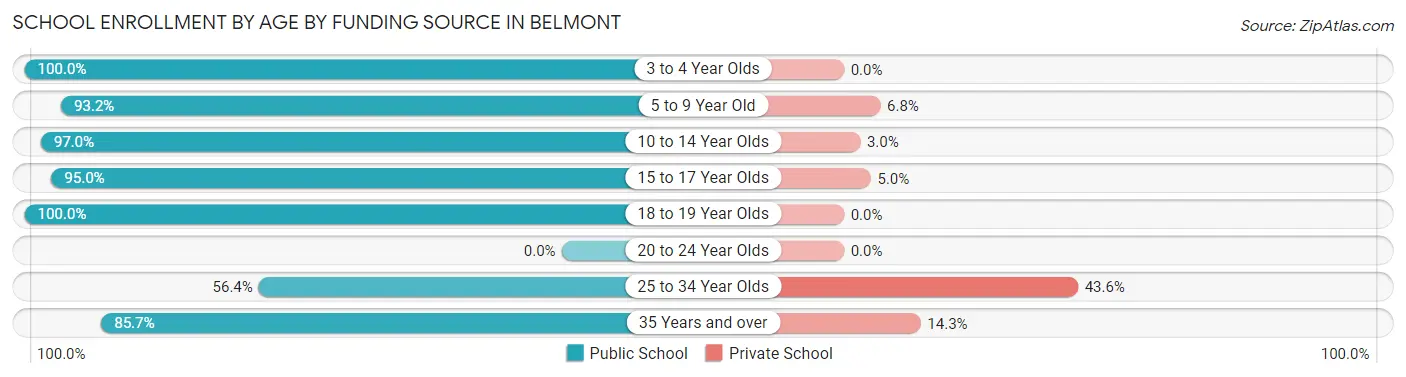
| Age Bracket | Public School | Private School |
| 3 to 4 Year Olds | 58 (100.0%) | 0 (0.0%) |
| 5 to 9 Year Old | 55 (93.2%) | 4 (6.8%) |
| 10 to 14 Year Olds | 64 (97.0%) | 2 (3.0%) |
| 15 to 17 Year Olds | 38 (95.0%) | 2 (5.0%) |
| 18 to 19 Year Olds | 3 (100.0%) | 0 (0.0%) |
| 20 to 24 Year Olds | 0 (0.0%) | 0 (0.0%) |
| 25 to 34 Year Olds | 22 (56.4%) | 17 (43.6%) |
| 35 Years and over | 12 (85.7%) | 2 (14.3%) |
| Total | 252 (90.3%) | 27 (9.7%) |
Educational Attainment by Field of Study in Belmont
Education (39 | 25.7%), business (21 | 13.8%), science & technology (17 | 11.2%), engineering (15 | 9.9%), and visual & performing arts (15 | 9.9%) are the most common fields of study among 152 individuals in Belmont who have obtained a bachelor's degree or higher.
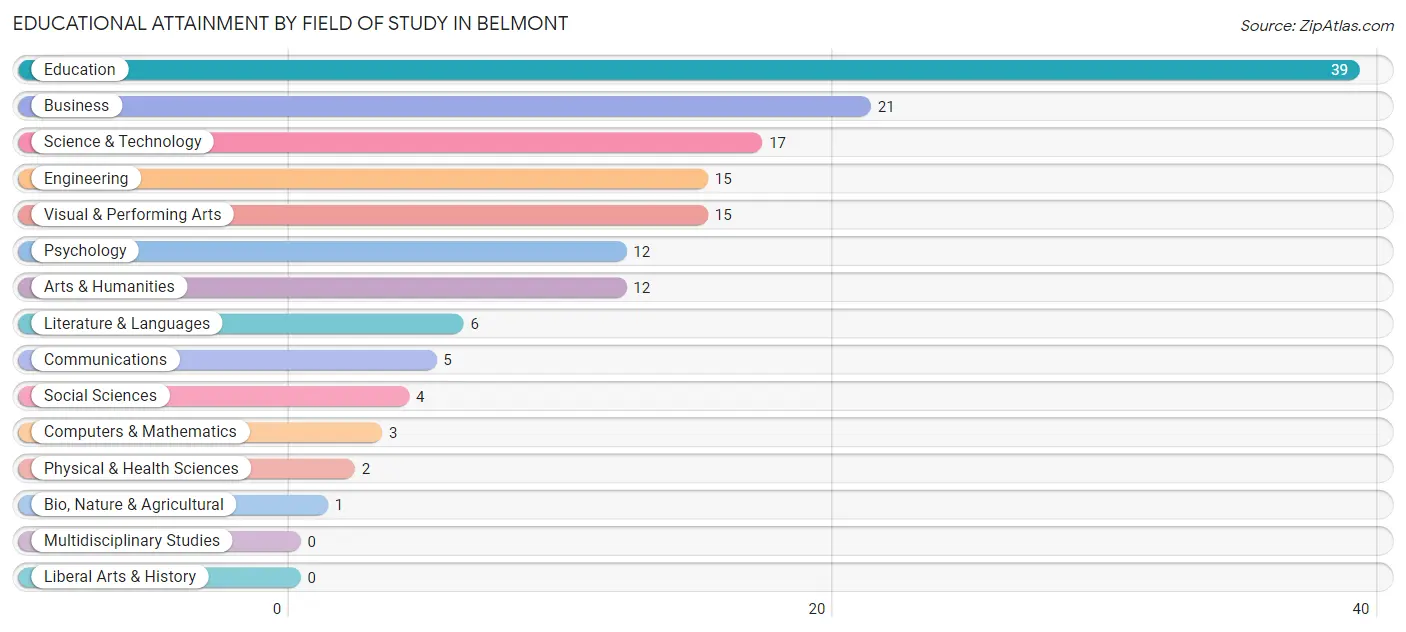
| Field of Study | # Graduates | % Graduates |
| Computers & Mathematics | 3 | 2.0% |
| Bio, Nature & Agricultural | 1 | 0.7% |
| Physical & Health Sciences | 2 | 1.3% |
| Psychology | 12 | 7.9% |
| Social Sciences | 4 | 2.6% |
| Engineering | 15 | 9.9% |
| Multidisciplinary Studies | 0 | 0.0% |
| Science & Technology | 17 | 11.2% |
| Business | 21 | 13.8% |
| Education | 39 | 25.7% |
| Literature & Languages | 6 | 4.0% |
| Liberal Arts & History | 0 | 0.0% |
| Visual & Performing Arts | 15 | 9.9% |
| Communications | 5 | 3.3% |
| Arts & Humanities | 12 | 7.9% |
| Total | 152 | 100.0% |
Transportation & Commute in Belmont
Vehicle Availability by Sex in Belmont
The most prevalent vehicle ownership categories in Belmont are males with 2 vehicles (65, accounting for 31.2%) and females with 2 vehicles (80, making up 42.8%).
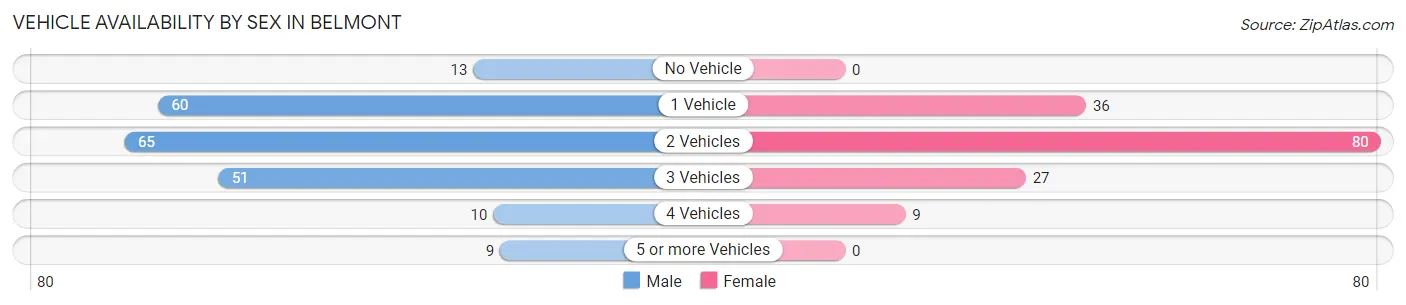
| Vehicles Available | Male | Female |
| No Vehicle | 13 (6.2%) | 0 (0.0%) |
| 1 Vehicle | 60 (28.8%) | 36 (23.7%) |
| 2 Vehicles | 65 (31.2%) | 80 (52.6%) |
| 3 Vehicles | 51 (24.5%) | 27 (17.8%) |
| 4 Vehicles | 10 (4.8%) | 9 (5.9%) |
| 5 or more Vehicles | 9 (4.3%) | 0 (0.0%) |
| Total | 208 (100.0%) | 152 (100.0%) |
Commute Time in Belmont
The most frequently occuring commute durations in Belmont are less than 5 minutes (62 commuters, 18.2%), 20 to 24 minutes (44 commuters, 12.9%), and 60 to 89 minutes (42 commuters, 12.3%).
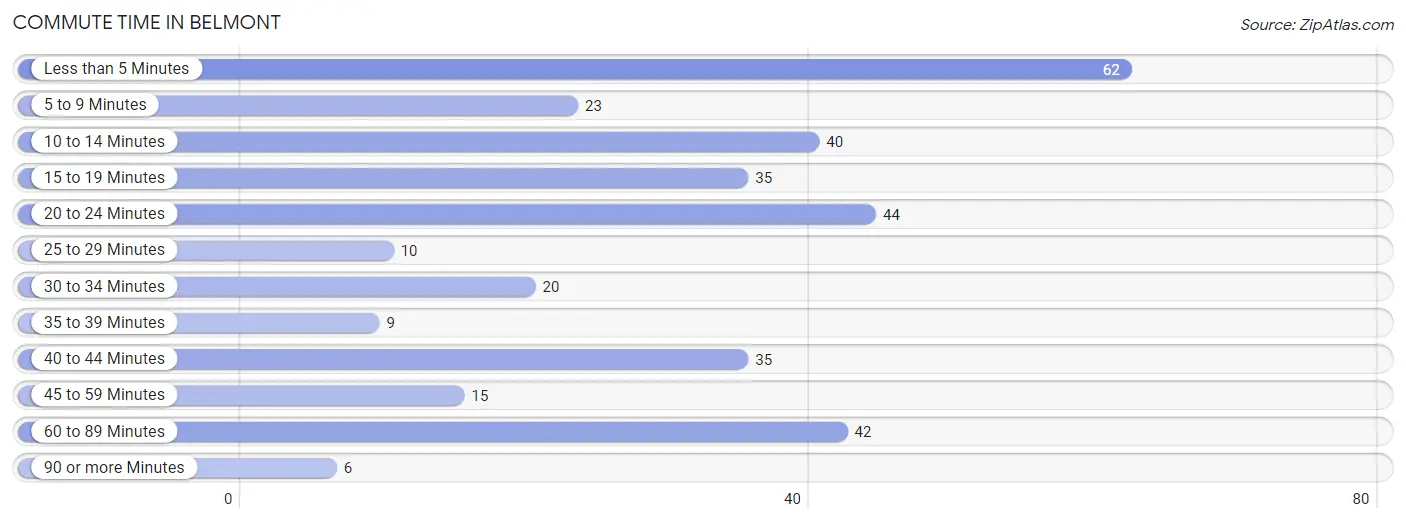
| Commute Time | # Commuters | % Commuters |
| Less than 5 Minutes | 62 | 18.2% |
| 5 to 9 Minutes | 23 | 6.7% |
| 10 to 14 Minutes | 40 | 11.7% |
| 15 to 19 Minutes | 35 | 10.3% |
| 20 to 24 Minutes | 44 | 12.9% |
| 25 to 29 Minutes | 10 | 2.9% |
| 30 to 34 Minutes | 20 | 5.9% |
| 35 to 39 Minutes | 9 | 2.6% |
| 40 to 44 Minutes | 35 | 10.3% |
| 45 to 59 Minutes | 15 | 4.4% |
| 60 to 89 Minutes | 42 | 12.3% |
| 90 or more Minutes | 6 | 1.8% |
Commute Time by Sex in Belmont
The most common commute times in Belmont are 60 to 89 minutes (42 commuters, 20.6%) for males and less than 5 minutes (30 commuters, 21.9%) for females.
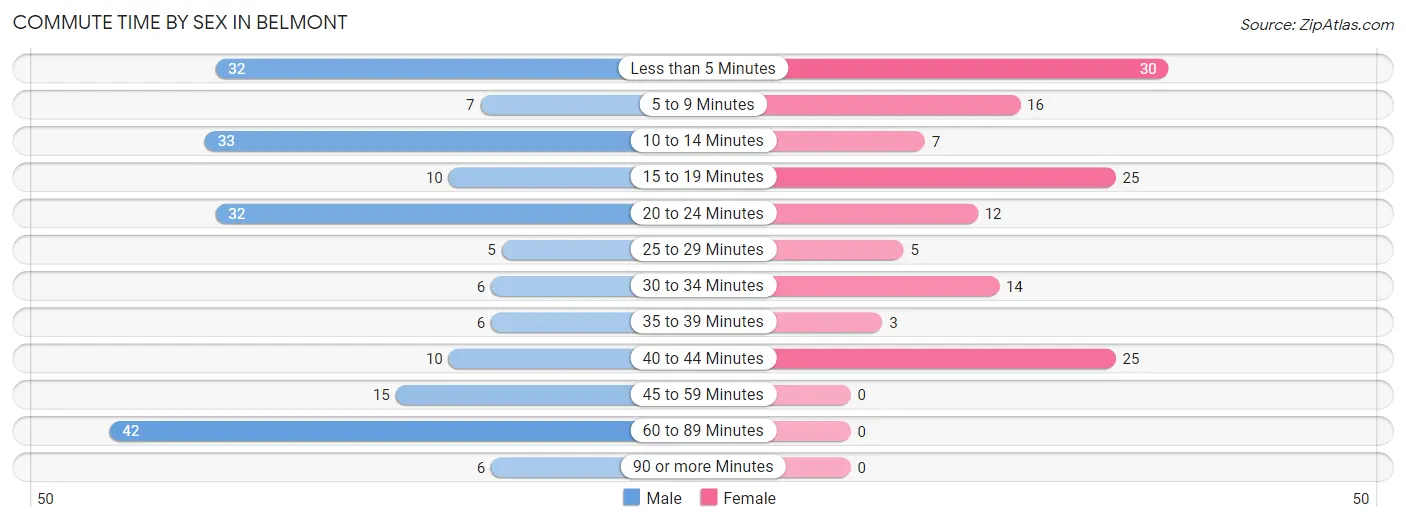
| Commute Time | Male | Female |
| Less than 5 Minutes | 32 (15.7%) | 30 (21.9%) |
| 5 to 9 Minutes | 7 (3.4%) | 16 (11.7%) |
| 10 to 14 Minutes | 33 (16.2%) | 7 (5.1%) |
| 15 to 19 Minutes | 10 (4.9%) | 25 (18.2%) |
| 20 to 24 Minutes | 32 (15.7%) | 12 (8.8%) |
| 25 to 29 Minutes | 5 (2.5%) | 5 (3.6%) |
| 30 to 34 Minutes | 6 (2.9%) | 14 (10.2%) |
| 35 to 39 Minutes | 6 (2.9%) | 3 (2.2%) |
| 40 to 44 Minutes | 10 (4.9%) | 25 (18.2%) |
| 45 to 59 Minutes | 15 (7.3%) | 0 (0.0%) |
| 60 to 89 Minutes | 42 (20.6%) | 0 (0.0%) |
| 90 or more Minutes | 6 (2.9%) | 0 (0.0%) |
Time of Departure to Work by Sex in Belmont
The most frequent times of departure to work in Belmont are 7:00 AM to 7:29 AM (73, 35.8%) for males and 7:30 AM to 7:59 AM (33, 24.1%) for females.
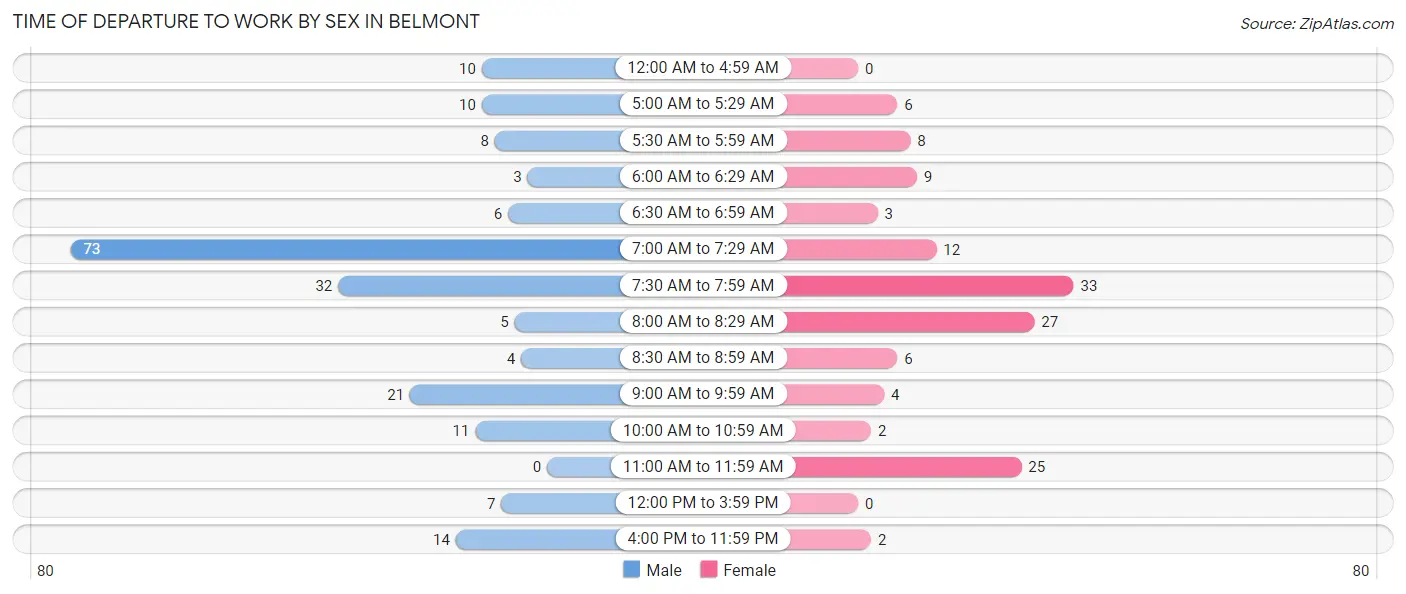
| Time of Departure | Male | Female |
| 12:00 AM to 4:59 AM | 10 (4.9%) | 0 (0.0%) |
| 5:00 AM to 5:29 AM | 10 (4.9%) | 6 (4.4%) |
| 5:30 AM to 5:59 AM | 8 (3.9%) | 8 (5.8%) |
| 6:00 AM to 6:29 AM | 3 (1.5%) | 9 (6.6%) |
| 6:30 AM to 6:59 AM | 6 (2.9%) | 3 (2.2%) |
| 7:00 AM to 7:29 AM | 73 (35.8%) | 12 (8.8%) |
| 7:30 AM to 7:59 AM | 32 (15.7%) | 33 (24.1%) |
| 8:00 AM to 8:29 AM | 5 (2.5%) | 27 (19.7%) |
| 8:30 AM to 8:59 AM | 4 (2.0%) | 6 (4.4%) |
| 9:00 AM to 9:59 AM | 21 (10.3%) | 4 (2.9%) |
| 10:00 AM to 10:59 AM | 11 (5.4%) | 2 (1.5%) |
| 11:00 AM to 11:59 AM | 0 (0.0%) | 25 (18.2%) |
| 12:00 PM to 3:59 PM | 7 (3.4%) | 0 (0.0%) |
| 4:00 PM to 11:59 PM | 14 (6.9%) | 2 (1.5%) |
| Total | 204 (100.0%) | 137 (100.0%) |
Housing Occupancy in Belmont
Occupancy by Ownership in Belmont
Of the total 344 dwellings in Belmont, owner-occupied units account for 259 (75.3%), while renter-occupied units make up 85 (24.7%).
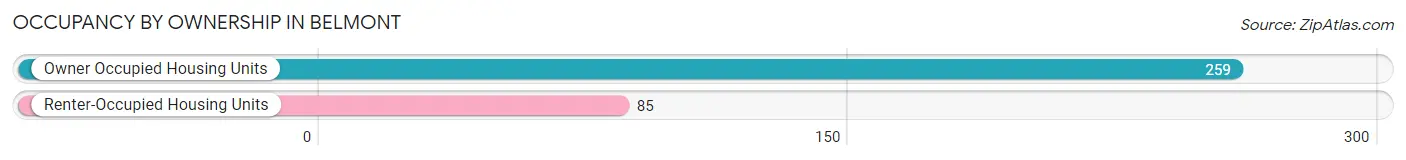
| Occupancy | # Housing Units | % Housing Units |
| Owner Occupied Housing Units | 259 | 75.3% |
| Renter-Occupied Housing Units | 85 | 24.7% |
| Total Occupied Housing Units | 344 | 100.0% |
Occupancy by Household Size in Belmont
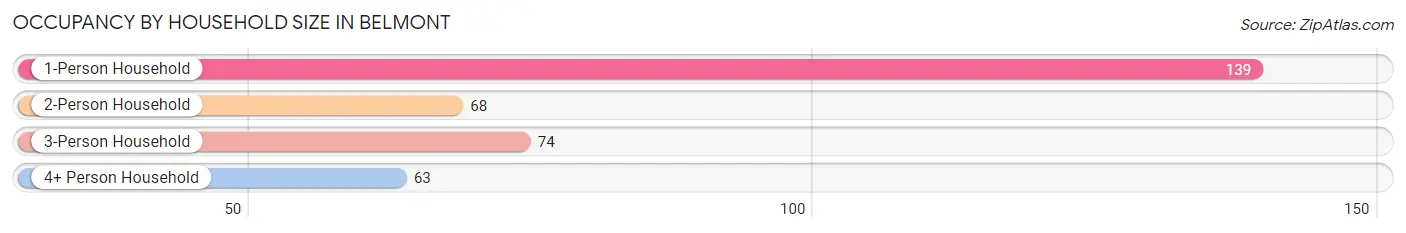
| Household Size | # Housing Units | % Housing Units |
| 1-Person Household | 139 | 40.4% |
| 2-Person Household | 68 | 19.8% |
| 3-Person Household | 74 | 21.5% |
| 4+ Person Household | 63 | 18.3% |
| Total Housing Units | 344 | 100.0% |
Occupancy by Ownership by Household Size in Belmont
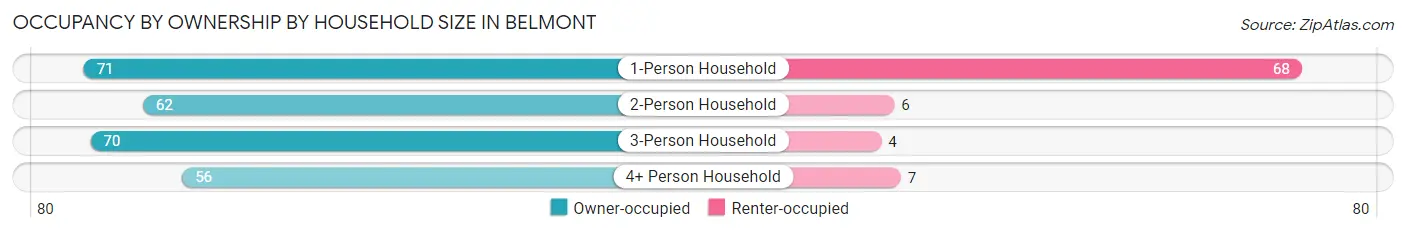
| Household Size | Owner-occupied | Renter-occupied |
| 1-Person Household | 71 (51.1%) | 68 (48.9%) |
| 2-Person Household | 62 (91.2%) | 6 (8.8%) |
| 3-Person Household | 70 (94.6%) | 4 (5.4%) |
| 4+ Person Household | 56 (88.9%) | 7 (11.1%) |
| Total Housing Units | 259 (75.3%) | 85 (24.7%) |
Occupancy by Educational Attainment in Belmont
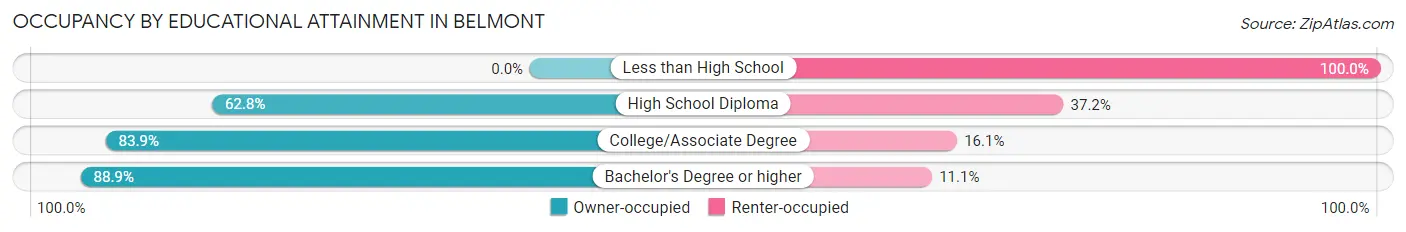
| Household Size | Owner-occupied | Renter-occupied |
| Less than High School | 0 (0.0%) | 3 (100.0%) |
| High School Diploma | 93 (62.8%) | 55 (37.2%) |
| College/Associate Degree | 94 (83.9%) | 18 (16.1%) |
| Bachelor's Degree or higher | 72 (88.9%) | 9 (11.1%) |
Occupancy by Age of Householder in Belmont
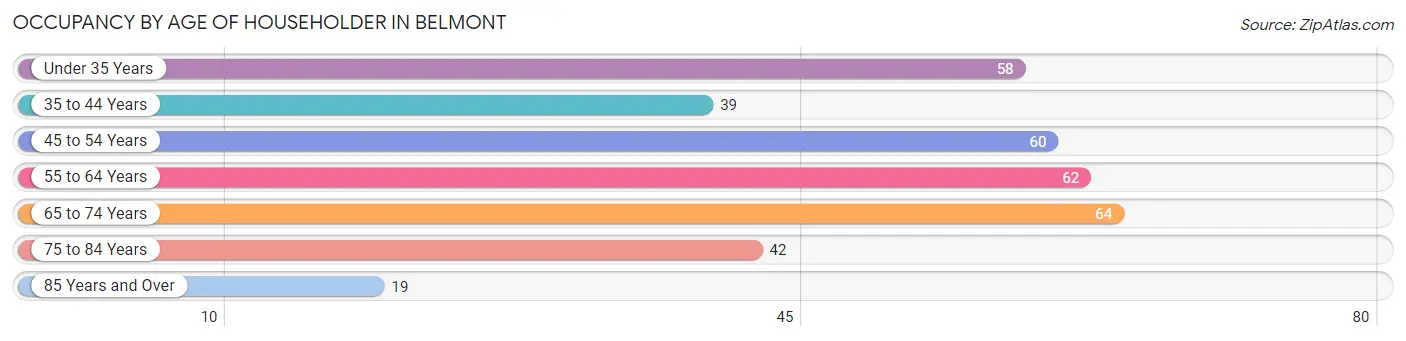
| Age Bracket | # Households | % Households |
| Under 35 Years | 58 | 16.9% |
| 35 to 44 Years | 39 | 11.3% |
| 45 to 54 Years | 60 | 17.4% |
| 55 to 64 Years | 62 | 18.0% |
| 65 to 74 Years | 64 | 18.6% |
| 75 to 84 Years | 42 | 12.2% |
| 85 Years and Over | 19 | 5.5% |
| Total | 344 | 100.0% |
Housing Finances in Belmont
Median Income by Occupancy in Belmont
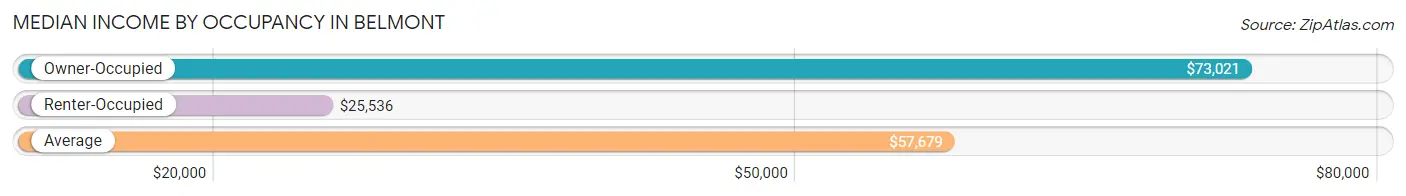
| Occupancy Type | # Households | Median Income |
| Owner-Occupied | 259 (75.3%) | $73,021 |
| Renter-Occupied | 85 (24.7%) | $25,536 |
| Average | 344 (100.0%) | $57,679 |
Occupancy by Householder Income Bracket in Belmont
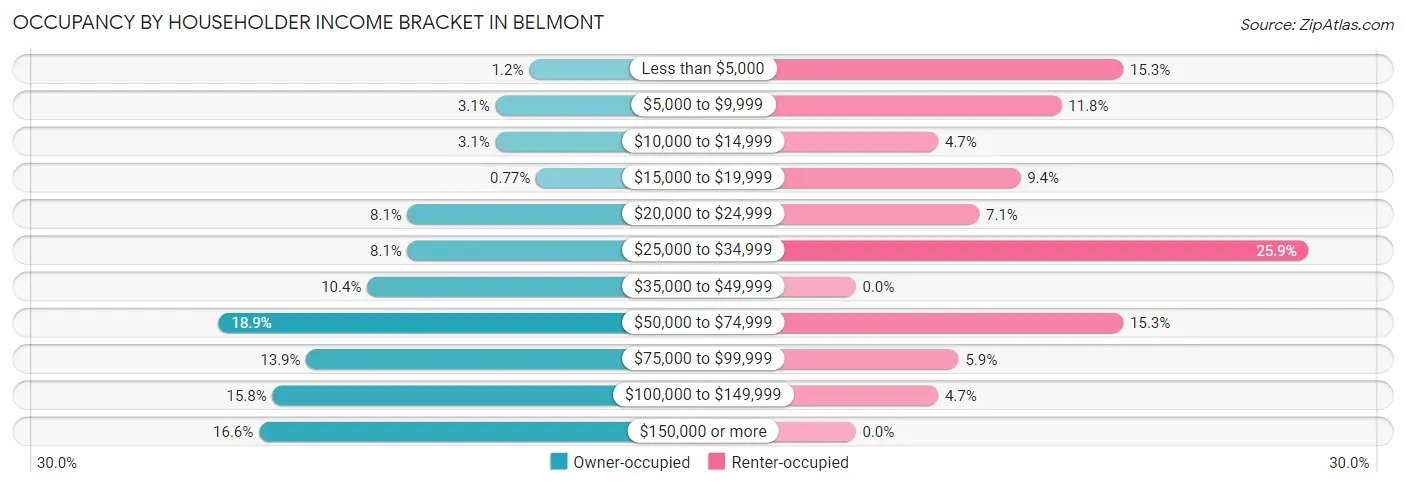
| Income Bracket | Owner-occupied | Renter-occupied |
| Less than $5,000 | 3 (1.2%) | 13 (15.3%) |
| $5,000 to $9,999 | 8 (3.1%) | 10 (11.8%) |
| $10,000 to $14,999 | 8 (3.1%) | 4 (4.7%) |
| $15,000 to $19,999 | 2 (0.8%) | 8 (9.4%) |
| $20,000 to $24,999 | 21 (8.1%) | 6 (7.1%) |
| $25,000 to $34,999 | 21 (8.1%) | 22 (25.9%) |
| $35,000 to $49,999 | 27 (10.4%) | 0 (0.0%) |
| $50,000 to $74,999 | 49 (18.9%) | 13 (15.3%) |
| $75,000 to $99,999 | 36 (13.9%) | 5 (5.9%) |
| $100,000 to $149,999 | 41 (15.8%) | 4 (4.7%) |
| $150,000 or more | 43 (16.6%) | 0 (0.0%) |
| Total | 259 (100.0%) | 85 (100.0%) |
Monthly Housing Cost Tiers in Belmont
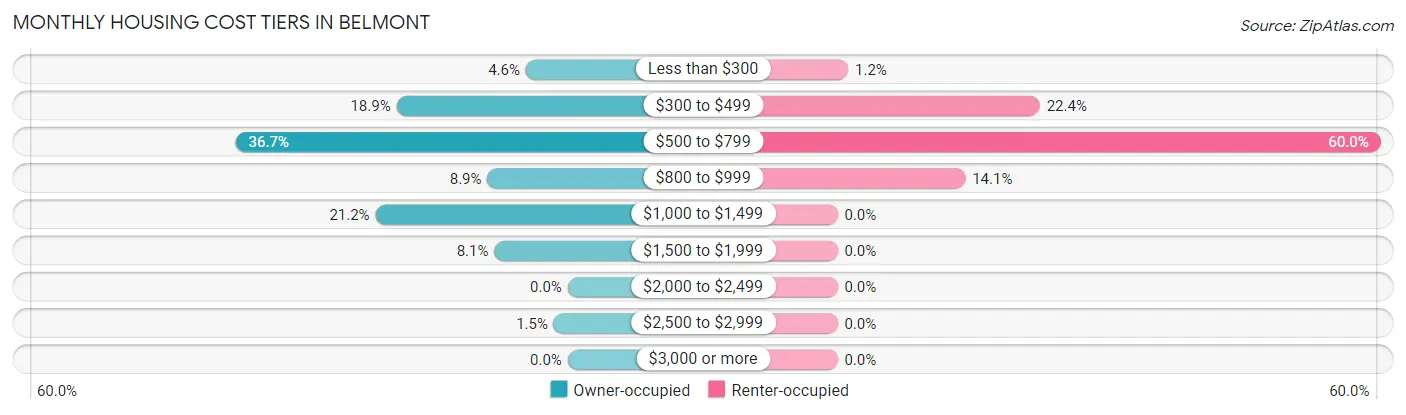
| Monthly Cost | Owner-occupied | Renter-occupied |
| Less than $300 | 12 (4.6%) | 1 (1.2%) |
| $300 to $499 | 49 (18.9%) | 19 (22.4%) |
| $500 to $799 | 95 (36.7%) | 51 (60.0%) |
| $800 to $999 | 23 (8.9%) | 12 (14.1%) |
| $1,000 to $1,499 | 55 (21.2%) | 0 (0.0%) |
| $1,500 to $1,999 | 21 (8.1%) | 0 (0.0%) |
| $2,000 to $2,499 | 0 (0.0%) | 0 (0.0%) |
| $2,500 to $2,999 | 4 (1.5%) | 0 (0.0%) |
| $3,000 or more | 0 (0.0%) | 0 (0.0%) |
| Total | 259 (100.0%) | 85 (100.0%) |
Physical Housing Characteristics in Belmont
Housing Structures in Belmont
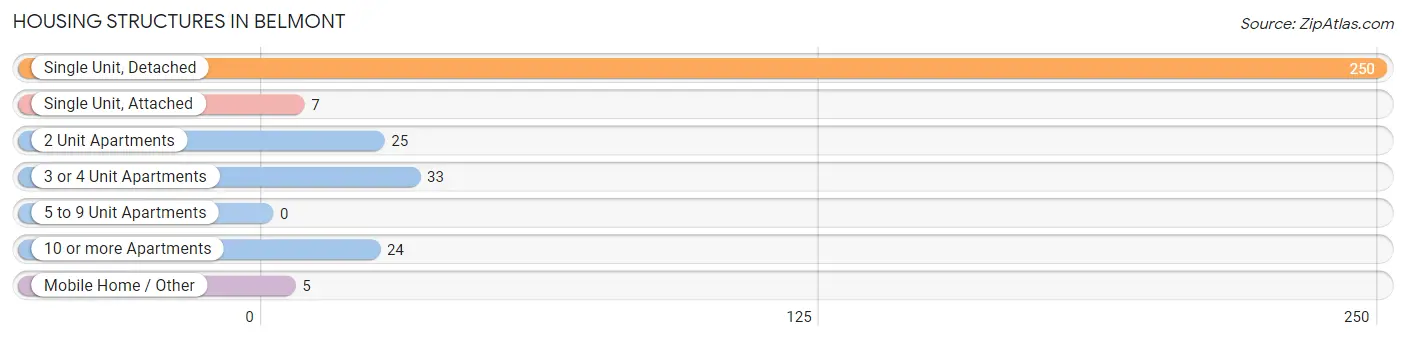
| Structure Type | # Housing Units | % Housing Units |
| Single Unit, Detached | 250 | 72.7% |
| Single Unit, Attached | 7 | 2.0% |
| 2 Unit Apartments | 25 | 7.3% |
| 3 or 4 Unit Apartments | 33 | 9.6% |
| 5 to 9 Unit Apartments | 0 | 0.0% |
| 10 or more Apartments | 24 | 7.0% |
| Mobile Home / Other | 5 | 1.5% |
| Total | 344 | 100.0% |
Housing Structures by Occupancy in Belmont
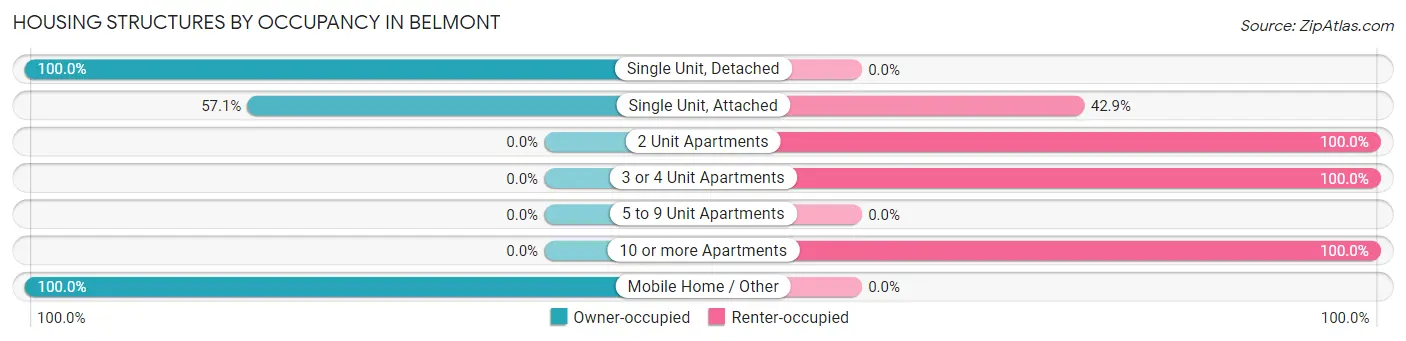
| Structure Type | Owner-occupied | Renter-occupied |
| Single Unit, Detached | 250 (100.0%) | 0 (0.0%) |
| Single Unit, Attached | 4 (57.1%) | 3 (42.9%) |
| 2 Unit Apartments | 0 (0.0%) | 25 (100.0%) |
| 3 or 4 Unit Apartments | 0 (0.0%) | 33 (100.0%) |
| 5 to 9 Unit Apartments | 0 (0.0%) | 0 (0.0%) |
| 10 or more Apartments | 0 (0.0%) | 24 (100.0%) |
| Mobile Home / Other | 5 (100.0%) | 0 (0.0%) |
| Total | 259 (75.3%) | 85 (24.7%) |
Housing Structures by Number of Rooms in Belmont
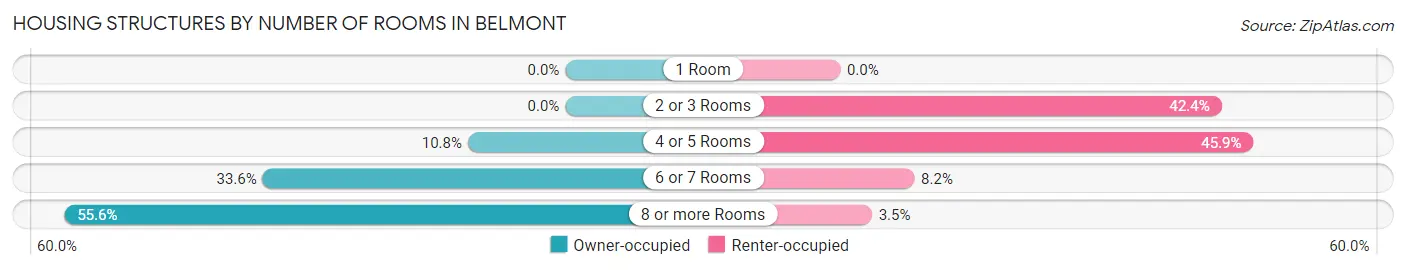
| Number of Rooms | Owner-occupied | Renter-occupied |
| 1 Room | 0 (0.0%) | 0 (0.0%) |
| 2 or 3 Rooms | 0 (0.0%) | 36 (42.3%) |
| 4 or 5 Rooms | 28 (10.8%) | 39 (45.9%) |
| 6 or 7 Rooms | 87 (33.6%) | 7 (8.2%) |
| 8 or more Rooms | 144 (55.6%) | 3 (3.5%) |
| Total | 259 (100.0%) | 85 (100.0%) |
Housing Structure by Heating Type in Belmont
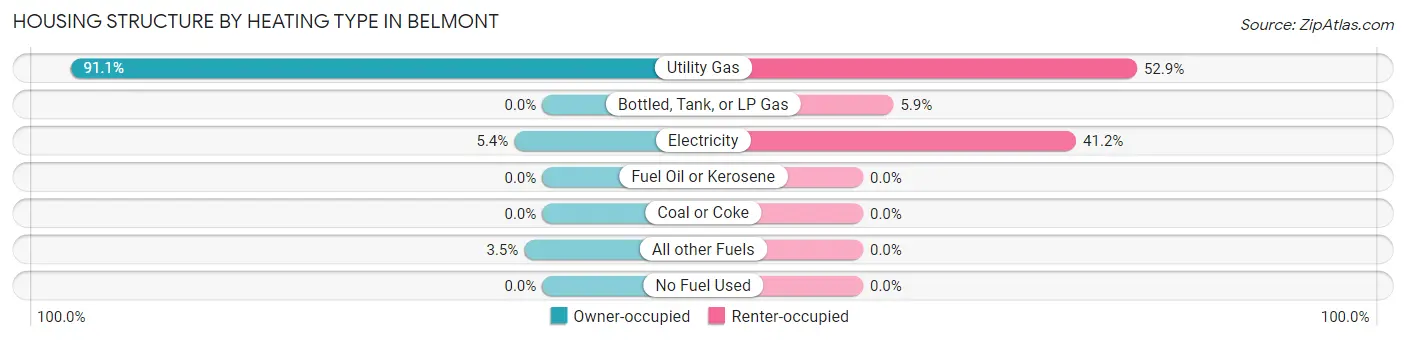
| Heating Type | Owner-occupied | Renter-occupied |
| Utility Gas | 236 (91.1%) | 45 (52.9%) |
| Bottled, Tank, or LP Gas | 0 (0.0%) | 5 (5.9%) |
| Electricity | 14 (5.4%) | 35 (41.2%) |
| Fuel Oil or Kerosene | 0 (0.0%) | 0 (0.0%) |
| Coal or Coke | 0 (0.0%) | 0 (0.0%) |
| All other Fuels | 9 (3.5%) | 0 (0.0%) |
| No Fuel Used | 0 (0.0%) | 0 (0.0%) |
| Total | 259 (100.0%) | 85 (100.0%) |
Household Vehicle Usage in Belmont
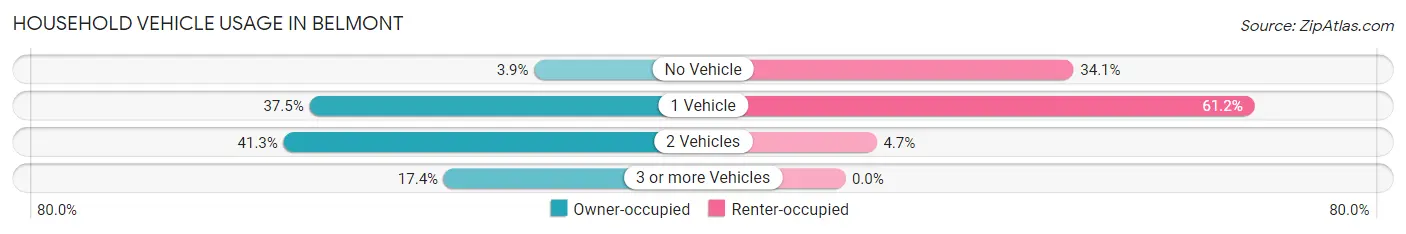
| Vehicles per Household | Owner-occupied | Renter-occupied |
| No Vehicle | 10 (3.9%) | 29 (34.1%) |
| 1 Vehicle | 97 (37.4%) | 52 (61.2%) |
| 2 Vehicles | 107 (41.3%) | 4 (4.7%) |
| 3 or more Vehicles | 45 (17.4%) | 0 (0.0%) |
| Total | 259 (100.0%) | 85 (100.0%) |
Real Estate & Mortgages in Belmont
Real Estate and Mortgage Overview in Belmont
| Characteristic | Without Mortgage | With Mortgage |
| Housing Units | 154 | 105 |
| Median Property Value | $85,000 | $87,800 |
| Median Household Income | $59,091 | $23 |
| Monthly Housing Costs | $532 | $0 |
| Real Estate Taxes | $2,119 | $0 |
Property Value by Mortgage Status in Belmont
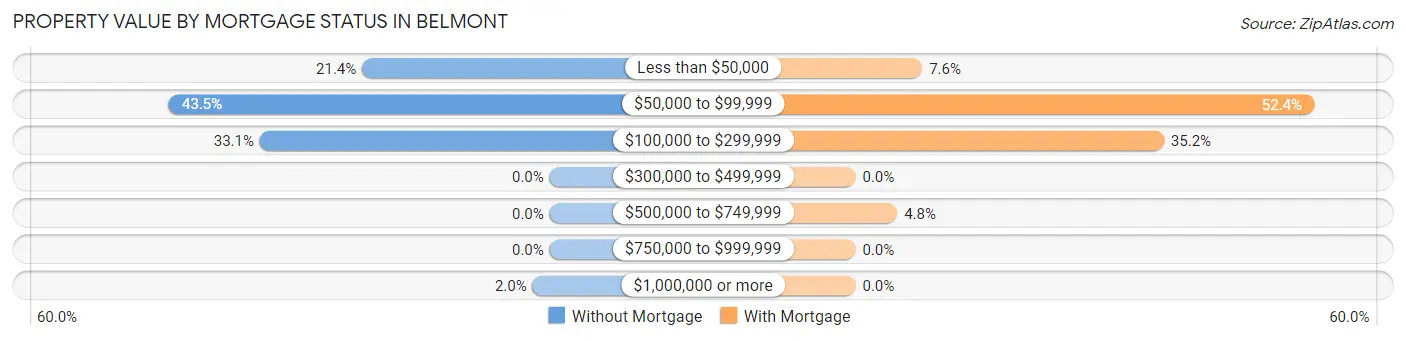
| Property Value | Without Mortgage | With Mortgage |
| Less than $50,000 | 33 (21.4%) | 8 (7.6%) |
| $50,000 to $99,999 | 67 (43.5%) | 55 (52.4%) |
| $100,000 to $299,999 | 51 (33.1%) | 37 (35.2%) |
| $300,000 to $499,999 | 0 (0.0%) | 0 (0.0%) |
| $500,000 to $749,999 | 0 (0.0%) | 5 (4.8%) |
| $750,000 to $999,999 | 0 (0.0%) | 0 (0.0%) |
| $1,000,000 or more | 3 (1.9%) | 0 (0.0%) |
| Total | 154 (100.0%) | 105 (100.0%) |
Household Income by Mortgage Status in Belmont
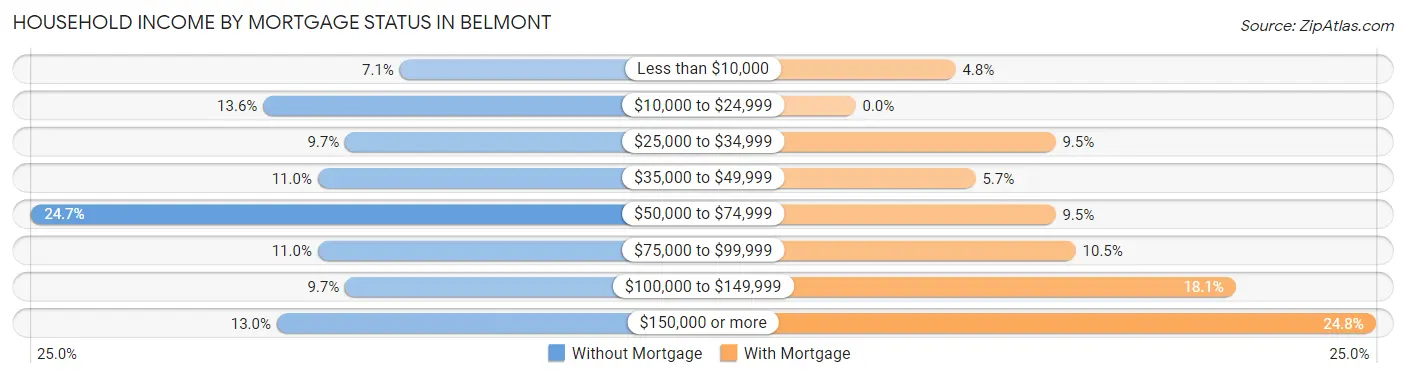
| Household Income | Without Mortgage | With Mortgage |
| Less than $10,000 | 11 (7.1%) | 5 (4.8%) |
| $10,000 to $24,999 | 21 (13.6%) | 0 (0.0%) |
| $25,000 to $34,999 | 15 (9.7%) | 10 (9.5%) |
| $35,000 to $49,999 | 17 (11.0%) | 6 (5.7%) |
| $50,000 to $74,999 | 38 (24.7%) | 10 (9.5%) |
| $75,000 to $99,999 | 17 (11.0%) | 11 (10.5%) |
| $100,000 to $149,999 | 15 (9.7%) | 19 (18.1%) |
| $150,000 or more | 20 (13.0%) | 26 (24.8%) |
| Total | 154 (100.0%) | 105 (100.0%) |
Property Value to Household Income Ratio in Belmont
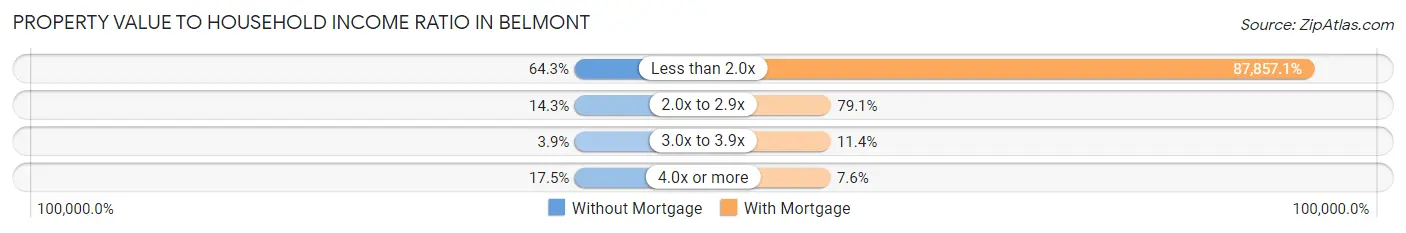
| Value-to-Income Ratio | Without Mortgage | With Mortgage |
| Less than 2.0x | 99 (64.3%) | 92,250 (87,857.1%) |
| 2.0x to 2.9x | 22 (14.3%) | 83 (79.0%) |
| 3.0x to 3.9x | 6 (3.9%) | 12 (11.4%) |
| 4.0x or more | 27 (17.5%) | 8 (7.6%) |
| Total | 154 (100.0%) | 105 (100.0%) |
Real Estate Taxes by Mortgage Status in Belmont
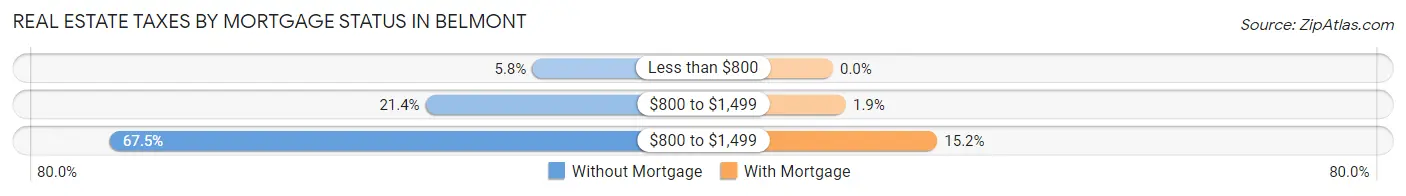
| Property Taxes | Without Mortgage | With Mortgage |
| Less than $800 | 9 (5.8%) | 0 (0.0%) |
| $800 to $1,499 | 33 (21.4%) | 2 (1.9%) |
| $800 to $1,499 | 104 (67.5%) | 16 (15.2%) |
| Total | 154 (100.0%) | 105 (100.0%) |
Health & Disability in Belmont
Health Insurance Coverage by Age in Belmont
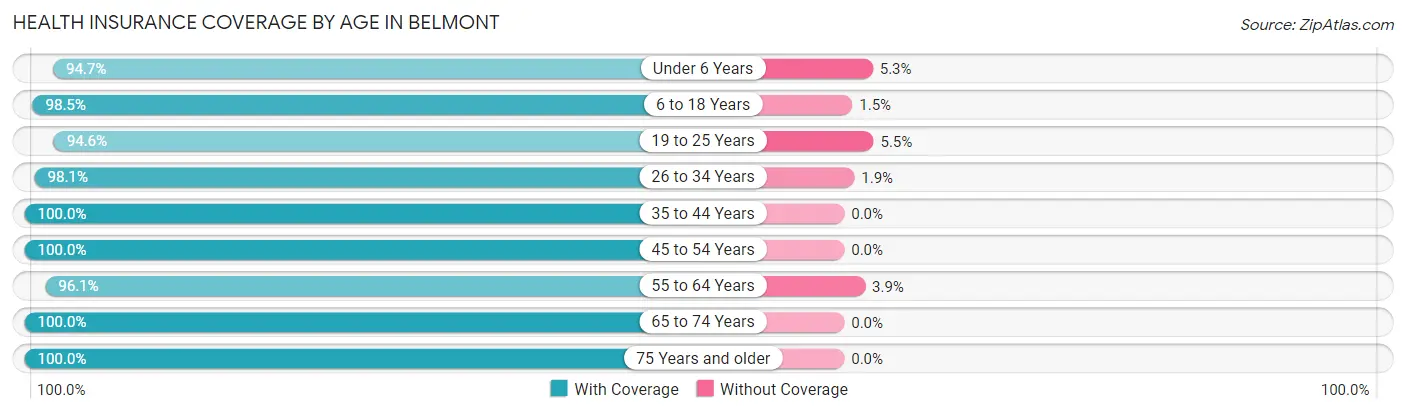
| Age Bracket | With Coverage | Without Coverage |
| Under 6 Years | 107 (94.7%) | 6 (5.3%) |
| 6 to 18 Years | 131 (98.5%) | 2 (1.5%) |
| 19 to 25 Years | 52 (94.6%) | 3 (5.4%) |
| 26 to 34 Years | 105 (98.1%) | 2 (1.9%) |
| 35 to 44 Years | 60 (100.0%) | 0 (0.0%) |
| 45 to 54 Years | 108 (100.0%) | 0 (0.0%) |
| 55 to 64 Years | 99 (96.1%) | 4 (3.9%) |
| 65 to 74 Years | 88 (100.0%) | 0 (0.0%) |
| 75 Years and older | 98 (100.0%) | 0 (0.0%) |
| Total | 848 (98.0%) | 17 (2.0%) |
Health Insurance Coverage by Citizenship Status in Belmont
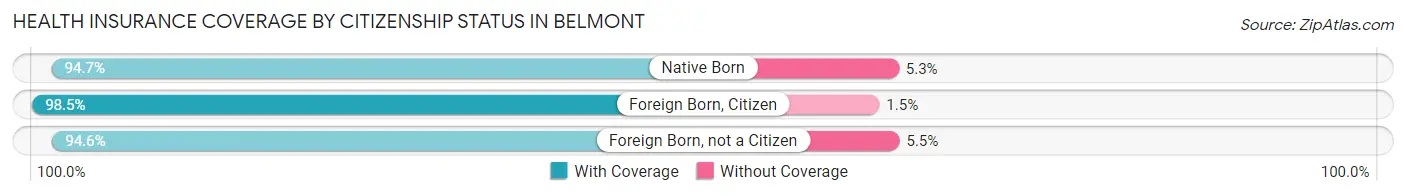
| Citizenship Status | With Coverage | Without Coverage |
| Native Born | 107 (94.7%) | 6 (5.3%) |
| Foreign Born, Citizen | 131 (98.5%) | 2 (1.5%) |
| Foreign Born, not a Citizen | 52 (94.6%) | 3 (5.4%) |
Health Insurance Coverage by Household Income in Belmont
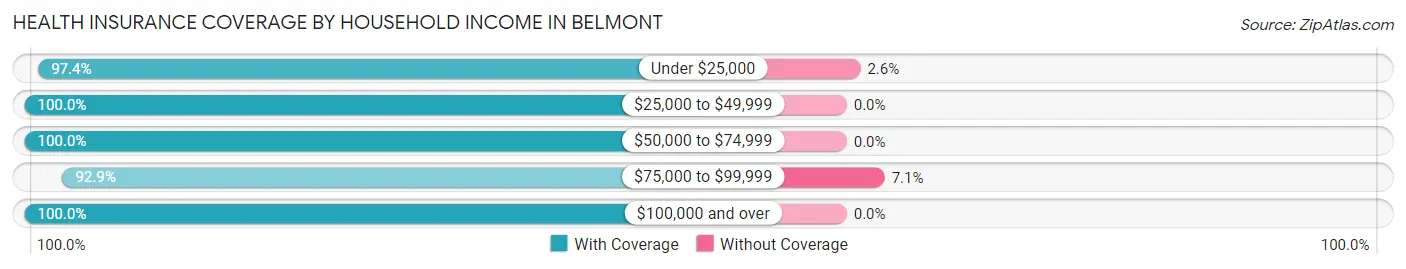
| Household Income | With Coverage | Without Coverage |
| Under $25,000 | 152 (97.4%) | 4 (2.6%) |
| $25,000 to $49,999 | 94 (100.0%) | 0 (0.0%) |
| $50,000 to $74,999 | 137 (100.0%) | 0 (0.0%) |
| $75,000 to $99,999 | 170 (92.9%) | 13 (7.1%) |
| $100,000 and over | 265 (100.0%) | 0 (0.0%) |
Public vs Private Health Insurance Coverage by Age in Belmont
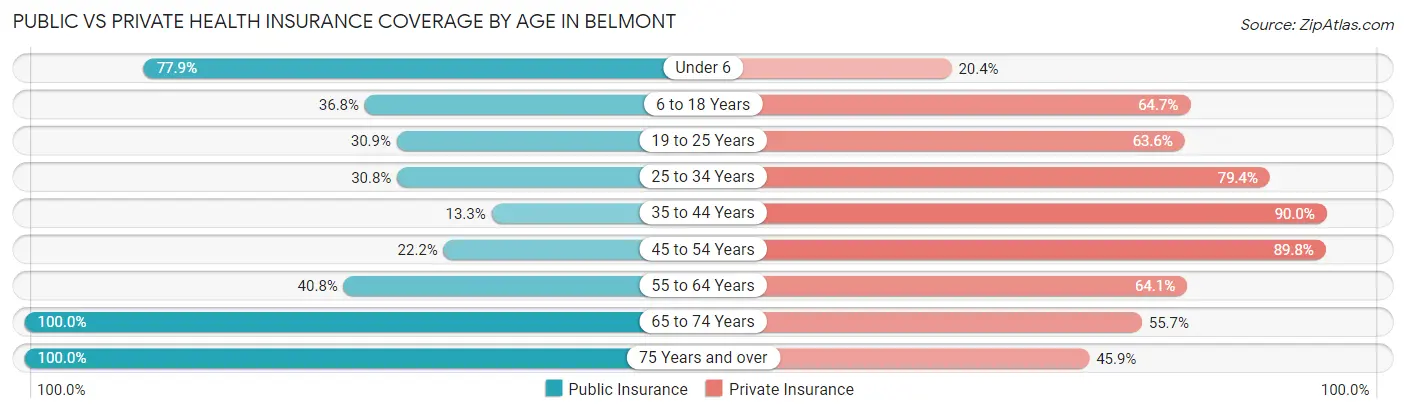
| Age Bracket | Public Insurance | Private Insurance |
| Under 6 | 88 (77.9%) | 23 (20.3%) |
| 6 to 18 Years | 49 (36.8%) | 86 (64.7%) |
| 19 to 25 Years | 17 (30.9%) | 35 (63.6%) |
| 25 to 34 Years | 33 (30.8%) | 85 (79.4%) |
| 35 to 44 Years | 8 (13.3%) | 54 (90.0%) |
| 45 to 54 Years | 24 (22.2%) | 97 (89.8%) |
| 55 to 64 Years | 42 (40.8%) | 66 (64.1%) |
| 65 to 74 Years | 88 (100.0%) | 49 (55.7%) |
| 75 Years and over | 98 (100.0%) | 45 (45.9%) |
| Total | 447 (51.7%) | 540 (62.4%) |
Disability Status by Sex by Age in Belmont
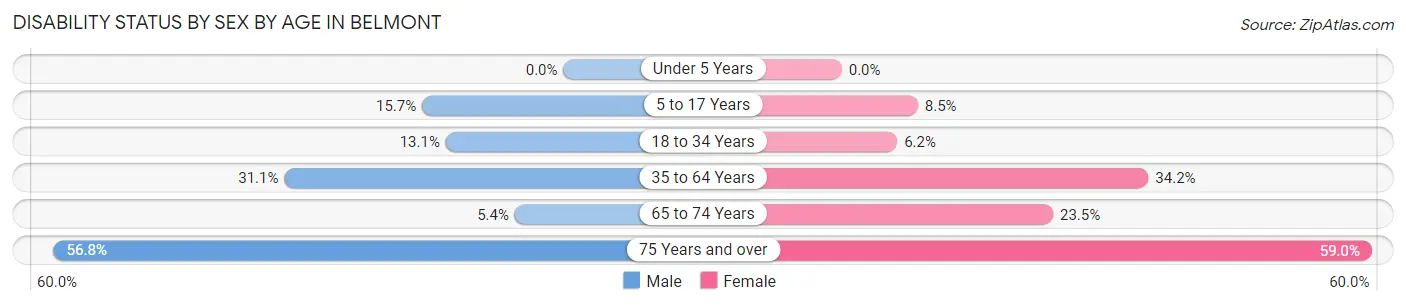
| Age Bracket | Male | Female |
| Under 5 Years | 0 (0.0%) | 0 (0.0%) |
| 5 to 17 Years | 17 (15.7%) | 5 (8.5%) |
| 18 to 34 Years | 11 (13.1%) | 5 (6.2%) |
| 35 to 64 Years | 46 (31.1%) | 42 (34.2%) |
| 65 to 74 Years | 2 (5.4%) | 12 (23.5%) |
| 75 Years and over | 21 (56.8%) | 36 (59.0%) |
Disability Class by Sex by Age in Belmont
Disability Class: Hearing Difficulty
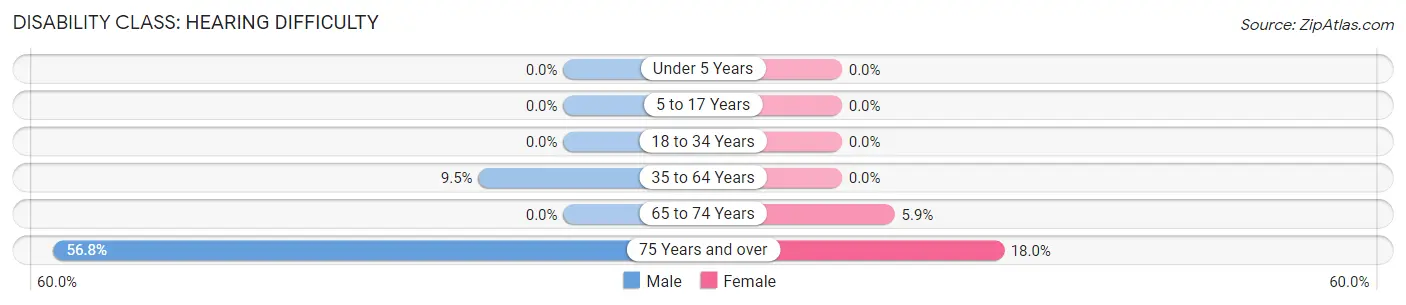
| Age Bracket | Male | Female |
| Under 5 Years | 0 (0.0%) | 0 (0.0%) |
| 5 to 17 Years | 0 (0.0%) | 0 (0.0%) |
| 18 to 34 Years | 0 (0.0%) | 0 (0.0%) |
| 35 to 64 Years | 14 (9.5%) | 0 (0.0%) |
| 65 to 74 Years | 0 (0.0%) | 3 (5.9%) |
| 75 Years and over | 21 (56.8%) | 11 (18.0%) |
Disability Class: Vision Difficulty
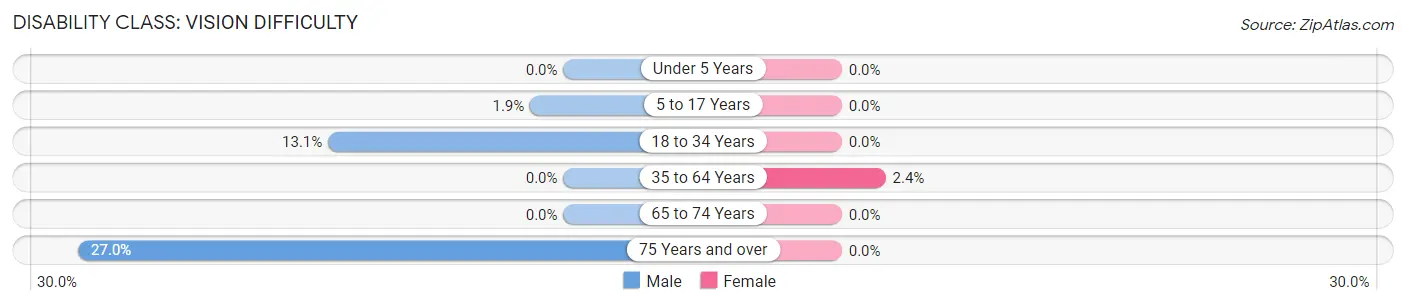
| Age Bracket | Male | Female |
| Under 5 Years | 0 (0.0%) | 0 (0.0%) |
| 5 to 17 Years | 2 (1.8%) | 0 (0.0%) |
| 18 to 34 Years | 11 (13.1%) | 0 (0.0%) |
| 35 to 64 Years | 0 (0.0%) | 3 (2.4%) |
| 65 to 74 Years | 0 (0.0%) | 0 (0.0%) |
| 75 Years and over | 10 (27.0%) | 0 (0.0%) |
Disability Class: Cognitive Difficulty
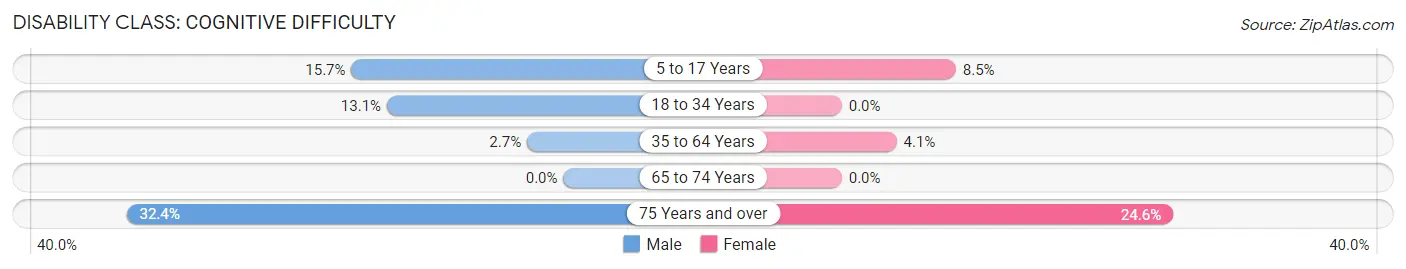
| Age Bracket | Male | Female |
| 5 to 17 Years | 17 (15.7%) | 5 (8.5%) |
| 18 to 34 Years | 11 (13.1%) | 0 (0.0%) |
| 35 to 64 Years | 4 (2.7%) | 5 (4.1%) |
| 65 to 74 Years | 0 (0.0%) | 0 (0.0%) |
| 75 Years and over | 12 (32.4%) | 15 (24.6%) |
Disability Class: Ambulatory Difficulty
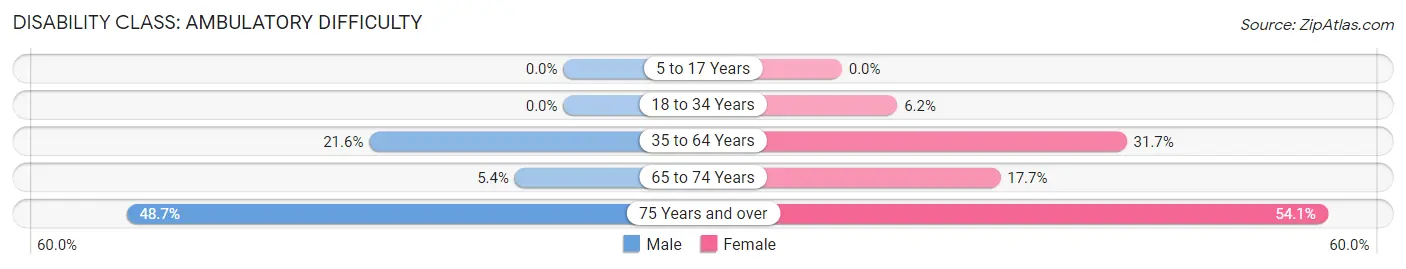
| Age Bracket | Male | Female |
| 5 to 17 Years | 0 (0.0%) | 0 (0.0%) |
| 18 to 34 Years | 0 (0.0%) | 5 (6.2%) |
| 35 to 64 Years | 32 (21.6%) | 39 (31.7%) |
| 65 to 74 Years | 2 (5.4%) | 9 (17.6%) |
| 75 Years and over | 18 (48.6%) | 33 (54.1%) |
Disability Class: Self-Care Difficulty
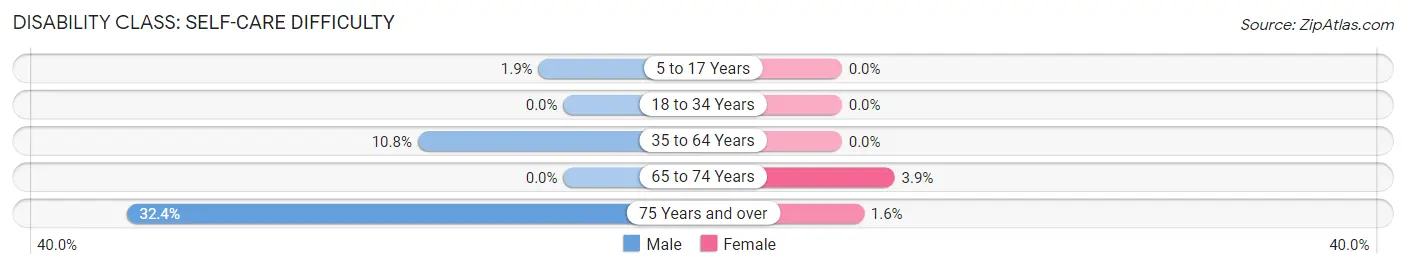
| Age Bracket | Male | Female |
| 5 to 17 Years | 2 (1.8%) | 0 (0.0%) |
| 18 to 34 Years | 0 (0.0%) | 0 (0.0%) |
| 35 to 64 Years | 16 (10.8%) | 0 (0.0%) |
| 65 to 74 Years | 0 (0.0%) | 2 (3.9%) |
| 75 Years and over | 12 (32.4%) | 1 (1.6%) |
Technology Access in Belmont
Computing Device Access in Belmont
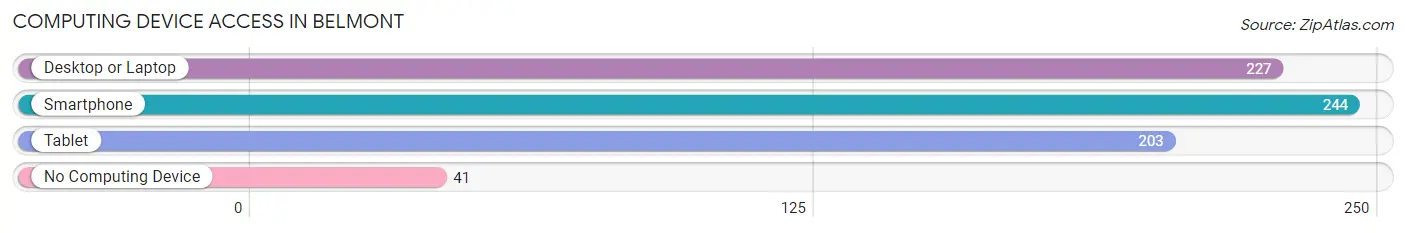
| Device Type | # Households | % Households |
| Desktop or Laptop | 227 | 66.0% |
| Smartphone | 244 | 70.9% |
| Tablet | 203 | 59.0% |
| No Computing Device | 41 | 11.9% |
| Total | 344 | 100.0% |
Internet Access in Belmont
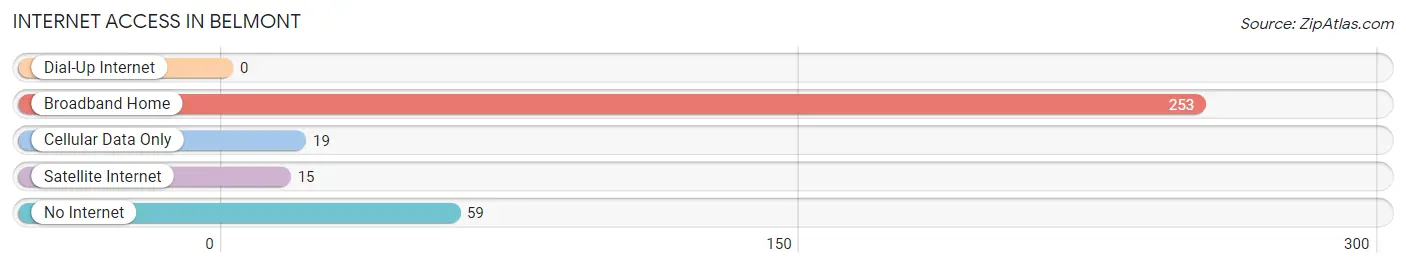
| Internet Type | # Households | % Households |
| Dial-Up Internet | 0 | 0.0% |
| Broadband Home | 253 | 73.6% |
| Cellular Data Only | 19 | 5.5% |
| Satellite Internet | 15 | 4.4% |
| No Internet | 59 | 17.2% |
| Total | 344 | 100.0% |
Belmont Summary
Belmont, NY is a small town located in the western part of Allegany County, New York. It is situated on the banks of the Genesee River and is home to a population of approximately 1,000 people. The town was founded in 1820 and has a rich history of industry, agriculture, and recreation.
Geography
Belmont is located in the western part of Allegany County, New York. It is situated on the banks of the Genesee River and is bordered by the towns of Amity, Angelica, and Wellsville. The town is approximately 10 miles from the Pennsylvania border and is located in the foothills of the Allegheny Mountains. The terrain is mostly rolling hills and valleys, with some flat areas. The highest point in the town is 1,400 feet above sea level.
Economy
Belmont’s economy is largely based on agriculture and tourism. The town is home to several farms, which produce a variety of crops, including corn, soybeans, hay, and wheat. The town also has a number of small businesses, including a grocery store, a hardware store, and a few restaurants. Tourism is also an important part of the local economy, as the town is home to several recreational areas, including a state park, a golf course, and a ski resort.
Demographics
As of the 2010 census, Belmont had a population of 1,000 people. The racial makeup of the town was 97.2% White, 0.7% African American, 0.3% Native American, 0.2% Asian, and 1.6% from other races. The median household income was $37,500, and the median family income was $45,000. The per capita income was $18,000.
History
Belmont was founded in 1820 by a group of settlers from Connecticut. The town was originally called “New Connecticut” and was later renamed Belmont, after the town of Belmont, Massachusetts. The town quickly grew and became an important center for industry and agriculture. In the late 19th century, the town was home to several mills, including a sawmill, a gristmill, and a woolen mill. The town also had a number of farms, which produced a variety of crops, including corn, wheat, and hay.
In the early 20th century, the town began to decline as the mills and farms closed. However, the town was revitalized in the 1950s when a ski resort was built in the area. The ski resort, which is still in operation today, helped to bring new life to the town and attract tourists.
Today, Belmont is a small, rural town with a population of approximately 1,000 people. The town is home to several recreational areas, including a state park, a golf course, and a ski resort. The town is also home to several small businesses, including a grocery store, a hardware store, and a few restaurants. Belmont is a quiet, peaceful town with a rich history and a bright future.
Common Questions
What is Per Capita Income in Belmont?
Per Capita income in Belmont is $31,618.
What is the Median Family Income in Belmont?
Median Family Income in Belmont is $84,792.
What is the Median Household income in Belmont?
Median Household Income in Belmont is $57,679.
What is Income or Wage Gap in Belmont?
Income or Wage Gap in Belmont is 14.2%.
Women in Belmont earn 85.8 cents for every dollar earned by a man.
What is Inequality or Gini Index in Belmont?
Inequality or Gini Index in Belmont is 0.46.
What is the Total Population of Belmont?
Total Population of Belmont is 865.
What is the Total Male Population of Belmont?
Total Male Population of Belmont is 432.
What is the Total Female Population of Belmont?
Total Female Population of Belmont is 433.
What is the Ratio of Males per 100 Females in Belmont?
There are 99.77 Males per 100 Females in Belmont.
What is the Ratio of Females per 100 Males in Belmont?
There are 100.23 Females per 100 Males in Belmont.
What is the Median Population Age in Belmont?
Median Population Age in Belmont is 39.9 Years.
What is the Average Family Size in Belmont
Average Family Size in Belmont is 3.2 People.
What is the Average Household Size in Belmont
Average Household Size in Belmont is 2.4 People.
How Large is the Labor Force in Belmont?
There are 373 People in the Labor Forcein in Belmont.
What is the Percentage of People in the Labor Force in Belmont?
56.7% of People are in the Labor Force in Belmont.
What is the Unemployment Rate in Belmont?
Unemployment Rate in Belmont is 1.6%.