Beaver Dam Lake, NY Map & Demographics
Beaver Dam Lake Map
Beaver Dam Lake Overview
$42,392
PER CAPITA INCOME
$114,025
AVG FAMILY INCOME
$113,775
AVG HOUSEHOLD INCOME
36.5%
WAGE / INCOME GAP [ % ]
63.5¢/ $1
WAGE / INCOME GAP [ $ ]
0.34
INEQUALITY / GINI INDEX
3,296
TOTAL POPULATION
1,402
MALE POPULATION
1,894
FEMALE POPULATION
74.02
MALES / 100 FEMALES
135.09
FEMALES / 100 MALES
36.3
MEDIAN AGE
3.4
AVG FAMILY SIZE
3.2
AVG HOUSEHOLD SIZE
1,712
LABOR FORCE [ PEOPLE ]
68.0%
PERCENT IN LABOR FORCE
6.2%
UNEMPLOYMENT RATE
Income in Beaver Dam Lake
Income Overview in Beaver Dam Lake
Per Capita Income in Beaver Dam Lake is $42,392, while median incomes of families and households are $114,025 and $113,775 respectively.
| Characteristic | Number | Measure |
| Per Capita Income | 3,296 | $42,392 |
| Median Family Income | 851 | $114,025 |
| Mean Family Income | 851 | $133,575 |
| Median Household Income | 1,027 | $113,775 |
| Mean Household Income | 1,027 | $131,234 |
| Income Deficit | 851 | $0 |
| Wage / Income Gap (%) | 3,296 | 36.49% |
| Wage / Income Gap ($) | 3,296 | 63.51¢ per $1 |
| Gini / Inequality Index | 3,296 | 0.34 |
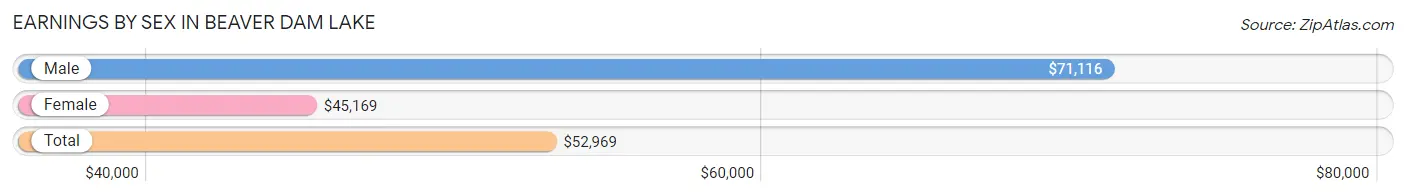
Earnings by Sex in Beaver Dam Lake
Average Earnings in Beaver Dam Lake are $52,969, $71,116 for men and $45,169 for women, a difference of 36.5%.
| Sex | Number | Average Earnings |
| Male | 749 (43.6%) | $71,116 |
| Female | 967 (56.4%) | $45,169 |
| Total | 1,716 (100.0%) | $52,969 |
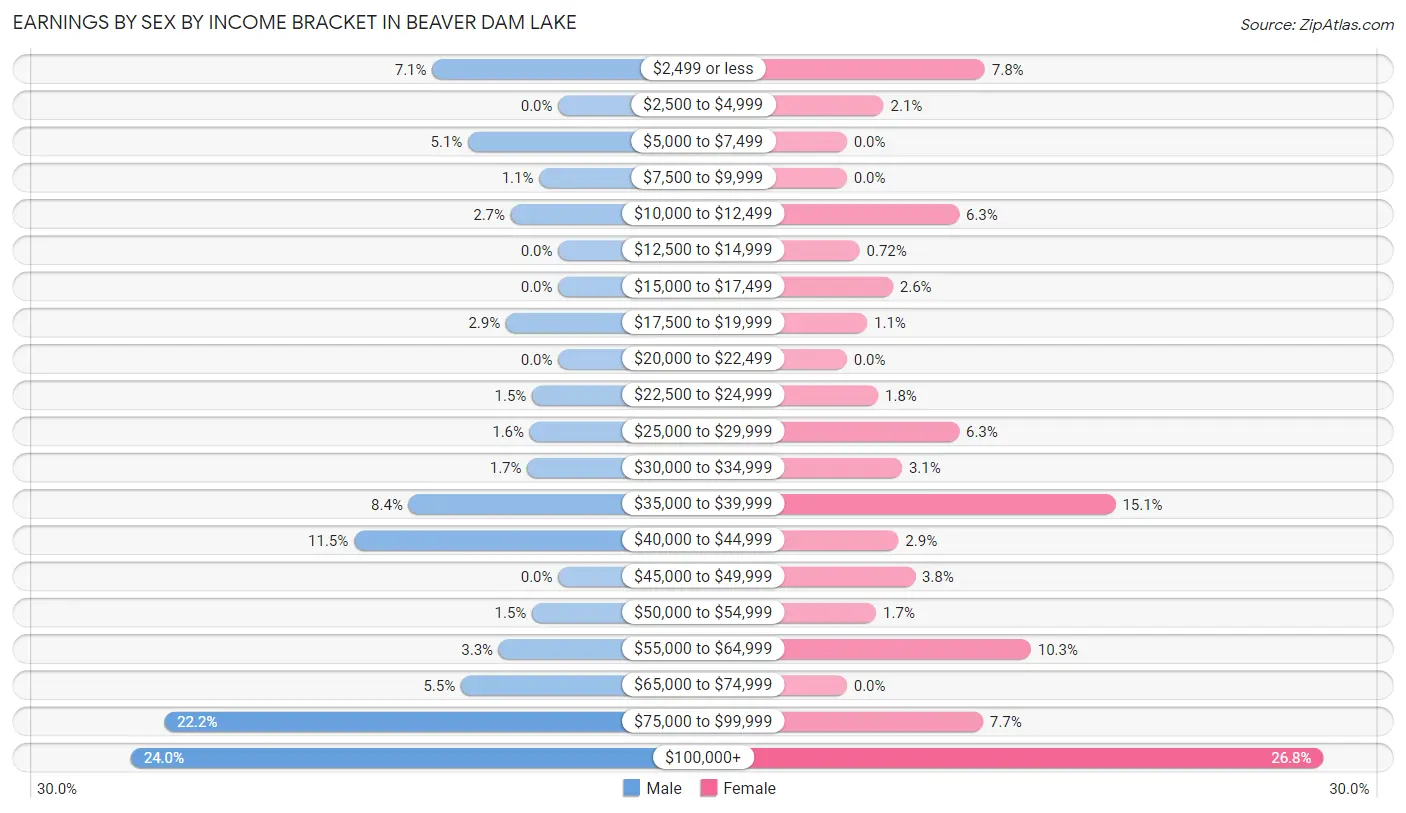
Earnings by Sex by Income Bracket in Beaver Dam Lake
The most common earnings brackets in Beaver Dam Lake are $100,000+ for men (180 | 24.0%) and $100,000+ for women (259 | 26.8%).
| Income | Male | Female |
| $2,499 or less | 53 (7.1%) | 75 (7.8%) |
| $2,500 to $4,999 | 0 (0.0%) | 20 (2.1%) |
| $5,000 to $7,499 | 38 (5.1%) | 0 (0.0%) |
| $7,500 to $9,999 | 8 (1.1%) | 0 (0.0%) |
| $10,000 to $12,499 | 20 (2.7%) | 61 (6.3%) |
| $12,500 to $14,999 | 0 (0.0%) | 7 (0.7%) |
| $15,000 to $17,499 | 0 (0.0%) | 25 (2.6%) |
| $17,500 to $19,999 | 22 (2.9%) | 11 (1.1%) |
| $20,000 to $22,499 | 0 (0.0%) | 0 (0.0%) |
| $22,500 to $24,999 | 11 (1.5%) | 17 (1.8%) |
| $25,000 to $29,999 | 12 (1.6%) | 61 (6.3%) |
| $30,000 to $34,999 | 13 (1.7%) | 30 (3.1%) |
| $35,000 to $39,999 | 63 (8.4%) | 146 (15.1%) |
| $40,000 to $44,999 | 86 (11.5%) | 28 (2.9%) |
| $45,000 to $49,999 | 0 (0.0%) | 37 (3.8%) |
| $50,000 to $54,999 | 11 (1.5%) | 16 (1.7%) |
| $55,000 to $64,999 | 25 (3.3%) | 100 (10.3%) |
| $65,000 to $74,999 | 41 (5.5%) | 0 (0.0%) |
| $75,000 to $99,999 | 166 (22.2%) | 74 (7.6%) |
| $100,000+ | 180 (24.0%) | 259 (26.8%) |
| Total | 749 (100.0%) | 967 (100.0%) |
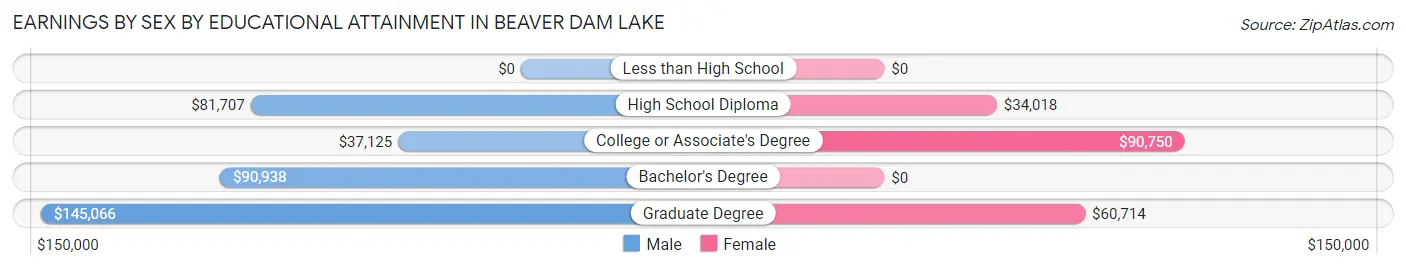
Earnings by Sex by Educational Attainment in Beaver Dam Lake
Average earnings in Beaver Dam Lake are $80,378 for men and $54,063 for women, a difference of 32.7%. Men with an educational attainment of graduate degree enjoy the highest average annual earnings of $145,066, while those with college or associate's degree education earn the least with $37,125. Women with an educational attainment of college or associate's degree earn the most with the average annual earnings of $90,750, while those with high school diploma education have the smallest earnings of $34,018.
| Educational Attainment | Male Income | Female Income |
| Less than High School | - | - |
| High School Diploma | $81,707 | $34,018 |
| College or Associate's Degree | $37,125 | $90,750 |
| Bachelor's Degree | $90,938 | $0 |
| Graduate Degree | $145,066 | $60,714 |
| Total | $80,378 | $54,063 |
Family Income in Beaver Dam Lake
Family Income Brackets in Beaver Dam Lake
According to the Beaver Dam Lake family income data, there are 210 families falling into the $150,000 to $199,999 income range, which is the most common income bracket and makes up 24.7% of all families.
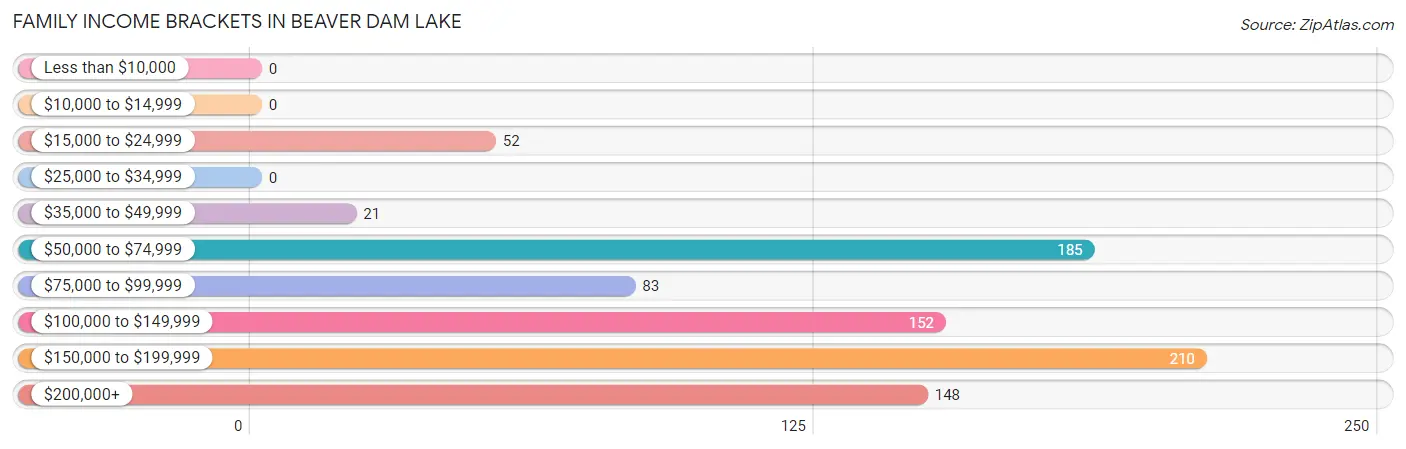
| Income Bracket | # Families | % Families |
| Less than $10,000 | 0 | 0.0% |
| $10,000 to $14,999 | 0 | 0.0% |
| $15,000 to $24,999 | 52 | 6.1% |
| $25,000 to $34,999 | 0 | 0.0% |
| $35,000 to $49,999 | 21 | 2.5% |
| $50,000 to $74,999 | 185 | 21.7% |
| $75,000 to $99,999 | 83 | 9.8% |
| $100,000 to $149,999 | 152 | 17.9% |
| $150,000 to $199,999 | 210 | 24.7% |
| $200,000+ | 148 | 17.4% |
Family Income by Famaliy Size in Beaver Dam Lake
4-person families (162 | 19.0%) account for the highest median family income in Beaver Dam Lake with $191,607 per family, while 3-person families (219 | 25.7%) have the highest median income of $56,708 per family member.
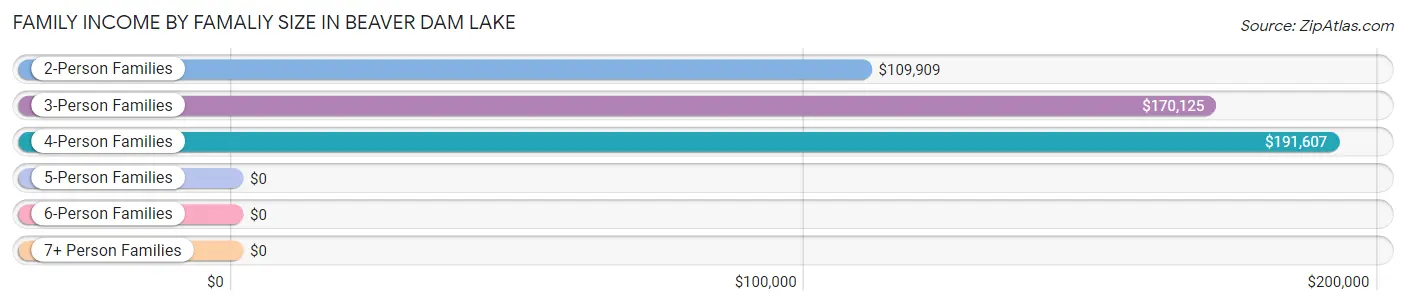
| Income Bracket | # Families | Median Income |
| 2-Person Families | 353 (41.5%) | $109,909 |
| 3-Person Families | 219 (25.7%) | $170,125 |
| 4-Person Families | 162 (19.0%) | $191,607 |
| 5-Person Families | 25 (2.9%) | $0 |
| 6-Person Families | 38 (4.5%) | $0 |
| 7+ Person Families | 54 (6.4%) | $0 |
| Total | 851 (100.0%) | $114,025 |
Family Income by Number of Earners in Beaver Dam Lake
The median family income in Beaver Dam Lake is $114,025, with families comprising 3+ earners (62) having the highest median family income of $191,875, while families with no earners (52) have the lowest median family income of $72,031, accounting for 7.3% and 6.1% of families, respectively.
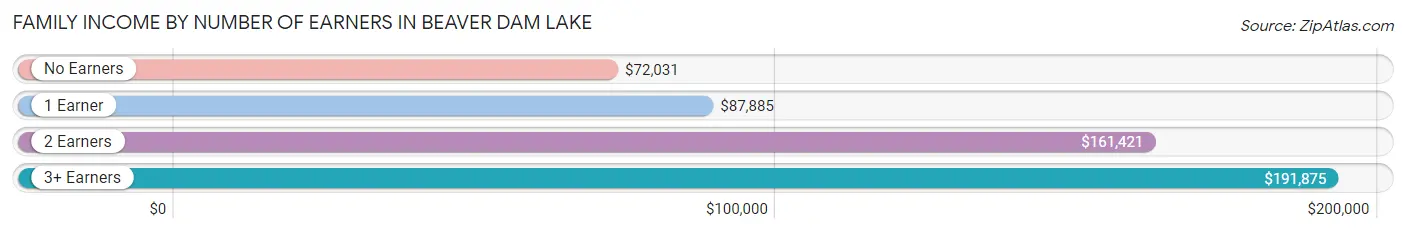
| Number of Earners | # Families | Median Income |
| No Earners | 52 (6.1%) | $72,031 |
| 1 Earner | 270 (31.7%) | $87,885 |
| 2 Earners | 467 (54.9%) | $161,421 |
| 3+ Earners | 62 (7.3%) | $191,875 |
| Total | 851 (100.0%) | $114,025 |
Household Income in Beaver Dam Lake
Household Income Brackets in Beaver Dam Lake
With 264 households falling in the category, the $150,000 to $199,999 income range is the most frequent in Beaver Dam Lake, accounting for 25.7% of all households. In contrast, only 7 households (0.7%) fall into the $25,000 to $34,999 income bracket, making it the least populous group.
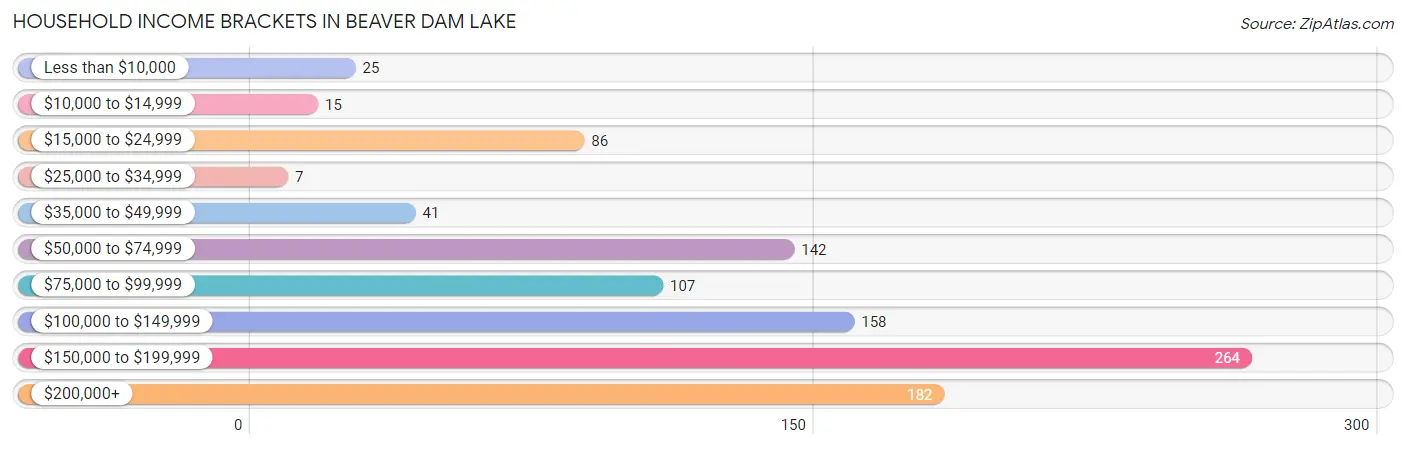
| Income Bracket | # Households | % Households |
| Less than $10,000 | 25 | 2.4% |
| $10,000 to $14,999 | 15 | 1.5% |
| $15,000 to $24,999 | 86 | 8.4% |
| $25,000 to $34,999 | 7 | 0.7% |
| $35,000 to $49,999 | 41 | 4.0% |
| $50,000 to $74,999 | 142 | 13.8% |
| $75,000 to $99,999 | 107 | 10.4% |
| $100,000 to $149,999 | 158 | 15.4% |
| $150,000 to $199,999 | 264 | 25.7% |
| $200,000+ | 182 | 17.7% |
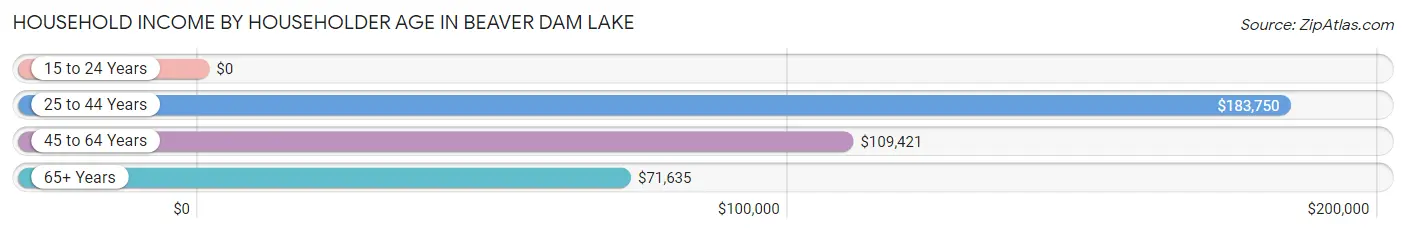
Household Income by Householder Age in Beaver Dam Lake
The median household income in Beaver Dam Lake is $113,775, with the highest median household income of $183,750 found in the 25 to 44 years age bracket for the primary householder. A total of 365 households (35.5%) fall into this category.
| Income Bracket | # Households | Median Income |
| 15 to 24 Years | 0 (0.0%) | $0 |
| 25 to 44 Years | 365 (35.5%) | $183,750 |
| 45 to 64 Years | 451 (43.9%) | $109,421 |
| 65+ Years | 211 (20.5%) | $71,635 |
| Total | 1,027 (100.0%) | $113,775 |
Poverty in Beaver Dam Lake
Income Below Poverty by Sex and Age in Beaver Dam Lake
With 6.7% poverty level for males and 3.2% for females among the residents of Beaver Dam Lake, 6 to 11 year old males and 45 to 54 year old females are the most vulnerable to poverty, with 18 males (100.0%) and 17 females (7.0%) in their respective age groups living below the poverty level.
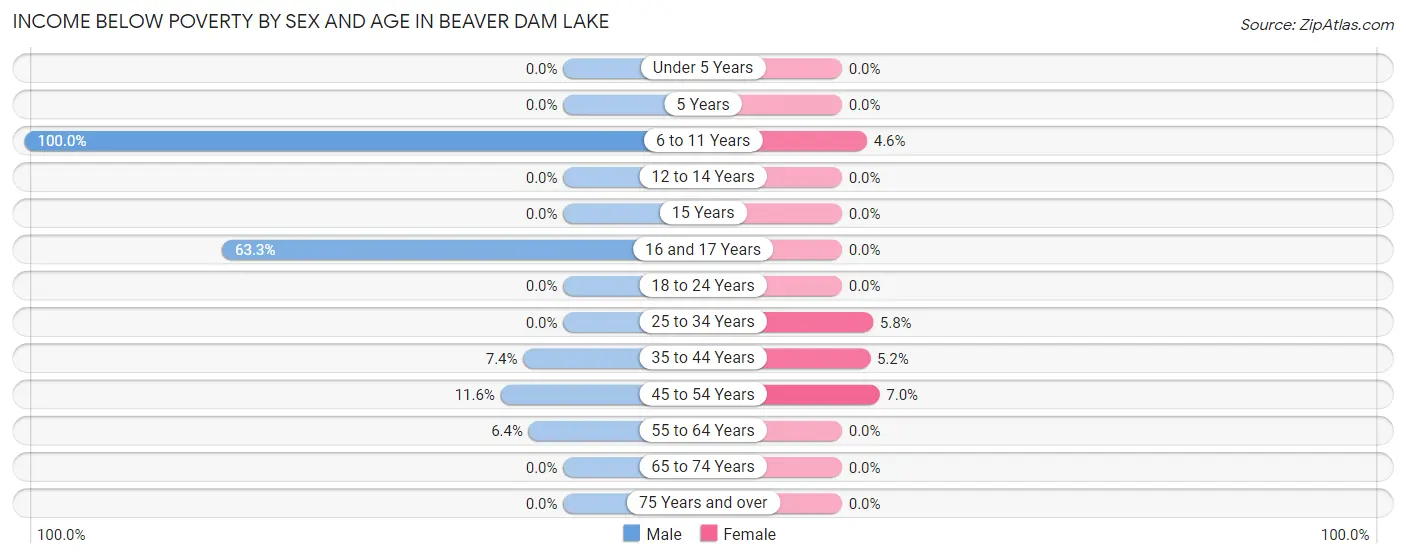
| Age Bracket | Male | Female |
| Under 5 Years | 0 (0.0%) | 0 (0.0%) |
| 5 Years | 0 (0.0%) | 0 (0.0%) |
| 6 to 11 Years | 18 (100.0%) | 15 (4.6%) |
| 12 to 14 Years | 0 (0.0%) | 0 (0.0%) |
| 15 Years | 0 (0.0%) | 0 (0.0%) |
| 16 and 17 Years | 19 (63.3%) | 0 (0.0%) |
| 18 to 24 Years | 0 (0.0%) | 0 (0.0%) |
| 25 to 34 Years | 0 (0.0%) | 11 (5.8%) |
| 35 to 44 Years | 17 (7.4%) | 17 (5.2%) |
| 45 to 54 Years | 25 (11.6%) | 17 (7.0%) |
| 55 to 64 Years | 15 (6.4%) | 0 (0.0%) |
| 65 to 74 Years | 0 (0.0%) | 0 (0.0%) |
| 75 Years and over | 0 (0.0%) | 0 (0.0%) |
| Total | 94 (6.7%) | 60 (3.2%) |
Income Above Poverty by Sex and Age in Beaver Dam Lake
According to the poverty statistics in Beaver Dam Lake, males aged under 5 years and females aged under 5 years are the age groups that are most secure financially, with 100.0% of males and 100.0% of females in these age groups living above the poverty line.
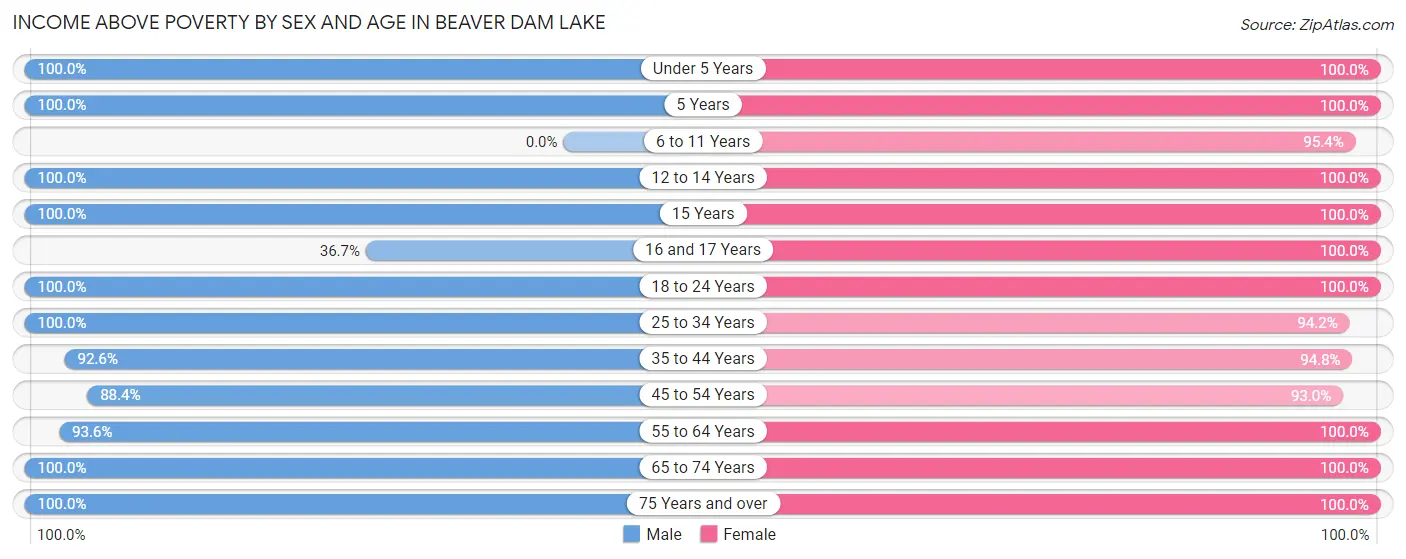
| Age Bracket | Male | Female |
| Under 5 Years | 128 (100.0%) | 76 (100.0%) |
| 5 Years | 36 (100.0%) | 56 (100.0%) |
| 6 to 11 Years | 0 (0.0%) | 308 (95.4%) |
| 12 to 14 Years | 49 (100.0%) | 8 (100.0%) |
| 15 Years | 47 (100.0%) | 38 (100.0%) |
| 16 and 17 Years | 11 (36.7%) | 42 (100.0%) |
| 18 to 24 Years | 113 (100.0%) | 169 (100.0%) |
| 25 to 34 Years | 179 (100.0%) | 180 (94.2%) |
| 35 to 44 Years | 212 (92.6%) | 308 (94.8%) |
| 45 to 54 Years | 190 (88.4%) | 227 (93.0%) |
| 55 to 64 Years | 219 (93.6%) | 240 (100.0%) |
| 65 to 74 Years | 70 (100.0%) | 92 (100.0%) |
| 75 Years and over | 54 (100.0%) | 90 (100.0%) |
| Total | 1,308 (93.3%) | 1,834 (96.8%) |
Income Below Poverty Among Married-Couple Families in Beaver Dam Lake
The poverty statistics for married-couple families in Beaver Dam Lake show that 2.7% or 17 of the total 624 families live below the poverty line. Families with 3 or 4 children have the highest poverty rate of 30.9%, comprising of 17 families. On the other hand, families with no children have the lowest poverty rate of 0.0%, which includes 0 families.
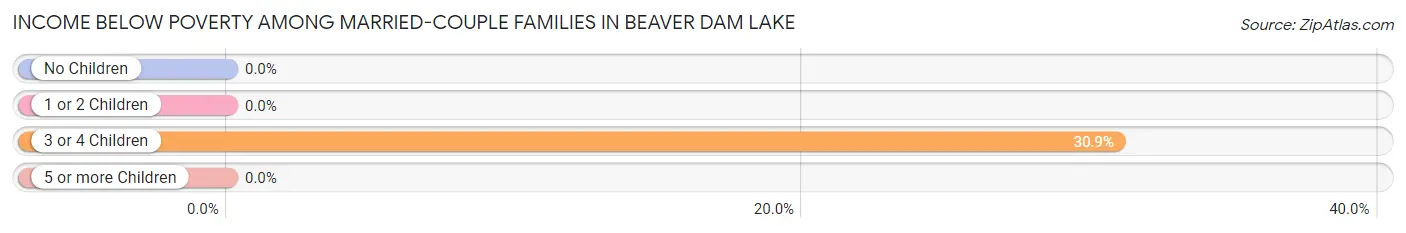
| Children | Above Poverty | Below Poverty |
| No Children | 375 (100.0%) | 0 (0.0%) |
| 1 or 2 Children | 194 (100.0%) | 0 (0.0%) |
| 3 or 4 Children | 38 (69.1%) | 17 (30.9%) |
| 5 or more Children | 0 (0.0%) | 0 (0.0%) |
| Total | 607 (97.3%) | 17 (2.7%) |
Income Below Poverty Among Single-Parent Households in Beaver Dam Lake
| Children | Single Father | Single Mother |
| No Children | 0 (0.0%) | 0 (0.0%) |
| 1 or 2 Children | 0 (0.0%) | 0 (0.0%) |
| 3 or 4 Children | 0 (0.0%) | 0 (0.0%) |
| 5 or more Children | 0 (0.0%) | 0 (0.0%) |
| Total | 0 (0.0%) | 0 (0.0%) |
Income Below Poverty Among Married-Couple vs Single-Parent Households in Beaver Dam Lake
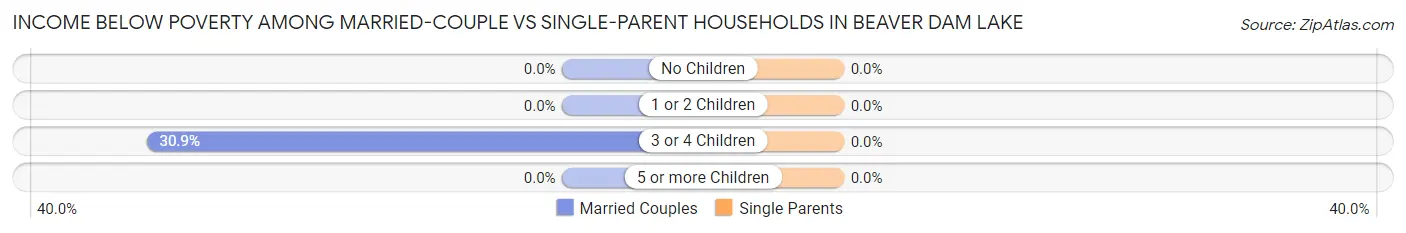
| Children | Married-Couple Families | Single-Parent Households |
| No Children | 0 (0.0%) | 0 (0.0%) |
| 1 or 2 Children | 0 (0.0%) | 0 (0.0%) |
| 3 or 4 Children | 17 (30.9%) | 0 (0.0%) |
| 5 or more Children | 0 (0.0%) | 0 (0.0%) |
| Total | 17 (2.7%) | 0 (0.0%) |
Race in Beaver Dam Lake
The most populous races in Beaver Dam Lake are White / Caucasian (2,967 | 90.0%), Hispanic or Latino (583 | 17.7%), and Two or more Races (212 | 6.4%).
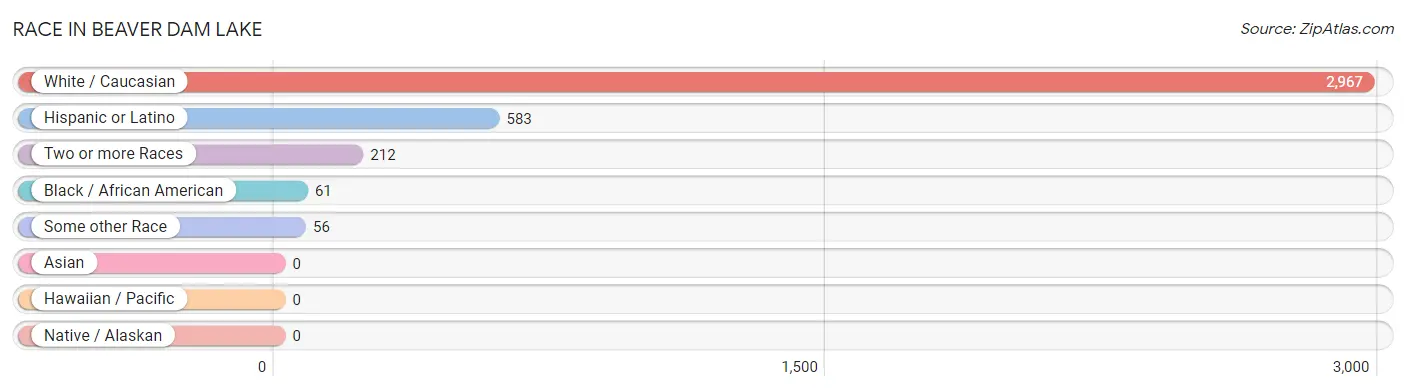
| Race | # Population | % Population |
| Asian | 0 | 0.0% |
| Black / African American | 61 | 1.8% |
| Hawaiian / Pacific | 0 | 0.0% |
| Hispanic or Latino | 583 | 17.7% |
| Native / Alaskan | 0 | 0.0% |
| White / Caucasian | 2,967 | 90.0% |
| Two or more Races | 212 | 6.4% |
| Some other Race | 56 | 1.7% |
| Total | 3,296 | 100.0% |
Ancestry in Beaver Dam Lake
The most populous ancestries reported in Beaver Dam Lake are Irish (752 | 22.8%), Italian (727 | 22.1%), American (707 | 21.4%), Puerto Rican (455 | 13.8%), and German (334 | 10.1%), together accounting for 90.3% of all Beaver Dam Lake residents.
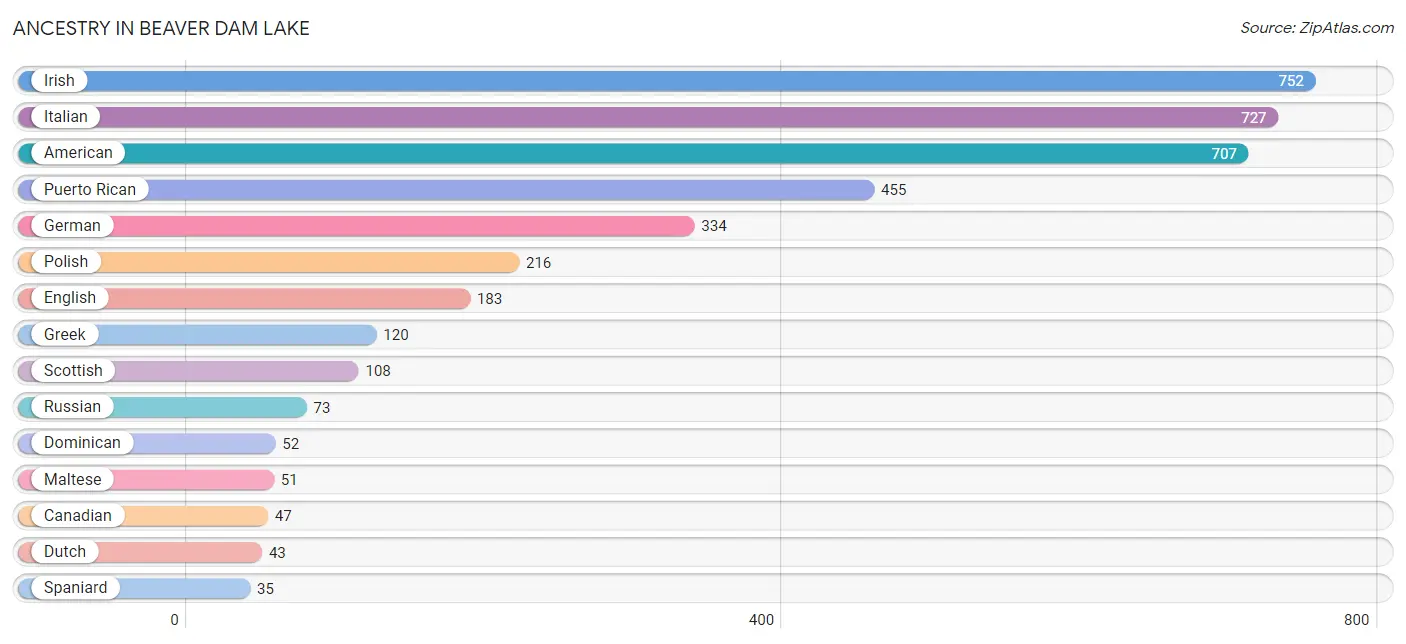
| Ancestry | # Population | % Population |
| African | 9 | 0.3% |
| American | 707 | 21.4% |
| Barbadian | 33 | 1.0% |
| Canadian | 47 | 1.4% |
| Colombian | 13 | 0.4% |
| Czech | 13 | 0.4% |
| Czechoslovakian | 27 | 0.8% |
| Dominican | 52 | 1.6% |
| Dutch | 43 | 1.3% |
| Eastern European | 7 | 0.2% |
| English | 183 | 5.6% |
| European | 11 | 0.3% |
| Finnish | 13 | 0.4% |
| French | 11 | 0.3% |
| German | 334 | 10.1% |
| Greek | 120 | 3.6% |
| Hungarian | 11 | 0.3% |
| Irish | 752 | 22.8% |
| Italian | 727 | 22.1% |
| Jamaican | 8 | 0.2% |
| Maltese | 51 | 1.5% |
| Mexican | 20 | 0.6% |
| Navajo | 8 | 0.2% |
| Polish | 216 | 6.6% |
| Portuguese | 27 | 0.8% |
| Puerto Rican | 455 | 13.8% |
| Russian | 73 | 2.2% |
| Scotch-Irish | 10 | 0.3% |
| Scottish | 108 | 3.3% |
| Slovak | 22 | 0.7% |
| South American | 13 | 0.4% |
| Spaniard | 35 | 1.1% |
| Subsaharan African | 9 | 0.3% | View All 33 Rows |
Immigrants in Beaver Dam Lake
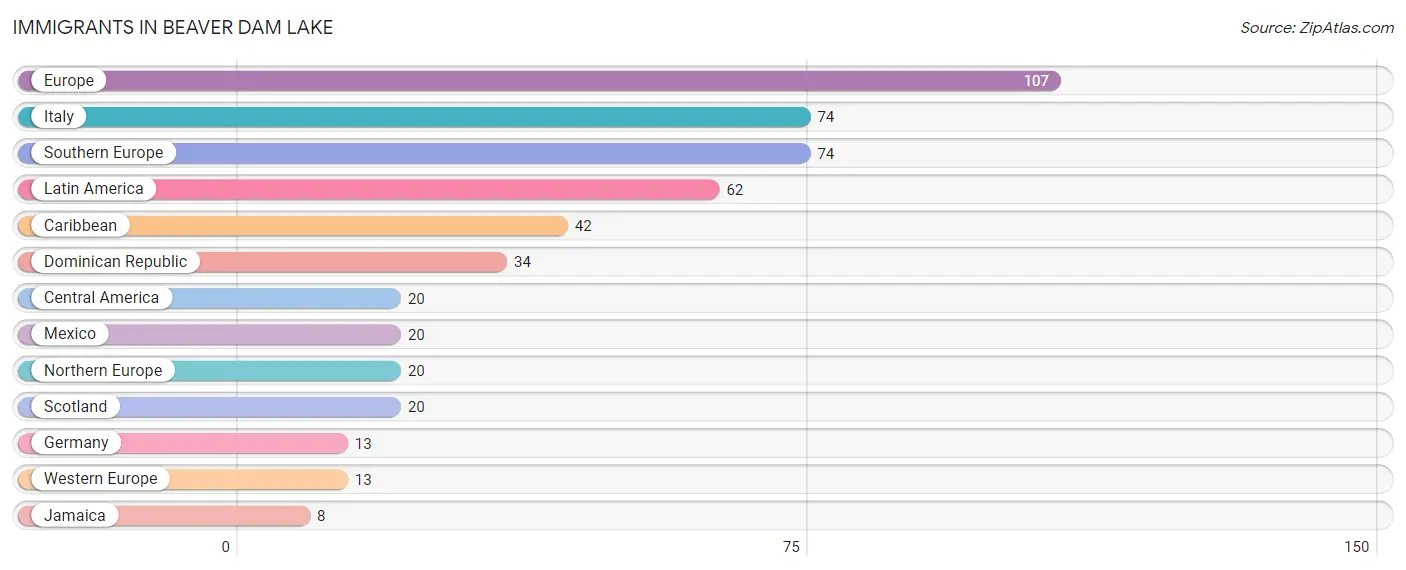
The most numerous immigrant groups reported in Beaver Dam Lake came from Europe (107 | 3.3%), Italy (74 | 2.2%), Southern Europe (74 | 2.2%), Latin America (62 | 1.9%), and Caribbean (42 | 1.3%), together accounting for 10.9% of all Beaver Dam Lake residents.
| Immigration Origin | # Population | % Population |
| Caribbean | 42 | 1.3% |
| Central America | 20 | 0.6% |
| Dominican Republic | 34 | 1.0% |
| Europe | 107 | 3.3% |
| Germany | 13 | 0.4% |
| Italy | 74 | 2.2% |
| Jamaica | 8 | 0.2% |
| Latin America | 62 | 1.9% |
| Mexico | 20 | 0.6% |
| Northern Europe | 20 | 0.6% |
| Scotland | 20 | 0.6% |
| Southern Europe | 74 | 2.2% |
| Western Europe | 13 | 0.4% | View All 13 Rows |
Sex and Age in Beaver Dam Lake
Sex and Age in Beaver Dam Lake
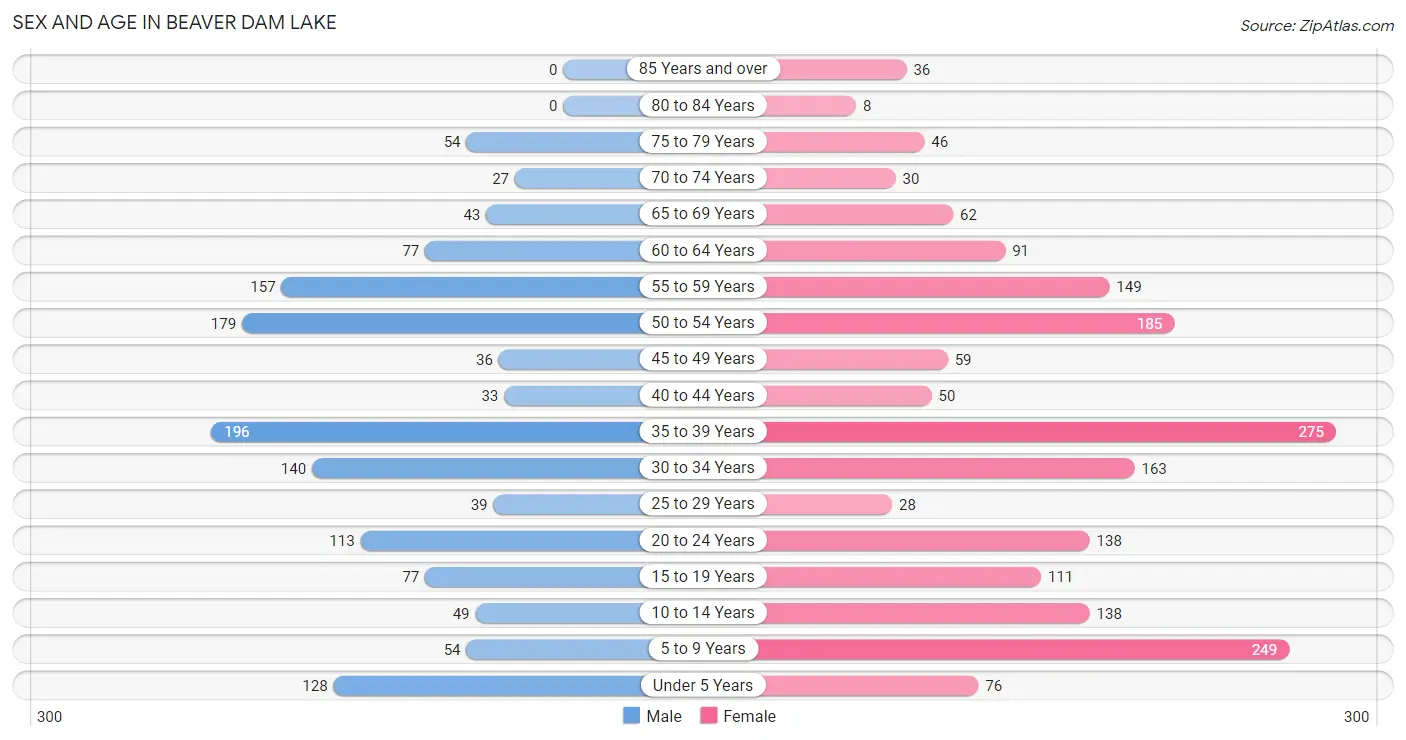
The most populous age groups in Beaver Dam Lake are 35 to 39 Years (196 | 14.0%) for men and 35 to 39 Years (275 | 14.5%) for women.
| Age Bracket | Male | Female |
| Under 5 Years | 128 (9.1%) | 76 (4.0%) |
| 5 to 9 Years | 54 (3.8%) | 249 (13.2%) |
| 10 to 14 Years | 49 (3.5%) | 138 (7.3%) |
| 15 to 19 Years | 77 (5.5%) | 111 (5.9%) |
| 20 to 24 Years | 113 (8.1%) | 138 (7.3%) |
| 25 to 29 Years | 39 (2.8%) | 28 (1.5%) |
| 30 to 34 Years | 140 (10.0%) | 163 (8.6%) |
| 35 to 39 Years | 196 (14.0%) | 275 (14.5%) |
| 40 to 44 Years | 33 (2.4%) | 50 (2.6%) |
| 45 to 49 Years | 36 (2.6%) | 59 (3.1%) |
| 50 to 54 Years | 179 (12.8%) | 185 (9.8%) |
| 55 to 59 Years | 157 (11.2%) | 149 (7.9%) |
| 60 to 64 Years | 77 (5.5%) | 91 (4.8%) |
| 65 to 69 Years | 43 (3.1%) | 62 (3.3%) |
| 70 to 74 Years | 27 (1.9%) | 30 (1.6%) |
| 75 to 79 Years | 54 (3.8%) | 46 (2.4%) |
| 80 to 84 Years | 0 (0.0%) | 8 (0.4%) |
| 85 Years and over | 0 (0.0%) | 36 (1.9%) |
| Total | 1,402 (100.0%) | 1,894 (100.0%) |
Families and Households in Beaver Dam Lake
Median Family Size in Beaver Dam Lake
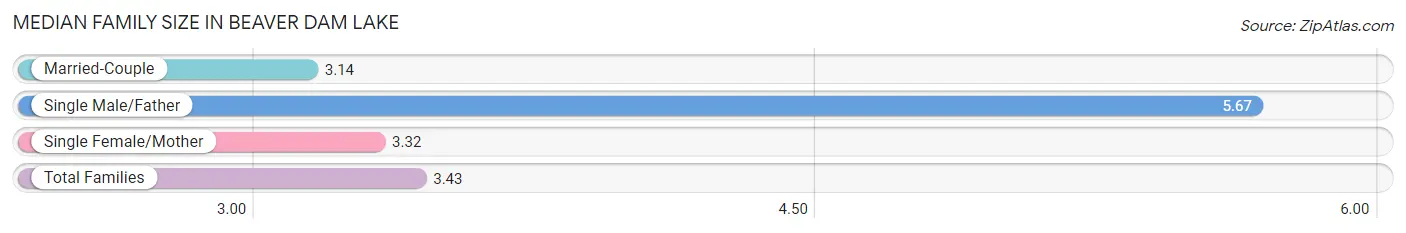
The median family size in Beaver Dam Lake is 3.43 persons per family, with single male/father families (88 | 10.3%) accounting for the largest median family size of 5.67 persons per family. On the other hand, married-couple families (624 | 73.3%) represent the smallest median family size with 3.14 persons per family.
| Family Type | # Families | Family Size |
| Married-Couple | 624 (73.3%) | 3.14 |
| Single Male/Father | 88 (10.3%) | 5.67 |
| Single Female/Mother | 139 (16.3%) | 3.32 |
| Total Families | 851 (100.0%) | 3.43 |
Median Household Size in Beaver Dam Lake
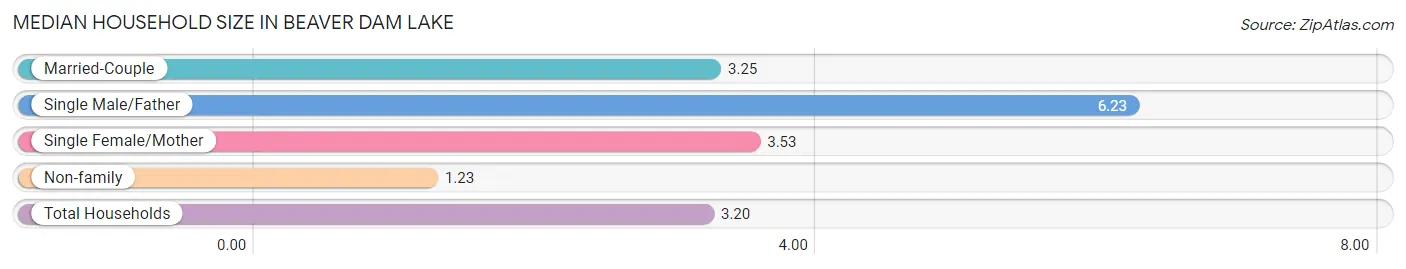
The median household size in Beaver Dam Lake is 3.20 persons per household, with single male/father households (88 | 8.6%) accounting for the largest median household size of 6.23 persons per household. non-family households (176 | 17.1%) represent the smallest median household size with 1.23 persons per household.
| Household Type | # Households | Household Size |
| Married-Couple | 624 (60.8%) | 3.25 |
| Single Male/Father | 88 (8.6%) | 6.23 |
| Single Female/Mother | 139 (13.5%) | 3.53 |
| Non-family | 176 (17.1%) | 1.23 |
| Total Households | 1,027 (100.0%) | 3.20 |
Household Size by Marriage Status in Beaver Dam Lake
Out of a total of 1,027 households in Beaver Dam Lake, 851 (82.9%) are family households, while 176 (17.1%) are nonfamily households. The most numerous type of family households are 3-person households, comprising 316, and the most common type of nonfamily households are 1-person households, comprising 140.
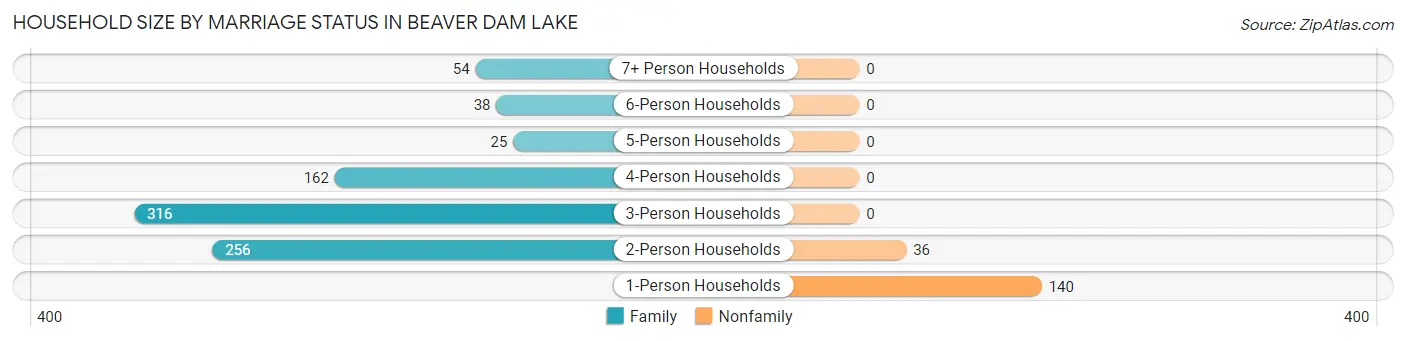
| Household Size | Family Households | Nonfamily Households |
| 1-Person Households | - | 140 (13.6%) |
| 2-Person Households | 256 (24.9%) | 36 (3.5%) |
| 3-Person Households | 316 (30.8%) | 0 (0.0%) |
| 4-Person Households | 162 (15.8%) | 0 (0.0%) |
| 5-Person Households | 25 (2.4%) | 0 (0.0%) |
| 6-Person Households | 38 (3.7%) | 0 (0.0%) |
| 7+ Person Households | 54 (5.3%) | 0 (0.0%) |
| Total | 851 (82.9%) | 176 (17.1%) |
Female Fertility in Beaver Dam Lake
Fertility by Age in Beaver Dam Lake
Average fertility rate in Beaver Dam Lake is 90.0 births per 1,000 women. Women in the age bracket of 35 to 50 years have the highest fertility rate with 182.0 births per 1,000 women. Women in the age bracket of 35 to 50 years acount for 100.0% of all women with births.
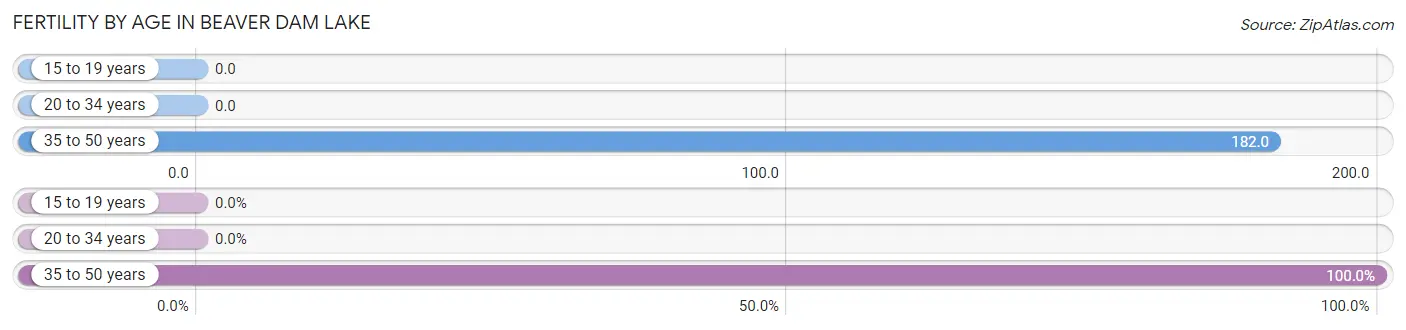
| Age Bracket | Women with Births | Births / 1,000 Women |
| 15 to 19 years | 0 (0.0%) | 0.0 |
| 20 to 34 years | 0 (0.0%) | 0.0 |
| 35 to 50 years | 78 (100.0%) | 182.0 |
| Total | 78 (100.0%) | 90.0 |
Fertility by Age by Marriage Status in Beaver Dam Lake
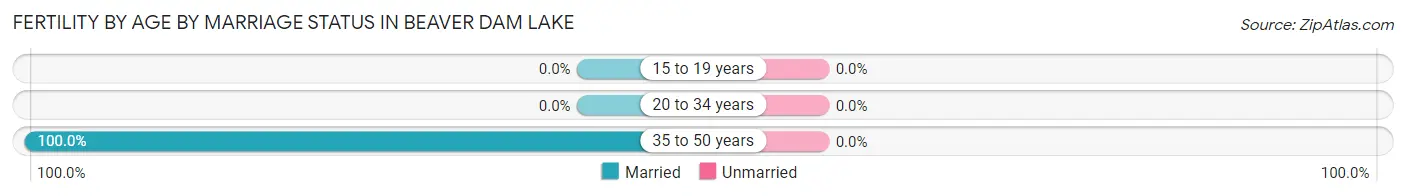
| Age Bracket | Married | Unmarried |
| 15 to 19 years | 0 (0.0%) | 0 (0.0%) |
| 20 to 34 years | 0 (0.0%) | 0 (0.0%) |
| 35 to 50 years | 78 (100.0%) | 0 (0.0%) |
| Total | 78 (100.0%) | 0 (0.0%) |
Fertility by Education in Beaver Dam Lake
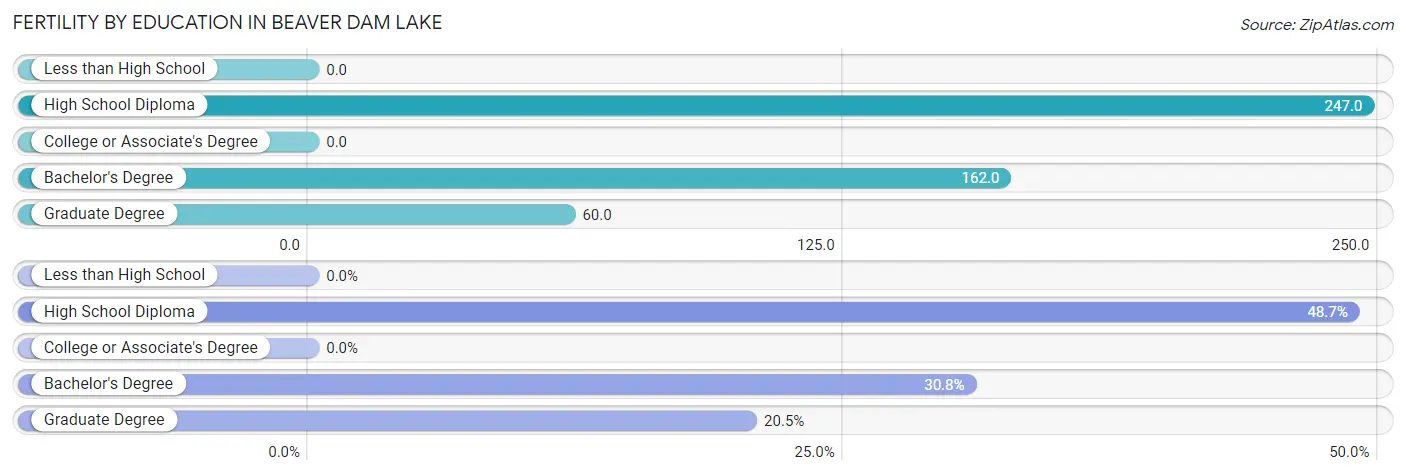
| Educational Attainment | Women with Births | Births / 1,000 Women |
| Less than High School | 0 (0.0%) | 0.0 |
| High School Diploma | 38 (48.7%) | 247.0 |
| College or Associate's Degree | 0 (0.0%) | 0.0 |
| Bachelor's Degree | 24 (30.8%) | 162.0 |
| Graduate Degree | 16 (20.5%) | 60.0 |
| Total | 78 (100.0%) | 90.0 |
Fertility by Education by Marriage Status in Beaver Dam Lake
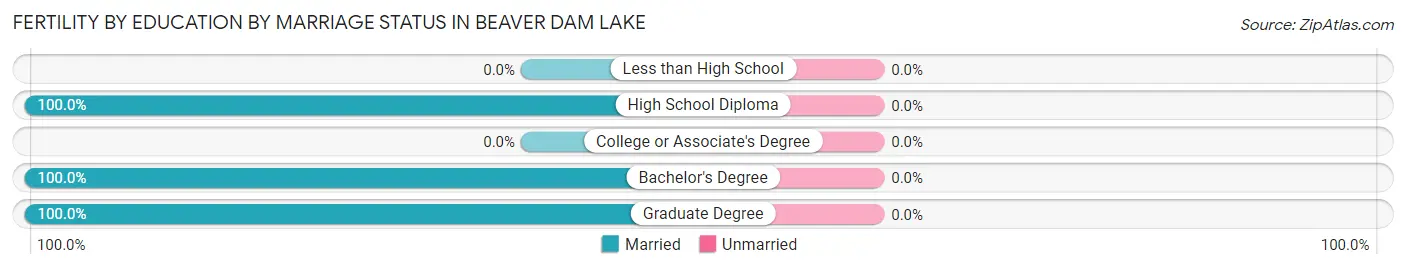
| Educational Attainment | Married | Unmarried |
| Less than High School | 0 (0.0%) | 0 (0.0%) |
| High School Diploma | 38 (100.0%) | 0 (0.0%) |
| College or Associate's Degree | 0 (0.0%) | 0 (0.0%) |
| Bachelor's Degree | 24 (100.0%) | 0 (0.0%) |
| Graduate Degree | 16 (100.0%) | 0 (0.0%) |
| Total | 78 (100.0%) | 0 (0.0%) |
Employment Characteristics in Beaver Dam Lake
Employment by Class of Employer in Beaver Dam Lake
Among the 1,519 employed individuals in Beaver Dam Lake, private company employees (1,076 | 70.8%), local government employees (145 | 9.6%), and state government employees (101 | 6.7%) make up the most common classes of employment.
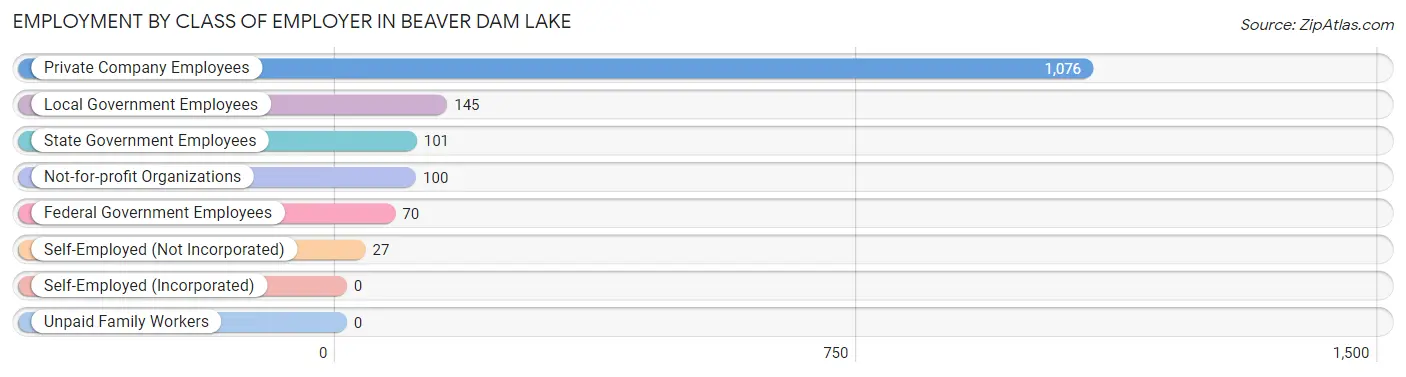
| Employer Class | # Employees | % Employees |
| Private Company Employees | 1,076 | 70.8% |
| Self-Employed (Incorporated) | 0 | 0.0% |
| Self-Employed (Not Incorporated) | 27 | 1.8% |
| Not-for-profit Organizations | 100 | 6.6% |
| Local Government Employees | 145 | 9.6% |
| State Government Employees | 101 | 6.7% |
| Federal Government Employees | 70 | 4.6% |
| Unpaid Family Workers | 0 | 0.0% |
| Total | 1,519 | 100.0% |
Employment Status by Age in Beaver Dam Lake
According to the labor force statistics for Beaver Dam Lake, out of the total population over 16 years of age (2,517), 68.0% or 1,712 individuals are in the labor force, with 6.2% or 106 of them unemployed. The age group with the highest labor force participation rate is 25 to 29 years, with 100.0% or 67 individuals in the labor force. Within the labor force, the 30 to 34 years age range has the highest percentage of unemployed individuals, with 35.2% or 82 of them being unemployed.
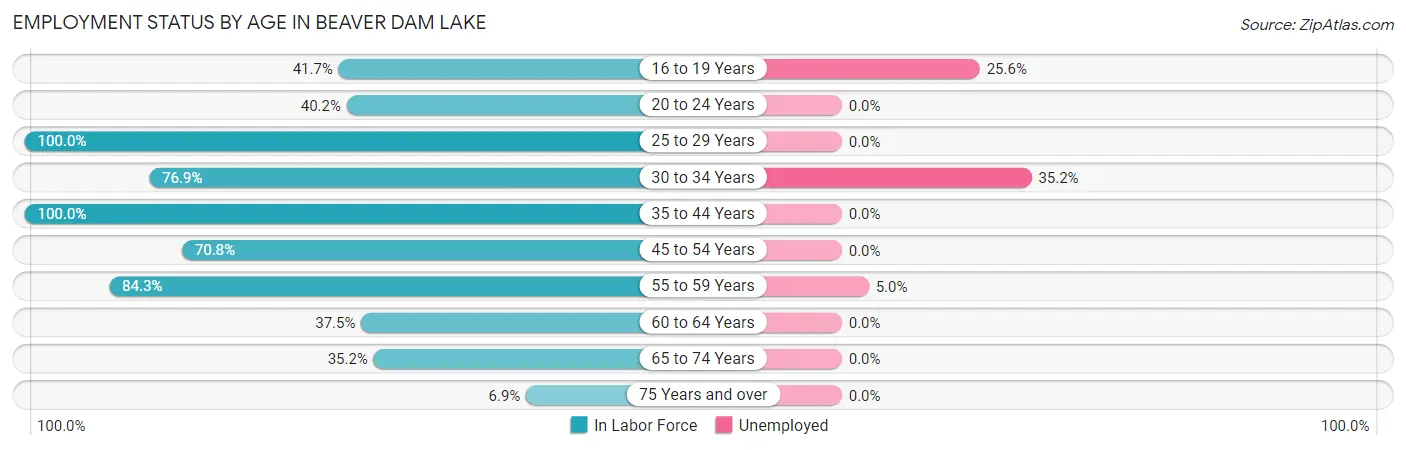
| Age Bracket | In Labor Force | Unemployed |
| 16 to 19 Years | 43 (41.7%) | 11 (25.6%) |
| 20 to 24 Years | 101 (40.2%) | 0 (0.0%) |
| 25 to 29 Years | 67 (100.0%) | 0 (0.0%) |
| 30 to 34 Years | 233 (76.9%) | 82 (35.2%) |
| 35 to 44 Years | 554 (100.0%) | 0 (0.0%) |
| 45 to 54 Years | 325 (70.8%) | 0 (0.0%) |
| 55 to 59 Years | 258 (84.3%) | 13 (5.0%) |
| 60 to 64 Years | 63 (37.5%) | 0 (0.0%) |
| 65 to 74 Years | 57 (35.2%) | 0 (0.0%) |
| 75 Years and over | 10 (6.9%) | 0 (0.0%) |
| Total | 1,712 (68.0%) | 106 (6.2%) |
Employment Status by Educational Attainment in Beaver Dam Lake
According to labor force statistics for Beaver Dam Lake, 80.8% of individuals (1,500) out of the total population between 25 and 64 years of age (1,857) are in the labor force, with 6.3% or 94 of them being unemployed. The group with the highest labor force participation rate are those with the educational attainment of high school diploma, with 87.8% or 361 individuals in the labor force. Within the labor force, individuals with high school diploma education have the highest percentage of unemployment, with 19.1% or 69 of them being unemployed.
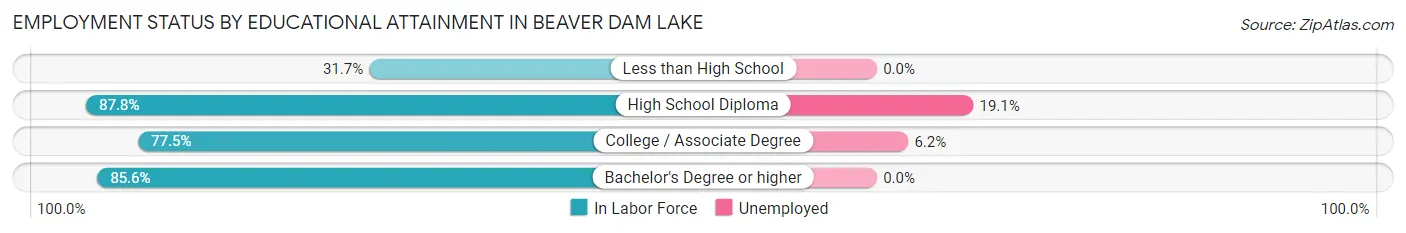
| Educational Attainment | In Labor Force | Unemployed |
| Less than High School | 32 (31.7%) | 0 (0.0%) |
| High School Diploma | 361 (87.8%) | 79 (19.1%) |
| College / Associate Degree | 420 (77.5%) | 34 (6.2%) |
| Bachelor's Degree or higher | 687 (85.6%) | 0 (0.0%) |
| Total | 1,500 (80.8%) | 117 (6.3%) |
Employment Occupations by Sex in Beaver Dam Lake
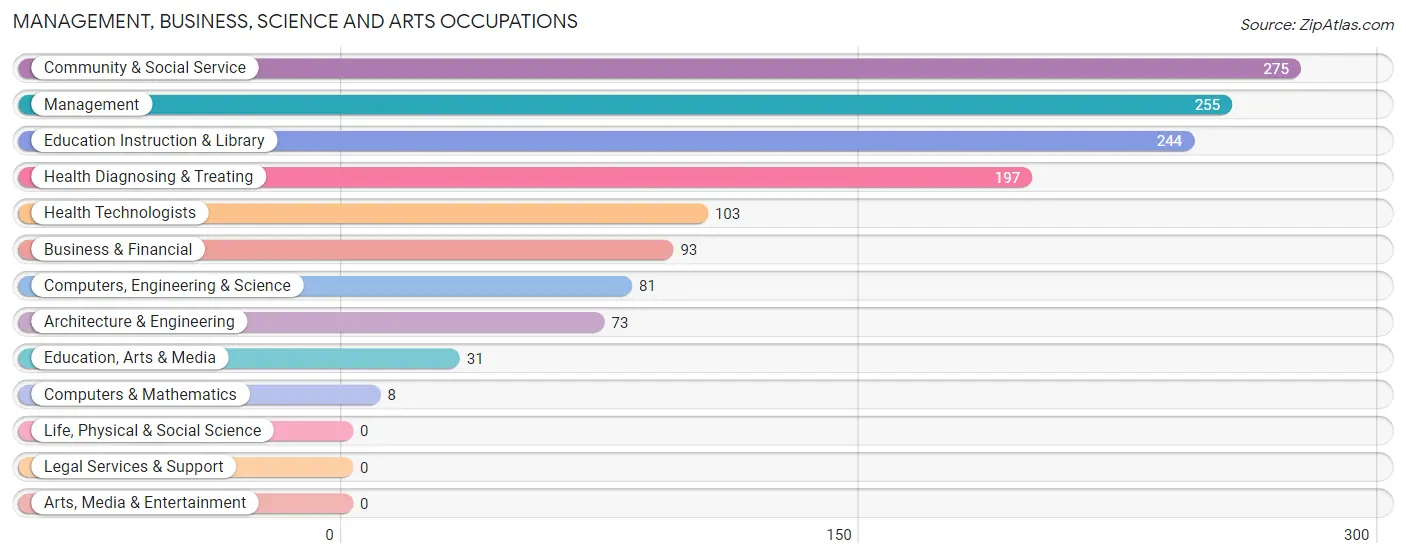
Management, Business, Science and Arts Occupations
The most common Management, Business, Science and Arts occupations in Beaver Dam Lake are Community & Social Service (275 | 17.1%), Management (255 | 15.9%), Education Instruction & Library (244 | 15.2%), Health Diagnosing & Treating (197 | 12.3%), and Health Technologists (103 | 6.4%).
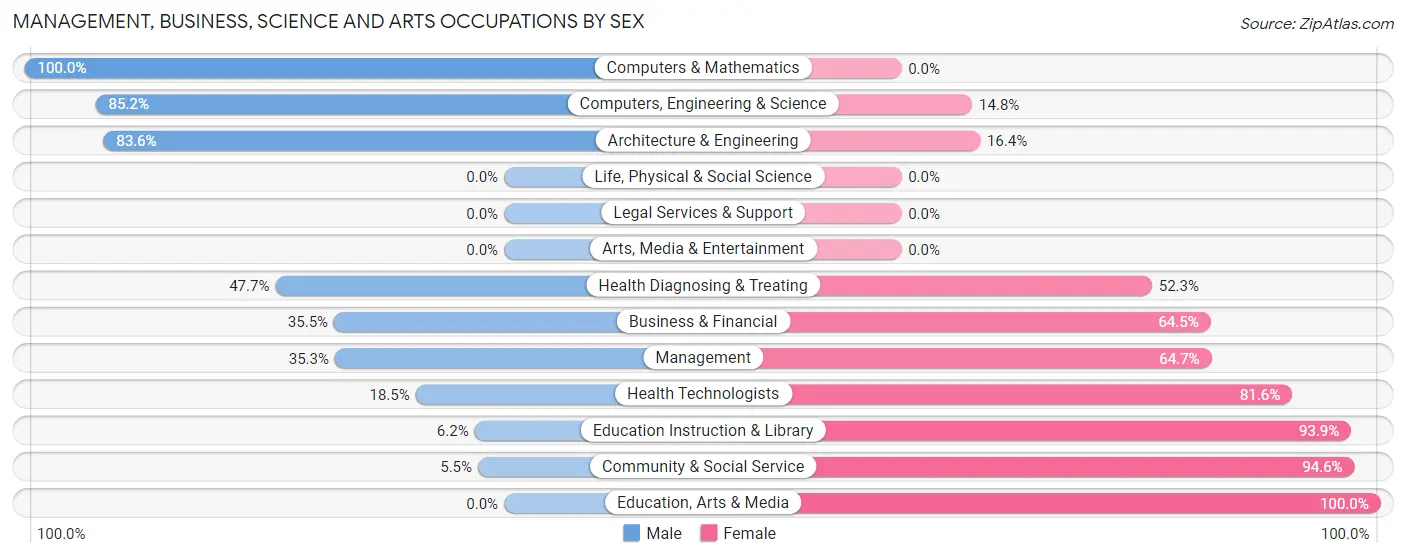
Management, Business, Science and Arts Occupations by Sex
Within the Management, Business, Science and Arts occupations in Beaver Dam Lake, the most male-oriented occupations are Computers & Mathematics (100.0%), Computers, Engineering & Science (85.2%), and Architecture & Engineering (83.6%), while the most female-oriented occupations are Education, Arts & Media (100.0%), Community & Social Service (94.6%), and Education Instruction & Library (93.9%).
| Occupation | Male | Female |
| Management | 90 (35.3%) | 165 (64.7%) |
| Business & Financial | 33 (35.5%) | 60 (64.5%) |
| Computers, Engineering & Science | 69 (85.2%) | 12 (14.8%) |
| Computers & Mathematics | 8 (100.0%) | 0 (0.0%) |
| Architecture & Engineering | 61 (83.6%) | 12 (16.4%) |
| Life, Physical & Social Science | 0 (0.0%) | 0 (0.0%) |
| Community & Social Service | 15 (5.4%) | 260 (94.6%) |
| Education, Arts & Media | 0 (0.0%) | 31 (100.0%) |
| Legal Services & Support | 0 (0.0%) | 0 (0.0%) |
| Education Instruction & Library | 15 (6.1%) | 229 (93.9%) |
| Arts, Media & Entertainment | 0 (0.0%) | 0 (0.0%) |
| Health Diagnosing & Treating | 94 (47.7%) | 103 (52.3%) |
| Health Technologists | 19 (18.4%) | 84 (81.6%) |
| Total (Category) | 301 (33.4%) | 600 (66.6%) |
| Total (Overall) | 703 (43.8%) | 902 (56.2%) |
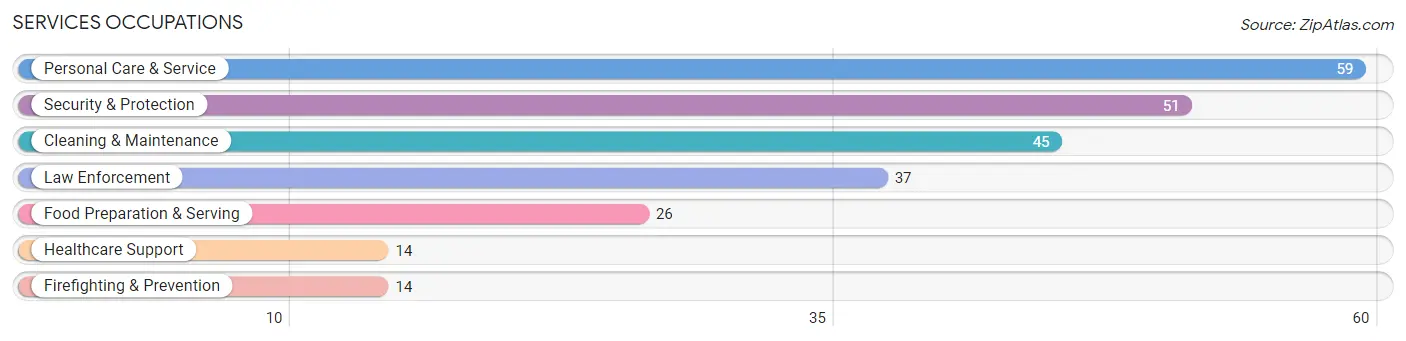
Services Occupations
The most common Services occupations in Beaver Dam Lake are Personal Care & Service (59 | 3.7%), Security & Protection (51 | 3.2%), Cleaning & Maintenance (45 | 2.8%), Law Enforcement (37 | 2.3%), and Food Preparation & Serving (26 | 1.6%).
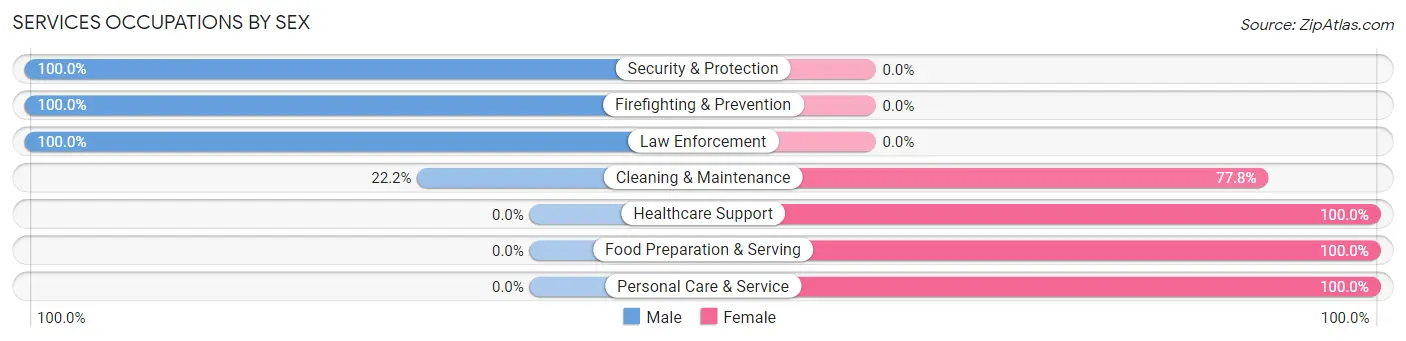
Services Occupations by Sex
Within the Services occupations in Beaver Dam Lake, the most male-oriented occupations are Security & Protection (100.0%), Firefighting & Prevention (100.0%), and Law Enforcement (100.0%), while the most female-oriented occupations are Healthcare Support (100.0%), Food Preparation & Serving (100.0%), and Personal Care & Service (100.0%).
| Occupation | Male | Female |
| Healthcare Support | 0 (0.0%) | 14 (100.0%) |
| Security & Protection | 51 (100.0%) | 0 (0.0%) |
| Firefighting & Prevention | 14 (100.0%) | 0 (0.0%) |
| Law Enforcement | 37 (100.0%) | 0 (0.0%) |
| Food Preparation & Serving | 0 (0.0%) | 26 (100.0%) |
| Cleaning & Maintenance | 10 (22.2%) | 35 (77.8%) |
| Personal Care & Service | 0 (0.0%) | 59 (100.0%) |
| Total (Category) | 61 (31.3%) | 134 (68.7%) |
| Total (Overall) | 703 (43.8%) | 902 (56.2%) |
Sales and Office Occupations
The most common Sales and Office occupations in Beaver Dam Lake are Office & Administration (166 | 10.3%), and Sales & Related (49 | 3.0%).
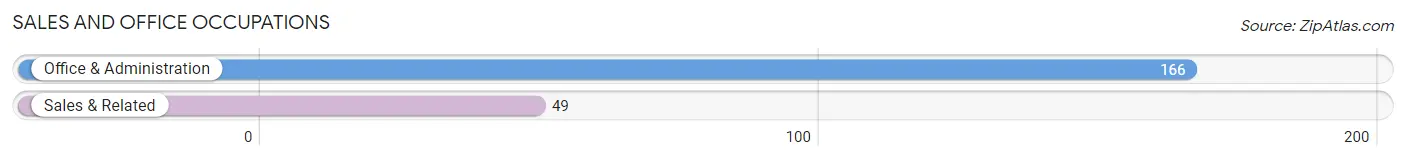
Sales and Office Occupations by Sex
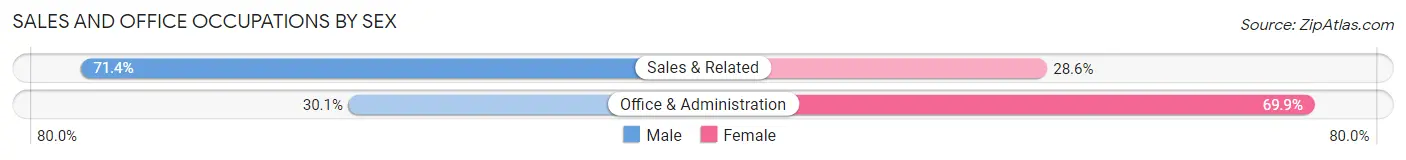
| Occupation | Male | Female |
| Sales & Related | 35 (71.4%) | 14 (28.6%) |
| Office & Administration | 50 (30.1%) | 116 (69.9%) |
| Total (Category) | 85 (39.5%) | 130 (60.5%) |
| Total (Overall) | 703 (43.8%) | 902 (56.2%) |
Natural Resources, Construction and Maintenance Occupations
The most common Natural Resources, Construction and Maintenance occupations in Beaver Dam Lake are Construction & Extraction (103 | 6.4%), and Installation, Maintenance & Repair (71 | 4.4%).
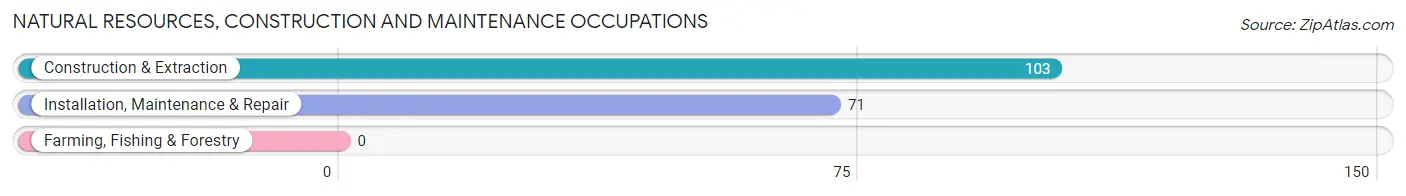
Natural Resources, Construction and Maintenance Occupations by Sex
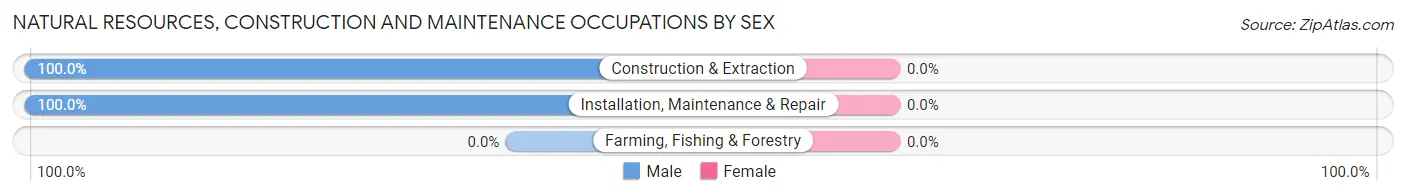
| Occupation | Male | Female |
| Farming, Fishing & Forestry | 0 (0.0%) | 0 (0.0%) |
| Construction & Extraction | 103 (100.0%) | 0 (0.0%) |
| Installation, Maintenance & Repair | 71 (100.0%) | 0 (0.0%) |
| Total (Category) | 174 (100.0%) | 0 (0.0%) |
| Total (Overall) | 703 (43.8%) | 902 (56.2%) |
Production, Transportation and Moving Occupations
The most common Production, Transportation and Moving occupations in Beaver Dam Lake are Material Moving (90 | 5.6%), and Production (30 | 1.9%).
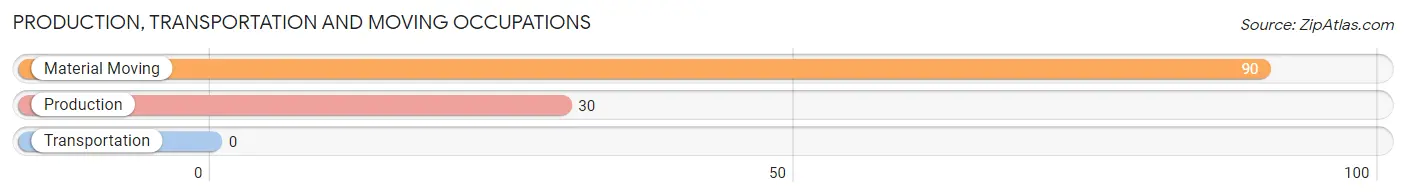
Production, Transportation and Moving Occupations by Sex
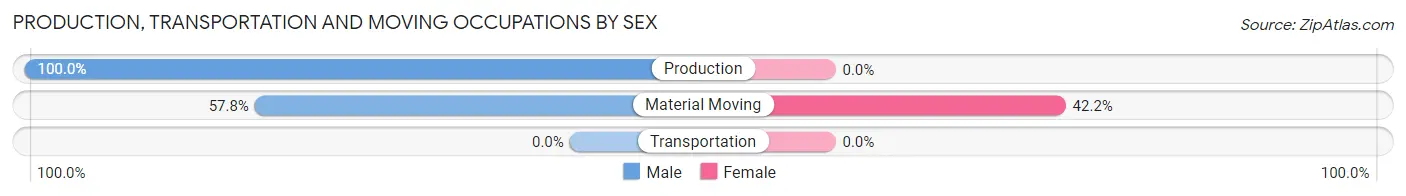
| Occupation | Male | Female |
| Production | 30 (100.0%) | 0 (0.0%) |
| Transportation | 0 (0.0%) | 0 (0.0%) |
| Material Moving | 52 (57.8%) | 38 (42.2%) |
| Total (Category) | 82 (68.3%) | 38 (31.7%) |
| Total (Overall) | 703 (43.8%) | 902 (56.2%) |
Employment Industries by Sex in Beaver Dam Lake
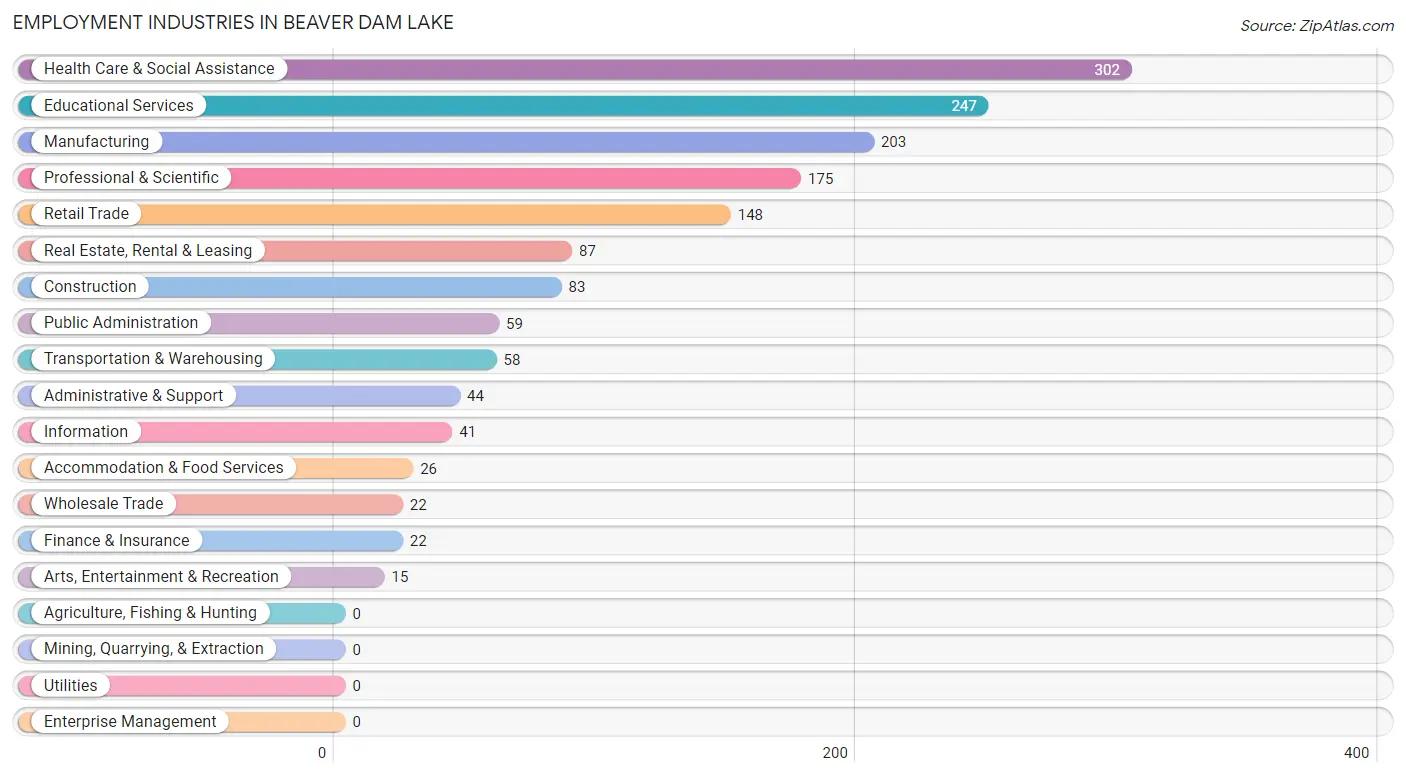
Employment Industries in Beaver Dam Lake
The major employment industries in Beaver Dam Lake include Health Care & Social Assistance (302 | 18.8%), Educational Services (247 | 15.4%), Manufacturing (203 | 12.7%), Professional & Scientific (175 | 10.9%), and Retail Trade (148 | 9.2%).
Employment Industries by Sex in Beaver Dam Lake
The Beaver Dam Lake industries that see more men than women are Wholesale Trade (100.0%), Finance & Insurance (100.0%), and Arts, Entertainment & Recreation (100.0%), whereas the industries that tend to have a higher number of women are Administrative & Support (100.0%), Accommodation & Food Services (100.0%), and Educational Services (86.6%).
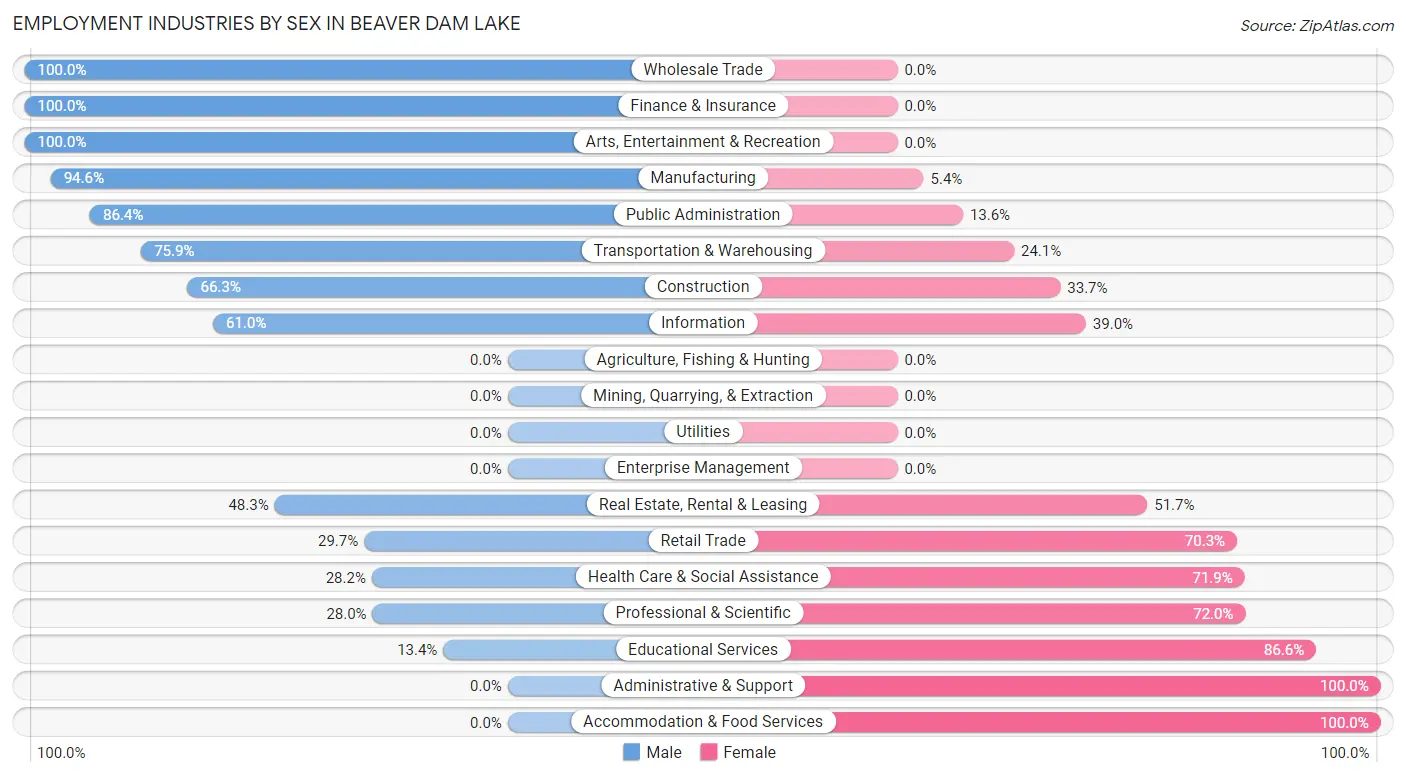
| Industry | Male | Female |
| Agriculture, Fishing & Hunting | 0 (0.0%) | 0 (0.0%) |
| Mining, Quarrying, & Extraction | 0 (0.0%) | 0 (0.0%) |
| Construction | 55 (66.3%) | 28 (33.7%) |
| Manufacturing | 192 (94.6%) | 11 (5.4%) |
| Wholesale Trade | 22 (100.0%) | 0 (0.0%) |
| Retail Trade | 44 (29.7%) | 104 (70.3%) |
| Transportation & Warehousing | 44 (75.9%) | 14 (24.1%) |
| Utilities | 0 (0.0%) | 0 (0.0%) |
| Information | 25 (61.0%) | 16 (39.0%) |
| Finance & Insurance | 22 (100.0%) | 0 (0.0%) |
| Real Estate, Rental & Leasing | 42 (48.3%) | 45 (51.7%) |
| Professional & Scientific | 49 (28.0%) | 126 (72.0%) |
| Enterprise Management | 0 (0.0%) | 0 (0.0%) |
| Administrative & Support | 0 (0.0%) | 44 (100.0%) |
| Educational Services | 33 (13.4%) | 214 (86.6%) |
| Health Care & Social Assistance | 85 (28.1%) | 217 (71.9%) |
| Arts, Entertainment & Recreation | 15 (100.0%) | 0 (0.0%) |
| Accommodation & Food Services | 0 (0.0%) | 26 (100.0%) |
| Public Administration | 51 (86.4%) | 8 (13.6%) |
| Total | 703 (43.8%) | 902 (56.2%) |
Education in Beaver Dam Lake
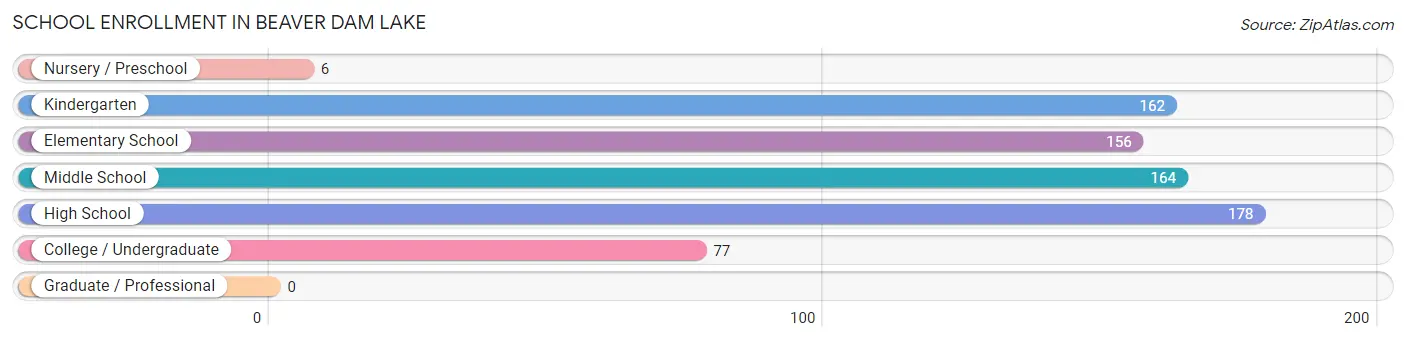
School Enrollment in Beaver Dam Lake
The most common levels of schooling among the 743 students in Beaver Dam Lake are high school (178 | 24.0%), middle school (164 | 22.1%), and kindergarten (162 | 21.8%).
| School Level | # Students | % Students |
| Nursery / Preschool | 6 | 0.8% |
| Kindergarten | 162 | 21.8% |
| Elementary School | 156 | 21.0% |
| Middle School | 164 | 22.1% |
| High School | 178 | 24.0% |
| College / Undergraduate | 77 | 10.4% |
| Graduate / Professional | 0 | 0.0% |
| Total | 743 | 100.0% |
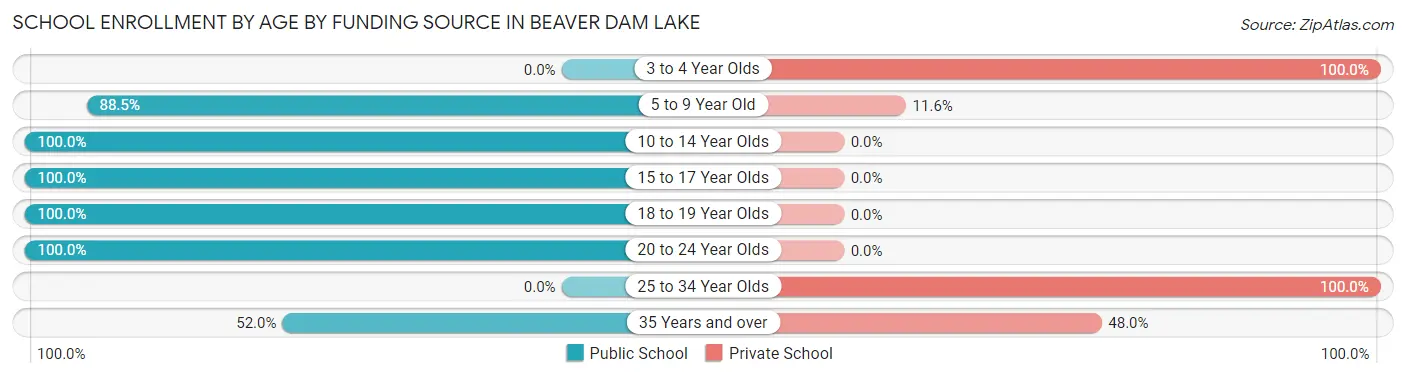
School Enrollment by Age by Funding Source in Beaver Dam Lake
Out of a total of 743 students who are enrolled in schools in Beaver Dam Lake, 61 (8.2%) attend a private institution, while the remaining 682 (91.8%) are enrolled in public schools. The age group of 3 to 4 year olds has the highest likelihood of being enrolled in private schools, with 6 (100.0% in the age bracket) enrolled. Conversely, the age group of 10 to 14 year olds has the lowest likelihood of being enrolled in a private school, with 187 (100.0% in the age bracket) attending a public institution.
| Age Bracket | Public School | Private School |
| 3 to 4 Year Olds | 0 (0.0%) | 6 (100.0%) |
| 5 to 9 Year Old | 268 (88.4%) | 35 (11.6%) |
| 10 to 14 Year Olds | 187 (100.0%) | 0 (0.0%) |
| 15 to 17 Year Olds | 157 (100.0%) | 0 (0.0%) |
| 18 to 19 Year Olds | 31 (100.0%) | 0 (0.0%) |
| 20 to 24 Year Olds | 26 (100.0%) | 0 (0.0%) |
| 25 to 34 Year Olds | 0 (0.0%) | 8 (100.0%) |
| 35 Years and over | 13 (52.0%) | 12 (48.0%) |
| Total | 682 (91.8%) | 61 (8.2%) |
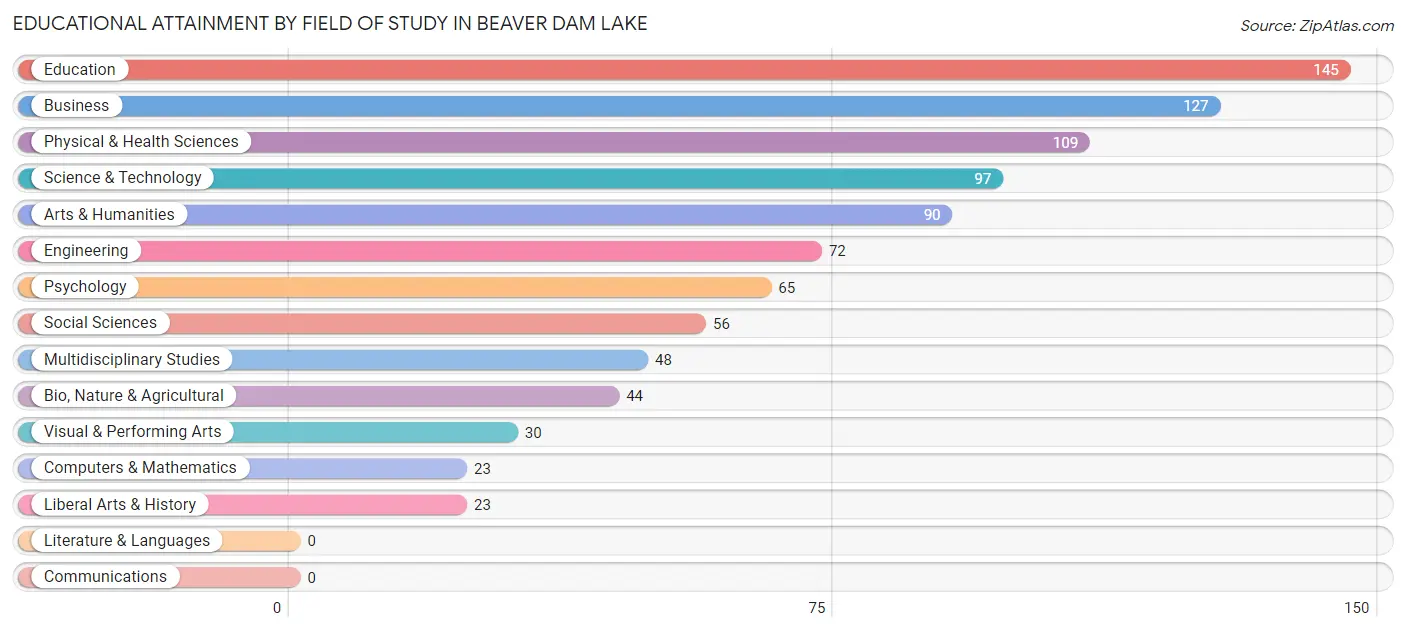
Educational Attainment by Field of Study in Beaver Dam Lake
Education (145 | 15.6%), business (127 | 13.7%), physical & health sciences (109 | 11.7%), science & technology (97 | 10.4%), and arts & humanities (90 | 9.7%) are the most common fields of study among 929 individuals in Beaver Dam Lake who have obtained a bachelor's degree or higher.
| Field of Study | # Graduates | % Graduates |
| Computers & Mathematics | 23 | 2.5% |
| Bio, Nature & Agricultural | 44 | 4.7% |
| Physical & Health Sciences | 109 | 11.7% |
| Psychology | 65 | 7.0% |
| Social Sciences | 56 | 6.0% |
| Engineering | 72 | 7.7% |
| Multidisciplinary Studies | 48 | 5.2% |
| Science & Technology | 97 | 10.4% |
| Business | 127 | 13.7% |
| Education | 145 | 15.6% |
| Literature & Languages | 0 | 0.0% |
| Liberal Arts & History | 23 | 2.5% |
| Visual & Performing Arts | 30 | 3.2% |
| Communications | 0 | 0.0% |
| Arts & Humanities | 90 | 9.7% |
| Total | 929 | 100.0% |
Transportation & Commute in Beaver Dam Lake
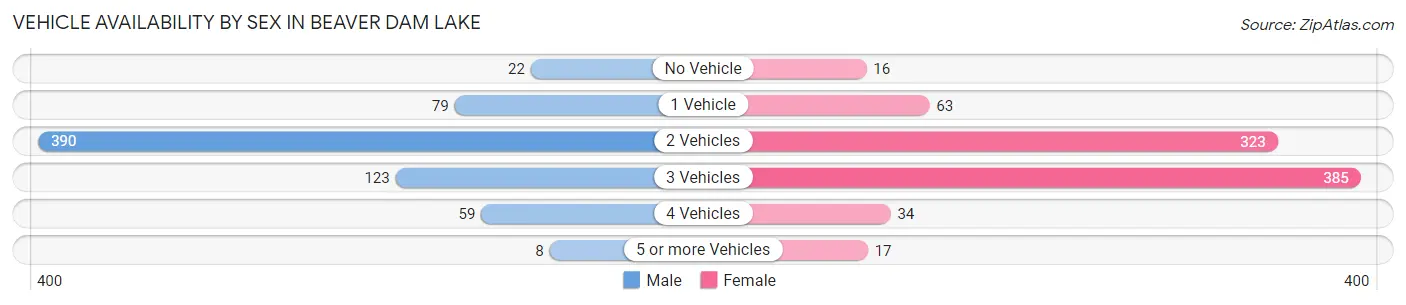
Vehicle Availability by Sex in Beaver Dam Lake
The most prevalent vehicle ownership categories in Beaver Dam Lake are males with 2 vehicles (390, accounting for 57.3%) and females with 2 vehicles (323, making up 46.5%).
| Vehicles Available | Male | Female |
| No Vehicle | 22 (3.2%) | 16 (1.9%) |
| 1 Vehicle | 79 (11.6%) | 63 (7.5%) |
| 2 Vehicles | 390 (57.3%) | 323 (38.5%) |
| 3 Vehicles | 123 (18.1%) | 385 (45.9%) |
| 4 Vehicles | 59 (8.7%) | 34 (4.1%) |
| 5 or more Vehicles | 8 (1.2%) | 17 (2.0%) |
| Total | 681 (100.0%) | 838 (100.0%) |
Commute Time in Beaver Dam Lake
The most frequently occuring commute durations in Beaver Dam Lake are 10 to 14 minutes (322 commuters, 23.1%), 40 to 44 minutes (219 commuters, 15.7%), and 45 to 59 minutes (184 commuters, 13.2%).
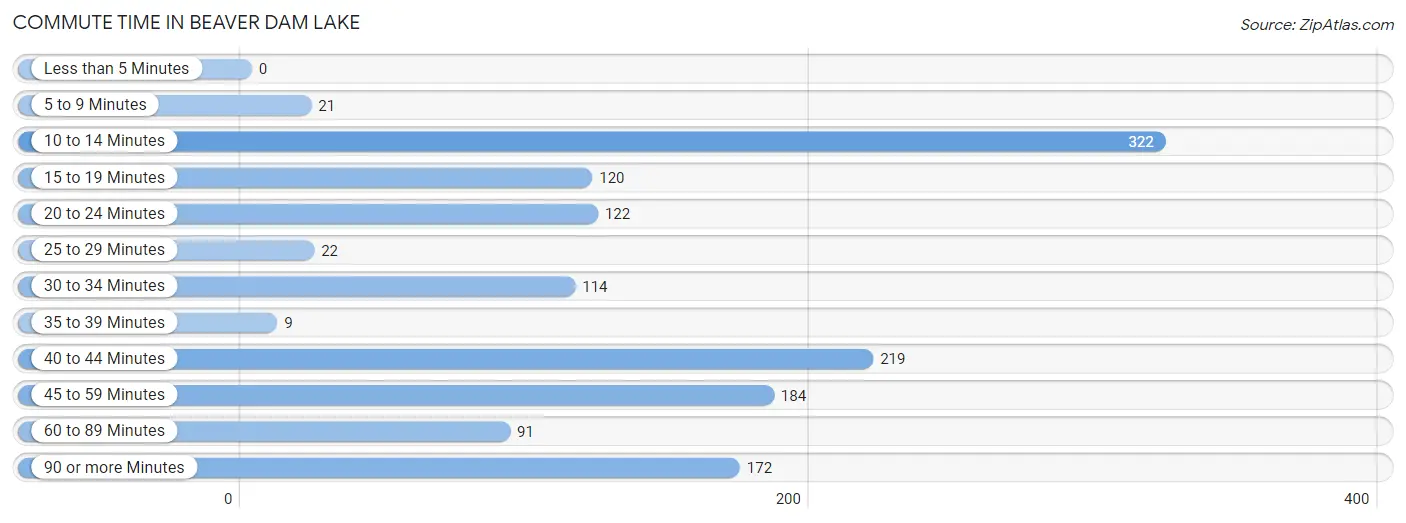
| Commute Time | # Commuters | % Commuters |
| Less than 5 Minutes | 0 | 0.0% |
| 5 to 9 Minutes | 21 | 1.5% |
| 10 to 14 Minutes | 322 | 23.1% |
| 15 to 19 Minutes | 120 | 8.6% |
| 20 to 24 Minutes | 122 | 8.7% |
| 25 to 29 Minutes | 22 | 1.6% |
| 30 to 34 Minutes | 114 | 8.2% |
| 35 to 39 Minutes | 9 | 0.6% |
| 40 to 44 Minutes | 219 | 15.7% |
| 45 to 59 Minutes | 184 | 13.2% |
| 60 to 89 Minutes | 91 | 6.5% |
| 90 or more Minutes | 172 | 12.3% |
Commute Time by Sex in Beaver Dam Lake
The most common commute times in Beaver Dam Lake are 10 to 14 minutes (165 commuters, 25.4%) for males and 10 to 14 minutes (157 commuters, 21.1%) for females.
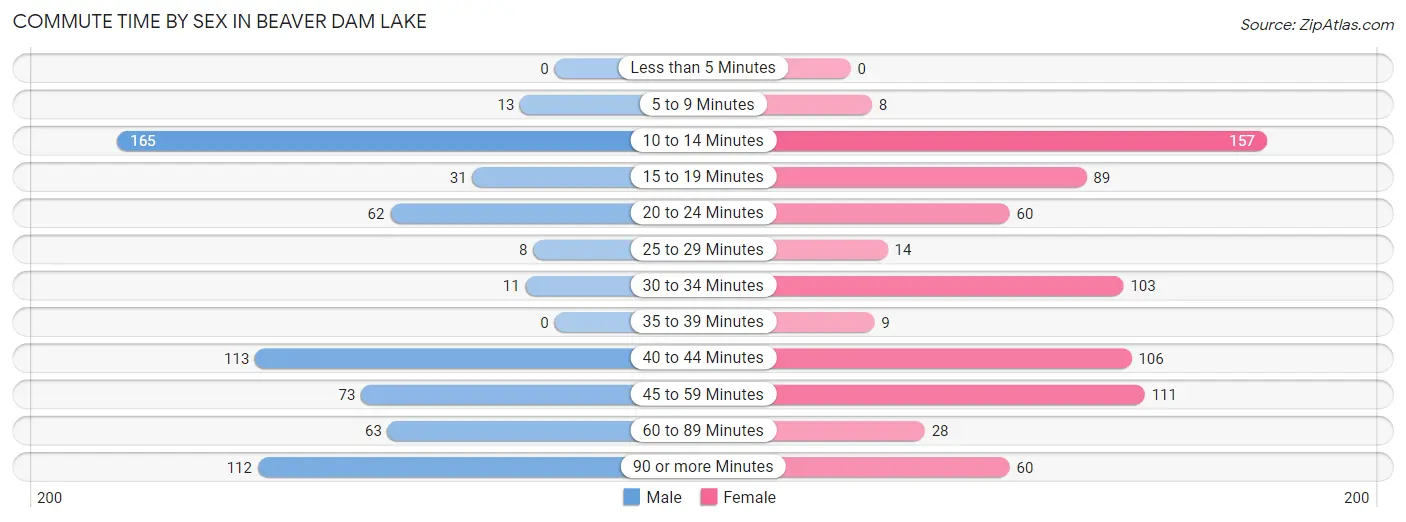
| Commute Time | Male | Female |
| Less than 5 Minutes | 0 (0.0%) | 0 (0.0%) |
| 5 to 9 Minutes | 13 (2.0%) | 8 (1.1%) |
| 10 to 14 Minutes | 165 (25.4%) | 157 (21.1%) |
| 15 to 19 Minutes | 31 (4.8%) | 89 (11.9%) |
| 20 to 24 Minutes | 62 (9.5%) | 60 (8.1%) |
| 25 to 29 Minutes | 8 (1.2%) | 14 (1.9%) |
| 30 to 34 Minutes | 11 (1.7%) | 103 (13.8%) |
| 35 to 39 Minutes | 0 (0.0%) | 9 (1.2%) |
| 40 to 44 Minutes | 113 (17.4%) | 106 (14.2%) |
| 45 to 59 Minutes | 73 (11.2%) | 111 (14.9%) |
| 60 to 89 Minutes | 63 (9.7%) | 28 (3.8%) |
| 90 or more Minutes | 112 (17.2%) | 60 (8.1%) |
Time of Departure to Work by Sex in Beaver Dam Lake
The most frequent times of departure to work in Beaver Dam Lake are 8:00 AM to 8:29 AM (188, 28.9%) for males and 8:00 AM to 8:29 AM (138, 18.5%) for females.
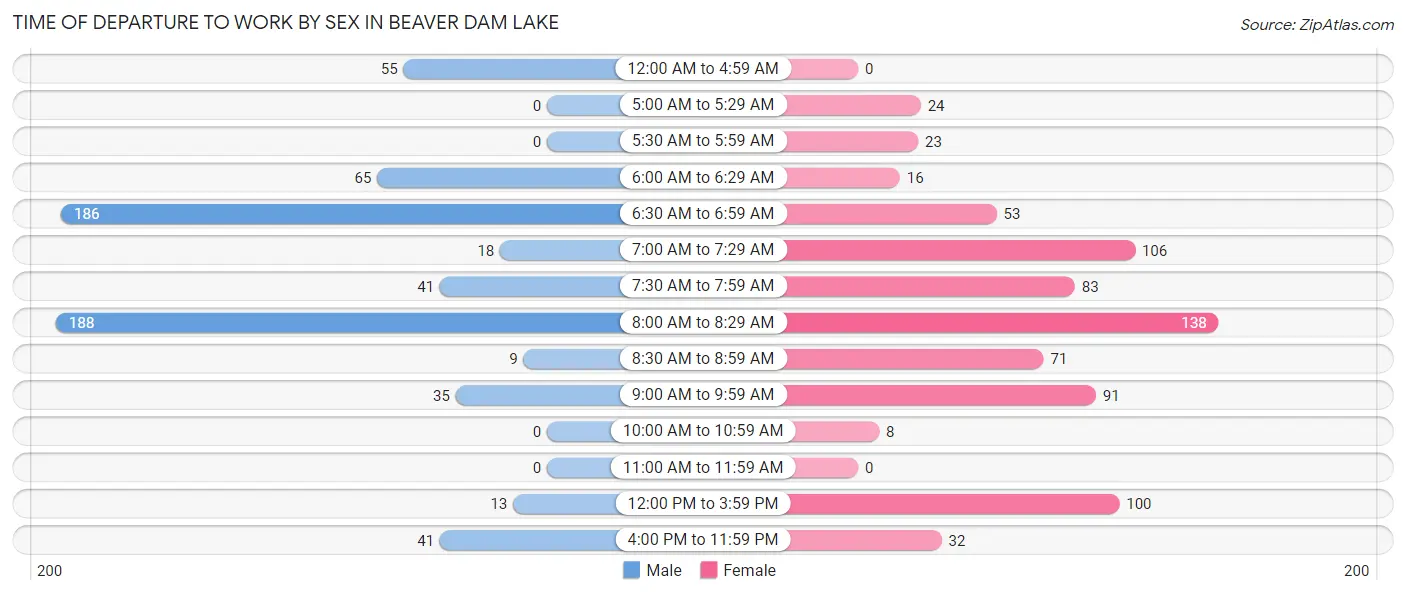
| Time of Departure | Male | Female |
| 12:00 AM to 4:59 AM | 55 (8.5%) | 0 (0.0%) |
| 5:00 AM to 5:29 AM | 0 (0.0%) | 24 (3.2%) |
| 5:30 AM to 5:59 AM | 0 (0.0%) | 23 (3.1%) |
| 6:00 AM to 6:29 AM | 65 (10.0%) | 16 (2.1%) |
| 6:30 AM to 6:59 AM | 186 (28.6%) | 53 (7.1%) |
| 7:00 AM to 7:29 AM | 18 (2.8%) | 106 (14.2%) |
| 7:30 AM to 7:59 AM | 41 (6.3%) | 83 (11.1%) |
| 8:00 AM to 8:29 AM | 188 (28.9%) | 138 (18.5%) |
| 8:30 AM to 8:59 AM | 9 (1.4%) | 71 (9.5%) |
| 9:00 AM to 9:59 AM | 35 (5.4%) | 91 (12.2%) |
| 10:00 AM to 10:59 AM | 0 (0.0%) | 8 (1.1%) |
| 11:00 AM to 11:59 AM | 0 (0.0%) | 0 (0.0%) |
| 12:00 PM to 3:59 PM | 13 (2.0%) | 100 (13.4%) |
| 4:00 PM to 11:59 PM | 41 (6.3%) | 32 (4.3%) |
| Total | 651 (100.0%) | 745 (100.0%) |
Housing Occupancy in Beaver Dam Lake
Occupancy by Ownership in Beaver Dam Lake
Of the total 1,027 dwellings in Beaver Dam Lake, owner-occupied units account for 911 (88.7%), while renter-occupied units make up 116 (11.3%).
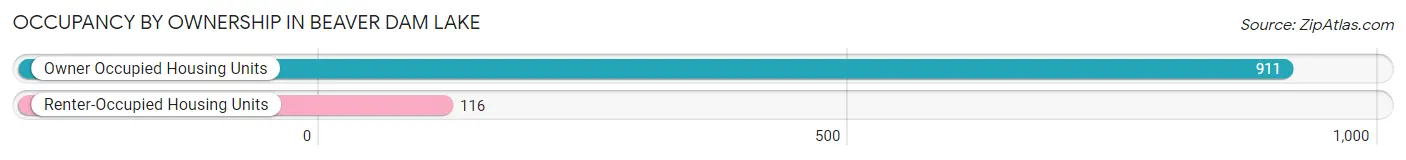
| Occupancy | # Housing Units | % Housing Units |
| Owner Occupied Housing Units | 911 | 88.7% |
| Renter-Occupied Housing Units | 116 | 11.3% |
| Total Occupied Housing Units | 1,027 | 100.0% |
Occupancy by Household Size in Beaver Dam Lake
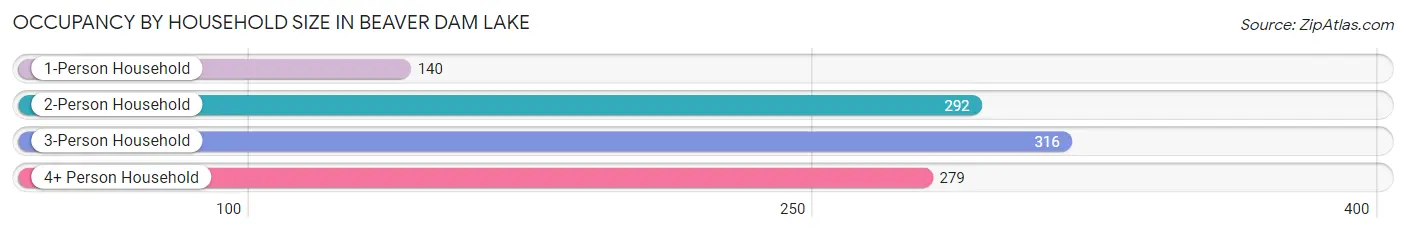
| Household Size | # Housing Units | % Housing Units |
| 1-Person Household | 140 | 13.6% |
| 2-Person Household | 292 | 28.4% |
| 3-Person Household | 316 | 30.8% |
| 4+ Person Household | 279 | 27.2% |
| Total Housing Units | 1,027 | 100.0% |
Occupancy by Ownership by Household Size in Beaver Dam Lake
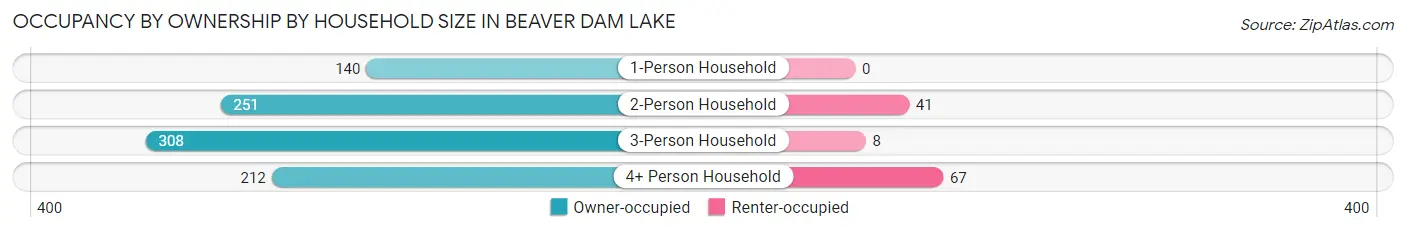
| Household Size | Owner-occupied | Renter-occupied |
| 1-Person Household | 140 (100.0%) | 0 (0.0%) |
| 2-Person Household | 251 (86.0%) | 41 (14.0%) |
| 3-Person Household | 308 (97.5%) | 8 (2.5%) |
| 4+ Person Household | 212 (76.0%) | 67 (24.0%) |
| Total Housing Units | 911 (88.7%) | 116 (11.3%) |
Occupancy by Educational Attainment in Beaver Dam Lake
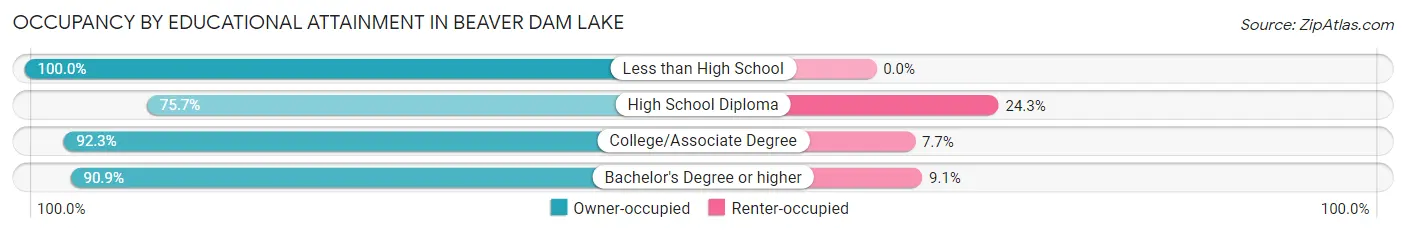
| Household Size | Owner-occupied | Renter-occupied |
| Less than High School | 55 (100.0%) | 0 (0.0%) |
| High School Diploma | 153 (75.7%) | 49 (24.3%) |
| College/Associate Degree | 204 (92.3%) | 17 (7.7%) |
| Bachelor's Degree or higher | 499 (90.9%) | 50 (9.1%) |
Occupancy by Age of Householder in Beaver Dam Lake
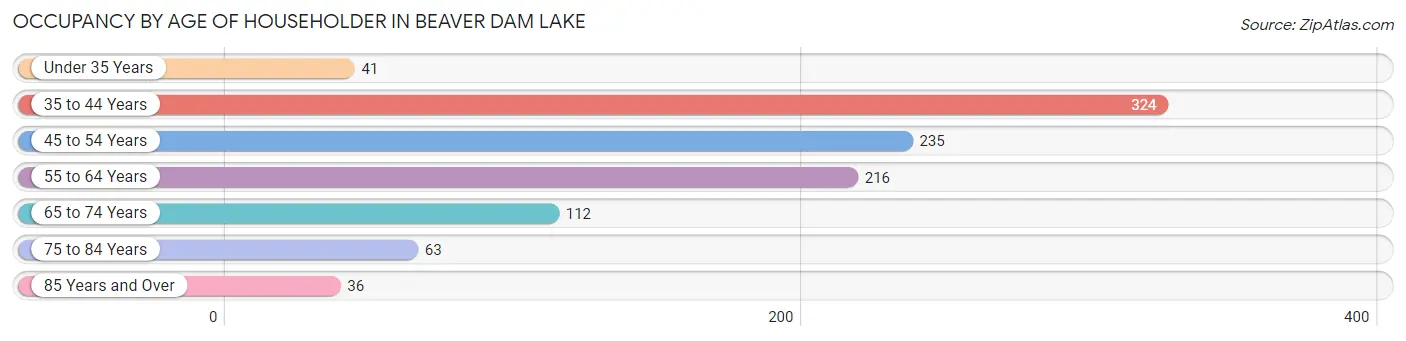
| Age Bracket | # Households | % Households |
| Under 35 Years | 41 | 4.0% |
| 35 to 44 Years | 324 | 31.6% |
| 45 to 54 Years | 235 | 22.9% |
| 55 to 64 Years | 216 | 21.0% |
| 65 to 74 Years | 112 | 10.9% |
| 75 to 84 Years | 63 | 6.1% |
| 85 Years and Over | 36 | 3.5% |
| Total | 1,027 | 100.0% |
Housing Finances in Beaver Dam Lake
Median Income by Occupancy in Beaver Dam Lake
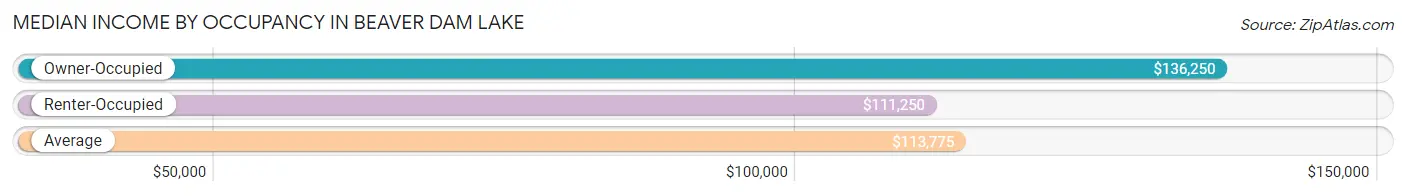
| Occupancy Type | # Households | Median Income |
| Owner-Occupied | 911 (88.7%) | $136,250 |
| Renter-Occupied | 116 (11.3%) | $111,250 |
| Average | 1,027 (100.0%) | $113,775 |
Occupancy by Householder Income Bracket in Beaver Dam Lake
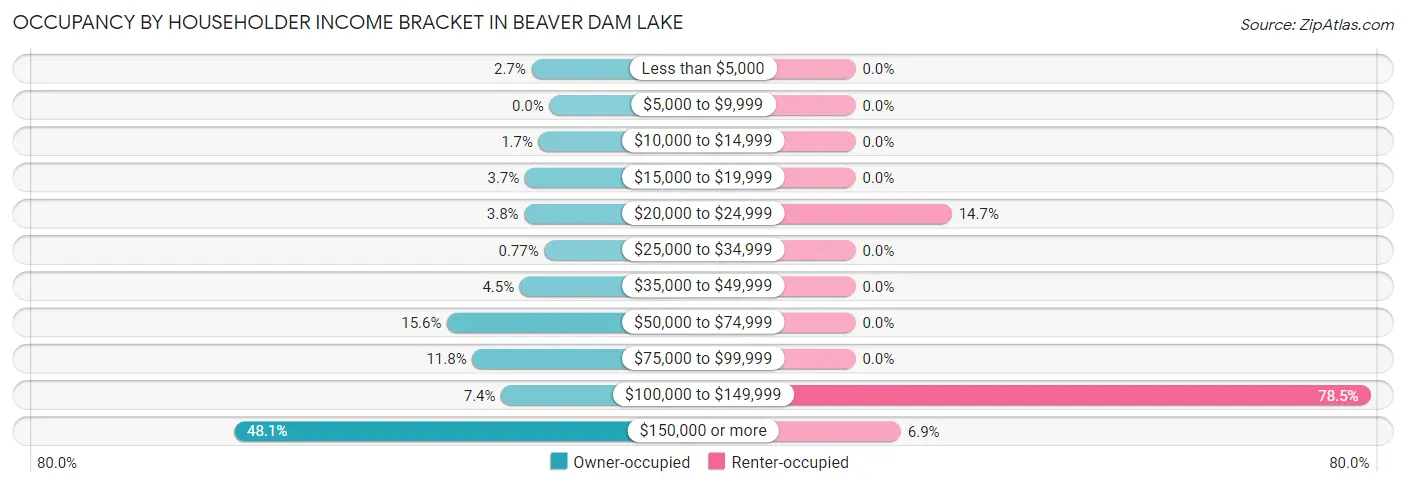
| Income Bracket | Owner-occupied | Renter-occupied |
| Less than $5,000 | 25 (2.7%) | 0 (0.0%) |
| $5,000 to $9,999 | 0 (0.0%) | 0 (0.0%) |
| $10,000 to $14,999 | 15 (1.7%) | 0 (0.0%) |
| $15,000 to $19,999 | 34 (3.7%) | 0 (0.0%) |
| $20,000 to $24,999 | 35 (3.8%) | 17 (14.7%) |
| $25,000 to $34,999 | 7 (0.8%) | 0 (0.0%) |
| $35,000 to $49,999 | 41 (4.5%) | 0 (0.0%) |
| $50,000 to $74,999 | 142 (15.6%) | 0 (0.0%) |
| $75,000 to $99,999 | 107 (11.7%) | 0 (0.0%) |
| $100,000 to $149,999 | 67 (7.3%) | 91 (78.4%) |
| $150,000 or more | 438 (48.1%) | 8 (6.9%) |
| Total | 911 (100.0%) | 116 (100.0%) |
Monthly Housing Cost Tiers in Beaver Dam Lake
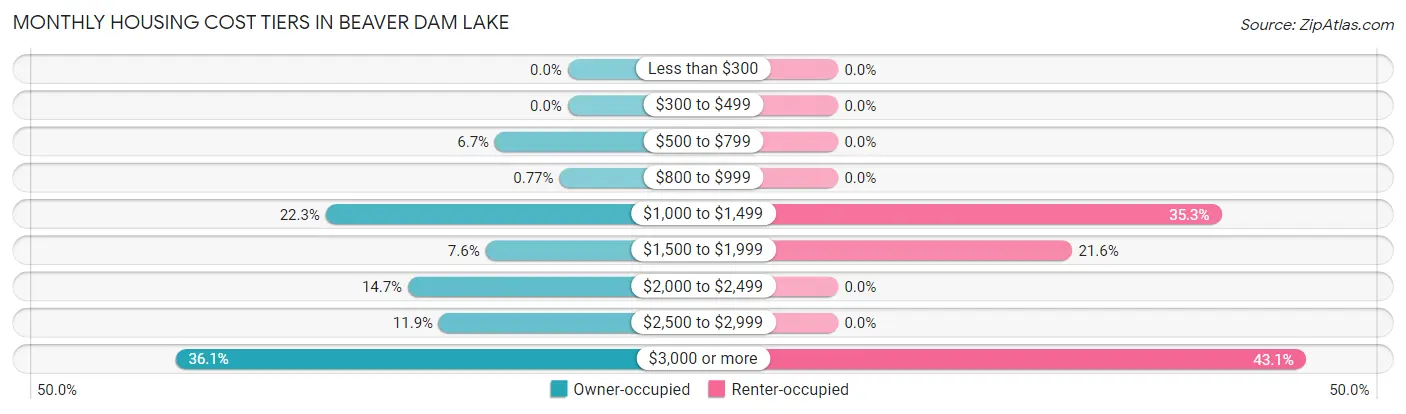
| Monthly Cost | Owner-occupied | Renter-occupied |
| Less than $300 | 0 (0.0%) | 0 (0.0%) |
| $300 to $499 | 0 (0.0%) | 0 (0.0%) |
| $500 to $799 | 61 (6.7%) | 0 (0.0%) |
| $800 to $999 | 7 (0.8%) | 0 (0.0%) |
| $1,000 to $1,499 | 203 (22.3%) | 41 (35.3%) |
| $1,500 to $1,999 | 69 (7.6%) | 25 (21.5%) |
| $2,000 to $2,499 | 134 (14.7%) | 0 (0.0%) |
| $2,500 to $2,999 | 108 (11.9%) | 0 (0.0%) |
| $3,000 or more | 329 (36.1%) | 50 (43.1%) |
| Total | 911 (100.0%) | 116 (100.0%) |
Physical Housing Characteristics in Beaver Dam Lake
Housing Structures in Beaver Dam Lake
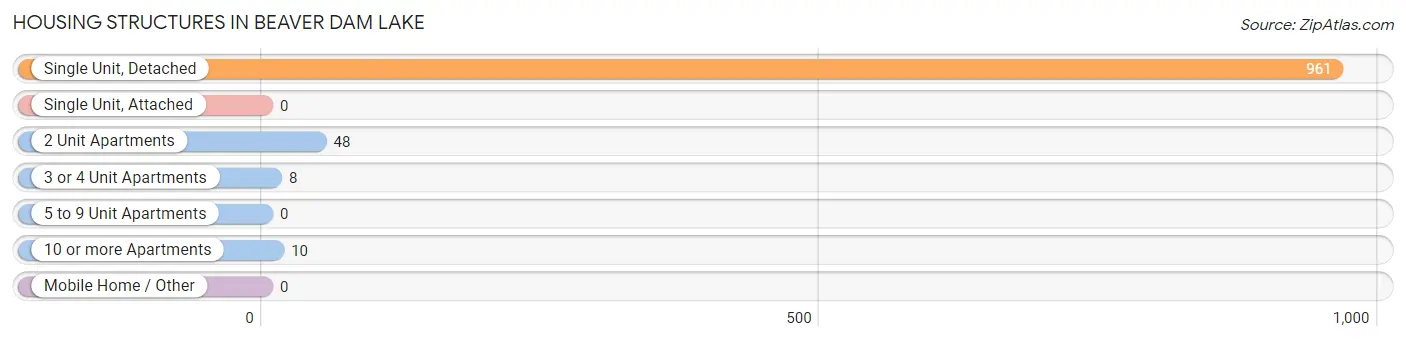
| Structure Type | # Housing Units | % Housing Units |
| Single Unit, Detached | 961 | 93.6% |
| Single Unit, Attached | 0 | 0.0% |
| 2 Unit Apartments | 48 | 4.7% |
| 3 or 4 Unit Apartments | 8 | 0.8% |
| 5 to 9 Unit Apartments | 0 | 0.0% |
| 10 or more Apartments | 10 | 1.0% |
| Mobile Home / Other | 0 | 0.0% |
| Total | 1,027 | 100.0% |
Housing Structures by Occupancy in Beaver Dam Lake
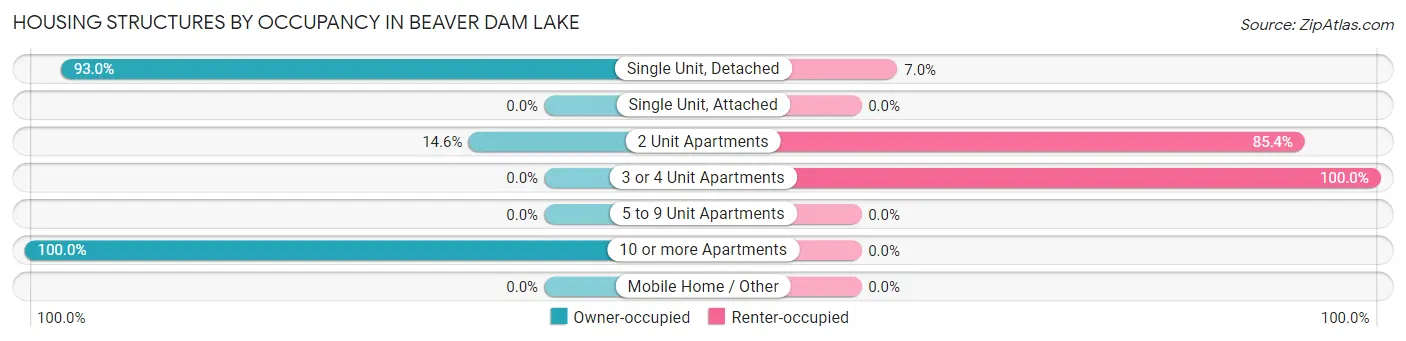
| Structure Type | Owner-occupied | Renter-occupied |
| Single Unit, Detached | 894 (93.0%) | 67 (7.0%) |
| Single Unit, Attached | 0 (0.0%) | 0 (0.0%) |
| 2 Unit Apartments | 7 (14.6%) | 41 (85.4%) |
| 3 or 4 Unit Apartments | 0 (0.0%) | 8 (100.0%) |
| 5 to 9 Unit Apartments | 0 (0.0%) | 0 (0.0%) |
| 10 or more Apartments | 10 (100.0%) | 0 (0.0%) |
| Mobile Home / Other | 0 (0.0%) | 0 (0.0%) |
| Total | 911 (88.7%) | 116 (11.3%) |
Housing Structures by Number of Rooms in Beaver Dam Lake
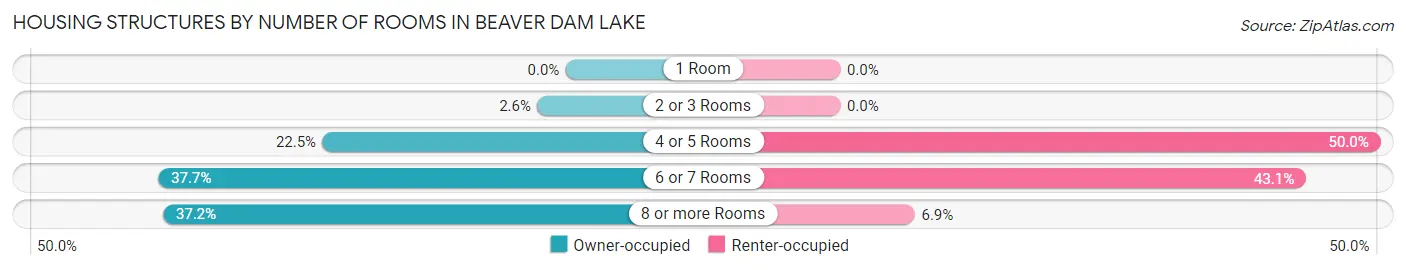
| Number of Rooms | Owner-occupied | Renter-occupied |
| 1 Room | 0 (0.0%) | 0 (0.0%) |
| 2 or 3 Rooms | 24 (2.6%) | 0 (0.0%) |
| 4 or 5 Rooms | 205 (22.5%) | 58 (50.0%) |
| 6 or 7 Rooms | 343 (37.7%) | 50 (43.1%) |
| 8 or more Rooms | 339 (37.2%) | 8 (6.9%) |
| Total | 911 (100.0%) | 116 (100.0%) |
Housing Structure by Heating Type in Beaver Dam Lake
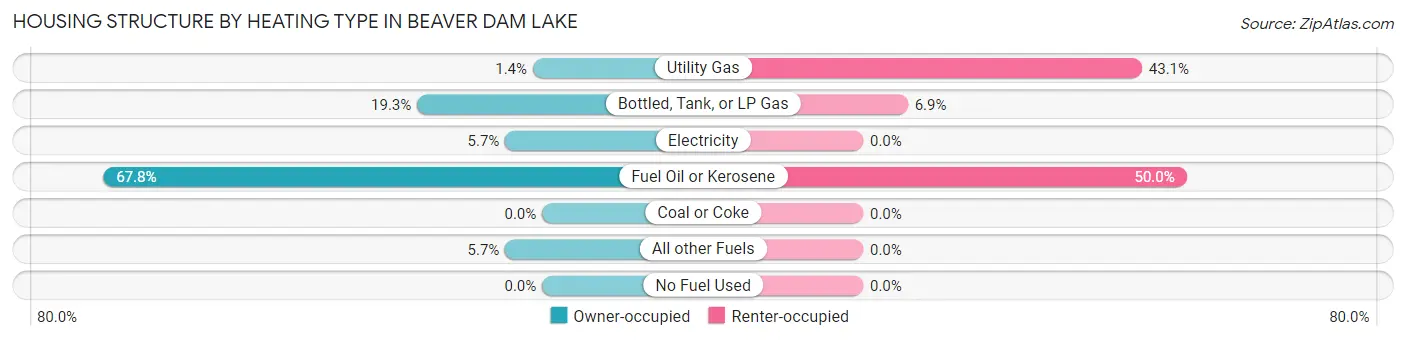
| Heating Type | Owner-occupied | Renter-occupied |
| Utility Gas | 13 (1.4%) | 50 (43.1%) |
| Bottled, Tank, or LP Gas | 176 (19.3%) | 8 (6.9%) |
| Electricity | 52 (5.7%) | 0 (0.0%) |
| Fuel Oil or Kerosene | 618 (67.8%) | 58 (50.0%) |
| Coal or Coke | 0 (0.0%) | 0 (0.0%) |
| All other Fuels | 52 (5.7%) | 0 (0.0%) |
| No Fuel Used | 0 (0.0%) | 0 (0.0%) |
| Total | 911 (100.0%) | 116 (100.0%) |
Household Vehicle Usage in Beaver Dam Lake
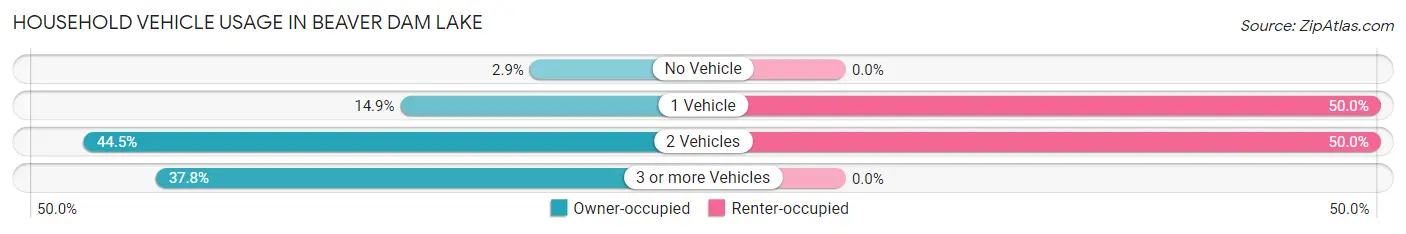
| Vehicles per Household | Owner-occupied | Renter-occupied |
| No Vehicle | 26 (2.9%) | 0 (0.0%) |
| 1 Vehicle | 136 (14.9%) | 58 (50.0%) |
| 2 Vehicles | 405 (44.5%) | 58 (50.0%) |
| 3 or more Vehicles | 344 (37.8%) | 0 (0.0%) |
| Total | 911 (100.0%) | 116 (100.0%) |
Real Estate & Mortgages in Beaver Dam Lake
Real Estate and Mortgage Overview in Beaver Dam Lake
| Characteristic | Without Mortgage | With Mortgage |
| Housing Units | 310 | 601 |
| Median Property Value | $336,200 | $407,700 |
| Median Household Income | $87,778 | $352 |
| Monthly Housing Costs | $1,231 | $329 |
| Real Estate Taxes | $8,281 | $0 |
Property Value by Mortgage Status in Beaver Dam Lake
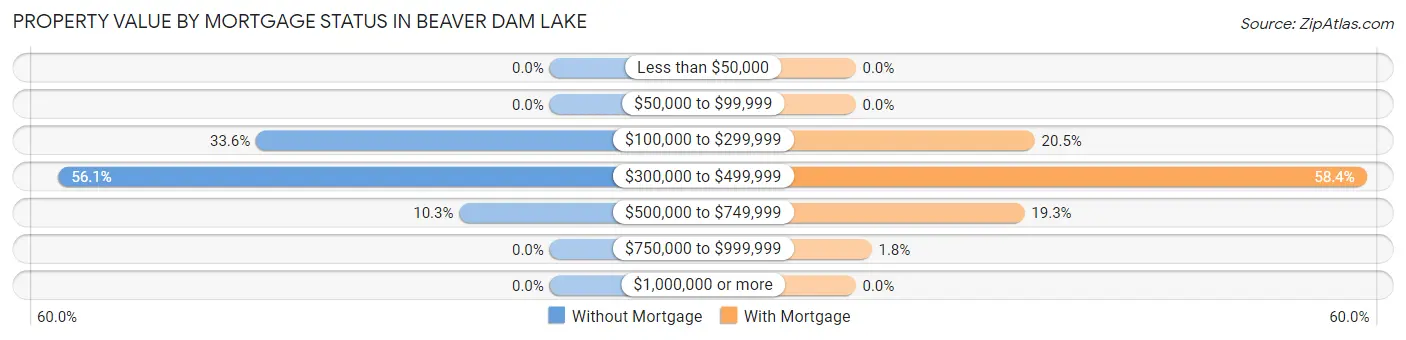
| Property Value | Without Mortgage | With Mortgage |
| Less than $50,000 | 0 (0.0%) | 0 (0.0%) |
| $50,000 to $99,999 | 0 (0.0%) | 0 (0.0%) |
| $100,000 to $299,999 | 104 (33.6%) | 123 (20.5%) |
| $300,000 to $499,999 | 174 (56.1%) | 351 (58.4%) |
| $500,000 to $749,999 | 32 (10.3%) | 116 (19.3%) |
| $750,000 to $999,999 | 0 (0.0%) | 11 (1.8%) |
| $1,000,000 or more | 0 (0.0%) | 0 (0.0%) |
| Total | 310 (100.0%) | 601 (100.0%) |
Household Income by Mortgage Status in Beaver Dam Lake
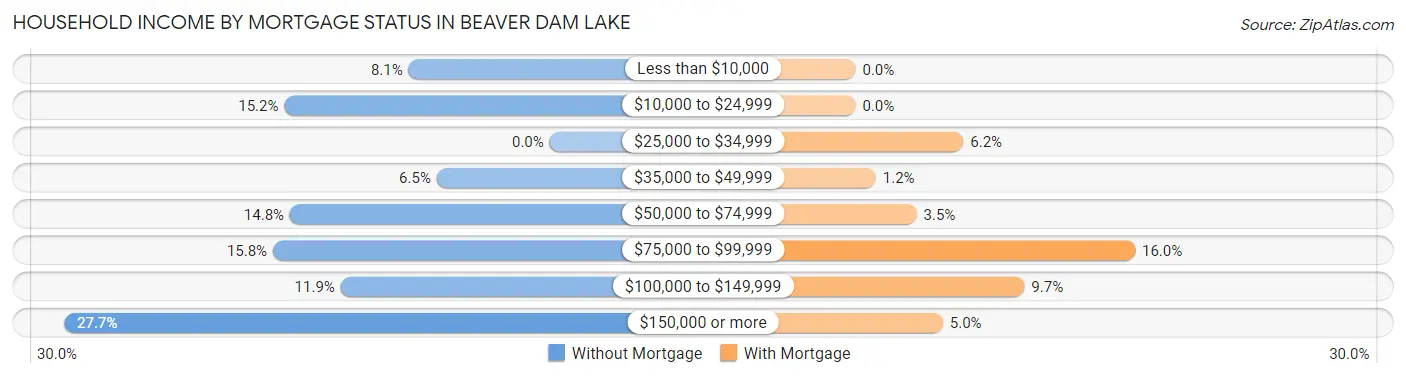
| Household Income | Without Mortgage | With Mortgage |
| Less than $10,000 | 25 (8.1%) | 0 (0.0%) |
| $10,000 to $24,999 | 47 (15.2%) | 0 (0.0%) |
| $25,000 to $34,999 | 0 (0.0%) | 37 (6.2%) |
| $35,000 to $49,999 | 20 (6.5%) | 7 (1.2%) |
| $50,000 to $74,999 | 46 (14.8%) | 21 (3.5%) |
| $75,000 to $99,999 | 49 (15.8%) | 96 (16.0%) |
| $100,000 to $149,999 | 37 (11.9%) | 58 (9.7%) |
| $150,000 or more | 86 (27.7%) | 30 (5.0%) |
| Total | 310 (100.0%) | 601 (100.0%) |
Property Value to Household Income Ratio in Beaver Dam Lake
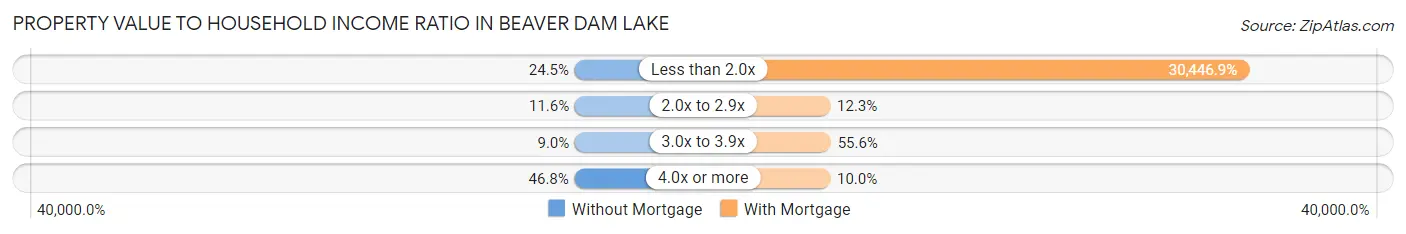
| Value-to-Income Ratio | Without Mortgage | With Mortgage |
| Less than 2.0x | 76 (24.5%) | 182,986 (30,446.9%) |
| 2.0x to 2.9x | 36 (11.6%) | 74 (12.3%) |
| 3.0x to 3.9x | 28 (9.0%) | 334 (55.6%) |
| 4.0x or more | 145 (46.8%) | 60 (10.0%) |
| Total | 310 (100.0%) | 601 (100.0%) |
Real Estate Taxes by Mortgage Status in Beaver Dam Lake
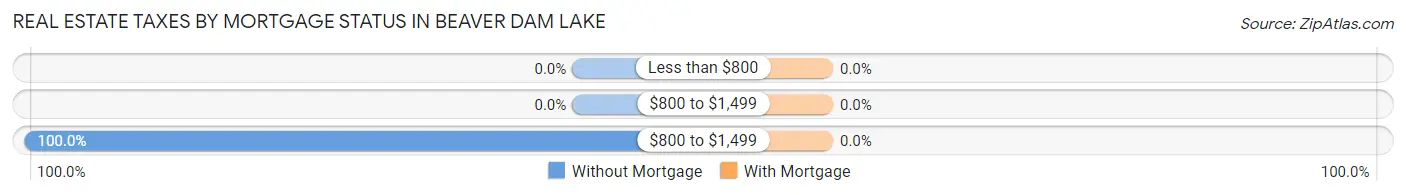
| Property Taxes | Without Mortgage | With Mortgage |
| Less than $800 | 0 (0.0%) | 0 (0.0%) |
| $800 to $1,499 | 0 (0.0%) | 0 (0.0%) |
| $800 to $1,499 | 310 (100.0%) | 0 (0.0%) |
| Total | 310 (100.0%) | 601 (100.0%) |
Health & Disability in Beaver Dam Lake
Health Insurance Coverage by Age in Beaver Dam Lake
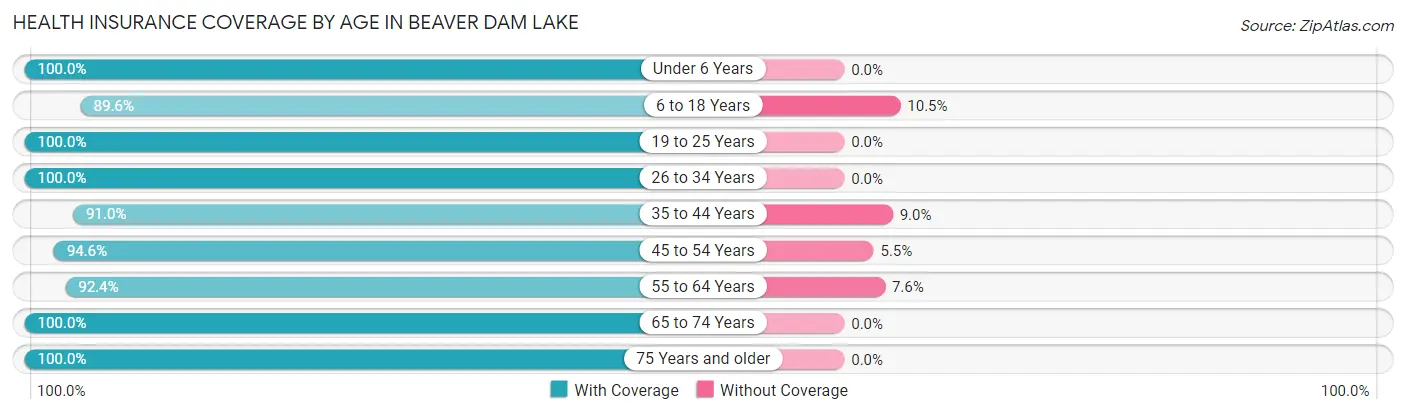
| Age Bracket | With Coverage | Without Coverage |
| Under 6 Years | 296 (100.0%) | 0 (0.0%) |
| 6 to 18 Years | 497 (89.5%) | 58 (10.4%) |
| 19 to 25 Years | 294 (100.0%) | 0 (0.0%) |
| 26 to 34 Years | 358 (100.0%) | 0 (0.0%) |
| 35 to 44 Years | 504 (91.0%) | 50 (9.0%) |
| 45 to 54 Years | 434 (94.6%) | 25 (5.4%) |
| 55 to 64 Years | 438 (92.4%) | 36 (7.6%) |
| 65 to 74 Years | 162 (100.0%) | 0 (0.0%) |
| 75 Years and older | 144 (100.0%) | 0 (0.0%) |
| Total | 3,127 (94.9%) | 169 (5.1%) |
Health Insurance Coverage by Citizenship Status in Beaver Dam Lake
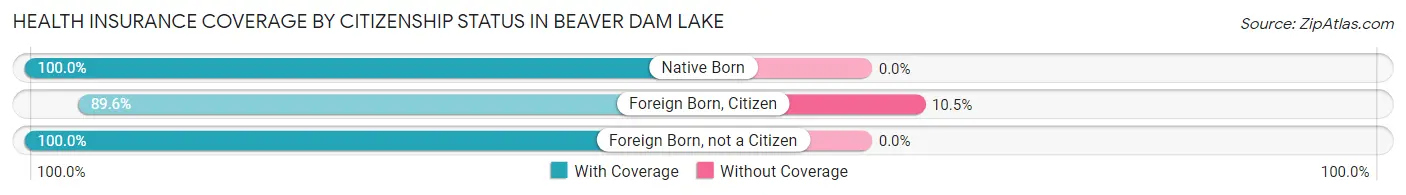
| Citizenship Status | With Coverage | Without Coverage |
| Native Born | 296 (100.0%) | 0 (0.0%) |
| Foreign Born, Citizen | 497 (89.5%) | 58 (10.4%) |
| Foreign Born, not a Citizen | 294 (100.0%) | 0 (0.0%) |
Health Insurance Coverage by Household Income in Beaver Dam Lake
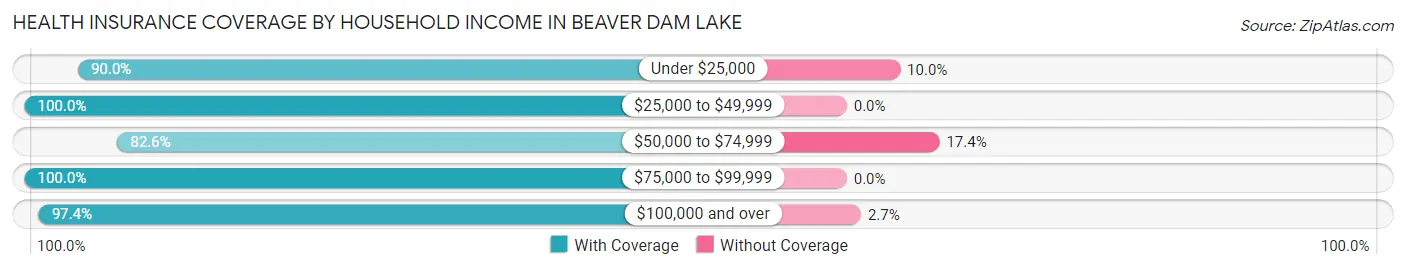
| Household Income | With Coverage | Without Coverage |
| Under $25,000 | 225 (90.0%) | 25 (10.0%) |
| $25,000 to $49,999 | 96 (100.0%) | 0 (0.0%) |
| $50,000 to $74,999 | 409 (82.6%) | 86 (17.4%) |
| $75,000 to $99,999 | 258 (100.0%) | 0 (0.0%) |
| $100,000 and over | 2,128 (97.4%) | 58 (2.6%) |
Public vs Private Health Insurance Coverage by Age in Beaver Dam Lake
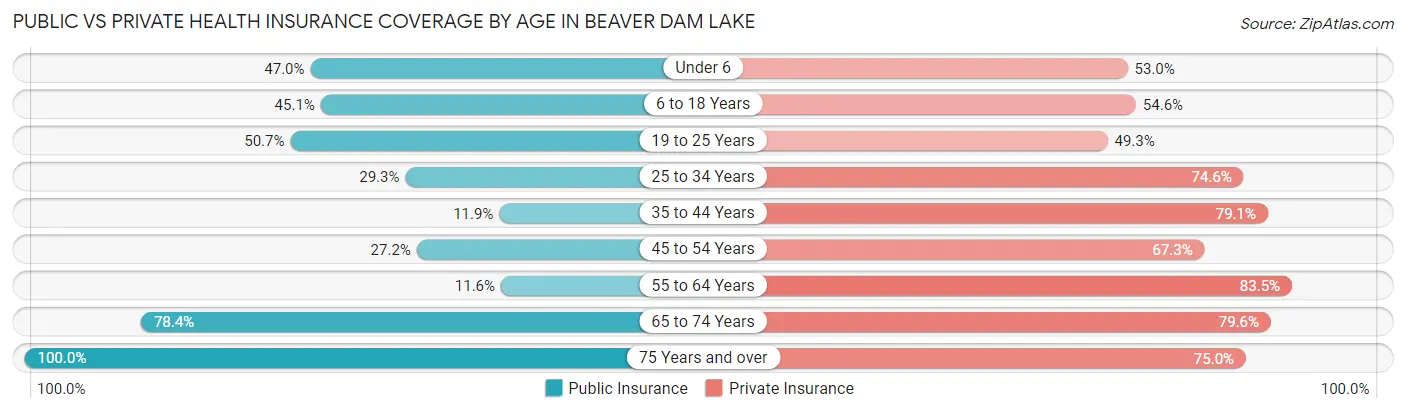
| Age Bracket | Public Insurance | Private Insurance |
| Under 6 | 139 (47.0%) | 157 (53.0%) |
| 6 to 18 Years | 250 (45.1%) | 303 (54.6%) |
| 19 to 25 Years | 149 (50.7%) | 145 (49.3%) |
| 25 to 34 Years | 105 (29.3%) | 267 (74.6%) |
| 35 to 44 Years | 66 (11.9%) | 438 (79.1%) |
| 45 to 54 Years | 125 (27.2%) | 309 (67.3%) |
| 55 to 64 Years | 55 (11.6%) | 396 (83.5%) |
| 65 to 74 Years | 127 (78.4%) | 129 (79.6%) |
| 75 Years and over | 144 (100.0%) | 108 (75.0%) |
| Total | 1,160 (35.2%) | 2,252 (68.3%) |
Disability Status by Sex by Age in Beaver Dam Lake
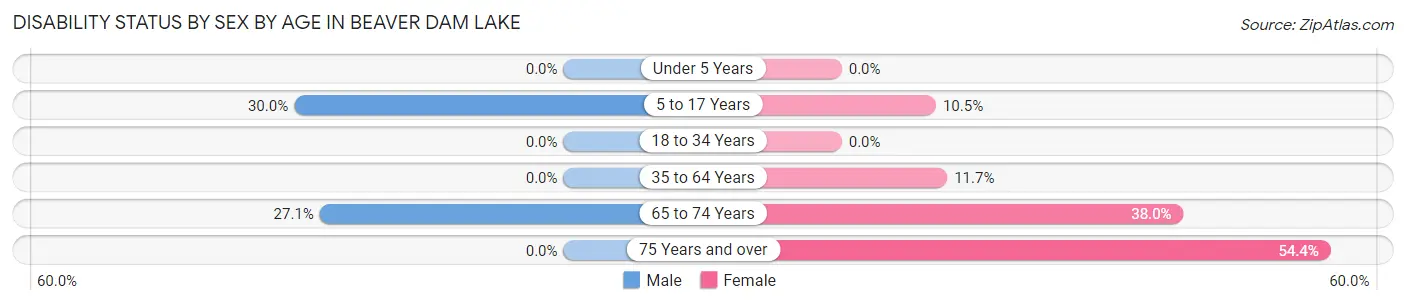
| Age Bracket | Male | Female |
| Under 5 Years | 0 (0.0%) | 0 (0.0%) |
| 5 to 17 Years | 54 (30.0%) | 49 (10.5%) |
| 18 to 34 Years | 0 (0.0%) | 0 (0.0%) |
| 35 to 64 Years | 0 (0.0%) | 95 (11.7%) |
| 65 to 74 Years | 19 (27.1%) | 35 (38.0%) |
| 75 Years and over | 0 (0.0%) | 49 (54.4%) |
Disability Class by Sex by Age in Beaver Dam Lake
Disability Class: Hearing Difficulty
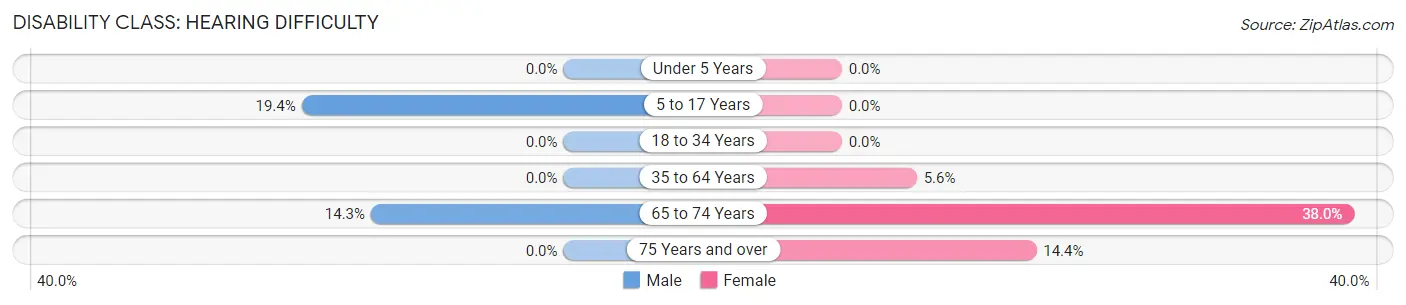
| Age Bracket | Male | Female |
| Under 5 Years | 0 (0.0%) | 0 (0.0%) |
| 5 to 17 Years | 35 (19.4%) | 0 (0.0%) |
| 18 to 34 Years | 0 (0.0%) | 0 (0.0%) |
| 35 to 64 Years | 0 (0.0%) | 45 (5.6%) |
| 65 to 74 Years | 10 (14.3%) | 35 (38.0%) |
| 75 Years and over | 0 (0.0%) | 13 (14.4%) |
Disability Class: Vision Difficulty
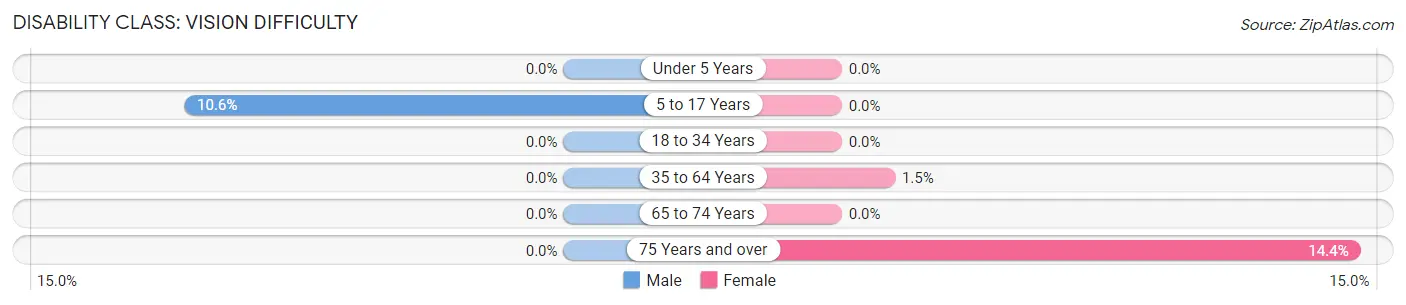
| Age Bracket | Male | Female |
| Under 5 Years | 0 (0.0%) | 0 (0.0%) |
| 5 to 17 Years | 19 (10.6%) | 0 (0.0%) |
| 18 to 34 Years | 0 (0.0%) | 0 (0.0%) |
| 35 to 64 Years | 0 (0.0%) | 12 (1.5%) |
| 65 to 74 Years | 0 (0.0%) | 0 (0.0%) |
| 75 Years and over | 0 (0.0%) | 13 (14.4%) |
Disability Class: Cognitive Difficulty
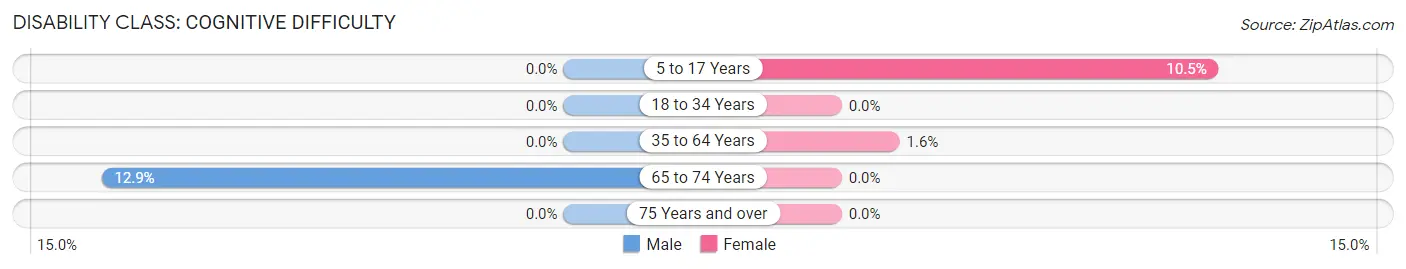
| Age Bracket | Male | Female |
| 5 to 17 Years | 0 (0.0%) | 49 (10.5%) |
| 18 to 34 Years | 0 (0.0%) | 0 (0.0%) |
| 35 to 64 Years | 0 (0.0%) | 13 (1.6%) |
| 65 to 74 Years | 9 (12.9%) | 0 (0.0%) |
| 75 Years and over | 0 (0.0%) | 0 (0.0%) |
Disability Class: Ambulatory Difficulty
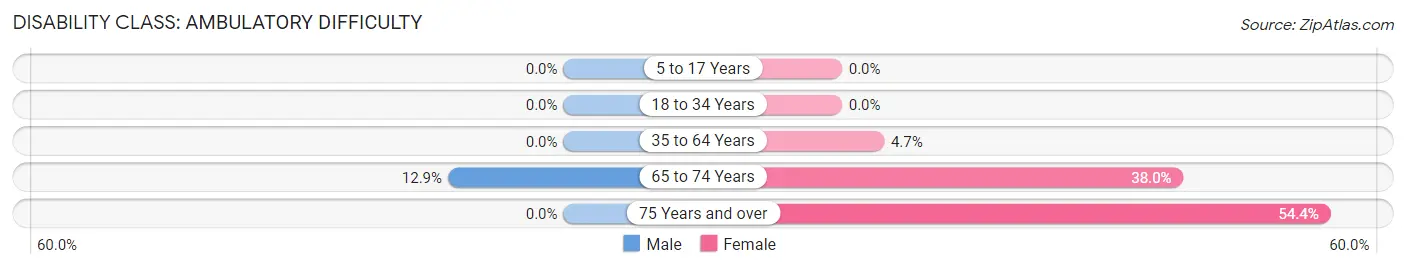
| Age Bracket | Male | Female |
| 5 to 17 Years | 0 (0.0%) | 0 (0.0%) |
| 18 to 34 Years | 0 (0.0%) | 0 (0.0%) |
| 35 to 64 Years | 0 (0.0%) | 38 (4.7%) |
| 65 to 74 Years | 9 (12.9%) | 35 (38.0%) |
| 75 Years and over | 0 (0.0%) | 49 (54.4%) |
Disability Class: Self-Care Difficulty
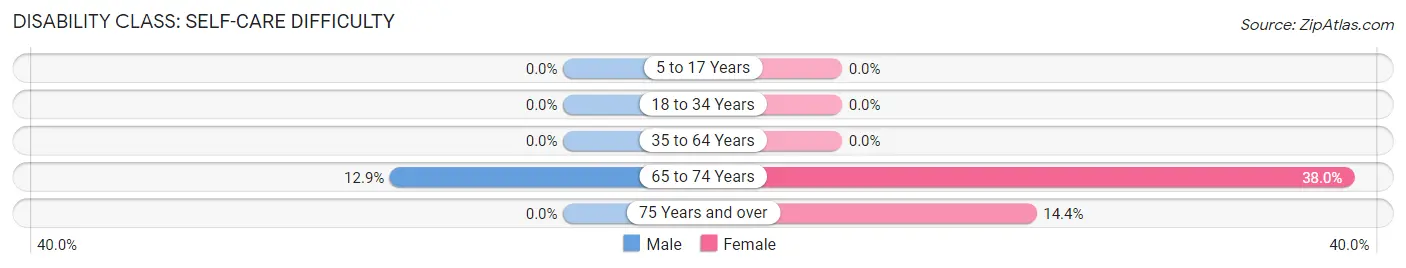
| Age Bracket | Male | Female |
| 5 to 17 Years | 0 (0.0%) | 0 (0.0%) |
| 18 to 34 Years | 0 (0.0%) | 0 (0.0%) |
| 35 to 64 Years | 0 (0.0%) | 0 (0.0%) |
| 65 to 74 Years | 9 (12.9%) | 35 (38.0%) |
| 75 Years and over | 0 (0.0%) | 13 (14.4%) |
Technology Access in Beaver Dam Lake
Computing Device Access in Beaver Dam Lake
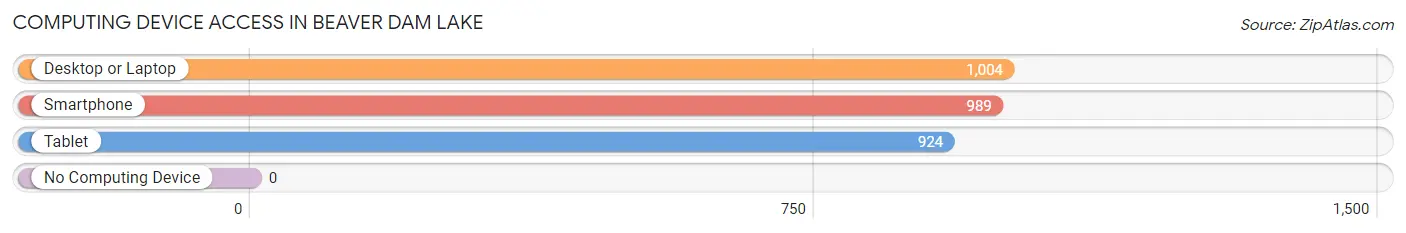
| Device Type | # Households | % Households |
| Desktop or Laptop | 1,004 | 97.8% |
| Smartphone | 989 | 96.3% |
| Tablet | 924 | 90.0% |
| No Computing Device | 0 | 0.0% |
| Total | 1,027 | 100.0% |
Internet Access in Beaver Dam Lake
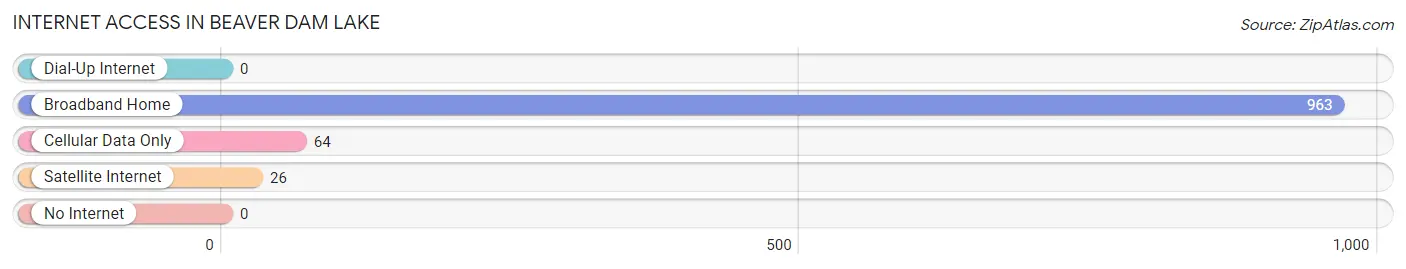
| Internet Type | # Households | % Households |
| Dial-Up Internet | 0 | 0.0% |
| Broadband Home | 963 | 93.8% |
| Cellular Data Only | 64 | 6.2% |
| Satellite Internet | 26 | 2.5% |
| No Internet | 0 | 0.0% |
| Total | 1,027 | 100.0% |
Beaver Dam Lake Summary
Beaver Dam Lake is a small lake located in the town of Westmoreland, Oneida County, New York. It is a popular destination for fishing, swimming, and boating. The lake is surrounded by a variety of wildlife, including deer, beavers, and other small mammals.
Geography
Beaver Dam Lake is located in the town of Westmoreland, Oneida County, New York. It is a small lake, measuring approximately 1.5 miles long and 0.5 miles wide. The lake is located at an elevation of 890 feet above sea level. The lake is fed by several small streams, including the Beaver Dam Creek, which flows into the lake from the north. The lake is drained by the Beaver Dam Creek, which flows out of the lake to the south.
The lake is surrounded by a variety of wildlife, including deer, beavers, and other small mammals. The lake is also home to a variety of fish, including bass, perch, and sunfish.
History
Beaver Dam Lake has been a popular destination for fishing, swimming, and boating since the early 1900s. The lake was originally created by beavers, who built a dam across the Beaver Dam Creek. The lake was later expanded by humans, who built a larger dam across the creek.
The lake was a popular destination for fishing and swimming in the early 1900s. In the 1920s, the lake was used for hydroelectric power generation. In the 1950s, the lake was used for recreational boating.
Economy
Beaver Dam Lake is a popular destination for fishing, swimming, and boating. The lake is home to several marinas, which offer boat rentals, fishing supplies, and other services. The lake is also home to several restaurants and lodges, which offer food and lodging to visitors.
The lake is also home to several businesses, including a bait shop, a boat repair shop, and a boat storage facility. The lake is also home to several campgrounds, which offer camping and RV sites.
Demographics
The population of the town of Westmoreland, which includes Beaver Dam Lake, was 8,845 in the 2010 census. The population is predominantly white, with a small percentage of African Americans, Hispanics, and other ethnicities. The median household income in the town is $50,945, and the median age is 43.
Conclusion
Beaver Dam Lake is a small lake located in the town of Westmoreland, Oneida County, New York. It is a popular destination for fishing, swimming, and boating. The lake is surrounded by a variety of wildlife, including deer, beavers, and other small mammals. The lake is also home to several businesses, including marinas, restaurants, lodges, and campgrounds. The population of the town of Westmoreland, which includes Beaver Dam Lake, was 8,845 in the 2010 census. The population is predominantly white, with a small percentage of African Americans, Hispanics, and other ethnicities.
Common Questions
What is Per Capita Income in Beaver Dam Lake?
Per Capita income in Beaver Dam Lake is $42,392.
What is the Median Family Income in Beaver Dam Lake?
Median Family Income in Beaver Dam Lake is $114,025.
What is the Median Household income in Beaver Dam Lake?
Median Household Income in Beaver Dam Lake is $113,775.
What is Income or Wage Gap in Beaver Dam Lake?
Income or Wage Gap in Beaver Dam Lake is 36.5%.
Women in Beaver Dam Lake earn 63.5 cents for every dollar earned by a man.
What is Inequality or Gini Index in Beaver Dam Lake?
Inequality or Gini Index in Beaver Dam Lake is 0.34.
What is the Total Population of Beaver Dam Lake?
Total Population of Beaver Dam Lake is 3,296.
What is the Total Male Population of Beaver Dam Lake?
Total Male Population of Beaver Dam Lake is 1,402.
What is the Total Female Population of Beaver Dam Lake?
Total Female Population of Beaver Dam Lake is 1,894.
What is the Ratio of Males per 100 Females in Beaver Dam Lake?
There are 74.02 Males per 100 Females in Beaver Dam Lake.
What is the Ratio of Females per 100 Males in Beaver Dam Lake?
There are 135.09 Females per 100 Males in Beaver Dam Lake.
What is the Median Population Age in Beaver Dam Lake?
Median Population Age in Beaver Dam Lake is 36.3 Years.
What is the Average Family Size in Beaver Dam Lake
Average Family Size in Beaver Dam Lake is 3.4 People.
What is the Average Household Size in Beaver Dam Lake
Average Household Size in Beaver Dam Lake is 3.2 People.
How Large is the Labor Force in Beaver Dam Lake?
There are 1,712 People in the Labor Forcein in Beaver Dam Lake.
What is the Percentage of People in the Labor Force in Beaver Dam Lake?
68.0% of People are in the Labor Force in Beaver Dam Lake.
What is the Unemployment Rate in Beaver Dam Lake?
Unemployment Rate in Beaver Dam Lake is 6.2%.