Barneveld, NY Map & Demographics
Barneveld Map
Barneveld Overview
$24,887
PER CAPITA INCOME
$73,417
AVG FAMILY INCOME
$73,384
AVG HOUSEHOLD INCOME
0.13
INEQUALITY / GINI INDEX
191
TOTAL POPULATION
89
MALE POPULATION
102
FEMALE POPULATION
87.25
MALES / 100 FEMALES
114.61
FEMALES / 100 MALES
27.7
MEDIAN AGE
3.5
AVG FAMILY SIZE
2.9
AVG HOUSEHOLD SIZE
60
LABOR FORCE [ PEOPLE ]
50.0%
PERCENT IN LABOR FORCE
Barneveld Zip Codes
Barneveld Area Codes
Income in Barneveld
Income Overview in Barneveld
Per Capita Income in Barneveld is $24,887, while median incomes of families and households are $73,417 and $73,384 respectively.
| Characteristic | Number | Measure |
| Per Capita Income | 191 | $24,887 |
| Median Family Income | 48 | $73,417 |
| Mean Family Income | 48 | $71,004 |
| Median Household Income | 67 | $73,384 |
| Mean Household Income | 67 | $68,740 |
| Income Deficit | 48 | $0 |
| Wage / Income Gap (%) | 191 | 0.00% |
| Wage / Income Gap ($) | 191 | 100.00¢ per $1 |
| Gini / Inequality Index | 191 | 0.13 |
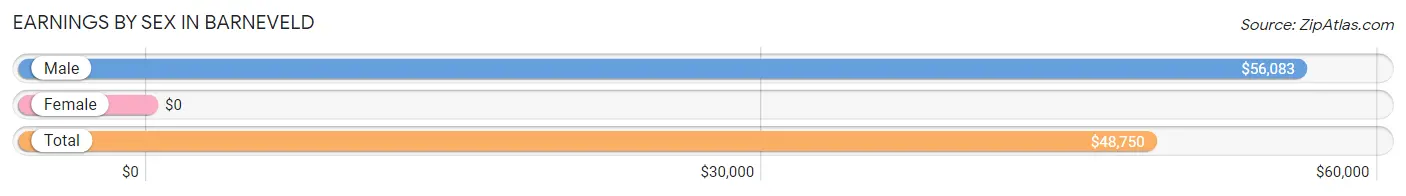
Earnings by Sex in Barneveld
| Sex | Number | Average Earnings |
| Male | 38 (59.4%) | $56,083 |
| Female | 26 (40.6%) | $0 |
| Total | 64 (100.0%) | $48,750 |
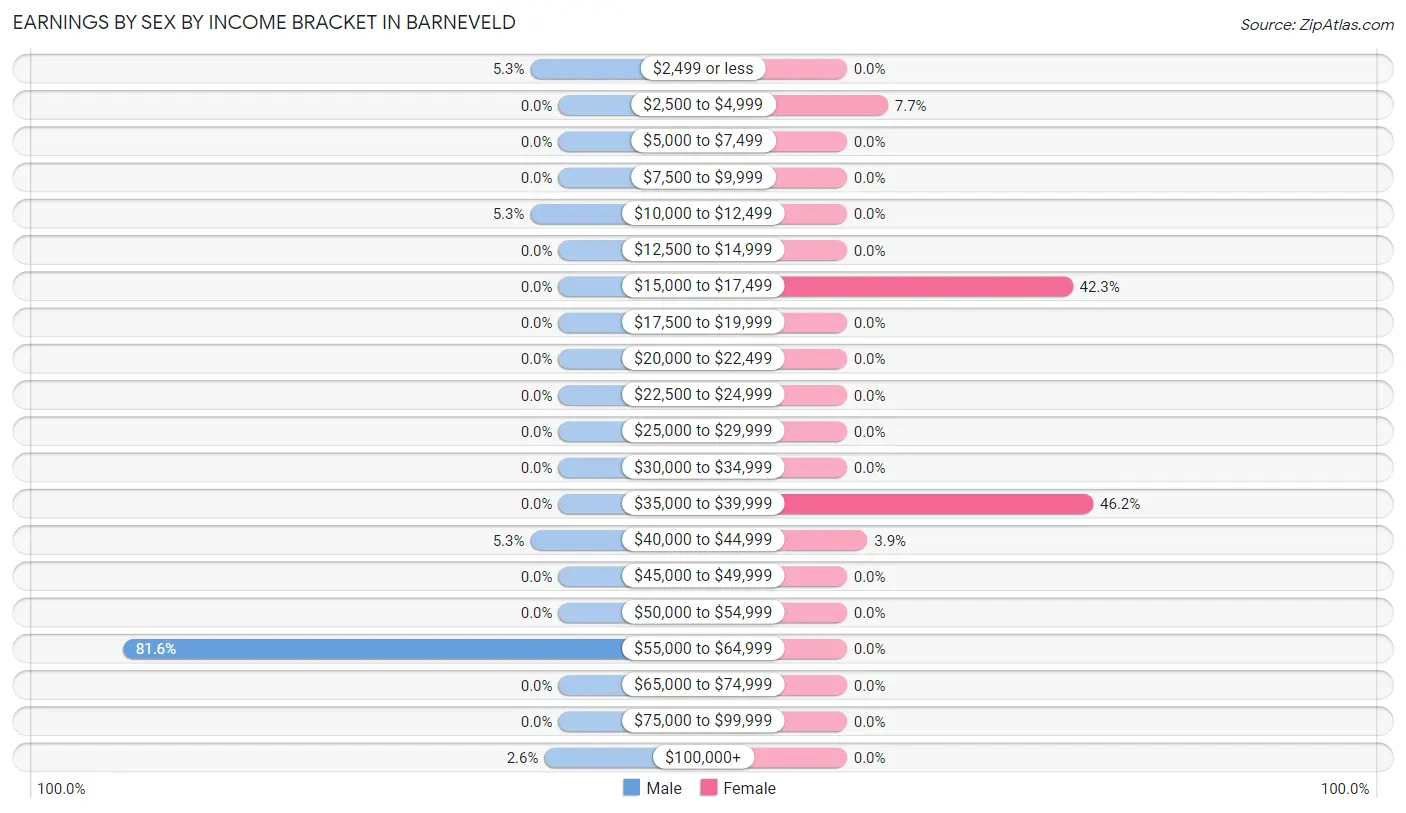
Earnings by Sex by Income Bracket in Barneveld
The most common earnings brackets in Barneveld are $55,000 to $64,999 for men (31 | 81.6%) and $35,000 to $39,999 for women (12 | 46.2%).
| Income | Male | Female |
| $2,499 or less | 2 (5.3%) | 0 (0.0%) |
| $2,500 to $4,999 | 0 (0.0%) | 2 (7.7%) |
| $5,000 to $7,499 | 0 (0.0%) | 0 (0.0%) |
| $7,500 to $9,999 | 0 (0.0%) | 0 (0.0%) |
| $10,000 to $12,499 | 2 (5.3%) | 0 (0.0%) |
| $12,500 to $14,999 | 0 (0.0%) | 0 (0.0%) |
| $15,000 to $17,499 | 0 (0.0%) | 11 (42.3%) |
| $17,500 to $19,999 | 0 (0.0%) | 0 (0.0%) |
| $20,000 to $22,499 | 0 (0.0%) | 0 (0.0%) |
| $22,500 to $24,999 | 0 (0.0%) | 0 (0.0%) |
| $25,000 to $29,999 | 0 (0.0%) | 0 (0.0%) |
| $30,000 to $34,999 | 0 (0.0%) | 0 (0.0%) |
| $35,000 to $39,999 | 0 (0.0%) | 12 (46.2%) |
| $40,000 to $44,999 | 2 (5.3%) | 1 (3.8%) |
| $45,000 to $49,999 | 0 (0.0%) | 0 (0.0%) |
| $50,000 to $54,999 | 0 (0.0%) | 0 (0.0%) |
| $55,000 to $64,999 | 31 (81.6%) | 0 (0.0%) |
| $65,000 to $74,999 | 0 (0.0%) | 0 (0.0%) |
| $75,000 to $99,999 | 0 (0.0%) | 0 (0.0%) |
| $100,000+ | 1 (2.6%) | 0 (0.0%) |
| Total | 38 (100.0%) | 26 (100.0%) |
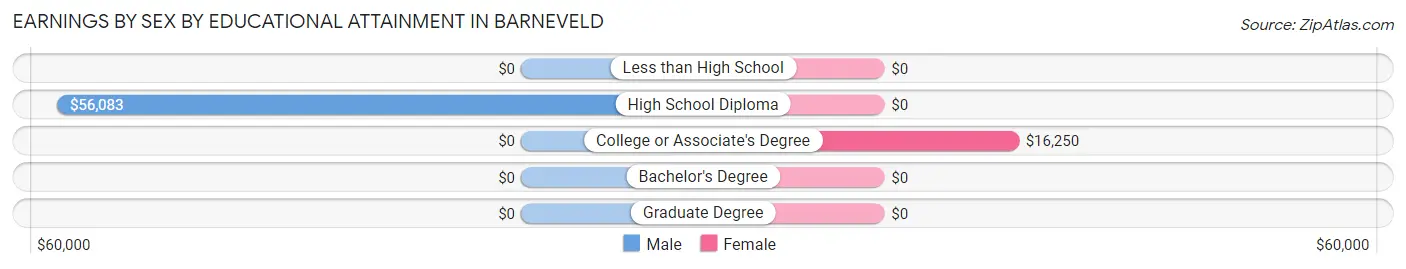
Earnings by Sex by Educational Attainment in Barneveld
| Educational Attainment | Male Income | Female Income |
| Less than High School | - | - |
| High School Diploma | $56,083 | $0 |
| College or Associate's Degree | - | - |
| Bachelor's Degree | - | - |
| Graduate Degree | - | - |
| Total | $56,167 | $0 |
Family Income in Barneveld
Family Income Brackets in Barneveld
According to the Barneveld family income data, there are 41 families falling into the $50,000 to $74,999 income range, which is the most common income bracket and makes up 85.4% of all families.
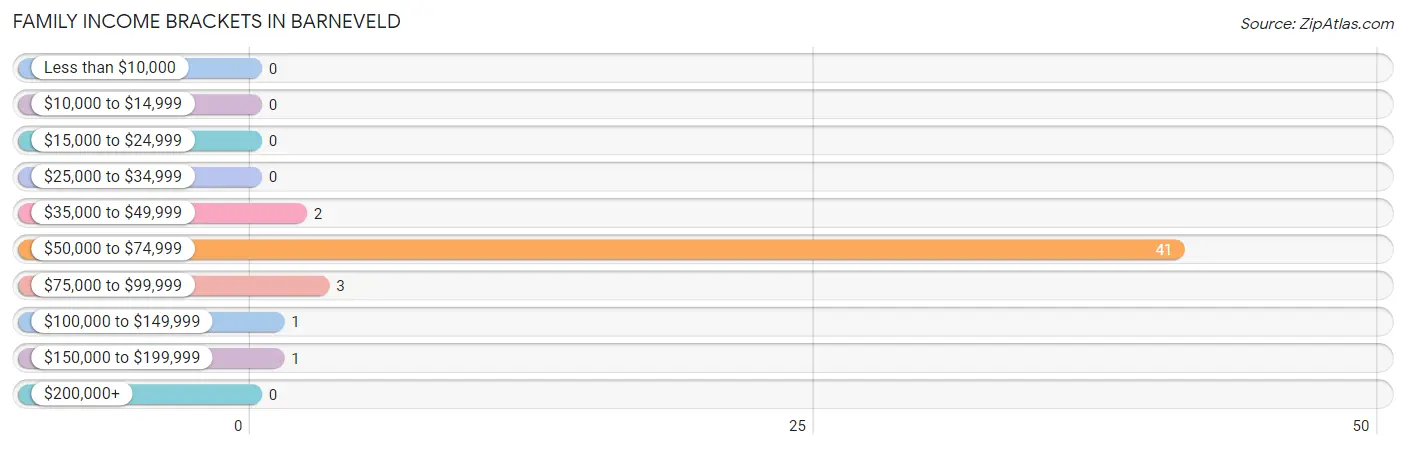
| Income Bracket | # Families | % Families |
| Less than $10,000 | 0 | 0.0% |
| $10,000 to $14,999 | 0 | 0.0% |
| $15,000 to $24,999 | 0 | 0.0% |
| $25,000 to $34,999 | 0 | 0.0% |
| $35,000 to $49,999 | 2 | 4.2% |
| $50,000 to $74,999 | 41 | 85.4% |
| $75,000 to $99,999 | 3 | 6.3% |
| $100,000 to $149,999 | 1 | 2.1% |
| $150,000 to $199,999 | 1 | 2.1% |
| $200,000+ | 0 | 0.0% |
Family Income by Famaliy Size in Barneveld
2-person families (6 | 12.5%) account for the highest median family income in Barneveld with $86,250 per family, while 2-person families (6 | 12.5%) have the highest median income of $43,125 per family member.
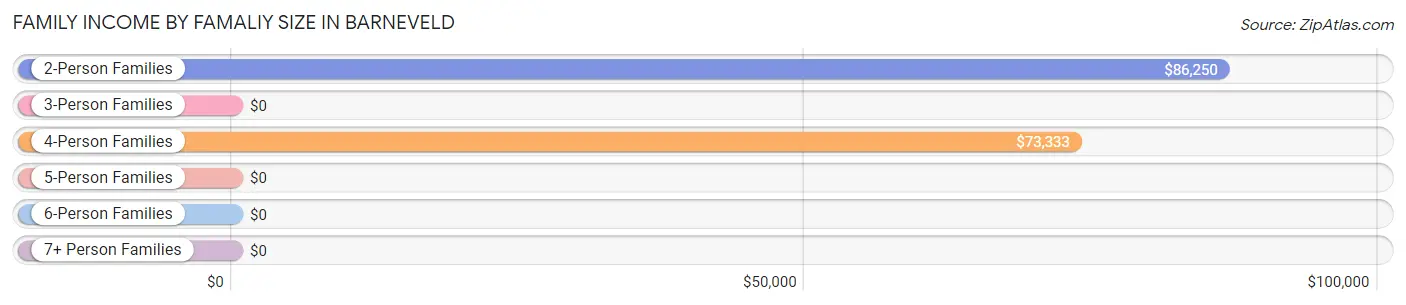
| Income Bracket | # Families | Median Income |
| 2-Person Families | 6 (12.5%) | $86,250 |
| 3-Person Families | 0 (0.0%) | $0 |
| 4-Person Families | 42 (87.5%) | $73,333 |
| 5-Person Families | 0 (0.0%) | $0 |
| 6-Person Families | 0 (0.0%) | $0 |
| 7+ Person Families | 0 (0.0%) | $0 |
| Total | 48 (100.0%) | $73,417 |
Family Income by Number of Earners in Barneveld
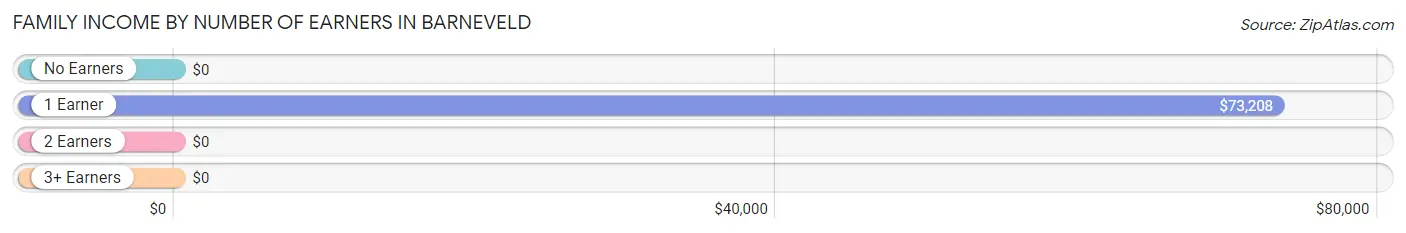
| Number of Earners | # Families | Median Income |
| No Earners | 1 (2.1%) | $0 |
| 1 Earner | 43 (89.6%) | $73,208 |
| 2 Earners | 3 (6.2%) | $0 |
| 3+ Earners | 1 (2.1%) | $0 |
| Total | 48 (100.0%) | $73,417 |
Household Income in Barneveld
Household Income Brackets in Barneveld
With 52 households falling in the category, the $50,000 to $74,999 income range is the most frequent in Barneveld, accounting for 77.6% of all households.
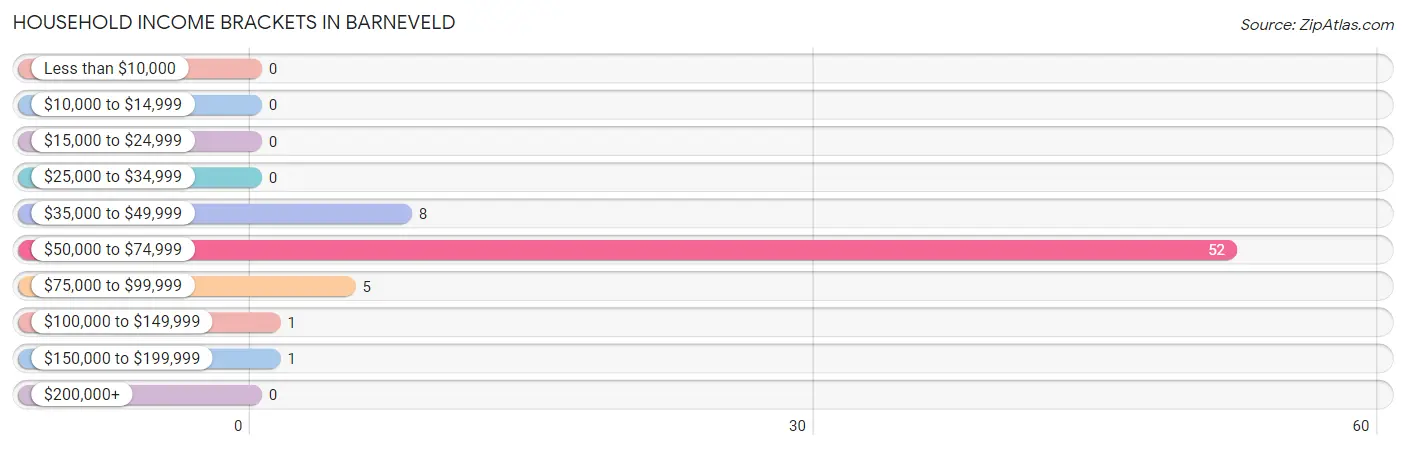
| Income Bracket | # Households | % Households |
| Less than $10,000 | 0 | 0.0% |
| $10,000 to $14,999 | 0 | 0.0% |
| $15,000 to $24,999 | 0 | 0.0% |
| $25,000 to $34,999 | 0 | 0.0% |
| $35,000 to $49,999 | 8 | 11.9% |
| $50,000 to $74,999 | 52 | 77.6% |
| $75,000 to $99,999 | 5 | 7.5% |
| $100,000 to $149,999 | 1 | 1.5% |
| $150,000 to $199,999 | 1 | 1.5% |
| $200,000+ | 0 | 0.0% |
Household Income by Householder Age in Barneveld
The median household income in Barneveld is $73,384, with the highest median household income of $74,091 found in the 65+ years age bracket for the primary householder. A total of 14 households (20.9%) fall into this category.
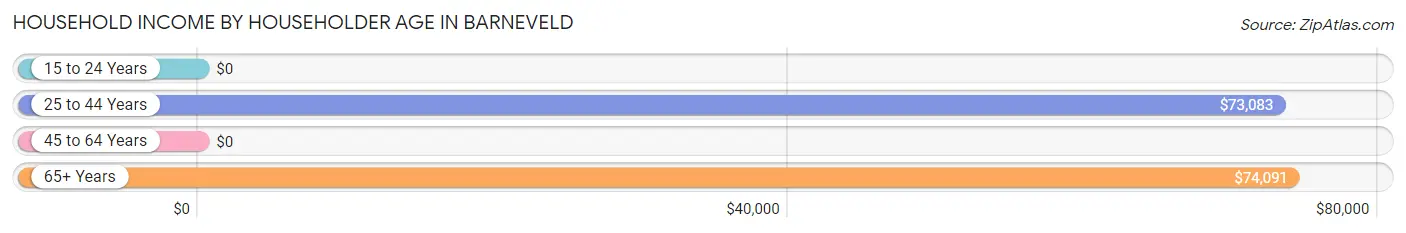
| Income Bracket | # Households | Median Income |
| 15 to 24 Years | 0 (0.0%) | $0 |
| 25 to 44 Years | 52 (77.6%) | $73,083 |
| 45 to 64 Years | 1 (1.5%) | $0 |
| 65+ Years | 14 (20.9%) | $74,091 |
| Total | 67 (100.0%) | $73,384 |
Poverty in Barneveld
Income Below Poverty by Sex and Age in Barneveld
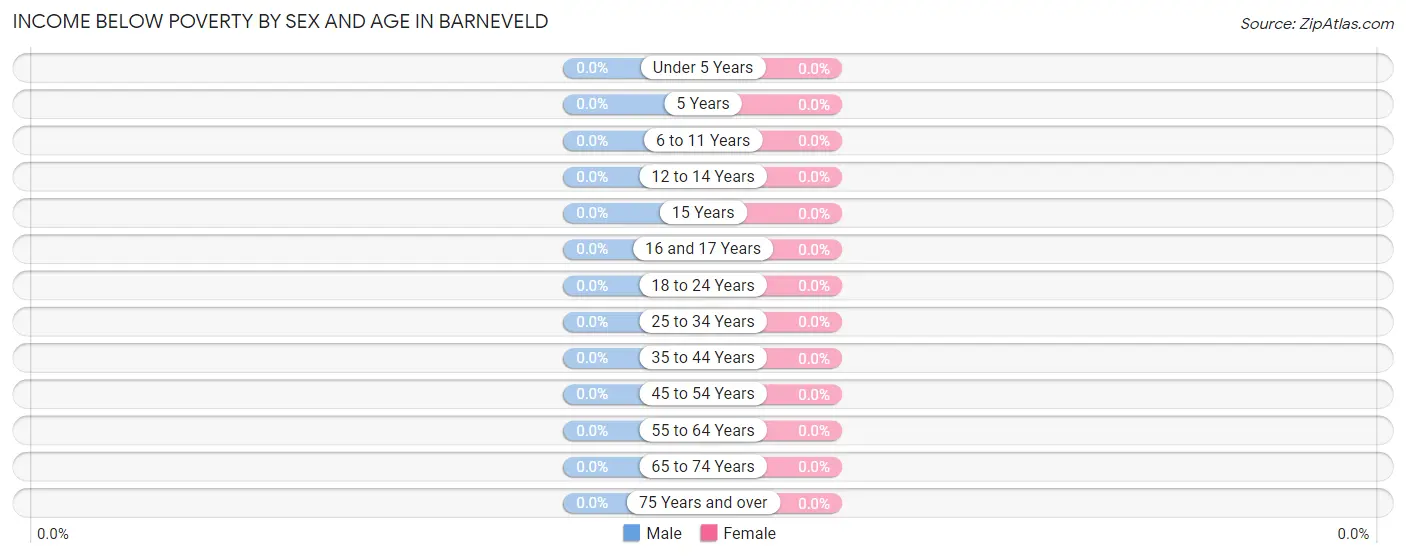
| Age Bracket | Male | Female |
| Under 5 Years | 0 (0.0%) | 0 (0.0%) |
| 5 Years | 0 (0.0%) | 0 (0.0%) |
| 6 to 11 Years | 0 (0.0%) | 0 (0.0%) |
| 12 to 14 Years | 0 (0.0%) | 0 (0.0%) |
| 15 Years | 0 (0.0%) | 0 (0.0%) |
| 16 and 17 Years | 0 (0.0%) | 0 (0.0%) |
| 18 to 24 Years | 0 (0.0%) | 0 (0.0%) |
| 25 to 34 Years | 0 (0.0%) | 0 (0.0%) |
| 35 to 44 Years | 0 (0.0%) | 0 (0.0%) |
| 45 to 54 Years | 0 (0.0%) | 0 (0.0%) |
| 55 to 64 Years | 0 (0.0%) | 0 (0.0%) |
| 65 to 74 Years | 0 (0.0%) | 0 (0.0%) |
| 75 Years and over | 0 (0.0%) | 0 (0.0%) |
| Total | 0 (0.0%) | 0 (0.0%) |
Income Above Poverty by Sex and Age in Barneveld
According to the poverty statistics in Barneveld, males aged under 5 years and females aged under 5 years are the age groups that are most secure financially, with 100.0% of males and 100.0% of females in these age groups living above the poverty line.
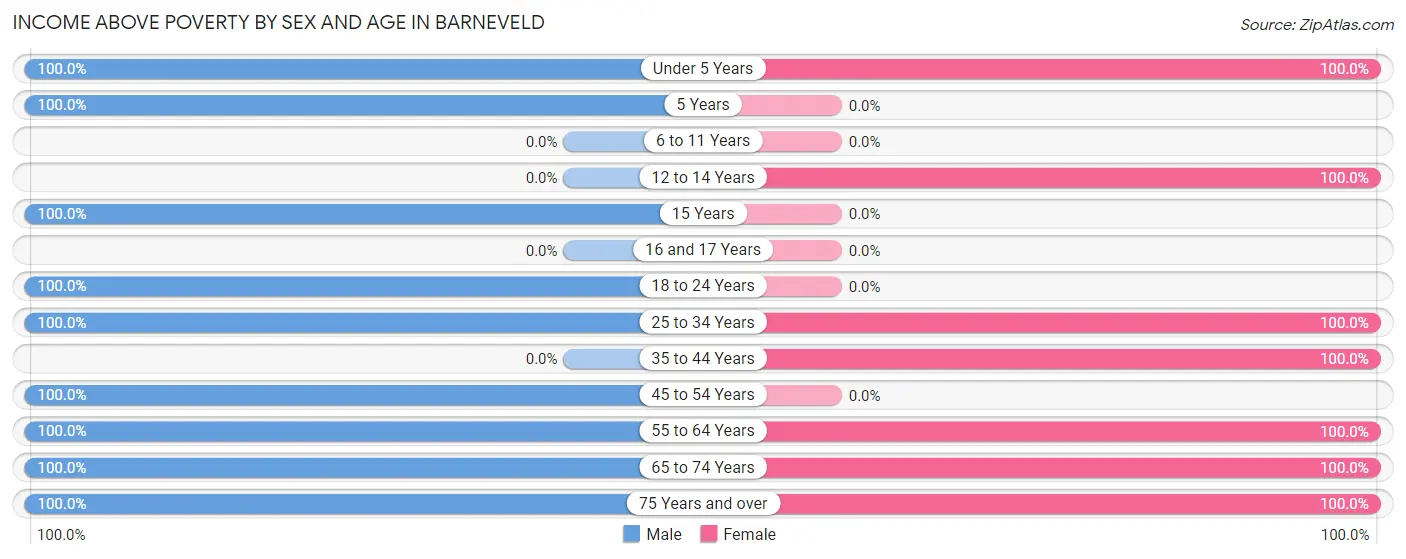
| Age Bracket | Male | Female |
| Under 5 Years | 27 (100.0%) | 25 (100.0%) |
| 5 Years | 2 (100.0%) | 0 (0.0%) |
| 6 to 11 Years | 0 (0.0%) | 0 (0.0%) |
| 12 to 14 Years | 0 (0.0%) | 8 (100.0%) |
| 15 Years | 9 (100.0%) | 0 (0.0%) |
| 16 and 17 Years | 0 (0.0%) | 0 (0.0%) |
| 18 to 24 Years | 2 (100.0%) | 0 (0.0%) |
| 25 to 34 Years | 33 (100.0%) | 42 (100.0%) |
| 35 to 44 Years | 0 (0.0%) | 11 (100.0%) |
| 45 to 54 Years | 12 (100.0%) | 0 (0.0%) |
| 55 to 64 Years | 1 (100.0%) | 1 (100.0%) |
| 65 to 74 Years | 2 (100.0%) | 2 (100.0%) |
| 75 Years and over | 1 (100.0%) | 13 (100.0%) |
| Total | 89 (100.0%) | 102 (100.0%) |
Income Below Poverty Among Married-Couple Families in Barneveld
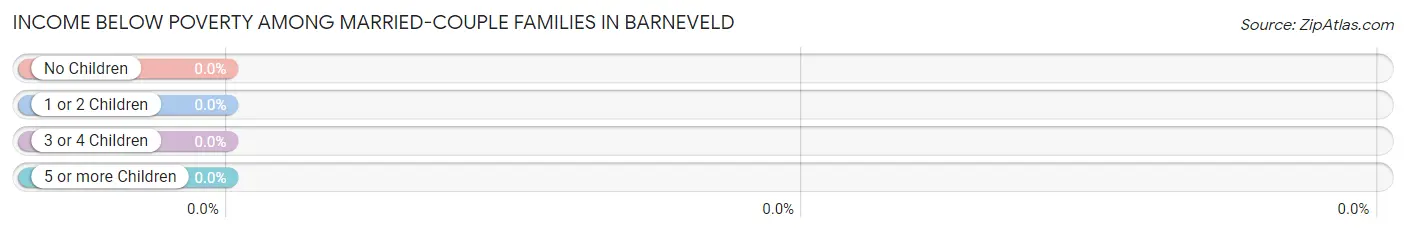
| Children | Above Poverty | Below Poverty |
| No Children | 5 (100.0%) | 0 (0.0%) |
| 1 or 2 Children | 41 (100.0%) | 0 (0.0%) |
| 3 or 4 Children | 0 (0.0%) | 0 (0.0%) |
| 5 or more Children | 0 (0.0%) | 0 (0.0%) |
| Total | 46 (100.0%) | 0 (0.0%) |
Income Below Poverty Among Single-Parent Households in Barneveld
| Children | Single Father | Single Mother |
| No Children | 0 (0.0%) | 0 (0.0%) |
| 1 or 2 Children | 0 (0.0%) | 0 (0.0%) |
| 3 or 4 Children | 0 (0.0%) | 0 (0.0%) |
| 5 or more Children | 0 (0.0%) | 0 (0.0%) |
| Total | 0 (0.0%) | 0 (0.0%) |
Income Below Poverty Among Married-Couple vs Single-Parent Households in Barneveld
| Children | Married-Couple Families | Single-Parent Households |
| No Children | 0 (0.0%) | 0 (0.0%) |
| 1 or 2 Children | 0 (0.0%) | 0 (0.0%) |
| 3 or 4 Children | 0 (0.0%) | 0 (0.0%) |
| 5 or more Children | 0 (0.0%) | 0 (0.0%) |
| Total | 0 (0.0%) | 0 (0.0%) |
Race in Barneveld
The most populous races in Barneveld are , and White / Caucasian (191 | 100.0%).
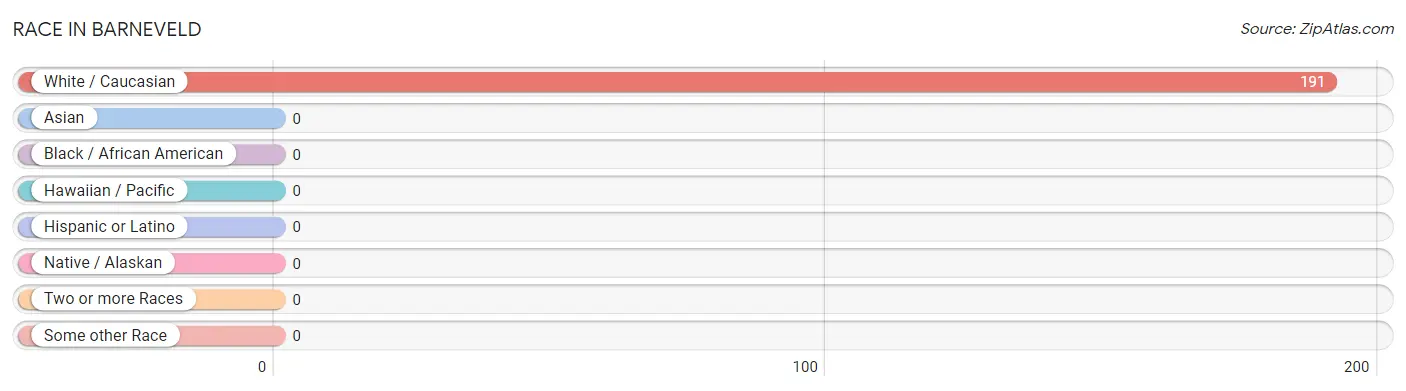
| Race | # Population | % Population |
| Asian | 0 | 0.0% |
| Black / African American | 0 | 0.0% |
| Hawaiian / Pacific | 0 | 0.0% |
| Hispanic or Latino | 0 | 0.0% |
| Native / Alaskan | 0 | 0.0% |
| White / Caucasian | 191 | 100.0% |
| Two or more Races | 0 | 0.0% |
| Some other Race | 0 | 0.0% |
| Total | 191 | 100.0% |
Ancestry in Barneveld
The most populous ancestries reported in Barneveld are American (120 | 62.8%), Irish (32 | 16.8%), French (28 | 14.7%), Polish (16 | 8.4%), and German (6 | 3.1%), together accounting for 105.8% of all Barneveld residents.
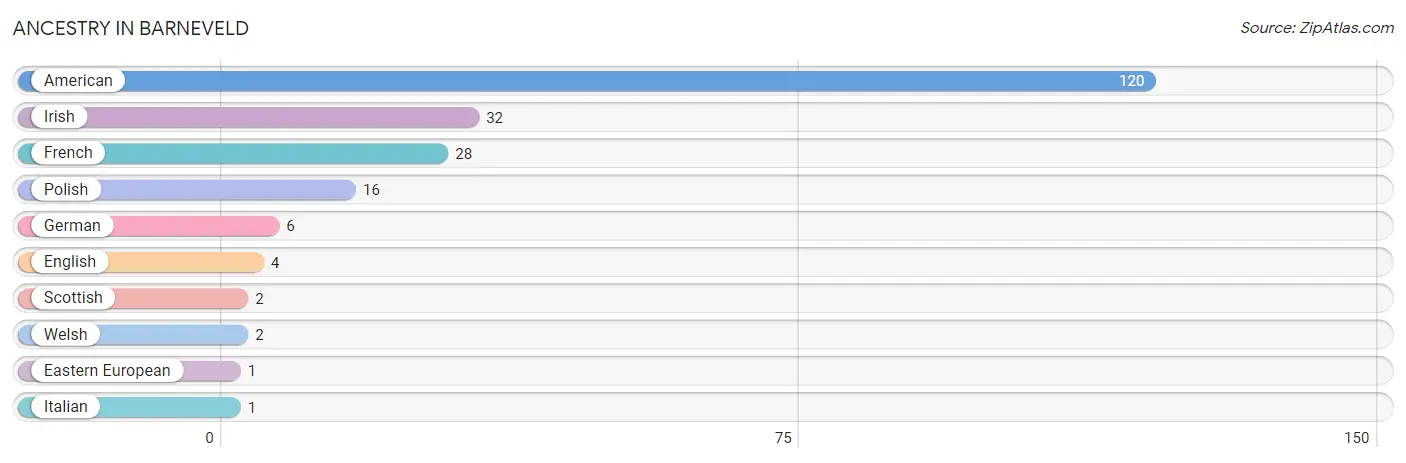
| Ancestry | # Population | % Population |
| American | 120 | 62.8% |
| Eastern European | 1 | 0.5% |
| English | 4 | 2.1% |
| French | 28 | 14.7% |
| German | 6 | 3.1% |
| Irish | 32 | 16.8% |
| Italian | 1 | 0.5% |
| Polish | 16 | 8.4% |
| Scottish | 2 | 1.1% |
| Welsh | 2 | 1.1% | View All 10 Rows |
Immigrants in Barneveld

| Immigration Origin | # Population | % Population | View All 0 Rows |
Sex and Age in Barneveld
Sex and Age in Barneveld
The most populous age groups in Barneveld are 25 to 29 Years (31 | 34.8%) for men and 25 to 29 Years (32 | 31.4%) for women.
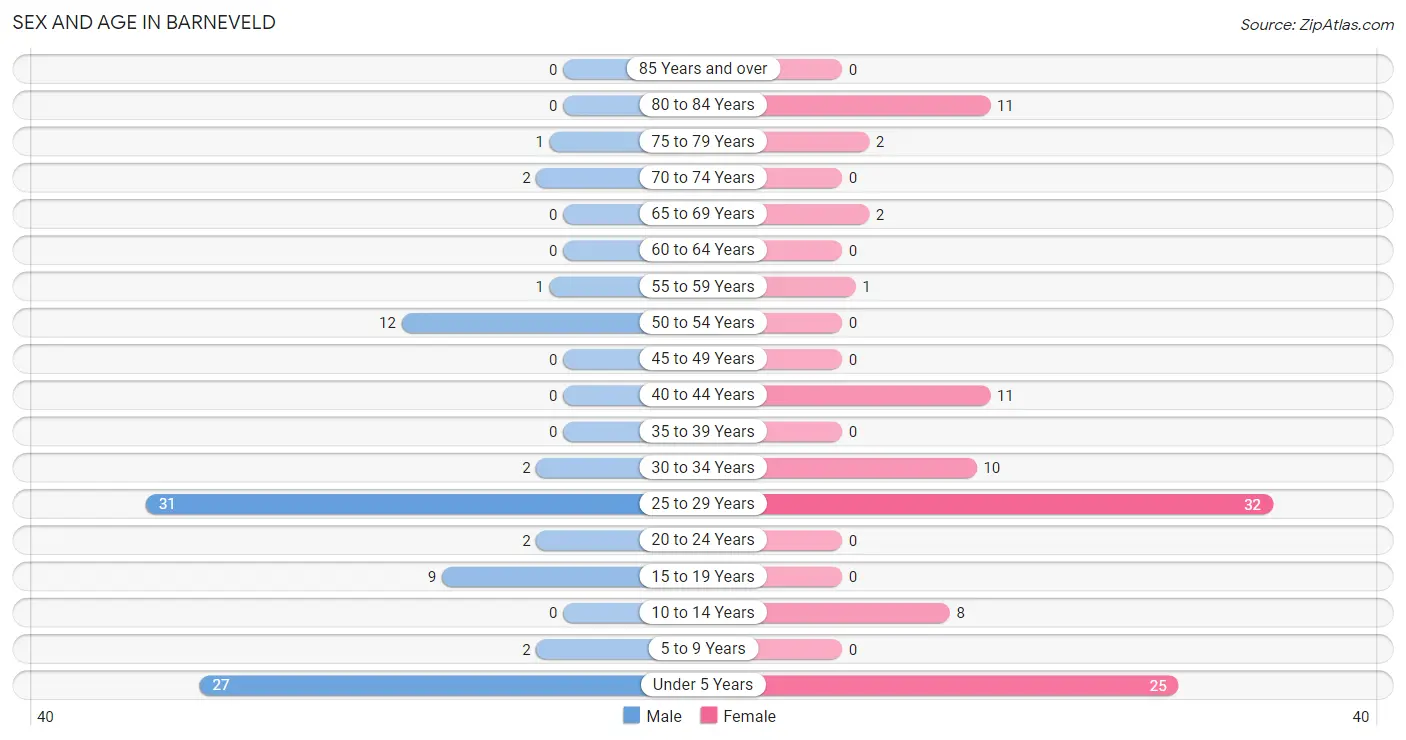
| Age Bracket | Male | Female |
| Under 5 Years | 27 (30.3%) | 25 (24.5%) |
| 5 to 9 Years | 2 (2.2%) | 0 (0.0%) |
| 10 to 14 Years | 0 (0.0%) | 8 (7.8%) |
| 15 to 19 Years | 9 (10.1%) | 0 (0.0%) |
| 20 to 24 Years | 2 (2.2%) | 0 (0.0%) |
| 25 to 29 Years | 31 (34.8%) | 32 (31.4%) |
| 30 to 34 Years | 2 (2.2%) | 10 (9.8%) |
| 35 to 39 Years | 0 (0.0%) | 0 (0.0%) |
| 40 to 44 Years | 0 (0.0%) | 11 (10.8%) |
| 45 to 49 Years | 0 (0.0%) | 0 (0.0%) |
| 50 to 54 Years | 12 (13.5%) | 0 (0.0%) |
| 55 to 59 Years | 1 (1.1%) | 1 (1.0%) |
| 60 to 64 Years | 0 (0.0%) | 0 (0.0%) |
| 65 to 69 Years | 0 (0.0%) | 2 (2.0%) |
| 70 to 74 Years | 2 (2.2%) | 0 (0.0%) |
| 75 to 79 Years | 1 (1.1%) | 2 (2.0%) |
| 80 to 84 Years | 0 (0.0%) | 11 (10.8%) |
| 85 Years and over | 0 (0.0%) | 0 (0.0%) |
| Total | 89 (100.0%) | 102 (100.0%) |
Families and Households in Barneveld
Median Family Size in Barneveld
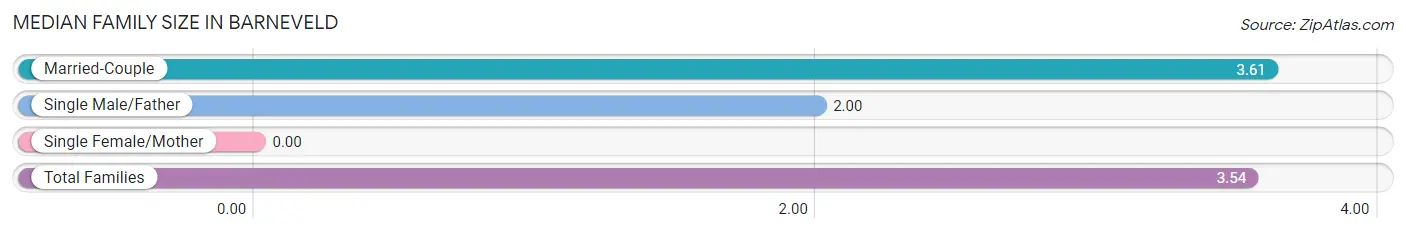
| Family Type | # Families | Family Size |
| Married-Couple | 46 (95.8%) | 3.61 |
| Single Male/Father | 2 (4.2%) | 2.00 |
| Single Female/Mother | 0 (0.0%) | - |
| Total Families | 48 (100.0%) | 3.54 |
Median Household Size in Barneveld
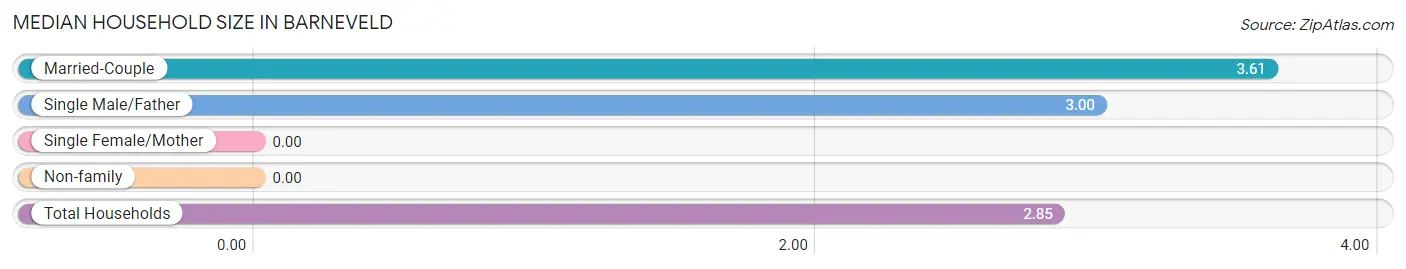
| Household Type | # Households | Household Size |
| Married-Couple | 46 (68.7%) | 3.61 |
| Single Male/Father | 2 (3.0%) | 3.00 |
| Single Female/Mother | 0 (0.0%) | - |
| Non-family | 19 (28.4%) | - |
| Total Households | 67 (100.0%) | 2.85 |
Household Size by Marriage Status in Barneveld
Out of a total of 67 households in Barneveld, 48 (71.6%) are family households, while 19 (28.4%) are nonfamily households. The most numerous type of family households are 4-person households, comprising 42, and the most common type of nonfamily households are 1-person households, comprising 19.
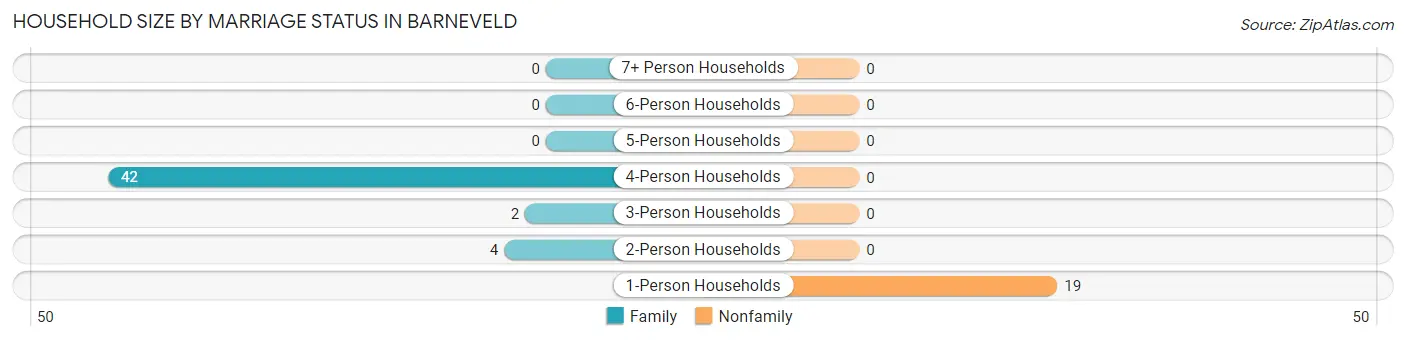
| Household Size | Family Households | Nonfamily Households |
| 1-Person Households | - | 19 (28.4%) |
| 2-Person Households | 4 (6.0%) | 0 (0.0%) |
| 3-Person Households | 2 (3.0%) | 0 (0.0%) |
| 4-Person Households | 42 (62.7%) | 0 (0.0%) |
| 5-Person Households | 0 (0.0%) | 0 (0.0%) |
| 6-Person Households | 0 (0.0%) | 0 (0.0%) |
| 7+ Person Households | 0 (0.0%) | 0 (0.0%) |
| Total | 48 (71.6%) | 19 (28.4%) |
Female Fertility in Barneveld
Fertility by Age in Barneveld
| Age Bracket | Women with Births | Births / 1,000 Women |
| 15 to 19 years | 0 (0.0%) | 0.0 |
| 20 to 34 years | 0 (0.0%) | 0.0 |
| 35 to 50 years | 0 (0.0%) | 0.0 |
| Total | 0 (0.0%) | 0.0 |
Fertility by Age by Marriage Status in Barneveld
| Age Bracket | Married | Unmarried |
| 15 to 19 years | 0 (0.0%) | 0 (0.0%) |
| 20 to 34 years | 0 (0.0%) | 0 (0.0%) |
| 35 to 50 years | 0 (0.0%) | 0 (0.0%) |
| Total | 0 (0.0%) | 0 (0.0%) |
Fertility by Education in Barneveld
| Educational Attainment | Women with Births | Births / 1,000 Women |
| Less than High School | 0 (0.0%) | 0.0 |
| High School Diploma | 0 (0.0%) | 0.0 |
| College or Associate's Degree | 0 (0.0%) | 0.0 |
| Bachelor's Degree | 0 (0.0%) | 0.0 |
| Graduate Degree | 0 (0.0%) | 0.0 |
| Total | 0 (0.0%) | 0.0 |
Fertility by Education by Marriage Status in Barneveld
| Educational Attainment | Married | Unmarried |
| Less than High School | 0 (0.0%) | 0 (0.0%) |
| High School Diploma | 0 (0.0%) | 0 (0.0%) |
| College or Associate's Degree | 0 (0.0%) | 0 (0.0%) |
| Bachelor's Degree | 0 (0.0%) | 0 (0.0%) |
| Graduate Degree | 0 (0.0%) | 0 (0.0%) |
| Total | 0 (0.0%) | 0 (0.0%) |
Employment Characteristics in Barneveld
Employment by Class of Employer in Barneveld
Among the 60 employed individuals in Barneveld, private company employees (58 | 96.7%), local government employees (1 | 1.7%), and federal government employees (1 | 1.7%) make up the most common classes of employment.
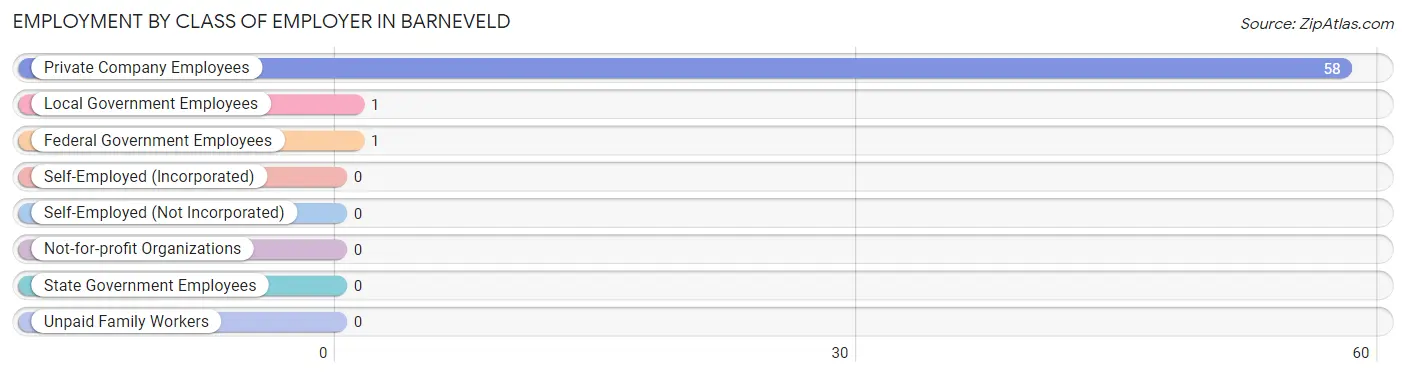
| Employer Class | # Employees | % Employees |
| Private Company Employees | 58 | 96.7% |
| Self-Employed (Incorporated) | 0 | 0.0% |
| Self-Employed (Not Incorporated) | 0 | 0.0% |
| Not-for-profit Organizations | 0 | 0.0% |
| Local Government Employees | 1 | 1.7% |
| State Government Employees | 0 | 0.0% |
| Federal Government Employees | 1 | 1.7% |
| Unpaid Family Workers | 0 | 0.0% |
| Total | 60 | 100.0% |
Employment Status by Age in Barneveld
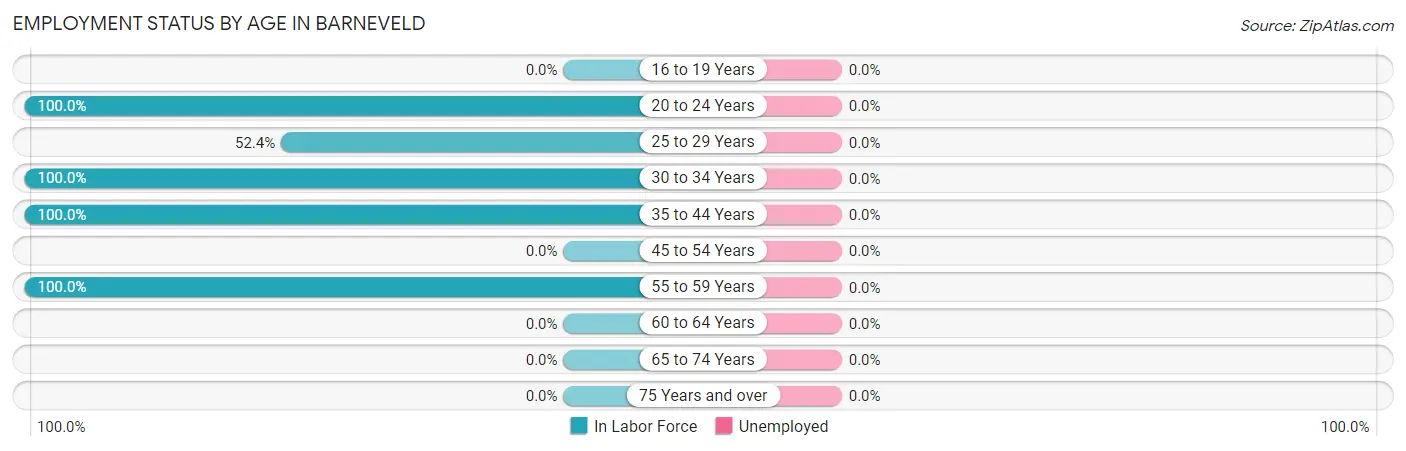
| Age Bracket | In Labor Force | Unemployed |
| 16 to 19 Years | 0 (0.0%) | 0 (0.0%) |
| 20 to 24 Years | 2 (100.0%) | 0 (0.0%) |
| 25 to 29 Years | 33 (52.4%) | 0 (0.0%) |
| 30 to 34 Years | 12 (100.0%) | 0 (0.0%) |
| 35 to 44 Years | 11 (100.0%) | 0 (0.0%) |
| 45 to 54 Years | 0 (0.0%) | 0 (0.0%) |
| 55 to 59 Years | 2 (100.0%) | 0 (0.0%) |
| 60 to 64 Years | 0 (0.0%) | 0 (0.0%) |
| 65 to 74 Years | 0 (0.0%) | 0 (0.0%) |
| 75 Years and over | 0 (0.0%) | 0 (0.0%) |
| Total | 60 (50.0%) | 0 (0.0%) |
Employment Status by Educational Attainment in Barneveld
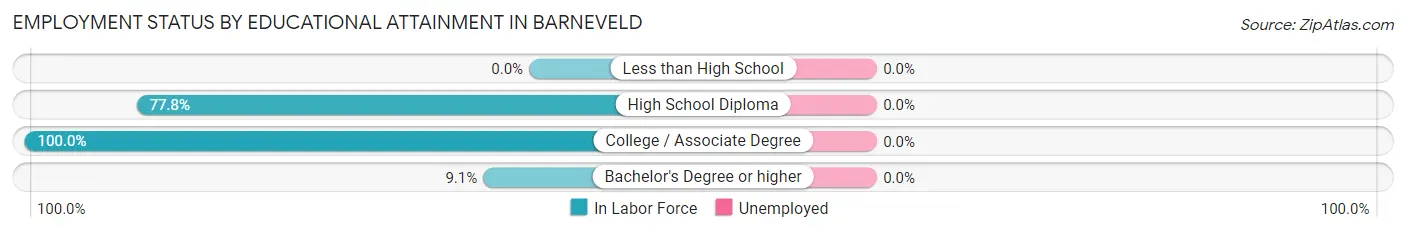
| Educational Attainment | In Labor Force | Unemployed |
| Less than High School | 0 (0.0%) | 0 (0.0%) |
| High School Diploma | 42 (77.8%) | 0 (0.0%) |
| College / Associate Degree | 13 (100.0%) | 0 (0.0%) |
| Bachelor's Degree or higher | 3 (9.1%) | 0 (0.0%) |
| Total | 58 (58.0%) | 0 (0.0%) |
Employment Occupations by Sex in Barneveld
Management, Business, Science and Arts Occupations
The most common Management, Business, Science and Arts occupations in Barneveld are Health Diagnosing & Treating (11 | 18.6%), Business & Financial (1 | 1.7%), Computers, Engineering & Science (1 | 1.7%), and Computers & Mathematics (1 | 1.7%).
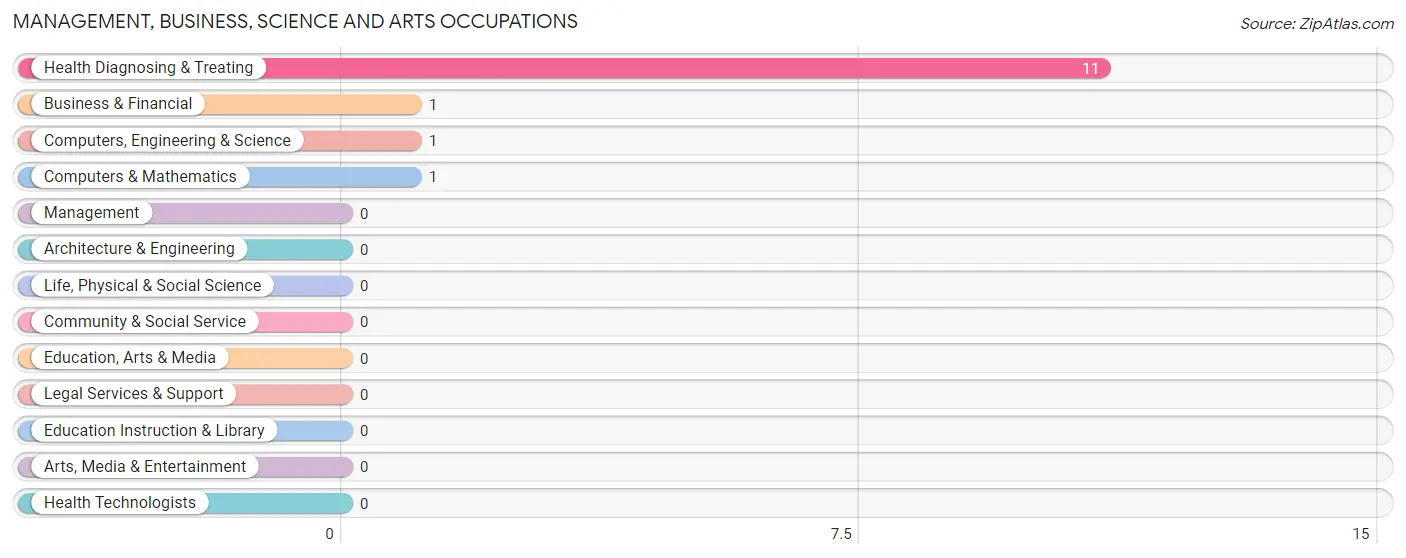
Management, Business, Science and Arts Occupations by Sex
Within the Management, Business, Science and Arts occupations in Barneveld, the most male-oriented occupations are Computers, Engineering & Science (100.0%), and Computers & Mathematics (100.0%), while the most female-oriented occupations are Business & Financial (100.0%), and Health Diagnosing & Treating (100.0%).
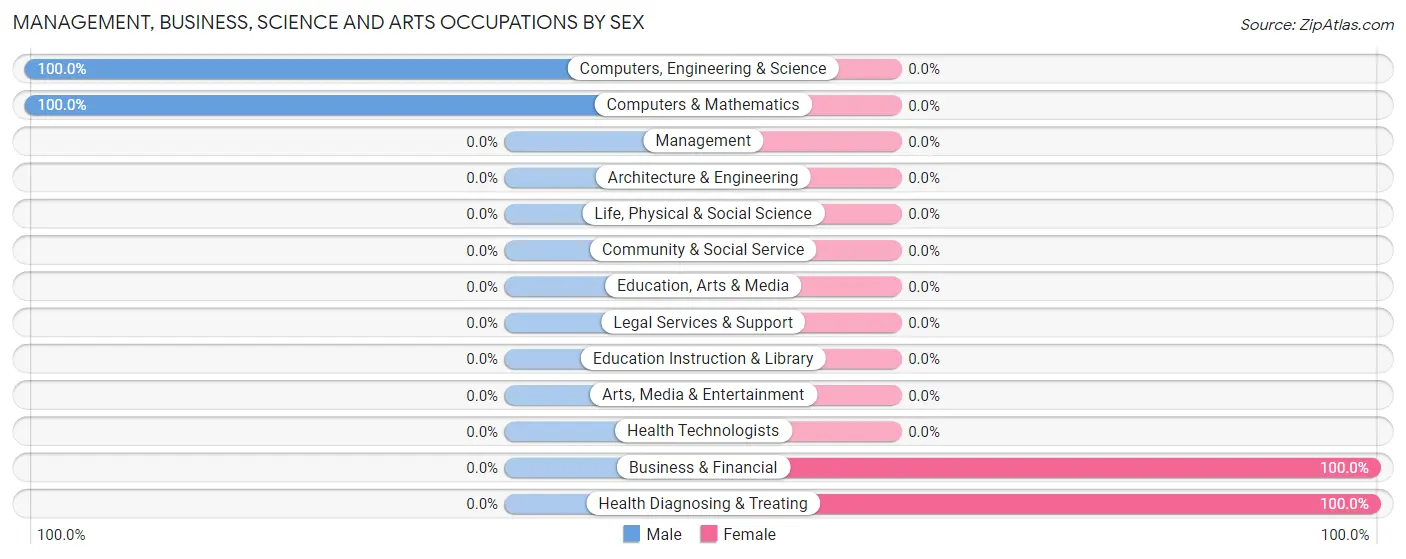
| Occupation | Male | Female |
| Management | 0 (0.0%) | 0 (0.0%) |
| Business & Financial | 0 (0.0%) | 1 (100.0%) |
| Computers, Engineering & Science | 1 (100.0%) | 0 (0.0%) |
| Computers & Mathematics | 1 (100.0%) | 0 (0.0%) |
| Architecture & Engineering | 0 (0.0%) | 0 (0.0%) |
| Life, Physical & Social Science | 0 (0.0%) | 0 (0.0%) |
| Community & Social Service | 0 (0.0%) | 0 (0.0%) |
| Education, Arts & Media | 0 (0.0%) | 0 (0.0%) |
| Legal Services & Support | 0 (0.0%) | 0 (0.0%) |
| Education Instruction & Library | 0 (0.0%) | 0 (0.0%) |
| Arts, Media & Entertainment | 0 (0.0%) | 0 (0.0%) |
| Health Diagnosing & Treating | 0 (0.0%) | 11 (100.0%) |
| Health Technologists | 0 (0.0%) | 0 (0.0%) |
| Total (Category) | 1 (7.7%) | 12 (92.3%) |
| Total (Overall) | 35 (59.3%) | 24 (40.7%) |
Services Occupations
The most common Services occupations in Barneveld are , and Food Preparation & Serving (4 | 6.8%).
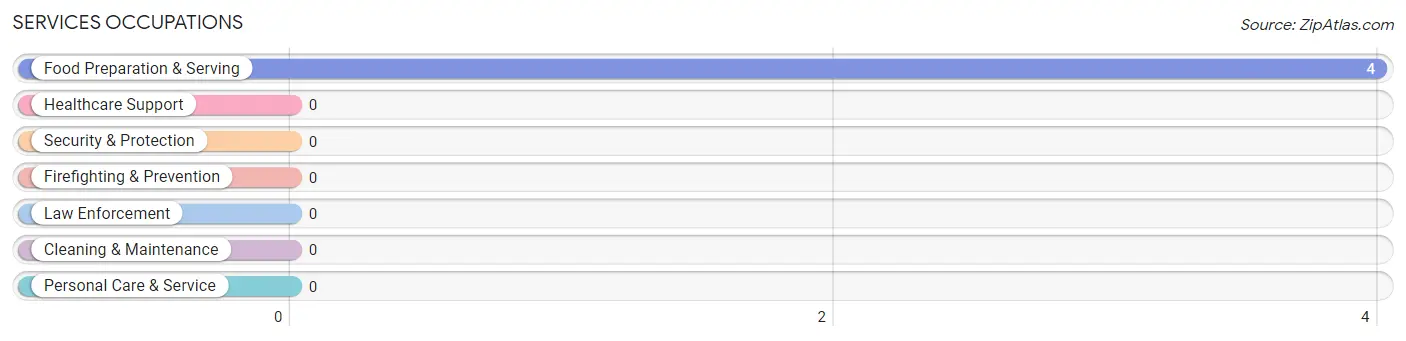
Services Occupations by Sex
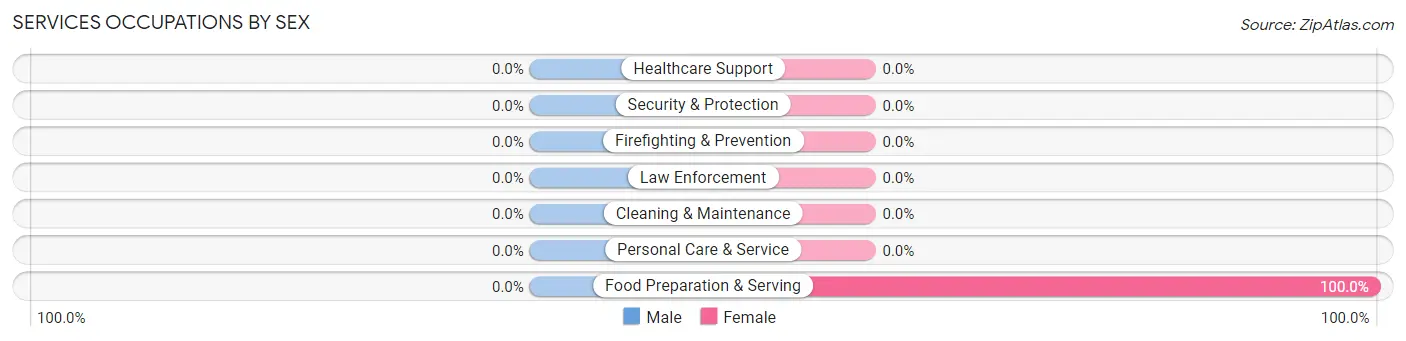
| Occupation | Male | Female |
| Healthcare Support | 0 (0.0%) | 0 (0.0%) |
| Security & Protection | 0 (0.0%) | 0 (0.0%) |
| Firefighting & Prevention | 0 (0.0%) | 0 (0.0%) |
| Law Enforcement | 0 (0.0%) | 0 (0.0%) |
| Food Preparation & Serving | 0 (0.0%) | 4 (100.0%) |
| Cleaning & Maintenance | 0 (0.0%) | 0 (0.0%) |
| Personal Care & Service | 0 (0.0%) | 0 (0.0%) |
| Total (Category) | 0 (0.0%) | 4 (100.0%) |
| Total (Overall) | 35 (59.3%) | 24 (40.7%) |
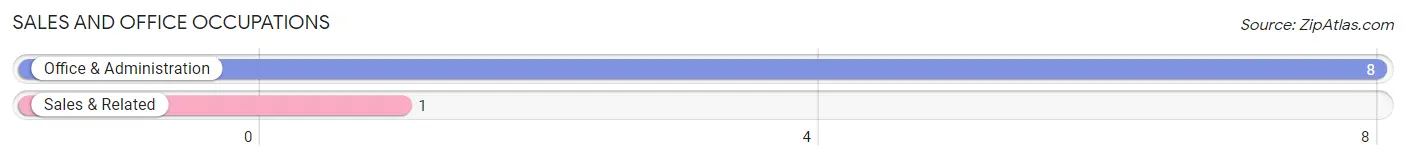
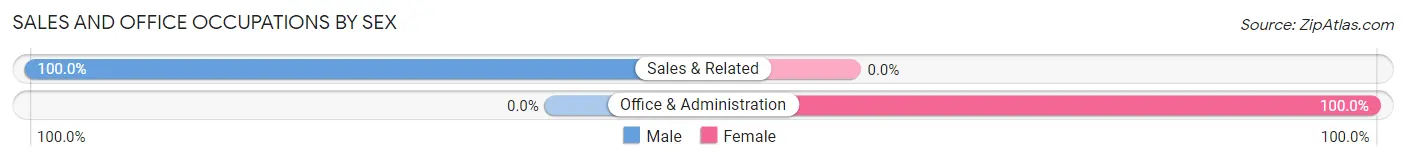
Sales and Office Occupations
The most common Sales and Office occupations in Barneveld are Office & Administration (8 | 13.6%), and Sales & Related (1 | 1.7%).
Sales and Office Occupations by Sex
| Occupation | Male | Female |
| Sales & Related | 1 (100.0%) | 0 (0.0%) |
| Office & Administration | 0 (0.0%) | 8 (100.0%) |
| Total (Category) | 1 (11.1%) | 8 (88.9%) |
| Total (Overall) | 35 (59.3%) | 24 (40.7%) |
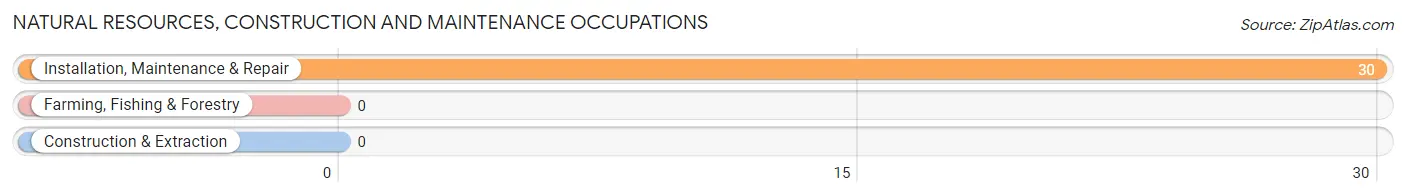
Natural Resources, Construction and Maintenance Occupations
The most common Natural Resources, Construction and Maintenance occupations in Barneveld are , and Installation, Maintenance & Repair (30 | 50.8%).
Natural Resources, Construction and Maintenance Occupations by Sex
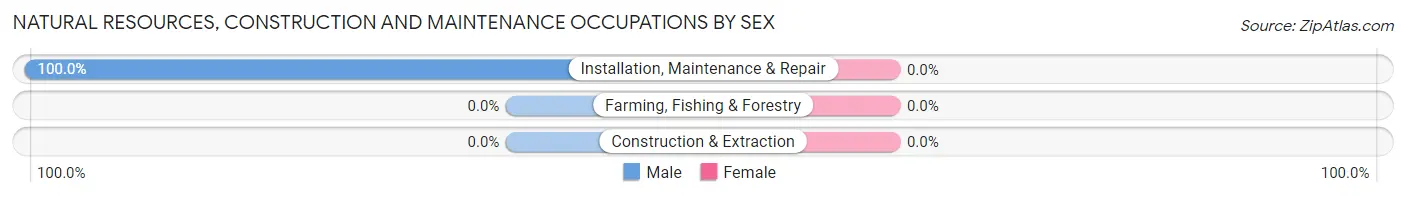
| Occupation | Male | Female |
| Farming, Fishing & Forestry | 0 (0.0%) | 0 (0.0%) |
| Construction & Extraction | 0 (0.0%) | 0 (0.0%) |
| Installation, Maintenance & Repair | 30 (100.0%) | 0 (0.0%) |
| Total (Category) | 30 (100.0%) | 0 (0.0%) |
| Total (Overall) | 35 (59.3%) | 24 (40.7%) |
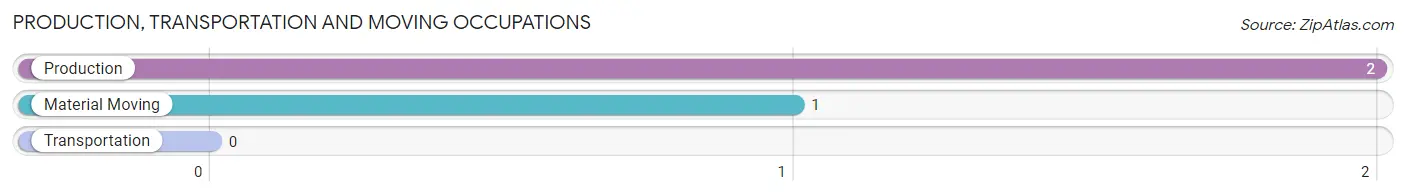
Production, Transportation and Moving Occupations
The most common Production, Transportation and Moving occupations in Barneveld are Production (2 | 3.4%), and Material Moving (1 | 1.7%).
Production, Transportation and Moving Occupations by Sex
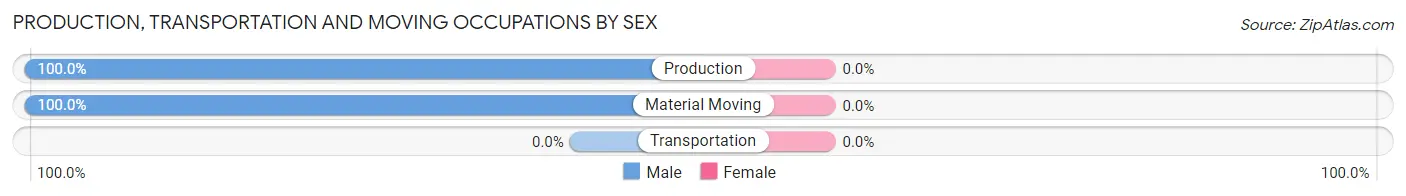
| Occupation | Male | Female |
| Production | 2 (100.0%) | 0 (0.0%) |
| Transportation | 0 (0.0%) | 0 (0.0%) |
| Material Moving | 1 (100.0%) | 0 (0.0%) |
| Total (Category) | 3 (100.0%) | 0 (0.0%) |
| Total (Overall) | 35 (59.3%) | 24 (40.7%) |
Employment Industries by Sex in Barneveld
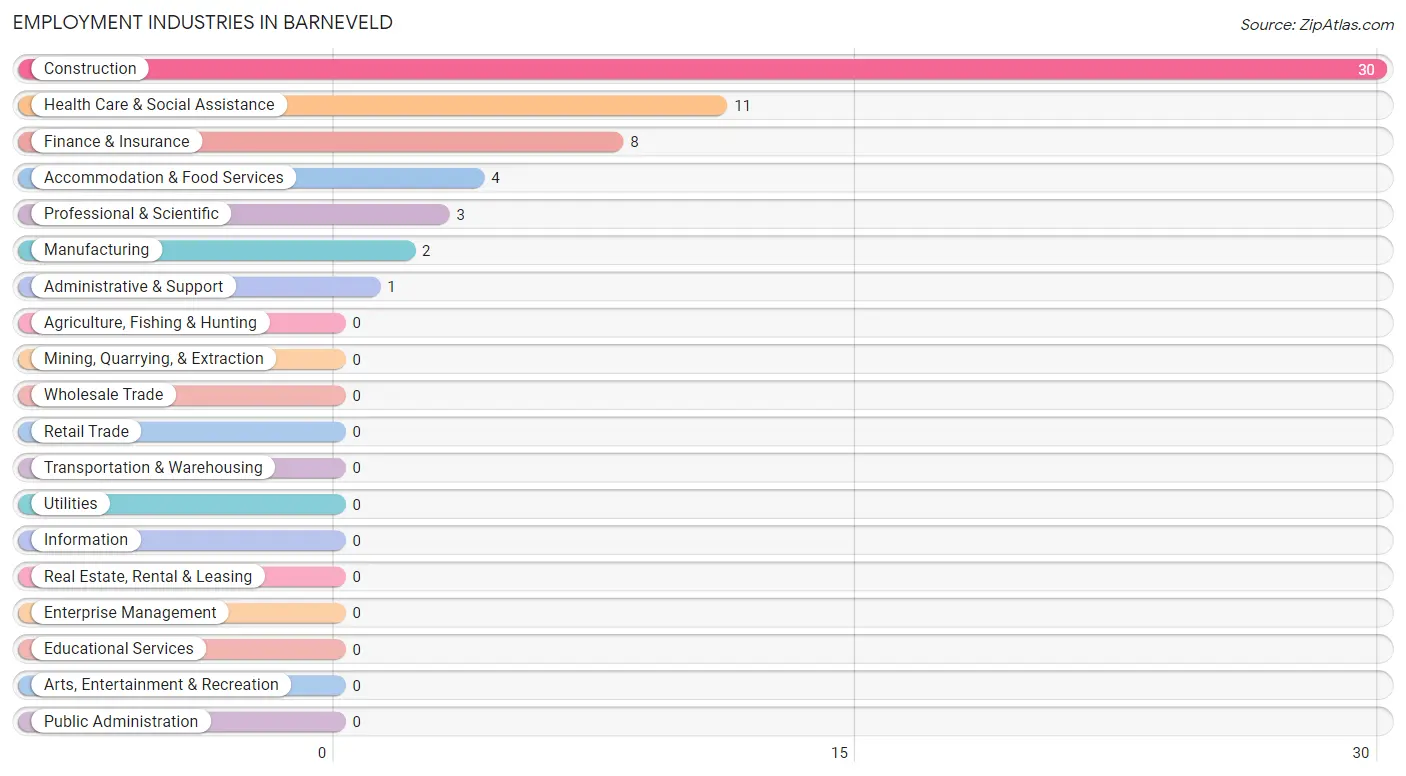
Employment Industries in Barneveld
The major employment industries in Barneveld include Construction (30 | 50.8%), Health Care & Social Assistance (11 | 18.6%), Finance & Insurance (8 | 13.6%), Accommodation & Food Services (4 | 6.8%), and Professional & Scientific (3 | 5.1%).
Employment Industries by Sex in Barneveld
The Barneveld industries that see more men than women are Construction (100.0%), Manufacturing (100.0%), and Administrative & Support (100.0%), whereas the industries that tend to have a higher number of women are Finance & Insurance (100.0%), Health Care & Social Assistance (100.0%), and Accommodation & Food Services (100.0%).
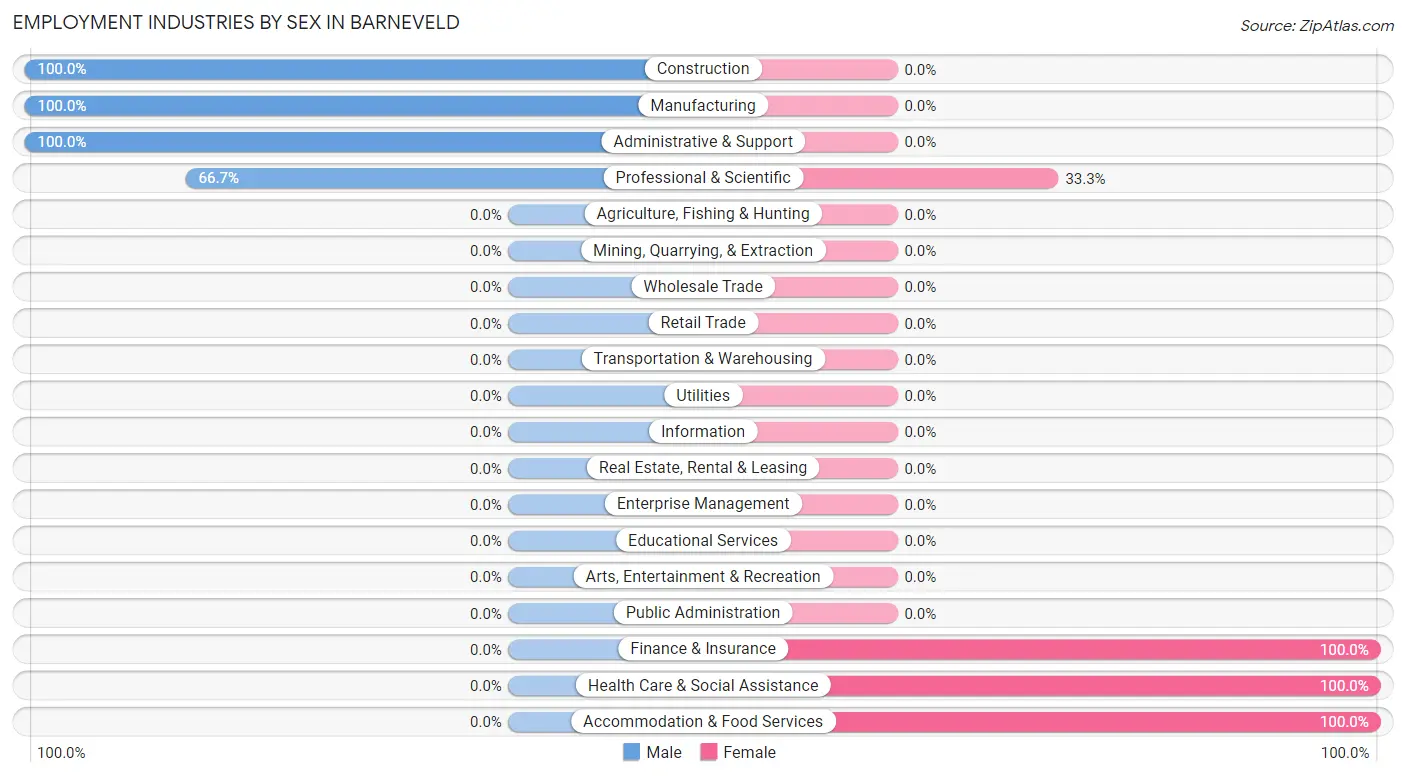
| Industry | Male | Female |
| Agriculture, Fishing & Hunting | 0 (0.0%) | 0 (0.0%) |
| Mining, Quarrying, & Extraction | 0 (0.0%) | 0 (0.0%) |
| Construction | 30 (100.0%) | 0 (0.0%) |
| Manufacturing | 2 (100.0%) | 0 (0.0%) |
| Wholesale Trade | 0 (0.0%) | 0 (0.0%) |
| Retail Trade | 0 (0.0%) | 0 (0.0%) |
| Transportation & Warehousing | 0 (0.0%) | 0 (0.0%) |
| Utilities | 0 (0.0%) | 0 (0.0%) |
| Information | 0 (0.0%) | 0 (0.0%) |
| Finance & Insurance | 0 (0.0%) | 8 (100.0%) |
| Real Estate, Rental & Leasing | 0 (0.0%) | 0 (0.0%) |
| Professional & Scientific | 2 (66.7%) | 1 (33.3%) |
| Enterprise Management | 0 (0.0%) | 0 (0.0%) |
| Administrative & Support | 1 (100.0%) | 0 (0.0%) |
| Educational Services | 0 (0.0%) | 0 (0.0%) |
| Health Care & Social Assistance | 0 (0.0%) | 11 (100.0%) |
| Arts, Entertainment & Recreation | 0 (0.0%) | 0 (0.0%) |
| Accommodation & Food Services | 0 (0.0%) | 4 (100.0%) |
| Public Administration | 0 (0.0%) | 0 (0.0%) |
| Total | 35 (59.3%) | 24 (40.7%) |
Education in Barneveld
School Enrollment in Barneveld
The most common levels of schooling among the 21 students in Barneveld are high school (9 | 42.9%), middle school (8 | 38.1%), and kindergarten (2 | 9.5%).
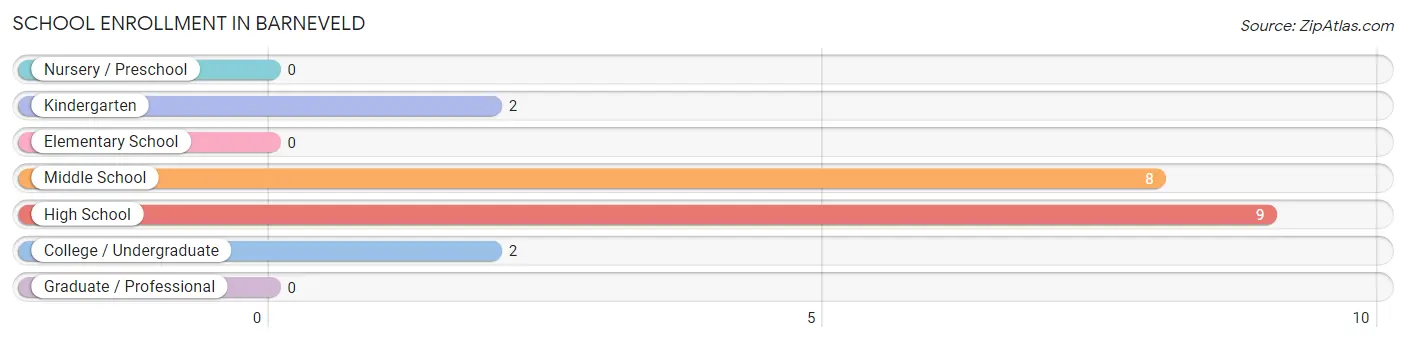
| School Level | # Students | % Students |
| Nursery / Preschool | 0 | 0.0% |
| Kindergarten | 2 | 9.5% |
| Elementary School | 0 | 0.0% |
| Middle School | 8 | 38.1% |
| High School | 9 | 42.9% |
| College / Undergraduate | 2 | 9.5% |
| Graduate / Professional | 0 | 0.0% |
| Total | 21 | 100.0% |
School Enrollment by Age by Funding Source in Barneveld
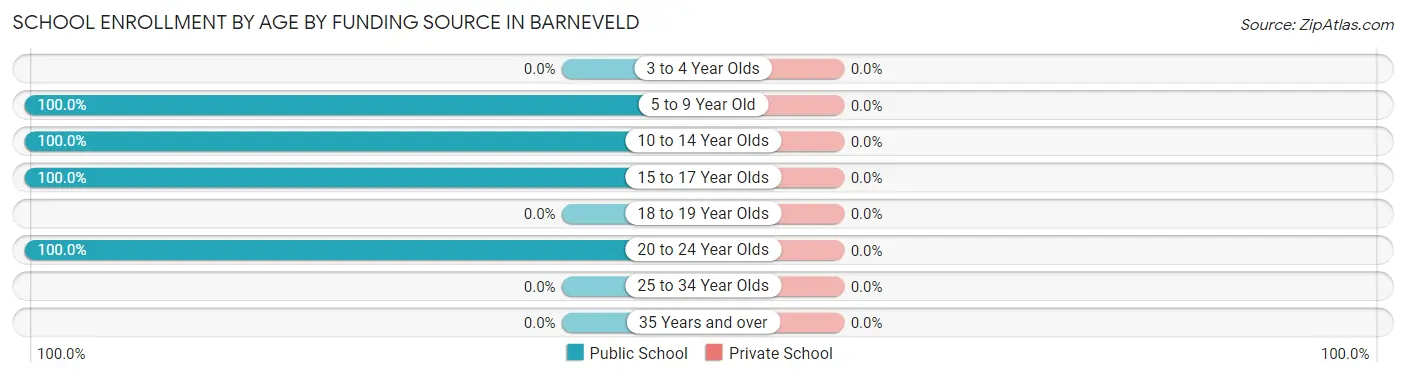
| Age Bracket | Public School | Private School |
| 3 to 4 Year Olds | 0 (0.0%) | 0 (0.0%) |
| 5 to 9 Year Old | 2 (100.0%) | 0 (0.0%) |
| 10 to 14 Year Olds | 8 (100.0%) | 0 (0.0%) |
| 15 to 17 Year Olds | 9 (100.0%) | 0 (0.0%) |
| 18 to 19 Year Olds | 0 (0.0%) | 0 (0.0%) |
| 20 to 24 Year Olds | 2 (100.0%) | 0 (0.0%) |
| 25 to 34 Year Olds | 0 (0.0%) | 0 (0.0%) |
| 35 Years and over | 0 (0.0%) | 0 (0.0%) |
| Total | 21 (100.0%) | 0 (0.0%) |
Educational Attainment by Field of Study in Barneveld
Education (30 | 65.2%), literature & languages (11 | 23.9%), science & technology (2 | 4.3%), computers & mathematics (1 | 2.2%), and social sciences (1 | 2.2%) are the most common fields of study among 46 individuals in Barneveld who have obtained a bachelor's degree or higher.
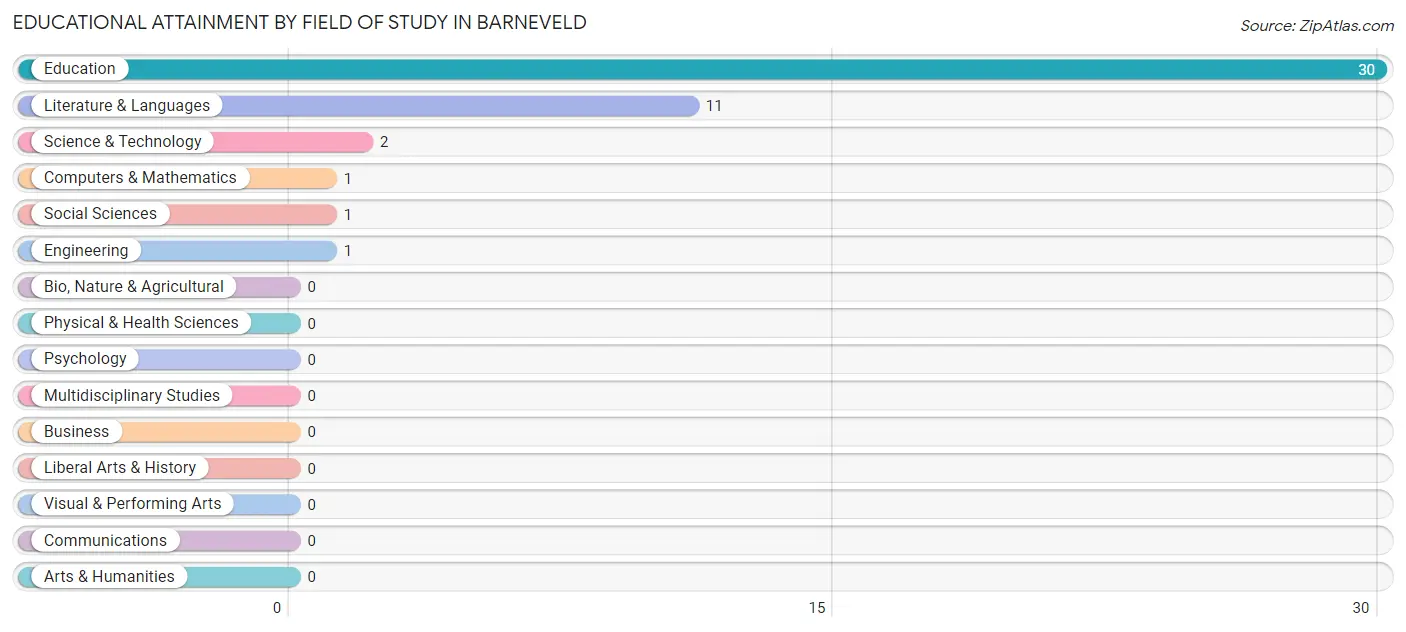
| Field of Study | # Graduates | % Graduates |
| Computers & Mathematics | 1 | 2.2% |
| Bio, Nature & Agricultural | 0 | 0.0% |
| Physical & Health Sciences | 0 | 0.0% |
| Psychology | 0 | 0.0% |
| Social Sciences | 1 | 2.2% |
| Engineering | 1 | 2.2% |
| Multidisciplinary Studies | 0 | 0.0% |
| Science & Technology | 2 | 4.3% |
| Business | 0 | 0.0% |
| Education | 30 | 65.2% |
| Literature & Languages | 11 | 23.9% |
| Liberal Arts & History | 0 | 0.0% |
| Visual & Performing Arts | 0 | 0.0% |
| Communications | 0 | 0.0% |
| Arts & Humanities | 0 | 0.0% |
| Total | 46 | 100.0% |
Transportation & Commute in Barneveld
Vehicle Availability by Sex in Barneveld
The most prevalent vehicle ownership categories in Barneveld are males with 1 vehicle (30, accounting for 83.3%) and females with 1 vehicle (19, making up 125.0%).
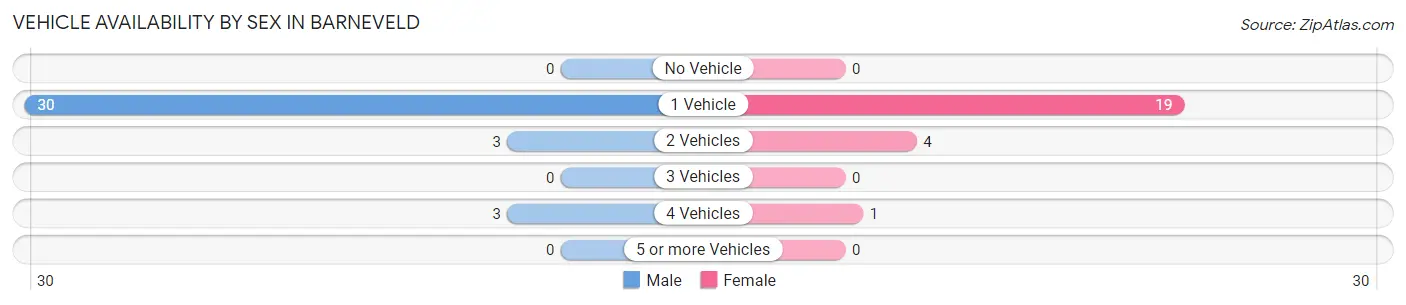
| Vehicles Available | Male | Female |
| No Vehicle | 0 (0.0%) | 0 (0.0%) |
| 1 Vehicle | 30 (83.3%) | 19 (79.2%) |
| 2 Vehicles | 3 (8.3%) | 4 (16.7%) |
| 3 Vehicles | 0 (0.0%) | 0 (0.0%) |
| 4 Vehicles | 3 (8.3%) | 1 (4.2%) |
| 5 or more Vehicles | 0 (0.0%) | 0 (0.0%) |
| Total | 36 (100.0%) | 24 (100.0%) |
Commute Time in Barneveld
The most frequently occuring commute durations in Barneveld are 15 to 19 minutes (30 commuters, 50.0%), 20 to 24 minutes (16 commuters, 26.7%), and 25 to 29 minutes (10 commuters, 16.7%).
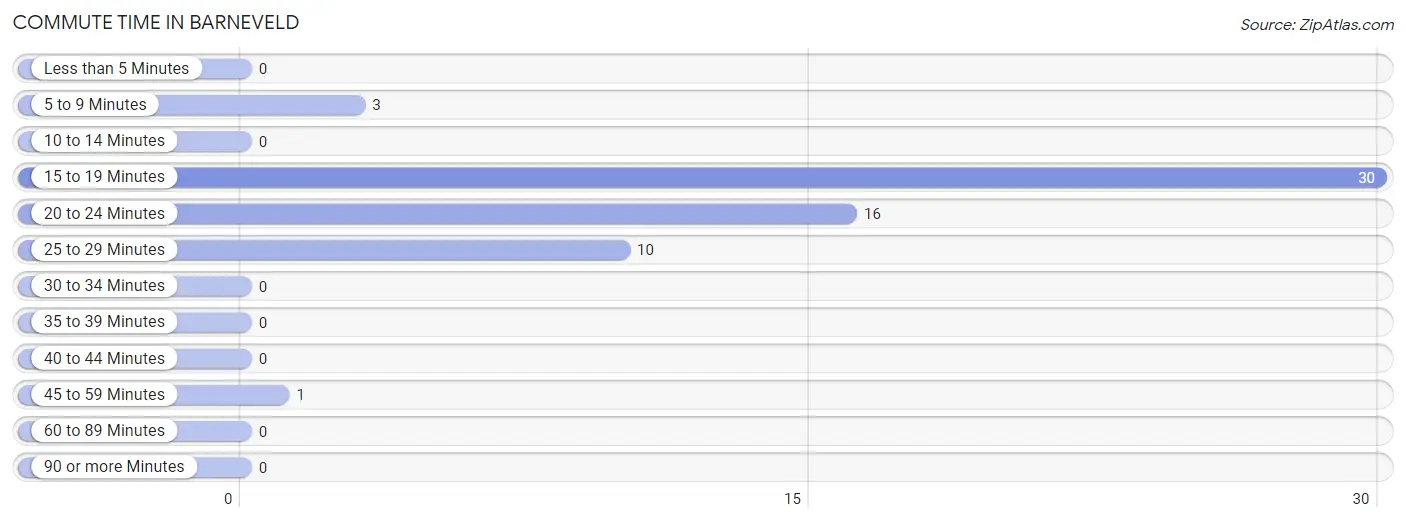
| Commute Time | # Commuters | % Commuters |
| Less than 5 Minutes | 0 | 0.0% |
| 5 to 9 Minutes | 3 | 5.0% |
| 10 to 14 Minutes | 0 | 0.0% |
| 15 to 19 Minutes | 30 | 50.0% |
| 20 to 24 Minutes | 16 | 26.7% |
| 25 to 29 Minutes | 10 | 16.7% |
| 30 to 34 Minutes | 0 | 0.0% |
| 35 to 39 Minutes | 0 | 0.0% |
| 40 to 44 Minutes | 0 | 0.0% |
| 45 to 59 Minutes | 1 | 1.7% |
| 60 to 89 Minutes | 0 | 0.0% |
| 90 or more Minutes | 0 | 0.0% |
Commute Time by Sex in Barneveld
The most common commute times in Barneveld are 15 to 19 minutes (30 commuters, 83.3%) for males and 20 to 24 minutes (14 commuters, 58.3%) for females.
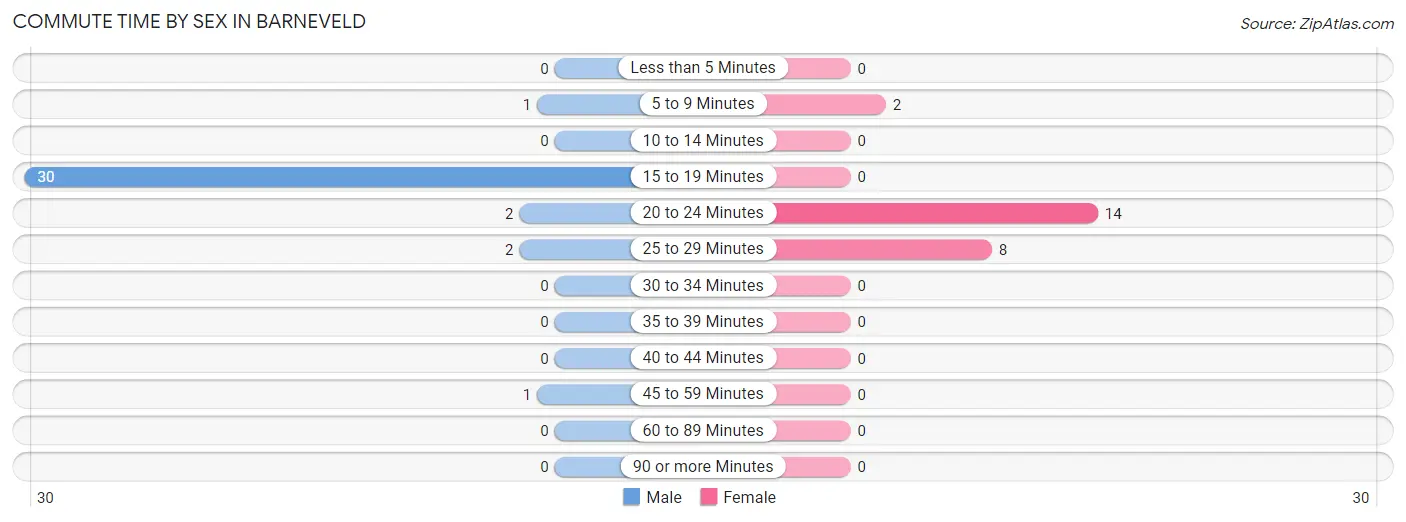
| Commute Time | Male | Female |
| Less than 5 Minutes | 0 (0.0%) | 0 (0.0%) |
| 5 to 9 Minutes | 1 (2.8%) | 2 (8.3%) |
| 10 to 14 Minutes | 0 (0.0%) | 0 (0.0%) |
| 15 to 19 Minutes | 30 (83.3%) | 0 (0.0%) |
| 20 to 24 Minutes | 2 (5.6%) | 14 (58.3%) |
| 25 to 29 Minutes | 2 (5.6%) | 8 (33.3%) |
| 30 to 34 Minutes | 0 (0.0%) | 0 (0.0%) |
| 35 to 39 Minutes | 0 (0.0%) | 0 (0.0%) |
| 40 to 44 Minutes | 0 (0.0%) | 0 (0.0%) |
| 45 to 59 Minutes | 1 (2.8%) | 0 (0.0%) |
| 60 to 89 Minutes | 0 (0.0%) | 0 (0.0%) |
| 90 or more Minutes | 0 (0.0%) | 0 (0.0%) |
Time of Departure to Work by Sex in Barneveld
The most frequent times of departure to work in Barneveld are 7:30 AM to 7:59 AM (30, 83.3%) for males and 8:00 AM to 8:29 AM (12, 50.0%) for females.
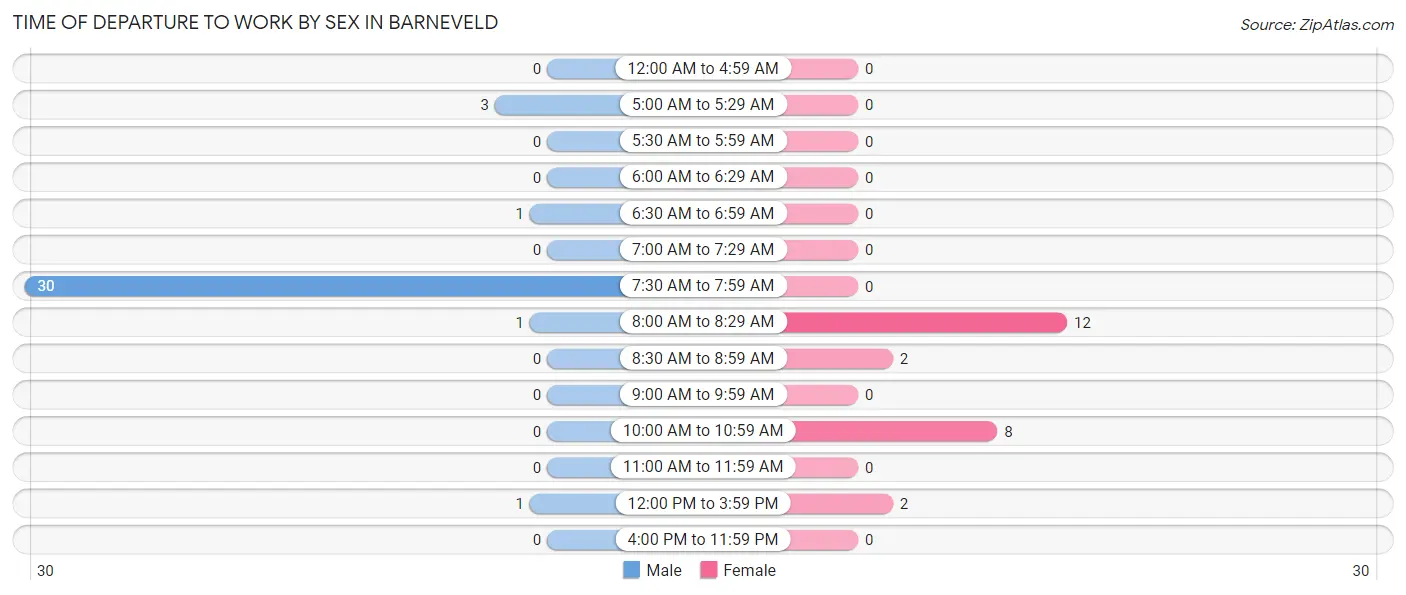
| Time of Departure | Male | Female |
| 12:00 AM to 4:59 AM | 0 (0.0%) | 0 (0.0%) |
| 5:00 AM to 5:29 AM | 3 (8.3%) | 0 (0.0%) |
| 5:30 AM to 5:59 AM | 0 (0.0%) | 0 (0.0%) |
| 6:00 AM to 6:29 AM | 0 (0.0%) | 0 (0.0%) |
| 6:30 AM to 6:59 AM | 1 (2.8%) | 0 (0.0%) |
| 7:00 AM to 7:29 AM | 0 (0.0%) | 0 (0.0%) |
| 7:30 AM to 7:59 AM | 30 (83.3%) | 0 (0.0%) |
| 8:00 AM to 8:29 AM | 1 (2.8%) | 12 (50.0%) |
| 8:30 AM to 8:59 AM | 0 (0.0%) | 2 (8.3%) |
| 9:00 AM to 9:59 AM | 0 (0.0%) | 0 (0.0%) |
| 10:00 AM to 10:59 AM | 0 (0.0%) | 8 (33.3%) |
| 11:00 AM to 11:59 AM | 0 (0.0%) | 0 (0.0%) |
| 12:00 PM to 3:59 PM | 1 (2.8%) | 2 (8.3%) |
| 4:00 PM to 11:59 PM | 0 (0.0%) | 0 (0.0%) |
| Total | 36 (100.0%) | 24 (100.0%) |
Housing Occupancy in Barneveld
Occupancy by Ownership in Barneveld
Of the total 67 dwellings in Barneveld, owner-occupied units account for 59 (88.1%), while renter-occupied units make up 8 (11.9%).
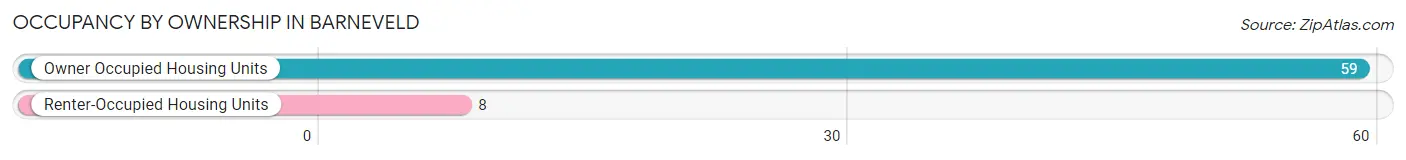
| Occupancy | # Housing Units | % Housing Units |
| Owner Occupied Housing Units | 59 | 88.1% |
| Renter-Occupied Housing Units | 8 | 11.9% |
| Total Occupied Housing Units | 67 | 100.0% |
Occupancy by Household Size in Barneveld
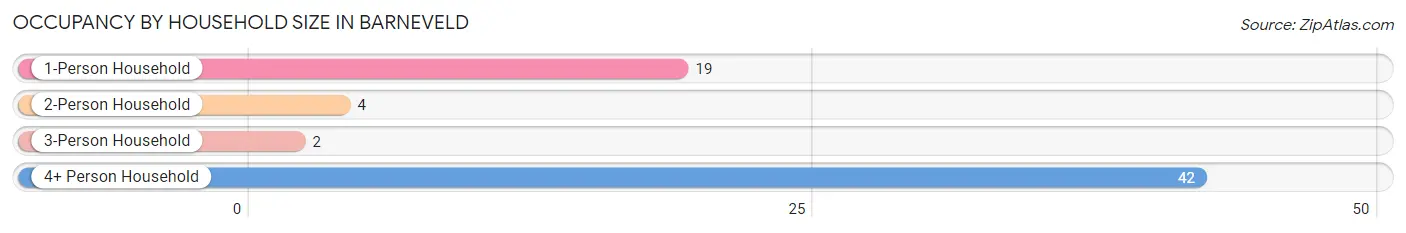
| Household Size | # Housing Units | % Housing Units |
| 1-Person Household | 19 | 28.4% |
| 2-Person Household | 4 | 6.0% |
| 3-Person Household | 2 | 3.0% |
| 4+ Person Household | 42 | 62.7% |
| Total Housing Units | 67 | 100.0% |
Occupancy by Ownership by Household Size in Barneveld
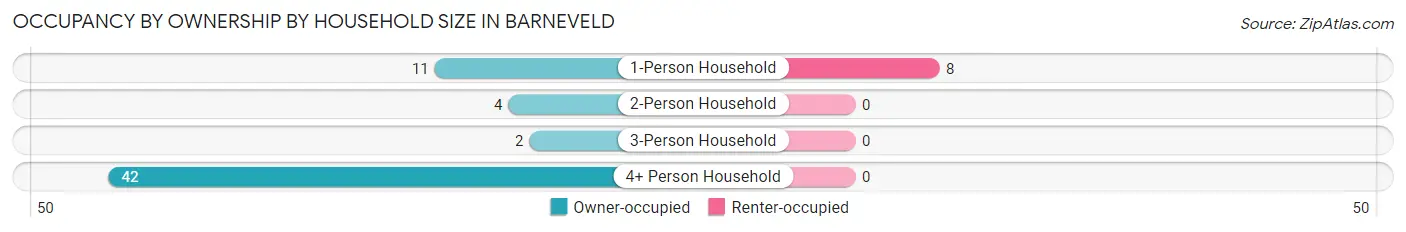
| Household Size | Owner-occupied | Renter-occupied |
| 1-Person Household | 11 (57.9%) | 8 (42.1%) |
| 2-Person Household | 4 (100.0%) | 0 (0.0%) |
| 3-Person Household | 2 (100.0%) | 0 (0.0%) |
| 4+ Person Household | 42 (100.0%) | 0 (0.0%) |
| Total Housing Units | 59 (88.1%) | 8 (11.9%) |
Occupancy by Educational Attainment in Barneveld
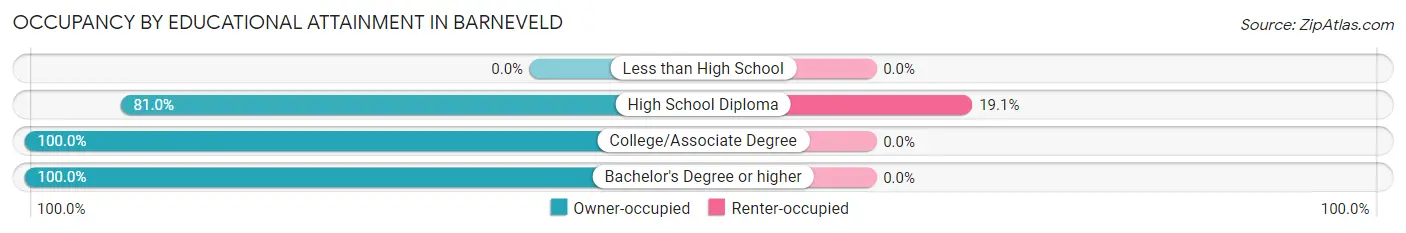
| Household Size | Owner-occupied | Renter-occupied |
| Less than High School | 0 (0.0%) | 0 (0.0%) |
| High School Diploma | 34 (80.9%) | 8 (19.1%) |
| College/Associate Degree | 12 (100.0%) | 0 (0.0%) |
| Bachelor's Degree or higher | 13 (100.0%) | 0 (0.0%) |
Occupancy by Age of Householder in Barneveld
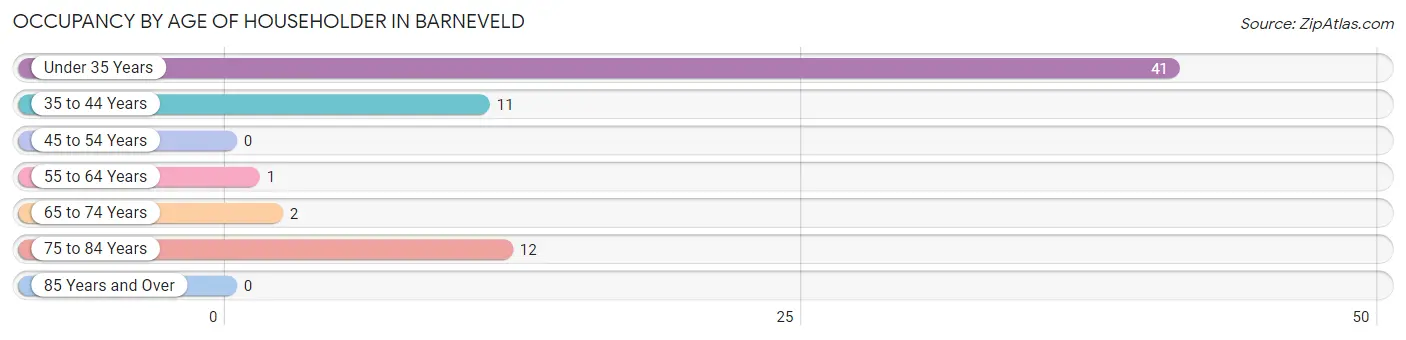
| Age Bracket | # Households | % Households |
| Under 35 Years | 41 | 61.2% |
| 35 to 44 Years | 11 | 16.4% |
| 45 to 54 Years | 0 | 0.0% |
| 55 to 64 Years | 1 | 1.5% |
| 65 to 74 Years | 2 | 3.0% |
| 75 to 84 Years | 12 | 17.9% |
| 85 Years and Over | 0 | 0.0% |
| Total | 67 | 100.0% |
Housing Finances in Barneveld
Median Income by Occupancy in Barneveld
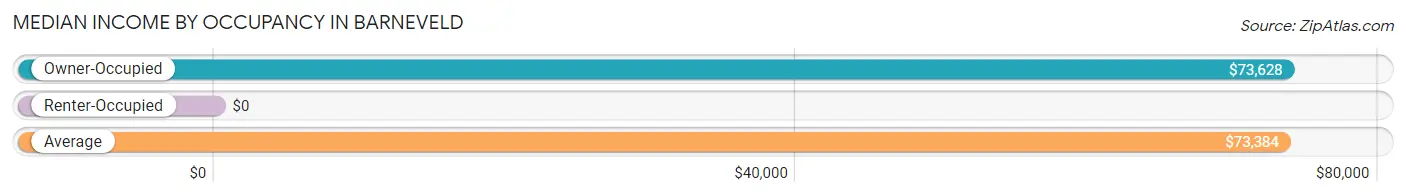
| Occupancy Type | # Households | Median Income |
| Owner-Occupied | 59 (88.1%) | $73,628 |
| Renter-Occupied | 8 (11.9%) | $0 |
| Average | 67 (100.0%) | $73,384 |
Occupancy by Householder Income Bracket in Barneveld
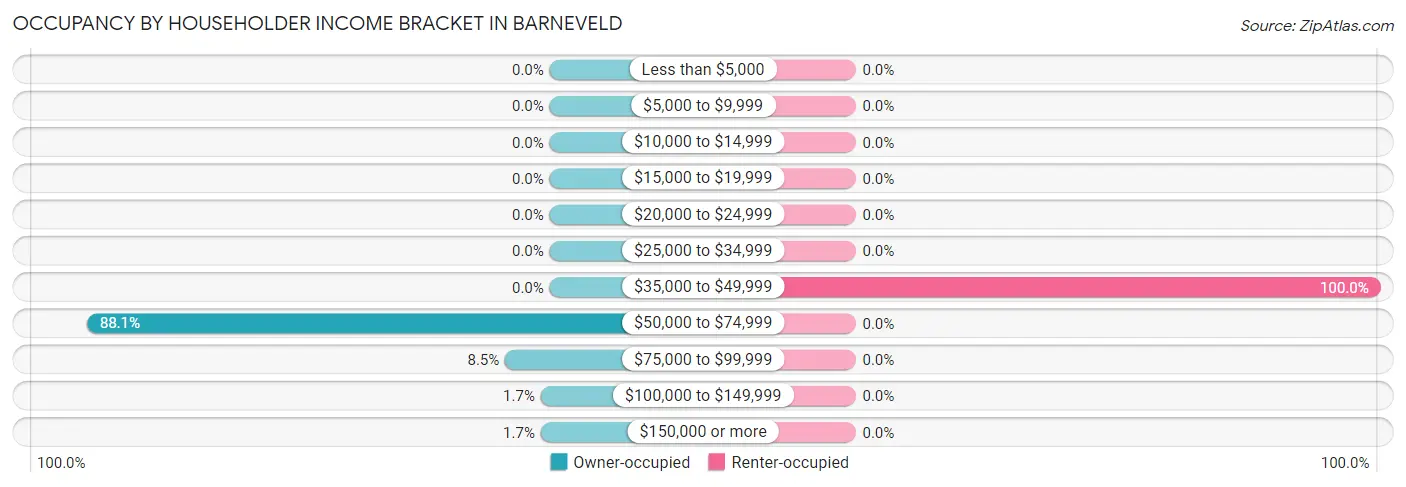
| Income Bracket | Owner-occupied | Renter-occupied |
| Less than $5,000 | 0 (0.0%) | 0 (0.0%) |
| $5,000 to $9,999 | 0 (0.0%) | 0 (0.0%) |
| $10,000 to $14,999 | 0 (0.0%) | 0 (0.0%) |
| $15,000 to $19,999 | 0 (0.0%) | 0 (0.0%) |
| $20,000 to $24,999 | 0 (0.0%) | 0 (0.0%) |
| $25,000 to $34,999 | 0 (0.0%) | 0 (0.0%) |
| $35,000 to $49,999 | 0 (0.0%) | 8 (100.0%) |
| $50,000 to $74,999 | 52 (88.1%) | 0 (0.0%) |
| $75,000 to $99,999 | 5 (8.5%) | 0 (0.0%) |
| $100,000 to $149,999 | 1 (1.7%) | 0 (0.0%) |
| $150,000 or more | 1 (1.7%) | 0 (0.0%) |
| Total | 59 (100.0%) | 8 (100.0%) |
Monthly Housing Cost Tiers in Barneveld
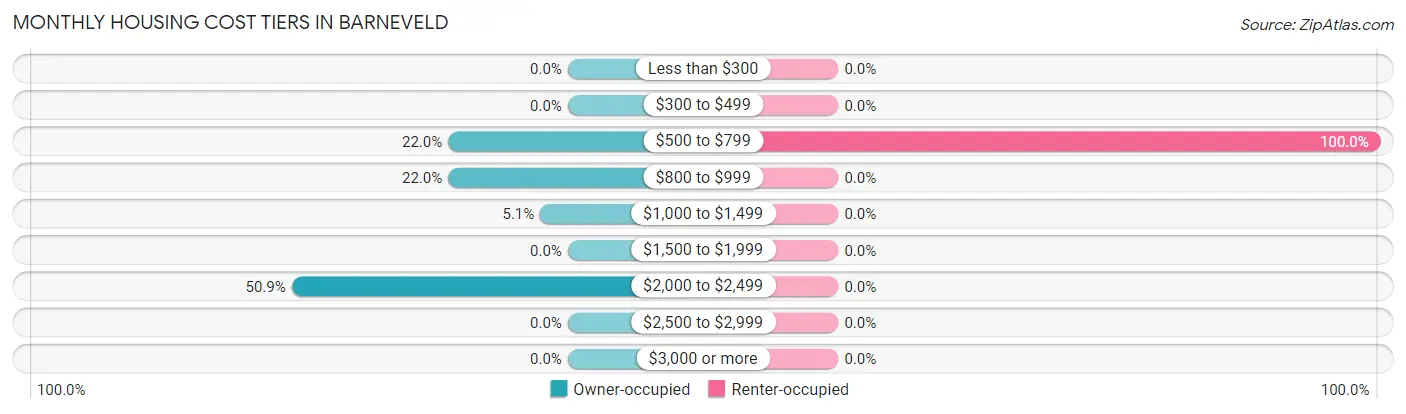
| Monthly Cost | Owner-occupied | Renter-occupied |
| Less than $300 | 0 (0.0%) | 0 (0.0%) |
| $300 to $499 | 0 (0.0%) | 0 (0.0%) |
| $500 to $799 | 13 (22.0%) | 8 (100.0%) |
| $800 to $999 | 13 (22.0%) | 0 (0.0%) |
| $1,000 to $1,499 | 3 (5.1%) | 0 (0.0%) |
| $1,500 to $1,999 | 0 (0.0%) | 0 (0.0%) |
| $2,000 to $2,499 | 30 (50.8%) | 0 (0.0%) |
| $2,500 to $2,999 | 0 (0.0%) | 0 (0.0%) |
| $3,000 or more | 0 (0.0%) | 0 (0.0%) |
| Total | 59 (100.0%) | 8 (100.0%) |
Physical Housing Characteristics in Barneveld
Housing Structures in Barneveld
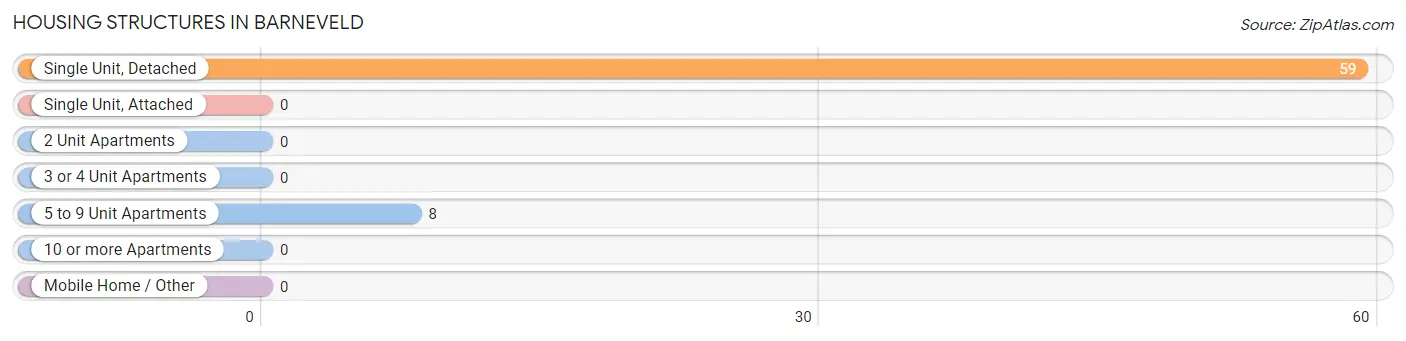
| Structure Type | # Housing Units | % Housing Units |
| Single Unit, Detached | 59 | 88.1% |
| Single Unit, Attached | 0 | 0.0% |
| 2 Unit Apartments | 0 | 0.0% |
| 3 or 4 Unit Apartments | 0 | 0.0% |
| 5 to 9 Unit Apartments | 8 | 11.9% |
| 10 or more Apartments | 0 | 0.0% |
| Mobile Home / Other | 0 | 0.0% |
| Total | 67 | 100.0% |
Housing Structures by Occupancy in Barneveld
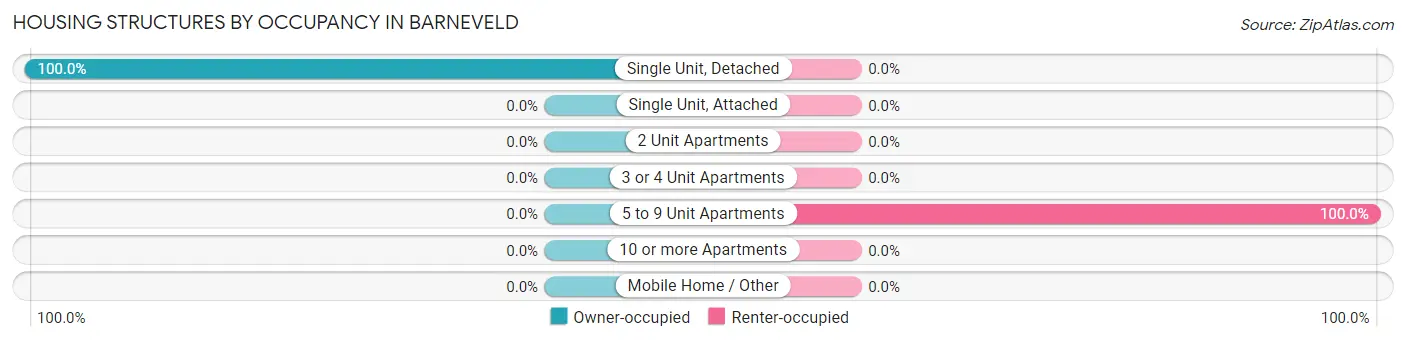
| Structure Type | Owner-occupied | Renter-occupied |
| Single Unit, Detached | 59 (100.0%) | 0 (0.0%) |
| Single Unit, Attached | 0 (0.0%) | 0 (0.0%) |
| 2 Unit Apartments | 0 (0.0%) | 0 (0.0%) |
| 3 or 4 Unit Apartments | 0 (0.0%) | 0 (0.0%) |
| 5 to 9 Unit Apartments | 0 (0.0%) | 8 (100.0%) |
| 10 or more Apartments | 0 (0.0%) | 0 (0.0%) |
| Mobile Home / Other | 0 (0.0%) | 0 (0.0%) |
| Total | 59 (88.1%) | 8 (11.9%) |
Housing Structures by Number of Rooms in Barneveld
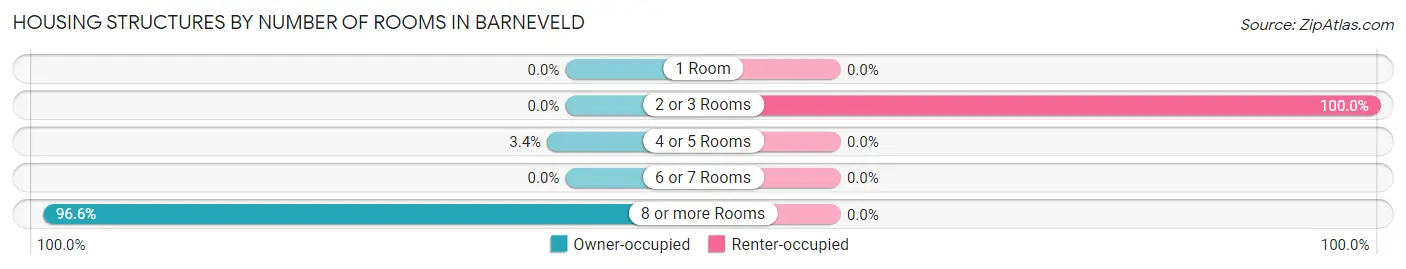
| Number of Rooms | Owner-occupied | Renter-occupied |
| 1 Room | 0 (0.0%) | 0 (0.0%) |
| 2 or 3 Rooms | 0 (0.0%) | 8 (100.0%) |
| 4 or 5 Rooms | 2 (3.4%) | 0 (0.0%) |
| 6 or 7 Rooms | 0 (0.0%) | 0 (0.0%) |
| 8 or more Rooms | 57 (96.6%) | 0 (0.0%) |
| Total | 59 (100.0%) | 8 (100.0%) |
Housing Structure by Heating Type in Barneveld
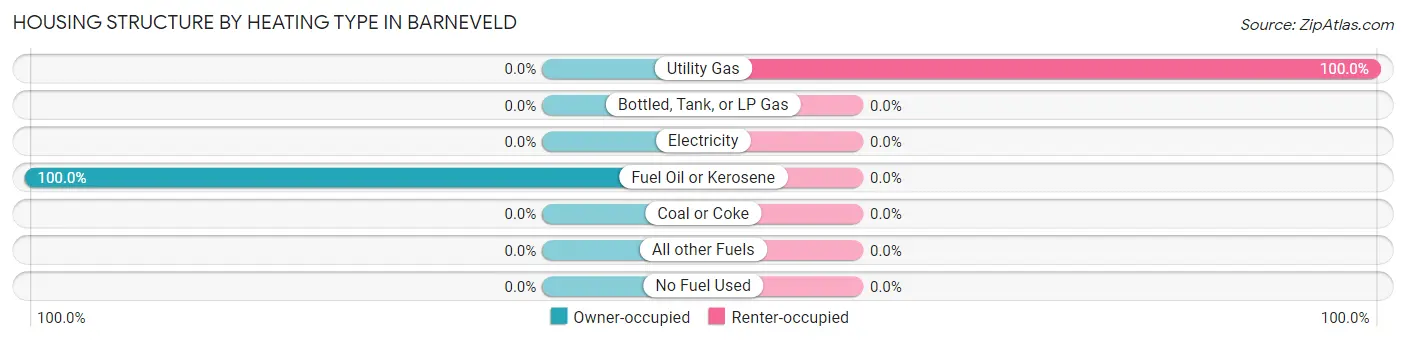
| Heating Type | Owner-occupied | Renter-occupied |
| Utility Gas | 0 (0.0%) | 8 (100.0%) |
| Bottled, Tank, or LP Gas | 0 (0.0%) | 0 (0.0%) |
| Electricity | 0 (0.0%) | 0 (0.0%) |
| Fuel Oil or Kerosene | 59 (100.0%) | 0 (0.0%) |
| Coal or Coke | 0 (0.0%) | 0 (0.0%) |
| All other Fuels | 0 (0.0%) | 0 (0.0%) |
| No Fuel Used | 0 (0.0%) | 0 (0.0%) |
| Total | 59 (100.0%) | 8 (100.0%) |
Household Vehicle Usage in Barneveld
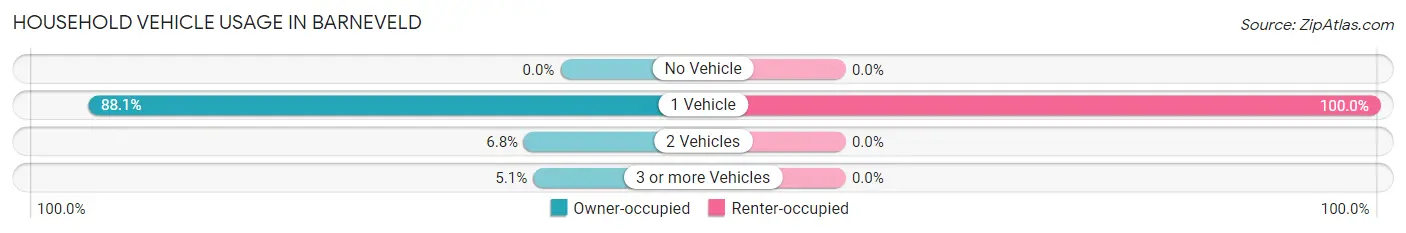
| Vehicles per Household | Owner-occupied | Renter-occupied |
| No Vehicle | 0 (0.0%) | 0 (0.0%) |
| 1 Vehicle | 52 (88.1%) | 8 (100.0%) |
| 2 Vehicles | 4 (6.8%) | 0 (0.0%) |
| 3 or more Vehicles | 3 (5.1%) | 0 (0.0%) |
| Total | 59 (100.0%) | 8 (100.0%) |
Real Estate & Mortgages in Barneveld
Real Estate and Mortgage Overview in Barneveld
| Characteristic | Without Mortgage | With Mortgage |
| Housing Units | 15 | 44 |
| Median Property Value | $139,800 | $326,700 |
| Median Household Income | $74,205 | $0 |
| Monthly Housing Costs | $658 | $0 |
| Real Estate Taxes | - | - |
Property Value by Mortgage Status in Barneveld
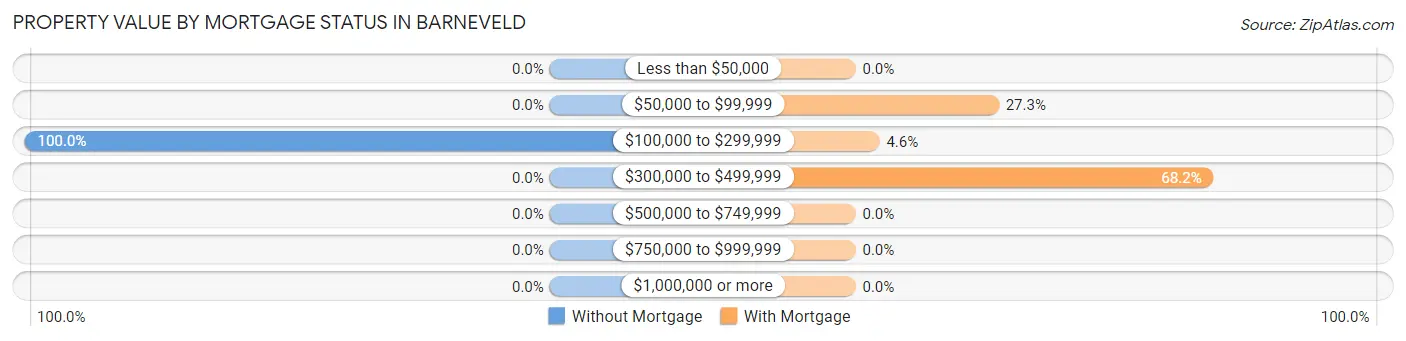
| Property Value | Without Mortgage | With Mortgage |
| Less than $50,000 | 0 (0.0%) | 0 (0.0%) |
| $50,000 to $99,999 | 0 (0.0%) | 12 (27.3%) |
| $100,000 to $299,999 | 15 (100.0%) | 2 (4.5%) |
| $300,000 to $499,999 | 0 (0.0%) | 30 (68.2%) |
| $500,000 to $749,999 | 0 (0.0%) | 0 (0.0%) |
| $750,000 to $999,999 | 0 (0.0%) | 0 (0.0%) |
| $1,000,000 or more | 0 (0.0%) | 0 (0.0%) |
| Total | 15 (100.0%) | 44 (100.0%) |
Household Income by Mortgage Status in Barneveld
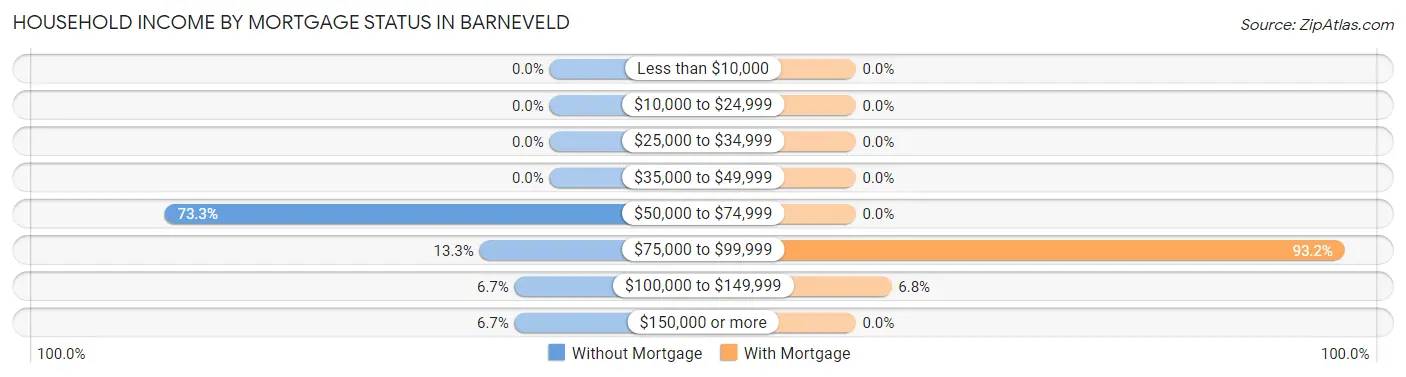
| Household Income | Without Mortgage | With Mortgage |
| Less than $10,000 | 0 (0.0%) | 0 (0.0%) |
| $10,000 to $24,999 | 0 (0.0%) | 0 (0.0%) |
| $25,000 to $34,999 | 0 (0.0%) | 0 (0.0%) |
| $35,000 to $49,999 | 0 (0.0%) | 0 (0.0%) |
| $50,000 to $74,999 | 11 (73.3%) | 0 (0.0%) |
| $75,000 to $99,999 | 2 (13.3%) | 41 (93.2%) |
| $100,000 to $149,999 | 1 (6.7%) | 3 (6.8%) |
| $150,000 or more | 1 (6.7%) | 0 (0.0%) |
| Total | 15 (100.0%) | 44 (100.0%) |
Property Value to Household Income Ratio in Barneveld
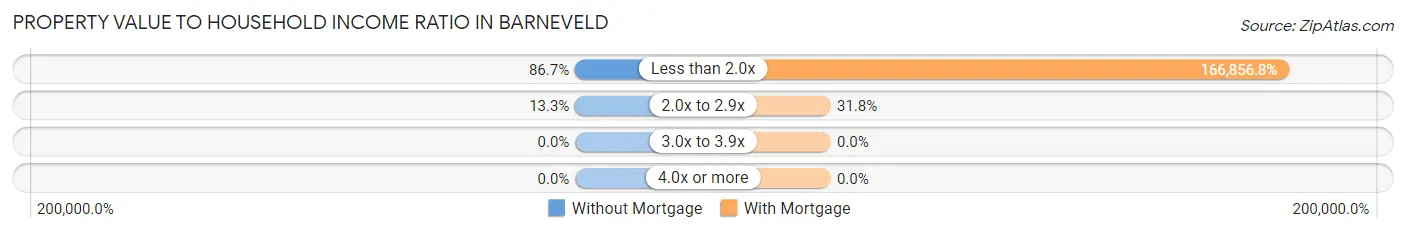
| Value-to-Income Ratio | Without Mortgage | With Mortgage |
| Less than 2.0x | 13 (86.7%) | 73,417 (166,856.8%) |
| 2.0x to 2.9x | 2 (13.3%) | 14 (31.8%) |
| 3.0x to 3.9x | 0 (0.0%) | 0 (0.0%) |
| 4.0x or more | 0 (0.0%) | 0 (0.0%) |
| Total | 15 (100.0%) | 44 (100.0%) |
Real Estate Taxes by Mortgage Status in Barneveld
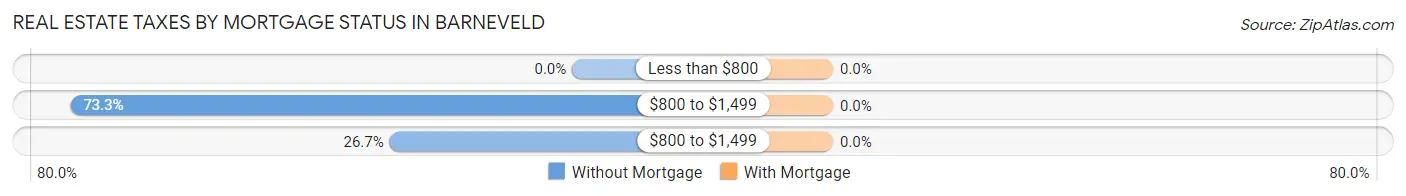
| Property Taxes | Without Mortgage | With Mortgage |
| Less than $800 | 0 (0.0%) | 0 (0.0%) |
| $800 to $1,499 | 11 (73.3%) | 0 (0.0%) |
| $800 to $1,499 | 4 (26.7%) | 0 (0.0%) |
| Total | 15 (100.0%) | 44 (100.0%) |
Health & Disability in Barneveld
Health Insurance Coverage by Age in Barneveld
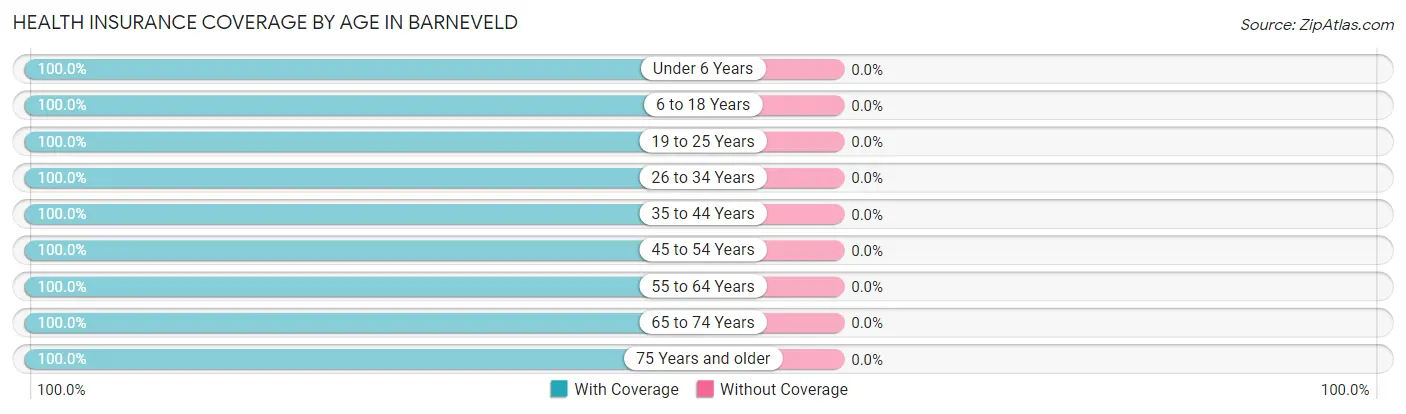
| Age Bracket | With Coverage | Without Coverage |
| Under 6 Years | 54 (100.0%) | 0 (0.0%) |
| 6 to 18 Years | 17 (100.0%) | 0 (0.0%) |
| 19 to 25 Years | 1 (100.0%) | 0 (0.0%) |
| 26 to 34 Years | 75 (100.0%) | 0 (0.0%) |
| 35 to 44 Years | 11 (100.0%) | 0 (0.0%) |
| 45 to 54 Years | 12 (100.0%) | 0 (0.0%) |
| 55 to 64 Years | 2 (100.0%) | 0 (0.0%) |
| 65 to 74 Years | 4 (100.0%) | 0 (0.0%) |
| 75 Years and older | 14 (100.0%) | 0 (0.0%) |
| Total | 190 (100.0%) | 0 (0.0%) |
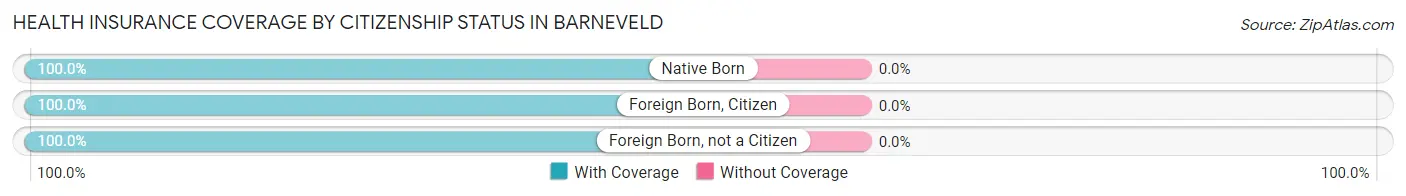
Health Insurance Coverage by Citizenship Status in Barneveld
| Citizenship Status | With Coverage | Without Coverage |
| Native Born | 54 (100.0%) | 0 (0.0%) |
| Foreign Born, Citizen | 17 (100.0%) | 0 (0.0%) |
| Foreign Born, not a Citizen | 1 (100.0%) | 0 (0.0%) |
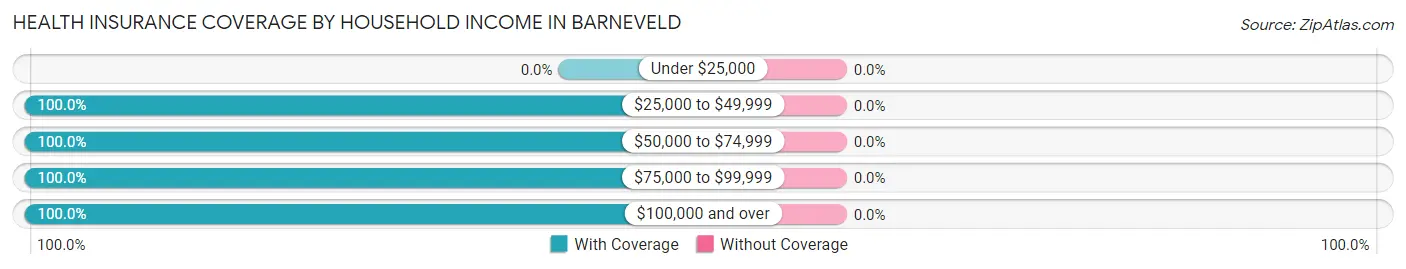
Health Insurance Coverage by Household Income in Barneveld
| Household Income | With Coverage | Without Coverage |
| Under $25,000 | 0 (0.0%) | 0 (0.0%) |
| $25,000 to $49,999 | 8 (100.0%) | 0 (0.0%) |
| $50,000 to $74,999 | 163 (100.0%) | 0 (0.0%) |
| $75,000 to $99,999 | 13 (100.0%) | 0 (0.0%) |
| $100,000 and over | 6 (100.0%) | 0 (0.0%) |
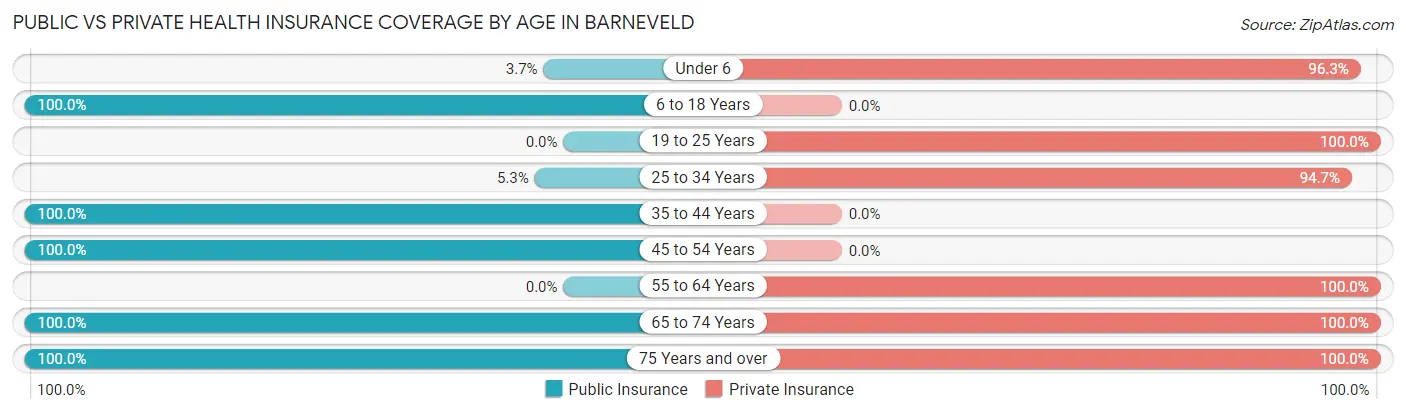
Public vs Private Health Insurance Coverage by Age in Barneveld
| Age Bracket | Public Insurance | Private Insurance |
| Under 6 | 2 (3.7%) | 52 (96.3%) |
| 6 to 18 Years | 17 (100.0%) | 0 (0.0%) |
| 19 to 25 Years | 0 (0.0%) | 1 (100.0%) |
| 25 to 34 Years | 4 (5.3%) | 71 (94.7%) |
| 35 to 44 Years | 11 (100.0%) | 0 (0.0%) |
| 45 to 54 Years | 12 (100.0%) | 0 (0.0%) |
| 55 to 64 Years | 0 (0.0%) | 2 (100.0%) |
| 65 to 74 Years | 4 (100.0%) | 4 (100.0%) |
| 75 Years and over | 14 (100.0%) | 14 (100.0%) |
| Total | 64 (33.7%) | 144 (75.8%) |
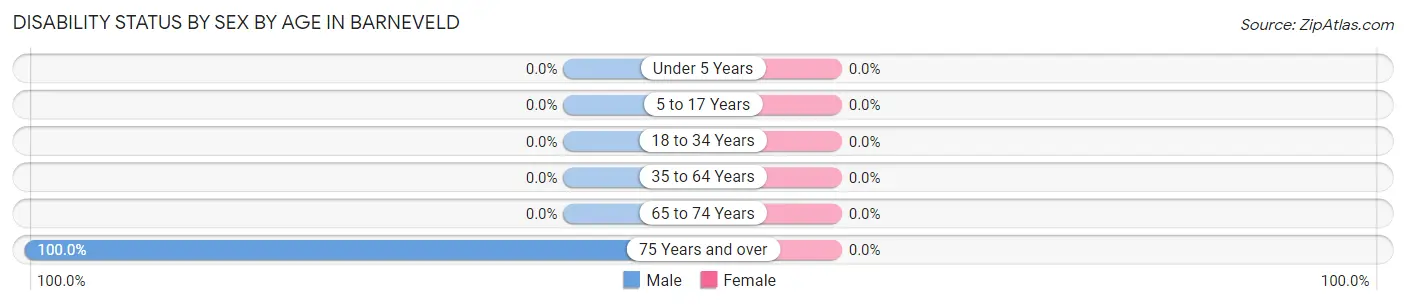
Disability Status by Sex by Age in Barneveld
| Age Bracket | Male | Female |
| Under 5 Years | 0 (0.0%) | 0 (0.0%) |
| 5 to 17 Years | 0 (0.0%) | 0 (0.0%) |
| 18 to 34 Years | 0 (0.0%) | 0 (0.0%) |
| 35 to 64 Years | 0 (0.0%) | 0 (0.0%) |
| 65 to 74 Years | 0 (0.0%) | 0 (0.0%) |
| 75 Years and over | 1 (100.0%) | 0 (0.0%) |
Disability Class by Sex by Age in Barneveld
Disability Class: Hearing Difficulty
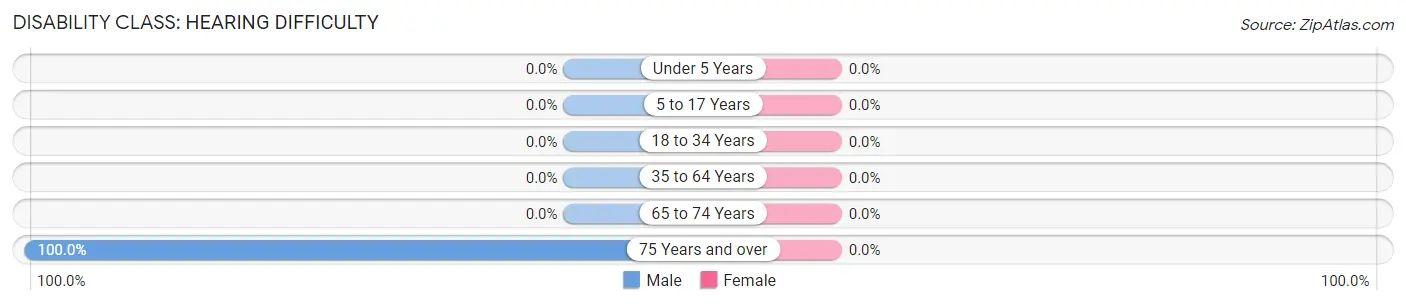
| Age Bracket | Male | Female |
| Under 5 Years | 0 (0.0%) | 0 (0.0%) |
| 5 to 17 Years | 0 (0.0%) | 0 (0.0%) |
| 18 to 34 Years | 0 (0.0%) | 0 (0.0%) |
| 35 to 64 Years | 0 (0.0%) | 0 (0.0%) |
| 65 to 74 Years | 0 (0.0%) | 0 (0.0%) |
| 75 Years and over | 1 (100.0%) | 0 (0.0%) |
Disability Class: Vision Difficulty
| Age Bracket | Male | Female |
| Under 5 Years | 0 (0.0%) | 0 (0.0%) |
| 5 to 17 Years | 0 (0.0%) | 0 (0.0%) |
| 18 to 34 Years | 0 (0.0%) | 0 (0.0%) |
| 35 to 64 Years | 0 (0.0%) | 0 (0.0%) |
| 65 to 74 Years | 0 (0.0%) | 0 (0.0%) |
| 75 Years and over | 0 (0.0%) | 0 (0.0%) |
Disability Class: Cognitive Difficulty
| Age Bracket | Male | Female |
| 5 to 17 Years | 0 (0.0%) | 0 (0.0%) |
| 18 to 34 Years | 0 (0.0%) | 0 (0.0%) |
| 35 to 64 Years | 0 (0.0%) | 0 (0.0%) |
| 65 to 74 Years | 0 (0.0%) | 0 (0.0%) |
| 75 Years and over | 0 (0.0%) | 0 (0.0%) |
Disability Class: Ambulatory Difficulty
| Age Bracket | Male | Female |
| 5 to 17 Years | 0 (0.0%) | 0 (0.0%) |
| 18 to 34 Years | 0 (0.0%) | 0 (0.0%) |
| 35 to 64 Years | 0 (0.0%) | 0 (0.0%) |
| 65 to 74 Years | 0 (0.0%) | 0 (0.0%) |
| 75 Years and over | 0 (0.0%) | 0 (0.0%) |
Disability Class: Self-Care Difficulty
| Age Bracket | Male | Female |
| 5 to 17 Years | 0 (0.0%) | 0 (0.0%) |
| 18 to 34 Years | 0 (0.0%) | 0 (0.0%) |
| 35 to 64 Years | 0 (0.0%) | 0 (0.0%) |
| 65 to 74 Years | 0 (0.0%) | 0 (0.0%) |
| 75 Years and over | 0 (0.0%) | 0 (0.0%) |
Technology Access in Barneveld
Computing Device Access in Barneveld
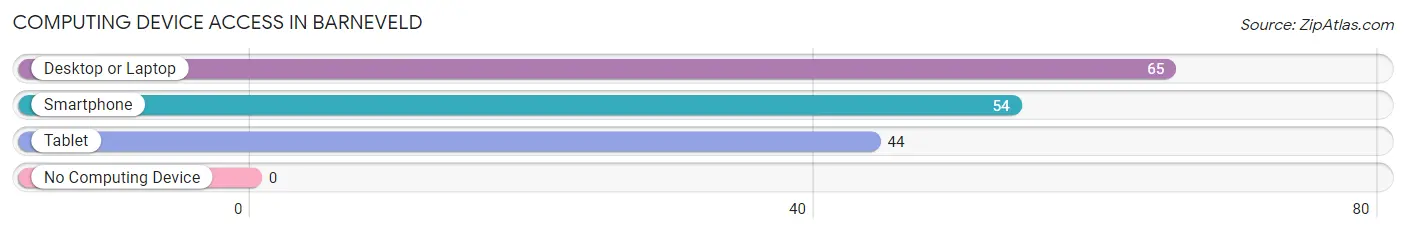
| Device Type | # Households | % Households |
| Desktop or Laptop | 65 | 97.0% |
| Smartphone | 54 | 80.6% |
| Tablet | 44 | 65.7% |
| No Computing Device | 0 | 0.0% |
| Total | 67 | 100.0% |
Internet Access in Barneveld
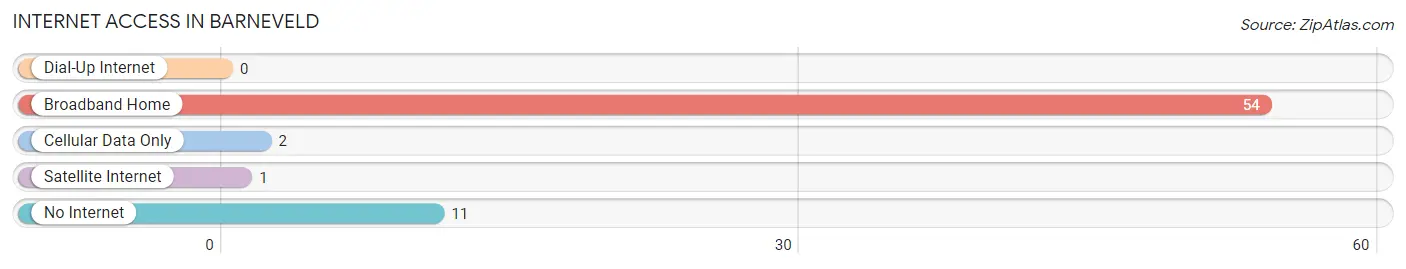
| Internet Type | # Households | % Households |
| Dial-Up Internet | 0 | 0.0% |
| Broadband Home | 54 | 80.6% |
| Cellular Data Only | 2 | 3.0% |
| Satellite Internet | 1 | 1.5% |
| No Internet | 11 | 16.4% |
| Total | 67 | 100.0% |
Barneveld Summary
Barneveld is a small town located in Oneida County, New York, United States. The town is situated in the foothills of the Adirondack Mountains, and is part of the Mohawk Valley region. As of the 2010 census, the population of Barneveld was 1,845.
History
The area that is now Barneveld was first settled in 1790 by a group of Dutch immigrants led by Johannes Barneveld. The town was officially established in 1817, and was named after the Dutch city of Barneveld. The town was originally part of the larger town of Trenton, but was later split off and incorporated as its own town.
In the 19th century, Barneveld was an important center for the production of cheese. The town was home to several cheese factories, and was known for its high-quality cheese. The cheese industry in Barneveld declined in the early 20th century, and the town shifted its focus to other industries, such as manufacturing and agriculture.
Geography
Barneveld is located in the foothills of the Adirondack Mountains, and is part of the Mohawk Valley region. The town is situated on the western edge of Oneida County, and is bordered by the towns of Trenton to the north, Marshall to the east, and Floyd to the south. The town is located approximately 25 miles east of Utica, and 40 miles west of Albany.
The terrain of Barneveld is mostly flat, with some rolling hills. The town is located in a valley, and is surrounded by several small mountains. The highest point in the town is the summit of Mount Barneveld, which has an elevation of 1,845 feet.
Economy
The economy of Barneveld is largely based on agriculture and manufacturing. The town is home to several farms, which produce a variety of crops, including corn, soybeans, and hay. The town is also home to several manufacturing companies, which produce a variety of products, including furniture, paper products, and automotive parts.
Demographics
As of the 2010 census, the population of Barneveld was 1,845. The racial makeup of the town was 97.3% White, 0.7% African American, 0.3% Native American, 0.2% Asian, and 1.5% from other races. The median household income in Barneveld was $45,938, and the median family income was $51,250. The per capita income in Barneveld was $20,945.
Conclusion
Barneveld is a small town located in Oneida County, New York. The town was established in 1817, and was originally an important center for the production of cheese. Today, the economy of Barneveld is largely based on agriculture and manufacturing. As of the 2010 census, the population of Barneveld was 1,845.
Common Questions
What is Per Capita Income in Barneveld?
Per Capita income in Barneveld is $24,887.
What is the Median Family Income in Barneveld?
Median Family Income in Barneveld is $73,417.
What is the Median Household income in Barneveld?
Median Household Income in Barneveld is $73,384.
What is Inequality or Gini Index in Barneveld?
Inequality or Gini Index in Barneveld is 0.13.
What is the Total Population of Barneveld?
Total Population of Barneveld is 191.
What is the Total Male Population of Barneveld?
Total Male Population of Barneveld is 89.
What is the Total Female Population of Barneveld?
Total Female Population of Barneveld is 102.
What is the Ratio of Males per 100 Females in Barneveld?
There are 87.25 Males per 100 Females in Barneveld.
What is the Ratio of Females per 100 Males in Barneveld?
There are 114.61 Females per 100 Males in Barneveld.
What is the Median Population Age in Barneveld?
Median Population Age in Barneveld is 27.7 Years.
What is the Average Family Size in Barneveld
Average Family Size in Barneveld is 3.5 People.
What is the Average Household Size in Barneveld
Average Household Size in Barneveld is 2.9 People.
How Large is the Labor Force in Barneveld?
There are 60 People in the Labor Forcein in Barneveld.
What is the Percentage of People in the Labor Force in Barneveld?
50.0% of People are in the Labor Force in Barneveld.