Averill Park, NY Map & Demographics
Averill Park Map
Averill Park Overview
$58,455
PER CAPITA INCOME
$147,266
AVG FAMILY INCOME
$109,746
AVG HOUSEHOLD INCOME
36.4%
WAGE / INCOME GAP [ % ]
63.6¢/ $1
WAGE / INCOME GAP [ $ ]
0.36
INEQUALITY / GINI INDEX
1,608
TOTAL POPULATION
973
MALE POPULATION
635
FEMALE POPULATION
153.23
MALES / 100 FEMALES
65.26
FEMALES / 100 MALES
53.3
MEDIAN AGE
2.8
AVG FAMILY SIZE
2.1
AVG HOUSEHOLD SIZE
1,008
LABOR FORCE [ PEOPLE ]
68.8%
PERCENT IN LABOR FORCE
4.7%
UNEMPLOYMENT RATE
Averill Park Zip Codes
Averill Park Area Codes
Income in Averill Park
Income Overview in Averill Park
Per Capita Income in Averill Park is $58,455, while median incomes of families and households are $147,266 and $109,746 respectively.
| Characteristic | Number | Measure |
| Per Capita Income | 1,608 | $58,455 |
| Median Family Income | 453 | $147,266 |
| Mean Family Income | 453 | $153,792 |
| Median Household Income | 782 | $109,746 |
| Mean Household Income | 782 | $119,865 |
| Income Deficit | 453 | $0 |
| Wage / Income Gap (%) | 1,608 | 36.41% |
| Wage / Income Gap ($) | 1,608 | 63.59¢ per $1 |
| Gini / Inequality Index | 1,608 | 0.36 |
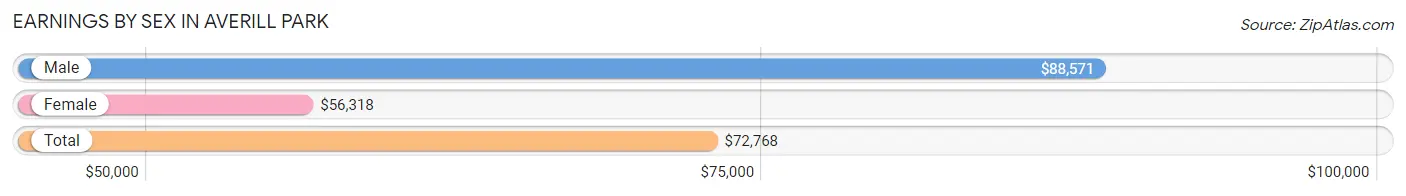
Earnings by Sex in Averill Park
Average Earnings in Averill Park are $72,768, $88,571 for men and $56,318 for women, a difference of 36.4%.
| Sex | Number | Average Earnings |
| Male | 588 (58.4%) | $88,571 |
| Female | 419 (41.6%) | $56,318 |
| Total | 1,007 (100.0%) | $72,768 |
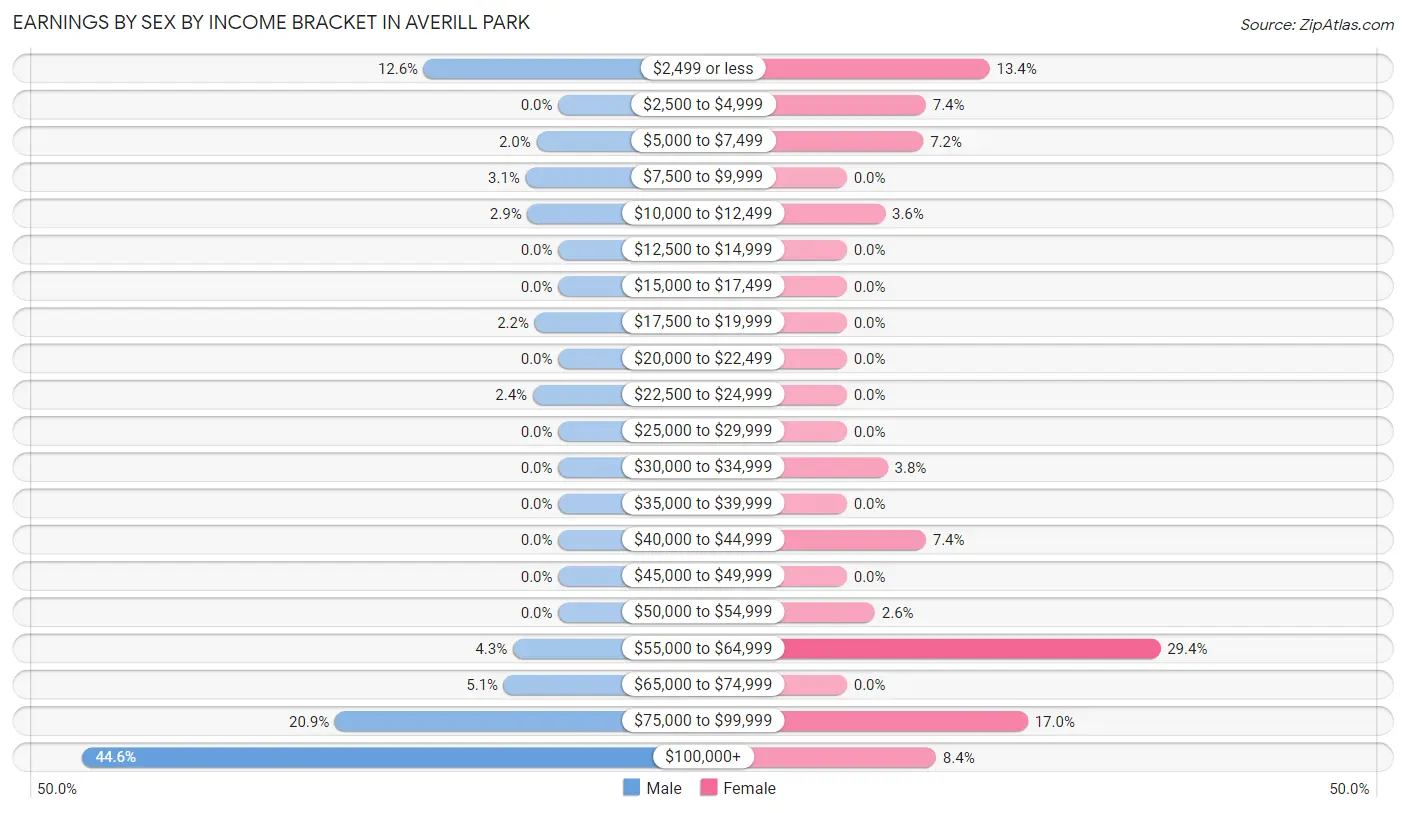
Earnings by Sex by Income Bracket in Averill Park
The most common earnings brackets in Averill Park are $100,000+ for men (262 | 44.6%) and $55,000 to $64,999 for women (123 | 29.4%).
| Income | Male | Female |
| $2,499 or less | 74 (12.6%) | 56 (13.4%) |
| $2,500 to $4,999 | 0 (0.0%) | 31 (7.4%) |
| $5,000 to $7,499 | 12 (2.0%) | 30 (7.2%) |
| $7,500 to $9,999 | 18 (3.1%) | 0 (0.0%) |
| $10,000 to $12,499 | 17 (2.9%) | 15 (3.6%) |
| $12,500 to $14,999 | 0 (0.0%) | 0 (0.0%) |
| $15,000 to $17,499 | 0 (0.0%) | 0 (0.0%) |
| $17,500 to $19,999 | 13 (2.2%) | 0 (0.0%) |
| $20,000 to $22,499 | 0 (0.0%) | 0 (0.0%) |
| $22,500 to $24,999 | 14 (2.4%) | 0 (0.0%) |
| $25,000 to $29,999 | 0 (0.0%) | 0 (0.0%) |
| $30,000 to $34,999 | 0 (0.0%) | 16 (3.8%) |
| $35,000 to $39,999 | 0 (0.0%) | 0 (0.0%) |
| $40,000 to $44,999 | 0 (0.0%) | 31 (7.4%) |
| $45,000 to $49,999 | 0 (0.0%) | 0 (0.0%) |
| $50,000 to $54,999 | 0 (0.0%) | 11 (2.6%) |
| $55,000 to $64,999 | 25 (4.3%) | 123 (29.4%) |
| $65,000 to $74,999 | 30 (5.1%) | 0 (0.0%) |
| $75,000 to $99,999 | 123 (20.9%) | 71 (17.0%) |
| $100,000+ | 262 (44.6%) | 35 (8.4%) |
| Total | 588 (100.0%) | 419 (100.0%) |
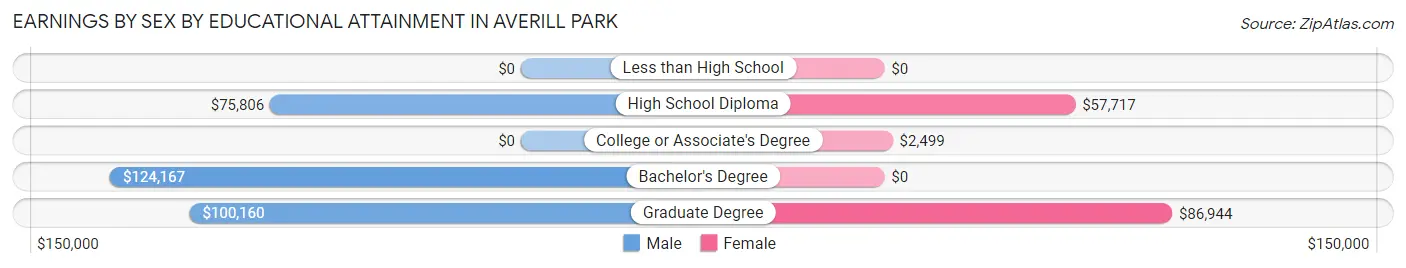
Earnings by Sex by Educational Attainment in Averill Park
Average earnings in Averill Park are $89,777 for men and $56,858 for women, a difference of 36.7%. Men with an educational attainment of bachelor's degree enjoy the highest average annual earnings of $124,167, while those with high school diploma education earn the least with $75,806. Women with an educational attainment of graduate degree earn the most with the average annual earnings of $86,944, while those with college or associate's degree education have the smallest earnings of $2,499.
| Educational Attainment | Male Income | Female Income |
| Less than High School | - | - |
| High School Diploma | $75,806 | $57,717 |
| College or Associate's Degree | - | - |
| Bachelor's Degree | $124,167 | $0 |
| Graduate Degree | $100,160 | $86,944 |
| Total | $89,777 | $56,858 |
Family Income in Averill Park
Family Income Brackets in Averill Park
According to the Averill Park family income data, there are 123 families falling into the $200,000+ income range, which is the most common income bracket and makes up 27.2% of all families.
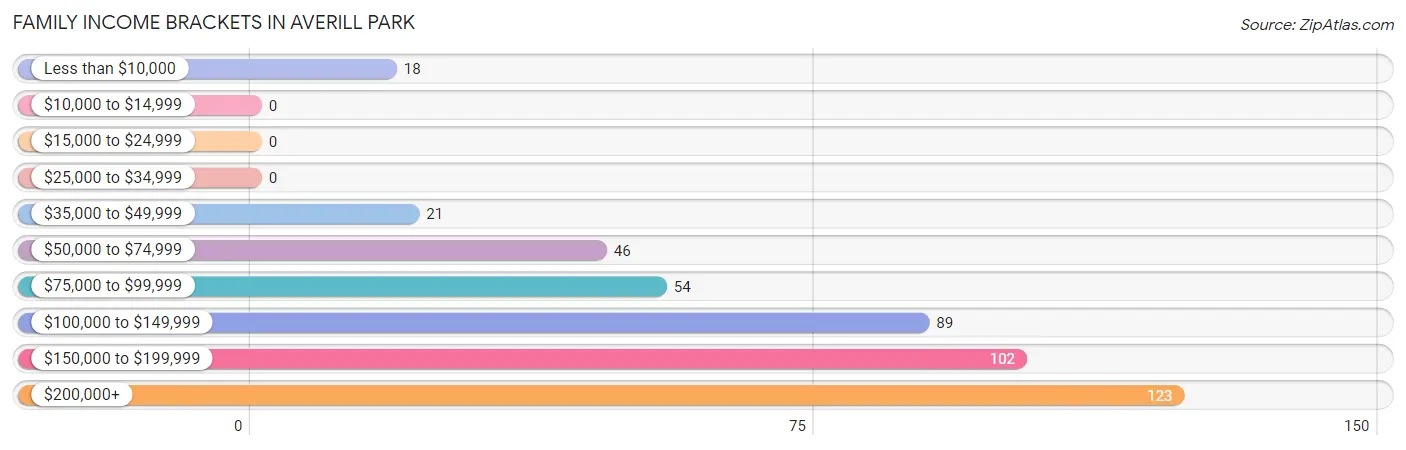
| Income Bracket | # Families | % Families |
| Less than $10,000 | 18 | 4.0% |
| $10,000 to $14,999 | 0 | 0.0% |
| $15,000 to $24,999 | 0 | 0.0% |
| $25,000 to $34,999 | 0 | 0.0% |
| $35,000 to $49,999 | 21 | 4.6% |
| $50,000 to $74,999 | 46 | 10.2% |
| $75,000 to $99,999 | 54 | 11.9% |
| $100,000 to $149,999 | 89 | 19.6% |
| $150,000 to $199,999 | 102 | 22.5% |
| $200,000+ | 123 | 27.2% |
Family Income by Famaliy Size in Averill Park
3-person families (110 | 24.3%) account for the highest median family income in Averill Park with $190,641 per family, while 2-person families (241 | 53.2%) have the highest median income of $76,094 per family member.
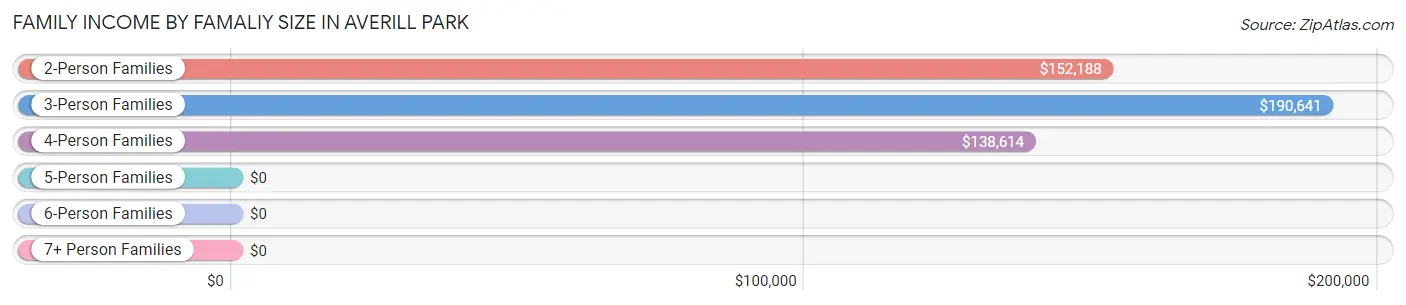
| Income Bracket | # Families | Median Income |
| 2-Person Families | 241 (53.2%) | $152,188 |
| 3-Person Families | 110 (24.3%) | $190,641 |
| 4-Person Families | 85 (18.8%) | $138,614 |
| 5-Person Families | 17 (3.7%) | $0 |
| 6-Person Families | 0 (0.0%) | $0 |
| 7+ Person Families | 0 (0.0%) | $0 |
| Total | 453 (100.0%) | $147,266 |
Family Income by Number of Earners in Averill Park
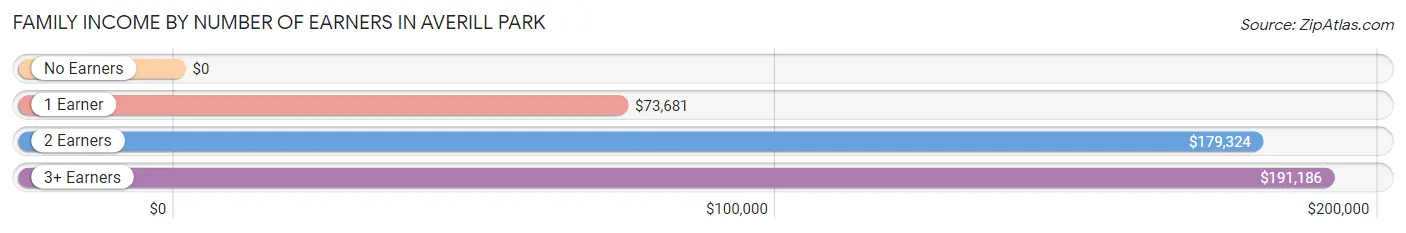
| Number of Earners | # Families | Median Income |
| No Earners | 29 (6.4%) | $0 |
| 1 Earner | 129 (28.5%) | $73,681 |
| 2 Earners | 230 (50.8%) | $179,324 |
| 3+ Earners | 65 (14.3%) | $191,186 |
| Total | 453 (100.0%) | $147,266 |
Household Income in Averill Park
Household Income Brackets in Averill Park
With 219 households falling in the category, the $100,000 to $149,999 income range is the most frequent in Averill Park, accounting for 28.0% of all households.
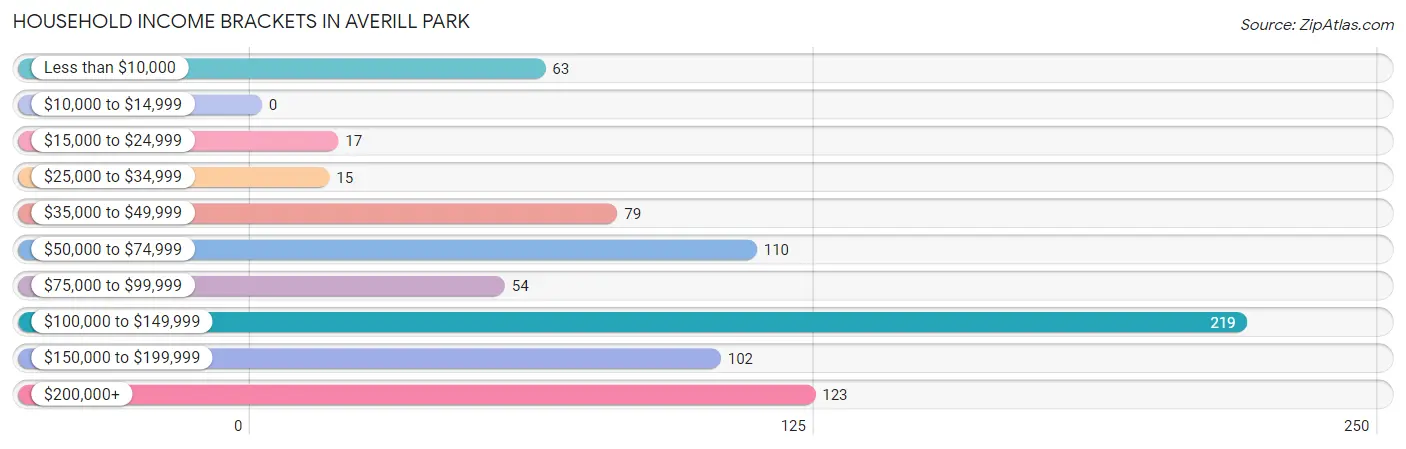
| Income Bracket | # Households | % Households |
| Less than $10,000 | 63 | 8.1% |
| $10,000 to $14,999 | 0 | 0.0% |
| $15,000 to $24,999 | 17 | 2.2% |
| $25,000 to $34,999 | 15 | 1.9% |
| $35,000 to $49,999 | 79 | 10.1% |
| $50,000 to $74,999 | 110 | 14.1% |
| $75,000 to $99,999 | 54 | 6.9% |
| $100,000 to $149,999 | 219 | 28.0% |
| $150,000 to $199,999 | 102 | 13.0% |
| $200,000+ | 123 | 15.7% |
Household Income by Householder Age in Averill Park
The median household income in Averill Park is $109,746, with the highest median household income of $179,792 found in the 25 to 44 years age bracket for the primary householder. A total of 78 households (10.0%) fall into this category.
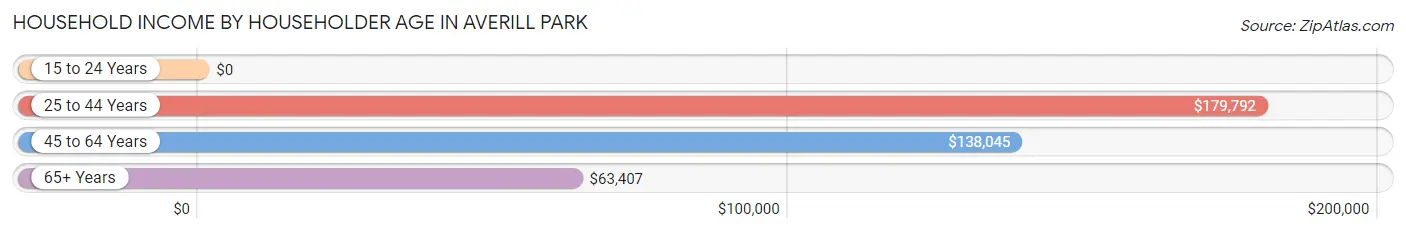
| Income Bracket | # Households | Median Income |
| 15 to 24 Years | 0 (0.0%) | $0 |
| 25 to 44 Years | 78 (10.0%) | $179,792 |
| 45 to 64 Years | 443 (56.7%) | $138,045 |
| 65+ Years | 261 (33.4%) | $63,407 |
| Total | 782 (100.0%) | $109,746 |
Poverty in Averill Park
Income Below Poverty by Sex and Age in Averill Park
With 2.1% poverty level for males and 9.9% for females among the residents of Averill Park, 55 to 64 year old males and 75 year old and over females are the most vulnerable to poverty, with 20 males (10.3%) and 18 females (34.0%) in their respective age groups living below the poverty level.
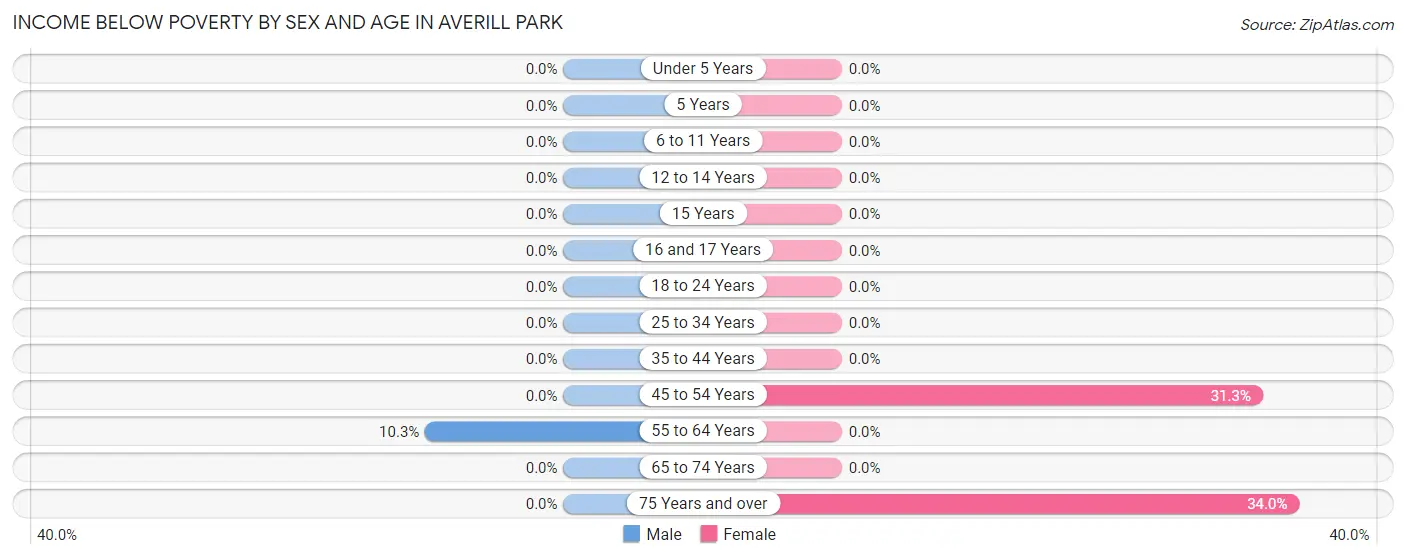
| Age Bracket | Male | Female |
| Under 5 Years | 0 (0.0%) | 0 (0.0%) |
| 5 Years | 0 (0.0%) | 0 (0.0%) |
| 6 to 11 Years | 0 (0.0%) | 0 (0.0%) |
| 12 to 14 Years | 0 (0.0%) | 0 (0.0%) |
| 15 Years | 0 (0.0%) | 0 (0.0%) |
| 16 and 17 Years | 0 (0.0%) | 0 (0.0%) |
| 18 to 24 Years | 0 (0.0%) | 0 (0.0%) |
| 25 to 34 Years | 0 (0.0%) | 0 (0.0%) |
| 35 to 44 Years | 0 (0.0%) | 0 (0.0%) |
| 45 to 54 Years | 0 (0.0%) | 45 (31.2%) |
| 55 to 64 Years | 20 (10.3%) | 0 (0.0%) |
| 65 to 74 Years | 0 (0.0%) | 0 (0.0%) |
| 75 Years and over | 0 (0.0%) | 18 (34.0%) |
| Total | 20 (2.1%) | 63 (9.9%) |
Income Above Poverty by Sex and Age in Averill Park
According to the poverty statistics in Averill Park, males aged under 5 years and females aged under 5 years are the age groups that are most secure financially, with 100.0% of males and 100.0% of females in these age groups living above the poverty line.
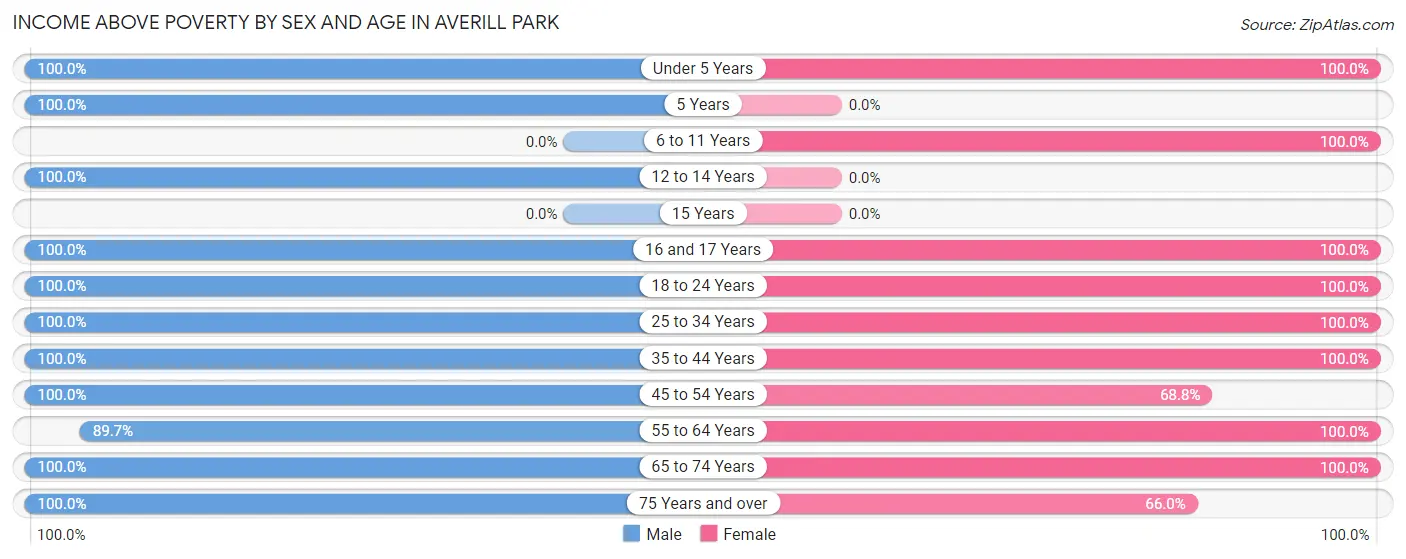
| Age Bracket | Male | Female |
| Under 5 Years | 72 (100.0%) | 16 (100.0%) |
| 5 Years | 17 (100.0%) | 0 (0.0%) |
| 6 to 11 Years | 0 (0.0%) | 15 (100.0%) |
| 12 to 14 Years | 23 (100.0%) | 0 (0.0%) |
| 15 Years | 0 (0.0%) | 0 (0.0%) |
| 16 and 17 Years | 27 (100.0%) | 32 (100.0%) |
| 18 to 24 Years | 95 (100.0%) | 16 (100.0%) |
| 25 to 34 Years | 50 (100.0%) | 109 (100.0%) |
| 35 to 44 Years | 29 (100.0%) | 30 (100.0%) |
| 45 to 54 Years | 215 (100.0%) | 99 (68.8%) |
| 55 to 64 Years | 175 (89.7%) | 137 (100.0%) |
| 65 to 74 Years | 217 (100.0%) | 83 (100.0%) |
| 75 Years and over | 33 (100.0%) | 35 (66.0%) |
| Total | 953 (97.9%) | 572 (90.1%) |
Income Below Poverty Among Married-Couple Families in Averill Park
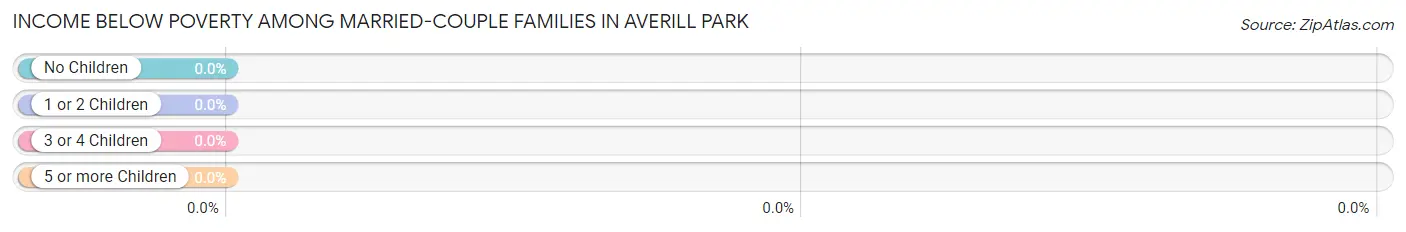
| Children | Above Poverty | Below Poverty |
| No Children | 323 (100.0%) | 0 (0.0%) |
| 1 or 2 Children | 70 (100.0%) | 0 (0.0%) |
| 3 or 4 Children | 17 (100.0%) | 0 (0.0%) |
| 5 or more Children | 0 (0.0%) | 0 (0.0%) |
| Total | 410 (100.0%) | 0 (0.0%) |
Income Below Poverty Among Single-Parent Households in Averill Park
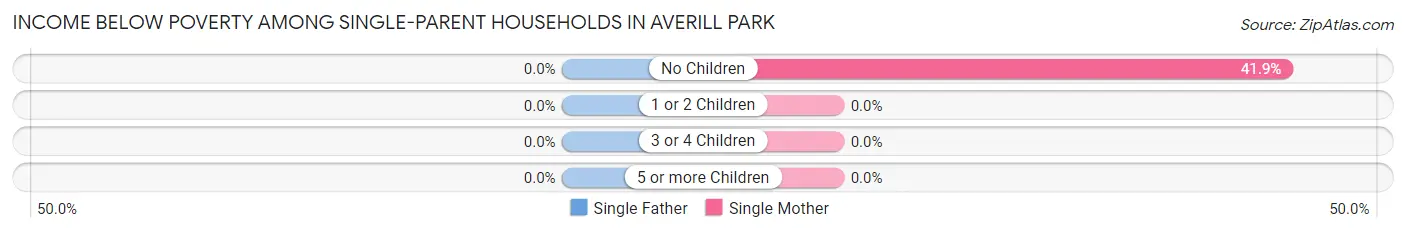
| Children | Single Father | Single Mother |
| No Children | 0 (0.0%) | 18 (41.9%) |
| 1 or 2 Children | 0 (0.0%) | 0 (0.0%) |
| 3 or 4 Children | 0 (0.0%) | 0 (0.0%) |
| 5 or more Children | 0 (0.0%) | 0 (0.0%) |
| Total | 0 (0.0%) | 18 (41.9%) |
Income Below Poverty Among Married-Couple vs Single-Parent Households in Averill Park

| Children | Married-Couple Families | Single-Parent Households |
| No Children | 0 (0.0%) | 18 (41.9%) |
| 1 or 2 Children | 0 (0.0%) | 0 (0.0%) |
| 3 or 4 Children | 0 (0.0%) | 0 (0.0%) |
| 5 or more Children | 0 (0.0%) | 0 (0.0%) |
| Total | 0 (0.0%) | 18 (41.9%) |
Race in Averill Park
The most populous races in Averill Park are , and White / Caucasian (1,608 | 100.0%).
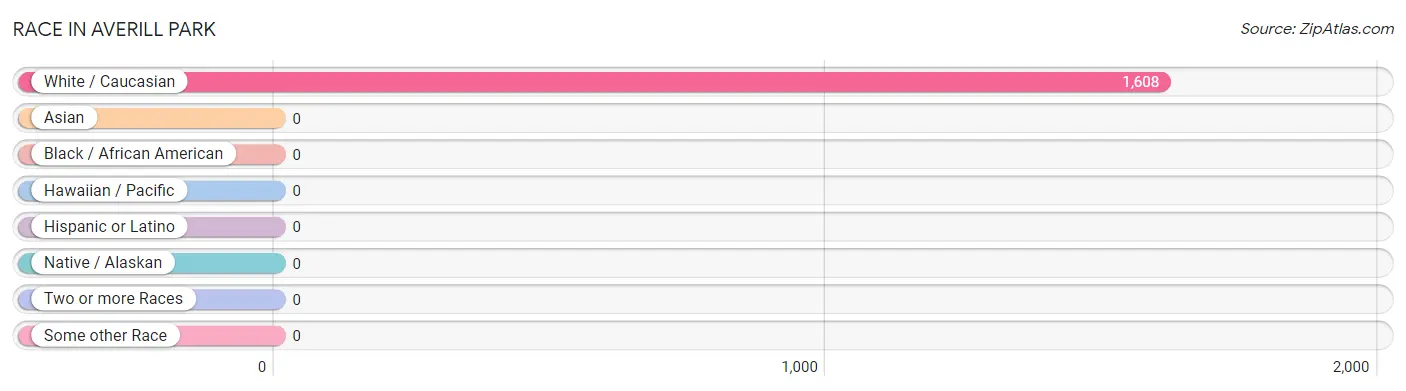
| Race | # Population | % Population |
| Asian | 0 | 0.0% |
| Black / African American | 0 | 0.0% |
| Hawaiian / Pacific | 0 | 0.0% |
| Hispanic or Latino | 0 | 0.0% |
| Native / Alaskan | 0 | 0.0% |
| White / Caucasian | 1,608 | 100.0% |
| Two or more Races | 0 | 0.0% |
| Some other Race | 0 | 0.0% |
| Total | 1,608 | 100.0% |
Ancestry in Averill Park
The most populous ancestries reported in Averill Park are Irish (363 | 22.6%), German (279 | 17.3%), Italian (228 | 14.2%), English (148 | 9.2%), and French (118 | 7.3%), together accounting for 70.6% of all Averill Park residents.
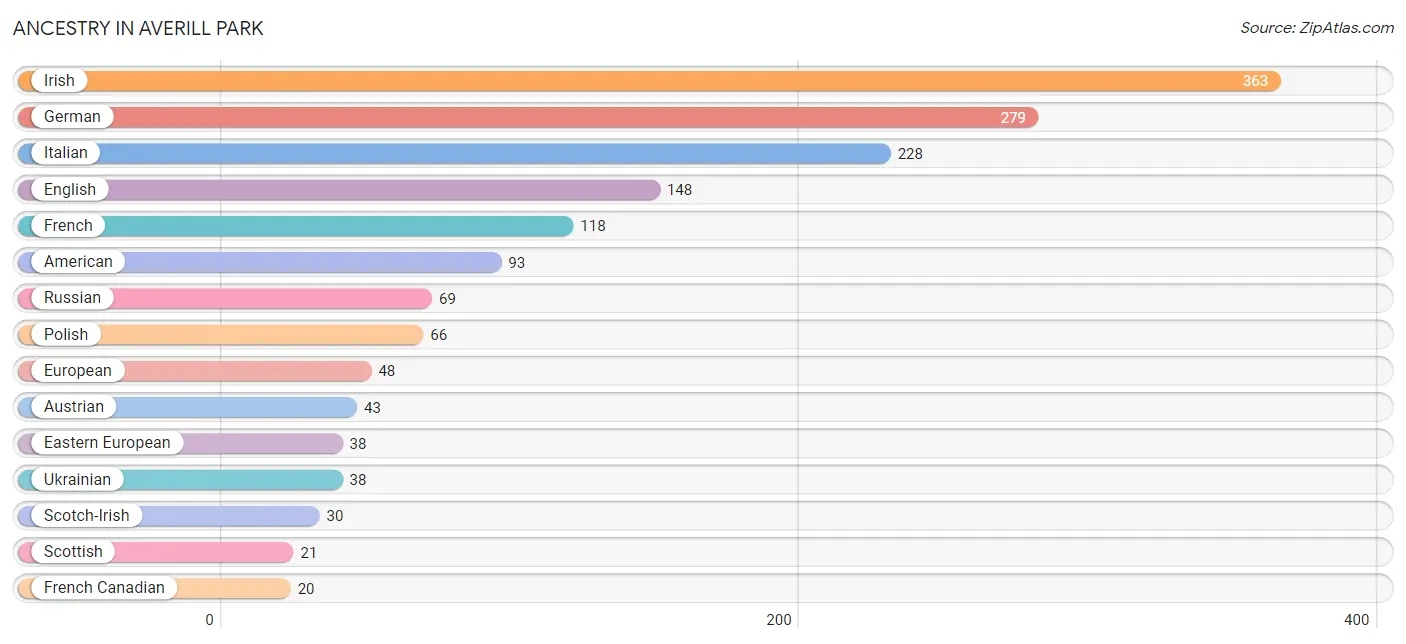
| Ancestry | # Population | % Population |
| American | 93 | 5.8% |
| Arab | 14 | 0.9% |
| Austrian | 43 | 2.7% |
| Danish | 8 | 0.5% |
| Dutch | 18 | 1.1% |
| Eastern European | 38 | 2.4% |
| English | 148 | 9.2% |
| European | 48 | 3.0% |
| French | 118 | 7.3% |
| French Canadian | 20 | 1.2% |
| German | 279 | 17.3% |
| Irish | 363 | 22.6% |
| Italian | 228 | 14.2% |
| Lithuanian | 15 | 0.9% |
| Norwegian | 9 | 0.6% |
| Polish | 66 | 4.1% |
| Romanian | 18 | 1.1% |
| Russian | 69 | 4.3% |
| Scotch-Irish | 30 | 1.9% |
| Scottish | 21 | 1.3% |
| Swedish | 18 | 1.1% |
| Syrian | 14 | 0.9% |
| Ukrainian | 38 | 2.4% | View All 23 Rows |
Immigrants in Averill Park
The most numerous immigrant groups reported in Averill Park came from Canada (116 | 7.2%), Europe (30 | 1.9%), Oceania (18 | 1.1%), Ireland (16 | 1.0%), and Northern Europe (16 | 1.0%), together accounting for 12.2% of all Averill Park residents.
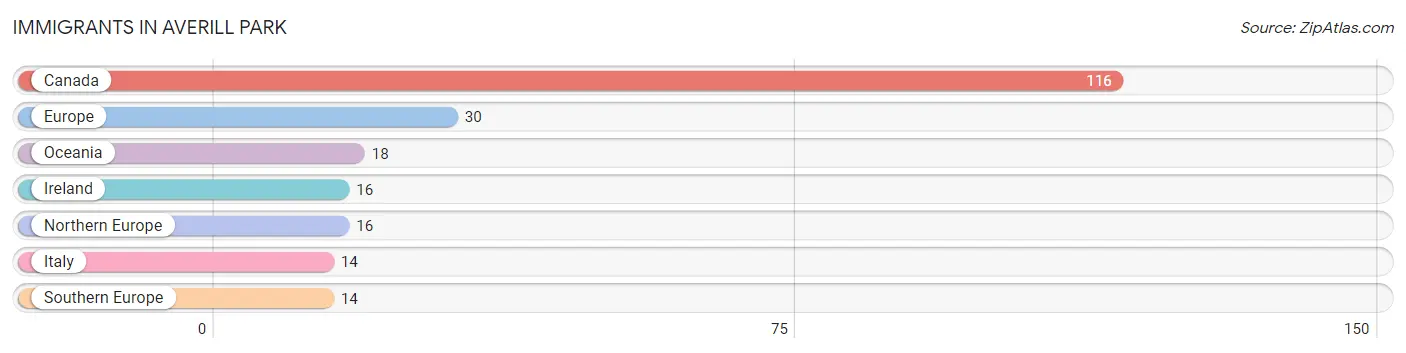
| Immigration Origin | # Population | % Population |
| Canada | 116 | 7.2% |
| Europe | 30 | 1.9% |
| Ireland | 16 | 1.0% |
| Italy | 14 | 0.9% |
| Northern Europe | 16 | 1.0% |
| Oceania | 18 | 1.1% |
| Southern Europe | 14 | 0.9% | View All 7 Rows |
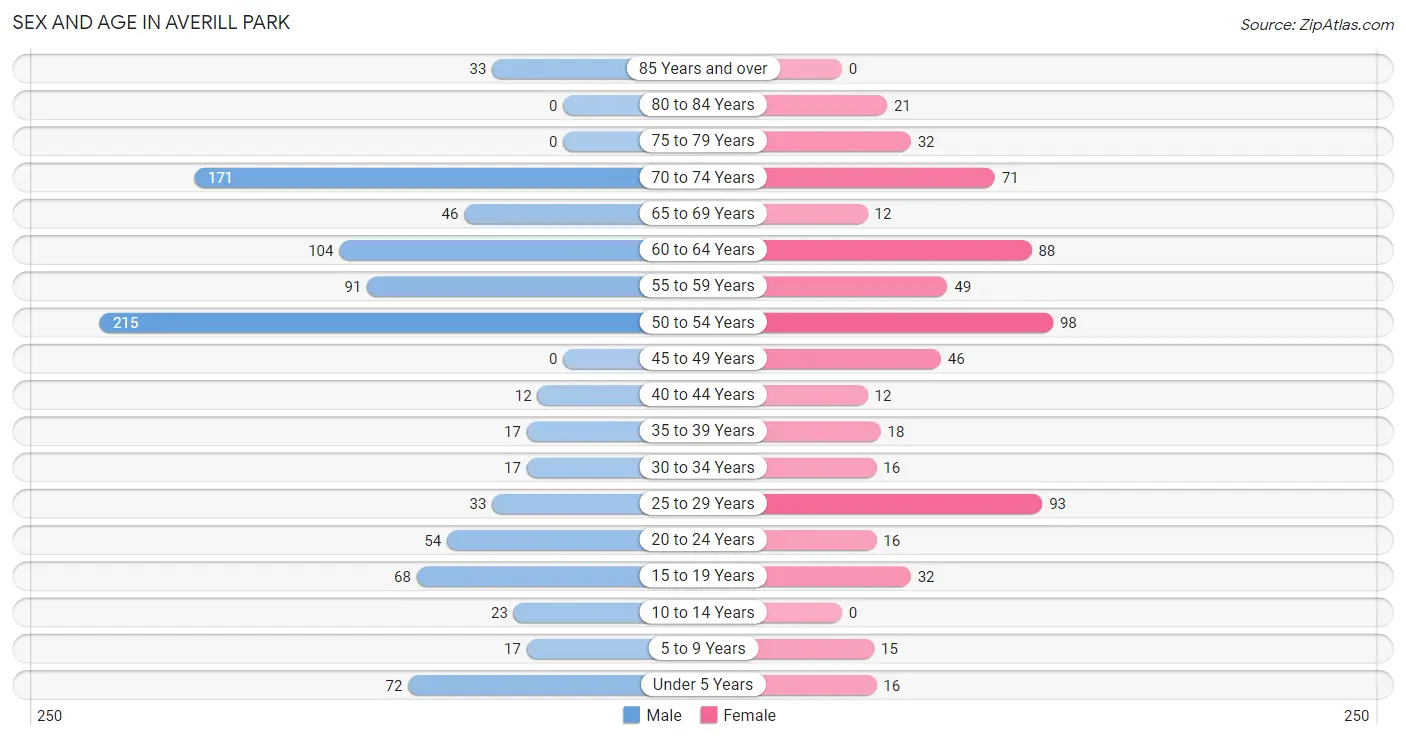
Sex and Age in Averill Park
Sex and Age in Averill Park
The most populous age groups in Averill Park are 50 to 54 Years (215 | 22.1%) for men and 50 to 54 Years (98 | 15.4%) for women.
| Age Bracket | Male | Female |
| Under 5 Years | 72 (7.4%) | 16 (2.5%) |
| 5 to 9 Years | 17 (1.8%) | 15 (2.4%) |
| 10 to 14 Years | 23 (2.4%) | 0 (0.0%) |
| 15 to 19 Years | 68 (7.0%) | 32 (5.0%) |
| 20 to 24 Years | 54 (5.6%) | 16 (2.5%) |
| 25 to 29 Years | 33 (3.4%) | 93 (14.6%) |
| 30 to 34 Years | 17 (1.8%) | 16 (2.5%) |
| 35 to 39 Years | 17 (1.8%) | 18 (2.8%) |
| 40 to 44 Years | 12 (1.2%) | 12 (1.9%) |
| 45 to 49 Years | 0 (0.0%) | 46 (7.2%) |
| 50 to 54 Years | 215 (22.1%) | 98 (15.4%) |
| 55 to 59 Years | 91 (9.3%) | 49 (7.7%) |
| 60 to 64 Years | 104 (10.7%) | 88 (13.9%) |
| 65 to 69 Years | 46 (4.7%) | 12 (1.9%) |
| 70 to 74 Years | 171 (17.6%) | 71 (11.2%) |
| 75 to 79 Years | 0 (0.0%) | 32 (5.0%) |
| 80 to 84 Years | 0 (0.0%) | 21 (3.3%) |
| 85 Years and over | 33 (3.4%) | 0 (0.0%) |
| Total | 973 (100.0%) | 635 (100.0%) |
Families and Households in Averill Park
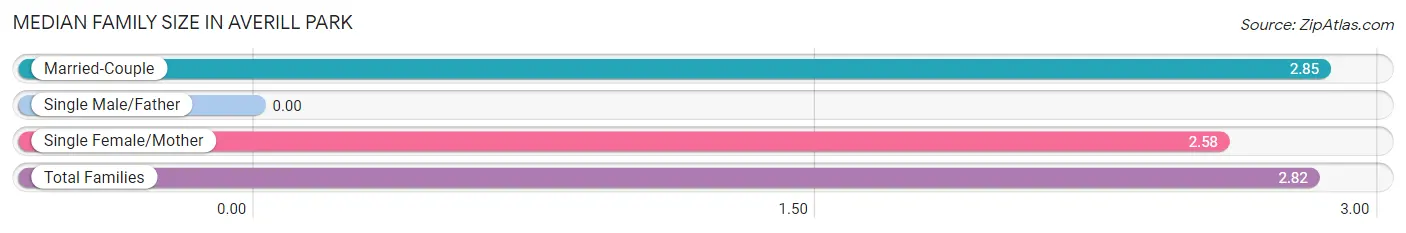
Median Family Size in Averill Park
| Family Type | # Families | Family Size |
| Married-Couple | 410 (90.5%) | 2.85 |
| Single Male/Father | 0 (0.0%) | - |
| Single Female/Mother | 43 (9.5%) | 2.58 |
| Total Families | 453 (100.0%) | 2.82 |
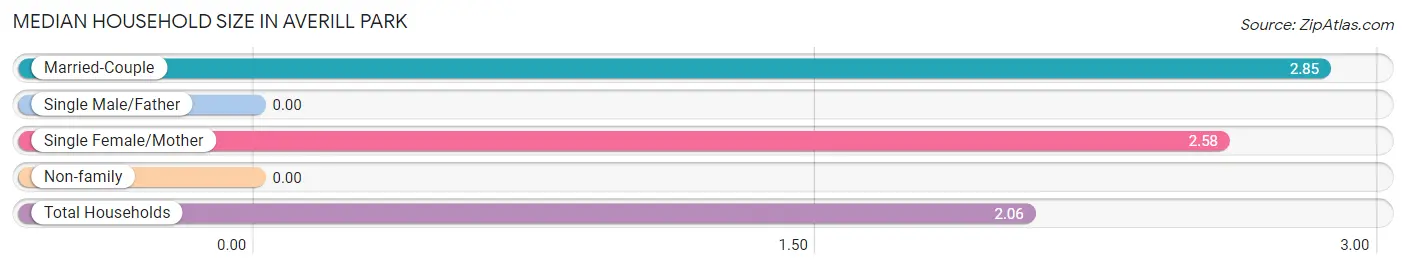
Median Household Size in Averill Park
| Household Type | # Households | Household Size |
| Married-Couple | 410 (52.4%) | 2.85 |
| Single Male/Father | 0 (0.0%) | - |
| Single Female/Mother | 43 (5.5%) | 2.58 |
| Non-family | 329 (42.1%) | - |
| Total Households | 782 (100.0%) | 2.06 |
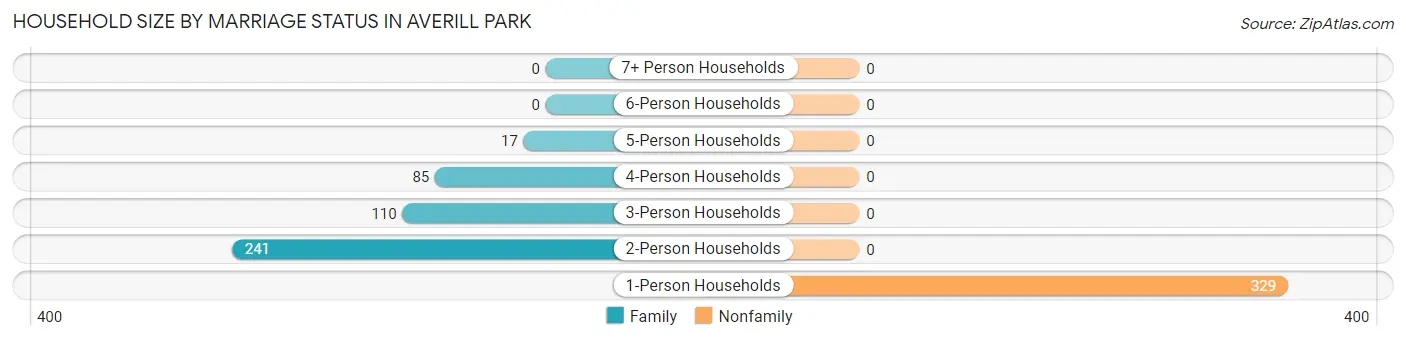
Household Size by Marriage Status in Averill Park
Out of a total of 782 households in Averill Park, 453 (57.9%) are family households, while 329 (42.1%) are nonfamily households. The most numerous type of family households are 2-person households, comprising 241, and the most common type of nonfamily households are 1-person households, comprising 329.
| Household Size | Family Households | Nonfamily Households |
| 1-Person Households | - | 329 (42.1%) |
| 2-Person Households | 241 (30.8%) | 0 (0.0%) |
| 3-Person Households | 110 (14.1%) | 0 (0.0%) |
| 4-Person Households | 85 (10.9%) | 0 (0.0%) |
| 5-Person Households | 17 (2.2%) | 0 (0.0%) |
| 6-Person Households | 0 (0.0%) | 0 (0.0%) |
| 7+ Person Households | 0 (0.0%) | 0 (0.0%) |
| Total | 453 (57.9%) | 329 (42.1%) |
Female Fertility in Averill Park
Fertility by Age in Averill Park
Average fertility rate in Averill Park is 107.0 births per 1,000 women. Women in the age bracket of 20 to 34 years have the highest fertility rate with 216.0 births per 1,000 women. Women in the age bracket of 20 to 34 years acount for 100.0% of all women with births.
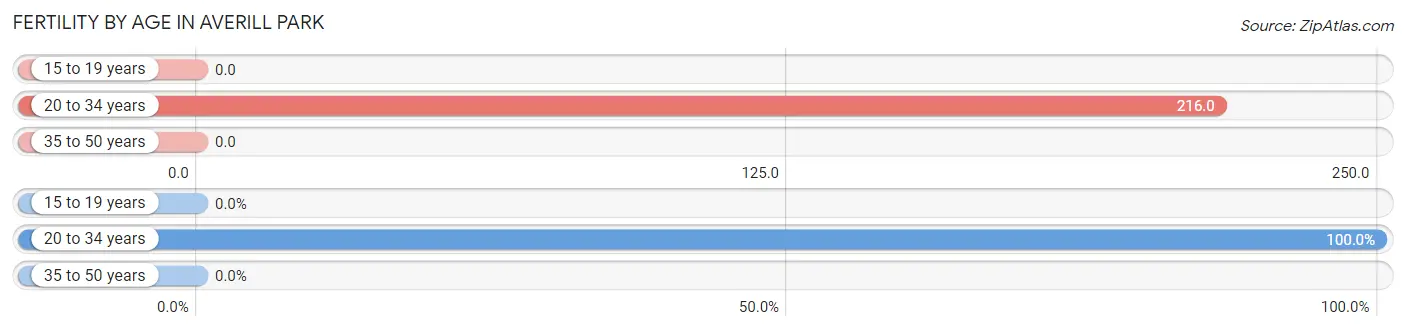
| Age Bracket | Women with Births | Births / 1,000 Women |
| 15 to 19 years | 0 (0.0%) | 0.0 |
| 20 to 34 years | 27 (100.0%) | 216.0 |
| 35 to 50 years | 0 (0.0%) | 0.0 |
| Total | 27 (100.0%) | 107.0 |
Fertility by Age by Marriage Status in Averill Park
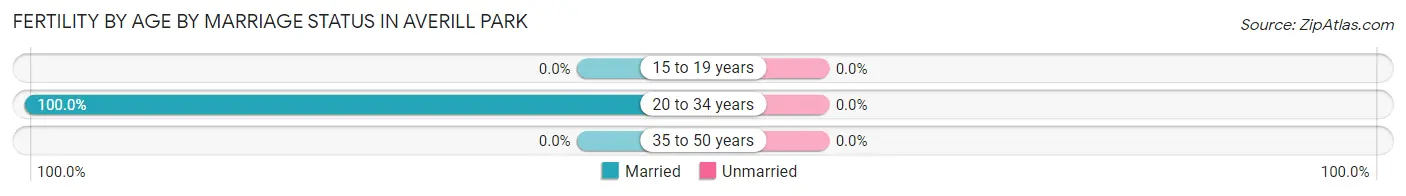
| Age Bracket | Married | Unmarried |
| 15 to 19 years | 0 (0.0%) | 0 (0.0%) |
| 20 to 34 years | 27 (100.0%) | 0 (0.0%) |
| 35 to 50 years | 0 (0.0%) | 0 (0.0%) |
| Total | 27 (100.0%) | 0 (0.0%) |
Fertility by Education in Averill Park
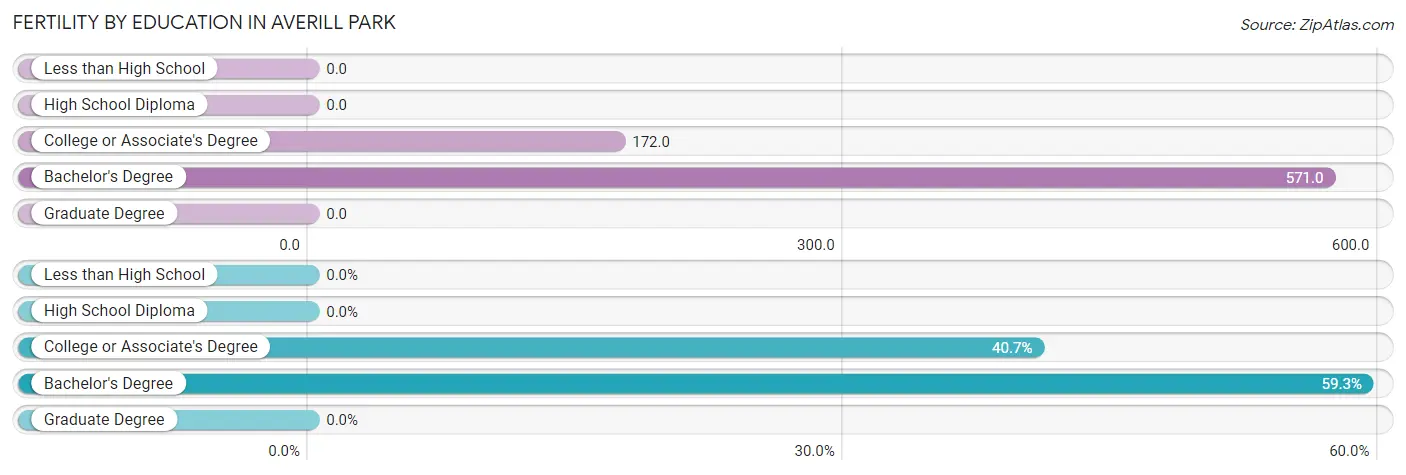
| Educational Attainment | Women with Births | Births / 1,000 Women |
| Less than High School | 0 (0.0%) | 0.0 |
| High School Diploma | 0 (0.0%) | 0.0 |
| College or Associate's Degree | 11 (40.7%) | 172.0 |
| Bachelor's Degree | 16 (59.3%) | 571.0 |
| Graduate Degree | 0 (0.0%) | 0.0 |
| Total | 27 (100.0%) | 107.0 |
Fertility by Education by Marriage Status in Averill Park
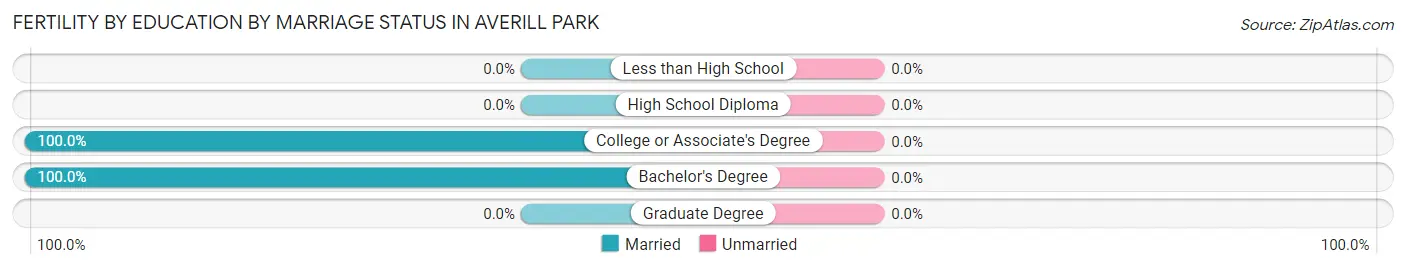
| Educational Attainment | Married | Unmarried |
| Less than High School | 0 (0.0%) | 0 (0.0%) |
| High School Diploma | 0 (0.0%) | 0 (0.0%) |
| College or Associate's Degree | 11 (100.0%) | 0 (0.0%) |
| Bachelor's Degree | 16 (100.0%) | 0 (0.0%) |
| Graduate Degree | 0 (0.0%) | 0 (0.0%) |
| Total | 27 (100.0%) | 0 (0.0%) |
Employment Characteristics in Averill Park
Employment by Class of Employer in Averill Park
Among the 911 employed individuals in Averill Park, private company employees (464 | 50.9%), state government employees (111 | 12.2%), and local government employees (99 | 10.9%) make up the most common classes of employment.
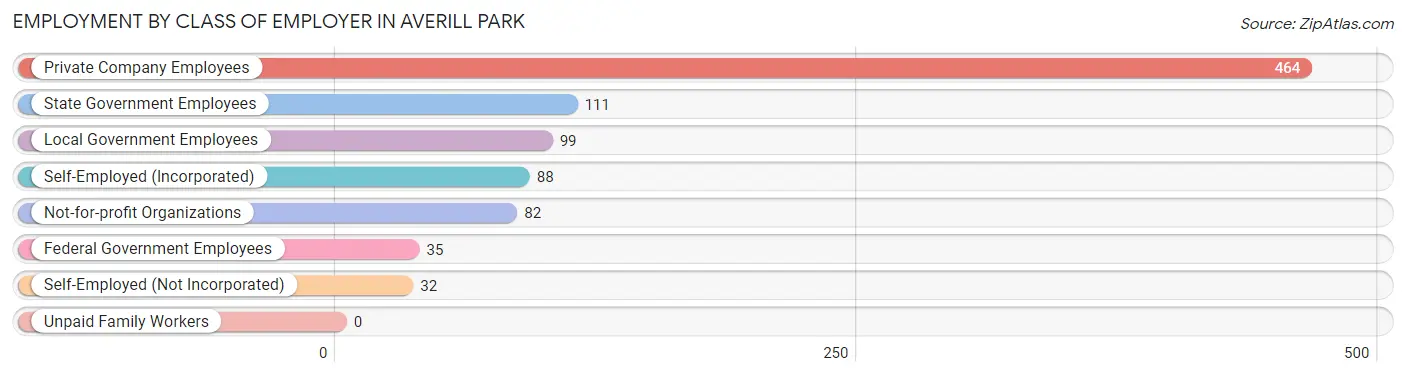
| Employer Class | # Employees | % Employees |
| Private Company Employees | 464 | 50.9% |
| Self-Employed (Incorporated) | 88 | 9.7% |
| Self-Employed (Not Incorporated) | 32 | 3.5% |
| Not-for-profit Organizations | 82 | 9.0% |
| Local Government Employees | 99 | 10.9% |
| State Government Employees | 111 | 12.2% |
| Federal Government Employees | 35 | 3.8% |
| Unpaid Family Workers | 0 | 0.0% |
| Total | 911 | 100.0% |
Employment Status by Age in Averill Park
According to the labor force statistics for Averill Park, out of the total population over 16 years of age (1,465), 68.8% or 1,008 individuals are in the labor force, with 4.7% or 47 of them unemployed. The age group with the highest labor force participation rate is 20 to 24 years, with 100.0% or 70 individuals in the labor force. Within the labor force, the 25 to 29 years age range has the highest percentage of unemployed individuals, with 37.3% or 47 of them being unemployed.
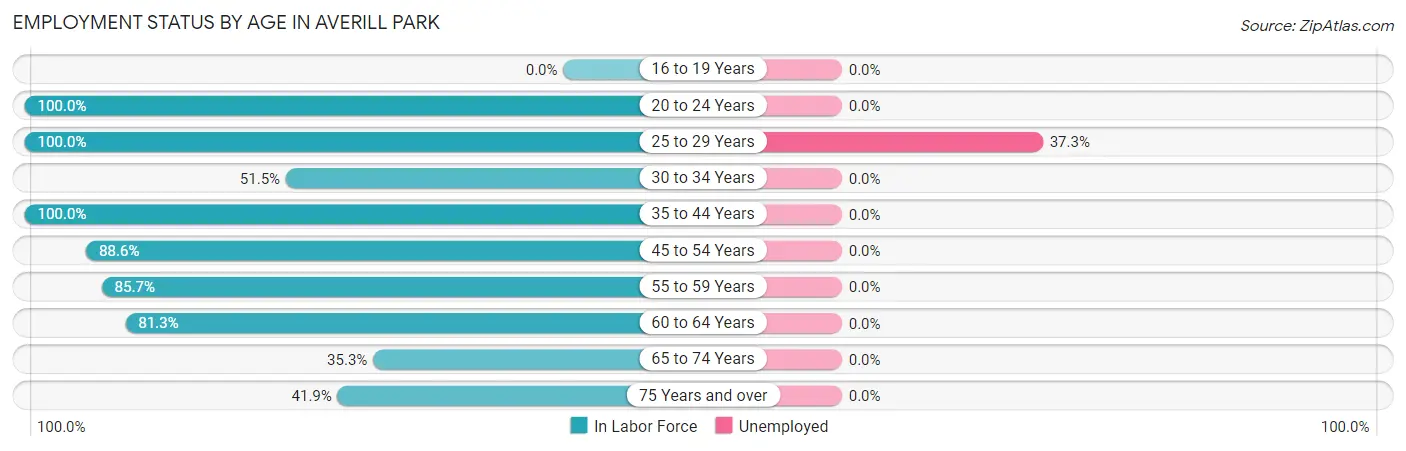
| Age Bracket | In Labor Force | Unemployed |
| 16 to 19 Years | 0 (0.0%) | 0 (0.0%) |
| 20 to 24 Years | 70 (100.0%) | 0 (0.0%) |
| 25 to 29 Years | 126 (100.0%) | 47 (37.3%) |
| 30 to 34 Years | 17 (51.5%) | 0 (0.0%) |
| 35 to 44 Years | 59 (100.0%) | 0 (0.0%) |
| 45 to 54 Years | 318 (88.6%) | 0 (0.0%) |
| 55 to 59 Years | 120 (85.7%) | 0 (0.0%) |
| 60 to 64 Years | 156 (81.3%) | 0 (0.0%) |
| 65 to 74 Years | 106 (35.3%) | 0 (0.0%) |
| 75 Years and over | 36 (41.9%) | 0 (0.0%) |
| Total | 1,008 (68.8%) | 47 (4.7%) |
Employment Status by Educational Attainment in Averill Park
According to labor force statistics for Averill Park, 87.6% of individuals (796) out of the total population between 25 and 64 years of age (909) are in the labor force, with 5.9% or 47 of them being unemployed. The group with the highest labor force participation rate are those with the educational attainment of less than high school, with 100.0% or 12 individuals in the labor force. Within the labor force, individuals with high school diploma education have the highest percentage of unemployment, with 17.4% or 47 of them being unemployed.
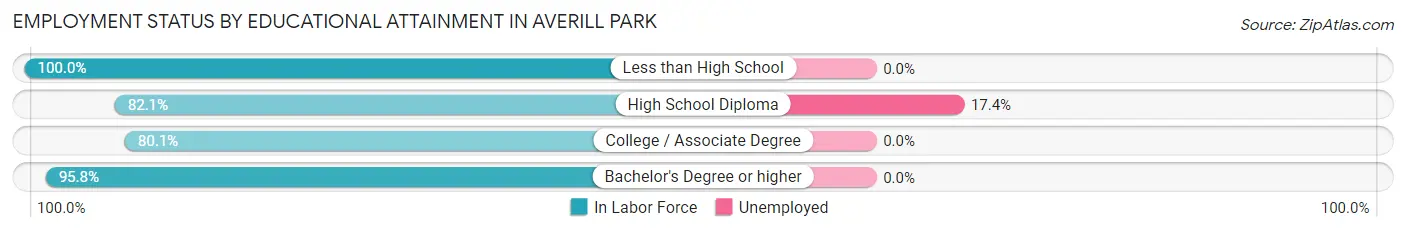
| Educational Attainment | In Labor Force | Unemployed |
| Less than High School | 12 (100.0%) | 0 (0.0%) |
| High School Diploma | 270 (82.1%) | 57 (17.4%) |
| College / Associate Degree | 153 (80.1%) | 0 (0.0%) |
| Bachelor's Degree or higher | 361 (95.8%) | 0 (0.0%) |
| Total | 796 (87.6%) | 54 (5.9%) |
Employment Occupations by Sex in Averill Park
Management, Business, Science and Arts Occupations
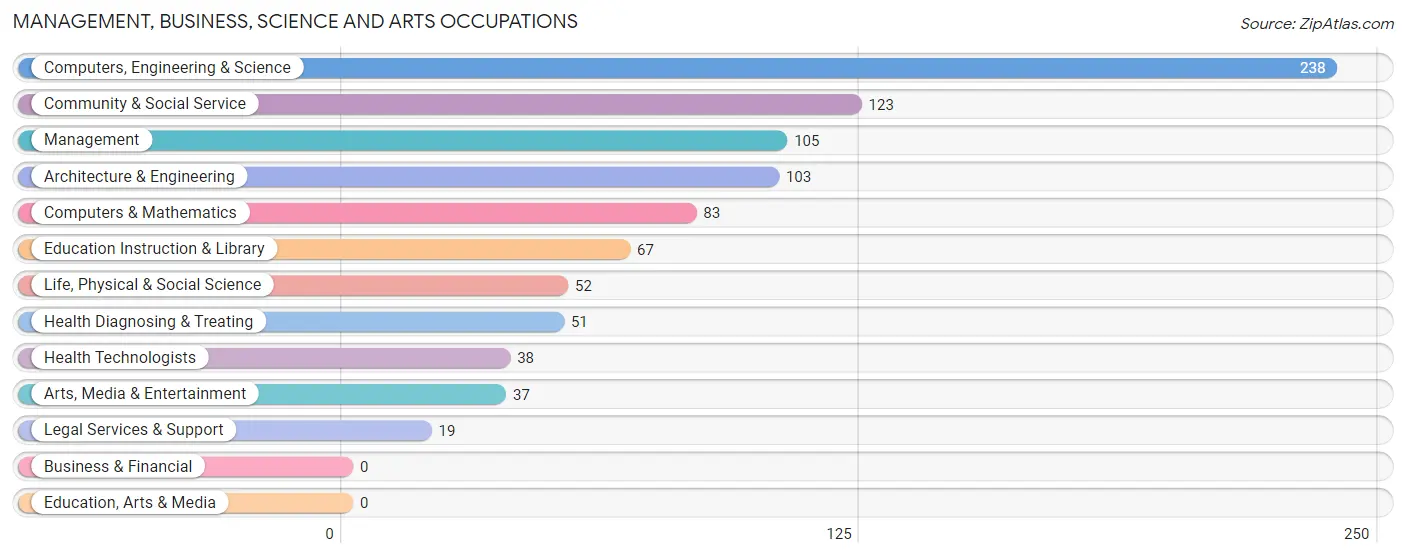
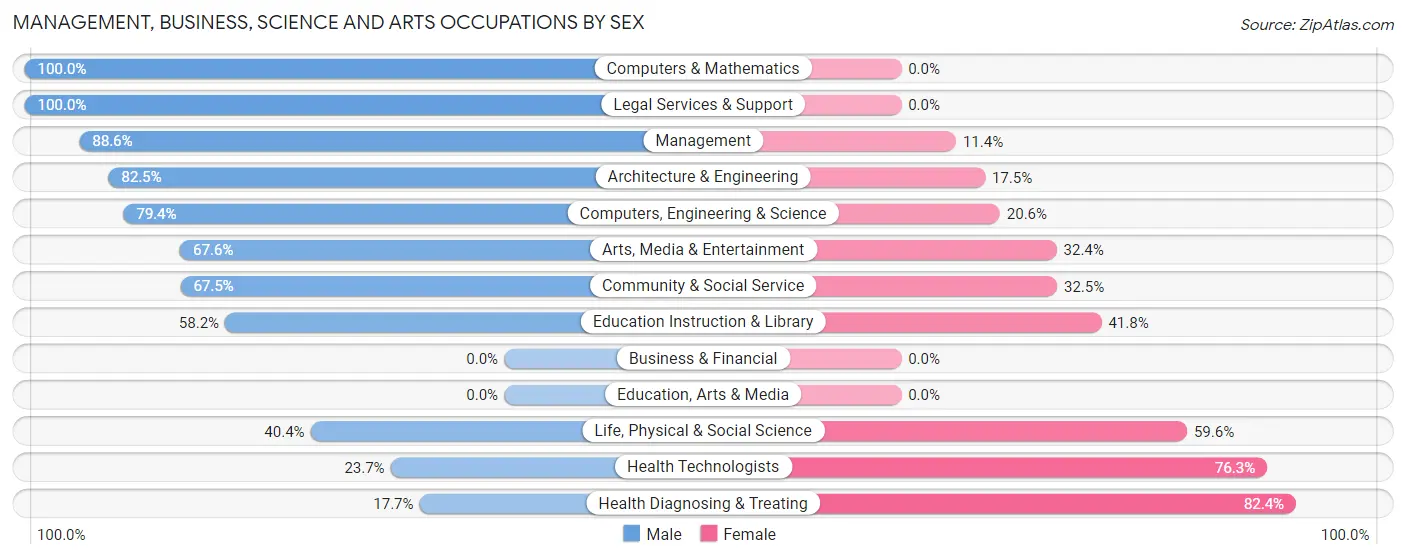
The most common Management, Business, Science and Arts occupations in Averill Park are Computers, Engineering & Science (238 | 24.8%), Community & Social Service (123 | 12.8%), Management (105 | 10.9%), Architecture & Engineering (103 | 10.7%), and Computers & Mathematics (83 | 8.6%).
Management, Business, Science and Arts Occupations by Sex
Within the Management, Business, Science and Arts occupations in Averill Park, the most male-oriented occupations are Computers & Mathematics (100.0%), Legal Services & Support (100.0%), and Management (88.6%), while the most female-oriented occupations are Health Diagnosing & Treating (82.4%), Health Technologists (76.3%), and Life, Physical & Social Science (59.6%).
| Occupation | Male | Female |
| Management | 93 (88.6%) | 12 (11.4%) |
| Business & Financial | 0 (0.0%) | 0 (0.0%) |
| Computers, Engineering & Science | 189 (79.4%) | 49 (20.6%) |
| Computers & Mathematics | 83 (100.0%) | 0 (0.0%) |
| Architecture & Engineering | 85 (82.5%) | 18 (17.5%) |
| Life, Physical & Social Science | 21 (40.4%) | 31 (59.6%) |
| Community & Social Service | 83 (67.5%) | 40 (32.5%) |
| Education, Arts & Media | 0 (0.0%) | 0 (0.0%) |
| Legal Services & Support | 19 (100.0%) | 0 (0.0%) |
| Education Instruction & Library | 39 (58.2%) | 28 (41.8%) |
| Arts, Media & Entertainment | 25 (67.6%) | 12 (32.4%) |
| Health Diagnosing & Treating | 9 (17.6%) | 42 (82.4%) |
| Health Technologists | 9 (23.7%) | 29 (76.3%) |
| Total (Category) | 374 (72.3%) | 143 (27.7%) |
| Total (Overall) | 574 (59.7%) | 387 (40.3%) |
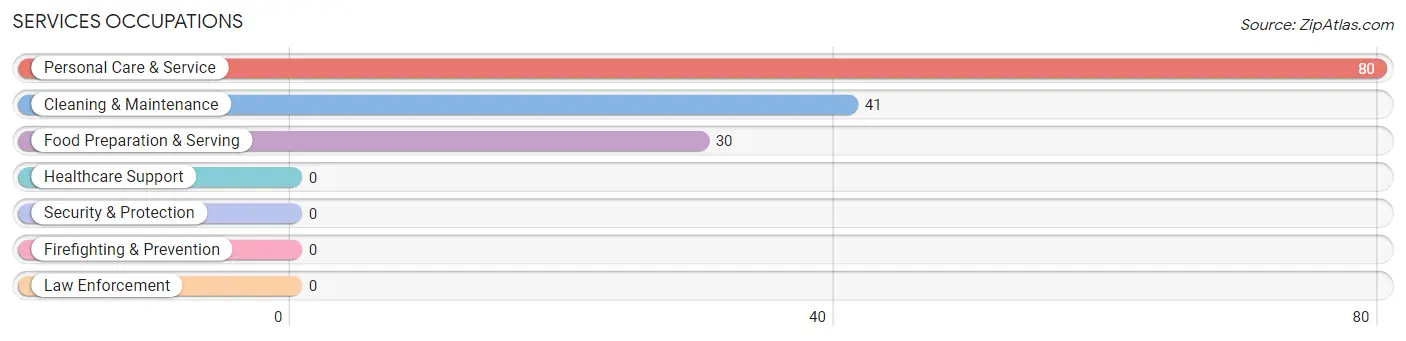
Services Occupations
The most common Services occupations in Averill Park are Personal Care & Service (80 | 8.3%), Cleaning & Maintenance (41 | 4.3%), and Food Preparation & Serving (30 | 3.1%).
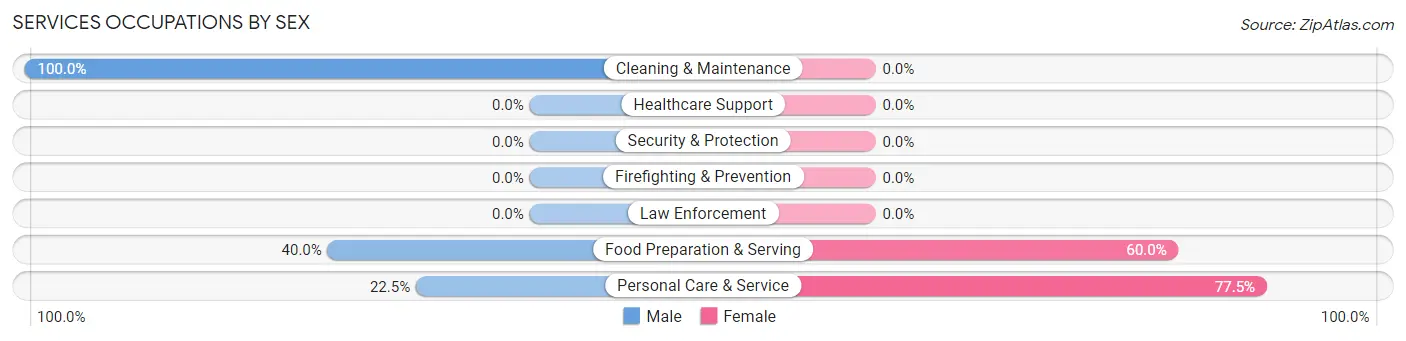
Services Occupations by Sex
Within the Services occupations in Averill Park, the most male-oriented occupations are Cleaning & Maintenance (100.0%), Food Preparation & Serving (40.0%), and Personal Care & Service (22.5%), while the most female-oriented occupations are Personal Care & Service (77.5%), and Food Preparation & Serving (60.0%).
| Occupation | Male | Female |
| Healthcare Support | 0 (0.0%) | 0 (0.0%) |
| Security & Protection | 0 (0.0%) | 0 (0.0%) |
| Firefighting & Prevention | 0 (0.0%) | 0 (0.0%) |
| Law Enforcement | 0 (0.0%) | 0 (0.0%) |
| Food Preparation & Serving | 12 (40.0%) | 18 (60.0%) |
| Cleaning & Maintenance | 41 (100.0%) | 0 (0.0%) |
| Personal Care & Service | 18 (22.5%) | 62 (77.5%) |
| Total (Category) | 71 (47.0%) | 80 (53.0%) |
| Total (Overall) | 574 (59.7%) | 387 (40.3%) |
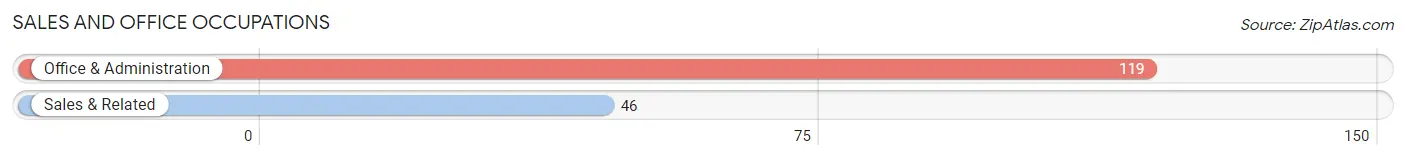
Sales and Office Occupations
The most common Sales and Office occupations in Averill Park are Office & Administration (119 | 12.4%), and Sales & Related (46 | 4.8%).
Sales and Office Occupations by Sex
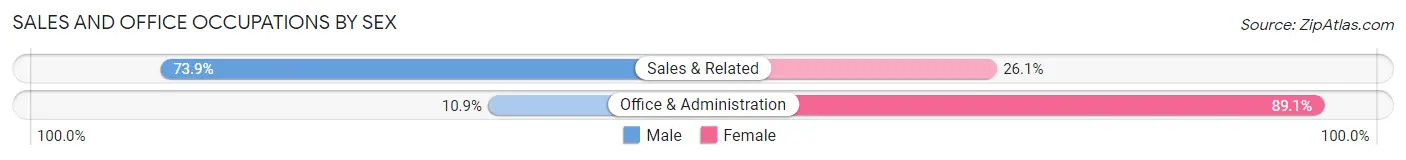
| Occupation | Male | Female |
| Sales & Related | 34 (73.9%) | 12 (26.1%) |
| Office & Administration | 13 (10.9%) | 106 (89.1%) |
| Total (Category) | 47 (28.5%) | 118 (71.5%) |
| Total (Overall) | 574 (59.7%) | 387 (40.3%) |
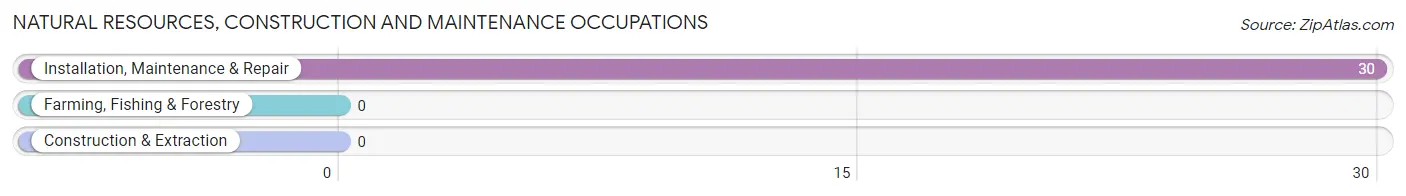
Natural Resources, Construction and Maintenance Occupations
The most common Natural Resources, Construction and Maintenance occupations in Averill Park are , and Installation, Maintenance & Repair (30 | 3.1%).
Natural Resources, Construction and Maintenance Occupations by Sex
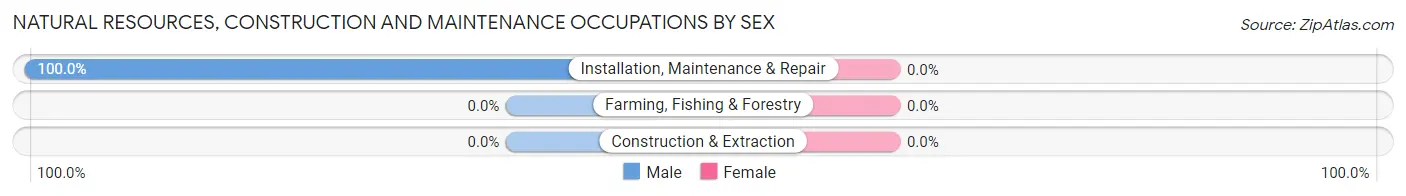
| Occupation | Male | Female |
| Farming, Fishing & Forestry | 0 (0.0%) | 0 (0.0%) |
| Construction & Extraction | 0 (0.0%) | 0 (0.0%) |
| Installation, Maintenance & Repair | 30 (100.0%) | 0 (0.0%) |
| Total (Category) | 30 (100.0%) | 0 (0.0%) |
| Total (Overall) | 574 (59.7%) | 387 (40.3%) |
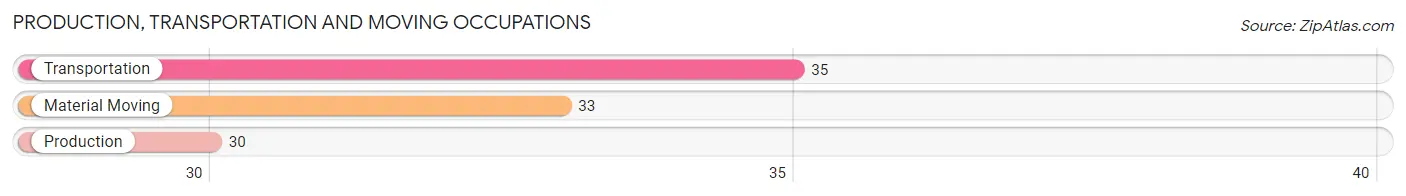
Production, Transportation and Moving Occupations
The most common Production, Transportation and Moving occupations in Averill Park are Transportation (35 | 3.6%), Material Moving (33 | 3.4%), and Production (30 | 3.1%).
Production, Transportation and Moving Occupations by Sex
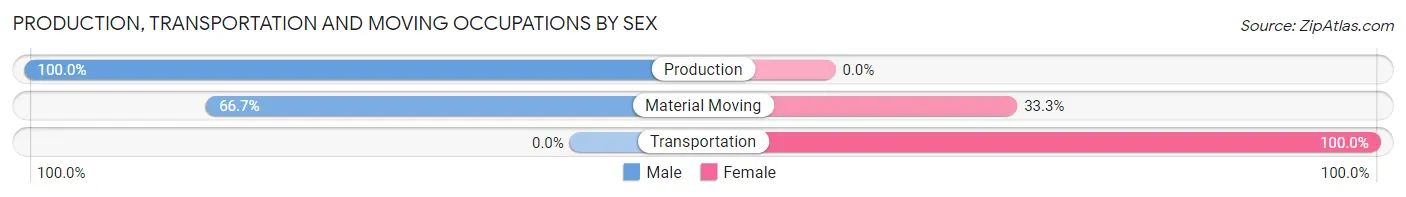
| Occupation | Male | Female |
| Production | 30 (100.0%) | 0 (0.0%) |
| Transportation | 0 (0.0%) | 35 (100.0%) |
| Material Moving | 22 (66.7%) | 11 (33.3%) |
| Total (Category) | 52 (53.1%) | 46 (46.9%) |
| Total (Overall) | 574 (59.7%) | 387 (40.3%) |
Employment Industries by Sex in Averill Park
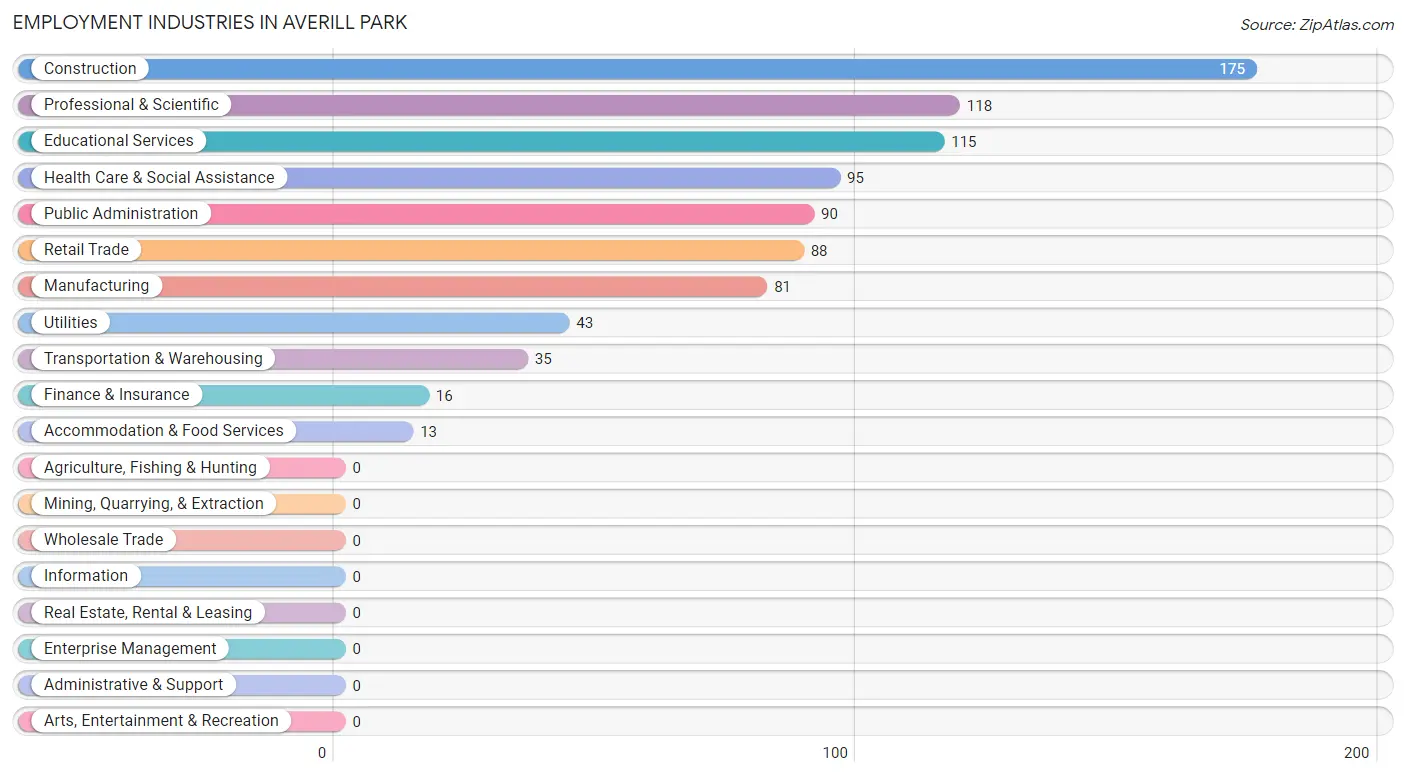
Employment Industries in Averill Park
The major employment industries in Averill Park include Construction (175 | 18.2%), Professional & Scientific (118 | 12.3%), Educational Services (115 | 12.0%), Health Care & Social Assistance (95 | 9.9%), and Public Administration (90 | 9.4%).
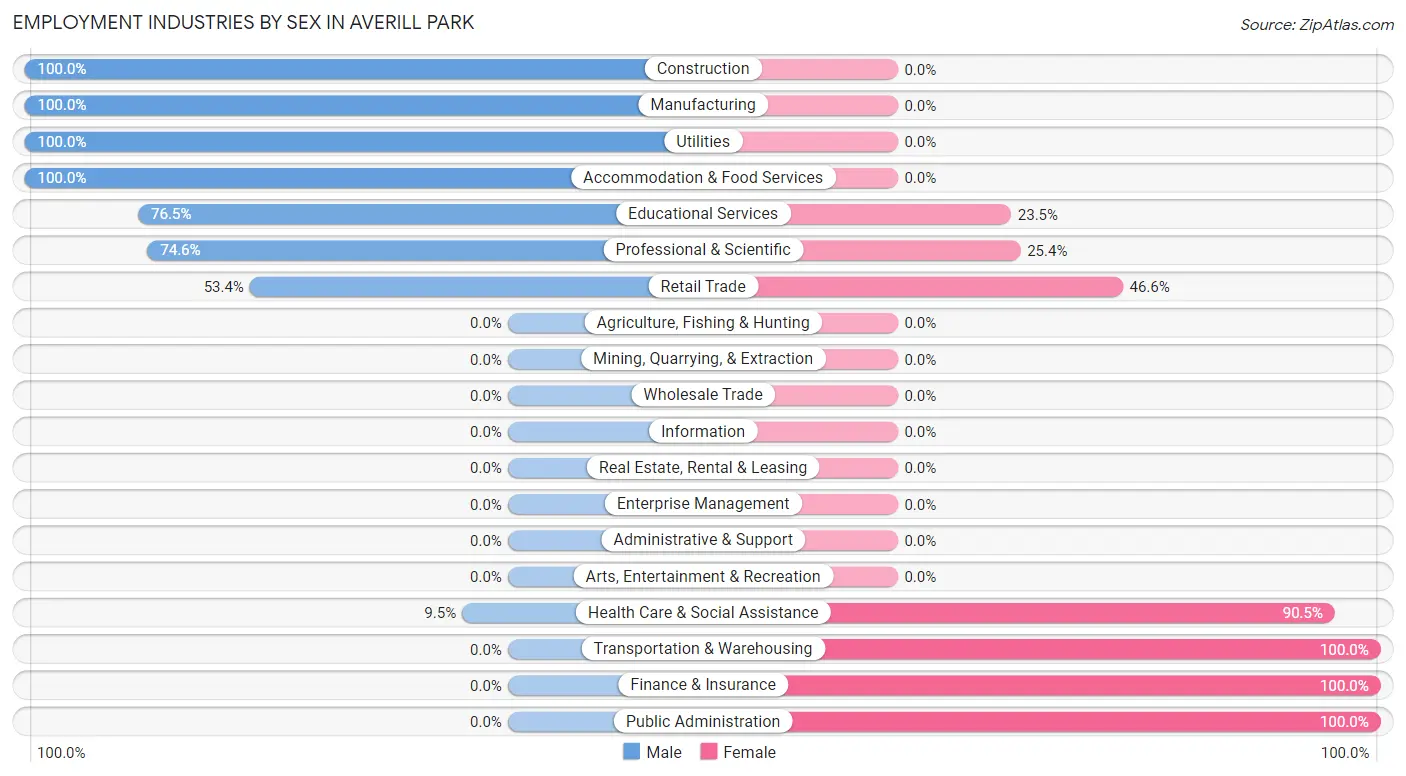
Employment Industries by Sex in Averill Park
The Averill Park industries that see more men than women are Construction (100.0%), Manufacturing (100.0%), and Utilities (100.0%), whereas the industries that tend to have a higher number of women are Transportation & Warehousing (100.0%), Finance & Insurance (100.0%), and Public Administration (100.0%).
| Industry | Male | Female |
| Agriculture, Fishing & Hunting | 0 (0.0%) | 0 (0.0%) |
| Mining, Quarrying, & Extraction | 0 (0.0%) | 0 (0.0%) |
| Construction | 175 (100.0%) | 0 (0.0%) |
| Manufacturing | 81 (100.0%) | 0 (0.0%) |
| Wholesale Trade | 0 (0.0%) | 0 (0.0%) |
| Retail Trade | 47 (53.4%) | 41 (46.6%) |
| Transportation & Warehousing | 0 (0.0%) | 35 (100.0%) |
| Utilities | 43 (100.0%) | 0 (0.0%) |
| Information | 0 (0.0%) | 0 (0.0%) |
| Finance & Insurance | 0 (0.0%) | 16 (100.0%) |
| Real Estate, Rental & Leasing | 0 (0.0%) | 0 (0.0%) |
| Professional & Scientific | 88 (74.6%) | 30 (25.4%) |
| Enterprise Management | 0 (0.0%) | 0 (0.0%) |
| Administrative & Support | 0 (0.0%) | 0 (0.0%) |
| Educational Services | 88 (76.5%) | 27 (23.5%) |
| Health Care & Social Assistance | 9 (9.5%) | 86 (90.5%) |
| Arts, Entertainment & Recreation | 0 (0.0%) | 0 (0.0%) |
| Accommodation & Food Services | 13 (100.0%) | 0 (0.0%) |
| Public Administration | 0 (0.0%) | 90 (100.0%) |
| Total | 574 (59.7%) | 387 (40.3%) |
Education in Averill Park
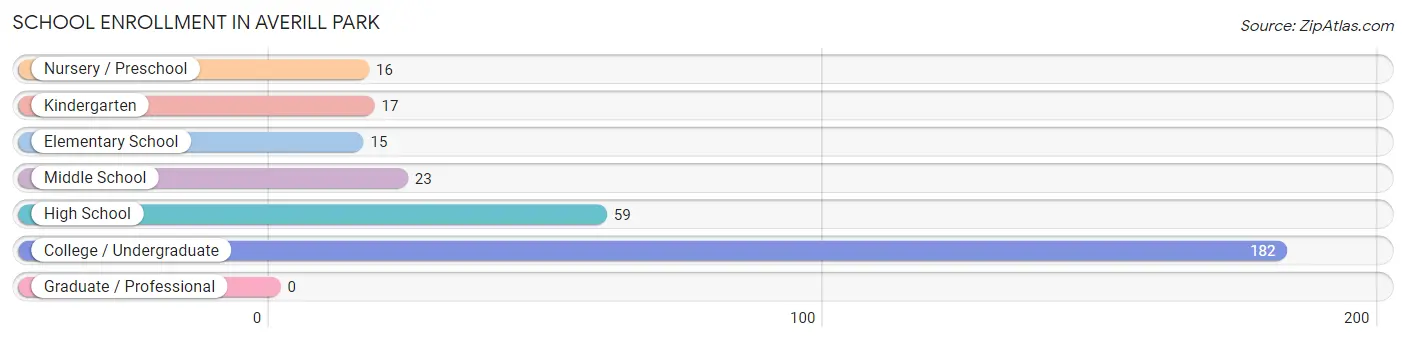
School Enrollment in Averill Park
The most common levels of schooling among the 312 students in Averill Park are college / undergraduate (182 | 58.3%), high school (59 | 18.9%), and middle school (23 | 7.4%).
| School Level | # Students | % Students |
| Nursery / Preschool | 16 | 5.1% |
| Kindergarten | 17 | 5.4% |
| Elementary School | 15 | 4.8% |
| Middle School | 23 | 7.4% |
| High School | 59 | 18.9% |
| College / Undergraduate | 182 | 58.3% |
| Graduate / Professional | 0 | 0.0% |
| Total | 312 | 100.0% |
School Enrollment by Age by Funding Source in Averill Park
Out of a total of 312 students who are enrolled in schools in Averill Park, 27 (8.7%) attend a private institution, while the remaining 285 (91.3%) are enrolled in public schools. The age group of 3 to 4 year olds has the highest likelihood of being enrolled in private schools, with 16 (100.0% in the age bracket) enrolled. Conversely, the age group of 5 to 9 year old has the lowest likelihood of being enrolled in a private school, with 32 (100.0% in the age bracket) attending a public institution.
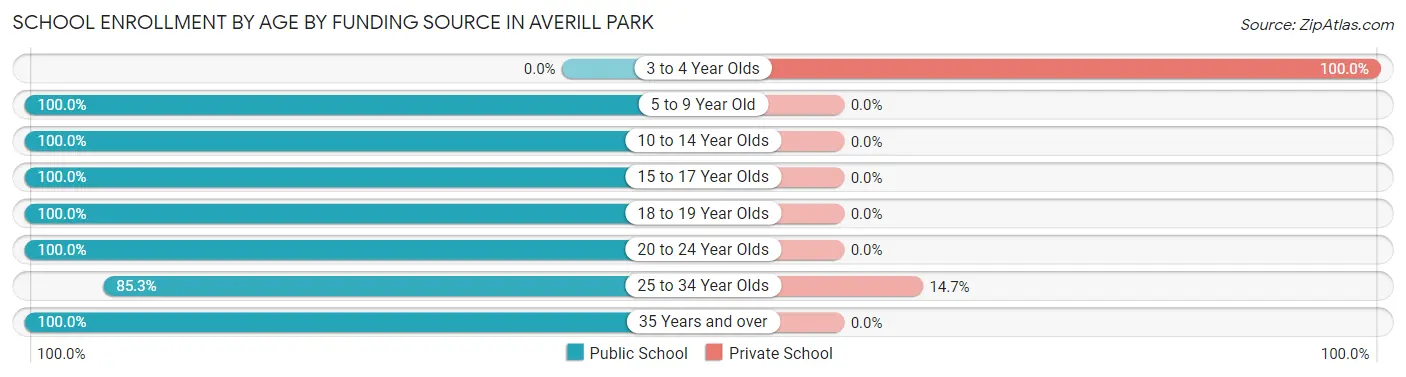
| Age Bracket | Public School | Private School |
| 3 to 4 Year Olds | 0 (0.0%) | 16 (100.0%) |
| 5 to 9 Year Old | 32 (100.0%) | 0 (0.0%) |
| 10 to 14 Year Olds | 23 (100.0%) | 0 (0.0%) |
| 15 to 17 Year Olds | 59 (100.0%) | 0 (0.0%) |
| 18 to 19 Year Olds | 41 (100.0%) | 0 (0.0%) |
| 20 to 24 Year Olds | 54 (100.0%) | 0 (0.0%) |
| 25 to 34 Year Olds | 64 (85.3%) | 11 (14.7%) |
| 35 Years and over | 12 (100.0%) | 0 (0.0%) |
| Total | 285 (91.3%) | 27 (8.7%) |
Educational Attainment by Field of Study in Averill Park
Computers & mathematics (130 | 21.6%), engineering (113 | 18.8%), bio, nature & agricultural (83 | 13.8%), visual & performing arts (71 | 11.8%), and education (68 | 11.3%) are the most common fields of study among 602 individuals in Averill Park who have obtained a bachelor's degree or higher.
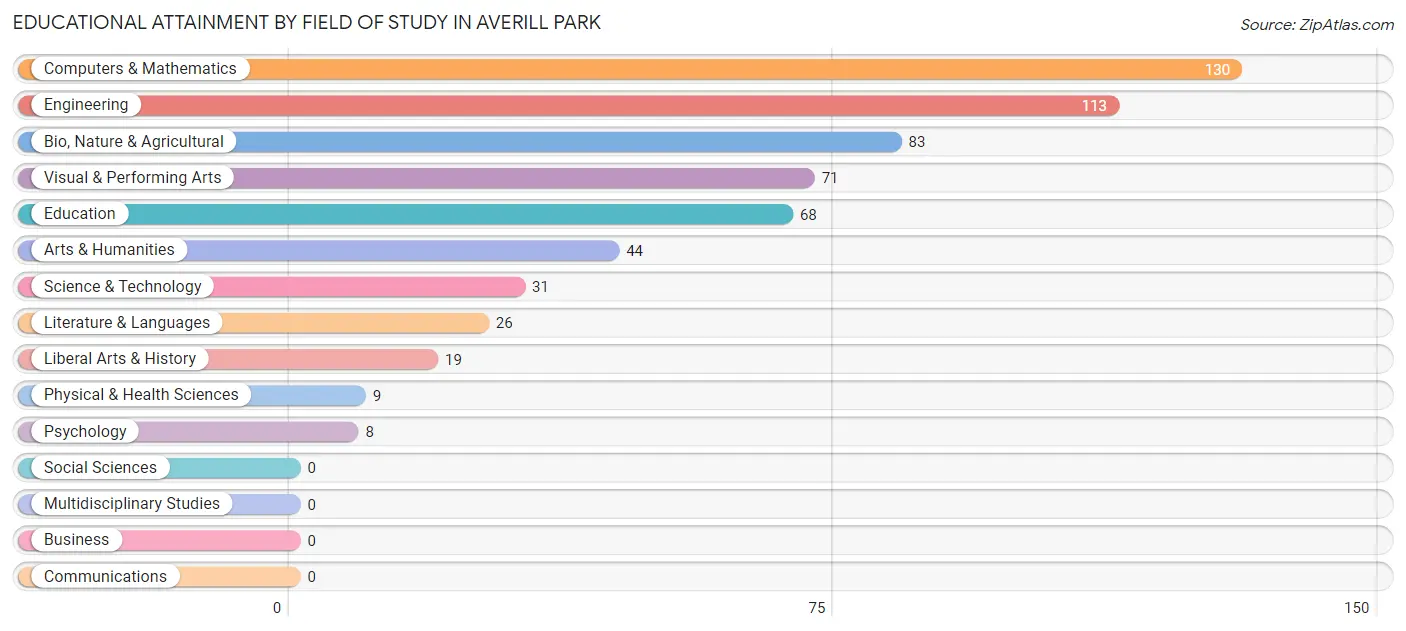
| Field of Study | # Graduates | % Graduates |
| Computers & Mathematics | 130 | 21.6% |
| Bio, Nature & Agricultural | 83 | 13.8% |
| Physical & Health Sciences | 9 | 1.5% |
| Psychology | 8 | 1.3% |
| Social Sciences | 0 | 0.0% |
| Engineering | 113 | 18.8% |
| Multidisciplinary Studies | 0 | 0.0% |
| Science & Technology | 31 | 5.1% |
| Business | 0 | 0.0% |
| Education | 68 | 11.3% |
| Literature & Languages | 26 | 4.3% |
| Liberal Arts & History | 19 | 3.2% |
| Visual & Performing Arts | 71 | 11.8% |
| Communications | 0 | 0.0% |
| Arts & Humanities | 44 | 7.3% |
| Total | 602 | 100.0% |
Transportation & Commute in Averill Park
Vehicle Availability by Sex in Averill Park
The most prevalent vehicle ownership categories in Averill Park are males with 2 vehicles (252, accounting for 47.1%) and females with 2 vehicles (141, making up 67.0%).
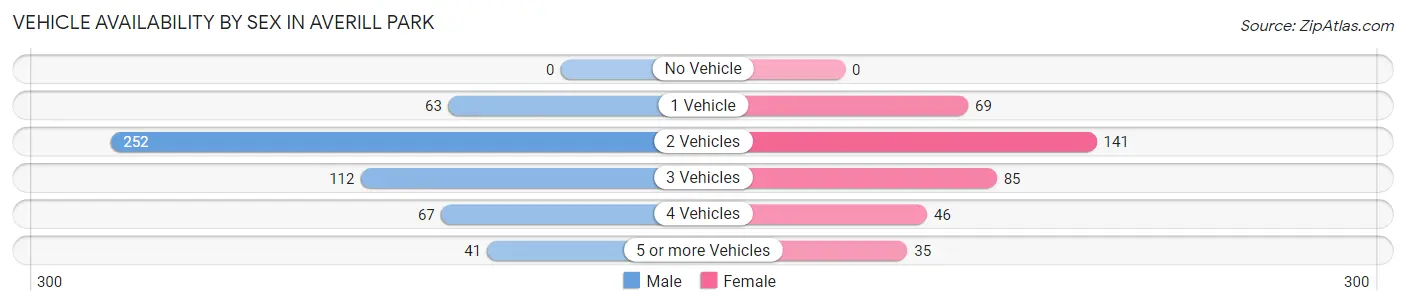
| Vehicles Available | Male | Female |
| No Vehicle | 0 (0.0%) | 0 (0.0%) |
| 1 Vehicle | 63 (11.8%) | 69 (18.3%) |
| 2 Vehicles | 252 (47.1%) | 141 (37.5%) |
| 3 Vehicles | 112 (20.9%) | 85 (22.6%) |
| 4 Vehicles | 67 (12.5%) | 46 (12.2%) |
| 5 or more Vehicles | 41 (7.7%) | 35 (9.3%) |
| Total | 535 (100.0%) | 376 (100.0%) |
Commute Time in Averill Park
The most frequently occuring commute durations in Averill Park are 30 to 34 minutes (165 commuters, 19.9%), 20 to 24 minutes (150 commuters, 18.1%), and 25 to 29 minutes (98 commuters, 11.8%).
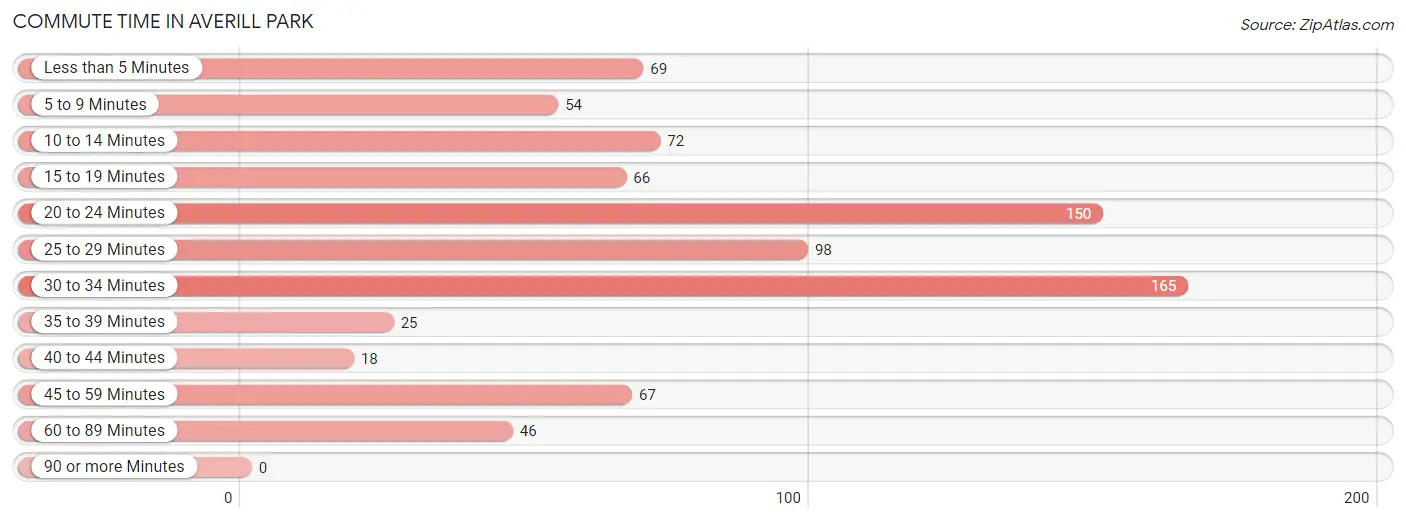
| Commute Time | # Commuters | % Commuters |
| Less than 5 Minutes | 69 | 8.3% |
| 5 to 9 Minutes | 54 | 6.5% |
| 10 to 14 Minutes | 72 | 8.7% |
| 15 to 19 Minutes | 66 | 8.0% |
| 20 to 24 Minutes | 150 | 18.1% |
| 25 to 29 Minutes | 98 | 11.8% |
| 30 to 34 Minutes | 165 | 19.9% |
| 35 to 39 Minutes | 25 | 3.0% |
| 40 to 44 Minutes | 18 | 2.2% |
| 45 to 59 Minutes | 67 | 8.1% |
| 60 to 89 Minutes | 46 | 5.5% |
| 90 or more Minutes | 0 | 0.0% |
Commute Time by Sex in Averill Park
The most common commute times in Averill Park are 30 to 34 minutes (89 commuters, 19.1%) for males and 30 to 34 minutes (76 commuters, 20.9%) for females.
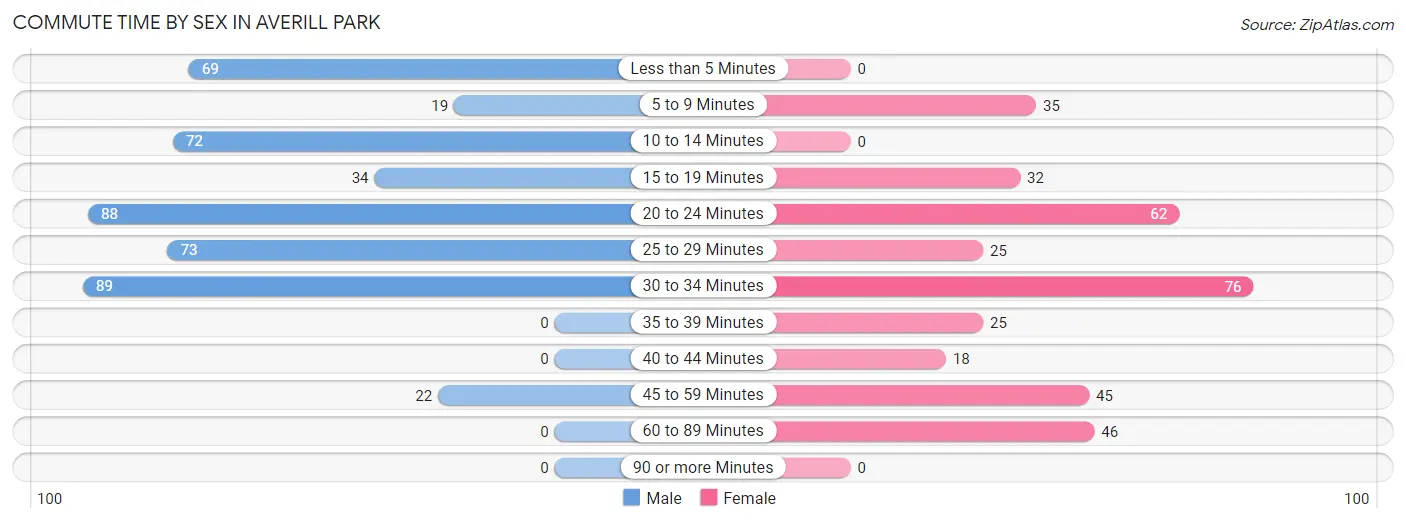
| Commute Time | Male | Female |
| Less than 5 Minutes | 69 (14.8%) | 0 (0.0%) |
| 5 to 9 Minutes | 19 (4.1%) | 35 (9.6%) |
| 10 to 14 Minutes | 72 (15.4%) | 0 (0.0%) |
| 15 to 19 Minutes | 34 (7.3%) | 32 (8.8%) |
| 20 to 24 Minutes | 88 (18.9%) | 62 (17.0%) |
| 25 to 29 Minutes | 73 (15.7%) | 25 (6.9%) |
| 30 to 34 Minutes | 89 (19.1%) | 76 (20.9%) |
| 35 to 39 Minutes | 0 (0.0%) | 25 (6.9%) |
| 40 to 44 Minutes | 0 (0.0%) | 18 (5.0%) |
| 45 to 59 Minutes | 22 (4.7%) | 45 (12.4%) |
| 60 to 89 Minutes | 0 (0.0%) | 46 (12.6%) |
| 90 or more Minutes | 0 (0.0%) | 0 (0.0%) |
Time of Departure to Work by Sex in Averill Park
The most frequent times of departure to work in Averill Park are 6:30 AM to 6:59 AM (171, 36.7%) for males and 8:00 AM to 8:29 AM (144, 39.6%) for females.
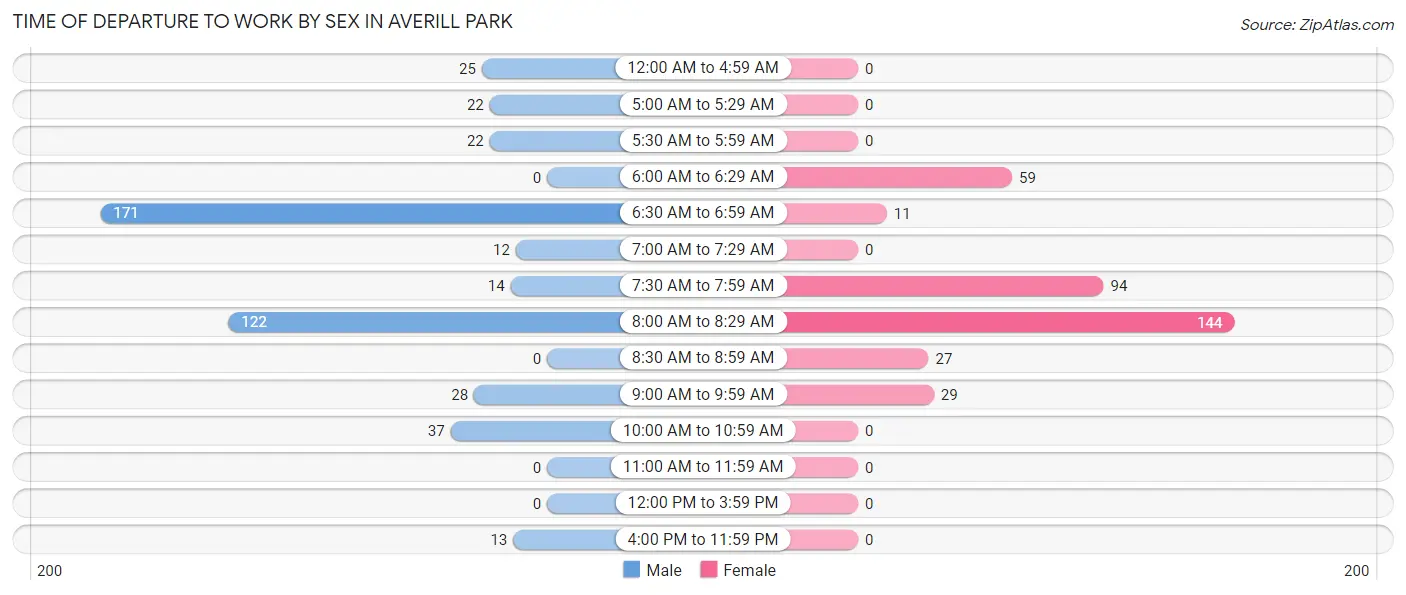
| Time of Departure | Male | Female |
| 12:00 AM to 4:59 AM | 25 (5.4%) | 0 (0.0%) |
| 5:00 AM to 5:29 AM | 22 (4.7%) | 0 (0.0%) |
| 5:30 AM to 5:59 AM | 22 (4.7%) | 0 (0.0%) |
| 6:00 AM to 6:29 AM | 0 (0.0%) | 59 (16.2%) |
| 6:30 AM to 6:59 AM | 171 (36.7%) | 11 (3.0%) |
| 7:00 AM to 7:29 AM | 12 (2.6%) | 0 (0.0%) |
| 7:30 AM to 7:59 AM | 14 (3.0%) | 94 (25.8%) |
| 8:00 AM to 8:29 AM | 122 (26.2%) | 144 (39.6%) |
| 8:30 AM to 8:59 AM | 0 (0.0%) | 27 (7.4%) |
| 9:00 AM to 9:59 AM | 28 (6.0%) | 29 (8.0%) |
| 10:00 AM to 10:59 AM | 37 (7.9%) | 0 (0.0%) |
| 11:00 AM to 11:59 AM | 0 (0.0%) | 0 (0.0%) |
| 12:00 PM to 3:59 PM | 0 (0.0%) | 0 (0.0%) |
| 4:00 PM to 11:59 PM | 13 (2.8%) | 0 (0.0%) |
| Total | 466 (100.0%) | 364 (100.0%) |
Housing Occupancy in Averill Park
Occupancy by Ownership in Averill Park
Of the total 782 dwellings in Averill Park, owner-occupied units account for 626 (80.0%), while renter-occupied units make up 156 (20.0%).
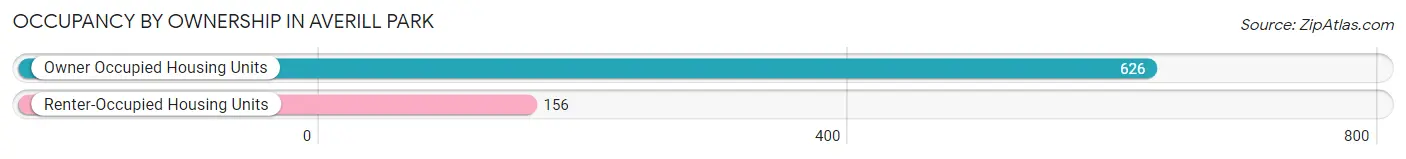
| Occupancy | # Housing Units | % Housing Units |
| Owner Occupied Housing Units | 626 | 80.0% |
| Renter-Occupied Housing Units | 156 | 20.0% |
| Total Occupied Housing Units | 782 | 100.0% |
Occupancy by Household Size in Averill Park
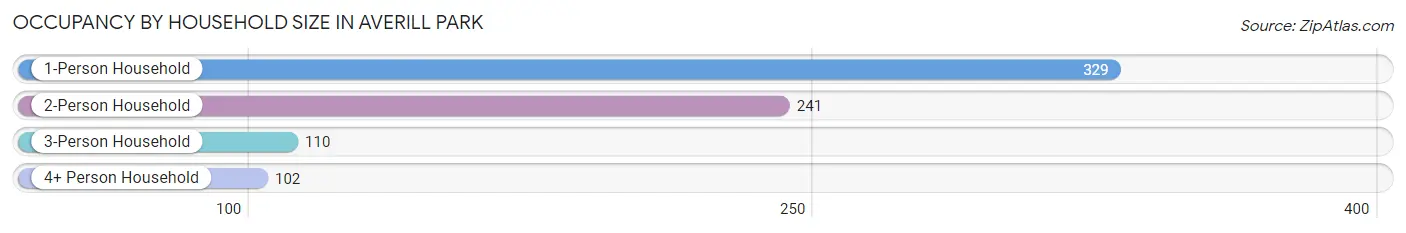
| Household Size | # Housing Units | % Housing Units |
| 1-Person Household | 329 | 42.1% |
| 2-Person Household | 241 | 30.8% |
| 3-Person Household | 110 | 14.1% |
| 4+ Person Household | 102 | 13.0% |
| Total Housing Units | 782 | 100.0% |
Occupancy by Ownership by Household Size in Averill Park
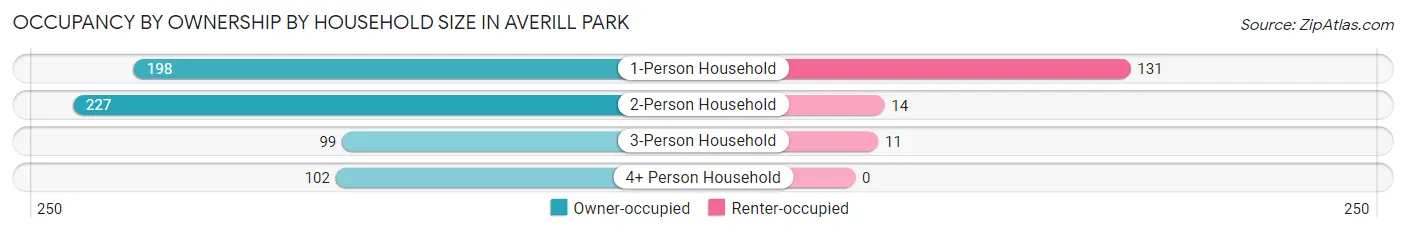
| Household Size | Owner-occupied | Renter-occupied |
| 1-Person Household | 198 (60.2%) | 131 (39.8%) |
| 2-Person Household | 227 (94.2%) | 14 (5.8%) |
| 3-Person Household | 99 (90.0%) | 11 (10.0%) |
| 4+ Person Household | 102 (100.0%) | 0 (0.0%) |
| Total Housing Units | 626 (80.0%) | 156 (20.0%) |
Occupancy by Educational Attainment in Averill Park
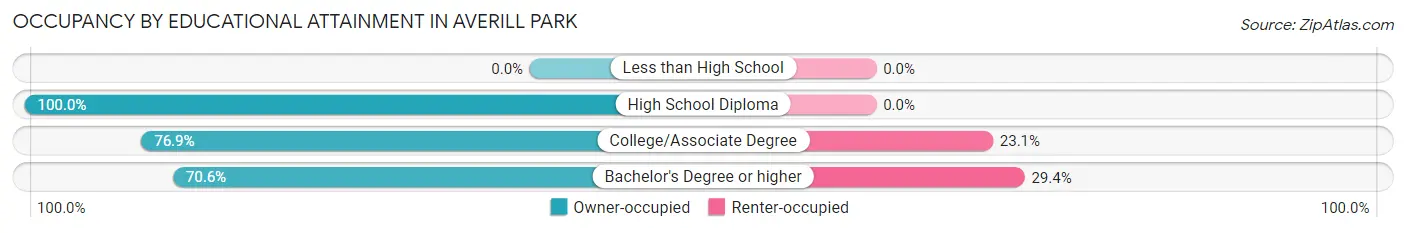
| Household Size | Owner-occupied | Renter-occupied |
| Less than High School | 0 (0.0%) | 0 (0.0%) |
| High School Diploma | 200 (100.0%) | 0 (0.0%) |
| College/Associate Degree | 186 (76.9%) | 56 (23.1%) |
| Bachelor's Degree or higher | 240 (70.6%) | 100 (29.4%) |
Occupancy by Age of Householder in Averill Park
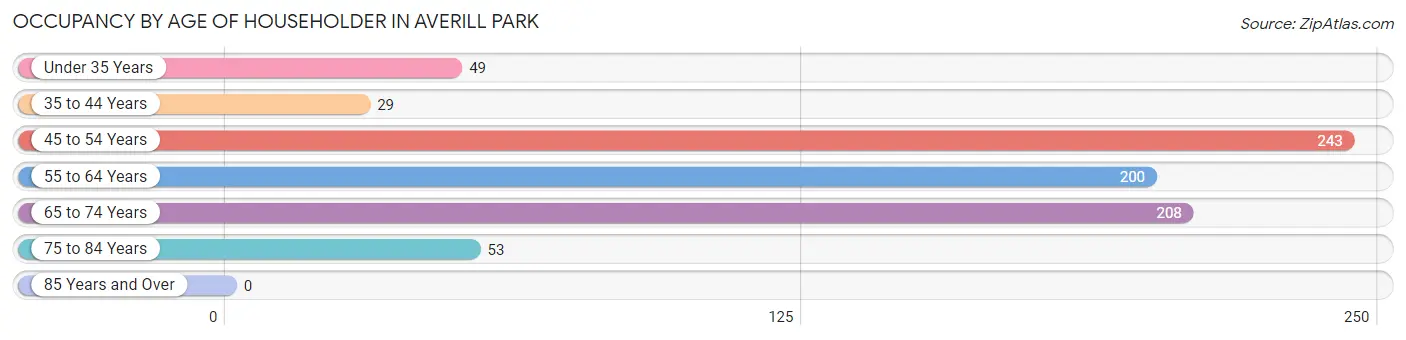
| Age Bracket | # Households | % Households |
| Under 35 Years | 49 | 6.3% |
| 35 to 44 Years | 29 | 3.7% |
| 45 to 54 Years | 243 | 31.1% |
| 55 to 64 Years | 200 | 25.6% |
| 65 to 74 Years | 208 | 26.6% |
| 75 to 84 Years | 53 | 6.8% |
| 85 Years and Over | 0 | 0.0% |
| Total | 782 | 100.0% |
Housing Finances in Averill Park
Median Income by Occupancy in Averill Park
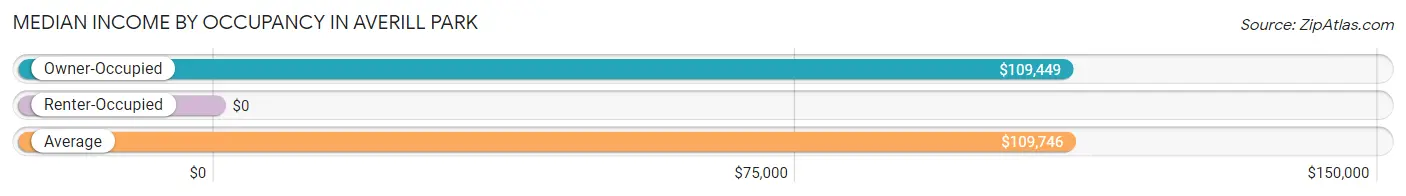
| Occupancy Type | # Households | Median Income |
| Owner-Occupied | 626 (80.0%) | $109,449 |
| Renter-Occupied | 156 (20.0%) | $0 |
| Average | 782 (100.0%) | $109,746 |
Occupancy by Householder Income Bracket in Averill Park
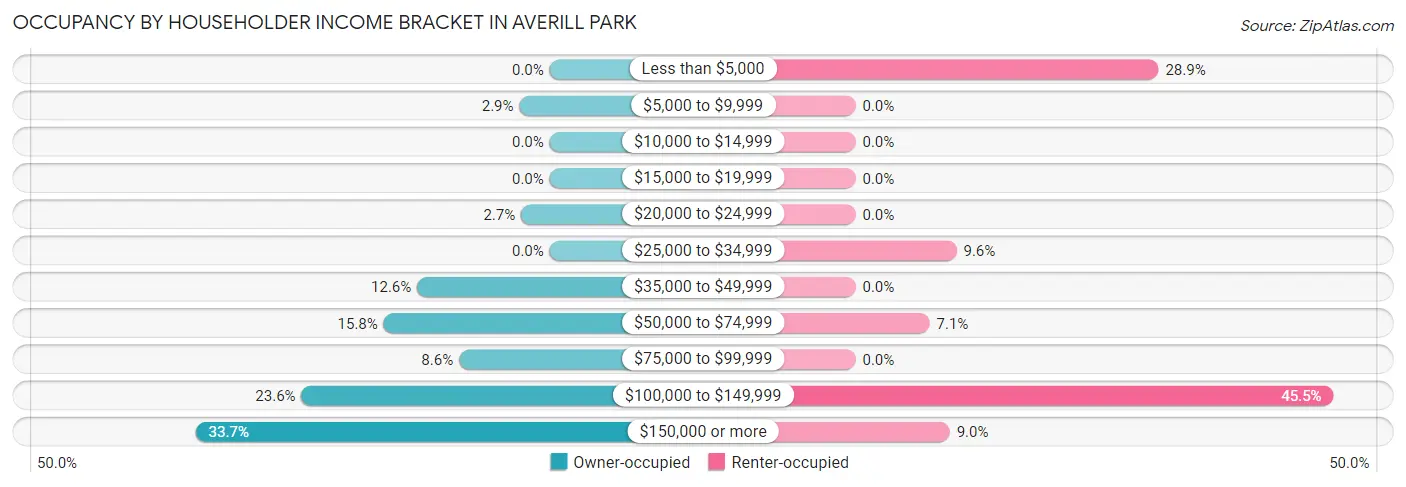
| Income Bracket | Owner-occupied | Renter-occupied |
| Less than $5,000 | 0 (0.0%) | 45 (28.8%) |
| $5,000 to $9,999 | 18 (2.9%) | 0 (0.0%) |
| $10,000 to $14,999 | 0 (0.0%) | 0 (0.0%) |
| $15,000 to $19,999 | 0 (0.0%) | 0 (0.0%) |
| $20,000 to $24,999 | 17 (2.7%) | 0 (0.0%) |
| $25,000 to $34,999 | 0 (0.0%) | 15 (9.6%) |
| $35,000 to $49,999 | 79 (12.6%) | 0 (0.0%) |
| $50,000 to $74,999 | 99 (15.8%) | 11 (7.0%) |
| $75,000 to $99,999 | 54 (8.6%) | 0 (0.0%) |
| $100,000 to $149,999 | 148 (23.6%) | 71 (45.5%) |
| $150,000 or more | 211 (33.7%) | 14 (9.0%) |
| Total | 626 (100.0%) | 156 (100.0%) |
Monthly Housing Cost Tiers in Averill Park
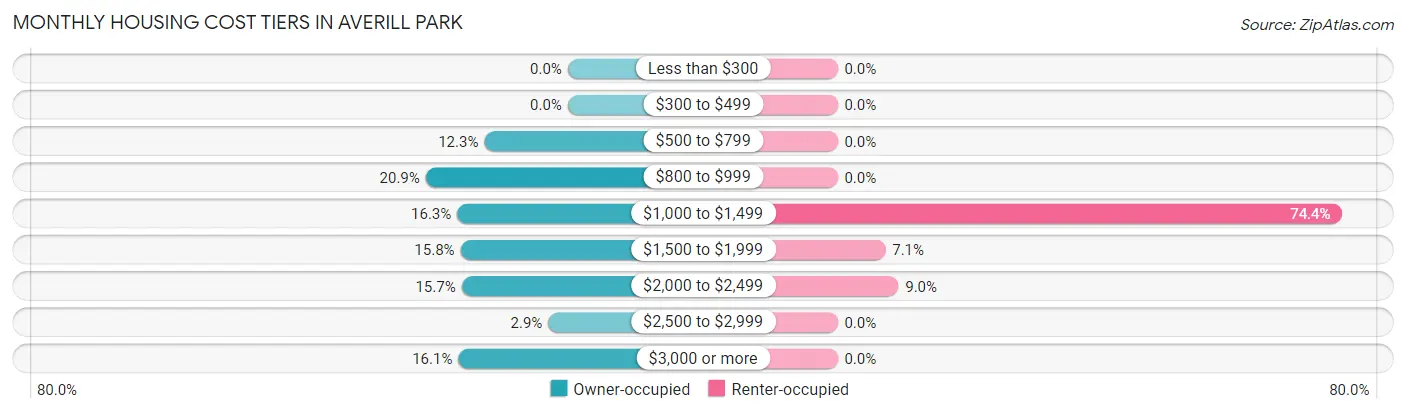
| Monthly Cost | Owner-occupied | Renter-occupied |
| Less than $300 | 0 (0.0%) | 0 (0.0%) |
| $300 to $499 | 0 (0.0%) | 0 (0.0%) |
| $500 to $799 | 77 (12.3%) | 0 (0.0%) |
| $800 to $999 | 131 (20.9%) | 0 (0.0%) |
| $1,000 to $1,499 | 102 (16.3%) | 116 (74.4%) |
| $1,500 to $1,999 | 99 (15.8%) | 11 (7.0%) |
| $2,000 to $2,499 | 98 (15.7%) | 14 (9.0%) |
| $2,500 to $2,999 | 18 (2.9%) | 0 (0.0%) |
| $3,000 or more | 101 (16.1%) | 0 (0.0%) |
| Total | 626 (100.0%) | 156 (100.0%) |
Physical Housing Characteristics in Averill Park
Housing Structures in Averill Park
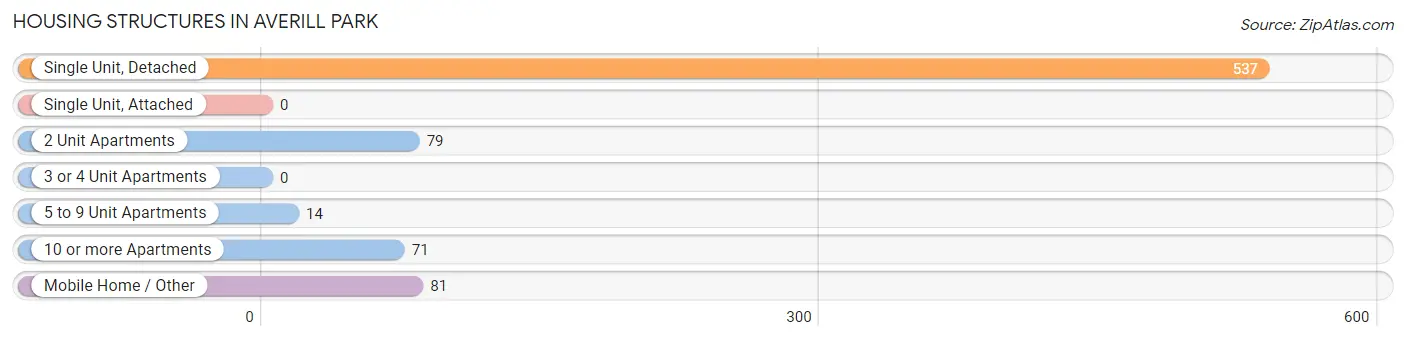
| Structure Type | # Housing Units | % Housing Units |
| Single Unit, Detached | 537 | 68.7% |
| Single Unit, Attached | 0 | 0.0% |
| 2 Unit Apartments | 79 | 10.1% |
| 3 or 4 Unit Apartments | 0 | 0.0% |
| 5 to 9 Unit Apartments | 14 | 1.8% |
| 10 or more Apartments | 71 | 9.1% |
| Mobile Home / Other | 81 | 10.4% |
| Total | 782 | 100.0% |
Housing Structures by Occupancy in Averill Park
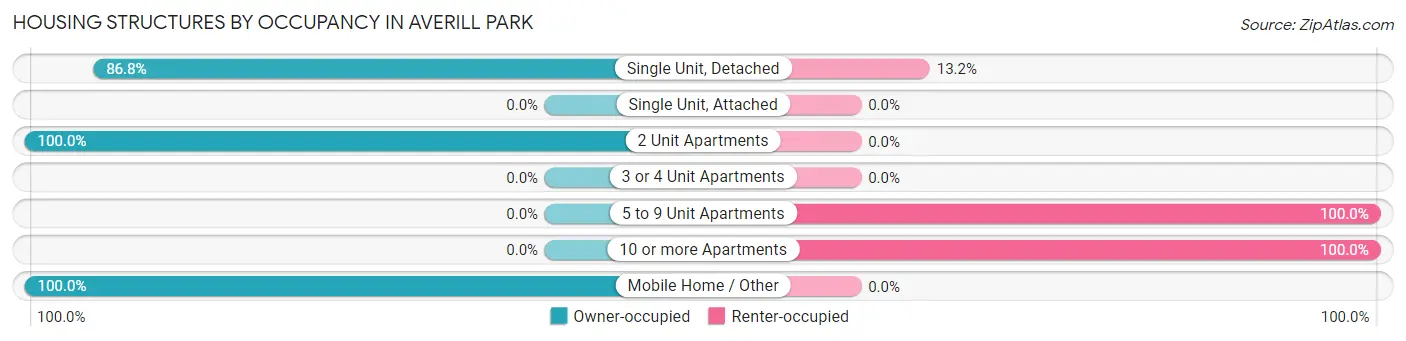
| Structure Type | Owner-occupied | Renter-occupied |
| Single Unit, Detached | 466 (86.8%) | 71 (13.2%) |
| Single Unit, Attached | 0 (0.0%) | 0 (0.0%) |
| 2 Unit Apartments | 79 (100.0%) | 0 (0.0%) |
| 3 or 4 Unit Apartments | 0 (0.0%) | 0 (0.0%) |
| 5 to 9 Unit Apartments | 0 (0.0%) | 14 (100.0%) |
| 10 or more Apartments | 0 (0.0%) | 71 (100.0%) |
| Mobile Home / Other | 81 (100.0%) | 0 (0.0%) |
| Total | 626 (80.0%) | 156 (20.0%) |
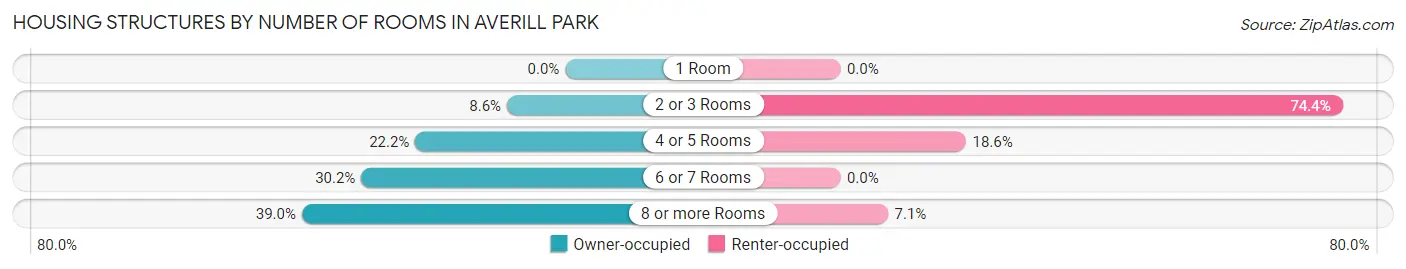
Housing Structures by Number of Rooms in Averill Park
| Number of Rooms | Owner-occupied | Renter-occupied |
| 1 Room | 0 (0.0%) | 0 (0.0%) |
| 2 or 3 Rooms | 54 (8.6%) | 116 (74.4%) |
| 4 or 5 Rooms | 139 (22.2%) | 29 (18.6%) |
| 6 or 7 Rooms | 189 (30.2%) | 0 (0.0%) |
| 8 or more Rooms | 244 (39.0%) | 11 (7.0%) |
| Total | 626 (100.0%) | 156 (100.0%) |
Housing Structure by Heating Type in Averill Park
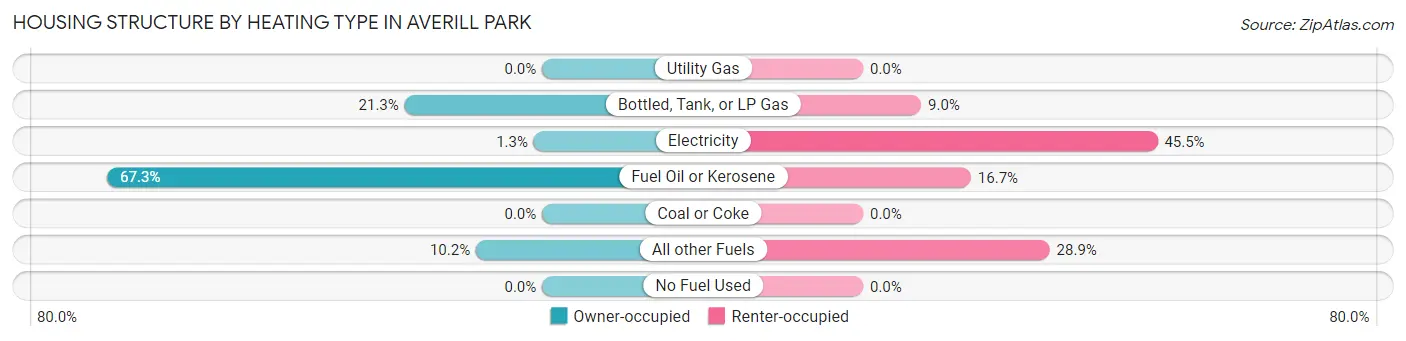
| Heating Type | Owner-occupied | Renter-occupied |
| Utility Gas | 0 (0.0%) | 0 (0.0%) |
| Bottled, Tank, or LP Gas | 133 (21.2%) | 14 (9.0%) |
| Electricity | 8 (1.3%) | 71 (45.5%) |
| Fuel Oil or Kerosene | 421 (67.2%) | 26 (16.7%) |
| Coal or Coke | 0 (0.0%) | 0 (0.0%) |
| All other Fuels | 64 (10.2%) | 45 (28.8%) |
| No Fuel Used | 0 (0.0%) | 0 (0.0%) |
| Total | 626 (100.0%) | 156 (100.0%) |
Household Vehicle Usage in Averill Park
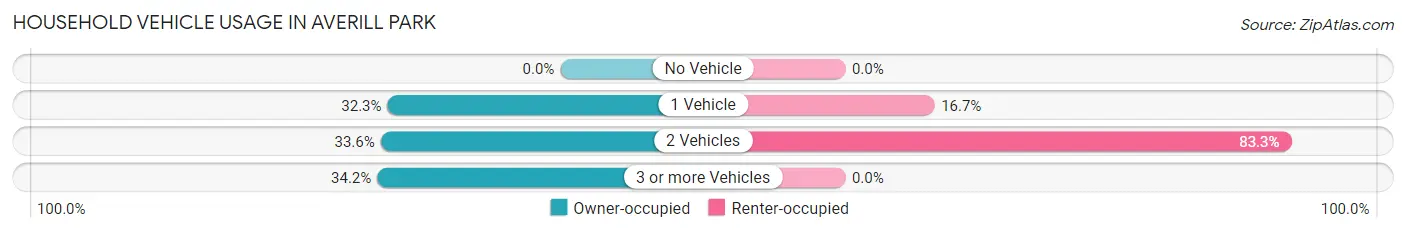
| Vehicles per Household | Owner-occupied | Renter-occupied |
| No Vehicle | 0 (0.0%) | 0 (0.0%) |
| 1 Vehicle | 202 (32.3%) | 26 (16.7%) |
| 2 Vehicles | 210 (33.6%) | 130 (83.3%) |
| 3 or more Vehicles | 214 (34.2%) | 0 (0.0%) |
| Total | 626 (100.0%) | 156 (100.0%) |
Real Estate & Mortgages in Averill Park
Real Estate and Mortgage Overview in Averill Park
| Characteristic | Without Mortgage | With Mortgage |
| Housing Units | 291 | 335 |
| Median Property Value | $167,800 | $283,100 |
| Median Household Income | $64,044 | $180 |
| Monthly Housing Costs | $876 | $101 |
| Real Estate Taxes | $4,396 | $13 |
Property Value by Mortgage Status in Averill Park
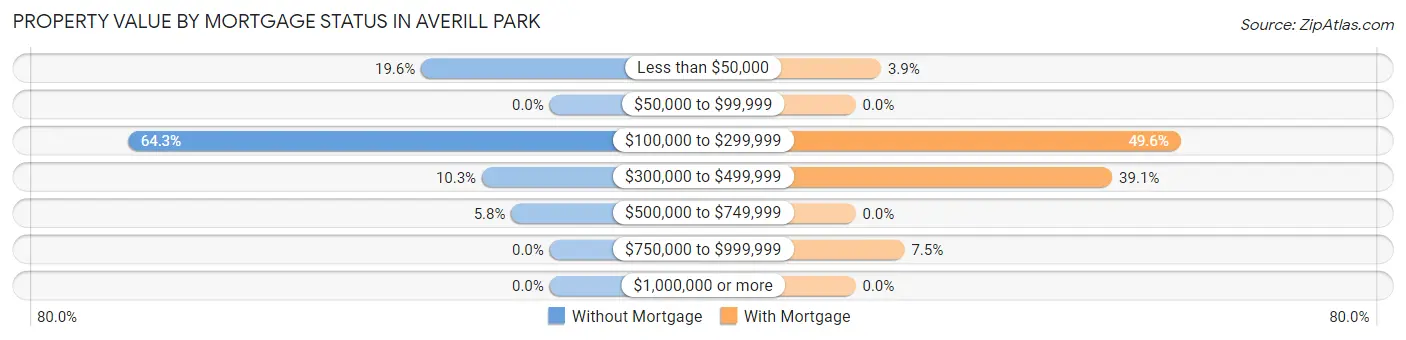
| Property Value | Without Mortgage | With Mortgage |
| Less than $50,000 | 57 (19.6%) | 13 (3.9%) |
| $50,000 to $99,999 | 0 (0.0%) | 0 (0.0%) |
| $100,000 to $299,999 | 187 (64.3%) | 166 (49.5%) |
| $300,000 to $499,999 | 30 (10.3%) | 131 (39.1%) |
| $500,000 to $749,999 | 17 (5.8%) | 0 (0.0%) |
| $750,000 to $999,999 | 0 (0.0%) | 25 (7.5%) |
| $1,000,000 or more | 0 (0.0%) | 0 (0.0%) |
| Total | 291 (100.0%) | 335 (100.0%) |
Household Income by Mortgage Status in Averill Park
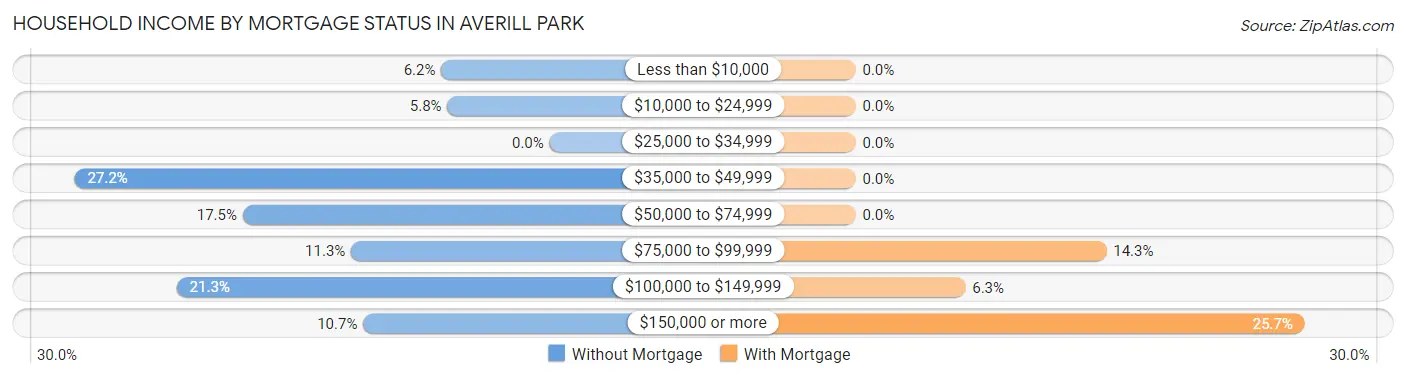
| Household Income | Without Mortgage | With Mortgage |
| Less than $10,000 | 18 (6.2%) | 0 (0.0%) |
| $10,000 to $24,999 | 17 (5.8%) | 0 (0.0%) |
| $25,000 to $34,999 | 0 (0.0%) | 0 (0.0%) |
| $35,000 to $49,999 | 79 (27.2%) | 0 (0.0%) |
| $50,000 to $74,999 | 51 (17.5%) | 0 (0.0%) |
| $75,000 to $99,999 | 33 (11.3%) | 48 (14.3%) |
| $100,000 to $149,999 | 62 (21.3%) | 21 (6.3%) |
| $150,000 or more | 31 (10.6%) | 86 (25.7%) |
| Total | 291 (100.0%) | 335 (100.0%) |
Property Value to Household Income Ratio in Averill Park
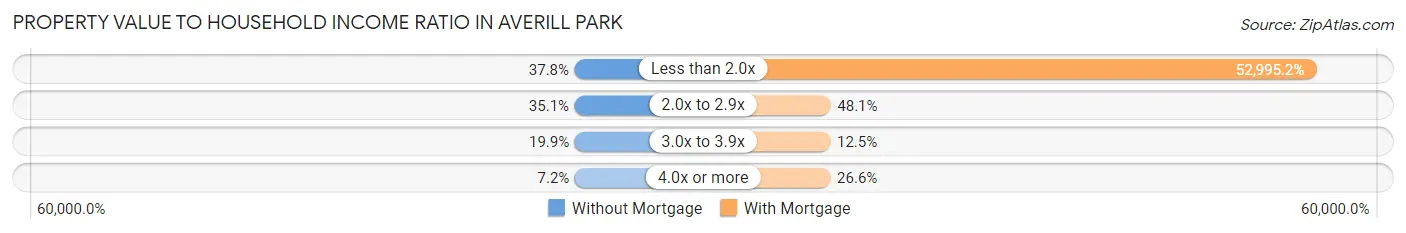
| Value-to-Income Ratio | Without Mortgage | With Mortgage |
| Less than 2.0x | 110 (37.8%) | 177,534 (52,995.2%) |
| 2.0x to 2.9x | 102 (35.0%) | 161 (48.1%) |
| 3.0x to 3.9x | 58 (19.9%) | 42 (12.5%) |
| 4.0x or more | 21 (7.2%) | 89 (26.6%) |
| Total | 291 (100.0%) | 335 (100.0%) |
Real Estate Taxes by Mortgage Status in Averill Park
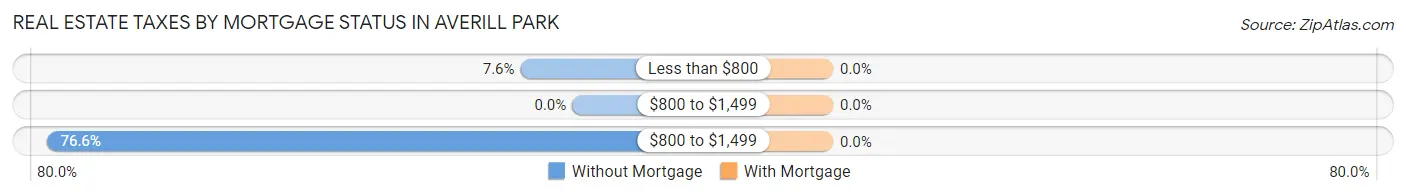
| Property Taxes | Without Mortgage | With Mortgage |
| Less than $800 | 22 (7.6%) | 0 (0.0%) |
| $800 to $1,499 | 0 (0.0%) | 0 (0.0%) |
| $800 to $1,499 | 223 (76.6%) | 0 (0.0%) |
| Total | 291 (100.0%) | 335 (100.0%) |
Health & Disability in Averill Park
Health Insurance Coverage by Age in Averill Park
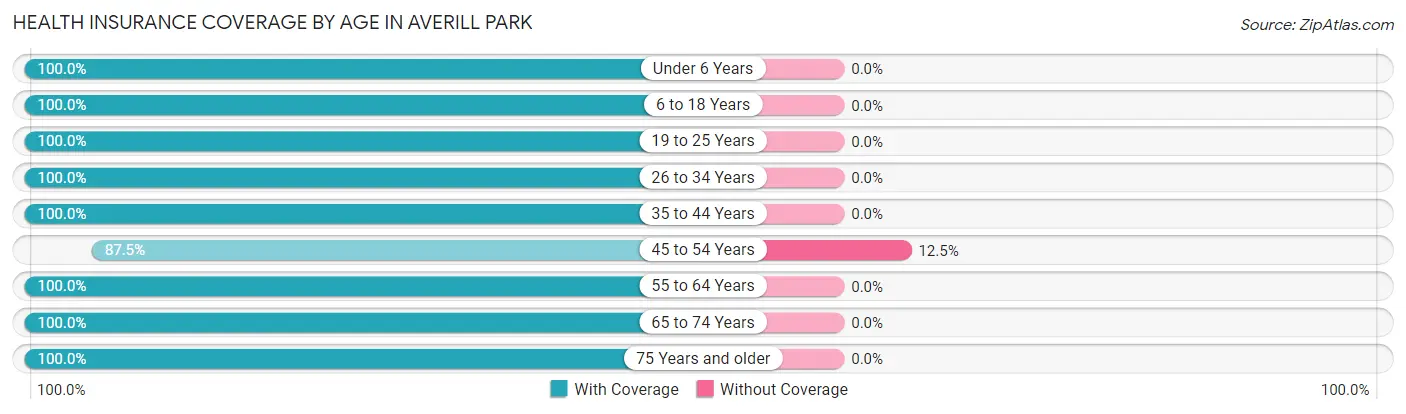
| Age Bracket | With Coverage | Without Coverage |
| Under 6 Years | 105 (100.0%) | 0 (0.0%) |
| 6 to 18 Years | 97 (100.0%) | 0 (0.0%) |
| 19 to 25 Years | 122 (100.0%) | 0 (0.0%) |
| 26 to 34 Years | 148 (100.0%) | 0 (0.0%) |
| 35 to 44 Years | 59 (100.0%) | 0 (0.0%) |
| 45 to 54 Years | 314 (87.5%) | 45 (12.5%) |
| 55 to 64 Years | 332 (100.0%) | 0 (0.0%) |
| 65 to 74 Years | 300 (100.0%) | 0 (0.0%) |
| 75 Years and older | 86 (100.0%) | 0 (0.0%) |
| Total | 1,563 (97.2%) | 45 (2.8%) |
Health Insurance Coverage by Citizenship Status in Averill Park
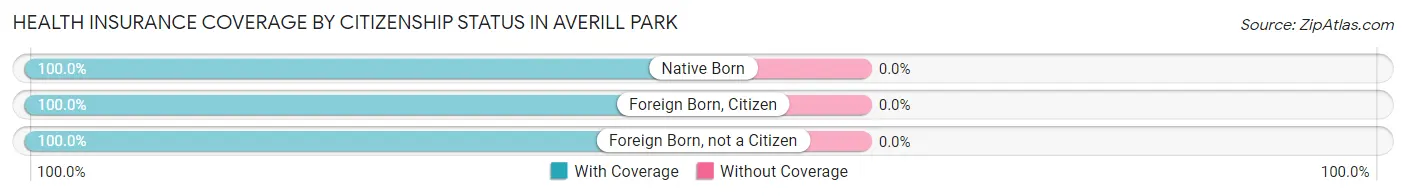
| Citizenship Status | With Coverage | Without Coverage |
| Native Born | 105 (100.0%) | 0 (0.0%) |
| Foreign Born, Citizen | 97 (100.0%) | 0 (0.0%) |
| Foreign Born, not a Citizen | 122 (100.0%) | 0 (0.0%) |
Health Insurance Coverage by Household Income in Averill Park
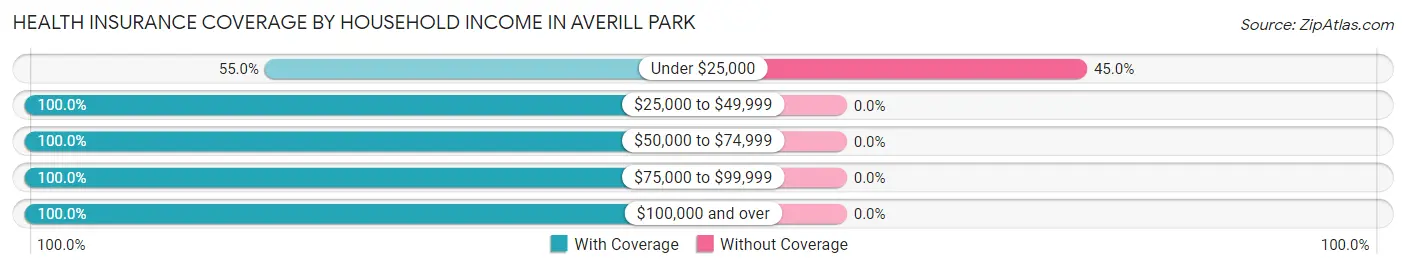
| Household Income | With Coverage | Without Coverage |
| Under $25,000 | 55 (55.0%) | 45 (45.0%) |
| $25,000 to $49,999 | 112 (100.0%) | 0 (0.0%) |
| $50,000 to $74,999 | 224 (100.0%) | 0 (0.0%) |
| $75,000 to $99,999 | 200 (100.0%) | 0 (0.0%) |
| $100,000 and over | 972 (100.0%) | 0 (0.0%) |
Public vs Private Health Insurance Coverage by Age in Averill Park
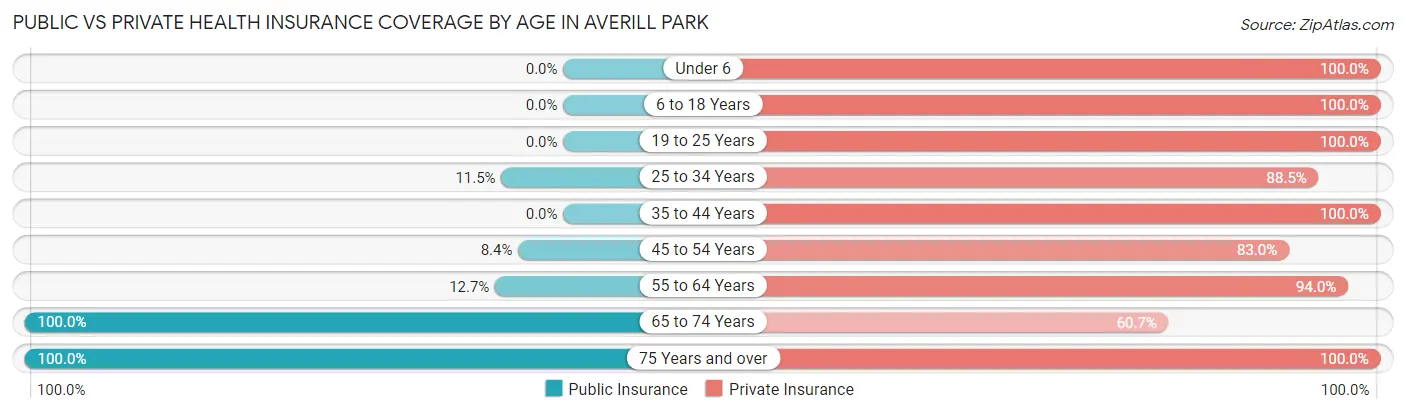
| Age Bracket | Public Insurance | Private Insurance |
| Under 6 | 0 (0.0%) | 105 (100.0%) |
| 6 to 18 Years | 0 (0.0%) | 97 (100.0%) |
| 19 to 25 Years | 0 (0.0%) | 122 (100.0%) |
| 25 to 34 Years | 17 (11.5%) | 131 (88.5%) |
| 35 to 44 Years | 0 (0.0%) | 59 (100.0%) |
| 45 to 54 Years | 30 (8.4%) | 298 (83.0%) |
| 55 to 64 Years | 42 (12.7%) | 312 (94.0%) |
| 65 to 74 Years | 300 (100.0%) | 182 (60.7%) |
| 75 Years and over | 86 (100.0%) | 86 (100.0%) |
| Total | 475 (29.5%) | 1,392 (86.6%) |
Disability Status by Sex by Age in Averill Park
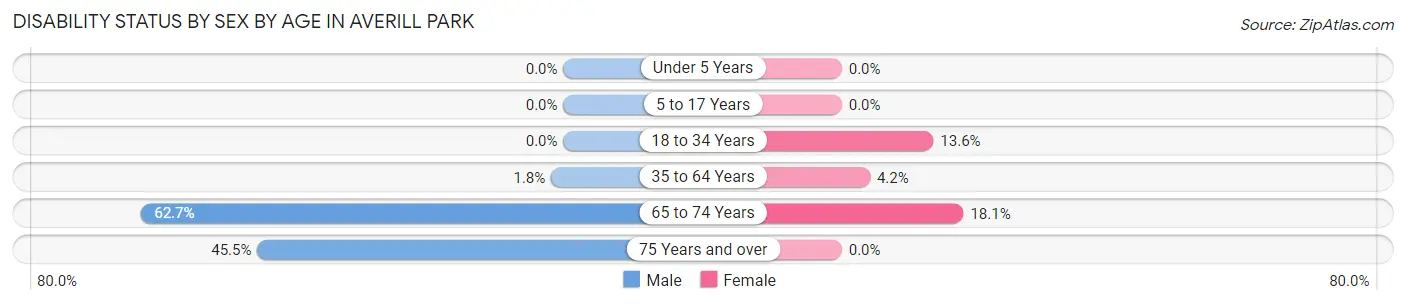
| Age Bracket | Male | Female |
| Under 5 Years | 0 (0.0%) | 0 (0.0%) |
| 5 to 17 Years | 0 (0.0%) | 0 (0.0%) |
| 18 to 34 Years | 0 (0.0%) | 17 (13.6%) |
| 35 to 64 Years | 8 (1.8%) | 13 (4.2%) |
| 65 to 74 Years | 136 (62.7%) | 15 (18.1%) |
| 75 Years and over | 15 (45.5%) | 0 (0.0%) |
Disability Class by Sex by Age in Averill Park
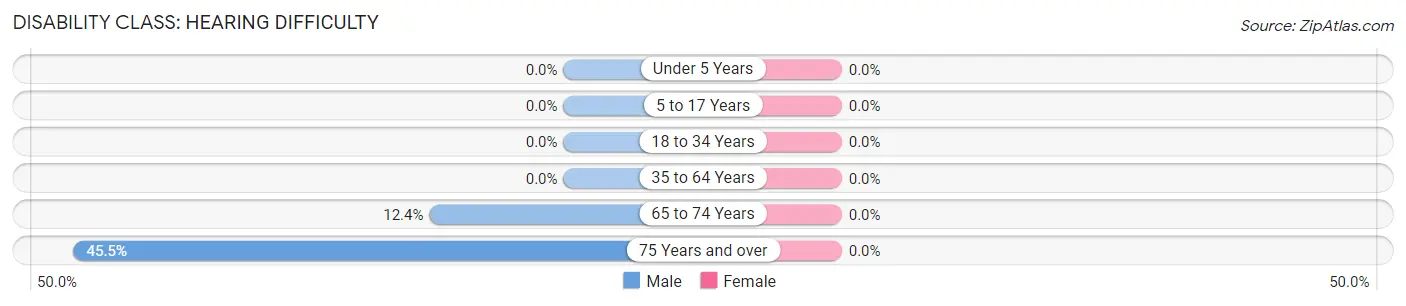
Disability Class: Hearing Difficulty
| Age Bracket | Male | Female |
| Under 5 Years | 0 (0.0%) | 0 (0.0%) |
| 5 to 17 Years | 0 (0.0%) | 0 (0.0%) |
| 18 to 34 Years | 0 (0.0%) | 0 (0.0%) |
| 35 to 64 Years | 0 (0.0%) | 0 (0.0%) |
| 65 to 74 Years | 27 (12.4%) | 0 (0.0%) |
| 75 Years and over | 15 (45.5%) | 0 (0.0%) |
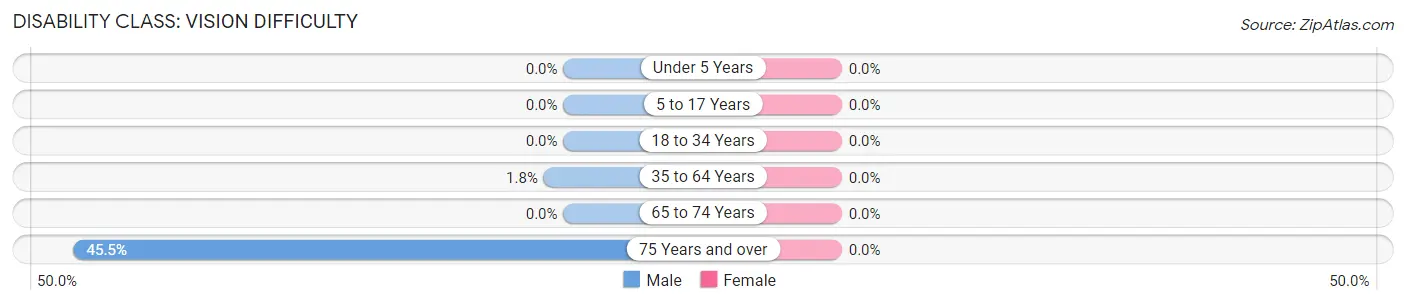
Disability Class: Vision Difficulty
| Age Bracket | Male | Female |
| Under 5 Years | 0 (0.0%) | 0 (0.0%) |
| 5 to 17 Years | 0 (0.0%) | 0 (0.0%) |
| 18 to 34 Years | 0 (0.0%) | 0 (0.0%) |
| 35 to 64 Years | 8 (1.8%) | 0 (0.0%) |
| 65 to 74 Years | 0 (0.0%) | 0 (0.0%) |
| 75 Years and over | 15 (45.5%) | 0 (0.0%) |
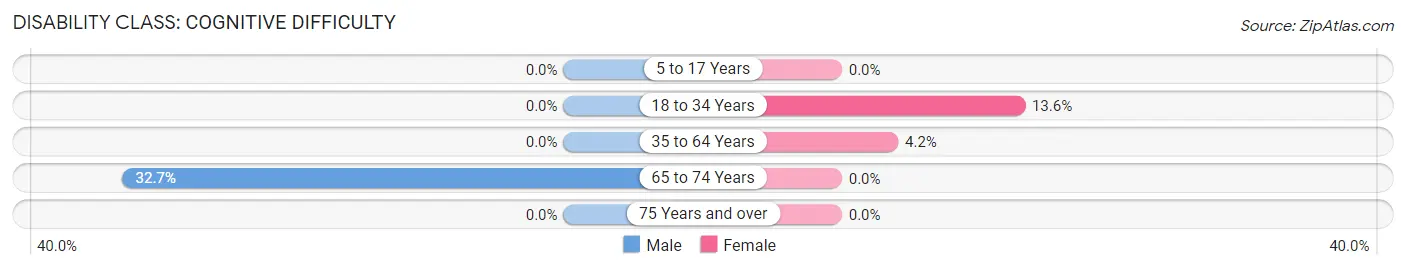
Disability Class: Cognitive Difficulty
| Age Bracket | Male | Female |
| 5 to 17 Years | 0 (0.0%) | 0 (0.0%) |
| 18 to 34 Years | 0 (0.0%) | 17 (13.6%) |
| 35 to 64 Years | 0 (0.0%) | 13 (4.2%) |
| 65 to 74 Years | 71 (32.7%) | 0 (0.0%) |
| 75 Years and over | 0 (0.0%) | 0 (0.0%) |
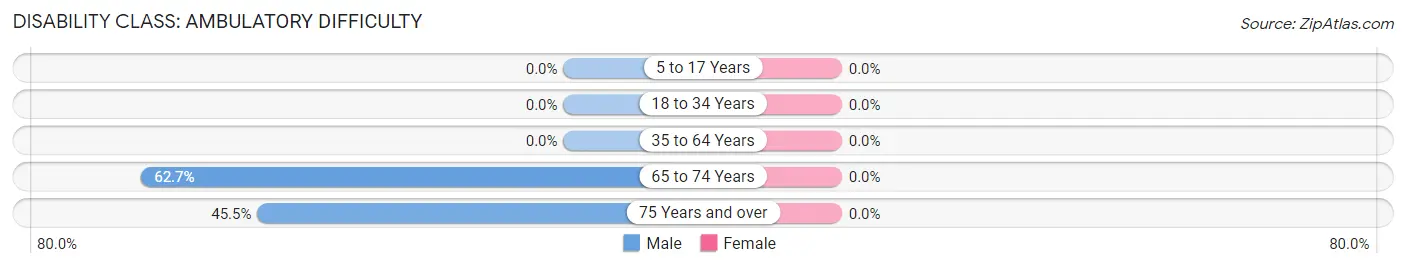
Disability Class: Ambulatory Difficulty
| Age Bracket | Male | Female |
| 5 to 17 Years | 0 (0.0%) | 0 (0.0%) |
| 18 to 34 Years | 0 (0.0%) | 0 (0.0%) |
| 35 to 64 Years | 0 (0.0%) | 0 (0.0%) |
| 65 to 74 Years | 136 (62.7%) | 0 (0.0%) |
| 75 Years and over | 15 (45.5%) | 0 (0.0%) |
Disability Class: Self-Care Difficulty
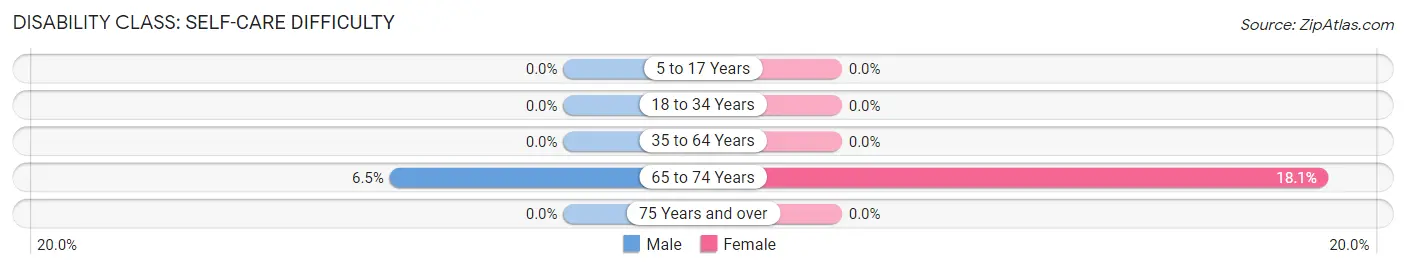
| Age Bracket | Male | Female |
| 5 to 17 Years | 0 (0.0%) | 0 (0.0%) |
| 18 to 34 Years | 0 (0.0%) | 0 (0.0%) |
| 35 to 64 Years | 0 (0.0%) | 0 (0.0%) |
| 65 to 74 Years | 14 (6.5%) | 15 (18.1%) |
| 75 Years and over | 0 (0.0%) | 0 (0.0%) |
Technology Access in Averill Park
Computing Device Access in Averill Park
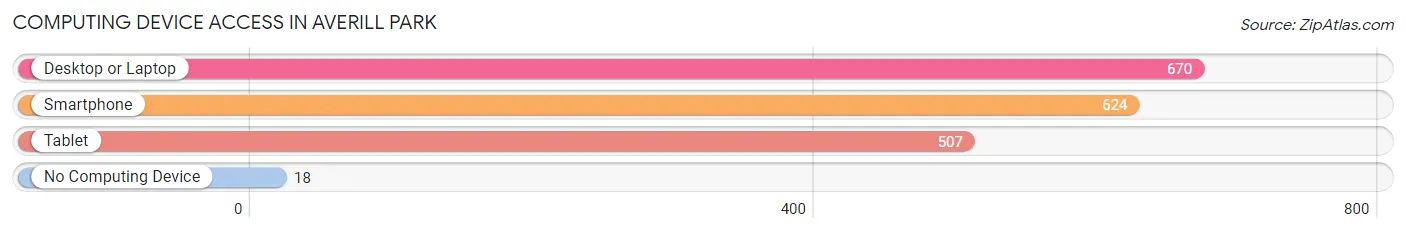
| Device Type | # Households | % Households |
| Desktop or Laptop | 670 | 85.7% |
| Smartphone | 624 | 79.8% |
| Tablet | 507 | 64.8% |
| No Computing Device | 18 | 2.3% |
| Total | 782 | 100.0% |
Internet Access in Averill Park
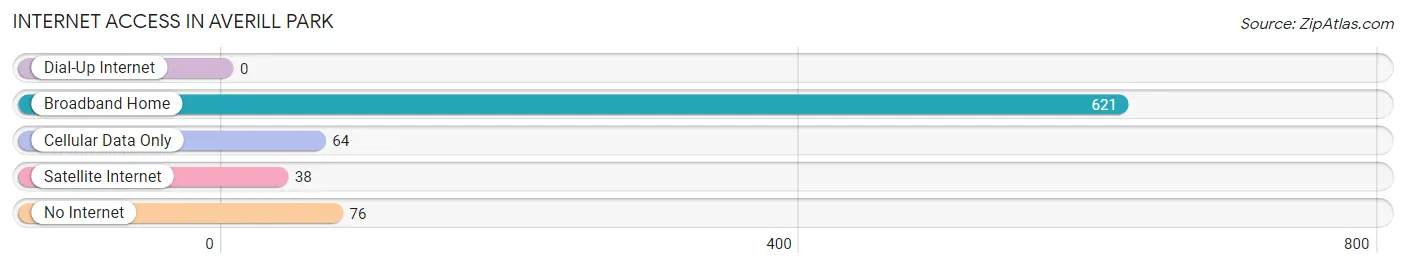
| Internet Type | # Households | % Households |
| Dial-Up Internet | 0 | 0.0% |
| Broadband Home | 621 | 79.4% |
| Cellular Data Only | 64 | 8.2% |
| Satellite Internet | 38 | 4.9% |
| No Internet | 76 | 9.7% |
| Total | 782 | 100.0% |
Averill Park Summary
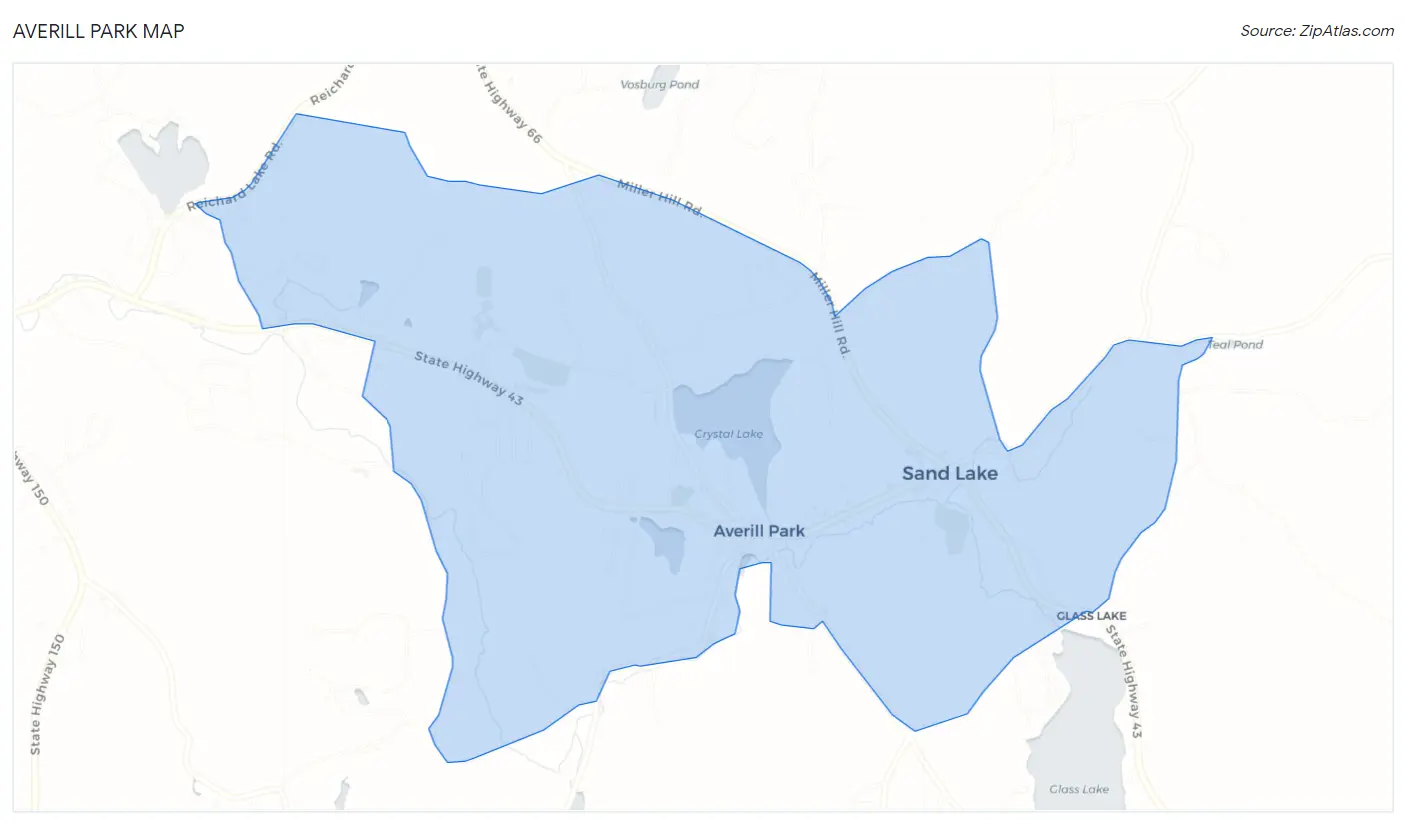
Averill Park is a hamlet located in Rensselaer County, New York, United States. It is part of the town of Sand Lake and is located approximately 15 miles southeast of Albany, the state capital. The hamlet is situated on the eastern shore of the Hudson River and is bordered by the towns of East Greenbush and Schodack. The population of Averill Park was estimated to be 4,845 in 2019.
History
Averill Park was first settled in the late 1700s by the Averill family, who were among the first settlers in the area. The hamlet was originally known as Averill’s Corners, and was later renamed Averill Park in 1845. The hamlet was officially incorporated in 1848.
The hamlet was home to several industries in the 19th century, including a sawmill, a gristmill, a tannery, and a brickyard. The hamlet was also home to a number of farms, which provided food for the local population.
In the early 20th century, the hamlet began to grow and develop. The hamlet was home to a number of businesses, including a general store, a post office, a blacksmith shop, and a hotel. The hamlet also had a number of churches, including the Averill Park Methodist Church, which was established in 1845.
Geography
Averill Park is located in Rensselaer County, New York, approximately 15 miles southeast of Albany. The hamlet is situated on the eastern shore of the Hudson River and is bordered by the towns of East Greenbush and Schodack. The hamlet is located in the Hudson Valley region of New York and is part of the Albany-Schenectady-Troy Metropolitan Statistical Area.
The hamlet has a total area of 4.2 square miles, all of which is land. The hamlet is located in a hilly area and is surrounded by forests and wetlands. The hamlet is home to several parks, including Averill Park, which is located on the eastern shore of the Hudson River.
Economy
Averill Park is a primarily residential community, with a small commercial district located in the center of the hamlet. The hamlet is home to a number of businesses, including restaurants, banks, and retail stores. The hamlet is also home to a number of professional services, including medical offices, law offices, and accounting firms.
The hamlet is home to a number of manufacturing companies, including a paper mill, a plastics manufacturer, and a metal fabrication company. The hamlet is also home to a number of farms, which provide food for the local population.
Demographics
As of the 2010 census, the population of Averill Park was 4,731. The population is primarily white (94.3%), with a small percentage of African Americans (2.2%), Asians (1.2%), and Hispanics (1.1%). The median household income in the hamlet is $68,944, and the median home value is $219,400.
The hamlet is served by the Averill Park Central School District, which includes four elementary schools, one middle school, and one high school. The hamlet is also home to a number of private schools, including the Averill Park Montessori School and the Averill Park Christian Academy.
Common Questions
What is Per Capita Income in Averill Park?
Per Capita income in Averill Park is $58,455.
What is the Median Family Income in Averill Park?
Median Family Income in Averill Park is $147,266.
What is the Median Household income in Averill Park?
Median Household Income in Averill Park is $109,746.
What is Income or Wage Gap in Averill Park?
Income or Wage Gap in Averill Park is 36.4%.
Women in Averill Park earn 63.6 cents for every dollar earned by a man.
What is Inequality or Gini Index in Averill Park?
Inequality or Gini Index in Averill Park is 0.36.
What is the Total Population of Averill Park?
Total Population of Averill Park is 1,608.
What is the Total Male Population of Averill Park?
Total Male Population of Averill Park is 973.
What is the Total Female Population of Averill Park?
Total Female Population of Averill Park is 635.
What is the Ratio of Males per 100 Females in Averill Park?
There are 153.23 Males per 100 Females in Averill Park.
What is the Ratio of Females per 100 Males in Averill Park?
There are 65.26 Females per 100 Males in Averill Park.
What is the Median Population Age in Averill Park?
Median Population Age in Averill Park is 53.3 Years.
What is the Average Family Size in Averill Park
Average Family Size in Averill Park is 2.8 People.
What is the Average Household Size in Averill Park
Average Household Size in Averill Park is 2.1 People.
How Large is the Labor Force in Averill Park?
There are 1,008 People in the Labor Forcein in Averill Park.
What is the Percentage of People in the Labor Force in Averill Park?
68.8% of People are in the Labor Force in Averill Park.
What is the Unemployment Rate in Averill Park?
Unemployment Rate in Averill Park is 4.7%.