Aurora, NY Map & Demographics
Aurora Map
Aurora Overview
$20,768
PER CAPITA INCOME
$102,188
AVG FAMILY INCOME
$81,500
AVG HOUSEHOLD INCOME
43.2%
WAGE / INCOME GAP [ % ]
56.8¢/ $1
WAGE / INCOME GAP [ $ ]
0.35
INEQUALITY / GINI INDEX
692
TOTAL POPULATION
345
MALE POPULATION
347
FEMALE POPULATION
99.42
MALES / 100 FEMALES
100.58
FEMALES / 100 MALES
21.5
MEDIAN AGE
2.6
AVG FAMILY SIZE
2.0
AVG HOUSEHOLD SIZE
410
LABOR FORCE [ PEOPLE ]
62.2%
PERCENT IN LABOR FORCE
0.7%
UNEMPLOYMENT RATE
Aurora Zip Codes
Aurora Area Codes
Income in Aurora
Income Overview in Aurora
Per Capita Income in Aurora is $20,768, while median incomes of families and households are $102,188 and $81,500 respectively.
| Characteristic | Number | Measure |
| Per Capita Income | 692 | $20,768 |
| Median Family Income | 79 | $102,188 |
| Mean Family Income | 79 | $107,863 |
| Median Household Income | 140 | $81,500 |
| Mean Household Income | 140 | $88,029 |
| Income Deficit | 79 | $0 |
| Wage / Income Gap (%) | 692 | 43.17% |
| Wage / Income Gap ($) | 692 | 56.83¢ per $1 |
| Gini / Inequality Index | 692 | 0.35 |
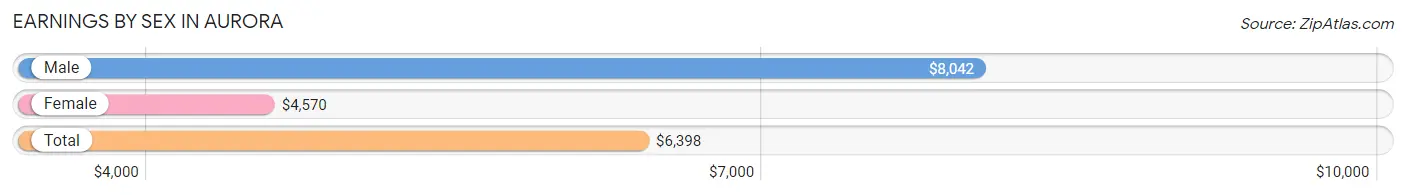
Earnings by Sex in Aurora
Average Earnings in Aurora are $6,398, $8,042 for men and $4,570 for women, a difference of 43.2%.
| Sex | Number | Average Earnings |
| Male | 227 (49.8%) | $8,042 |
| Female | 229 (50.2%) | $4,570 |
| Total | 456 (100.0%) | $6,398 |
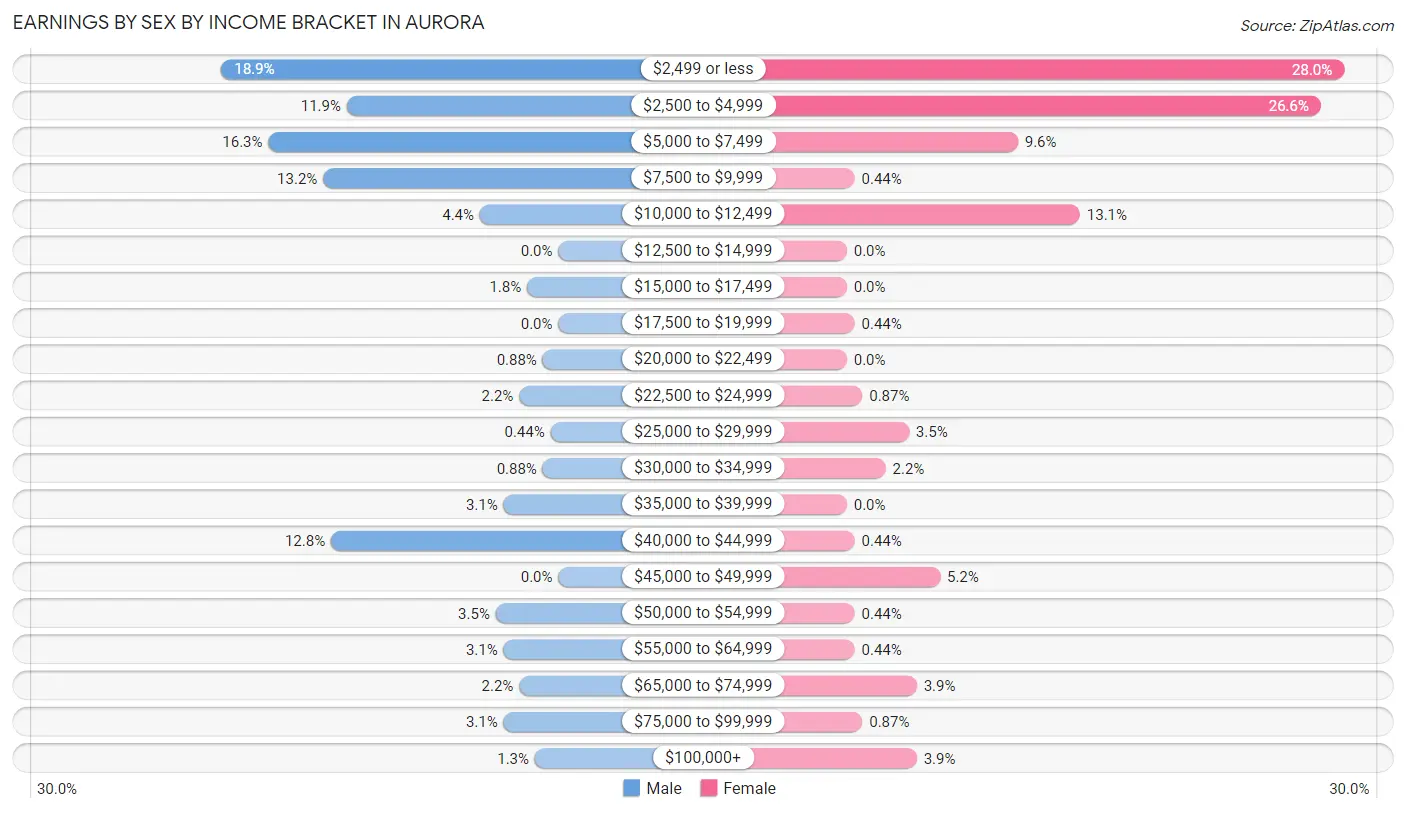
Earnings by Sex by Income Bracket in Aurora
The most common earnings brackets in Aurora are $2,499 or less for men (43 | 18.9%) and $2,499 or less for women (64 | 28.0%).
| Income | Male | Female |
| $2,499 or less | 43 (18.9%) | 64 (28.0%) |
| $2,500 to $4,999 | 27 (11.9%) | 61 (26.6%) |
| $5,000 to $7,499 | 37 (16.3%) | 22 (9.6%) |
| $7,500 to $9,999 | 30 (13.2%) | 1 (0.4%) |
| $10,000 to $12,499 | 10 (4.4%) | 30 (13.1%) |
| $12,500 to $14,999 | 0 (0.0%) | 0 (0.0%) |
| $15,000 to $17,499 | 4 (1.8%) | 0 (0.0%) |
| $17,500 to $19,999 | 0 (0.0%) | 1 (0.4%) |
| $20,000 to $22,499 | 2 (0.9%) | 0 (0.0%) |
| $22,500 to $24,999 | 5 (2.2%) | 2 (0.9%) |
| $25,000 to $29,999 | 1 (0.4%) | 8 (3.5%) |
| $30,000 to $34,999 | 2 (0.9%) | 5 (2.2%) |
| $35,000 to $39,999 | 7 (3.1%) | 0 (0.0%) |
| $40,000 to $44,999 | 29 (12.8%) | 1 (0.4%) |
| $45,000 to $49,999 | 0 (0.0%) | 12 (5.2%) |
| $50,000 to $54,999 | 8 (3.5%) | 1 (0.4%) |
| $55,000 to $64,999 | 7 (3.1%) | 1 (0.4%) |
| $65,000 to $74,999 | 5 (2.2%) | 9 (3.9%) |
| $75,000 to $99,999 | 7 (3.1%) | 2 (0.9%) |
| $100,000+ | 3 (1.3%) | 9 (3.9%) |
| Total | 227 (100.0%) | 229 (100.0%) |
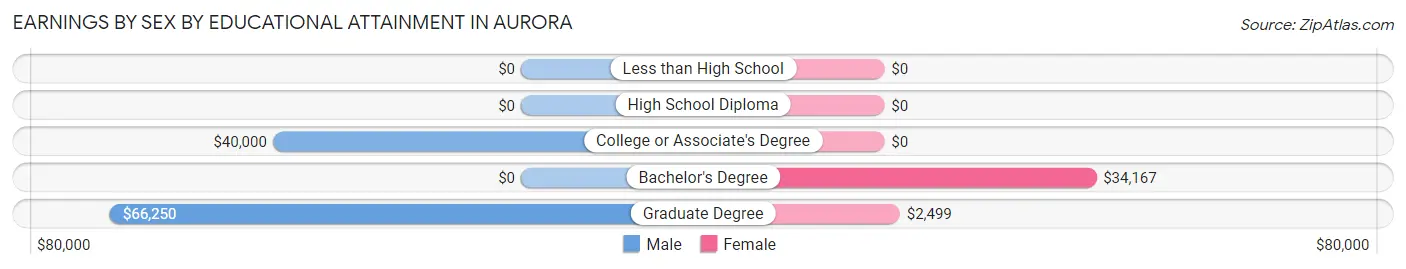
Earnings by Sex by Educational Attainment in Aurora
| Educational Attainment | Male Income | Female Income |
| Less than High School | - | - |
| High School Diploma | - | - |
| College or Associate's Degree | $40,000 | $0 |
| Bachelor's Degree | - | - |
| Graduate Degree | $66,250 | $2,499 |
| Total | $39,792 | $0 |
Family Income in Aurora
Family Income Brackets in Aurora
According to the Aurora family income data, there are 28 families falling into the $100,000 to $149,999 income range, which is the most common income bracket and makes up 35.4% of all families.
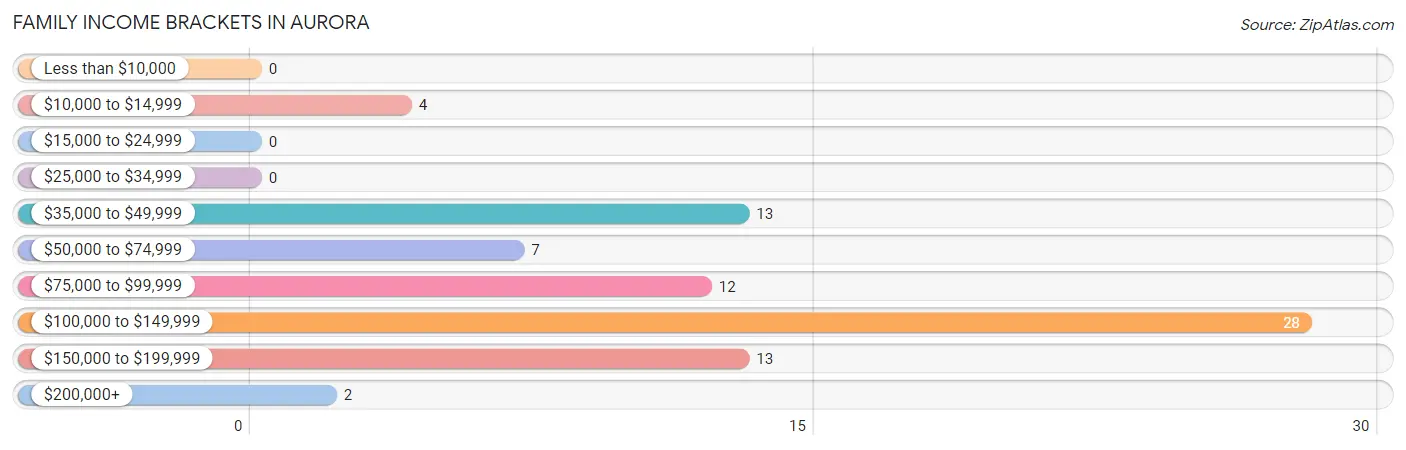
| Income Bracket | # Families | % Families |
| Less than $10,000 | 0 | 0.0% |
| $10,000 to $14,999 | 4 | 5.1% |
| $15,000 to $24,999 | 0 | 0.0% |
| $25,000 to $34,999 | 0 | 0.0% |
| $35,000 to $49,999 | 13 | 16.5% |
| $50,000 to $74,999 | 7 | 8.9% |
| $75,000 to $99,999 | 12 | 15.2% |
| $100,000 to $149,999 | 28 | 35.4% |
| $150,000 to $199,999 | 13 | 16.5% |
| $200,000+ | 2 | 2.5% |
Family Income by Famaliy Size in Aurora
5-person families (9 | 11.4%) account for the highest median family income in Aurora with $195,250 per family, while 2-person families (57 | 72.2%) have the highest median income of $46,406 per family member.
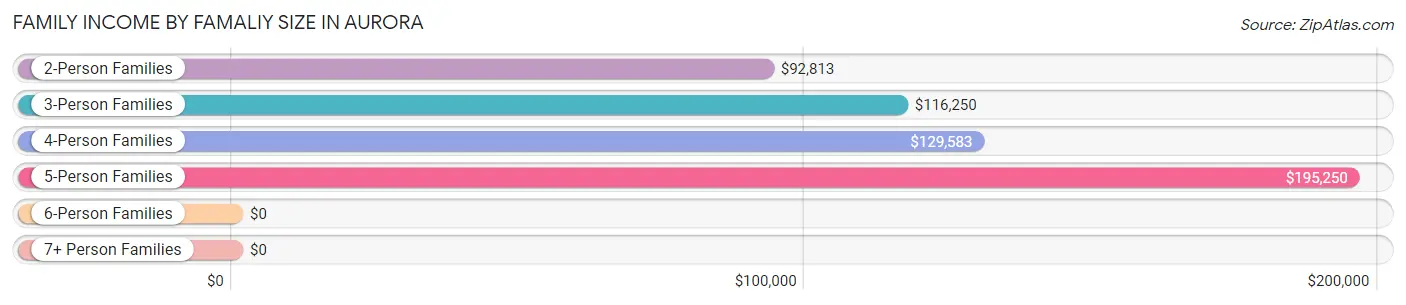
| Income Bracket | # Families | Median Income |
| 2-Person Families | 57 (72.2%) | $92,813 |
| 3-Person Families | 5 (6.3%) | $116,250 |
| 4-Person Families | 7 (8.9%) | $129,583 |
| 5-Person Families | 9 (11.4%) | $195,250 |
| 6-Person Families | 0 (0.0%) | $0 |
| 7+ Person Families | 1 (1.3%) | $0 |
| Total | 79 (100.0%) | $102,188 |
Family Income by Number of Earners in Aurora
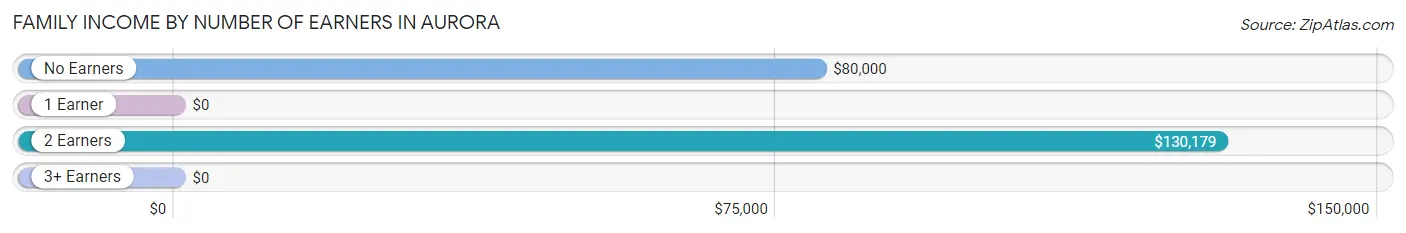
| Number of Earners | # Families | Median Income |
| No Earners | 20 (25.3%) | $80,000 |
| 1 Earner | 20 (25.3%) | $0 |
| 2 Earners | 39 (49.4%) | $130,179 |
| 3+ Earners | 0 (0.0%) | $0 |
| Total | 79 (100.0%) | $102,188 |
Household Income in Aurora
Household Income Brackets in Aurora
With 41 households falling in the category, the $100,000 to $149,999 income range is the most frequent in Aurora, accounting for 29.3% of all households.
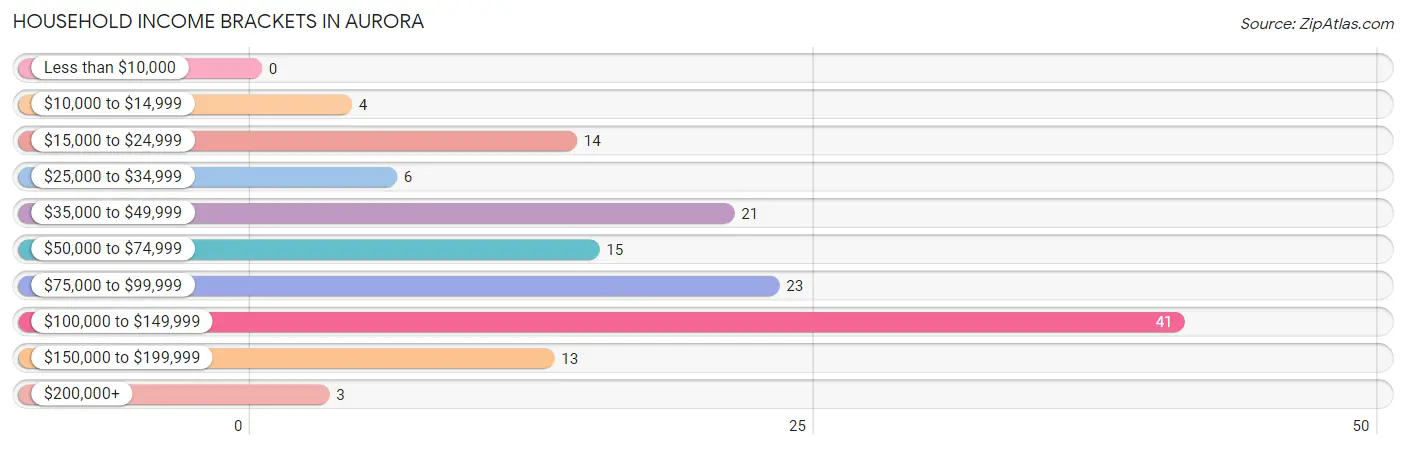
| Income Bracket | # Households | % Households |
| Less than $10,000 | 0 | 0.0% |
| $10,000 to $14,999 | 4 | 2.9% |
| $15,000 to $24,999 | 14 | 10.0% |
| $25,000 to $34,999 | 6 | 4.3% |
| $35,000 to $49,999 | 21 | 15.0% |
| $50,000 to $74,999 | 15 | 10.7% |
| $75,000 to $99,999 | 23 | 16.4% |
| $100,000 to $149,999 | 41 | 29.3% |
| $150,000 to $199,999 | 13 | 9.3% |
| $200,000+ | 3 | 2.1% |
Household Income by Householder Age in Aurora
The median household income in Aurora is $81,500, with the highest median household income of $100,417 found in the 25 to 44 years age bracket for the primary householder. A total of 29 households (20.7%) fall into this category. Meanwhile, the 15 to 24 years age bracket for the primary householder has the lowest median household income of $0, with 5 households (3.6%) in this group.
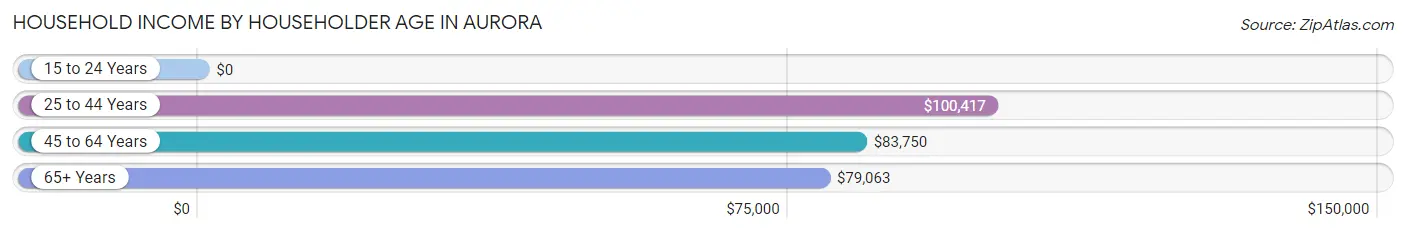
| Income Bracket | # Households | Median Income |
| 15 to 24 Years | 5 (3.6%) | $0 |
| 25 to 44 Years | 29 (20.7%) | $100,417 |
| 45 to 64 Years | 29 (20.7%) | $83,750 |
| 65+ Years | 77 (55.0%) | $79,063 |
| Total | 140 (100.0%) | $81,500 |
Poverty in Aurora
Income Below Poverty by Sex and Age in Aurora
With 15.4% poverty level for males and 3.0% for females among the residents of Aurora, 18 to 24 year old males and 65 to 74 year old females are the most vulnerable to poverty, with 18 males (69.2%) and 4 females (10.8%) in their respective age groups living below the poverty level.
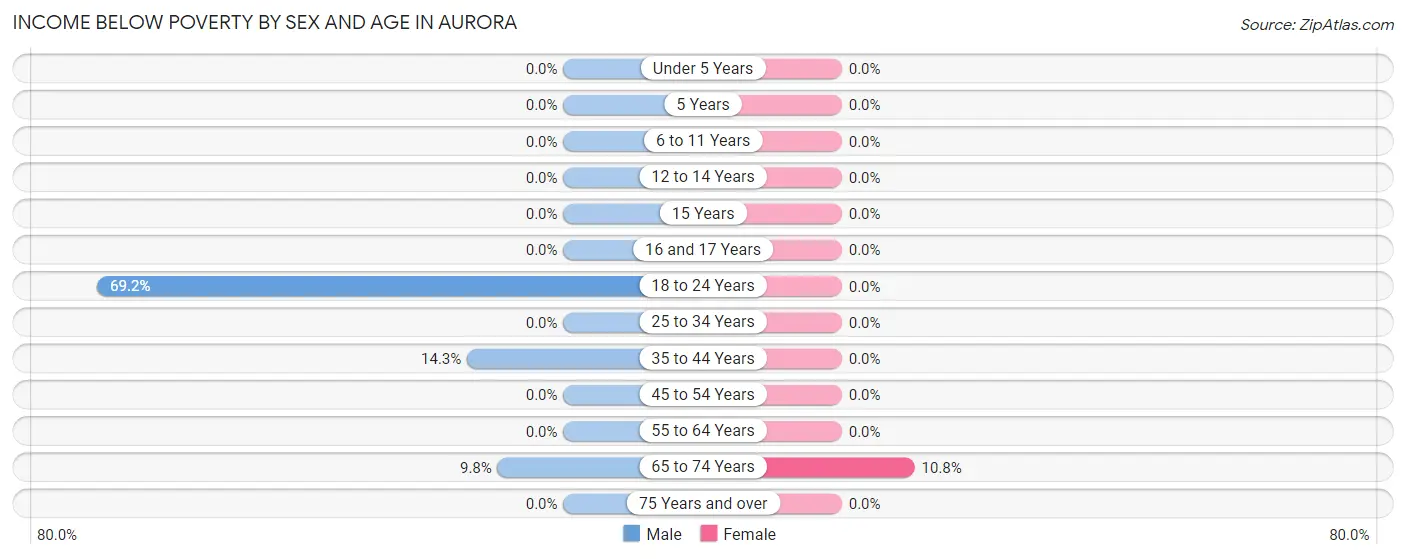
| Age Bracket | Male | Female |
| Under 5 Years | 0 (0.0%) | 0 (0.0%) |
| 5 Years | 0 (0.0%) | 0 (0.0%) |
| 6 to 11 Years | 0 (0.0%) | 0 (0.0%) |
| 12 to 14 Years | 0 (0.0%) | 0 (0.0%) |
| 15 Years | 0 (0.0%) | 0 (0.0%) |
| 16 and 17 Years | 0 (0.0%) | 0 (0.0%) |
| 18 to 24 Years | 18 (69.2%) | 0 (0.0%) |
| 25 to 34 Years | 0 (0.0%) | 0 (0.0%) |
| 35 to 44 Years | 2 (14.3%) | 0 (0.0%) |
| 45 to 54 Years | 0 (0.0%) | 0 (0.0%) |
| 55 to 64 Years | 0 (0.0%) | 0 (0.0%) |
| 65 to 74 Years | 4 (9.8%) | 4 (10.8%) |
| 75 Years and over | 0 (0.0%) | 0 (0.0%) |
| Total | 24 (15.4%) | 4 (3.0%) |
Income Above Poverty by Sex and Age in Aurora
According to the poverty statistics in Aurora, males aged under 5 years and females aged under 5 years are the age groups that are most secure financially, with 100.0% of males and 100.0% of females in these age groups living above the poverty line.
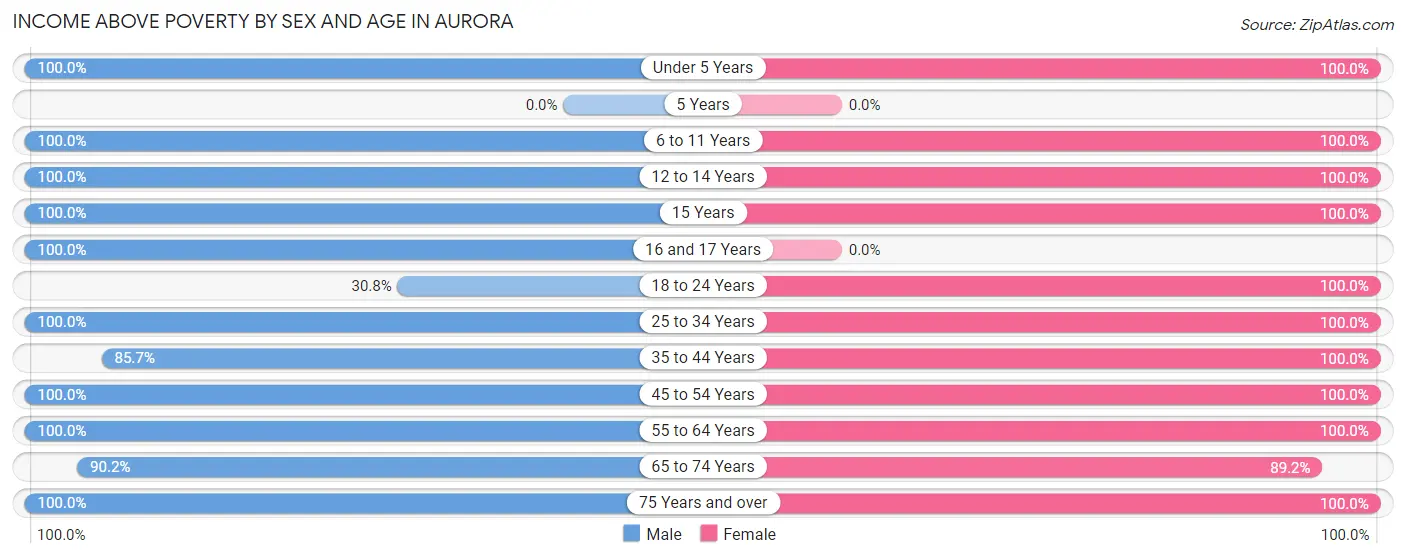
| Age Bracket | Male | Female |
| Under 5 Years | 2 (100.0%) | 5 (100.0%) |
| 5 Years | 0 (0.0%) | 0 (0.0%) |
| 6 to 11 Years | 6 (100.0%) | 5 (100.0%) |
| 12 to 14 Years | 4 (100.0%) | 7 (100.0%) |
| 15 Years | 1 (100.0%) | 3 (100.0%) |
| 16 and 17 Years | 3 (100.0%) | 0 (0.0%) |
| 18 to 24 Years | 8 (30.8%) | 1 (100.0%) |
| 25 to 34 Years | 22 (100.0%) | 14 (100.0%) |
| 35 to 44 Years | 12 (85.7%) | 5 (100.0%) |
| 45 to 54 Years | 3 (100.0%) | 11 (100.0%) |
| 55 to 64 Years | 9 (100.0%) | 21 (100.0%) |
| 65 to 74 Years | 37 (90.2%) | 33 (89.2%) |
| 75 Years and over | 25 (100.0%) | 22 (100.0%) |
| Total | 132 (84.6%) | 127 (97.0%) |
Income Below Poverty Among Married-Couple Families in Aurora
The poverty statistics for married-couple families in Aurora show that 5.3% or 4 of the total 76 families live below the poverty line. Families with no children have the highest poverty rate of 6.9%, comprising of 4 families. On the other hand, families with 1 or 2 children have the lowest poverty rate of 0.0%, which includes 0 families.
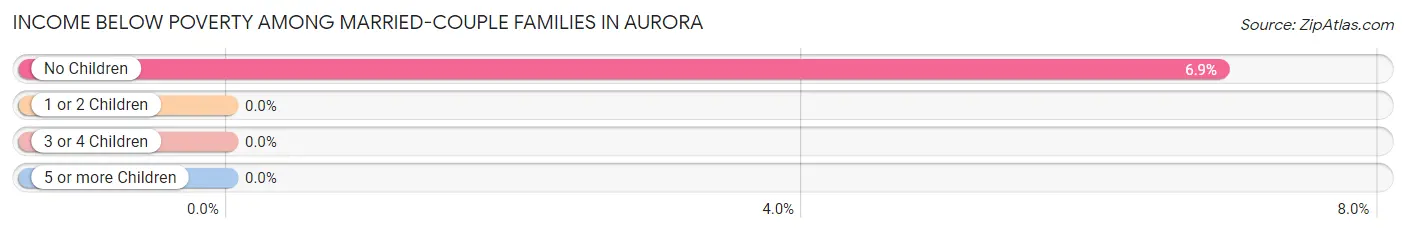
| Children | Above Poverty | Below Poverty |
| No Children | 54 (93.1%) | 4 (6.9%) |
| 1 or 2 Children | 14 (100.0%) | 0 (0.0%) |
| 3 or 4 Children | 3 (100.0%) | 0 (0.0%) |
| 5 or more Children | 1 (100.0%) | 0 (0.0%) |
| Total | 72 (94.7%) | 4 (5.3%) |
Income Below Poverty Among Single-Parent Households in Aurora
| Children | Single Father | Single Mother |
| No Children | 0 (0.0%) | 0 (0.0%) |
| 1 or 2 Children | 0 (0.0%) | 0 (0.0%) |
| 3 or 4 Children | 0 (0.0%) | 0 (0.0%) |
| 5 or more Children | 0 (0.0%) | 0 (0.0%) |
| Total | 0 (0.0%) | 0 (0.0%) |
Income Below Poverty Among Married-Couple vs Single-Parent Households in Aurora
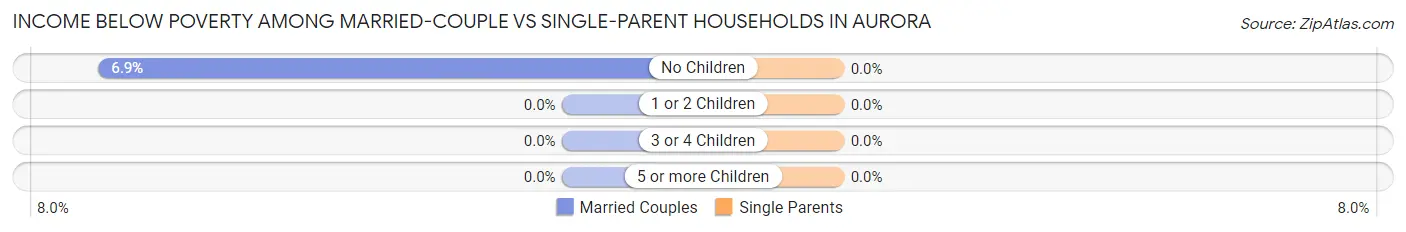
| Children | Married-Couple Families | Single-Parent Households |
| No Children | 4 (6.9%) | 0 (0.0%) |
| 1 or 2 Children | 0 (0.0%) | 0 (0.0%) |
| 3 or 4 Children | 0 (0.0%) | 0 (0.0%) |
| 5 or more Children | 0 (0.0%) | 0 (0.0%) |
| Total | 4 (5.3%) | 0 (0.0%) |
Race in Aurora
The most populous races in Aurora are White / Caucasian (599 | 86.6%), Hispanic or Latino (96 | 13.9%), and Some other Race (49 | 7.1%).
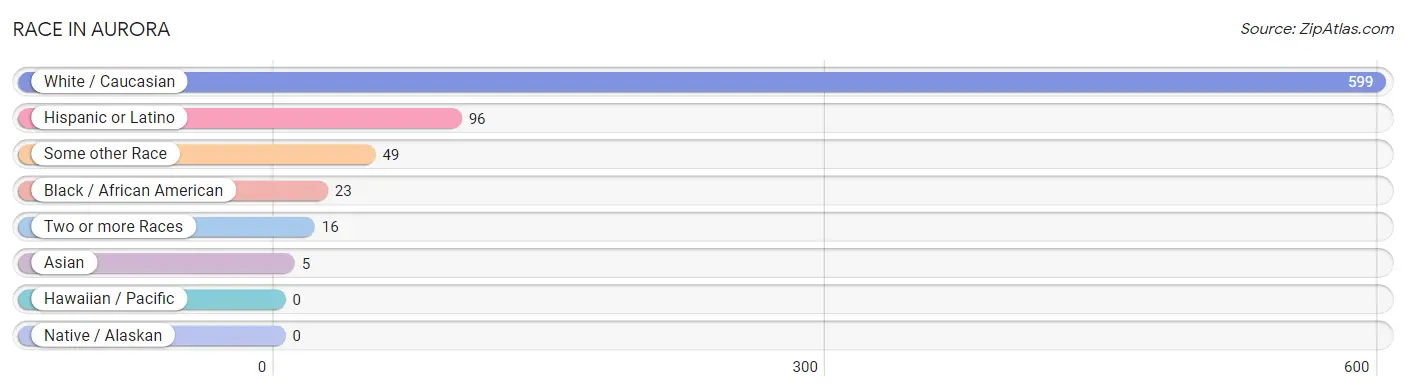
| Race | # Population | % Population |
| Asian | 5 | 0.7% |
| Black / African American | 23 | 3.3% |
| Hawaiian / Pacific | 0 | 0.0% |
| Hispanic or Latino | 96 | 13.9% |
| Native / Alaskan | 0 | 0.0% |
| White / Caucasian | 599 | 86.6% |
| Two or more Races | 16 | 2.3% |
| Some other Race | 49 | 7.1% |
| Total | 692 | 100.0% |
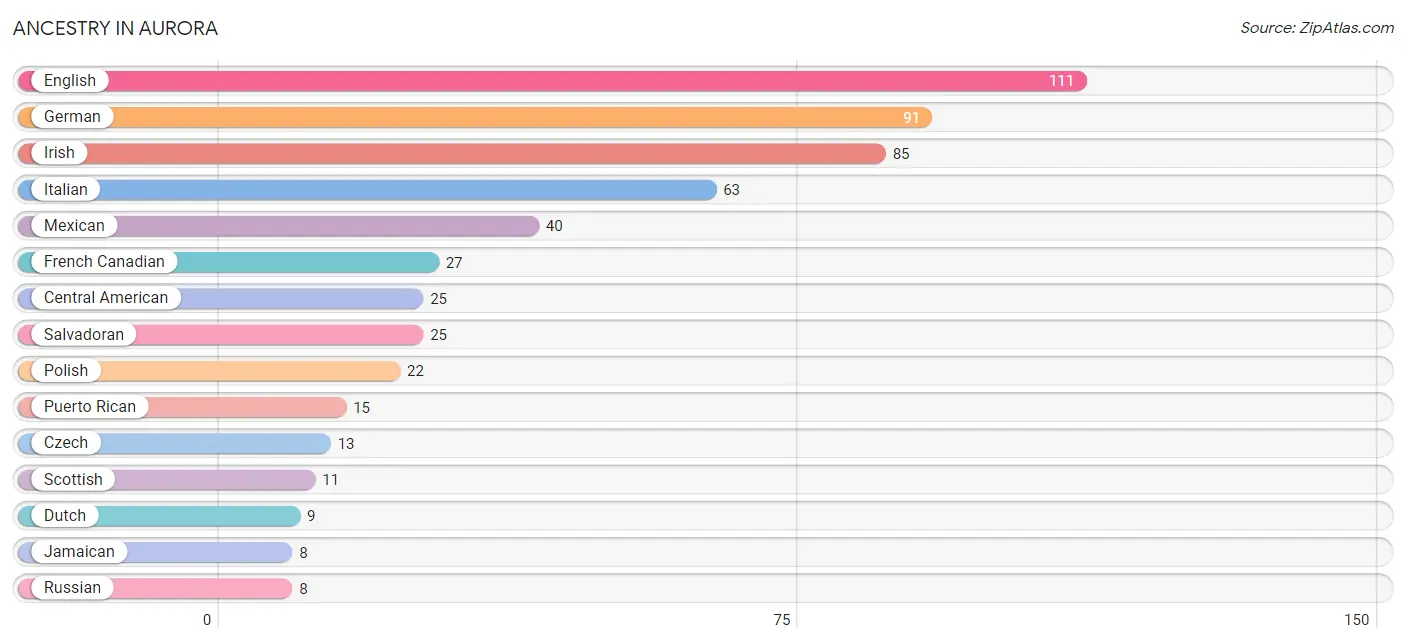
Ancestry in Aurora
The most populous ancestries reported in Aurora are English (111 | 16.0%), German (91 | 13.2%), Irish (85 | 12.3%), Italian (63 | 9.1%), and Mexican (40 | 5.8%), together accounting for 56.4% of all Aurora residents.
| Ancestry | # Population | % Population |
| American | 1 | 0.1% |
| British | 1 | 0.1% |
| Burmese | 1 | 0.1% |
| Canadian | 5 | 0.7% |
| Central American | 25 | 3.6% |
| Cuban | 6 | 0.9% |
| Czech | 13 | 1.9% |
| Dutch | 9 | 1.3% |
| English | 111 | 16.0% |
| European | 6 | 0.9% |
| French | 5 | 0.7% |
| French Canadian | 27 | 3.9% |
| German | 91 | 13.2% |
| Indian (Asian) | 3 | 0.4% |
| Irish | 85 | 12.3% |
| Italian | 63 | 9.1% |
| Jamaican | 8 | 1.2% |
| Korean | 1 | 0.1% |
| Mexican | 40 | 5.8% |
| Norwegian | 5 | 0.7% |
| Polish | 22 | 3.2% |
| Puerto Rican | 15 | 2.2% |
| Russian | 8 | 1.2% |
| Salvadoran | 25 | 3.6% |
| Scotch-Irish | 1 | 0.1% |
| Scottish | 11 | 1.6% |
| Spaniard | 6 | 0.9% |
| Swedish | 1 | 0.1% |
| Swiss | 2 | 0.3% |
| Ukrainian | 1 | 0.1% |
| Welsh | 3 | 0.4% | View All 31 Rows |
Immigrants in Aurora
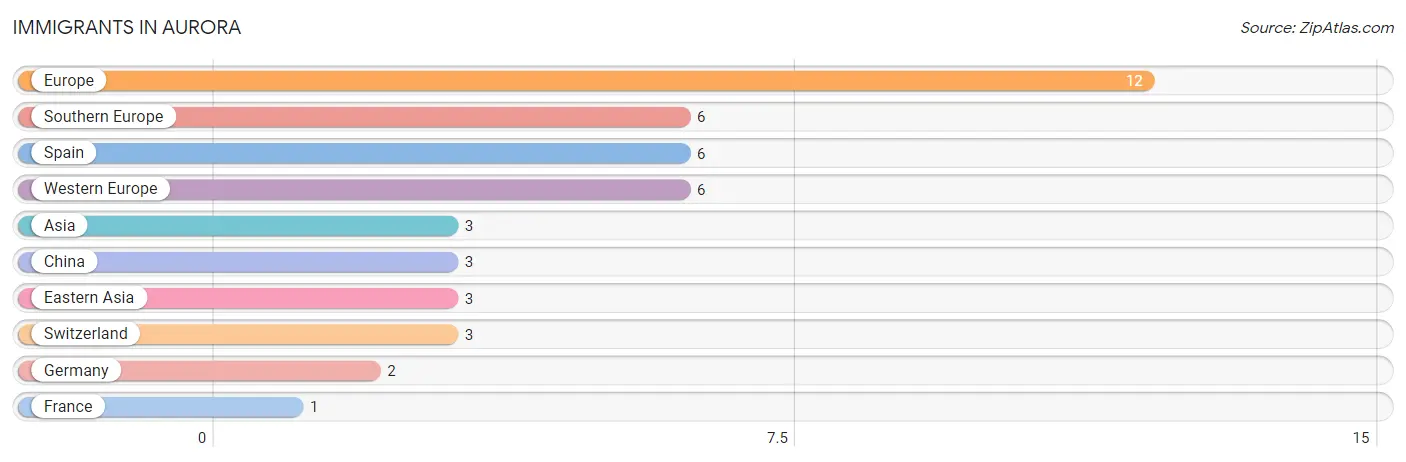
The most numerous immigrant groups reported in Aurora came from Europe (12 | 1.7%), Southern Europe (6 | 0.9%), Spain (6 | 0.9%), Western Europe (6 | 0.9%), and Asia (3 | 0.4%), together accounting for 4.8% of all Aurora residents.
| Immigration Origin | # Population | % Population |
| Asia | 3 | 0.4% |
| China | 3 | 0.4% |
| Eastern Asia | 3 | 0.4% |
| Europe | 12 | 1.7% |
| France | 1 | 0.1% |
| Germany | 2 | 0.3% |
| Southern Europe | 6 | 0.9% |
| Spain | 6 | 0.9% |
| Switzerland | 3 | 0.4% |
| Western Europe | 6 | 0.9% | View All 10 Rows |
Sex and Age in Aurora
Sex and Age in Aurora
The most populous age groups in Aurora are 20 to 24 Years (150 | 43.5%) for men and 20 to 24 Years (100 | 28.8%) for women.
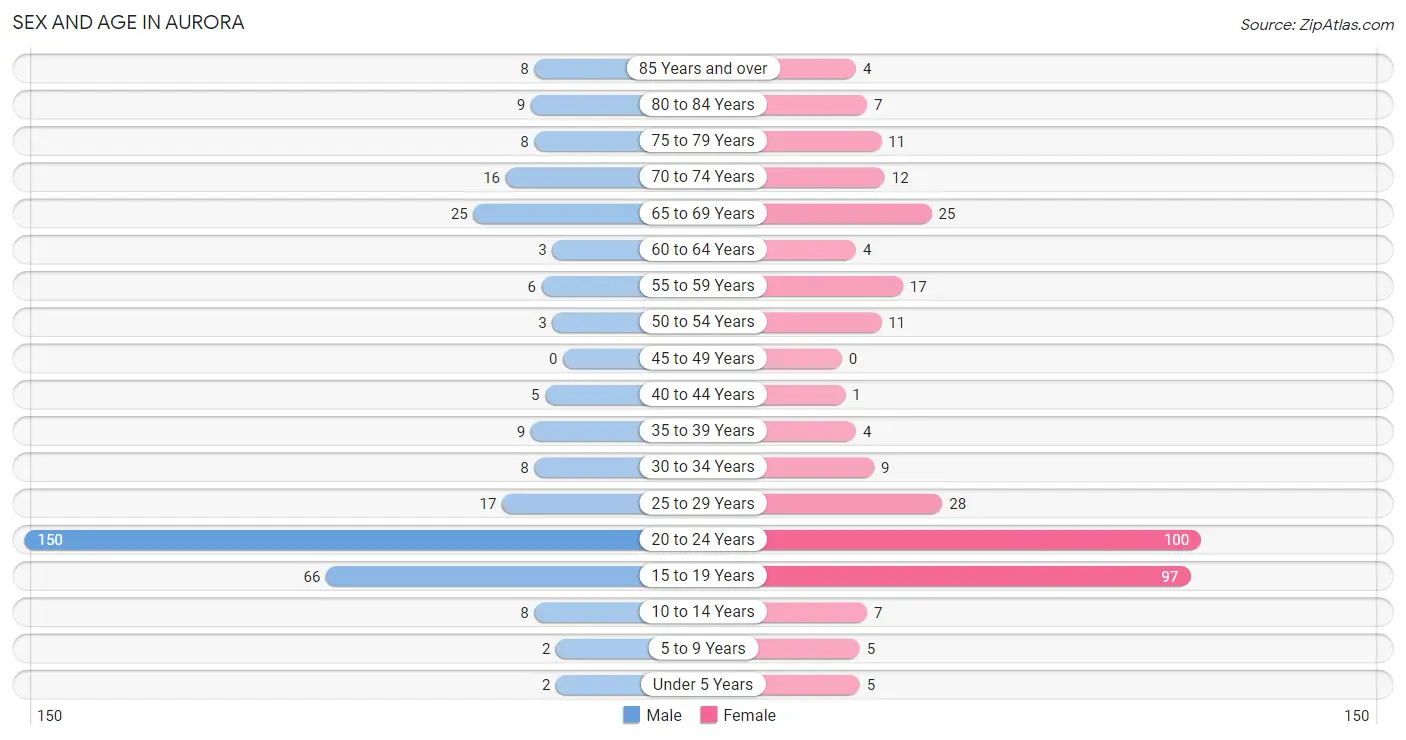
| Age Bracket | Male | Female |
| Under 5 Years | 2 (0.6%) | 5 (1.4%) |
| 5 to 9 Years | 2 (0.6%) | 5 (1.4%) |
| 10 to 14 Years | 8 (2.3%) | 7 (2.0%) |
| 15 to 19 Years | 66 (19.1%) | 97 (28.0%) |
| 20 to 24 Years | 150 (43.5%) | 100 (28.8%) |
| 25 to 29 Years | 17 (4.9%) | 28 (8.1%) |
| 30 to 34 Years | 8 (2.3%) | 9 (2.6%) |
| 35 to 39 Years | 9 (2.6%) | 4 (1.1%) |
| 40 to 44 Years | 5 (1.5%) | 1 (0.3%) |
| 45 to 49 Years | 0 (0.0%) | 0 (0.0%) |
| 50 to 54 Years | 3 (0.9%) | 11 (3.2%) |
| 55 to 59 Years | 6 (1.7%) | 17 (4.9%) |
| 60 to 64 Years | 3 (0.9%) | 4 (1.1%) |
| 65 to 69 Years | 25 (7.2%) | 25 (7.2%) |
| 70 to 74 Years | 16 (4.6%) | 12 (3.5%) |
| 75 to 79 Years | 8 (2.3%) | 11 (3.2%) |
| 80 to 84 Years | 9 (2.6%) | 7 (2.0%) |
| 85 Years and over | 8 (2.3%) | 4 (1.1%) |
| Total | 345 (100.0%) | 347 (100.0%) |
Families and Households in Aurora
Median Family Size in Aurora
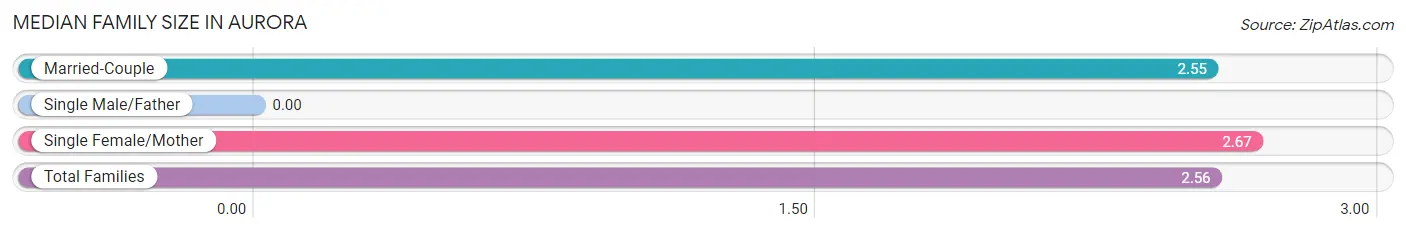
| Family Type | # Families | Family Size |
| Married-Couple | 76 (96.2%) | 2.55 |
| Single Male/Father | 0 (0.0%) | - |
| Single Female/Mother | 3 (3.8%) | 2.67 |
| Total Families | 79 (100.0%) | 2.56 |
Median Household Size in Aurora
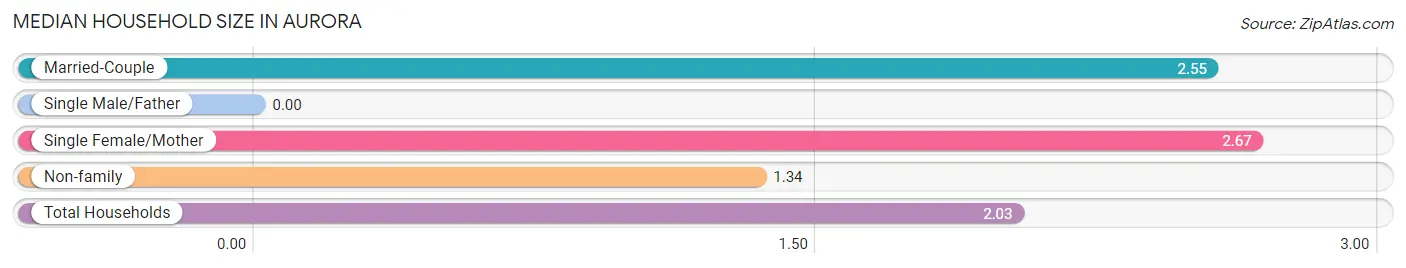
| Household Type | # Households | Household Size |
| Married-Couple | 76 (54.3%) | 2.55 |
| Single Male/Father | 0 (0.0%) | - |
| Single Female/Mother | 3 (2.1%) | 2.67 |
| Non-family | 61 (43.6%) | 1.34 |
| Total Households | 140 (100.0%) | 2.03 |
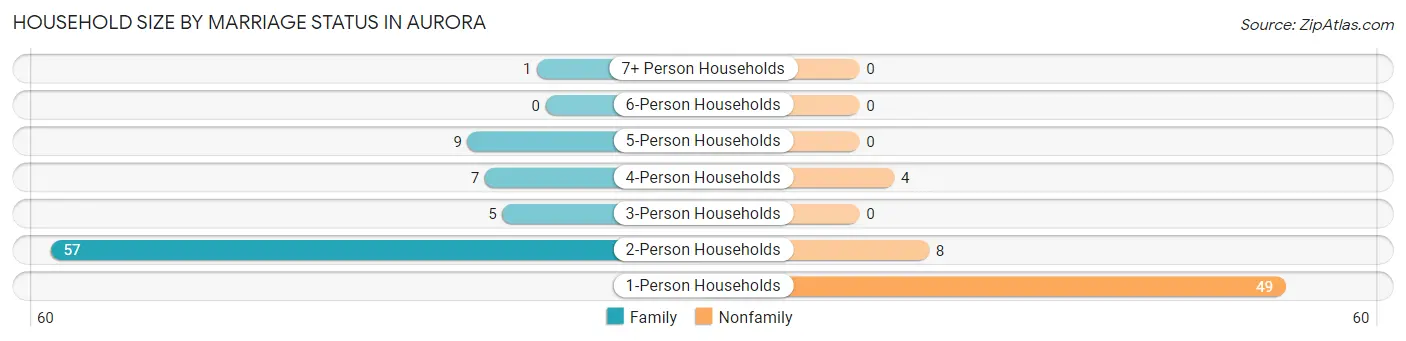
Household Size by Marriage Status in Aurora
Out of a total of 140 households in Aurora, 79 (56.4%) are family households, while 61 (43.6%) are nonfamily households. The most numerous type of family households are 2-person households, comprising 57, and the most common type of nonfamily households are 1-person households, comprising 49.
| Household Size | Family Households | Nonfamily Households |
| 1-Person Households | - | 49 (35.0%) |
| 2-Person Households | 57 (40.7%) | 8 (5.7%) |
| 3-Person Households | 5 (3.6%) | 0 (0.0%) |
| 4-Person Households | 7 (5.0%) | 4 (2.9%) |
| 5-Person Households | 9 (6.4%) | 0 (0.0%) |
| 6-Person Households | 0 (0.0%) | 0 (0.0%) |
| 7+ Person Households | 1 (0.7%) | 0 (0.0%) |
| Total | 79 (56.4%) | 61 (43.6%) |
Female Fertility in Aurora
Fertility by Age in Aurora
| Age Bracket | Women with Births | Births / 1,000 Women |
| 15 to 19 years | 0 (0.0%) | 0.0 |
| 20 to 34 years | 0 (0.0%) | 0.0 |
| 35 to 50 years | 0 (0.0%) | 0.0 |
| Total | 0 (0.0%) | 0.0 |
Fertility by Age by Marriage Status in Aurora
| Age Bracket | Married | Unmarried |
| 15 to 19 years | 0 (0.0%) | 0 (0.0%) |
| 20 to 34 years | 0 (0.0%) | 0 (0.0%) |
| 35 to 50 years | 0 (0.0%) | 0 (0.0%) |
| Total | 0 (0.0%) | 0 (0.0%) |
Fertility by Education in Aurora
| Educational Attainment | Women with Births | Births / 1,000 Women |
| Less than High School | 0 (0.0%) | 0.0 |
| High School Diploma | 0 (0.0%) | 0.0 |
| College or Associate's Degree | 0 (0.0%) | 0.0 |
| Bachelor's Degree | 0 (0.0%) | 0.0 |
| Graduate Degree | 0 (0.0%) | 0.0 |
| Total | 0 (0.0%) | 0.0 |
Fertility by Education by Marriage Status in Aurora
| Educational Attainment | Married | Unmarried |
| Less than High School | 0 (0.0%) | 0 (0.0%) |
| High School Diploma | 0 (0.0%) | 0 (0.0%) |
| College or Associate's Degree | 0 (0.0%) | 0 (0.0%) |
| Bachelor's Degree | 0 (0.0%) | 0 (0.0%) |
| Graduate Degree | 0 (0.0%) | 0 (0.0%) |
| Total | 0 (0.0%) | 0 (0.0%) |
Employment Characteristics in Aurora
Employment by Class of Employer in Aurora
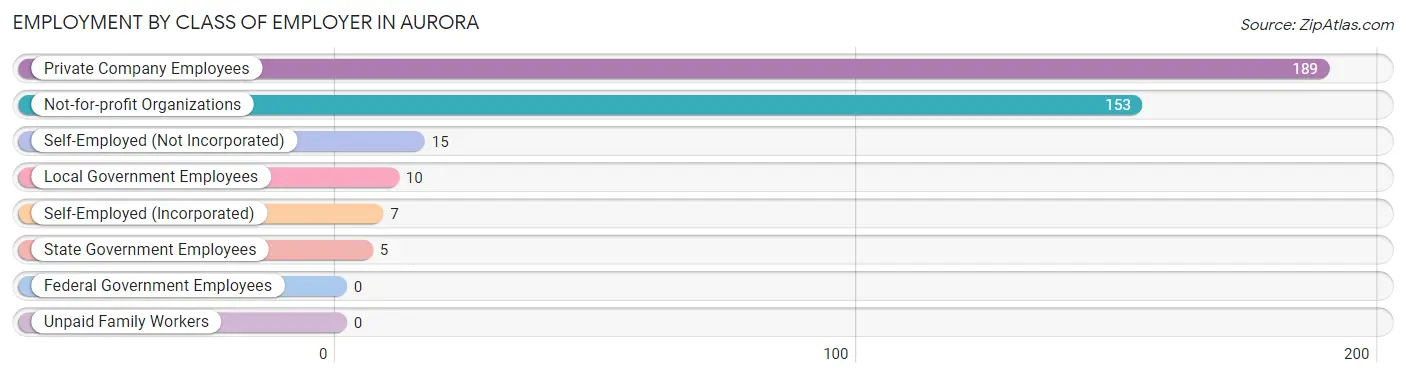
Among the 379 employed individuals in Aurora, private company employees (189 | 49.9%), not-for-profit organizations (153 | 40.4%), and self-employed (not incorporated) (15 | 4.0%) make up the most common classes of employment.
| Employer Class | # Employees | % Employees |
| Private Company Employees | 189 | 49.9% |
| Self-Employed (Incorporated) | 7 | 1.8% |
| Self-Employed (Not Incorporated) | 15 | 4.0% |
| Not-for-profit Organizations | 153 | 40.4% |
| Local Government Employees | 10 | 2.6% |
| State Government Employees | 5 | 1.3% |
| Federal Government Employees | 0 | 0.0% |
| Unpaid Family Workers | 0 | 0.0% |
| Total | 379 | 100.0% |
Employment Status by Age in Aurora
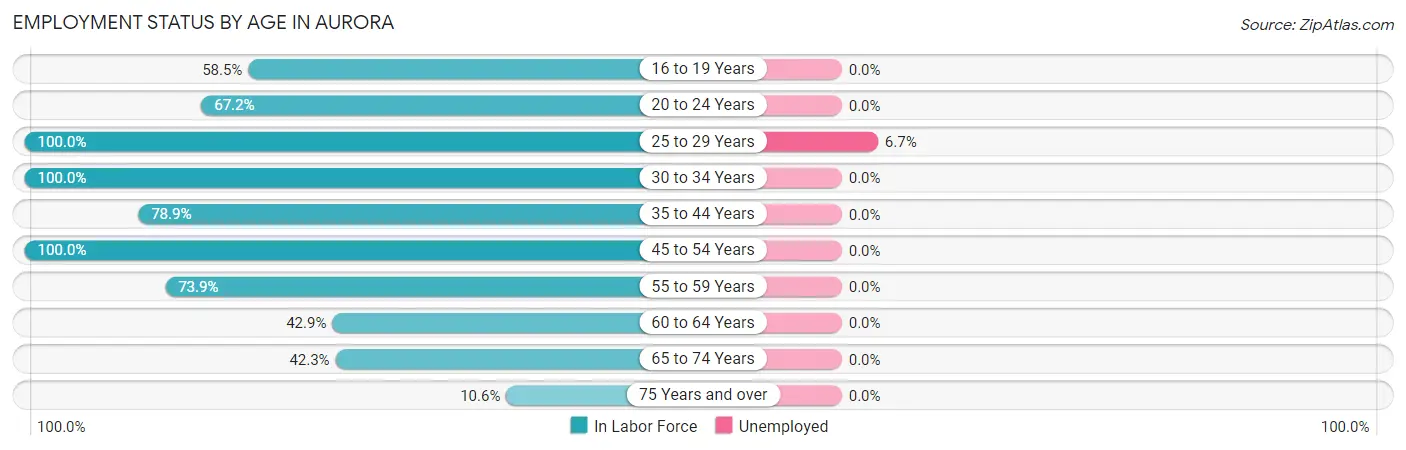
According to the labor force statistics for Aurora, out of the total population over 16 years of age (659), 62.2% or 410 individuals are in the labor force, with 0.7% or 3 of them unemployed. The age group with the highest labor force participation rate is 25 to 29 years, with 100.0% or 45 individuals in the labor force. Within the labor force, the 25 to 29 years age range has the highest percentage of unemployed individuals, with 6.7% or 3 of them being unemployed.
| Age Bracket | In Labor Force | Unemployed |
| 16 to 19 Years | 93 (58.5%) | 0 (0.0%) |
| 20 to 24 Years | 168 (67.2%) | 0 (0.0%) |
| 25 to 29 Years | 45 (100.0%) | 3 (6.7%) |
| 30 to 34 Years | 17 (100.0%) | 0 (0.0%) |
| 35 to 44 Years | 15 (78.9%) | 0 (0.0%) |
| 45 to 54 Years | 14 (100.0%) | 0 (0.0%) |
| 55 to 59 Years | 17 (73.9%) | 0 (0.0%) |
| 60 to 64 Years | 3 (42.9%) | 0 (0.0%) |
| 65 to 74 Years | 33 (42.3%) | 0 (0.0%) |
| 75 Years and over | 5 (10.6%) | 0 (0.0%) |
| Total | 410 (62.2%) | 3 (0.7%) |
Employment Status by Educational Attainment in Aurora
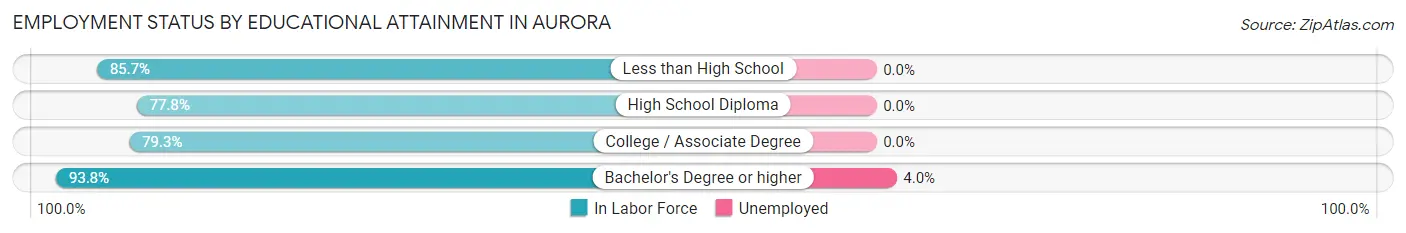
According to labor force statistics for Aurora, 88.8% of individuals (111) out of the total population between 25 and 64 years of age (125) are in the labor force, with 2.7% or 3 of them being unemployed. The group with the highest labor force participation rate are those with the educational attainment of bachelor's degree or higher, with 93.8% or 75 individuals in the labor force. Within the labor force, individuals with bachelor's degree or higher education have the highest percentage of unemployment, with 4.0% or 3 of them being unemployed.
| Educational Attainment | In Labor Force | Unemployed |
| Less than High School | 6 (85.7%) | 0 (0.0%) |
| High School Diploma | 7 (77.8%) | 0 (0.0%) |
| College / Associate Degree | 23 (79.3%) | 0 (0.0%) |
| Bachelor's Degree or higher | 75 (93.8%) | 3 (4.0%) |
| Total | 111 (88.8%) | 3 (2.7%) |
Employment Occupations by Sex in Aurora
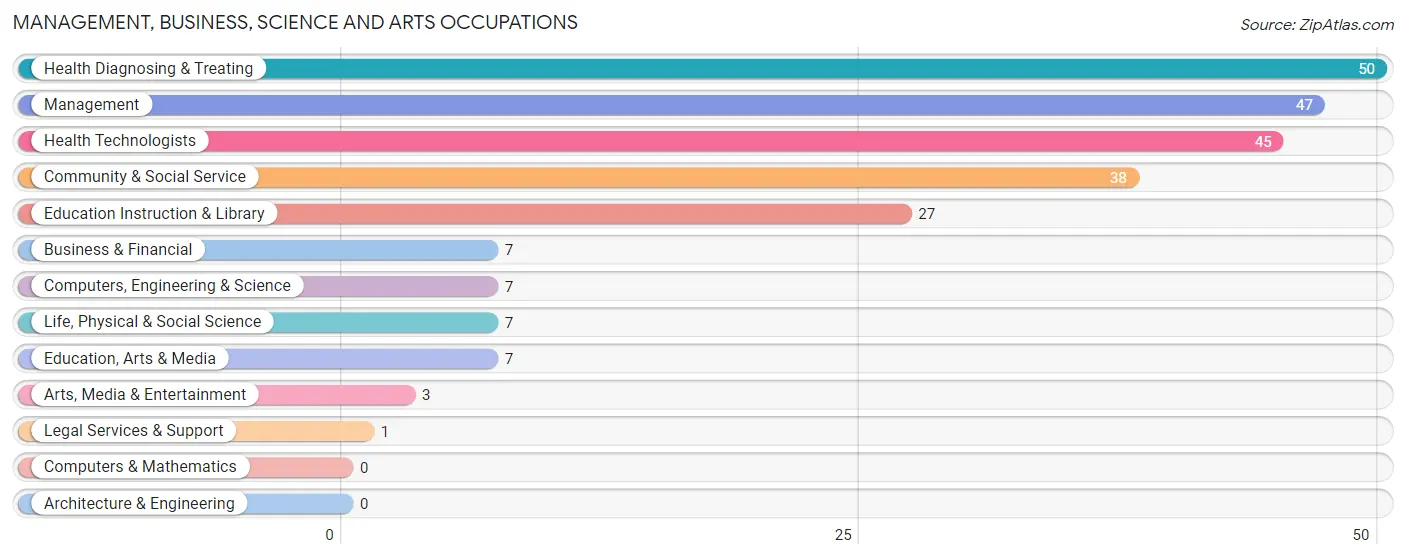
Management, Business, Science and Arts Occupations
The most common Management, Business, Science and Arts occupations in Aurora are Health Diagnosing & Treating (50 | 12.3%), Management (47 | 11.6%), Health Technologists (45 | 11.1%), Community & Social Service (38 | 9.3%), and Education Instruction & Library (27 | 6.6%).
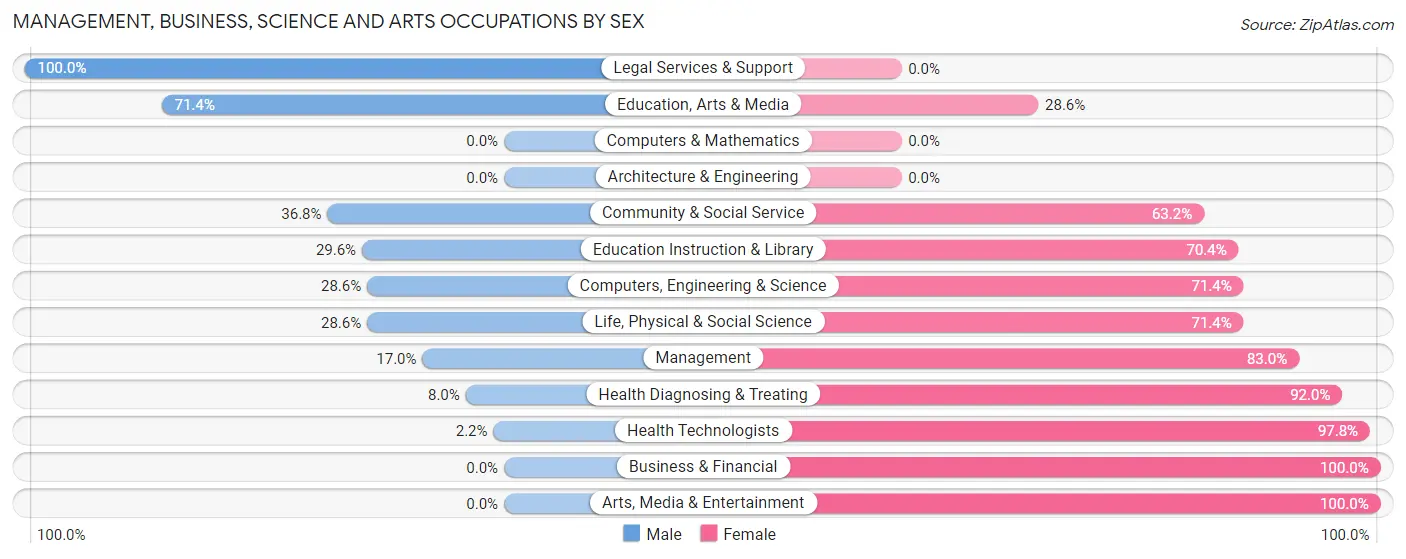
Management, Business, Science and Arts Occupations by Sex
Within the Management, Business, Science and Arts occupations in Aurora, the most male-oriented occupations are Legal Services & Support (100.0%), Education, Arts & Media (71.4%), and Community & Social Service (36.8%), while the most female-oriented occupations are Business & Financial (100.0%), Arts, Media & Entertainment (100.0%), and Health Technologists (97.8%).
| Occupation | Male | Female |
| Management | 8 (17.0%) | 39 (83.0%) |
| Business & Financial | 0 (0.0%) | 7 (100.0%) |
| Computers, Engineering & Science | 2 (28.6%) | 5 (71.4%) |
| Computers & Mathematics | 0 (0.0%) | 0 (0.0%) |
| Architecture & Engineering | 0 (0.0%) | 0 (0.0%) |
| Life, Physical & Social Science | 2 (28.6%) | 5 (71.4%) |
| Community & Social Service | 14 (36.8%) | 24 (63.2%) |
| Education, Arts & Media | 5 (71.4%) | 2 (28.6%) |
| Legal Services & Support | 1 (100.0%) | 0 (0.0%) |
| Education Instruction & Library | 8 (29.6%) | 19 (70.4%) |
| Arts, Media & Entertainment | 0 (0.0%) | 3 (100.0%) |
| Health Diagnosing & Treating | 4 (8.0%) | 46 (92.0%) |
| Health Technologists | 1 (2.2%) | 44 (97.8%) |
| Total (Category) | 28 (18.8%) | 121 (81.2%) |
| Total (Overall) | 199 (48.9%) | 208 (51.1%) |
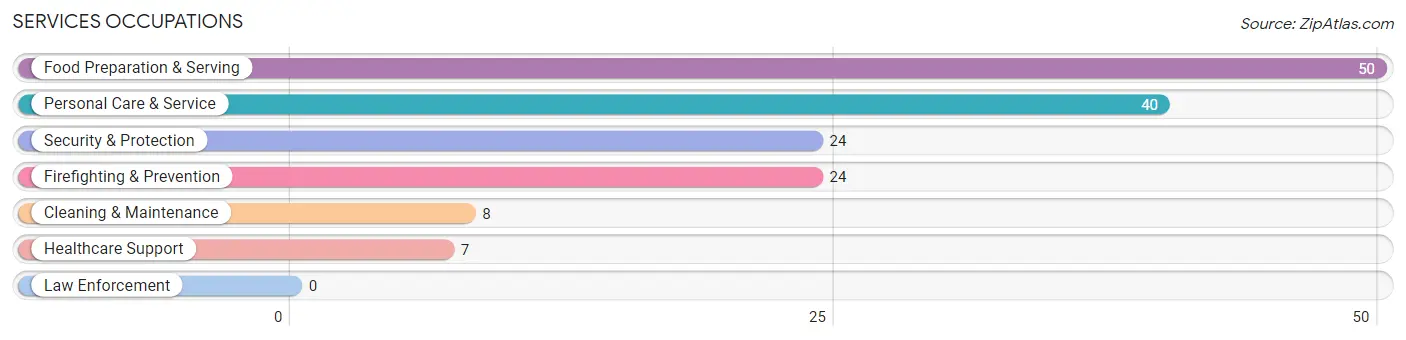
Services Occupations
The most common Services occupations in Aurora are Food Preparation & Serving (50 | 12.3%), Personal Care & Service (40 | 9.8%), Security & Protection (24 | 5.9%), Firefighting & Prevention (24 | 5.9%), and Cleaning & Maintenance (8 | 2.0%).
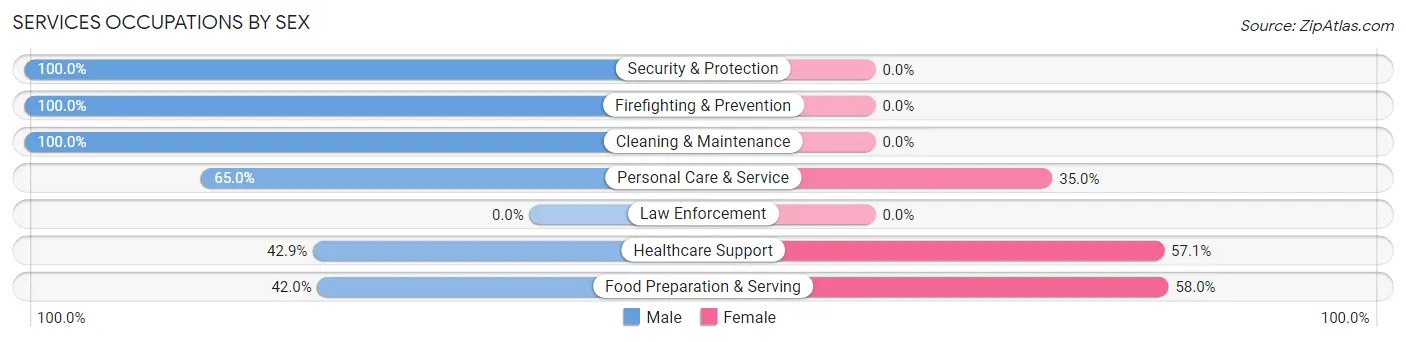
Services Occupations by Sex
Within the Services occupations in Aurora, the most male-oriented occupations are Security & Protection (100.0%), Firefighting & Prevention (100.0%), and Cleaning & Maintenance (100.0%), while the most female-oriented occupations are Food Preparation & Serving (58.0%), Healthcare Support (57.1%), and Personal Care & Service (35.0%).
| Occupation | Male | Female |
| Healthcare Support | 3 (42.9%) | 4 (57.1%) |
| Security & Protection | 24 (100.0%) | 0 (0.0%) |
| Firefighting & Prevention | 24 (100.0%) | 0 (0.0%) |
| Law Enforcement | 0 (0.0%) | 0 (0.0%) |
| Food Preparation & Serving | 21 (42.0%) | 29 (58.0%) |
| Cleaning & Maintenance | 8 (100.0%) | 0 (0.0%) |
| Personal Care & Service | 26 (65.0%) | 14 (35.0%) |
| Total (Category) | 82 (63.6%) | 47 (36.4%) |
| Total (Overall) | 199 (48.9%) | 208 (51.1%) |
Sales and Office Occupations
The most common Sales and Office occupations in Aurora are Sales & Related (51 | 12.5%), and Office & Administration (23 | 5.7%).
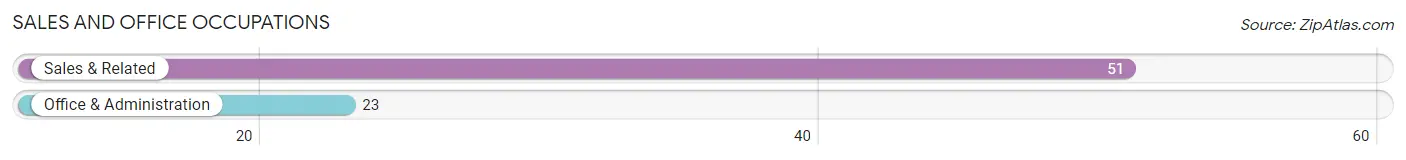
Sales and Office Occupations by Sex
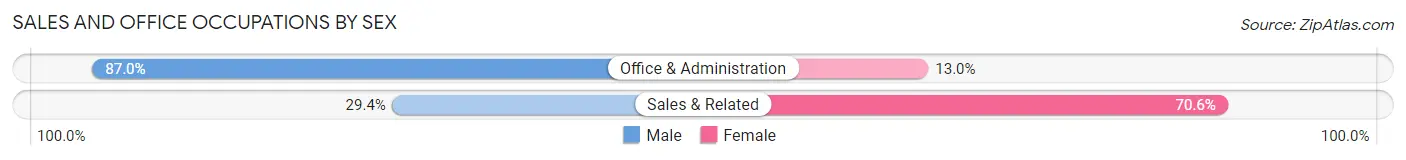
| Occupation | Male | Female |
| Sales & Related | 15 (29.4%) | 36 (70.6%) |
| Office & Administration | 20 (87.0%) | 3 (13.0%) |
| Total (Category) | 35 (47.3%) | 39 (52.7%) |
| Total (Overall) | 199 (48.9%) | 208 (51.1%) |
Natural Resources, Construction and Maintenance Occupations
The most common Natural Resources, Construction and Maintenance occupations in Aurora are , and Construction & Extraction (42 | 10.3%).
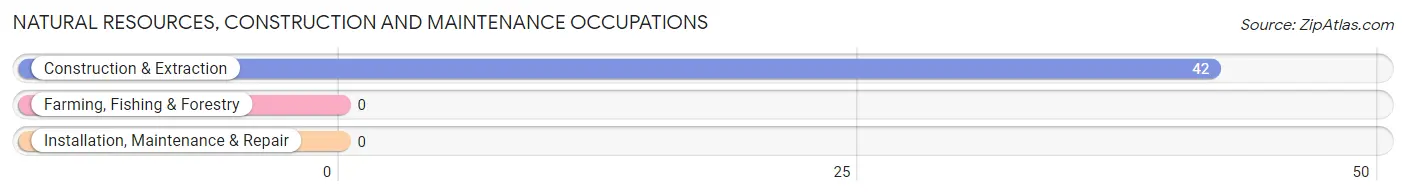
Natural Resources, Construction and Maintenance Occupations by Sex
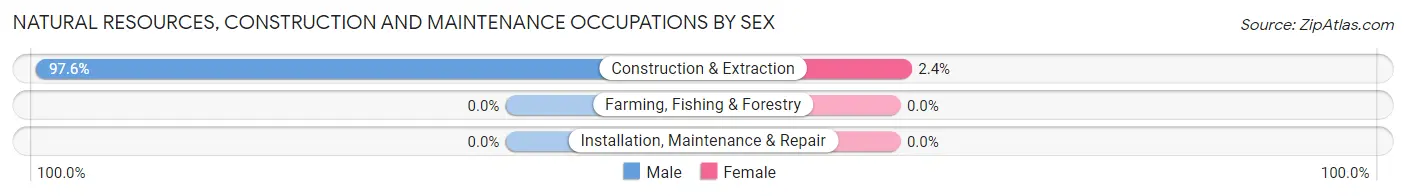
| Occupation | Male | Female |
| Farming, Fishing & Forestry | 0 (0.0%) | 0 (0.0%) |
| Construction & Extraction | 41 (97.6%) | 1 (2.4%) |
| Installation, Maintenance & Repair | 0 (0.0%) | 0 (0.0%) |
| Total (Category) | 41 (97.6%) | 1 (2.4%) |
| Total (Overall) | 199 (48.9%) | 208 (51.1%) |
Production, Transportation and Moving Occupations
The most common Production, Transportation and Moving occupations in Aurora are Transportation (11 | 2.7%), and Production (2 | 0.5%).
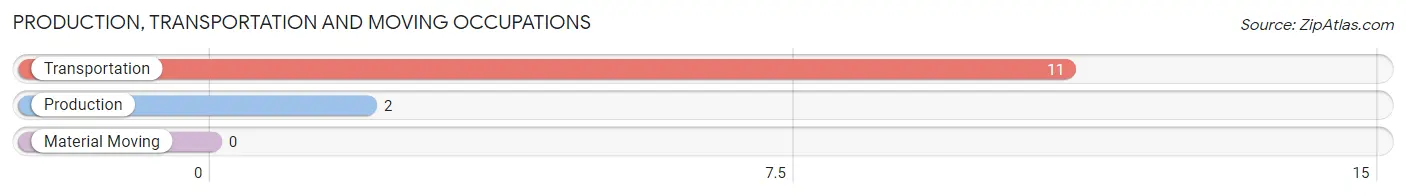
Production, Transportation and Moving Occupations by Sex
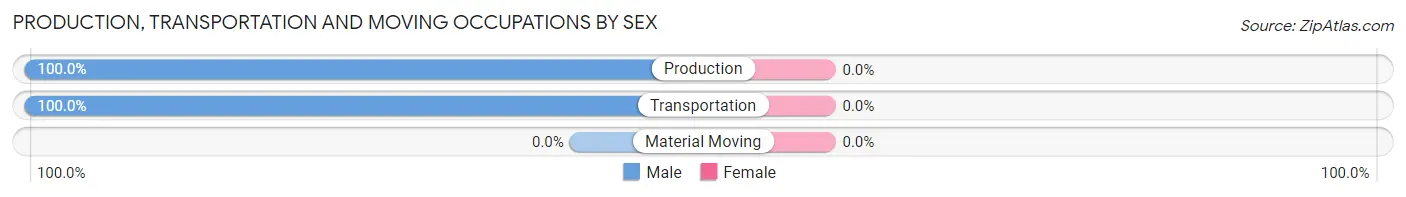
| Occupation | Male | Female |
| Production | 2 (100.0%) | 0 (0.0%) |
| Transportation | 11 (100.0%) | 0 (0.0%) |
| Material Moving | 0 (0.0%) | 0 (0.0%) |
| Total (Category) | 13 (100.0%) | 0 (0.0%) |
| Total (Overall) | 199 (48.9%) | 208 (51.1%) |
Employment Industries by Sex in Aurora
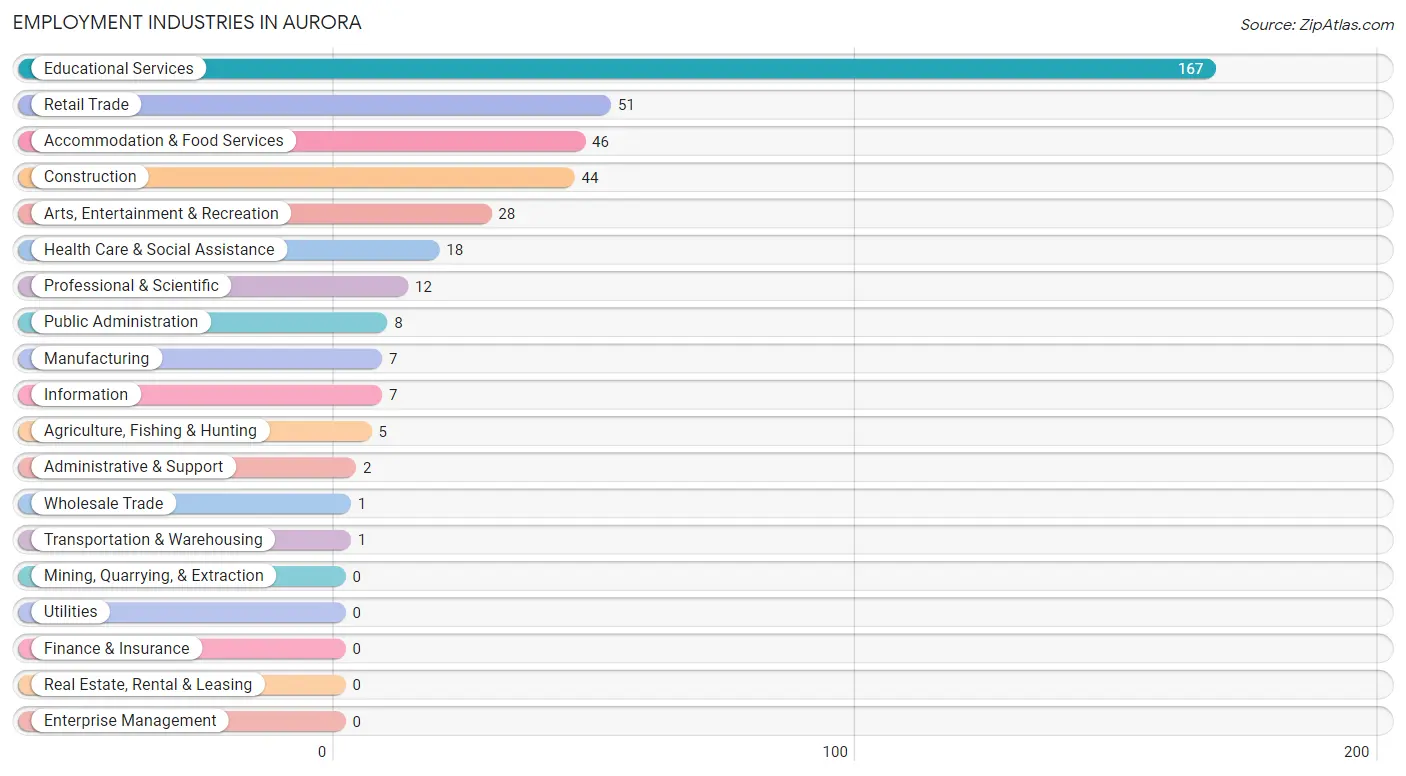
Employment Industries in Aurora
The major employment industries in Aurora include Educational Services (167 | 41.0%), Retail Trade (51 | 12.5%), Accommodation & Food Services (46 | 11.3%), Construction (44 | 10.8%), and Arts, Entertainment & Recreation (28 | 6.9%).
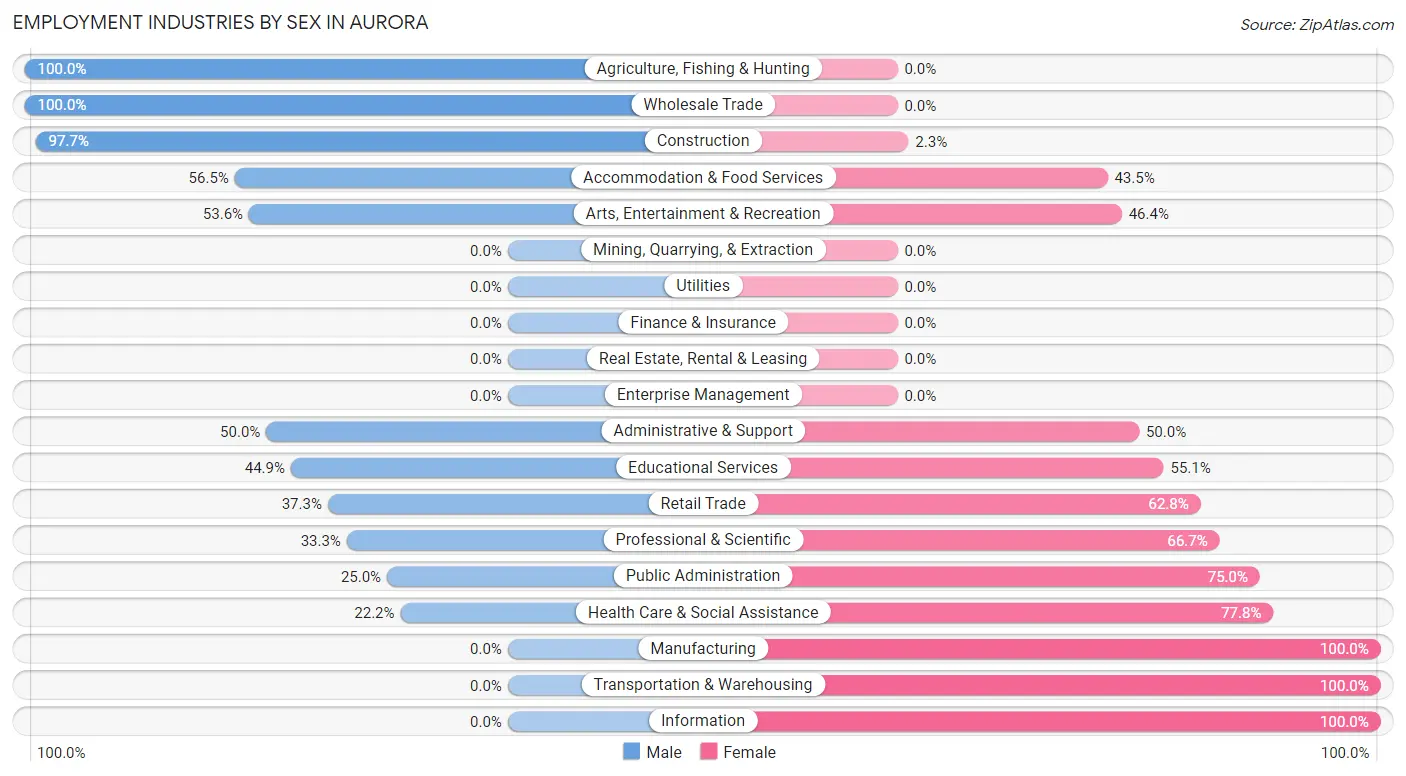
Employment Industries by Sex in Aurora
The Aurora industries that see more men than women are Agriculture, Fishing & Hunting (100.0%), Wholesale Trade (100.0%), and Construction (97.7%), whereas the industries that tend to have a higher number of women are Manufacturing (100.0%), Transportation & Warehousing (100.0%), and Information (100.0%).
| Industry | Male | Female |
| Agriculture, Fishing & Hunting | 5 (100.0%) | 0 (0.0%) |
| Mining, Quarrying, & Extraction | 0 (0.0%) | 0 (0.0%) |
| Construction | 43 (97.7%) | 1 (2.3%) |
| Manufacturing | 0 (0.0%) | 7 (100.0%) |
| Wholesale Trade | 1 (100.0%) | 0 (0.0%) |
| Retail Trade | 19 (37.2%) | 32 (62.7%) |
| Transportation & Warehousing | 0 (0.0%) | 1 (100.0%) |
| Utilities | 0 (0.0%) | 0 (0.0%) |
| Information | 0 (0.0%) | 7 (100.0%) |
| Finance & Insurance | 0 (0.0%) | 0 (0.0%) |
| Real Estate, Rental & Leasing | 0 (0.0%) | 0 (0.0%) |
| Professional & Scientific | 4 (33.3%) | 8 (66.7%) |
| Enterprise Management | 0 (0.0%) | 0 (0.0%) |
| Administrative & Support | 1 (50.0%) | 1 (50.0%) |
| Educational Services | 75 (44.9%) | 92 (55.1%) |
| Health Care & Social Assistance | 4 (22.2%) | 14 (77.8%) |
| Arts, Entertainment & Recreation | 15 (53.6%) | 13 (46.4%) |
| Accommodation & Food Services | 26 (56.5%) | 20 (43.5%) |
| Public Administration | 2 (25.0%) | 6 (75.0%) |
| Total | 199 (48.9%) | 208 (51.1%) |
Education in Aurora
School Enrollment in Aurora
The most common levels of schooling among the 443 students in Aurora are college / undergraduate (402 | 90.7%), high school (14 | 3.2%), and middle school (11 | 2.5%).
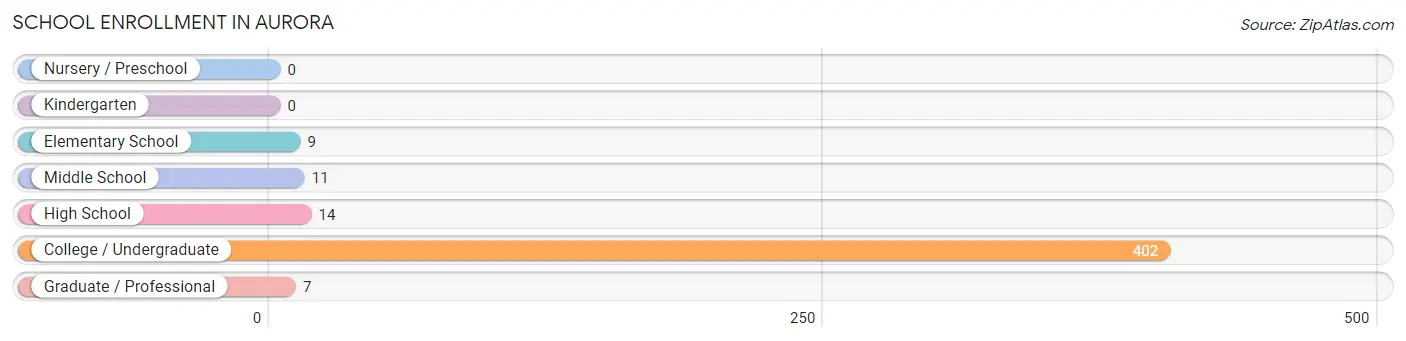
| School Level | # Students | % Students |
| Nursery / Preschool | 0 | 0.0% |
| Kindergarten | 0 | 0.0% |
| Elementary School | 9 | 2.0% |
| Middle School | 11 | 2.5% |
| High School | 14 | 3.2% |
| College / Undergraduate | 402 | 90.7% |
| Graduate / Professional | 7 | 1.6% |
| Total | 443 | 100.0% |
School Enrollment by Age by Funding Source in Aurora
Out of a total of 443 students who are enrolled in schools in Aurora, 365 (82.4%) attend a private institution, while the remaining 78 (17.6%) are enrolled in public schools. The age group of 35 years and over has the highest likelihood of being enrolled in private schools, with 1 (100.0% in the age bracket) enrolled. Conversely, the age group of 10 to 14 year olds has the lowest likelihood of being enrolled in a private school, with 15 (100.0% in the age bracket) attending a public institution.
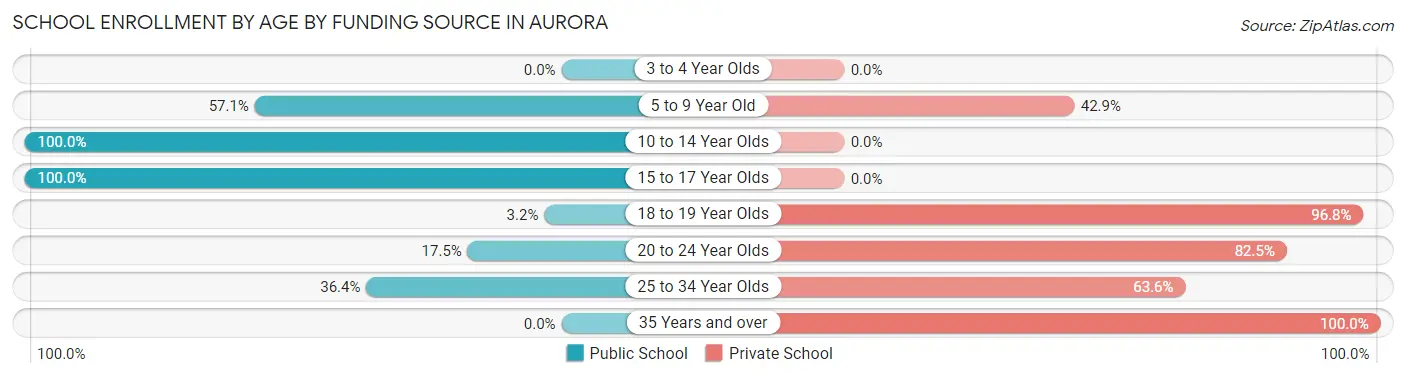
| Age Bracket | Public School | Private School |
| 3 to 4 Year Olds | 0 (0.0%) | 0 (0.0%) |
| 5 to 9 Year Old | 4 (57.1%) | 3 (42.9%) |
| 10 to 14 Year Olds | 15 (100.0%) | 0 (0.0%) |
| 15 to 17 Year Olds | 7 (100.0%) | 0 (0.0%) |
| 18 to 19 Year Olds | 5 (3.2%) | 151 (96.8%) |
| 20 to 24 Year Olds | 43 (17.5%) | 203 (82.5%) |
| 25 to 34 Year Olds | 4 (36.4%) | 7 (63.6%) |
| 35 Years and over | 0 (0.0%) | 1 (100.0%) |
| Total | 78 (17.6%) | 365 (82.4%) |
Educational Attainment by Field of Study in Aurora
Visual & performing arts (34 | 19.2%), communications (25 | 14.1%), literature & languages (24 | 13.6%), bio, nature & agricultural (14 | 7.9%), and psychology (14 | 7.9%) are the most common fields of study among 177 individuals in Aurora who have obtained a bachelor's degree or higher.
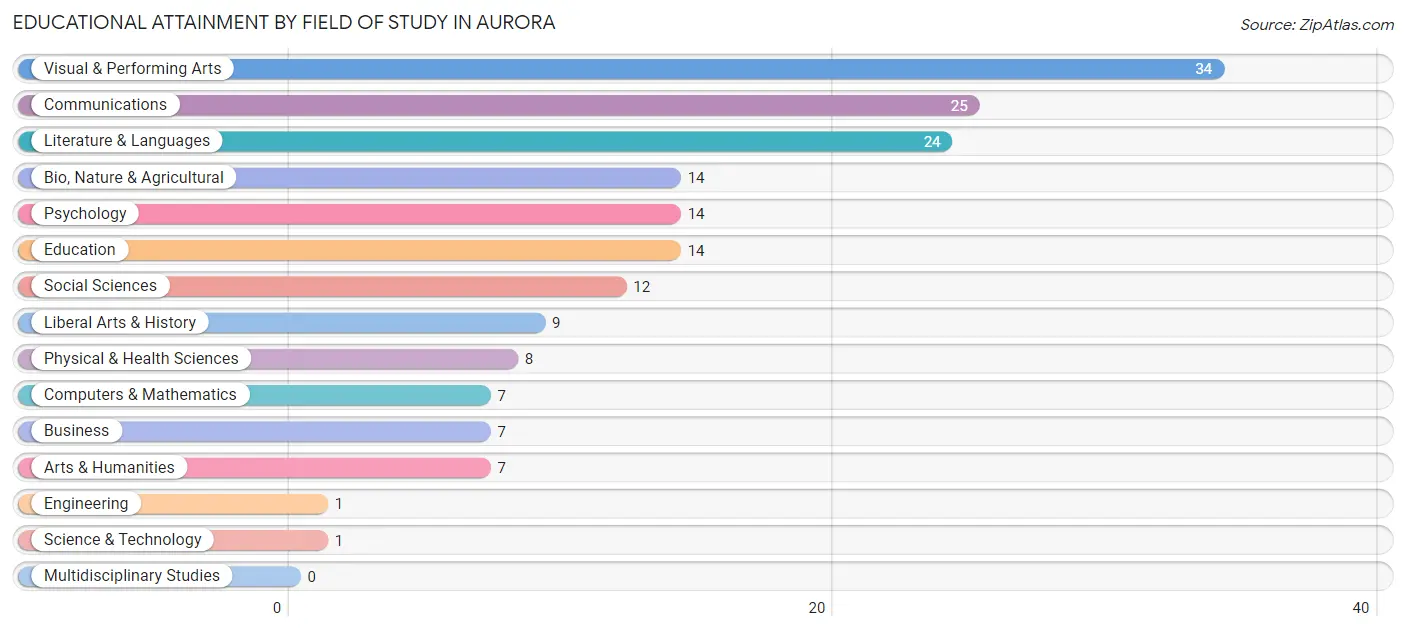
| Field of Study | # Graduates | % Graduates |
| Computers & Mathematics | 7 | 4.0% |
| Bio, Nature & Agricultural | 14 | 7.9% |
| Physical & Health Sciences | 8 | 4.5% |
| Psychology | 14 | 7.9% |
| Social Sciences | 12 | 6.8% |
| Engineering | 1 | 0.6% |
| Multidisciplinary Studies | 0 | 0.0% |
| Science & Technology | 1 | 0.6% |
| Business | 7 | 4.0% |
| Education | 14 | 7.9% |
| Literature & Languages | 24 | 13.6% |
| Liberal Arts & History | 9 | 5.1% |
| Visual & Performing Arts | 34 | 19.2% |
| Communications | 25 | 14.1% |
| Arts & Humanities | 7 | 4.0% |
| Total | 177 | 100.0% |
Transportation & Commute in Aurora
Vehicle Availability by Sex in Aurora
The most prevalent vehicle ownership categories in Aurora are males with 2 vehicles (45, accounting for 52.9%) and females with 2 vehicles (33, making up 75.0%).
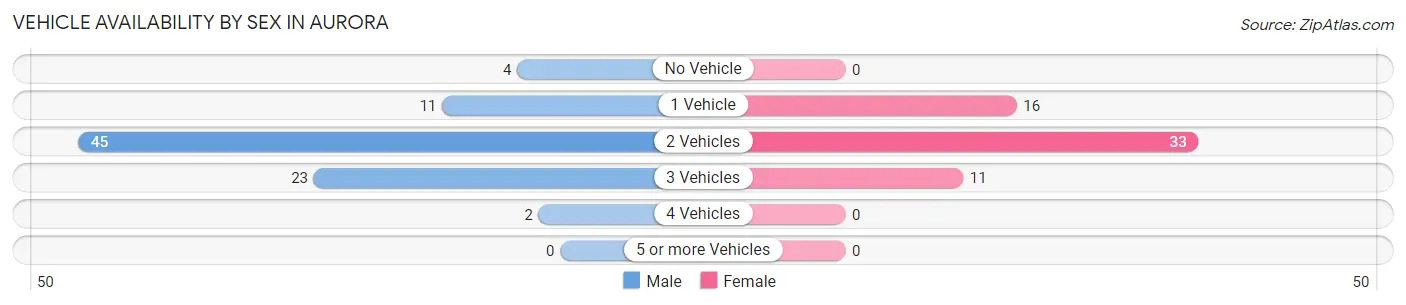
| Vehicles Available | Male | Female |
| No Vehicle | 4 (4.7%) | 0 (0.0%) |
| 1 Vehicle | 11 (12.9%) | 16 (26.7%) |
| 2 Vehicles | 45 (52.9%) | 33 (55.0%) |
| 3 Vehicles | 23 (27.1%) | 11 (18.3%) |
| 4 Vehicles | 2 (2.4%) | 0 (0.0%) |
| 5 or more Vehicles | 0 (0.0%) | 0 (0.0%) |
| Total | 85 (100.0%) | 60 (100.0%) |
Commute Time in Aurora
The most frequently occuring commute durations in Aurora are less than 5 minutes (154 commuters, 47.7%), 5 to 9 minutes (67 commuters, 20.7%), and 10 to 14 minutes (40 commuters, 12.4%).
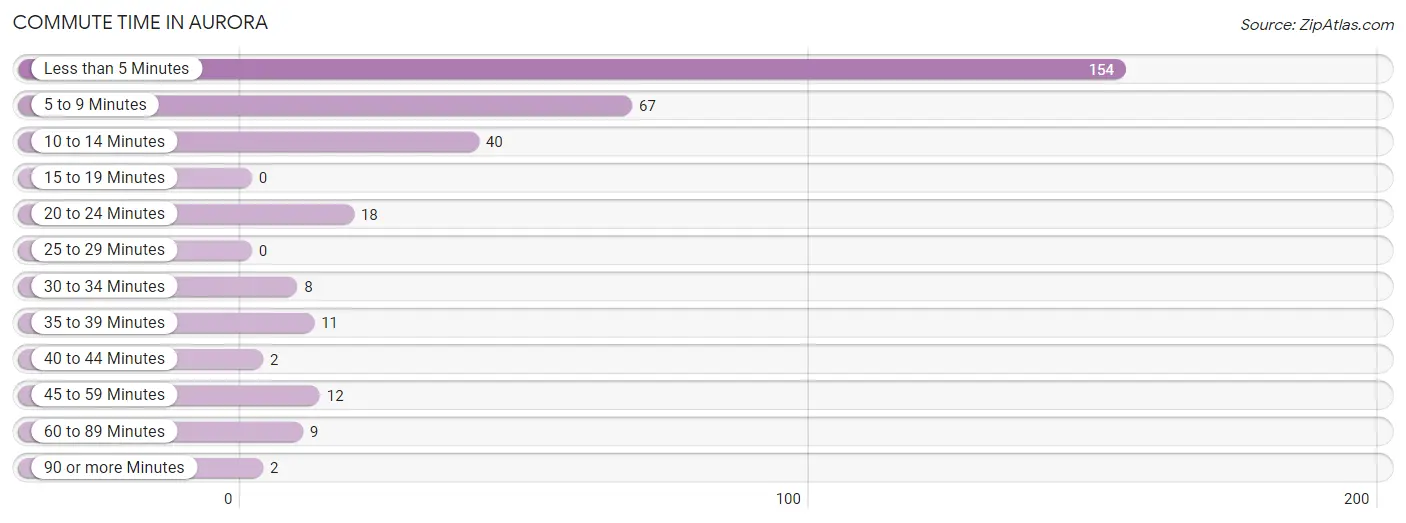
| Commute Time | # Commuters | % Commuters |
| Less than 5 Minutes | 154 | 47.7% |
| 5 to 9 Minutes | 67 | 20.7% |
| 10 to 14 Minutes | 40 | 12.4% |
| 15 to 19 Minutes | 0 | 0.0% |
| 20 to 24 Minutes | 18 | 5.6% |
| 25 to 29 Minutes | 0 | 0.0% |
| 30 to 34 Minutes | 8 | 2.5% |
| 35 to 39 Minutes | 11 | 3.4% |
| 40 to 44 Minutes | 2 | 0.6% |
| 45 to 59 Minutes | 12 | 3.7% |
| 60 to 89 Minutes | 9 | 2.8% |
| 90 or more Minutes | 2 | 0.6% |
Commute Time by Sex in Aurora
The most common commute times in Aurora are less than 5 minutes (64 commuters, 40.5%) for males and less than 5 minutes (90 commuters, 54.5%) for females.
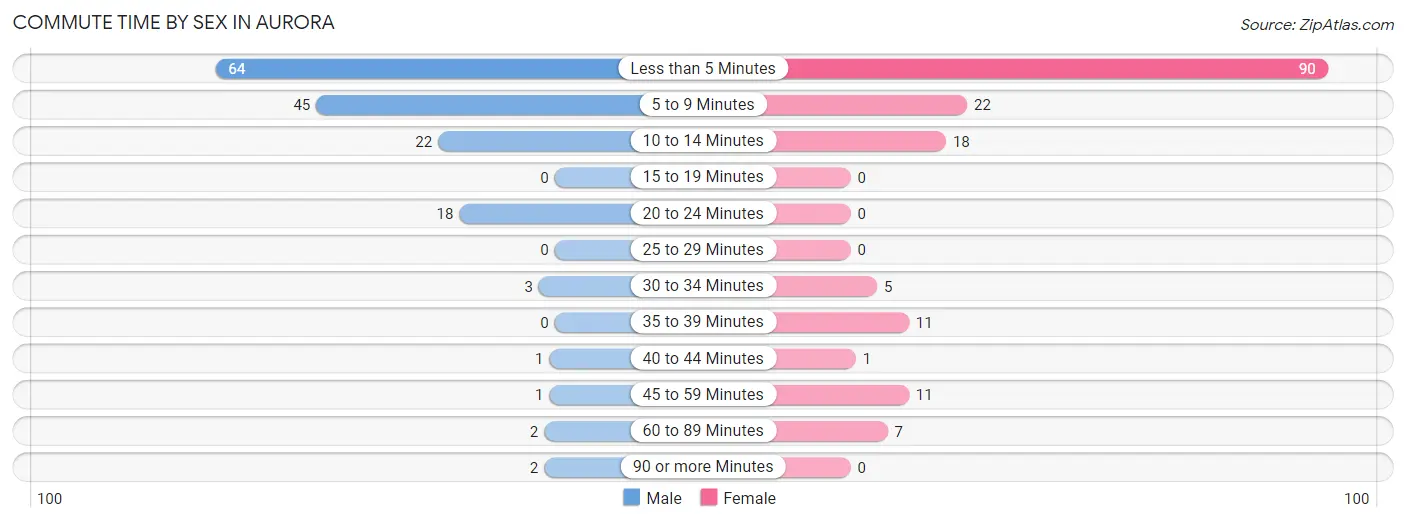
| Commute Time | Male | Female |
| Less than 5 Minutes | 64 (40.5%) | 90 (54.5%) |
| 5 to 9 Minutes | 45 (28.5%) | 22 (13.3%) |
| 10 to 14 Minutes | 22 (13.9%) | 18 (10.9%) |
| 15 to 19 Minutes | 0 (0.0%) | 0 (0.0%) |
| 20 to 24 Minutes | 18 (11.4%) | 0 (0.0%) |
| 25 to 29 Minutes | 0 (0.0%) | 0 (0.0%) |
| 30 to 34 Minutes | 3 (1.9%) | 5 (3.0%) |
| 35 to 39 Minutes | 0 (0.0%) | 11 (6.7%) |
| 40 to 44 Minutes | 1 (0.6%) | 1 (0.6%) |
| 45 to 59 Minutes | 1 (0.6%) | 11 (6.7%) |
| 60 to 89 Minutes | 2 (1.3%) | 7 (4.2%) |
| 90 or more Minutes | 2 (1.3%) | 0 (0.0%) |
Time of Departure to Work by Sex in Aurora
The most frequent times of departure to work in Aurora are 4:00 PM to 11:59 PM (70, 44.3%) for males and 12:00 PM to 3:59 PM (76, 46.1%) for females.
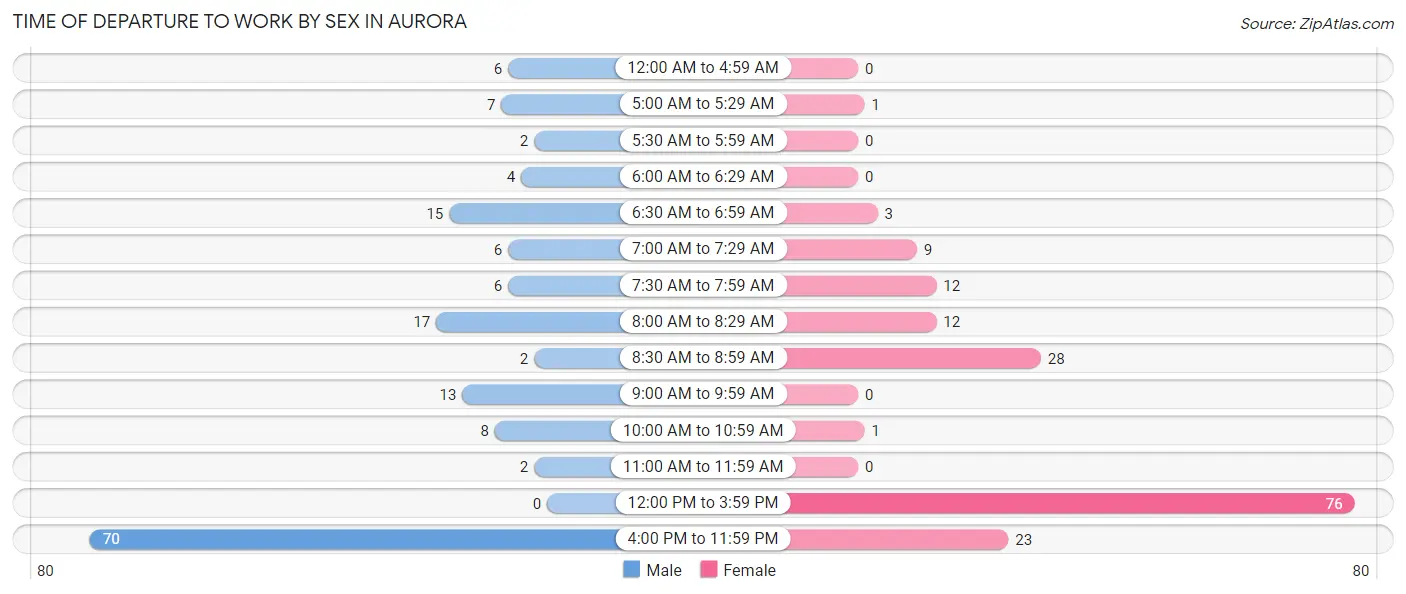
| Time of Departure | Male | Female |
| 12:00 AM to 4:59 AM | 6 (3.8%) | 0 (0.0%) |
| 5:00 AM to 5:29 AM | 7 (4.4%) | 1 (0.6%) |
| 5:30 AM to 5:59 AM | 2 (1.3%) | 0 (0.0%) |
| 6:00 AM to 6:29 AM | 4 (2.5%) | 0 (0.0%) |
| 6:30 AM to 6:59 AM | 15 (9.5%) | 3 (1.8%) |
| 7:00 AM to 7:29 AM | 6 (3.8%) | 9 (5.4%) |
| 7:30 AM to 7:59 AM | 6 (3.8%) | 12 (7.3%) |
| 8:00 AM to 8:29 AM | 17 (10.8%) | 12 (7.3%) |
| 8:30 AM to 8:59 AM | 2 (1.3%) | 28 (17.0%) |
| 9:00 AM to 9:59 AM | 13 (8.2%) | 0 (0.0%) |
| 10:00 AM to 10:59 AM | 8 (5.1%) | 1 (0.6%) |
| 11:00 AM to 11:59 AM | 2 (1.3%) | 0 (0.0%) |
| 12:00 PM to 3:59 PM | 0 (0.0%) | 76 (46.1%) |
| 4:00 PM to 11:59 PM | 70 (44.3%) | 23 (13.9%) |
| Total | 158 (100.0%) | 165 (100.0%) |
Housing Occupancy in Aurora
Occupancy by Ownership in Aurora
Of the total 140 dwellings in Aurora, owner-occupied units account for 102 (72.9%), while renter-occupied units make up 38 (27.1%).
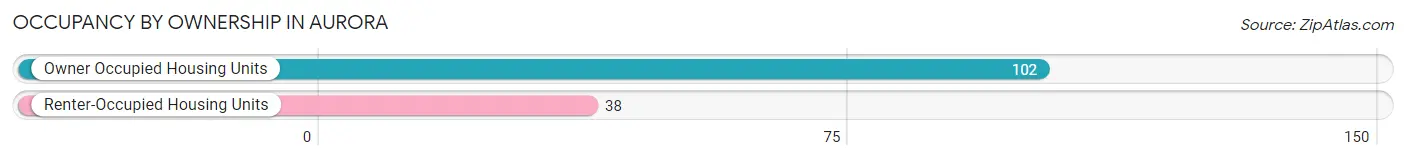
| Occupancy | # Housing Units | % Housing Units |
| Owner Occupied Housing Units | 102 | 72.9% |
| Renter-Occupied Housing Units | 38 | 27.1% |
| Total Occupied Housing Units | 140 | 100.0% |
Occupancy by Household Size in Aurora
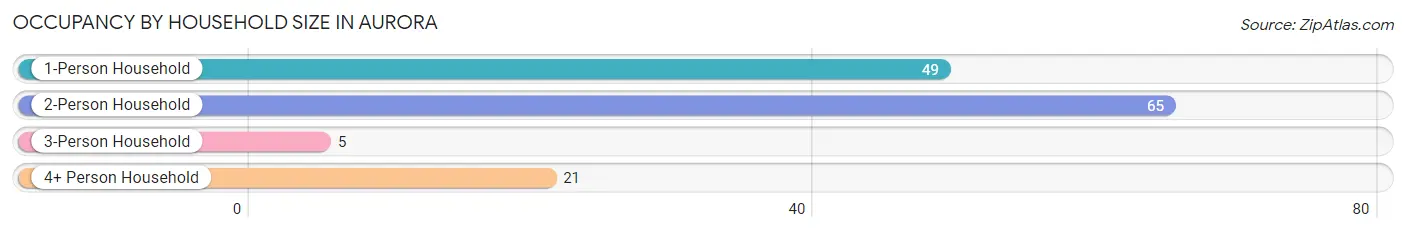
| Household Size | # Housing Units | % Housing Units |
| 1-Person Household | 49 | 35.0% |
| 2-Person Household | 65 | 46.4% |
| 3-Person Household | 5 | 3.6% |
| 4+ Person Household | 21 | 15.0% |
| Total Housing Units | 140 | 100.0% |
Occupancy by Ownership by Household Size in Aurora
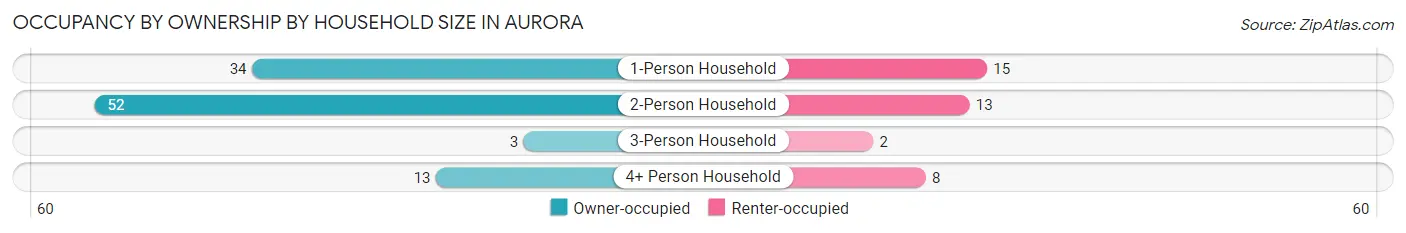
| Household Size | Owner-occupied | Renter-occupied |
| 1-Person Household | 34 (69.4%) | 15 (30.6%) |
| 2-Person Household | 52 (80.0%) | 13 (20.0%) |
| 3-Person Household | 3 (60.0%) | 2 (40.0%) |
| 4+ Person Household | 13 (61.9%) | 8 (38.1%) |
| Total Housing Units | 102 (72.9%) | 38 (27.1%) |
Occupancy by Educational Attainment in Aurora
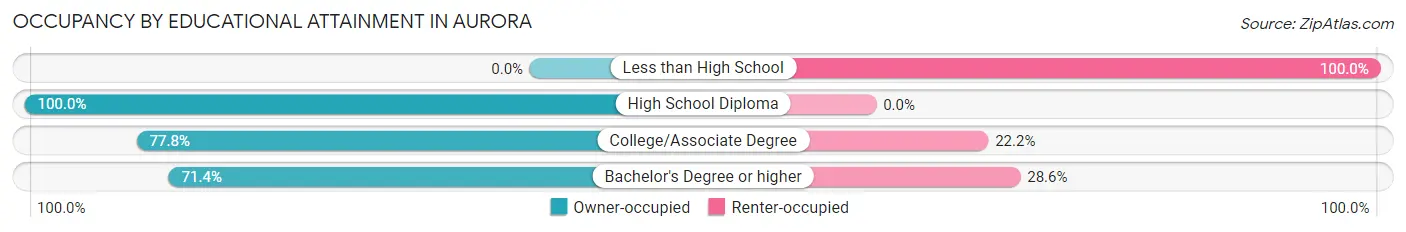
| Household Size | Owner-occupied | Renter-occupied |
| Less than High School | 0 (0.0%) | 4 (100.0%) |
| High School Diploma | 3 (100.0%) | 0 (0.0%) |
| College/Associate Degree | 49 (77.8%) | 14 (22.2%) |
| Bachelor's Degree or higher | 50 (71.4%) | 20 (28.6%) |
Occupancy by Age of Householder in Aurora
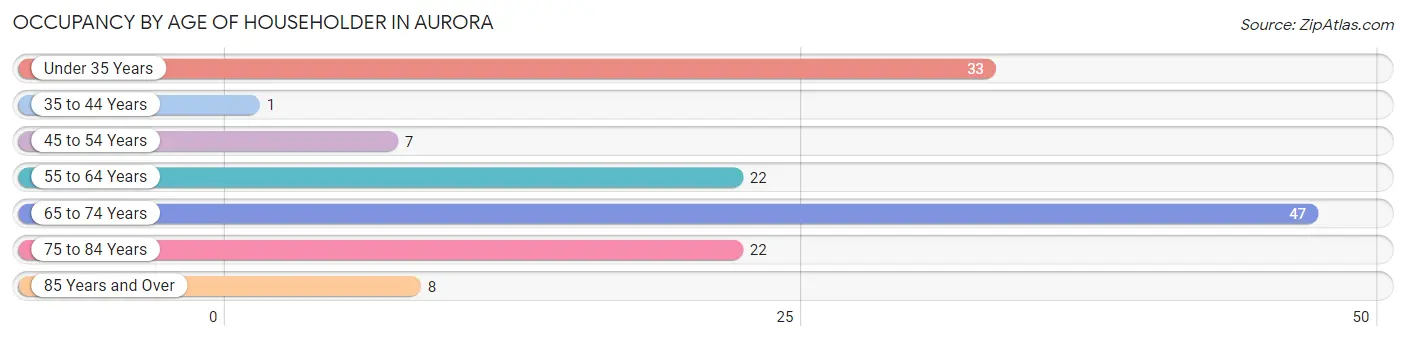
| Age Bracket | # Households | % Households |
| Under 35 Years | 33 | 23.6% |
| 35 to 44 Years | 1 | 0.7% |
| 45 to 54 Years | 7 | 5.0% |
| 55 to 64 Years | 22 | 15.7% |
| 65 to 74 Years | 47 | 33.6% |
| 75 to 84 Years | 22 | 15.7% |
| 85 Years and Over | 8 | 5.7% |
| Total | 140 | 100.0% |
Housing Finances in Aurora
Median Income by Occupancy in Aurora
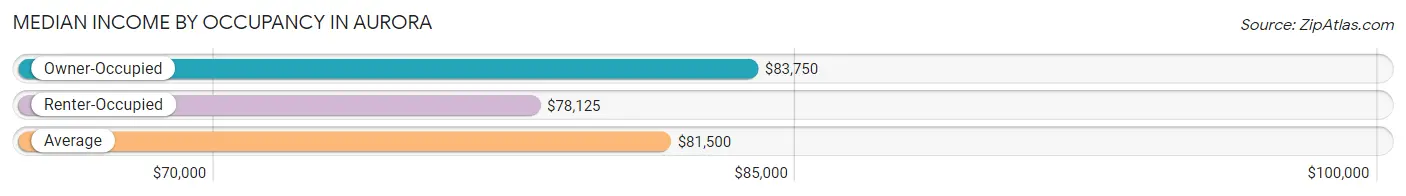
| Occupancy Type | # Households | Median Income |
| Owner-Occupied | 102 (72.9%) | $83,750 |
| Renter-Occupied | 38 (27.1%) | $78,125 |
| Average | 140 (100.0%) | $81,500 |
Occupancy by Householder Income Bracket in Aurora
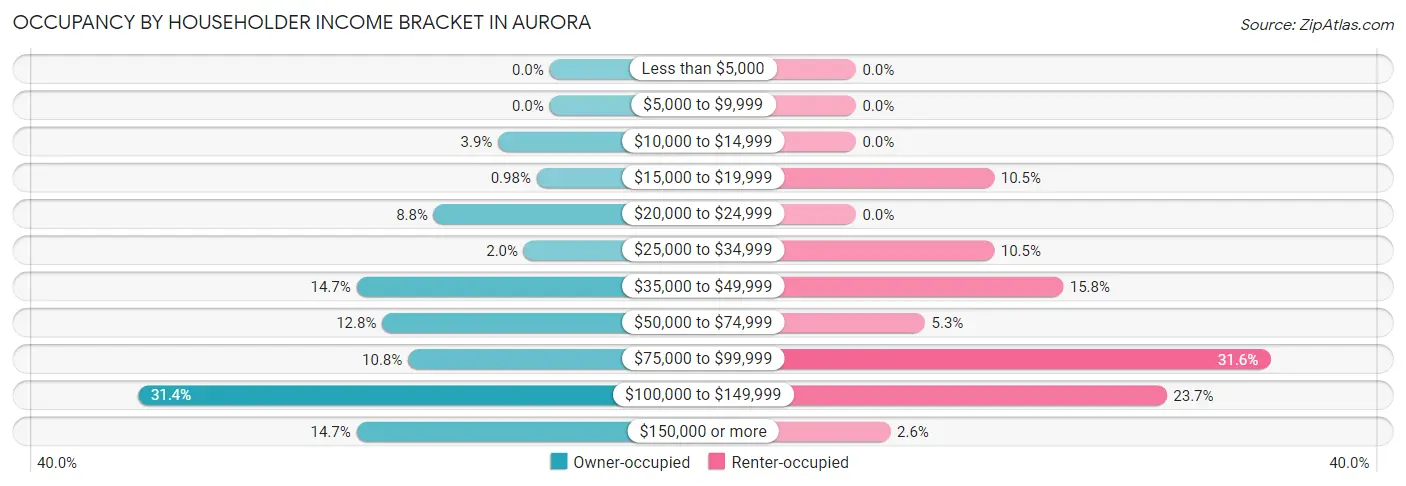
| Income Bracket | Owner-occupied | Renter-occupied |
| Less than $5,000 | 0 (0.0%) | 0 (0.0%) |
| $5,000 to $9,999 | 0 (0.0%) | 0 (0.0%) |
| $10,000 to $14,999 | 4 (3.9%) | 0 (0.0%) |
| $15,000 to $19,999 | 1 (1.0%) | 4 (10.5%) |
| $20,000 to $24,999 | 9 (8.8%) | 0 (0.0%) |
| $25,000 to $34,999 | 2 (2.0%) | 4 (10.5%) |
| $35,000 to $49,999 | 15 (14.7%) | 6 (15.8%) |
| $50,000 to $74,999 | 13 (12.8%) | 2 (5.3%) |
| $75,000 to $99,999 | 11 (10.8%) | 12 (31.6%) |
| $100,000 to $149,999 | 32 (31.4%) | 9 (23.7%) |
| $150,000 or more | 15 (14.7%) | 1 (2.6%) |
| Total | 102 (100.0%) | 38 (100.0%) |
Monthly Housing Cost Tiers in Aurora
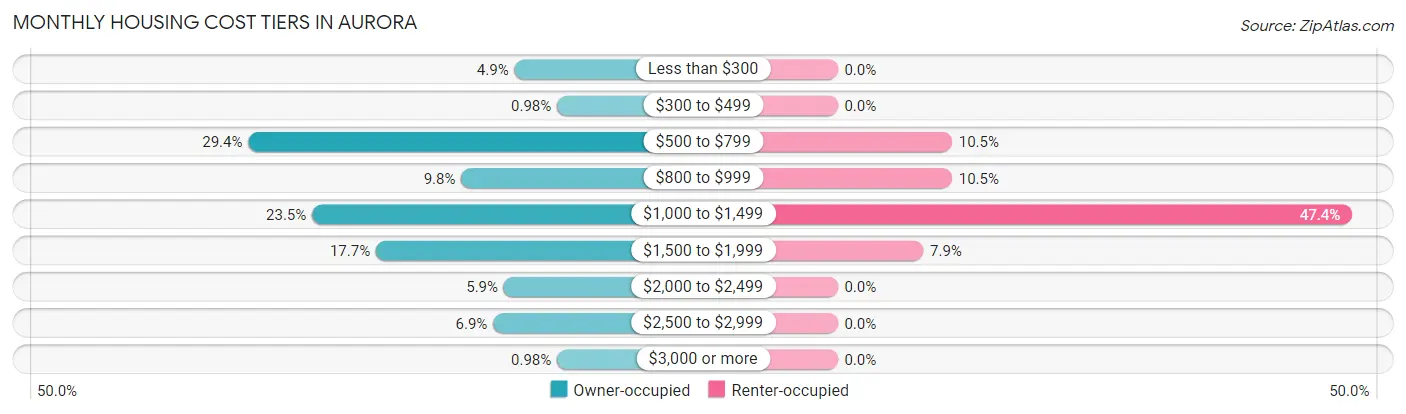
| Monthly Cost | Owner-occupied | Renter-occupied |
| Less than $300 | 5 (4.9%) | 0 (0.0%) |
| $300 to $499 | 1 (1.0%) | 0 (0.0%) |
| $500 to $799 | 30 (29.4%) | 4 (10.5%) |
| $800 to $999 | 10 (9.8%) | 4 (10.5%) |
| $1,000 to $1,499 | 24 (23.5%) | 18 (47.4%) |
| $1,500 to $1,999 | 18 (17.6%) | 3 (7.9%) |
| $2,000 to $2,499 | 6 (5.9%) | 0 (0.0%) |
| $2,500 to $2,999 | 7 (6.9%) | 0 (0.0%) |
| $3,000 or more | 1 (1.0%) | 0 (0.0%) |
| Total | 102 (100.0%) | 38 (100.0%) |
Physical Housing Characteristics in Aurora
Housing Structures in Aurora
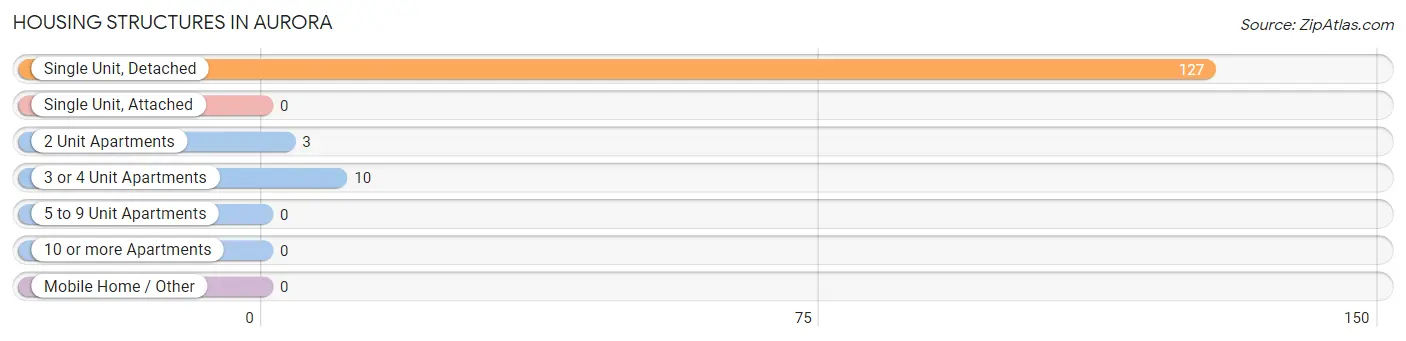
| Structure Type | # Housing Units | % Housing Units |
| Single Unit, Detached | 127 | 90.7% |
| Single Unit, Attached | 0 | 0.0% |
| 2 Unit Apartments | 3 | 2.1% |
| 3 or 4 Unit Apartments | 10 | 7.1% |
| 5 to 9 Unit Apartments | 0 | 0.0% |
| 10 or more Apartments | 0 | 0.0% |
| Mobile Home / Other | 0 | 0.0% |
| Total | 140 | 100.0% |
Housing Structures by Occupancy in Aurora
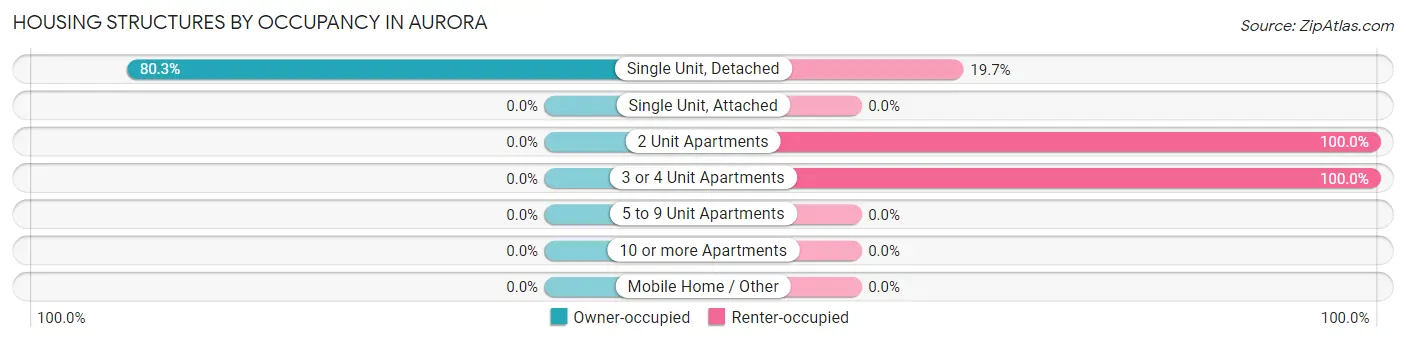
| Structure Type | Owner-occupied | Renter-occupied |
| Single Unit, Detached | 102 (80.3%) | 25 (19.7%) |
| Single Unit, Attached | 0 (0.0%) | 0 (0.0%) |
| 2 Unit Apartments | 0 (0.0%) | 3 (100.0%) |
| 3 or 4 Unit Apartments | 0 (0.0%) | 10 (100.0%) |
| 5 to 9 Unit Apartments | 0 (0.0%) | 0 (0.0%) |
| 10 or more Apartments | 0 (0.0%) | 0 (0.0%) |
| Mobile Home / Other | 0 (0.0%) | 0 (0.0%) |
| Total | 102 (72.9%) | 38 (27.1%) |
Housing Structures by Number of Rooms in Aurora
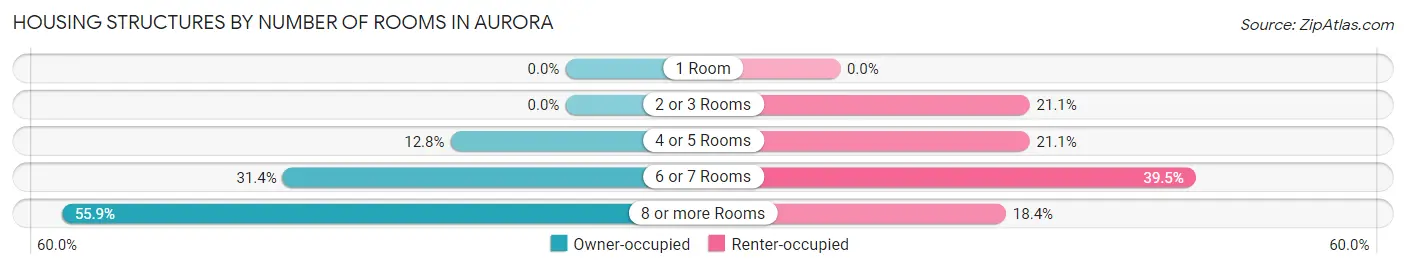
| Number of Rooms | Owner-occupied | Renter-occupied |
| 1 Room | 0 (0.0%) | 0 (0.0%) |
| 2 or 3 Rooms | 0 (0.0%) | 8 (21.0%) |
| 4 or 5 Rooms | 13 (12.8%) | 8 (21.0%) |
| 6 or 7 Rooms | 32 (31.4%) | 15 (39.5%) |
| 8 or more Rooms | 57 (55.9%) | 7 (18.4%) |
| Total | 102 (100.0%) | 38 (100.0%) |
Housing Structure by Heating Type in Aurora
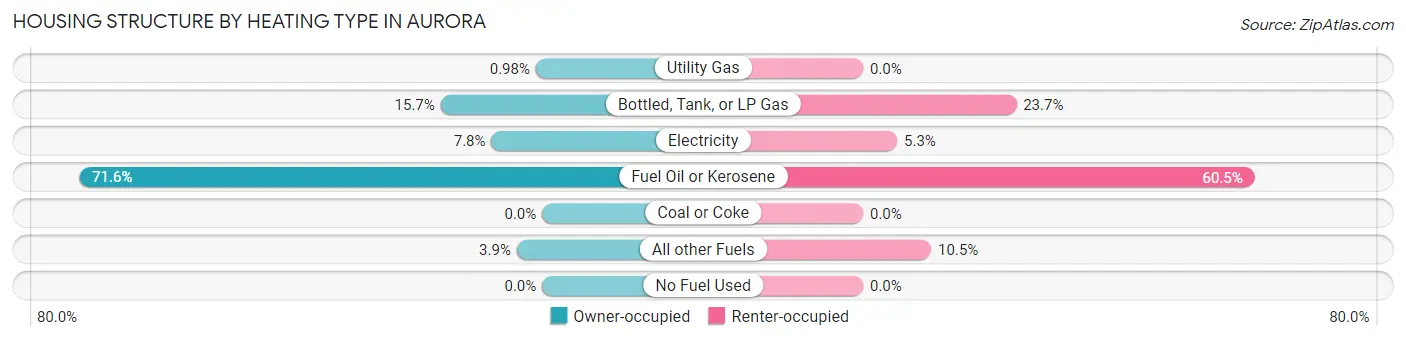
| Heating Type | Owner-occupied | Renter-occupied |
| Utility Gas | 1 (1.0%) | 0 (0.0%) |
| Bottled, Tank, or LP Gas | 16 (15.7%) | 9 (23.7%) |
| Electricity | 8 (7.8%) | 2 (5.3%) |
| Fuel Oil or Kerosene | 73 (71.6%) | 23 (60.5%) |
| Coal or Coke | 0 (0.0%) | 0 (0.0%) |
| All other Fuels | 4 (3.9%) | 4 (10.5%) |
| No Fuel Used | 0 (0.0%) | 0 (0.0%) |
| Total | 102 (100.0%) | 38 (100.0%) |
Household Vehicle Usage in Aurora
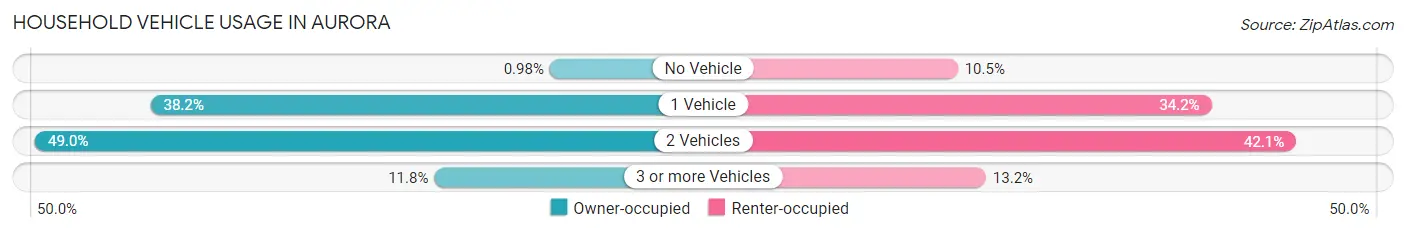
| Vehicles per Household | Owner-occupied | Renter-occupied |
| No Vehicle | 1 (1.0%) | 4 (10.5%) |
| 1 Vehicle | 39 (38.2%) | 13 (34.2%) |
| 2 Vehicles | 50 (49.0%) | 16 (42.1%) |
| 3 or more Vehicles | 12 (11.8%) | 5 (13.2%) |
| Total | 102 (100.0%) | 38 (100.0%) |
Real Estate & Mortgages in Aurora
Real Estate and Mortgage Overview in Aurora
| Characteristic | Without Mortgage | With Mortgage |
| Housing Units | 67 | 35 |
| Median Property Value | $273,600 | $234,100 |
| Median Household Income | $69,375 | $4 |
| Monthly Housing Costs | $764 | $1 |
| Real Estate Taxes | $5,284 | $0 |
Property Value by Mortgage Status in Aurora
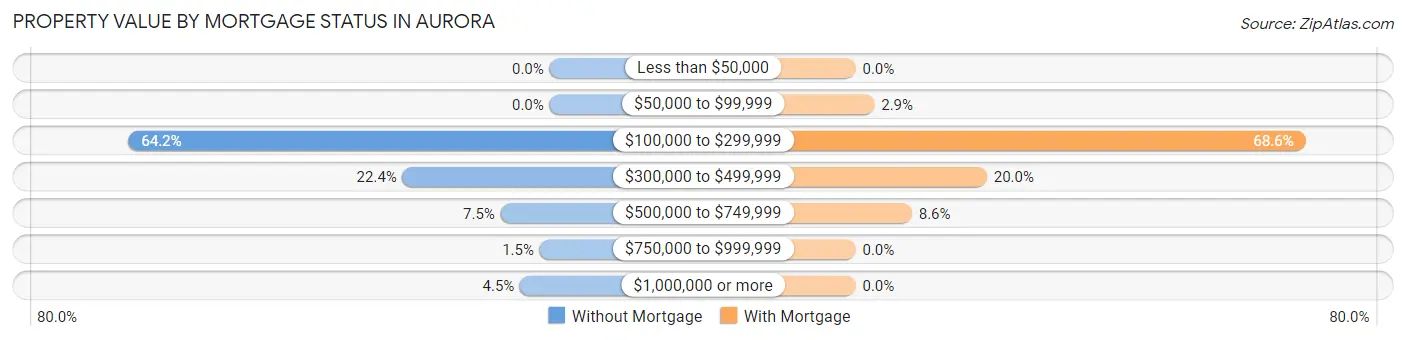
| Property Value | Without Mortgage | With Mortgage |
| Less than $50,000 | 0 (0.0%) | 0 (0.0%) |
| $50,000 to $99,999 | 0 (0.0%) | 1 (2.9%) |
| $100,000 to $299,999 | 43 (64.2%) | 24 (68.6%) |
| $300,000 to $499,999 | 15 (22.4%) | 7 (20.0%) |
| $500,000 to $749,999 | 5 (7.5%) | 3 (8.6%) |
| $750,000 to $999,999 | 1 (1.5%) | 0 (0.0%) |
| $1,000,000 or more | 3 (4.5%) | 0 (0.0%) |
| Total | 67 (100.0%) | 35 (100.0%) |
Household Income by Mortgage Status in Aurora
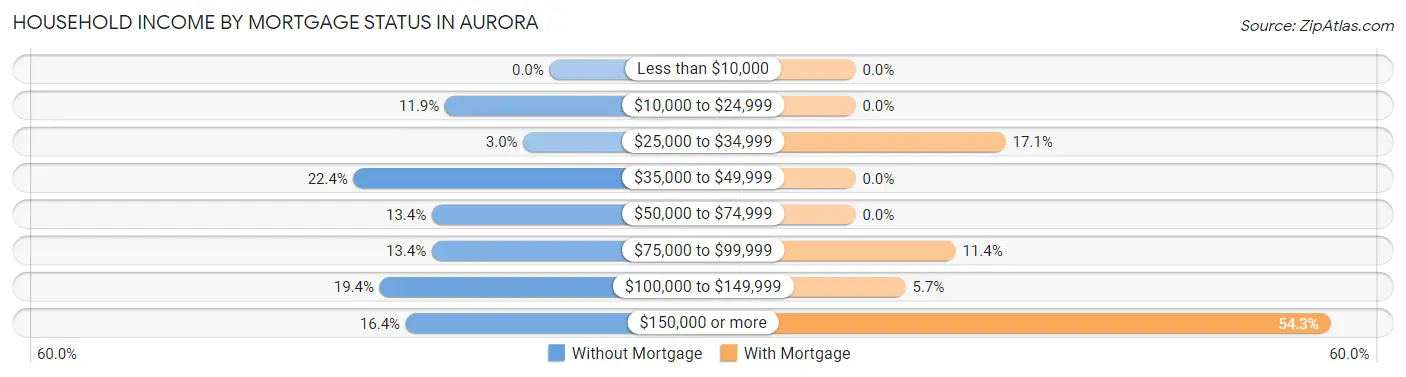
| Household Income | Without Mortgage | With Mortgage |
| Less than $10,000 | 0 (0.0%) | 0 (0.0%) |
| $10,000 to $24,999 | 8 (11.9%) | 0 (0.0%) |
| $25,000 to $34,999 | 2 (3.0%) | 6 (17.1%) |
| $35,000 to $49,999 | 15 (22.4%) | 0 (0.0%) |
| $50,000 to $74,999 | 9 (13.4%) | 0 (0.0%) |
| $75,000 to $99,999 | 9 (13.4%) | 4 (11.4%) |
| $100,000 to $149,999 | 13 (19.4%) | 2 (5.7%) |
| $150,000 or more | 11 (16.4%) | 19 (54.3%) |
| Total | 67 (100.0%) | 35 (100.0%) |
Property Value to Household Income Ratio in Aurora
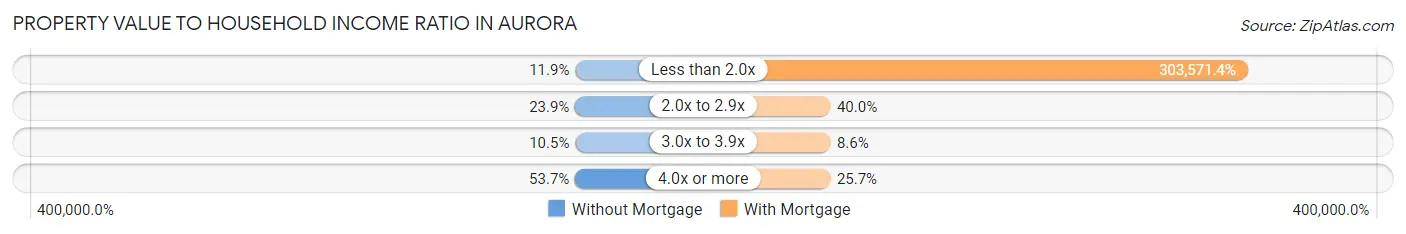
| Value-to-Income Ratio | Without Mortgage | With Mortgage |
| Less than 2.0x | 8 (11.9%) | 106,250 (303,571.4%) |
| 2.0x to 2.9x | 16 (23.9%) | 14 (40.0%) |
| 3.0x to 3.9x | 7 (10.4%) | 3 (8.6%) |
| 4.0x or more | 36 (53.7%) | 9 (25.7%) |
| Total | 67 (100.0%) | 35 (100.0%) |
Real Estate Taxes by Mortgage Status in Aurora
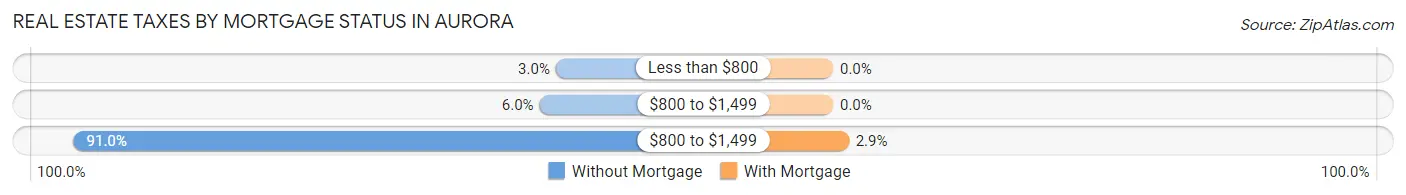
| Property Taxes | Without Mortgage | With Mortgage |
| Less than $800 | 2 (3.0%) | 0 (0.0%) |
| $800 to $1,499 | 4 (6.0%) | 0 (0.0%) |
| $800 to $1,499 | 61 (91.0%) | 1 (2.9%) |
| Total | 67 (100.0%) | 35 (100.0%) |
Health & Disability in Aurora
Health Insurance Coverage by Age in Aurora
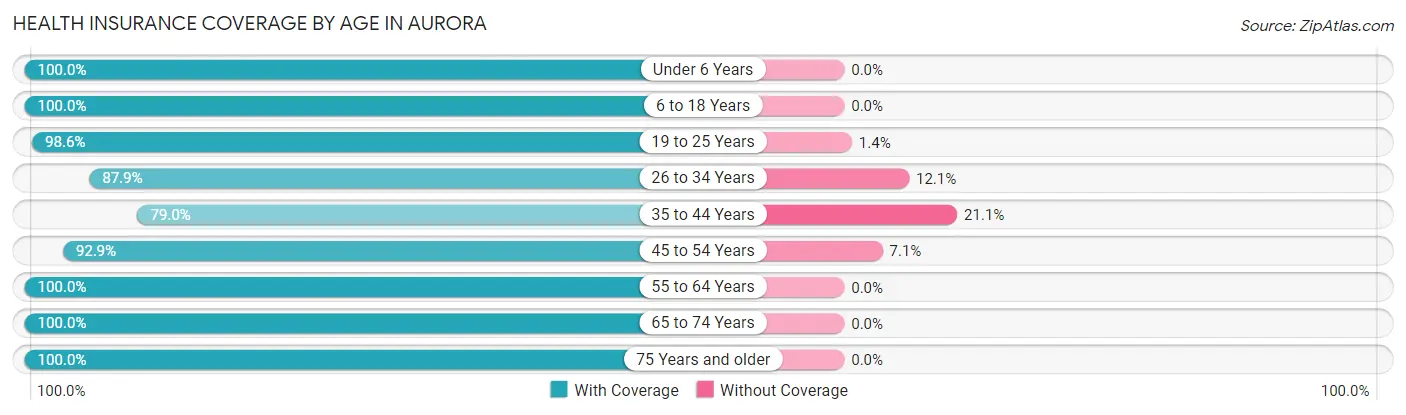
| Age Bracket | With Coverage | Without Coverage |
| Under 6 Years | 7 (100.0%) | 0 (0.0%) |
| 6 to 18 Years | 86 (100.0%) | 0 (0.0%) |
| 19 to 25 Years | 348 (98.6%) | 5 (1.4%) |
| 26 to 34 Years | 51 (87.9%) | 7 (12.1%) |
| 35 to 44 Years | 15 (78.9%) | 4 (21.0%) |
| 45 to 54 Years | 13 (92.9%) | 1 (7.1%) |
| 55 to 64 Years | 30 (100.0%) | 0 (0.0%) |
| 65 to 74 Years | 78 (100.0%) | 0 (0.0%) |
| 75 Years and older | 47 (100.0%) | 0 (0.0%) |
| Total | 675 (97.5%) | 17 (2.5%) |
Health Insurance Coverage by Citizenship Status in Aurora
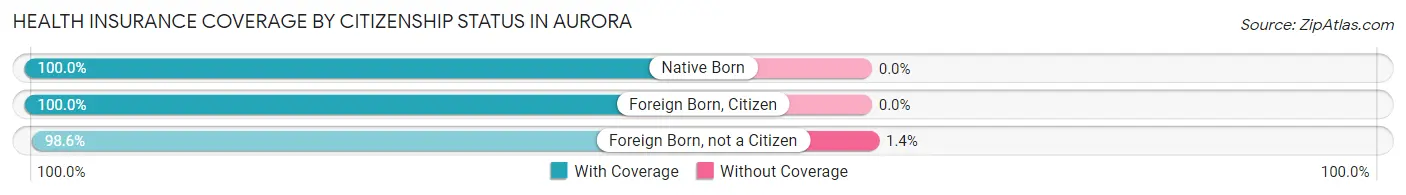
| Citizenship Status | With Coverage | Without Coverage |
| Native Born | 7 (100.0%) | 0 (0.0%) |
| Foreign Born, Citizen | 86 (100.0%) | 0 (0.0%) |
| Foreign Born, not a Citizen | 348 (98.6%) | 5 (1.4%) |
Health Insurance Coverage by Household Income in Aurora
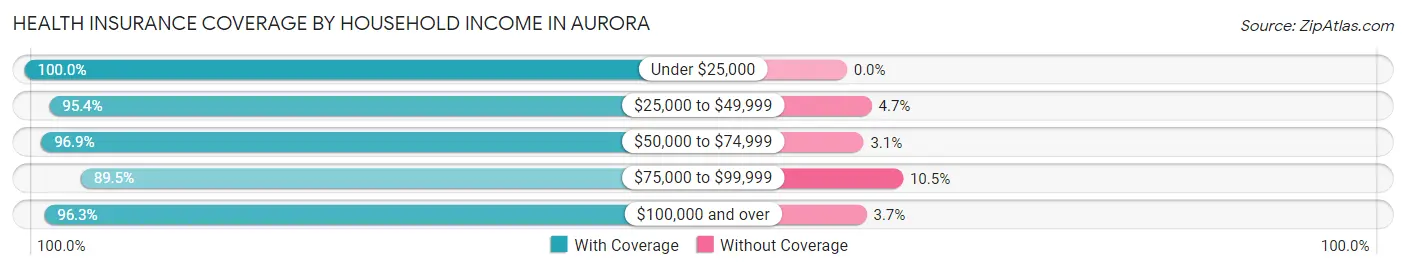
| Household Income | With Coverage | Without Coverage |
| Under $25,000 | 36 (100.0%) | 0 (0.0%) |
| $25,000 to $49,999 | 41 (95.4%) | 2 (4.6%) |
| $50,000 to $74,999 | 31 (96.9%) | 1 (3.1%) |
| $75,000 to $99,999 | 34 (89.5%) | 4 (10.5%) |
| $100,000 and over | 130 (96.3%) | 5 (3.7%) |
Public vs Private Health Insurance Coverage by Age in Aurora
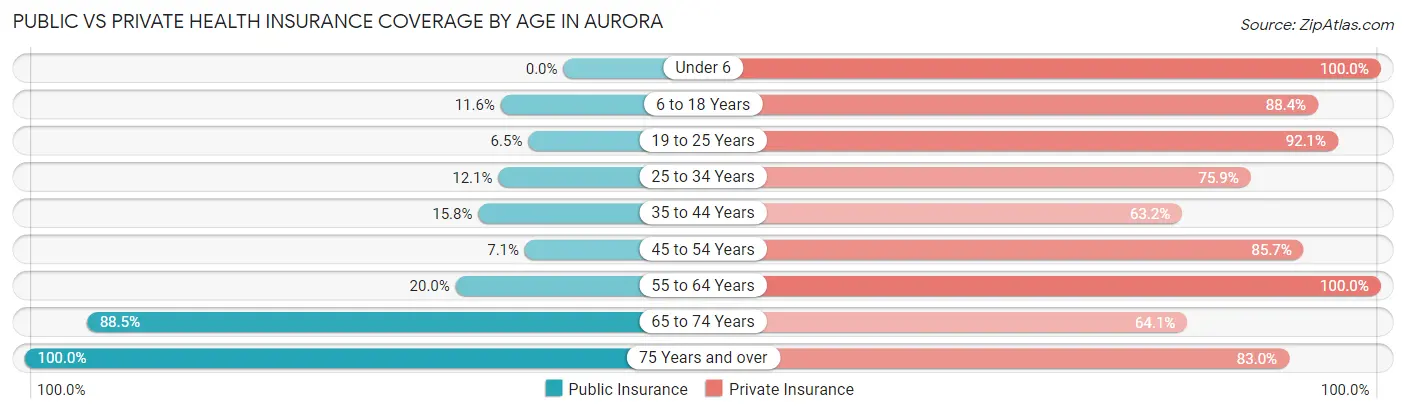
| Age Bracket | Public Insurance | Private Insurance |
| Under 6 | 0 (0.0%) | 7 (100.0%) |
| 6 to 18 Years | 10 (11.6%) | 76 (88.4%) |
| 19 to 25 Years | 23 (6.5%) | 325 (92.1%) |
| 25 to 34 Years | 7 (12.1%) | 44 (75.9%) |
| 35 to 44 Years | 3 (15.8%) | 12 (63.2%) |
| 45 to 54 Years | 1 (7.1%) | 12 (85.7%) |
| 55 to 64 Years | 6 (20.0%) | 30 (100.0%) |
| 65 to 74 Years | 69 (88.5%) | 50 (64.1%) |
| 75 Years and over | 47 (100.0%) | 39 (83.0%) |
| Total | 166 (24.0%) | 595 (86.0%) |
Disability Status by Sex by Age in Aurora
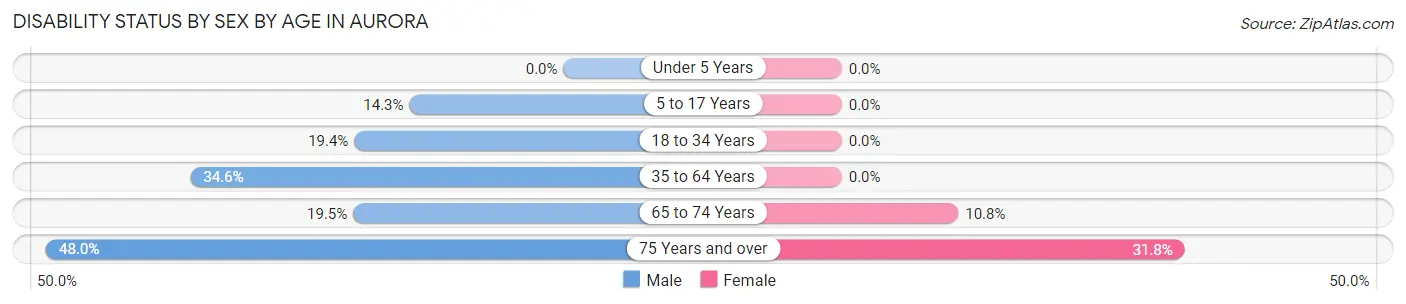
| Age Bracket | Male | Female |
| Under 5 Years | 0 (0.0%) | 0 (0.0%) |
| 5 to 17 Years | 2 (14.3%) | 0 (0.0%) |
| 18 to 34 Years | 46 (19.4%) | 0 (0.0%) |
| 35 to 64 Years | 9 (34.6%) | 0 (0.0%) |
| 65 to 74 Years | 8 (19.5%) | 4 (10.8%) |
| 75 Years and over | 12 (48.0%) | 7 (31.8%) |
Disability Class by Sex by Age in Aurora
Disability Class: Hearing Difficulty
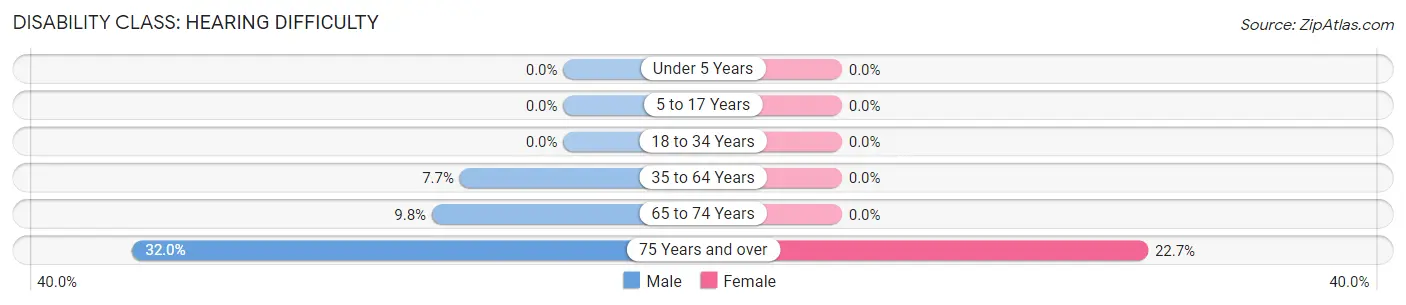
| Age Bracket | Male | Female |
| Under 5 Years | 0 (0.0%) | 0 (0.0%) |
| 5 to 17 Years | 0 (0.0%) | 0 (0.0%) |
| 18 to 34 Years | 0 (0.0%) | 0 (0.0%) |
| 35 to 64 Years | 2 (7.7%) | 0 (0.0%) |
| 65 to 74 Years | 4 (9.8%) | 0 (0.0%) |
| 75 Years and over | 8 (32.0%) | 5 (22.7%) |
Disability Class: Vision Difficulty
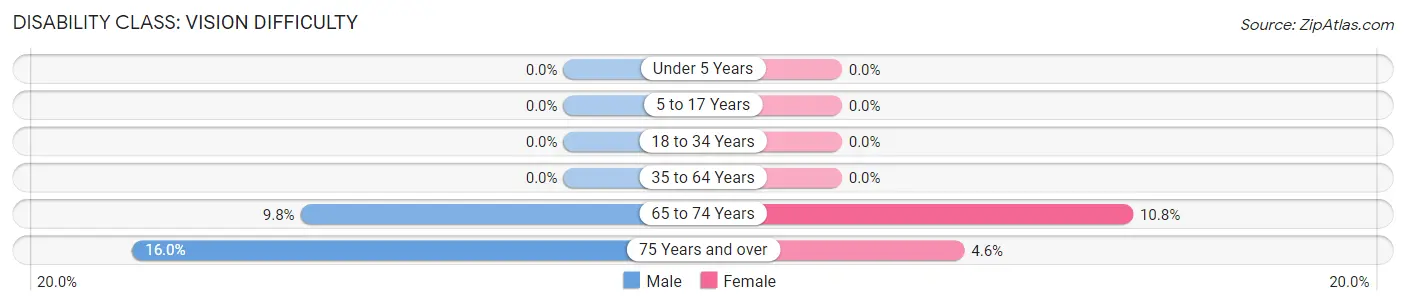
| Age Bracket | Male | Female |
| Under 5 Years | 0 (0.0%) | 0 (0.0%) |
| 5 to 17 Years | 0 (0.0%) | 0 (0.0%) |
| 18 to 34 Years | 0 (0.0%) | 0 (0.0%) |
| 35 to 64 Years | 0 (0.0%) | 0 (0.0%) |
| 65 to 74 Years | 4 (9.8%) | 4 (10.8%) |
| 75 Years and over | 4 (16.0%) | 1 (4.5%) |
Disability Class: Cognitive Difficulty
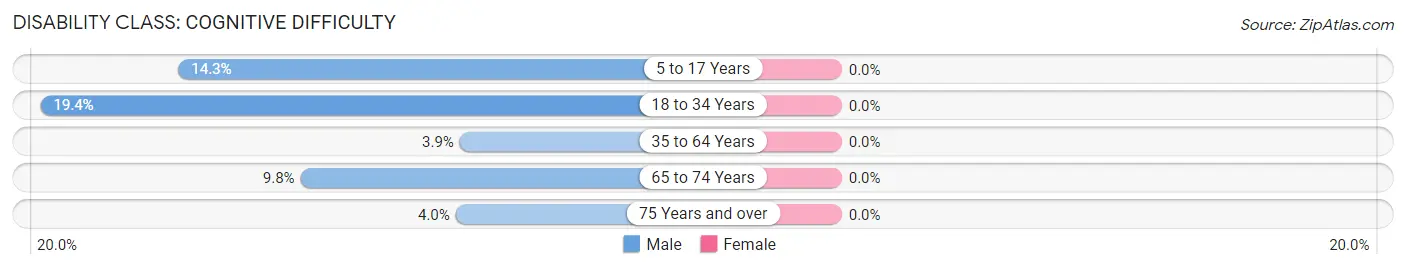
| Age Bracket | Male | Female |
| 5 to 17 Years | 2 (14.3%) | 0 (0.0%) |
| 18 to 34 Years | 46 (19.4%) | 0 (0.0%) |
| 35 to 64 Years | 1 (3.8%) | 0 (0.0%) |
| 65 to 74 Years | 4 (9.8%) | 0 (0.0%) |
| 75 Years and over | 1 (4.0%) | 0 (0.0%) |
Disability Class: Ambulatory Difficulty
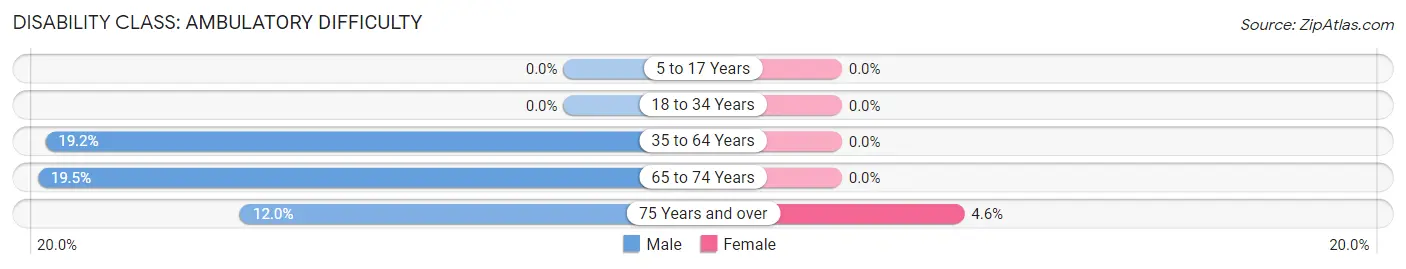
| Age Bracket | Male | Female |
| 5 to 17 Years | 0 (0.0%) | 0 (0.0%) |
| 18 to 34 Years | 0 (0.0%) | 0 (0.0%) |
| 35 to 64 Years | 5 (19.2%) | 0 (0.0%) |
| 65 to 74 Years | 8 (19.5%) | 0 (0.0%) |
| 75 Years and over | 3 (12.0%) | 1 (4.5%) |
Disability Class: Self-Care Difficulty
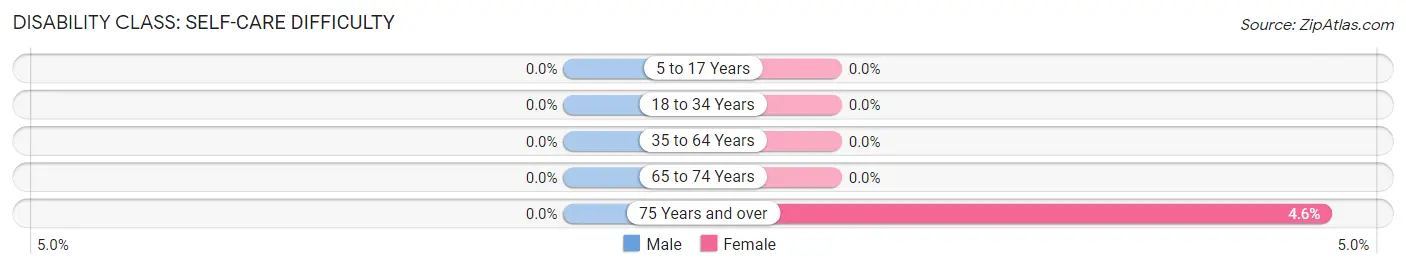
| Age Bracket | Male | Female |
| 5 to 17 Years | 0 (0.0%) | 0 (0.0%) |
| 18 to 34 Years | 0 (0.0%) | 0 (0.0%) |
| 35 to 64 Years | 0 (0.0%) | 0 (0.0%) |
| 65 to 74 Years | 0 (0.0%) | 0 (0.0%) |
| 75 Years and over | 0 (0.0%) | 1 (4.5%) |
Technology Access in Aurora
Computing Device Access in Aurora
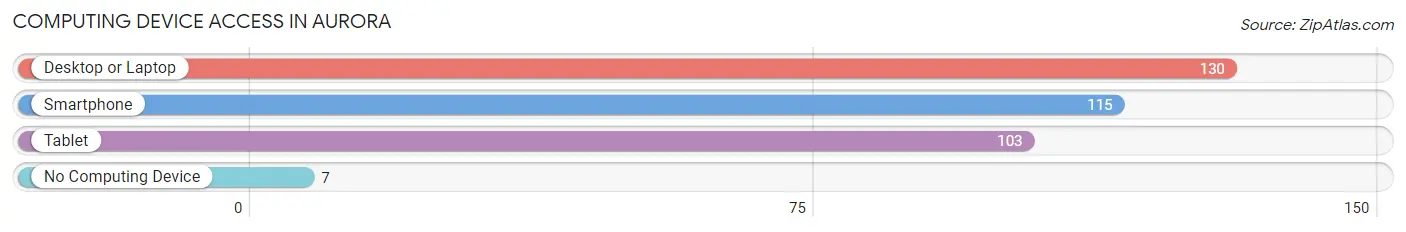
| Device Type | # Households | % Households |
| Desktop or Laptop | 130 | 92.9% |
| Smartphone | 115 | 82.1% |
| Tablet | 103 | 73.6% |
| No Computing Device | 7 | 5.0% |
| Total | 140 | 100.0% |
Internet Access in Aurora
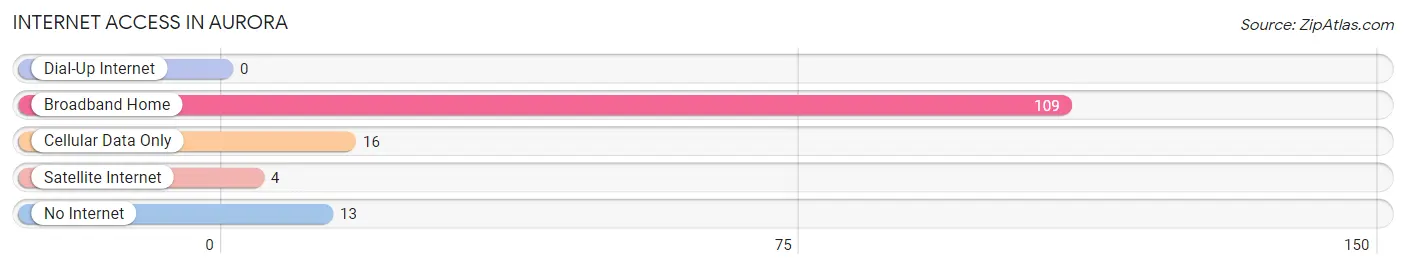
| Internet Type | # Households | % Households |
| Dial-Up Internet | 0 | 0.0% |
| Broadband Home | 109 | 77.9% |
| Cellular Data Only | 16 | 11.4% |
| Satellite Internet | 4 | 2.9% |
| No Internet | 13 | 9.3% |
| Total | 140 | 100.0% |
Aurora Summary
Aurora, New York is a small village located in the town of Ledyard in Cayuga County, New York. It is situated on the eastern shore of Cayuga Lake, the largest of the Finger Lakes. The village has a population of 1,717 as of the 2010 census.
History
The area that is now Aurora was first settled in 1789 by a group of Quakers from Pennsylvania. The village was originally known as "Quaker Settlement" and was later renamed "Aurora" in 1804. The name was chosen to honor the Roman goddess of the dawn.
The village was incorporated in 1837 and was an important stop on the Erie Canal. The canal was completed in 1825 and provided a direct route from the Great Lakes to the Hudson River. The canal brought increased trade and commerce to the area, and Aurora quickly became a thriving commercial center.
The village was also home to several important industries, including a paper mill, a grist mill, and a sawmill. The paper mill was the largest employer in the area and provided jobs for many of the local residents.
Geography
Aurora is located at 42°45'N 76°45'W. It is situated on the eastern shore of Cayuga Lake, the largest of the Finger Lakes. The village is bordered by the towns of Ledyard to the north, Owasco to the east, and Sennett to the south.
The village has a total area of 1.2 square miles, all of which is land. The terrain is mostly flat, with some rolling hills in the surrounding area.
Economy
Aurora's economy is largely based on tourism and agriculture. The village is home to several wineries, including the Aurora Inn and the Long Point Winery. The village also has several restaurants, shops, and other businesses that cater to tourists.
Agriculture is also an important part of the local economy. The surrounding area is home to several farms, which produce a variety of crops, including corn, soybeans, and hay.
Demographics
As of the 2010 census, Aurora had a population of 1,717. The racial makeup of the village was 95.2% White, 1.2% African American, 0.6% Native American, 0.7% Asian, 0.1% Pacific Islander, 0.7% from other races, and 1.5% from two or more races. Hispanic or Latino of any race were 2.2% of the population.
The median household income in Aurora was $45,938, and the median family income was $51,250. About 11.2% of families and 13.2% of the population were below the poverty line, including 17.2% of those under age 18 and 8.2% of those age 65 or over.
Common Questions
What is Per Capita Income in Aurora?
Per Capita income in Aurora is $20,768.
What is the Median Family Income in Aurora?
Median Family Income in Aurora is $102,188.
What is the Median Household income in Aurora?
Median Household Income in Aurora is $81,500.
What is Income or Wage Gap in Aurora?
Income or Wage Gap in Aurora is 43.2%.
Women in Aurora earn 56.8 cents for every dollar earned by a man.
What is Inequality or Gini Index in Aurora?
Inequality or Gini Index in Aurora is 0.35.
What is the Total Population of Aurora?
Total Population of Aurora is 692.
What is the Total Male Population of Aurora?
Total Male Population of Aurora is 345.
What is the Total Female Population of Aurora?
Total Female Population of Aurora is 347.
What is the Ratio of Males per 100 Females in Aurora?
There are 99.42 Males per 100 Females in Aurora.
What is the Ratio of Females per 100 Males in Aurora?
There are 100.58 Females per 100 Males in Aurora.
What is the Median Population Age in Aurora?
Median Population Age in Aurora is 21.5 Years.
What is the Average Family Size in Aurora
Average Family Size in Aurora is 2.6 People.
What is the Average Household Size in Aurora
Average Household Size in Aurora is 2.0 People.
How Large is the Labor Force in Aurora?
There are 410 People in the Labor Forcein in Aurora.
What is the Percentage of People in the Labor Force in Aurora?
62.2% of People are in the Labor Force in Aurora.
What is the Unemployment Rate in Aurora?
Unemployment Rate in Aurora is 0.7%.