Auburn, NY Map & Demographics
Auburn Map
Auburn Overview
$29,387
PER CAPITA INCOME
$64,101
AVG FAMILY INCOME
$48,203
AVG HOUSEHOLD INCOME
17.1%
WAGE / INCOME GAP [ % ]
82.9¢/ $1
WAGE / INCOME GAP [ $ ]
$12,748
FAMILY INCOME DEFICIT
0.48
INEQUALITY / GINI INDEX
26,674
TOTAL POPULATION
13,384
MALE POPULATION
13,290
FEMALE POPULATION
100.71
MALES / 100 FEMALES
99.30
FEMALES / 100 MALES
40.3
MEDIAN AGE
2.9
AVG FAMILY SIZE
2.1
AVG HOUSEHOLD SIZE
11,760
LABOR FORCE [ PEOPLE ]
53.1%
PERCENT IN LABOR FORCE
6.0%
UNEMPLOYMENT RATE
Auburn Area Codes
Income in Auburn
Income Overview in Auburn
Per Capita Income in Auburn is $29,387, while median incomes of families and households are $64,101 and $48,203 respectively.
| Characteristic | Number | Measure |
| Per Capita Income | 26,674 | $29,387 |
| Median Family Income | 5,641 | $64,101 |
| Mean Family Income | 5,641 | $85,901 |
| Median Household Income | 11,544 | $48,203 |
| Mean Household Income | 11,544 | $65,495 |
| Income Deficit | 5,641 | $12,748 |
| Wage / Income Gap (%) | 26,674 | 17.09% |
| Wage / Income Gap ($) | 26,674 | 82.91¢ per $1 |
| Gini / Inequality Index | 26,674 | 0.48 |
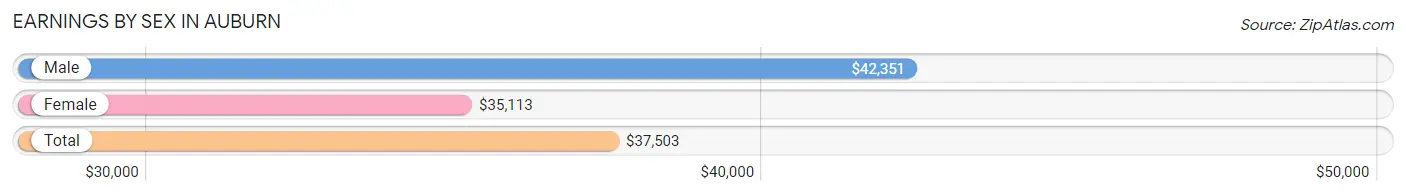
Earnings by Sex in Auburn
Average Earnings in Auburn are $37,503, $42,351 for men and $35,113 for women, a difference of 17.1%.
| Sex | Number | Average Earnings |
| Male | 6,376 (51.5%) | $42,351 |
| Female | 5,993 (48.4%) | $35,113 |
| Total | 12,369 (100.0%) | $37,503 |
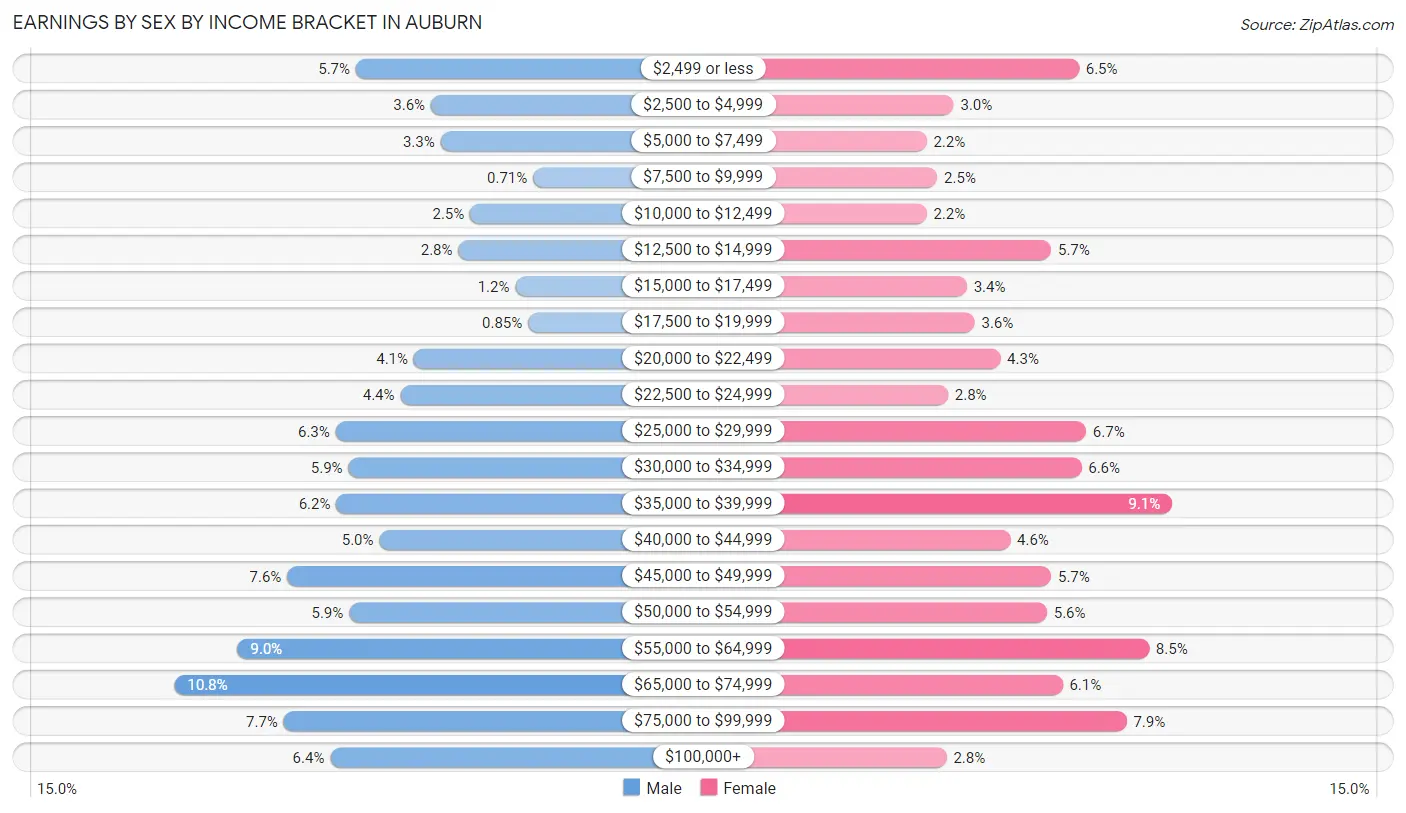
Earnings by Sex by Income Bracket in Auburn
The most common earnings brackets in Auburn are $65,000 to $74,999 for men (688 | 10.8%) and $35,000 to $39,999 for women (548 | 9.1%).
| Income | Male | Female |
| $2,499 or less | 363 (5.7%) | 391 (6.5%) |
| $2,500 to $4,999 | 228 (3.6%) | 180 (3.0%) |
| $5,000 to $7,499 | 211 (3.3%) | 134 (2.2%) |
| $7,500 to $9,999 | 45 (0.7%) | 152 (2.5%) |
| $10,000 to $12,499 | 158 (2.5%) | 134 (2.2%) |
| $12,500 to $14,999 | 179 (2.8%) | 344 (5.7%) |
| $15,000 to $17,499 | 77 (1.2%) | 202 (3.4%) |
| $17,500 to $19,999 | 54 (0.9%) | 215 (3.6%) |
| $20,000 to $22,499 | 259 (4.1%) | 258 (4.3%) |
| $22,500 to $24,999 | 283 (4.4%) | 170 (2.8%) |
| $25,000 to $29,999 | 399 (6.3%) | 403 (6.7%) |
| $30,000 to $34,999 | 376 (5.9%) | 395 (6.6%) |
| $35,000 to $39,999 | 398 (6.2%) | 548 (9.1%) |
| $40,000 to $44,999 | 321 (5.0%) | 275 (4.6%) |
| $45,000 to $49,999 | 486 (7.6%) | 344 (5.7%) |
| $50,000 to $54,999 | 375 (5.9%) | 337 (5.6%) |
| $55,000 to $64,999 | 575 (9.0%) | 509 (8.5%) |
| $65,000 to $74,999 | 688 (10.8%) | 363 (6.1%) |
| $75,000 to $99,999 | 492 (7.7%) | 471 (7.9%) |
| $100,000+ | 409 (6.4%) | 168 (2.8%) |
| Total | 6,376 (100.0%) | 5,993 (100.0%) |
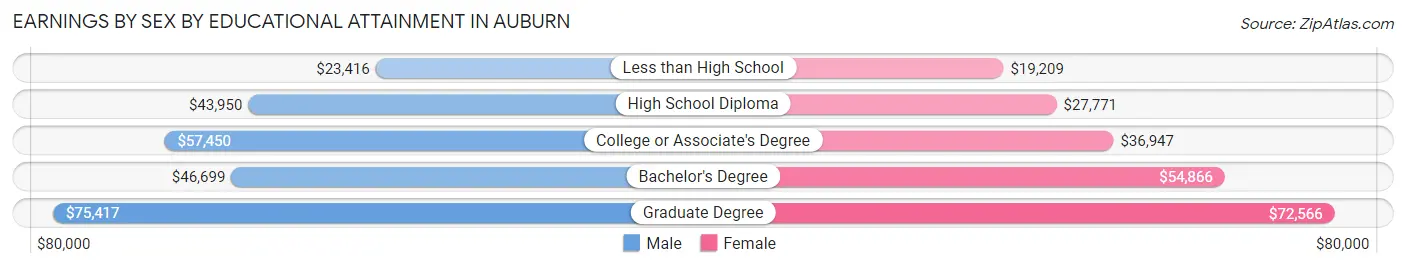
Earnings by Sex by Educational Attainment in Auburn
Average earnings in Auburn are $46,565 for men and $37,066 for women, a difference of 20.4%. Men with an educational attainment of graduate degree enjoy the highest average annual earnings of $75,417, while those with less than high school education earn the least with $23,416. Women with an educational attainment of graduate degree earn the most with the average annual earnings of $72,566, while those with less than high school education have the smallest earnings of $19,209.
| Educational Attainment | Male Income | Female Income |
| Less than High School | $23,416 | $19,209 |
| High School Diploma | $43,950 | $27,771 |
| College or Associate's Degree | $57,450 | $36,947 |
| Bachelor's Degree | $46,699 | $54,866 |
| Graduate Degree | $75,417 | $72,566 |
| Total | $46,565 | $37,066 |
Family Income in Auburn
Family Income Brackets in Auburn
According to the Auburn family income data, there are 1,162 families falling into the $50,000 to $74,999 income range, which is the most common income bracket and makes up 20.6% of all families. Conversely, the $10,000 to $14,999 income bracket is the least frequent group with only 209 families (3.7%) belonging to this category.
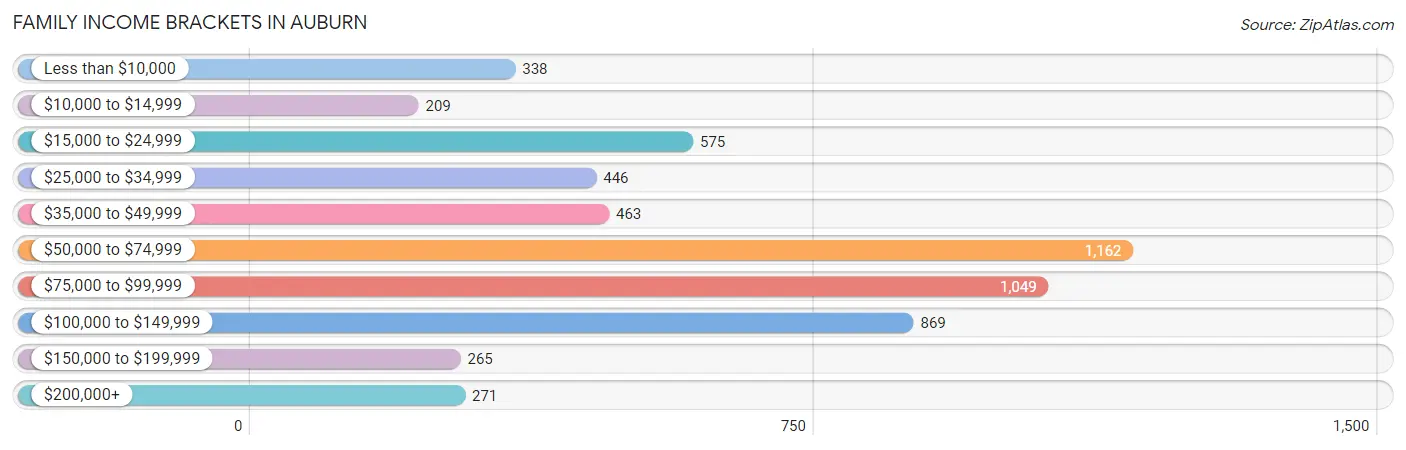
| Income Bracket | # Families | % Families |
| Less than $10,000 | 338 | 6.0% |
| $10,000 to $14,999 | 209 | 3.7% |
| $15,000 to $24,999 | 575 | 10.2% |
| $25,000 to $34,999 | 446 | 7.9% |
| $35,000 to $49,999 | 463 | 8.2% |
| $50,000 to $74,999 | 1,162 | 20.6% |
| $75,000 to $99,999 | 1,049 | 18.6% |
| $100,000 to $149,999 | 869 | 15.4% |
| $150,000 to $199,999 | 265 | 4.7% |
| $200,000+ | 271 | 4.8% |
Family Income by Famaliy Size in Auburn
5-person families (217 | 3.8%) account for the highest median family income in Auburn with $145,250 per family, while 2-person families (2,811 | 49.8%) have the highest median income of $29,250 per family member.
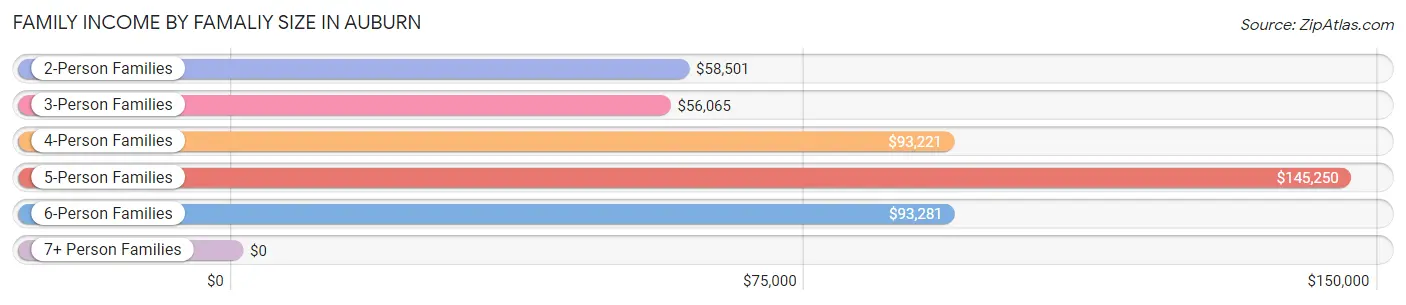
| Income Bracket | # Families | Median Income |
| 2-Person Families | 2,811 (49.8%) | $58,501 |
| 3-Person Families | 1,491 (26.4%) | $56,065 |
| 4-Person Families | 927 (16.4%) | $93,221 |
| 5-Person Families | 217 (3.8%) | $145,250 |
| 6-Person Families | 123 (2.2%) | $93,281 |
| 7+ Person Families | 72 (1.3%) | $0 |
| Total | 5,641 (100.0%) | $64,101 |
Family Income by Number of Earners in Auburn
The median family income in Auburn is $64,101, with families comprising 3+ earners (506) having the highest median family income of $94,617, while families with no earners (1,076) have the lowest median family income of $30,918, accounting for 9.0% and 19.1% of families, respectively.
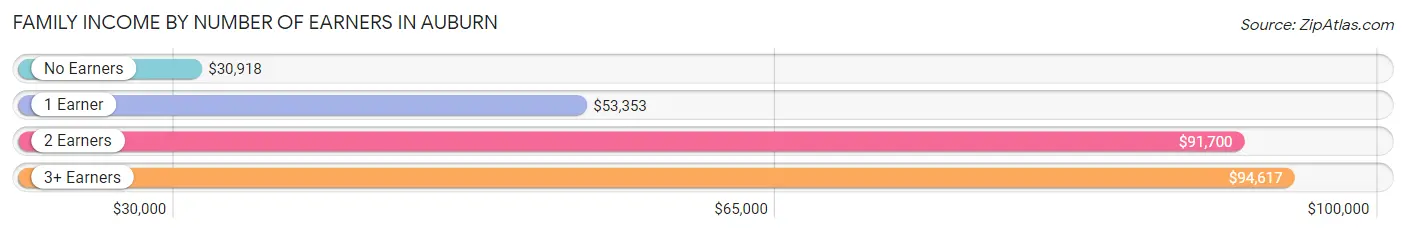
| Number of Earners | # Families | Median Income |
| No Earners | 1,076 (19.1%) | $30,918 |
| 1 Earner | 2,183 (38.7%) | $53,353 |
| 2 Earners | 1,876 (33.3%) | $91,700 |
| 3+ Earners | 506 (9.0%) | $94,617 |
| Total | 5,641 (100.0%) | $64,101 |
Household Income in Auburn
Household Income Brackets in Auburn
With 2,286 households falling in the category, the $50,000 to $74,999 income range is the most frequent in Auburn, accounting for 19.8% of all households. In contrast, only 312 households (2.7%) fall into the $200,000+ income bracket, making it the least populous group.
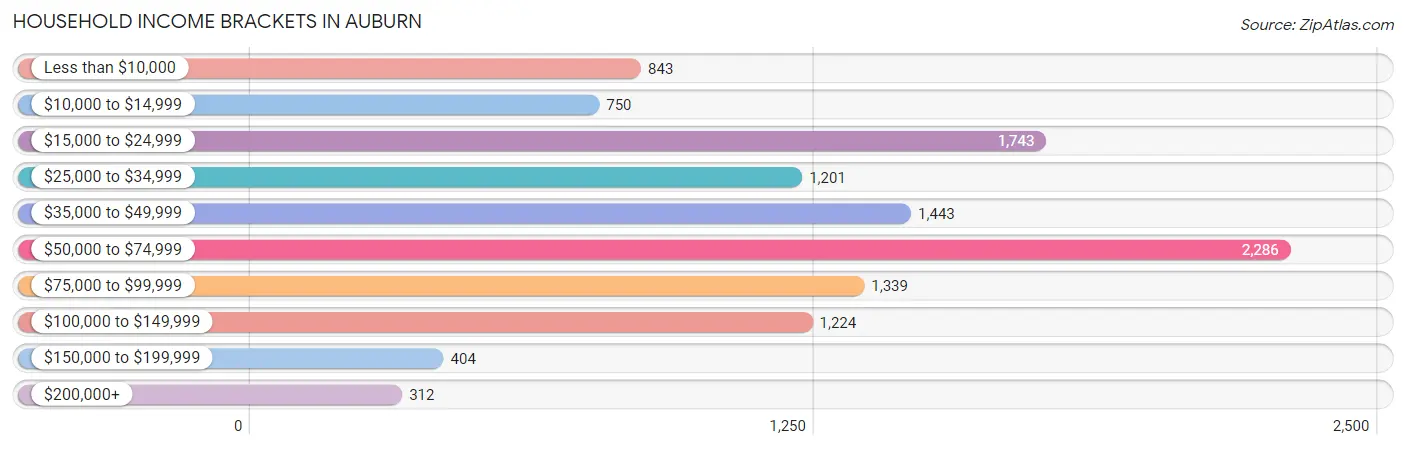
| Income Bracket | # Households | % Households |
| Less than $10,000 | 843 | 7.3% |
| $10,000 to $14,999 | 750 | 6.5% |
| $15,000 to $24,999 | 1,743 | 15.1% |
| $25,000 to $34,999 | 1,201 | 10.4% |
| $35,000 to $49,999 | 1,443 | 12.5% |
| $50,000 to $74,999 | 2,286 | 19.8% |
| $75,000 to $99,999 | 1,339 | 11.6% |
| $100,000 to $149,999 | 1,224 | 10.6% |
| $150,000 to $199,999 | 404 | 3.5% |
| $200,000+ | 312 | 2.7% |
Household Income by Householder Age in Auburn
The median household income in Auburn is $48,203, with the highest median household income of $57,567 found in the 45 to 64 years age bracket for the primary householder. A total of 3,677 households (31.9%) fall into this category. Meanwhile, the 15 to 24 years age bracket for the primary householder has the lowest median household income of $0, with 429 households (3.7%) in this group.
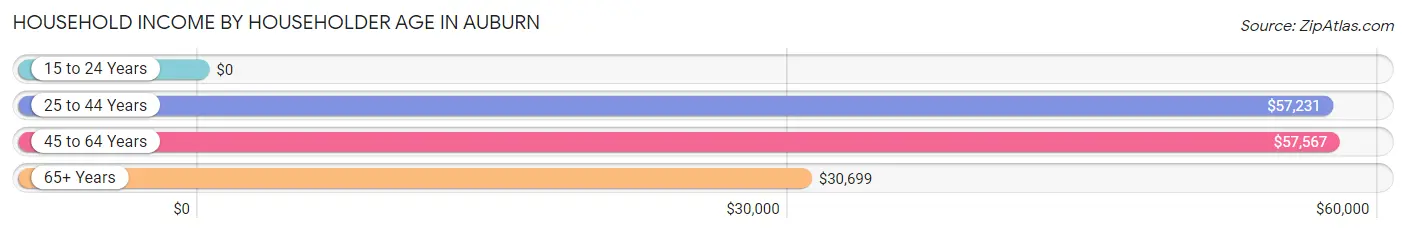
| Income Bracket | # Households | Median Income |
| 15 to 24 Years | 429 (3.7%) | $0 |
| 25 to 44 Years | 3,727 (32.3%) | $57,231 |
| 45 to 64 Years | 3,677 (31.9%) | $57,567 |
| 65+ Years | 3,711 (32.2%) | $30,699 |
| Total | 11,544 (100.0%) | $48,203 |
Poverty in Auburn
Income Below Poverty by Sex and Age in Auburn
With 16.3% poverty level for males and 23.2% for females among the residents of Auburn, 6 to 11 year old males and 5 year old females are the most vulnerable to poverty, with 229 males (35.6%) and 137 females (77.8%) in their respective age groups living below the poverty level.
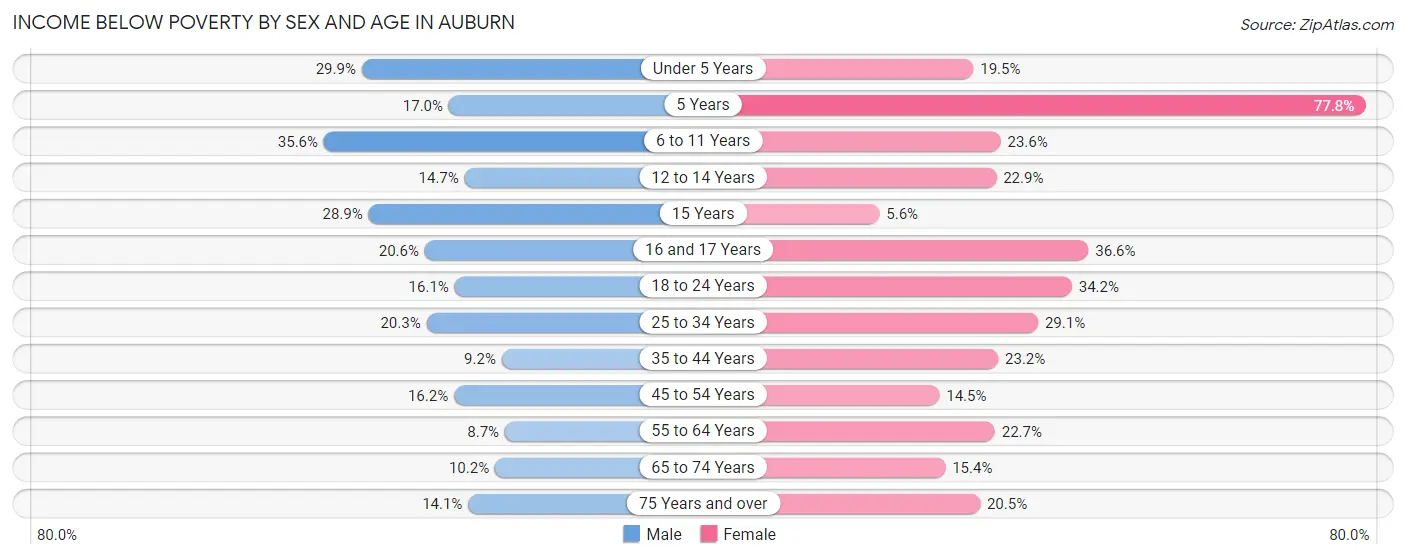
| Age Bracket | Male | Female |
| Under 5 Years | 262 (29.9%) | 158 (19.5%) |
| 5 Years | 17 (17.0%) | 137 (77.8%) |
| 6 to 11 Years | 229 (35.6%) | 169 (23.6%) |
| 12 to 14 Years | 56 (14.7%) | 61 (22.9%) |
| 15 Years | 35 (28.9%) | 14 (5.6%) |
| 16 and 17 Years | 36 (20.6%) | 67 (36.6%) |
| 18 to 24 Years | 185 (16.1%) | 308 (34.2%) |
| 25 to 34 Years | 382 (20.3%) | 561 (29.1%) |
| 35 to 44 Years | 147 (9.1%) | 404 (23.2%) |
| 45 to 54 Years | 189 (16.2%) | 187 (14.5%) |
| 55 to 64 Years | 141 (8.7%) | 413 (22.7%) |
| 65 to 74 Years | 123 (10.2%) | 213 (15.4%) |
| 75 Years and over | 103 (14.1%) | 293 (20.5%) |
| Total | 1,905 (16.3%) | 2,985 (23.2%) |
Income Above Poverty by Sex and Age in Auburn
According to the poverty statistics in Auburn, males aged 55 to 64 years and females aged 15 years are the age groups that are most secure financially, with 91.3% of males and 94.4% of females in these age groups living above the poverty line.
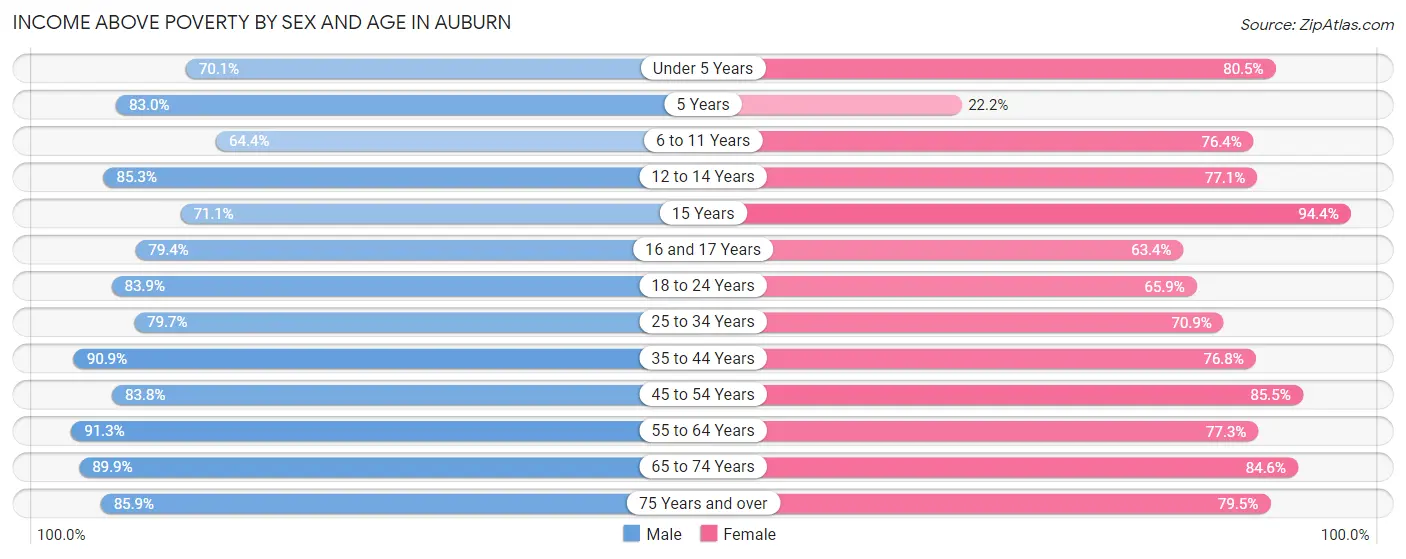
| Age Bracket | Male | Female |
| Under 5 Years | 613 (70.1%) | 651 (80.5%) |
| 5 Years | 83 (83.0%) | 39 (22.2%) |
| 6 to 11 Years | 415 (64.4%) | 548 (76.4%) |
| 12 to 14 Years | 326 (85.3%) | 205 (77.1%) |
| 15 Years | 86 (71.1%) | 237 (94.4%) |
| 16 and 17 Years | 139 (79.4%) | 116 (63.4%) |
| 18 to 24 Years | 961 (83.9%) | 594 (65.8%) |
| 25 to 34 Years | 1,498 (79.7%) | 1,365 (70.9%) |
| 35 to 44 Years | 1,460 (90.8%) | 1,337 (76.8%) |
| 45 to 54 Years | 975 (83.8%) | 1,104 (85.5%) |
| 55 to 64 Years | 1,484 (91.3%) | 1,405 (77.3%) |
| 65 to 74 Years | 1,089 (89.8%) | 1,174 (84.6%) |
| 75 Years and over | 626 (85.9%) | 1,135 (79.5%) |
| Total | 9,755 (83.7%) | 9,910 (76.8%) |
Income Below Poverty Among Married-Couple Families in Auburn
The poverty statistics for married-couple families in Auburn show that 4.5% or 137 of the total 3,014 families live below the poverty line. Families with 3 or 4 children have the highest poverty rate of 14.6%, comprising of 29 families. On the other hand, families with no children have the lowest poverty rate of 3.2%, which includes 64 families.
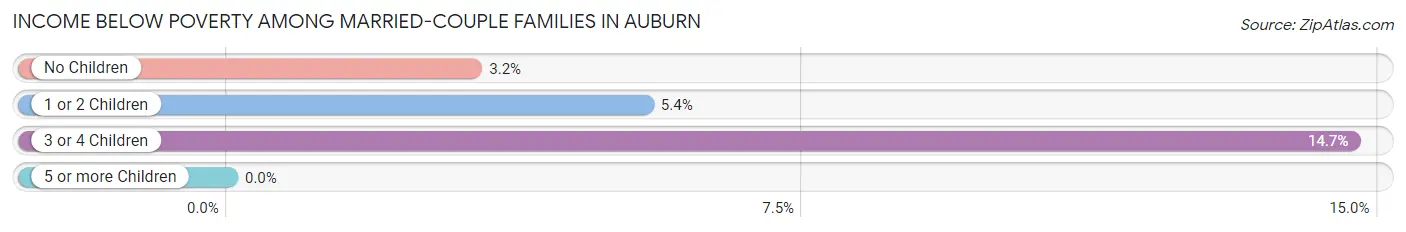
| Children | Above Poverty | Below Poverty |
| No Children | 1,941 (96.8%) | 64 (3.2%) |
| 1 or 2 Children | 767 (94.6%) | 44 (5.4%) |
| 3 or 4 Children | 169 (85.4%) | 29 (14.6%) |
| 5 or more Children | 0 (0.0%) | 0 (0.0%) |
| Total | 2,877 (95.5%) | 137 (4.5%) |
Income Below Poverty Among Single-Parent Households in Auburn
According to the poverty data in Auburn, 19.4% or 163 single-father households and 27.6% or 492 single-mother households are living below the poverty line. Among single-father households, those with 3 or 4 children have the highest poverty rate, with 45 households (55.6%) experiencing poverty. Likewise, among single-mother households, those with 5 or more children have the highest poverty rate, with 5 households (100.0%) falling below the poverty line.
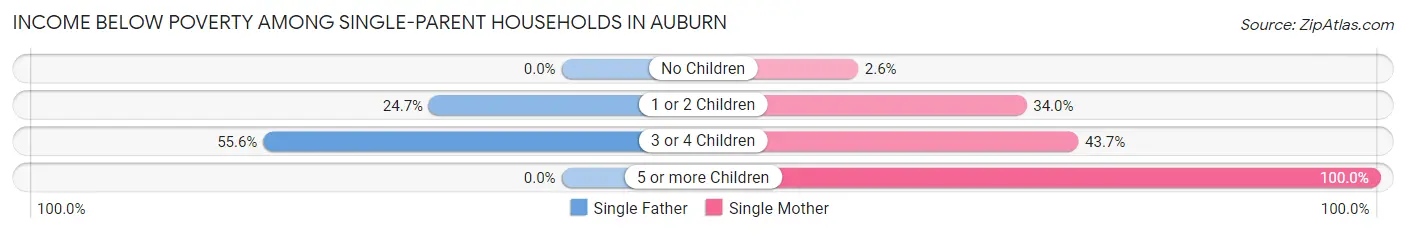
| Children | Single Father | Single Mother |
| No Children | 0 (0.0%) | 12 (2.6%) |
| 1 or 2 Children | 118 (24.7%) | 368 (34.0%) |
| 3 or 4 Children | 45 (55.6%) | 107 (43.7%) |
| 5 or more Children | 0 (0.0%) | 5 (100.0%) |
| Total | 163 (19.4%) | 492 (27.6%) |
Income Below Poverty Among Married-Couple vs Single-Parent Households in Auburn
The poverty data for Auburn shows that 137 of the married-couple family households (4.5%) and 655 of the single-parent households (24.9%) are living below the poverty level. Within the married-couple family households, those with 3 or 4 children have the highest poverty rate, with 29 households (14.6%) falling below the poverty line. Among the single-parent households, those with 5 or more children have the highest poverty rate, with 5 household (100.0%) living below poverty.
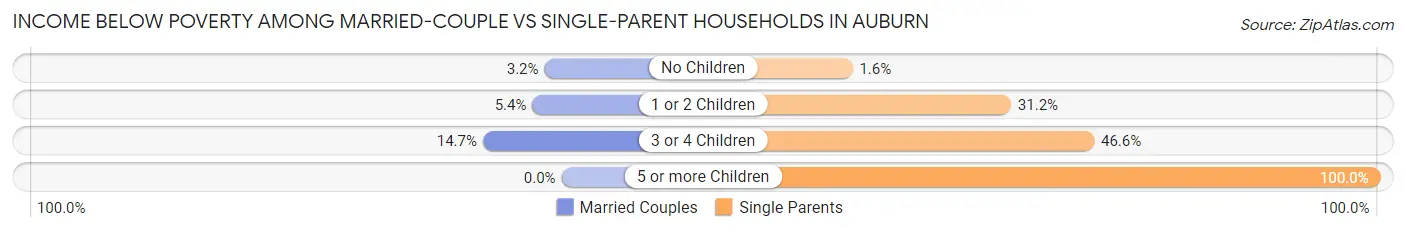
| Children | Married-Couple Families | Single-Parent Households |
| No Children | 64 (3.2%) | 12 (1.6%) |
| 1 or 2 Children | 44 (5.4%) | 486 (31.1%) |
| 3 or 4 Children | 29 (14.6%) | 152 (46.6%) |
| 5 or more Children | 0 (0.0%) | 5 (100.0%) |
| Total | 137 (4.5%) | 655 (24.9%) |
Race in Auburn
The most populous races in Auburn are White / Caucasian (22,091 | 82.8%), Black / African American (1,963 | 7.4%), and Two or more Races (1,773 | 6.7%).
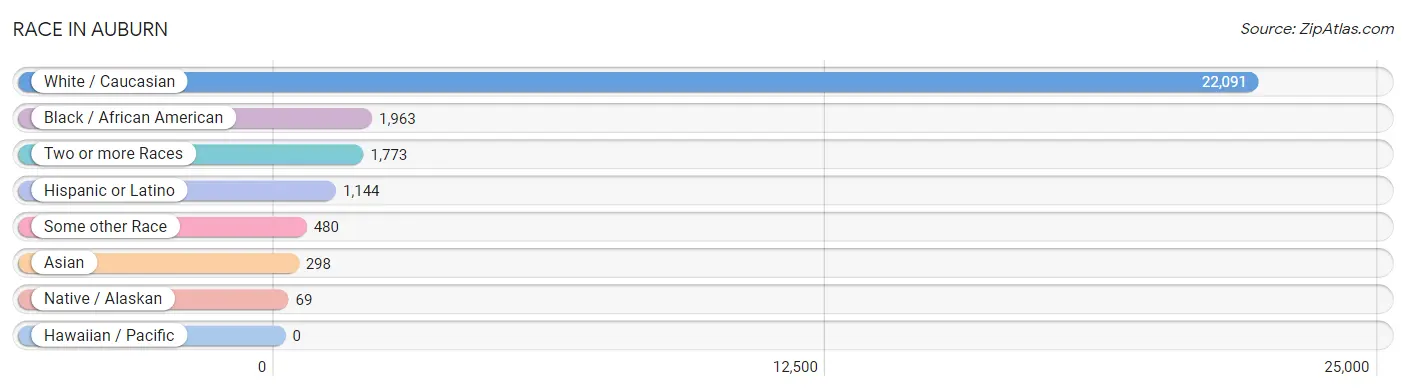
| Race | # Population | % Population |
| Asian | 298 | 1.1% |
| Black / African American | 1,963 | 7.4% |
| Hawaiian / Pacific | 0 | 0.0% |
| Hispanic or Latino | 1,144 | 4.3% |
| Native / Alaskan | 69 | 0.3% |
| White / Caucasian | 22,091 | 82.8% |
| Two or more Races | 1,773 | 6.7% |
| Some other Race | 480 | 1.8% |
| Total | 26,674 | 100.0% |
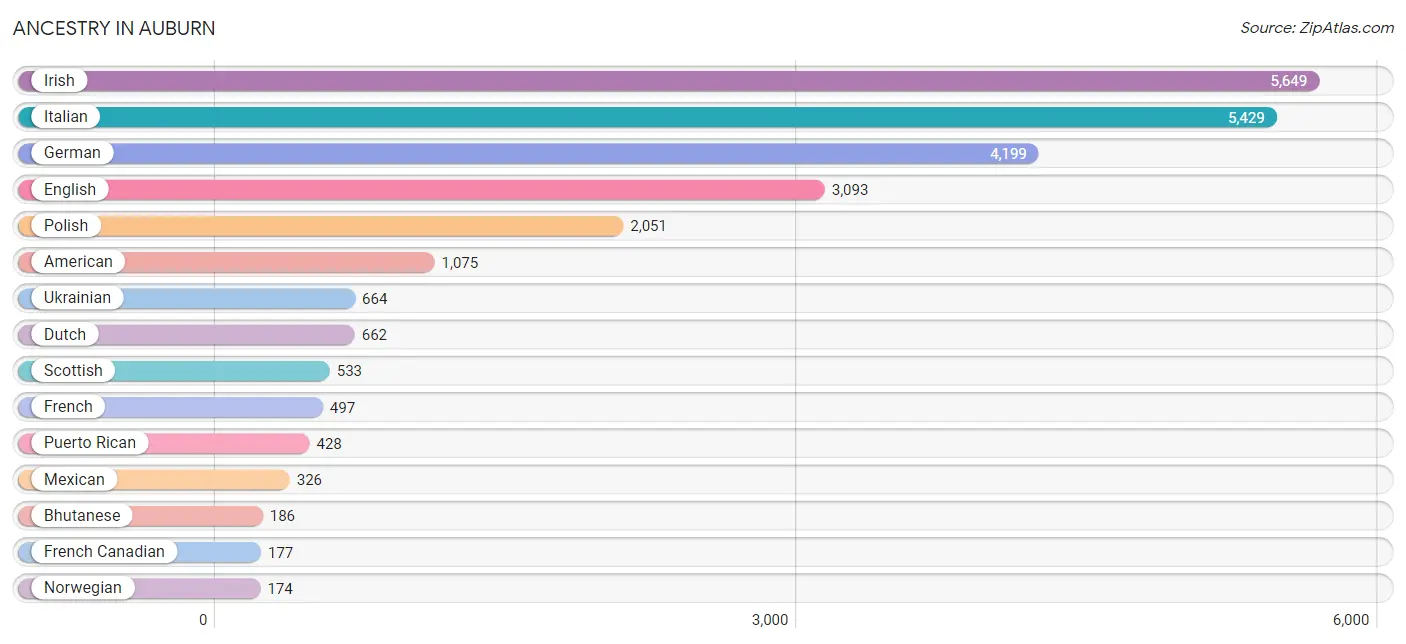
Ancestry in Auburn
The most populous ancestries reported in Auburn are Irish (5,649 | 21.2%), Italian (5,429 | 20.3%), German (4,199 | 15.7%), English (3,093 | 11.6%), and Polish (2,051 | 7.7%), together accounting for 76.6% of all Auburn residents.
| Ancestry | # Population | % Population |
| African | 4 | 0.0% |
| American | 1,075 | 4.0% |
| Arab | 88 | 0.3% |
| Armenian | 11 | 0.0% |
| Austrian | 10 | 0.0% |
| Belgian | 20 | 0.1% |
| Bhutanese | 186 | 0.7% |
| British | 102 | 0.4% |
| Burmese | 7 | 0.0% |
| Canadian | 18 | 0.1% |
| Central American | 33 | 0.1% |
| Cherokee | 12 | 0.0% |
| Colombian | 4 | 0.0% |
| Croatian | 16 | 0.1% |
| Crow | 20 | 0.1% |
| Cuban | 36 | 0.1% |
| Czech | 40 | 0.2% |
| Czechoslovakian | 64 | 0.2% |
| Danish | 59 | 0.2% |
| Dominican | 93 | 0.4% |
| Dutch | 662 | 2.5% |
| Eastern European | 31 | 0.1% |
| Ecuadorian | 34 | 0.1% |
| Egyptian | 9 | 0.0% |
| English | 3,093 | 11.6% |
| European | 62 | 0.2% |
| French | 497 | 1.9% |
| French Canadian | 177 | 0.7% |
| German | 4,199 | 15.7% |
| Greek | 150 | 0.6% |
| Guatemalan | 7 | 0.0% |
| Guyanese | 19 | 0.1% |
| Haitian | 14 | 0.1% |
| Honduran | 17 | 0.1% |
| Hungarian | 88 | 0.3% |
| Indian (Asian) | 20 | 0.1% |
| Irish | 5,649 | 21.2% |
| Iroquois | 104 | 0.4% |
| Italian | 5,429 | 20.3% |
| Jamaican | 4 | 0.0% |
| Korean | 63 | 0.2% |
| Lebanese | 65 | 0.2% |
| Macedonian | 45 | 0.2% |
| Mexican | 326 | 1.2% |
| Moroccan | 5 | 0.0% |
| Nicaraguan | 9 | 0.0% |
| Nigerian | 15 | 0.1% |
| Northern European | 12 | 0.0% |
| Norwegian | 174 | 0.6% |
| Osage | 13 | 0.1% |
| Pakistani | 3 | 0.0% |
| Paraguayan | 26 | 0.1% |
| Pennsylvania German | 15 | 0.1% |
| Peruvian | 33 | 0.1% |
| Polish | 2,051 | 7.7% |
| Puerto Rican | 428 | 1.6% |
| Russian | 51 | 0.2% |
| Scandinavian | 29 | 0.1% |
| Scotch-Irish | 125 | 0.5% |
| Scottish | 533 | 2.0% |
| Serbian | 19 | 0.1% |
| Slavic | 32 | 0.1% |
| Slovak | 103 | 0.4% |
| South American | 97 | 0.4% |
| Spanish | 8 | 0.0% |
| Sri Lankan | 32 | 0.1% |
| Subsaharan African | 19 | 0.1% |
| Swedish | 152 | 0.6% |
| Swiss | 50 | 0.2% |
| Syrian | 9 | 0.0% |
| Thai | 18 | 0.1% |
| Ukrainian | 664 | 2.5% |
| Ute | 9 | 0.0% |
| Welsh | 142 | 0.5% | View All 74 Rows |
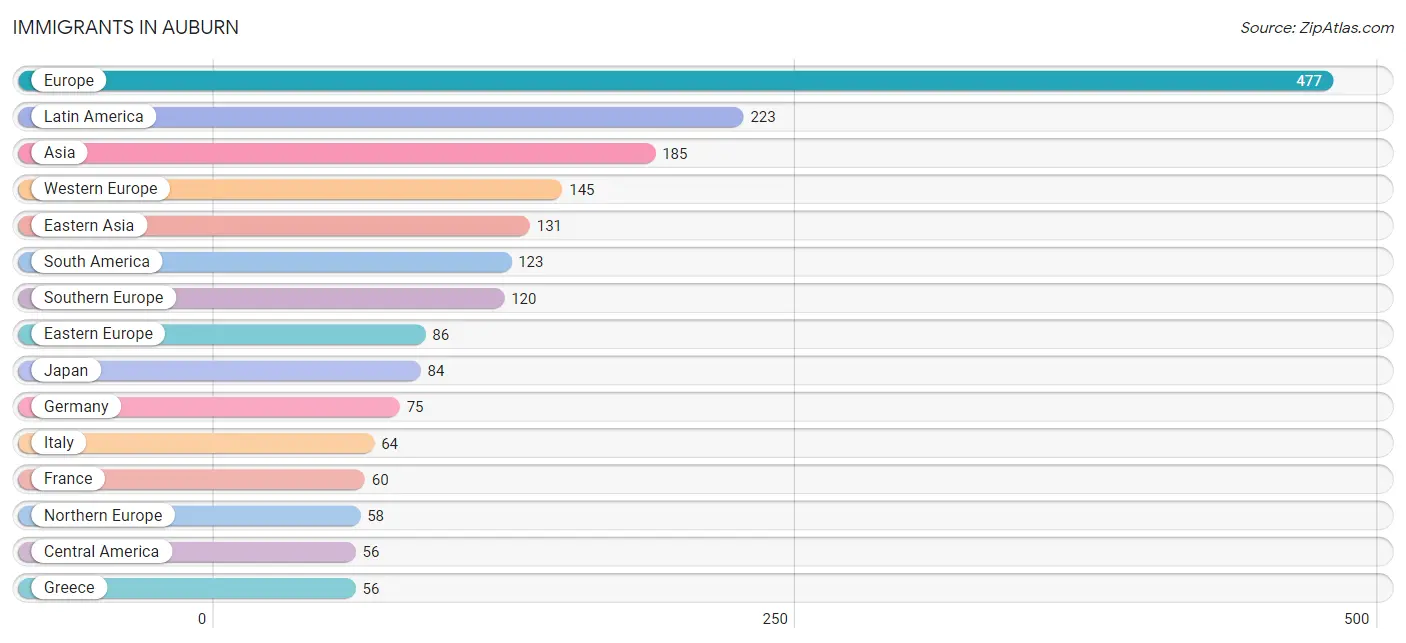
Immigrants in Auburn
The most numerous immigrant groups reported in Auburn came from Europe (477 | 1.8%), Latin America (223 | 0.8%), Asia (185 | 0.7%), Western Europe (145 | 0.5%), and Eastern Asia (131 | 0.5%), together accounting for 4.3% of all Auburn residents.
| Immigration Origin | # Population | % Population |
| Africa | 17 | 0.1% |
| Asia | 185 | 0.7% |
| Belgium | 10 | 0.0% |
| Brazil | 26 | 0.1% |
| Canada | 25 | 0.1% |
| Caribbean | 44 | 0.2% |
| Central America | 56 | 0.2% |
| China | 46 | 0.2% |
| Colombia | 15 | 0.1% |
| Dominican Republic | 36 | 0.1% |
| Eastern Africa | 4 | 0.0% |
| Eastern Asia | 131 | 0.5% |
| Eastern Europe | 86 | 0.3% |
| Ecuador | 34 | 0.1% |
| Egypt | 9 | 0.0% |
| England | 14 | 0.1% |
| Europe | 477 | 1.8% |
| France | 60 | 0.2% |
| Germany | 75 | 0.3% |
| Greece | 56 | 0.2% |
| Haiti | 6 | 0.0% |
| Honduras | 17 | 0.1% |
| India | 10 | 0.0% |
| Italy | 64 | 0.2% |
| Jamaica | 2 | 0.0% |
| Japan | 84 | 0.3% |
| Kenya | 4 | 0.0% |
| Korea | 1 | 0.0% |
| Latin America | 223 | 0.8% |
| Mexico | 30 | 0.1% |
| Nicaragua | 9 | 0.0% |
| Northern Africa | 9 | 0.0% |
| Northern Europe | 58 | 0.2% |
| Norway | 39 | 0.2% |
| Peru | 31 | 0.1% |
| Philippines | 41 | 0.2% |
| Poland | 13 | 0.1% |
| Sierra Leone | 4 | 0.0% |
| South America | 123 | 0.5% |
| South Central Asia | 10 | 0.0% |
| South Eastern Asia | 44 | 0.2% |
| Southern Europe | 120 | 0.4% |
| Taiwan | 32 | 0.1% |
| Thailand | 3 | 0.0% |
| Western Africa | 4 | 0.0% |
| Western Europe | 145 | 0.5% | View All 46 Rows |
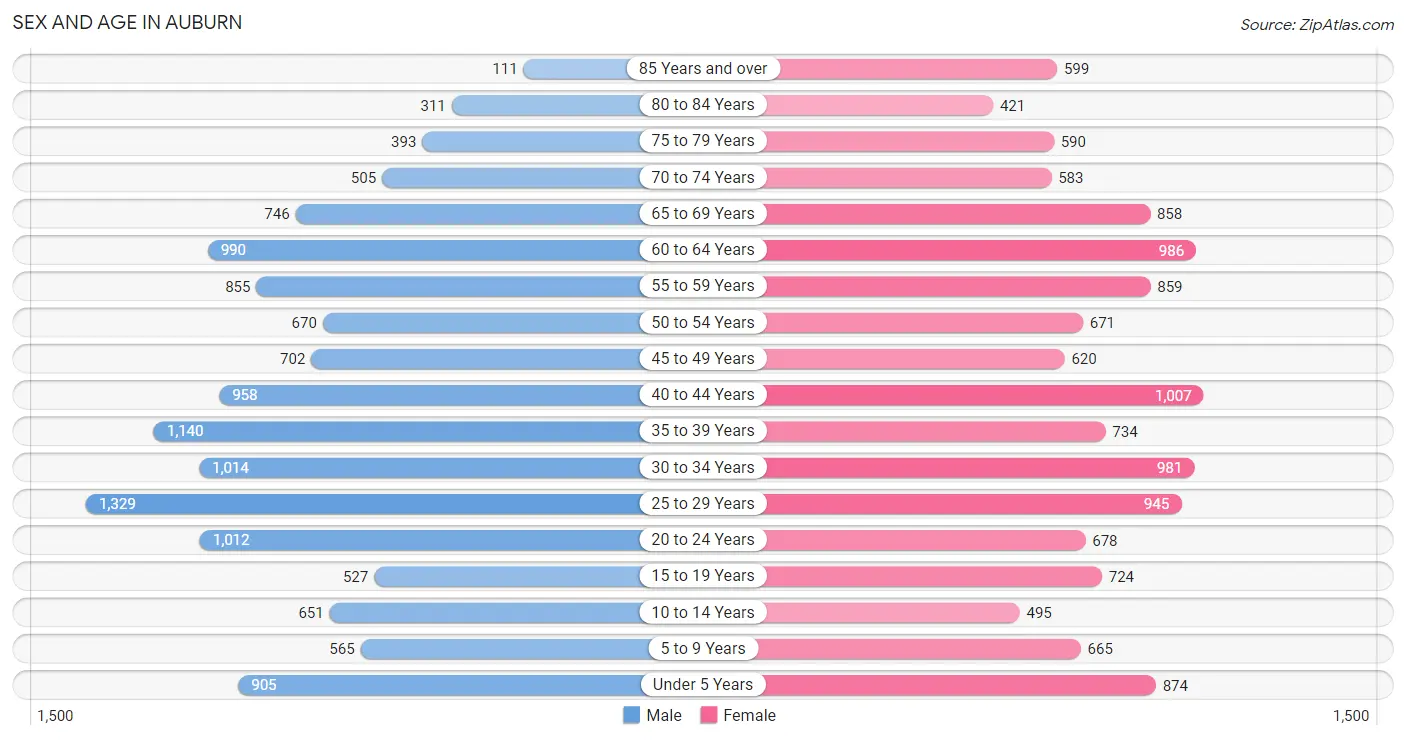
Sex and Age in Auburn
Sex and Age in Auburn
The most populous age groups in Auburn are 25 to 29 Years (1,329 | 9.9%) for men and 40 to 44 Years (1,007 | 7.6%) for women.
| Age Bracket | Male | Female |
| Under 5 Years | 905 (6.8%) | 874 (6.6%) |
| 5 to 9 Years | 565 (4.2%) | 665 (5.0%) |
| 10 to 14 Years | 651 (4.9%) | 495 (3.7%) |
| 15 to 19 Years | 527 (3.9%) | 724 (5.4%) |
| 20 to 24 Years | 1,012 (7.6%) | 678 (5.1%) |
| 25 to 29 Years | 1,329 (9.9%) | 945 (7.1%) |
| 30 to 34 Years | 1,014 (7.6%) | 981 (7.4%) |
| 35 to 39 Years | 1,140 (8.5%) | 734 (5.5%) |
| 40 to 44 Years | 958 (7.2%) | 1,007 (7.6%) |
| 45 to 49 Years | 702 (5.2%) | 620 (4.7%) |
| 50 to 54 Years | 670 (5.0%) | 671 (5.1%) |
| 55 to 59 Years | 855 (6.4%) | 859 (6.5%) |
| 60 to 64 Years | 990 (7.4%) | 986 (7.4%) |
| 65 to 69 Years | 746 (5.6%) | 858 (6.5%) |
| 70 to 74 Years | 505 (3.8%) | 583 (4.4%) |
| 75 to 79 Years | 393 (2.9%) | 590 (4.4%) |
| 80 to 84 Years | 311 (2.3%) | 421 (3.2%) |
| 85 Years and over | 111 (0.8%) | 599 (4.5%) |
| Total | 13,384 (100.0%) | 13,290 (100.0%) |
Families and Households in Auburn
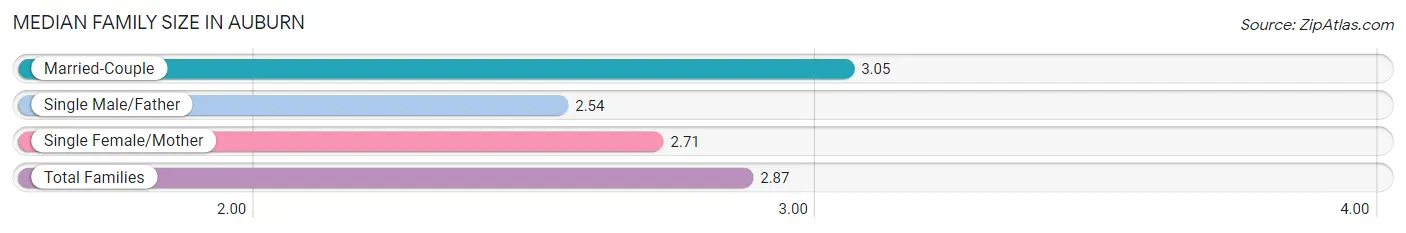
Median Family Size in Auburn
The median family size in Auburn is 2.87 persons per family, with married-couple families (3,014 | 53.4%) accounting for the largest median family size of 3.05 persons per family. On the other hand, single male/father families (841 | 14.9%) represent the smallest median family size with 2.54 persons per family.
| Family Type | # Families | Family Size |
| Married-Couple | 3,014 (53.4%) | 3.05 |
| Single Male/Father | 841 (14.9%) | 2.54 |
| Single Female/Mother | 1,786 (31.7%) | 2.71 |
| Total Families | 5,641 (100.0%) | 2.87 |
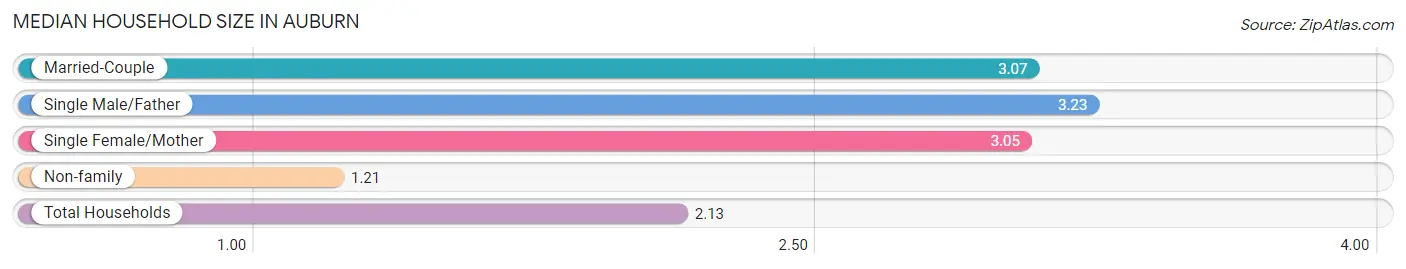
Median Household Size in Auburn
The median household size in Auburn is 2.13 persons per household, with single male/father households (841 | 7.3%) accounting for the largest median household size of 3.23 persons per household. non-family households (5,903 | 51.1%) represent the smallest median household size with 1.21 persons per household.
| Household Type | # Households | Household Size |
| Married-Couple | 3,014 (26.1%) | 3.07 |
| Single Male/Father | 841 (7.3%) | 3.23 |
| Single Female/Mother | 1,786 (15.5%) | 3.05 |
| Non-family | 5,903 (51.1%) | 1.21 |
| Total Households | 11,544 (100.0%) | 2.13 |
Household Size by Marriage Status in Auburn
Out of a total of 11,544 households in Auburn, 5,641 (48.9%) are family households, while 5,903 (51.1%) are nonfamily households. The most numerous type of family households are 2-person households, comprising 2,325, and the most common type of nonfamily households are 1-person households, comprising 4,803.
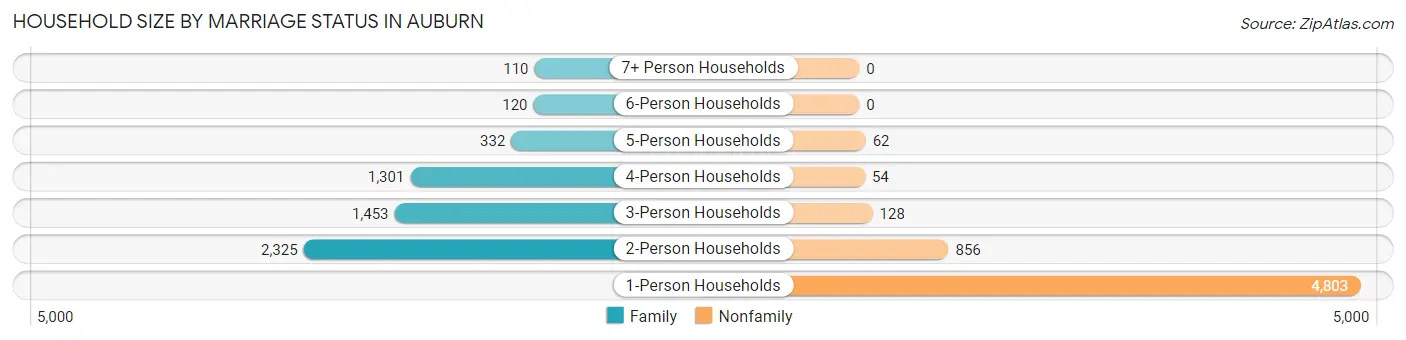
| Household Size | Family Households | Nonfamily Households |
| 1-Person Households | - | 4,803 (41.6%) |
| 2-Person Households | 2,325 (20.1%) | 856 (7.4%) |
| 3-Person Households | 1,453 (12.6%) | 128 (1.1%) |
| 4-Person Households | 1,301 (11.3%) | 54 (0.5%) |
| 5-Person Households | 332 (2.9%) | 62 (0.5%) |
| 6-Person Households | 120 (1.0%) | 0 (0.0%) |
| 7+ Person Households | 110 (0.9%) | 0 (0.0%) |
| Total | 5,641 (48.9%) | 5,903 (51.1%) |
Female Fertility in Auburn
Fertility by Age in Auburn
Average fertility rate in Auburn is 90.0 births per 1,000 women. Women in the age bracket of 20 to 34 years have the highest fertility rate with 163.0 births per 1,000 women. Women in the age bracket of 20 to 34 years acount for 82.4% of all women with births.
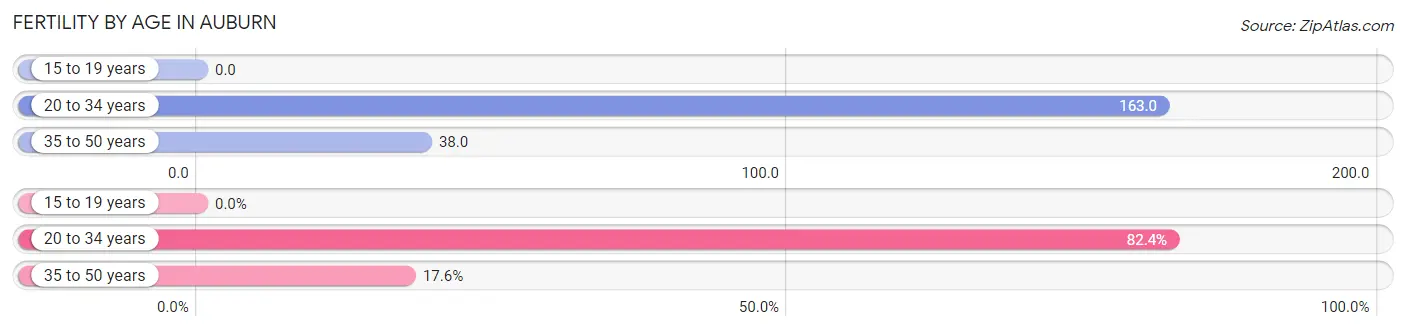
| Age Bracket | Women with Births | Births / 1,000 Women |
| 15 to 19 years | 0 (0.0%) | 0.0 |
| 20 to 34 years | 425 (82.4%) | 163.0 |
| 35 to 50 years | 91 (17.6%) | 38.0 |
| Total | 516 (100.0%) | 90.0 |
Fertility by Age by Marriage Status in Auburn
26.0% of women with births (516) in Auburn are married. The highest percentage of unmarried women with births falls into 20 to 34 years age bracket with 83.3% of them unmarried at the time of birth, while the lowest percentage of unmarried women with births belong to 35 to 50 years age bracket with 30.8% of them unmarried.
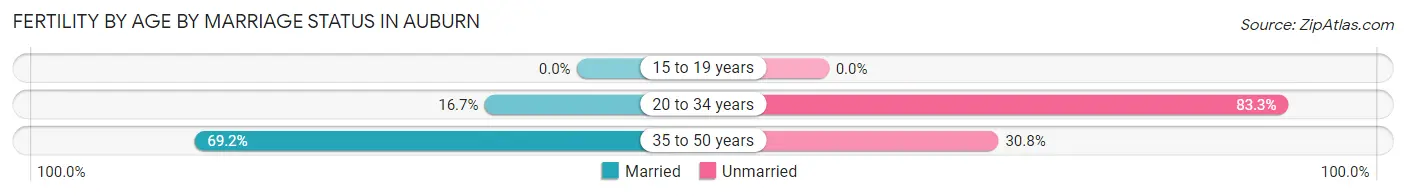
| Age Bracket | Married | Unmarried |
| 15 to 19 years | 0 (0.0%) | 0 (0.0%) |
| 20 to 34 years | 71 (16.7%) | 354 (83.3%) |
| 35 to 50 years | 63 (69.2%) | 28 (30.8%) |
| Total | 134 (26.0%) | 382 (74.0%) |
Fertility by Education in Auburn
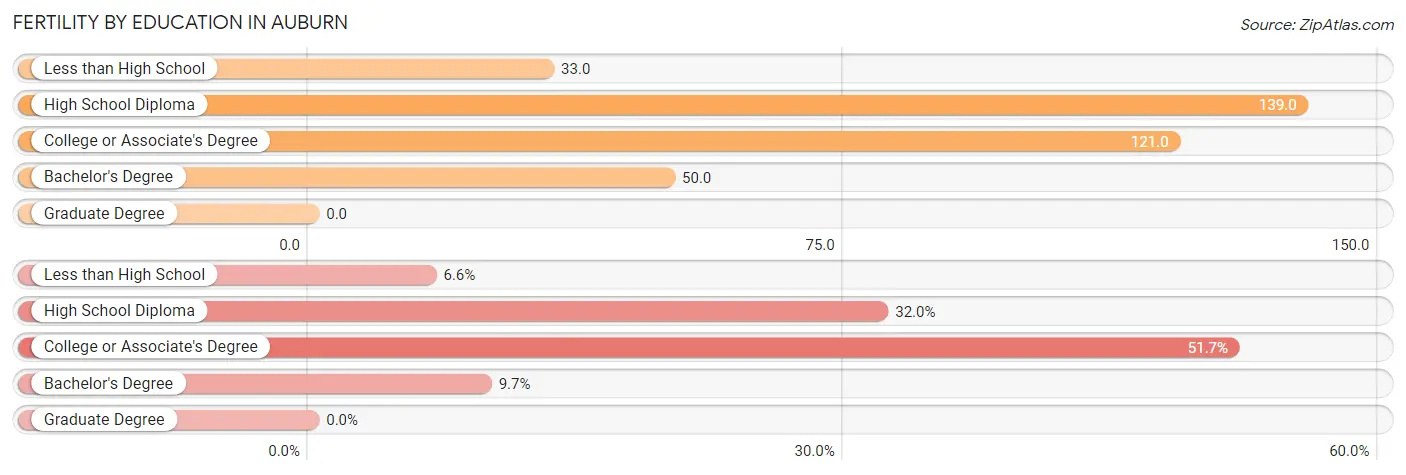
| Educational Attainment | Women with Births | Births / 1,000 Women |
| Less than High School | 34 (6.6%) | 33.0 |
| High School Diploma | 165 (32.0%) | 139.0 |
| College or Associate's Degree | 267 (51.7%) | 121.0 |
| Bachelor's Degree | 50 (9.7%) | 50.0 |
| Graduate Degree | 0 (0.0%) | 0.0 |
| Total | 516 (100.0%) | 90.0 |
Fertility by Education by Marriage Status in Auburn
74.0% of women with births in Auburn are unmarried. Women with the educational attainment of bachelor's degree are most likely to be married with 100.0% of them married at childbirth, while women with the educational attainment of high school diploma are least likely to be married with 100.0% of them unmarried at childbirth.
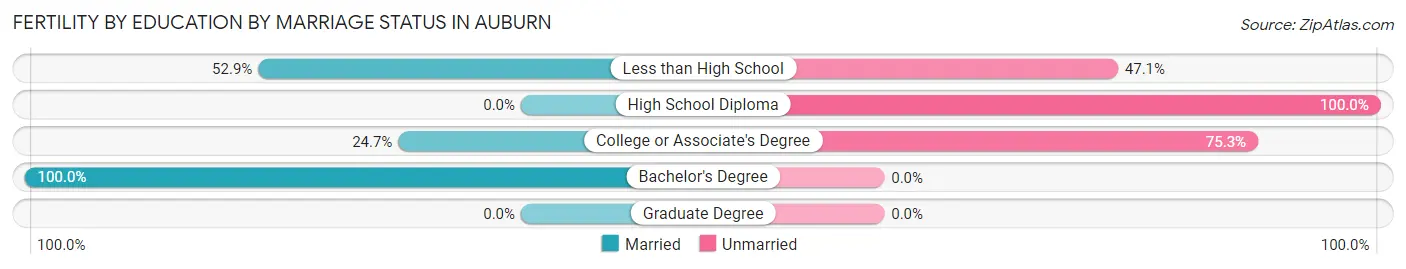
| Educational Attainment | Married | Unmarried |
| Less than High School | 18 (52.9%) | 16 (47.1%) |
| High School Diploma | 0 (0.0%) | 165 (100.0%) |
| College or Associate's Degree | 66 (24.7%) | 201 (75.3%) |
| Bachelor's Degree | 50 (100.0%) | 0 (0.0%) |
| Graduate Degree | 0 (0.0%) | 0 (0.0%) |
| Total | 134 (26.0%) | 382 (74.0%) |
Employment Characteristics in Auburn
Employment by Class of Employer in Auburn
Among the 10,836 employed individuals in Auburn, private company employees (7,101 | 65.5%), not-for-profit organizations (1,391 | 12.8%), and local government employees (885 | 8.2%) make up the most common classes of employment.
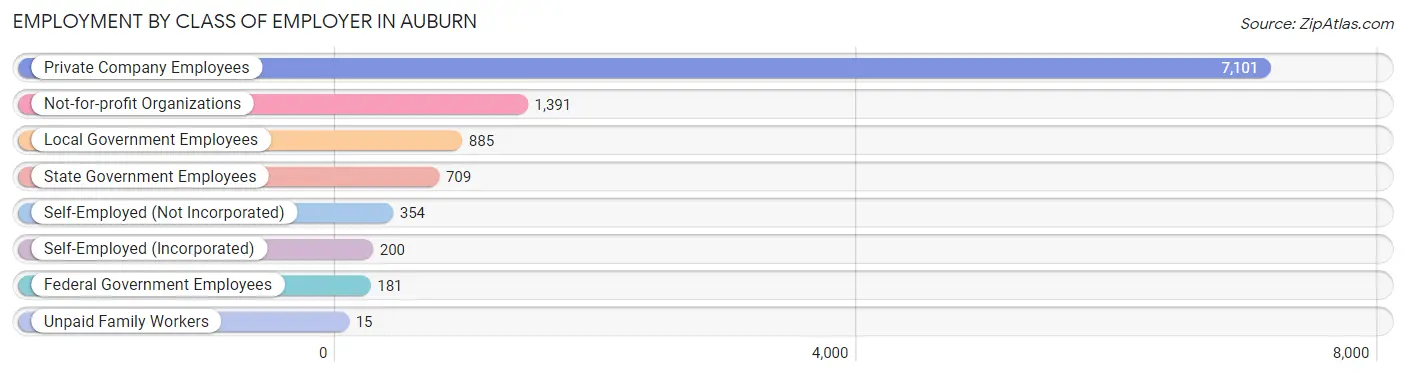
| Employer Class | # Employees | % Employees |
| Private Company Employees | 7,101 | 65.5% |
| Self-Employed (Incorporated) | 200 | 1.8% |
| Self-Employed (Not Incorporated) | 354 | 3.3% |
| Not-for-profit Organizations | 1,391 | 12.8% |
| Local Government Employees | 885 | 8.2% |
| State Government Employees | 709 | 6.5% |
| Federal Government Employees | 181 | 1.7% |
| Unpaid Family Workers | 15 | 0.1% |
| Total | 10,836 | 100.0% |
Employment Status by Age in Auburn
According to the labor force statistics for Auburn, out of the total population over 16 years of age (22,147), 53.1% or 11,760 individuals are in the labor force, with 6.0% or 706 of them unemployed. The age group with the highest labor force participation rate is 30 to 34 years, with 74.2% or 1,480 individuals in the labor force. Within the labor force, the 55 to 59 years age range has the highest percentage of unemployed individuals, with 13.9% or 147 of them being unemployed.
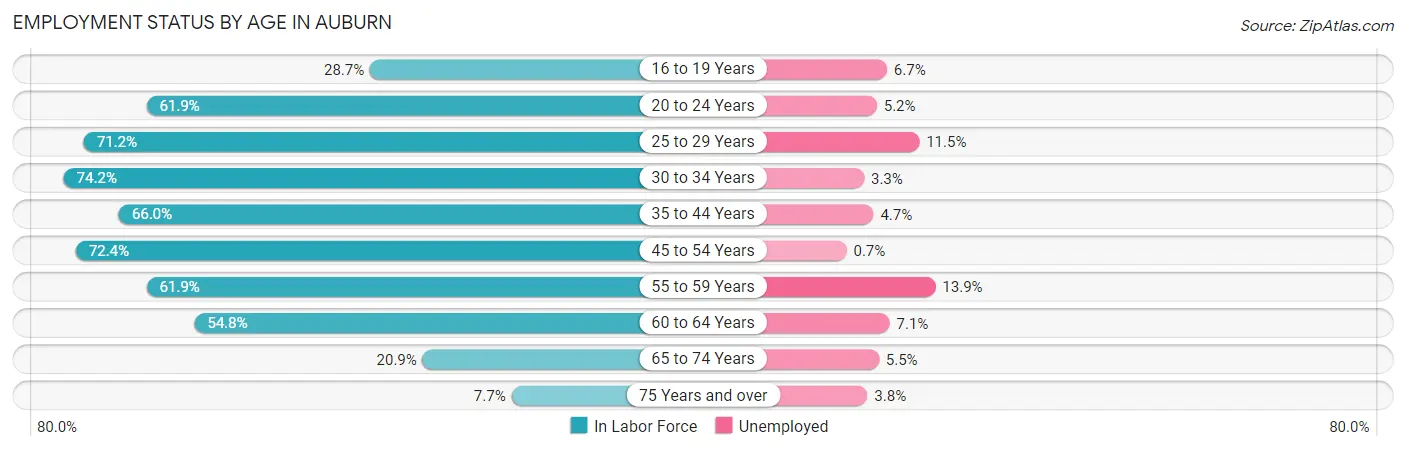
| Age Bracket | In Labor Force | Unemployed |
| 16 to 19 Years | 252 (28.7%) | 17 (6.7%) |
| 20 to 24 Years | 1,046 (61.9%) | 54 (5.2%) |
| 25 to 29 Years | 1,619 (71.2%) | 186 (11.5%) |
| 30 to 34 Years | 1,480 (74.2%) | 49 (3.3%) |
| 35 to 44 Years | 2,534 (66.0%) | 119 (4.7%) |
| 45 to 54 Years | 1,928 (72.4%) | 13 (0.7%) |
| 55 to 59 Years | 1,061 (61.9%) | 147 (13.9%) |
| 60 to 64 Years | 1,083 (54.8%) | 77 (7.1%) |
| 65 to 74 Years | 563 (20.9%) | 31 (5.5%) |
| 75 Years and over | 187 (7.7%) | 7 (3.8%) |
| Total | 11,760 (53.1%) | 706 (6.0%) |
Employment Status by Educational Attainment in Auburn
According to labor force statistics for Auburn, 67.1% of individuals (9,703) out of the total population between 25 and 64 years of age (14,461) are in the labor force, with 6.1% or 592 of them being unemployed. The group with the highest labor force participation rate are those with the educational attainment of bachelor's degree or higher, with 81.5% or 2,343 individuals in the labor force. Within the labor force, individuals with less than high school education have the highest percentage of unemployment, with 29.4% or 173 of them being unemployed.
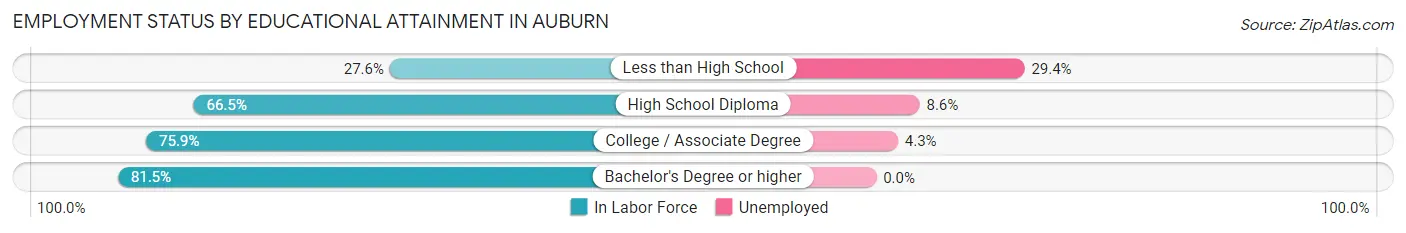
| Educational Attainment | In Labor Force | Unemployed |
| Less than High School | 590 (27.6%) | 629 (29.4%) |
| High School Diploma | 2,849 (66.5%) | 368 (8.6%) |
| College / Associate Degree | 3,919 (75.9%) | 222 (4.3%) |
| Bachelor's Degree or higher | 2,343 (81.5%) | 0 (0.0%) |
| Total | 9,703 (67.1%) | 882 (6.1%) |
Employment Occupations by Sex in Auburn
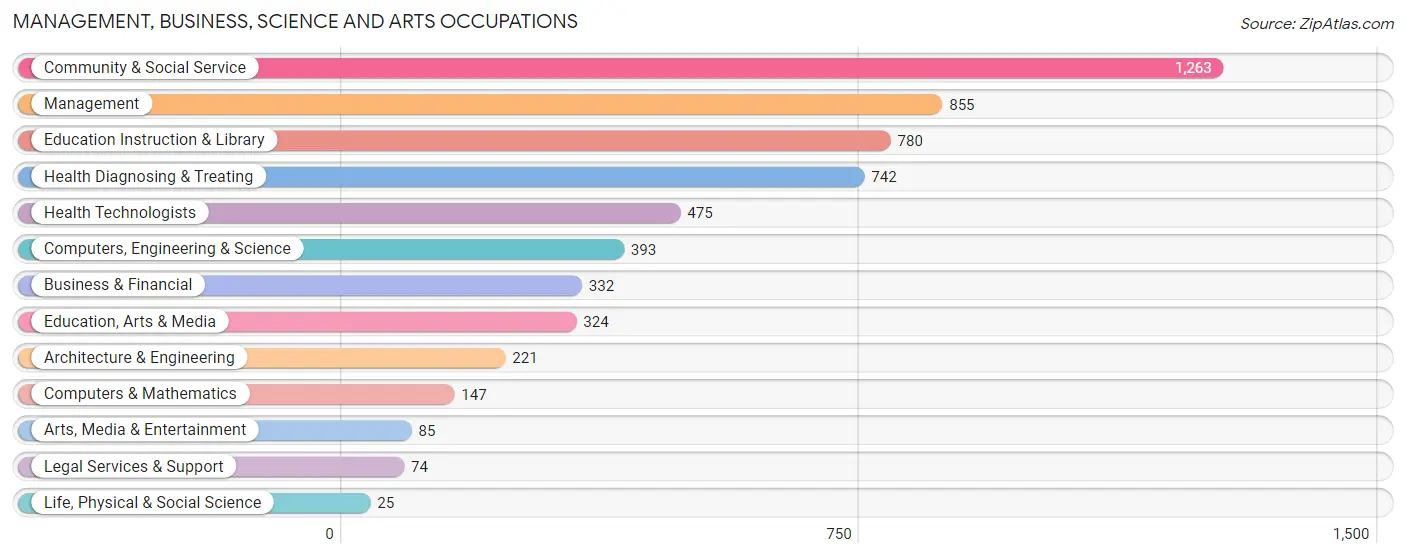
Management, Business, Science and Arts Occupations
The most common Management, Business, Science and Arts occupations in Auburn are Community & Social Service (1,263 | 11.4%), Management (855 | 7.7%), Education Instruction & Library (780 | 7.1%), Health Diagnosing & Treating (742 | 6.7%), and Health Technologists (475 | 4.3%).
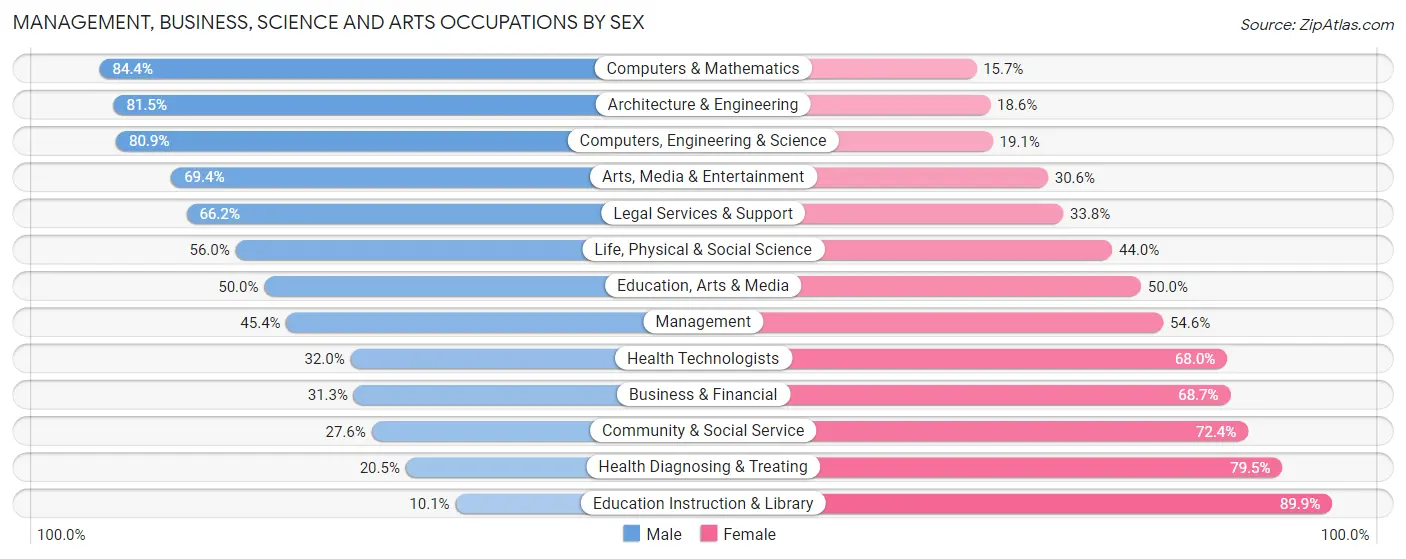
Management, Business, Science and Arts Occupations by Sex
Within the Management, Business, Science and Arts occupations in Auburn, the most male-oriented occupations are Computers & Mathematics (84.4%), Architecture & Engineering (81.5%), and Computers, Engineering & Science (80.9%), while the most female-oriented occupations are Education Instruction & Library (89.9%), Health Diagnosing & Treating (79.5%), and Community & Social Service (72.4%).
| Occupation | Male | Female |
| Management | 388 (45.4%) | 467 (54.6%) |
| Business & Financial | 104 (31.3%) | 228 (68.7%) |
| Computers, Engineering & Science | 318 (80.9%) | 75 (19.1%) |
| Computers & Mathematics | 124 (84.4%) | 23 (15.7%) |
| Architecture & Engineering | 180 (81.5%) | 41 (18.5%) |
| Life, Physical & Social Science | 14 (56.0%) | 11 (44.0%) |
| Community & Social Service | 349 (27.6%) | 914 (72.4%) |
| Education, Arts & Media | 162 (50.0%) | 162 (50.0%) |
| Legal Services & Support | 49 (66.2%) | 25 (33.8%) |
| Education Instruction & Library | 79 (10.1%) | 701 (89.9%) |
| Arts, Media & Entertainment | 59 (69.4%) | 26 (30.6%) |
| Health Diagnosing & Treating | 152 (20.5%) | 590 (79.5%) |
| Health Technologists | 152 (32.0%) | 323 (68.0%) |
| Total (Category) | 1,311 (36.6%) | 2,274 (63.4%) |
| Total (Overall) | 5,684 (51.5%) | 5,354 (48.5%) |
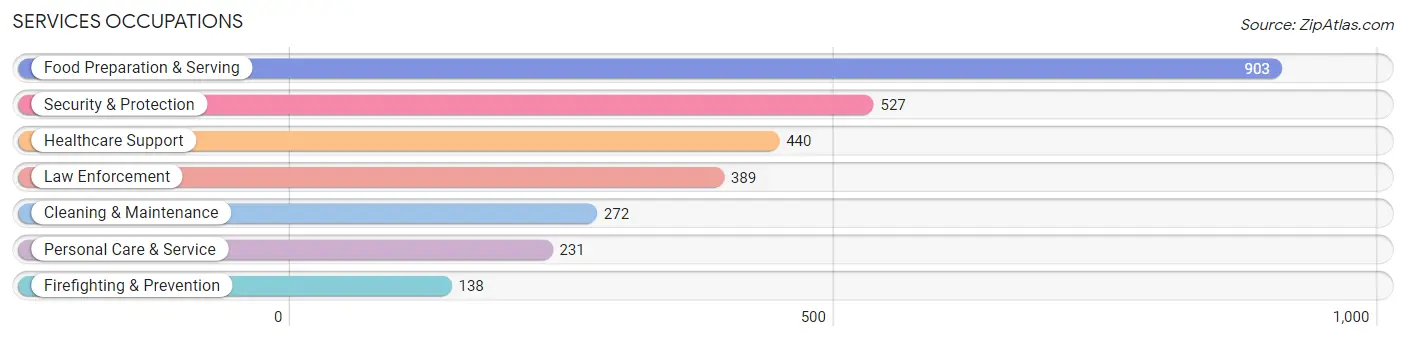
Services Occupations
The most common Services occupations in Auburn are Food Preparation & Serving (903 | 8.2%), Security & Protection (527 | 4.8%), Healthcare Support (440 | 4.0%), Law Enforcement (389 | 3.5%), and Cleaning & Maintenance (272 | 2.5%).
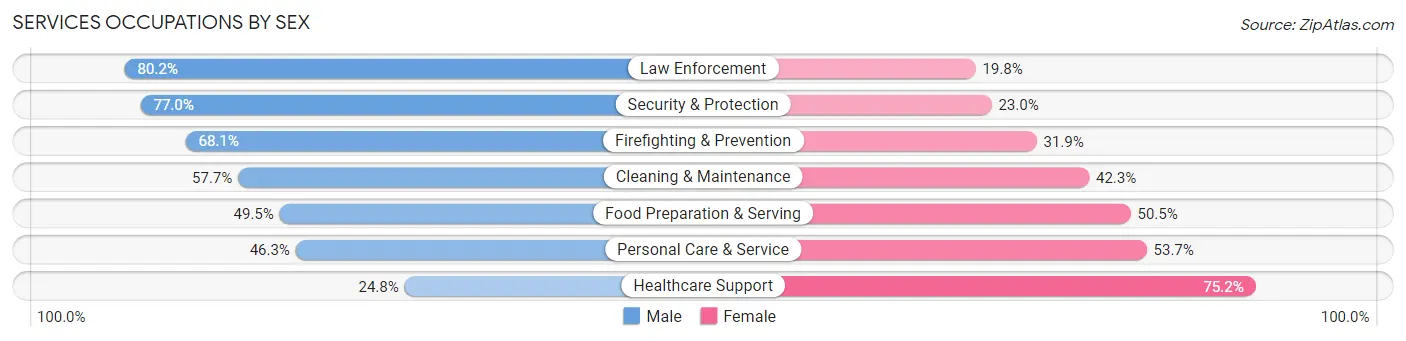
Services Occupations by Sex
Within the Services occupations in Auburn, the most male-oriented occupations are Law Enforcement (80.2%), Security & Protection (77.0%), and Firefighting & Prevention (68.1%), while the most female-oriented occupations are Healthcare Support (75.2%), Personal Care & Service (53.7%), and Food Preparation & Serving (50.5%).
| Occupation | Male | Female |
| Healthcare Support | 109 (24.8%) | 331 (75.2%) |
| Security & Protection | 406 (77.0%) | 121 (23.0%) |
| Firefighting & Prevention | 94 (68.1%) | 44 (31.9%) |
| Law Enforcement | 312 (80.2%) | 77 (19.8%) |
| Food Preparation & Serving | 447 (49.5%) | 456 (50.5%) |
| Cleaning & Maintenance | 157 (57.7%) | 115 (42.3%) |
| Personal Care & Service | 107 (46.3%) | 124 (53.7%) |
| Total (Category) | 1,226 (51.7%) | 1,147 (48.3%) |
| Total (Overall) | 5,684 (51.5%) | 5,354 (48.5%) |
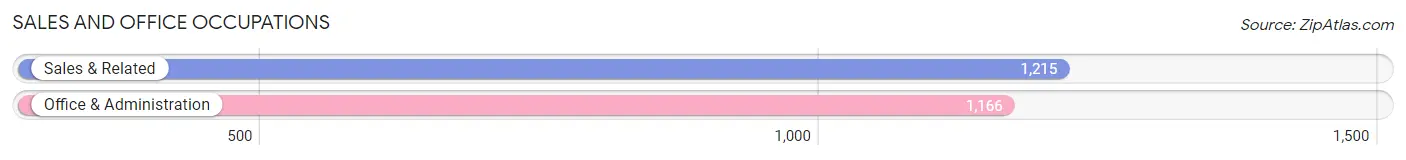
Sales and Office Occupations
The most common Sales and Office occupations in Auburn are Sales & Related (1,215 | 11.0%), and Office & Administration (1,166 | 10.6%).
Sales and Office Occupations by Sex
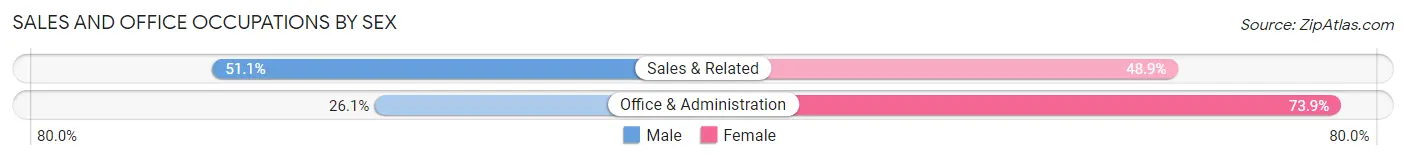
| Occupation | Male | Female |
| Sales & Related | 621 (51.1%) | 594 (48.9%) |
| Office & Administration | 304 (26.1%) | 862 (73.9%) |
| Total (Category) | 925 (38.9%) | 1,456 (61.2%) |
| Total (Overall) | 5,684 (51.5%) | 5,354 (48.5%) |
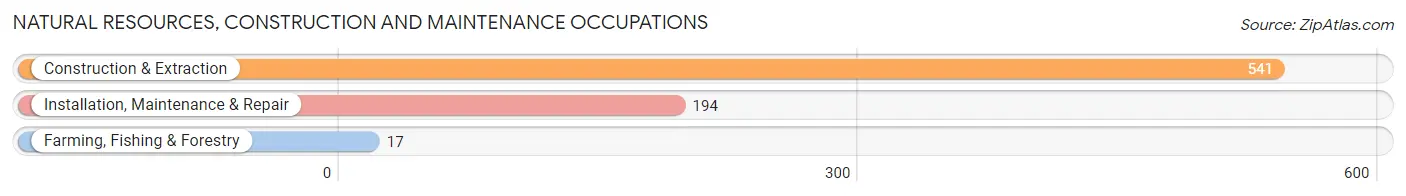
Natural Resources, Construction and Maintenance Occupations
The most common Natural Resources, Construction and Maintenance occupations in Auburn are Construction & Extraction (541 | 4.9%), Installation, Maintenance & Repair (194 | 1.8%), and Farming, Fishing & Forestry (17 | 0.2%).
Natural Resources, Construction and Maintenance Occupations by Sex
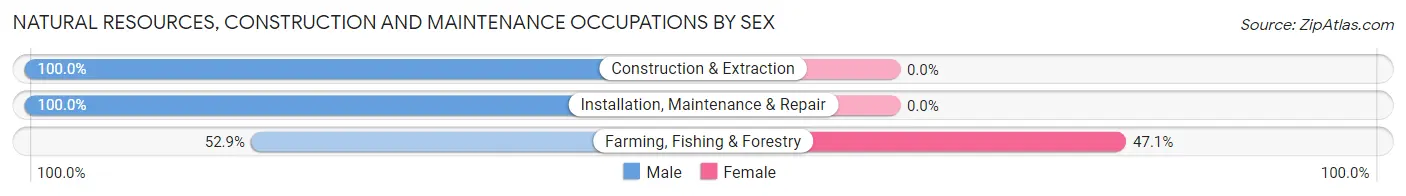
| Occupation | Male | Female |
| Farming, Fishing & Forestry | 9 (52.9%) | 8 (47.1%) |
| Construction & Extraction | 541 (100.0%) | 0 (0.0%) |
| Installation, Maintenance & Repair | 194 (100.0%) | 0 (0.0%) |
| Total (Category) | 744 (98.9%) | 8 (1.1%) |
| Total (Overall) | 5,684 (51.5%) | 5,354 (48.5%) |
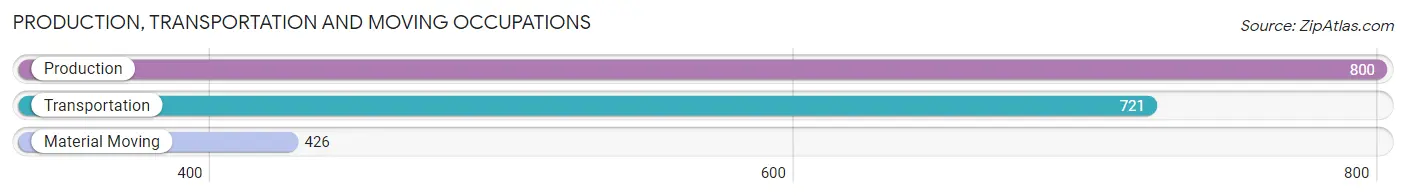
Production, Transportation and Moving Occupations
The most common Production, Transportation and Moving occupations in Auburn are Production (800 | 7.2%), Transportation (721 | 6.5%), and Material Moving (426 | 3.9%).
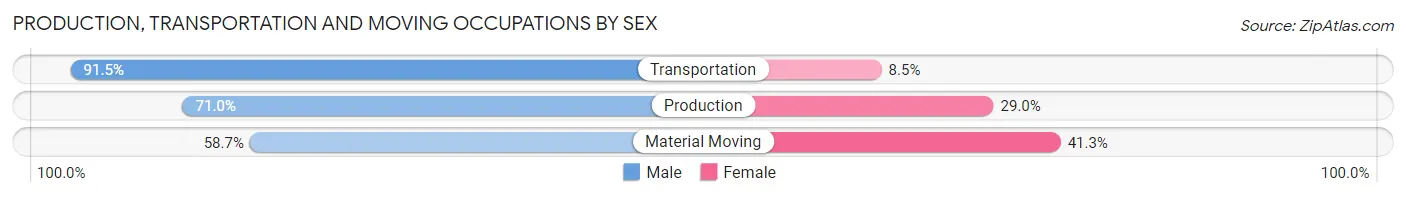
Production, Transportation and Moving Occupations by Sex
| Occupation | Male | Female |
| Production | 568 (71.0%) | 232 (29.0%) |
| Transportation | 660 (91.5%) | 61 (8.5%) |
| Material Moving | 250 (58.7%) | 176 (41.3%) |
| Total (Category) | 1,478 (75.9%) | 469 (24.1%) |
| Total (Overall) | 5,684 (51.5%) | 5,354 (48.5%) |
Employment Industries by Sex in Auburn
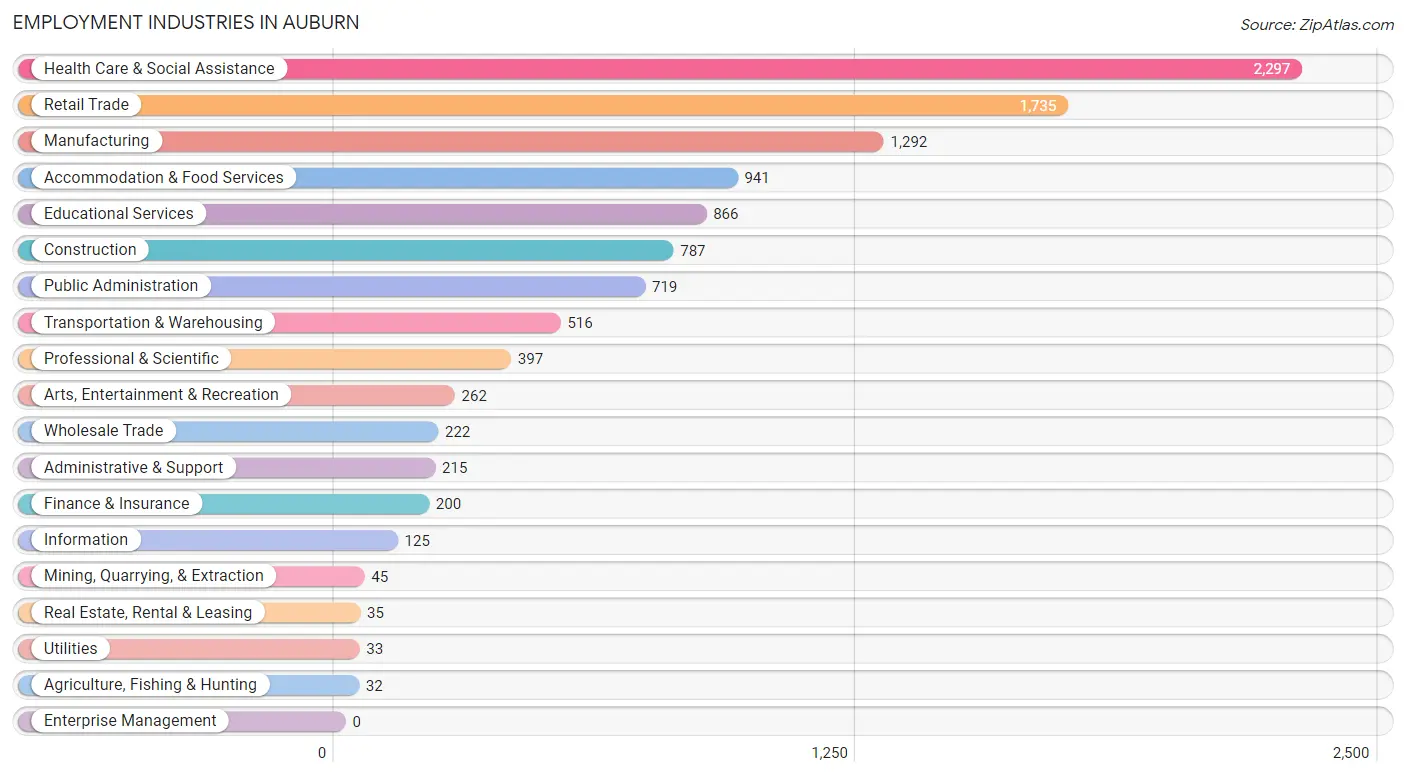
Employment Industries in Auburn
The major employment industries in Auburn include Health Care & Social Assistance (2,297 | 20.8%), Retail Trade (1,735 | 15.7%), Manufacturing (1,292 | 11.7%), Accommodation & Food Services (941 | 8.5%), and Educational Services (866 | 7.9%).
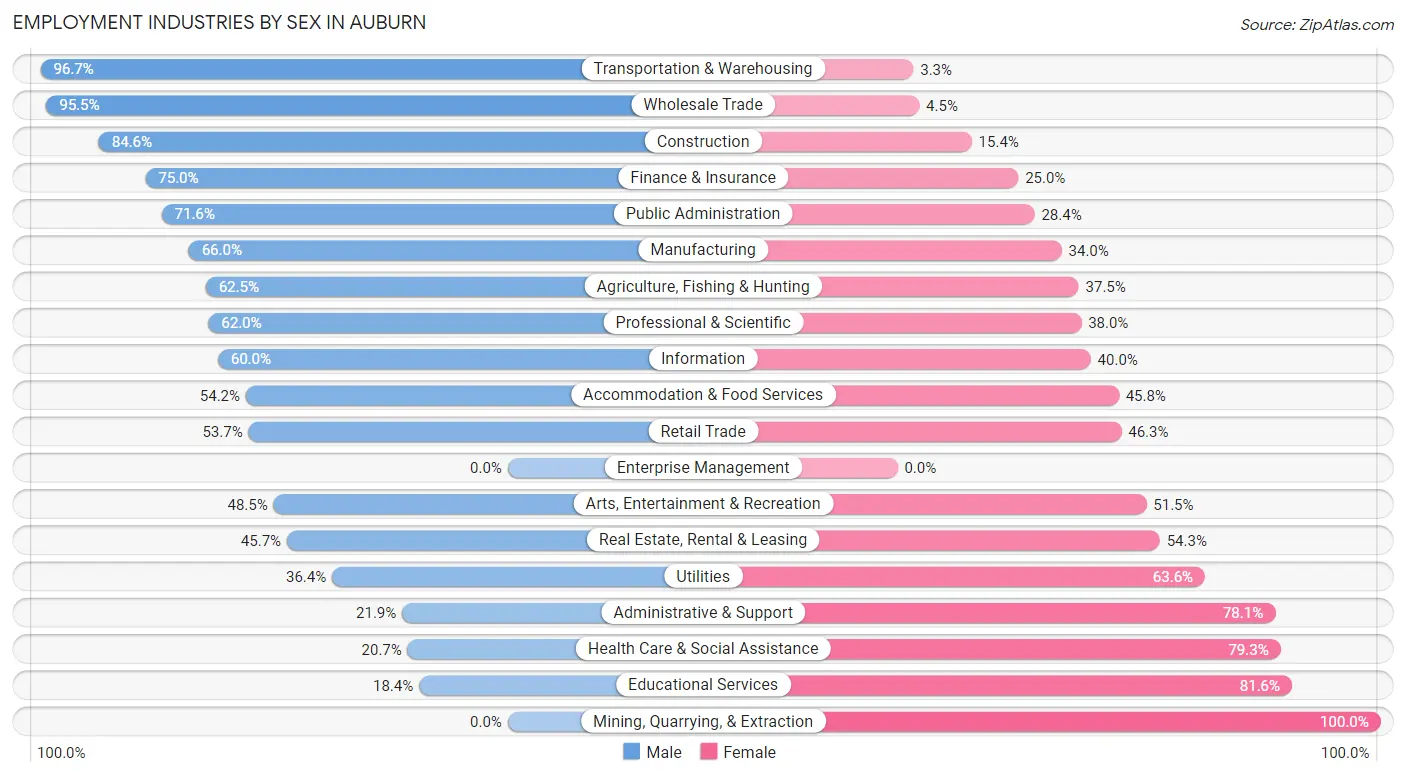
Employment Industries by Sex in Auburn
The Auburn industries that see more men than women are Transportation & Warehousing (96.7%), Wholesale Trade (95.5%), and Construction (84.6%), whereas the industries that tend to have a higher number of women are Mining, Quarrying, & Extraction (100.0%), Educational Services (81.6%), and Health Care & Social Assistance (79.3%).
| Industry | Male | Female |
| Agriculture, Fishing & Hunting | 20 (62.5%) | 12 (37.5%) |
| Mining, Quarrying, & Extraction | 0 (0.0%) | 45 (100.0%) |
| Construction | 666 (84.6%) | 121 (15.4%) |
| Manufacturing | 853 (66.0%) | 439 (34.0%) |
| Wholesale Trade | 212 (95.5%) | 10 (4.5%) |
| Retail Trade | 931 (53.7%) | 804 (46.3%) |
| Transportation & Warehousing | 499 (96.7%) | 17 (3.3%) |
| Utilities | 12 (36.4%) | 21 (63.6%) |
| Information | 75 (60.0%) | 50 (40.0%) |
| Finance & Insurance | 150 (75.0%) | 50 (25.0%) |
| Real Estate, Rental & Leasing | 16 (45.7%) | 19 (54.3%) |
| Professional & Scientific | 246 (62.0%) | 151 (38.0%) |
| Enterprise Management | 0 (0.0%) | 0 (0.0%) |
| Administrative & Support | 47 (21.9%) | 168 (78.1%) |
| Educational Services | 159 (18.4%) | 707 (81.6%) |
| Health Care & Social Assistance | 476 (20.7%) | 1,821 (79.3%) |
| Arts, Entertainment & Recreation | 127 (48.5%) | 135 (51.5%) |
| Accommodation & Food Services | 510 (54.2%) | 431 (45.8%) |
| Public Administration | 515 (71.6%) | 204 (28.4%) |
| Total | 5,684 (51.5%) | 5,354 (48.5%) |
Education in Auburn
School Enrollment in Auburn
The most common levels of schooling among the 4,574 students in Auburn are high school (1,041 | 22.8%), middle school (923 | 20.2%), and elementary school (833 | 18.2%).
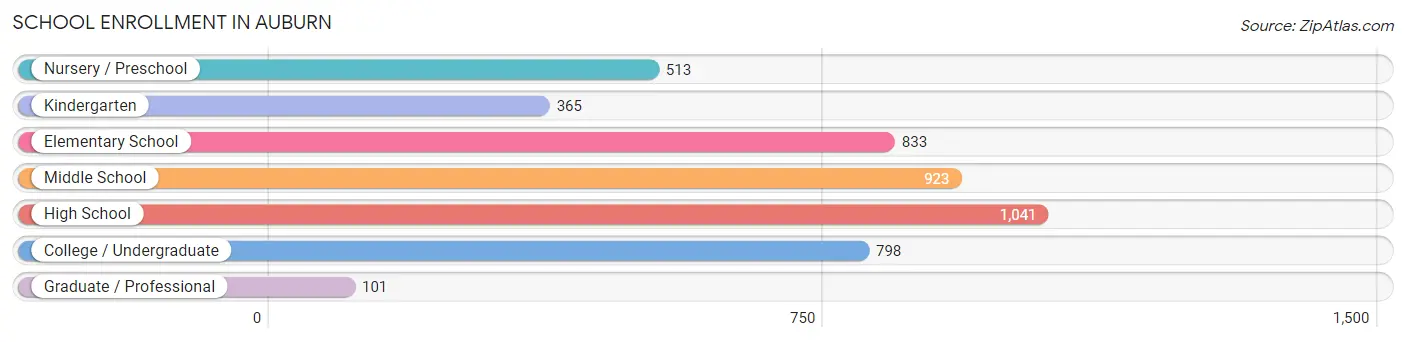
| School Level | # Students | % Students |
| Nursery / Preschool | 513 | 11.2% |
| Kindergarten | 365 | 8.0% |
| Elementary School | 833 | 18.2% |
| Middle School | 923 | 20.2% |
| High School | 1,041 | 22.8% |
| College / Undergraduate | 798 | 17.4% |
| Graduate / Professional | 101 | 2.2% |
| Total | 4,574 | 100.0% |
School Enrollment by Age by Funding Source in Auburn
Out of a total of 4,574 students who are enrolled in schools in Auburn, 453 (9.9%) attend a private institution, while the remaining 4,121 (90.1%) are enrolled in public schools. The age group of 25 to 34 year olds has the highest likelihood of being enrolled in private schools, with 72 (42.1% in the age bracket) enrolled. Conversely, the age group of 15 to 17 year olds has the lowest likelihood of being enrolled in a private school, with 722 (98.0% in the age bracket) attending a public institution.
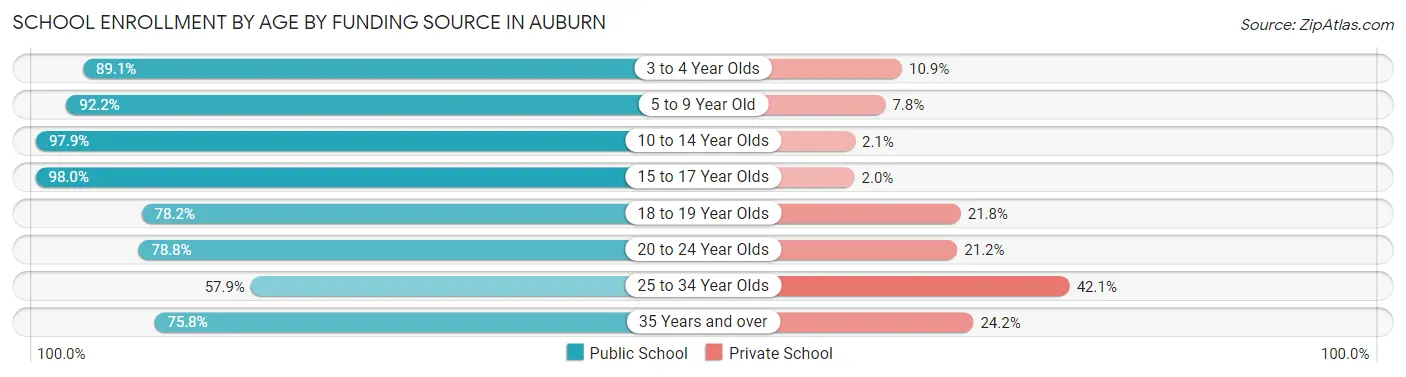
| Age Bracket | Public School | Private School |
| 3 to 4 Year Olds | 459 (89.1%) | 56 (10.9%) |
| 5 to 9 Year Old | 1,053 (92.2%) | 89 (7.8%) |
| 10 to 14 Year Olds | 1,110 (97.9%) | 24 (2.1%) |
| 15 to 17 Year Olds | 722 (98.0%) | 15 (2.0%) |
| 18 to 19 Year Olds | 294 (78.2%) | 82 (21.8%) |
| 20 to 24 Year Olds | 201 (78.8%) | 54 (21.2%) |
| 25 to 34 Year Olds | 99 (57.9%) | 72 (42.1%) |
| 35 Years and over | 185 (75.8%) | 59 (24.2%) |
| Total | 4,121 (90.1%) | 453 (9.9%) |
Educational Attainment by Field of Study in Auburn
Business (807 | 19.8%), education (516 | 12.7%), arts & humanities (489 | 12.0%), science & technology (357 | 8.8%), and social sciences (324 | 8.0%) are the most common fields of study among 4,068 individuals in Auburn who have obtained a bachelor's degree or higher.
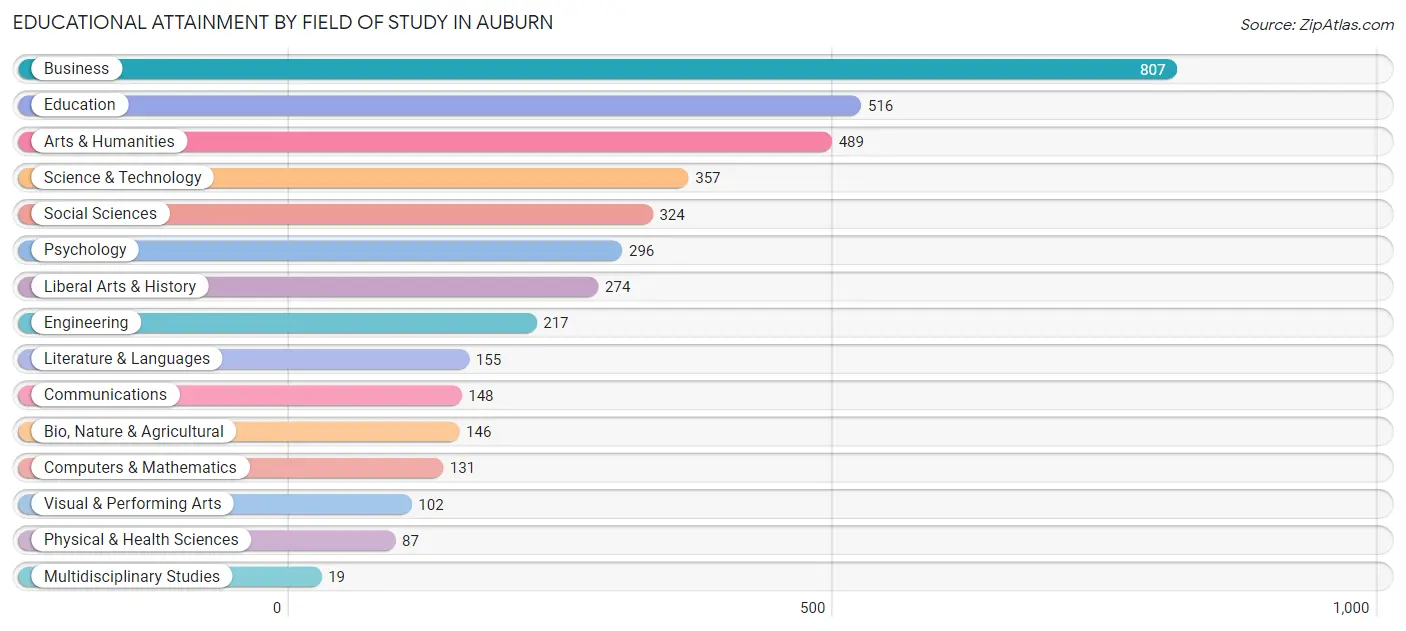
| Field of Study | # Graduates | % Graduates |
| Computers & Mathematics | 131 | 3.2% |
| Bio, Nature & Agricultural | 146 | 3.6% |
| Physical & Health Sciences | 87 | 2.1% |
| Psychology | 296 | 7.3% |
| Social Sciences | 324 | 8.0% |
| Engineering | 217 | 5.3% |
| Multidisciplinary Studies | 19 | 0.5% |
| Science & Technology | 357 | 8.8% |
| Business | 807 | 19.8% |
| Education | 516 | 12.7% |
| Literature & Languages | 155 | 3.8% |
| Liberal Arts & History | 274 | 6.7% |
| Visual & Performing Arts | 102 | 2.5% |
| Communications | 148 | 3.6% |
| Arts & Humanities | 489 | 12.0% |
| Total | 4,068 | 100.0% |
Transportation & Commute in Auburn
Vehicle Availability by Sex in Auburn
The most prevalent vehicle ownership categories in Auburn are males with 2 vehicles (2,638, accounting for 46.8%) and females with 2 vehicles (2,079, making up 51.2%).
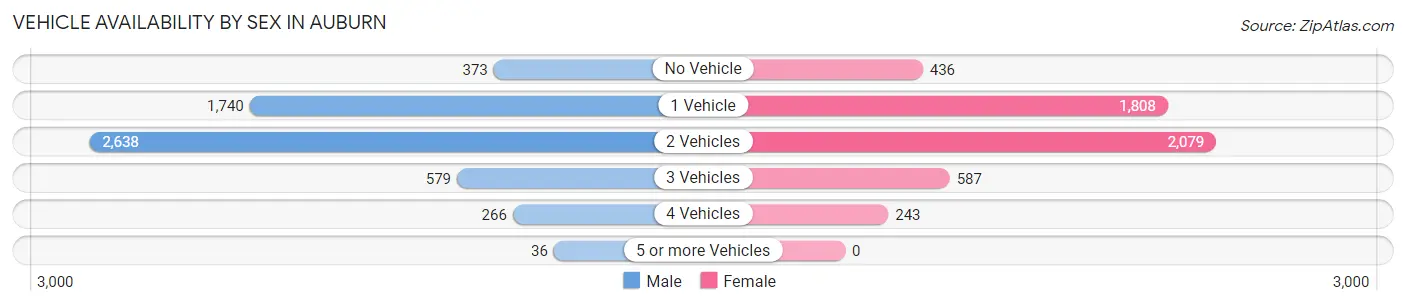
| Vehicles Available | Male | Female |
| No Vehicle | 373 (6.6%) | 436 (8.5%) |
| 1 Vehicle | 1,740 (30.9%) | 1,808 (35.1%) |
| 2 Vehicles | 2,638 (46.8%) | 2,079 (40.4%) |
| 3 Vehicles | 579 (10.3%) | 587 (11.4%) |
| 4 Vehicles | 266 (4.7%) | 243 (4.7%) |
| 5 or more Vehicles | 36 (0.6%) | 0 (0.0%) |
| Total | 5,632 (100.0%) | 5,153 (100.0%) |
Commute Time in Auburn
The most frequently occuring commute durations in Auburn are 5 to 9 minutes (2,905 commuters, 27.8%), 10 to 14 minutes (1,997 commuters, 19.1%), and 15 to 19 minutes (1,260 commuters, 12.0%).
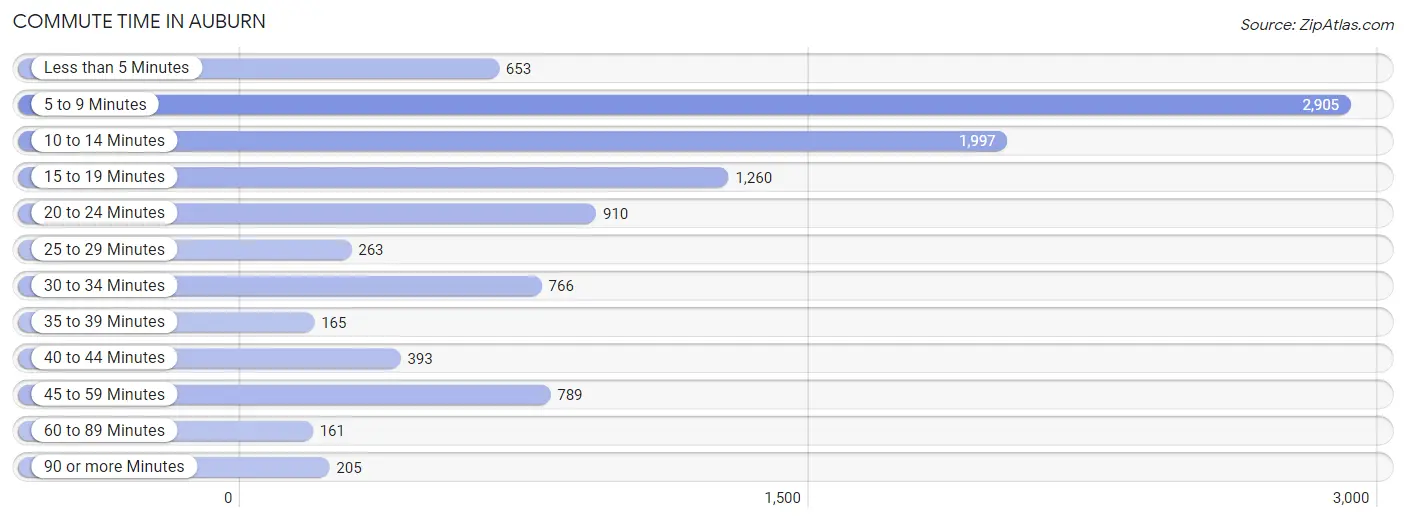
| Commute Time | # Commuters | % Commuters |
| Less than 5 Minutes | 653 | 6.2% |
| 5 to 9 Minutes | 2,905 | 27.8% |
| 10 to 14 Minutes | 1,997 | 19.1% |
| 15 to 19 Minutes | 1,260 | 12.0% |
| 20 to 24 Minutes | 910 | 8.7% |
| 25 to 29 Minutes | 263 | 2.5% |
| 30 to 34 Minutes | 766 | 7.3% |
| 35 to 39 Minutes | 165 | 1.6% |
| 40 to 44 Minutes | 393 | 3.7% |
| 45 to 59 Minutes | 789 | 7.5% |
| 60 to 89 Minutes | 161 | 1.5% |
| 90 or more Minutes | 205 | 2.0% |
Commute Time by Sex in Auburn
The most common commute times in Auburn are 5 to 9 minutes (1,247 commuters, 22.7%) for males and 5 to 9 minutes (1,658 commuters, 33.4%) for females.
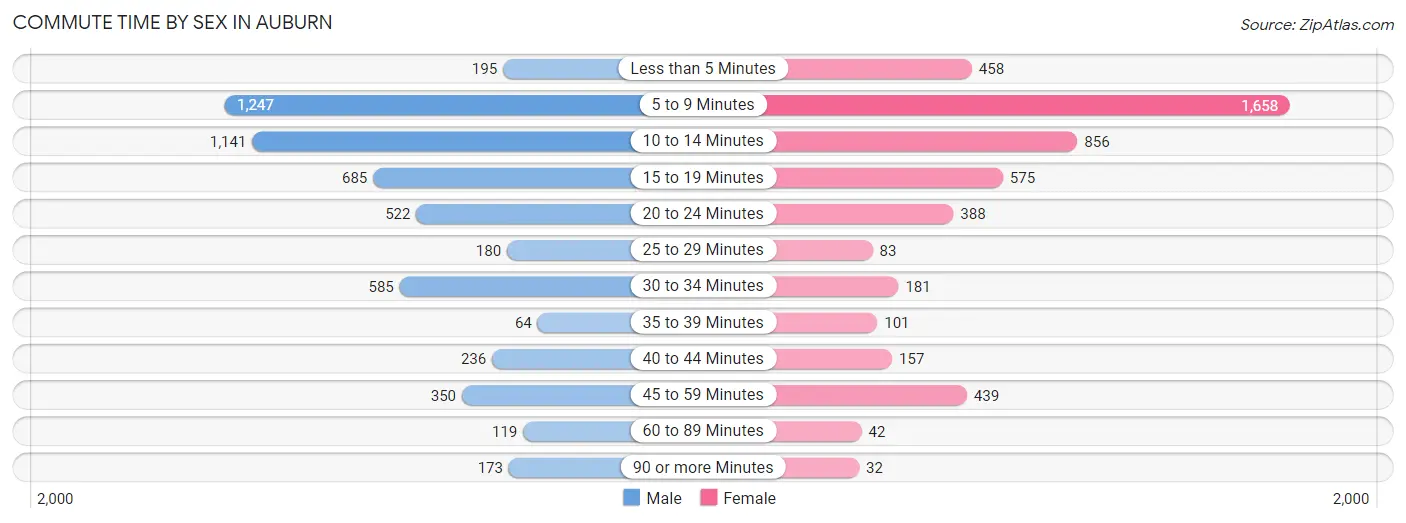
| Commute Time | Male | Female |
| Less than 5 Minutes | 195 (3.5%) | 458 (9.2%) |
| 5 to 9 Minutes | 1,247 (22.7%) | 1,658 (33.4%) |
| 10 to 14 Minutes | 1,141 (20.8%) | 856 (17.2%) |
| 15 to 19 Minutes | 685 (12.5%) | 575 (11.6%) |
| 20 to 24 Minutes | 522 (9.5%) | 388 (7.8%) |
| 25 to 29 Minutes | 180 (3.3%) | 83 (1.7%) |
| 30 to 34 Minutes | 585 (10.6%) | 181 (3.6%) |
| 35 to 39 Minutes | 64 (1.2%) | 101 (2.0%) |
| 40 to 44 Minutes | 236 (4.3%) | 157 (3.2%) |
| 45 to 59 Minutes | 350 (6.4%) | 439 (8.8%) |
| 60 to 89 Minutes | 119 (2.2%) | 42 (0.9%) |
| 90 or more Minutes | 173 (3.2%) | 32 (0.6%) |
Time of Departure to Work by Sex in Auburn
The most frequent times of departure to work in Auburn are 12:00 PM to 3:59 PM (894, 16.3%) for males and 6:30 AM to 6:59 AM (881, 17.7%) for females.
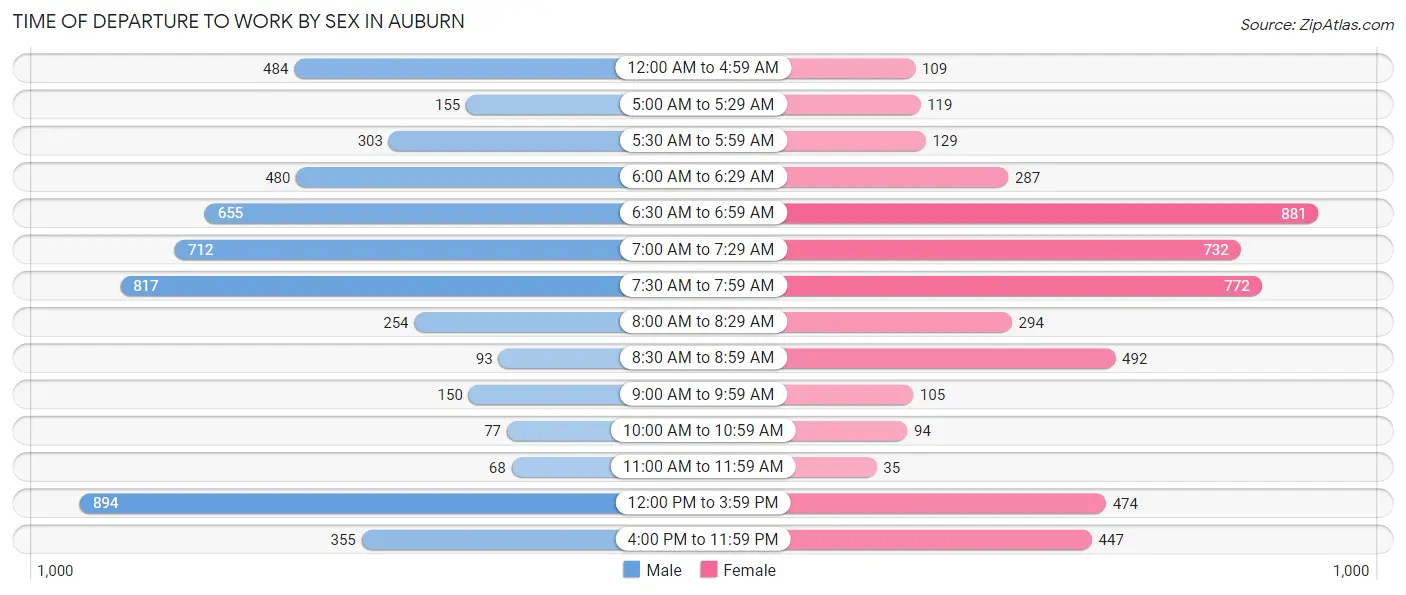
| Time of Departure | Male | Female |
| 12:00 AM to 4:59 AM | 484 (8.8%) | 109 (2.2%) |
| 5:00 AM to 5:29 AM | 155 (2.8%) | 119 (2.4%) |
| 5:30 AM to 5:59 AM | 303 (5.5%) | 129 (2.6%) |
| 6:00 AM to 6:29 AM | 480 (8.7%) | 287 (5.8%) |
| 6:30 AM to 6:59 AM | 655 (11.9%) | 881 (17.7%) |
| 7:00 AM to 7:29 AM | 712 (13.0%) | 732 (14.7%) |
| 7:30 AM to 7:59 AM | 817 (14.9%) | 772 (15.5%) |
| 8:00 AM to 8:29 AM | 254 (4.6%) | 294 (5.9%) |
| 8:30 AM to 8:59 AM | 93 (1.7%) | 492 (9.9%) |
| 9:00 AM to 9:59 AM | 150 (2.7%) | 105 (2.1%) |
| 10:00 AM to 10:59 AM | 77 (1.4%) | 94 (1.9%) |
| 11:00 AM to 11:59 AM | 68 (1.2%) | 35 (0.7%) |
| 12:00 PM to 3:59 PM | 894 (16.3%) | 474 (9.5%) |
| 4:00 PM to 11:59 PM | 355 (6.5%) | 447 (9.0%) |
| Total | 5,497 (100.0%) | 4,970 (100.0%) |
Housing Occupancy in Auburn
Occupancy by Ownership in Auburn
Of the total 11,544 dwellings in Auburn, owner-occupied units account for 5,187 (44.9%), while renter-occupied units make up 6,357 (55.1%).
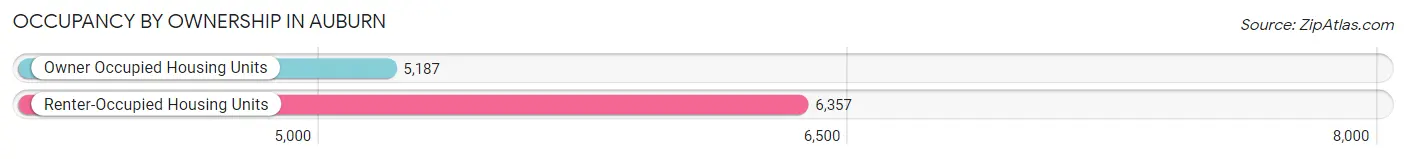
| Occupancy | # Housing Units | % Housing Units |
| Owner Occupied Housing Units | 5,187 | 44.9% |
| Renter-Occupied Housing Units | 6,357 | 55.1% |
| Total Occupied Housing Units | 11,544 | 100.0% |
Occupancy by Household Size in Auburn
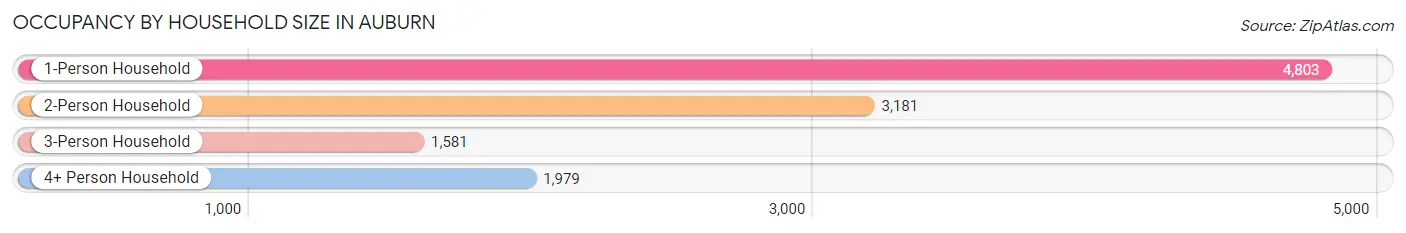
| Household Size | # Housing Units | % Housing Units |
| 1-Person Household | 4,803 | 41.6% |
| 2-Person Household | 3,181 | 27.6% |
| 3-Person Household | 1,581 | 13.7% |
| 4+ Person Household | 1,979 | 17.1% |
| Total Housing Units | 11,544 | 100.0% |
Occupancy by Ownership by Household Size in Auburn
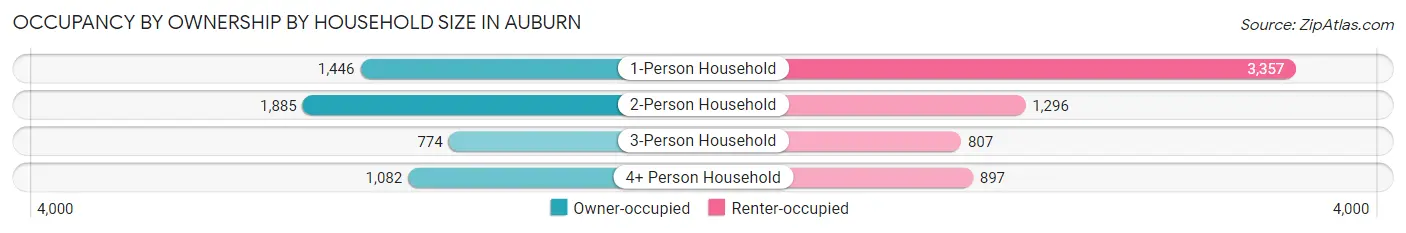
| Household Size | Owner-occupied | Renter-occupied |
| 1-Person Household | 1,446 (30.1%) | 3,357 (69.9%) |
| 2-Person Household | 1,885 (59.3%) | 1,296 (40.7%) |
| 3-Person Household | 774 (49.0%) | 807 (51.0%) |
| 4+ Person Household | 1,082 (54.7%) | 897 (45.3%) |
| Total Housing Units | 5,187 (44.9%) | 6,357 (55.1%) |
Occupancy by Educational Attainment in Auburn
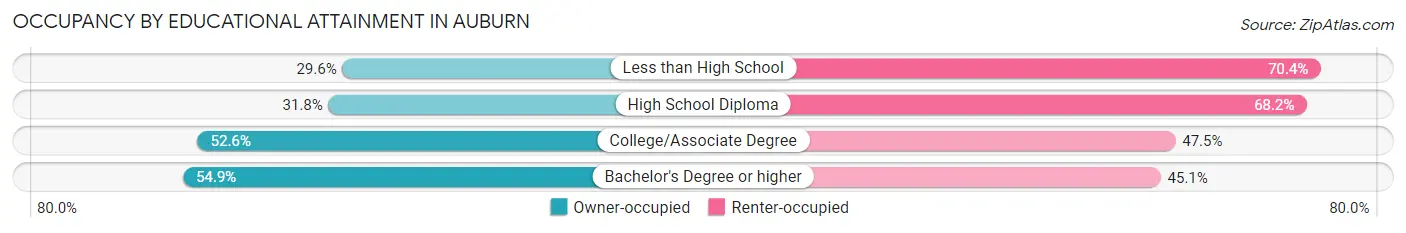
| Household Size | Owner-occupied | Renter-occupied |
| Less than High School | 326 (29.6%) | 776 (70.4%) |
| High School Diploma | 1,053 (31.8%) | 2,259 (68.2%) |
| College/Associate Degree | 2,363 (52.5%) | 2,134 (47.4%) |
| Bachelor's Degree or higher | 1,445 (54.9%) | 1,188 (45.1%) |
Occupancy by Age of Householder in Auburn
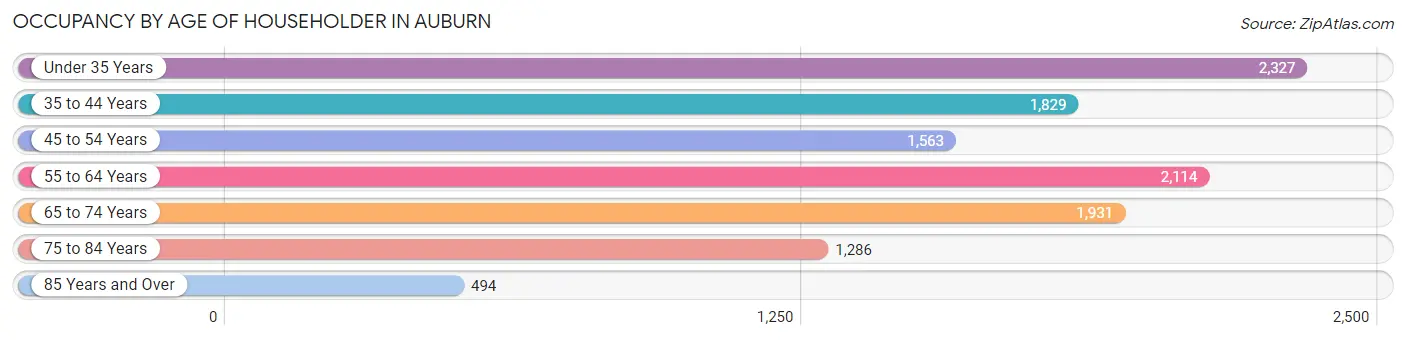
| Age Bracket | # Households | % Households |
| Under 35 Years | 2,327 | 20.2% |
| 35 to 44 Years | 1,829 | 15.8% |
| 45 to 54 Years | 1,563 | 13.5% |
| 55 to 64 Years | 2,114 | 18.3% |
| 65 to 74 Years | 1,931 | 16.7% |
| 75 to 84 Years | 1,286 | 11.1% |
| 85 Years and Over | 494 | 4.3% |
| Total | 11,544 | 100.0% |
Housing Finances in Auburn
Median Income by Occupancy in Auburn
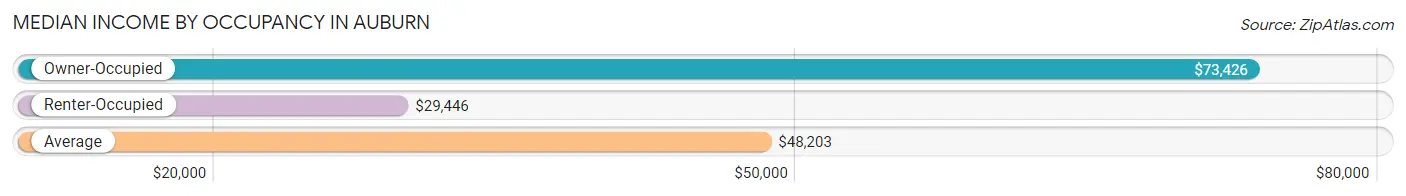
| Occupancy Type | # Households | Median Income |
| Owner-Occupied | 5,187 (44.9%) | $73,426 |
| Renter-Occupied | 6,357 (55.1%) | $29,446 |
| Average | 11,544 (100.0%) | $48,203 |
Occupancy by Householder Income Bracket in Auburn
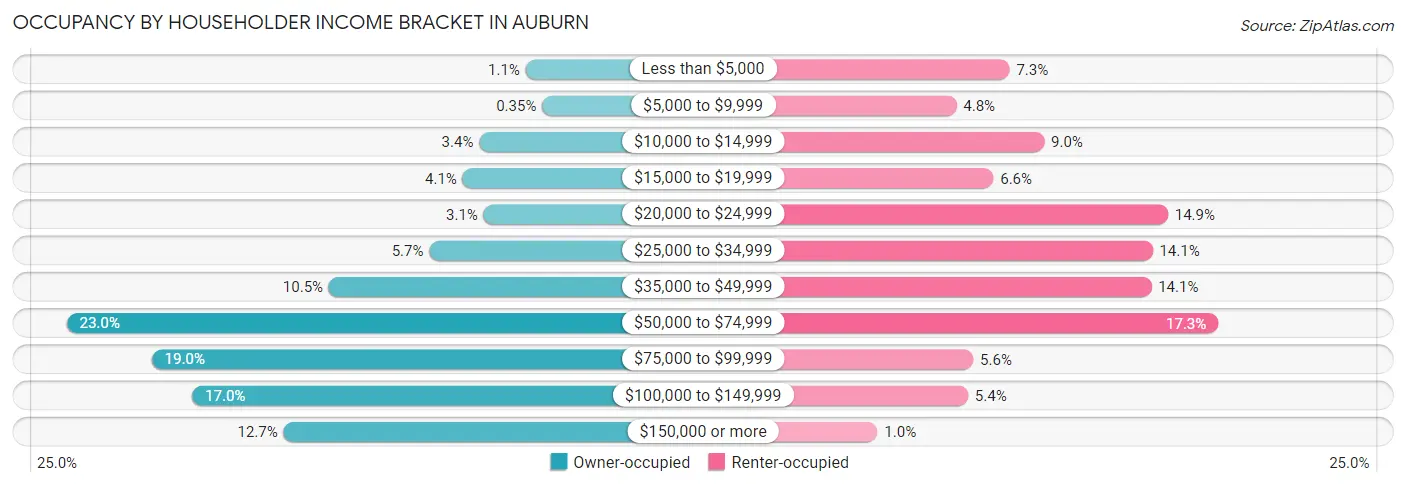
| Income Bracket | Owner-occupied | Renter-occupied |
| Less than $5,000 | 59 (1.1%) | 466 (7.3%) |
| $5,000 to $9,999 | 18 (0.4%) | 305 (4.8%) |
| $10,000 to $14,999 | 174 (3.4%) | 571 (9.0%) |
| $15,000 to $19,999 | 215 (4.1%) | 417 (6.6%) |
| $20,000 to $24,999 | 163 (3.1%) | 945 (14.9%) |
| $25,000 to $34,999 | 297 (5.7%) | 899 (14.1%) |
| $35,000 to $49,999 | 545 (10.5%) | 895 (14.1%) |
| $50,000 to $74,999 | 1,193 (23.0%) | 1,097 (17.3%) |
| $75,000 to $99,999 | 983 (19.0%) | 356 (5.6%) |
| $100,000 to $149,999 | 883 (17.0%) | 340 (5.3%) |
| $150,000 or more | 657 (12.7%) | 66 (1.0%) |
| Total | 5,187 (100.0%) | 6,357 (100.0%) |
Monthly Housing Cost Tiers in Auburn
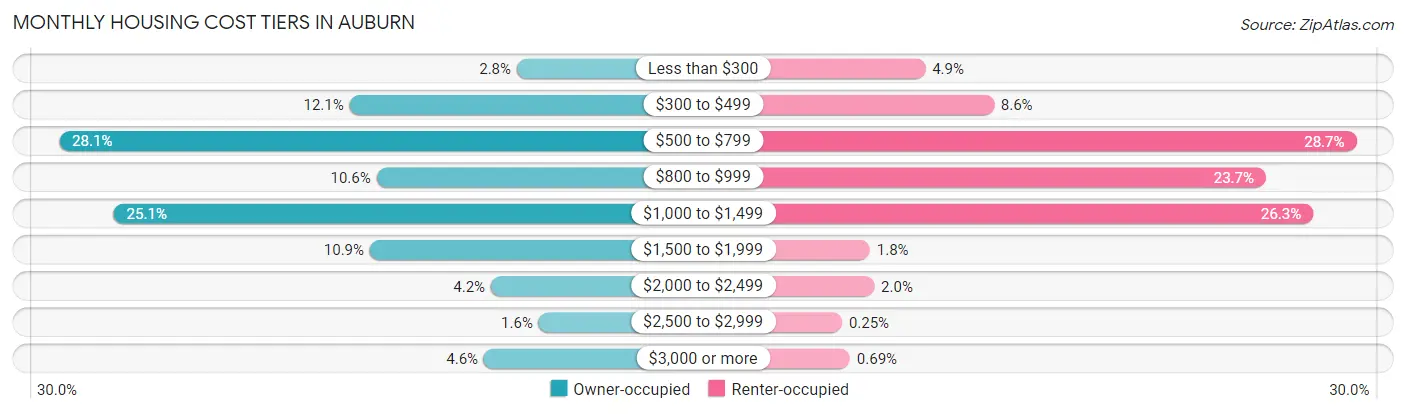
| Monthly Cost | Owner-occupied | Renter-occupied |
| Less than $300 | 146 (2.8%) | 308 (4.9%) |
| $300 to $499 | 625 (12.0%) | 549 (8.6%) |
| $500 to $799 | 1,457 (28.1%) | 1,822 (28.7%) |
| $800 to $999 | 548 (10.6%) | 1,504 (23.7%) |
| $1,000 to $1,499 | 1,301 (25.1%) | 1,670 (26.3%) |
| $1,500 to $1,999 | 567 (10.9%) | 114 (1.8%) |
| $2,000 to $2,499 | 220 (4.2%) | 129 (2.0%) |
| $2,500 to $2,999 | 83 (1.6%) | 16 (0.3%) |
| $3,000 or more | 240 (4.6%) | 44 (0.7%) |
| Total | 5,187 (100.0%) | 6,357 (100.0%) |
Physical Housing Characteristics in Auburn
Housing Structures in Auburn
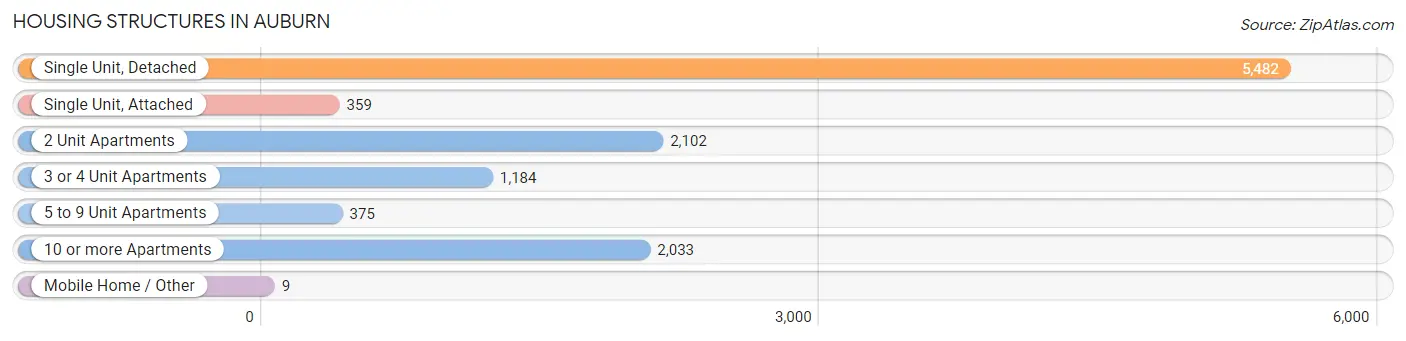
| Structure Type | # Housing Units | % Housing Units |
| Single Unit, Detached | 5,482 | 47.5% |
| Single Unit, Attached | 359 | 3.1% |
| 2 Unit Apartments | 2,102 | 18.2% |
| 3 or 4 Unit Apartments | 1,184 | 10.3% |
| 5 to 9 Unit Apartments | 375 | 3.3% |
| 10 or more Apartments | 2,033 | 17.6% |
| Mobile Home / Other | 9 | 0.1% |
| Total | 11,544 | 100.0% |
Housing Structures by Occupancy in Auburn
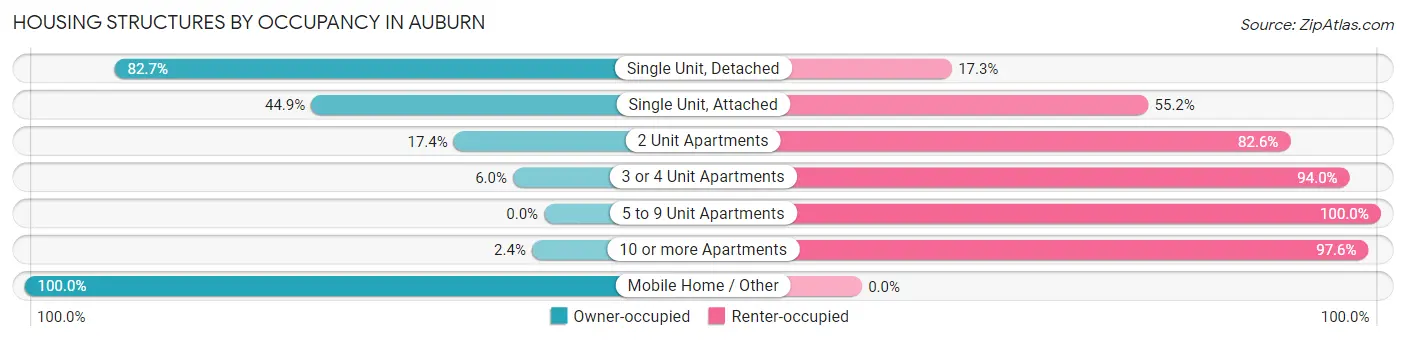
| Structure Type | Owner-occupied | Renter-occupied |
| Single Unit, Detached | 4,532 (82.7%) | 950 (17.3%) |
| Single Unit, Attached | 161 (44.9%) | 198 (55.1%) |
| 2 Unit Apartments | 366 (17.4%) | 1,736 (82.6%) |
| 3 or 4 Unit Apartments | 71 (6.0%) | 1,113 (94.0%) |
| 5 to 9 Unit Apartments | 0 (0.0%) | 375 (100.0%) |
| 10 or more Apartments | 48 (2.4%) | 1,985 (97.6%) |
| Mobile Home / Other | 9 (100.0%) | 0 (0.0%) |
| Total | 5,187 (44.9%) | 6,357 (55.1%) |
Housing Structures by Number of Rooms in Auburn
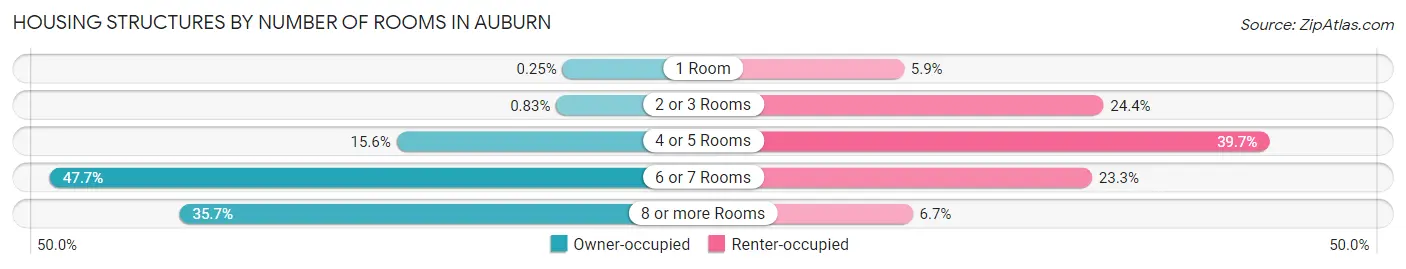
| Number of Rooms | Owner-occupied | Renter-occupied |
| 1 Room | 13 (0.3%) | 376 (5.9%) |
| 2 or 3 Rooms | 43 (0.8%) | 1,549 (24.4%) |
| 4 or 5 Rooms | 809 (15.6%) | 2,524 (39.7%) |
| 6 or 7 Rooms | 2,472 (47.7%) | 1,481 (23.3%) |
| 8 or more Rooms | 1,850 (35.7%) | 427 (6.7%) |
| Total | 5,187 (100.0%) | 6,357 (100.0%) |
Housing Structure by Heating Type in Auburn
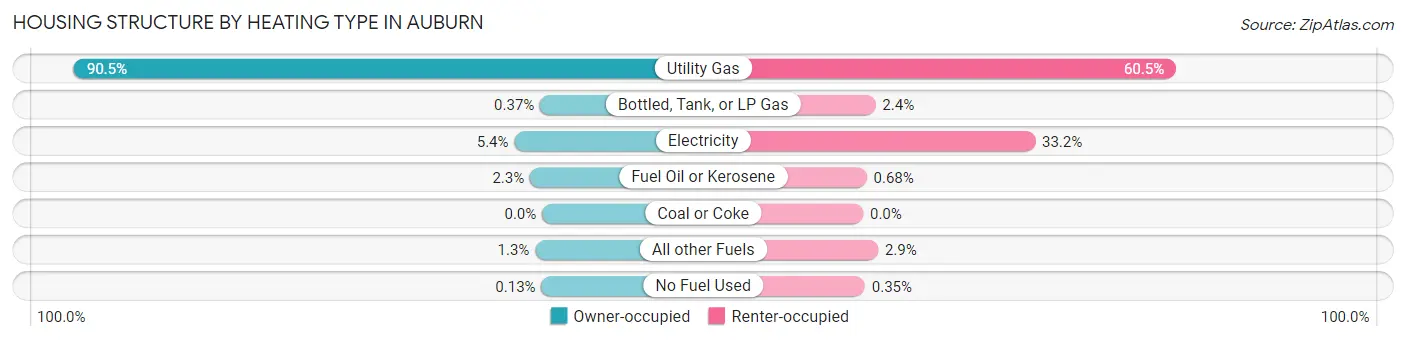
| Heating Type | Owner-occupied | Renter-occupied |
| Utility Gas | 4,693 (90.5%) | 3,844 (60.5%) |
| Bottled, Tank, or LP Gas | 19 (0.4%) | 152 (2.4%) |
| Electricity | 278 (5.4%) | 2,113 (33.2%) |
| Fuel Oil or Kerosene | 121 (2.3%) | 43 (0.7%) |
| Coal or Coke | 0 (0.0%) | 0 (0.0%) |
| All other Fuels | 69 (1.3%) | 183 (2.9%) |
| No Fuel Used | 7 (0.1%) | 22 (0.4%) |
| Total | 5,187 (100.0%) | 6,357 (100.0%) |
Household Vehicle Usage in Auburn
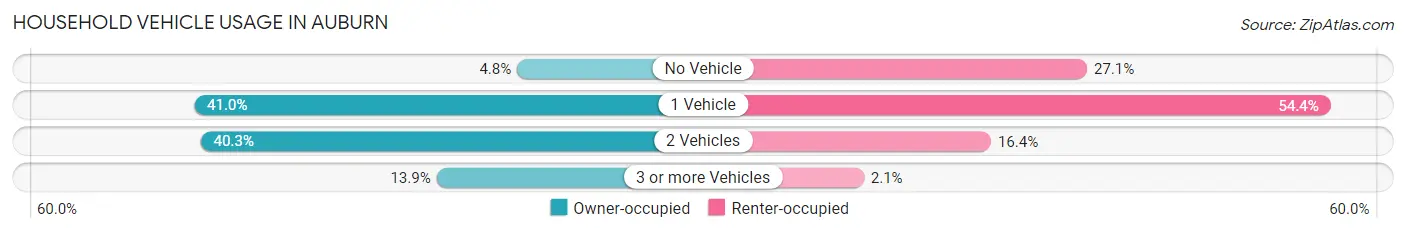
| Vehicles per Household | Owner-occupied | Renter-occupied |
| No Vehicle | 251 (4.8%) | 1,724 (27.1%) |
| 1 Vehicle | 2,127 (41.0%) | 3,458 (54.4%) |
| 2 Vehicles | 2,090 (40.3%) | 1,040 (16.4%) |
| 3 or more Vehicles | 719 (13.9%) | 135 (2.1%) |
| Total | 5,187 (100.0%) | 6,357 (100.0%) |
Real Estate & Mortgages in Auburn
Real Estate and Mortgage Overview in Auburn
| Characteristic | Without Mortgage | With Mortgage |
| Housing Units | 2,305 | 2,882 |
| Median Property Value | $126,900 | $151,200 |
| Median Household Income | $52,914 | $408 |
| Monthly Housing Costs | $619 | $240 |
| Real Estate Taxes | $3,336 | $68 |
Property Value by Mortgage Status in Auburn
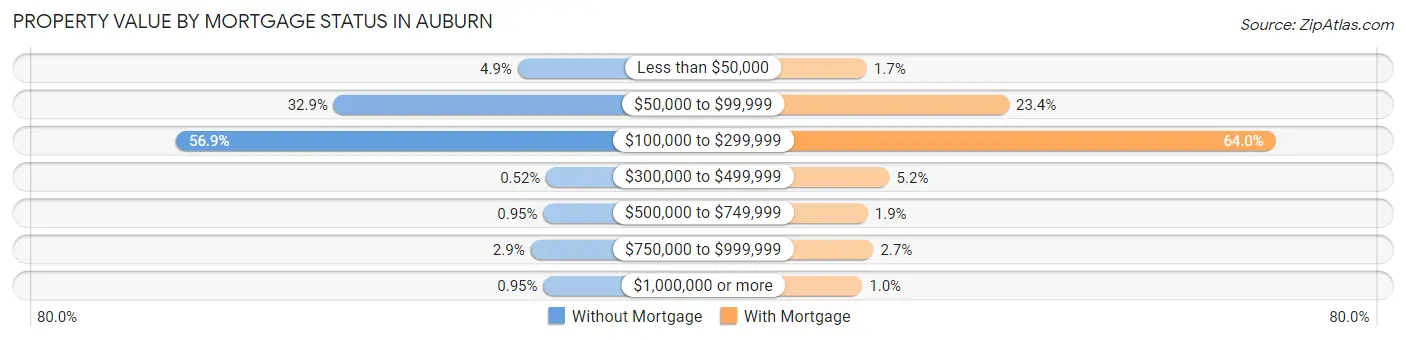
| Property Value | Without Mortgage | With Mortgage |
| Less than $50,000 | 112 (4.9%) | 50 (1.7%) |
| $50,000 to $99,999 | 758 (32.9%) | 674 (23.4%) |
| $100,000 to $299,999 | 1,312 (56.9%) | 1,845 (64.0%) |
| $300,000 to $499,999 | 12 (0.5%) | 150 (5.2%) |
| $500,000 to $749,999 | 22 (0.9%) | 54 (1.9%) |
| $750,000 to $999,999 | 67 (2.9%) | 79 (2.7%) |
| $1,000,000 or more | 22 (0.9%) | 30 (1.0%) |
| Total | 2,305 (100.0%) | 2,882 (100.0%) |
Household Income by Mortgage Status in Auburn
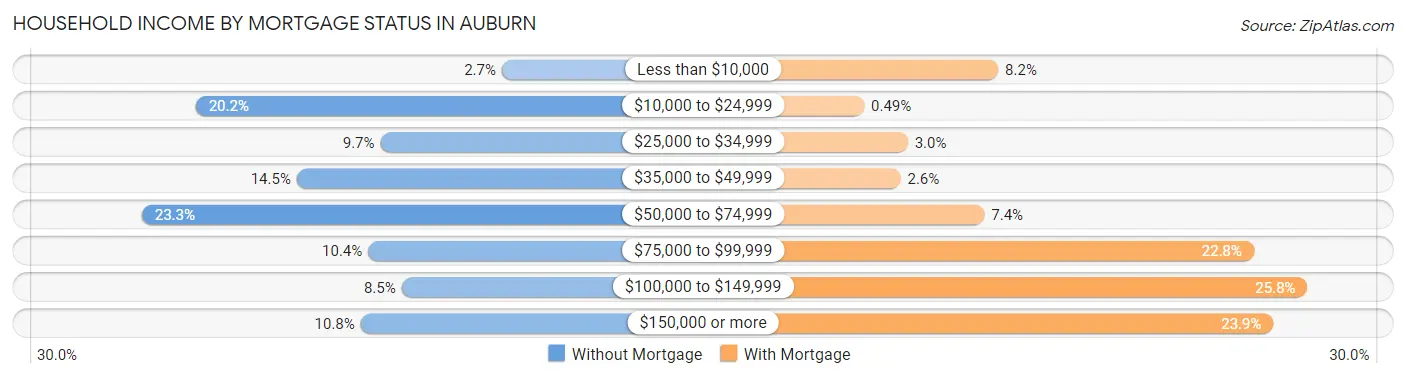
| Household Income | Without Mortgage | With Mortgage |
| Less than $10,000 | 63 (2.7%) | 235 (8.2%) |
| $10,000 to $24,999 | 466 (20.2%) | 14 (0.5%) |
| $25,000 to $34,999 | 223 (9.7%) | 86 (3.0%) |
| $35,000 to $49,999 | 333 (14.4%) | 74 (2.6%) |
| $50,000 to $74,999 | 537 (23.3%) | 212 (7.4%) |
| $75,000 to $99,999 | 239 (10.4%) | 656 (22.8%) |
| $100,000 to $149,999 | 195 (8.5%) | 744 (25.8%) |
| $150,000 or more | 249 (10.8%) | 688 (23.9%) |
| Total | 2,305 (100.0%) | 2,882 (100.0%) |
Property Value to Household Income Ratio in Auburn
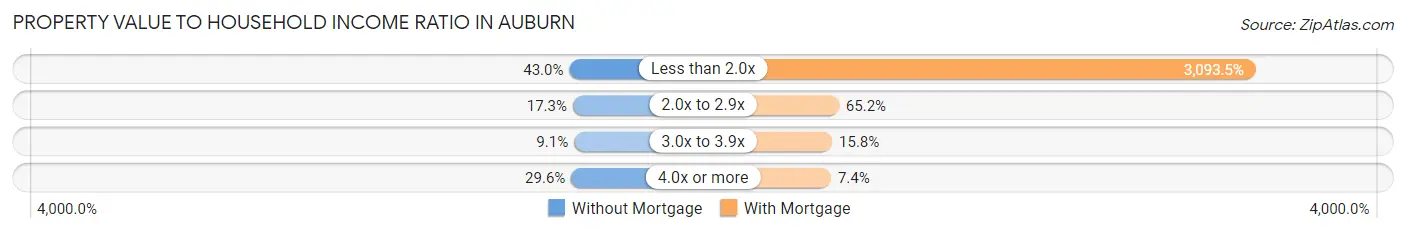
| Value-to-Income Ratio | Without Mortgage | With Mortgage |
| Less than 2.0x | 991 (43.0%) | 89,155 (3,093.5%) |
| 2.0x to 2.9x | 399 (17.3%) | 1,878 (65.2%) |
| 3.0x to 3.9x | 209 (9.1%) | 454 (15.8%) |
| 4.0x or more | 682 (29.6%) | 214 (7.4%) |
| Total | 2,305 (100.0%) | 2,882 (100.0%) |
Real Estate Taxes by Mortgage Status in Auburn
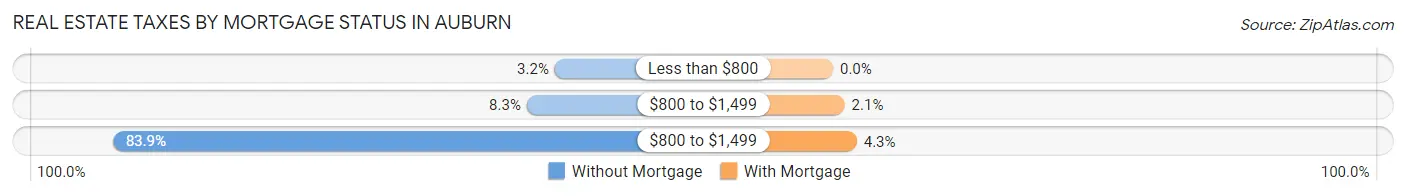
| Property Taxes | Without Mortgage | With Mortgage |
| Less than $800 | 73 (3.2%) | 0 (0.0%) |
| $800 to $1,499 | 191 (8.3%) | 61 (2.1%) |
| $800 to $1,499 | 1,934 (83.9%) | 125 (4.3%) |
| Total | 2,305 (100.0%) | 2,882 (100.0%) |
Health & Disability in Auburn
Health Insurance Coverage by Age in Auburn
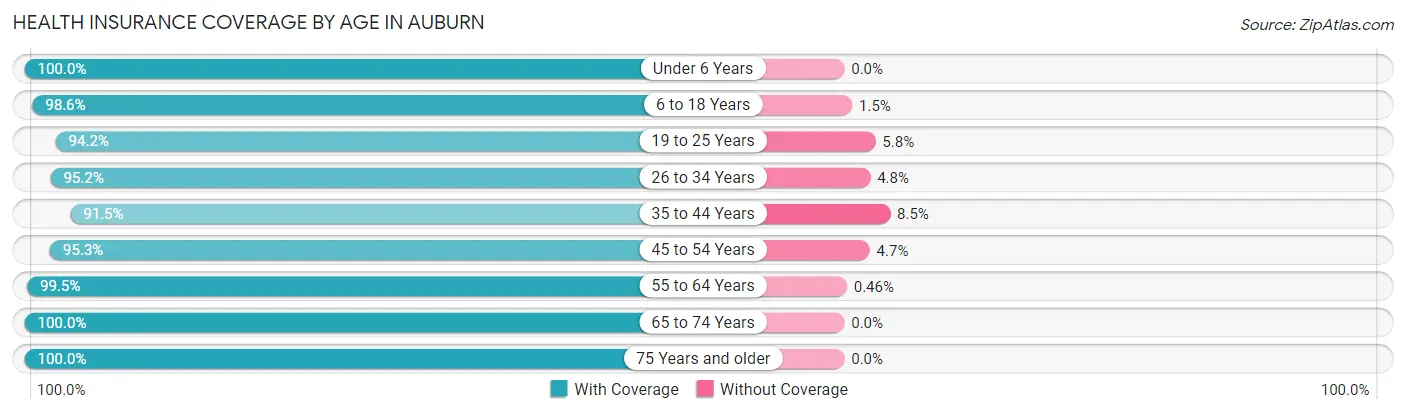
| Age Bracket | With Coverage | Without Coverage |
| Under 6 Years | 2,055 (100.0%) | 0 (0.0%) |
| 6 to 18 Years | 2,986 (98.6%) | 44 (1.5%) |
| 19 to 25 Years | 2,079 (94.2%) | 128 (5.8%) |
| 26 to 34 Years | 3,331 (95.2%) | 169 (4.8%) |
| 35 to 44 Years | 3,062 (91.5%) | 286 (8.5%) |
| 45 to 54 Years | 2,339 (95.3%) | 116 (4.7%) |
| 55 to 64 Years | 3,427 (99.5%) | 16 (0.5%) |
| 65 to 74 Years | 2,599 (100.0%) | 0 (0.0%) |
| 75 Years and older | 2,157 (100.0%) | 0 (0.0%) |
| Total | 24,035 (96.9%) | 759 (3.1%) |
Health Insurance Coverage by Citizenship Status in Auburn
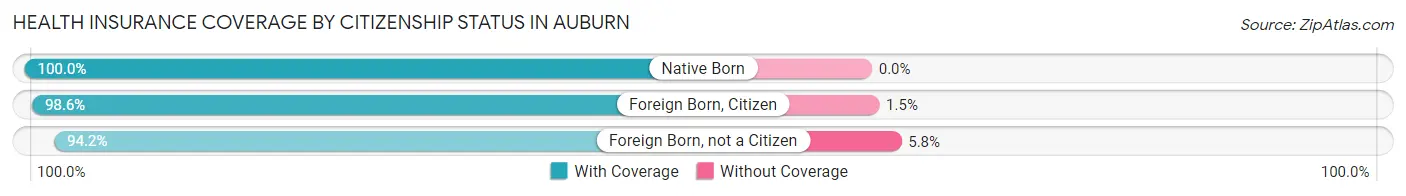
| Citizenship Status | With Coverage | Without Coverage |
| Native Born | 2,055 (100.0%) | 0 (0.0%) |
| Foreign Born, Citizen | 2,986 (98.6%) | 44 (1.5%) |
| Foreign Born, not a Citizen | 2,079 (94.2%) | 128 (5.8%) |
Health Insurance Coverage by Household Income in Auburn
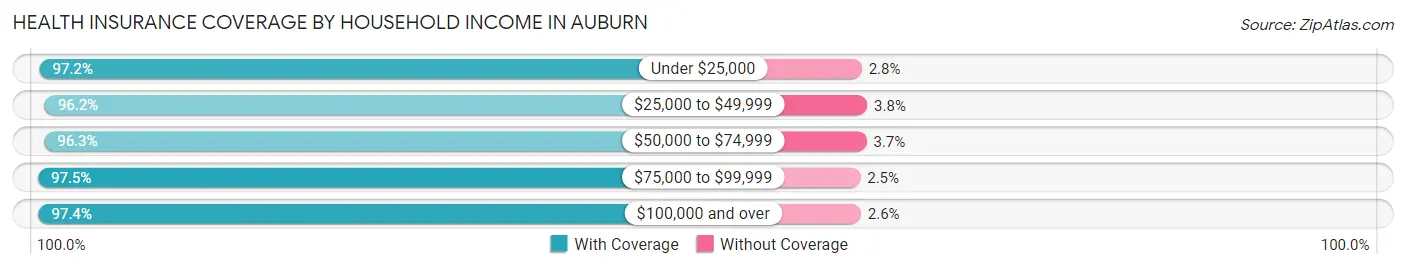
| Household Income | With Coverage | Without Coverage |
| Under $25,000 | 5,006 (97.2%) | 144 (2.8%) |
| $25,000 to $49,999 | 4,531 (96.2%) | 180 (3.8%) |
| $50,000 to $74,999 | 4,815 (96.3%) | 185 (3.7%) |
| $75,000 to $99,999 | 3,695 (97.5%) | 96 (2.5%) |
| $100,000 and over | 5,712 (97.4%) | 154 (2.6%) |
Public vs Private Health Insurance Coverage by Age in Auburn
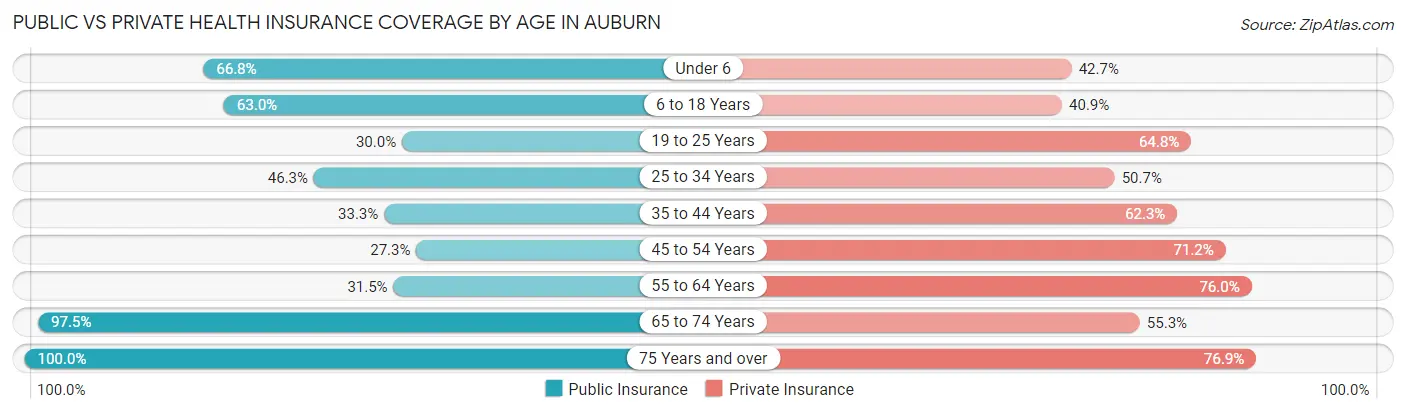
| Age Bracket | Public Insurance | Private Insurance |
| Under 6 | 1,373 (66.8%) | 877 (42.7%) |
| 6 to 18 Years | 1,909 (63.0%) | 1,239 (40.9%) |
| 19 to 25 Years | 661 (29.9%) | 1,431 (64.8%) |
| 25 to 34 Years | 1,621 (46.3%) | 1,773 (50.7%) |
| 35 to 44 Years | 1,114 (33.3%) | 2,084 (62.3%) |
| 45 to 54 Years | 670 (27.3%) | 1,749 (71.2%) |
| 55 to 64 Years | 1,086 (31.5%) | 2,618 (76.0%) |
| 65 to 74 Years | 2,534 (97.5%) | 1,438 (55.3%) |
| 75 Years and over | 2,157 (100.0%) | 1,659 (76.9%) |
| Total | 13,125 (52.9%) | 14,868 (60.0%) |
Disability Status by Sex by Age in Auburn
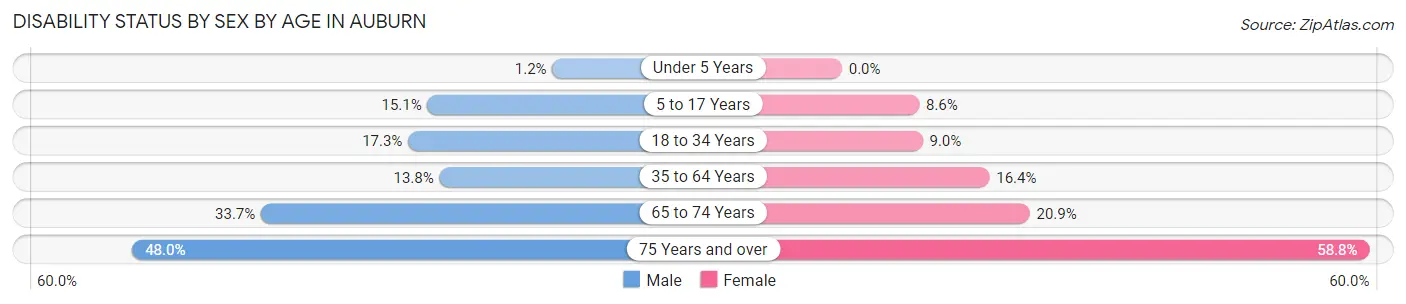
| Age Bracket | Male | Female |
| Under 5 Years | 11 (1.2%) | 0 (0.0%) |
| 5 to 17 Years | 228 (15.1%) | 137 (8.6%) |
| 18 to 34 Years | 522 (17.3%) | 260 (9.0%) |
| 35 to 64 Years | 606 (13.8%) | 797 (16.4%) |
| 65 to 74 Years | 408 (33.7%) | 290 (20.9%) |
| 75 Years and over | 350 (48.0%) | 839 (58.8%) |
Disability Class by Sex by Age in Auburn
Disability Class: Hearing Difficulty
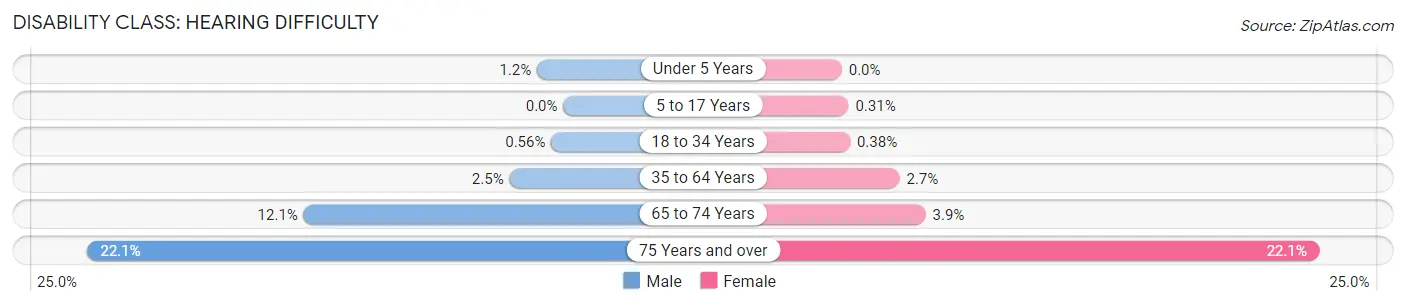
| Age Bracket | Male | Female |
| Under 5 Years | 11 (1.2%) | 0 (0.0%) |
| 5 to 17 Years | 0 (0.0%) | 5 (0.3%) |
| 18 to 34 Years | 17 (0.6%) | 11 (0.4%) |
| 35 to 64 Years | 110 (2.5%) | 130 (2.7%) |
| 65 to 74 Years | 146 (12.0%) | 54 (3.9%) |
| 75 Years and over | 161 (22.1%) | 316 (22.1%) |
Disability Class: Vision Difficulty
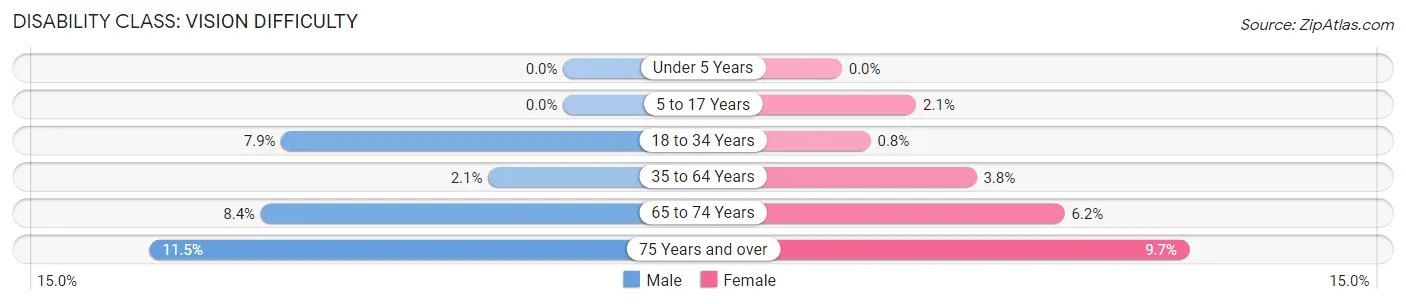
| Age Bracket | Male | Female |
| Under 5 Years | 0 (0.0%) | 0 (0.0%) |
| 5 to 17 Years | 0 (0.0%) | 33 (2.1%) |
| 18 to 34 Years | 237 (7.9%) | 23 (0.8%) |
| 35 to 64 Years | 92 (2.1%) | 182 (3.7%) |
| 65 to 74 Years | 102 (8.4%) | 86 (6.2%) |
| 75 Years and over | 84 (11.5%) | 138 (9.7%) |
Disability Class: Cognitive Difficulty
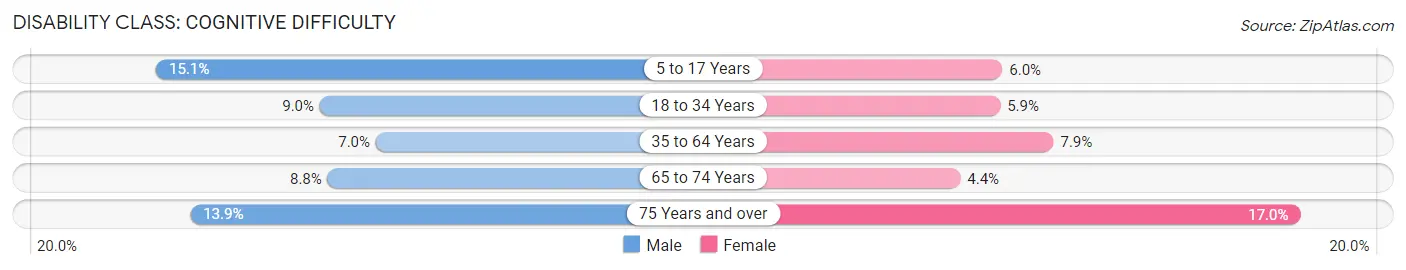
| Age Bracket | Male | Female |
| 5 to 17 Years | 228 (15.1%) | 95 (6.0%) |
| 18 to 34 Years | 273 (9.0%) | 170 (5.9%) |
| 35 to 64 Years | 306 (7.0%) | 381 (7.9%) |
| 65 to 74 Years | 106 (8.7%) | 61 (4.4%) |
| 75 Years and over | 101 (13.9%) | 243 (17.0%) |
Disability Class: Ambulatory Difficulty
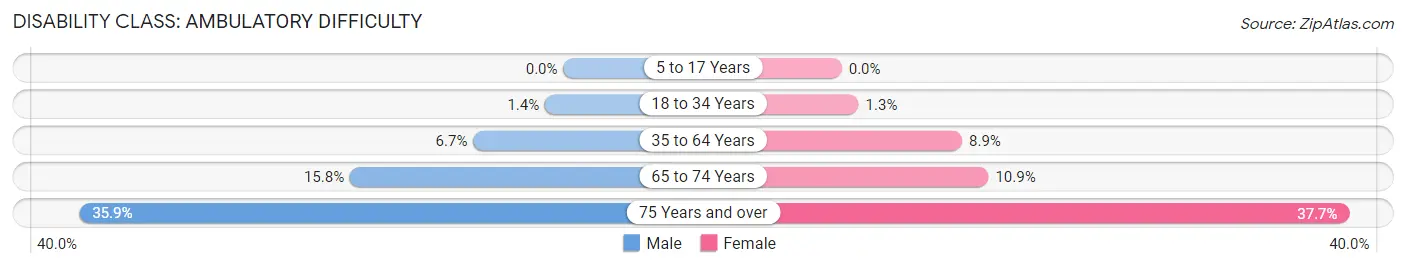
| Age Bracket | Male | Female |
| 5 to 17 Years | 0 (0.0%) | 0 (0.0%) |
| 18 to 34 Years | 41 (1.4%) | 36 (1.3%) |
| 35 to 64 Years | 294 (6.7%) | 433 (8.9%) |
| 65 to 74 Years | 192 (15.8%) | 151 (10.9%) |
| 75 Years and over | 262 (35.9%) | 538 (37.7%) |
Disability Class: Self-Care Difficulty
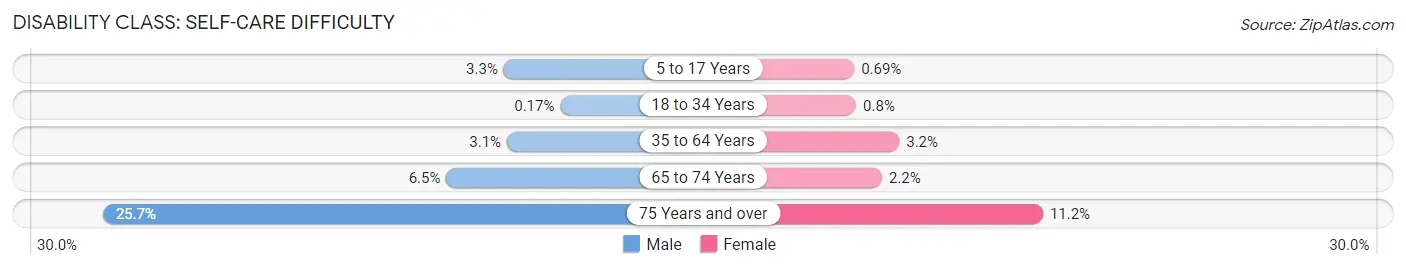
| Age Bracket | Male | Female |
| 5 to 17 Years | 50 (3.3%) | 11 (0.7%) |
| 18 to 34 Years | 5 (0.2%) | 23 (0.8%) |
| 35 to 64 Years | 138 (3.1%) | 155 (3.2%) |
| 65 to 74 Years | 79 (6.5%) | 31 (2.2%) |
| 75 Years and over | 187 (25.7%) | 160 (11.2%) |
Technology Access in Auburn
Computing Device Access in Auburn
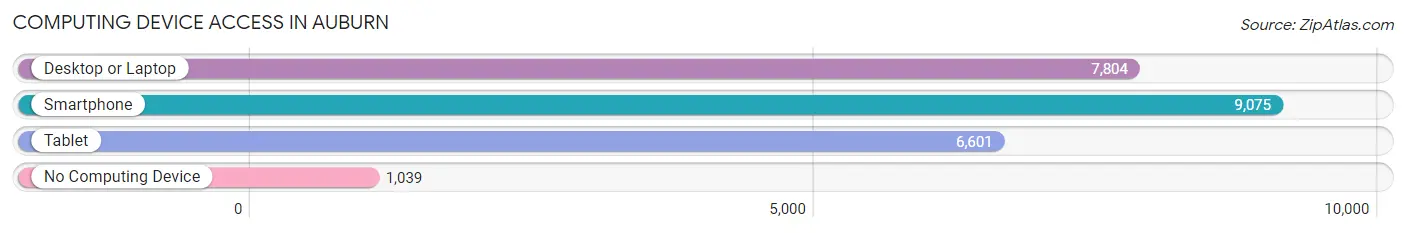
| Device Type | # Households | % Households |
| Desktop or Laptop | 7,804 | 67.6% |
| Smartphone | 9,075 | 78.6% |
| Tablet | 6,601 | 57.2% |
| No Computing Device | 1,039 | 9.0% |
| Total | 11,544 | 100.0% |
Internet Access in Auburn
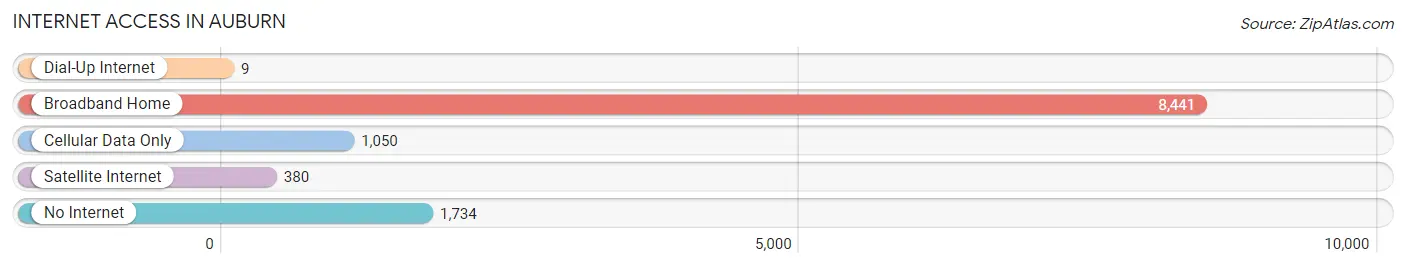
| Internet Type | # Households | % Households |
| Dial-Up Internet | 9 | 0.1% |
| Broadband Home | 8,441 | 73.1% |
| Cellular Data Only | 1,050 | 9.1% |
| Satellite Internet | 380 | 3.3% |
| No Internet | 1,734 | 15.0% |
| Total | 11,544 | 100.0% |
Auburn Summary
Auburn, New York is a city located in Cayuga County, New York, United States. It is the county seat of Cayuga County and is located in the Finger Lakes region of New York. The city is situated on the north bank of Owasco Lake, one of the Finger Lakes. As of the 2010 census, the city had a population of 27,687.
History
The area around Auburn was first settled in 1793 by John L. Hardenbergh, a Revolutionary War veteran. The area was originally known as Hardenbergh's Corners. In 1805, Hardenbergh built a tavern and inn on the corner of Genesee Street and South Street. This tavern became a popular stop for travelers and was the first business in the area.
In 1809, the village of Auburn was officially incorporated. The village was named after Auburn, New York, the former home of William H. Seward, who was then the Governor of New York. Seward had previously served as a United States Senator from New York.
In 1848, Auburn was designated as the county seat of Cayuga County. This designation was made official in 1853.
In 1868, Auburn was the site of the first Women's Rights Convention in the United States. The convention was held at the Wesleyan Chapel and was attended by over 300 people.
In 1871, Auburn was the site of the first execution by electric chair. William Kemmler was the first person to be executed in this manner.
In 1875 Auburn was the site of the first telephone exchange in the United States
In 1892 Auburn was the site of the first public library in the United States
Geography
Auburn is located at 42°57′N 76°37′W (42.95, -76.62). According to the United States Census Bureau, the city has a total area of 8.2 square miles (21.2 km2), of which 8.1 square miles (21.0 km2) is land and 0.1 square miles (0.2 km2) is water.
The city is located on the north bank of Owasco Lake, one of the Finger Lakes. The city is situated in the Finger Lakes region of New York.
Economy
Auburn's economy is largely based on manufacturing and healthcare. The city is home to several large manufacturing companies, including Auburn Manufacturing, Inc., which produces industrial fabrics and textiles, and Auburn Gear, Inc., which produces automotive parts.
The city is also home to several healthcare facilities, including Auburn Community Hospital, Cayuga County Health System, and Finger Lakes Health.
Demographics
As of the 2010 census, there were 27,687 people, 11,072 households, and 6,845 families residing in the city. The population density was 3,412.3 people per square mile (1,318.2/km2). There were 11,945 housing units at an average density of 1,476.3 per square mile (571.2/km2). The racial makeup of the city was 88.2% White, 6.3% African American, 0.3% Native American, 1.3% Asian, 0.1% Pacific Islander, 1.2% from other races, and 2.6% from two or more races. Hispanic or Latino of any race were 4.2% of the population.
There were 11,072 households, out of which 28.2% had children under the age of 18 living with them, 43.2% were married couples living together, 14.3% had a female householder with no husband present, and 37.7% were non-families. 32.2% of all households were made up of individuals, and 13.3% had someone living alone who was 65 years of age or older. The average household size was 2.35 and the average family size was 2.97.
In the city, the population was spread out, with 23.2% under the age of 18, 8.2% from 18 to 24, 27.2% from 25 to 44, 24.2% from 45 to 64, and 17.2% who were 65 years of age or older. The median age was 39 years. For every 100 females, there were 91.2 males. For every 100 females age 18 and over, there were 87.7 males.
The median income for a household in the city was $35,945, and the median income for a family was $45,945. Males had a median income of $35,945 versus $27,945 for females. The per capita income for the city was $19,945. About 11.2% of families and 14.2% of the population were below the poverty line, including 20.2% of those under age 18 and 8.2% of those age 65 or over.
Common Questions
What is Per Capita Income in Auburn?
Per Capita income in Auburn is $29,387.
What is the Median Family Income in Auburn?
Median Family Income in Auburn is $64,101.
What is the Median Household income in Auburn?
Median Household Income in Auburn is $48,203.
What is Income or Wage Gap in Auburn?
Income or Wage Gap in Auburn is 17.1%.
Women in Auburn earn 82.9 cents for every dollar earned by a man.
What is Family Income Deficit in Auburn?
Family Income Deficit in Auburn is $12,748.
Families that are below poverty line in Auburn earn $12,748 less on average than the poverty threshold level.
What is Inequality or Gini Index in Auburn?
Inequality or Gini Index in Auburn is 0.48.
What is the Total Population of Auburn?
Total Population of Auburn is 26,674.
What is the Total Male Population of Auburn?
Total Male Population of Auburn is 13,384.
What is the Total Female Population of Auburn?
Total Female Population of Auburn is 13,290.
What is the Ratio of Males per 100 Females in Auburn?
There are 100.71 Males per 100 Females in Auburn.
What is the Ratio of Females per 100 Males in Auburn?
There are 99.30 Females per 100 Males in Auburn.
What is the Median Population Age in Auburn?
Median Population Age in Auburn is 40.3 Years.
What is the Average Family Size in Auburn
Average Family Size in Auburn is 2.9 People.
What is the Average Household Size in Auburn
Average Household Size in Auburn is 2.1 People.
How Large is the Labor Force in Auburn?
There are 11,760 People in the Labor Forcein in Auburn.
What is the Percentage of People in the Labor Force in Auburn?
53.1% of People are in the Labor Force in Auburn.
What is the Unemployment Rate in Auburn?
Unemployment Rate in Auburn is 6.0%.