Zip Codes with the Highest Percentage of Population Employed in Security & Protection in Gallup, NM
RELATED REPORTS & OPTIONS
Security & Protection
Gallup
Compare Zip Codes
Map of Zip Codes with the Highest Percentage of Population Employed in Security & Protection in Gallup
2.0%
5.3%
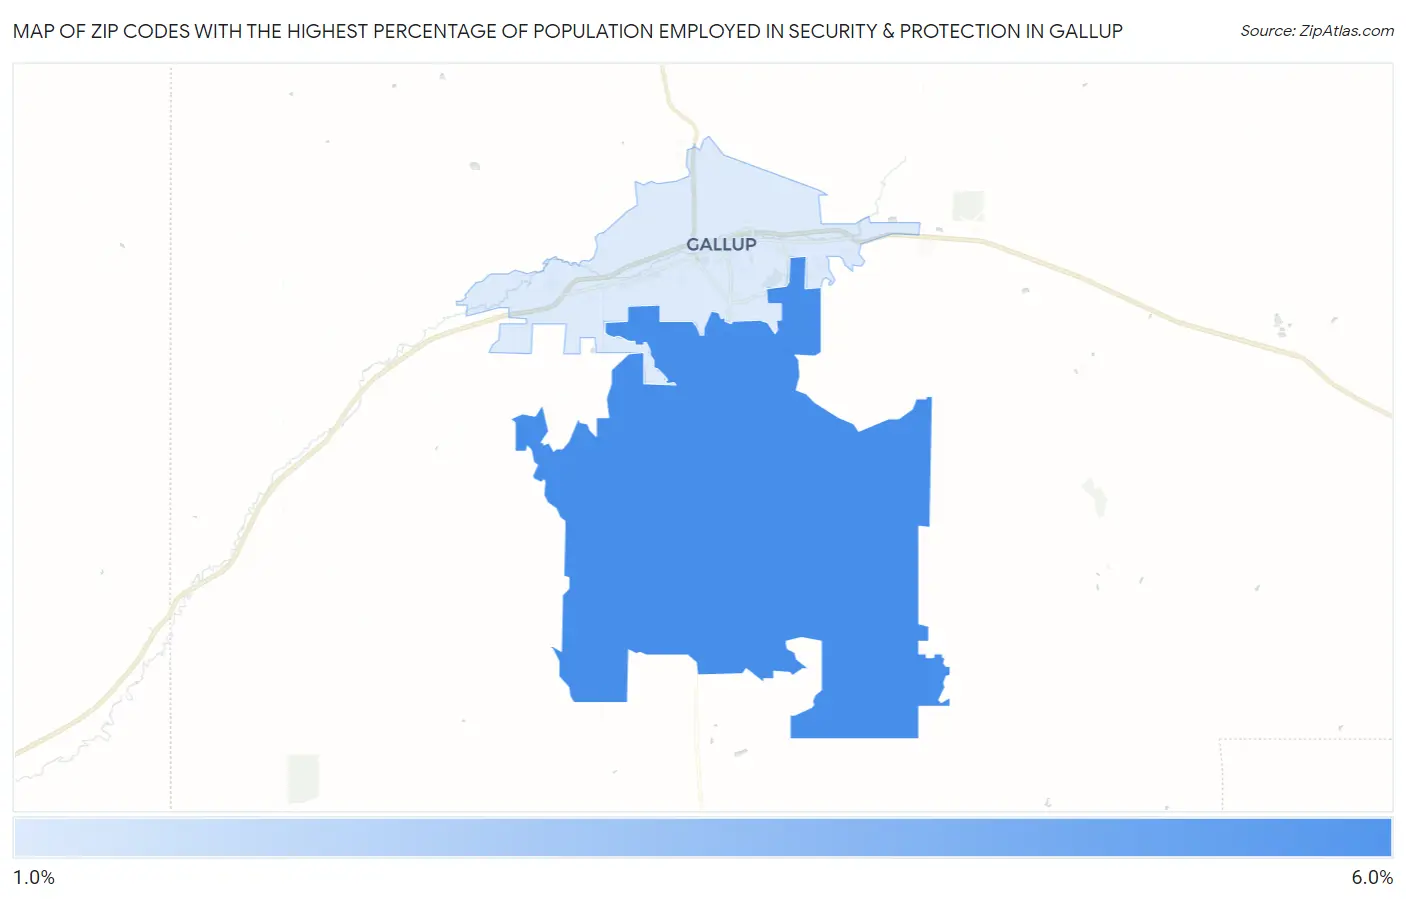
Zip Codes with the Highest Percentage of Population Employed in Security & Protection in Gallup, NM
| Zip Code | % Employed | vs State | vs National | |
| 1. | 87305 | 5.3% | 2.8%(+2.50)#53 | 2.1%(+3.11)#2,662 |
| 2. | 87301 | 2.0% | 2.8%(-0.786)#137 | 2.1%(-0.173)#12,722 |
1
Common Questions
What are the Top Zip Codes with the Highest Percentage of Population Employed in Security & Protection in Gallup, NM?
Top Zip Codes with the Highest Percentage of Population Employed in Security & Protection in Gallup, NM are:
What zip code has the Highest Percentage of Population Employed in Security & Protection in Gallup, NM?
87305 has the Highest Percentage of Population Employed in Security & Protection in Gallup, NM with 5.3%.
What is the Percentage of Population Employed in Security & Protection in Gallup, NM?
Percentage of Population Employed in Security & Protection in Gallup is 2.0%.
What is the Percentage of Population Employed in Security & Protection in New Mexico?
Percentage of Population Employed in Security & Protection in New Mexico is 2.8%.
What is the Percentage of Population Employed in Security & Protection in the United States?
Percentage of Population Employed in Security & Protection in the United States is 2.1%.