Zip Codes with the Highest Percentage of Population Employed in Architecture & Engineering in Grand Island, NE
RELATED REPORTS & OPTIONS
Architecture & Engineering
Grand Island
Compare Zip Codes
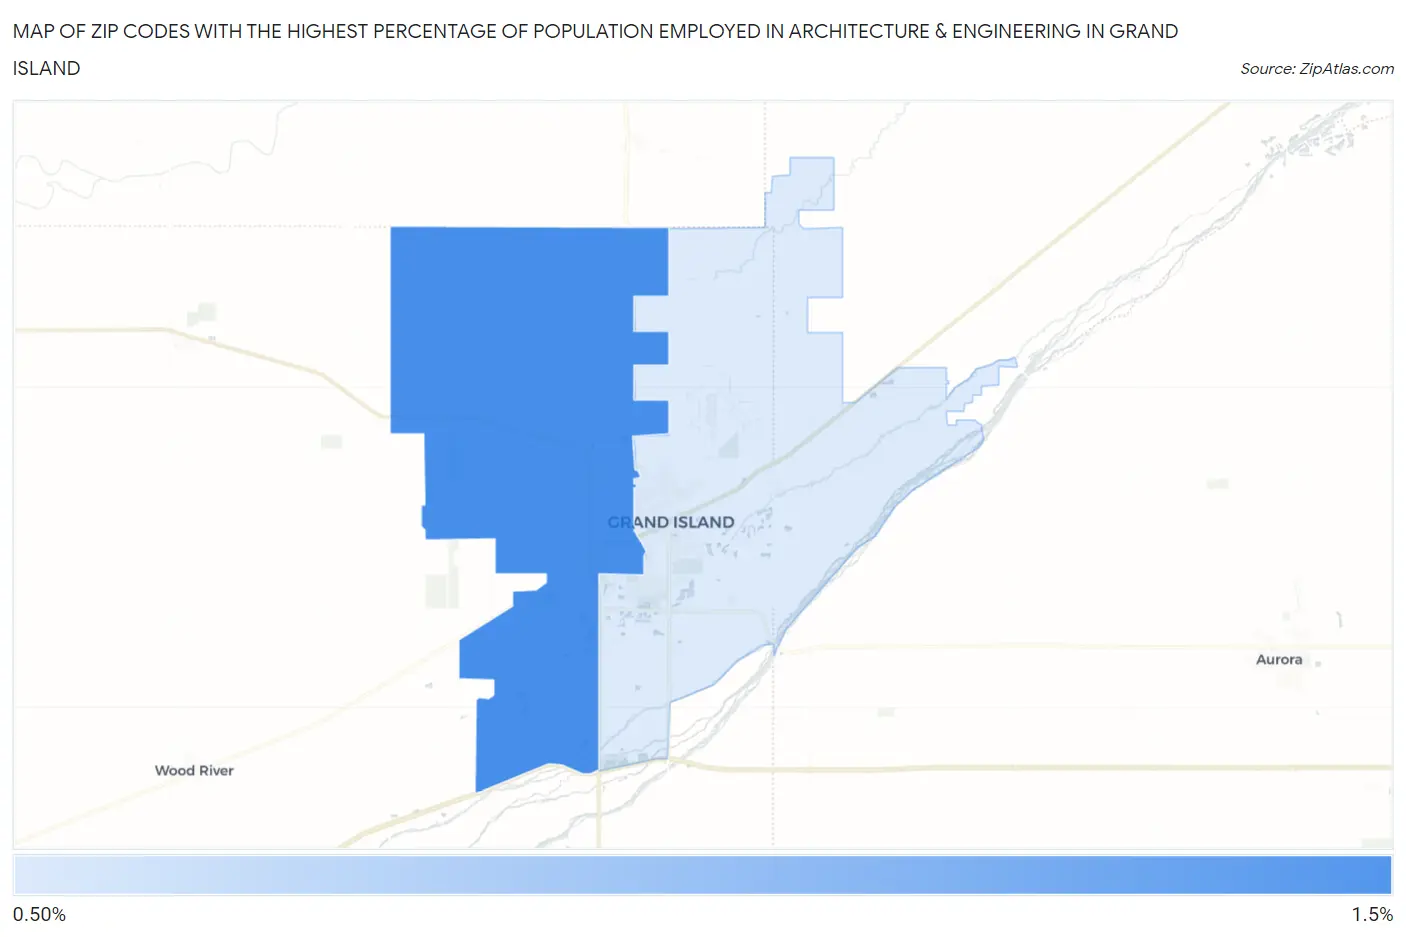
Map of Zip Codes with the Highest Percentage of Population Employed in Architecture & Engineering in Grand Island
0.95%
1.1%
Zip Codes with the Highest Percentage of Population Employed in Architecture & Engineering in Grand Island, NE
| Zip Code | % Employed | vs State | vs National | |
| 1. | 68803 | 1.1% | 1.5%(-0.387)#174 | 2.1%(-1.03)#15,725 |
| 2. | 68801 | 0.95% | 1.5%(-0.553)#198 | 2.1%(-1.20)#16,988 |
1
Common Questions
What are the Top Zip Codes with the Highest Percentage of Population Employed in Architecture & Engineering in Grand Island, NE?
Top Zip Codes with the Highest Percentage of Population Employed in Architecture & Engineering in Grand Island, NE are:
What zip code has the Highest Percentage of Population Employed in Architecture & Engineering in Grand Island, NE?
68803 has the Highest Percentage of Population Employed in Architecture & Engineering in Grand Island, NE with 1.1%.
What is the Percentage of Population Employed in Architecture & Engineering in Grand Island, NE?
Percentage of Population Employed in Architecture & Engineering in Grand Island is 0.95%.
What is the Percentage of Population Employed in Architecture & Engineering in Nebraska?
Percentage of Population Employed in Architecture & Engineering in Nebraska is 1.5%.
What is the Percentage of Population Employed in Architecture & Engineering in the United States?
Percentage of Population Employed in Architecture & Engineering in the United States is 2.1%.