Zip Codes with the Most Immigrants from South Eastern Asia in Grand Island, NE
RELATED REPORTS & OPTIONS
South Eastern Asia
Grand Island
Compare Zip Codes
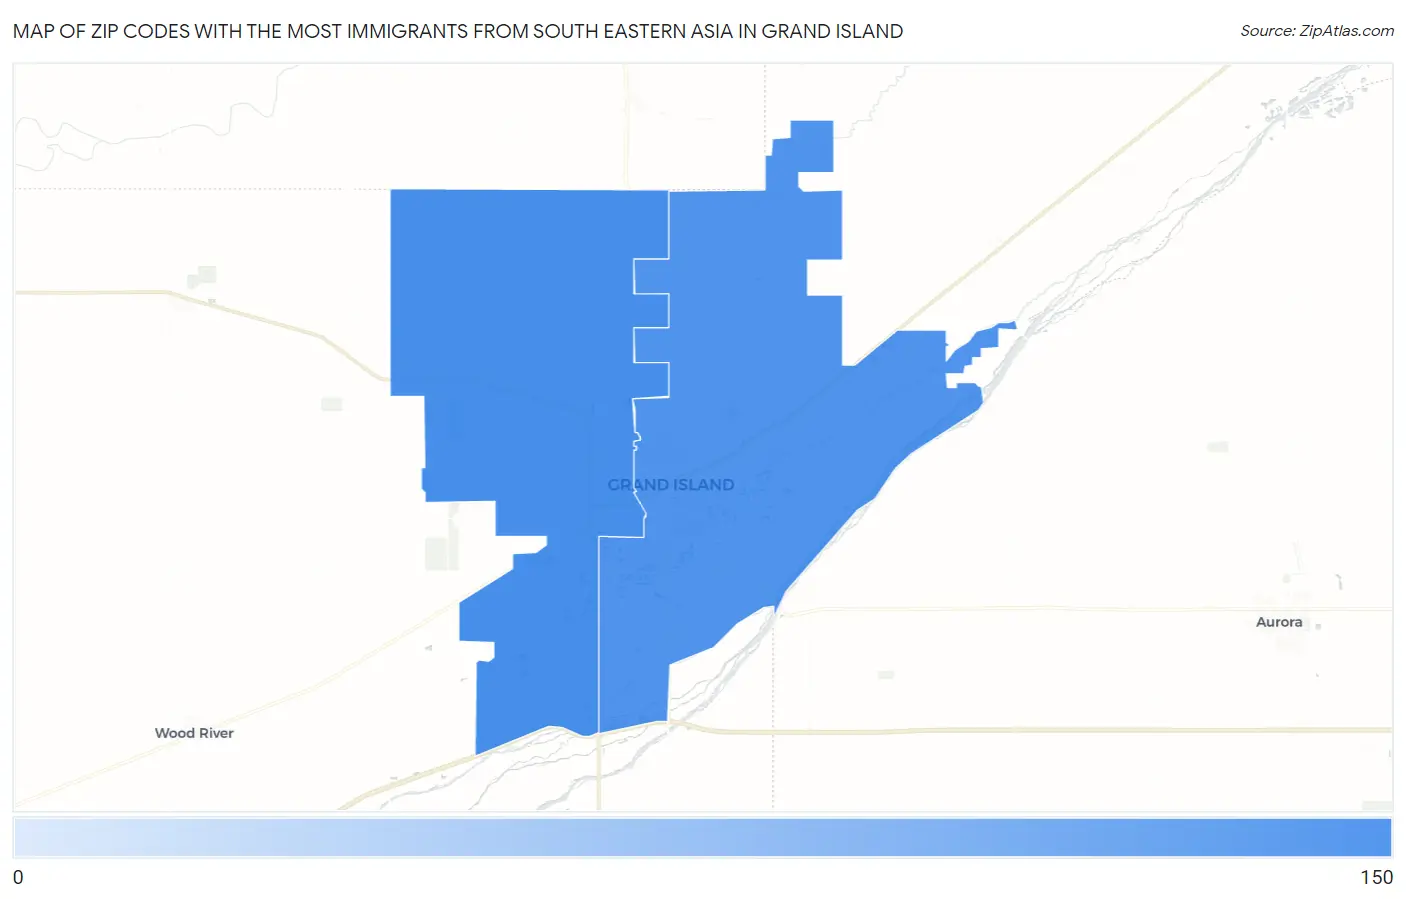
Map of Zip Codes with the Most Immigrants from South Eastern Asia in Grand Island
111
146
Zip Codes with the Most Immigrants from South Eastern Asia in Grand Island, NE
| Zip Code | South Eastern Asia | vs State | vs National | |
| 1. | 68803 | 146 | 17,592(0.83%)#30 | 4,292,058(0.00%)#4,894 |
| 2. | 68801 | 111 | 17,592(0.63%)#35 | 4,292,058(0.00%)#5,627 |
1
Common Questions
What are the Top Zip Codes with the Most Immigrants from South Eastern Asia in Grand Island, NE?
Top Zip Codes with the Most Immigrants from South Eastern Asia in Grand Island, NE are:
What zip code has the Most Immigrants from South Eastern Asia in Grand Island, NE?
68803 has the Most Immigrants from South Eastern Asia in Grand Island, NE with 146.
What is the Total Immigrants from South Eastern Asia in Grand Island, NE?
Total Immigrants from South Eastern Asia in Grand Island is 257.
What is the Total Immigrants from South Eastern Asia in Nebraska?
Total Immigrants from South Eastern Asia in Nebraska is 17,592.
What is the Total Immigrants from South Eastern Asia in the United States?
Total Immigrants from South Eastern Asia in the United States is 4,292,058.