Whitewater, MO Map & Demographics
Whitewater Map
Whitewater Overview
$33,015
PER CAPITA INCOME
$76,250
AVG FAMILY INCOME
$46,146
AVG HOUSEHOLD INCOME
21.2%
WAGE / INCOME GAP [ % ]
78.8¢/ $1
WAGE / INCOME GAP [ $ ]
0.30
INEQUALITY / GINI INDEX
75
TOTAL POPULATION
42
MALE POPULATION
33
FEMALE POPULATION
127.27
MALES / 100 FEMALES
78.57
FEMALES / 100 MALES
58.3
MEDIAN AGE
2.4
AVG FAMILY SIZE
1.6
AVG HOUSEHOLD SIZE
43
LABOR FORCE [ PEOPLE ]
59.7%
PERCENT IN LABOR FORCE
Whitewater Zip Codes
Whitewater Area Codes
Income in Whitewater
Income Overview in Whitewater
Per Capita Income in Whitewater is $33,015, while median incomes of families and households are $76,250 and $46,146 respectively.
| Characteristic | Number | Measure |
| Per Capita Income | 75 | $33,015 |
| Median Family Income | 20 | $76,250 |
| Mean Family Income | 20 | $70,575 |
| Median Household Income | 47 | $46,146 |
| Mean Household Income | 47 | $49,330 |
| Income Deficit | 20 | $0 |
| Wage / Income Gap (%) | 75 | 21.21% |
| Wage / Income Gap ($) | 75 | 78.79¢ per $1 |
| Gini / Inequality Index | 75 | 0.30 |
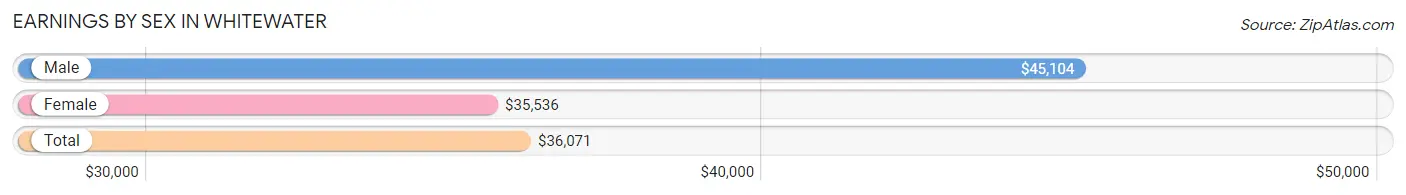
Earnings by Sex in Whitewater
Average Earnings in Whitewater are $36,071, $45,104 for men and $35,536 for women, a difference of 21.2%.
| Sex | Number | Average Earnings |
| Male | 27 (61.4%) | $45,104 |
| Female | 17 (38.6%) | $35,536 |
| Total | 44 (100.0%) | $36,071 |
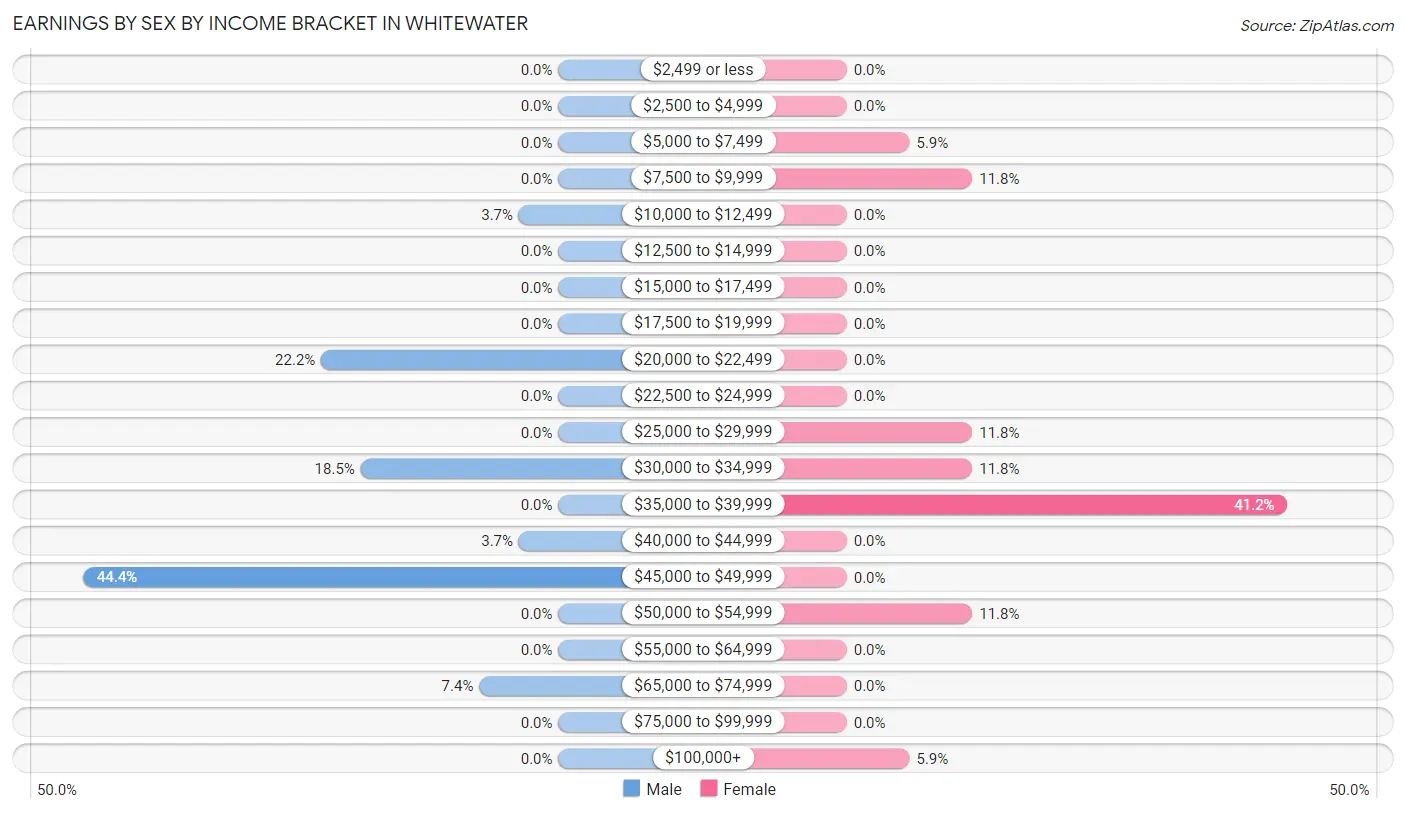
Earnings by Sex by Income Bracket in Whitewater
The most common earnings brackets in Whitewater are $45,000 to $49,999 for men (12 | 44.4%) and $35,000 to $39,999 for women (7 | 41.2%).
| Income | Male | Female |
| $2,499 or less | 0 (0.0%) | 0 (0.0%) |
| $2,500 to $4,999 | 0 (0.0%) | 0 (0.0%) |
| $5,000 to $7,499 | 0 (0.0%) | 1 (5.9%) |
| $7,500 to $9,999 | 0 (0.0%) | 2 (11.8%) |
| $10,000 to $12,499 | 1 (3.7%) | 0 (0.0%) |
| $12,500 to $14,999 | 0 (0.0%) | 0 (0.0%) |
| $15,000 to $17,499 | 0 (0.0%) | 0 (0.0%) |
| $17,500 to $19,999 | 0 (0.0%) | 0 (0.0%) |
| $20,000 to $22,499 | 6 (22.2%) | 0 (0.0%) |
| $22,500 to $24,999 | 0 (0.0%) | 0 (0.0%) |
| $25,000 to $29,999 | 0 (0.0%) | 2 (11.8%) |
| $30,000 to $34,999 | 5 (18.5%) | 2 (11.8%) |
| $35,000 to $39,999 | 0 (0.0%) | 7 (41.2%) |
| $40,000 to $44,999 | 1 (3.7%) | 0 (0.0%) |
| $45,000 to $49,999 | 12 (44.4%) | 0 (0.0%) |
| $50,000 to $54,999 | 0 (0.0%) | 2 (11.8%) |
| $55,000 to $64,999 | 0 (0.0%) | 0 (0.0%) |
| $65,000 to $74,999 | 2 (7.4%) | 0 (0.0%) |
| $75,000 to $99,999 | 0 (0.0%) | 0 (0.0%) |
| $100,000+ | 0 (0.0%) | 1 (5.9%) |
| Total | 27 (100.0%) | 17 (100.0%) |
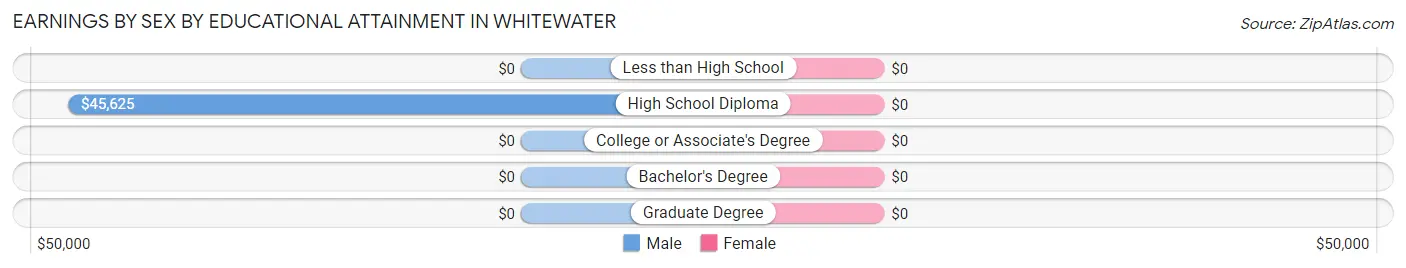
Earnings by Sex by Educational Attainment in Whitewater
| Educational Attainment | Male Income | Female Income |
| Less than High School | - | - |
| High School Diploma | $45,625 | $0 |
| College or Associate's Degree | - | - |
| Bachelor's Degree | - | - |
| Graduate Degree | - | - |
| Total | $45,729 | $30,625 |
Family Income in Whitewater
Family Income Brackets in Whitewater
According to the Whitewater family income data, there are 10 families falling into the $75,000 to $99,999 income range, which is the most common income bracket and makes up 50.0% of all families.
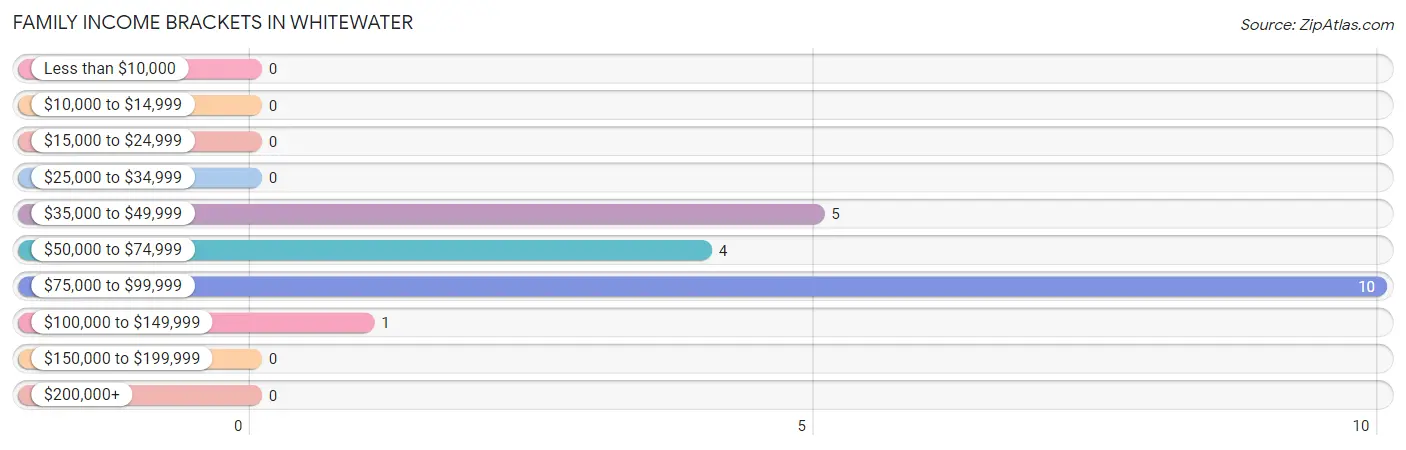
| Income Bracket | # Families | % Families |
| Less than $10,000 | 0 | 0.0% |
| $10,000 to $14,999 | 0 | 0.0% |
| $15,000 to $24,999 | 0 | 0.0% |
| $25,000 to $34,999 | 0 | 0.0% |
| $35,000 to $49,999 | 5 | 25.0% |
| $50,000 to $74,999 | 4 | 20.0% |
| $75,000 to $99,999 | 10 | 50.0% |
| $100,000 to $149,999 | 1 | 5.0% |
| $150,000 to $199,999 | 0 | 0.0% |
| $200,000+ | 0 | 0.0% |
Family Income by Famaliy Size in Whitewater
2-person families (14 | 70.0%) account for the highest median family income in Whitewater with $55,000 per family, while 2-person families (14 | 70.0%) have the highest median income of $27,500 per family member.
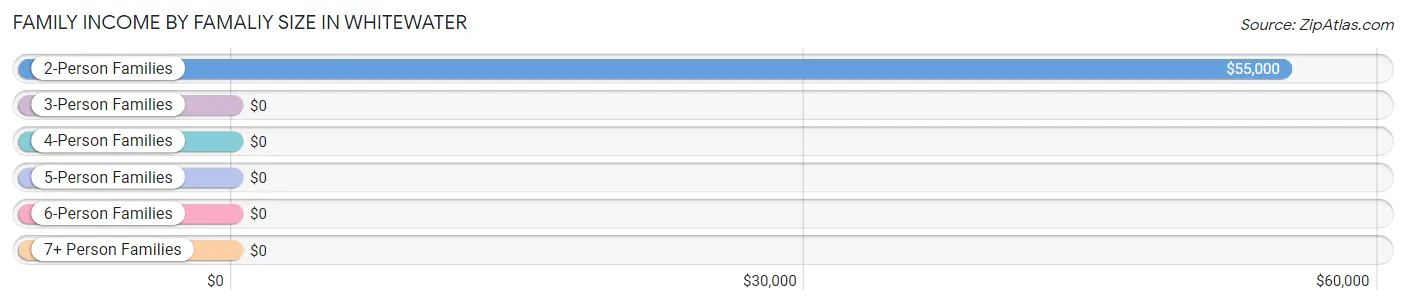
| Income Bracket | # Families | Median Income |
| 2-Person Families | 14 (70.0%) | $55,000 |
| 3-Person Families | 6 (30.0%) | $0 |
| 4-Person Families | 0 (0.0%) | $0 |
| 5-Person Families | 0 (0.0%) | $0 |
| 6-Person Families | 0 (0.0%) | $0 |
| 7+ Person Families | 0 (0.0%) | $0 |
| Total | 20 (100.0%) | $76,250 |
Family Income by Number of Earners in Whitewater
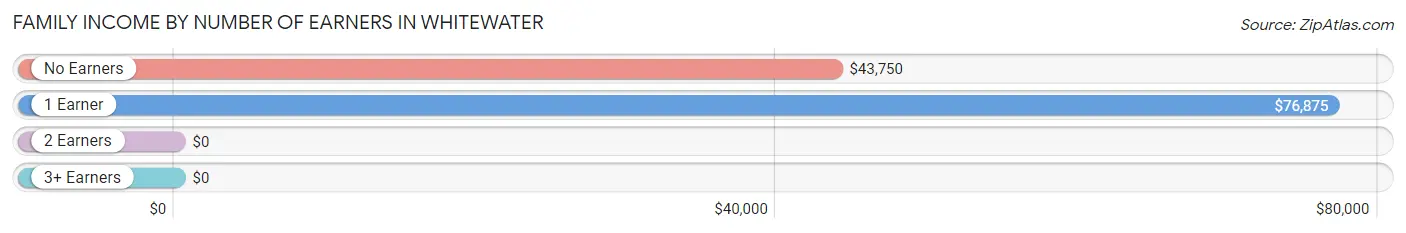
| Number of Earners | # Families | Median Income |
| No Earners | 8 (40.0%) | $43,750 |
| 1 Earner | 5 (25.0%) | $76,875 |
| 2 Earners | 2 (10.0%) | $0 |
| 3+ Earners | 5 (25.0%) | $0 |
| Total | 20 (100.0%) | $76,250 |
Household Income in Whitewater
Household Income Brackets in Whitewater
With 17 households falling in the category, the $35,000 to $49,999 income range is the most frequent in Whitewater, accounting for 36.2% of all households.
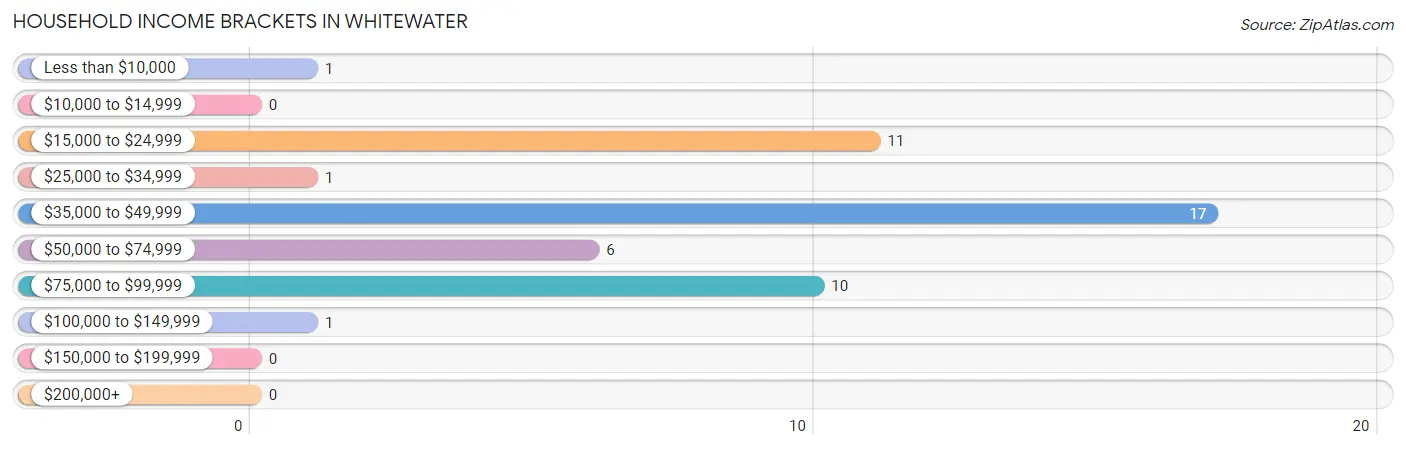
| Income Bracket | # Households | % Households |
| Less than $10,000 | 1 | 2.1% |
| $10,000 to $14,999 | 0 | 0.0% |
| $15,000 to $24,999 | 11 | 23.4% |
| $25,000 to $34,999 | 1 | 2.1% |
| $35,000 to $49,999 | 17 | 36.2% |
| $50,000 to $74,999 | 6 | 12.8% |
| $75,000 to $99,999 | 10 | 21.3% |
| $100,000 to $149,999 | 1 | 2.1% |
| $150,000 to $199,999 | 0 | 0.0% |
| $200,000+ | 0 | 0.0% |
Household Income by Householder Age in Whitewater
The median household income in Whitewater is $46,146, with the highest median household income of $46,875 found in the 45 to 64 years age bracket for the primary householder. A total of 20 households (42.5%) fall into this category.
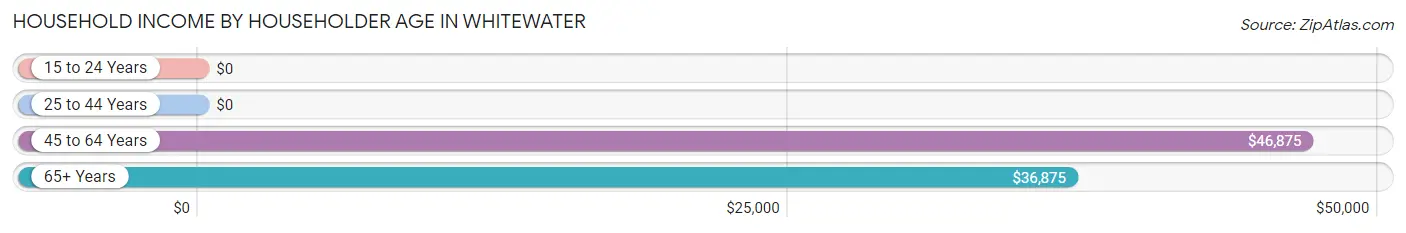
| Income Bracket | # Households | Median Income |
| 15 to 24 Years | 0 (0.0%) | $0 |
| 25 to 44 Years | 9 (19.2%) | $0 |
| 45 to 64 Years | 20 (42.5%) | $46,875 |
| 65+ Years | 18 (38.3%) | $36,875 |
| Total | 47 (100.0%) | $46,146 |
Poverty in Whitewater
Income Below Poverty by Sex and Age in Whitewater
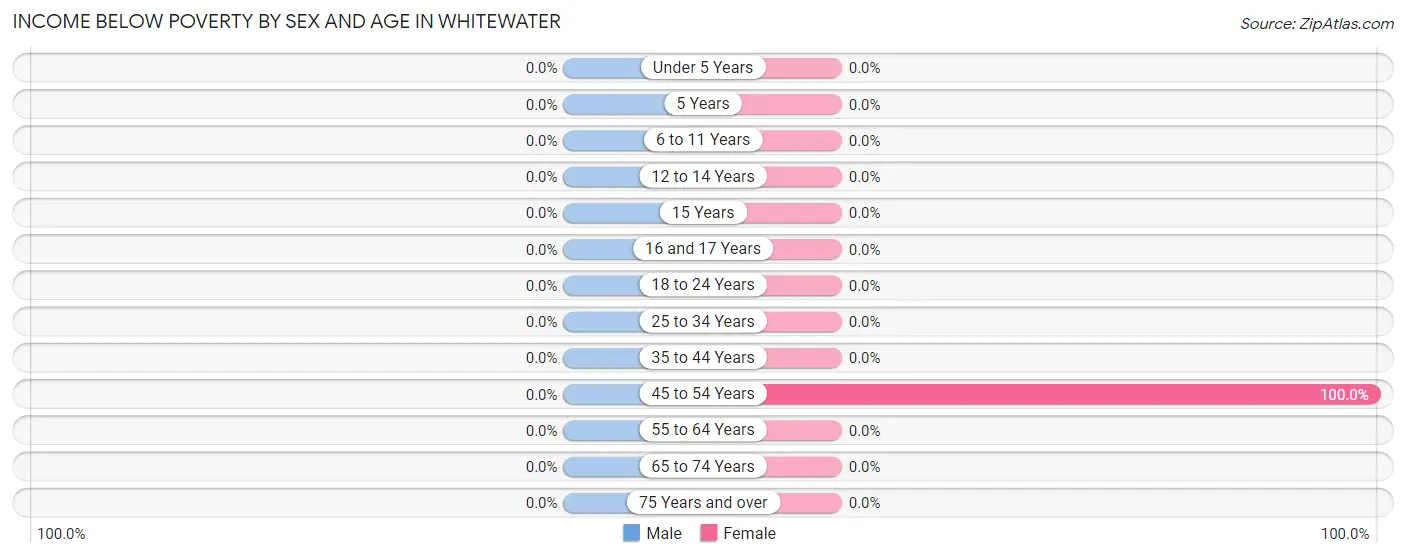
| Age Bracket | Male | Female |
| Under 5 Years | 0 (0.0%) | 0 (0.0%) |
| 5 Years | 0 (0.0%) | 0 (0.0%) |
| 6 to 11 Years | 0 (0.0%) | 0 (0.0%) |
| 12 to 14 Years | 0 (0.0%) | 0 (0.0%) |
| 15 Years | 0 (0.0%) | 0 (0.0%) |
| 16 and 17 Years | 0 (0.0%) | 0 (0.0%) |
| 18 to 24 Years | 0 (0.0%) | 0 (0.0%) |
| 25 to 34 Years | 0 (0.0%) | 0 (0.0%) |
| 35 to 44 Years | 0 (0.0%) | 0 (0.0%) |
| 45 to 54 Years | 0 (0.0%) | 1 (100.0%) |
| 55 to 64 Years | 0 (0.0%) | 0 (0.0%) |
| 65 to 74 Years | 0 (0.0%) | 0 (0.0%) |
| 75 Years and over | 0 (0.0%) | 0 (0.0%) |
| Total | 0 (0.0%) | 1 (3.0%) |
Income Above Poverty by Sex and Age in Whitewater
According to the poverty statistics in Whitewater, males aged 18 to 24 years and females aged 6 to 11 years are the age groups that are most secure financially, with 100.0% of males and 100.0% of females in these age groups living above the poverty line.
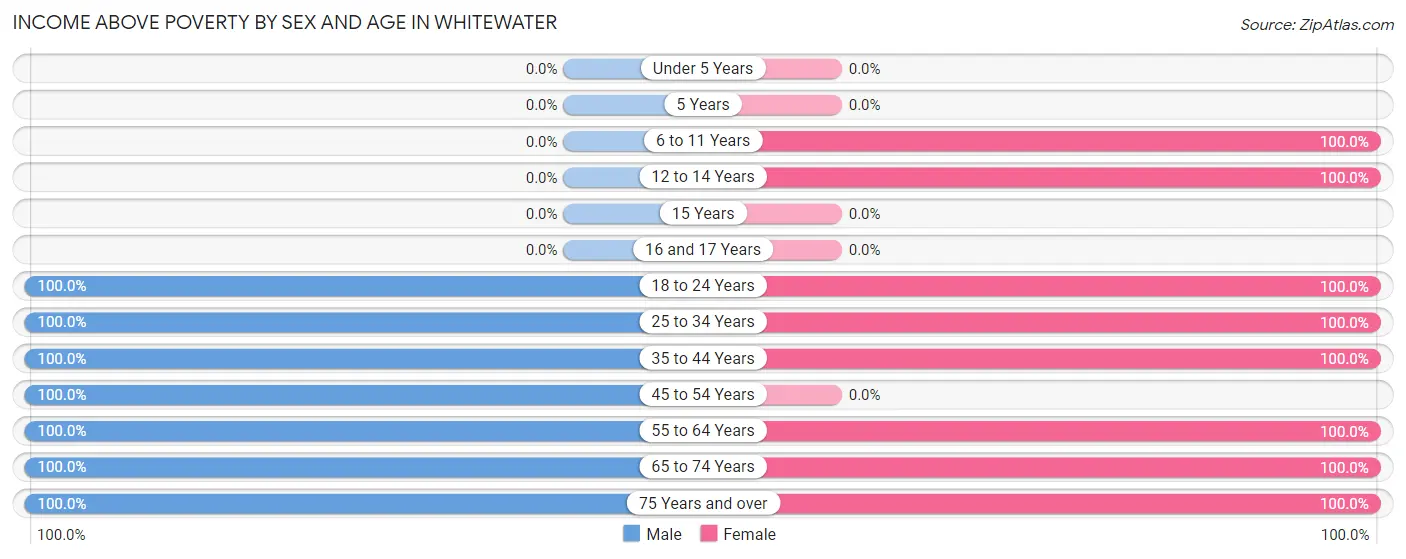
| Age Bracket | Male | Female |
| Under 5 Years | 0 (0.0%) | 0 (0.0%) |
| 5 Years | 0 (0.0%) | 0 (0.0%) |
| 6 to 11 Years | 0 (0.0%) | 2 (100.0%) |
| 12 to 14 Years | 0 (0.0%) | 1 (100.0%) |
| 15 Years | 0 (0.0%) | 0 (0.0%) |
| 16 and 17 Years | 0 (0.0%) | 0 (0.0%) |
| 18 to 24 Years | 6 (100.0%) | 6 (100.0%) |
| 25 to 34 Years | 1 (100.0%) | 3 (100.0%) |
| 35 to 44 Years | 4 (100.0%) | 3 (100.0%) |
| 45 to 54 Years | 7 (100.0%) | 0 (0.0%) |
| 55 to 64 Years | 12 (100.0%) | 2 (100.0%) |
| 65 to 74 Years | 9 (100.0%) | 11 (100.0%) |
| 75 Years and over | 3 (100.0%) | 4 (100.0%) |
| Total | 42 (100.0%) | 32 (97.0%) |
Income Below Poverty Among Married-Couple Families in Whitewater
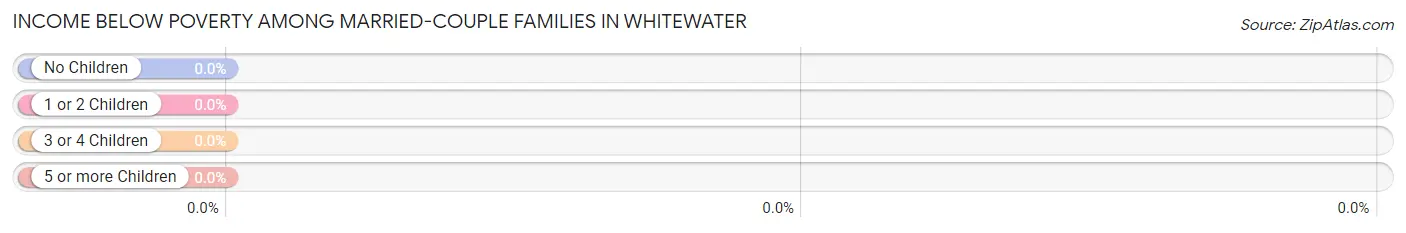
| Children | Above Poverty | Below Poverty |
| No Children | 9 (100.0%) | 0 (0.0%) |
| 1 or 2 Children | 1 (100.0%) | 0 (0.0%) |
| 3 or 4 Children | 0 (0.0%) | 0 (0.0%) |
| 5 or more Children | 0 (0.0%) | 0 (0.0%) |
| Total | 10 (100.0%) | 0 (0.0%) |
Income Below Poverty Among Single-Parent Households in Whitewater
| Children | Single Father | Single Mother |
| No Children | 0 (0.0%) | 0 (0.0%) |
| 1 or 2 Children | 0 (0.0%) | 0 (0.0%) |
| 3 or 4 Children | 0 (0.0%) | 0 (0.0%) |
| 5 or more Children | 0 (0.0%) | 0 (0.0%) |
| Total | 0 (0.0%) | 0 (0.0%) |
Income Below Poverty Among Married-Couple vs Single-Parent Households in Whitewater
| Children | Married-Couple Families | Single-Parent Households |
| No Children | 0 (0.0%) | 0 (0.0%) |
| 1 or 2 Children | 0 (0.0%) | 0 (0.0%) |
| 3 or 4 Children | 0 (0.0%) | 0 (0.0%) |
| 5 or more Children | 0 (0.0%) | 0 (0.0%) |
| Total | 0 (0.0%) | 0 (0.0%) |
Race in Whitewater
The most populous races in Whitewater are White / Caucasian (73 | 97.3%), and Black / African American (2 | 2.7%).
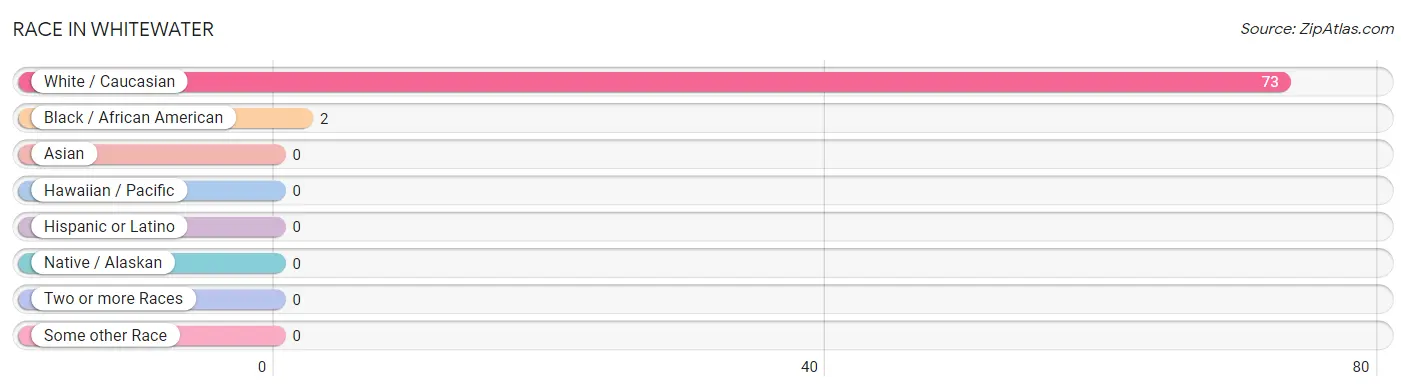
| Race | # Population | % Population |
| Asian | 0 | 0.0% |
| Black / African American | 2 | 2.7% |
| Hawaiian / Pacific | 0 | 0.0% |
| Hispanic or Latino | 0 | 0.0% |
| Native / Alaskan | 0 | 0.0% |
| White / Caucasian | 73 | 97.3% |
| Two or more Races | 0 | 0.0% |
| Some other Race | 0 | 0.0% |
| Total | 75 | 100.0% |
Ancestry in Whitewater
The most populous ancestries reported in Whitewater are American (26 | 34.7%), German (10 | 13.3%), Dutch (3 | 4.0%), Welsh (3 | 4.0%), and English (2 | 2.7%), together accounting for 58.7% of all Whitewater residents.
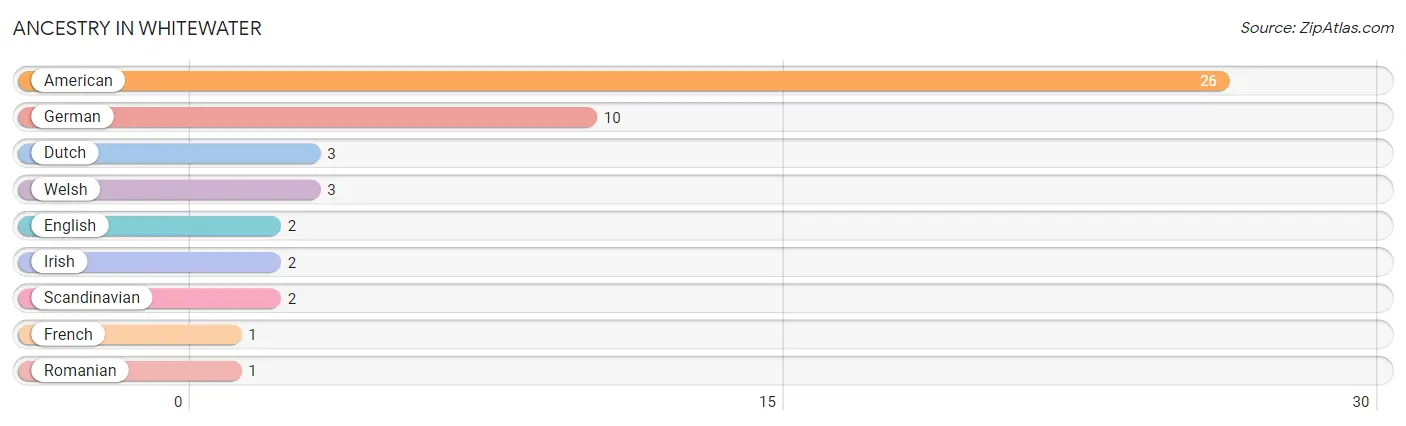
| Ancestry | # Population | % Population |
| American | 26 | 34.7% |
| Dutch | 3 | 4.0% |
| English | 2 | 2.7% |
| French | 1 | 1.3% |
| German | 10 | 13.3% |
| Irish | 2 | 2.7% |
| Romanian | 1 | 1.3% |
| Scandinavian | 2 | 2.7% |
| Welsh | 3 | 4.0% | View All 9 Rows |
Immigrants in Whitewater

| Immigration Origin | # Population | % Population | View All 0 Rows |
Sex and Age in Whitewater
Sex and Age in Whitewater
The most populous age groups in Whitewater are 55 to 59 Years (12 | 28.6%) for men and 70 to 74 Years (7 | 21.2%) for women.
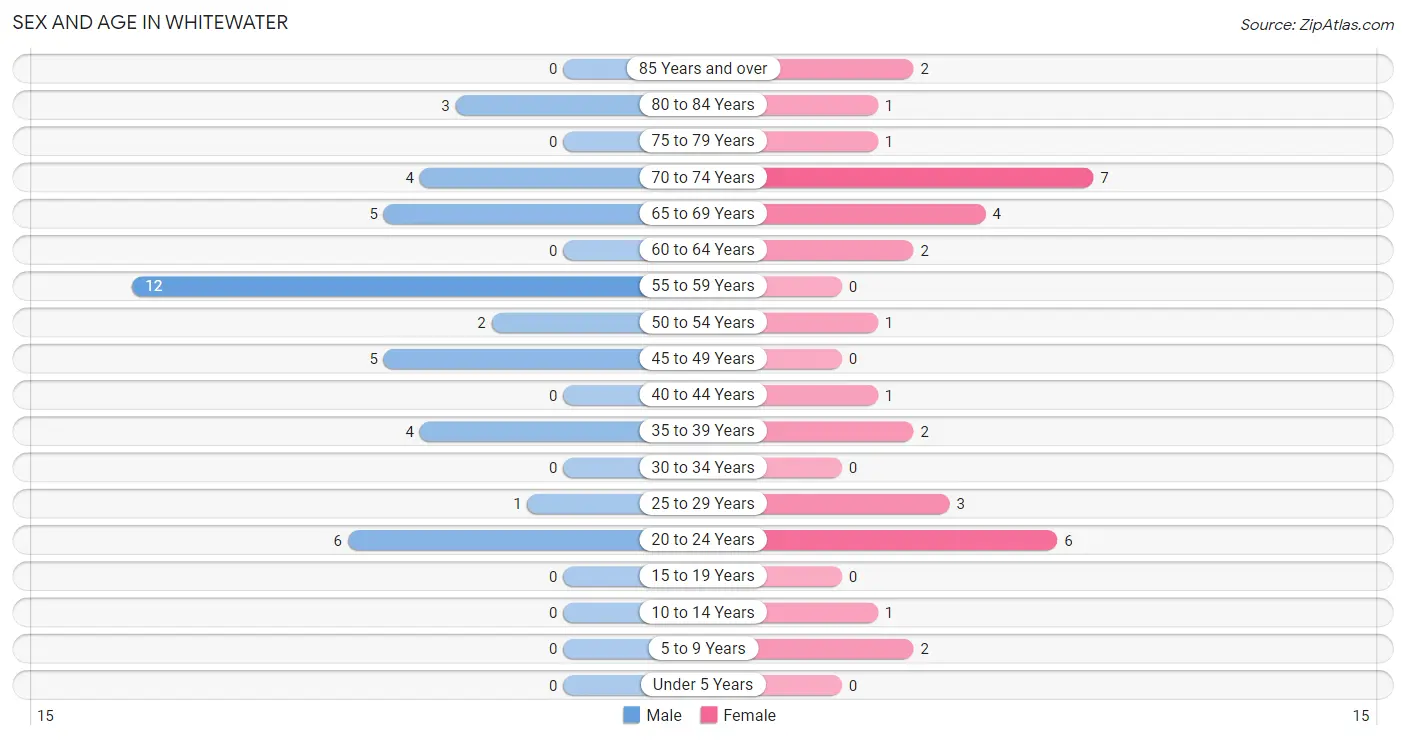
| Age Bracket | Male | Female |
| Under 5 Years | 0 (0.0%) | 0 (0.0%) |
| 5 to 9 Years | 0 (0.0%) | 2 (6.1%) |
| 10 to 14 Years | 0 (0.0%) | 1 (3.0%) |
| 15 to 19 Years | 0 (0.0%) | 0 (0.0%) |
| 20 to 24 Years | 6 (14.3%) | 6 (18.2%) |
| 25 to 29 Years | 1 (2.4%) | 3 (9.1%) |
| 30 to 34 Years | 0 (0.0%) | 0 (0.0%) |
| 35 to 39 Years | 4 (9.5%) | 2 (6.1%) |
| 40 to 44 Years | 0 (0.0%) | 1 (3.0%) |
| 45 to 49 Years | 5 (11.9%) | 0 (0.0%) |
| 50 to 54 Years | 2 (4.8%) | 1 (3.0%) |
| 55 to 59 Years | 12 (28.6%) | 0 (0.0%) |
| 60 to 64 Years | 0 (0.0%) | 2 (6.1%) |
| 65 to 69 Years | 5 (11.9%) | 4 (12.1%) |
| 70 to 74 Years | 4 (9.5%) | 7 (21.2%) |
| 75 to 79 Years | 0 (0.0%) | 1 (3.0%) |
| 80 to 84 Years | 3 (7.1%) | 1 (3.0%) |
| 85 Years and over | 0 (0.0%) | 2 (6.1%) |
| Total | 42 (100.0%) | 33 (100.0%) |
Families and Households in Whitewater
Median Family Size in Whitewater
The median family size in Whitewater is 2.40 persons per family, with single male/father families (5 | 25.0%) accounting for the largest median family size of 3.4 persons per family. On the other hand, married-couple families (10 | 50.0%) represent the smallest median family size with 2.00 persons per family.
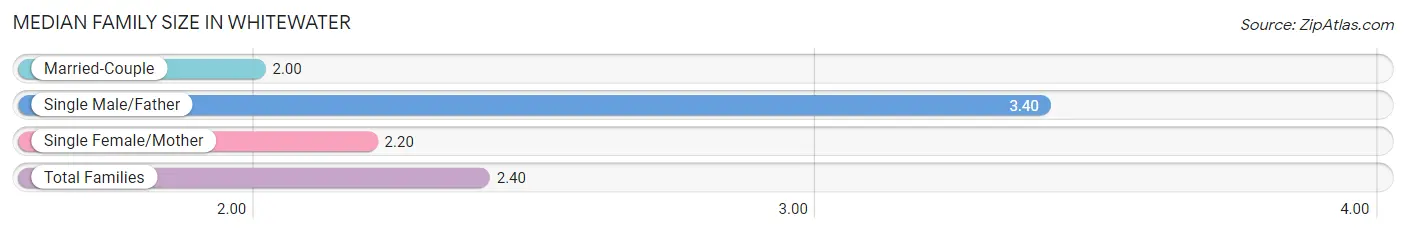
| Family Type | # Families | Family Size |
| Married-Couple | 10 (50.0%) | 2.00 |
| Single Male/Father | 5 (25.0%) | 3.40 |
| Single Female/Mother | 5 (25.0%) | 2.20 |
| Total Families | 20 (100.0%) | 2.40 |
Median Household Size in Whitewater
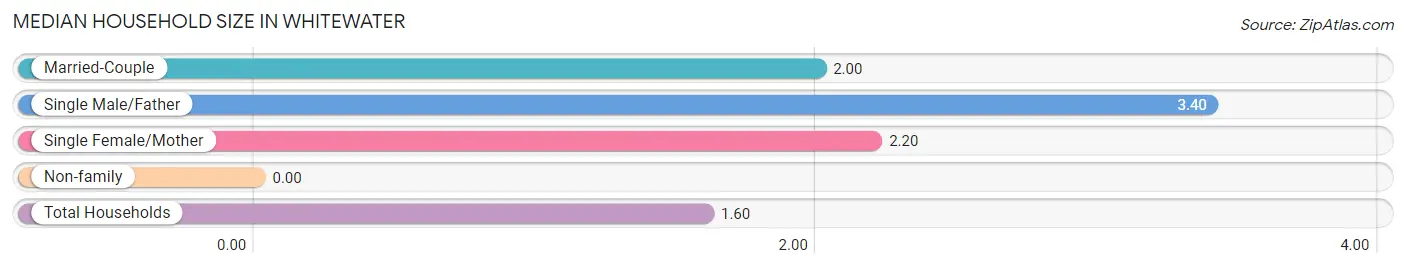
| Household Type | # Households | Household Size |
| Married-Couple | 10 (21.3%) | 2.00 |
| Single Male/Father | 5 (10.6%) | 3.40 |
| Single Female/Mother | 5 (10.6%) | 2.20 |
| Non-family | 27 (57.5%) | - |
| Total Households | 47 (100.0%) | 1.60 |
Household Size by Marriage Status in Whitewater
Out of a total of 47 households in Whitewater, 20 (42.5%) are family households, while 27 (57.5%) are nonfamily households. The most numerous type of family households are 2-person households, comprising 14, and the most common type of nonfamily households are 1-person households, comprising 27.
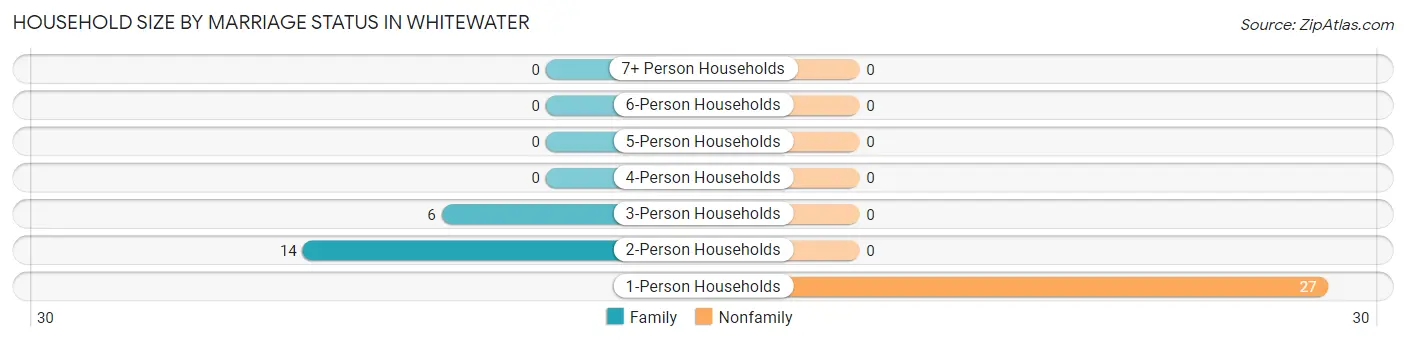
| Household Size | Family Households | Nonfamily Households |
| 1-Person Households | - | 27 (57.5%) |
| 2-Person Households | 14 (29.8%) | 0 (0.0%) |
| 3-Person Households | 6 (12.8%) | 0 (0.0%) |
| 4-Person Households | 0 (0.0%) | 0 (0.0%) |
| 5-Person Households | 0 (0.0%) | 0 (0.0%) |
| 6-Person Households | 0 (0.0%) | 0 (0.0%) |
| 7+ Person Households | 0 (0.0%) | 0 (0.0%) |
| Total | 20 (42.5%) | 27 (57.5%) |
Female Fertility in Whitewater
Fertility by Age in Whitewater
| Age Bracket | Women with Births | Births / 1,000 Women |
| 15 to 19 years | 0 (0.0%) | 0.0 |
| 20 to 34 years | 0 (0.0%) | 0.0 |
| 35 to 50 years | 0 (0.0%) | 0.0 |
| Total | 0 (0.0%) | 0.0 |
Fertility by Age by Marriage Status in Whitewater
| Age Bracket | Married | Unmarried |
| 15 to 19 years | 0 (0.0%) | 0 (0.0%) |
| 20 to 34 years | 0 (0.0%) | 0 (0.0%) |
| 35 to 50 years | 0 (0.0%) | 0 (0.0%) |
| Total | 0 (0.0%) | 0 (0.0%) |
Fertility by Education in Whitewater
| Educational Attainment | Women with Births | Births / 1,000 Women |
| Less than High School | 0 (0.0%) | 0.0 |
| High School Diploma | 0 (0.0%) | 0.0 |
| College or Associate's Degree | 0 (0.0%) | 0.0 |
| Bachelor's Degree | 0 (0.0%) | 0.0 |
| Graduate Degree | 0 (0.0%) | 0.0 |
| Total | 0 (0.0%) | 0.0 |
Fertility by Education by Marriage Status in Whitewater
| Educational Attainment | Married | Unmarried |
| Less than High School | 0 (0.0%) | 0 (0.0%) |
| High School Diploma | 0 (0.0%) | 0 (0.0%) |
| College or Associate's Degree | 0 (0.0%) | 0 (0.0%) |
| Bachelor's Degree | 0 (0.0%) | 0 (0.0%) |
| Graduate Degree | 0 (0.0%) | 0 (0.0%) |
| Total | 0 (0.0%) | 0 (0.0%) |
Employment Characteristics in Whitewater
Employment by Class of Employer in Whitewater
Among the 43 employed individuals in Whitewater, private company employees (33 | 76.7%), not-for-profit organizations (6 | 14.0%), and local government employees (2 | 4.6%) make up the most common classes of employment.
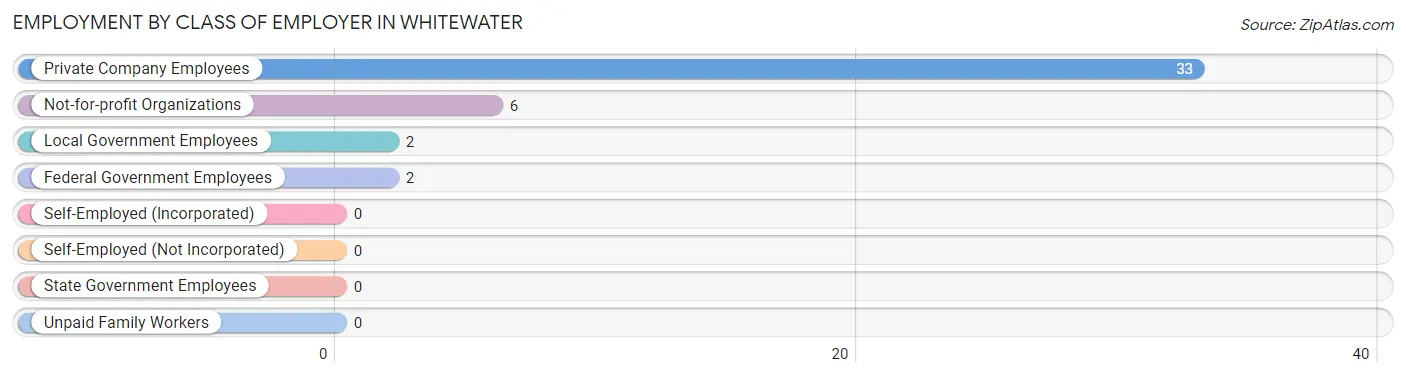
| Employer Class | # Employees | % Employees |
| Private Company Employees | 33 | 76.7% |
| Self-Employed (Incorporated) | 0 | 0.0% |
| Self-Employed (Not Incorporated) | 0 | 0.0% |
| Not-for-profit Organizations | 6 | 14.0% |
| Local Government Employees | 2 | 4.6% |
| State Government Employees | 0 | 0.0% |
| Federal Government Employees | 2 | 4.6% |
| Unpaid Family Workers | 0 | 0.0% |
| Total | 43 | 100.0% |
Employment Status by Age in Whitewater
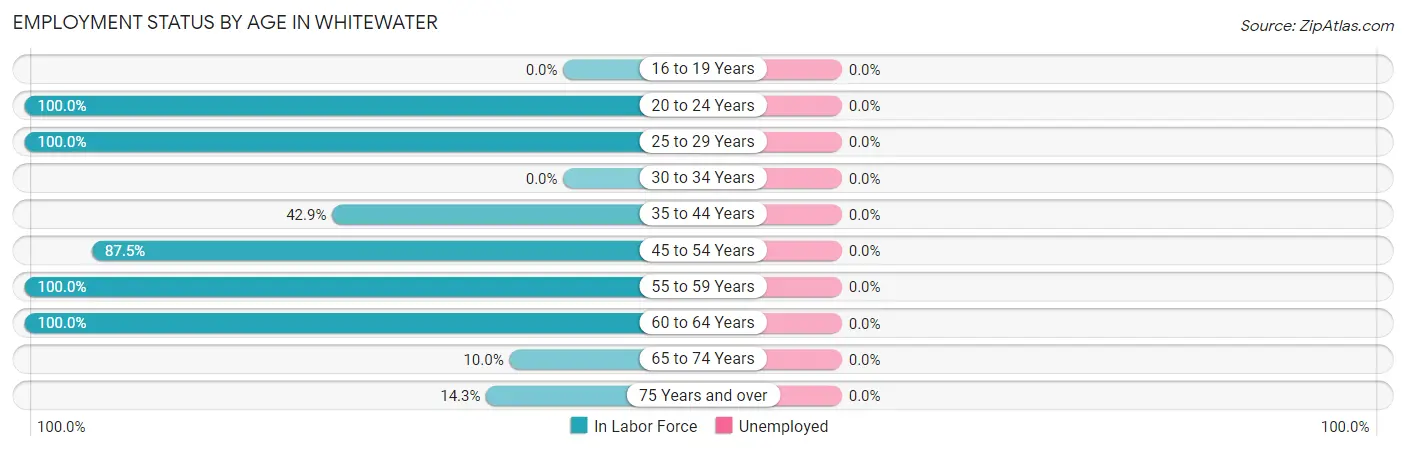
| Age Bracket | In Labor Force | Unemployed |
| 16 to 19 Years | 0 (0.0%) | 0 (0.0%) |
| 20 to 24 Years | 12 (100.0%) | 0 (0.0%) |
| 25 to 29 Years | 4 (100.0%) | 0 (0.0%) |
| 30 to 34 Years | 0 (0.0%) | 0 (0.0%) |
| 35 to 44 Years | 3 (42.9%) | 0 (0.0%) |
| 45 to 54 Years | 7 (87.5%) | 0 (0.0%) |
| 55 to 59 Years | 12 (100.0%) | 0 (0.0%) |
| 60 to 64 Years | 2 (100.0%) | 0 (0.0%) |
| 65 to 74 Years | 2 (10.0%) | 0 (0.0%) |
| 75 Years and over | 1 (14.3%) | 0 (0.0%) |
| Total | 43 (59.7%) | 0 (0.0%) |
Employment Status by Educational Attainment in Whitewater
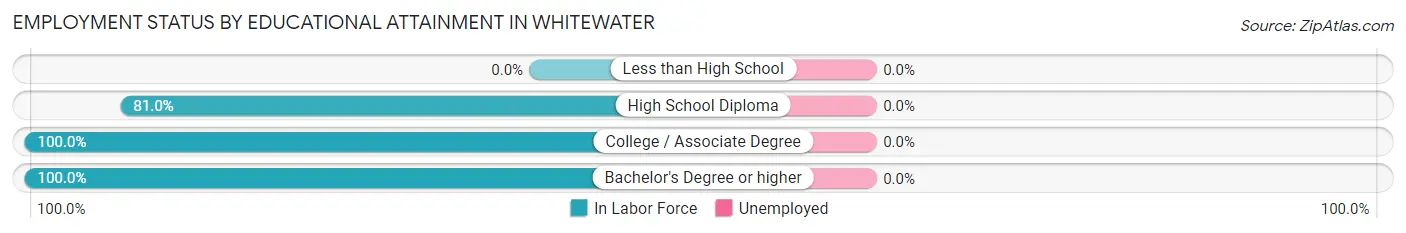
| Educational Attainment | In Labor Force | Unemployed |
| Less than High School | 0 (0.0%) | 0 (0.0%) |
| High School Diploma | 17 (81.0%) | 0 (0.0%) |
| College / Associate Degree | 4 (100.0%) | 0 (0.0%) |
| Bachelor's Degree or higher | 7 (100.0%) | 0 (0.0%) |
| Total | 28 (84.8%) | 0 (0.0%) |
Employment Occupations by Sex in Whitewater
Management, Business, Science and Arts Occupations
The most common Management, Business, Science and Arts occupations in Whitewater are Health Diagnosing & Treating (3 | 7.0%), Management (2 | 4.6%), and Health Technologists (2 | 4.6%).
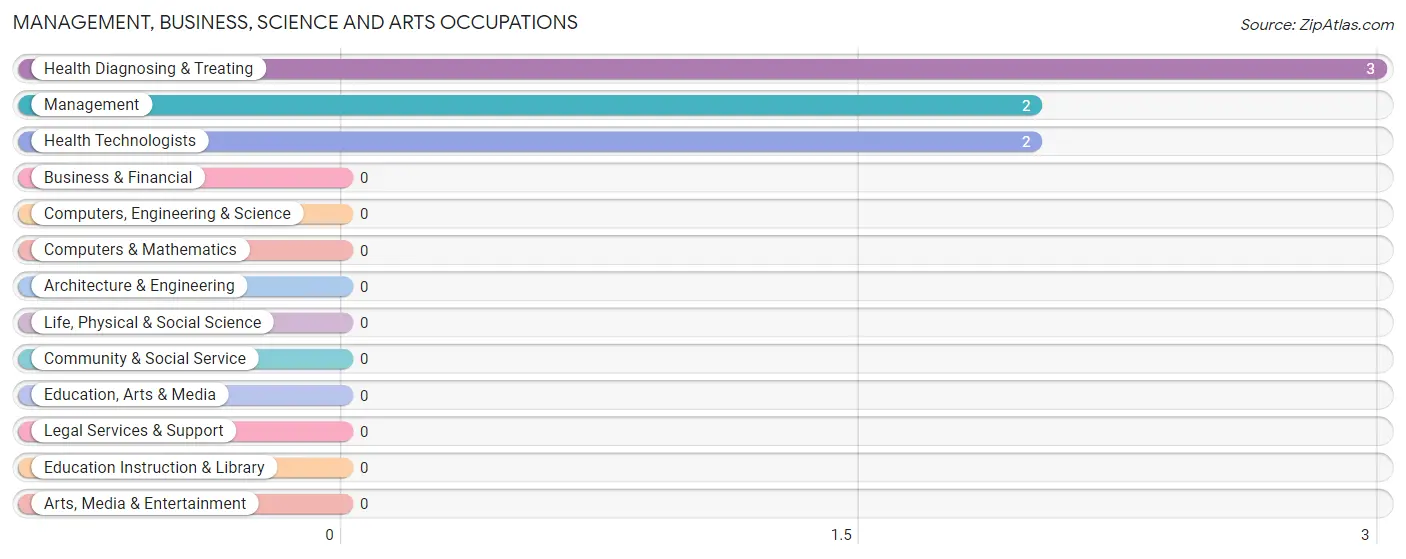
Management, Business, Science and Arts Occupations by Sex
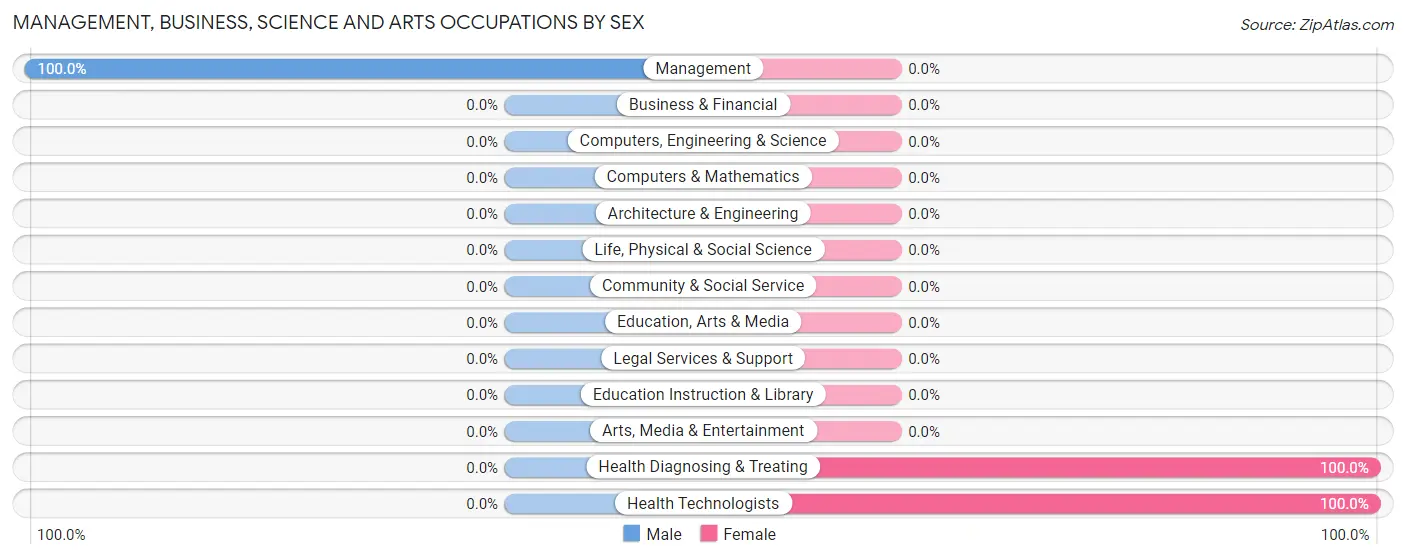
| Occupation | Male | Female |
| Management | 2 (100.0%) | 0 (0.0%) |
| Business & Financial | 0 (0.0%) | 0 (0.0%) |
| Computers, Engineering & Science | 0 (0.0%) | 0 (0.0%) |
| Computers & Mathematics | 0 (0.0%) | 0 (0.0%) |
| Architecture & Engineering | 0 (0.0%) | 0 (0.0%) |
| Life, Physical & Social Science | 0 (0.0%) | 0 (0.0%) |
| Community & Social Service | 0 (0.0%) | 0 (0.0%) |
| Education, Arts & Media | 0 (0.0%) | 0 (0.0%) |
| Legal Services & Support | 0 (0.0%) | 0 (0.0%) |
| Education Instruction & Library | 0 (0.0%) | 0 (0.0%) |
| Arts, Media & Entertainment | 0 (0.0%) | 0 (0.0%) |
| Health Diagnosing & Treating | 0 (0.0%) | 3 (100.0%) |
| Health Technologists | 0 (0.0%) | 2 (100.0%) |
| Total (Category) | 2 (40.0%) | 3 (60.0%) |
| Total (Overall) | 27 (62.8%) | 16 (37.2%) |
Services Occupations
The most common Services occupations in Whitewater are , and Healthcare Support (2 | 4.6%).
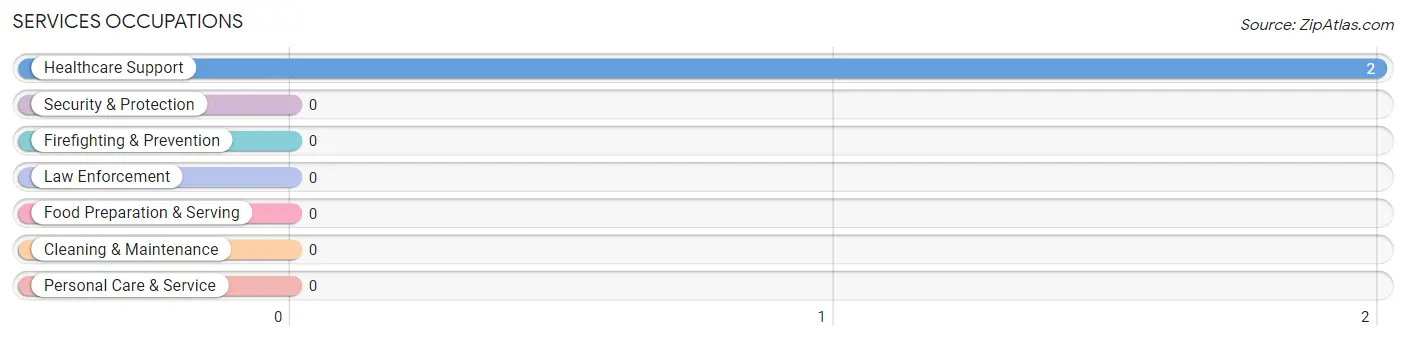
Services Occupations by Sex
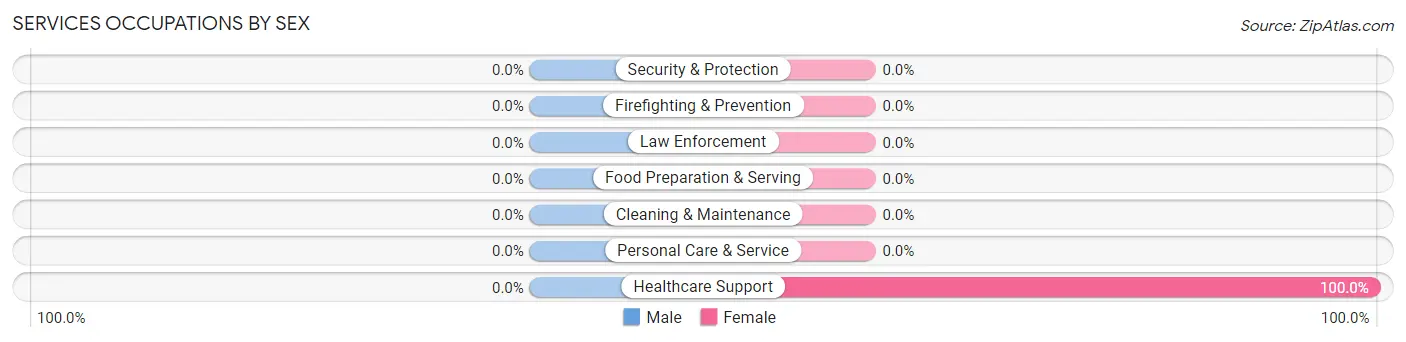
| Occupation | Male | Female |
| Healthcare Support | 0 (0.0%) | 2 (100.0%) |
| Security & Protection | 0 (0.0%) | 0 (0.0%) |
| Firefighting & Prevention | 0 (0.0%) | 0 (0.0%) |
| Law Enforcement | 0 (0.0%) | 0 (0.0%) |
| Food Preparation & Serving | 0 (0.0%) | 0 (0.0%) |
| Cleaning & Maintenance | 0 (0.0%) | 0 (0.0%) |
| Personal Care & Service | 0 (0.0%) | 0 (0.0%) |
| Total (Category) | 0 (0.0%) | 2 (100.0%) |
| Total (Overall) | 27 (62.8%) | 16 (37.2%) |
Sales and Office Occupations
The most common Sales and Office occupations in Whitewater are , and Office & Administration (8 | 18.6%).
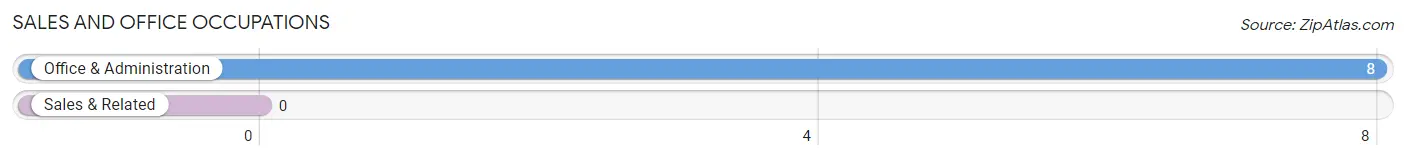
Sales and Office Occupations by Sex
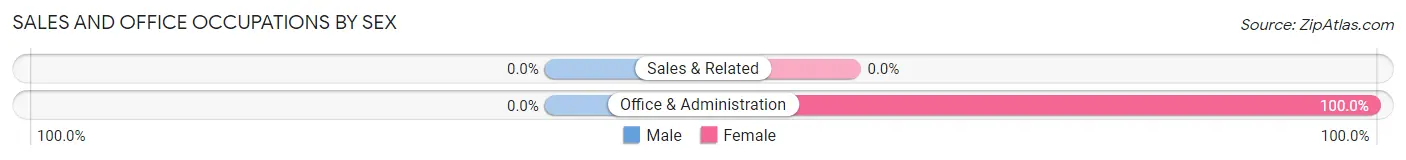
| Occupation | Male | Female |
| Sales & Related | 0 (0.0%) | 0 (0.0%) |
| Office & Administration | 0 (0.0%) | 8 (100.0%) |
| Total (Category) | 0 (0.0%) | 8 (100.0%) |
| Total (Overall) | 27 (62.8%) | 16 (37.2%) |
Natural Resources, Construction and Maintenance Occupations
The most common Natural Resources, Construction and Maintenance occupations in Whitewater are , and Construction & Extraction (17 | 39.5%).
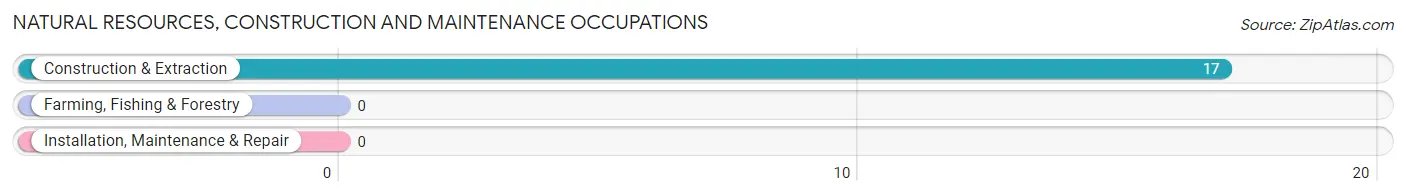
Natural Resources, Construction and Maintenance Occupations by Sex
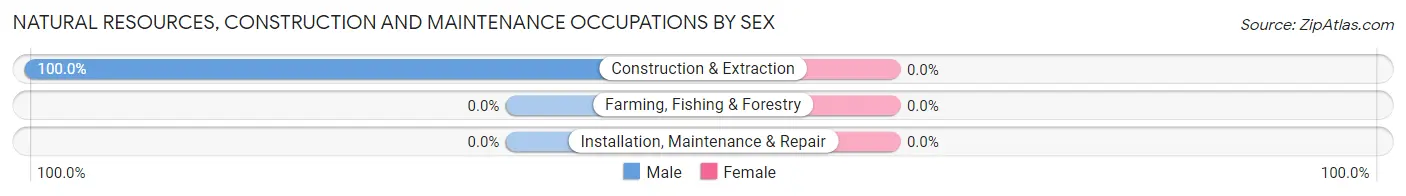
| Occupation | Male | Female |
| Farming, Fishing & Forestry | 0 (0.0%) | 0 (0.0%) |
| Construction & Extraction | 17 (100.0%) | 0 (0.0%) |
| Installation, Maintenance & Repair | 0 (0.0%) | 0 (0.0%) |
| Total (Category) | 17 (100.0%) | 0 (0.0%) |
| Total (Overall) | 27 (62.8%) | 16 (37.2%) |
Production, Transportation and Moving Occupations
The most common Production, Transportation and Moving occupations in Whitewater are Production (8 | 18.6%), and Transportation (3 | 7.0%).
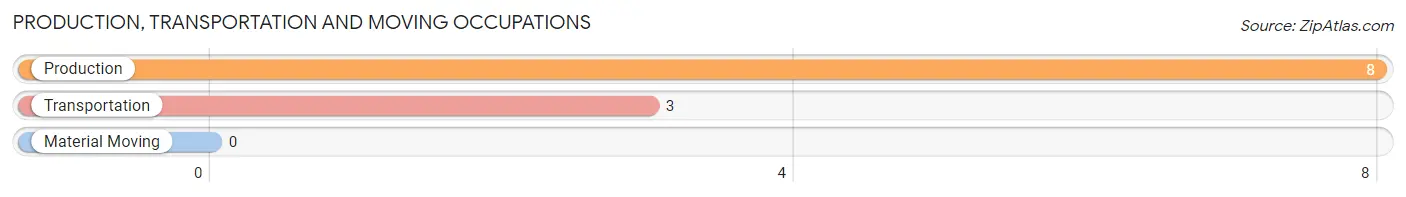
Production, Transportation and Moving Occupations by Sex
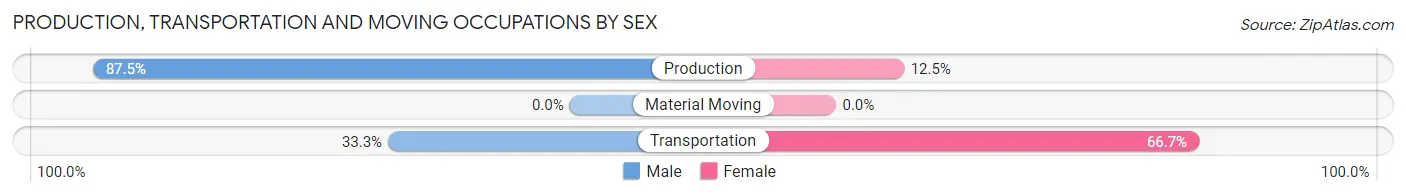
| Occupation | Male | Female |
| Production | 7 (87.5%) | 1 (12.5%) |
| Transportation | 1 (33.3%) | 2 (66.7%) |
| Material Moving | 0 (0.0%) | 0 (0.0%) |
| Total (Category) | 8 (72.7%) | 3 (27.3%) |
| Total (Overall) | 27 (62.8%) | 16 (37.2%) |
Employment Industries by Sex in Whitewater
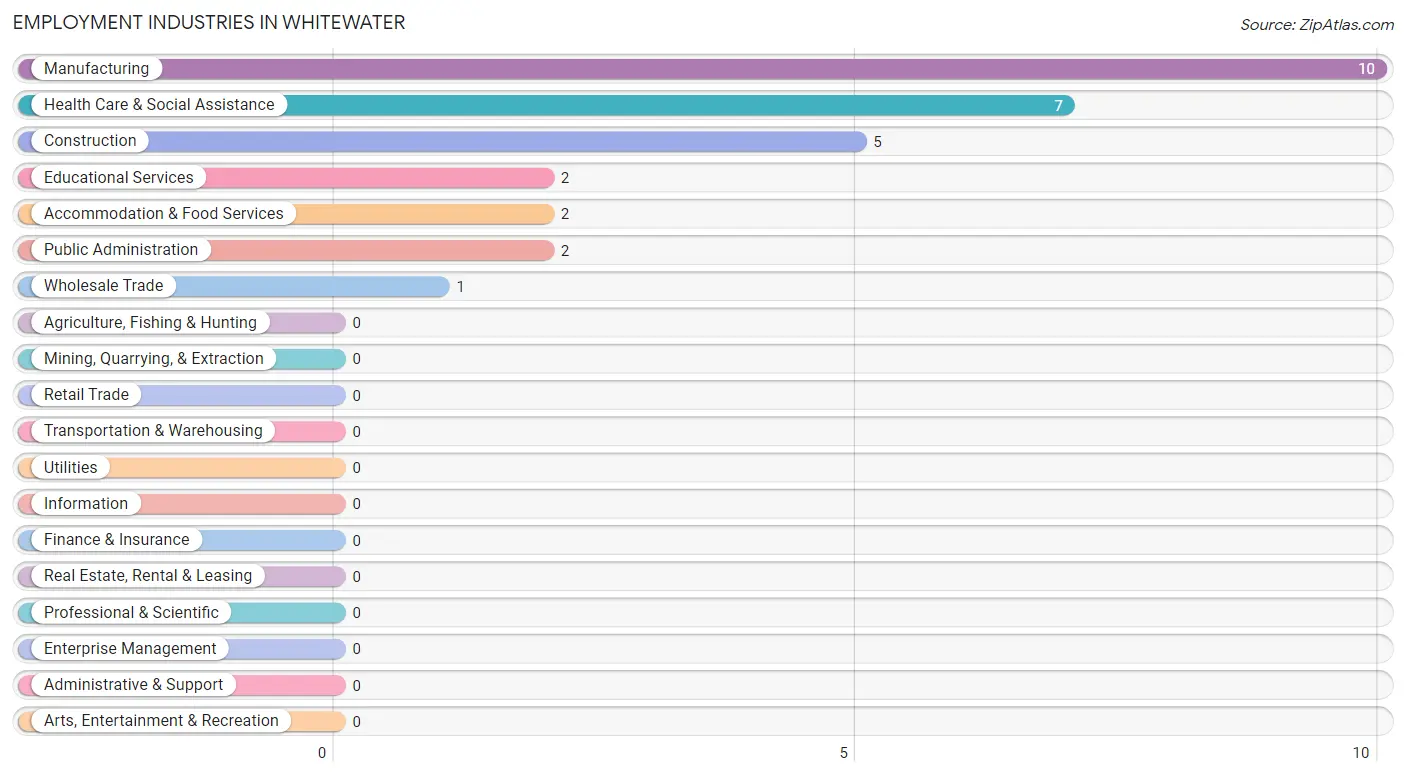
Employment Industries in Whitewater
The major employment industries in Whitewater include Manufacturing (10 | 23.3%), Health Care & Social Assistance (7 | 16.3%), Construction (5 | 11.6%), Educational Services (2 | 4.6%), and Accommodation & Food Services (2 | 4.6%).
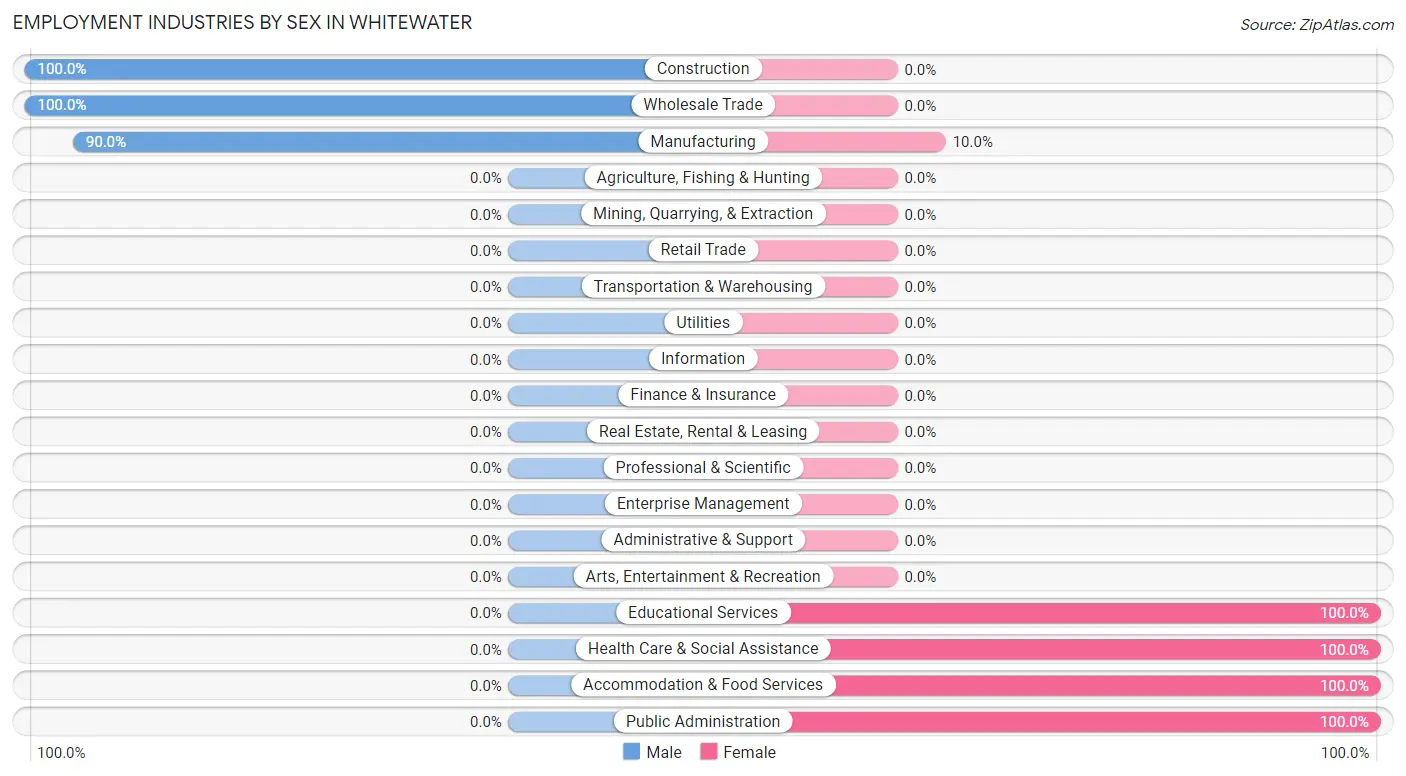
Employment Industries by Sex in Whitewater
The Whitewater industries that see more men than women are Construction (100.0%), Wholesale Trade (100.0%), and Manufacturing (90.0%), whereas the industries that tend to have a higher number of women are Educational Services (100.0%), Health Care & Social Assistance (100.0%), and Accommodation & Food Services (100.0%).
| Industry | Male | Female |
| Agriculture, Fishing & Hunting | 0 (0.0%) | 0 (0.0%) |
| Mining, Quarrying, & Extraction | 0 (0.0%) | 0 (0.0%) |
| Construction | 5 (100.0%) | 0 (0.0%) |
| Manufacturing | 9 (90.0%) | 1 (10.0%) |
| Wholesale Trade | 1 (100.0%) | 0 (0.0%) |
| Retail Trade | 0 (0.0%) | 0 (0.0%) |
| Transportation & Warehousing | 0 (0.0%) | 0 (0.0%) |
| Utilities | 0 (0.0%) | 0 (0.0%) |
| Information | 0 (0.0%) | 0 (0.0%) |
| Finance & Insurance | 0 (0.0%) | 0 (0.0%) |
| Real Estate, Rental & Leasing | 0 (0.0%) | 0 (0.0%) |
| Professional & Scientific | 0 (0.0%) | 0 (0.0%) |
| Enterprise Management | 0 (0.0%) | 0 (0.0%) |
| Administrative & Support | 0 (0.0%) | 0 (0.0%) |
| Educational Services | 0 (0.0%) | 2 (100.0%) |
| Health Care & Social Assistance | 0 (0.0%) | 7 (100.0%) |
| Arts, Entertainment & Recreation | 0 (0.0%) | 0 (0.0%) |
| Accommodation & Food Services | 0 (0.0%) | 2 (100.0%) |
| Public Administration | 0 (0.0%) | 2 (100.0%) |
| Total | 27 (62.8%) | 16 (37.2%) |
Education in Whitewater
School Enrollment in Whitewater
The most common levels of schooling among the 3 students in Whitewater are elementary school (2 | 66.7%), and middle school (1 | 33.3%).
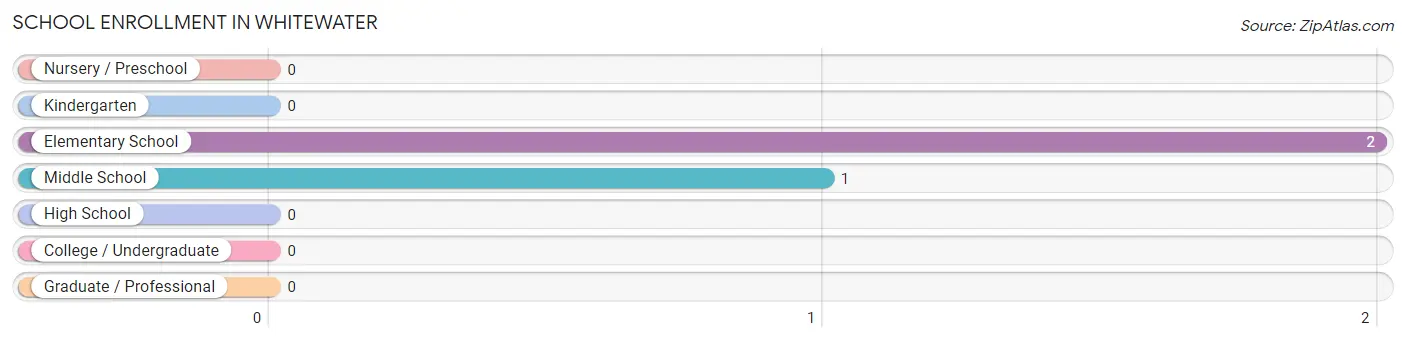
| School Level | # Students | % Students |
| Nursery / Preschool | 0 | 0.0% |
| Kindergarten | 0 | 0.0% |
| Elementary School | 2 | 66.7% |
| Middle School | 1 | 33.3% |
| High School | 0 | 0.0% |
| College / Undergraduate | 0 | 0.0% |
| Graduate / Professional | 0 | 0.0% |
| Total | 3 | 100.0% |
School Enrollment by Age by Funding Source in Whitewater
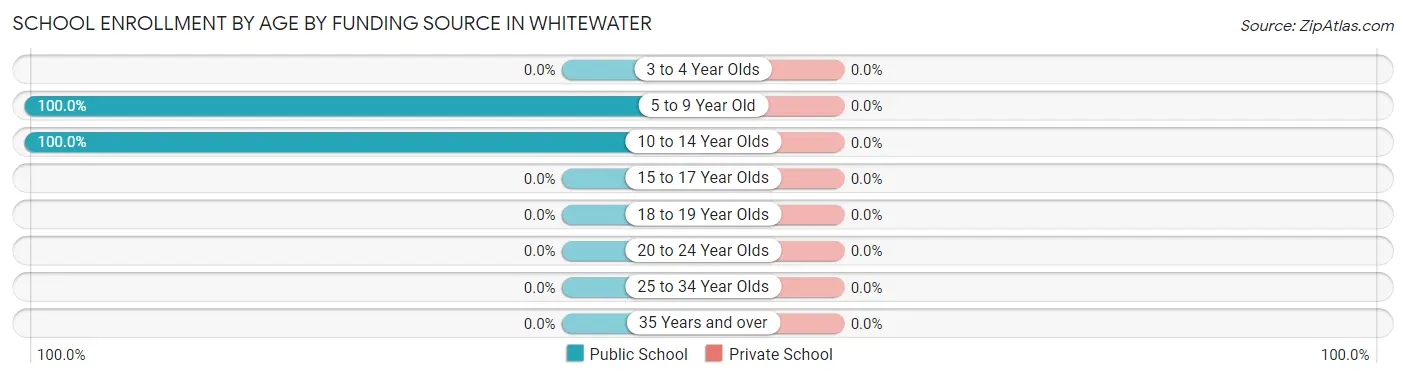
| Age Bracket | Public School | Private School |
| 3 to 4 Year Olds | 0 (0.0%) | 0 (0.0%) |
| 5 to 9 Year Old | 2 (100.0%) | 0 (0.0%) |
| 10 to 14 Year Olds | 1 (100.0%) | 0 (0.0%) |
| 15 to 17 Year Olds | 0 (0.0%) | 0 (0.0%) |
| 18 to 19 Year Olds | 0 (0.0%) | 0 (0.0%) |
| 20 to 24 Year Olds | 0 (0.0%) | 0 (0.0%) |
| 25 to 34 Year Olds | 0 (0.0%) | 0 (0.0%) |
| 35 Years and over | 0 (0.0%) | 0 (0.0%) |
| Total | 3 (100.0%) | 0 (0.0%) |
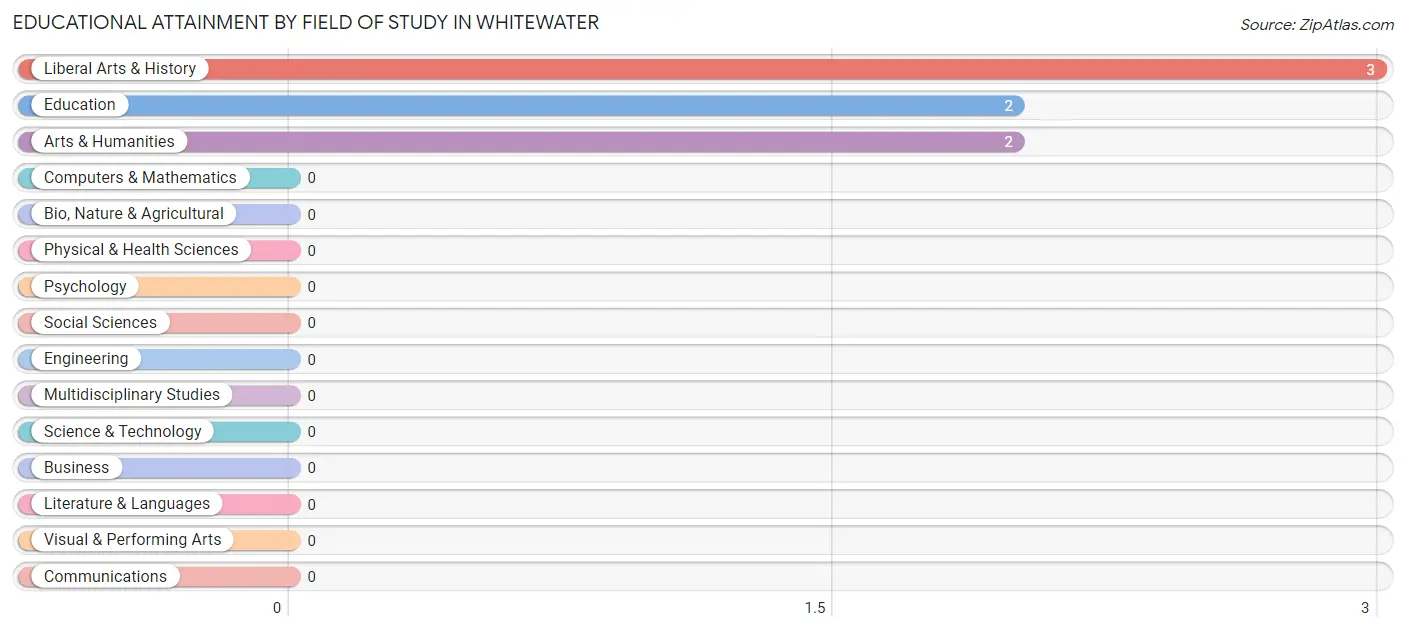
Educational Attainment by Field of Study in Whitewater
Liberal arts & history (3 | 42.9%), education (2 | 28.6%), and arts & humanities (2 | 28.6%) are the most common fields of study among 7 individuals in Whitewater who have obtained a bachelor's degree or higher.
| Field of Study | # Graduates | % Graduates |
| Computers & Mathematics | 0 | 0.0% |
| Bio, Nature & Agricultural | 0 | 0.0% |
| Physical & Health Sciences | 0 | 0.0% |
| Psychology | 0 | 0.0% |
| Social Sciences | 0 | 0.0% |
| Engineering | 0 | 0.0% |
| Multidisciplinary Studies | 0 | 0.0% |
| Science & Technology | 0 | 0.0% |
| Business | 0 | 0.0% |
| Education | 2 | 28.6% |
| Literature & Languages | 0 | 0.0% |
| Liberal Arts & History | 3 | 42.9% |
| Visual & Performing Arts | 0 | 0.0% |
| Communications | 0 | 0.0% |
| Arts & Humanities | 2 | 28.6% |
| Total | 7 | 100.0% |
Transportation & Commute in Whitewater
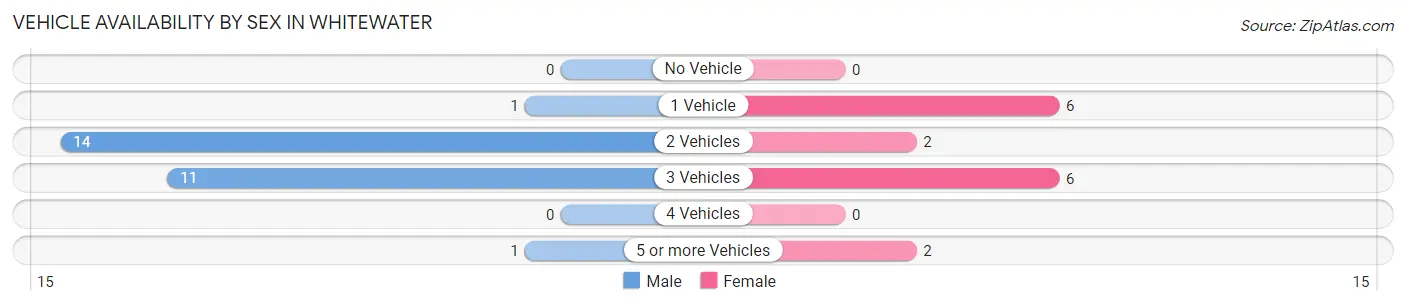
Vehicle Availability by Sex in Whitewater
The most prevalent vehicle ownership categories in Whitewater are males with 2 vehicles (14, accounting for 51.8%) and females with 2 vehicles (2, making up 87.5%).
| Vehicles Available | Male | Female |
| No Vehicle | 0 (0.0%) | 0 (0.0%) |
| 1 Vehicle | 1 (3.7%) | 6 (37.5%) |
| 2 Vehicles | 14 (51.8%) | 2 (12.5%) |
| 3 Vehicles | 11 (40.7%) | 6 (37.5%) |
| 4 Vehicles | 0 (0.0%) | 0 (0.0%) |
| 5 or more Vehicles | 1 (3.7%) | 2 (12.5%) |
| Total | 27 (100.0%) | 16 (100.0%) |
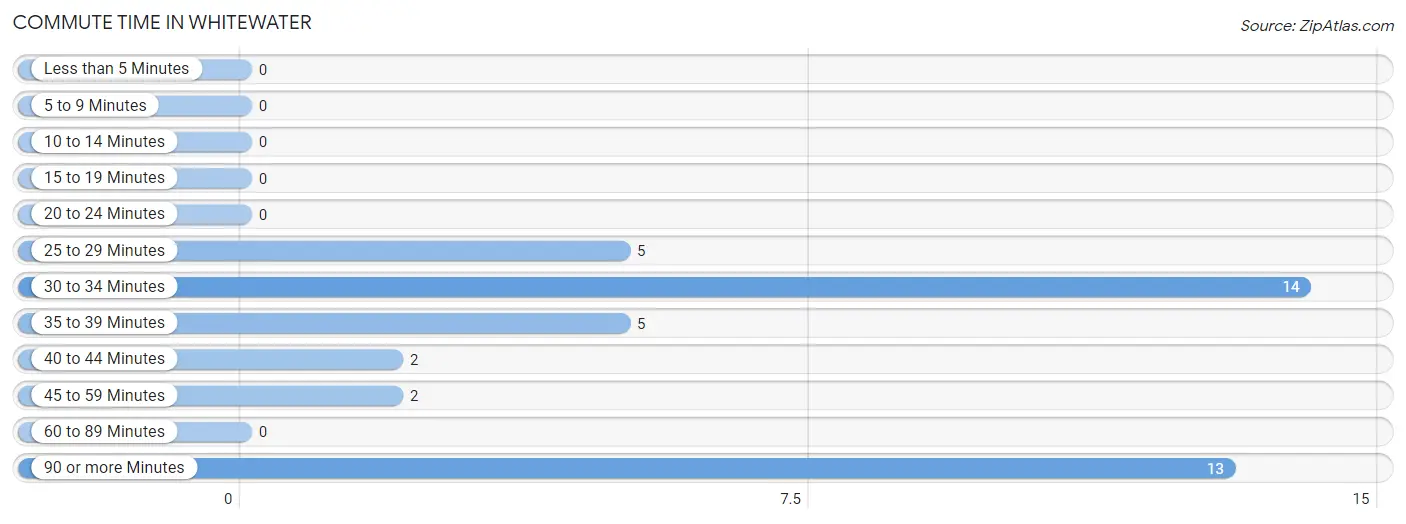
Commute Time in Whitewater
The most frequently occuring commute durations in Whitewater are 30 to 34 minutes (14 commuters, 34.2%), 90 or more minutes (13 commuters, 31.7%), and 25 to 29 minutes (5 commuters, 12.2%).
| Commute Time | # Commuters | % Commuters |
| Less than 5 Minutes | 0 | 0.0% |
| 5 to 9 Minutes | 0 | 0.0% |
| 10 to 14 Minutes | 0 | 0.0% |
| 15 to 19 Minutes | 0 | 0.0% |
| 20 to 24 Minutes | 0 | 0.0% |
| 25 to 29 Minutes | 5 | 12.2% |
| 30 to 34 Minutes | 14 | 34.2% |
| 35 to 39 Minutes | 5 | 12.2% |
| 40 to 44 Minutes | 2 | 4.9% |
| 45 to 59 Minutes | 2 | 4.9% |
| 60 to 89 Minutes | 0 | 0.0% |
| 90 or more Minutes | 13 | 31.7% |
Commute Time by Sex in Whitewater
The most common commute times in Whitewater are 90 or more minutes (12 commuters, 44.4%) for males and 30 to 34 minutes (8 commuters, 57.1%) for females.
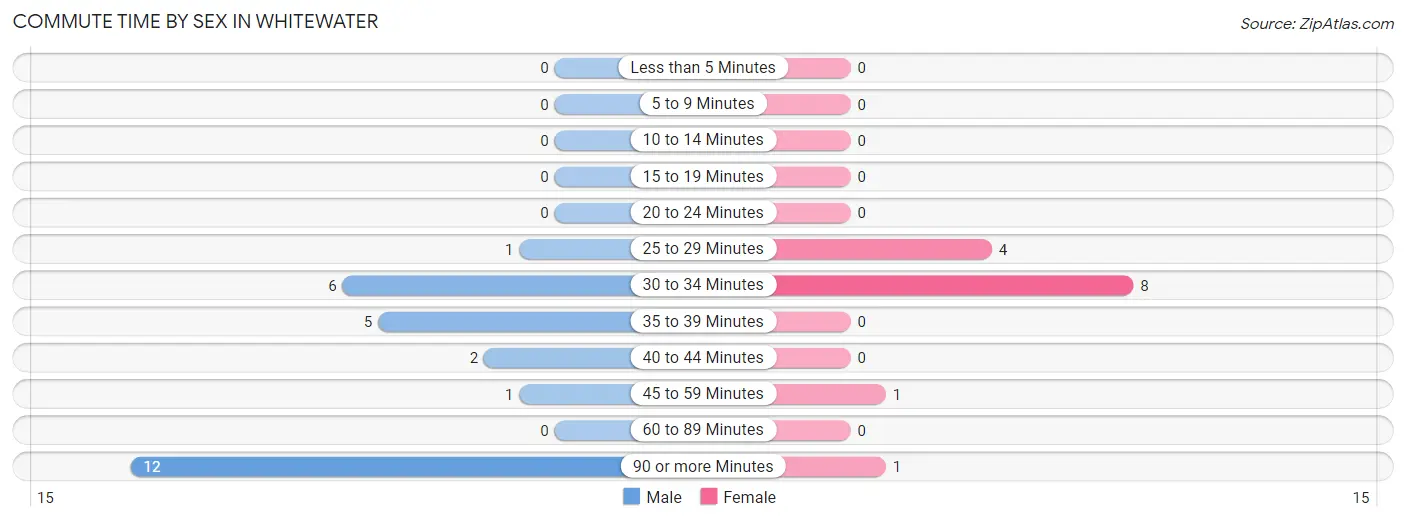
| Commute Time | Male | Female |
| Less than 5 Minutes | 0 (0.0%) | 0 (0.0%) |
| 5 to 9 Minutes | 0 (0.0%) | 0 (0.0%) |
| 10 to 14 Minutes | 0 (0.0%) | 0 (0.0%) |
| 15 to 19 Minutes | 0 (0.0%) | 0 (0.0%) |
| 20 to 24 Minutes | 0 (0.0%) | 0 (0.0%) |
| 25 to 29 Minutes | 1 (3.7%) | 4 (28.6%) |
| 30 to 34 Minutes | 6 (22.2%) | 8 (57.1%) |
| 35 to 39 Minutes | 5 (18.5%) | 0 (0.0%) |
| 40 to 44 Minutes | 2 (7.4%) | 0 (0.0%) |
| 45 to 59 Minutes | 1 (3.7%) | 1 (7.1%) |
| 60 to 89 Minutes | 0 (0.0%) | 0 (0.0%) |
| 90 or more Minutes | 12 (44.4%) | 1 (7.1%) |
Time of Departure to Work by Sex in Whitewater
The most frequent times of departure to work in Whitewater are 6:00 AM to 6:29 AM (18, 66.7%) for males and 8:00 AM to 8:29 AM (10, 71.4%) for females.
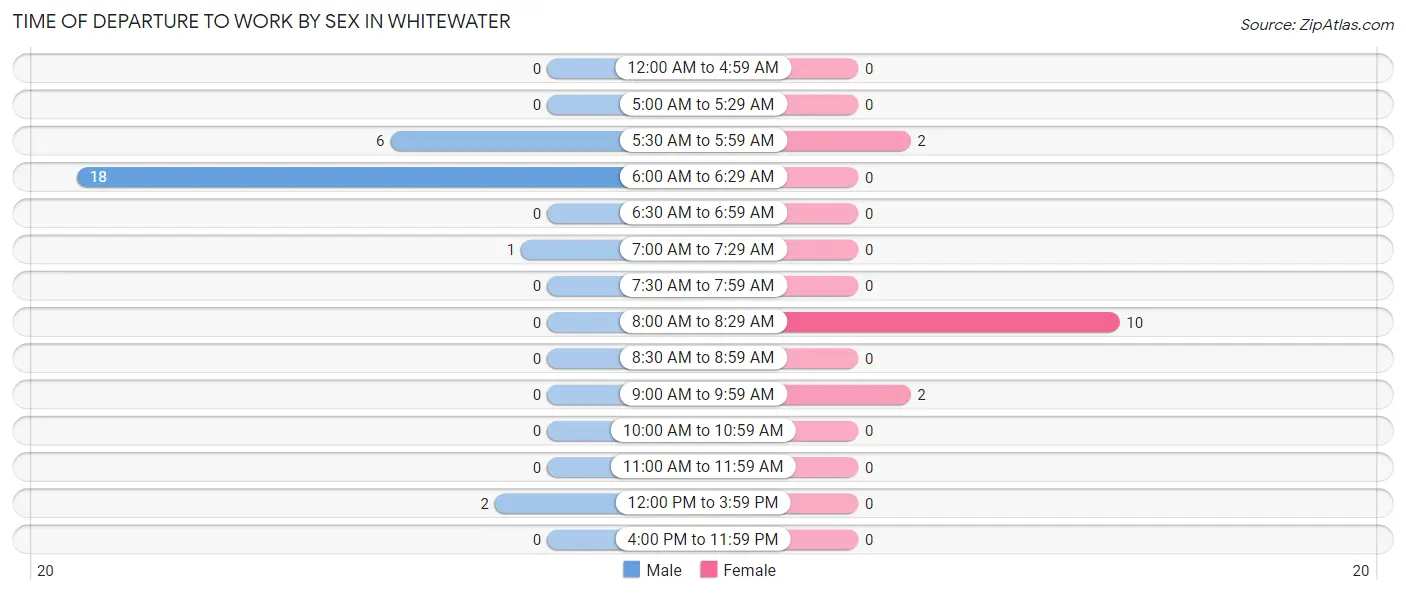
| Time of Departure | Male | Female |
| 12:00 AM to 4:59 AM | 0 (0.0%) | 0 (0.0%) |
| 5:00 AM to 5:29 AM | 0 (0.0%) | 0 (0.0%) |
| 5:30 AM to 5:59 AM | 6 (22.2%) | 2 (14.3%) |
| 6:00 AM to 6:29 AM | 18 (66.7%) | 0 (0.0%) |
| 6:30 AM to 6:59 AM | 0 (0.0%) | 0 (0.0%) |
| 7:00 AM to 7:29 AM | 1 (3.7%) | 0 (0.0%) |
| 7:30 AM to 7:59 AM | 0 (0.0%) | 0 (0.0%) |
| 8:00 AM to 8:29 AM | 0 (0.0%) | 10 (71.4%) |
| 8:30 AM to 8:59 AM | 0 (0.0%) | 0 (0.0%) |
| 9:00 AM to 9:59 AM | 0 (0.0%) | 2 (14.3%) |
| 10:00 AM to 10:59 AM | 0 (0.0%) | 0 (0.0%) |
| 11:00 AM to 11:59 AM | 0 (0.0%) | 0 (0.0%) |
| 12:00 PM to 3:59 PM | 2 (7.4%) | 0 (0.0%) |
| 4:00 PM to 11:59 PM | 0 (0.0%) | 0 (0.0%) |
| Total | 27 (100.0%) | 14 (100.0%) |
Housing Occupancy in Whitewater
Occupancy by Ownership in Whitewater
Of the total 47 dwellings in Whitewater, owner-occupied units account for 42 (89.4%), while renter-occupied units make up 5 (10.6%).
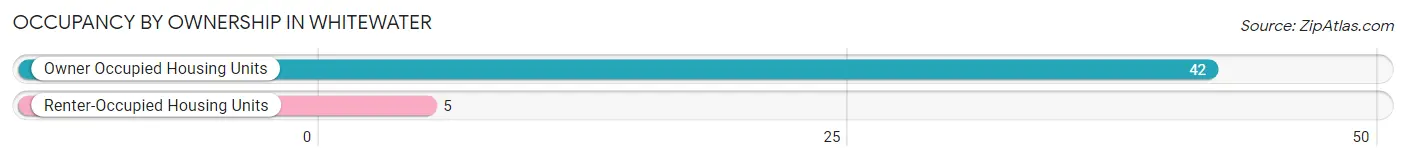
| Occupancy | # Housing Units | % Housing Units |
| Owner Occupied Housing Units | 42 | 89.4% |
| Renter-Occupied Housing Units | 5 | 10.6% |
| Total Occupied Housing Units | 47 | 100.0% |
Occupancy by Household Size in Whitewater
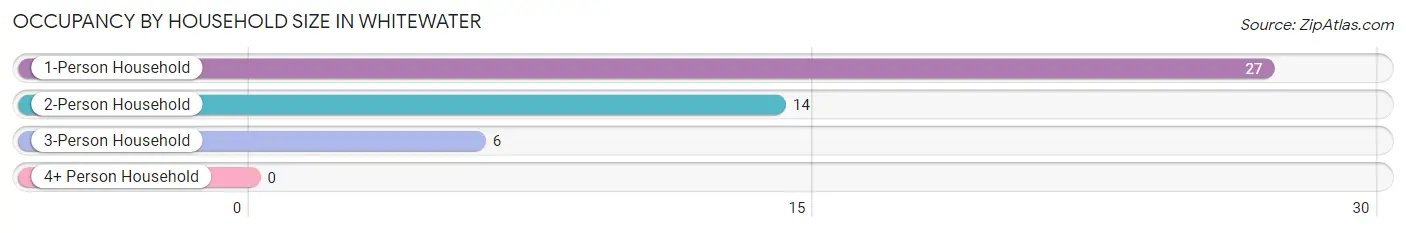
| Household Size | # Housing Units | % Housing Units |
| 1-Person Household | 27 | 57.5% |
| 2-Person Household | 14 | 29.8% |
| 3-Person Household | 6 | 12.8% |
| 4+ Person Household | 0 | 0.0% |
| Total Housing Units | 47 | 100.0% |
Occupancy by Ownership by Household Size in Whitewater
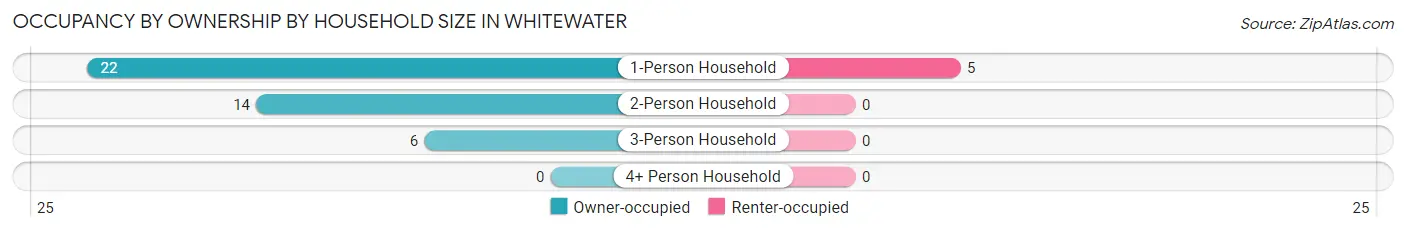
| Household Size | Owner-occupied | Renter-occupied |
| 1-Person Household | 22 (81.5%) | 5 (18.5%) |
| 2-Person Household | 14 (100.0%) | 0 (0.0%) |
| 3-Person Household | 6 (100.0%) | 0 (0.0%) |
| 4+ Person Household | 0 (0.0%) | 0 (0.0%) |
| Total Housing Units | 42 (89.4%) | 5 (10.6%) |
Occupancy by Educational Attainment in Whitewater
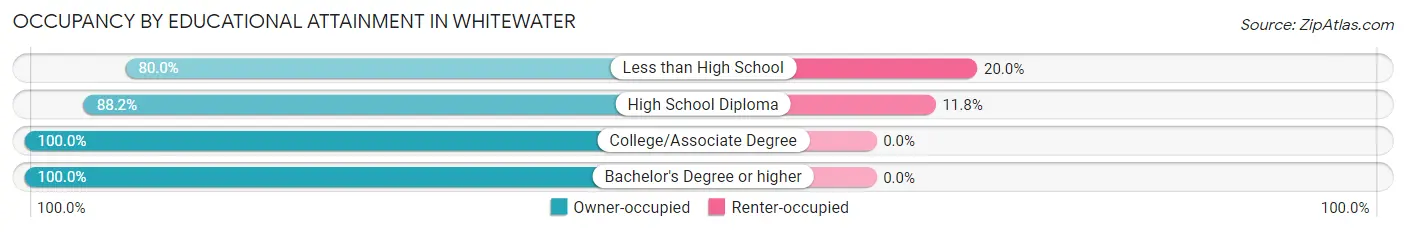
| Household Size | Owner-occupied | Renter-occupied |
| Less than High School | 4 (80.0%) | 1 (20.0%) |
| High School Diploma | 30 (88.2%) | 4 (11.8%) |
| College/Associate Degree | 5 (100.0%) | 0 (0.0%) |
| Bachelor's Degree or higher | 3 (100.0%) | 0 (0.0%) |
Occupancy by Age of Householder in Whitewater
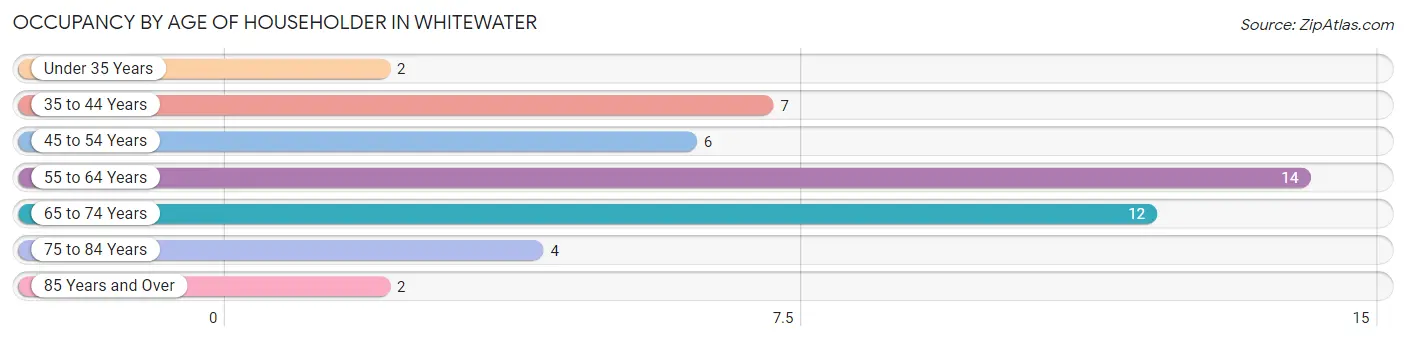
| Age Bracket | # Households | % Households |
| Under 35 Years | 2 | 4.3% |
| 35 to 44 Years | 7 | 14.9% |
| 45 to 54 Years | 6 | 12.8% |
| 55 to 64 Years | 14 | 29.8% |
| 65 to 74 Years | 12 | 25.5% |
| 75 to 84 Years | 4 | 8.5% |
| 85 Years and Over | 2 | 4.3% |
| Total | 47 | 100.0% |
Housing Finances in Whitewater
Median Income by Occupancy in Whitewater
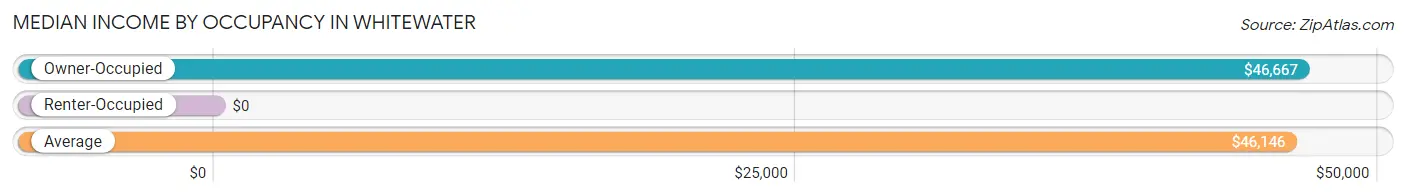
| Occupancy Type | # Households | Median Income |
| Owner-Occupied | 42 (89.4%) | $46,667 |
| Renter-Occupied | 5 (10.6%) | $0 |
| Average | 47 (100.0%) | $46,146 |
Occupancy by Householder Income Bracket in Whitewater
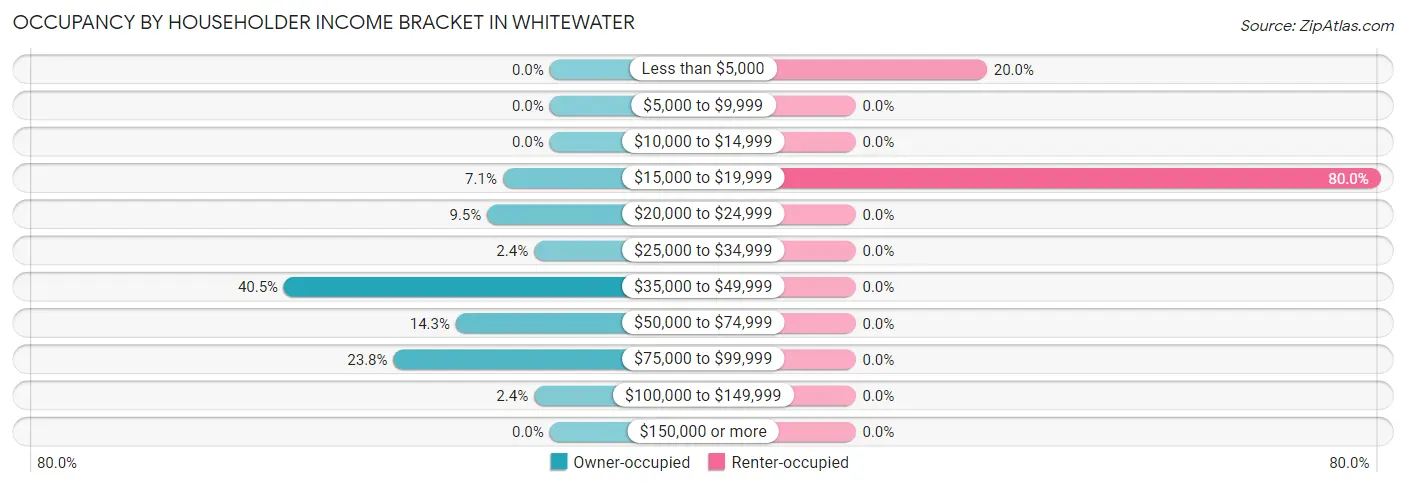
| Income Bracket | Owner-occupied | Renter-occupied |
| Less than $5,000 | 0 (0.0%) | 1 (20.0%) |
| $5,000 to $9,999 | 0 (0.0%) | 0 (0.0%) |
| $10,000 to $14,999 | 0 (0.0%) | 0 (0.0%) |
| $15,000 to $19,999 | 3 (7.1%) | 4 (80.0%) |
| $20,000 to $24,999 | 4 (9.5%) | 0 (0.0%) |
| $25,000 to $34,999 | 1 (2.4%) | 0 (0.0%) |
| $35,000 to $49,999 | 17 (40.5%) | 0 (0.0%) |
| $50,000 to $74,999 | 6 (14.3%) | 0 (0.0%) |
| $75,000 to $99,999 | 10 (23.8%) | 0 (0.0%) |
| $100,000 to $149,999 | 1 (2.4%) | 0 (0.0%) |
| $150,000 or more | 0 (0.0%) | 0 (0.0%) |
| Total | 42 (100.0%) | 5 (100.0%) |
Monthly Housing Cost Tiers in Whitewater
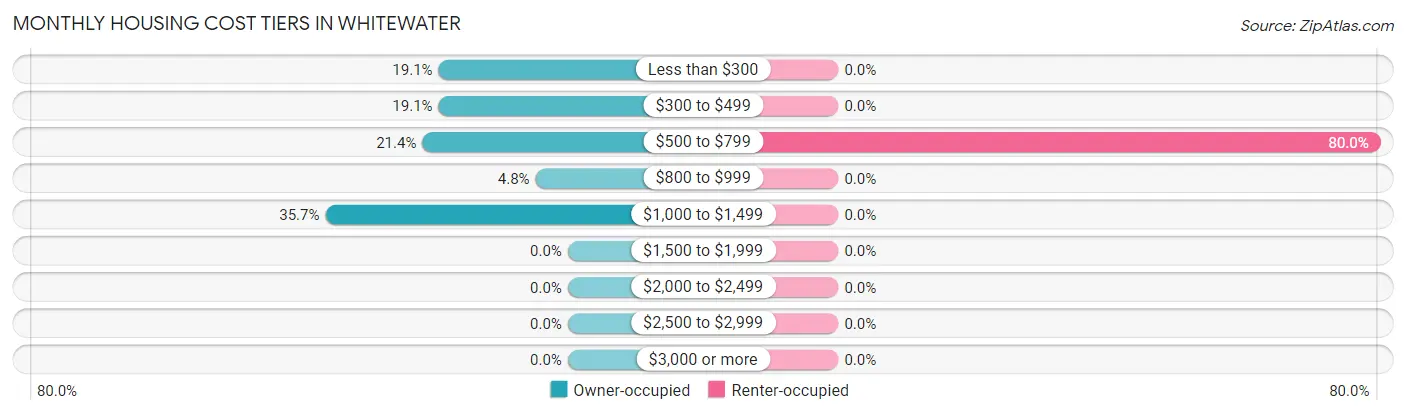
| Monthly Cost | Owner-occupied | Renter-occupied |
| Less than $300 | 8 (19.1%) | 0 (0.0%) |
| $300 to $499 | 8 (19.1%) | 0 (0.0%) |
| $500 to $799 | 9 (21.4%) | 4 (80.0%) |
| $800 to $999 | 2 (4.8%) | 0 (0.0%) |
| $1,000 to $1,499 | 15 (35.7%) | 0 (0.0%) |
| $1,500 to $1,999 | 0 (0.0%) | 0 (0.0%) |
| $2,000 to $2,499 | 0 (0.0%) | 0 (0.0%) |
| $2,500 to $2,999 | 0 (0.0%) | 0 (0.0%) |
| $3,000 or more | 0 (0.0%) | 0 (0.0%) |
| Total | 42 (100.0%) | 5 (100.0%) |
Physical Housing Characteristics in Whitewater
Housing Structures in Whitewater
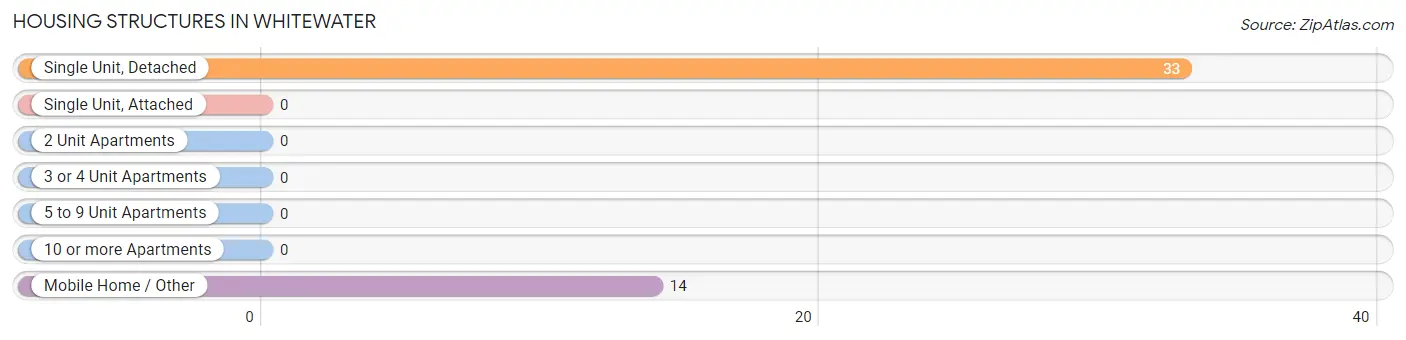
| Structure Type | # Housing Units | % Housing Units |
| Single Unit, Detached | 33 | 70.2% |
| Single Unit, Attached | 0 | 0.0% |
| 2 Unit Apartments | 0 | 0.0% |
| 3 or 4 Unit Apartments | 0 | 0.0% |
| 5 to 9 Unit Apartments | 0 | 0.0% |
| 10 or more Apartments | 0 | 0.0% |
| Mobile Home / Other | 14 | 29.8% |
| Total | 47 | 100.0% |
Housing Structures by Occupancy in Whitewater
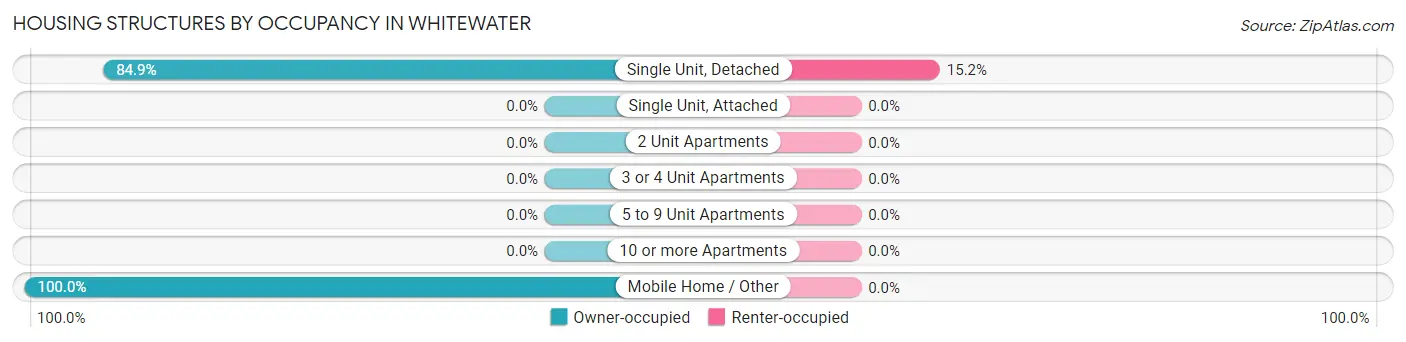
| Structure Type | Owner-occupied | Renter-occupied |
| Single Unit, Detached | 28 (84.9%) | 5 (15.1%) |
| Single Unit, Attached | 0 (0.0%) | 0 (0.0%) |
| 2 Unit Apartments | 0 (0.0%) | 0 (0.0%) |
| 3 or 4 Unit Apartments | 0 (0.0%) | 0 (0.0%) |
| 5 to 9 Unit Apartments | 0 (0.0%) | 0 (0.0%) |
| 10 or more Apartments | 0 (0.0%) | 0 (0.0%) |
| Mobile Home / Other | 14 (100.0%) | 0 (0.0%) |
| Total | 42 (89.4%) | 5 (10.6%) |
Housing Structures by Number of Rooms in Whitewater
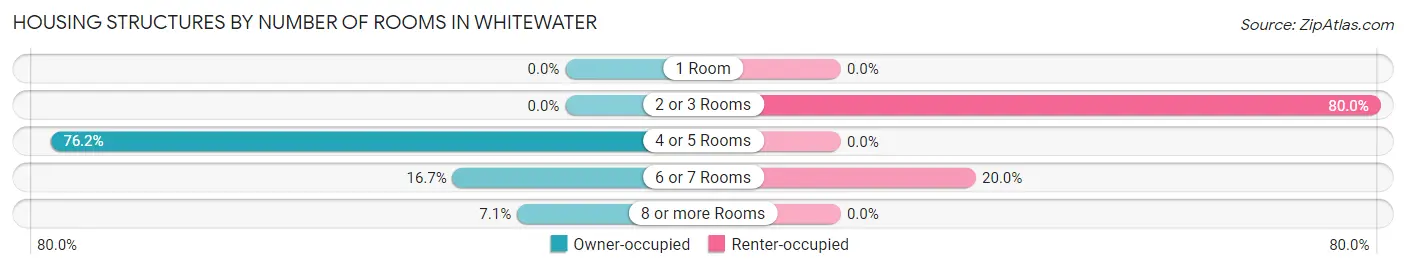
| Number of Rooms | Owner-occupied | Renter-occupied |
| 1 Room | 0 (0.0%) | 0 (0.0%) |
| 2 or 3 Rooms | 0 (0.0%) | 4 (80.0%) |
| 4 or 5 Rooms | 32 (76.2%) | 0 (0.0%) |
| 6 or 7 Rooms | 7 (16.7%) | 1 (20.0%) |
| 8 or more Rooms | 3 (7.1%) | 0 (0.0%) |
| Total | 42 (100.0%) | 5 (100.0%) |
Housing Structure by Heating Type in Whitewater
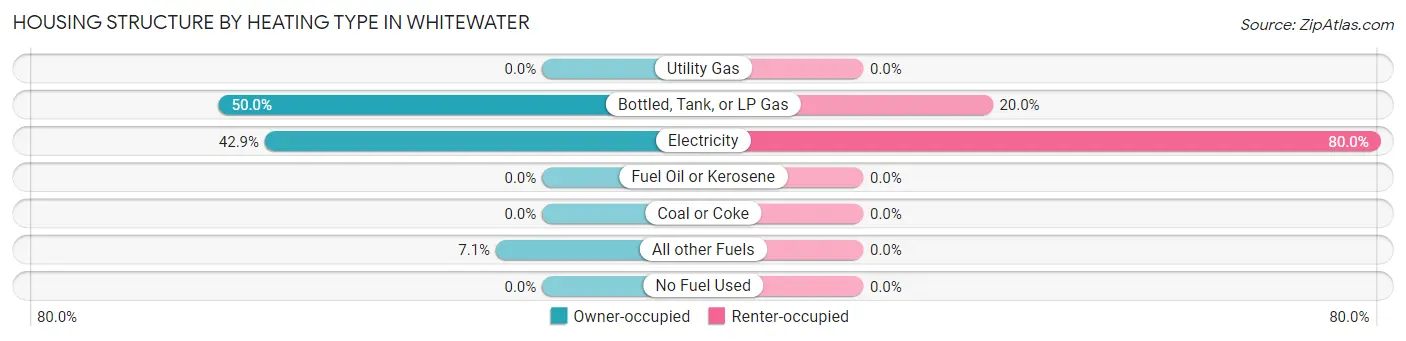
| Heating Type | Owner-occupied | Renter-occupied |
| Utility Gas | 0 (0.0%) | 0 (0.0%) |
| Bottled, Tank, or LP Gas | 21 (50.0%) | 1 (20.0%) |
| Electricity | 18 (42.9%) | 4 (80.0%) |
| Fuel Oil or Kerosene | 0 (0.0%) | 0 (0.0%) |
| Coal or Coke | 0 (0.0%) | 0 (0.0%) |
| All other Fuels | 3 (7.1%) | 0 (0.0%) |
| No Fuel Used | 0 (0.0%) | 0 (0.0%) |
| Total | 42 (100.0%) | 5 (100.0%) |
Household Vehicle Usage in Whitewater
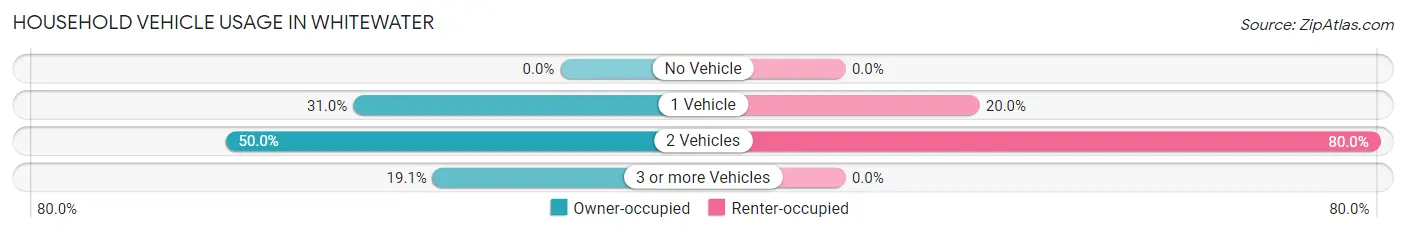
| Vehicles per Household | Owner-occupied | Renter-occupied |
| No Vehicle | 0 (0.0%) | 0 (0.0%) |
| 1 Vehicle | 13 (30.9%) | 1 (20.0%) |
| 2 Vehicles | 21 (50.0%) | 4 (80.0%) |
| 3 or more Vehicles | 8 (19.1%) | 0 (0.0%) |
| Total | 42 (100.0%) | 5 (100.0%) |
Real Estate & Mortgages in Whitewater
Real Estate and Mortgage Overview in Whitewater
| Characteristic | Without Mortgage | With Mortgage |
| Housing Units | 17 | 25 |
| Median Property Value | $51,300 | $101,000 |
| Median Household Income | $50,625 | $0 |
| Monthly Housing Costs | $356 | $0 |
| Real Estate Taxes | $285 | $1 |
Property Value by Mortgage Status in Whitewater
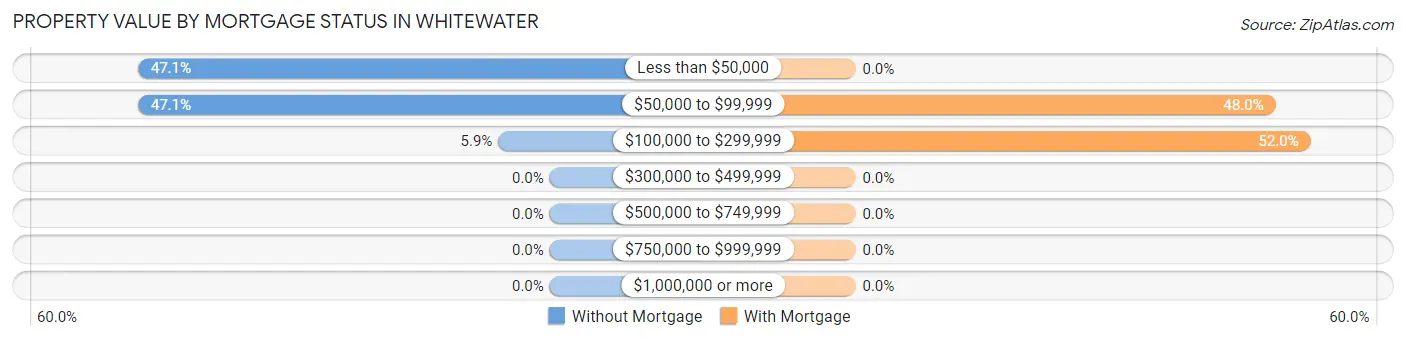
| Property Value | Without Mortgage | With Mortgage |
| Less than $50,000 | 8 (47.1%) | 0 (0.0%) |
| $50,000 to $99,999 | 8 (47.1%) | 12 (48.0%) |
| $100,000 to $299,999 | 1 (5.9%) | 13 (52.0%) |
| $300,000 to $499,999 | 0 (0.0%) | 0 (0.0%) |
| $500,000 to $749,999 | 0 (0.0%) | 0 (0.0%) |
| $750,000 to $999,999 | 0 (0.0%) | 0 (0.0%) |
| $1,000,000 or more | 0 (0.0%) | 0 (0.0%) |
| Total | 17 (100.0%) | 25 (100.0%) |
Household Income by Mortgage Status in Whitewater
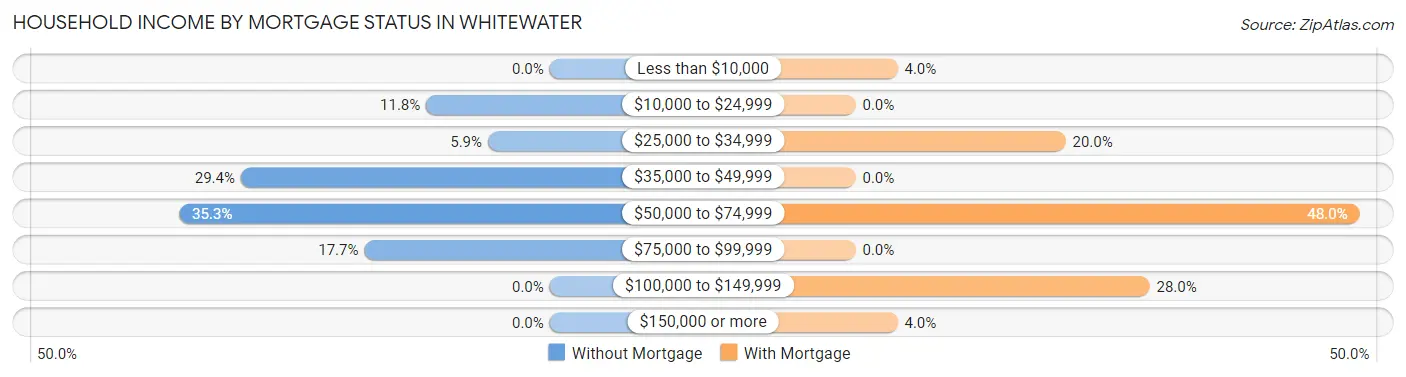
| Household Income | Without Mortgage | With Mortgage |
| Less than $10,000 | 0 (0.0%) | 1 (4.0%) |
| $10,000 to $24,999 | 2 (11.8%) | 0 (0.0%) |
| $25,000 to $34,999 | 1 (5.9%) | 5 (20.0%) |
| $35,000 to $49,999 | 5 (29.4%) | 0 (0.0%) |
| $50,000 to $74,999 | 6 (35.3%) | 12 (48.0%) |
| $75,000 to $99,999 | 3 (17.6%) | 0 (0.0%) |
| $100,000 to $149,999 | 0 (0.0%) | 7 (28.0%) |
| $150,000 or more | 0 (0.0%) | 1 (4.0%) |
| Total | 17 (100.0%) | 25 (100.0%) |
Property Value to Household Income Ratio in Whitewater
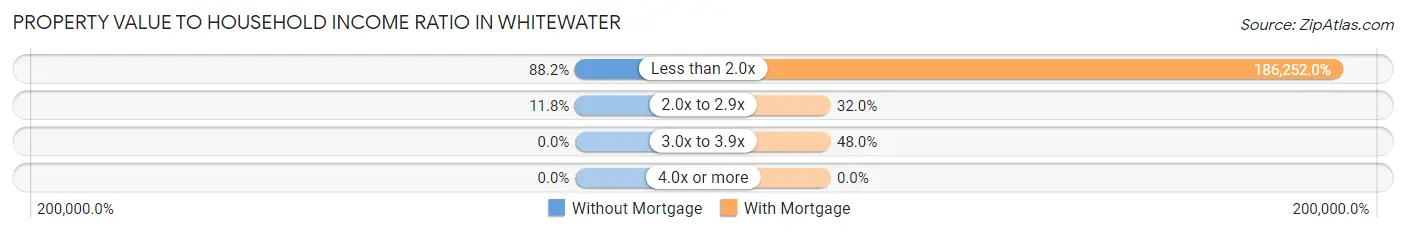
| Value-to-Income Ratio | Without Mortgage | With Mortgage |
| Less than 2.0x | 15 (88.2%) | 46,563 (186,252.0%) |
| 2.0x to 2.9x | 2 (11.8%) | 8 (32.0%) |
| 3.0x to 3.9x | 0 (0.0%) | 12 (48.0%) |
| 4.0x or more | 0 (0.0%) | 0 (0.0%) |
| Total | 17 (100.0%) | 25 (100.0%) |
Real Estate Taxes by Mortgage Status in Whitewater
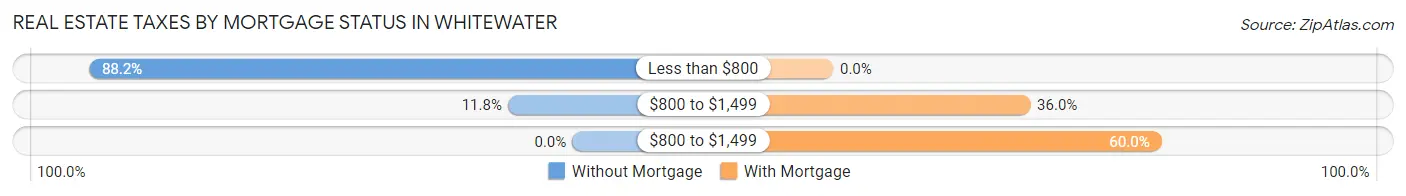
| Property Taxes | Without Mortgage | With Mortgage |
| Less than $800 | 15 (88.2%) | 0 (0.0%) |
| $800 to $1,499 | 2 (11.8%) | 9 (36.0%) |
| $800 to $1,499 | 0 (0.0%) | 15 (60.0%) |
| Total | 17 (100.0%) | 25 (100.0%) |
Health & Disability in Whitewater
Health Insurance Coverage by Age in Whitewater
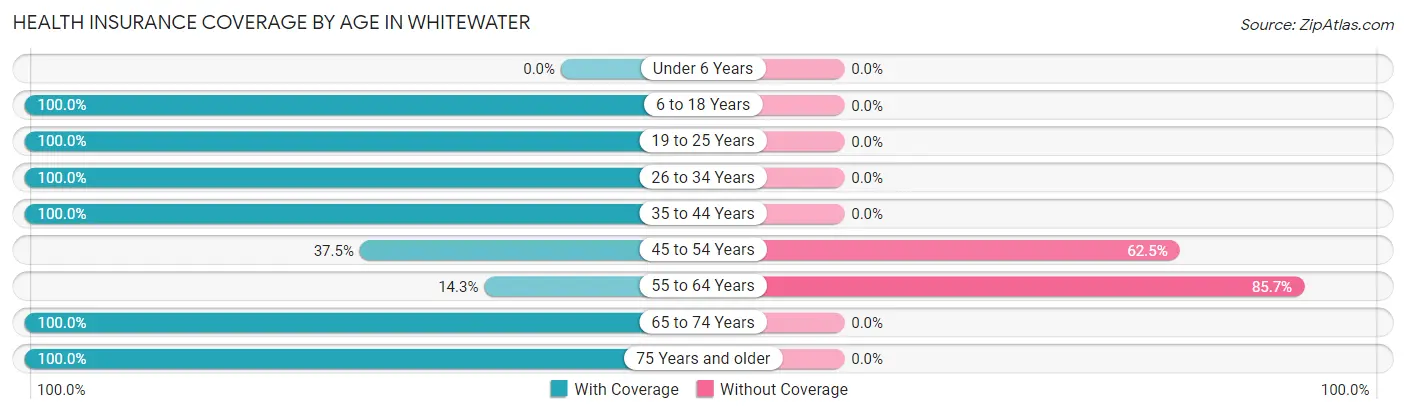
| Age Bracket | With Coverage | Without Coverage |
| Under 6 Years | 0 (0.0%) | 0 (0.0%) |
| 6 to 18 Years | 3 (100.0%) | 0 (0.0%) |
| 19 to 25 Years | 12 (100.0%) | 0 (0.0%) |
| 26 to 34 Years | 4 (100.0%) | 0 (0.0%) |
| 35 to 44 Years | 7 (100.0%) | 0 (0.0%) |
| 45 to 54 Years | 3 (37.5%) | 5 (62.5%) |
| 55 to 64 Years | 2 (14.3%) | 12 (85.7%) |
| 65 to 74 Years | 20 (100.0%) | 0 (0.0%) |
| 75 Years and older | 7 (100.0%) | 0 (0.0%) |
| Total | 58 (77.3%) | 17 (22.7%) |
Health Insurance Coverage by Citizenship Status in Whitewater
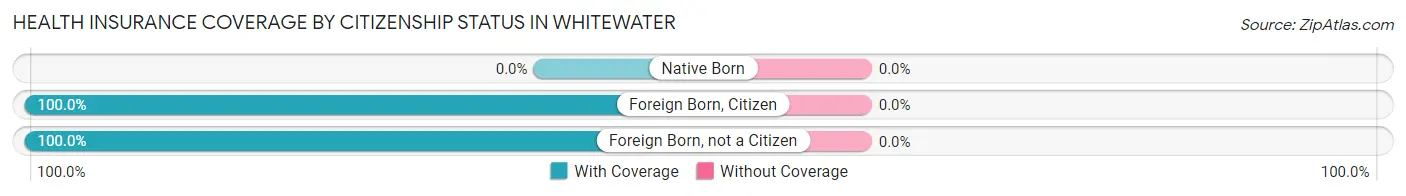
| Citizenship Status | With Coverage | Without Coverage |
| Native Born | 0 (0.0%) | 0 (0.0%) |
| Foreign Born, Citizen | 3 (100.0%) | 0 (0.0%) |
| Foreign Born, not a Citizen | 12 (100.0%) | 0 (0.0%) |
Health Insurance Coverage by Household Income in Whitewater
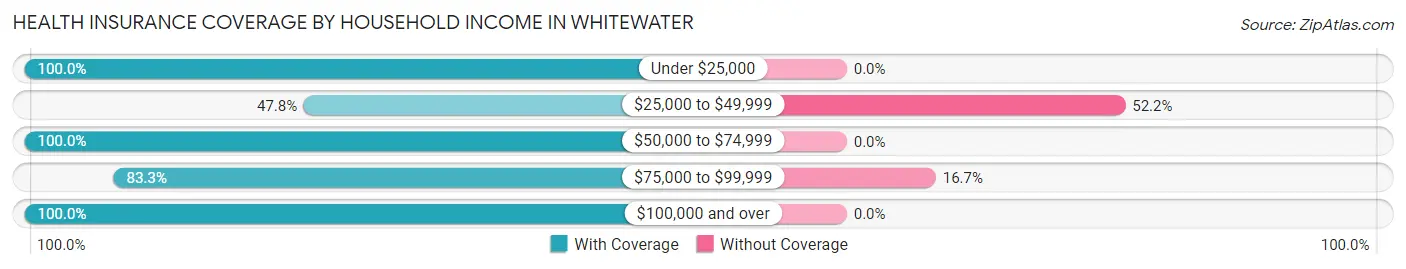
| Household Income | With Coverage | Without Coverage |
| Under $25,000 | 12 (100.0%) | 0 (0.0%) |
| $25,000 to $49,999 | 11 (47.8%) | 12 (52.2%) |
| $50,000 to $74,999 | 8 (100.0%) | 0 (0.0%) |
| $75,000 to $99,999 | 25 (83.3%) | 5 (16.7%) |
| $100,000 and over | 2 (100.0%) | 0 (0.0%) |
Public vs Private Health Insurance Coverage by Age in Whitewater
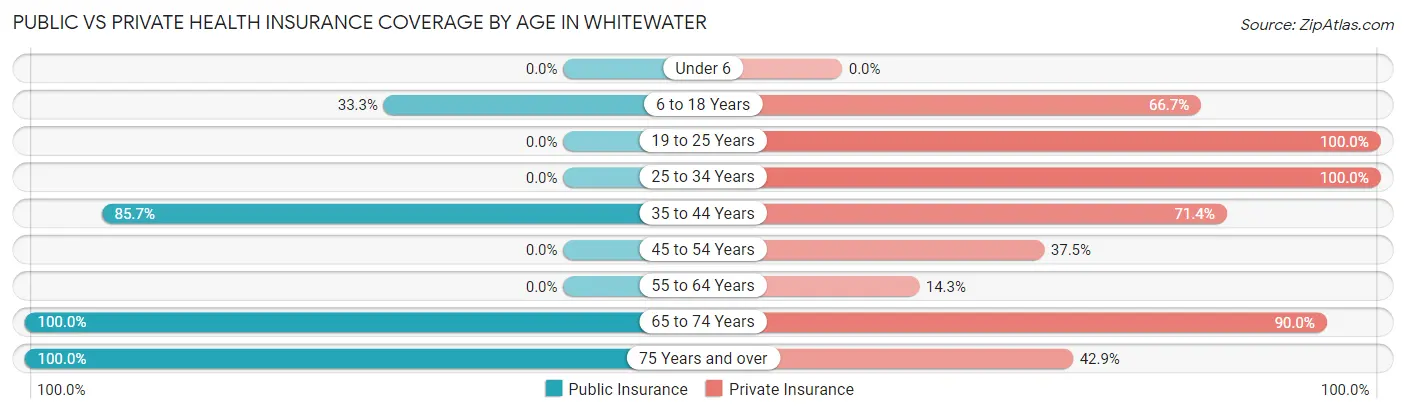
| Age Bracket | Public Insurance | Private Insurance |
| Under 6 | 0 (0.0%) | 0 (0.0%) |
| 6 to 18 Years | 1 (33.3%) | 2 (66.7%) |
| 19 to 25 Years | 0 (0.0%) | 12 (100.0%) |
| 25 to 34 Years | 0 (0.0%) | 4 (100.0%) |
| 35 to 44 Years | 6 (85.7%) | 5 (71.4%) |
| 45 to 54 Years | 0 (0.0%) | 3 (37.5%) |
| 55 to 64 Years | 0 (0.0%) | 2 (14.3%) |
| 65 to 74 Years | 20 (100.0%) | 18 (90.0%) |
| 75 Years and over | 7 (100.0%) | 3 (42.9%) |
| Total | 34 (45.3%) | 49 (65.3%) |
Disability Status by Sex by Age in Whitewater
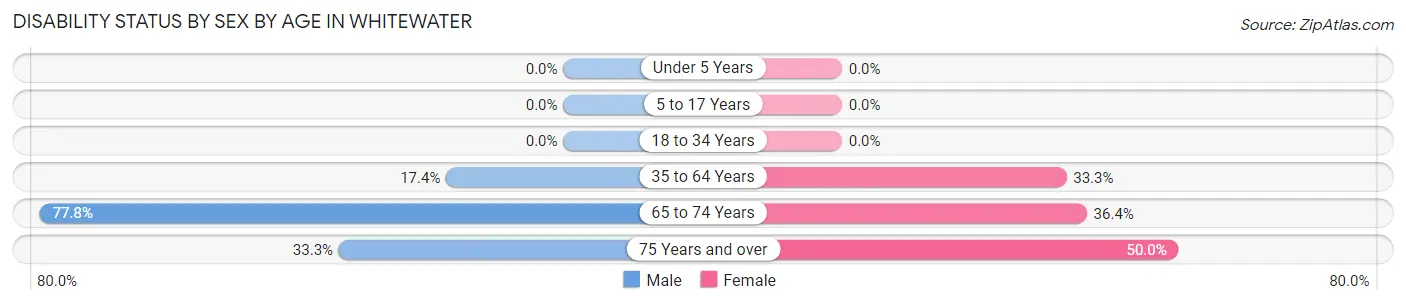
| Age Bracket | Male | Female |
| Under 5 Years | 0 (0.0%) | 0 (0.0%) |
| 5 to 17 Years | 0 (0.0%) | 0 (0.0%) |
| 18 to 34 Years | 0 (0.0%) | 0 (0.0%) |
| 35 to 64 Years | 4 (17.4%) | 2 (33.3%) |
| 65 to 74 Years | 7 (77.8%) | 4 (36.4%) |
| 75 Years and over | 1 (33.3%) | 2 (50.0%) |
Disability Class by Sex by Age in Whitewater
Disability Class: Hearing Difficulty
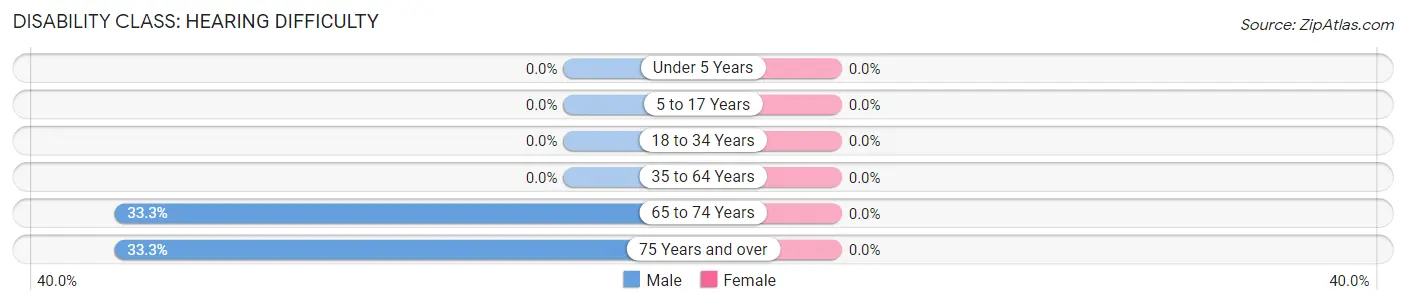
| Age Bracket | Male | Female |
| Under 5 Years | 0 (0.0%) | 0 (0.0%) |
| 5 to 17 Years | 0 (0.0%) | 0 (0.0%) |
| 18 to 34 Years | 0 (0.0%) | 0 (0.0%) |
| 35 to 64 Years | 0 (0.0%) | 0 (0.0%) |
| 65 to 74 Years | 3 (33.3%) | 0 (0.0%) |
| 75 Years and over | 1 (33.3%) | 0 (0.0%) |
Disability Class: Vision Difficulty
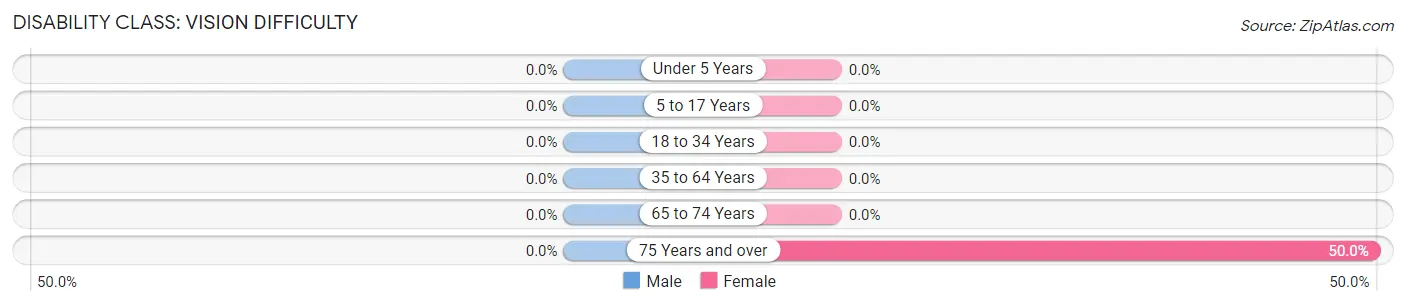
| Age Bracket | Male | Female |
| Under 5 Years | 0 (0.0%) | 0 (0.0%) |
| 5 to 17 Years | 0 (0.0%) | 0 (0.0%) |
| 18 to 34 Years | 0 (0.0%) | 0 (0.0%) |
| 35 to 64 Years | 0 (0.0%) | 0 (0.0%) |
| 65 to 74 Years | 0 (0.0%) | 0 (0.0%) |
| 75 Years and over | 0 (0.0%) | 2 (50.0%) |
Disability Class: Cognitive Difficulty
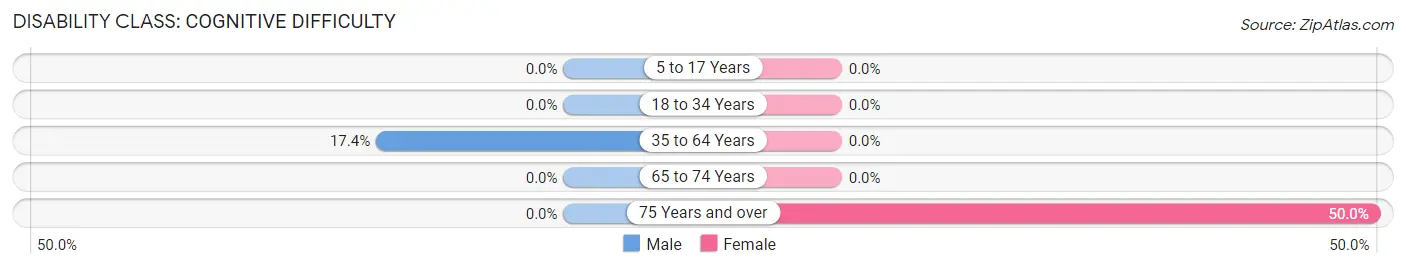
| Age Bracket | Male | Female |
| 5 to 17 Years | 0 (0.0%) | 0 (0.0%) |
| 18 to 34 Years | 0 (0.0%) | 0 (0.0%) |
| 35 to 64 Years | 4 (17.4%) | 0 (0.0%) |
| 65 to 74 Years | 0 (0.0%) | 0 (0.0%) |
| 75 Years and over | 0 (0.0%) | 2 (50.0%) |
Disability Class: Ambulatory Difficulty
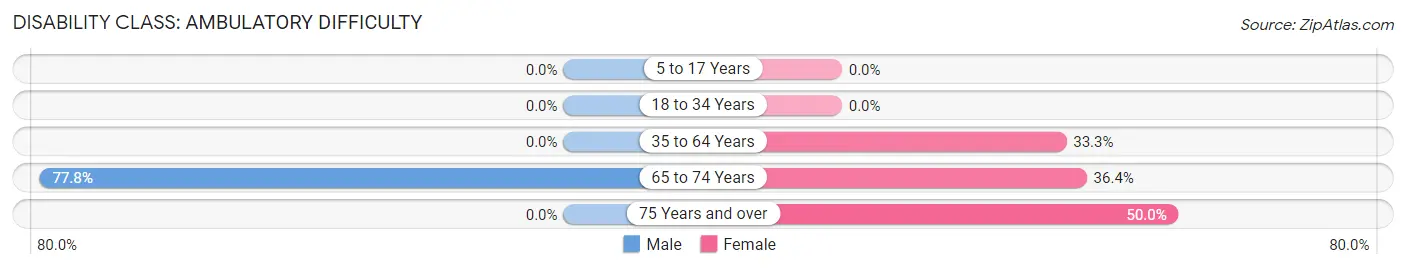
| Age Bracket | Male | Female |
| 5 to 17 Years | 0 (0.0%) | 0 (0.0%) |
| 18 to 34 Years | 0 (0.0%) | 0 (0.0%) |
| 35 to 64 Years | 0 (0.0%) | 2 (33.3%) |
| 65 to 74 Years | 7 (77.8%) | 4 (36.4%) |
| 75 Years and over | 0 (0.0%) | 2 (50.0%) |
Disability Class: Self-Care Difficulty
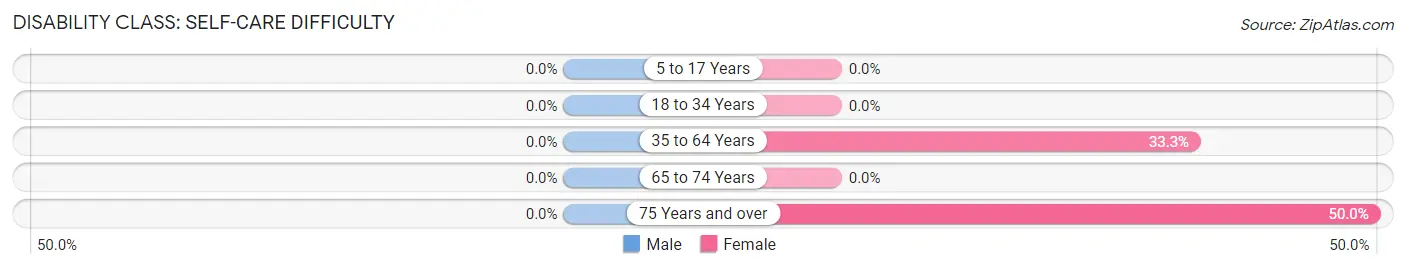
| Age Bracket | Male | Female |
| 5 to 17 Years | 0 (0.0%) | 0 (0.0%) |
| 18 to 34 Years | 0 (0.0%) | 0 (0.0%) |
| 35 to 64 Years | 0 (0.0%) | 2 (33.3%) |
| 65 to 74 Years | 0 (0.0%) | 0 (0.0%) |
| 75 Years and over | 0 (0.0%) | 2 (50.0%) |
Technology Access in Whitewater
Computing Device Access in Whitewater
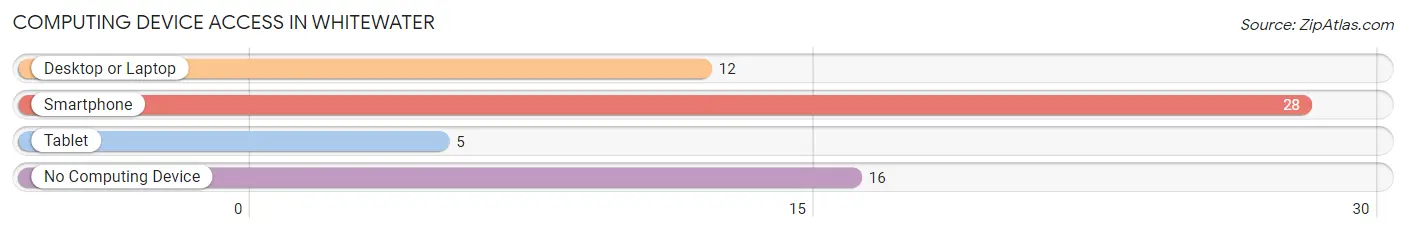
| Device Type | # Households | % Households |
| Desktop or Laptop | 12 | 25.5% |
| Smartphone | 28 | 59.6% |
| Tablet | 5 | 10.6% |
| No Computing Device | 16 | 34.0% |
| Total | 47 | 100.0% |
Internet Access in Whitewater
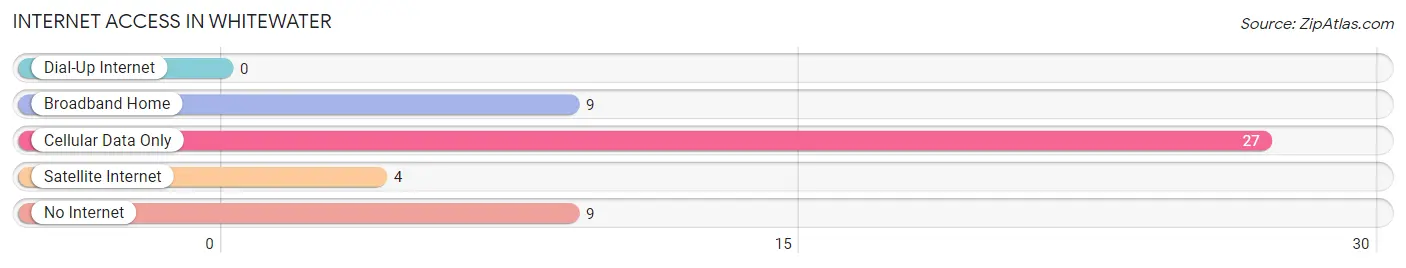
| Internet Type | # Households | % Households |
| Dial-Up Internet | 0 | 0.0% |
| Broadband Home | 9 | 19.2% |
| Cellular Data Only | 27 | 57.5% |
| Satellite Internet | 4 | 8.5% |
| No Internet | 9 | 19.2% |
| Total | 47 | 100.0% |
Whitewater Summary
Whitewater, Missouri is a small town located in the southeastern corner of the state, near the Mississippi River. It is part of the St. Louis metropolitan area and is located in St. Charles County. The population of Whitewater was 1,845 in the 2010 census.
Geography
Whitewater is located at 38°45'25" North, 90°37'45" West (38.756944, -90.629167). It is situated on the banks of the Mississippi River, just south of the city of St. Louis. The town is located in the Ozark Plateau region of Missouri, and is surrounded by rolling hills and forests. The climate is humid subtropical, with hot, humid summers and mild winters.
Economy
The economy of Whitewater is largely based on agriculture and tourism. The town is home to several small businesses, including a grocery store, a hardware store, and a few restaurants. The town also has a few small manufacturing companies, such as a furniture factory and a plastics factory.
Tourism is an important part of the local economy. The town is home to several historic sites, including the Whitewater Historical Museum, the Whitewater Covered Bridge, and the Whitewater State Park. The town also hosts several annual festivals, such as the Whitewater Festival and the Whitewater Music Festival.
Demographics
As of the 2010 census, the population of Whitewater was 1,845. The racial makeup of the town was 95.2% White, 1.2% African American, 0.3% Native American, 0.3% Asian, 0.1% Pacific Islander, 0.7% from other races, and 2.3% from two or more races. Hispanic or Latino of any race were 2.3% of the population.
The median income for a household in Whitewater was $41,250, and the median income for a family was $50,000. The per capita income for the town was $20,845. About 11.2% of families and 14.2% of the population were below the poverty line, including 18.2% of those under age 18 and 8.3% of those age 65 or over.
Conclusion
Whitewater, Missouri is a small town located in the southeastern corner of the state, near the Mississippi River. It is part of the St. Louis metropolitan area and is located in St. Charles County. The economy of Whitewater is largely based on agriculture and tourism, and the town is home to several small businesses, historic sites, and annual festivals. The population of Whitewater was 1,845 in the 2010 census, and the median income for a household was $41,250.
Common Questions
What is Per Capita Income in Whitewater?
Per Capita income in Whitewater is $33,015.
What is the Median Family Income in Whitewater?
Median Family Income in Whitewater is $76,250.
What is the Median Household income in Whitewater?
Median Household Income in Whitewater is $46,146.
What is Income or Wage Gap in Whitewater?
Income or Wage Gap in Whitewater is 21.2%.
Women in Whitewater earn 78.8 cents for every dollar earned by a man.
What is Inequality or Gini Index in Whitewater?
Inequality or Gini Index in Whitewater is 0.30.
What is the Total Population of Whitewater?
Total Population of Whitewater is 75.
What is the Total Male Population of Whitewater?
Total Male Population of Whitewater is 42.
What is the Total Female Population of Whitewater?
Total Female Population of Whitewater is 33.
What is the Ratio of Males per 100 Females in Whitewater?
There are 127.27 Males per 100 Females in Whitewater.
What is the Ratio of Females per 100 Males in Whitewater?
There are 78.57 Females per 100 Males in Whitewater.
What is the Median Population Age in Whitewater?
Median Population Age in Whitewater is 58.3 Years.
What is the Average Family Size in Whitewater
Average Family Size in Whitewater is 2.4 People.
What is the Average Household Size in Whitewater
Average Household Size in Whitewater is 1.6 People.
How Large is the Labor Force in Whitewater?
There are 43 People in the Labor Forcein in Whitewater.
What is the Percentage of People in the Labor Force in Whitewater?
59.7% of People are in the Labor Force in Whitewater.