Vandalia, MO Map & Demographics
Vandalia Map
Vandalia Overview
$19,291
PER CAPITA INCOME
$63,148
AVG FAMILY INCOME
$43,654
AVG HOUSEHOLD INCOME
43.3%
WAGE / INCOME GAP [ % ]
56.7¢/ $1
WAGE / INCOME GAP [ $ ]
0.40
INEQUALITY / GINI INDEX
3,382
TOTAL POPULATION
1,584
MALE POPULATION
1,798
FEMALE POPULATION
88.10
MALES / 100 FEMALES
113.51
FEMALES / 100 MALES
39.7
MEDIAN AGE
3.5
AVG FAMILY SIZE
2.5
AVG HOUSEHOLD SIZE
1,323
LABOR FORCE [ PEOPLE ]
44.7%
PERCENT IN LABOR FORCE
3.3%
UNEMPLOYMENT RATE
Vandalia Zip Codes
Vandalia Area Codes
Income in Vandalia
Income Overview in Vandalia
Per Capita Income in Vandalia is $19,291, while median incomes of families and households are $63,148 and $43,654 respectively.
| Characteristic | Number | Measure |
| Per Capita Income | 3,382 | $19,291 |
| Median Family Income | 496 | $63,148 |
| Mean Family Income | 496 | $69,135 |
| Median Household Income | 944 | $43,654 |
| Mean Household Income | 944 | $59,355 |
| Income Deficit | 496 | $0 |
| Wage / Income Gap (%) | 3,382 | 43.32% |
| Wage / Income Gap ($) | 3,382 | 56.68¢ per $1 |
| Gini / Inequality Index | 3,382 | 0.40 |
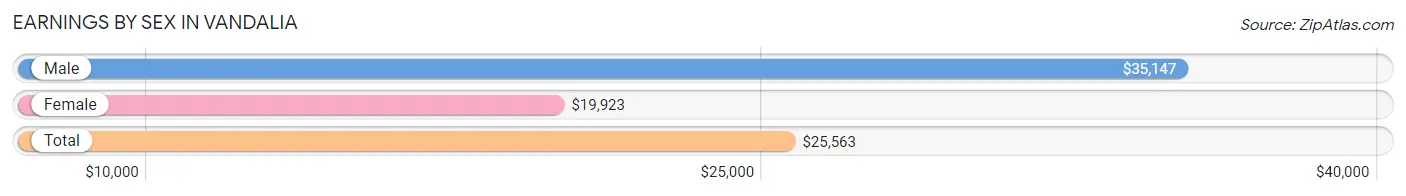
Earnings by Sex in Vandalia
Average Earnings in Vandalia are $25,563, $35,147 for men and $19,923 for women, a difference of 43.3%.
| Sex | Number | Average Earnings |
| Male | 738 (46.5%) | $35,147 |
| Female | 848 (53.5%) | $19,923 |
| Total | 1,586 (100.0%) | $25,563 |
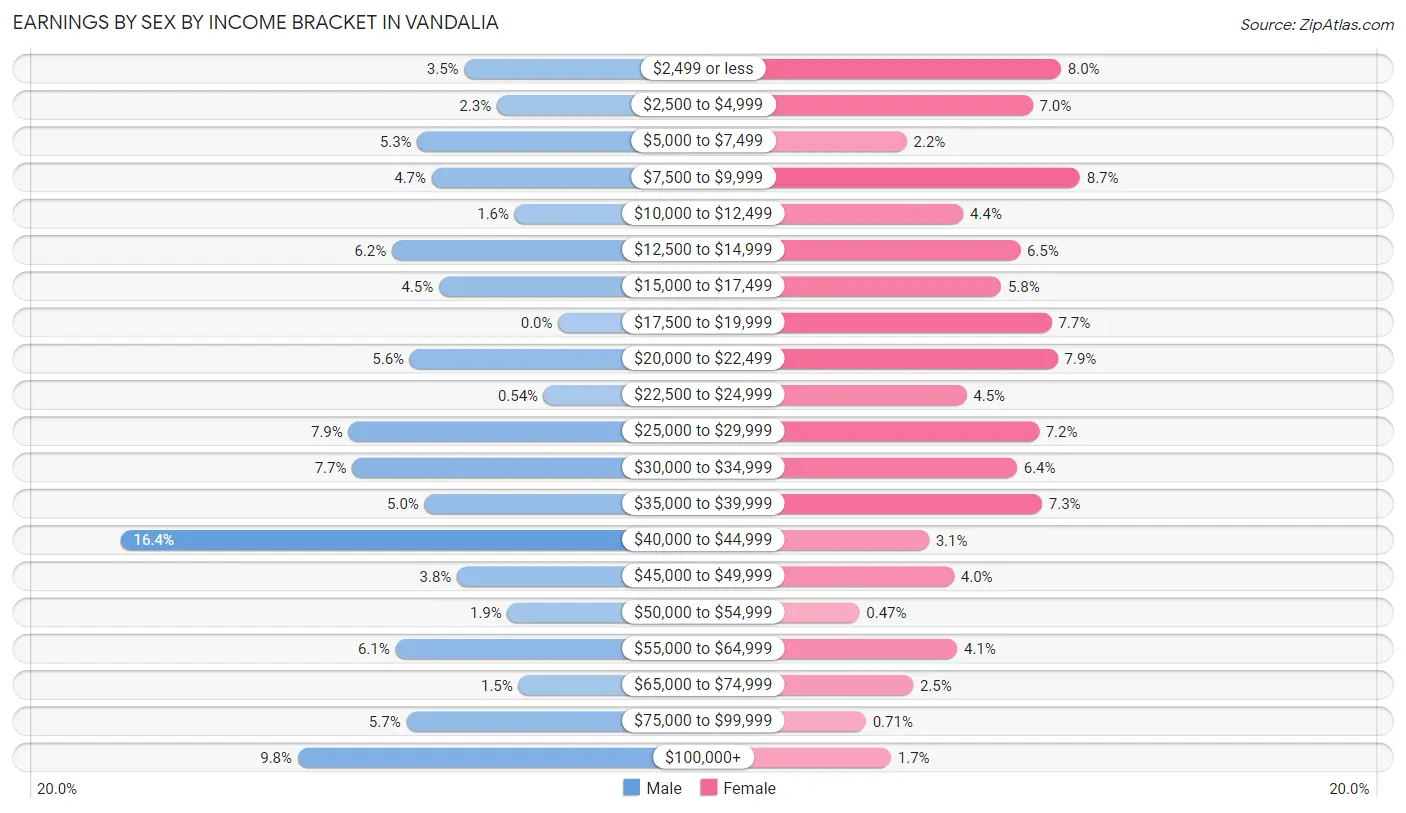
Earnings by Sex by Income Bracket in Vandalia
The most common earnings brackets in Vandalia are $40,000 to $44,999 for men (121 | 16.4%) and $7,500 to $9,999 for women (74 | 8.7%).
| Income | Male | Female |
| $2,499 or less | 26 (3.5%) | 68 (8.0%) |
| $2,500 to $4,999 | 17 (2.3%) | 59 (7.0%) |
| $5,000 to $7,499 | 39 (5.3%) | 19 (2.2%) |
| $7,500 to $9,999 | 35 (4.7%) | 74 (8.7%) |
| $10,000 to $12,499 | 12 (1.6%) | 37 (4.4%) |
| $12,500 to $14,999 | 46 (6.2%) | 55 (6.5%) |
| $15,000 to $17,499 | 33 (4.5%) | 49 (5.8%) |
| $17,500 to $19,999 | 0 (0.0%) | 65 (7.7%) |
| $20,000 to $22,499 | 41 (5.6%) | 67 (7.9%) |
| $22,500 to $24,999 | 4 (0.5%) | 38 (4.5%) |
| $25,000 to $29,999 | 58 (7.9%) | 61 (7.2%) |
| $30,000 to $34,999 | 57 (7.7%) | 54 (6.4%) |
| $35,000 to $39,999 | 37 (5.0%) | 62 (7.3%) |
| $40,000 to $44,999 | 121 (16.4%) | 26 (3.1%) |
| $45,000 to $49,999 | 28 (3.8%) | 34 (4.0%) |
| $50,000 to $54,999 | 14 (1.9%) | 4 (0.5%) |
| $55,000 to $64,999 | 45 (6.1%) | 35 (4.1%) |
| $65,000 to $74,999 | 11 (1.5%) | 21 (2.5%) |
| $75,000 to $99,999 | 42 (5.7%) | 6 (0.7%) |
| $100,000+ | 72 (9.8%) | 14 (1.7%) |
| Total | 738 (100.0%) | 848 (100.0%) |
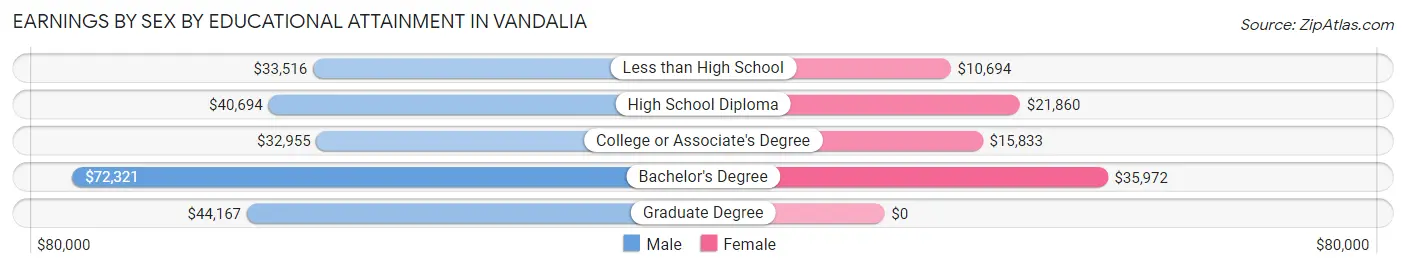
Earnings by Sex by Educational Attainment in Vandalia
Average earnings in Vandalia are $40,764 for men and $21,372 for women, a difference of 47.6%. Men with an educational attainment of bachelor's degree enjoy the highest average annual earnings of $72,321, while those with college or associate's degree education earn the least with $32,955. Women with an educational attainment of bachelor's degree earn the most with the average annual earnings of $35,972, while those with less than high school education have the smallest earnings of $10,694.
| Educational Attainment | Male Income | Female Income |
| Less than High School | $33,516 | $10,694 |
| High School Diploma | $40,694 | $21,860 |
| College or Associate's Degree | $32,955 | $15,833 |
| Bachelor's Degree | $72,321 | $35,972 |
| Graduate Degree | $44,167 | $0 |
| Total | $40,764 | $21,372 |
Family Income in Vandalia
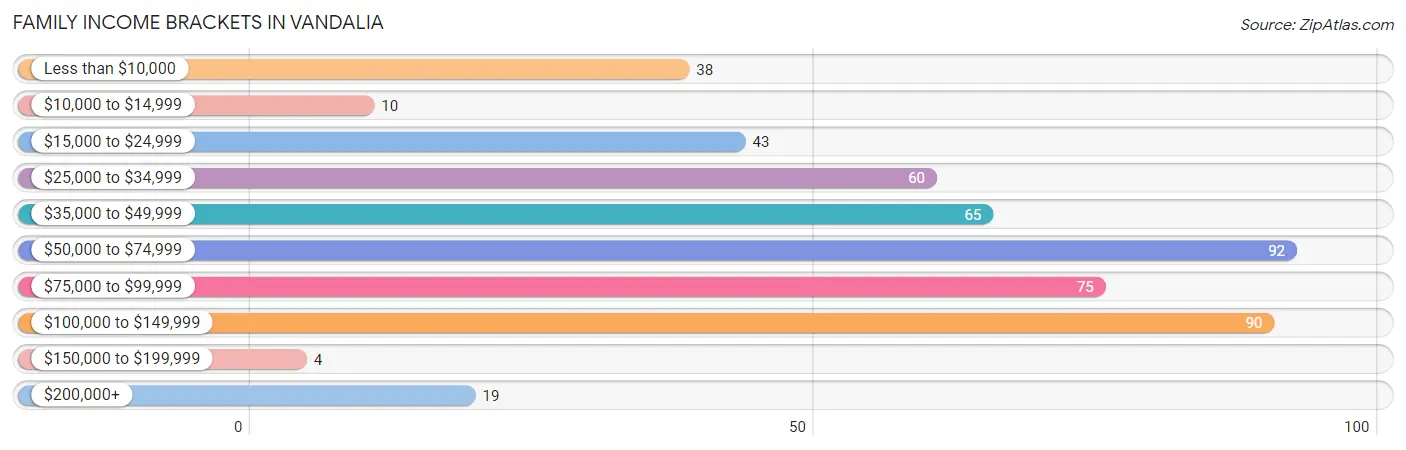
Family Income Brackets in Vandalia
According to the Vandalia family income data, there are 92 families falling into the $50,000 to $74,999 income range, which is the most common income bracket and makes up 18.5% of all families. Conversely, the $150,000 to $199,999 income bracket is the least frequent group with only 4 families (0.8%) belonging to this category.
| Income Bracket | # Families | % Families |
| Less than $10,000 | 38 | 7.7% |
| $10,000 to $14,999 | 10 | 2.0% |
| $15,000 to $24,999 | 43 | 8.7% |
| $25,000 to $34,999 | 60 | 12.1% |
| $35,000 to $49,999 | 65 | 13.1% |
| $50,000 to $74,999 | 92 | 18.5% |
| $75,000 to $99,999 | 75 | 15.1% |
| $100,000 to $149,999 | 90 | 18.1% |
| $150,000 to $199,999 | 4 | 0.8% |
| $200,000+ | 19 | 3.8% |
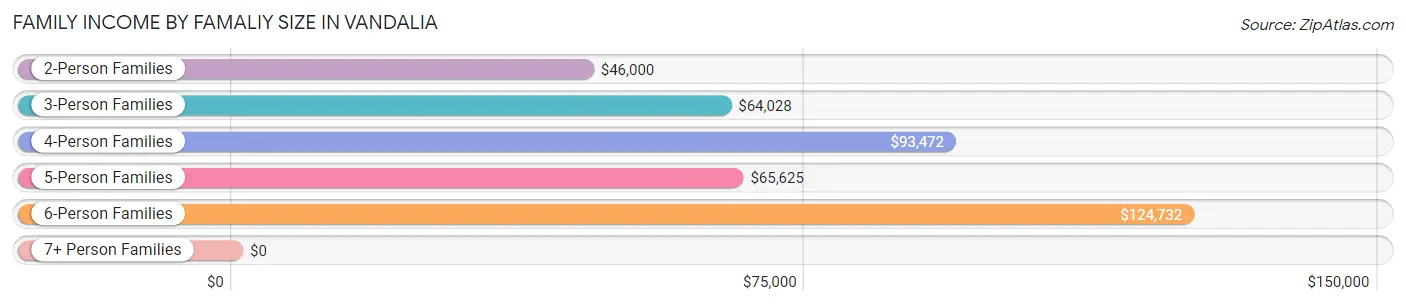
Family Income by Famaliy Size in Vandalia
6-person families (45 | 9.1%) account for the highest median family income in Vandalia with $124,732 per family, while 4-person families (81 | 16.3%) have the highest median income of $23,368 per family member.
| Income Bracket | # Families | Median Income |
| 2-Person Families | 236 (47.6%) | $46,000 |
| 3-Person Families | 117 (23.6%) | $64,028 |
| 4-Person Families | 81 (16.3%) | $93,472 |
| 5-Person Families | 17 (3.4%) | $65,625 |
| 6-Person Families | 45 (9.1%) | $124,732 |
| 7+ Person Families | 0 (0.0%) | $0 |
| Total | 496 (100.0%) | $63,148 |
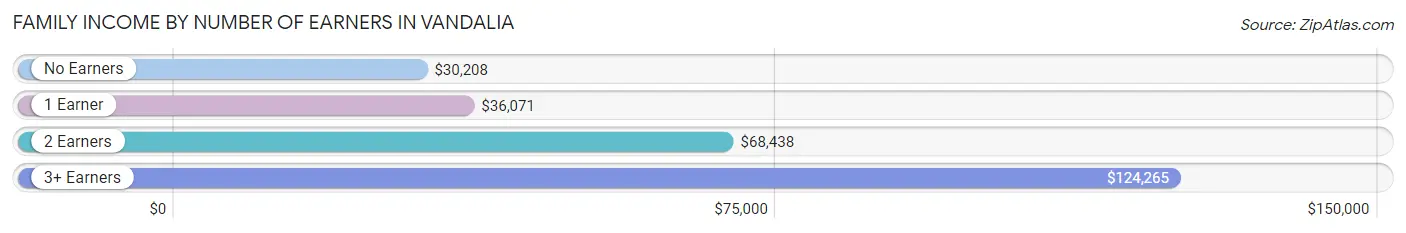
Family Income by Number of Earners in Vandalia
The median family income in Vandalia is $63,148, with families comprising 3+ earners (70) having the highest median family income of $124,265, while families with no earners (71) have the lowest median family income of $30,208, accounting for 14.1% and 14.3% of families, respectively.
| Number of Earners | # Families | Median Income |
| No Earners | 71 (14.3%) | $30,208 |
| 1 Earner | 142 (28.6%) | $36,071 |
| 2 Earners | 213 (42.9%) | $68,438 |
| 3+ Earners | 70 (14.1%) | $124,265 |
| Total | 496 (100.0%) | $63,148 |
Household Income in Vandalia
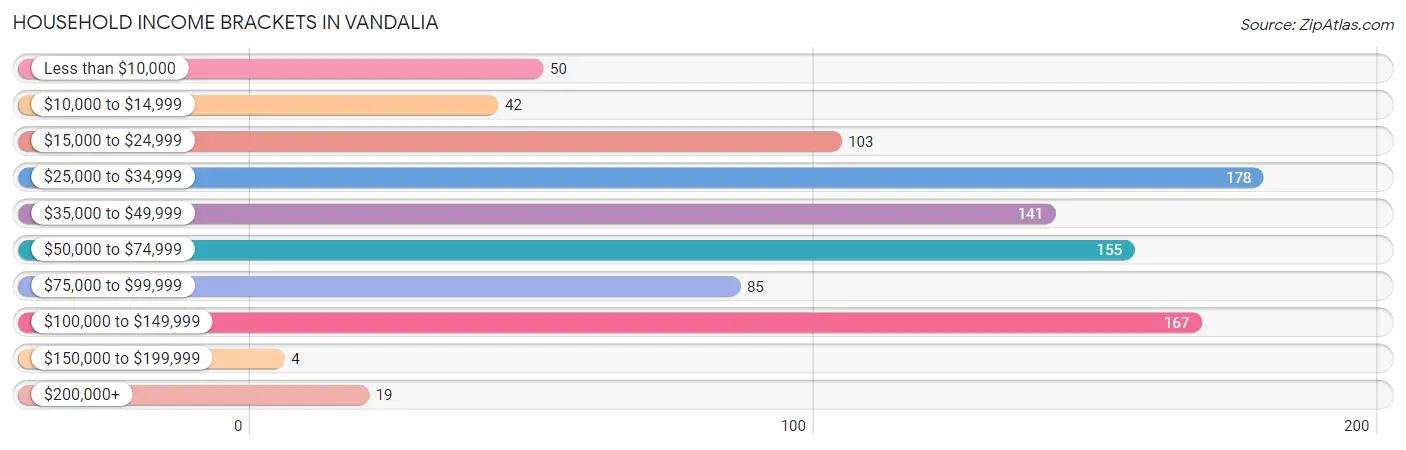
Household Income Brackets in Vandalia
With 178 households falling in the category, the $25,000 to $34,999 income range is the most frequent in Vandalia, accounting for 18.9% of all households. In contrast, only 4 households (0.4%) fall into the $150,000 to $199,999 income bracket, making it the least populous group.
| Income Bracket | # Households | % Households |
| Less than $10,000 | 50 | 5.3% |
| $10,000 to $14,999 | 42 | 4.4% |
| $15,000 to $24,999 | 103 | 10.9% |
| $25,000 to $34,999 | 178 | 18.9% |
| $35,000 to $49,999 | 141 | 14.9% |
| $50,000 to $74,999 | 155 | 16.4% |
| $75,000 to $99,999 | 85 | 9.0% |
| $100,000 to $149,999 | 167 | 17.7% |
| $150,000 to $199,999 | 4 | 0.4% |
| $200,000+ | 19 | 2.0% |
Household Income by Householder Age in Vandalia
The median household income in Vandalia is $43,654, with the highest median household income of $58,472 found in the 45 to 64 years age bracket for the primary householder. A total of 441 households (46.7%) fall into this category. Meanwhile, the 65+ years age bracket for the primary householder has the lowest median household income of $34,706, with 234 households (24.8%) in this group.
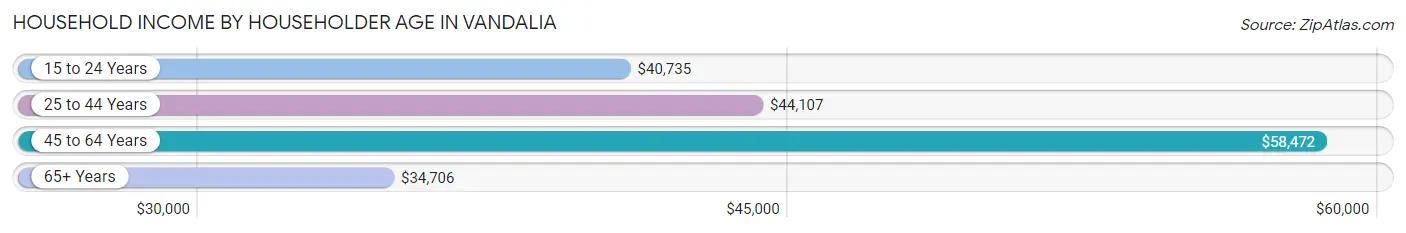
| Income Bracket | # Households | Median Income |
| 15 to 24 Years | 46 (4.9%) | $40,735 |
| 25 to 44 Years | 223 (23.6%) | $44,107 |
| 45 to 64 Years | 441 (46.7%) | $58,472 |
| 65+ Years | 234 (24.8%) | $34,706 |
| Total | 944 (100.0%) | $43,654 |
Poverty in Vandalia
Income Below Poverty by Sex and Age in Vandalia
With 15.2% poverty level for males and 18.2% for females among the residents of Vandalia, 5 year old males and 15 year old females are the most vulnerable to poverty, with 7 males (100.0%) and 21 females (70.0%) in their respective age groups living below the poverty level.
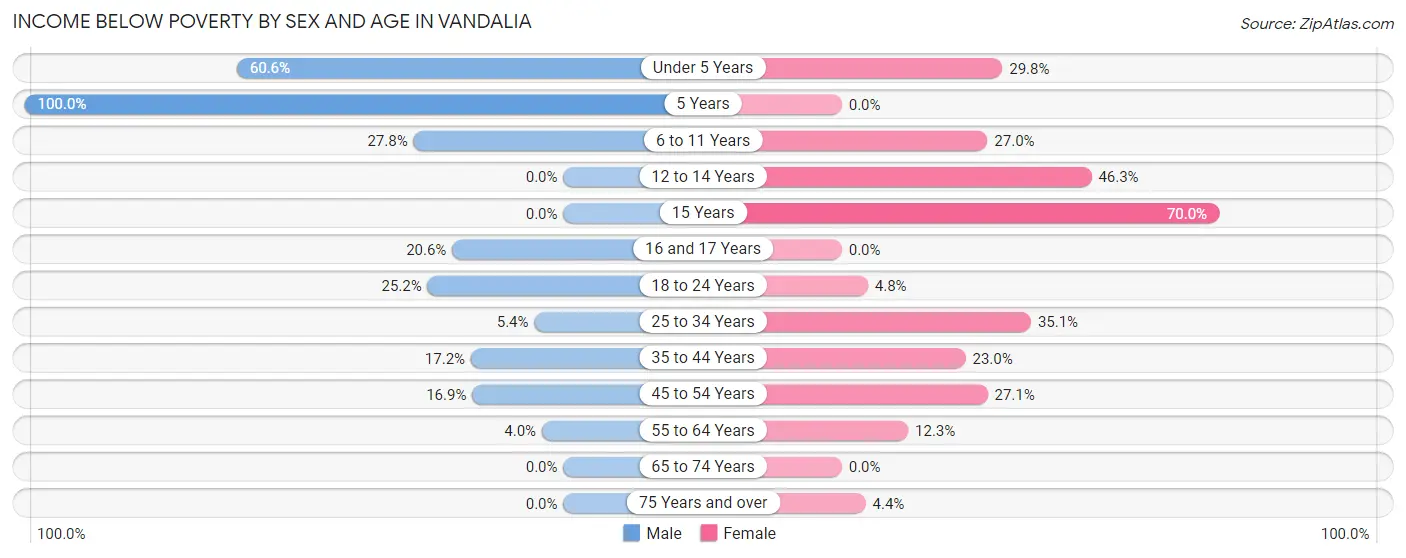
| Age Bracket | Male | Female |
| Under 5 Years | 20 (60.6%) | 14 (29.8%) |
| 5 Years | 7 (100.0%) | 0 (0.0%) |
| 6 to 11 Years | 37 (27.8%) | 10 (27.0%) |
| 12 to 14 Years | 0 (0.0%) | 19 (46.3%) |
| 15 Years | 0 (0.0%) | 21 (70.0%) |
| 16 and 17 Years | 13 (20.6%) | 0 (0.0%) |
| 18 to 24 Years | 31 (25.2%) | 6 (4.8%) |
| 25 to 34 Years | 5 (5.4%) | 46 (35.1%) |
| 35 to 44 Years | 35 (17.2%) | 34 (23.0%) |
| 45 to 54 Years | 23 (16.9%) | 33 (27.1%) |
| 55 to 64 Years | 8 (4.0%) | 24 (12.3%) |
| 65 to 74 Years | 0 (0.0%) | 0 (0.0%) |
| 75 Years and over | 0 (0.0%) | 5 (4.4%) |
| Total | 179 (15.2%) | 212 (18.2%) |
Income Above Poverty by Sex and Age in Vandalia
According to the poverty statistics in Vandalia, males aged 12 to 14 years and females aged 5 years are the age groups that are most secure financially, with 100.0% of males and 100.0% of females in these age groups living above the poverty line.
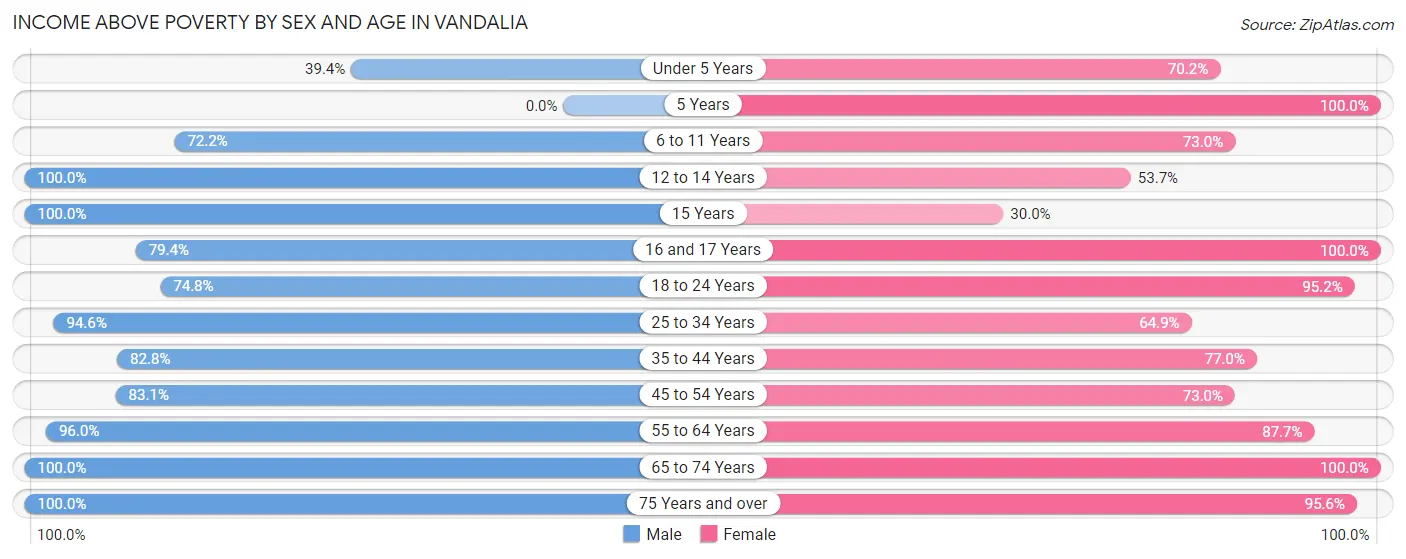
| Age Bracket | Male | Female |
| Under 5 Years | 13 (39.4%) | 33 (70.2%) |
| 5 Years | 0 (0.0%) | 10 (100.0%) |
| 6 to 11 Years | 96 (72.2%) | 27 (73.0%) |
| 12 to 14 Years | 21 (100.0%) | 22 (53.7%) |
| 15 Years | 32 (100.0%) | 9 (30.0%) |
| 16 and 17 Years | 50 (79.4%) | 13 (100.0%) |
| 18 to 24 Years | 92 (74.8%) | 118 (95.2%) |
| 25 to 34 Years | 88 (94.6%) | 85 (64.9%) |
| 35 to 44 Years | 169 (82.8%) | 114 (77.0%) |
| 45 to 54 Years | 113 (83.1%) | 89 (73.0%) |
| 55 to 64 Years | 193 (96.0%) | 171 (87.7%) |
| 65 to 74 Years | 88 (100.0%) | 154 (100.0%) |
| 75 Years and over | 46 (100.0%) | 108 (95.6%) |
| Total | 1,001 (84.8%) | 953 (81.8%) |
Income Below Poverty Among Married-Couple Families in Vandalia
The poverty statistics for married-couple families in Vandalia show that 8.6% or 25 of the total 292 families live below the poverty line. Families with 1 or 2 children have the highest poverty rate of 25.9%, comprising of 22 families. On the other hand, families with 3 or 4 children have the lowest poverty rate of 0.0%, which includes 0 families.
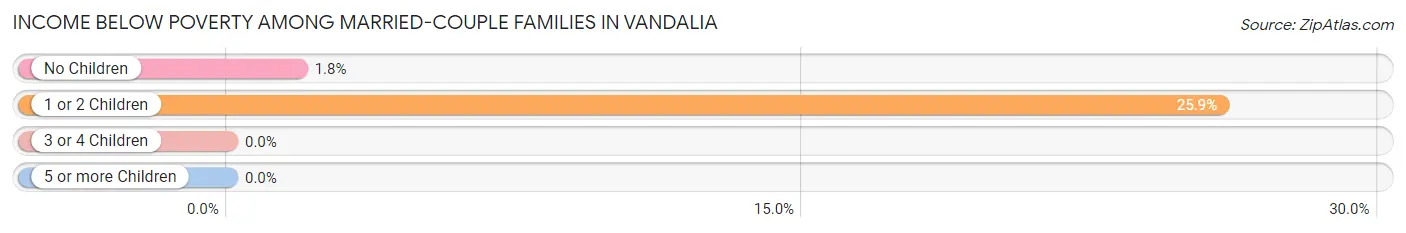
| Children | Above Poverty | Below Poverty |
| No Children | 162 (98.2%) | 3 (1.8%) |
| 1 or 2 Children | 63 (74.1%) | 22 (25.9%) |
| 3 or 4 Children | 42 (100.0%) | 0 (0.0%) |
| 5 or more Children | 0 (0.0%) | 0 (0.0%) |
| Total | 267 (91.4%) | 25 (8.6%) |
Income Below Poverty Among Single-Parent Households in Vandalia
According to the poverty data in Vandalia, 17.3% or 13 single-father households and 25.6% or 33 single-mother households are living below the poverty line. Among single-father households, those with 1 or 2 children have the highest poverty rate, with 13 households (39.4%) experiencing poverty. Likewise, among single-mother households, those with 3 or 4 children have the highest poverty rate, with 11 households (100.0%) falling below the poverty line.
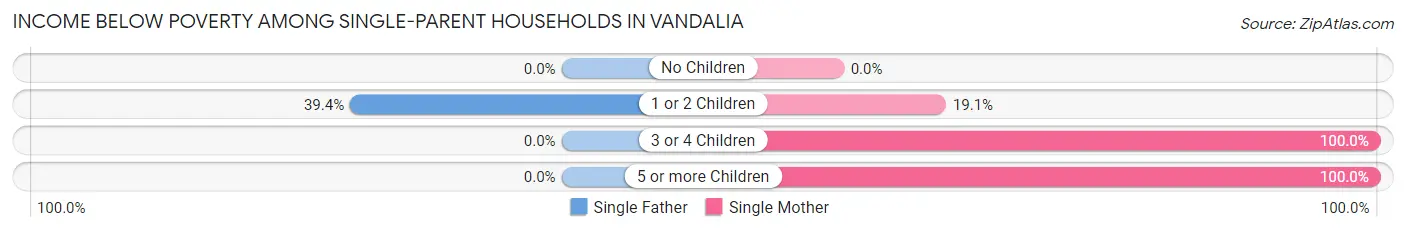
| Children | Single Father | Single Mother |
| No Children | 0 (0.0%) | 0 (0.0%) |
| 1 or 2 Children | 13 (39.4%) | 12 (19.1%) |
| 3 or 4 Children | 0 (0.0%) | 11 (100.0%) |
| 5 or more Children | 0 (0.0%) | 10 (100.0%) |
| Total | 13 (17.3%) | 33 (25.6%) |
Income Below Poverty Among Married-Couple vs Single-Parent Households in Vandalia
The poverty data for Vandalia shows that 25 of the married-couple family households (8.6%) and 46 of the single-parent households (22.6%) are living below the poverty level. Within the married-couple family households, those with 1 or 2 children have the highest poverty rate, with 22 households (25.9%) falling below the poverty line. Among the single-parent households, those with 3 or 4 children have the highest poverty rate, with 11 household (100.0%) living below poverty.
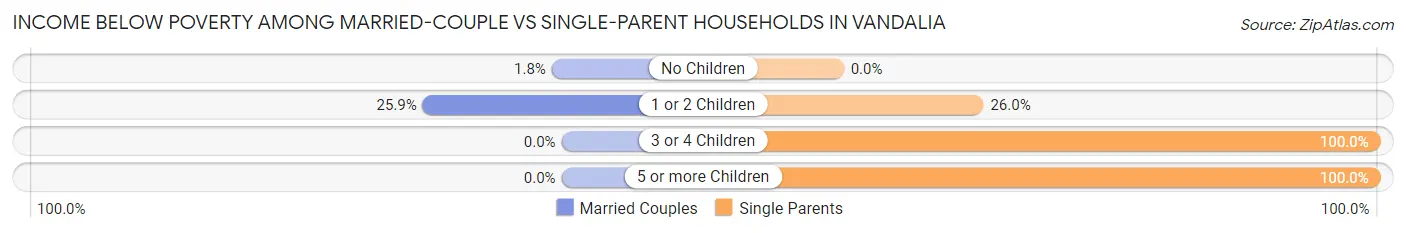
| Children | Married-Couple Families | Single-Parent Households |
| No Children | 3 (1.8%) | 0 (0.0%) |
| 1 or 2 Children | 22 (25.9%) | 25 (26.0%) |
| 3 or 4 Children | 0 (0.0%) | 11 (100.0%) |
| 5 or more Children | 0 (0.0%) | 10 (100.0%) |
| Total | 25 (8.6%) | 46 (22.6%) |
Race in Vandalia
The most populous races in Vandalia are White / Caucasian (2,634 | 77.9%), Black / African American (446 | 13.2%), and Two or more Races (204 | 6.0%).
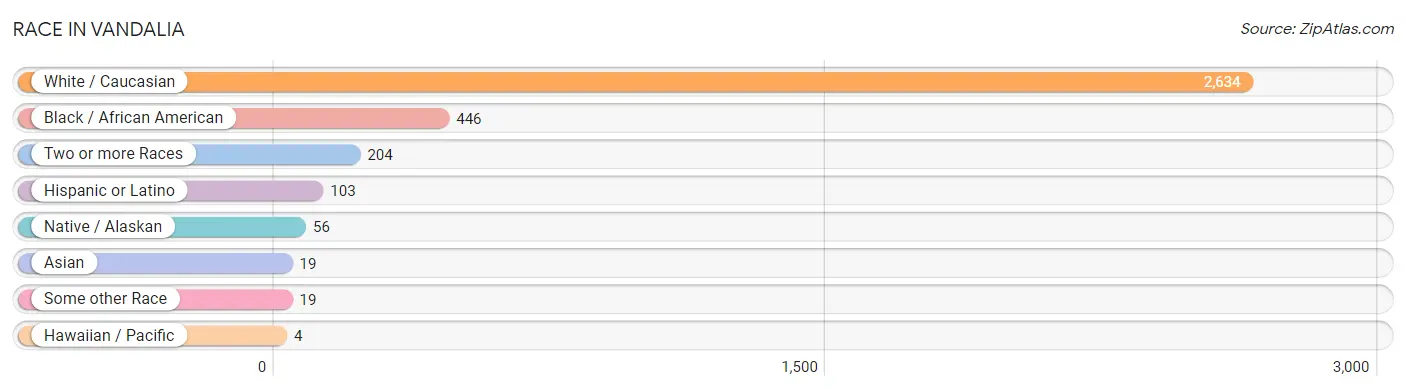
| Race | # Population | % Population |
| Asian | 19 | 0.6% |
| Black / African American | 446 | 13.2% |
| Hawaiian / Pacific | 4 | 0.1% |
| Hispanic or Latino | 103 | 3.0% |
| Native / Alaskan | 56 | 1.7% |
| White / Caucasian | 2,634 | 77.9% |
| Two or more Races | 204 | 6.0% |
| Some other Race | 19 | 0.6% |
| Total | 3,382 | 100.0% |
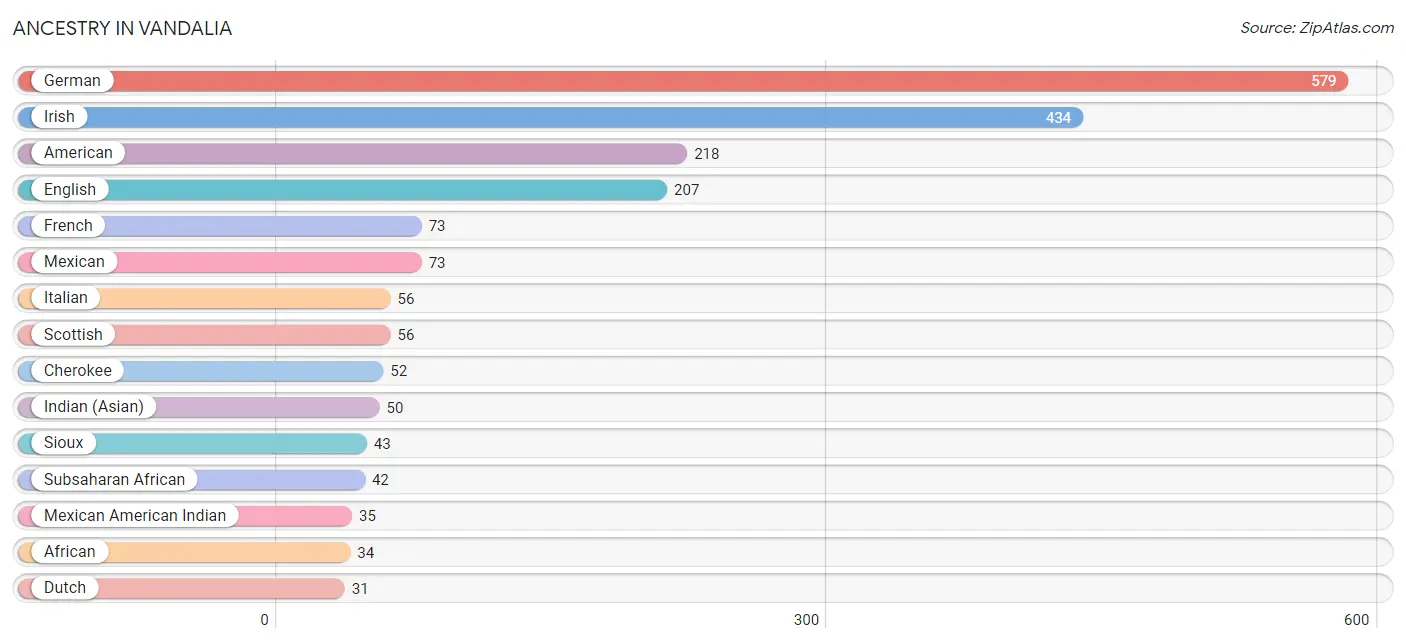
Ancestry in Vandalia
The most populous ancestries reported in Vandalia are German (579 | 17.1%), Irish (434 | 12.8%), American (218 | 6.5%), English (207 | 6.1%), and French (73 | 2.2%), together accounting for 44.7% of all Vandalia residents.
| Ancestry | # Population | % Population |
| African | 34 | 1.0% |
| American | 218 | 6.5% |
| Apache | 13 | 0.4% |
| Australian | 2 | 0.1% |
| Blackfeet | 9 | 0.3% |
| Canadian | 12 | 0.4% |
| Central American | 7 | 0.2% |
| Cherokee | 52 | 1.5% |
| Croatian | 3 | 0.1% |
| Czech | 3 | 0.1% |
| Dutch | 31 | 0.9% |
| English | 207 | 6.1% |
| European | 13 | 0.4% |
| French | 73 | 2.2% |
| German | 579 | 17.1% |
| Greek | 20 | 0.6% |
| Honduran | 7 | 0.2% |
| Icelander | 3 | 0.1% |
| Indian (Asian) | 50 | 1.5% |
| Irish | 434 | 12.8% |
| Italian | 56 | 1.7% |
| Japanese | 14 | 0.4% |
| Korean | 16 | 0.5% |
| Mexican | 73 | 2.2% |
| Mexican American Indian | 35 | 1.0% |
| Nigerian | 8 | 0.2% |
| Norwegian | 4 | 0.1% |
| Polish | 21 | 0.6% |
| Portuguese | 3 | 0.1% |
| Scottish | 56 | 1.7% |
| Sioux | 43 | 1.3% |
| Spanish | 7 | 0.2% |
| Sri Lankan | 3 | 0.1% |
| Subsaharan African | 42 | 1.2% |
| Swedish | 5 | 0.2% | View All 35 Rows |
Immigrants in Vandalia
The most numerous immigrant groups reported in Vandalia came from Central America (35 | 1.0%), Latin America (35 | 1.0%), Mexico (35 | 1.0%), Asia (19 | 0.6%), and South Eastern Asia (19 | 0.6%), together accounting for 4.2% of all Vandalia residents.
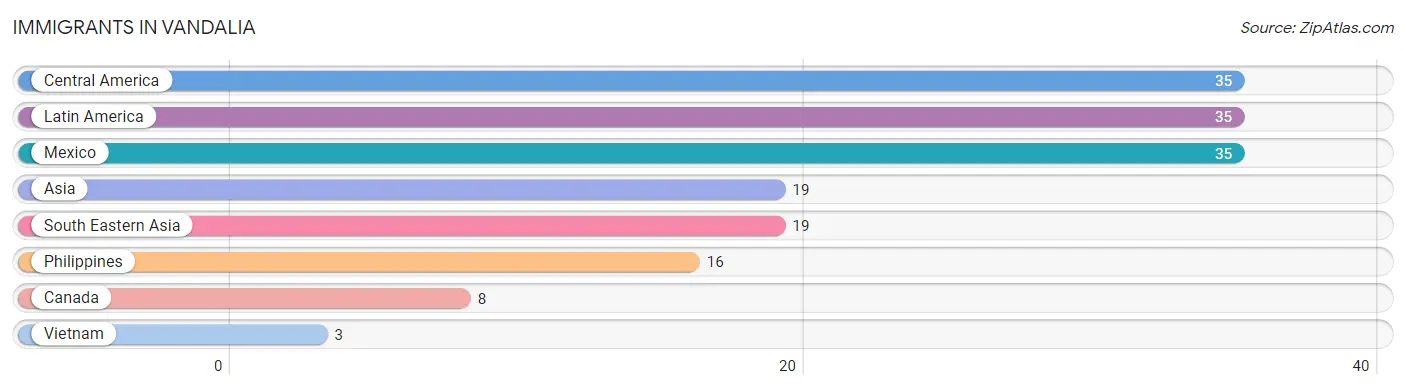
| Immigration Origin | # Population | % Population |
| Asia | 19 | 0.6% |
| Canada | 8 | 0.2% |
| Central America | 35 | 1.0% |
| Latin America | 35 | 1.0% |
| Mexico | 35 | 1.0% |
| Philippines | 16 | 0.5% |
| South Eastern Asia | 19 | 0.6% |
| Vietnam | 3 | 0.1% | View All 8 Rows |
Sex and Age in Vandalia
Sex and Age in Vandalia
The most populous age groups in Vandalia are 40 to 44 Years (261 | 16.5%) for men and 35 to 39 Years (233 | 13.0%) for women.
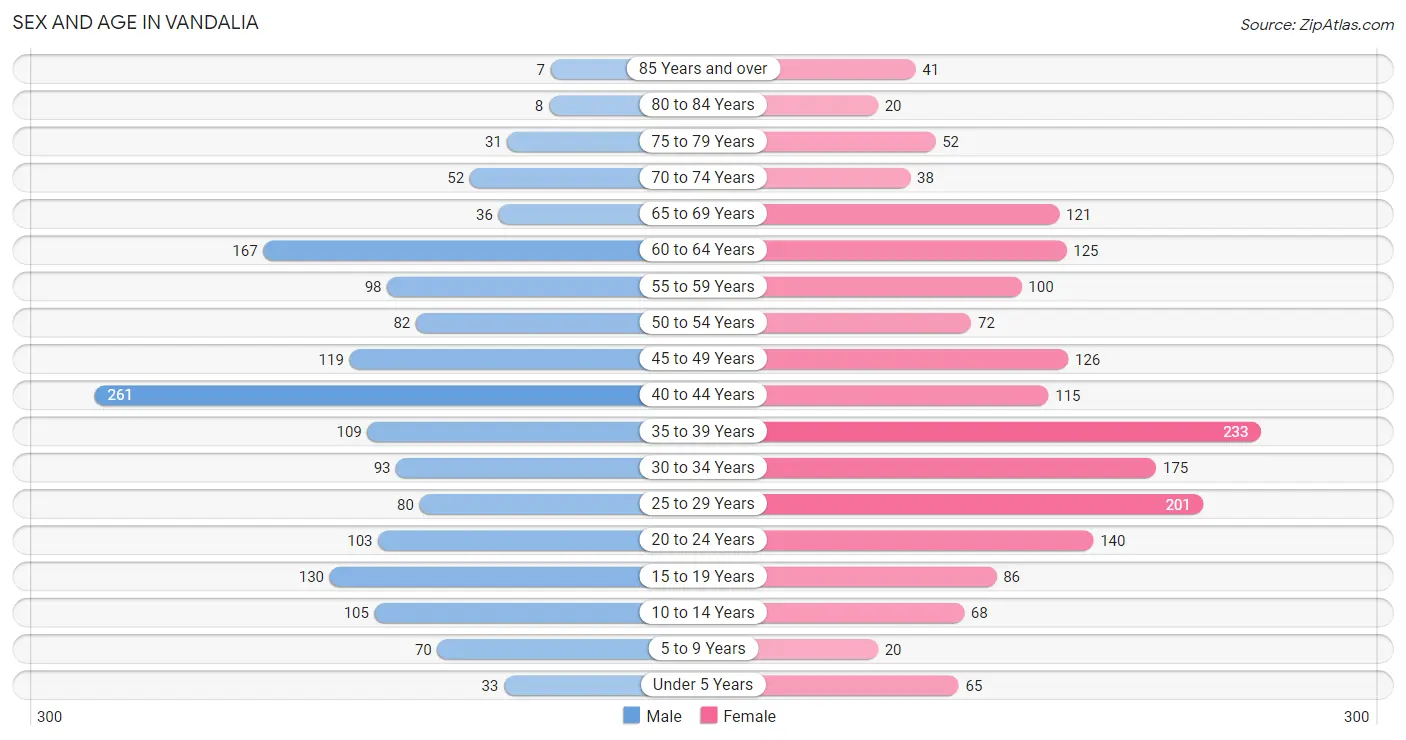
| Age Bracket | Male | Female |
| Under 5 Years | 33 (2.1%) | 65 (3.6%) |
| 5 to 9 Years | 70 (4.4%) | 20 (1.1%) |
| 10 to 14 Years | 105 (6.6%) | 68 (3.8%) |
| 15 to 19 Years | 130 (8.2%) | 86 (4.8%) |
| 20 to 24 Years | 103 (6.5%) | 140 (7.8%) |
| 25 to 29 Years | 80 (5.1%) | 201 (11.2%) |
| 30 to 34 Years | 93 (5.9%) | 175 (9.7%) |
| 35 to 39 Years | 109 (6.9%) | 233 (13.0%) |
| 40 to 44 Years | 261 (16.5%) | 115 (6.4%) |
| 45 to 49 Years | 119 (7.5%) | 126 (7.0%) |
| 50 to 54 Years | 82 (5.2%) | 72 (4.0%) |
| 55 to 59 Years | 98 (6.2%) | 100 (5.6%) |
| 60 to 64 Years | 167 (10.5%) | 125 (7.0%) |
| 65 to 69 Years | 36 (2.3%) | 121 (6.7%) |
| 70 to 74 Years | 52 (3.3%) | 38 (2.1%) |
| 75 to 79 Years | 31 (2.0%) | 52 (2.9%) |
| 80 to 84 Years | 8 (0.5%) | 20 (1.1%) |
| 85 Years and over | 7 (0.4%) | 41 (2.3%) |
| Total | 1,584 (100.0%) | 1,798 (100.0%) |
Families and Households in Vandalia
Median Family Size in Vandalia
The median family size in Vandalia is 3.49 persons per family, with single male/father families (75 | 15.1%) accounting for the largest median family size of 3.64 persons per family. On the other hand, married-couple families (292 | 58.9%) represent the smallest median family size with 3.41 persons per family.
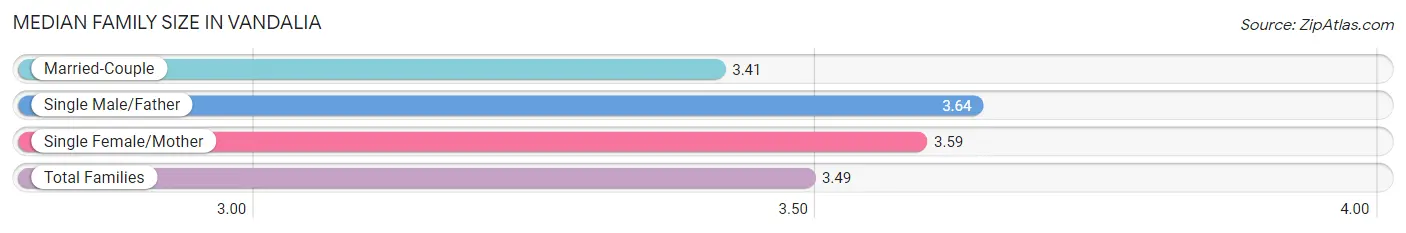
| Family Type | # Families | Family Size |
| Married-Couple | 292 (58.9%) | 3.41 |
| Single Male/Father | 75 (15.1%) | 3.64 |
| Single Female/Mother | 129 (26.0%) | 3.59 |
| Total Families | 496 (100.0%) | 3.49 |
Median Household Size in Vandalia
The median household size in Vandalia is 2.51 persons per household, with single male/father households (75 | 7.9%) accounting for the largest median household size of 3.97 persons per household. non-family households (448 | 47.5%) represent the smallest median household size with 1.20 persons per household.
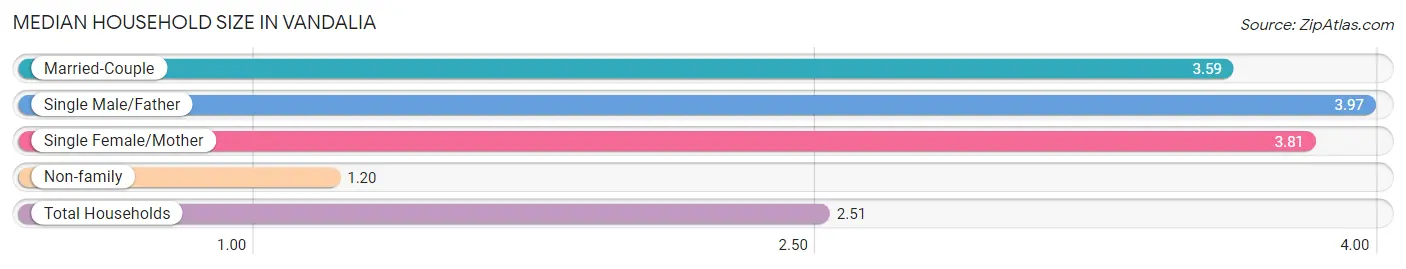
| Household Type | # Households | Household Size |
| Married-Couple | 292 (30.9%) | 3.59 |
| Single Male/Father | 75 (7.9%) | 3.97 |
| Single Female/Mother | 129 (13.7%) | 3.81 |
| Non-family | 448 (47.5%) | 1.20 |
| Total Households | 944 (100.0%) | 2.51 |
Household Size by Marriage Status in Vandalia
Out of a total of 944 households in Vandalia, 496 (52.5%) are family households, while 448 (47.5%) are nonfamily households. The most numerous type of family households are 2-person households, comprising 200, and the most common type of nonfamily households are 1-person households, comprising 380.
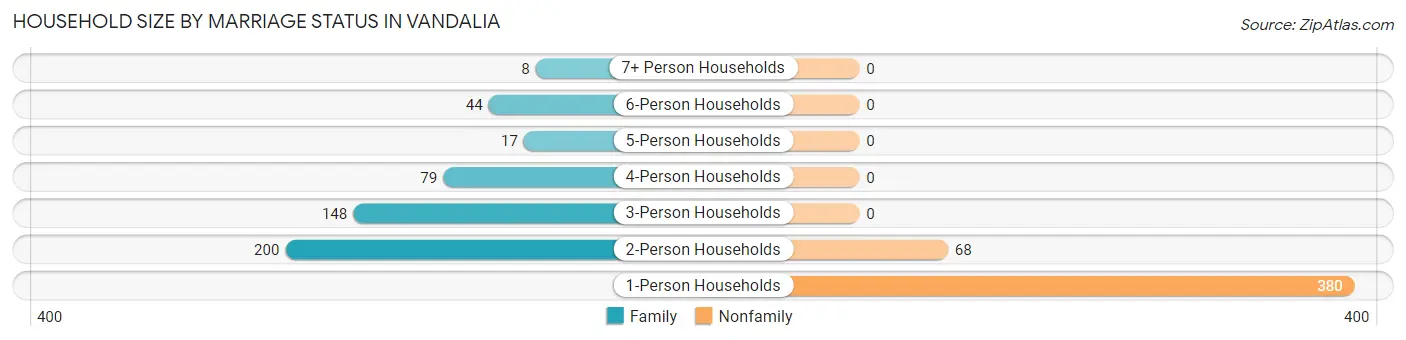
| Household Size | Family Households | Nonfamily Households |
| 1-Person Households | - | 380 (40.3%) |
| 2-Person Households | 200 (21.2%) | 68 (7.2%) |
| 3-Person Households | 148 (15.7%) | 0 (0.0%) |
| 4-Person Households | 79 (8.4%) | 0 (0.0%) |
| 5-Person Households | 17 (1.8%) | 0 (0.0%) |
| 6-Person Households | 44 (4.7%) | 0 (0.0%) |
| 7+ Person Households | 8 (0.9%) | 0 (0.0%) |
| Total | 496 (52.5%) | 448 (47.5%) |
Female Fertility in Vandalia
Fertility by Age in Vandalia
Average fertility rate in Vandalia is 24.0 births per 1,000 women. Women in the age bracket of 20 to 34 years have the highest fertility rate with 47.0 births per 1,000 women. Women in the age bracket of 20 to 34 years acount for 92.3% of all women with births.
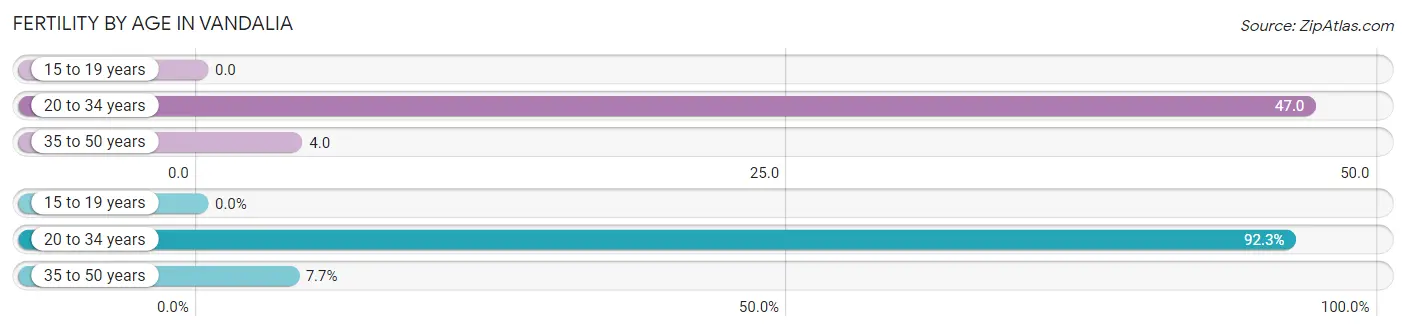
| Age Bracket | Women with Births | Births / 1,000 Women |
| 15 to 19 years | 0 (0.0%) | 0.0 |
| 20 to 34 years | 24 (92.3%) | 47.0 |
| 35 to 50 years | 2 (7.7%) | 4.0 |
| Total | 26 (100.0%) | 24.0 |
Fertility by Age by Marriage Status in Vandalia
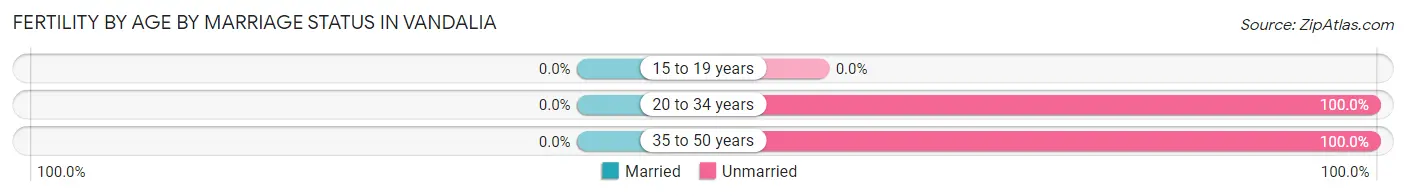
| Age Bracket | Married | Unmarried |
| 15 to 19 years | 0 (0.0%) | 0 (0.0%) |
| 20 to 34 years | 0 (0.0%) | 24 (100.0%) |
| 35 to 50 years | 0 (0.0%) | 2 (100.0%) |
| Total | 0 (0.0%) | 26 (100.0%) |
Fertility by Education in Vandalia
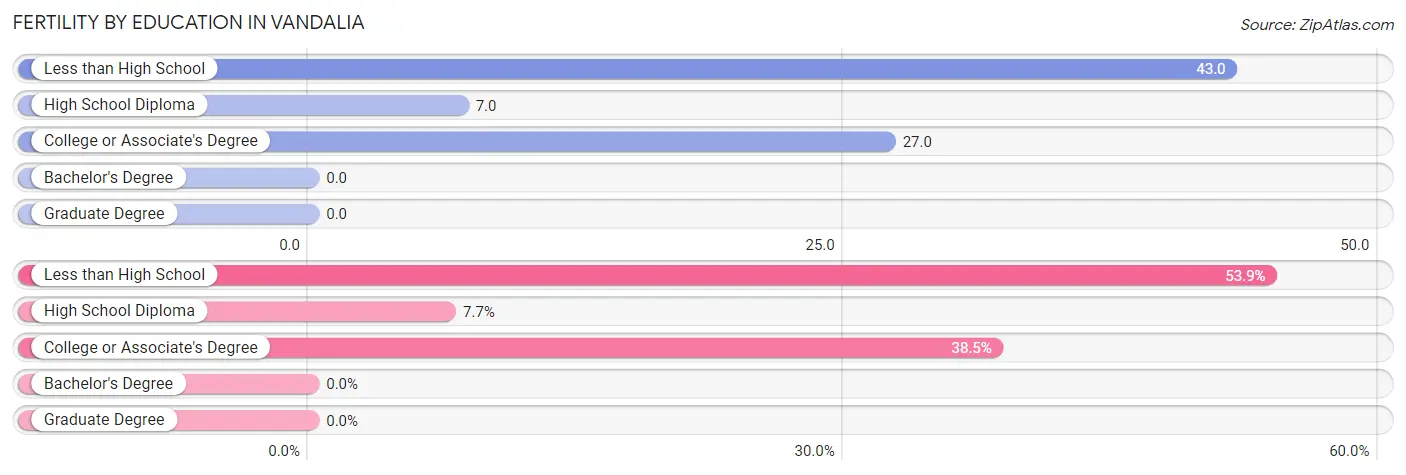
| Educational Attainment | Women with Births | Births / 1,000 Women |
| Less than High School | 14 (53.8%) | 43.0 |
| High School Diploma | 2 (7.7%) | 7.0 |
| College or Associate's Degree | 10 (38.5%) | 27.0 |
| Bachelor's Degree | 0 (0.0%) | 0.0 |
| Graduate Degree | 0 (0.0%) | 0.0 |
| Total | 26 (100.0%) | 24.0 |
Fertility by Education by Marriage Status in Vandalia
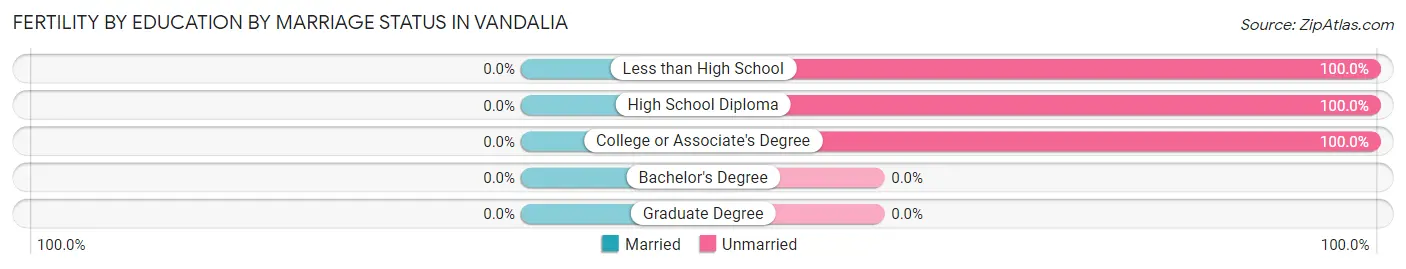
| Educational Attainment | Married | Unmarried |
| Less than High School | 0 (0.0%) | 14 (100.0%) |
| High School Diploma | 0 (0.0%) | 2 (100.0%) |
| College or Associate's Degree | 0 (0.0%) | 10 (100.0%) |
| Bachelor's Degree | 0 (0.0%) | 0 (0.0%) |
| Graduate Degree | 0 (0.0%) | 0 (0.0%) |
| Total | 0 (0.0%) | 26 (100.0%) |
Employment Characteristics in Vandalia
Employment by Class of Employer in Vandalia
Among the 1,265 employed individuals in Vandalia, private company employees (859 | 67.9%), local government employees (111 | 8.8%), and not-for-profit organizations (95 | 7.5%) make up the most common classes of employment.
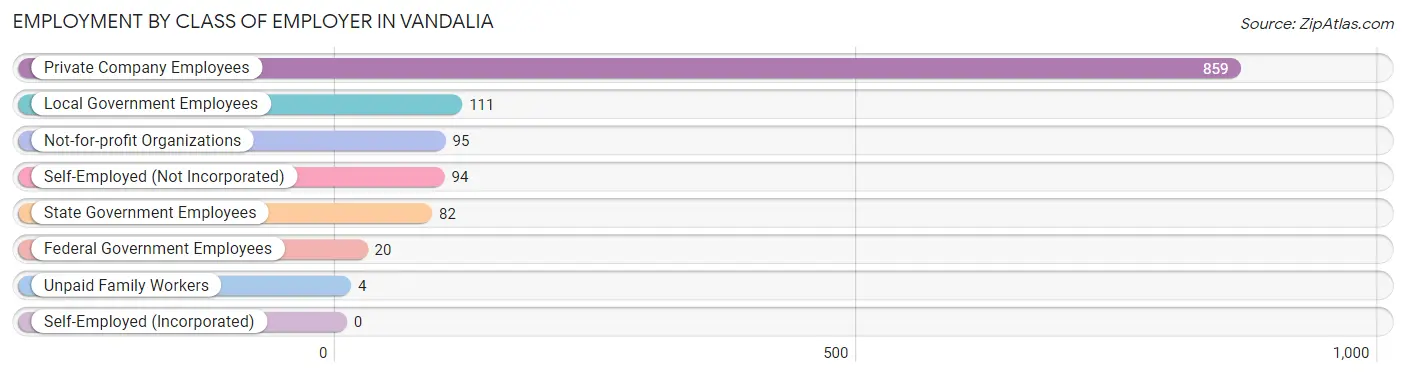
| Employer Class | # Employees | % Employees |
| Private Company Employees | 859 | 67.9% |
| Self-Employed (Incorporated) | 0 | 0.0% |
| Self-Employed (Not Incorporated) | 94 | 7.4% |
| Not-for-profit Organizations | 95 | 7.5% |
| Local Government Employees | 111 | 8.8% |
| State Government Employees | 82 | 6.5% |
| Federal Government Employees | 20 | 1.6% |
| Unpaid Family Workers | 4 | 0.3% |
| Total | 1,265 | 100.0% |
Employment Status by Age in Vandalia
According to the labor force statistics for Vandalia, out of the total population over 16 years of age (2,959), 44.7% or 1,323 individuals are in the labor force, with 3.3% or 44 of them unemployed. The age group with the highest labor force participation rate is 16 to 19 years, with 74.0% or 114 individuals in the labor force. Within the labor force, the 25 to 29 years age range has the highest percentage of unemployed individuals, with 12.3% or 19 of them being unemployed.
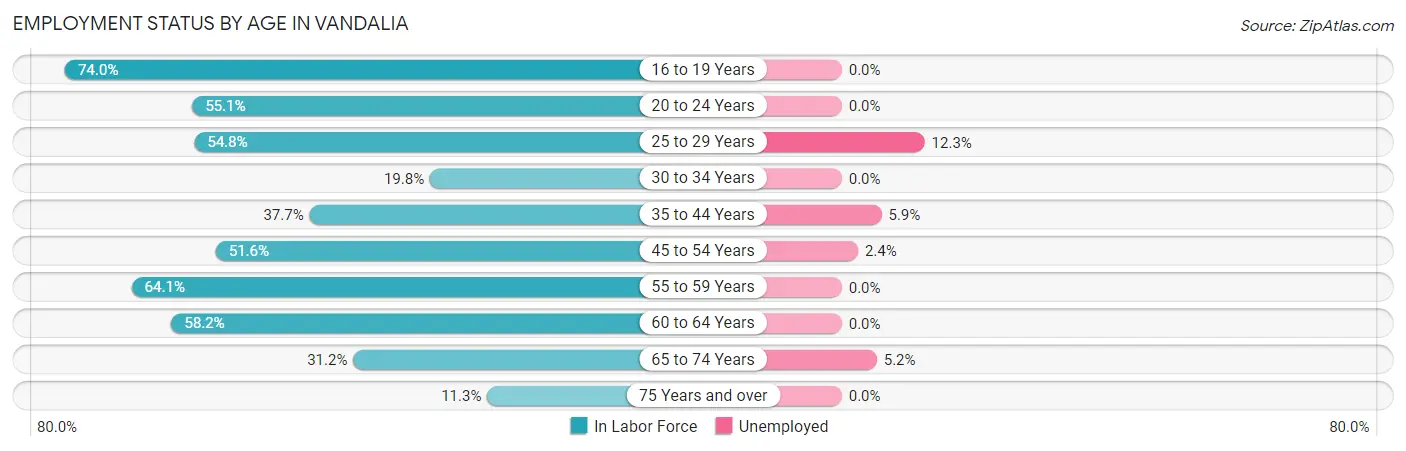
| Age Bracket | In Labor Force | Unemployed |
| 16 to 19 Years | 114 (74.0%) | 0 (0.0%) |
| 20 to 24 Years | 134 (55.1%) | 0 (0.0%) |
| 25 to 29 Years | 154 (54.8%) | 19 (12.3%) |
| 30 to 34 Years | 53 (19.8%) | 0 (0.0%) |
| 35 to 44 Years | 271 (37.7%) | 16 (5.9%) |
| 45 to 54 Years | 206 (51.6%) | 5 (2.4%) |
| 55 to 59 Years | 127 (64.1%) | 0 (0.0%) |
| 60 to 64 Years | 170 (58.2%) | 0 (0.0%) |
| 65 to 74 Years | 77 (31.2%) | 4 (5.2%) |
| 75 Years and over | 18 (11.3%) | 0 (0.0%) |
| Total | 1,323 (44.7%) | 44 (3.3%) |
Employment Status by Educational Attainment in Vandalia
According to labor force statistics for Vandalia, 45.5% of individuals (981) out of the total population between 25 and 64 years of age (2,156) are in the labor force, with 4.1% or 40 of them being unemployed. The group with the highest labor force participation rate are those with the educational attainment of bachelor's degree or higher, with 91.4% or 160 individuals in the labor force. Within the labor force, individuals with less than high school education have the highest percentage of unemployment, with 27.7% or 28 of them being unemployed.
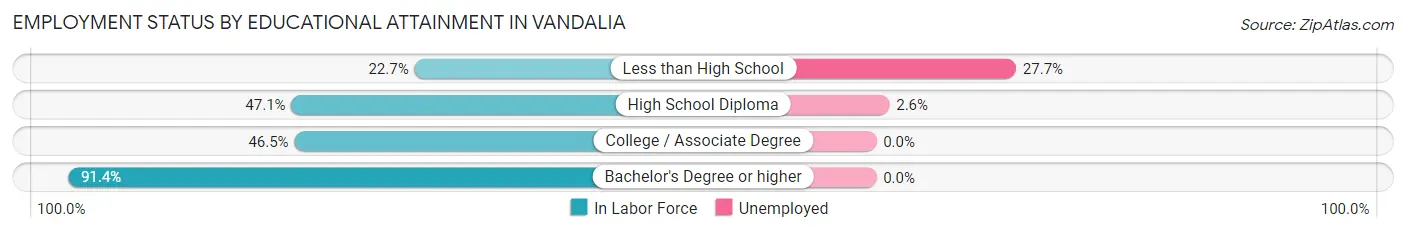
| Educational Attainment | In Labor Force | Unemployed |
| Less than High School | 101 (22.7%) | 123 (27.7%) |
| High School Diploma | 458 (47.1%) | 25 (2.6%) |
| College / Associate Degree | 262 (46.5%) | 0 (0.0%) |
| Bachelor's Degree or higher | 160 (91.4%) | 0 (0.0%) |
| Total | 981 (45.5%) | 88 (4.1%) |
Employment Occupations by Sex in Vandalia
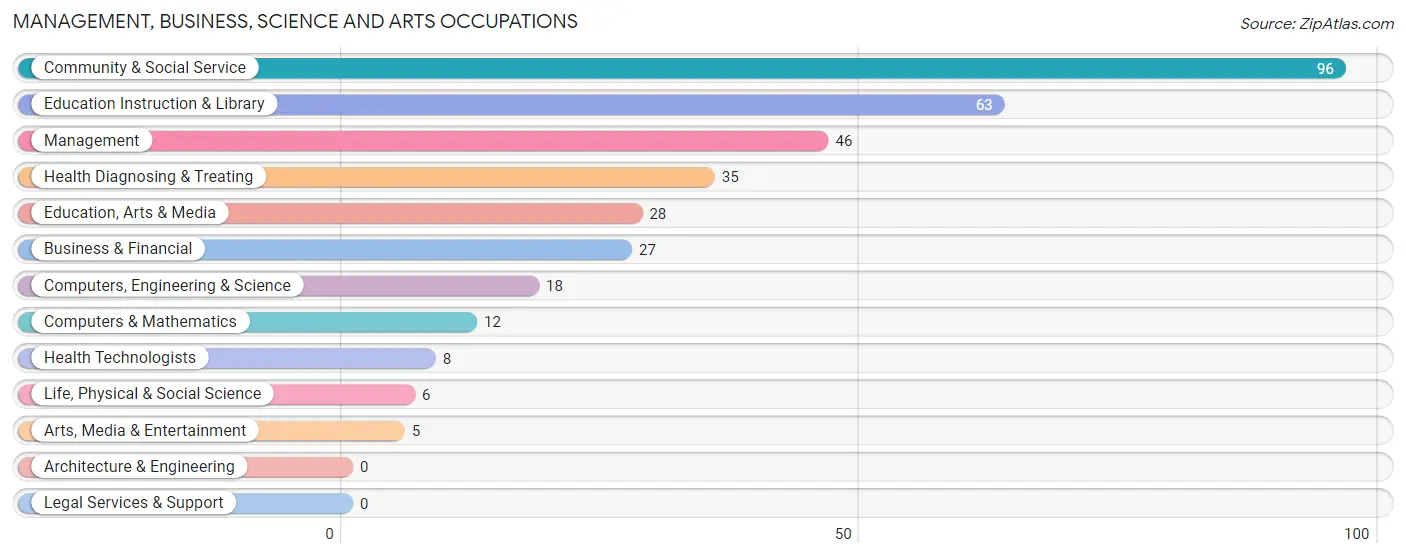
Management, Business, Science and Arts Occupations
The most common Management, Business, Science and Arts occupations in Vandalia are Community & Social Service (96 | 7.5%), Education Instruction & Library (63 | 4.9%), Management (46 | 3.6%), Health Diagnosing & Treating (35 | 2.7%), and Education, Arts & Media (28 | 2.2%).
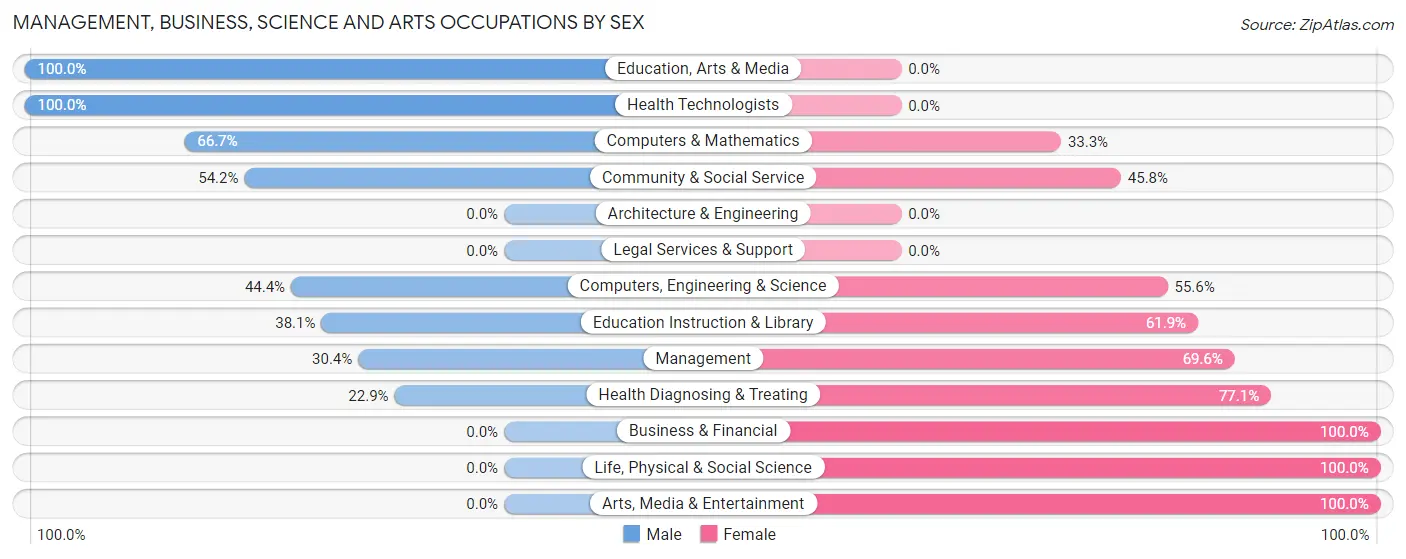
Management, Business, Science and Arts Occupations by Sex
Within the Management, Business, Science and Arts occupations in Vandalia, the most male-oriented occupations are Education, Arts & Media (100.0%), Health Technologists (100.0%), and Computers & Mathematics (66.7%), while the most female-oriented occupations are Business & Financial (100.0%), Life, Physical & Social Science (100.0%), and Arts, Media & Entertainment (100.0%).
| Occupation | Male | Female |
| Management | 14 (30.4%) | 32 (69.6%) |
| Business & Financial | 0 (0.0%) | 27 (100.0%) |
| Computers, Engineering & Science | 8 (44.4%) | 10 (55.6%) |
| Computers & Mathematics | 8 (66.7%) | 4 (33.3%) |
| Architecture & Engineering | 0 (0.0%) | 0 (0.0%) |
| Life, Physical & Social Science | 0 (0.0%) | 6 (100.0%) |
| Community & Social Service | 52 (54.2%) | 44 (45.8%) |
| Education, Arts & Media | 28 (100.0%) | 0 (0.0%) |
| Legal Services & Support | 0 (0.0%) | 0 (0.0%) |
| Education Instruction & Library | 24 (38.1%) | 39 (61.9%) |
| Arts, Media & Entertainment | 0 (0.0%) | 5 (100.0%) |
| Health Diagnosing & Treating | 8 (22.9%) | 27 (77.1%) |
| Health Technologists | 8 (100.0%) | 0 (0.0%) |
| Total (Category) | 82 (36.9%) | 140 (63.1%) |
| Total (Overall) | 701 (54.8%) | 579 (45.2%) |
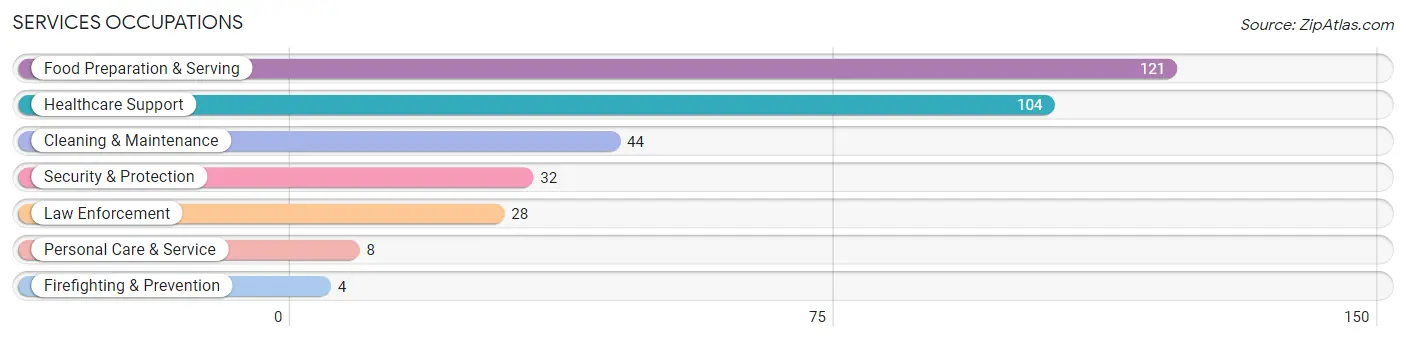
Services Occupations
The most common Services occupations in Vandalia are Food Preparation & Serving (121 | 9.5%), Healthcare Support (104 | 8.1%), Cleaning & Maintenance (44 | 3.4%), Security & Protection (32 | 2.5%), and Law Enforcement (28 | 2.2%).
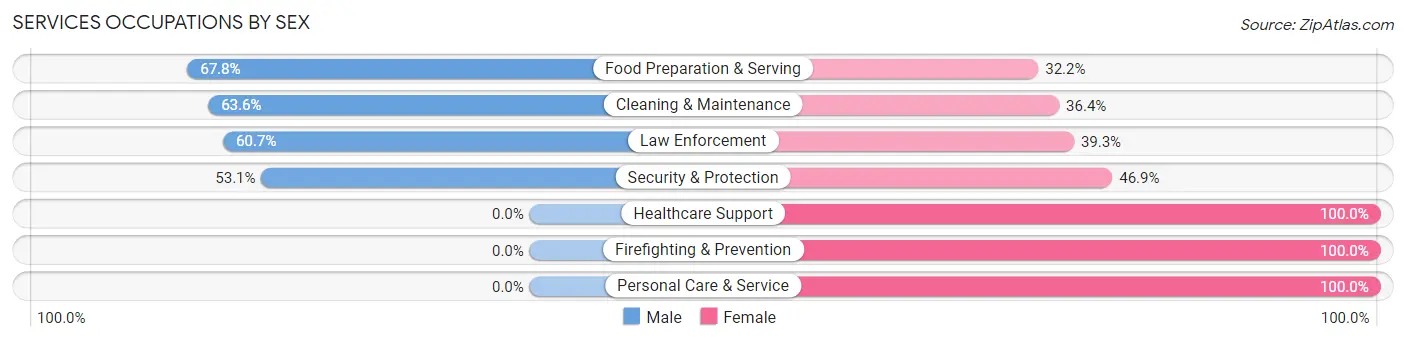
Services Occupations by Sex
Within the Services occupations in Vandalia, the most male-oriented occupations are Food Preparation & Serving (67.8%), Cleaning & Maintenance (63.6%), and Law Enforcement (60.7%), while the most female-oriented occupations are Healthcare Support (100.0%), Firefighting & Prevention (100.0%), and Personal Care & Service (100.0%).
| Occupation | Male | Female |
| Healthcare Support | 0 (0.0%) | 104 (100.0%) |
| Security & Protection | 17 (53.1%) | 15 (46.9%) |
| Firefighting & Prevention | 0 (0.0%) | 4 (100.0%) |
| Law Enforcement | 17 (60.7%) | 11 (39.3%) |
| Food Preparation & Serving | 82 (67.8%) | 39 (32.2%) |
| Cleaning & Maintenance | 28 (63.6%) | 16 (36.4%) |
| Personal Care & Service | 0 (0.0%) | 8 (100.0%) |
| Total (Category) | 127 (41.1%) | 182 (58.9%) |
| Total (Overall) | 701 (54.8%) | 579 (45.2%) |
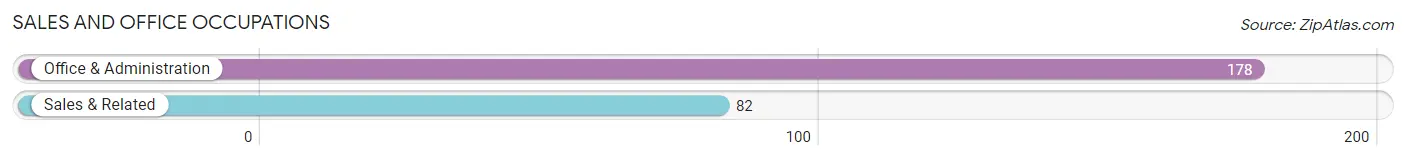
Sales and Office Occupations
The most common Sales and Office occupations in Vandalia are Office & Administration (178 | 13.9%), and Sales & Related (82 | 6.4%).
Sales and Office Occupations by Sex
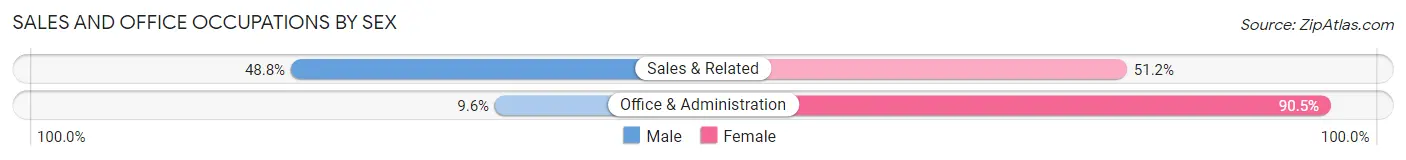
| Occupation | Male | Female |
| Sales & Related | 40 (48.8%) | 42 (51.2%) |
| Office & Administration | 17 (9.6%) | 161 (90.4%) |
| Total (Category) | 57 (21.9%) | 203 (78.1%) |
| Total (Overall) | 701 (54.8%) | 579 (45.2%) |
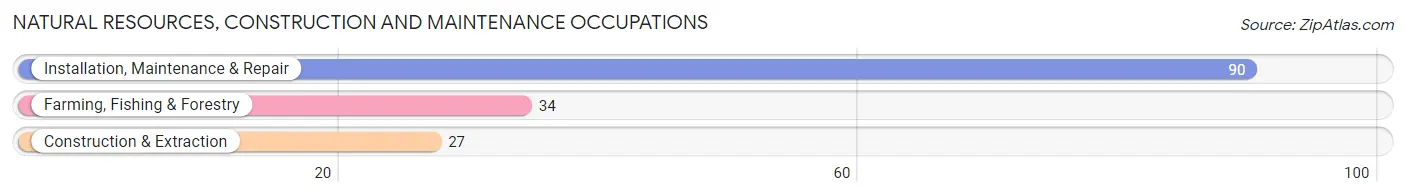
Natural Resources, Construction and Maintenance Occupations
The most common Natural Resources, Construction and Maintenance occupations in Vandalia are Installation, Maintenance & Repair (90 | 7.0%), Farming, Fishing & Forestry (34 | 2.7%), and Construction & Extraction (27 | 2.1%).
Natural Resources, Construction and Maintenance Occupations by Sex
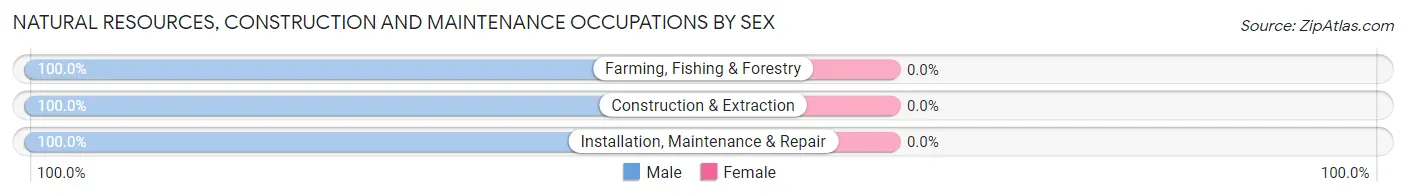
| Occupation | Male | Female |
| Farming, Fishing & Forestry | 34 (100.0%) | 0 (0.0%) |
| Construction & Extraction | 27 (100.0%) | 0 (0.0%) |
| Installation, Maintenance & Repair | 90 (100.0%) | 0 (0.0%) |
| Total (Category) | 151 (100.0%) | 0 (0.0%) |
| Total (Overall) | 701 (54.8%) | 579 (45.2%) |
Production, Transportation and Moving Occupations
The most common Production, Transportation and Moving occupations in Vandalia are Material Moving (187 | 14.6%), Production (109 | 8.5%), and Transportation (42 | 3.3%).
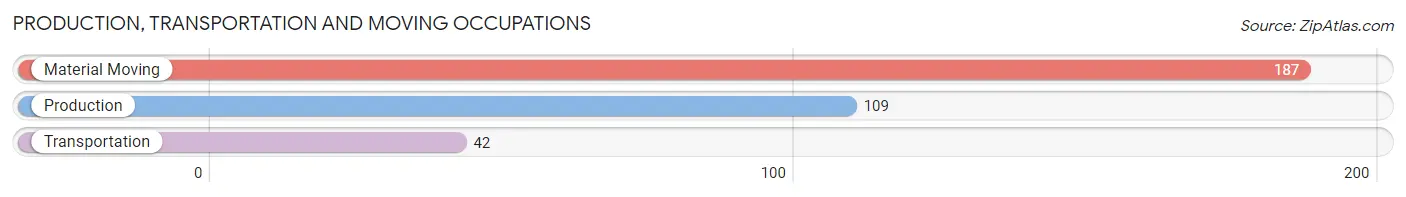
Production, Transportation and Moving Occupations by Sex
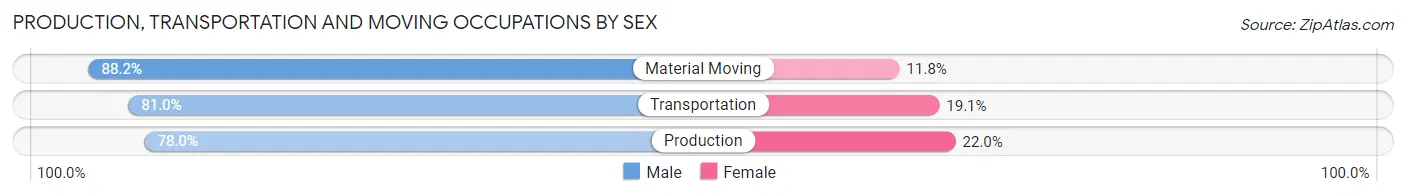
| Occupation | Male | Female |
| Production | 85 (78.0%) | 24 (22.0%) |
| Transportation | 34 (80.9%) | 8 (19.1%) |
| Material Moving | 165 (88.2%) | 22 (11.8%) |
| Total (Category) | 284 (84.0%) | 54 (16.0%) |
| Total (Overall) | 701 (54.8%) | 579 (45.2%) |
Employment Industries by Sex in Vandalia
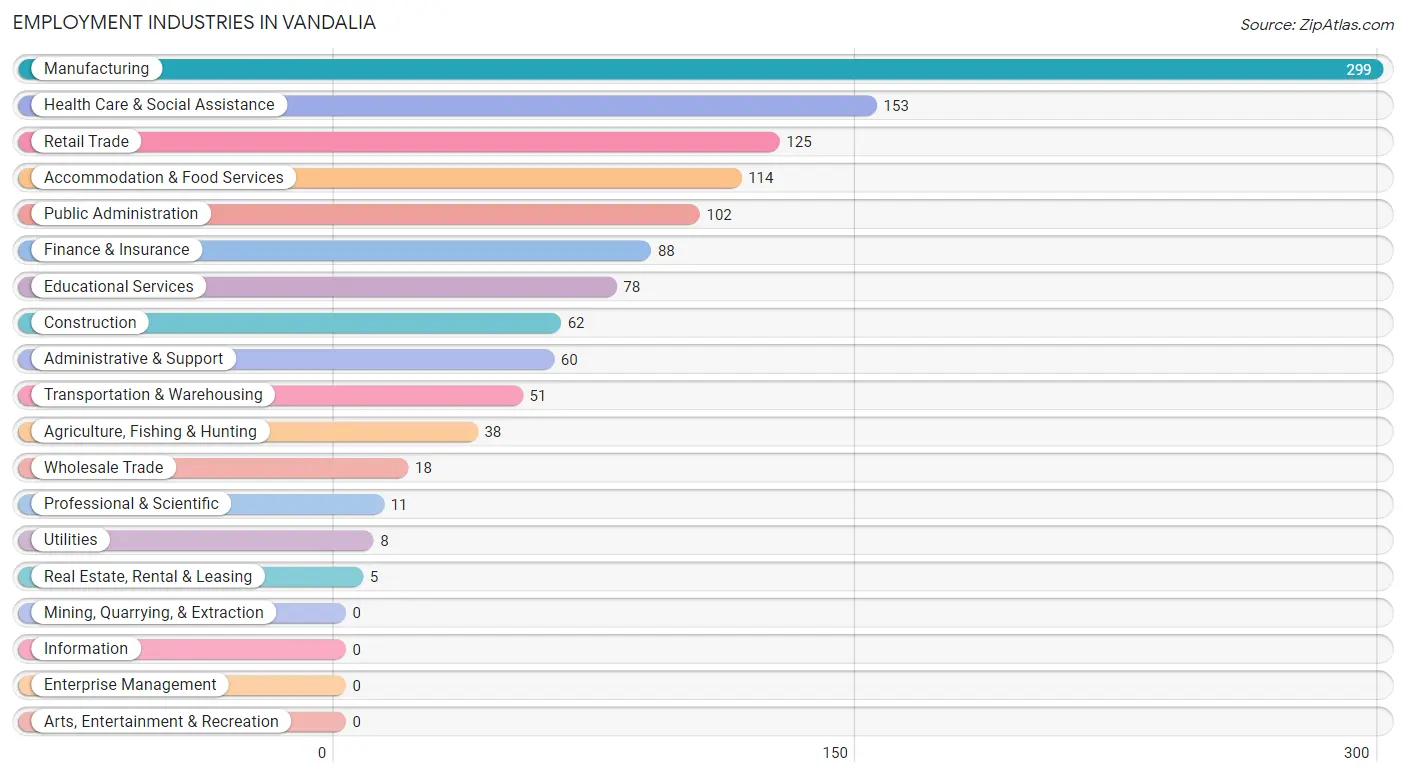
Employment Industries in Vandalia
The major employment industries in Vandalia include Manufacturing (299 | 23.4%), Health Care & Social Assistance (153 | 11.9%), Retail Trade (125 | 9.8%), Accommodation & Food Services (114 | 8.9%), and Public Administration (102 | 8.0%).
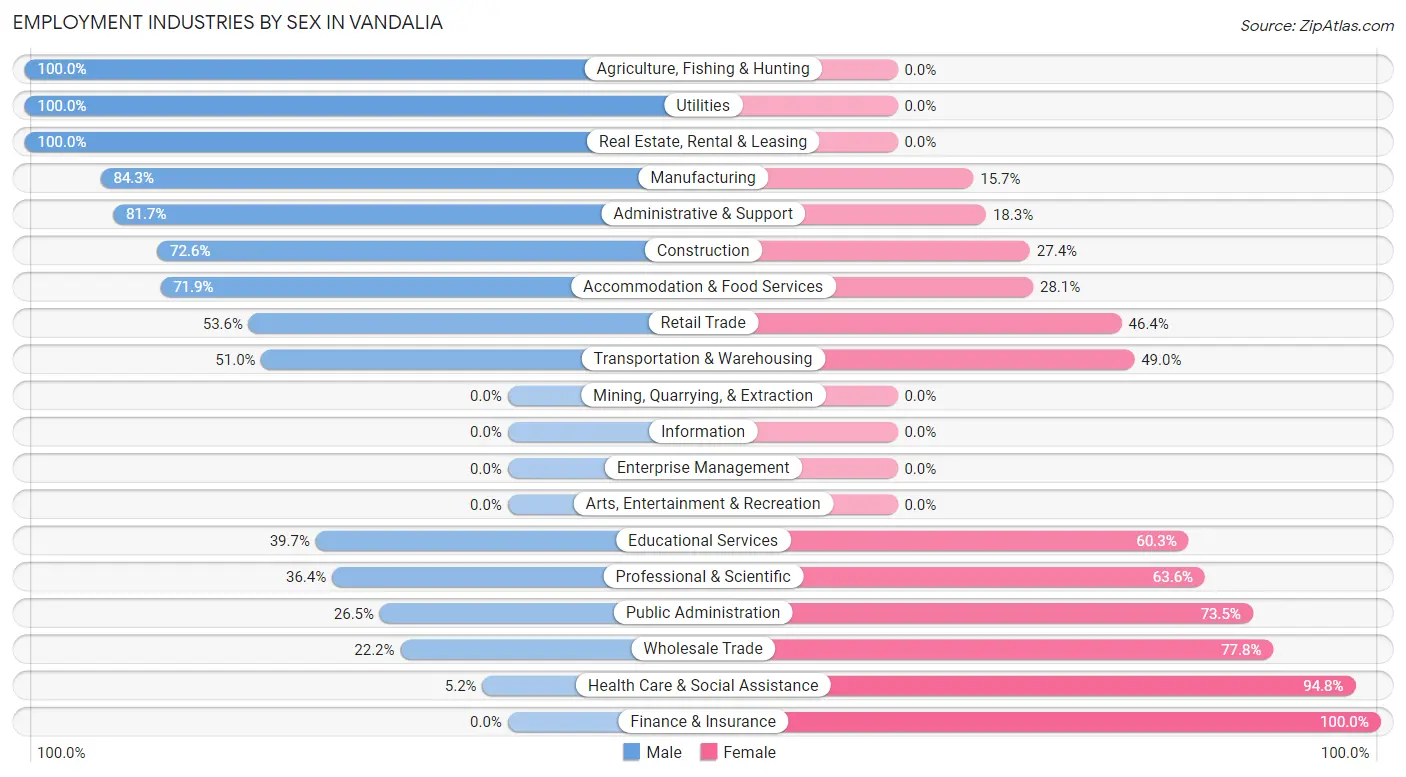
Employment Industries by Sex in Vandalia
The Vandalia industries that see more men than women are Agriculture, Fishing & Hunting (100.0%), Utilities (100.0%), and Real Estate, Rental & Leasing (100.0%), whereas the industries that tend to have a higher number of women are Finance & Insurance (100.0%), Health Care & Social Assistance (94.8%), and Wholesale Trade (77.8%).
| Industry | Male | Female |
| Agriculture, Fishing & Hunting | 38 (100.0%) | 0 (0.0%) |
| Mining, Quarrying, & Extraction | 0 (0.0%) | 0 (0.0%) |
| Construction | 45 (72.6%) | 17 (27.4%) |
| Manufacturing | 252 (84.3%) | 47 (15.7%) |
| Wholesale Trade | 4 (22.2%) | 14 (77.8%) |
| Retail Trade | 67 (53.6%) | 58 (46.4%) |
| Transportation & Warehousing | 26 (51.0%) | 25 (49.0%) |
| Utilities | 8 (100.0%) | 0 (0.0%) |
| Information | 0 (0.0%) | 0 (0.0%) |
| Finance & Insurance | 0 (0.0%) | 88 (100.0%) |
| Real Estate, Rental & Leasing | 5 (100.0%) | 0 (0.0%) |
| Professional & Scientific | 4 (36.4%) | 7 (63.6%) |
| Enterprise Management | 0 (0.0%) | 0 (0.0%) |
| Administrative & Support | 49 (81.7%) | 11 (18.3%) |
| Educational Services | 31 (39.7%) | 47 (60.3%) |
| Health Care & Social Assistance | 8 (5.2%) | 145 (94.8%) |
| Arts, Entertainment & Recreation | 0 (0.0%) | 0 (0.0%) |
| Accommodation & Food Services | 82 (71.9%) | 32 (28.1%) |
| Public Administration | 27 (26.5%) | 75 (73.5%) |
| Total | 701 (54.8%) | 579 (45.2%) |
Education in Vandalia
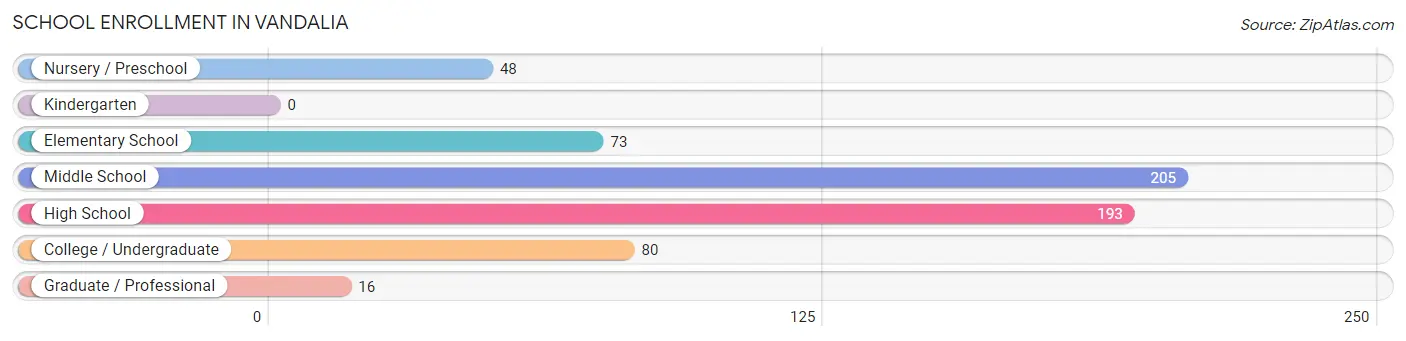
School Enrollment in Vandalia
The most common levels of schooling among the 615 students in Vandalia are middle school (205 | 33.3%), high school (193 | 31.4%), and college / undergraduate (80 | 13.0%).
| School Level | # Students | % Students |
| Nursery / Preschool | 48 | 7.8% |
| Kindergarten | 0 | 0.0% |
| Elementary School | 73 | 11.9% |
| Middle School | 205 | 33.3% |
| High School | 193 | 31.4% |
| College / Undergraduate | 80 | 13.0% |
| Graduate / Professional | 16 | 2.6% |
| Total | 615 | 100.0% |
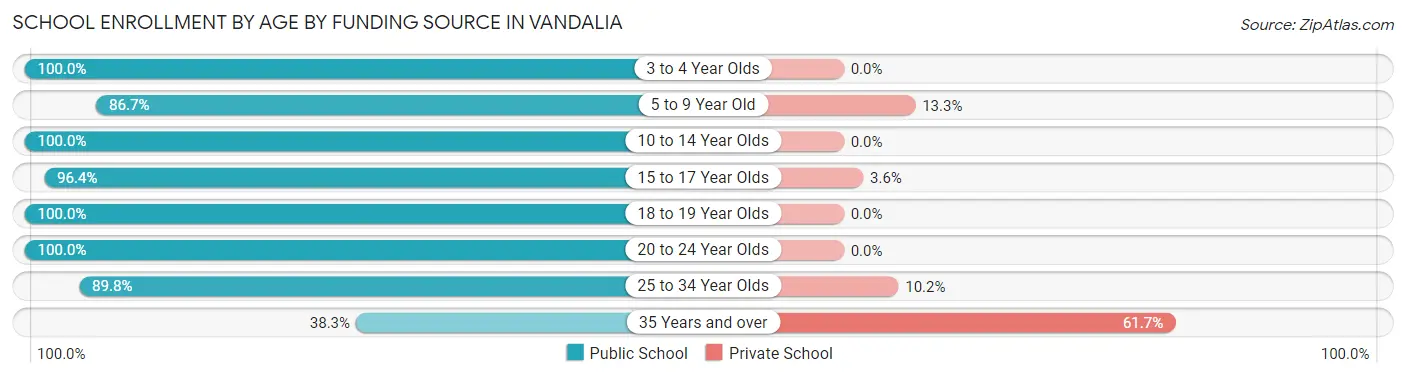
School Enrollment by Age by Funding Source in Vandalia
Out of a total of 615 students who are enrolled in schools in Vandalia, 52 (8.5%) attend a private institution, while the remaining 563 (91.5%) are enrolled in public schools. The age group of 35 years and over has the highest likelihood of being enrolled in private schools, with 29 (61.7% in the age bracket) enrolled. Conversely, the age group of 3 to 4 year olds has the lowest likelihood of being enrolled in a private school, with 31 (100.0% in the age bracket) attending a public institution.
| Age Bracket | Public School | Private School |
| 3 to 4 Year Olds | 31 (100.0%) | 0 (0.0%) |
| 5 to 9 Year Old | 78 (86.7%) | 12 (13.3%) |
| 10 to 14 Year Olds | 173 (100.0%) | 0 (0.0%) |
| 15 to 17 Year Olds | 133 (96.4%) | 5 (3.6%) |
| 18 to 19 Year Olds | 45 (100.0%) | 0 (0.0%) |
| 20 to 24 Year Olds | 32 (100.0%) | 0 (0.0%) |
| 25 to 34 Year Olds | 53 (89.8%) | 6 (10.2%) |
| 35 Years and over | 18 (38.3%) | 29 (61.7%) |
| Total | 563 (91.5%) | 52 (8.5%) |
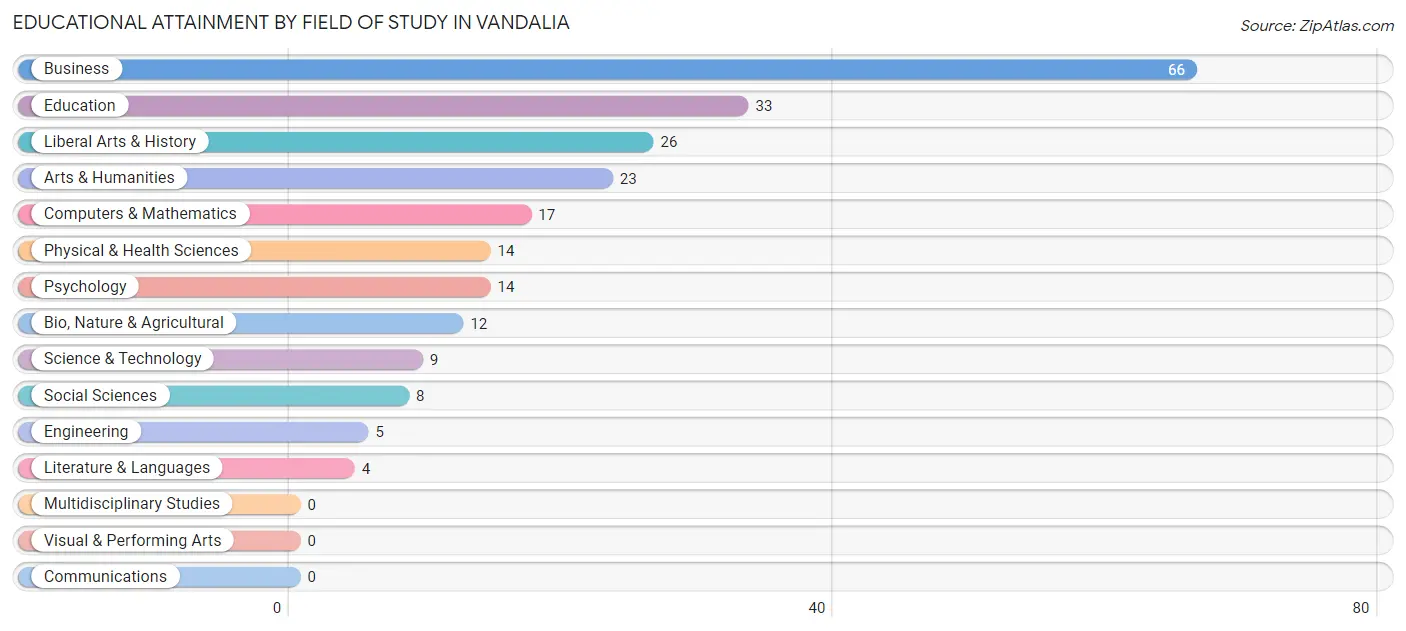
Educational Attainment by Field of Study in Vandalia
Business (66 | 28.6%), education (33 | 14.3%), liberal arts & history (26 | 11.3%), arts & humanities (23 | 10.0%), and computers & mathematics (17 | 7.4%) are the most common fields of study among 231 individuals in Vandalia who have obtained a bachelor's degree or higher.
| Field of Study | # Graduates | % Graduates |
| Computers & Mathematics | 17 | 7.4% |
| Bio, Nature & Agricultural | 12 | 5.2% |
| Physical & Health Sciences | 14 | 6.1% |
| Psychology | 14 | 6.1% |
| Social Sciences | 8 | 3.5% |
| Engineering | 5 | 2.2% |
| Multidisciplinary Studies | 0 | 0.0% |
| Science & Technology | 9 | 3.9% |
| Business | 66 | 28.6% |
| Education | 33 | 14.3% |
| Literature & Languages | 4 | 1.7% |
| Liberal Arts & History | 26 | 11.3% |
| Visual & Performing Arts | 0 | 0.0% |
| Communications | 0 | 0.0% |
| Arts & Humanities | 23 | 10.0% |
| Total | 231 | 100.0% |
Transportation & Commute in Vandalia
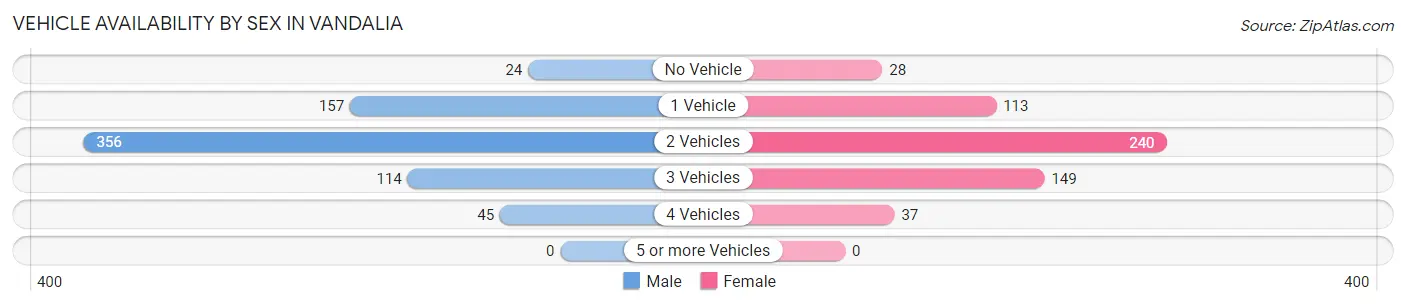
Vehicle Availability by Sex in Vandalia
The most prevalent vehicle ownership categories in Vandalia are males with 2 vehicles (356, accounting for 51.1%) and females with 2 vehicles (240, making up 62.8%).
| Vehicles Available | Male | Female |
| No Vehicle | 24 (3.5%) | 28 (4.9%) |
| 1 Vehicle | 157 (22.6%) | 113 (19.9%) |
| 2 Vehicles | 356 (51.1%) | 240 (42.3%) |
| 3 Vehicles | 114 (16.4%) | 149 (26.3%) |
| 4 Vehicles | 45 (6.5%) | 37 (6.5%) |
| 5 or more Vehicles | 0 (0.0%) | 0 (0.0%) |
| Total | 696 (100.0%) | 567 (100.0%) |
Commute Time in Vandalia
The most frequently occuring commute durations in Vandalia are 5 to 9 minutes (294 commuters, 23.4%), less than 5 minutes (242 commuters, 19.3%), and 30 to 34 minutes (151 commuters, 12.0%).
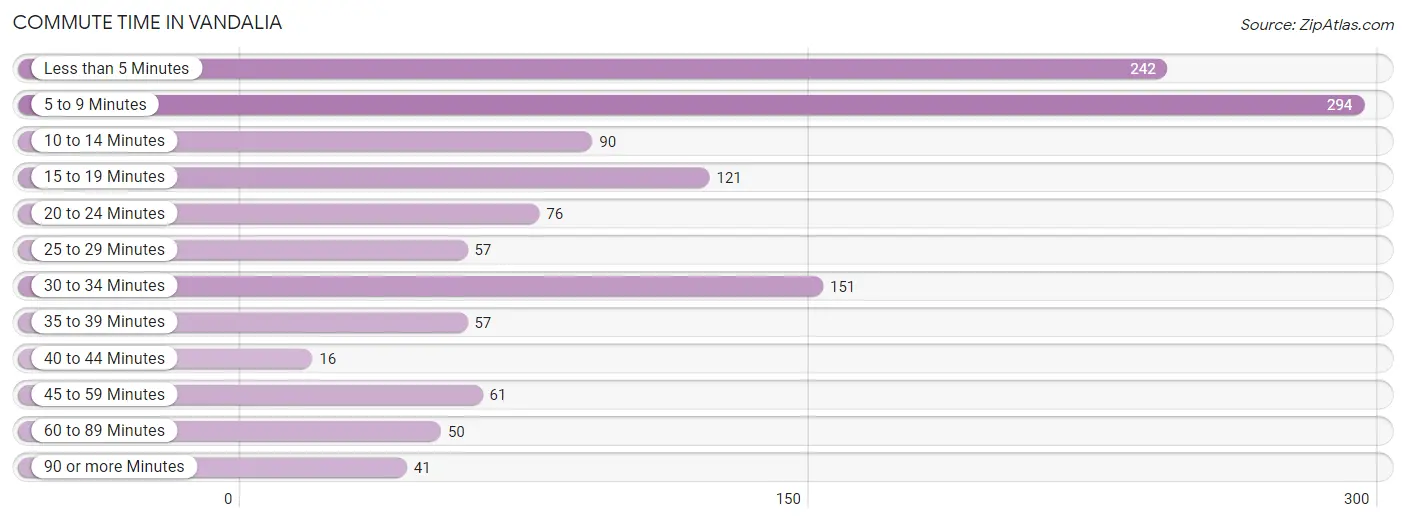
| Commute Time | # Commuters | % Commuters |
| Less than 5 Minutes | 242 | 19.3% |
| 5 to 9 Minutes | 294 | 23.4% |
| 10 to 14 Minutes | 90 | 7.2% |
| 15 to 19 Minutes | 121 | 9.6% |
| 20 to 24 Minutes | 76 | 6.0% |
| 25 to 29 Minutes | 57 | 4.5% |
| 30 to 34 Minutes | 151 | 12.0% |
| 35 to 39 Minutes | 57 | 4.5% |
| 40 to 44 Minutes | 16 | 1.3% |
| 45 to 59 Minutes | 61 | 4.9% |
| 60 to 89 Minutes | 50 | 4.0% |
| 90 or more Minutes | 41 | 3.3% |
Commute Time by Sex in Vandalia
The most common commute times in Vandalia are less than 5 minutes (148 commuters, 21.4%) for males and 5 to 9 minutes (178 commuters, 31.6%) for females.
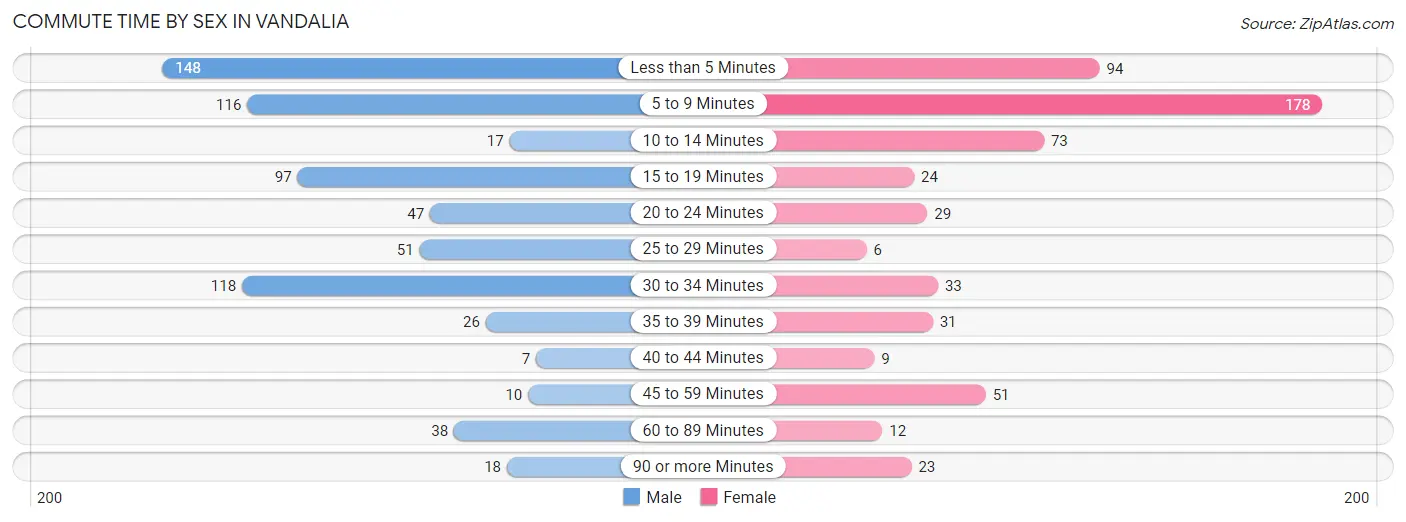
| Commute Time | Male | Female |
| Less than 5 Minutes | 148 (21.4%) | 94 (16.7%) |
| 5 to 9 Minutes | 116 (16.7%) | 178 (31.6%) |
| 10 to 14 Minutes | 17 (2.5%) | 73 (13.0%) |
| 15 to 19 Minutes | 97 (14.0%) | 24 (4.3%) |
| 20 to 24 Minutes | 47 (6.8%) | 29 (5.1%) |
| 25 to 29 Minutes | 51 (7.4%) | 6 (1.1%) |
| 30 to 34 Minutes | 118 (17.0%) | 33 (5.9%) |
| 35 to 39 Minutes | 26 (3.7%) | 31 (5.5%) |
| 40 to 44 Minutes | 7 (1.0%) | 9 (1.6%) |
| 45 to 59 Minutes | 10 (1.4%) | 51 (9.1%) |
| 60 to 89 Minutes | 38 (5.5%) | 12 (2.1%) |
| 90 or more Minutes | 18 (2.6%) | 23 (4.1%) |
Time of Departure to Work by Sex in Vandalia
The most frequent times of departure to work in Vandalia are 6:30 AM to 6:59 AM (176, 25.4%) for males and 7:30 AM to 7:59 AM (149, 26.5%) for females.
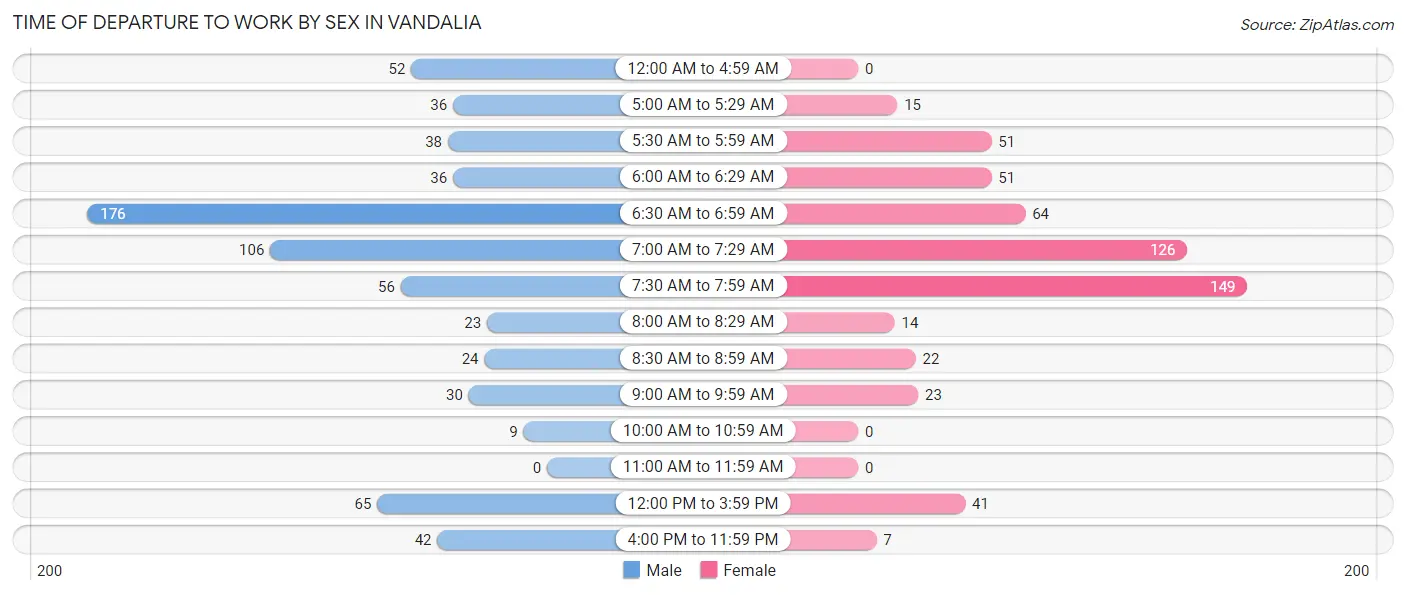
| Time of Departure | Male | Female |
| 12:00 AM to 4:59 AM | 52 (7.5%) | 0 (0.0%) |
| 5:00 AM to 5:29 AM | 36 (5.2%) | 15 (2.7%) |
| 5:30 AM to 5:59 AM | 38 (5.5%) | 51 (9.1%) |
| 6:00 AM to 6:29 AM | 36 (5.2%) | 51 (9.1%) |
| 6:30 AM to 6:59 AM | 176 (25.4%) | 64 (11.4%) |
| 7:00 AM to 7:29 AM | 106 (15.3%) | 126 (22.4%) |
| 7:30 AM to 7:59 AM | 56 (8.1%) | 149 (26.5%) |
| 8:00 AM to 8:29 AM | 23 (3.3%) | 14 (2.5%) |
| 8:30 AM to 8:59 AM | 24 (3.5%) | 22 (3.9%) |
| 9:00 AM to 9:59 AM | 30 (4.3%) | 23 (4.1%) |
| 10:00 AM to 10:59 AM | 9 (1.3%) | 0 (0.0%) |
| 11:00 AM to 11:59 AM | 0 (0.0%) | 0 (0.0%) |
| 12:00 PM to 3:59 PM | 65 (9.4%) | 41 (7.3%) |
| 4:00 PM to 11:59 PM | 42 (6.1%) | 7 (1.2%) |
| Total | 693 (100.0%) | 563 (100.0%) |
Housing Occupancy in Vandalia
Occupancy by Ownership in Vandalia
Of the total 944 dwellings in Vandalia, owner-occupied units account for 640 (67.8%), while renter-occupied units make up 304 (32.2%).
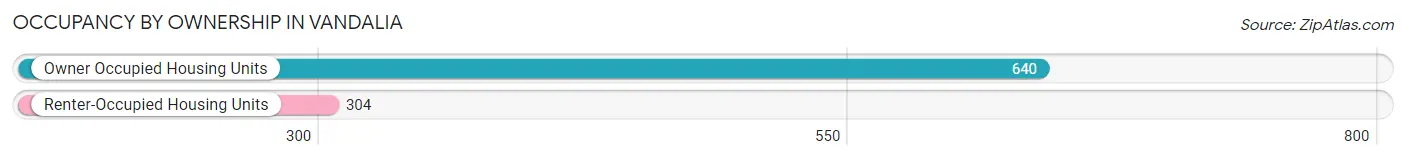
| Occupancy | # Housing Units | % Housing Units |
| Owner Occupied Housing Units | 640 | 67.8% |
| Renter-Occupied Housing Units | 304 | 32.2% |
| Total Occupied Housing Units | 944 | 100.0% |
Occupancy by Household Size in Vandalia
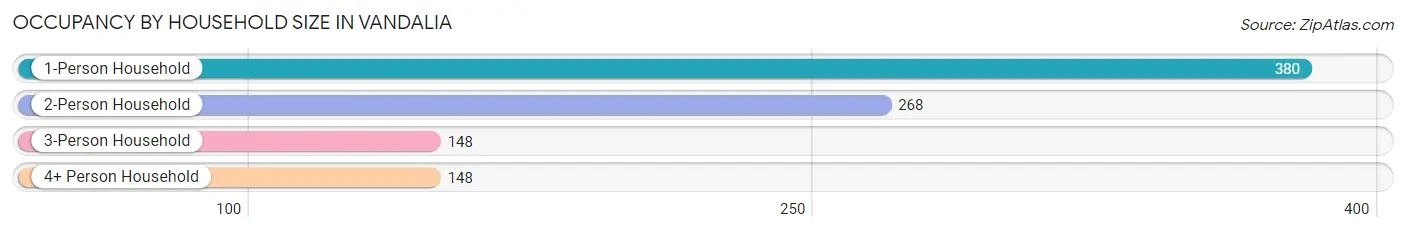
| Household Size | # Housing Units | % Housing Units |
| 1-Person Household | 380 | 40.3% |
| 2-Person Household | 268 | 28.4% |
| 3-Person Household | 148 | 15.7% |
| 4+ Person Household | 148 | 15.7% |
| Total Housing Units | 944 | 100.0% |
Occupancy by Ownership by Household Size in Vandalia
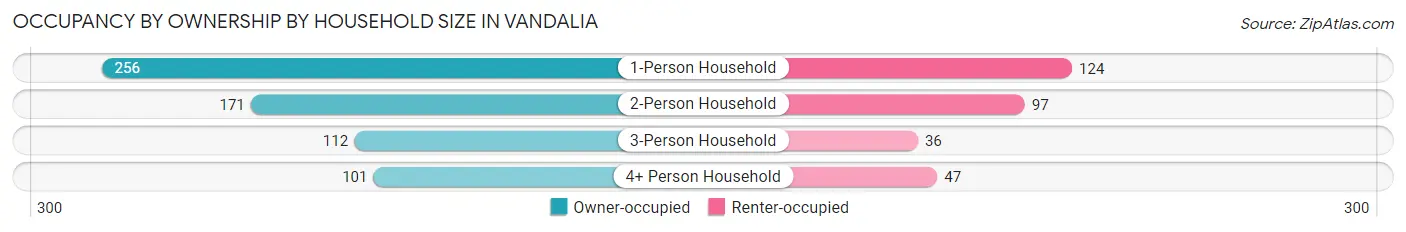
| Household Size | Owner-occupied | Renter-occupied |
| 1-Person Household | 256 (67.4%) | 124 (32.6%) |
| 2-Person Household | 171 (63.8%) | 97 (36.2%) |
| 3-Person Household | 112 (75.7%) | 36 (24.3%) |
| 4+ Person Household | 101 (68.2%) | 47 (31.8%) |
| Total Housing Units | 640 (67.8%) | 304 (32.2%) |
Occupancy by Educational Attainment in Vandalia
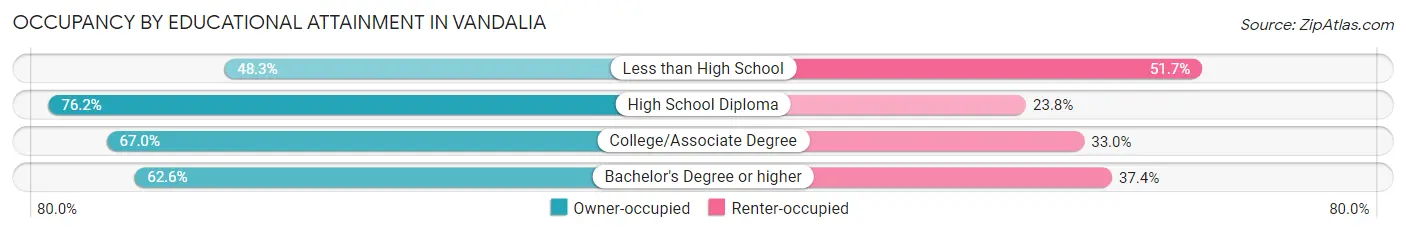
| Household Size | Owner-occupied | Renter-occupied |
| Less than High School | 72 (48.3%) | 77 (51.7%) |
| High School Diploma | 343 (76.2%) | 107 (23.8%) |
| College/Associate Degree | 138 (67.0%) | 68 (33.0%) |
| Bachelor's Degree or higher | 87 (62.6%) | 52 (37.4%) |
Occupancy by Age of Householder in Vandalia
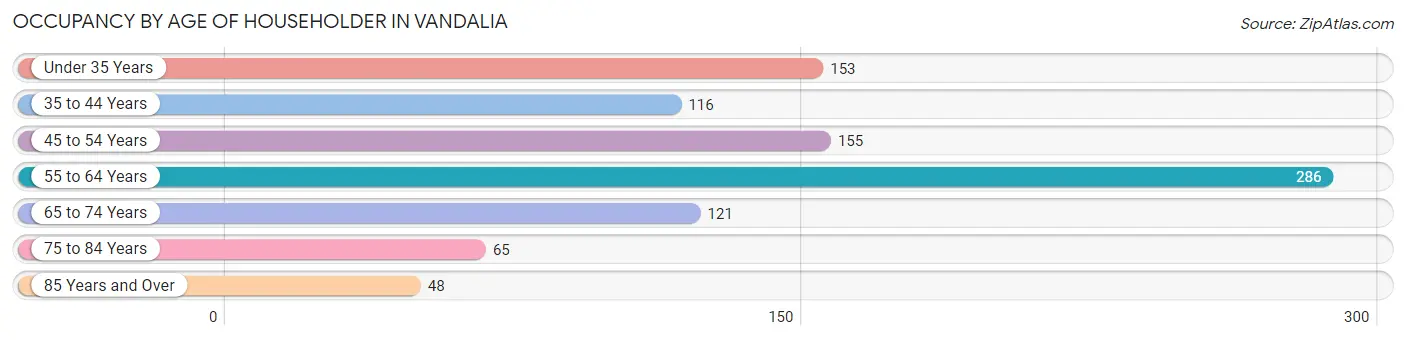
| Age Bracket | # Households | % Households |
| Under 35 Years | 153 | 16.2% |
| 35 to 44 Years | 116 | 12.3% |
| 45 to 54 Years | 155 | 16.4% |
| 55 to 64 Years | 286 | 30.3% |
| 65 to 74 Years | 121 | 12.8% |
| 75 to 84 Years | 65 | 6.9% |
| 85 Years and Over | 48 | 5.1% |
| Total | 944 | 100.0% |
Housing Finances in Vandalia
Median Income by Occupancy in Vandalia
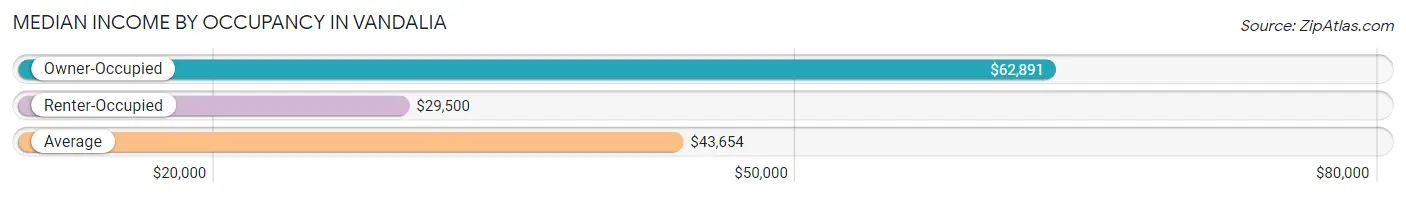
| Occupancy Type | # Households | Median Income |
| Owner-Occupied | 640 (67.8%) | $62,891 |
| Renter-Occupied | 304 (32.2%) | $29,500 |
| Average | 944 (100.0%) | $43,654 |
Occupancy by Householder Income Bracket in Vandalia
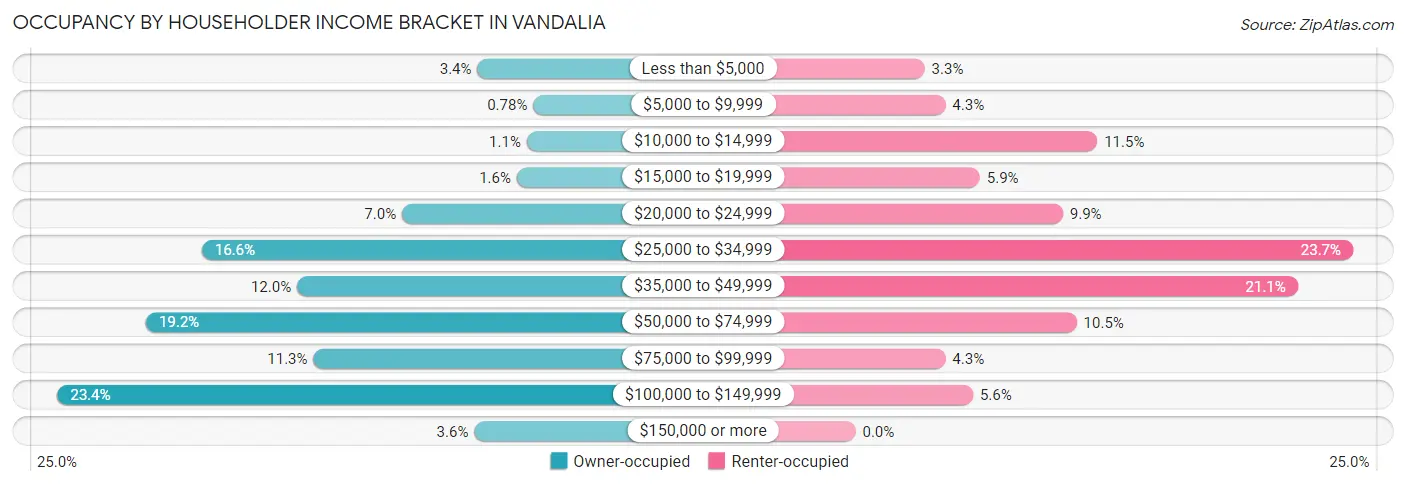
| Income Bracket | Owner-occupied | Renter-occupied |
| Less than $5,000 | 22 (3.4%) | 10 (3.3%) |
| $5,000 to $9,999 | 5 (0.8%) | 13 (4.3%) |
| $10,000 to $14,999 | 7 (1.1%) | 35 (11.5%) |
| $15,000 to $19,999 | 10 (1.6%) | 18 (5.9%) |
| $20,000 to $24,999 | 45 (7.0%) | 30 (9.9%) |
| $25,000 to $34,999 | 106 (16.6%) | 72 (23.7%) |
| $35,000 to $49,999 | 77 (12.0%) | 64 (21.0%) |
| $50,000 to $74,999 | 123 (19.2%) | 32 (10.5%) |
| $75,000 to $99,999 | 72 (11.3%) | 13 (4.3%) |
| $100,000 to $149,999 | 150 (23.4%) | 17 (5.6%) |
| $150,000 or more | 23 (3.6%) | 0 (0.0%) |
| Total | 640 (100.0%) | 304 (100.0%) |
Monthly Housing Cost Tiers in Vandalia
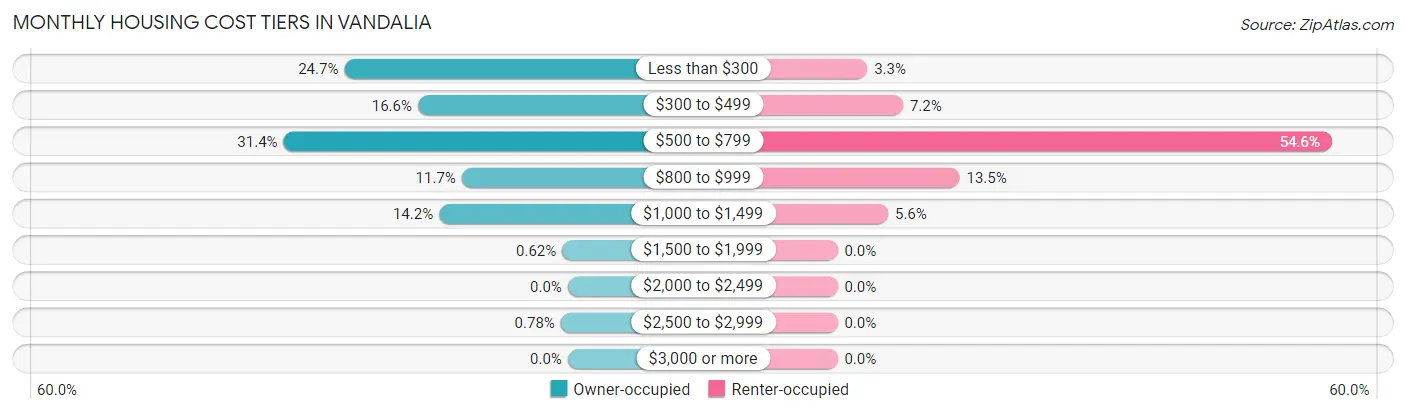
| Monthly Cost | Owner-occupied | Renter-occupied |
| Less than $300 | 158 (24.7%) | 10 (3.3%) |
| $300 to $499 | 106 (16.6%) | 22 (7.2%) |
| $500 to $799 | 201 (31.4%) | 166 (54.6%) |
| $800 to $999 | 75 (11.7%) | 41 (13.5%) |
| $1,000 to $1,499 | 91 (14.2%) | 17 (5.6%) |
| $1,500 to $1,999 | 4 (0.6%) | 0 (0.0%) |
| $2,000 to $2,499 | 0 (0.0%) | 0 (0.0%) |
| $2,500 to $2,999 | 5 (0.8%) | 0 (0.0%) |
| $3,000 or more | 0 (0.0%) | 0 (0.0%) |
| Total | 640 (100.0%) | 304 (100.0%) |
Physical Housing Characteristics in Vandalia
Housing Structures in Vandalia
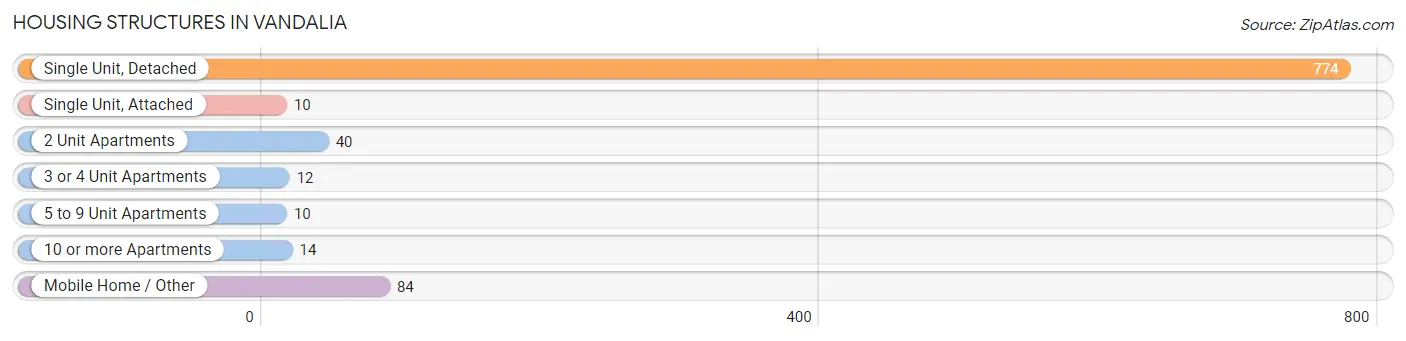
| Structure Type | # Housing Units | % Housing Units |
| Single Unit, Detached | 774 | 82.0% |
| Single Unit, Attached | 10 | 1.1% |
| 2 Unit Apartments | 40 | 4.2% |
| 3 or 4 Unit Apartments | 12 | 1.3% |
| 5 to 9 Unit Apartments | 10 | 1.1% |
| 10 or more Apartments | 14 | 1.5% |
| Mobile Home / Other | 84 | 8.9% |
| Total | 944 | 100.0% |
Housing Structures by Occupancy in Vandalia
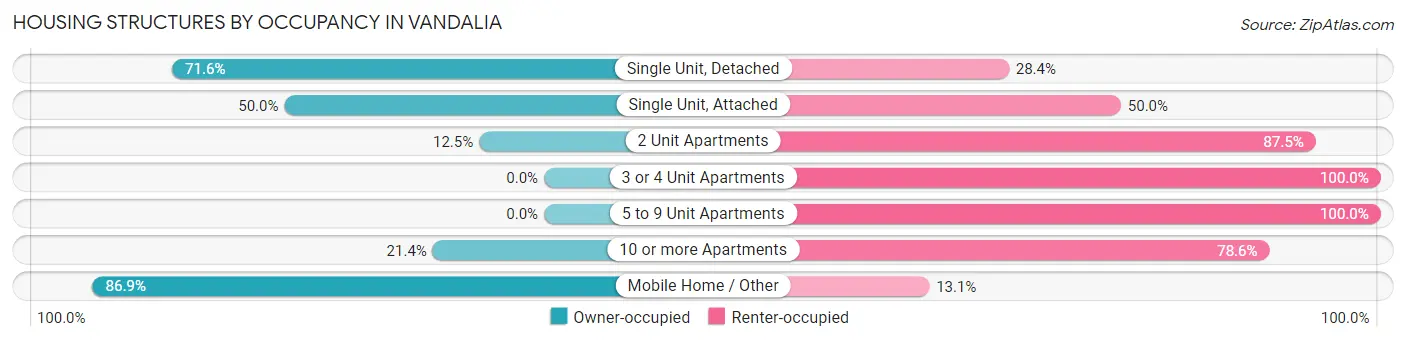
| Structure Type | Owner-occupied | Renter-occupied |
| Single Unit, Detached | 554 (71.6%) | 220 (28.4%) |
| Single Unit, Attached | 5 (50.0%) | 5 (50.0%) |
| 2 Unit Apartments | 5 (12.5%) | 35 (87.5%) |
| 3 or 4 Unit Apartments | 0 (0.0%) | 12 (100.0%) |
| 5 to 9 Unit Apartments | 0 (0.0%) | 10 (100.0%) |
| 10 or more Apartments | 3 (21.4%) | 11 (78.6%) |
| Mobile Home / Other | 73 (86.9%) | 11 (13.1%) |
| Total | 640 (67.8%) | 304 (32.2%) |
Housing Structures by Number of Rooms in Vandalia
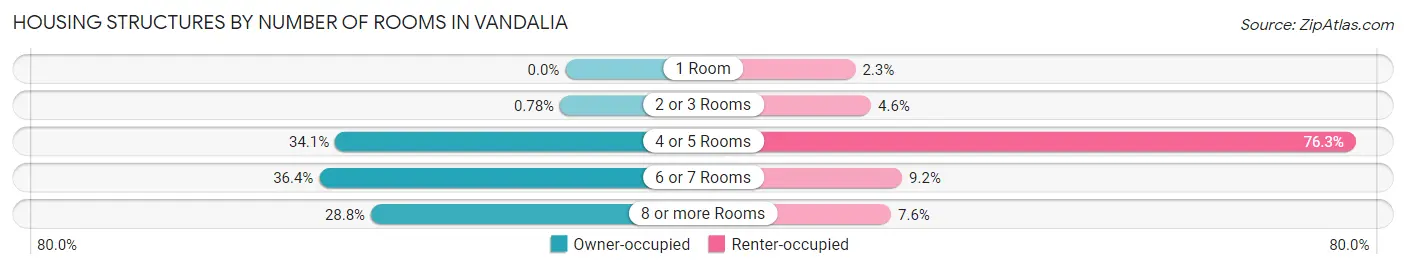
| Number of Rooms | Owner-occupied | Renter-occupied |
| 1 Room | 0 (0.0%) | 7 (2.3%) |
| 2 or 3 Rooms | 5 (0.8%) | 14 (4.6%) |
| 4 or 5 Rooms | 218 (34.1%) | 232 (76.3%) |
| 6 or 7 Rooms | 233 (36.4%) | 28 (9.2%) |
| 8 or more Rooms | 184 (28.7%) | 23 (7.6%) |
| Total | 640 (100.0%) | 304 (100.0%) |
Housing Structure by Heating Type in Vandalia
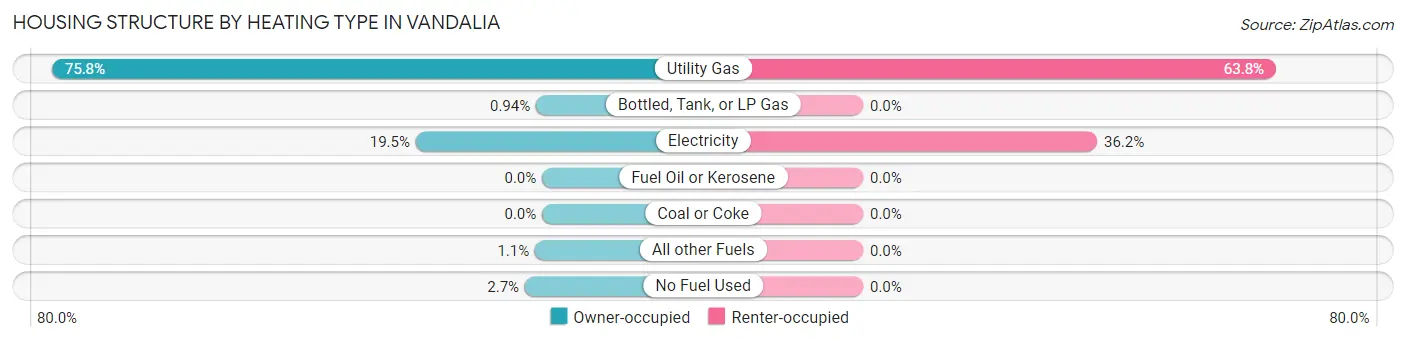
| Heating Type | Owner-occupied | Renter-occupied |
| Utility Gas | 485 (75.8%) | 194 (63.8%) |
| Bottled, Tank, or LP Gas | 6 (0.9%) | 0 (0.0%) |
| Electricity | 125 (19.5%) | 110 (36.2%) |
| Fuel Oil or Kerosene | 0 (0.0%) | 0 (0.0%) |
| Coal or Coke | 0 (0.0%) | 0 (0.0%) |
| All other Fuels | 7 (1.1%) | 0 (0.0%) |
| No Fuel Used | 17 (2.7%) | 0 (0.0%) |
| Total | 640 (100.0%) | 304 (100.0%) |
Household Vehicle Usage in Vandalia
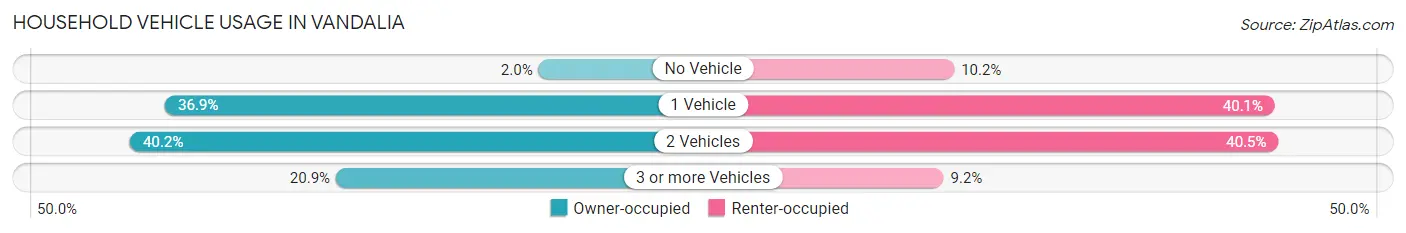
| Vehicles per Household | Owner-occupied | Renter-occupied |
| No Vehicle | 13 (2.0%) | 31 (10.2%) |
| 1 Vehicle | 236 (36.9%) | 122 (40.1%) |
| 2 Vehicles | 257 (40.2%) | 123 (40.5%) |
| 3 or more Vehicles | 134 (20.9%) | 28 (9.2%) |
| Total | 640 (100.0%) | 304 (100.0%) |
Real Estate & Mortgages in Vandalia
Real Estate and Mortgage Overview in Vandalia
| Characteristic | Without Mortgage | With Mortgage |
| Housing Units | 376 | 264 |
| Median Property Value | $54,800 | $81,200 |
| Median Household Income | $48,000 | $18 |
| Monthly Housing Costs | $372 | $0 |
| Real Estate Taxes | $529 | $5 |
Property Value by Mortgage Status in Vandalia
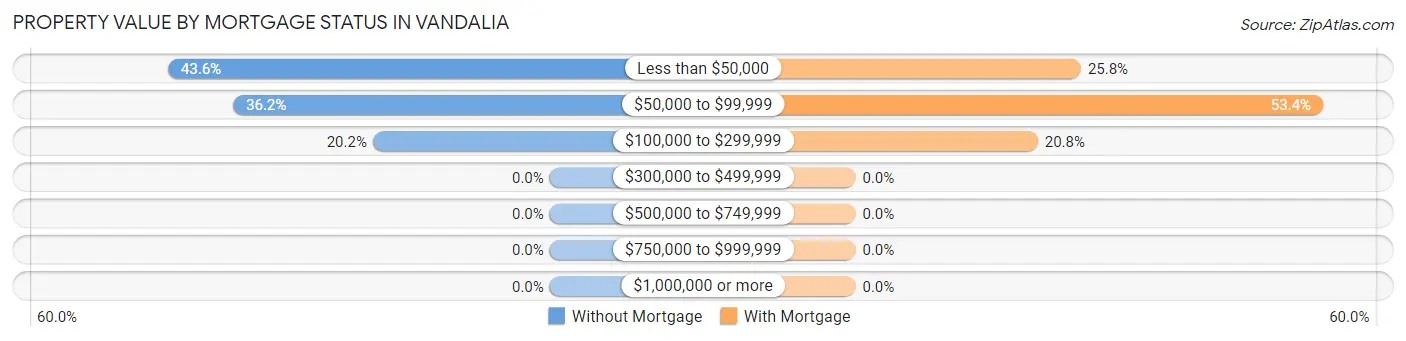
| Property Value | Without Mortgage | With Mortgage |
| Less than $50,000 | 164 (43.6%) | 68 (25.8%) |
| $50,000 to $99,999 | 136 (36.2%) | 141 (53.4%) |
| $100,000 to $299,999 | 76 (20.2%) | 55 (20.8%) |
| $300,000 to $499,999 | 0 (0.0%) | 0 (0.0%) |
| $500,000 to $749,999 | 0 (0.0%) | 0 (0.0%) |
| $750,000 to $999,999 | 0 (0.0%) | 0 (0.0%) |
| $1,000,000 or more | 0 (0.0%) | 0 (0.0%) |
| Total | 376 (100.0%) | 264 (100.0%) |
Household Income by Mortgage Status in Vandalia
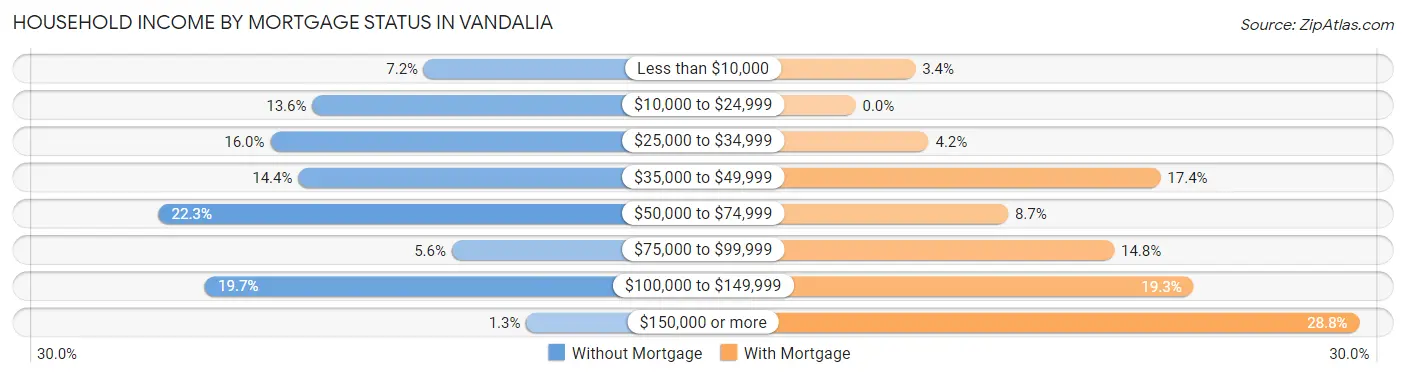
| Household Income | Without Mortgage | With Mortgage |
| Less than $10,000 | 27 (7.2%) | 9 (3.4%) |
| $10,000 to $24,999 | 51 (13.6%) | 0 (0.0%) |
| $25,000 to $34,999 | 60 (16.0%) | 11 (4.2%) |
| $35,000 to $49,999 | 54 (14.4%) | 46 (17.4%) |
| $50,000 to $74,999 | 84 (22.3%) | 23 (8.7%) |
| $75,000 to $99,999 | 21 (5.6%) | 39 (14.8%) |
| $100,000 to $149,999 | 74 (19.7%) | 51 (19.3%) |
| $150,000 or more | 5 (1.3%) | 76 (28.8%) |
| Total | 376 (100.0%) | 264 (100.0%) |
Property Value to Household Income Ratio in Vandalia
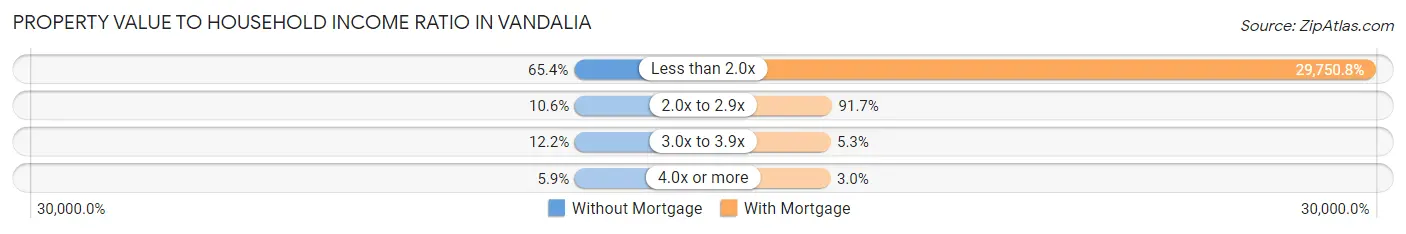
| Value-to-Income Ratio | Without Mortgage | With Mortgage |
| Less than 2.0x | 246 (65.4%) | 78,542 (29,750.8%) |
| 2.0x to 2.9x | 40 (10.6%) | 242 (91.7%) |
| 3.0x to 3.9x | 46 (12.2%) | 14 (5.3%) |
| 4.0x or more | 22 (5.9%) | 8 (3.0%) |
| Total | 376 (100.0%) | 264 (100.0%) |
Real Estate Taxes by Mortgage Status in Vandalia
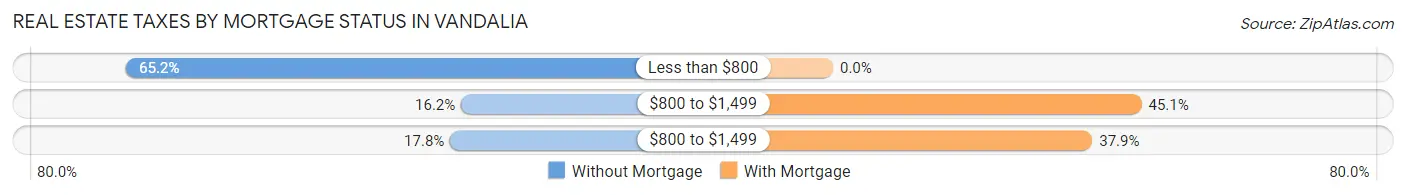
| Property Taxes | Without Mortgage | With Mortgage |
| Less than $800 | 245 (65.2%) | 0 (0.0%) |
| $800 to $1,499 | 61 (16.2%) | 119 (45.1%) |
| $800 to $1,499 | 67 (17.8%) | 100 (37.9%) |
| Total | 376 (100.0%) | 264 (100.0%) |
Health & Disability in Vandalia
Health Insurance Coverage by Age in Vandalia
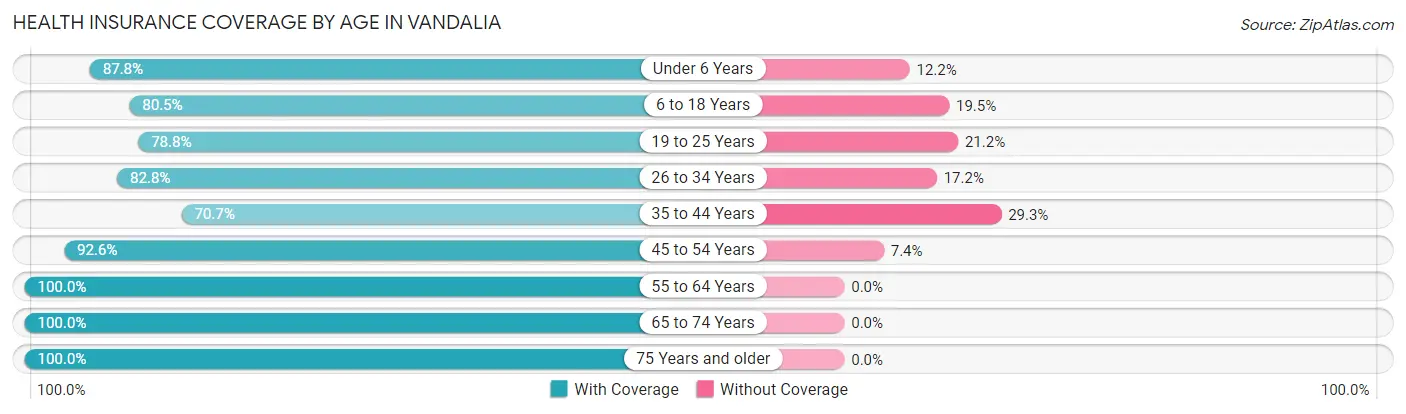
| Age Bracket | With Coverage | Without Coverage |
| Under 6 Years | 101 (87.8%) | 14 (12.2%) |
| 6 to 18 Years | 350 (80.5%) | 85 (19.5%) |
| 19 to 25 Years | 171 (78.8%) | 46 (21.2%) |
| 26 to 34 Years | 168 (82.8%) | 35 (17.2%) |
| 35 to 44 Years | 249 (70.7%) | 103 (29.3%) |
| 45 to 54 Years | 239 (92.6%) | 19 (7.4%) |
| 55 to 64 Years | 396 (100.0%) | 0 (0.0%) |
| 65 to 74 Years | 242 (100.0%) | 0 (0.0%) |
| 75 Years and older | 159 (100.0%) | 0 (0.0%) |
| Total | 2,075 (87.3%) | 302 (12.7%) |
Health Insurance Coverage by Citizenship Status in Vandalia
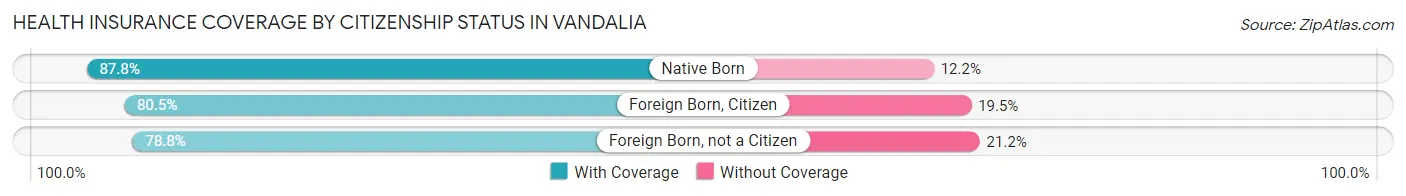
| Citizenship Status | With Coverage | Without Coverage |
| Native Born | 101 (87.8%) | 14 (12.2%) |
| Foreign Born, Citizen | 350 (80.5%) | 85 (19.5%) |
| Foreign Born, not a Citizen | 171 (78.8%) | 46 (21.2%) |
Health Insurance Coverage by Household Income in Vandalia
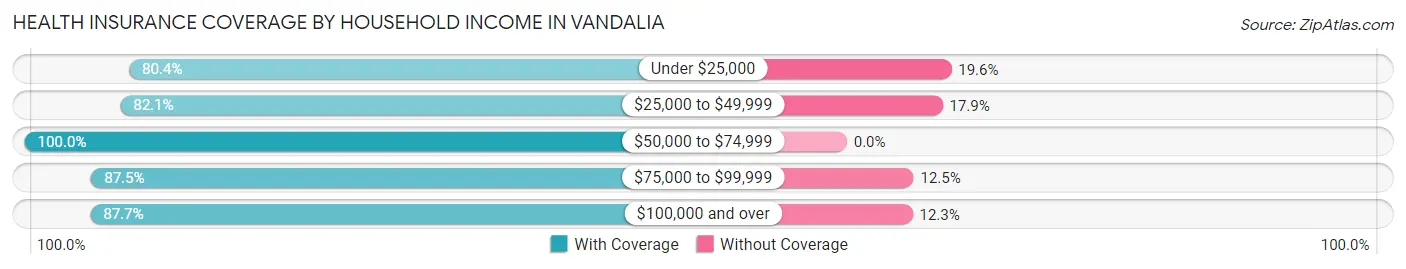
| Household Income | With Coverage | Without Coverage |
| Under $25,000 | 374 (80.4%) | 91 (19.6%) |
| $25,000 to $49,999 | 485 (82.1%) | 106 (17.9%) |
| $50,000 to $74,999 | 486 (100.0%) | 0 (0.0%) |
| $75,000 to $99,999 | 238 (87.5%) | 34 (12.5%) |
| $100,000 and over | 491 (87.7%) | 69 (12.3%) |
Public vs Private Health Insurance Coverage by Age in Vandalia
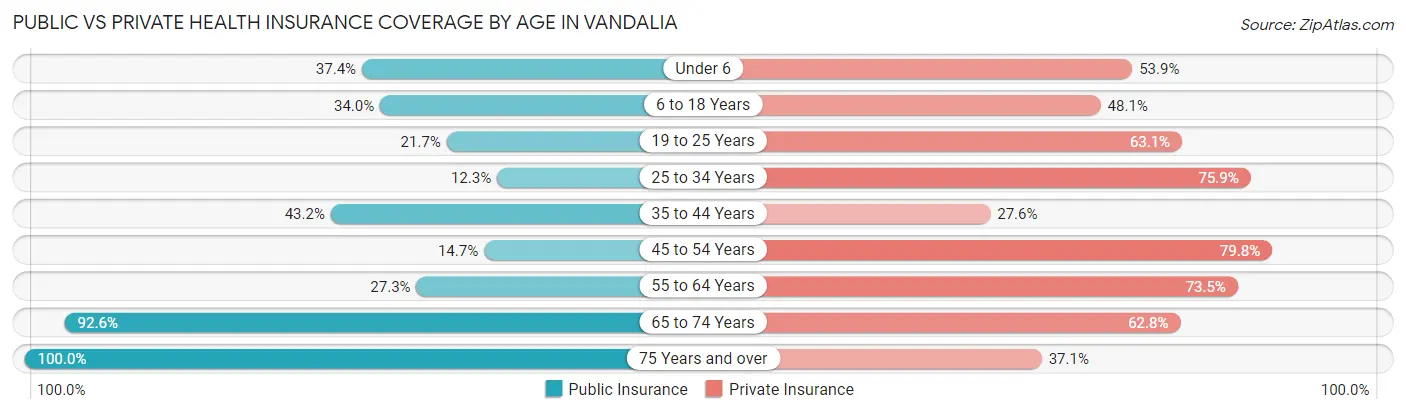
| Age Bracket | Public Insurance | Private Insurance |
| Under 6 | 43 (37.4%) | 62 (53.9%) |
| 6 to 18 Years | 148 (34.0%) | 209 (48.0%) |
| 19 to 25 Years | 47 (21.7%) | 137 (63.1%) |
| 25 to 34 Years | 25 (12.3%) | 154 (75.9%) |
| 35 to 44 Years | 152 (43.2%) | 97 (27.6%) |
| 45 to 54 Years | 38 (14.7%) | 206 (79.8%) |
| 55 to 64 Years | 108 (27.3%) | 291 (73.5%) |
| 65 to 74 Years | 224 (92.6%) | 152 (62.8%) |
| 75 Years and over | 159 (100.0%) | 59 (37.1%) |
| Total | 944 (39.7%) | 1,367 (57.5%) |
Disability Status by Sex by Age in Vandalia
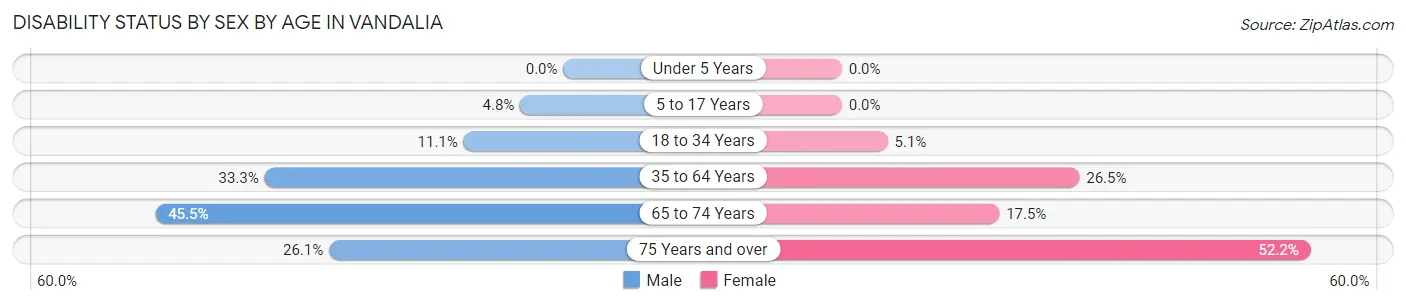
| Age Bracket | Male | Female |
| Under 5 Years | 0 (0.0%) | 0 (0.0%) |
| 5 to 17 Years | 13 (4.8%) | 0 (0.0%) |
| 18 to 34 Years | 24 (11.1%) | 13 (5.1%) |
| 35 to 64 Years | 180 (33.3%) | 123 (26.5%) |
| 65 to 74 Years | 40 (45.5%) | 27 (17.5%) |
| 75 Years and over | 12 (26.1%) | 59 (52.2%) |
Disability Class by Sex by Age in Vandalia
Disability Class: Hearing Difficulty
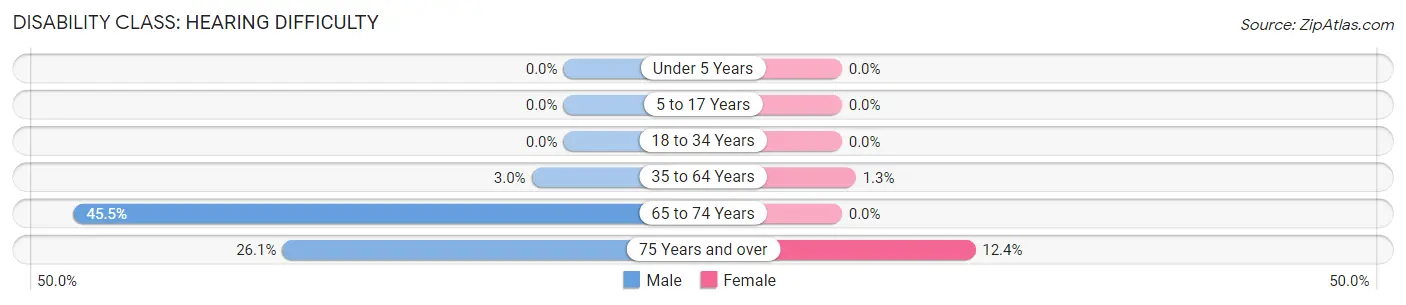
| Age Bracket | Male | Female |
| Under 5 Years | 0 (0.0%) | 0 (0.0%) |
| 5 to 17 Years | 0 (0.0%) | 0 (0.0%) |
| 18 to 34 Years | 0 (0.0%) | 0 (0.0%) |
| 35 to 64 Years | 16 (3.0%) | 6 (1.3%) |
| 65 to 74 Years | 40 (45.5%) | 0 (0.0%) |
| 75 Years and over | 12 (26.1%) | 14 (12.4%) |
Disability Class: Vision Difficulty
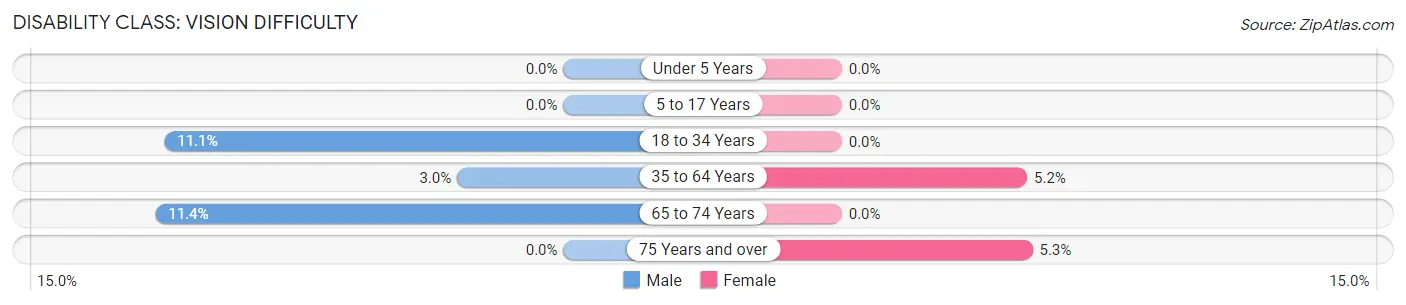
| Age Bracket | Male | Female |
| Under 5 Years | 0 (0.0%) | 0 (0.0%) |
| 5 to 17 Years | 0 (0.0%) | 0 (0.0%) |
| 18 to 34 Years | 24 (11.1%) | 0 (0.0%) |
| 35 to 64 Years | 16 (3.0%) | 24 (5.2%) |
| 65 to 74 Years | 10 (11.4%) | 0 (0.0%) |
| 75 Years and over | 0 (0.0%) | 6 (5.3%) |
Disability Class: Cognitive Difficulty
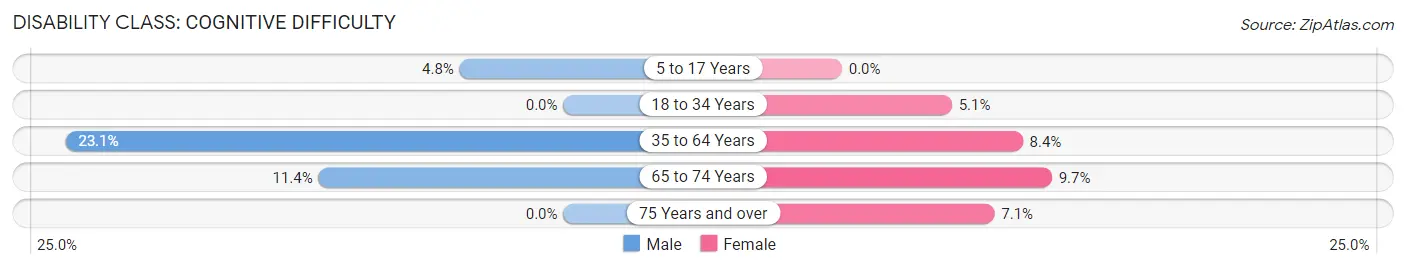
| Age Bracket | Male | Female |
| 5 to 17 Years | 13 (4.8%) | 0 (0.0%) |
| 18 to 34 Years | 0 (0.0%) | 13 (5.1%) |
| 35 to 64 Years | 125 (23.1%) | 39 (8.4%) |
| 65 to 74 Years | 10 (11.4%) | 15 (9.7%) |
| 75 Years and over | 0 (0.0%) | 8 (7.1%) |
Disability Class: Ambulatory Difficulty
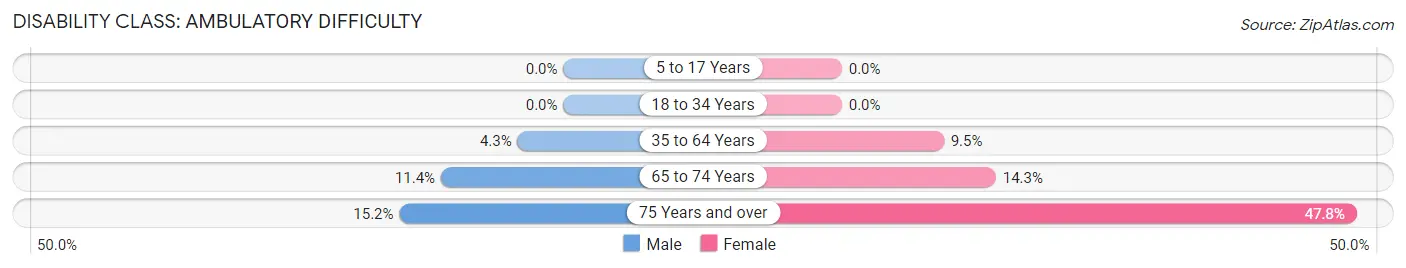
| Age Bracket | Male | Female |
| 5 to 17 Years | 0 (0.0%) | 0 (0.0%) |
| 18 to 34 Years | 0 (0.0%) | 0 (0.0%) |
| 35 to 64 Years | 23 (4.3%) | 44 (9.5%) |
| 65 to 74 Years | 10 (11.4%) | 22 (14.3%) |
| 75 Years and over | 7 (15.2%) | 54 (47.8%) |
Disability Class: Self-Care Difficulty
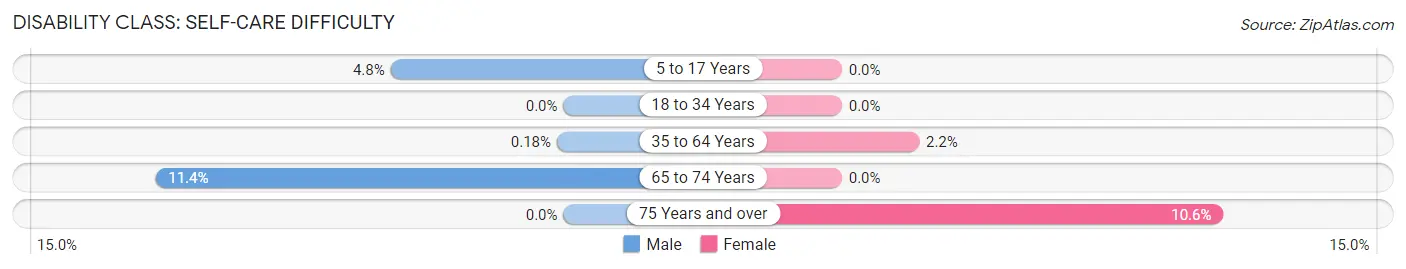
| Age Bracket | Male | Female |
| 5 to 17 Years | 13 (4.8%) | 0 (0.0%) |
| 18 to 34 Years | 0 (0.0%) | 0 (0.0%) |
| 35 to 64 Years | 1 (0.2%) | 10 (2.1%) |
| 65 to 74 Years | 10 (11.4%) | 0 (0.0%) |
| 75 Years and over | 0 (0.0%) | 12 (10.6%) |
Technology Access in Vandalia
Computing Device Access in Vandalia
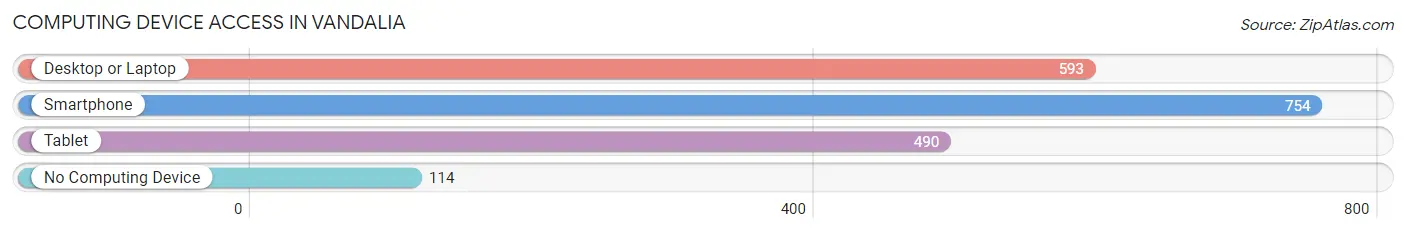
| Device Type | # Households | % Households |
| Desktop or Laptop | 593 | 62.8% |
| Smartphone | 754 | 79.9% |
| Tablet | 490 | 51.9% |
| No Computing Device | 114 | 12.1% |
| Total | 944 | 100.0% |
Internet Access in Vandalia
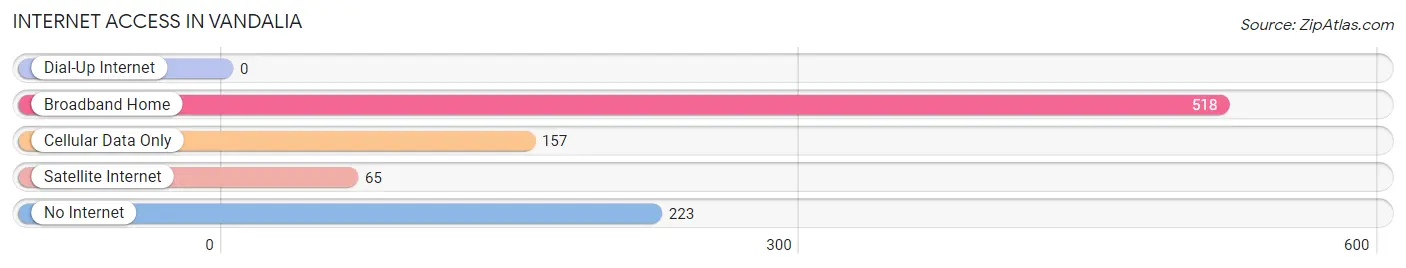
| Internet Type | # Households | % Households |
| Dial-Up Internet | 0 | 0.0% |
| Broadband Home | 518 | 54.9% |
| Cellular Data Only | 157 | 16.6% |
| Satellite Internet | 65 | 6.9% |
| No Internet | 223 | 23.6% |
| Total | 944 | 100.0% |
Vandalia Summary
Vandalia, Missouri is a small city located in Audrain County in the northeastern part of the state. It is situated on the banks of the Cuivre River, about 40 miles northwest of St. Louis. The city has a population of approximately 4,000 people and is the county seat of Audrain County.
History
Vandalia was founded in 1819 by a group of settlers from Kentucky and Tennessee. The city was named after the ancient city of Vandalia, which was the capital of the ancient Germanic tribe of the Vandals. The settlers chose the name because of its historical significance.
The city was incorporated in 1837 and quickly became a thriving agricultural center. The Cuivre River provided a convenient transportation route for goods and services, and the city soon became a hub for trade and commerce.
In the late 19th century, Vandalia was a major stop on the Hannibal and St. Joseph Railroad. This railroad connected the city to St. Louis and other major cities in the Midwest. The railroad also helped to spur the growth of the city's manufacturing industry.
Geography
Vandalia is located in the northeastern part of Missouri, about 40 miles northwest of St. Louis. The city is situated on the banks of the Cuivre River, which flows through the city and provides a convenient transportation route for goods and services.
The city is surrounded by rolling hills and farmland. The climate is generally mild, with hot summers and cold winters. The average annual temperature is around 50 degrees Fahrenheit.
Economy
Vandalia's economy is largely based on agriculture and manufacturing. The city is home to several large agricultural operations, including a large dairy farm and a large hog farm. The city also has several manufacturing plants, including a furniture factory and a plastics factory.
The city also has a thriving retail sector, with several stores and restaurants located in the downtown area. The city is also home to several small businesses, including a local newspaper and a radio station.
Demographics
As of the 2010 census, Vandalia had a population of 4,000 people. The racial makeup of the city was 95.3% White, 1.2% African American, 0.3% Native American, 0.3% Asian, 0.1% Pacific Islander, and 2.7% from other races. Hispanic or Latino of any race were 3.2% of the population.
The median household income in Vandalia was $37,500, and the median family income was $45,000. The per capita income was $19,000. About 11.3% of families and 14.2% of the population were below the poverty line, including 18.2% of those under age 18 and 8.3% of those age 65 or over.
Vandalia is a small city with a rich history and a vibrant economy. The city is home to a diverse population and offers a variety of activities and attractions for visitors and residents alike. With its convenient location and strong economy, Vandalia is an ideal place to live and work.
Common Questions
What is Per Capita Income in Vandalia?
Per Capita income in Vandalia is $19,291.
What is the Median Family Income in Vandalia?
Median Family Income in Vandalia is $63,148.
What is the Median Household income in Vandalia?
Median Household Income in Vandalia is $43,654.
What is Income or Wage Gap in Vandalia?
Income or Wage Gap in Vandalia is 43.3%.
Women in Vandalia earn 56.7 cents for every dollar earned by a man.
What is Inequality or Gini Index in Vandalia?
Inequality or Gini Index in Vandalia is 0.40.
What is the Total Population of Vandalia?
Total Population of Vandalia is 3,382.
What is the Total Male Population of Vandalia?
Total Male Population of Vandalia is 1,584.
What is the Total Female Population of Vandalia?
Total Female Population of Vandalia is 1,798.
What is the Ratio of Males per 100 Females in Vandalia?
There are 88.10 Males per 100 Females in Vandalia.
What is the Ratio of Females per 100 Males in Vandalia?
There are 113.51 Females per 100 Males in Vandalia.
What is the Median Population Age in Vandalia?
Median Population Age in Vandalia is 39.7 Years.
What is the Average Family Size in Vandalia
Average Family Size in Vandalia is 3.5 People.
What is the Average Household Size in Vandalia
Average Household Size in Vandalia is 2.5 People.
How Large is the Labor Force in Vandalia?
There are 1,323 People in the Labor Forcein in Vandalia.
What is the Percentage of People in the Labor Force in Vandalia?
44.7% of People are in the Labor Force in Vandalia.
What is the Unemployment Rate in Vandalia?
Unemployment Rate in Vandalia is 3.3%.