Urich, MO Map & Demographics
Urich Map
Urich Overview
$26,925
PER CAPITA INCOME
$54,306
AVG FAMILY INCOME
$43,611
AVG HOUSEHOLD INCOME
13.7%
WAGE / INCOME GAP [ % ]
86.3¢/ $1
WAGE / INCOME GAP [ $ ]
0.38
INEQUALITY / GINI INDEX
352
TOTAL POPULATION
170
MALE POPULATION
182
FEMALE POPULATION
93.41
MALES / 100 FEMALES
107.06
FEMALES / 100 MALES
48.3
MEDIAN AGE
2.4
AVG FAMILY SIZE
2.2
AVG HOUSEHOLD SIZE
186
LABOR FORCE [ PEOPLE ]
59.2%
PERCENT IN LABOR FORCE
8.1%
UNEMPLOYMENT RATE
Urich Zip Codes
Urich Area Codes
Income in Urich
Income Overview in Urich
Per Capita Income in Urich is $26,925, while median incomes of families and households are $54,306 and $43,611 respectively.
| Characteristic | Number | Measure |
| Per Capita Income | 352 | $26,925 |
| Median Family Income | 95 | $54,306 |
| Mean Family Income | 95 | $63,726 |
| Median Household Income | 162 | $43,611 |
| Mean Household Income | 162 | $57,391 |
| Income Deficit | 95 | $0 |
| Wage / Income Gap (%) | 352 | 13.72% |
| Wage / Income Gap ($) | 352 | 86.28¢ per $1 |
| Gini / Inequality Index | 352 | 0.38 |
Earnings by Sex in Urich
Average Earnings in Urich are $28,906, $32,222 for men and $27,800 for women, a difference of 13.7%.
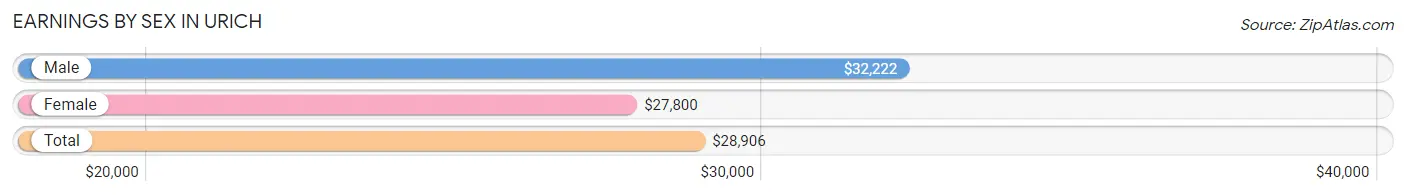
| Sex | Number | Average Earnings |
| Male | 98 (48.0%) | $32,222 |
| Female | 106 (52.0%) | $27,800 |
| Total | 204 (100.0%) | $28,906 |
Earnings by Sex by Income Bracket in Urich
The most common earnings brackets in Urich are $75,000 to $99,999 for men (16 | 16.3%) and $25,000 to $29,999 for women (32 | 30.2%).
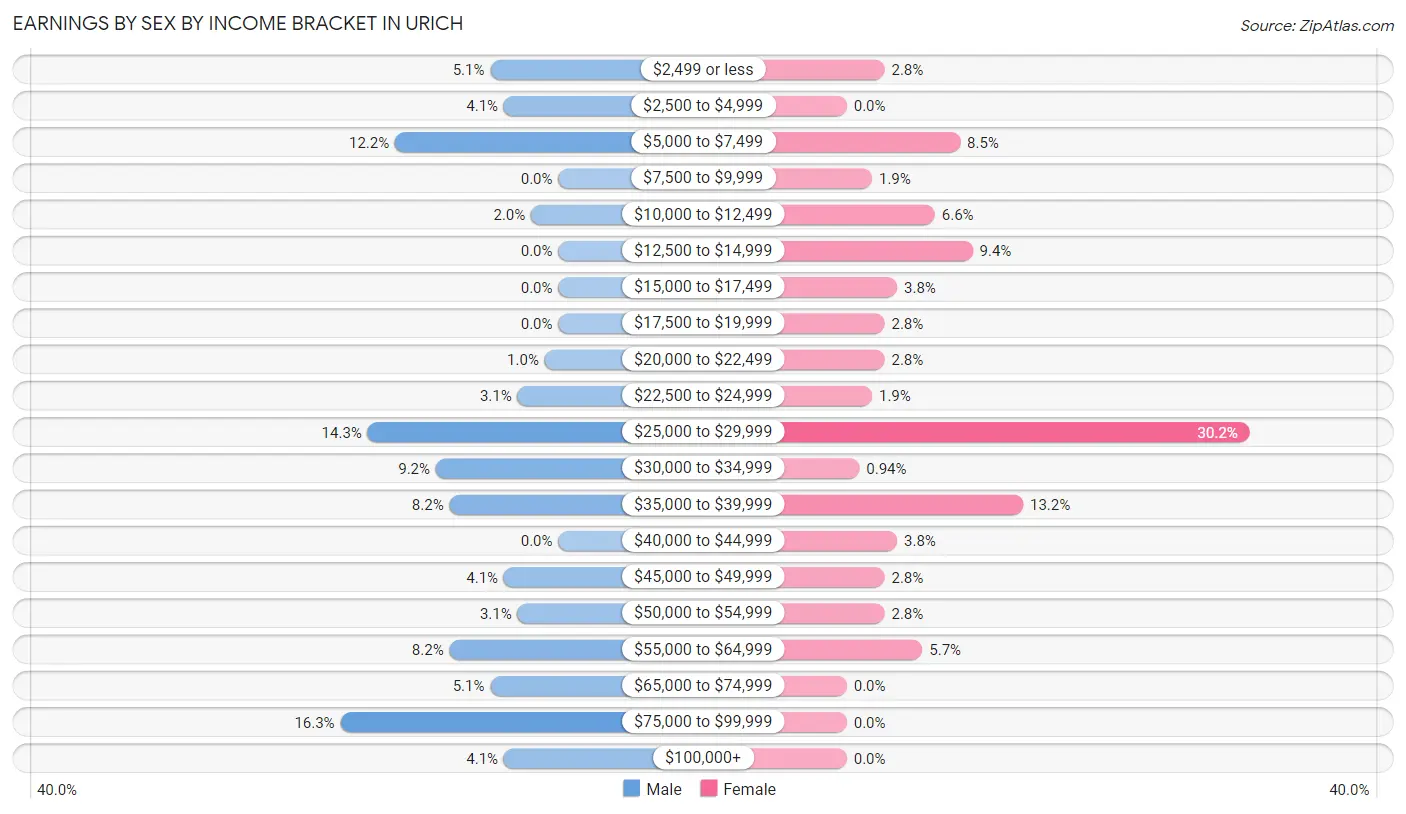
| Income | Male | Female |
| $2,499 or less | 5 (5.1%) | 3 (2.8%) |
| $2,500 to $4,999 | 4 (4.1%) | 0 (0.0%) |
| $5,000 to $7,499 | 12 (12.2%) | 9 (8.5%) |
| $7,500 to $9,999 | 0 (0.0%) | 2 (1.9%) |
| $10,000 to $12,499 | 2 (2.0%) | 7 (6.6%) |
| $12,500 to $14,999 | 0 (0.0%) | 10 (9.4%) |
| $15,000 to $17,499 | 0 (0.0%) | 4 (3.8%) |
| $17,500 to $19,999 | 0 (0.0%) | 3 (2.8%) |
| $20,000 to $22,499 | 1 (1.0%) | 3 (2.8%) |
| $22,500 to $24,999 | 3 (3.1%) | 2 (1.9%) |
| $25,000 to $29,999 | 14 (14.3%) | 32 (30.2%) |
| $30,000 to $34,999 | 9 (9.2%) | 1 (0.9%) |
| $35,000 to $39,999 | 8 (8.2%) | 14 (13.2%) |
| $40,000 to $44,999 | 0 (0.0%) | 4 (3.8%) |
| $45,000 to $49,999 | 4 (4.1%) | 3 (2.8%) |
| $50,000 to $54,999 | 3 (3.1%) | 3 (2.8%) |
| $55,000 to $64,999 | 8 (8.2%) | 6 (5.7%) |
| $65,000 to $74,999 | 5 (5.1%) | 0 (0.0%) |
| $75,000 to $99,999 | 16 (16.3%) | 0 (0.0%) |
| $100,000+ | 4 (4.1%) | 0 (0.0%) |
| Total | 98 (100.0%) | 106 (100.0%) |
Earnings by Sex by Educational Attainment in Urich
Average earnings in Urich are $37,500 for men and $28,150 for women, a difference of 24.9%. Men with an educational attainment of high school diploma enjoy the highest average annual earnings of $38,750, while those with high school diploma education earn the least with $38,750. Women with an educational attainment of bachelor's degree earn the most with the average annual earnings of $47,917, while those with high school diploma education have the smallest earnings of $27,917.
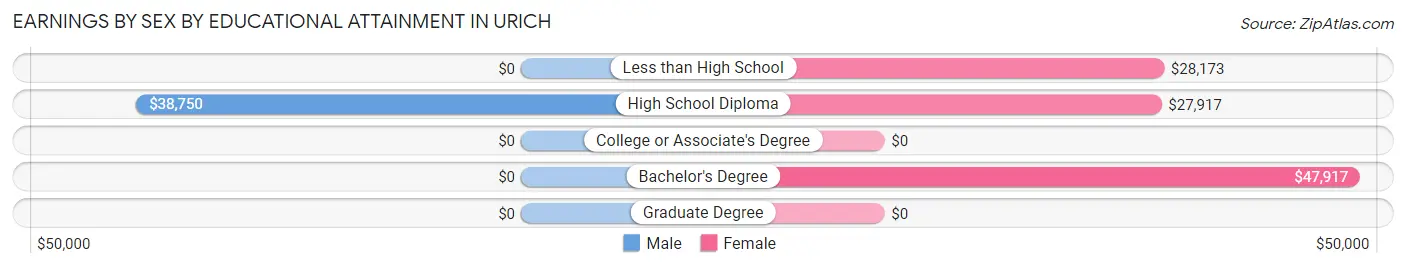
| Educational Attainment | Male Income | Female Income |
| Less than High School | - | - |
| High School Diploma | $38,750 | $27,917 |
| College or Associate's Degree | - | - |
| Bachelor's Degree | - | - |
| Graduate Degree | - | - |
| Total | $37,500 | $28,150 |
Family Income in Urich
Family Income Brackets in Urich
According to the Urich family income data, there are 27 families falling into the $35,000 to $49,999 income range, which is the most common income bracket and makes up 28.4% of all families.
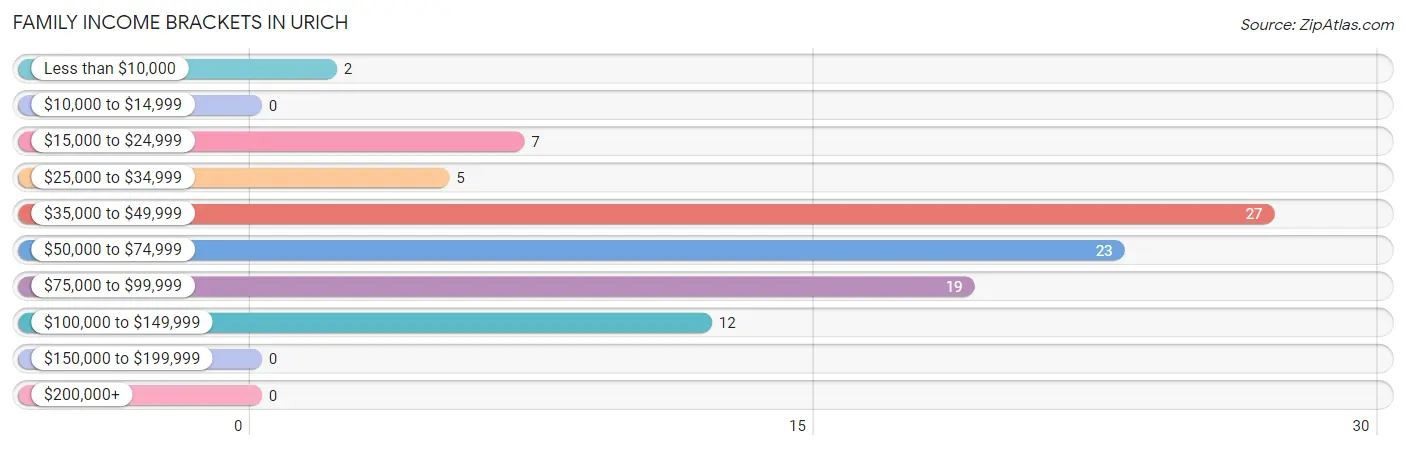
| Income Bracket | # Families | % Families |
| Less than $10,000 | 2 | 2.1% |
| $10,000 to $14,999 | 0 | 0.0% |
| $15,000 to $24,999 | 7 | 7.4% |
| $25,000 to $34,999 | 5 | 5.3% |
| $35,000 to $49,999 | 27 | 28.4% |
| $50,000 to $74,999 | 23 | 24.2% |
| $75,000 to $99,999 | 19 | 20.0% |
| $100,000 to $149,999 | 12 | 12.6% |
| $150,000 to $199,999 | 0 | 0.0% |
| $200,000+ | 0 | 0.0% |
Family Income by Famaliy Size in Urich
3-person families (12 | 12.6%) account for the highest median family income in Urich with $91,667 per family, while 3-person families (12 | 12.6%) have the highest median income of $30,556 per family member.
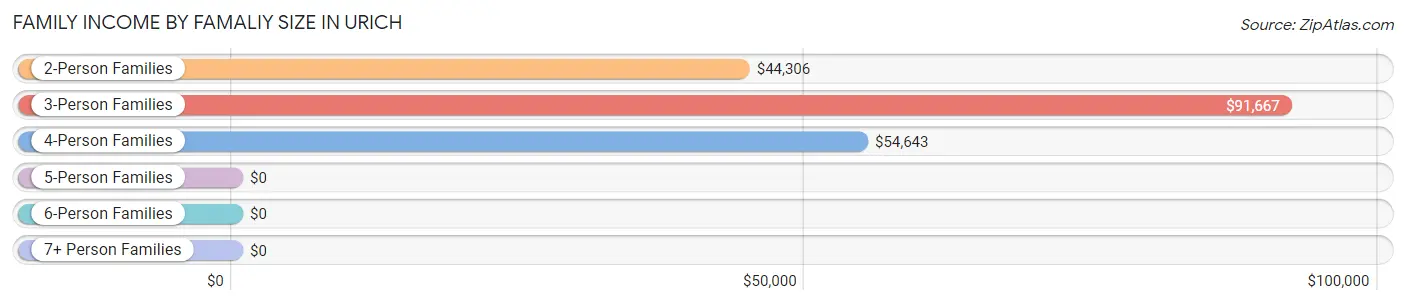
| Income Bracket | # Families | Median Income |
| 2-Person Families | 69 (72.6%) | $44,306 |
| 3-Person Families | 12 (12.6%) | $91,667 |
| 4-Person Families | 12 (12.6%) | $54,643 |
| 5-Person Families | 2 (2.1%) | $0 |
| 6-Person Families | 0 (0.0%) | $0 |
| 7+ Person Families | 0 (0.0%) | $0 |
| Total | 95 (100.0%) | $54,306 |
Family Income by Number of Earners in Urich
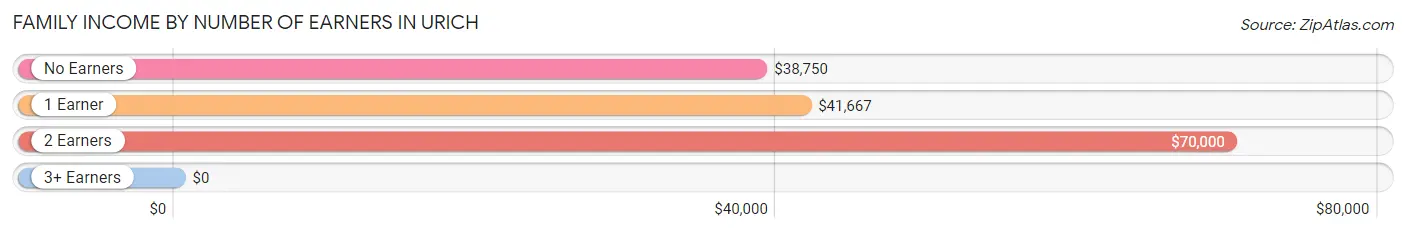
| Number of Earners | # Families | Median Income |
| No Earners | 11 (11.6%) | $38,750 |
| 1 Earner | 32 (33.7%) | $41,667 |
| 2 Earners | 50 (52.6%) | $70,000 |
| 3+ Earners | 2 (2.1%) | $0 |
| Total | 95 (100.0%) | $54,306 |
Household Income in Urich
Household Income Brackets in Urich
With 40 households falling in the category, the $35,000 to $49,999 income range is the most frequent in Urich, accounting for 24.7% of all households.
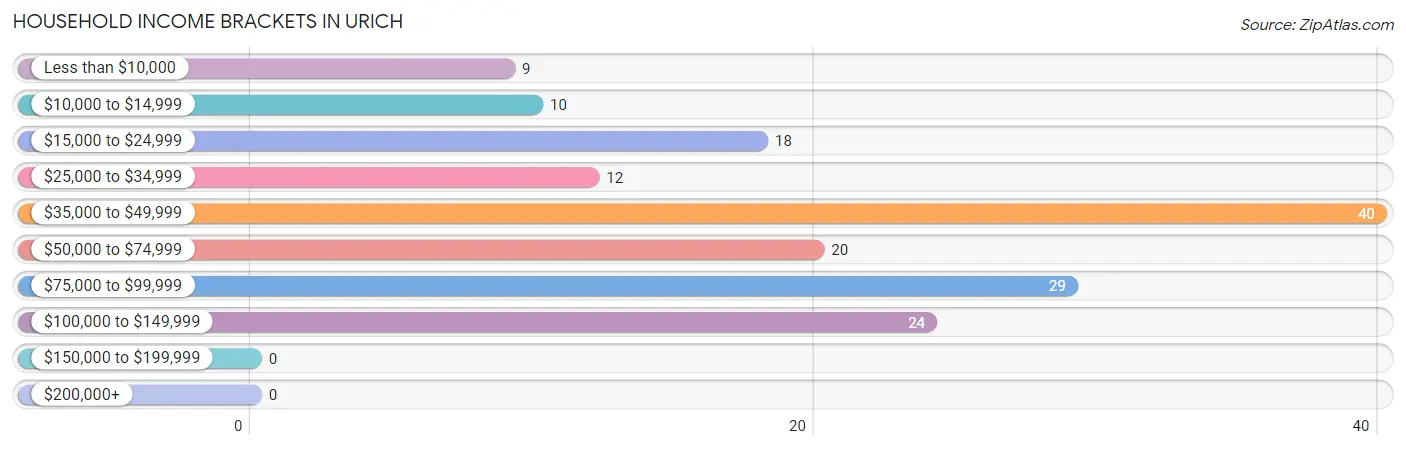
| Income Bracket | # Households | % Households |
| Less than $10,000 | 9 | 5.6% |
| $10,000 to $14,999 | 10 | 6.2% |
| $15,000 to $24,999 | 18 | 11.1% |
| $25,000 to $34,999 | 12 | 7.4% |
| $35,000 to $49,999 | 40 | 24.7% |
| $50,000 to $74,999 | 20 | 12.3% |
| $75,000 to $99,999 | 29 | 17.9% |
| $100,000 to $149,999 | 24 | 14.8% |
| $150,000 to $199,999 | 0 | 0.0% |
| $200,000+ | 0 | 0.0% |
Household Income by Householder Age in Urich
The median household income in Urich is $43,611, with the highest median household income of $79,464 found in the 25 to 44 years age bracket for the primary householder. A total of 51 households (31.5%) fall into this category.
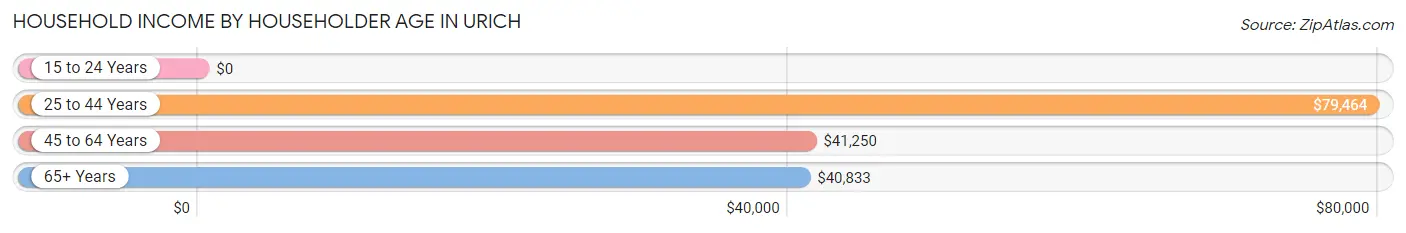
| Income Bracket | # Households | Median Income |
| 15 to 24 Years | 0 (0.0%) | $0 |
| 25 to 44 Years | 51 (31.5%) | $79,464 |
| 45 to 64 Years | 65 (40.1%) | $41,250 |
| 65+ Years | 46 (28.4%) | $40,833 |
| Total | 162 (100.0%) | $43,611 |
Poverty in Urich
Income Below Poverty by Sex and Age in Urich
With 12.3% poverty level for males and 16.4% for females among the residents of Urich, 5 year old males and 16 and 17 year old females are the most vulnerable to poverty, with 2 males (100.0%) and 12 females (60.0%) in their respective age groups living below the poverty level.
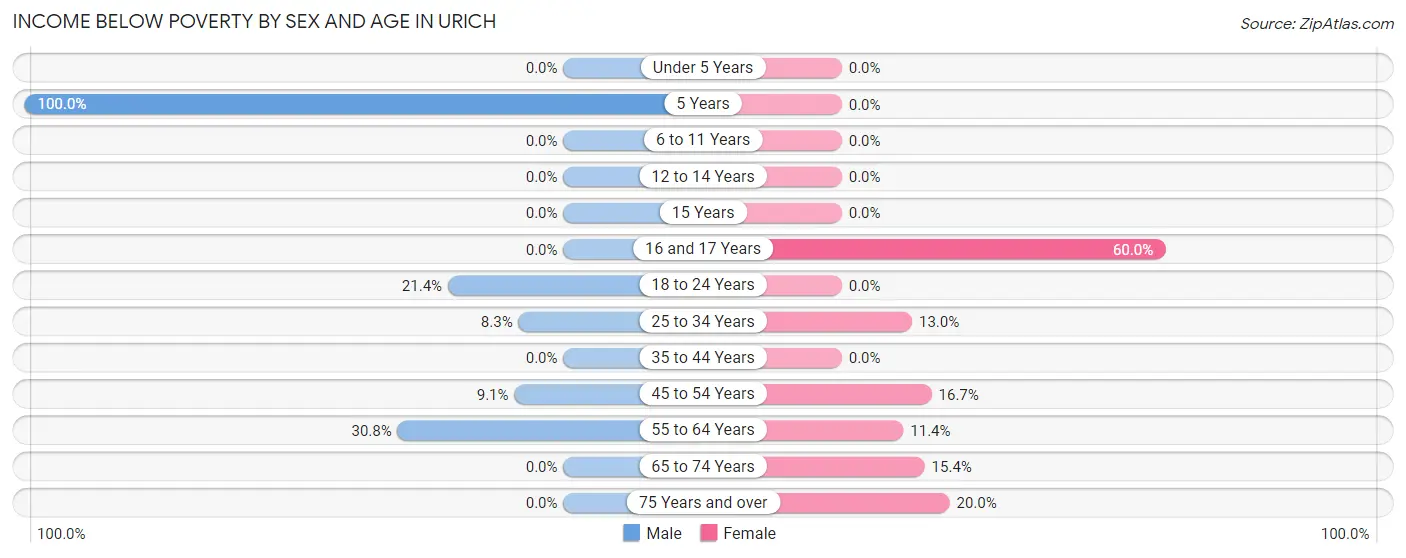
| Age Bracket | Male | Female |
| Under 5 Years | 0 (0.0%) | 0 (0.0%) |
| 5 Years | 2 (100.0%) | 0 (0.0%) |
| 6 to 11 Years | 0 (0.0%) | 0 (0.0%) |
| 12 to 14 Years | 0 (0.0%) | 0 (0.0%) |
| 15 Years | 0 (0.0%) | 0 (0.0%) |
| 16 and 17 Years | 0 (0.0%) | 12 (60.0%) |
| 18 to 24 Years | 3 (21.4%) | 0 (0.0%) |
| 25 to 34 Years | 2 (8.3%) | 3 (13.0%) |
| 35 to 44 Years | 0 (0.0%) | 0 (0.0%) |
| 45 to 54 Years | 2 (9.1%) | 3 (16.7%) |
| 55 to 64 Years | 12 (30.8%) | 4 (11.4%) |
| 65 to 74 Years | 0 (0.0%) | 2 (15.4%) |
| 75 Years and over | 0 (0.0%) | 4 (20.0%) |
| Total | 21 (12.3%) | 28 (16.4%) |
Income Above Poverty by Sex and Age in Urich
According to the poverty statistics in Urich, males aged under 5 years and females aged under 5 years are the age groups that are most secure financially, with 100.0% of males and 100.0% of females in these age groups living above the poverty line.
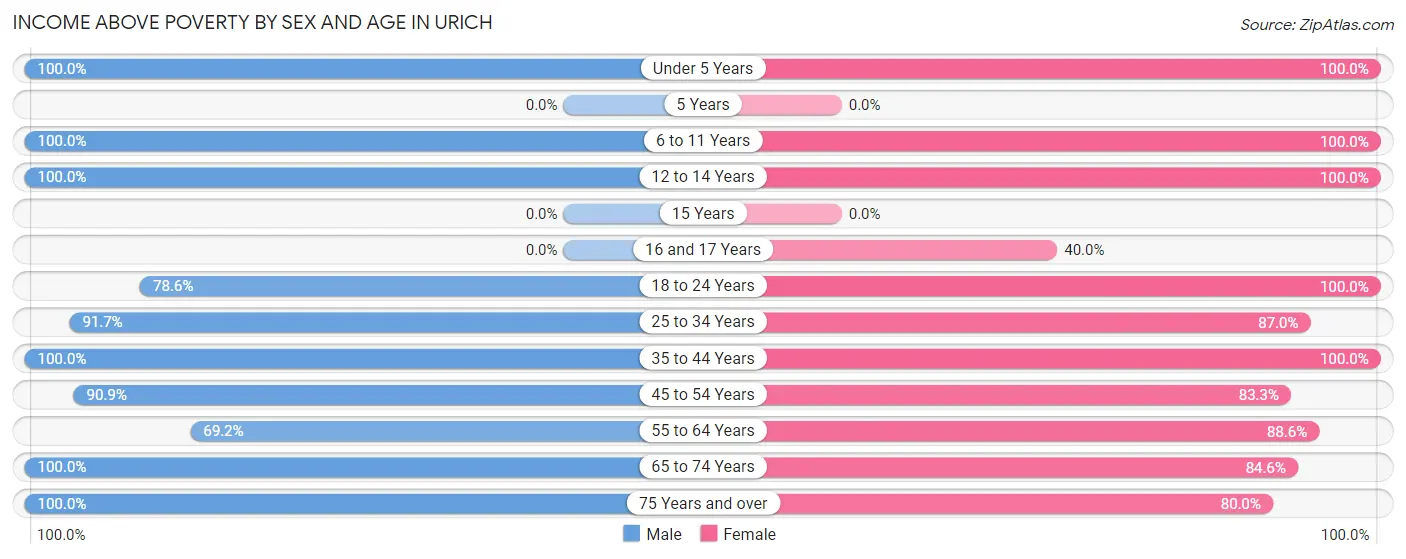
| Age Bracket | Male | Female |
| Under 5 Years | 8 (100.0%) | 3 (100.0%) |
| 5 Years | 0 (0.0%) | 0 (0.0%) |
| 6 to 11 Years | 3 (100.0%) | 3 (100.0%) |
| 12 to 14 Years | 3 (100.0%) | 5 (100.0%) |
| 15 Years | 0 (0.0%) | 0 (0.0%) |
| 16 and 17 Years | 0 (0.0%) | 8 (40.0%) |
| 18 to 24 Years | 11 (78.6%) | 9 (100.0%) |
| 25 to 34 Years | 22 (91.7%) | 20 (87.0%) |
| 35 to 44 Years | 16 (100.0%) | 22 (100.0%) |
| 45 to 54 Years | 20 (90.9%) | 15 (83.3%) |
| 55 to 64 Years | 27 (69.2%) | 31 (88.6%) |
| 65 to 74 Years | 28 (100.0%) | 11 (84.6%) |
| 75 Years and over | 11 (100.0%) | 16 (80.0%) |
| Total | 149 (87.6%) | 143 (83.6%) |
Income Below Poverty Among Married-Couple Families in Urich
The poverty statistics for married-couple families in Urich show that 6.5% or 4 of the total 62 families live below the poverty line. Families with 1 or 2 children have the highest poverty rate of 15.4%, comprising of 2 families. On the other hand, families with no children have the lowest poverty rate of 4.1%, which includes 2 families.
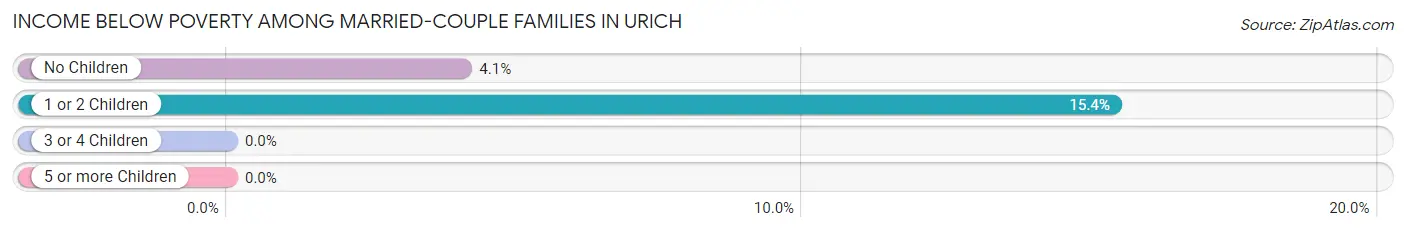
| Children | Above Poverty | Below Poverty |
| No Children | 47 (95.9%) | 2 (4.1%) |
| 1 or 2 Children | 11 (84.6%) | 2 (15.4%) |
| 3 or 4 Children | 0 (0.0%) | 0 (0.0%) |
| 5 or more Children | 0 (0.0%) | 0 (0.0%) |
| Total | 58 (93.5%) | 4 (6.5%) |
Income Below Poverty Among Single-Parent Households in Urich
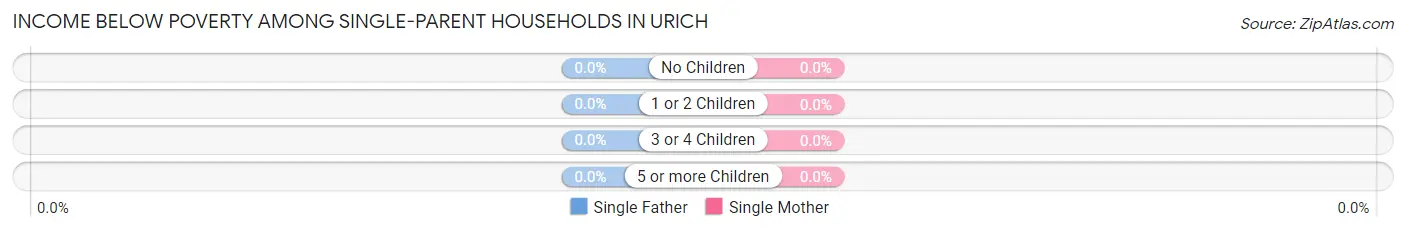
| Children | Single Father | Single Mother |
| No Children | 0 (0.0%) | 0 (0.0%) |
| 1 or 2 Children | 0 (0.0%) | 0 (0.0%) |
| 3 or 4 Children | 0 (0.0%) | 0 (0.0%) |
| 5 or more Children | 0 (0.0%) | 0 (0.0%) |
| Total | 0 (0.0%) | 0 (0.0%) |
Income Below Poverty Among Married-Couple vs Single-Parent Households in Urich
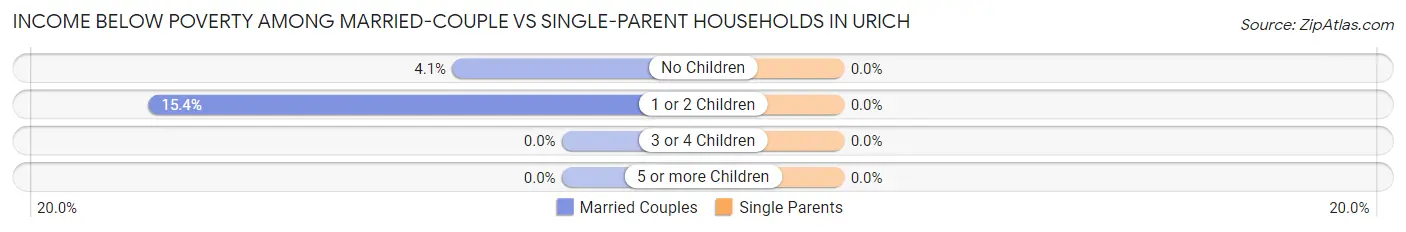
| Children | Married-Couple Families | Single-Parent Households |
| No Children | 2 (4.1%) | 0 (0.0%) |
| 1 or 2 Children | 2 (15.4%) | 0 (0.0%) |
| 3 or 4 Children | 0 (0.0%) | 0 (0.0%) |
| 5 or more Children | 0 (0.0%) | 0 (0.0%) |
| Total | 4 (6.5%) | 0 (0.0%) |
Race in Urich
The most populous races in Urich are White / Caucasian (335 | 95.2%), Two or more Races (15 | 4.3%), and Hispanic or Latino (13 | 3.7%).
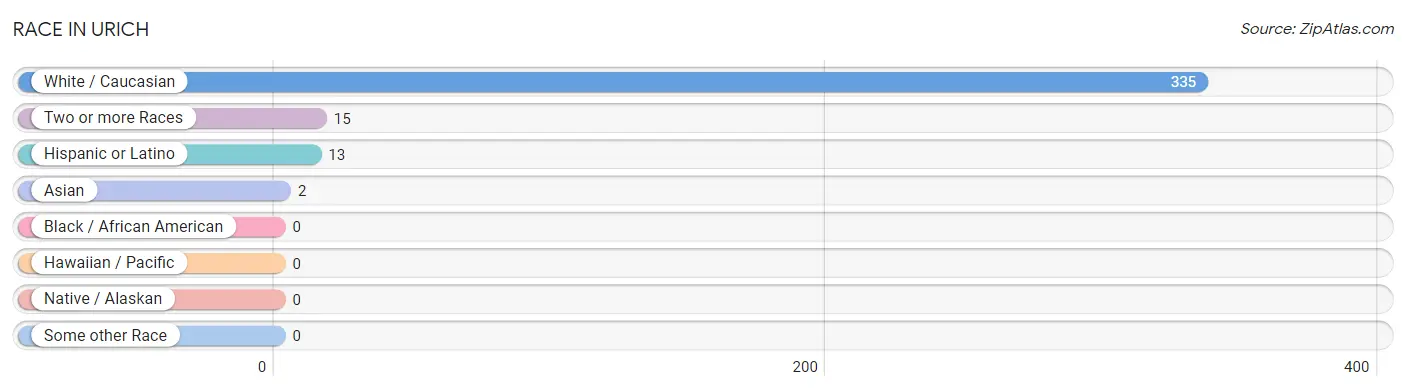
| Race | # Population | % Population |
| Asian | 2 | 0.6% |
| Black / African American | 0 | 0.0% |
| Hawaiian / Pacific | 0 | 0.0% |
| Hispanic or Latino | 13 | 3.7% |
| Native / Alaskan | 0 | 0.0% |
| White / Caucasian | 335 | 95.2% |
| Two or more Races | 15 | 4.3% |
| Some other Race | 0 | 0.0% |
| Total | 352 | 100.0% |
Ancestry in Urich
The most populous ancestries reported in Urich are German (78 | 22.2%), Irish (70 | 19.9%), American (37 | 10.5%), English (31 | 8.8%), and Mexican (13 | 3.7%), together accounting for 65.1% of all Urich residents.
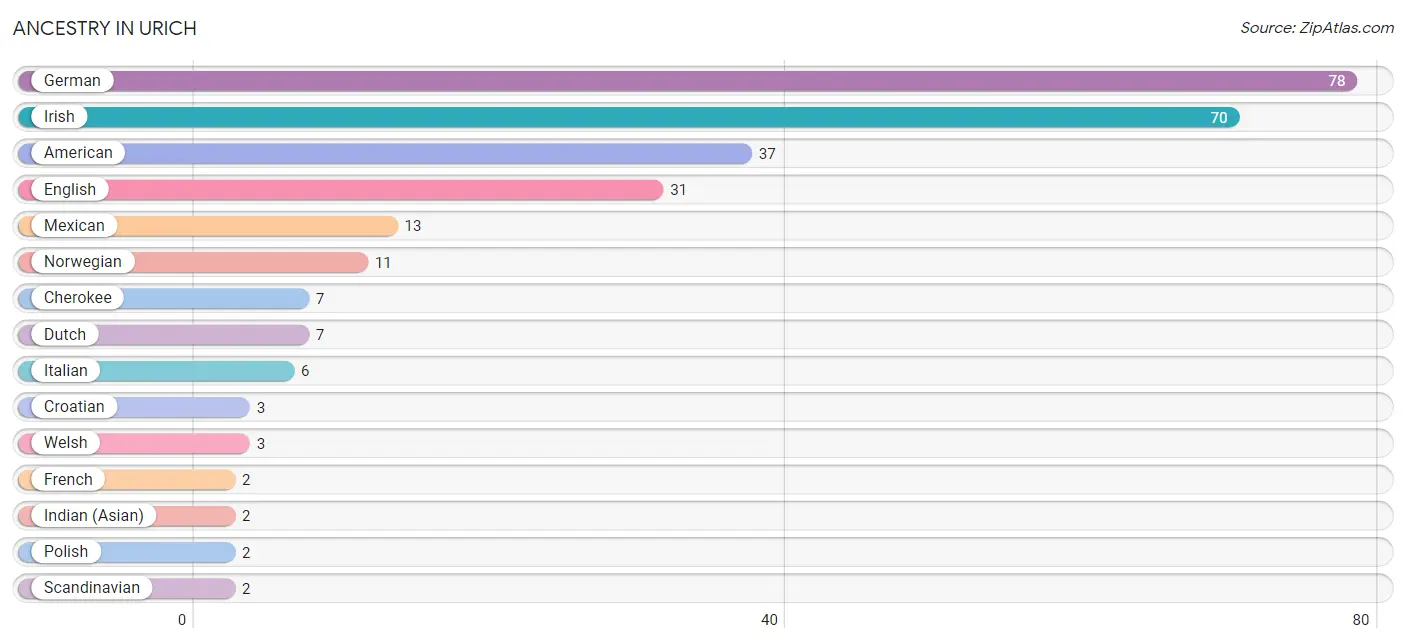
| Ancestry | # Population | % Population |
| American | 37 | 10.5% |
| Cherokee | 7 | 2.0% |
| Croatian | 3 | 0.9% |
| Dutch | 7 | 2.0% |
| English | 31 | 8.8% |
| French | 2 | 0.6% |
| German | 78 | 22.2% |
| Indian (Asian) | 2 | 0.6% |
| Irish | 70 | 19.9% |
| Italian | 6 | 1.7% |
| Mexican | 13 | 3.7% |
| Norwegian | 11 | 3.1% |
| Polish | 2 | 0.6% |
| Scandinavian | 2 | 0.6% |
| Swedish | 1 | 0.3% |
| Welsh | 3 | 0.9% | View All 16 Rows |
Immigrants in Urich
The most numerous immigrant groups reported in Urich came from Asia (2 | 0.6%), China (2 | 0.6%), and Eastern Asia (2 | 0.6%), together accounting for 1.7% of all Urich residents.
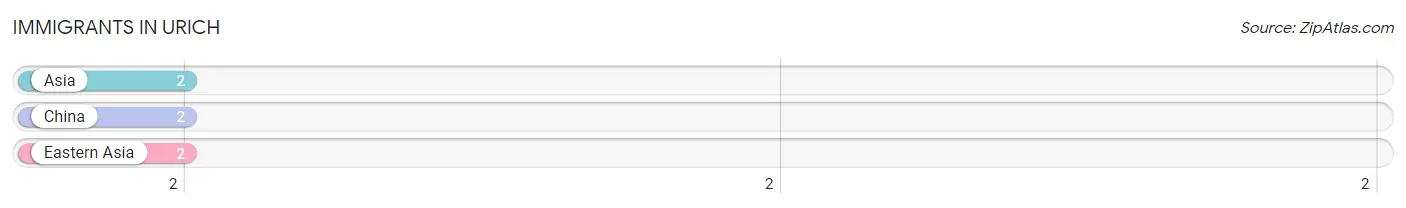
| Immigration Origin | # Population | % Population |
| Asia | 2 | 0.6% |
| China | 2 | 0.6% |
| Eastern Asia | 2 | 0.6% | View All 3 Rows |
Sex and Age in Urich
Sex and Age in Urich
The most populous age groups in Urich are 60 to 64 Years (24 | 14.1%) for men and 15 to 19 Years (20 | 11.0%) for women.
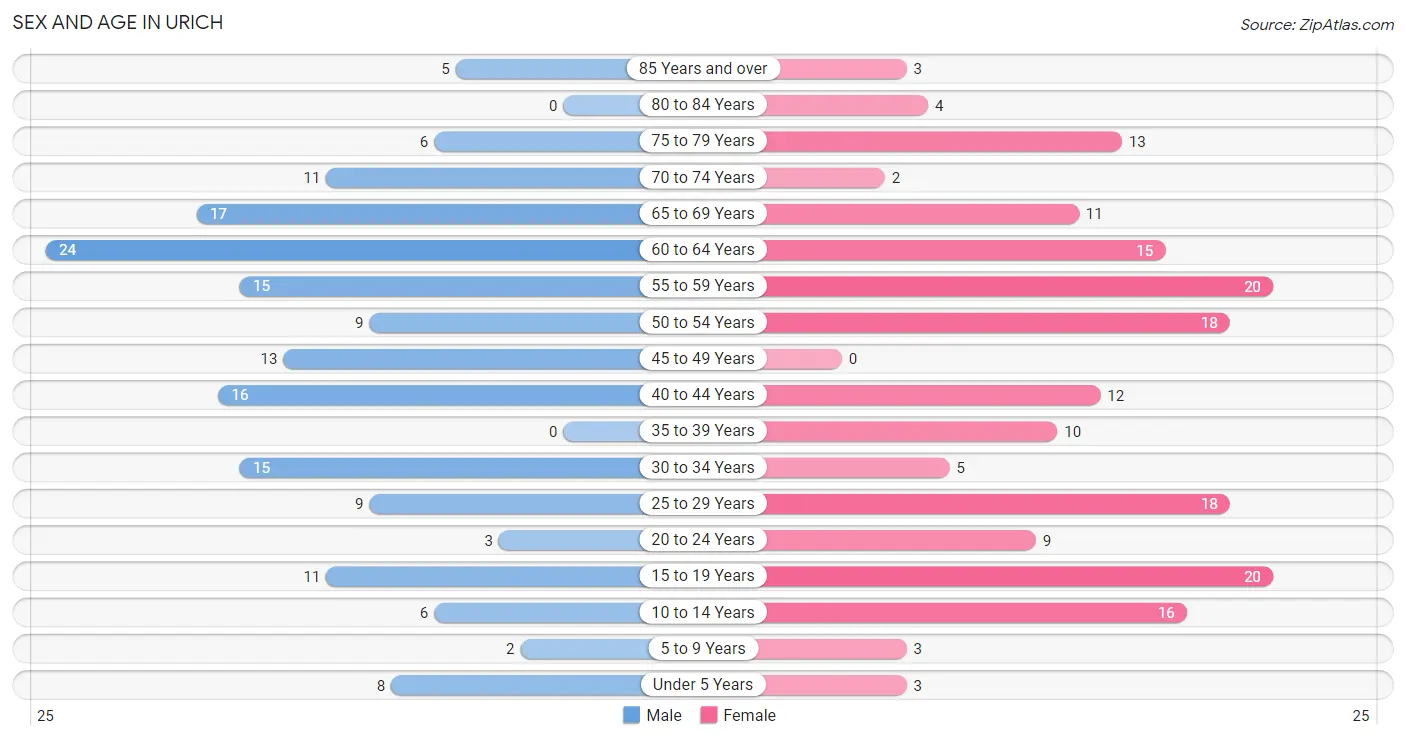
| Age Bracket | Male | Female |
| Under 5 Years | 8 (4.7%) | 3 (1.7%) |
| 5 to 9 Years | 2 (1.2%) | 3 (1.7%) |
| 10 to 14 Years | 6 (3.5%) | 16 (8.8%) |
| 15 to 19 Years | 11 (6.5%) | 20 (11.0%) |
| 20 to 24 Years | 3 (1.8%) | 9 (5.0%) |
| 25 to 29 Years | 9 (5.3%) | 18 (9.9%) |
| 30 to 34 Years | 15 (8.8%) | 5 (2.8%) |
| 35 to 39 Years | 0 (0.0%) | 10 (5.5%) |
| 40 to 44 Years | 16 (9.4%) | 12 (6.6%) |
| 45 to 49 Years | 13 (7.6%) | 0 (0.0%) |
| 50 to 54 Years | 9 (5.3%) | 18 (9.9%) |
| 55 to 59 Years | 15 (8.8%) | 20 (11.0%) |
| 60 to 64 Years | 24 (14.1%) | 15 (8.2%) |
| 65 to 69 Years | 17 (10.0%) | 11 (6.0%) |
| 70 to 74 Years | 11 (6.5%) | 2 (1.1%) |
| 75 to 79 Years | 6 (3.5%) | 13 (7.1%) |
| 80 to 84 Years | 0 (0.0%) | 4 (2.2%) |
| 85 Years and over | 5 (2.9%) | 3 (1.7%) |
| Total | 170 (100.0%) | 182 (100.0%) |
Families and Households in Urich
Median Family Size in Urich
The median family size in Urich is 2.44 persons per family, with married-couple families (62 | 65.3%) accounting for the largest median family size of 2.55 persons per family. On the other hand, single male/father families (17 | 17.9%) represent the smallest median family size with 2.24 persons per family.
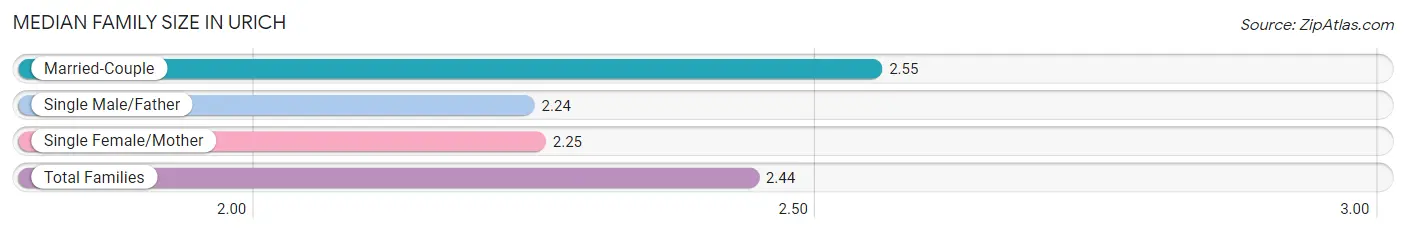
| Family Type | # Families | Family Size |
| Married-Couple | 62 (65.3%) | 2.55 |
| Single Male/Father | 17 (17.9%) | 2.24 |
| Single Female/Mother | 16 (16.8%) | 2.25 |
| Total Families | 95 (100.0%) | 2.44 |
Median Household Size in Urich
The median household size in Urich is 2.17 persons per household, with single female/mother households (16 | 9.9%) accounting for the largest median household size of 3.25 persons per household. non-family households (67 | 41.4%) represent the smallest median household size with 1.55 persons per household.
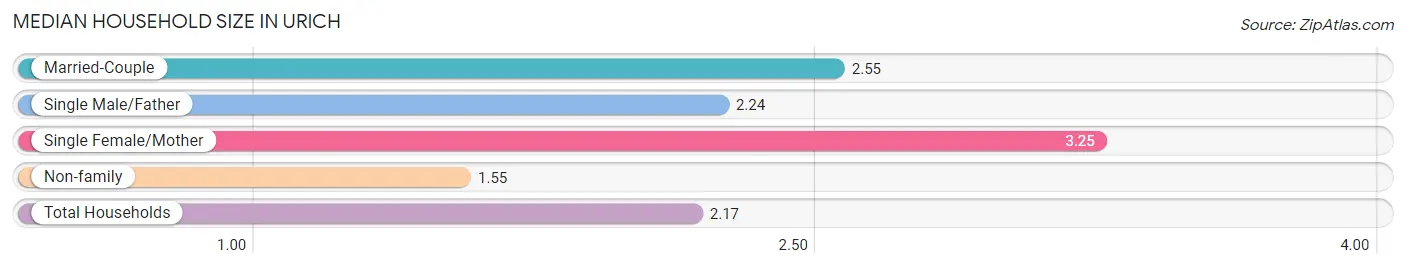
| Household Type | # Households | Household Size |
| Married-Couple | 62 (38.3%) | 2.55 |
| Single Male/Father | 17 (10.5%) | 2.24 |
| Single Female/Mother | 16 (9.9%) | 3.25 |
| Non-family | 67 (41.4%) | 1.55 |
| Total Households | 162 (100.0%) | 2.17 |
Household Size by Marriage Status in Urich
Out of a total of 162 households in Urich, 95 (58.6%) are family households, while 67 (41.4%) are nonfamily households. The most numerous type of family households are 2-person households, comprising 69, and the most common type of nonfamily households are 1-person households, comprising 45.
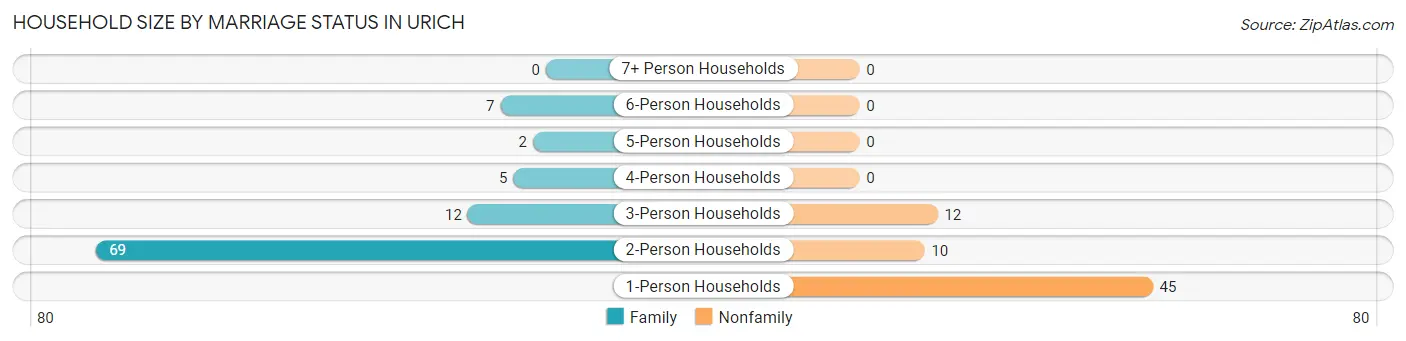
| Household Size | Family Households | Nonfamily Households |
| 1-Person Households | - | 45 (27.8%) |
| 2-Person Households | 69 (42.6%) | 10 (6.2%) |
| 3-Person Households | 12 (7.4%) | 12 (7.4%) |
| 4-Person Households | 5 (3.1%) | 0 (0.0%) |
| 5-Person Households | 2 (1.2%) | 0 (0.0%) |
| 6-Person Households | 7 (4.3%) | 0 (0.0%) |
| 7+ Person Households | 0 (0.0%) | 0 (0.0%) |
| Total | 95 (58.6%) | 67 (41.4%) |
Female Fertility in Urich
Fertility by Age in Urich
Average fertility rate in Urich is 38.0 births per 1,000 women. Women in the age bracket of 20 to 34 years have the highest fertility rate with 94.0 births per 1,000 women. Women in the age bracket of 20 to 34 years acount for 100.0% of all women with births.
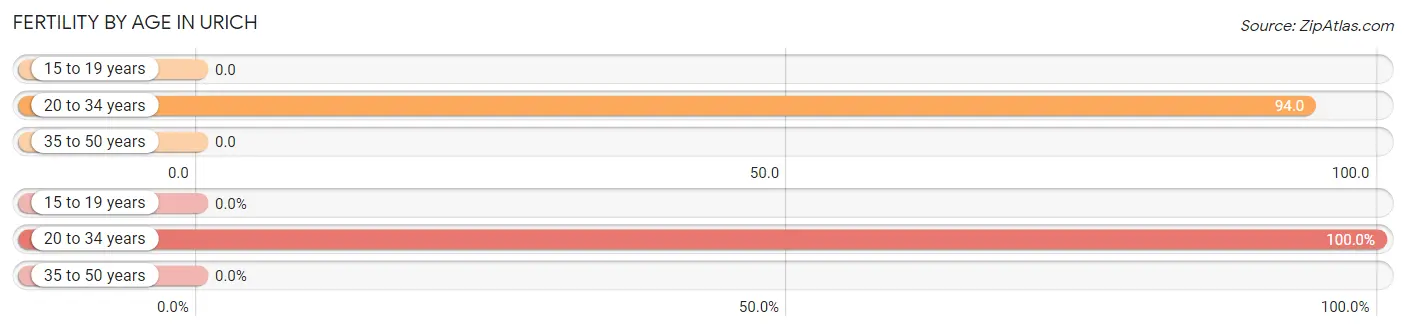
| Age Bracket | Women with Births | Births / 1,000 Women |
| 15 to 19 years | 0 (0.0%) | 0.0 |
| 20 to 34 years | 3 (100.0%) | 94.0 |
| 35 to 50 years | 0 (0.0%) | 0.0 |
| Total | 3 (100.0%) | 38.0 |
Fertility by Age by Marriage Status in Urich
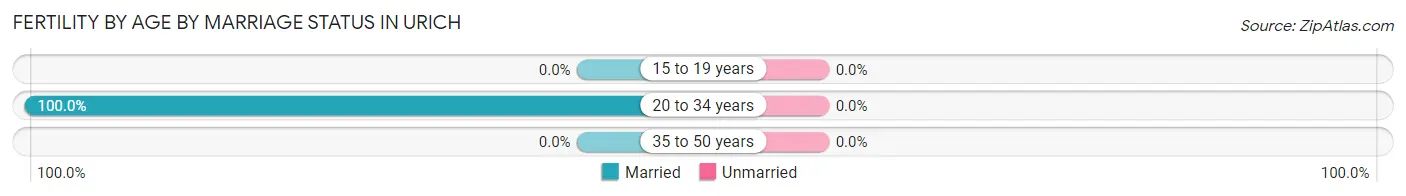
| Age Bracket | Married | Unmarried |
| 15 to 19 years | 0 (0.0%) | 0 (0.0%) |
| 20 to 34 years | 3 (100.0%) | 0 (0.0%) |
| 35 to 50 years | 0 (0.0%) | 0 (0.0%) |
| Total | 3 (100.0%) | 0 (0.0%) |
Fertility by Education in Urich
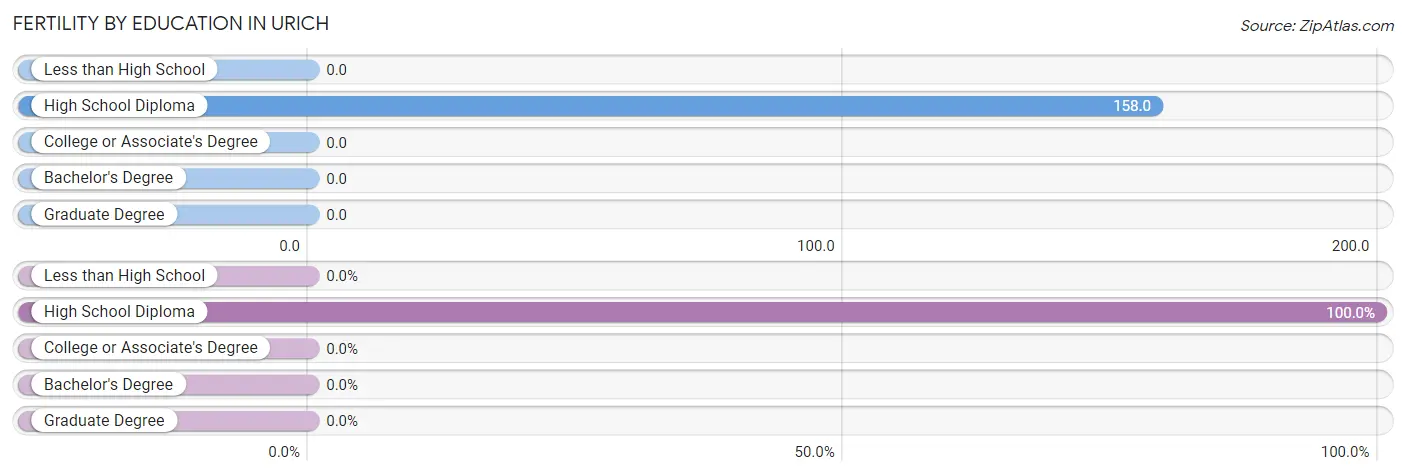
| Educational Attainment | Women with Births | Births / 1,000 Women |
| Less than High School | 0 (0.0%) | 0.0 |
| High School Diploma | 3 (100.0%) | 158.0 |
| College or Associate's Degree | 0 (0.0%) | 0.0 |
| Bachelor's Degree | 0 (0.0%) | 0.0 |
| Graduate Degree | 0 (0.0%) | 0.0 |
| Total | 3 (100.0%) | 38.0 |
Fertility by Education by Marriage Status in Urich
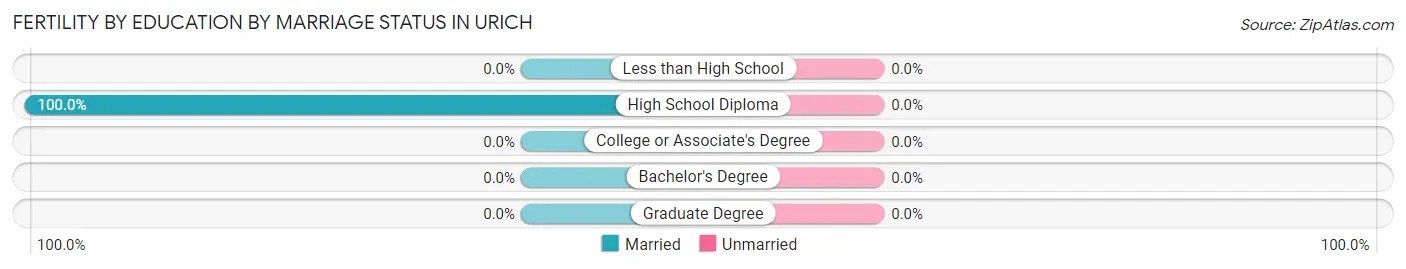
| Educational Attainment | Married | Unmarried |
| Less than High School | 0 (0.0%) | 0 (0.0%) |
| High School Diploma | 3 (100.0%) | 0 (0.0%) |
| College or Associate's Degree | 0 (0.0%) | 0 (0.0%) |
| Bachelor's Degree | 0 (0.0%) | 0 (0.0%) |
| Graduate Degree | 0 (0.0%) | 0 (0.0%) |
| Total | 3 (100.0%) | 0 (0.0%) |
Employment Characteristics in Urich
Employment by Class of Employer in Urich
Among the 171 employed individuals in Urich, private company employees (133 | 77.8%), self-employed (not incorporated) (15 | 8.8%), and not-for-profit organizations (7 | 4.1%) make up the most common classes of employment.
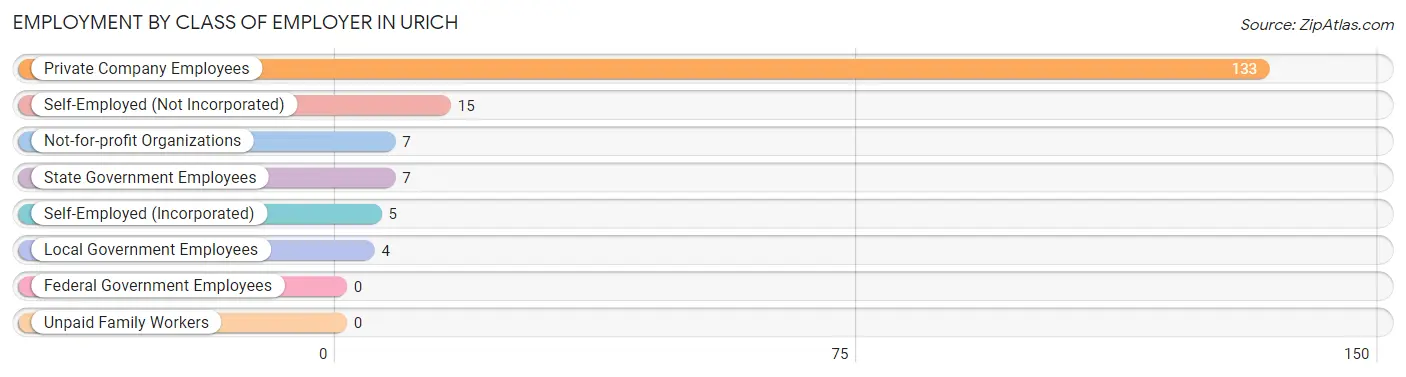
| Employer Class | # Employees | % Employees |
| Private Company Employees | 133 | 77.8% |
| Self-Employed (Incorporated) | 5 | 2.9% |
| Self-Employed (Not Incorporated) | 15 | 8.8% |
| Not-for-profit Organizations | 7 | 4.1% |
| Local Government Employees | 4 | 2.3% |
| State Government Employees | 7 | 4.1% |
| Federal Government Employees | 0 | 0.0% |
| Unpaid Family Workers | 0 | 0.0% |
| Total | 171 | 100.0% |
Employment Status by Age in Urich
According to the labor force statistics for Urich, out of the total population over 16 years of age (314), 59.2% or 186 individuals are in the labor force, with 8.1% or 15 of them unemployed. The age group with the highest labor force participation rate is 25 to 29 years, with 100.0% or 27 individuals in the labor force. Within the labor force, the 25 to 29 years age range has the highest percentage of unemployed individuals, with 48.1% or 13 of them being unemployed.
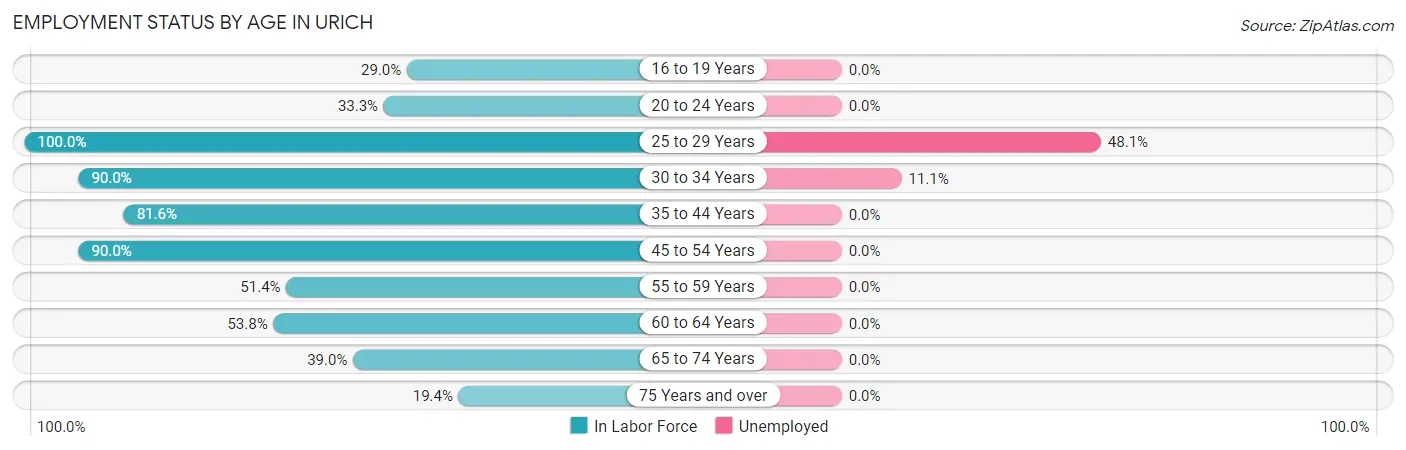
| Age Bracket | In Labor Force | Unemployed |
| 16 to 19 Years | 9 (29.0%) | 0 (0.0%) |
| 20 to 24 Years | 4 (33.3%) | 0 (0.0%) |
| 25 to 29 Years | 27 (100.0%) | 13 (48.1%) |
| 30 to 34 Years | 18 (90.0%) | 2 (11.1%) |
| 35 to 44 Years | 31 (81.6%) | 0 (0.0%) |
| 45 to 54 Years | 36 (90.0%) | 0 (0.0%) |
| 55 to 59 Years | 18 (51.4%) | 0 (0.0%) |
| 60 to 64 Years | 21 (53.8%) | 0 (0.0%) |
| 65 to 74 Years | 16 (39.0%) | 0 (0.0%) |
| 75 Years and over | 6 (19.4%) | 0 (0.0%) |
| Total | 186 (59.2%) | 15 (8.1%) |
Employment Status by Educational Attainment in Urich
According to labor force statistics for Urich, 75.9% of individuals (151) out of the total population between 25 and 64 years of age (199) are in the labor force, with 9.9% or 15 of them being unemployed. The group with the highest labor force participation rate are those with the educational attainment of less than high school, with 83.3% or 30 individuals in the labor force. Within the labor force, individuals with less than high school education have the highest percentage of unemployment, with 43.3% or 13 of them being unemployed.
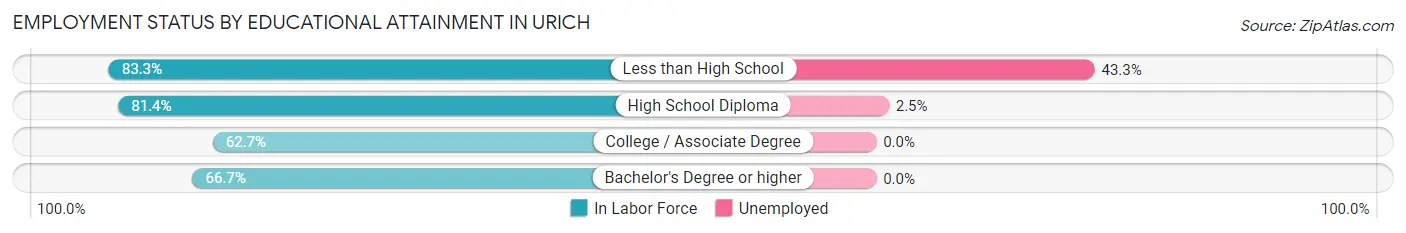
| Educational Attainment | In Labor Force | Unemployed |
| Less than High School | 30 (83.3%) | 16 (43.3%) |
| High School Diploma | 79 (81.4%) | 2 (2.5%) |
| College / Associate Degree | 32 (62.7%) | 0 (0.0%) |
| Bachelor's Degree or higher | 10 (66.7%) | 0 (0.0%) |
| Total | 151 (75.9%) | 20 (9.9%) |
Employment Occupations by Sex in Urich
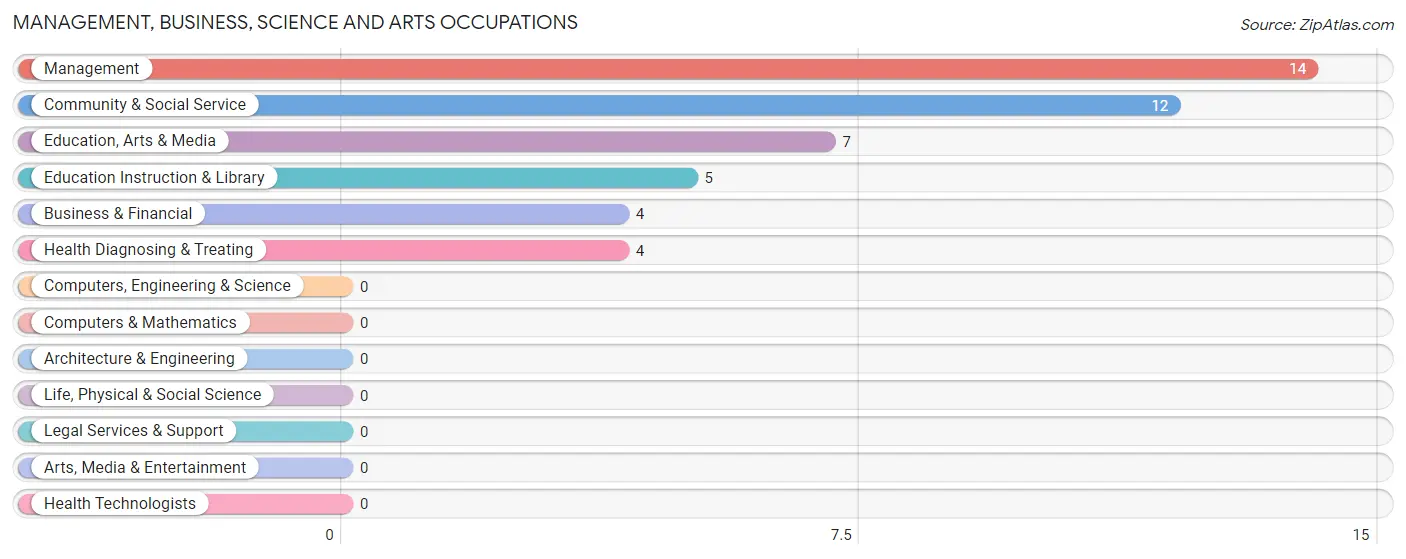
Management, Business, Science and Arts Occupations
The most common Management, Business, Science and Arts occupations in Urich are Management (14 | 8.2%), Community & Social Service (12 | 7.0%), Education, Arts & Media (7 | 4.1%), Education Instruction & Library (5 | 2.9%), and Business & Financial (4 | 2.3%).
Management, Business, Science and Arts Occupations by Sex
Within the Management, Business, Science and Arts occupations in Urich, the most male-oriented occupations are Business & Financial (100.0%), and Management (57.1%), while the most female-oriented occupations are Community & Social Service (100.0%), Education, Arts & Media (100.0%), and Education Instruction & Library (100.0%).
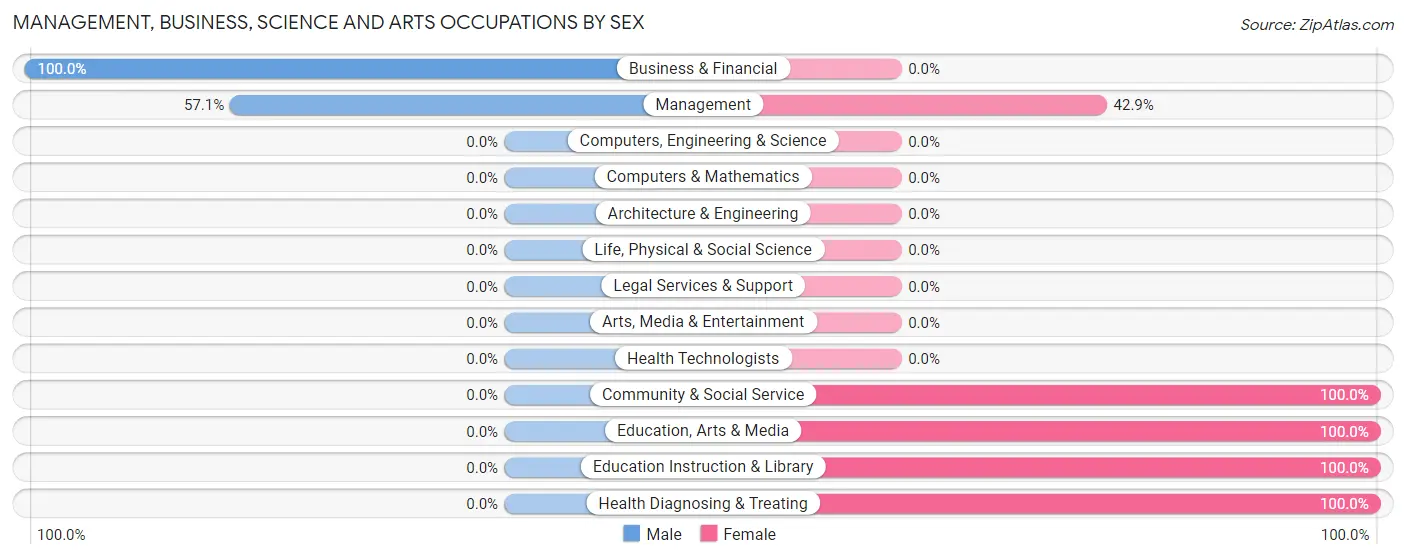
| Occupation | Male | Female |
| Management | 8 (57.1%) | 6 (42.9%) |
| Business & Financial | 4 (100.0%) | 0 (0.0%) |
| Computers, Engineering & Science | 0 (0.0%) | 0 (0.0%) |
| Computers & Mathematics | 0 (0.0%) | 0 (0.0%) |
| Architecture & Engineering | 0 (0.0%) | 0 (0.0%) |
| Life, Physical & Social Science | 0 (0.0%) | 0 (0.0%) |
| Community & Social Service | 0 (0.0%) | 12 (100.0%) |
| Education, Arts & Media | 0 (0.0%) | 7 (100.0%) |
| Legal Services & Support | 0 (0.0%) | 0 (0.0%) |
| Education Instruction & Library | 0 (0.0%) | 5 (100.0%) |
| Arts, Media & Entertainment | 0 (0.0%) | 0 (0.0%) |
| Health Diagnosing & Treating | 0 (0.0%) | 4 (100.0%) |
| Health Technologists | 0 (0.0%) | 0 (0.0%) |
| Total (Category) | 12 (35.3%) | 22 (64.7%) |
| Total (Overall) | 90 (52.6%) | 81 (47.4%) |
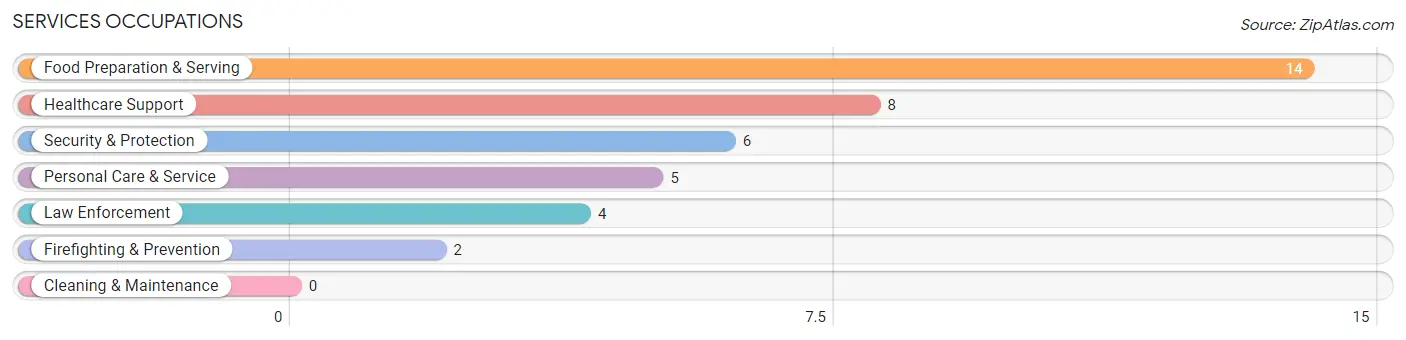
Services Occupations
The most common Services occupations in Urich are Food Preparation & Serving (14 | 8.2%), Healthcare Support (8 | 4.7%), Security & Protection (6 | 3.5%), Personal Care & Service (5 | 2.9%), and Law Enforcement (4 | 2.3%).
Services Occupations by Sex
Within the Services occupations in Urich, the most male-oriented occupations are Security & Protection (100.0%), Firefighting & Prevention (100.0%), and Law Enforcement (100.0%), while the most female-oriented occupations are Food Preparation & Serving (100.0%), Healthcare Support (87.5%), and Personal Care & Service (40.0%).
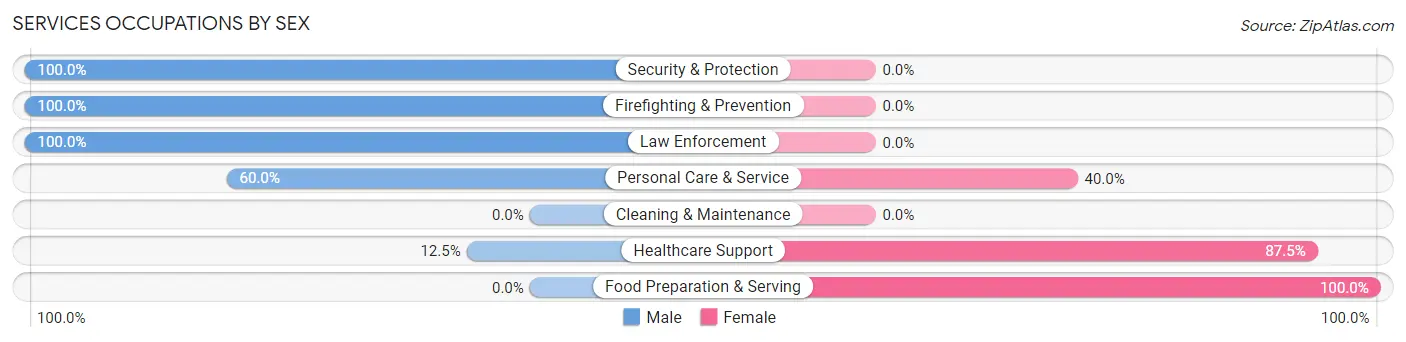
| Occupation | Male | Female |
| Healthcare Support | 1 (12.5%) | 7 (87.5%) |
| Security & Protection | 6 (100.0%) | 0 (0.0%) |
| Firefighting & Prevention | 2 (100.0%) | 0 (0.0%) |
| Law Enforcement | 4 (100.0%) | 0 (0.0%) |
| Food Preparation & Serving | 0 (0.0%) | 14 (100.0%) |
| Cleaning & Maintenance | 0 (0.0%) | 0 (0.0%) |
| Personal Care & Service | 3 (60.0%) | 2 (40.0%) |
| Total (Category) | 10 (30.3%) | 23 (69.7%) |
| Total (Overall) | 90 (52.6%) | 81 (47.4%) |
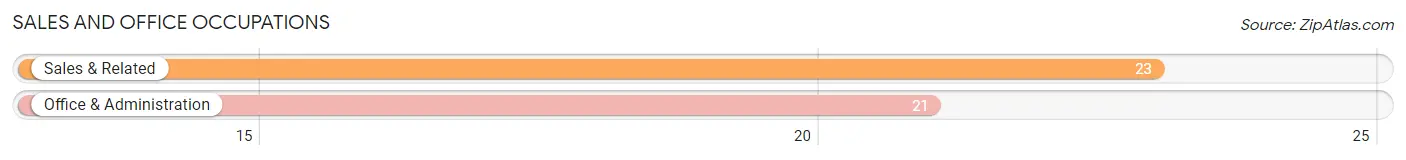
Sales and Office Occupations
The most common Sales and Office occupations in Urich are Sales & Related (23 | 13.5%), and Office & Administration (21 | 12.3%).
Sales and Office Occupations by Sex
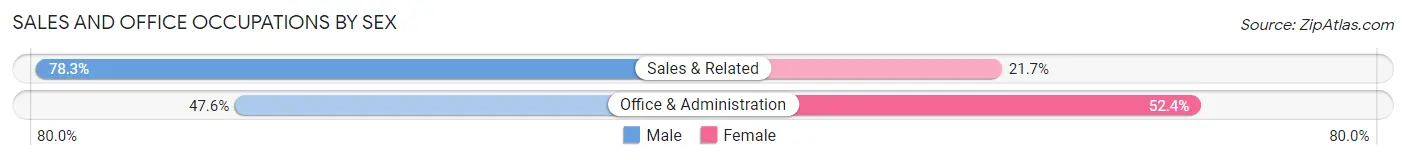
| Occupation | Male | Female |
| Sales & Related | 18 (78.3%) | 5 (21.7%) |
| Office & Administration | 10 (47.6%) | 11 (52.4%) |
| Total (Category) | 28 (63.6%) | 16 (36.4%) |
| Total (Overall) | 90 (52.6%) | 81 (47.4%) |
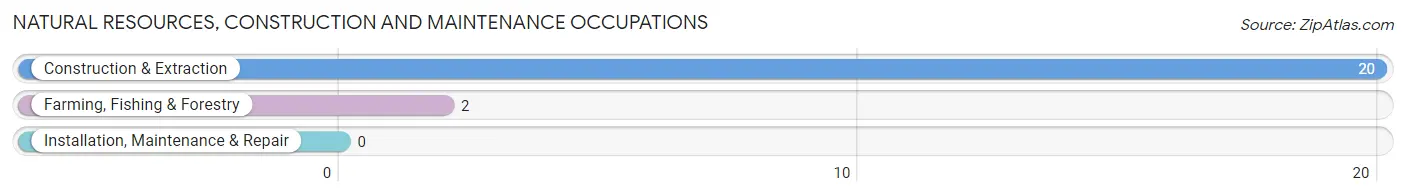
Natural Resources, Construction and Maintenance Occupations
The most common Natural Resources, Construction and Maintenance occupations in Urich are Construction & Extraction (20 | 11.7%), and Farming, Fishing & Forestry (2 | 1.2%).
Natural Resources, Construction and Maintenance Occupations by Sex
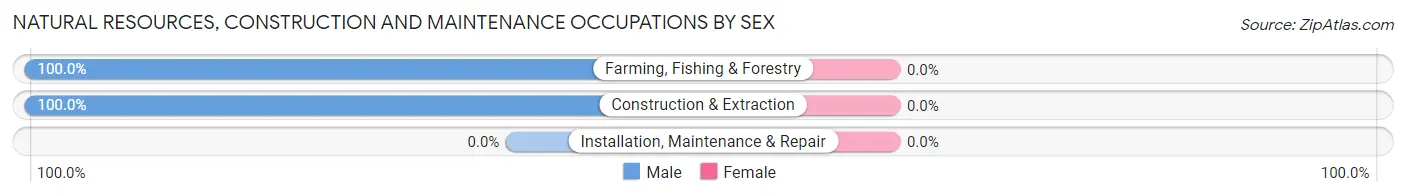
| Occupation | Male | Female |
| Farming, Fishing & Forestry | 2 (100.0%) | 0 (0.0%) |
| Construction & Extraction | 20 (100.0%) | 0 (0.0%) |
| Installation, Maintenance & Repair | 0 (0.0%) | 0 (0.0%) |
| Total (Category) | 22 (100.0%) | 0 (0.0%) |
| Total (Overall) | 90 (52.6%) | 81 (47.4%) |
Production, Transportation and Moving Occupations
The most common Production, Transportation and Moving occupations in Urich are Material Moving (17 | 9.9%), Production (11 | 6.4%), and Transportation (10 | 5.9%).
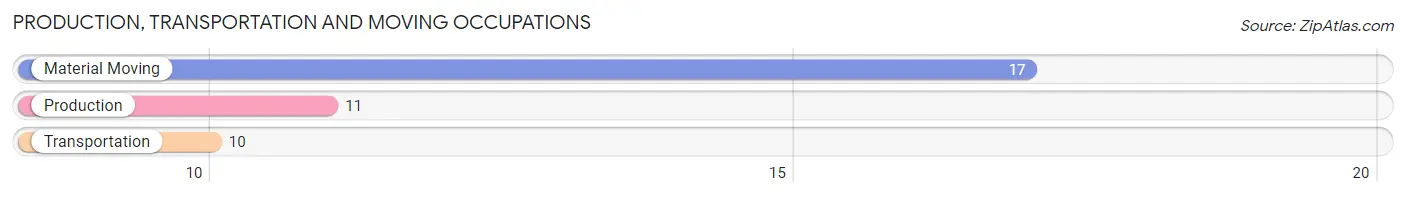
Production, Transportation and Moving Occupations by Sex
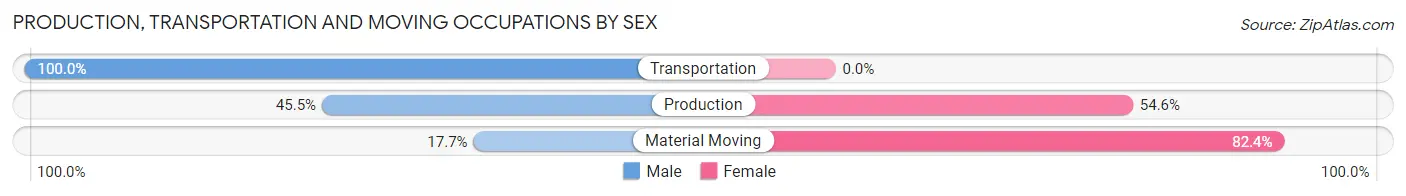
| Occupation | Male | Female |
| Production | 5 (45.5%) | 6 (54.5%) |
| Transportation | 10 (100.0%) | 0 (0.0%) |
| Material Moving | 3 (17.6%) | 14 (82.4%) |
| Total (Category) | 18 (47.4%) | 20 (52.6%) |
| Total (Overall) | 90 (52.6%) | 81 (47.4%) |
Employment Industries by Sex in Urich
Employment Industries in Urich
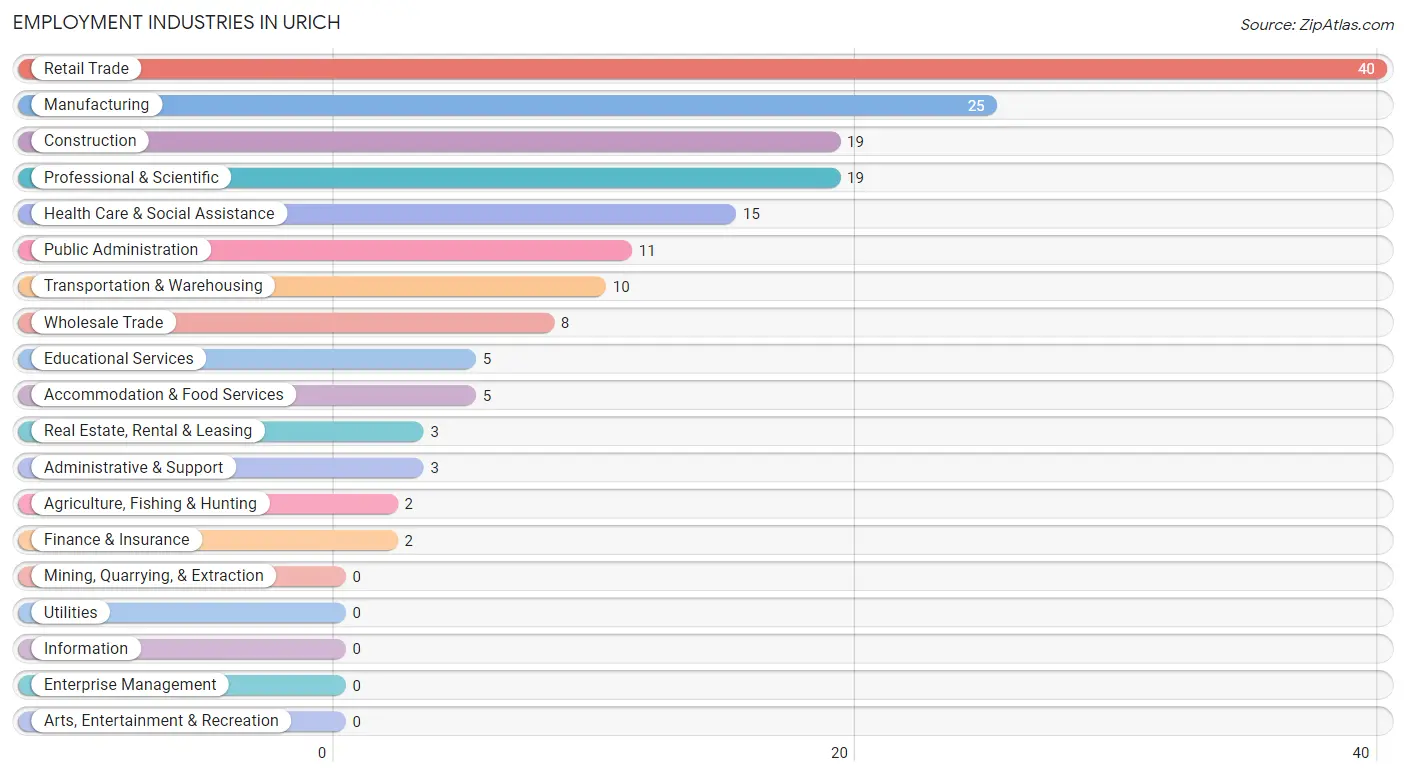
The major employment industries in Urich include Retail Trade (40 | 23.4%), Manufacturing (25 | 14.6%), Construction (19 | 11.1%), Professional & Scientific (19 | 11.1%), and Health Care & Social Assistance (15 | 8.8%).
Employment Industries by Sex in Urich
The Urich industries that see more men than women are Agriculture, Fishing & Hunting (100.0%), Construction (100.0%), and Wholesale Trade (100.0%), whereas the industries that tend to have a higher number of women are Administrative & Support (100.0%), Educational Services (100.0%), and Health Care & Social Assistance (100.0%).
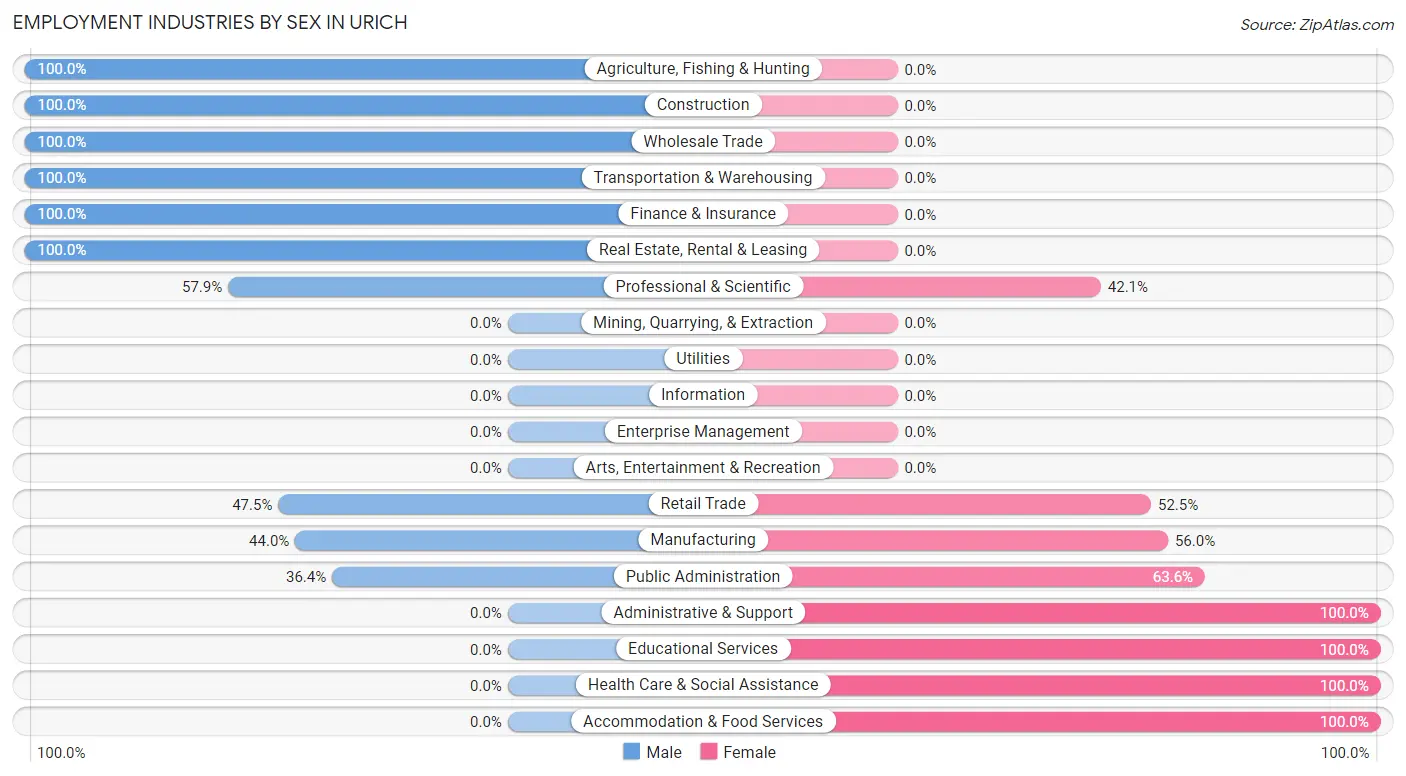
| Industry | Male | Female |
| Agriculture, Fishing & Hunting | 2 (100.0%) | 0 (0.0%) |
| Mining, Quarrying, & Extraction | 0 (0.0%) | 0 (0.0%) |
| Construction | 19 (100.0%) | 0 (0.0%) |
| Manufacturing | 11 (44.0%) | 14 (56.0%) |
| Wholesale Trade | 8 (100.0%) | 0 (0.0%) |
| Retail Trade | 19 (47.5%) | 21 (52.5%) |
| Transportation & Warehousing | 10 (100.0%) | 0 (0.0%) |
| Utilities | 0 (0.0%) | 0 (0.0%) |
| Information | 0 (0.0%) | 0 (0.0%) |
| Finance & Insurance | 2 (100.0%) | 0 (0.0%) |
| Real Estate, Rental & Leasing | 3 (100.0%) | 0 (0.0%) |
| Professional & Scientific | 11 (57.9%) | 8 (42.1%) |
| Enterprise Management | 0 (0.0%) | 0 (0.0%) |
| Administrative & Support | 0 (0.0%) | 3 (100.0%) |
| Educational Services | 0 (0.0%) | 5 (100.0%) |
| Health Care & Social Assistance | 0 (0.0%) | 15 (100.0%) |
| Arts, Entertainment & Recreation | 0 (0.0%) | 0 (0.0%) |
| Accommodation & Food Services | 0 (0.0%) | 5 (100.0%) |
| Public Administration | 4 (36.4%) | 7 (63.6%) |
| Total | 90 (52.6%) | 81 (47.4%) |
Education in Urich
School Enrollment in Urich
The most common levels of schooling among the 55 students in Urich are middle school (22 | 40.0%), high school (22 | 40.0%), and college / undergraduate (9 | 16.4%).
| School Level | # Students | % Students |
| Nursery / Preschool | 2 | 3.6% |
| Kindergarten | 0 | 0.0% |
| Elementary School | 0 | 0.0% |
| Middle School | 22 | 40.0% |
| High School | 22 | 40.0% |
| College / Undergraduate | 9 | 16.4% |
| Graduate / Professional | 0 | 0.0% |
| Total | 55 | 100.0% |
School Enrollment by Age by Funding Source in Urich
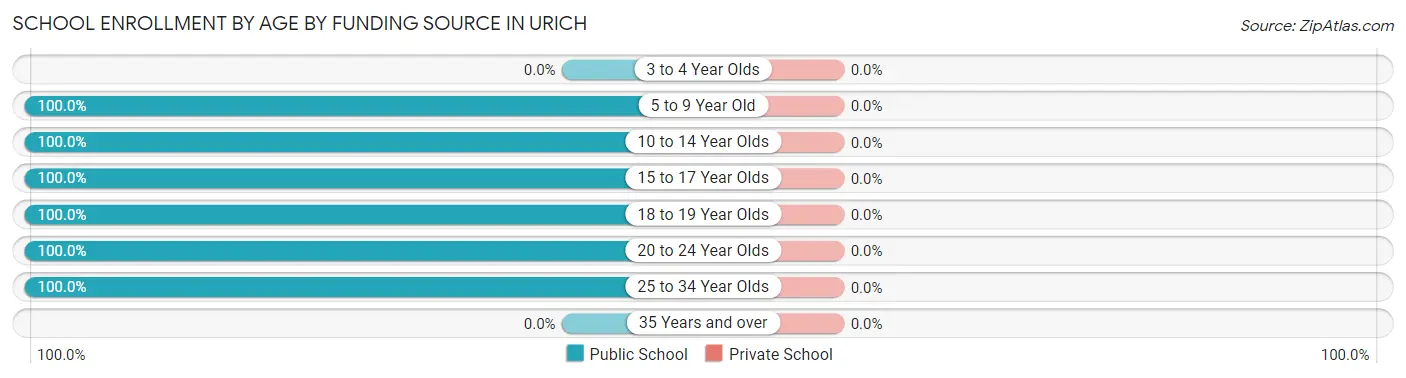
| Age Bracket | Public School | Private School |
| 3 to 4 Year Olds | 0 (0.0%) | 0 (0.0%) |
| 5 to 9 Year Old | 2 (100.0%) | 0 (0.0%) |
| 10 to 14 Year Olds | 22 (100.0%) | 0 (0.0%) |
| 15 to 17 Year Olds | 20 (100.0%) | 0 (0.0%) |
| 18 to 19 Year Olds | 5 (100.0%) | 0 (0.0%) |
| 20 to 24 Year Olds | 4 (100.0%) | 0 (0.0%) |
| 25 to 34 Year Olds | 2 (100.0%) | 0 (0.0%) |
| 35 Years and over | 0 (0.0%) | 0 (0.0%) |
| Total | 55 (100.0%) | 0 (0.0%) |
Educational Attainment by Field of Study in Urich
Business (5 | 22.7%), arts & humanities (4 | 18.2%), bio, nature & agricultural (3 | 13.6%), education (3 | 13.6%), and visual & performing arts (3 | 13.6%) are the most common fields of study among 22 individuals in Urich who have obtained a bachelor's degree or higher.
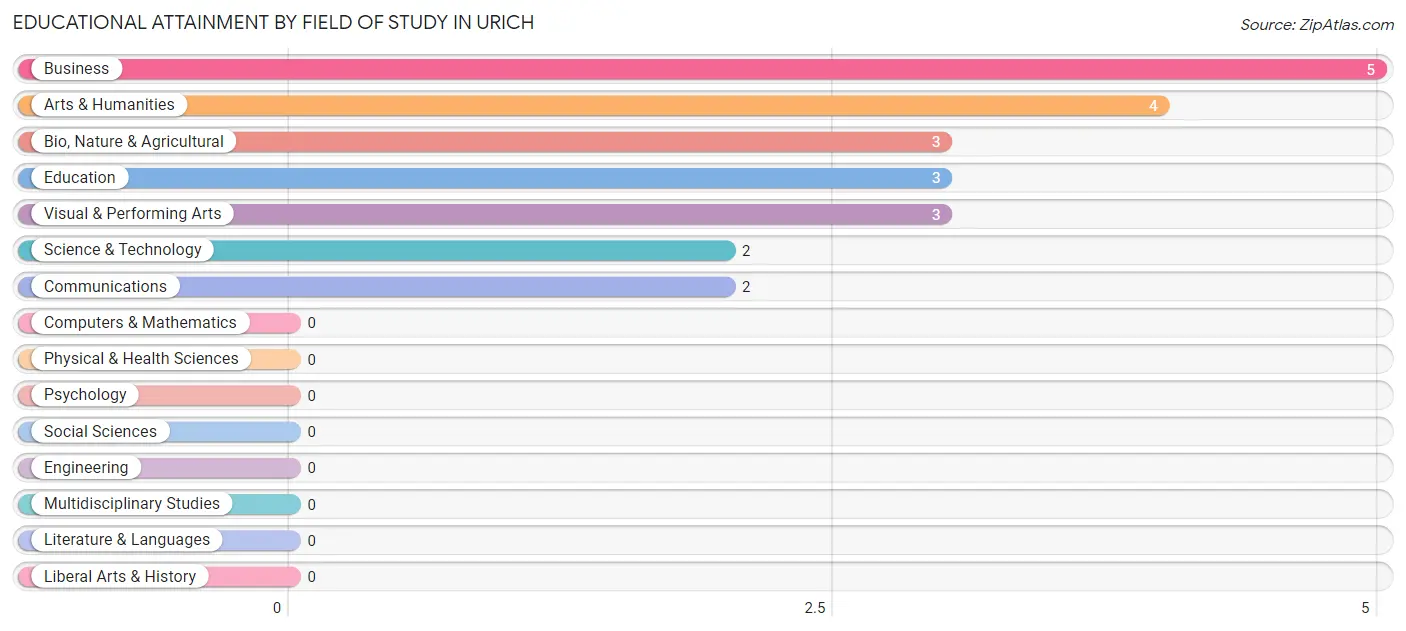
| Field of Study | # Graduates | % Graduates |
| Computers & Mathematics | 0 | 0.0% |
| Bio, Nature & Agricultural | 3 | 13.6% |
| Physical & Health Sciences | 0 | 0.0% |
| Psychology | 0 | 0.0% |
| Social Sciences | 0 | 0.0% |
| Engineering | 0 | 0.0% |
| Multidisciplinary Studies | 0 | 0.0% |
| Science & Technology | 2 | 9.1% |
| Business | 5 | 22.7% |
| Education | 3 | 13.6% |
| Literature & Languages | 0 | 0.0% |
| Liberal Arts & History | 0 | 0.0% |
| Visual & Performing Arts | 3 | 13.6% |
| Communications | 2 | 9.1% |
| Arts & Humanities | 4 | 18.2% |
| Total | 22 | 100.0% |
Transportation & Commute in Urich
Vehicle Availability by Sex in Urich
The most prevalent vehicle ownership categories in Urich are males with 2 vehicles (39, accounting for 43.3%) and females with 2 vehicles (28, making up 48.1%).
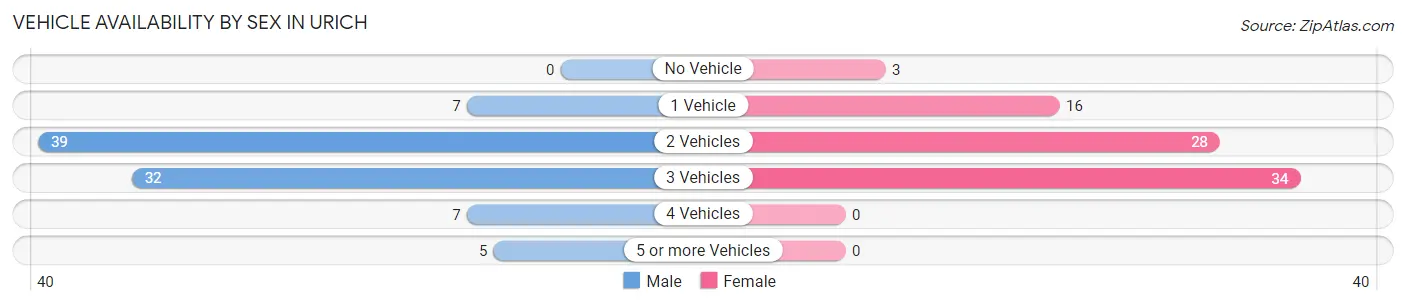
| Vehicles Available | Male | Female |
| No Vehicle | 0 (0.0%) | 3 (3.7%) |
| 1 Vehicle | 7 (7.8%) | 16 (19.8%) |
| 2 Vehicles | 39 (43.3%) | 28 (34.6%) |
| 3 Vehicles | 32 (35.6%) | 34 (42.0%) |
| 4 Vehicles | 7 (7.8%) | 0 (0.0%) |
| 5 or more Vehicles | 5 (5.6%) | 0 (0.0%) |
| Total | 90 (100.0%) | 81 (100.0%) |
Commute Time in Urich
The most frequently occuring commute durations in Urich are 30 to 34 minutes (36 commuters, 21.7%), 5 to 9 minutes (30 commuters, 18.1%), and 45 to 59 minutes (28 commuters, 16.9%).
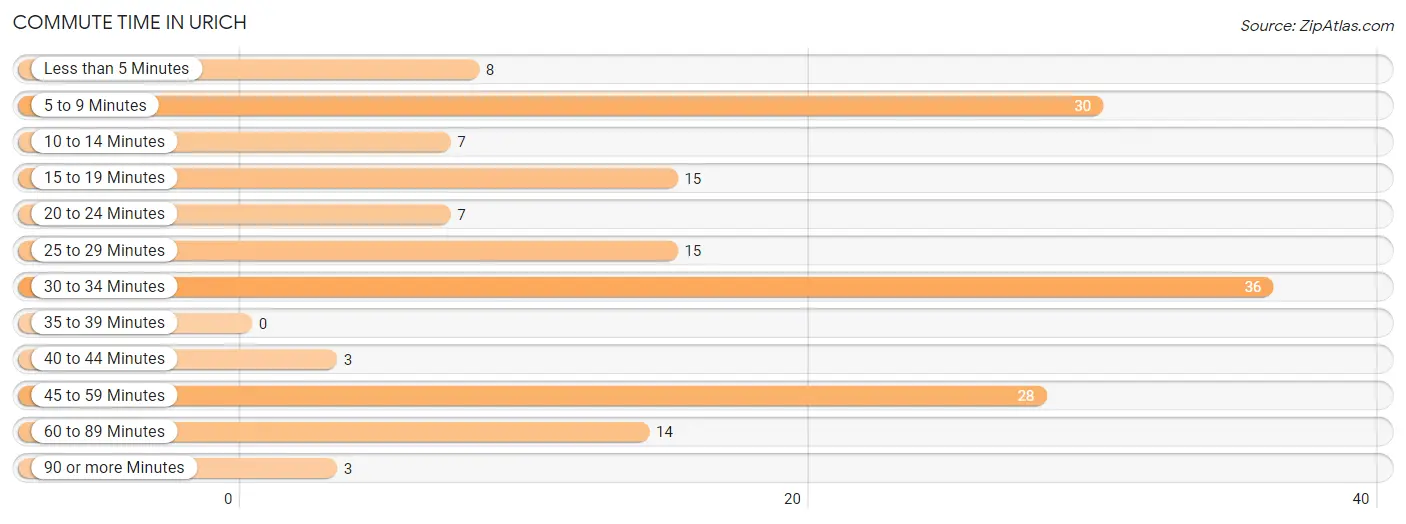
| Commute Time | # Commuters | % Commuters |
| Less than 5 Minutes | 8 | 4.8% |
| 5 to 9 Minutes | 30 | 18.1% |
| 10 to 14 Minutes | 7 | 4.2% |
| 15 to 19 Minutes | 15 | 9.0% |
| 20 to 24 Minutes | 7 | 4.2% |
| 25 to 29 Minutes | 15 | 9.0% |
| 30 to 34 Minutes | 36 | 21.7% |
| 35 to 39 Minutes | 0 | 0.0% |
| 40 to 44 Minutes | 3 | 1.8% |
| 45 to 59 Minutes | 28 | 16.9% |
| 60 to 89 Minutes | 14 | 8.4% |
| 90 or more Minutes | 3 | 1.8% |
Commute Time by Sex in Urich
The most common commute times in Urich are 30 to 34 minutes (23 commuters, 25.6%) for males and 5 to 9 minutes (14 commuters, 18.4%) for females.
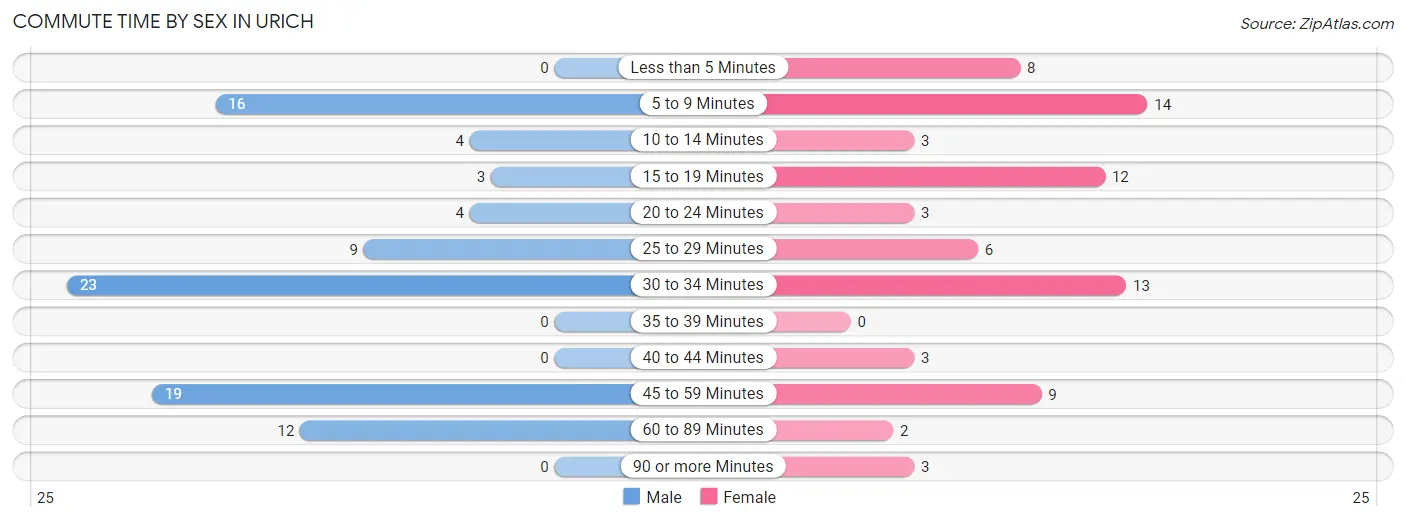
| Commute Time | Male | Female |
| Less than 5 Minutes | 0 (0.0%) | 8 (10.5%) |
| 5 to 9 Minutes | 16 (17.8%) | 14 (18.4%) |
| 10 to 14 Minutes | 4 (4.4%) | 3 (4.0%) |
| 15 to 19 Minutes | 3 (3.3%) | 12 (15.8%) |
| 20 to 24 Minutes | 4 (4.4%) | 3 (4.0%) |
| 25 to 29 Minutes | 9 (10.0%) | 6 (7.9%) |
| 30 to 34 Minutes | 23 (25.6%) | 13 (17.1%) |
| 35 to 39 Minutes | 0 (0.0%) | 0 (0.0%) |
| 40 to 44 Minutes | 0 (0.0%) | 3 (4.0%) |
| 45 to 59 Minutes | 19 (21.1%) | 9 (11.8%) |
| 60 to 89 Minutes | 12 (13.3%) | 2 (2.6%) |
| 90 or more Minutes | 0 (0.0%) | 3 (4.0%) |
Time of Departure to Work by Sex in Urich
The most frequent times of departure to work in Urich are 5:00 AM to 5:29 AM (22, 24.4%) for males and 4:00 PM to 11:59 PM (16, 21.0%) for females.
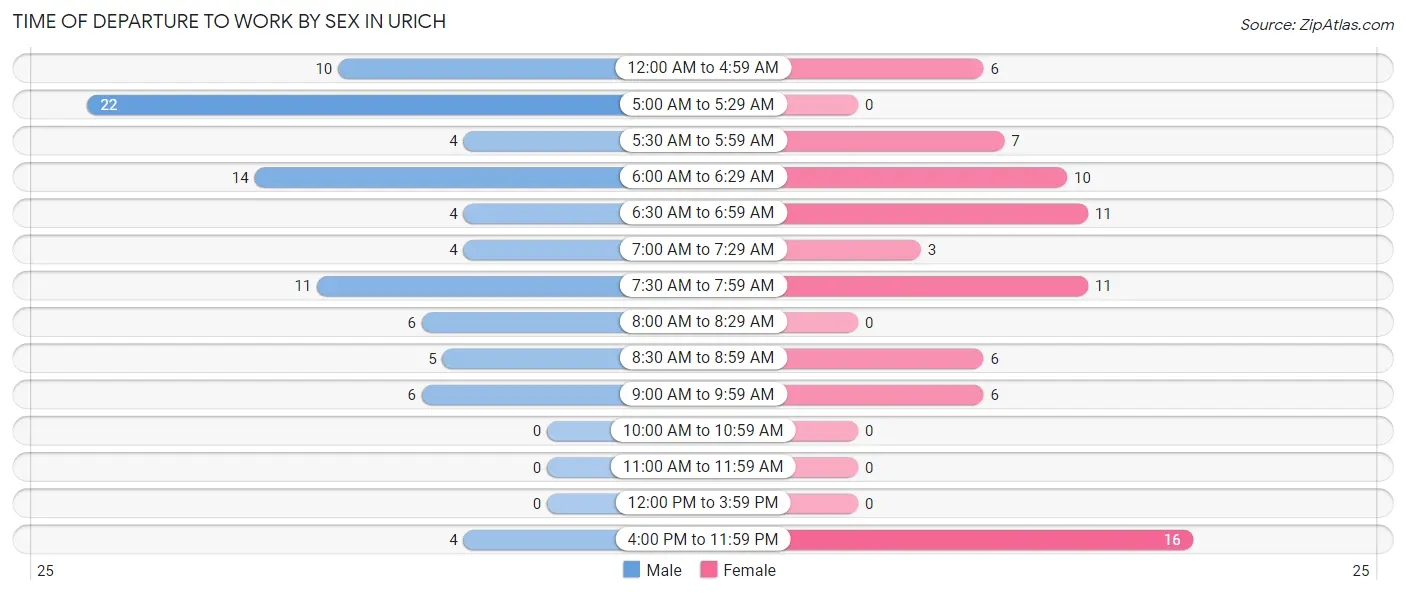
| Time of Departure | Male | Female |
| 12:00 AM to 4:59 AM | 10 (11.1%) | 6 (7.9%) |
| 5:00 AM to 5:29 AM | 22 (24.4%) | 0 (0.0%) |
| 5:30 AM to 5:59 AM | 4 (4.4%) | 7 (9.2%) |
| 6:00 AM to 6:29 AM | 14 (15.6%) | 10 (13.2%) |
| 6:30 AM to 6:59 AM | 4 (4.4%) | 11 (14.5%) |
| 7:00 AM to 7:29 AM | 4 (4.4%) | 3 (4.0%) |
| 7:30 AM to 7:59 AM | 11 (12.2%) | 11 (14.5%) |
| 8:00 AM to 8:29 AM | 6 (6.7%) | 0 (0.0%) |
| 8:30 AM to 8:59 AM | 5 (5.6%) | 6 (7.9%) |
| 9:00 AM to 9:59 AM | 6 (6.7%) | 6 (7.9%) |
| 10:00 AM to 10:59 AM | 0 (0.0%) | 0 (0.0%) |
| 11:00 AM to 11:59 AM | 0 (0.0%) | 0 (0.0%) |
| 12:00 PM to 3:59 PM | 0 (0.0%) | 0 (0.0%) |
| 4:00 PM to 11:59 PM | 4 (4.4%) | 16 (21.0%) |
| Total | 90 (100.0%) | 76 (100.0%) |
Housing Occupancy in Urich
Occupancy by Ownership in Urich
Of the total 162 dwellings in Urich, owner-occupied units account for 119 (73.5%), while renter-occupied units make up 43 (26.5%).
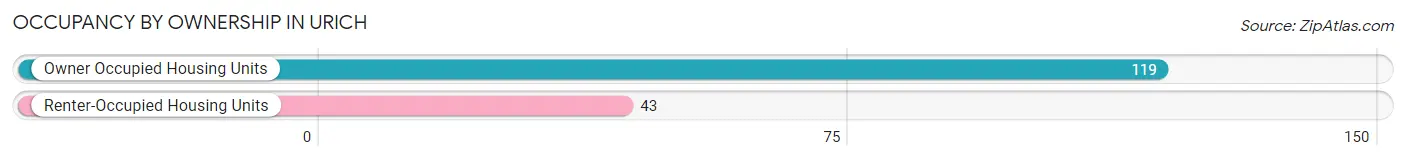
| Occupancy | # Housing Units | % Housing Units |
| Owner Occupied Housing Units | 119 | 73.5% |
| Renter-Occupied Housing Units | 43 | 26.5% |
| Total Occupied Housing Units | 162 | 100.0% |
Occupancy by Household Size in Urich
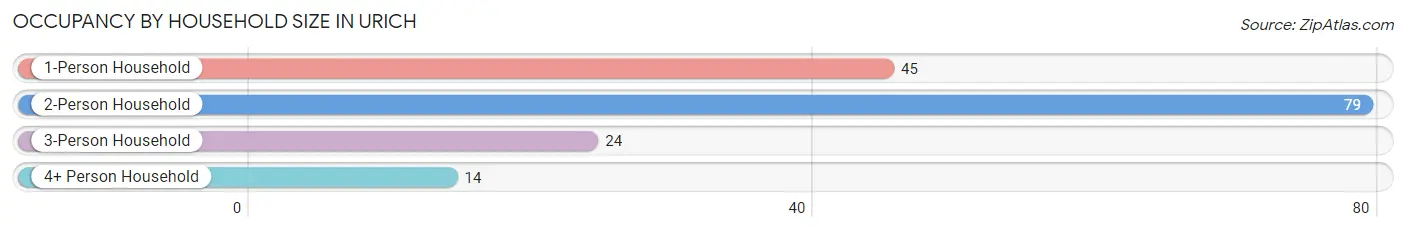
| Household Size | # Housing Units | % Housing Units |
| 1-Person Household | 45 | 27.8% |
| 2-Person Household | 79 | 48.8% |
| 3-Person Household | 24 | 14.8% |
| 4+ Person Household | 14 | 8.6% |
| Total Housing Units | 162 | 100.0% |
Occupancy by Ownership by Household Size in Urich
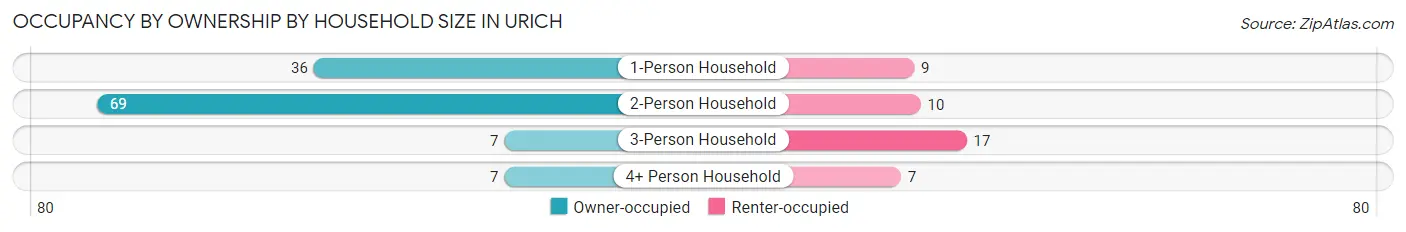
| Household Size | Owner-occupied | Renter-occupied |
| 1-Person Household | 36 (80.0%) | 9 (20.0%) |
| 2-Person Household | 69 (87.3%) | 10 (12.7%) |
| 3-Person Household | 7 (29.2%) | 17 (70.8%) |
| 4+ Person Household | 7 (50.0%) | 7 (50.0%) |
| Total Housing Units | 119 (73.5%) | 43 (26.5%) |
Occupancy by Educational Attainment in Urich
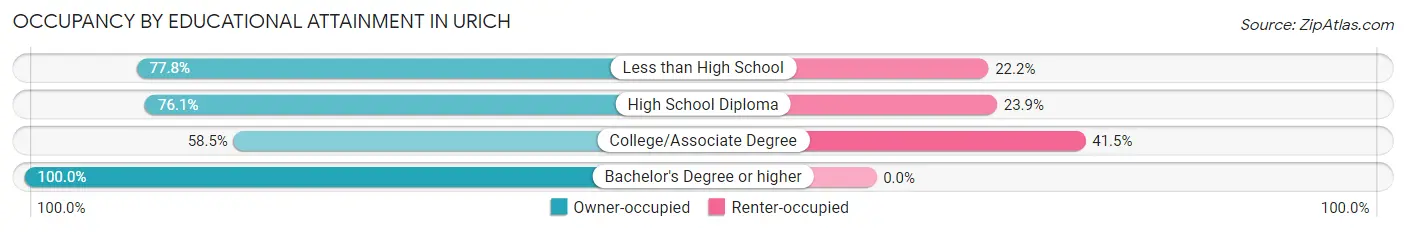
| Household Size | Owner-occupied | Renter-occupied |
| Less than High School | 14 (77.8%) | 4 (22.2%) |
| High School Diploma | 70 (76.1%) | 22 (23.9%) |
| College/Associate Degree | 24 (58.5%) | 17 (41.5%) |
| Bachelor's Degree or higher | 11 (100.0%) | 0 (0.0%) |
Occupancy by Age of Householder in Urich
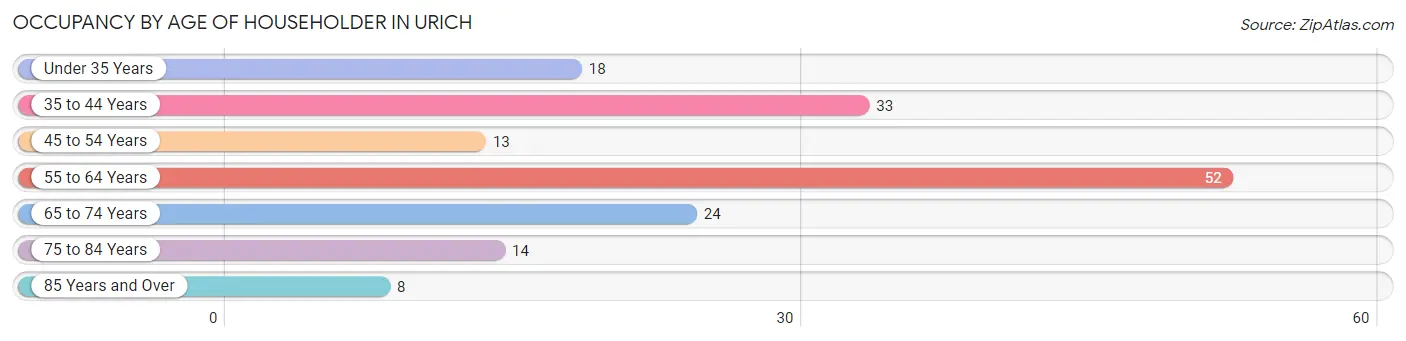
| Age Bracket | # Households | % Households |
| Under 35 Years | 18 | 11.1% |
| 35 to 44 Years | 33 | 20.4% |
| 45 to 54 Years | 13 | 8.0% |
| 55 to 64 Years | 52 | 32.1% |
| 65 to 74 Years | 24 | 14.8% |
| 75 to 84 Years | 14 | 8.6% |
| 85 Years and Over | 8 | 4.9% |
| Total | 162 | 100.0% |
Housing Finances in Urich
Median Income by Occupancy in Urich
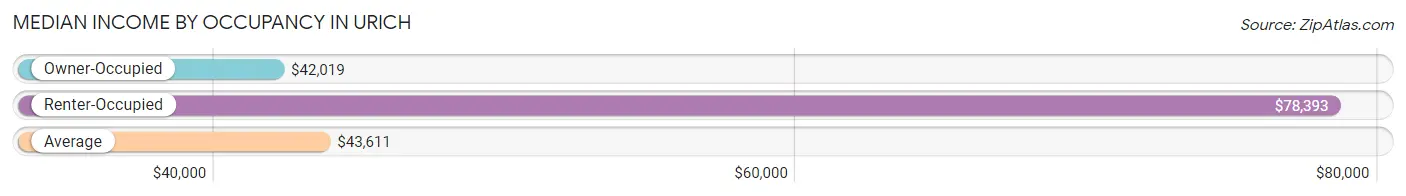
| Occupancy Type | # Households | Median Income |
| Owner-Occupied | 119 (73.5%) | $42,019 |
| Renter-Occupied | 43 (26.5%) | $78,393 |
| Average | 162 (100.0%) | $43,611 |
Occupancy by Householder Income Bracket in Urich
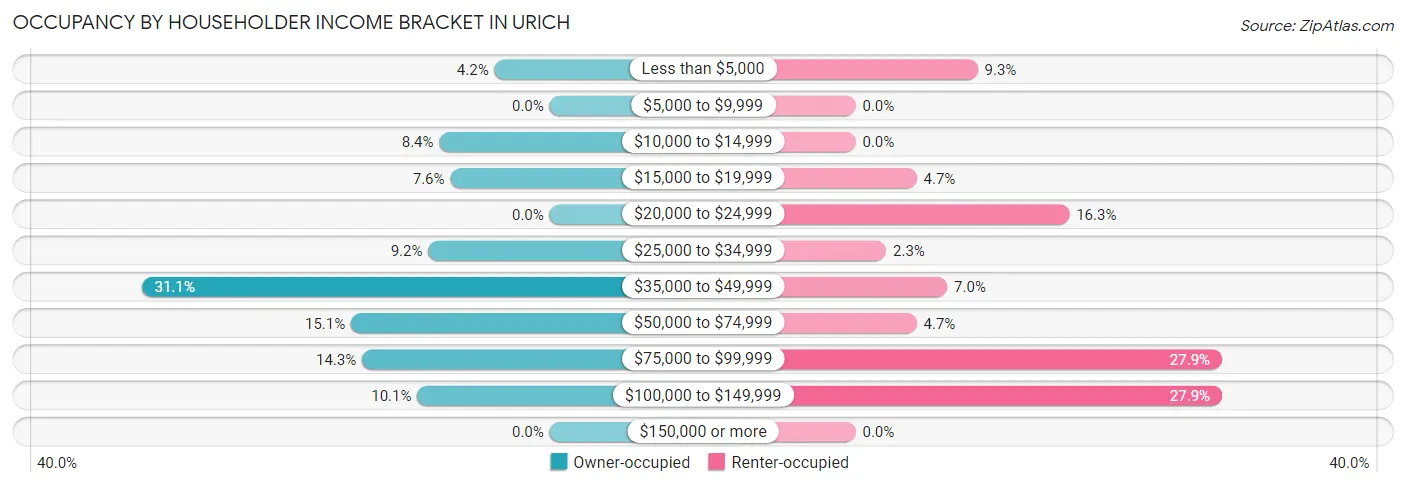
| Income Bracket | Owner-occupied | Renter-occupied |
| Less than $5,000 | 5 (4.2%) | 4 (9.3%) |
| $5,000 to $9,999 | 0 (0.0%) | 0 (0.0%) |
| $10,000 to $14,999 | 10 (8.4%) | 0 (0.0%) |
| $15,000 to $19,999 | 9 (7.6%) | 2 (4.6%) |
| $20,000 to $24,999 | 0 (0.0%) | 7 (16.3%) |
| $25,000 to $34,999 | 11 (9.2%) | 1 (2.3%) |
| $35,000 to $49,999 | 37 (31.1%) | 3 (7.0%) |
| $50,000 to $74,999 | 18 (15.1%) | 2 (4.6%) |
| $75,000 to $99,999 | 17 (14.3%) | 12 (27.9%) |
| $100,000 to $149,999 | 12 (10.1%) | 12 (27.9%) |
| $150,000 or more | 0 (0.0%) | 0 (0.0%) |
| Total | 119 (100.0%) | 43 (100.0%) |
Monthly Housing Cost Tiers in Urich
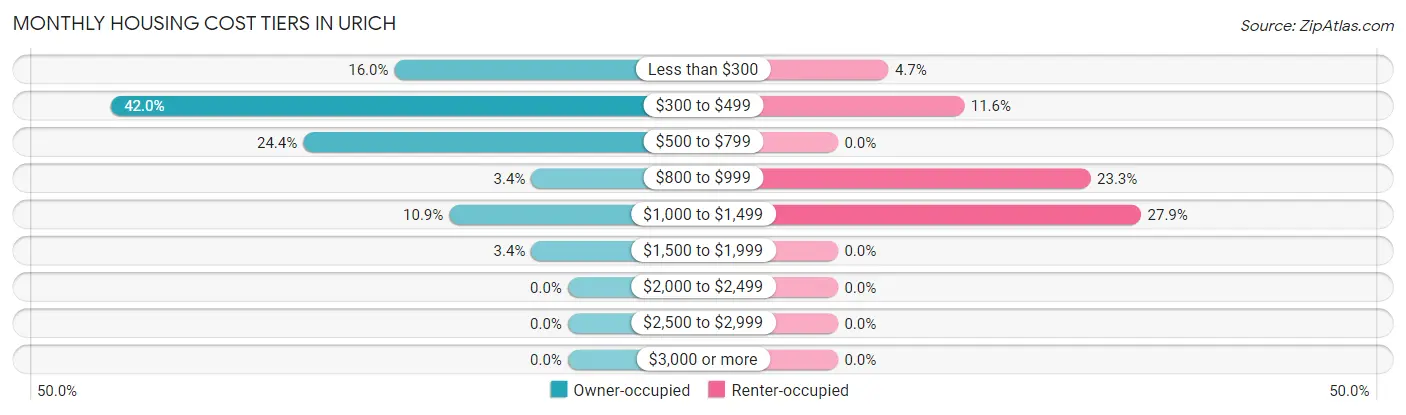
| Monthly Cost | Owner-occupied | Renter-occupied |
| Less than $300 | 19 (16.0%) | 2 (4.6%) |
| $300 to $499 | 50 (42.0%) | 5 (11.6%) |
| $500 to $799 | 29 (24.4%) | 0 (0.0%) |
| $800 to $999 | 4 (3.4%) | 10 (23.3%) |
| $1,000 to $1,499 | 13 (10.9%) | 12 (27.9%) |
| $1,500 to $1,999 | 4 (3.4%) | 0 (0.0%) |
| $2,000 to $2,499 | 0 (0.0%) | 0 (0.0%) |
| $2,500 to $2,999 | 0 (0.0%) | 0 (0.0%) |
| $3,000 or more | 0 (0.0%) | 0 (0.0%) |
| Total | 119 (100.0%) | 43 (100.0%) |
Physical Housing Characteristics in Urich
Housing Structures in Urich
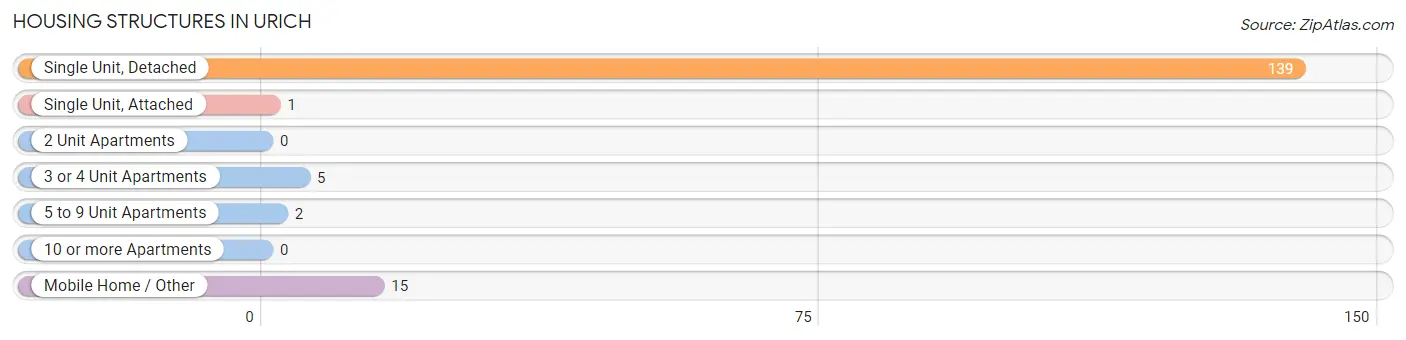
| Structure Type | # Housing Units | % Housing Units |
| Single Unit, Detached | 139 | 85.8% |
| Single Unit, Attached | 1 | 0.6% |
| 2 Unit Apartments | 0 | 0.0% |
| 3 or 4 Unit Apartments | 5 | 3.1% |
| 5 to 9 Unit Apartments | 2 | 1.2% |
| 10 or more Apartments | 0 | 0.0% |
| Mobile Home / Other | 15 | 9.3% |
| Total | 162 | 100.0% |
Housing Structures by Occupancy in Urich
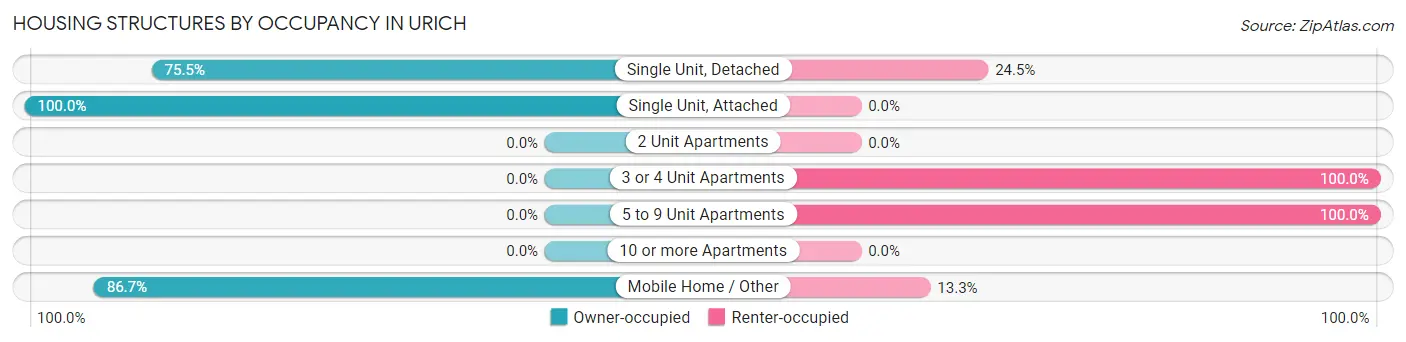
| Structure Type | Owner-occupied | Renter-occupied |
| Single Unit, Detached | 105 (75.5%) | 34 (24.5%) |
| Single Unit, Attached | 1 (100.0%) | 0 (0.0%) |
| 2 Unit Apartments | 0 (0.0%) | 0 (0.0%) |
| 3 or 4 Unit Apartments | 0 (0.0%) | 5 (100.0%) |
| 5 to 9 Unit Apartments | 0 (0.0%) | 2 (100.0%) |
| 10 or more Apartments | 0 (0.0%) | 0 (0.0%) |
| Mobile Home / Other | 13 (86.7%) | 2 (13.3%) |
| Total | 119 (73.5%) | 43 (26.5%) |
Housing Structures by Number of Rooms in Urich
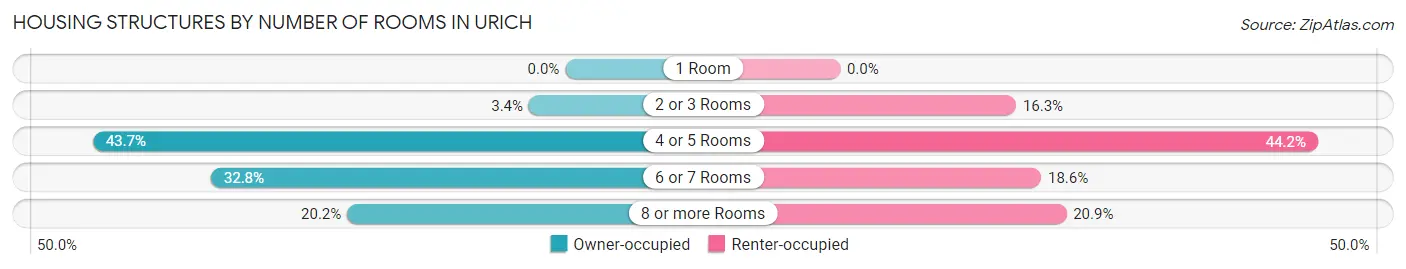
| Number of Rooms | Owner-occupied | Renter-occupied |
| 1 Room | 0 (0.0%) | 0 (0.0%) |
| 2 or 3 Rooms | 4 (3.4%) | 7 (16.3%) |
| 4 or 5 Rooms | 52 (43.7%) | 19 (44.2%) |
| 6 or 7 Rooms | 39 (32.8%) | 8 (18.6%) |
| 8 or more Rooms | 24 (20.2%) | 9 (20.9%) |
| Total | 119 (100.0%) | 43 (100.0%) |
Housing Structure by Heating Type in Urich
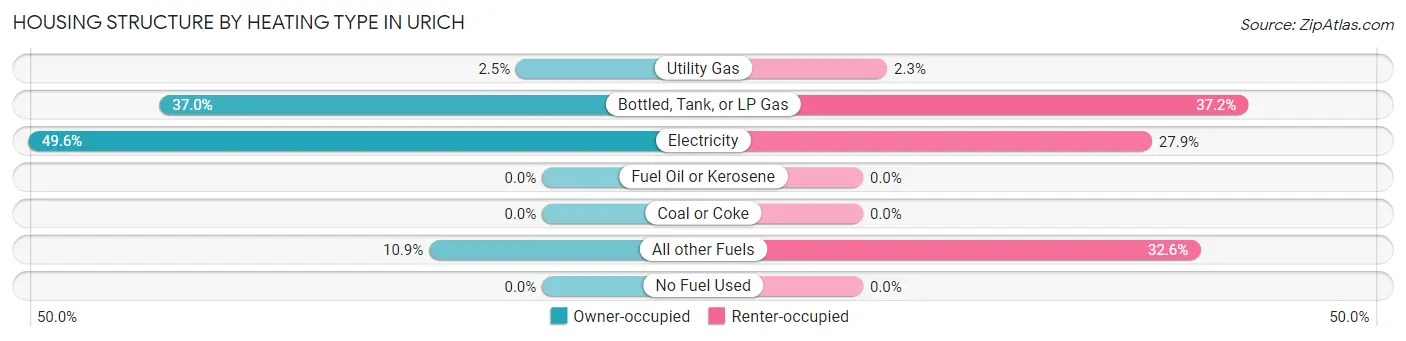
| Heating Type | Owner-occupied | Renter-occupied |
| Utility Gas | 3 (2.5%) | 1 (2.3%) |
| Bottled, Tank, or LP Gas | 44 (37.0%) | 16 (37.2%) |
| Electricity | 59 (49.6%) | 12 (27.9%) |
| Fuel Oil or Kerosene | 0 (0.0%) | 0 (0.0%) |
| Coal or Coke | 0 (0.0%) | 0 (0.0%) |
| All other Fuels | 13 (10.9%) | 14 (32.6%) |
| No Fuel Used | 0 (0.0%) | 0 (0.0%) |
| Total | 119 (100.0%) | 43 (100.0%) |
Household Vehicle Usage in Urich
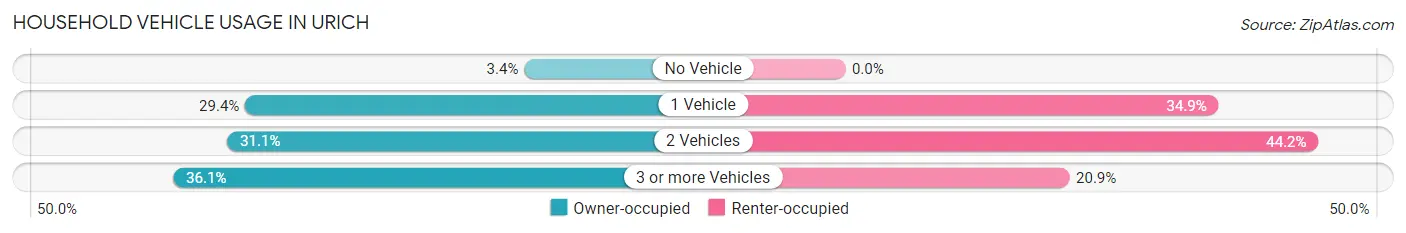
| Vehicles per Household | Owner-occupied | Renter-occupied |
| No Vehicle | 4 (3.4%) | 0 (0.0%) |
| 1 Vehicle | 35 (29.4%) | 15 (34.9%) |
| 2 Vehicles | 37 (31.1%) | 19 (44.2%) |
| 3 or more Vehicles | 43 (36.1%) | 9 (20.9%) |
| Total | 119 (100.0%) | 43 (100.0%) |
Real Estate & Mortgages in Urich
Real Estate and Mortgage Overview in Urich
| Characteristic | Without Mortgage | With Mortgage |
| Housing Units | 80 | 39 |
| Median Property Value | $51,800 | $73,800 |
| Median Household Income | $40,909 | $0 |
| Monthly Housing Costs | $382 | $0 |
| Real Estate Taxes | $680 | $0 |
Property Value by Mortgage Status in Urich
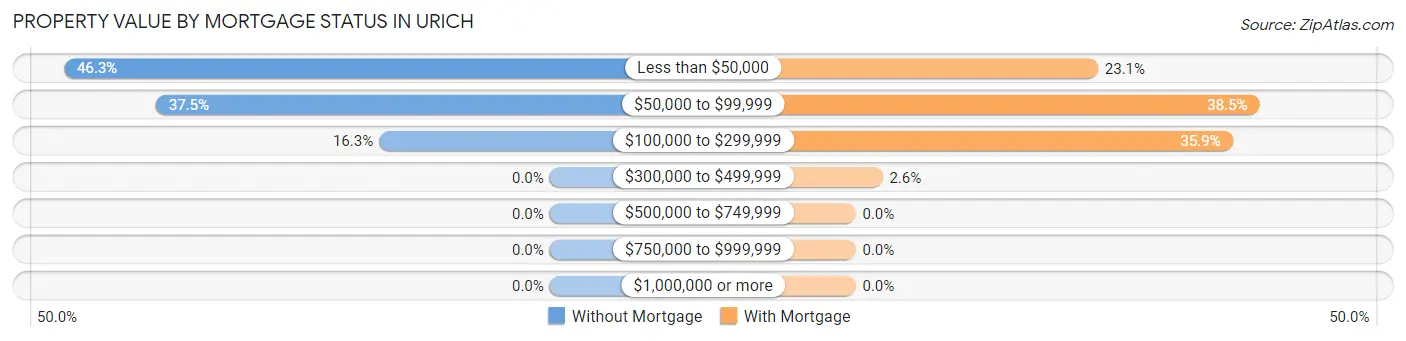
| Property Value | Without Mortgage | With Mortgage |
| Less than $50,000 | 37 (46.3%) | 9 (23.1%) |
| $50,000 to $99,999 | 30 (37.5%) | 15 (38.5%) |
| $100,000 to $299,999 | 13 (16.3%) | 14 (35.9%) |
| $300,000 to $499,999 | 0 (0.0%) | 1 (2.6%) |
| $500,000 to $749,999 | 0 (0.0%) | 0 (0.0%) |
| $750,000 to $999,999 | 0 (0.0%) | 0 (0.0%) |
| $1,000,000 or more | 0 (0.0%) | 0 (0.0%) |
| Total | 80 (100.0%) | 39 (100.0%) |
Household Income by Mortgage Status in Urich
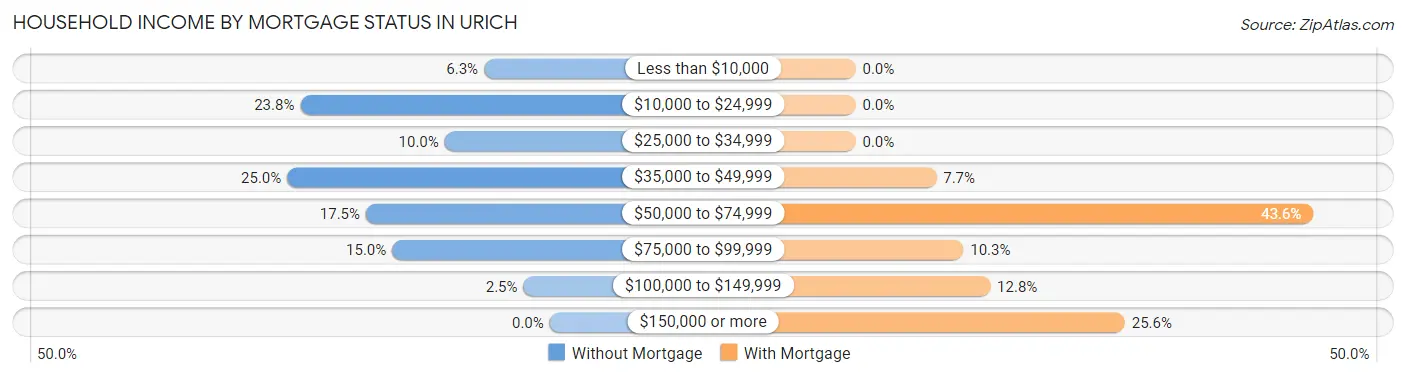
| Household Income | Without Mortgage | With Mortgage |
| Less than $10,000 | 5 (6.2%) | 0 (0.0%) |
| $10,000 to $24,999 | 19 (23.7%) | 0 (0.0%) |
| $25,000 to $34,999 | 8 (10.0%) | 0 (0.0%) |
| $35,000 to $49,999 | 20 (25.0%) | 3 (7.7%) |
| $50,000 to $74,999 | 14 (17.5%) | 17 (43.6%) |
| $75,000 to $99,999 | 12 (15.0%) | 4 (10.3%) |
| $100,000 to $149,999 | 2 (2.5%) | 5 (12.8%) |
| $150,000 or more | 0 (0.0%) | 10 (25.6%) |
| Total | 80 (100.0%) | 39 (100.0%) |
Property Value to Household Income Ratio in Urich
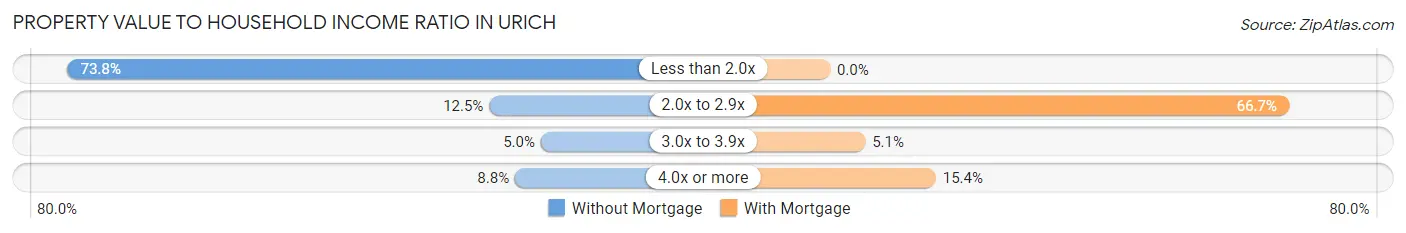
| Value-to-Income Ratio | Without Mortgage | With Mortgage |
| Less than 2.0x | 59 (73.8%) | 0 (0.0%) |
| 2.0x to 2.9x | 10 (12.5%) | 26 (66.7%) |
| 3.0x to 3.9x | 4 (5.0%) | 2 (5.1%) |
| 4.0x or more | 7 (8.7%) | 6 (15.4%) |
| Total | 80 (100.0%) | 39 (100.0%) |
Real Estate Taxes by Mortgage Status in Urich
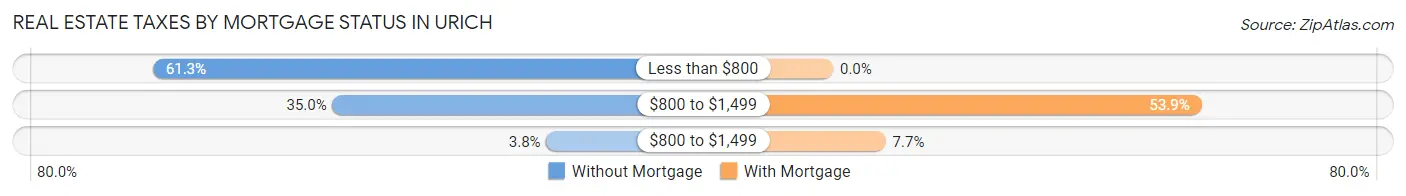
| Property Taxes | Without Mortgage | With Mortgage |
| Less than $800 | 49 (61.3%) | 0 (0.0%) |
| $800 to $1,499 | 28 (35.0%) | 21 (53.8%) |
| $800 to $1,499 | 3 (3.7%) | 3 (7.7%) |
| Total | 80 (100.0%) | 39 (100.0%) |
Health & Disability in Urich
Health Insurance Coverage by Age in Urich
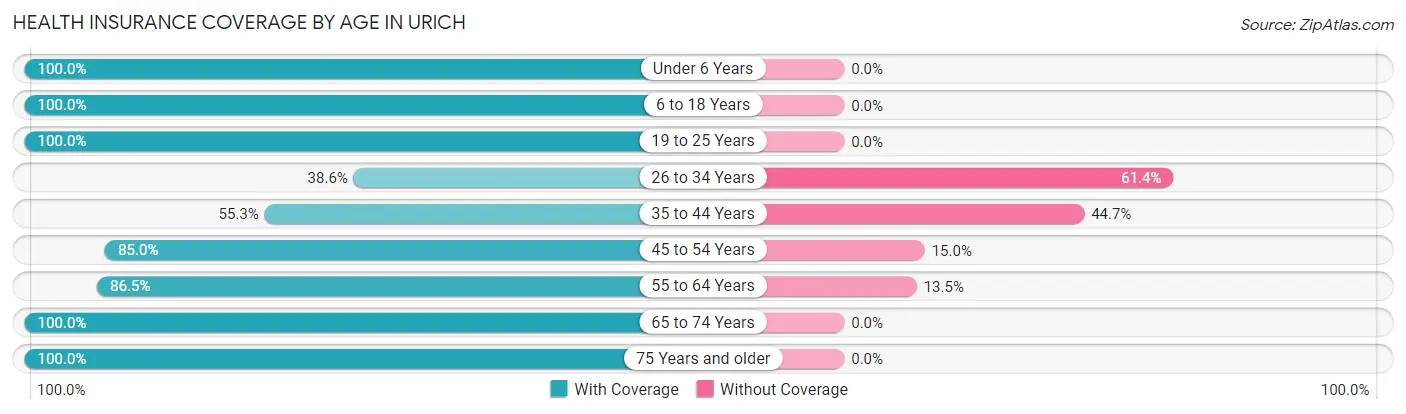
| Age Bracket | With Coverage | Without Coverage |
| Under 6 Years | 13 (100.0%) | 0 (0.0%) |
| 6 to 18 Years | 47 (100.0%) | 0 (0.0%) |
| 19 to 25 Years | 24 (100.0%) | 0 (0.0%) |
| 26 to 34 Years | 17 (38.6%) | 27 (61.4%) |
| 35 to 44 Years | 21 (55.3%) | 17 (44.7%) |
| 45 to 54 Years | 34 (85.0%) | 6 (15.0%) |
| 55 to 64 Years | 64 (86.5%) | 10 (13.5%) |
| 65 to 74 Years | 41 (100.0%) | 0 (0.0%) |
| 75 Years and older | 31 (100.0%) | 0 (0.0%) |
| Total | 292 (83.0%) | 60 (17.1%) |
Health Insurance Coverage by Citizenship Status in Urich
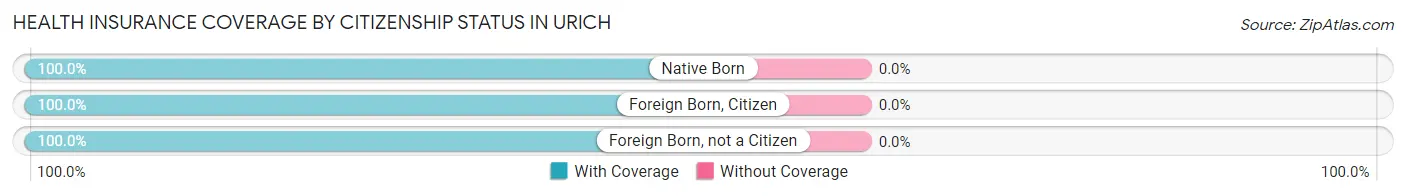
| Citizenship Status | With Coverage | Without Coverage |
| Native Born | 13 (100.0%) | 0 (0.0%) |
| Foreign Born, Citizen | 47 (100.0%) | 0 (0.0%) |
| Foreign Born, not a Citizen | 24 (100.0%) | 0 (0.0%) |
Health Insurance Coverage by Household Income in Urich
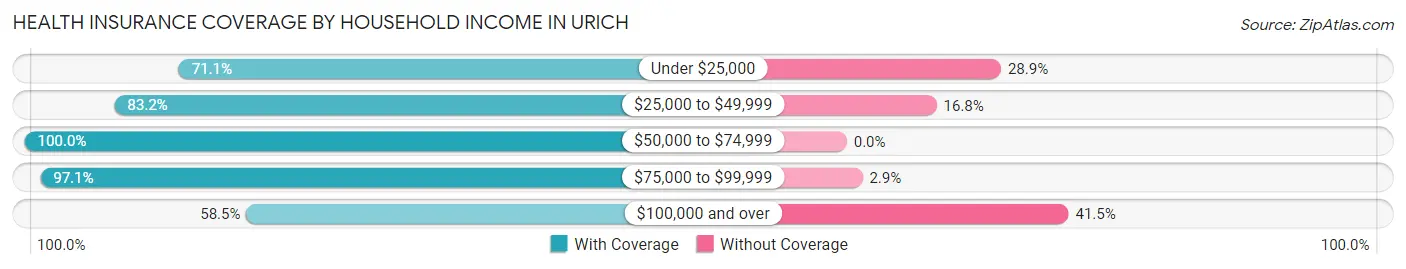
| Household Income | With Coverage | Without Coverage |
| Under $25,000 | 32 (71.1%) | 13 (28.9%) |
| $25,000 to $49,999 | 84 (83.2%) | 17 (16.8%) |
| $50,000 to $74,999 | 39 (100.0%) | 0 (0.0%) |
| $75,000 to $99,999 | 99 (97.1%) | 3 (2.9%) |
| $100,000 and over | 38 (58.5%) | 27 (41.5%) |
Public vs Private Health Insurance Coverage by Age in Urich
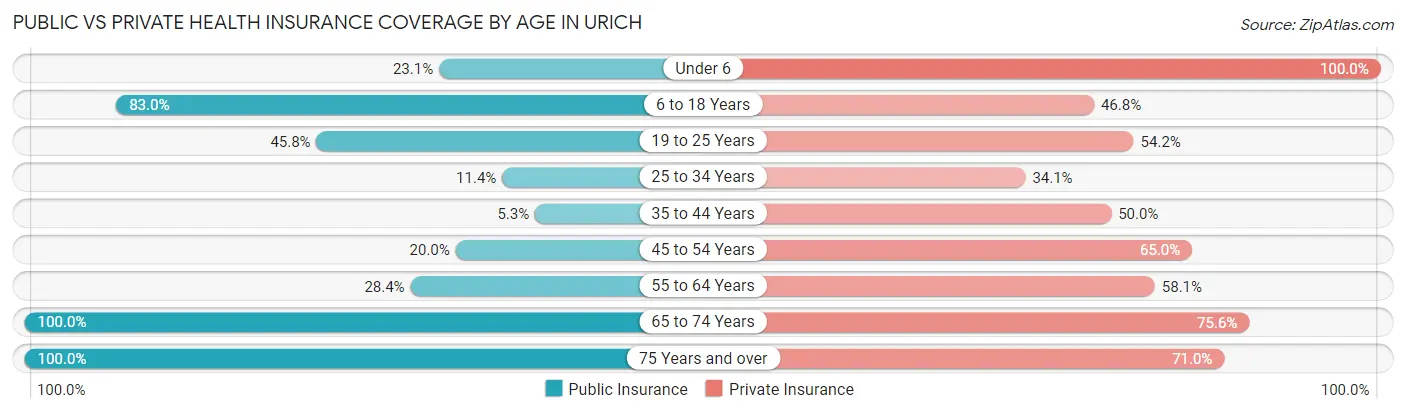
| Age Bracket | Public Insurance | Private Insurance |
| Under 6 | 3 (23.1%) | 13 (100.0%) |
| 6 to 18 Years | 39 (83.0%) | 22 (46.8%) |
| 19 to 25 Years | 11 (45.8%) | 13 (54.2%) |
| 25 to 34 Years | 5 (11.4%) | 15 (34.1%) |
| 35 to 44 Years | 2 (5.3%) | 19 (50.0%) |
| 45 to 54 Years | 8 (20.0%) | 26 (65.0%) |
| 55 to 64 Years | 21 (28.4%) | 43 (58.1%) |
| 65 to 74 Years | 41 (100.0%) | 31 (75.6%) |
| 75 Years and over | 31 (100.0%) | 22 (71.0%) |
| Total | 161 (45.7%) | 204 (58.0%) |
Disability Status by Sex by Age in Urich
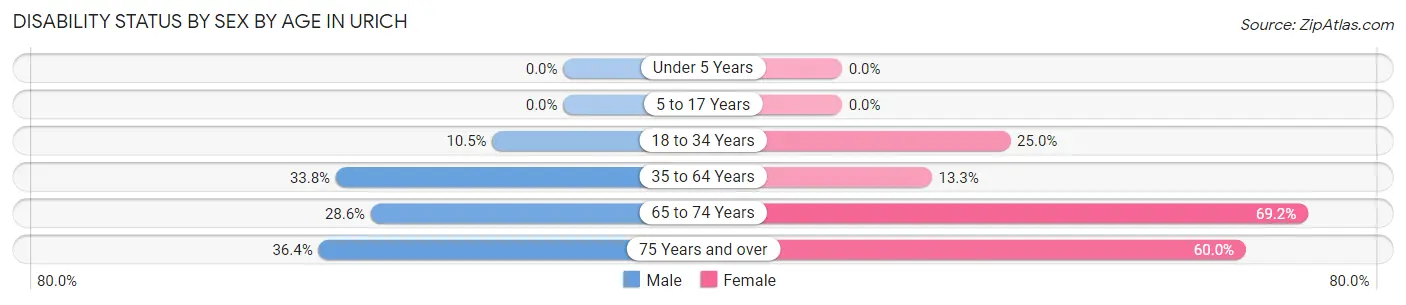
| Age Bracket | Male | Female |
| Under 5 Years | 0 (0.0%) | 0 (0.0%) |
| 5 to 17 Years | 0 (0.0%) | 0 (0.0%) |
| 18 to 34 Years | 4 (10.5%) | 8 (25.0%) |
| 35 to 64 Years | 26 (33.8%) | 10 (13.3%) |
| 65 to 74 Years | 8 (28.6%) | 9 (69.2%) |
| 75 Years and over | 4 (36.4%) | 12 (60.0%) |
Disability Class by Sex by Age in Urich
Disability Class: Hearing Difficulty
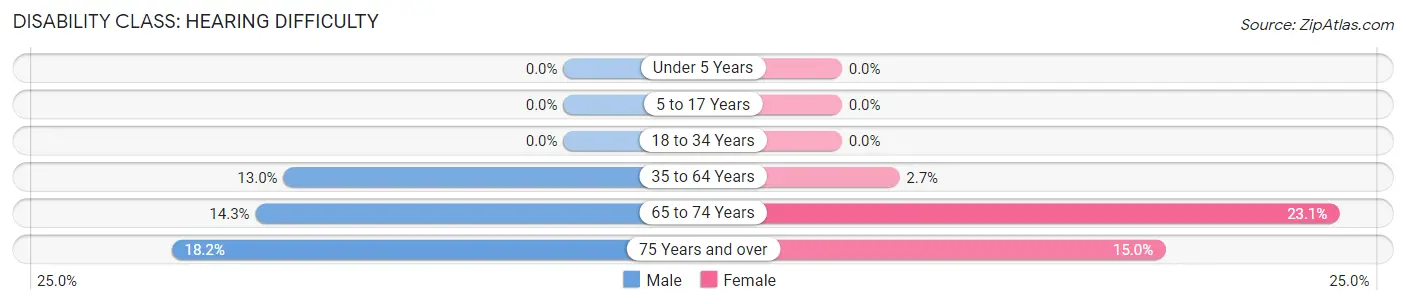
| Age Bracket | Male | Female |
| Under 5 Years | 0 (0.0%) | 0 (0.0%) |
| 5 to 17 Years | 0 (0.0%) | 0 (0.0%) |
| 18 to 34 Years | 0 (0.0%) | 0 (0.0%) |
| 35 to 64 Years | 10 (13.0%) | 2 (2.7%) |
| 65 to 74 Years | 4 (14.3%) | 3 (23.1%) |
| 75 Years and over | 2 (18.2%) | 3 (15.0%) |
Disability Class: Vision Difficulty
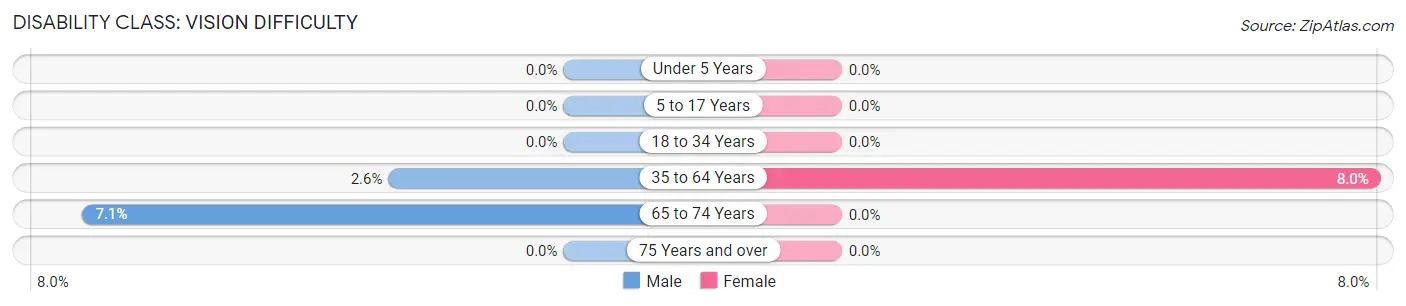
| Age Bracket | Male | Female |
| Under 5 Years | 0 (0.0%) | 0 (0.0%) |
| 5 to 17 Years | 0 (0.0%) | 0 (0.0%) |
| 18 to 34 Years | 0 (0.0%) | 0 (0.0%) |
| 35 to 64 Years | 2 (2.6%) | 6 (8.0%) |
| 65 to 74 Years | 2 (7.1%) | 0 (0.0%) |
| 75 Years and over | 0 (0.0%) | 0 (0.0%) |
Disability Class: Cognitive Difficulty
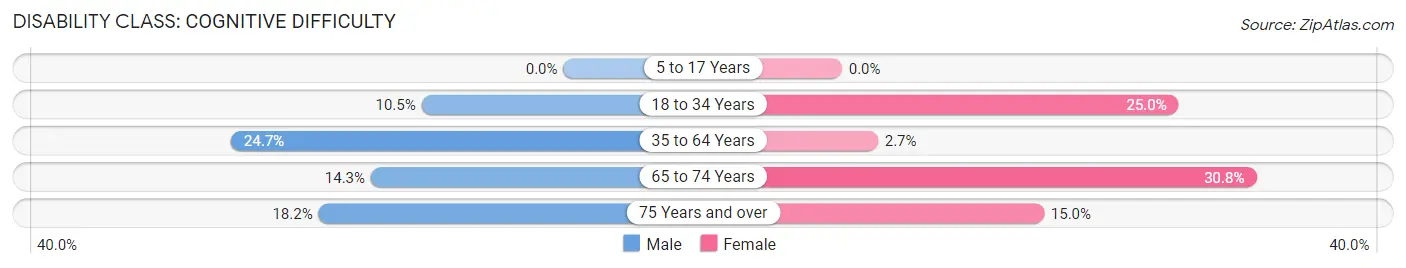
| Age Bracket | Male | Female |
| 5 to 17 Years | 0 (0.0%) | 0 (0.0%) |
| 18 to 34 Years | 4 (10.5%) | 8 (25.0%) |
| 35 to 64 Years | 19 (24.7%) | 2 (2.7%) |
| 65 to 74 Years | 4 (14.3%) | 4 (30.8%) |
| 75 Years and over | 2 (18.2%) | 3 (15.0%) |
Disability Class: Ambulatory Difficulty
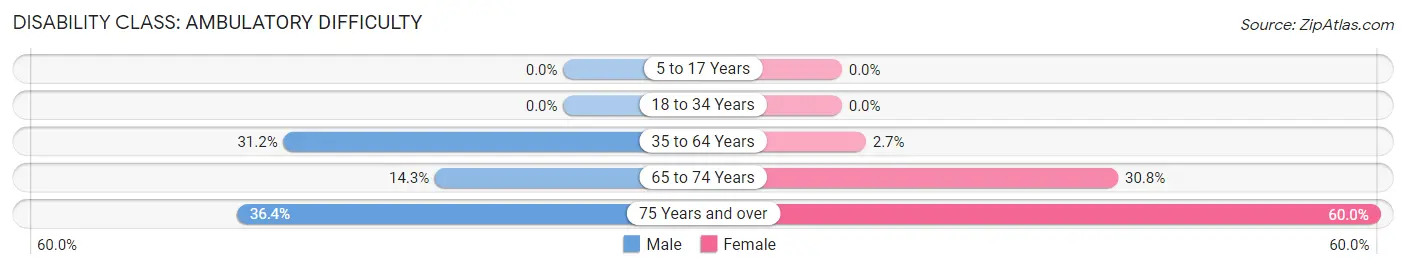
| Age Bracket | Male | Female |
| 5 to 17 Years | 0 (0.0%) | 0 (0.0%) |
| 18 to 34 Years | 0 (0.0%) | 0 (0.0%) |
| 35 to 64 Years | 24 (31.2%) | 2 (2.7%) |
| 65 to 74 Years | 4 (14.3%) | 4 (30.8%) |
| 75 Years and over | 4 (36.4%) | 12 (60.0%) |
Disability Class: Self-Care Difficulty
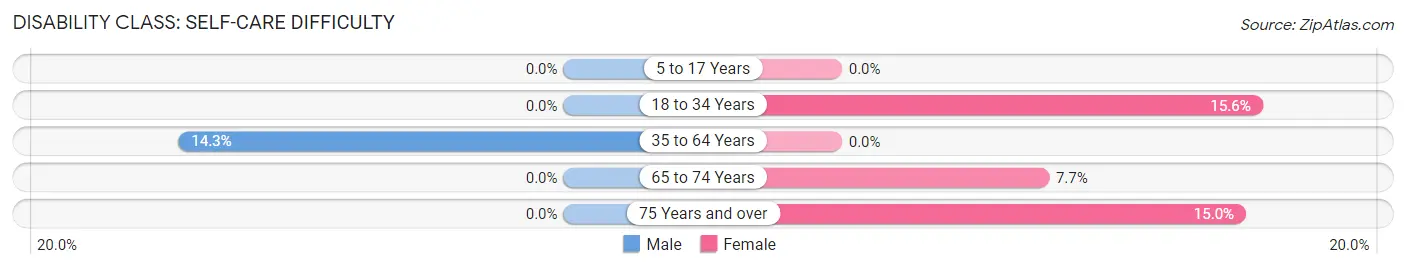
| Age Bracket | Male | Female |
| 5 to 17 Years | 0 (0.0%) | 0 (0.0%) |
| 18 to 34 Years | 0 (0.0%) | 5 (15.6%) |
| 35 to 64 Years | 11 (14.3%) | 0 (0.0%) |
| 65 to 74 Years | 0 (0.0%) | 1 (7.7%) |
| 75 Years and over | 0 (0.0%) | 3 (15.0%) |
Technology Access in Urich
Computing Device Access in Urich
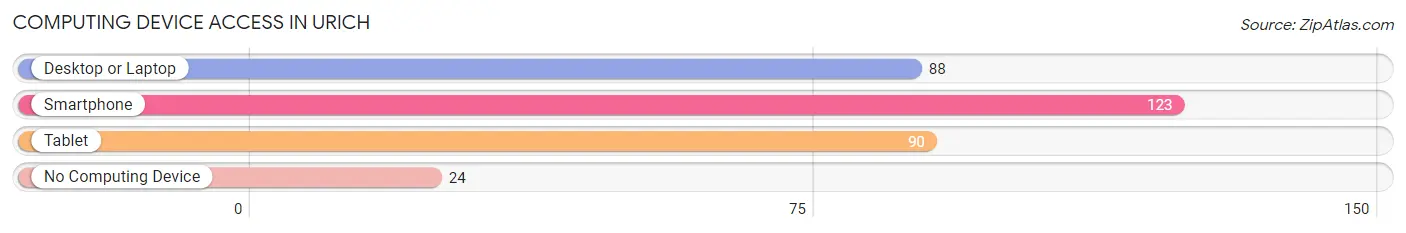
| Device Type | # Households | % Households |
| Desktop or Laptop | 88 | 54.3% |
| Smartphone | 123 | 75.9% |
| Tablet | 90 | 55.6% |
| No Computing Device | 24 | 14.8% |
| Total | 162 | 100.0% |
Internet Access in Urich
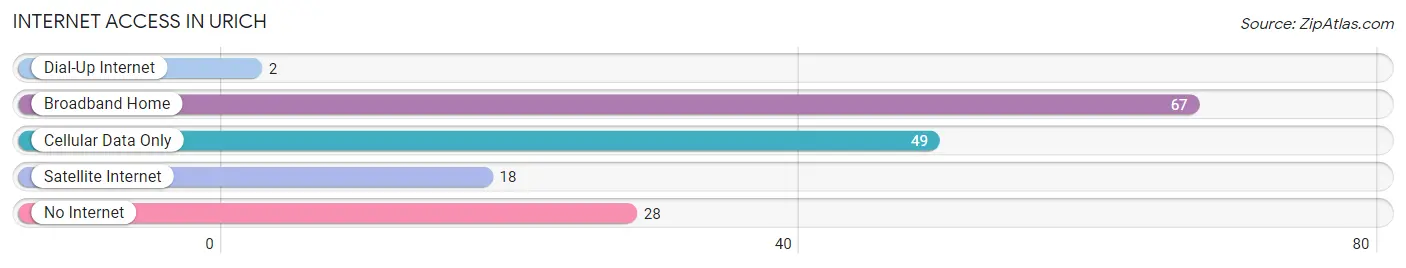
| Internet Type | # Households | % Households |
| Dial-Up Internet | 2 | 1.2% |
| Broadband Home | 67 | 41.4% |
| Cellular Data Only | 49 | 30.2% |
| Satellite Internet | 18 | 11.1% |
| No Internet | 28 | 17.3% |
| Total | 162 | 100.0% |
Urich Summary
Urich is a small city located in Henry County, Missouri. It is situated in the western part of the state, about 40 miles south of Kansas City. The city has a population of approximately 1,000 people and is part of the larger metropolitan area of Kansas City.
History
Urich was founded in 1871 by a group of settlers from Ohio. The city was named after a local settler, John Urich, who had a large farm in the area. The city was incorporated in 1876 and quickly grew to become a thriving agricultural community. The city was home to a variety of businesses, including a flour mill, a sawmill, a blacksmith shop, and a general store.
In the early 1900s, Urich began to experience a period of growth and development. The city was home to a variety of industries, including a brickyard, a canning factory, and a furniture factory. The city also had a number of churches, schools, and other civic organizations.
In the 1950s, Urich experienced a period of decline as many of its industries closed or moved away. The city was also affected by the Great Depression and World War II. However, the city was able to rebound in the 1960s and 1970s, thanks to the growth of the nearby Kansas City metropolitan area.
Geography
Urich is located in western Missouri, about 40 miles south of Kansas City. The city is situated in the Missouri River Valley, which is part of the larger Ozark Plateau. The city is surrounded by rolling hills and is home to a variety of wildlife, including deer, turkey, and quail.
The climate in Urich is generally mild, with hot summers and cold winters. The average annual temperature is around 55 degrees Fahrenheit. The city receives an average of 40 inches of precipitation each year.
Economy
Urich’s economy is largely based on agriculture. The city is home to a variety of farms, including dairy, beef, and poultry farms. The city is also home to a number of small businesses, including restaurants, retail stores, and service providers.
The city is also home to a number of manufacturing companies, including a furniture factory and a canning factory. The city is also home to a number of educational institutions, including a community college and a vocational school.
Demographics
As of the 2010 census, the population of Urich was 1,000 people. The racial makeup of the city was 97.2% White, 0.7% African American, 0.3% Native American, 0.2% Asian, and 1.6% from other races. The median household income was $37,500, and the median age was 40.
Urich is a small city with a rich history and a diverse economy. The city is home to a variety of businesses, educational institutions, and civic organizations. The city is also home to a variety of wildlife and is surrounded by rolling hills and the Missouri River Valley.
Common Questions
What is Per Capita Income in Urich?
Per Capita income in Urich is $26,925.
What is the Median Family Income in Urich?
Median Family Income in Urich is $54,306.
What is the Median Household income in Urich?
Median Household Income in Urich is $43,611.
What is Income or Wage Gap in Urich?
Income or Wage Gap in Urich is 13.7%.
Women in Urich earn 86.3 cents for every dollar earned by a man.
What is Inequality or Gini Index in Urich?
Inequality or Gini Index in Urich is 0.38.
What is the Total Population of Urich?
Total Population of Urich is 352.
What is the Total Male Population of Urich?
Total Male Population of Urich is 170.
What is the Total Female Population of Urich?
Total Female Population of Urich is 182.
What is the Ratio of Males per 100 Females in Urich?
There are 93.41 Males per 100 Females in Urich.
What is the Ratio of Females per 100 Males in Urich?
There are 107.06 Females per 100 Males in Urich.
What is the Median Population Age in Urich?
Median Population Age in Urich is 48.3 Years.
What is the Average Family Size in Urich
Average Family Size in Urich is 2.4 People.
What is the Average Household Size in Urich
Average Household Size in Urich is 2.2 People.
How Large is the Labor Force in Urich?
There are 186 People in the Labor Forcein in Urich.
What is the Percentage of People in the Labor Force in Urich?
59.2% of People are in the Labor Force in Urich.
What is the Unemployment Rate in Urich?
Unemployment Rate in Urich is 8.1%.