Tarkio, MO Map & Demographics
Tarkio Map
Tarkio Overview
$31,471
PER CAPITA INCOME
$64,783
AVG FAMILY INCOME
$56,875
AVG HOUSEHOLD INCOME
15.7%
WAGE / INCOME GAP [ % ]
84.3¢/ $1
WAGE / INCOME GAP [ $ ]
0.42
INEQUALITY / GINI INDEX
1,473
TOTAL POPULATION
739
MALE POPULATION
734
FEMALE POPULATION
100.68
MALES / 100 FEMALES
99.32
FEMALES / 100 MALES
45.3
MEDIAN AGE
2.8
AVG FAMILY SIZE
2.1
AVG HOUSEHOLD SIZE
752
LABOR FORCE [ PEOPLE ]
60.9%
PERCENT IN LABOR FORCE
2.8%
UNEMPLOYMENT RATE
Tarkio Zip Codes
Tarkio Area Codes
Income in Tarkio
Income Overview in Tarkio
Per Capita Income in Tarkio is $31,471, while median incomes of families and households are $64,783 and $56,875 respectively.
| Characteristic | Number | Measure |
| Per Capita Income | 1,473 | $31,471 |
| Median Family Income | 372 | $64,783 |
| Mean Family Income | 372 | $78,318 |
| Median Household Income | 664 | $56,875 |
| Mean Household Income | 664 | $66,012 |
| Income Deficit | 372 | $0 |
| Wage / Income Gap (%) | 1,473 | 15.72% |
| Wage / Income Gap ($) | 1,473 | 84.28¢ per $1 |
| Gini / Inequality Index | 1,473 | 0.42 |
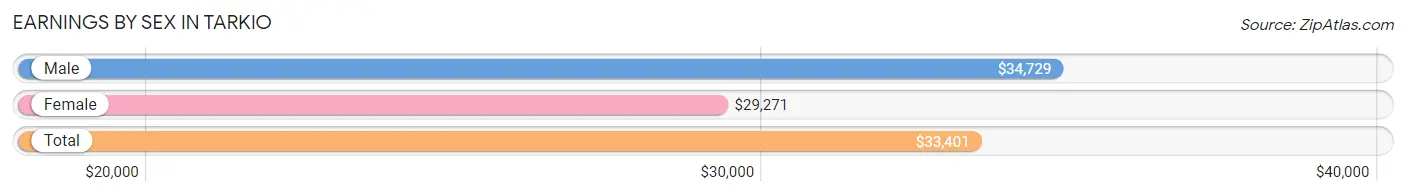
Earnings by Sex in Tarkio
Average Earnings in Tarkio are $33,401, $34,729 for men and $29,271 for women, a difference of 15.7%.
| Sex | Number | Average Earnings |
| Male | 457 (57.4%) | $34,729 |
| Female | 339 (42.6%) | $29,271 |
| Total | 796 (100.0%) | $33,401 |
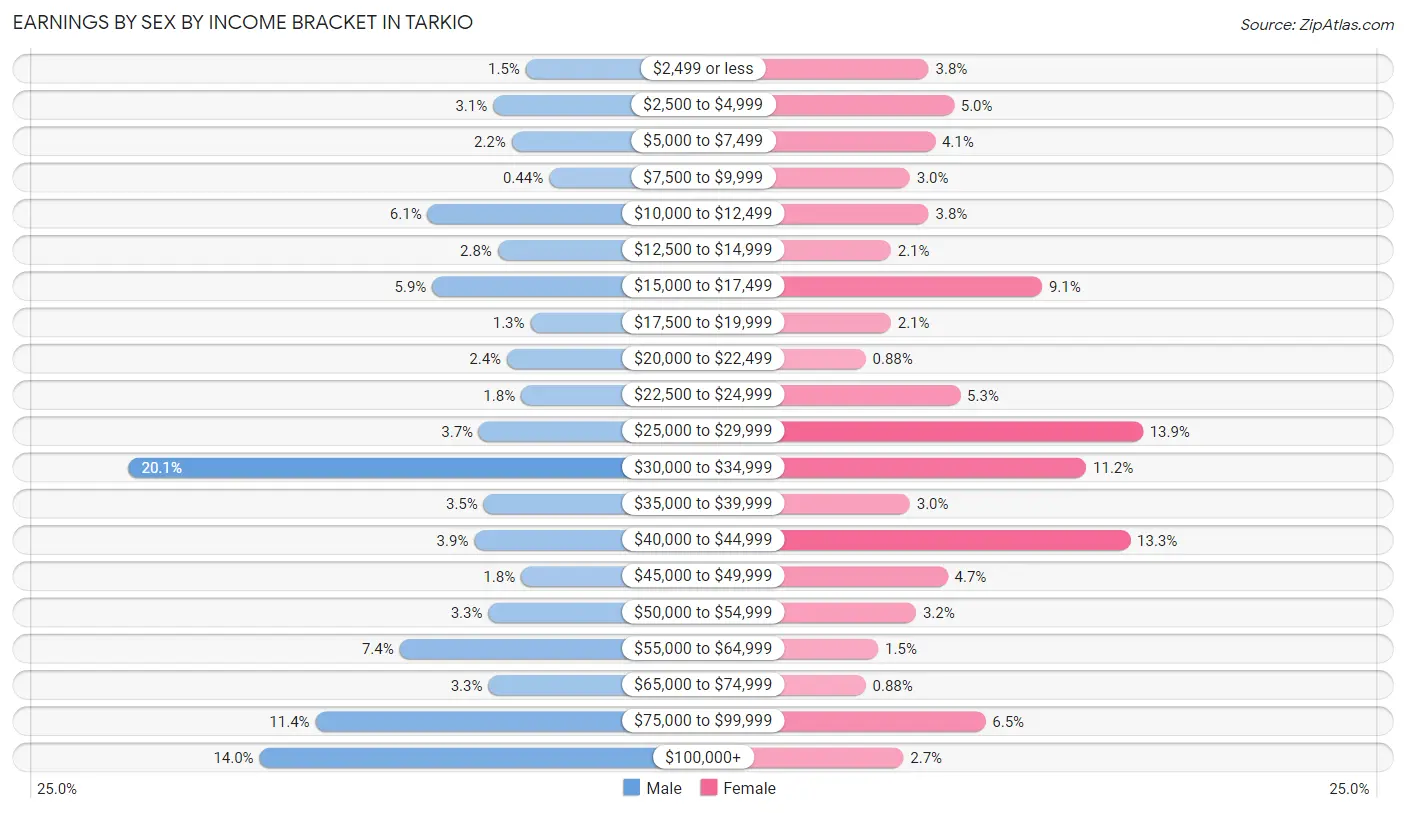
Earnings by Sex by Income Bracket in Tarkio
The most common earnings brackets in Tarkio are $30,000 to $34,999 for men (92 | 20.1%) and $25,000 to $29,999 for women (47 | 13.9%).
| Income | Male | Female |
| $2,499 or less | 7 (1.5%) | 13 (3.8%) |
| $2,500 to $4,999 | 14 (3.1%) | 17 (5.0%) |
| $5,000 to $7,499 | 10 (2.2%) | 14 (4.1%) |
| $7,500 to $9,999 | 2 (0.4%) | 10 (2.9%) |
| $10,000 to $12,499 | 28 (6.1%) | 13 (3.8%) |
| $12,500 to $14,999 | 13 (2.8%) | 7 (2.1%) |
| $15,000 to $17,499 | 27 (5.9%) | 31 (9.1%) |
| $17,500 to $19,999 | 6 (1.3%) | 7 (2.1%) |
| $20,000 to $22,499 | 11 (2.4%) | 3 (0.9%) |
| $22,500 to $24,999 | 8 (1.8%) | 18 (5.3%) |
| $25,000 to $29,999 | 17 (3.7%) | 47 (13.9%) |
| $30,000 to $34,999 | 92 (20.1%) | 38 (11.2%) |
| $35,000 to $39,999 | 16 (3.5%) | 10 (2.9%) |
| $40,000 to $44,999 | 18 (3.9%) | 45 (13.3%) |
| $45,000 to $49,999 | 8 (1.8%) | 16 (4.7%) |
| $50,000 to $54,999 | 15 (3.3%) | 11 (3.2%) |
| $55,000 to $64,999 | 34 (7.4%) | 5 (1.5%) |
| $65,000 to $74,999 | 15 (3.3%) | 3 (0.9%) |
| $75,000 to $99,999 | 52 (11.4%) | 22 (6.5%) |
| $100,000+ | 64 (14.0%) | 9 (2.6%) |
| Total | 457 (100.0%) | 339 (100.0%) |
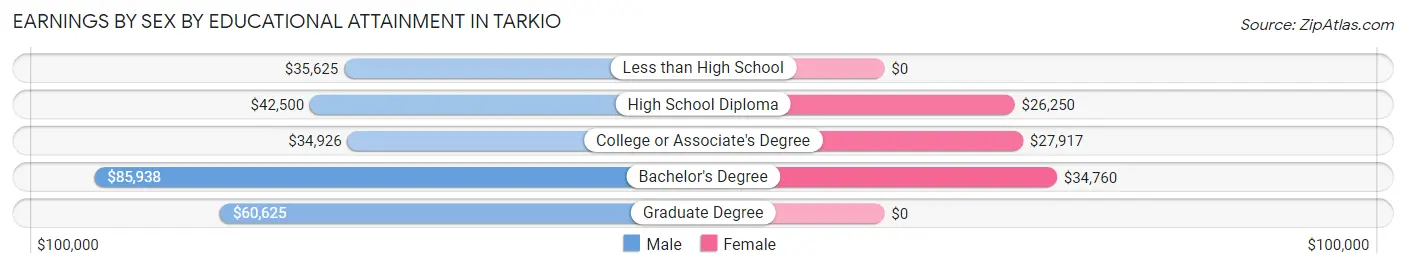
Earnings by Sex by Educational Attainment in Tarkio
Average earnings in Tarkio are $49,000 for men and $30,000 for women, a difference of 38.8%. Men with an educational attainment of bachelor's degree enjoy the highest average annual earnings of $85,938, while those with college or associate's degree education earn the least with $34,926. Women with an educational attainment of bachelor's degree earn the most with the average annual earnings of $34,760, while those with high school diploma education have the smallest earnings of $26,250.
| Educational Attainment | Male Income | Female Income |
| Less than High School | $35,625 | $0 |
| High School Diploma | $42,500 | $26,250 |
| College or Associate's Degree | $34,926 | $27,917 |
| Bachelor's Degree | $85,938 | $34,760 |
| Graduate Degree | $60,625 | $0 |
| Total | $49,000 | $30,000 |
Family Income in Tarkio
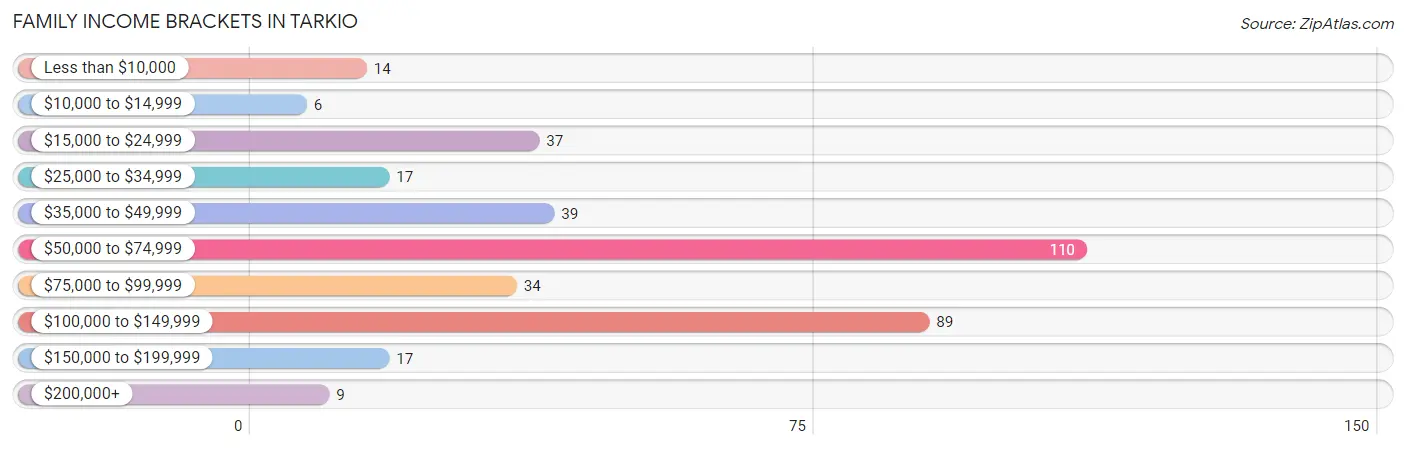
Family Income Brackets in Tarkio
According to the Tarkio family income data, there are 110 families falling into the $50,000 to $74,999 income range, which is the most common income bracket and makes up 29.6% of all families. Conversely, the $10,000 to $14,999 income bracket is the least frequent group with only 6 families (1.6%) belonging to this category.
| Income Bracket | # Families | % Families |
| Less than $10,000 | 14 | 3.8% |
| $10,000 to $14,999 | 6 | 1.6% |
| $15,000 to $24,999 | 37 | 9.9% |
| $25,000 to $34,999 | 17 | 4.6% |
| $35,000 to $49,999 | 39 | 10.5% |
| $50,000 to $74,999 | 110 | 29.6% |
| $75,000 to $99,999 | 34 | 9.1% |
| $100,000 to $149,999 | 89 | 23.9% |
| $150,000 to $199,999 | 17 | 4.6% |
| $200,000+ | 9 | 2.4% |
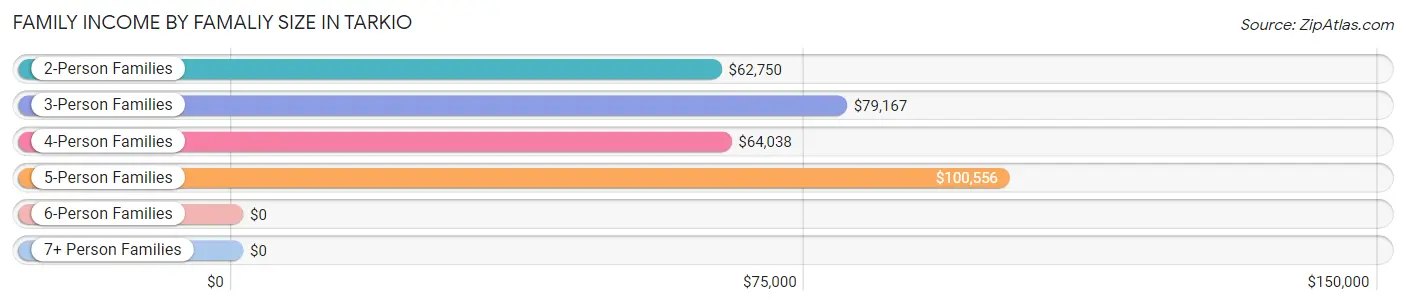
Family Income by Famaliy Size in Tarkio
5-person families (32 | 8.6%) account for the highest median family income in Tarkio with $100,556 per family, while 2-person families (252 | 67.7%) have the highest median income of $31,375 per family member.
| Income Bracket | # Families | Median Income |
| 2-Person Families | 252 (67.7%) | $62,750 |
| 3-Person Families | 42 (11.3%) | $79,167 |
| 4-Person Families | 38 (10.2%) | $64,038 |
| 5-Person Families | 32 (8.6%) | $100,556 |
| 6-Person Families | 8 (2.1%) | $0 |
| 7+ Person Families | 0 (0.0%) | $0 |
| Total | 372 (100.0%) | $64,783 |
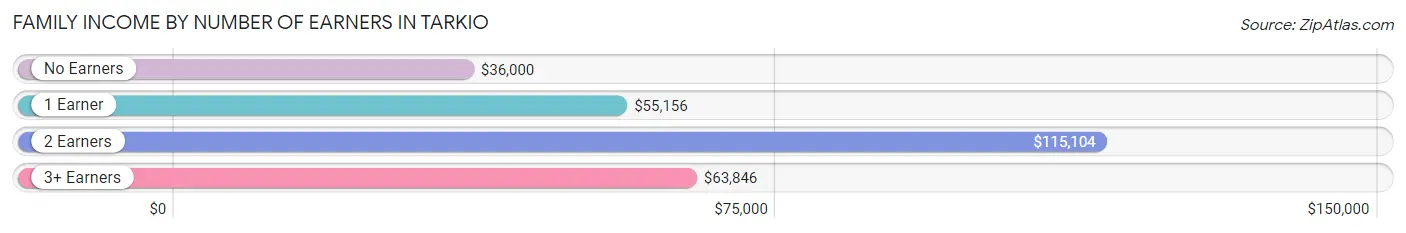
Family Income by Number of Earners in Tarkio
The median family income in Tarkio is $64,783, with families comprising 2 earners (159) having the highest median family income of $115,104, while families with no earners (62) have the lowest median family income of $36,000, accounting for 42.7% and 16.7% of families, respectively.
| Number of Earners | # Families | Median Income |
| No Earners | 62 (16.7%) | $36,000 |
| 1 Earner | 133 (35.7%) | $55,156 |
| 2 Earners | 159 (42.7%) | $115,104 |
| 3+ Earners | 18 (4.8%) | $63,846 |
| Total | 372 (100.0%) | $64,783 |
Household Income in Tarkio
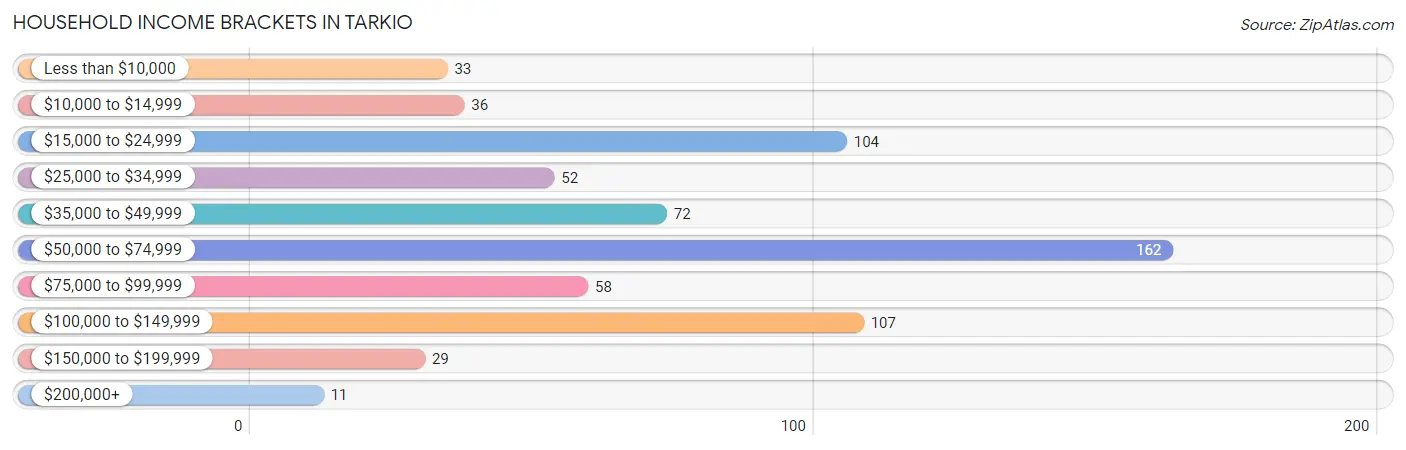
Household Income Brackets in Tarkio
With 162 households falling in the category, the $50,000 to $74,999 income range is the most frequent in Tarkio, accounting for 24.4% of all households. In contrast, only 11 households (1.7%) fall into the $200,000+ income bracket, making it the least populous group.
| Income Bracket | # Households | % Households |
| Less than $10,000 | 33 | 5.0% |
| $10,000 to $14,999 | 36 | 5.4% |
| $15,000 to $24,999 | 104 | 15.7% |
| $25,000 to $34,999 | 52 | 7.8% |
| $35,000 to $49,999 | 72 | 10.8% |
| $50,000 to $74,999 | 162 | 24.4% |
| $75,000 to $99,999 | 58 | 8.7% |
| $100,000 to $149,999 | 107 | 16.1% |
| $150,000 to $199,999 | 29 | 4.4% |
| $200,000+ | 11 | 1.7% |
Household Income by Householder Age in Tarkio
The median household income in Tarkio is $56,875, with the highest median household income of $78,594 found in the 25 to 44 years age bracket for the primary householder. A total of 189 households (28.5%) fall into this category. Meanwhile, the 15 to 24 years age bracket for the primary householder has the lowest median household income of $28,482, with 53 households (8.0%) in this group.
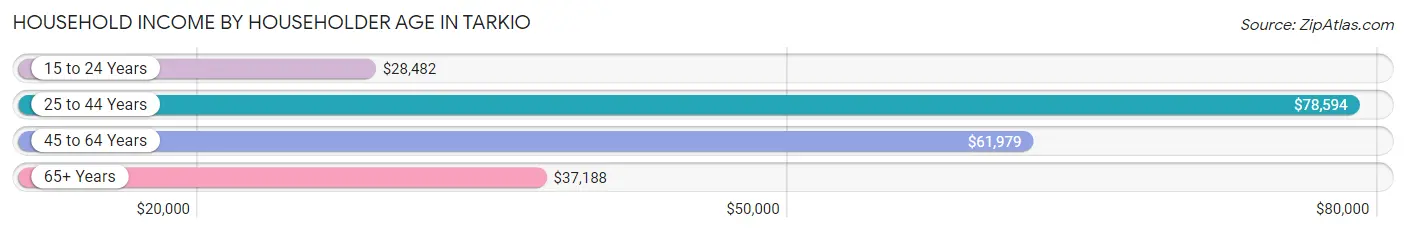
| Income Bracket | # Households | Median Income |
| 15 to 24 Years | 53 (8.0%) | $28,482 |
| 25 to 44 Years | 189 (28.5%) | $78,594 |
| 45 to 64 Years | 189 (28.5%) | $61,979 |
| 65+ Years | 233 (35.1%) | $37,188 |
| Total | 664 (100.0%) | $56,875 |
Poverty in Tarkio
Income Below Poverty by Sex and Age in Tarkio
With 14.3% poverty level for males and 18.6% for females among the residents of Tarkio, 15 year old males and 6 to 11 year old females are the most vulnerable to poverty, with 8 males (72.7%) and 14 females (29.8%) in their respective age groups living below the poverty level.
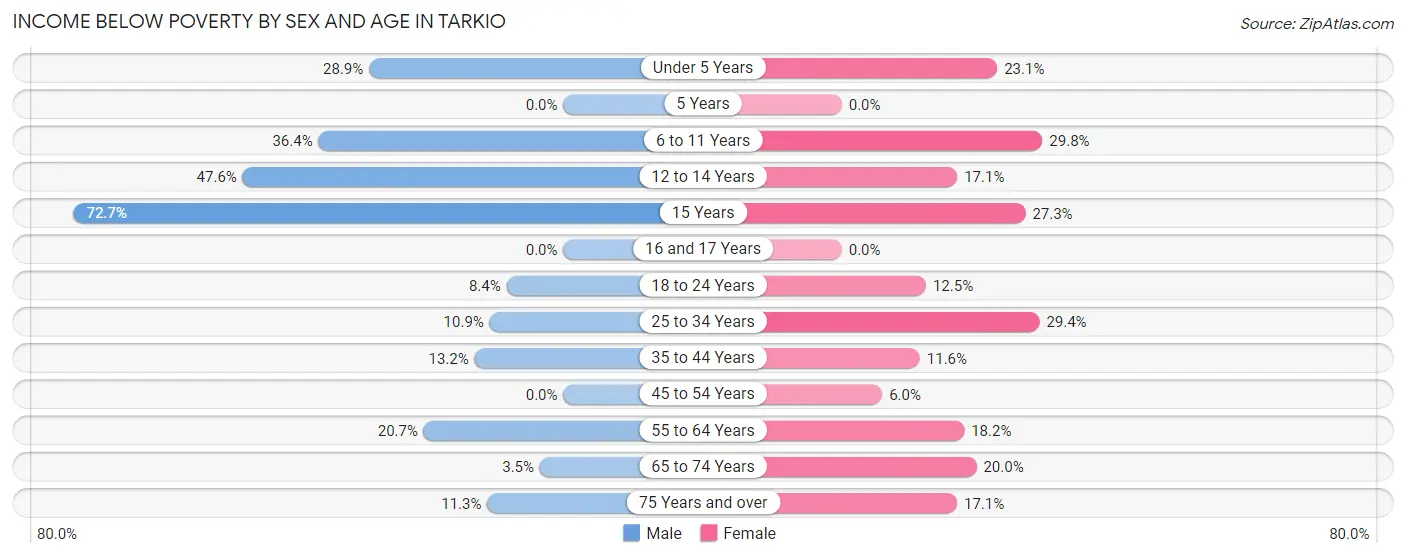
| Age Bracket | Male | Female |
| Under 5 Years | 15 (28.8%) | 6 (23.1%) |
| 5 Years | 0 (0.0%) | 0 (0.0%) |
| 6 to 11 Years | 12 (36.4%) | 14 (29.8%) |
| 12 to 14 Years | 10 (47.6%) | 6 (17.1%) |
| 15 Years | 8 (72.7%) | 3 (27.3%) |
| 16 and 17 Years | 0 (0.0%) | 0 (0.0%) |
| 18 to 24 Years | 7 (8.4%) | 9 (12.5%) |
| 25 to 34 Years | 7 (10.9%) | 27 (29.3%) |
| 35 to 44 Years | 12 (13.2%) | 8 (11.6%) |
| 45 to 54 Years | 0 (0.0%) | 3 (6.0%) |
| 55 to 64 Years | 23 (20.7%) | 20 (18.2%) |
| 65 to 74 Years | 3 (3.5%) | 18 (20.0%) |
| 75 Years and over | 7 (11.3%) | 19 (17.1%) |
| Total | 104 (14.3%) | 133 (18.6%) |
Income Above Poverty by Sex and Age in Tarkio
According to the poverty statistics in Tarkio, males aged 16 and 17 years and females aged 16 and 17 years are the age groups that are most secure financially, with 100.0% of males and 100.0% of females in these age groups living above the poverty line.
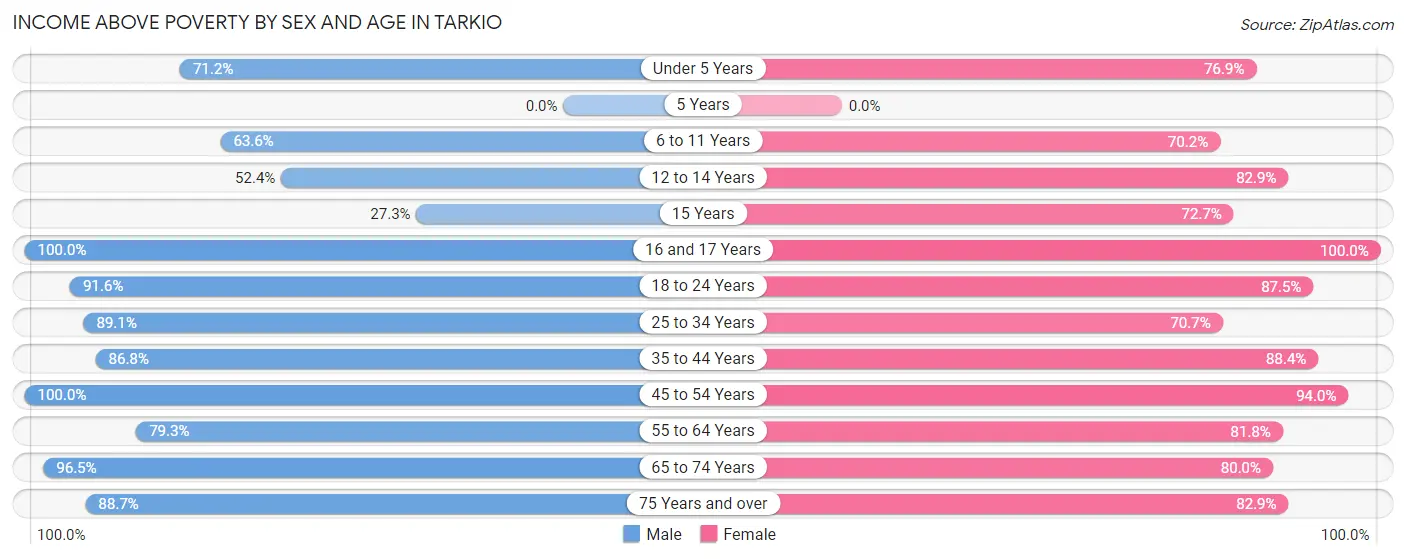
| Age Bracket | Male | Female |
| Under 5 Years | 37 (71.2%) | 20 (76.9%) |
| 5 Years | 0 (0.0%) | 0 (0.0%) |
| 6 to 11 Years | 21 (63.6%) | 33 (70.2%) |
| 12 to 14 Years | 11 (52.4%) | 29 (82.9%) |
| 15 Years | 3 (27.3%) | 8 (72.7%) |
| 16 and 17 Years | 25 (100.0%) | 2 (100.0%) |
| 18 to 24 Years | 76 (91.6%) | 63 (87.5%) |
| 25 to 34 Years | 57 (89.1%) | 65 (70.7%) |
| 35 to 44 Years | 79 (86.8%) | 61 (88.4%) |
| 45 to 54 Years | 86 (100.0%) | 47 (94.0%) |
| 55 to 64 Years | 88 (79.3%) | 90 (81.8%) |
| 65 to 74 Years | 83 (96.5%) | 72 (80.0%) |
| 75 Years and over | 55 (88.7%) | 92 (82.9%) |
| Total | 621 (85.7%) | 582 (81.4%) |
Income Below Poverty Among Married-Couple Families in Tarkio
The poverty statistics for married-couple families in Tarkio show that 7.8% or 22 of the total 283 families live below the poverty line. Families with no children have the highest poverty rate of 10.5%, comprising of 22 families. On the other hand, families with 1 or 2 children have the lowest poverty rate of 0.0%, which includes 0 families.
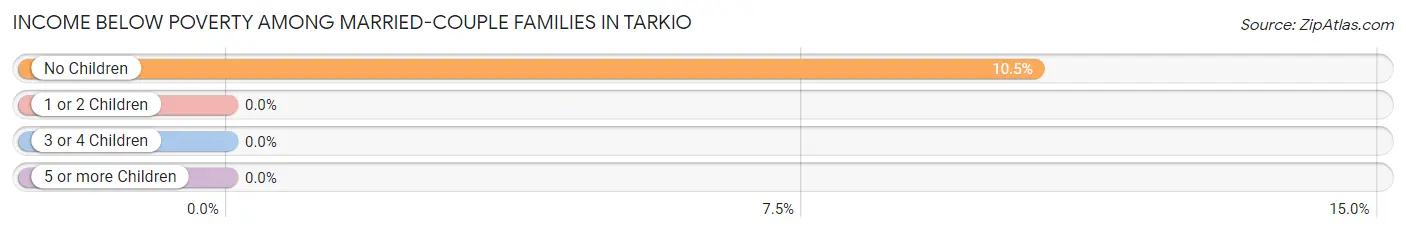
| Children | Above Poverty | Below Poverty |
| No Children | 187 (89.5%) | 22 (10.5%) |
| 1 or 2 Children | 56 (100.0%) | 0 (0.0%) |
| 3 or 4 Children | 18 (100.0%) | 0 (0.0%) |
| 5 or more Children | 0 (0.0%) | 0 (0.0%) |
| Total | 261 (92.2%) | 22 (7.8%) |
Income Below Poverty Among Single-Parent Households in Tarkio
According to the poverty data in Tarkio, 18.2% or 6 single-father households and 41.1% or 23 single-mother households are living below the poverty line. Among single-father households, those with 3 or 4 children have the highest poverty rate, with 6 households (100.0%) experiencing poverty. Likewise, among single-mother households, those with 3 or 4 children have the highest poverty rate, with 14 households (100.0%) falling below the poverty line.
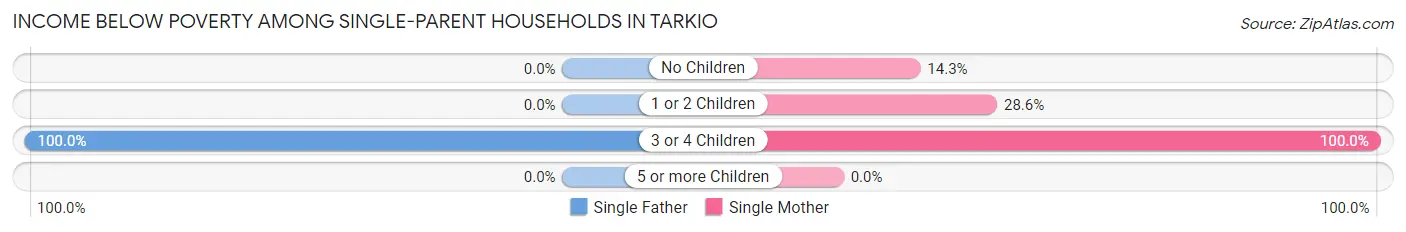
| Children | Single Father | Single Mother |
| No Children | 0 (0.0%) | 3 (14.3%) |
| 1 or 2 Children | 0 (0.0%) | 6 (28.6%) |
| 3 or 4 Children | 6 (100.0%) | 14 (100.0%) |
| 5 or more Children | 0 (0.0%) | 0 (0.0%) |
| Total | 6 (18.2%) | 23 (41.1%) |
Income Below Poverty Among Married-Couple vs Single-Parent Households in Tarkio
The poverty data for Tarkio shows that 22 of the married-couple family households (7.8%) and 29 of the single-parent households (32.6%) are living below the poverty level. Within the married-couple family households, those with no children have the highest poverty rate, with 22 households (10.5%) falling below the poverty line. Among the single-parent households, those with 3 or 4 children have the highest poverty rate, with 20 household (100.0%) living below poverty.
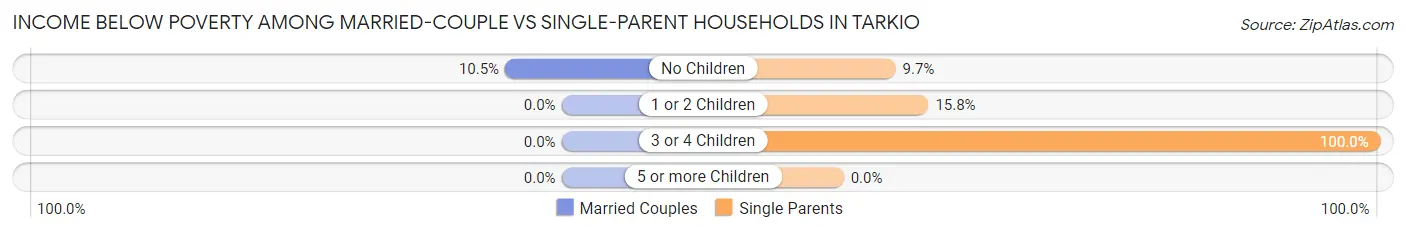
| Children | Married-Couple Families | Single-Parent Households |
| No Children | 22 (10.5%) | 3 (9.7%) |
| 1 or 2 Children | 0 (0.0%) | 6 (15.8%) |
| 3 or 4 Children | 0 (0.0%) | 20 (100.0%) |
| 5 or more Children | 0 (0.0%) | 0 (0.0%) |
| Total | 22 (7.8%) | 29 (32.6%) |
Race in Tarkio
The most populous races in Tarkio are White / Caucasian (1,377 | 93.5%), Two or more Races (73 | 5.0%), and Hispanic or Latino (31 | 2.1%).
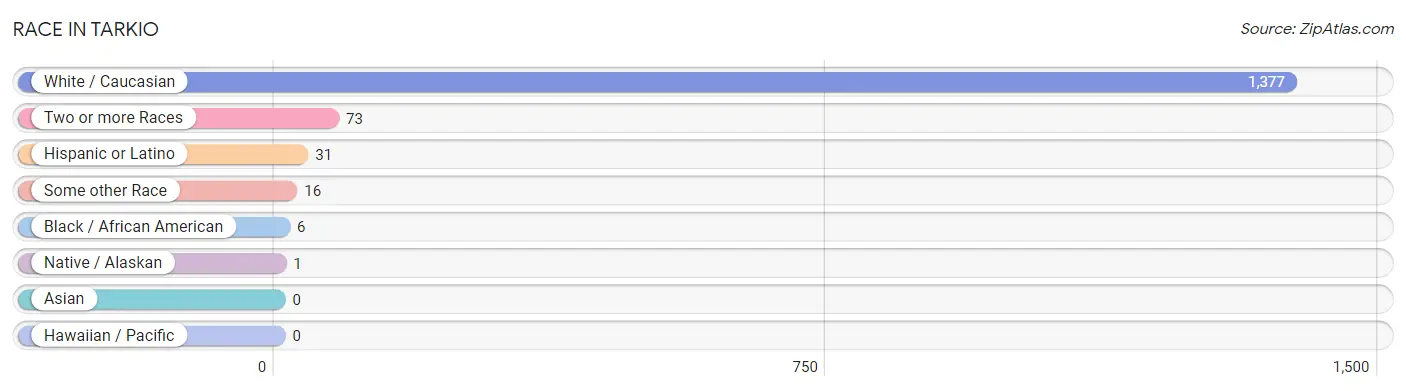
| Race | # Population | % Population |
| Asian | 0 | 0.0% |
| Black / African American | 6 | 0.4% |
| Hawaiian / Pacific | 0 | 0.0% |
| Hispanic or Latino | 31 | 2.1% |
| Native / Alaskan | 1 | 0.1% |
| White / Caucasian | 1,377 | 93.5% |
| Two or more Races | 73 | 5.0% |
| Some other Race | 16 | 1.1% |
| Total | 1,473 | 100.0% |
Ancestry in Tarkio
The most populous ancestries reported in Tarkio are German (346 | 23.5%), Irish (280 | 19.0%), English (200 | 13.6%), American (143 | 9.7%), and Dutch (26 | 1.8%), together accounting for 67.6% of all Tarkio residents.
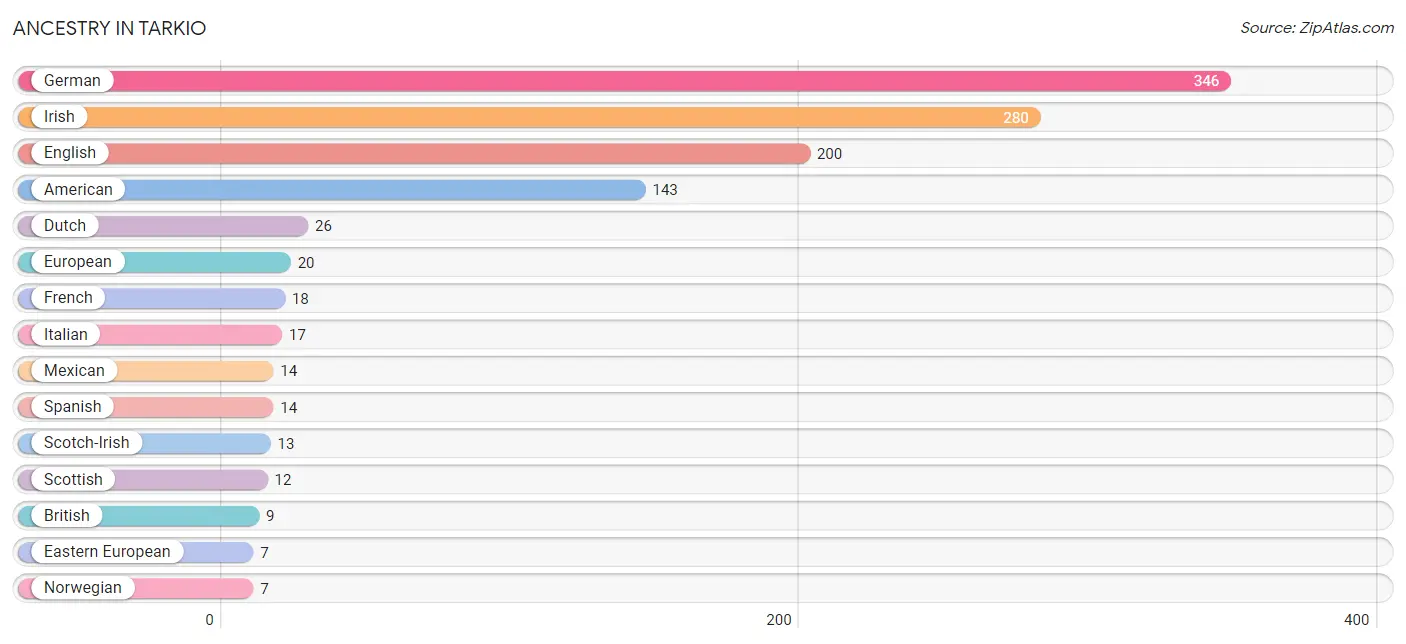
| Ancestry | # Population | % Population |
| American | 143 | 9.7% |
| Blackfeet | 4 | 0.3% |
| British | 9 | 0.6% |
| Cherokee | 3 | 0.2% |
| Czech | 4 | 0.3% |
| Dutch | 26 | 1.8% |
| Eastern European | 7 | 0.5% |
| English | 200 | 13.6% |
| European | 20 | 1.4% |
| French | 18 | 1.2% |
| German | 346 | 23.5% |
| Irish | 280 | 19.0% |
| Italian | 17 | 1.1% |
| Mexican | 14 | 0.9% |
| Northern European | 3 | 0.2% |
| Norwegian | 7 | 0.5% |
| Pennsylvania German | 1 | 0.1% |
| Polish | 3 | 0.2% |
| Puerto Rican | 3 | 0.2% |
| Scotch-Irish | 13 | 0.9% |
| Scottish | 12 | 0.8% |
| Spanish | 14 | 0.9% |
| Welsh | 7 | 0.5% | View All 23 Rows |
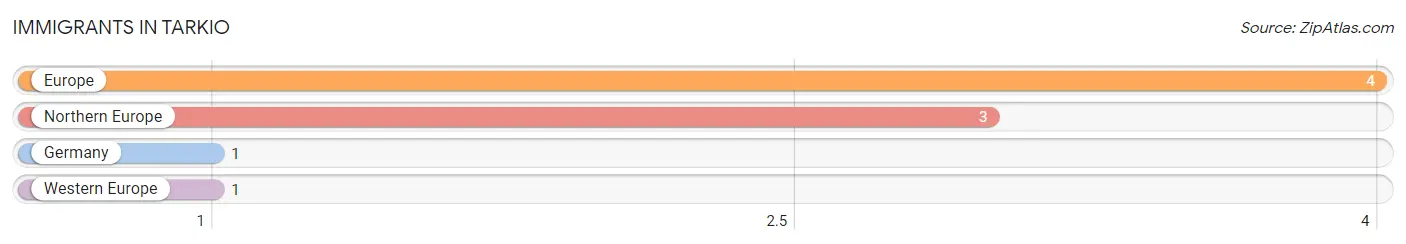
Immigrants in Tarkio
The most numerous immigrant groups reported in Tarkio came from Europe (4 | 0.3%), Northern Europe (3 | 0.2%), Germany (1 | 0.1%), and Western Europe (1 | 0.1%), together accounting for 0.6% of all Tarkio residents.
| Immigration Origin | # Population | % Population |
| Europe | 4 | 0.3% |
| Germany | 1 | 0.1% |
| Northern Europe | 3 | 0.2% |
| Western Europe | 1 | 0.1% | View All 4 Rows |
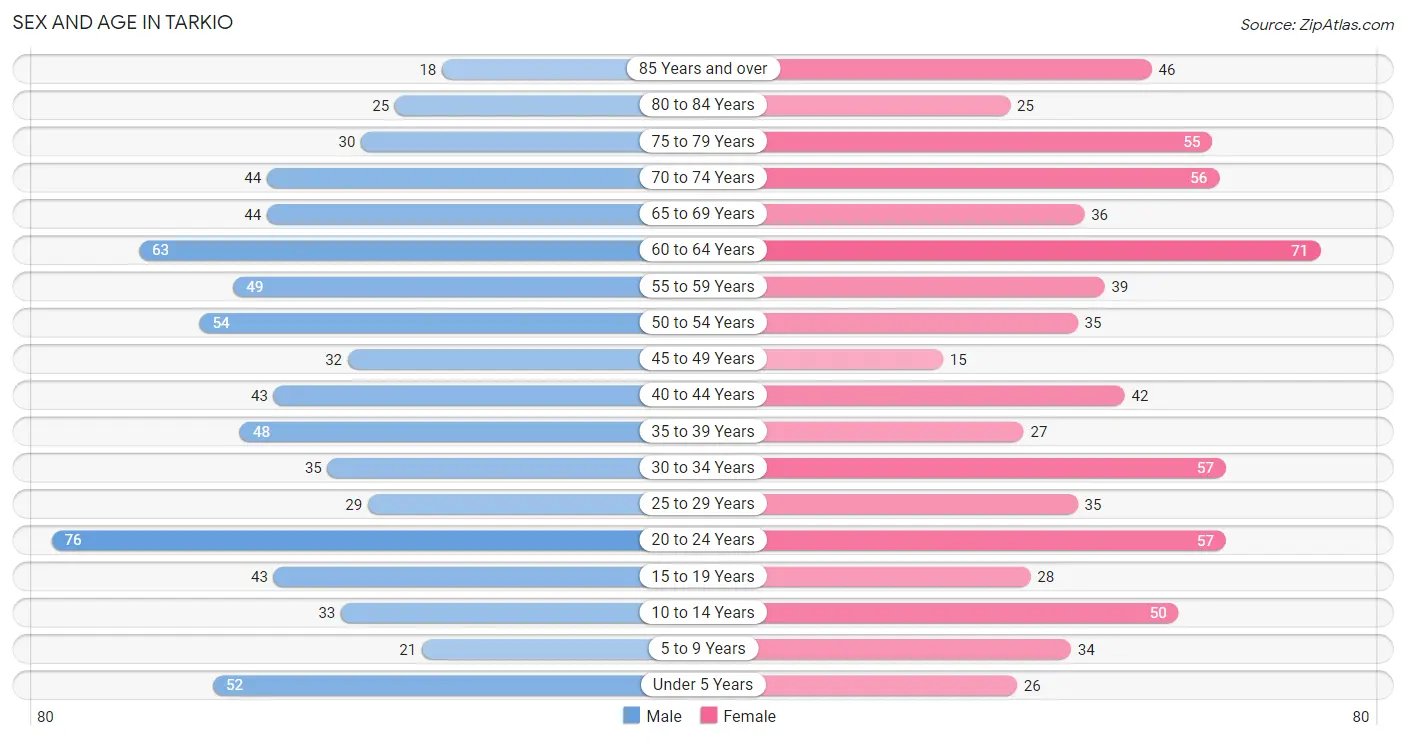
Sex and Age in Tarkio
Sex and Age in Tarkio
The most populous age groups in Tarkio are 20 to 24 Years (76 | 10.3%) for men and 60 to 64 Years (71 | 9.7%) for women.
| Age Bracket | Male | Female |
| Under 5 Years | 52 (7.0%) | 26 (3.5%) |
| 5 to 9 Years | 21 (2.8%) | 34 (4.6%) |
| 10 to 14 Years | 33 (4.5%) | 50 (6.8%) |
| 15 to 19 Years | 43 (5.8%) | 28 (3.8%) |
| 20 to 24 Years | 76 (10.3%) | 57 (7.8%) |
| 25 to 29 Years | 29 (3.9%) | 35 (4.8%) |
| 30 to 34 Years | 35 (4.7%) | 57 (7.8%) |
| 35 to 39 Years | 48 (6.5%) | 27 (3.7%) |
| 40 to 44 Years | 43 (5.8%) | 42 (5.7%) |
| 45 to 49 Years | 32 (4.3%) | 15 (2.0%) |
| 50 to 54 Years | 54 (7.3%) | 35 (4.8%) |
| 55 to 59 Years | 49 (6.6%) | 39 (5.3%) |
| 60 to 64 Years | 63 (8.5%) | 71 (9.7%) |
| 65 to 69 Years | 44 (5.9%) | 36 (4.9%) |
| 70 to 74 Years | 44 (5.9%) | 56 (7.6%) |
| 75 to 79 Years | 30 (4.1%) | 55 (7.5%) |
| 80 to 84 Years | 25 (3.4%) | 25 (3.4%) |
| 85 Years and over | 18 (2.4%) | 46 (6.3%) |
| Total | 739 (100.0%) | 734 (100.0%) |
Families and Households in Tarkio
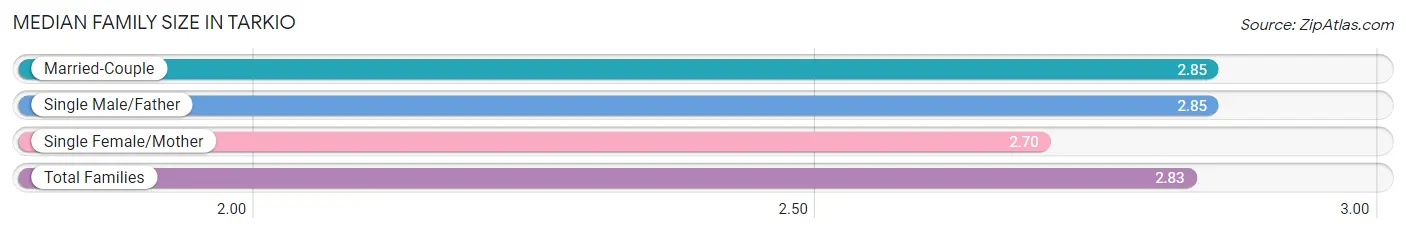
Median Family Size in Tarkio
The median family size in Tarkio is 2.83 persons per family, with married-couple families (283 | 76.1%) accounting for the largest median family size of 2.85 persons per family. On the other hand, single female/mother families (56 | 15.0%) represent the smallest median family size with 2.70 persons per family.
| Family Type | # Families | Family Size |
| Married-Couple | 283 (76.1%) | 2.85 |
| Single Male/Father | 33 (8.9%) | 2.85 |
| Single Female/Mother | 56 (15.0%) | 2.70 |
| Total Families | 372 (100.0%) | 2.83 |
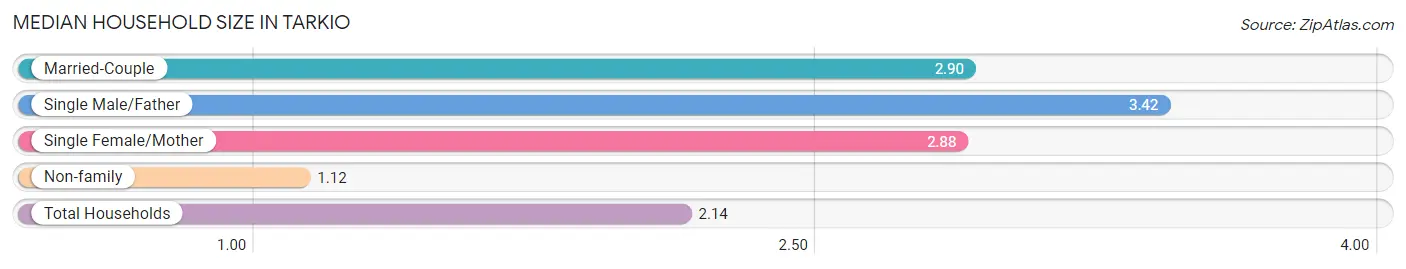
Median Household Size in Tarkio
The median household size in Tarkio is 2.14 persons per household, with single male/father households (33 | 5.0%) accounting for the largest median household size of 3.42 persons per household. non-family households (292 | 44.0%) represent the smallest median household size with 1.12 persons per household.
| Household Type | # Households | Household Size |
| Married-Couple | 283 (42.6%) | 2.90 |
| Single Male/Father | 33 (5.0%) | 3.42 |
| Single Female/Mother | 56 (8.4%) | 2.88 |
| Non-family | 292 (44.0%) | 1.12 |
| Total Households | 664 (100.0%) | 2.14 |
Household Size by Marriage Status in Tarkio
Out of a total of 664 households in Tarkio, 372 (56.0%) are family households, while 292 (44.0%) are nonfamily households. The most numerous type of family households are 2-person households, comprising 232, and the most common type of nonfamily households are 1-person households, comprising 254.
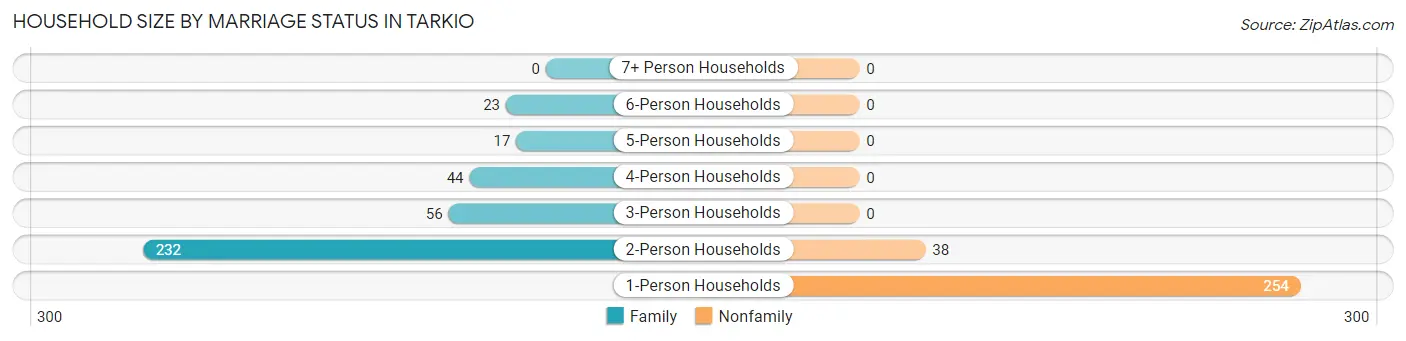
| Household Size | Family Households | Nonfamily Households |
| 1-Person Households | - | 254 (38.3%) |
| 2-Person Households | 232 (34.9%) | 38 (5.7%) |
| 3-Person Households | 56 (8.4%) | 0 (0.0%) |
| 4-Person Households | 44 (6.6%) | 0 (0.0%) |
| 5-Person Households | 17 (2.6%) | 0 (0.0%) |
| 6-Person Households | 23 (3.5%) | 0 (0.0%) |
| 7+ Person Households | 0 (0.0%) | 0 (0.0%) |
| Total | 372 (56.0%) | 292 (44.0%) |
Female Fertility in Tarkio
Fertility by Age in Tarkio
Average fertility rate in Tarkio is 53.0 births per 1,000 women. Women in the age bracket of 20 to 34 years have the highest fertility rate with 87.0 births per 1,000 women. Women in the age bracket of 20 to 34 years acount for 92.9% of all women with births.
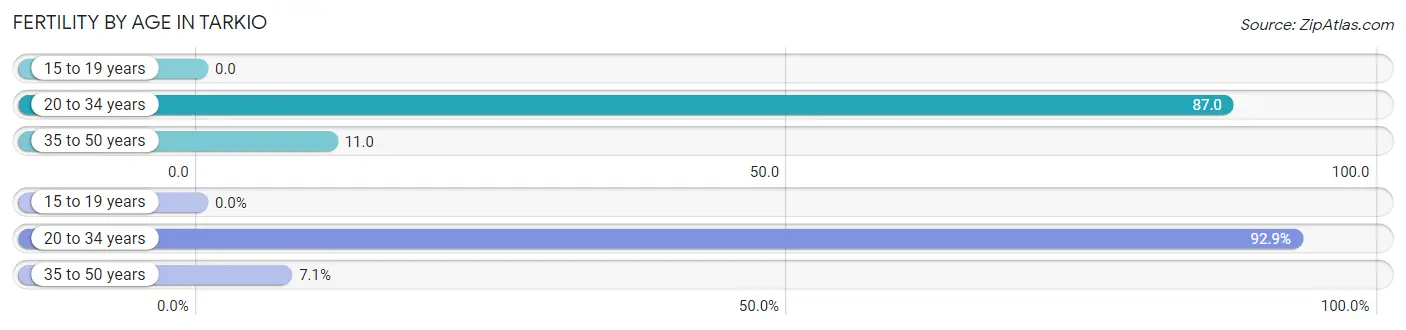
| Age Bracket | Women with Births | Births / 1,000 Women |
| 15 to 19 years | 0 (0.0%) | 0.0 |
| 20 to 34 years | 13 (92.9%) | 87.0 |
| 35 to 50 years | 1 (7.1%) | 11.0 |
| Total | 14 (100.0%) | 53.0 |
Fertility by Age by Marriage Status in Tarkio
42.9% of women with births (14) in Tarkio are married. The highest percentage of unmarried women with births falls into 35 to 50 years age bracket with 100.0% of them unmarried at the time of birth, while the lowest percentage of unmarried women with births belong to 20 to 34 years age bracket with 53.8% of them unmarried.
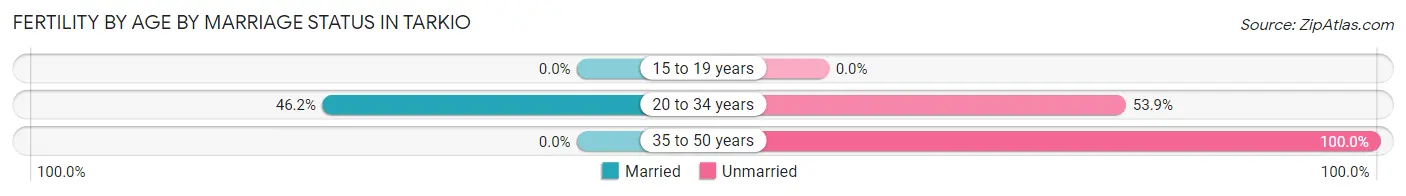
| Age Bracket | Married | Unmarried |
| 15 to 19 years | 0 (0.0%) | 0 (0.0%) |
| 20 to 34 years | 6 (46.2%) | 7 (53.8%) |
| 35 to 50 years | 0 (0.0%) | 1 (100.0%) |
| Total | 6 (42.9%) | 8 (57.1%) |
Fertility by Education in Tarkio
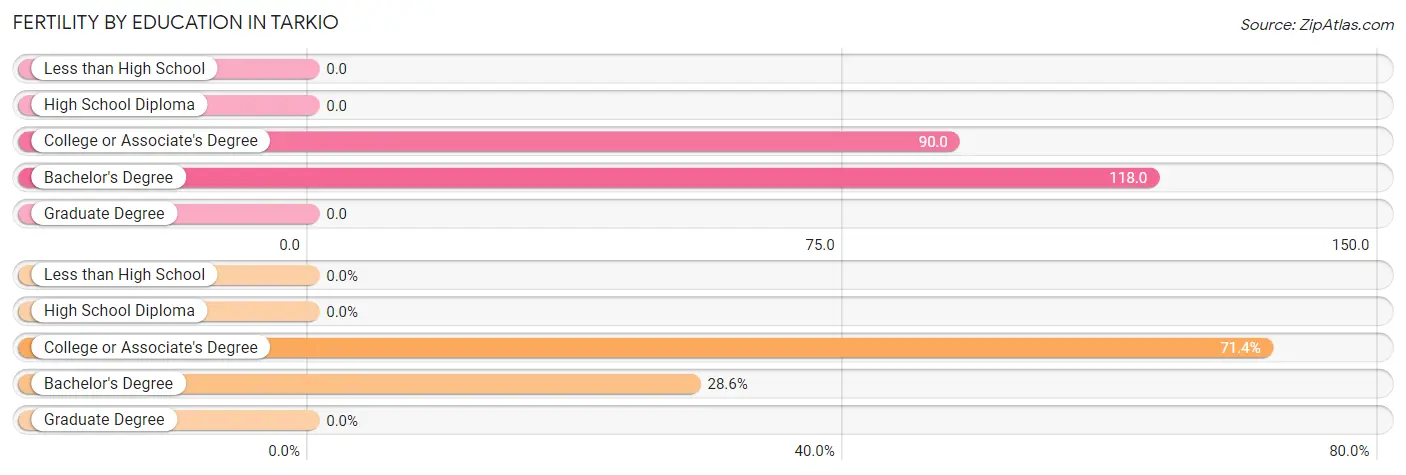
| Educational Attainment | Women with Births | Births / 1,000 Women |
| Less than High School | 0 (0.0%) | 0.0 |
| High School Diploma | 0 (0.0%) | 0.0 |
| College or Associate's Degree | 10 (71.4%) | 90.0 |
| Bachelor's Degree | 4 (28.6%) | 118.0 |
| Graduate Degree | 0 (0.0%) | 0.0 |
| Total | 14 (100.0%) | 53.0 |
Fertility by Education by Marriage Status in Tarkio
57.1% of women with births in Tarkio are unmarried. Women with the educational attainment of bachelor's degree are most likely to be married with 75.0% of them married at childbirth, while women with the educational attainment of college or associate's degree are least likely to be married with 70.0% of them unmarried at childbirth.
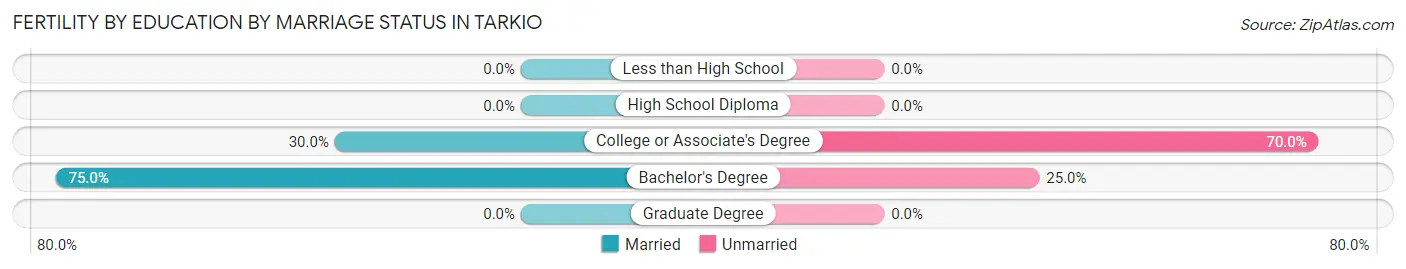
| Educational Attainment | Married | Unmarried |
| Less than High School | 0 (0.0%) | 0 (0.0%) |
| High School Diploma | 0 (0.0%) | 0 (0.0%) |
| College or Associate's Degree | 3 (30.0%) | 7 (70.0%) |
| Bachelor's Degree | 3 (75.0%) | 1 (25.0%) |
| Graduate Degree | 0 (0.0%) | 0 (0.0%) |
| Total | 6 (42.9%) | 8 (57.1%) |
Employment Characteristics in Tarkio
Employment by Class of Employer in Tarkio
Among the 723 employed individuals in Tarkio, private company employees (451 | 62.4%), state government employees (84 | 11.6%), and self-employed (not incorporated) (71 | 9.8%) make up the most common classes of employment.
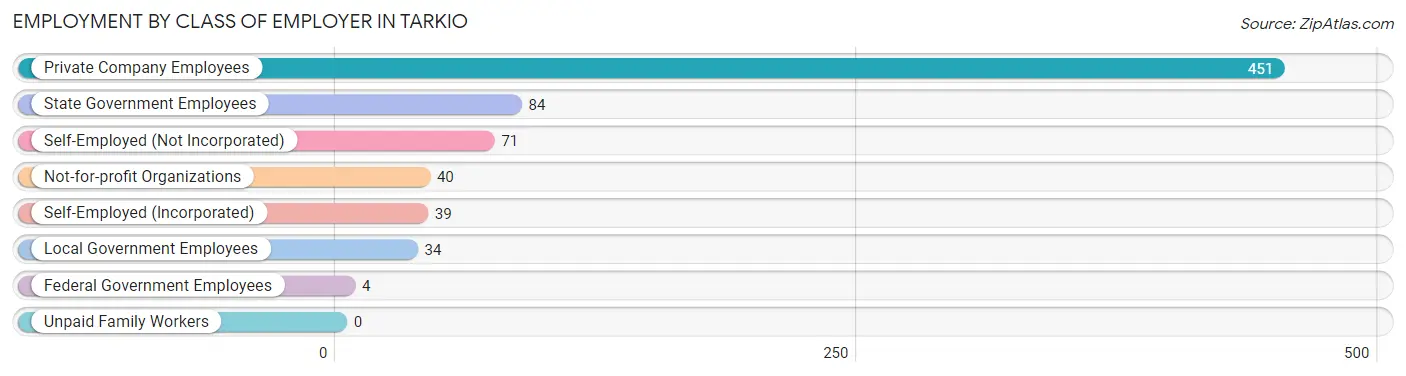
| Employer Class | # Employees | % Employees |
| Private Company Employees | 451 | 62.4% |
| Self-Employed (Incorporated) | 39 | 5.4% |
| Self-Employed (Not Incorporated) | 71 | 9.8% |
| Not-for-profit Organizations | 40 | 5.5% |
| Local Government Employees | 34 | 4.7% |
| State Government Employees | 84 | 11.6% |
| Federal Government Employees | 4 | 0.5% |
| Unpaid Family Workers | 0 | 0.0% |
| Total | 723 | 100.0% |
Employment Status by Age in Tarkio
According to the labor force statistics for Tarkio, out of the total population over 16 years of age (1,235), 60.9% or 752 individuals are in the labor force, with 2.8% or 21 of them unemployed. The age group with the highest labor force participation rate is 35 to 44 years, with 95.6% or 153 individuals in the labor force. Within the labor force, the 45 to 54 years age range has the highest percentage of unemployed individuals, with 6.7% or 7 of them being unemployed.
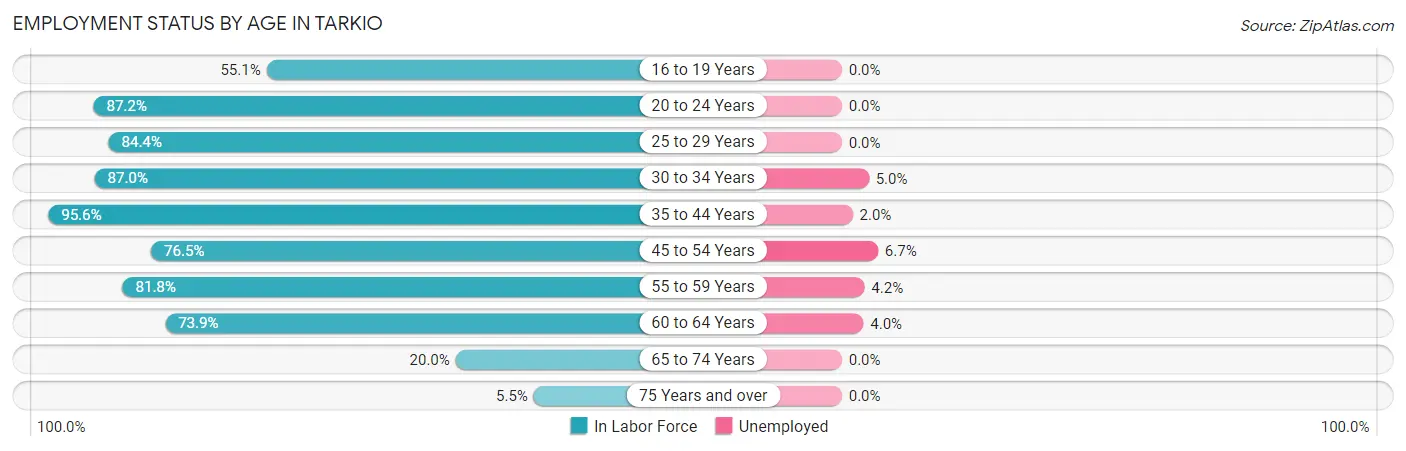
| Age Bracket | In Labor Force | Unemployed |
| 16 to 19 Years | 27 (55.1%) | 0 (0.0%) |
| 20 to 24 Years | 116 (87.2%) | 0 (0.0%) |
| 25 to 29 Years | 54 (84.4%) | 0 (0.0%) |
| 30 to 34 Years | 80 (87.0%) | 4 (5.0%) |
| 35 to 44 Years | 153 (95.6%) | 3 (2.0%) |
| 45 to 54 Years | 104 (76.5%) | 7 (6.7%) |
| 55 to 59 Years | 72 (81.8%) | 3 (4.2%) |
| 60 to 64 Years | 99 (73.9%) | 4 (4.0%) |
| 65 to 74 Years | 36 (20.0%) | 0 (0.0%) |
| 75 Years and over | 11 (5.5%) | 0 (0.0%) |
| Total | 752 (60.9%) | 21 (2.8%) |
Employment Status by Educational Attainment in Tarkio
According to labor force statistics for Tarkio, 83.4% of individuals (562) out of the total population between 25 and 64 years of age (674) are in the labor force, with 3.7% or 21 of them being unemployed. The group with the highest labor force participation rate are those with the educational attainment of bachelor's degree or higher, with 94.5% or 156 individuals in the labor force. Within the labor force, individuals with less than high school education have the highest percentage of unemployment, with 10.7% or 3 of them being unemployed.
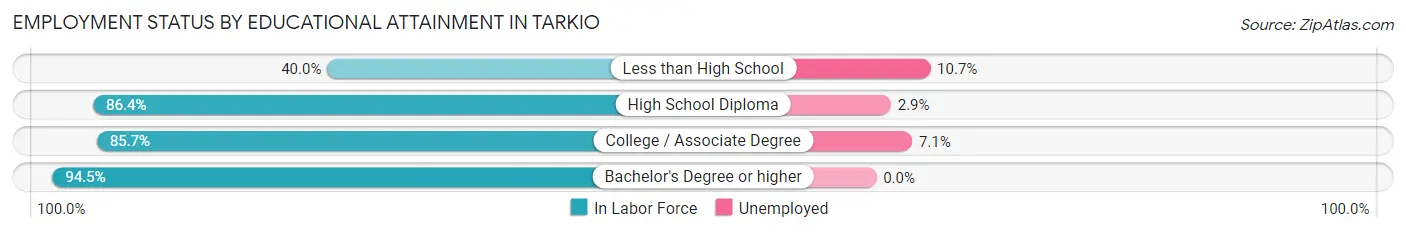
| Educational Attainment | In Labor Force | Unemployed |
| Less than High School | 28 (40.0%) | 7 (10.7%) |
| High School Diploma | 210 (86.4%) | 7 (2.9%) |
| College / Associate Degree | 168 (85.7%) | 14 (7.1%) |
| Bachelor's Degree or higher | 156 (94.5%) | 0 (0.0%) |
| Total | 562 (83.4%) | 25 (3.7%) |
Employment Occupations by Sex in Tarkio
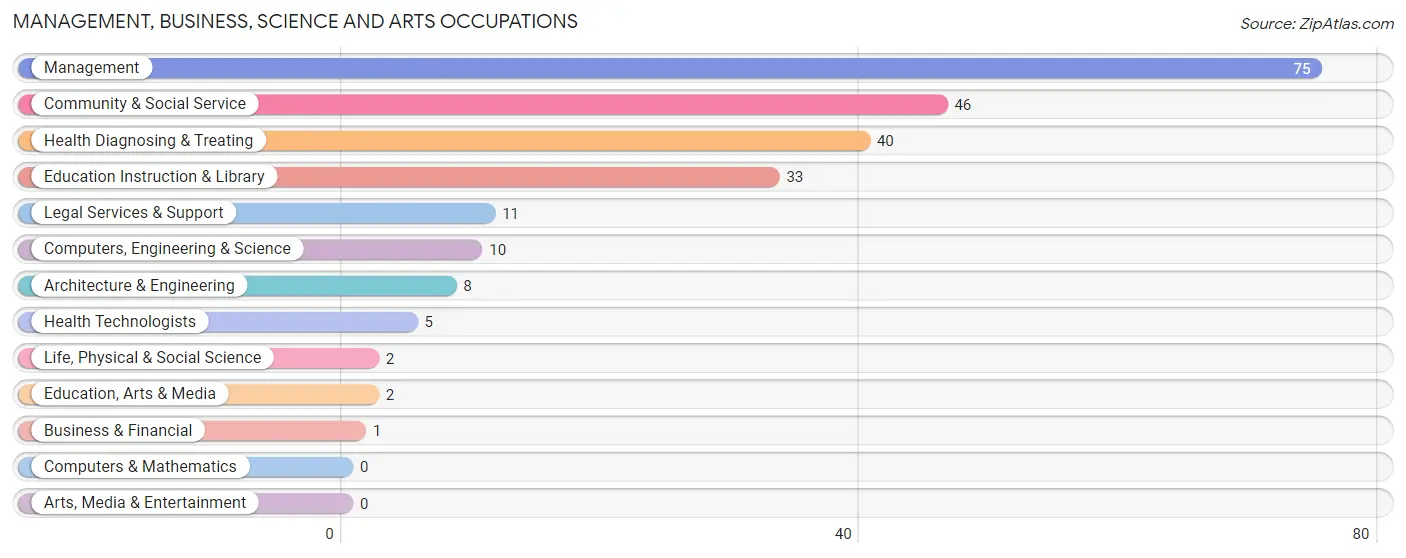
Management, Business, Science and Arts Occupations
The most common Management, Business, Science and Arts occupations in Tarkio are Management (75 | 10.3%), Community & Social Service (46 | 6.3%), Health Diagnosing & Treating (40 | 5.5%), Education Instruction & Library (33 | 4.5%), and Legal Services & Support (11 | 1.5%).
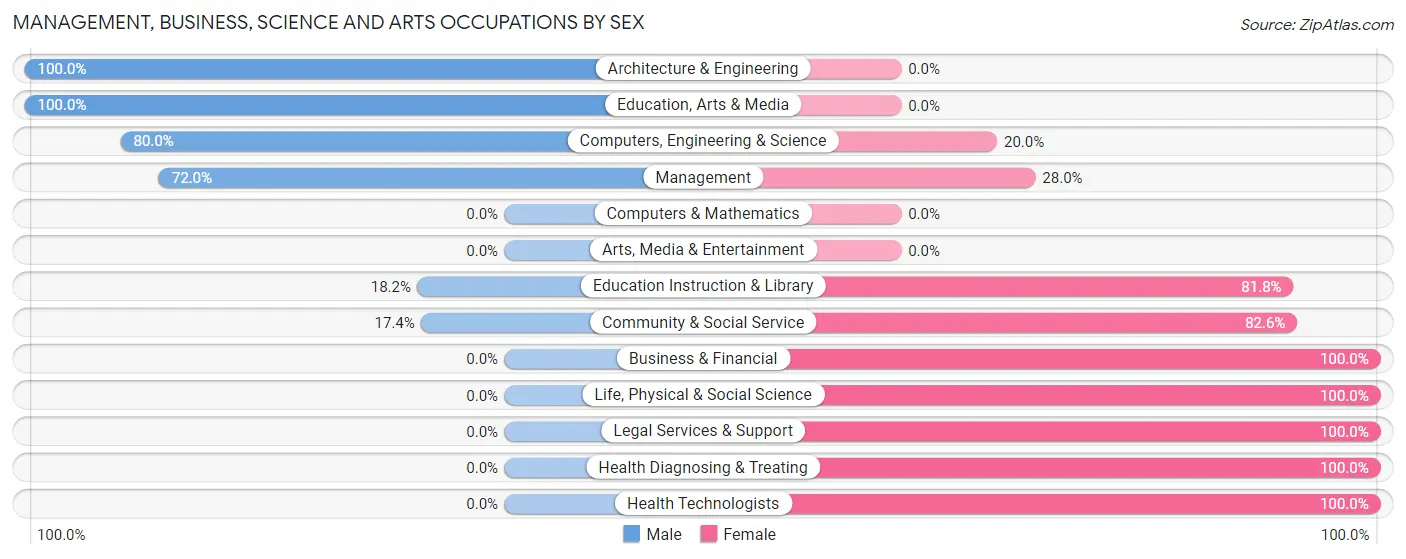
Management, Business, Science and Arts Occupations by Sex
Within the Management, Business, Science and Arts occupations in Tarkio, the most male-oriented occupations are Architecture & Engineering (100.0%), Education, Arts & Media (100.0%), and Computers, Engineering & Science (80.0%), while the most female-oriented occupations are Business & Financial (100.0%), Life, Physical & Social Science (100.0%), and Legal Services & Support (100.0%).
| Occupation | Male | Female |
| Management | 54 (72.0%) | 21 (28.0%) |
| Business & Financial | 0 (0.0%) | 1 (100.0%) |
| Computers, Engineering & Science | 8 (80.0%) | 2 (20.0%) |
| Computers & Mathematics | 0 (0.0%) | 0 (0.0%) |
| Architecture & Engineering | 8 (100.0%) | 0 (0.0%) |
| Life, Physical & Social Science | 0 (0.0%) | 2 (100.0%) |
| Community & Social Service | 8 (17.4%) | 38 (82.6%) |
| Education, Arts & Media | 2 (100.0%) | 0 (0.0%) |
| Legal Services & Support | 0 (0.0%) | 11 (100.0%) |
| Education Instruction & Library | 6 (18.2%) | 27 (81.8%) |
| Arts, Media & Entertainment | 0 (0.0%) | 0 (0.0%) |
| Health Diagnosing & Treating | 0 (0.0%) | 40 (100.0%) |
| Health Technologists | 0 (0.0%) | 5 (100.0%) |
| Total (Category) | 70 (40.7%) | 102 (59.3%) |
| Total (Overall) | 424 (58.0%) | 307 (42.0%) |
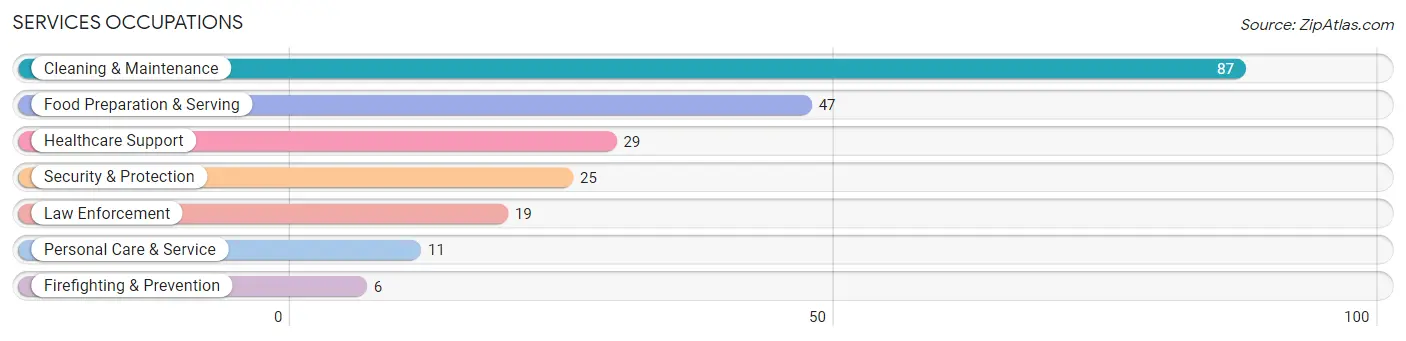
Services Occupations
The most common Services occupations in Tarkio are Cleaning & Maintenance (87 | 11.9%), Food Preparation & Serving (47 | 6.4%), Healthcare Support (29 | 4.0%), Security & Protection (25 | 3.4%), and Law Enforcement (19 | 2.6%).
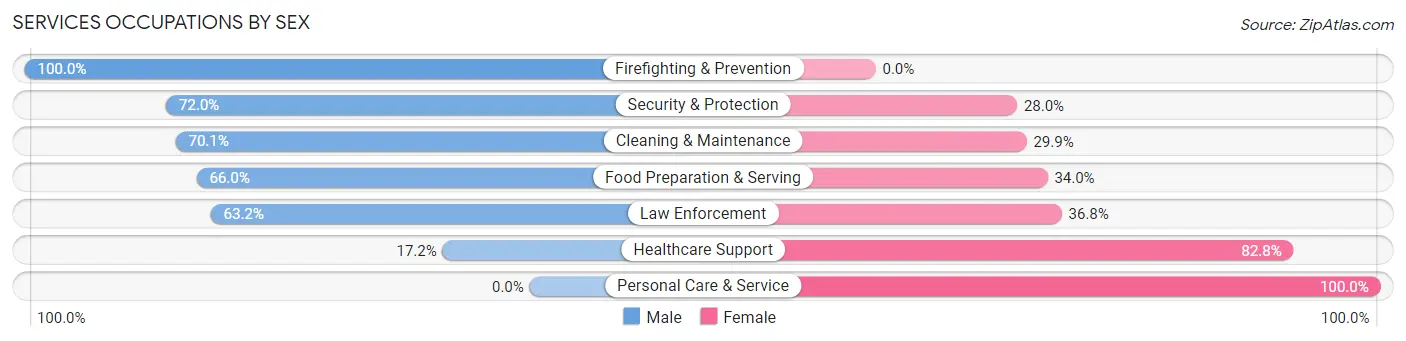
Services Occupations by Sex
Within the Services occupations in Tarkio, the most male-oriented occupations are Firefighting & Prevention (100.0%), Security & Protection (72.0%), and Cleaning & Maintenance (70.1%), while the most female-oriented occupations are Personal Care & Service (100.0%), Healthcare Support (82.8%), and Law Enforcement (36.8%).
| Occupation | Male | Female |
| Healthcare Support | 5 (17.2%) | 24 (82.8%) |
| Security & Protection | 18 (72.0%) | 7 (28.0%) |
| Firefighting & Prevention | 6 (100.0%) | 0 (0.0%) |
| Law Enforcement | 12 (63.2%) | 7 (36.8%) |
| Food Preparation & Serving | 31 (66.0%) | 16 (34.0%) |
| Cleaning & Maintenance | 61 (70.1%) | 26 (29.9%) |
| Personal Care & Service | 0 (0.0%) | 11 (100.0%) |
| Total (Category) | 115 (57.8%) | 84 (42.2%) |
| Total (Overall) | 424 (58.0%) | 307 (42.0%) |
Sales and Office Occupations
The most common Sales and Office occupations in Tarkio are Sales & Related (89 | 12.2%), and Office & Administration (52 | 7.1%).

Sales and Office Occupations by Sex
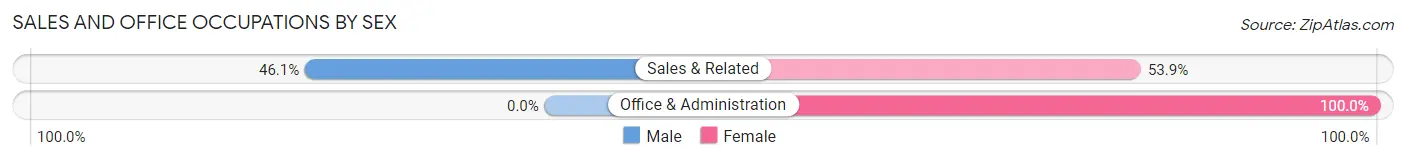
| Occupation | Male | Female |
| Sales & Related | 41 (46.1%) | 48 (53.9%) |
| Office & Administration | 0 (0.0%) | 52 (100.0%) |
| Total (Category) | 41 (29.1%) | 100 (70.9%) |
| Total (Overall) | 424 (58.0%) | 307 (42.0%) |
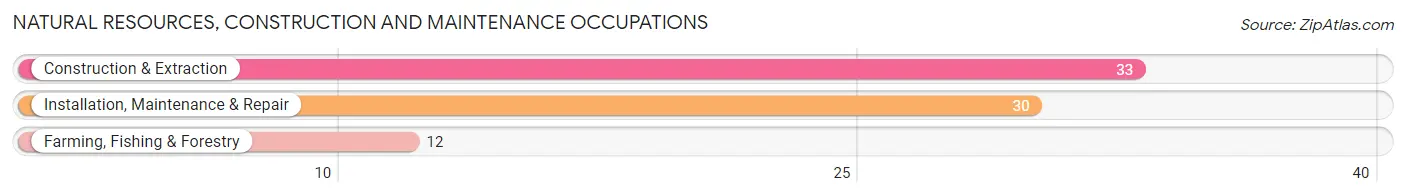
Natural Resources, Construction and Maintenance Occupations
The most common Natural Resources, Construction and Maintenance occupations in Tarkio are Construction & Extraction (33 | 4.5%), Installation, Maintenance & Repair (30 | 4.1%), and Farming, Fishing & Forestry (12 | 1.6%).
Natural Resources, Construction and Maintenance Occupations by Sex
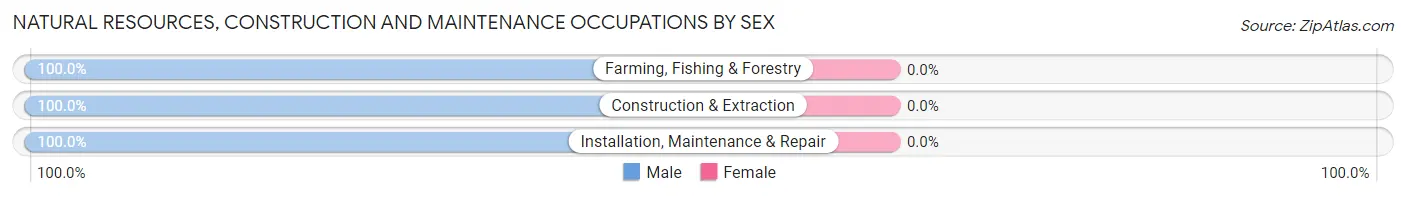
| Occupation | Male | Female |
| Farming, Fishing & Forestry | 12 (100.0%) | 0 (0.0%) |
| Construction & Extraction | 33 (100.0%) | 0 (0.0%) |
| Installation, Maintenance & Repair | 30 (100.0%) | 0 (0.0%) |
| Total (Category) | 75 (100.0%) | 0 (0.0%) |
| Total (Overall) | 424 (58.0%) | 307 (42.0%) |
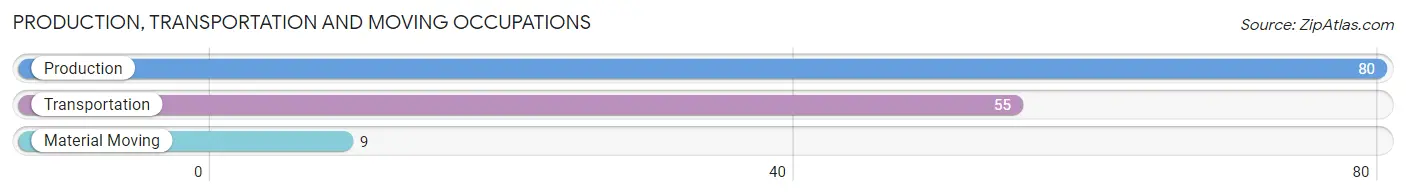
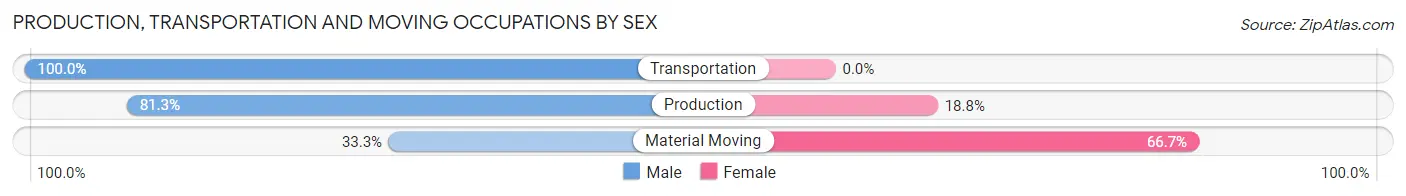
Production, Transportation and Moving Occupations
The most common Production, Transportation and Moving occupations in Tarkio are Production (80 | 10.9%), Transportation (55 | 7.5%), and Material Moving (9 | 1.2%).
Production, Transportation and Moving Occupations by Sex
| Occupation | Male | Female |
| Production | 65 (81.2%) | 15 (18.8%) |
| Transportation | 55 (100.0%) | 0 (0.0%) |
| Material Moving | 3 (33.3%) | 6 (66.7%) |
| Total (Category) | 123 (85.4%) | 21 (14.6%) |
| Total (Overall) | 424 (58.0%) | 307 (42.0%) |
Employment Industries by Sex in Tarkio
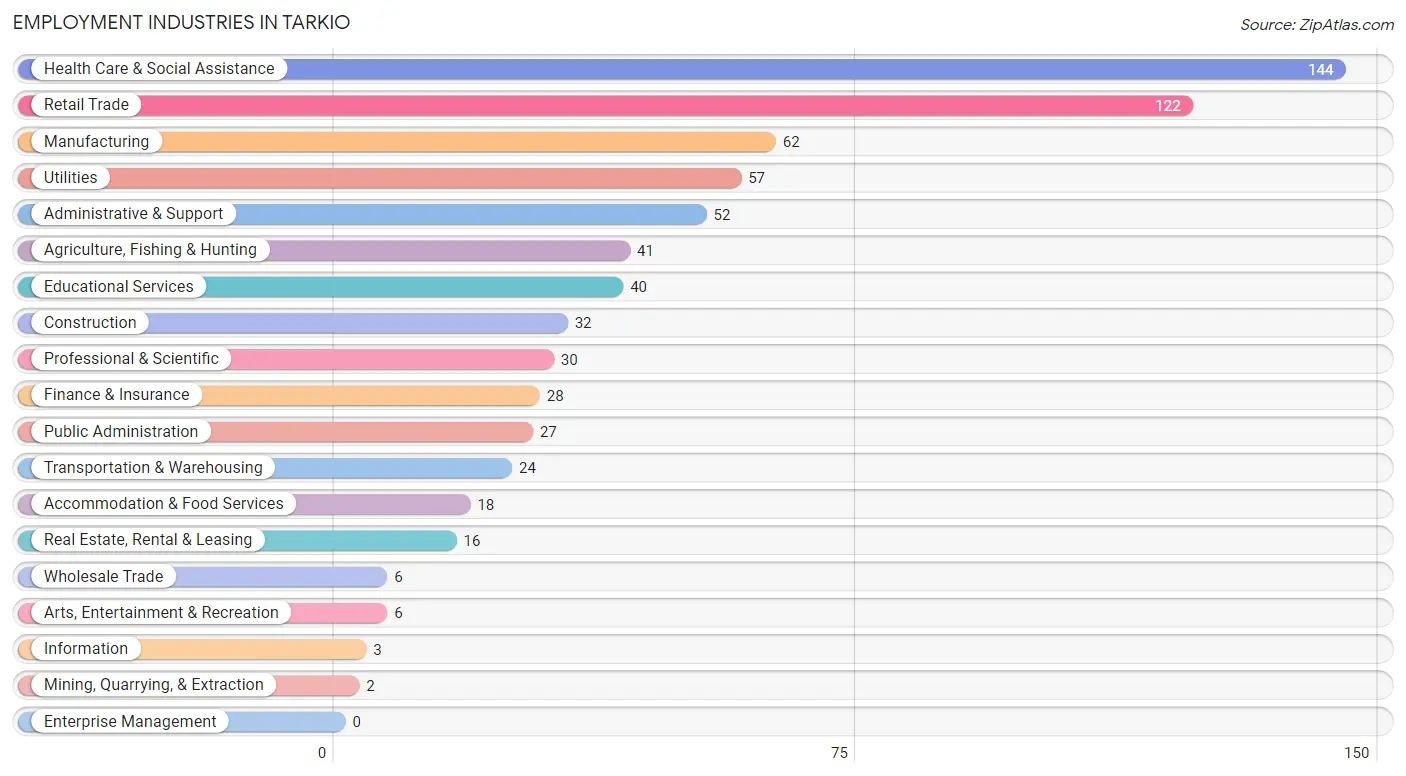
Employment Industries in Tarkio
The major employment industries in Tarkio include Health Care & Social Assistance (144 | 19.7%), Retail Trade (122 | 16.7%), Manufacturing (62 | 8.5%), Utilities (57 | 7.8%), and Administrative & Support (52 | 7.1%).
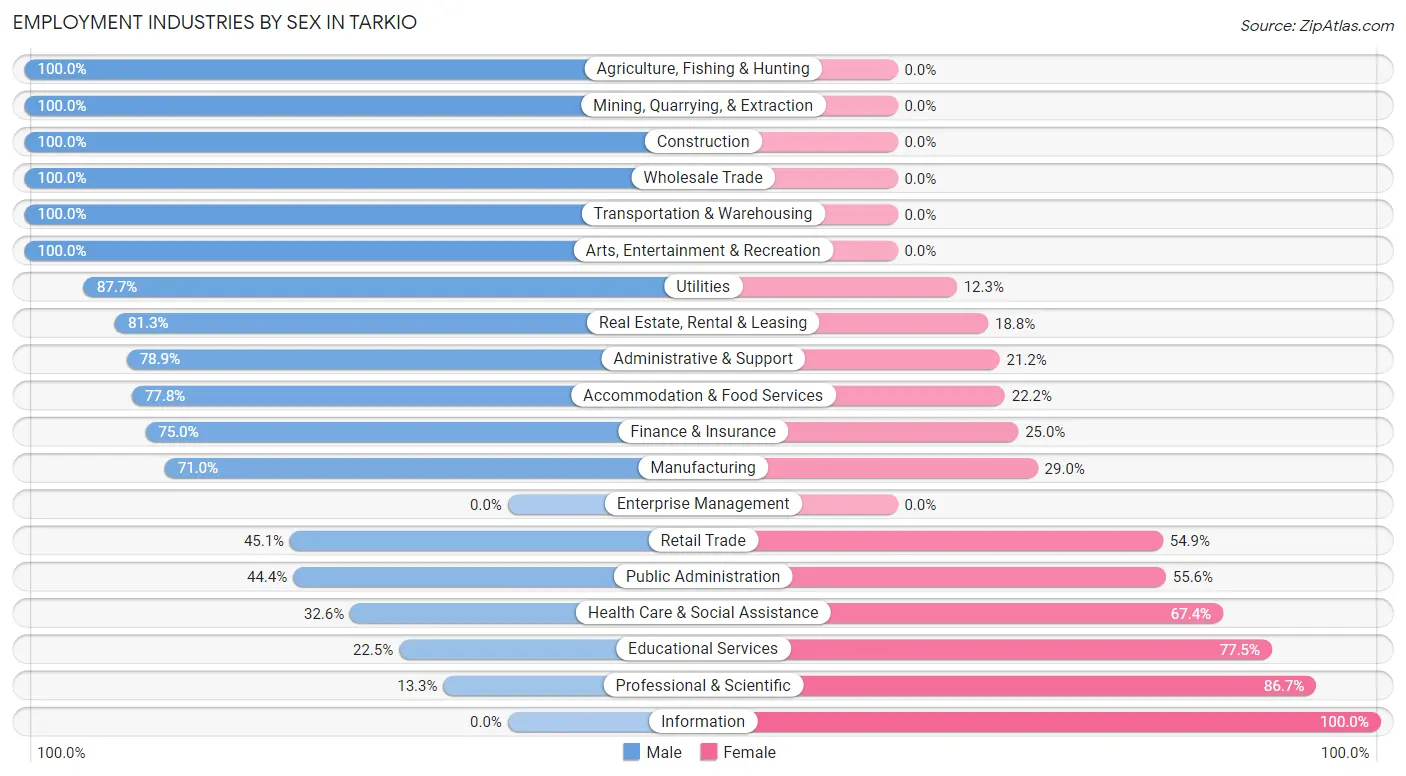
Employment Industries by Sex in Tarkio
The Tarkio industries that see more men than women are Agriculture, Fishing & Hunting (100.0%), Mining, Quarrying, & Extraction (100.0%), and Construction (100.0%), whereas the industries that tend to have a higher number of women are Information (100.0%), Professional & Scientific (86.7%), and Educational Services (77.5%).
| Industry | Male | Female |
| Agriculture, Fishing & Hunting | 41 (100.0%) | 0 (0.0%) |
| Mining, Quarrying, & Extraction | 2 (100.0%) | 0 (0.0%) |
| Construction | 32 (100.0%) | 0 (0.0%) |
| Manufacturing | 44 (71.0%) | 18 (29.0%) |
| Wholesale Trade | 6 (100.0%) | 0 (0.0%) |
| Retail Trade | 55 (45.1%) | 67 (54.9%) |
| Transportation & Warehousing | 24 (100.0%) | 0 (0.0%) |
| Utilities | 50 (87.7%) | 7 (12.3%) |
| Information | 0 (0.0%) | 3 (100.0%) |
| Finance & Insurance | 21 (75.0%) | 7 (25.0%) |
| Real Estate, Rental & Leasing | 13 (81.2%) | 3 (18.8%) |
| Professional & Scientific | 4 (13.3%) | 26 (86.7%) |
| Enterprise Management | 0 (0.0%) | 0 (0.0%) |
| Administrative & Support | 41 (78.8%) | 11 (21.1%) |
| Educational Services | 9 (22.5%) | 31 (77.5%) |
| Health Care & Social Assistance | 47 (32.6%) | 97 (67.4%) |
| Arts, Entertainment & Recreation | 6 (100.0%) | 0 (0.0%) |
| Accommodation & Food Services | 14 (77.8%) | 4 (22.2%) |
| Public Administration | 12 (44.4%) | 15 (55.6%) |
| Total | 424 (58.0%) | 307 (42.0%) |
Education in Tarkio
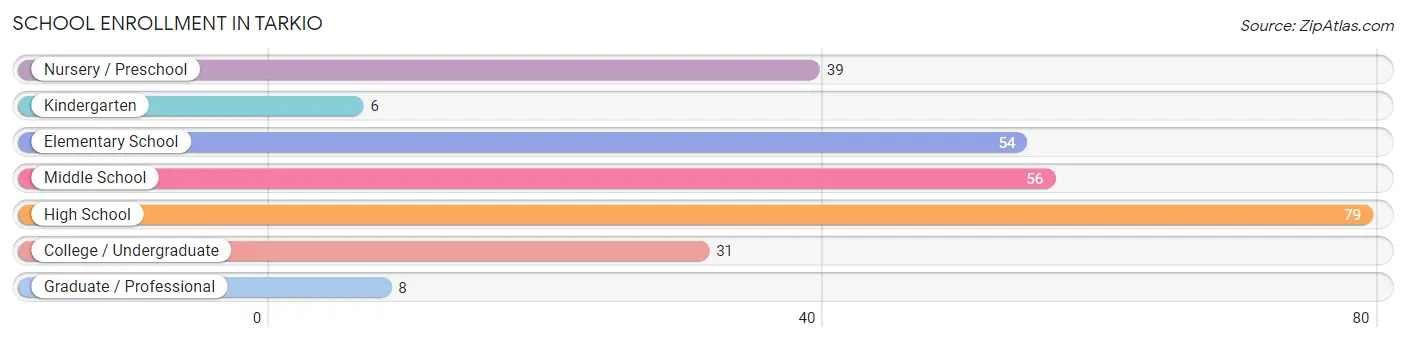
School Enrollment in Tarkio
The most common levels of schooling among the 273 students in Tarkio are high school (79 | 28.9%), middle school (56 | 20.5%), and elementary school (54 | 19.8%).
| School Level | # Students | % Students |
| Nursery / Preschool | 39 | 14.3% |
| Kindergarten | 6 | 2.2% |
| Elementary School | 54 | 19.8% |
| Middle School | 56 | 20.5% |
| High School | 79 | 28.9% |
| College / Undergraduate | 31 | 11.4% |
| Graduate / Professional | 8 | 2.9% |
| Total | 273 | 100.0% |
School Enrollment by Age by Funding Source in Tarkio
Out of a total of 273 students who are enrolled in schools in Tarkio, 6 (2.2%) attend a private institution, while the remaining 267 (97.8%) are enrolled in public schools. The age group of 20 to 24 year olds has the highest likelihood of being enrolled in private schools, with 3 (17.6% in the age bracket) enrolled. Conversely, the age group of 5 to 9 year old has the lowest likelihood of being enrolled in a private school, with 53 (100.0% in the age bracket) attending a public institution.
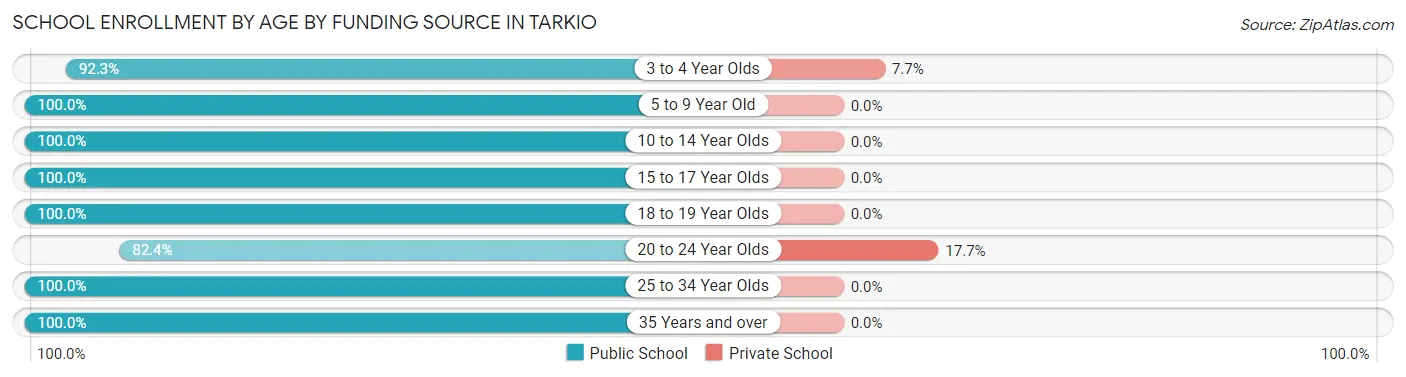
| Age Bracket | Public School | Private School |
| 3 to 4 Year Olds | 36 (92.3%) | 3 (7.7%) |
| 5 to 9 Year Old | 53 (100.0%) | 0 (0.0%) |
| 10 to 14 Year Olds | 83 (100.0%) | 0 (0.0%) |
| 15 to 17 Year Olds | 49 (100.0%) | 0 (0.0%) |
| 18 to 19 Year Olds | 16 (100.0%) | 0 (0.0%) |
| 20 to 24 Year Olds | 14 (82.4%) | 3 (17.6%) |
| 25 to 34 Year Olds | 7 (100.0%) | 0 (0.0%) |
| 35 Years and over | 9 (100.0%) | 0 (0.0%) |
| Total | 267 (97.8%) | 6 (2.2%) |
Educational Attainment by Field of Study in Tarkio
Education (70 | 28.3%), bio, nature & agricultural (51 | 20.6%), business (46 | 18.6%), science & technology (23 | 9.3%), and social sciences (16 | 6.5%) are the most common fields of study among 247 individuals in Tarkio who have obtained a bachelor's degree or higher.
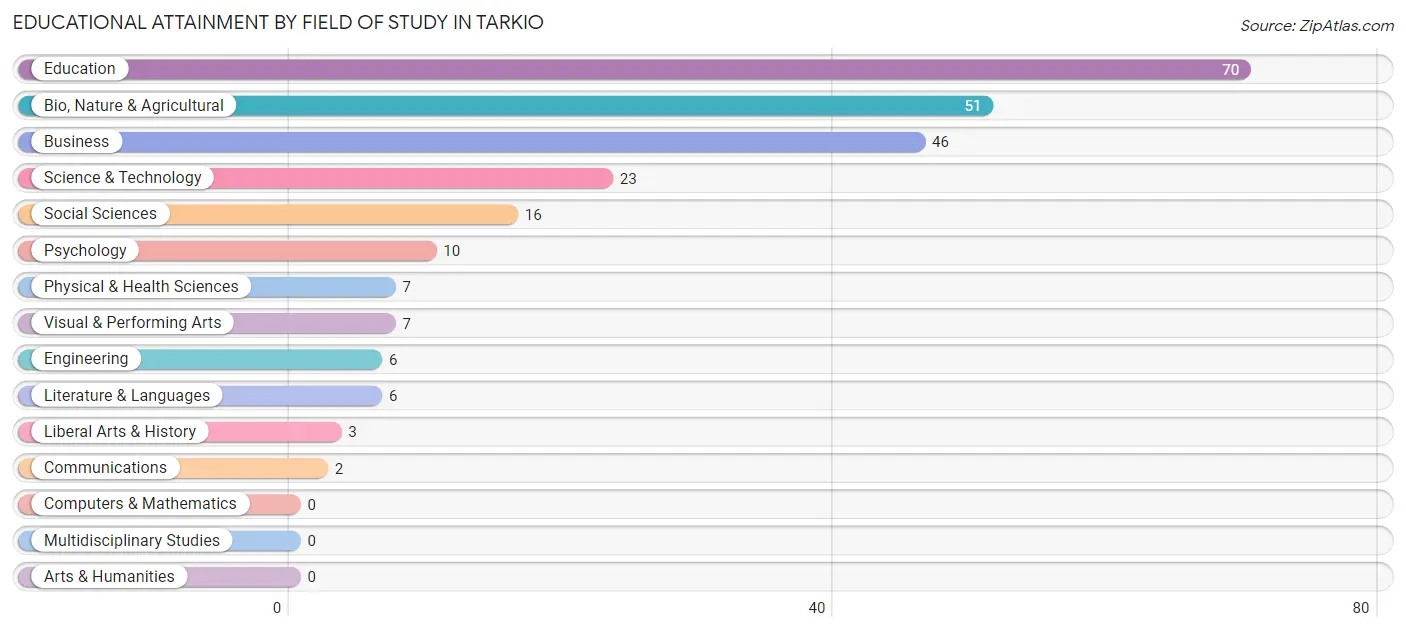
| Field of Study | # Graduates | % Graduates |
| Computers & Mathematics | 0 | 0.0% |
| Bio, Nature & Agricultural | 51 | 20.6% |
| Physical & Health Sciences | 7 | 2.8% |
| Psychology | 10 | 4.1% |
| Social Sciences | 16 | 6.5% |
| Engineering | 6 | 2.4% |
| Multidisciplinary Studies | 0 | 0.0% |
| Science & Technology | 23 | 9.3% |
| Business | 46 | 18.6% |
| Education | 70 | 28.3% |
| Literature & Languages | 6 | 2.4% |
| Liberal Arts & History | 3 | 1.2% |
| Visual & Performing Arts | 7 | 2.8% |
| Communications | 2 | 0.8% |
| Arts & Humanities | 0 | 0.0% |
| Total | 247 | 100.0% |
Transportation & Commute in Tarkio
Vehicle Availability by Sex in Tarkio
The most prevalent vehicle ownership categories in Tarkio are males with 1 vehicle (146, accounting for 34.7%) and females with 1 vehicle (94, making up 48.7%).
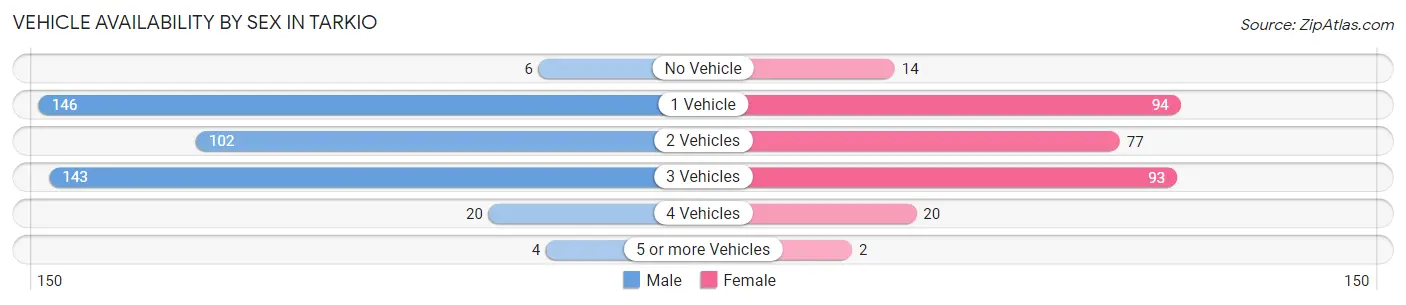
| Vehicles Available | Male | Female |
| No Vehicle | 6 (1.4%) | 14 (4.7%) |
| 1 Vehicle | 146 (34.7%) | 94 (31.3%) |
| 2 Vehicles | 102 (24.2%) | 77 (25.7%) |
| 3 Vehicles | 143 (34.0%) | 93 (31.0%) |
| 4 Vehicles | 20 (4.8%) | 20 (6.7%) |
| 5 or more Vehicles | 4 (0.9%) | 2 (0.7%) |
| Total | 421 (100.0%) | 300 (100.0%) |
Commute Time in Tarkio
The most frequently occuring commute durations in Tarkio are 5 to 9 minutes (149 commuters, 21.0%), 15 to 19 minutes (146 commuters, 20.6%), and 10 to 14 minutes (92 commuters, 13.0%).
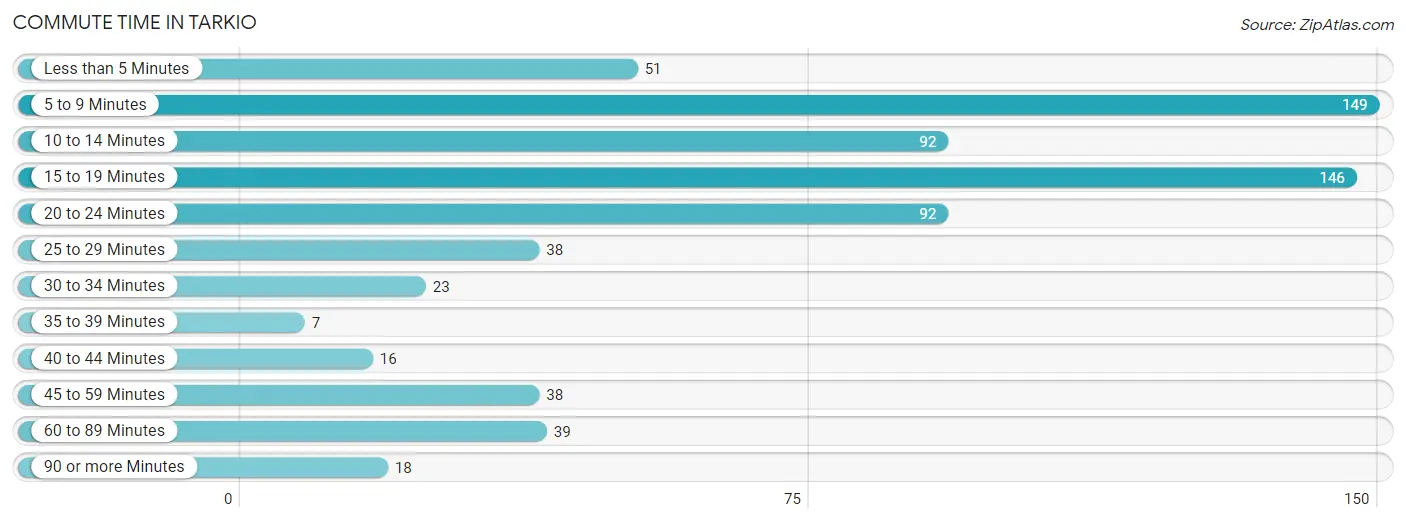
| Commute Time | # Commuters | % Commuters |
| Less than 5 Minutes | 51 | 7.2% |
| 5 to 9 Minutes | 149 | 21.0% |
| 10 to 14 Minutes | 92 | 13.0% |
| 15 to 19 Minutes | 146 | 20.6% |
| 20 to 24 Minutes | 92 | 13.0% |
| 25 to 29 Minutes | 38 | 5.4% |
| 30 to 34 Minutes | 23 | 3.2% |
| 35 to 39 Minutes | 7 | 1.0% |
| 40 to 44 Minutes | 16 | 2.3% |
| 45 to 59 Minutes | 38 | 5.4% |
| 60 to 89 Minutes | 39 | 5.5% |
| 90 or more Minutes | 18 | 2.5% |
Commute Time by Sex in Tarkio
The most common commute times in Tarkio are 15 to 19 minutes (112 commuters, 26.7%) for males and 5 to 9 minutes (75 commuters, 25.9%) for females.
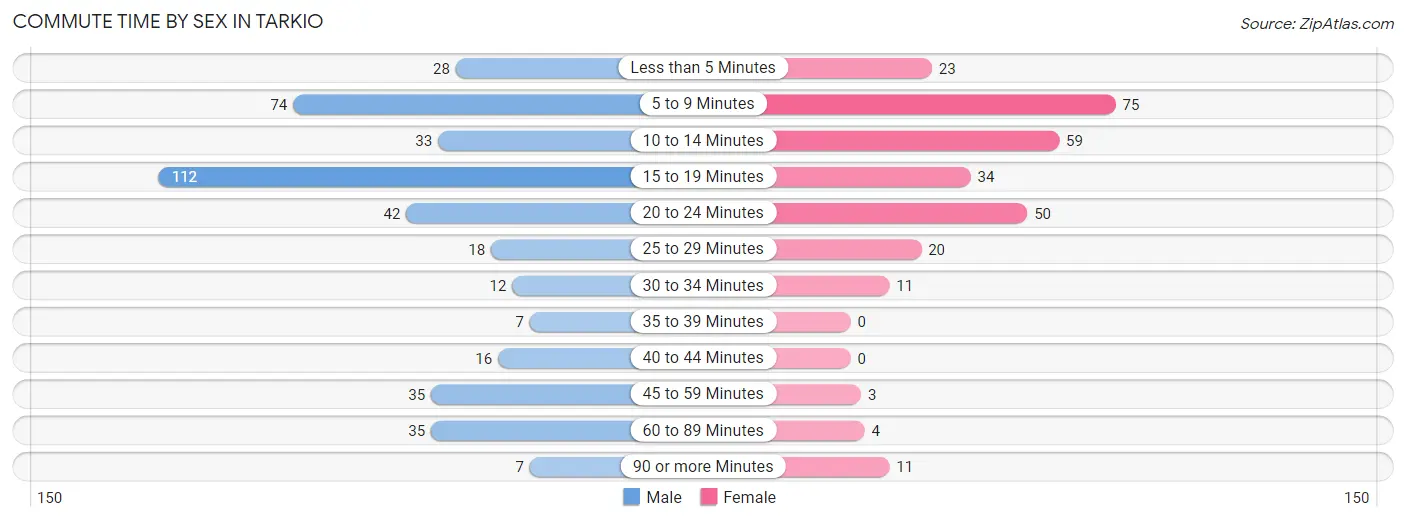
| Commute Time | Male | Female |
| Less than 5 Minutes | 28 (6.7%) | 23 (7.9%) |
| 5 to 9 Minutes | 74 (17.7%) | 75 (25.9%) |
| 10 to 14 Minutes | 33 (7.9%) | 59 (20.3%) |
| 15 to 19 Minutes | 112 (26.7%) | 34 (11.7%) |
| 20 to 24 Minutes | 42 (10.0%) | 50 (17.2%) |
| 25 to 29 Minutes | 18 (4.3%) | 20 (6.9%) |
| 30 to 34 Minutes | 12 (2.9%) | 11 (3.8%) |
| 35 to 39 Minutes | 7 (1.7%) | 0 (0.0%) |
| 40 to 44 Minutes | 16 (3.8%) | 0 (0.0%) |
| 45 to 59 Minutes | 35 (8.4%) | 3 (1.0%) |
| 60 to 89 Minutes | 35 (8.4%) | 4 (1.4%) |
| 90 or more Minutes | 7 (1.7%) | 11 (3.8%) |
Time of Departure to Work by Sex in Tarkio
The most frequent times of departure to work in Tarkio are 7:30 AM to 7:59 AM (87, 20.8%) for males and 7:30 AM to 7:59 AM (99, 34.1%) for females.
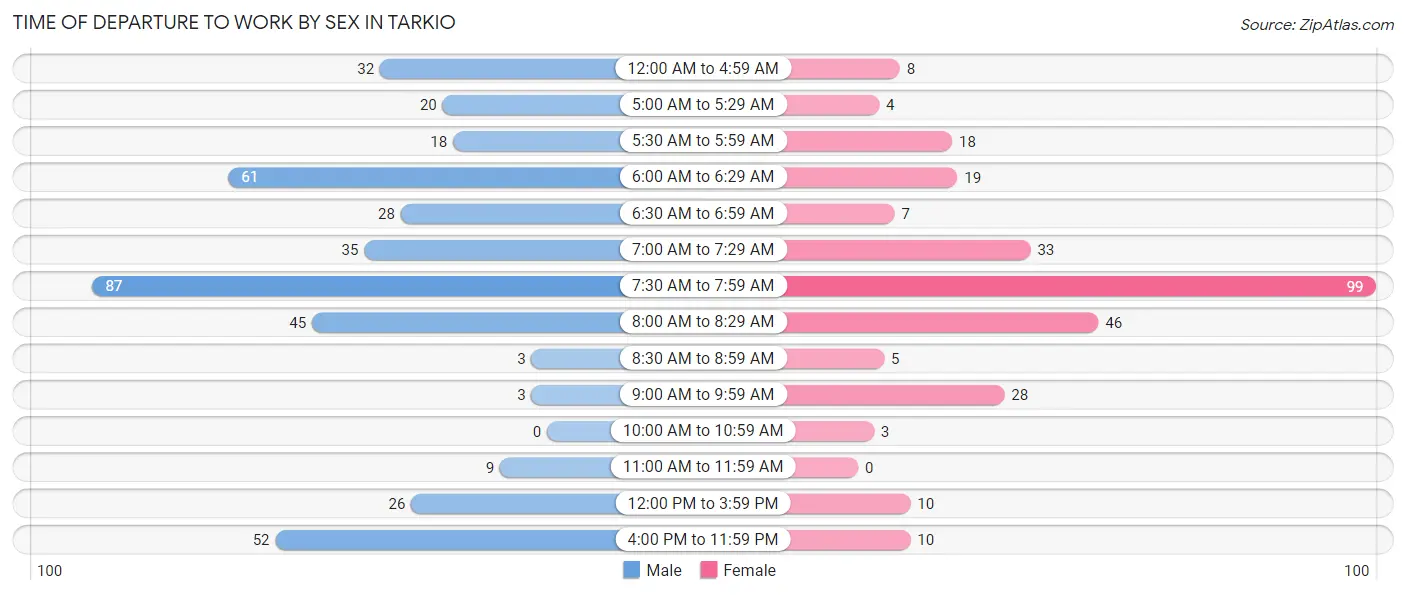
| Time of Departure | Male | Female |
| 12:00 AM to 4:59 AM | 32 (7.6%) | 8 (2.8%) |
| 5:00 AM to 5:29 AM | 20 (4.8%) | 4 (1.4%) |
| 5:30 AM to 5:59 AM | 18 (4.3%) | 18 (6.2%) |
| 6:00 AM to 6:29 AM | 61 (14.6%) | 19 (6.6%) |
| 6:30 AM to 6:59 AM | 28 (6.7%) | 7 (2.4%) |
| 7:00 AM to 7:29 AM | 35 (8.4%) | 33 (11.4%) |
| 7:30 AM to 7:59 AM | 87 (20.8%) | 99 (34.1%) |
| 8:00 AM to 8:29 AM | 45 (10.7%) | 46 (15.9%) |
| 8:30 AM to 8:59 AM | 3 (0.7%) | 5 (1.7%) |
| 9:00 AM to 9:59 AM | 3 (0.7%) | 28 (9.7%) |
| 10:00 AM to 10:59 AM | 0 (0.0%) | 3 (1.0%) |
| 11:00 AM to 11:59 AM | 9 (2.1%) | 0 (0.0%) |
| 12:00 PM to 3:59 PM | 26 (6.2%) | 10 (3.5%) |
| 4:00 PM to 11:59 PM | 52 (12.4%) | 10 (3.5%) |
| Total | 419 (100.0%) | 290 (100.0%) |
Housing Occupancy in Tarkio
Occupancy by Ownership in Tarkio
Of the total 664 dwellings in Tarkio, owner-occupied units account for 461 (69.4%), while renter-occupied units make up 203 (30.6%).
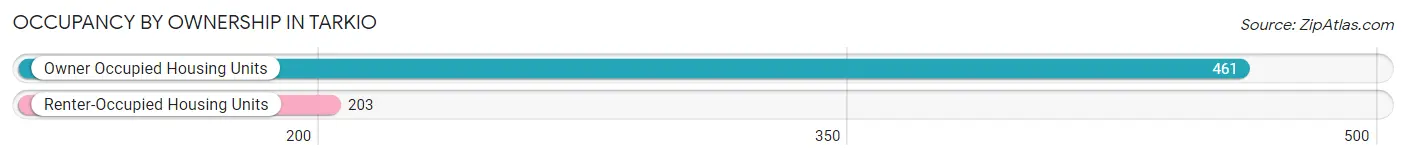
| Occupancy | # Housing Units | % Housing Units |
| Owner Occupied Housing Units | 461 | 69.4% |
| Renter-Occupied Housing Units | 203 | 30.6% |
| Total Occupied Housing Units | 664 | 100.0% |
Occupancy by Household Size in Tarkio
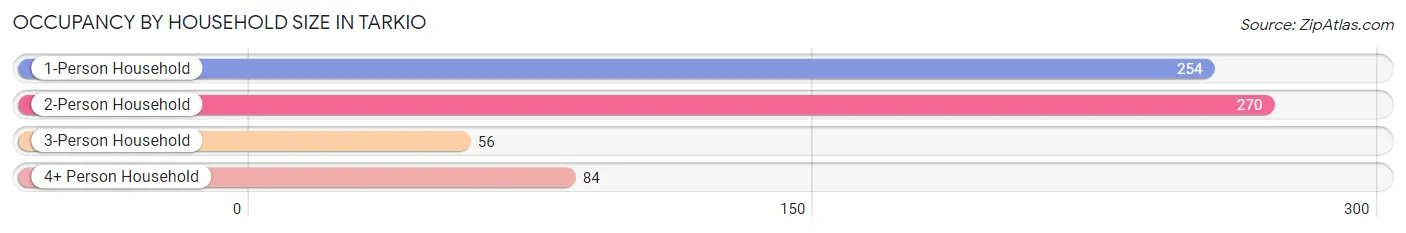
| Household Size | # Housing Units | % Housing Units |
| 1-Person Household | 254 | 38.3% |
| 2-Person Household | 270 | 40.7% |
| 3-Person Household | 56 | 8.4% |
| 4+ Person Household | 84 | 12.7% |
| Total Housing Units | 664 | 100.0% |
Occupancy by Ownership by Household Size in Tarkio
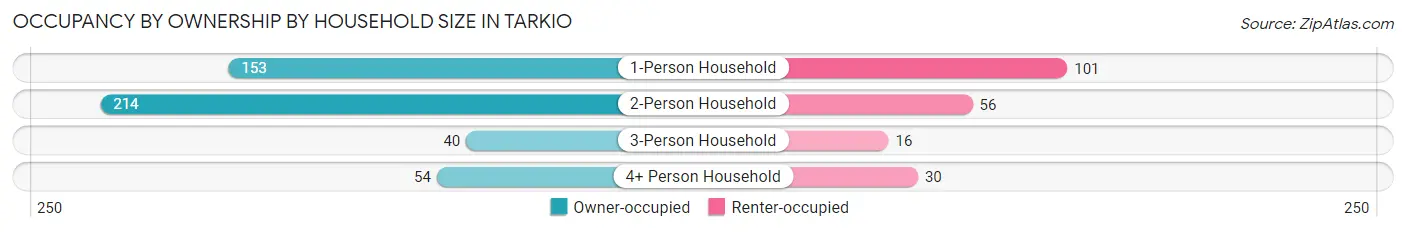
| Household Size | Owner-occupied | Renter-occupied |
| 1-Person Household | 153 (60.2%) | 101 (39.8%) |
| 2-Person Household | 214 (79.3%) | 56 (20.7%) |
| 3-Person Household | 40 (71.4%) | 16 (28.6%) |
| 4+ Person Household | 54 (64.3%) | 30 (35.7%) |
| Total Housing Units | 461 (69.4%) | 203 (30.6%) |
Occupancy by Educational Attainment in Tarkio
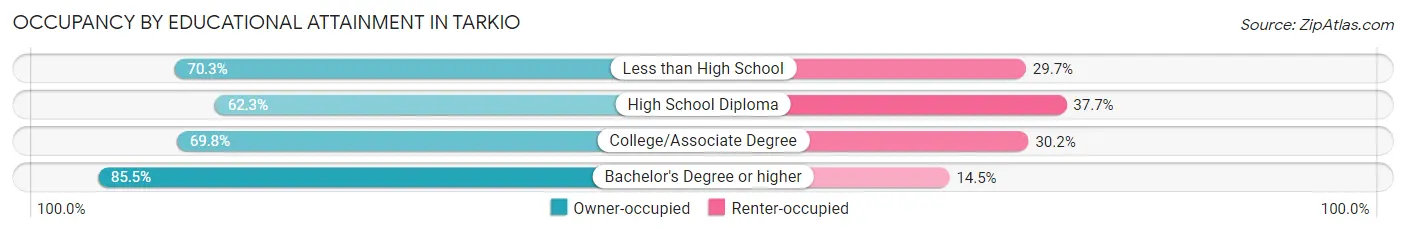
| Household Size | Owner-occupied | Renter-occupied |
| Less than High School | 45 (70.3%) | 19 (29.7%) |
| High School Diploma | 175 (62.3%) | 106 (37.7%) |
| College/Associate Degree | 141 (69.8%) | 61 (30.2%) |
| Bachelor's Degree or higher | 100 (85.5%) | 17 (14.5%) |
Occupancy by Age of Householder in Tarkio
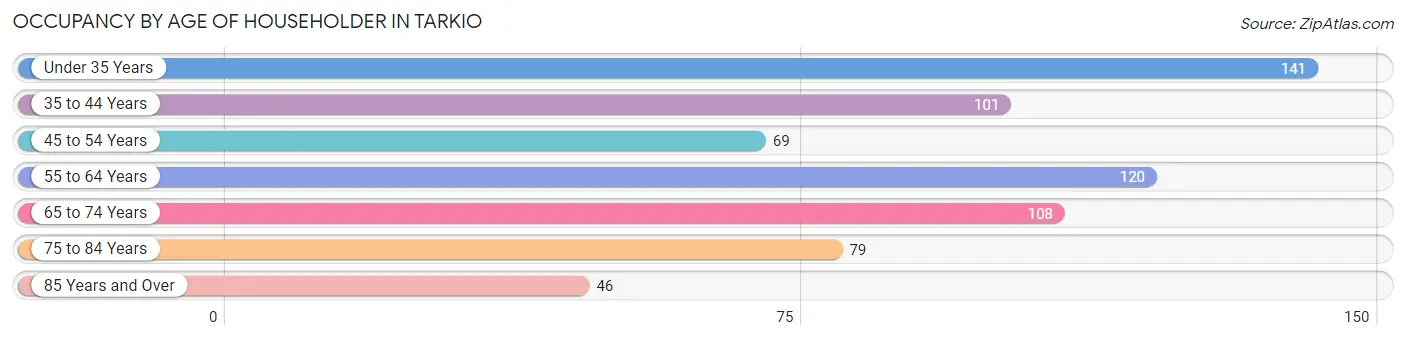
| Age Bracket | # Households | % Households |
| Under 35 Years | 141 | 21.2% |
| 35 to 44 Years | 101 | 15.2% |
| 45 to 54 Years | 69 | 10.4% |
| 55 to 64 Years | 120 | 18.1% |
| 65 to 74 Years | 108 | 16.3% |
| 75 to 84 Years | 79 | 11.9% |
| 85 Years and Over | 46 | 6.9% |
| Total | 664 | 100.0% |
Housing Finances in Tarkio
Median Income by Occupancy in Tarkio
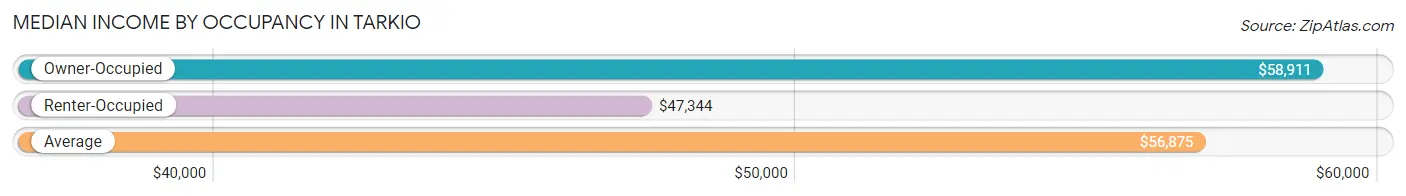
| Occupancy Type | # Households | Median Income |
| Owner-Occupied | 461 (69.4%) | $58,911 |
| Renter-Occupied | 203 (30.6%) | $47,344 |
| Average | 664 (100.0%) | $56,875 |
Occupancy by Householder Income Bracket in Tarkio
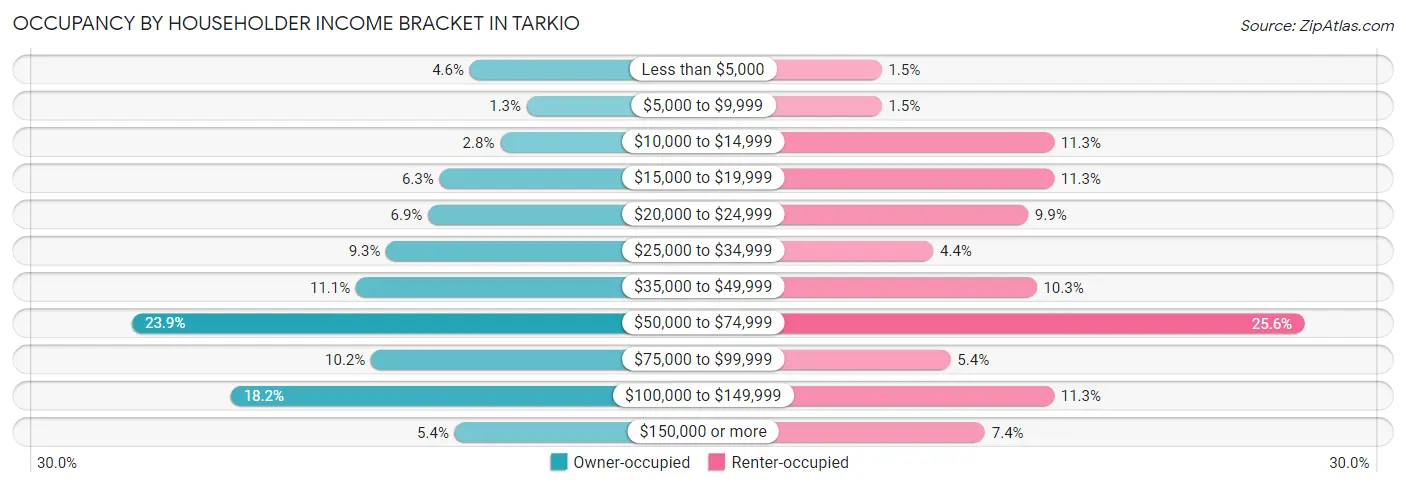
| Income Bracket | Owner-occupied | Renter-occupied |
| Less than $5,000 | 21 (4.6%) | 3 (1.5%) |
| $5,000 to $9,999 | 6 (1.3%) | 3 (1.5%) |
| $10,000 to $14,999 | 13 (2.8%) | 23 (11.3%) |
| $15,000 to $19,999 | 29 (6.3%) | 23 (11.3%) |
| $20,000 to $24,999 | 32 (6.9%) | 20 (9.9%) |
| $25,000 to $34,999 | 43 (9.3%) | 9 (4.4%) |
| $35,000 to $49,999 | 51 (11.1%) | 21 (10.3%) |
| $50,000 to $74,999 | 110 (23.9%) | 52 (25.6%) |
| $75,000 to $99,999 | 47 (10.2%) | 11 (5.4%) |
| $100,000 to $149,999 | 84 (18.2%) | 23 (11.3%) |
| $150,000 or more | 25 (5.4%) | 15 (7.4%) |
| Total | 461 (100.0%) | 203 (100.0%) |
Monthly Housing Cost Tiers in Tarkio
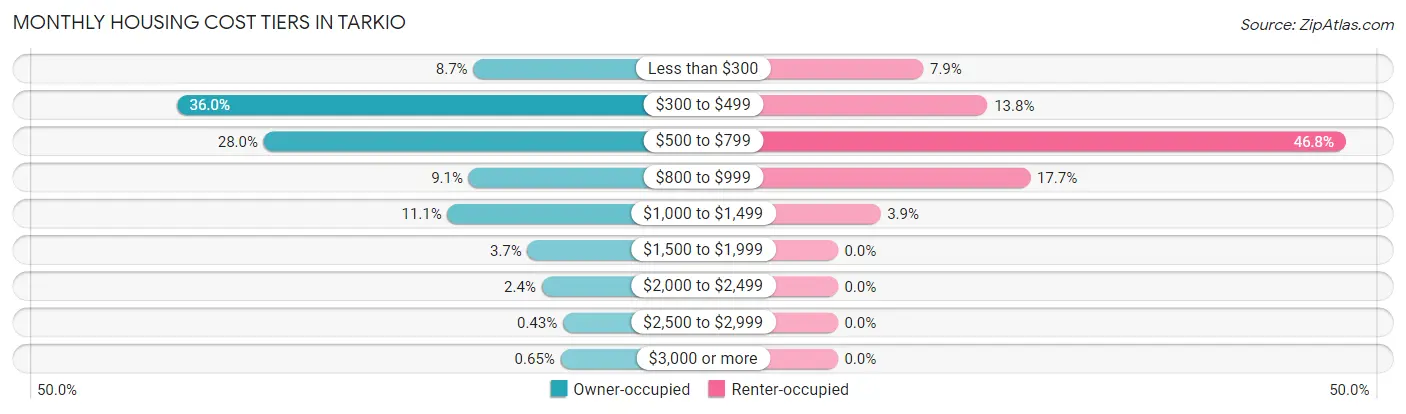
| Monthly Cost | Owner-occupied | Renter-occupied |
| Less than $300 | 40 (8.7%) | 16 (7.9%) |
| $300 to $499 | 166 (36.0%) | 28 (13.8%) |
| $500 to $799 | 129 (28.0%) | 95 (46.8%) |
| $800 to $999 | 42 (9.1%) | 36 (17.7%) |
| $1,000 to $1,499 | 51 (11.1%) | 8 (3.9%) |
| $1,500 to $1,999 | 17 (3.7%) | 0 (0.0%) |
| $2,000 to $2,499 | 11 (2.4%) | 0 (0.0%) |
| $2,500 to $2,999 | 2 (0.4%) | 0 (0.0%) |
| $3,000 or more | 3 (0.6%) | 0 (0.0%) |
| Total | 461 (100.0%) | 203 (100.0%) |
Physical Housing Characteristics in Tarkio
Housing Structures in Tarkio
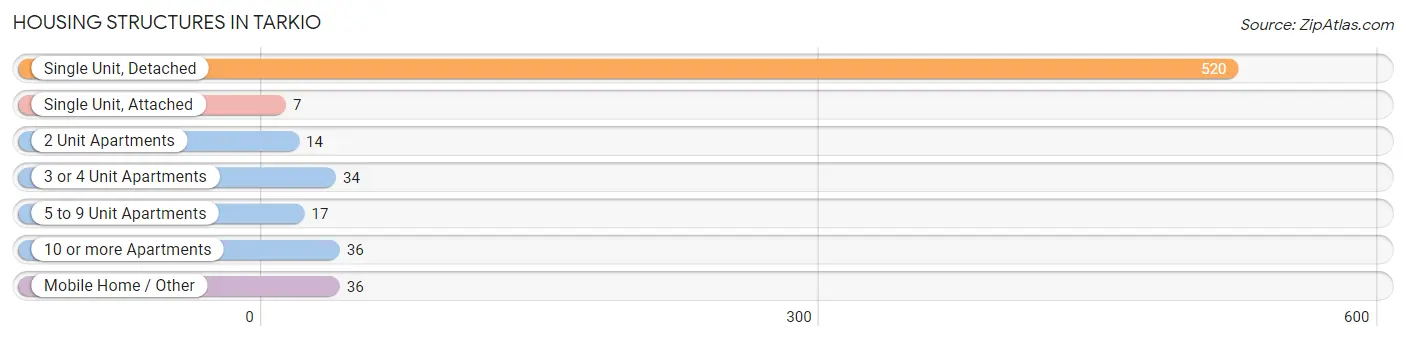
| Structure Type | # Housing Units | % Housing Units |
| Single Unit, Detached | 520 | 78.3% |
| Single Unit, Attached | 7 | 1.1% |
| 2 Unit Apartments | 14 | 2.1% |
| 3 or 4 Unit Apartments | 34 | 5.1% |
| 5 to 9 Unit Apartments | 17 | 2.6% |
| 10 or more Apartments | 36 | 5.4% |
| Mobile Home / Other | 36 | 5.4% |
| Total | 664 | 100.0% |
Housing Structures by Occupancy in Tarkio
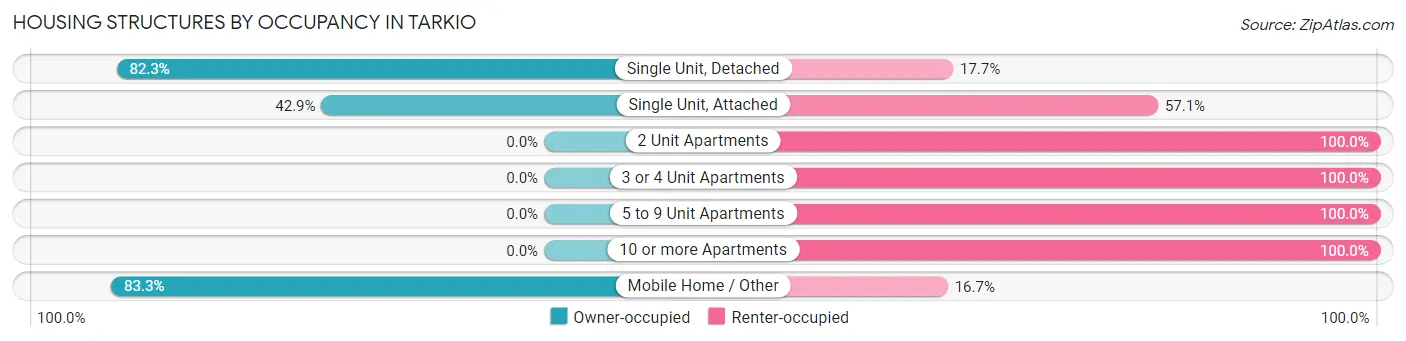
| Structure Type | Owner-occupied | Renter-occupied |
| Single Unit, Detached | 428 (82.3%) | 92 (17.7%) |
| Single Unit, Attached | 3 (42.9%) | 4 (57.1%) |
| 2 Unit Apartments | 0 (0.0%) | 14 (100.0%) |
| 3 or 4 Unit Apartments | 0 (0.0%) | 34 (100.0%) |
| 5 to 9 Unit Apartments | 0 (0.0%) | 17 (100.0%) |
| 10 or more Apartments | 0 (0.0%) | 36 (100.0%) |
| Mobile Home / Other | 30 (83.3%) | 6 (16.7%) |
| Total | 461 (69.4%) | 203 (30.6%) |
Housing Structures by Number of Rooms in Tarkio
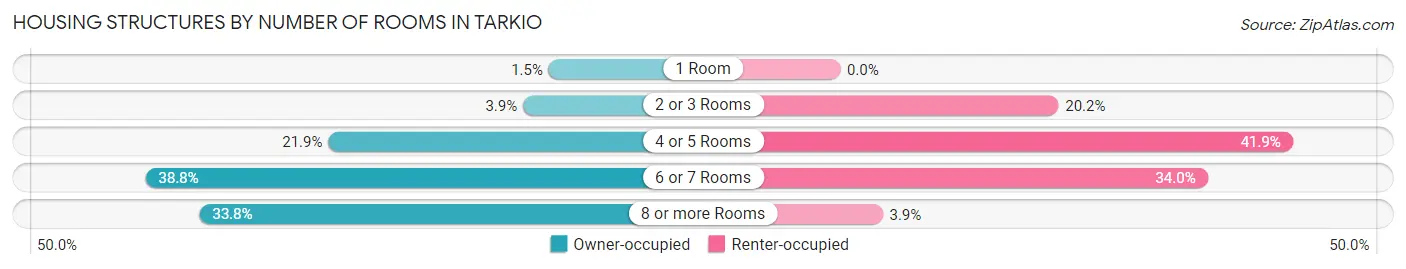
| Number of Rooms | Owner-occupied | Renter-occupied |
| 1 Room | 7 (1.5%) | 0 (0.0%) |
| 2 or 3 Rooms | 18 (3.9%) | 41 (20.2%) |
| 4 or 5 Rooms | 101 (21.9%) | 85 (41.9%) |
| 6 or 7 Rooms | 179 (38.8%) | 69 (34.0%) |
| 8 or more Rooms | 156 (33.8%) | 8 (3.9%) |
| Total | 461 (100.0%) | 203 (100.0%) |
Housing Structure by Heating Type in Tarkio
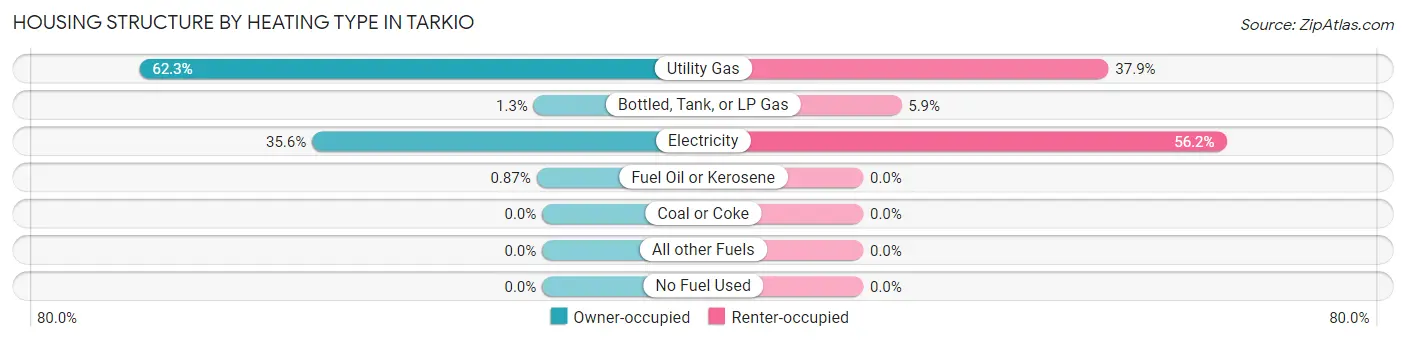
| Heating Type | Owner-occupied | Renter-occupied |
| Utility Gas | 287 (62.3%) | 77 (37.9%) |
| Bottled, Tank, or LP Gas | 6 (1.3%) | 12 (5.9%) |
| Electricity | 164 (35.6%) | 114 (56.2%) |
| Fuel Oil or Kerosene | 4 (0.9%) | 0 (0.0%) |
| Coal or Coke | 0 (0.0%) | 0 (0.0%) |
| All other Fuels | 0 (0.0%) | 0 (0.0%) |
| No Fuel Used | 0 (0.0%) | 0 (0.0%) |
| Total | 461 (100.0%) | 203 (100.0%) |
Household Vehicle Usage in Tarkio
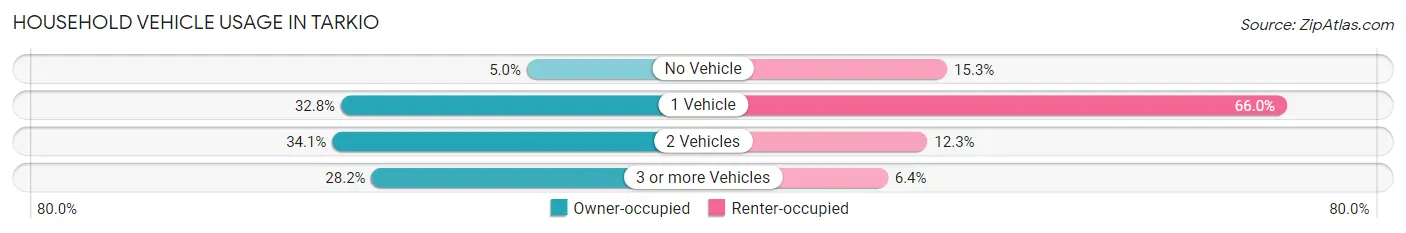
| Vehicles per Household | Owner-occupied | Renter-occupied |
| No Vehicle | 23 (5.0%) | 31 (15.3%) |
| 1 Vehicle | 151 (32.8%) | 134 (66.0%) |
| 2 Vehicles | 157 (34.1%) | 25 (12.3%) |
| 3 or more Vehicles | 130 (28.2%) | 13 (6.4%) |
| Total | 461 (100.0%) | 203 (100.0%) |
Real Estate & Mortgages in Tarkio
Real Estate and Mortgage Overview in Tarkio
| Characteristic | Without Mortgage | With Mortgage |
| Housing Units | 265 | 196 |
| Median Property Value | $82,200 | $83,600 |
| Median Household Income | $59,911 | $18 |
| Monthly Housing Costs | $434 | $3 |
| Real Estate Taxes | $1,165 | $3 |
Property Value by Mortgage Status in Tarkio
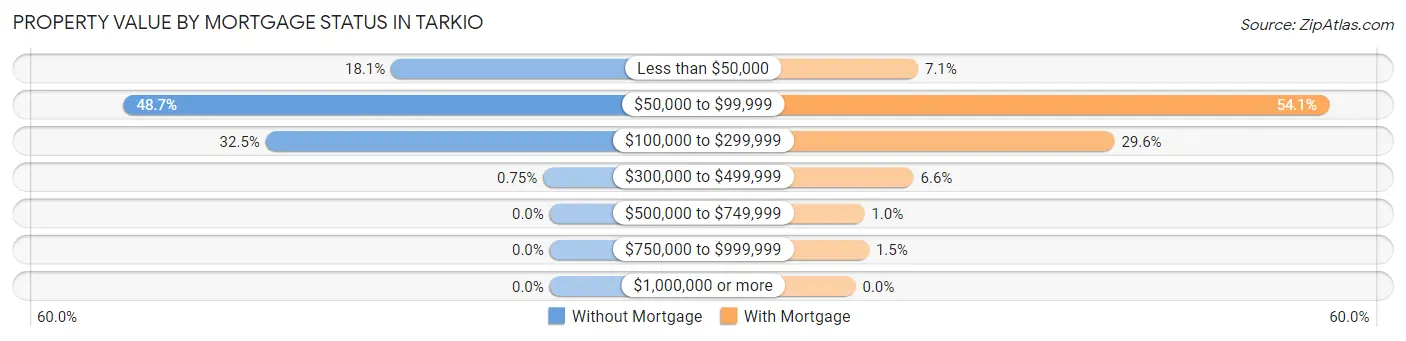
| Property Value | Without Mortgage | With Mortgage |
| Less than $50,000 | 48 (18.1%) | 14 (7.1%) |
| $50,000 to $99,999 | 129 (48.7%) | 106 (54.1%) |
| $100,000 to $299,999 | 86 (32.5%) | 58 (29.6%) |
| $300,000 to $499,999 | 2 (0.7%) | 13 (6.6%) |
| $500,000 to $749,999 | 0 (0.0%) | 2 (1.0%) |
| $750,000 to $999,999 | 0 (0.0%) | 3 (1.5%) |
| $1,000,000 or more | 0 (0.0%) | 0 (0.0%) |
| Total | 265 (100.0%) | 196 (100.0%) |
Household Income by Mortgage Status in Tarkio
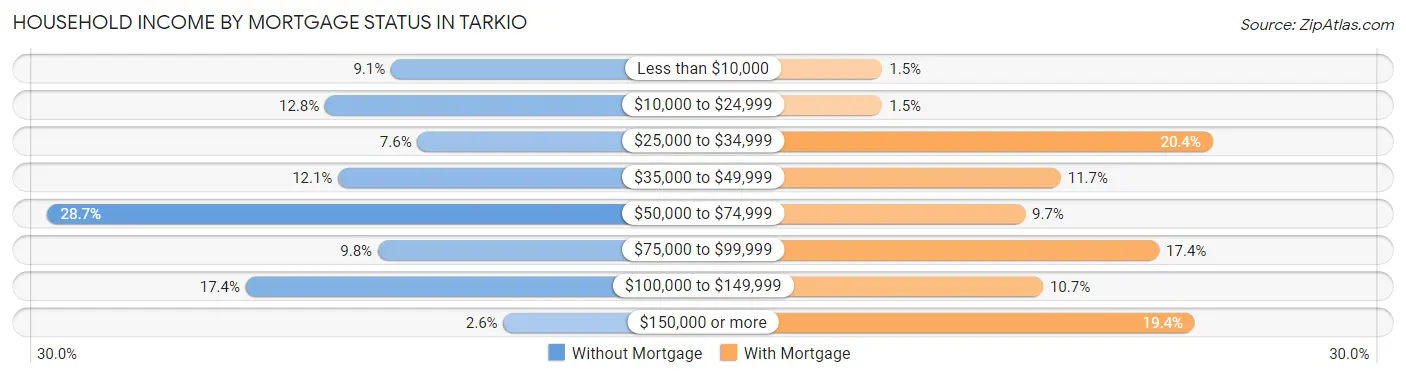
| Household Income | Without Mortgage | With Mortgage |
| Less than $10,000 | 24 (9.1%) | 3 (1.5%) |
| $10,000 to $24,999 | 34 (12.8%) | 3 (1.5%) |
| $25,000 to $34,999 | 20 (7.5%) | 40 (20.4%) |
| $35,000 to $49,999 | 32 (12.1%) | 23 (11.7%) |
| $50,000 to $74,999 | 76 (28.7%) | 19 (9.7%) |
| $75,000 to $99,999 | 26 (9.8%) | 34 (17.3%) |
| $100,000 to $149,999 | 46 (17.4%) | 21 (10.7%) |
| $150,000 or more | 7 (2.6%) | 38 (19.4%) |
| Total | 265 (100.0%) | 196 (100.0%) |
Property Value to Household Income Ratio in Tarkio
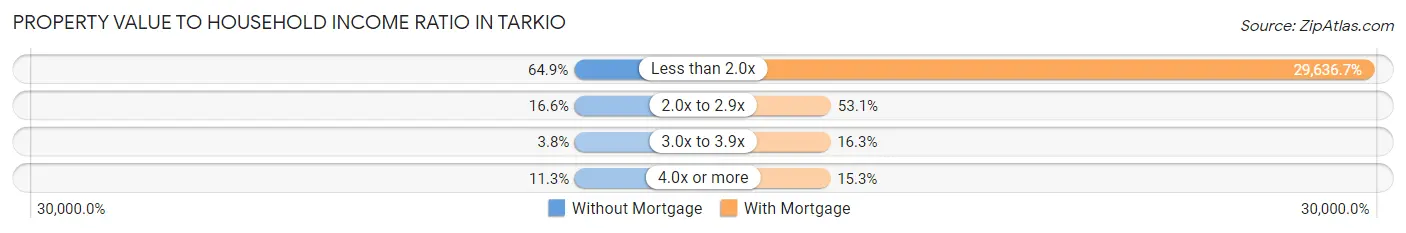
| Value-to-Income Ratio | Without Mortgage | With Mortgage |
| Less than 2.0x | 172 (64.9%) | 58,088 (29,636.7%) |
| 2.0x to 2.9x | 44 (16.6%) | 104 (53.1%) |
| 3.0x to 3.9x | 10 (3.8%) | 32 (16.3%) |
| 4.0x or more | 30 (11.3%) | 30 (15.3%) |
| Total | 265 (100.0%) | 196 (100.0%) |
Real Estate Taxes by Mortgage Status in Tarkio
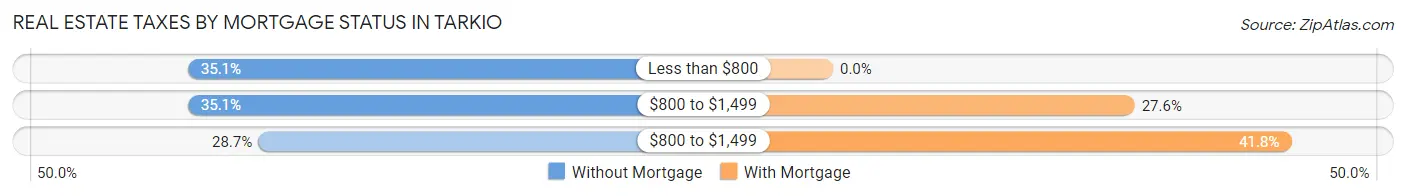
| Property Taxes | Without Mortgage | With Mortgage |
| Less than $800 | 93 (35.1%) | 0 (0.0%) |
| $800 to $1,499 | 93 (35.1%) | 54 (27.6%) |
| $800 to $1,499 | 76 (28.7%) | 82 (41.8%) |
| Total | 265 (100.0%) | 196 (100.0%) |
Health & Disability in Tarkio
Health Insurance Coverage by Age in Tarkio
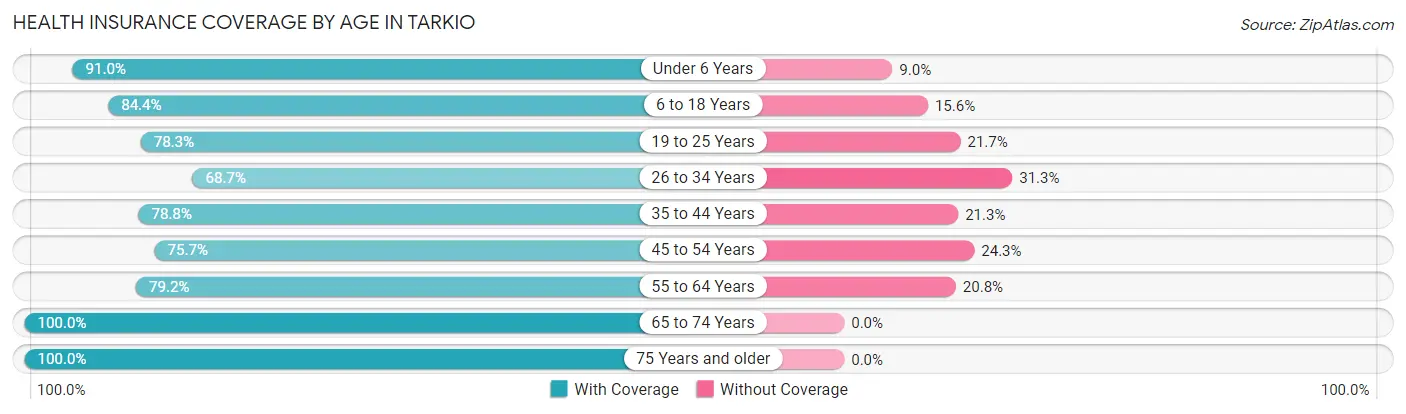
| Age Bracket | With Coverage | Without Coverage |
| Under 6 Years | 71 (91.0%) | 7 (9.0%) |
| 6 to 18 Years | 173 (84.4%) | 32 (15.6%) |
| 19 to 25 Years | 112 (78.3%) | 31 (21.7%) |
| 26 to 34 Years | 103 (68.7%) | 47 (31.3%) |
| 35 to 44 Years | 126 (78.7%) | 34 (21.2%) |
| 45 to 54 Years | 103 (75.7%) | 33 (24.3%) |
| 55 to 64 Years | 175 (79.2%) | 46 (20.8%) |
| 65 to 74 Years | 176 (100.0%) | 0 (0.0%) |
| 75 Years and older | 173 (100.0%) | 0 (0.0%) |
| Total | 1,212 (84.1%) | 230 (16.0%) |
Health Insurance Coverage by Citizenship Status in Tarkio
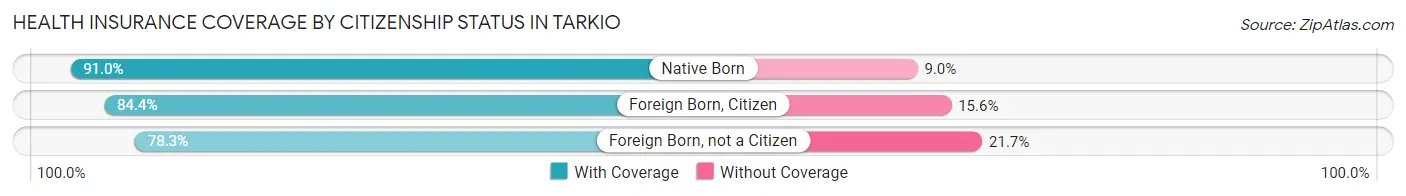
| Citizenship Status | With Coverage | Without Coverage |
| Native Born | 71 (91.0%) | 7 (9.0%) |
| Foreign Born, Citizen | 173 (84.4%) | 32 (15.6%) |
| Foreign Born, not a Citizen | 112 (78.3%) | 31 (21.7%) |
Health Insurance Coverage by Household Income in Tarkio
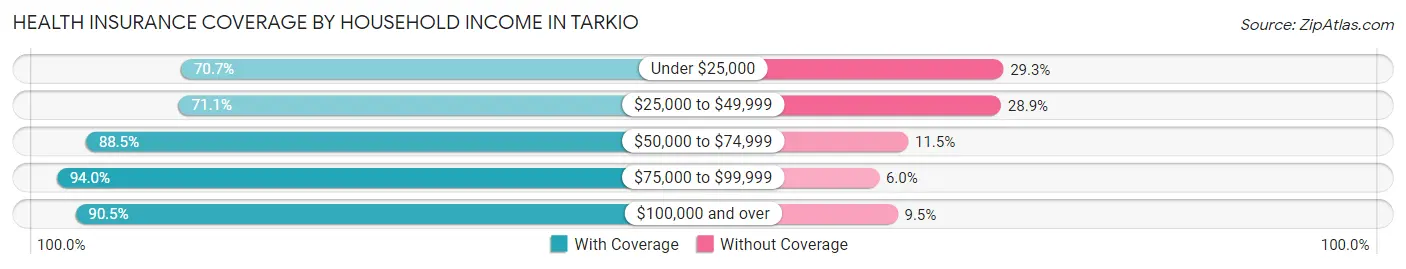
| Household Income | With Coverage | Without Coverage |
| Under $25,000 | 193 (70.7%) | 80 (29.3%) |
| $25,000 to $49,999 | 138 (71.1%) | 56 (28.9%) |
| $50,000 to $74,999 | 355 (88.5%) | 46 (11.5%) |
| $75,000 to $99,999 | 125 (94.0%) | 8 (6.0%) |
| $100,000 and over | 381 (90.5%) | 40 (9.5%) |
Public vs Private Health Insurance Coverage by Age in Tarkio
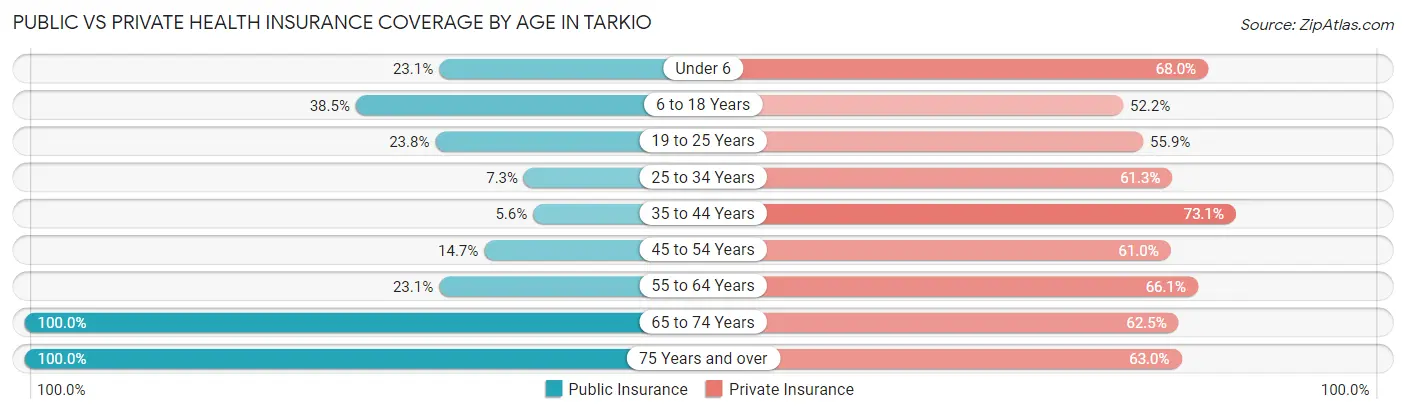
| Age Bracket | Public Insurance | Private Insurance |
| Under 6 | 18 (23.1%) | 53 (67.9%) |
| 6 to 18 Years | 79 (38.5%) | 107 (52.2%) |
| 19 to 25 Years | 34 (23.8%) | 80 (55.9%) |
| 25 to 34 Years | 11 (7.3%) | 92 (61.3%) |
| 35 to 44 Years | 9 (5.6%) | 117 (73.1%) |
| 45 to 54 Years | 20 (14.7%) | 83 (61.0%) |
| 55 to 64 Years | 51 (23.1%) | 146 (66.1%) |
| 65 to 74 Years | 176 (100.0%) | 110 (62.5%) |
| 75 Years and over | 173 (100.0%) | 109 (63.0%) |
| Total | 571 (39.6%) | 897 (62.2%) |
Disability Status by Sex by Age in Tarkio
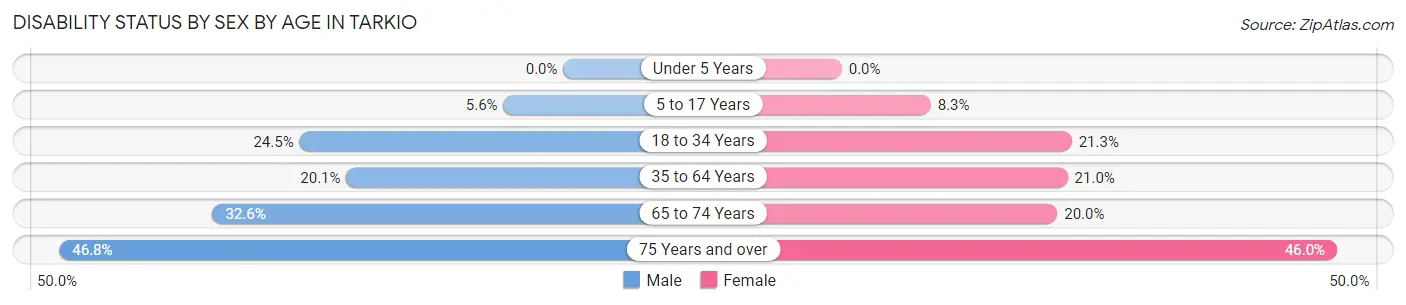
| Age Bracket | Male | Female |
| Under 5 Years | 0 (0.0%) | 0 (0.0%) |
| 5 to 17 Years | 5 (5.6%) | 8 (8.3%) |
| 18 to 34 Years | 36 (24.5%) | 35 (21.3%) |
| 35 to 64 Years | 58 (20.1%) | 48 (21.0%) |
| 65 to 74 Years | 28 (32.6%) | 18 (20.0%) |
| 75 Years and over | 29 (46.8%) | 51 (46.0%) |
Disability Class by Sex by Age in Tarkio
Disability Class: Hearing Difficulty
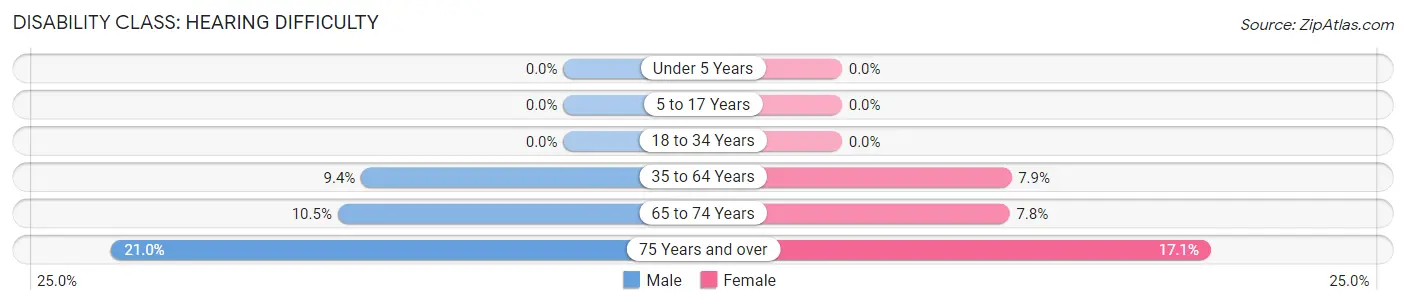
| Age Bracket | Male | Female |
| Under 5 Years | 0 (0.0%) | 0 (0.0%) |
| 5 to 17 Years | 0 (0.0%) | 0 (0.0%) |
| 18 to 34 Years | 0 (0.0%) | 0 (0.0%) |
| 35 to 64 Years | 27 (9.4%) | 18 (7.9%) |
| 65 to 74 Years | 9 (10.5%) | 7 (7.8%) |
| 75 Years and over | 13 (21.0%) | 19 (17.1%) |
Disability Class: Vision Difficulty
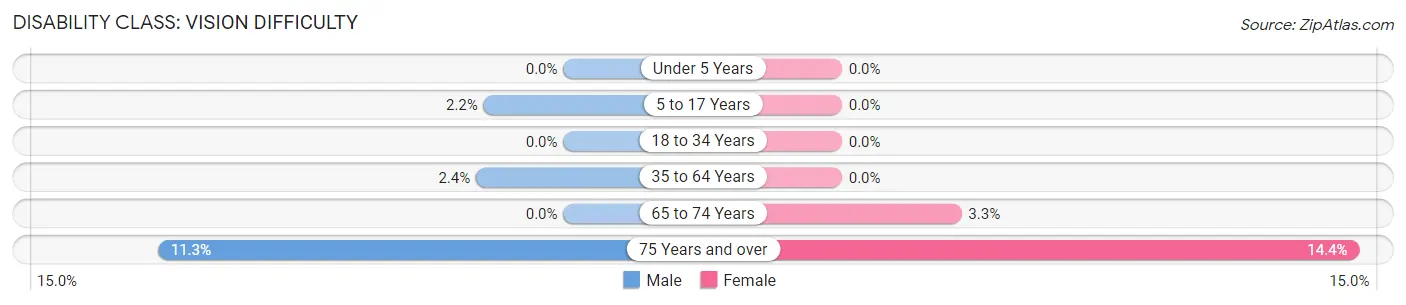
| Age Bracket | Male | Female |
| Under 5 Years | 0 (0.0%) | 0 (0.0%) |
| 5 to 17 Years | 2 (2.2%) | 0 (0.0%) |
| 18 to 34 Years | 0 (0.0%) | 0 (0.0%) |
| 35 to 64 Years | 7 (2.4%) | 0 (0.0%) |
| 65 to 74 Years | 0 (0.0%) | 3 (3.3%) |
| 75 Years and over | 7 (11.3%) | 16 (14.4%) |
Disability Class: Cognitive Difficulty
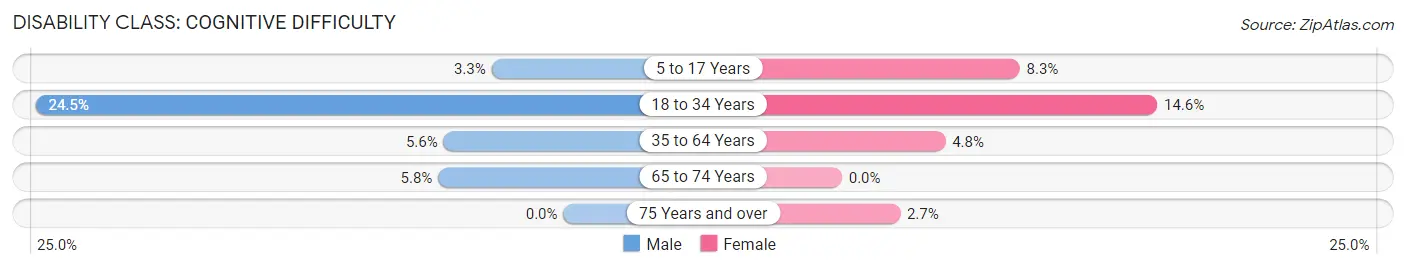
| Age Bracket | Male | Female |
| 5 to 17 Years | 3 (3.3%) | 8 (8.3%) |
| 18 to 34 Years | 36 (24.5%) | 24 (14.6%) |
| 35 to 64 Years | 16 (5.6%) | 11 (4.8%) |
| 65 to 74 Years | 5 (5.8%) | 0 (0.0%) |
| 75 Years and over | 0 (0.0%) | 3 (2.7%) |
Disability Class: Ambulatory Difficulty
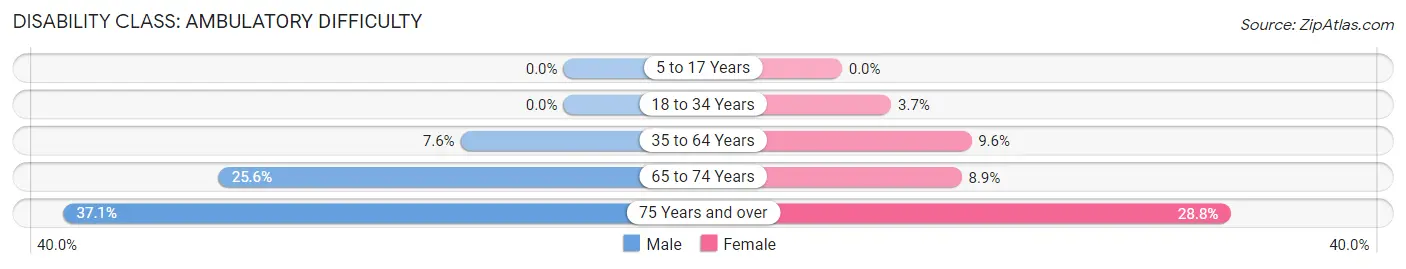
| Age Bracket | Male | Female |
| 5 to 17 Years | 0 (0.0%) | 0 (0.0%) |
| 18 to 34 Years | 0 (0.0%) | 6 (3.7%) |
| 35 to 64 Years | 22 (7.6%) | 22 (9.6%) |
| 65 to 74 Years | 22 (25.6%) | 8 (8.9%) |
| 75 Years and over | 23 (37.1%) | 32 (28.8%) |
Disability Class: Self-Care Difficulty
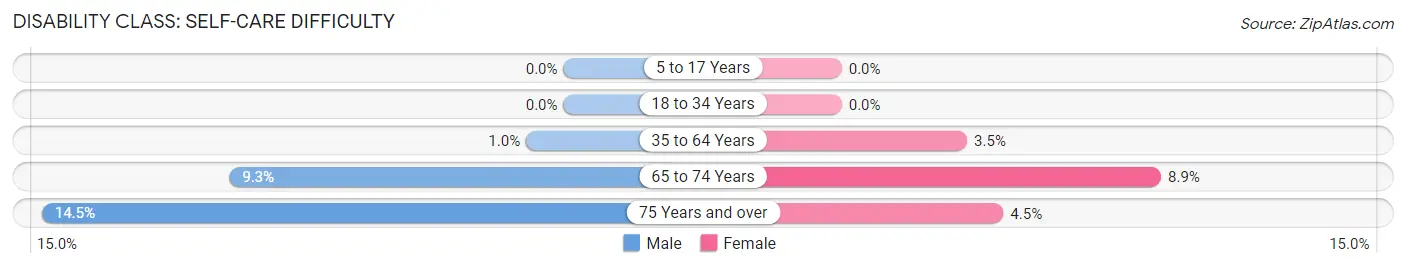
| Age Bracket | Male | Female |
| 5 to 17 Years | 0 (0.0%) | 0 (0.0%) |
| 18 to 34 Years | 0 (0.0%) | 0 (0.0%) |
| 35 to 64 Years | 3 (1.0%) | 8 (3.5%) |
| 65 to 74 Years | 8 (9.3%) | 8 (8.9%) |
| 75 Years and over | 9 (14.5%) | 5 (4.5%) |
Technology Access in Tarkio
Computing Device Access in Tarkio
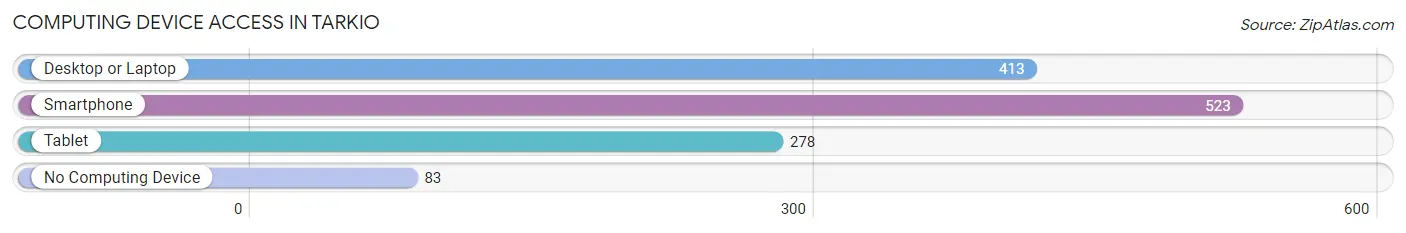
| Device Type | # Households | % Households |
| Desktop or Laptop | 413 | 62.2% |
| Smartphone | 523 | 78.8% |
| Tablet | 278 | 41.9% |
| No Computing Device | 83 | 12.5% |
| Total | 664 | 100.0% |
Internet Access in Tarkio
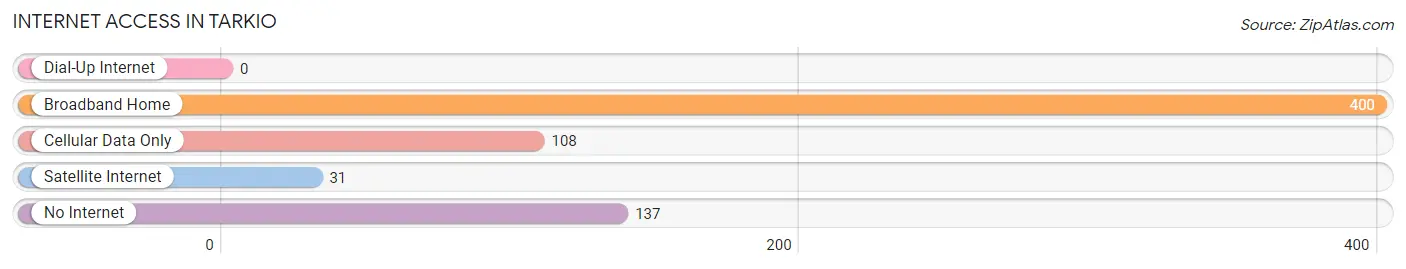
| Internet Type | # Households | % Households |
| Dial-Up Internet | 0 | 0.0% |
| Broadband Home | 400 | 60.2% |
| Cellular Data Only | 108 | 16.3% |
| Satellite Internet | 31 | 4.7% |
| No Internet | 137 | 20.6% |
| Total | 664 | 100.0% |
Tarkio Summary
Tarkio is a small city located in the northwest corner of Missouri, in Atchison County. It is situated on the banks of the Tarkio River, and is surrounded by rolling hills and farmland. The city has a population of 1,717 people, according to the 2010 census.
History
Tarkio was founded in 1858 by a group of settlers from Ohio. The city was named after the Tarkio River, which was named after a Native American chief. The settlers were attracted to the area by the fertile soil and abundant natural resources. The city was incorporated in 1872.
In the late 19th century, Tarkio became a center for the lumber industry. The city was also home to several flour mills, which supplied flour to the surrounding area. In the early 20th century, Tarkio became a center for the dairy industry.
Geography
Tarkio is located in the northwest corner of Missouri, in Atchison County. It is situated on the banks of the Tarkio River, and is surrounded by rolling hills and farmland. The city has a total area of 1.2 square miles, all of which is land.
Economy
Tarkio’s economy is largely based on agriculture. The city is home to several dairy farms, as well as a number of grain and livestock farms. The city is also home to several manufacturing companies, including a furniture factory and a plastics factory.
Demographics
According to the 2010 census, Tarkio has a population of 1,717 people. The population is predominantly white (96.2%), with a small percentage of African Americans (1.3%) and Hispanics (1.2%). The median household income is $37,917, and the median age is 41.7 years.
Tarkio is a small city with a rich history and a strong agricultural economy. The city is home to a diverse population, and is a great place to live and work. With its rolling hills and abundant natural resources, Tarkio is a great place to call home.
Common Questions
What is Per Capita Income in Tarkio?
Per Capita income in Tarkio is $31,471.
What is the Median Family Income in Tarkio?
Median Family Income in Tarkio is $64,783.
What is the Median Household income in Tarkio?
Median Household Income in Tarkio is $56,875.
What is Income or Wage Gap in Tarkio?
Income or Wage Gap in Tarkio is 15.7%.
Women in Tarkio earn 84.3 cents for every dollar earned by a man.
What is Inequality or Gini Index in Tarkio?
Inequality or Gini Index in Tarkio is 0.42.
What is the Total Population of Tarkio?
Total Population of Tarkio is 1,473.
What is the Total Male Population of Tarkio?
Total Male Population of Tarkio is 739.
What is the Total Female Population of Tarkio?
Total Female Population of Tarkio is 734.
What is the Ratio of Males per 100 Females in Tarkio?
There are 100.68 Males per 100 Females in Tarkio.
What is the Ratio of Females per 100 Males in Tarkio?
There are 99.32 Females per 100 Males in Tarkio.
What is the Median Population Age in Tarkio?
Median Population Age in Tarkio is 45.3 Years.
What is the Average Family Size in Tarkio
Average Family Size in Tarkio is 2.8 People.
What is the Average Household Size in Tarkio
Average Household Size in Tarkio is 2.1 People.
How Large is the Labor Force in Tarkio?
There are 752 People in the Labor Forcein in Tarkio.
What is the Percentage of People in the Labor Force in Tarkio?
60.9% of People are in the Labor Force in Tarkio.
What is the Unemployment Rate in Tarkio?
Unemployment Rate in Tarkio is 2.8%.