Tallapoosa, MO Map & Demographics
Tallapoosa Map
Tallapoosa Overview
$17,629
PER CAPITA INCOME
$50,000
AVG FAMILY INCOME
$49,583
AVG HOUSEHOLD INCOME
0.23
INEQUALITY / GINI INDEX
80
TOTAL POPULATION
42
MALE POPULATION
38
FEMALE POPULATION
110.53
MALES / 100 FEMALES
90.48
FEMALES / 100 MALES
45.5
MEDIAN AGE
2.4
AVG FAMILY SIZE
2.6
AVG HOUSEHOLD SIZE
40
LABOR FORCE [ PEOPLE ]
57.1%
PERCENT IN LABOR FORCE
Tallapoosa Zip Codes
Tallapoosa Area Codes
Income in Tallapoosa
Income Overview in Tallapoosa
Per Capita Income in Tallapoosa is $17,629, while median incomes of families and households are $50,000 and $49,583 respectively.
| Characteristic | Number | Measure |
| Per Capita Income | 80 | $17,629 |
| Median Family Income | 30 | $50,000 |
| Mean Family Income | 30 | $45,773 |
| Median Household Income | 31 | $49,583 |
| Mean Household Income | 31 | $46,310 |
| Income Deficit | 30 | $0 |
| Wage / Income Gap (%) | 80 | 0.00% |
| Wage / Income Gap ($) | 80 | 100.00¢ per $1 |
| Gini / Inequality Index | 80 | 0.23 |
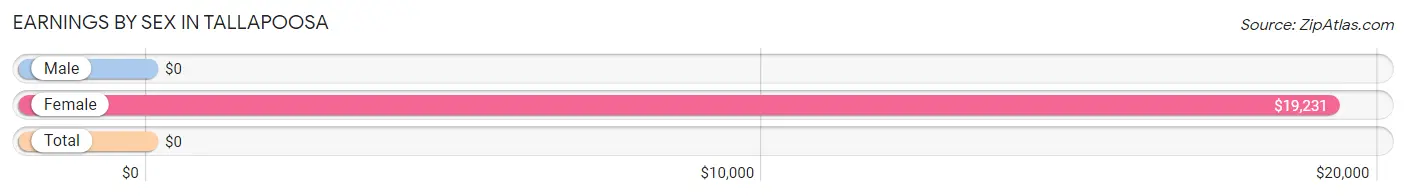
Earnings by Sex in Tallapoosa
| Sex | Number | Average Earnings |
| Male | 19 (44.2%) | $0 |
| Female | 24 (55.8%) | $19,231 |
| Total | 43 (100.0%) | $0 |
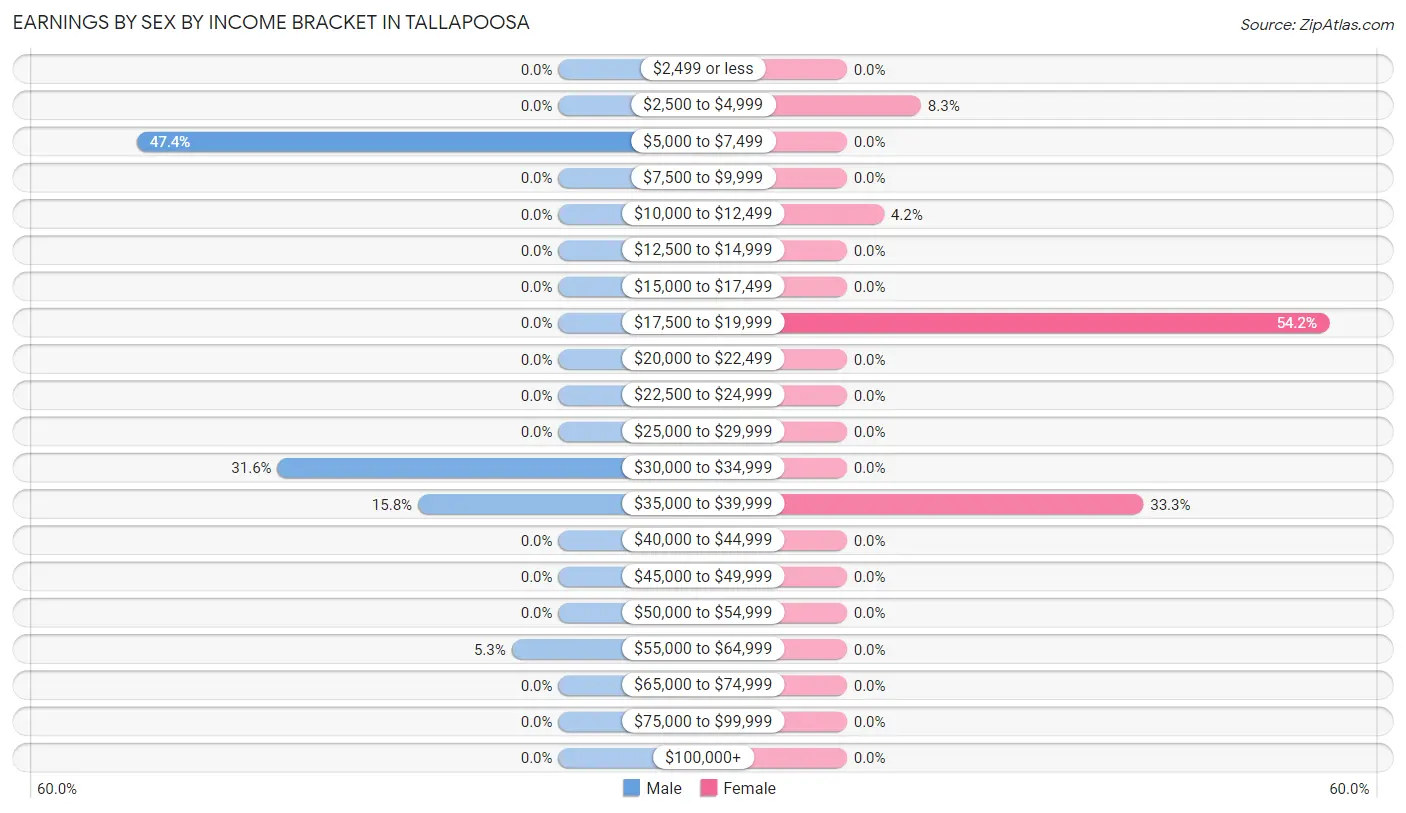
Earnings by Sex by Income Bracket in Tallapoosa
The most common earnings brackets in Tallapoosa are $5,000 to $7,499 for men (9 | 47.4%) and $17,500 to $19,999 for women (13 | 54.2%).
| Income | Male | Female |
| $2,499 or less | 0 (0.0%) | 0 (0.0%) |
| $2,500 to $4,999 | 0 (0.0%) | 2 (8.3%) |
| $5,000 to $7,499 | 9 (47.4%) | 0 (0.0%) |
| $7,500 to $9,999 | 0 (0.0%) | 0 (0.0%) |
| $10,000 to $12,499 | 0 (0.0%) | 1 (4.2%) |
| $12,500 to $14,999 | 0 (0.0%) | 0 (0.0%) |
| $15,000 to $17,499 | 0 (0.0%) | 0 (0.0%) |
| $17,500 to $19,999 | 0 (0.0%) | 13 (54.2%) |
| $20,000 to $22,499 | 0 (0.0%) | 0 (0.0%) |
| $22,500 to $24,999 | 0 (0.0%) | 0 (0.0%) |
| $25,000 to $29,999 | 0 (0.0%) | 0 (0.0%) |
| $30,000 to $34,999 | 6 (31.6%) | 0 (0.0%) |
| $35,000 to $39,999 | 3 (15.8%) | 8 (33.3%) |
| $40,000 to $44,999 | 0 (0.0%) | 0 (0.0%) |
| $45,000 to $49,999 | 0 (0.0%) | 0 (0.0%) |
| $50,000 to $54,999 | 0 (0.0%) | 0 (0.0%) |
| $55,000 to $64,999 | 1 (5.3%) | 0 (0.0%) |
| $65,000 to $74,999 | 0 (0.0%) | 0 (0.0%) |
| $75,000 to $99,999 | 0 (0.0%) | 0 (0.0%) |
| $100,000+ | 0 (0.0%) | 0 (0.0%) |
| Total | 19 (100.0%) | 24 (100.0%) |
Earnings by Sex by Educational Attainment in Tallapoosa
| Educational Attainment | Male Income | Female Income |
| Less than High School | - | - |
| High School Diploma | - | - |
| College or Associate's Degree | - | - |
| Bachelor's Degree | - | - |
| Graduate Degree | - | - |
| Total | - | - |
Family Income in Tallapoosa
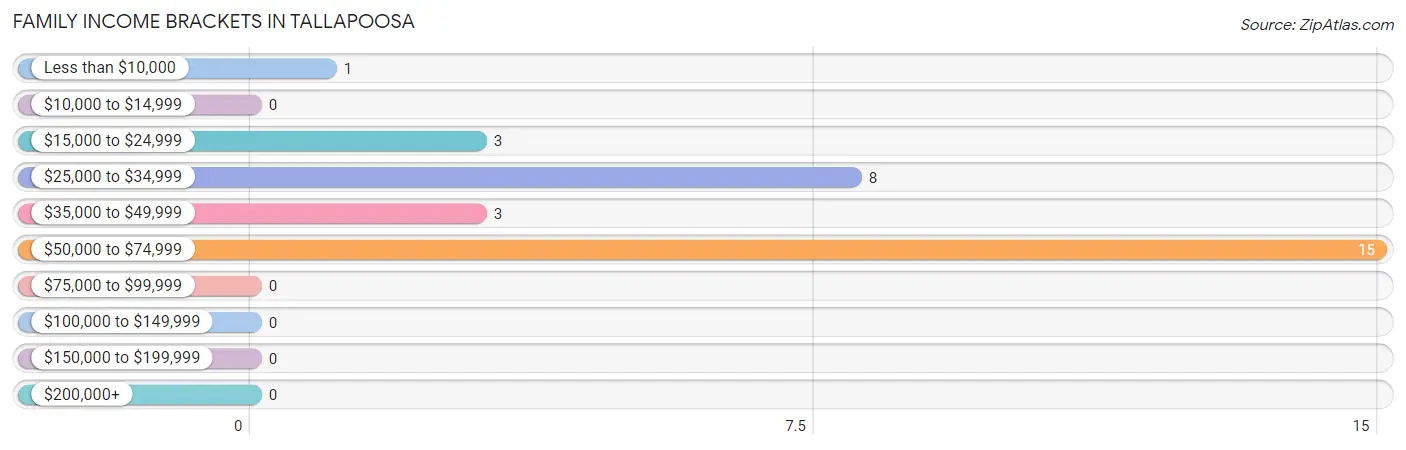
Family Income Brackets in Tallapoosa
According to the Tallapoosa family income data, there are 15 families falling into the $50,000 to $74,999 income range, which is the most common income bracket and makes up 50.0% of all families.
| Income Bracket | # Families | % Families |
| Less than $10,000 | 1 | 3.3% |
| $10,000 to $14,999 | 0 | 0.0% |
| $15,000 to $24,999 | 3 | 10.0% |
| $25,000 to $34,999 | 8 | 26.7% |
| $35,000 to $49,999 | 3 | 10.0% |
| $50,000 to $74,999 | 15 | 50.0% |
| $75,000 to $99,999 | 0 | 0.0% |
| $100,000 to $149,999 | 0 | 0.0% |
| $150,000 to $199,999 | 0 | 0.0% |
| $200,000+ | 0 | 0.0% |
Family Income by Famaliy Size in Tallapoosa
| Income Bracket | # Families | Median Income |
| 2-Person Families | 23 (76.7%) | $0 |
| 3-Person Families | 0 (0.0%) | $0 |
| 4-Person Families | 7 (23.3%) | $0 |
| 5-Person Families | 0 (0.0%) | $0 |
| 6-Person Families | 0 (0.0%) | $0 |
| 7+ Person Families | 0 (0.0%) | $0 |
| Total | 30 (100.0%) | $50,000 |
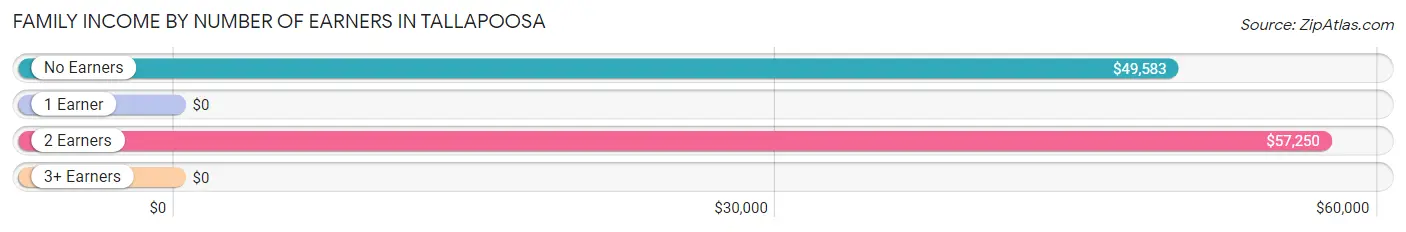
Family Income by Number of Earners in Tallapoosa
| Number of Earners | # Families | Median Income |
| No Earners | 7 (23.3%) | $49,583 |
| 1 Earner | 8 (26.7%) | $0 |
| 2 Earners | 15 (50.0%) | $57,250 |
| 3+ Earners | 0 (0.0%) | $0 |
| Total | 30 (100.0%) | $50,000 |
Household Income in Tallapoosa
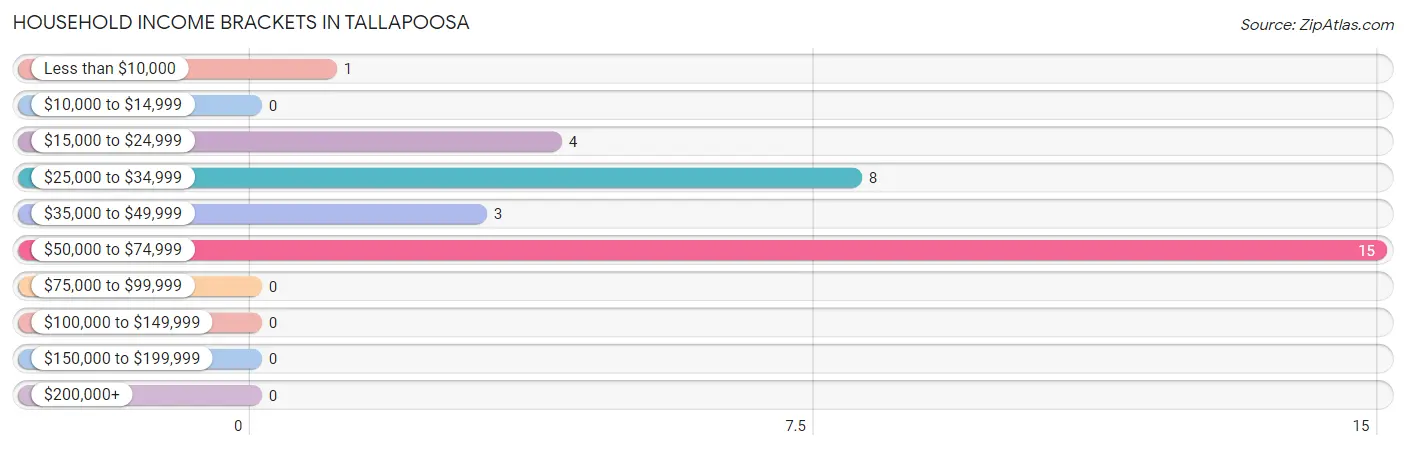
Household Income Brackets in Tallapoosa
With 15 households falling in the category, the $50,000 to $74,999 income range is the most frequent in Tallapoosa, accounting for 48.4% of all households.
| Income Bracket | # Households | % Households |
| Less than $10,000 | 1 | 3.2% |
| $10,000 to $14,999 | 0 | 0.0% |
| $15,000 to $24,999 | 4 | 12.9% |
| $25,000 to $34,999 | 8 | 25.8% |
| $35,000 to $49,999 | 3 | 9.7% |
| $50,000 to $74,999 | 15 | 48.4% |
| $75,000 to $99,999 | 0 | 0.0% |
| $100,000 to $149,999 | 0 | 0.0% |
| $150,000 to $199,999 | 0 | 0.0% |
| $200,000+ | 0 | 0.0% |
Household Income by Householder Age in Tallapoosa
The median household income in Tallapoosa is $49,583, with the highest median household income of $57,000 found in the 45 to 64 years age bracket for the primary householder. A total of 14 households (45.2%) fall into this category.
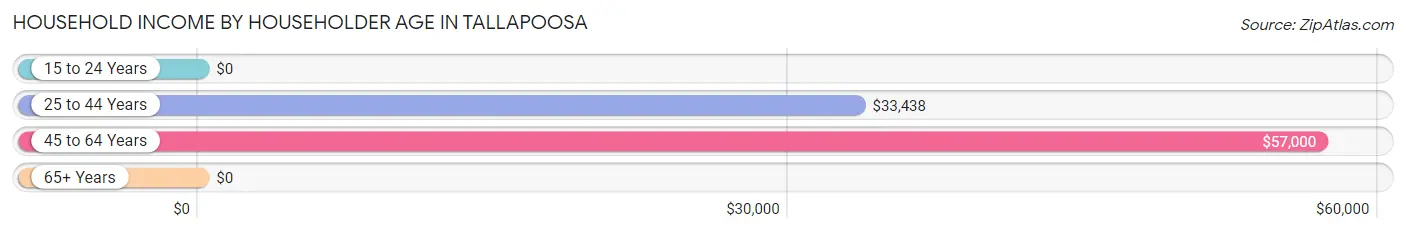
| Income Bracket | # Households | Median Income |
| 15 to 24 Years | 0 (0.0%) | $0 |
| 25 to 44 Years | 12 (38.7%) | $33,438 |
| 45 to 64 Years | 14 (45.2%) | $57,000 |
| 65+ Years | 5 (16.1%) | $0 |
| Total | 31 (100.0%) | $49,583 |
Poverty in Tallapoosa
Income Below Poverty by Sex and Age in Tallapoosa
With 23.8% poverty level for males and 5.3% for females among the residents of Tallapoosa, 35 to 44 year old males and 75 year old and over females are the most vulnerable to poverty, with 3 males (100.0%) and 1 females (25.0%) in their respective age groups living below the poverty level.
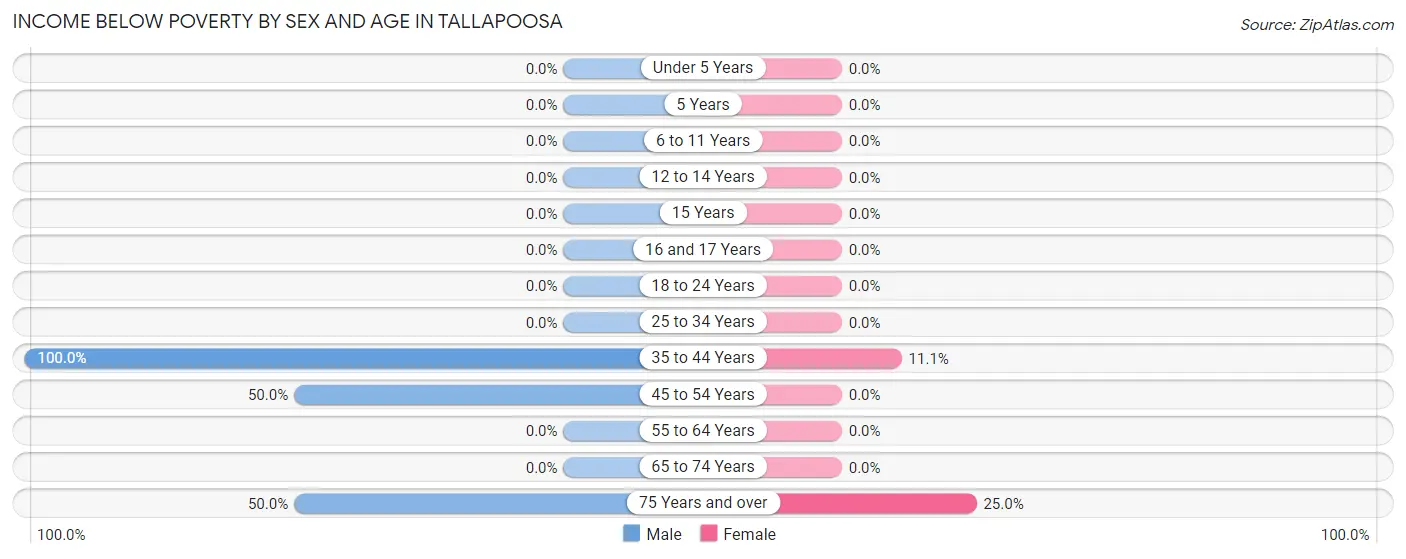
| Age Bracket | Male | Female |
| Under 5 Years | 0 (0.0%) | 0 (0.0%) |
| 5 Years | 0 (0.0%) | 0 (0.0%) |
| 6 to 11 Years | 0 (0.0%) | 0 (0.0%) |
| 12 to 14 Years | 0 (0.0%) | 0 (0.0%) |
| 15 Years | 0 (0.0%) | 0 (0.0%) |
| 16 and 17 Years | 0 (0.0%) | 0 (0.0%) |
| 18 to 24 Years | 0 (0.0%) | 0 (0.0%) |
| 25 to 34 Years | 0 (0.0%) | 0 (0.0%) |
| 35 to 44 Years | 3 (100.0%) | 1 (11.1%) |
| 45 to 54 Years | 6 (50.0%) | 0 (0.0%) |
| 55 to 64 Years | 0 (0.0%) | 0 (0.0%) |
| 65 to 74 Years | 0 (0.0%) | 0 (0.0%) |
| 75 Years and over | 1 (50.0%) | 1 (25.0%) |
| Total | 10 (23.8%) | 2 (5.3%) |
Income Above Poverty by Sex and Age in Tallapoosa
According to the poverty statistics in Tallapoosa, males aged under 5 years and females aged under 5 years are the age groups that are most secure financially, with 100.0% of males and 100.0% of females in these age groups living above the poverty line.
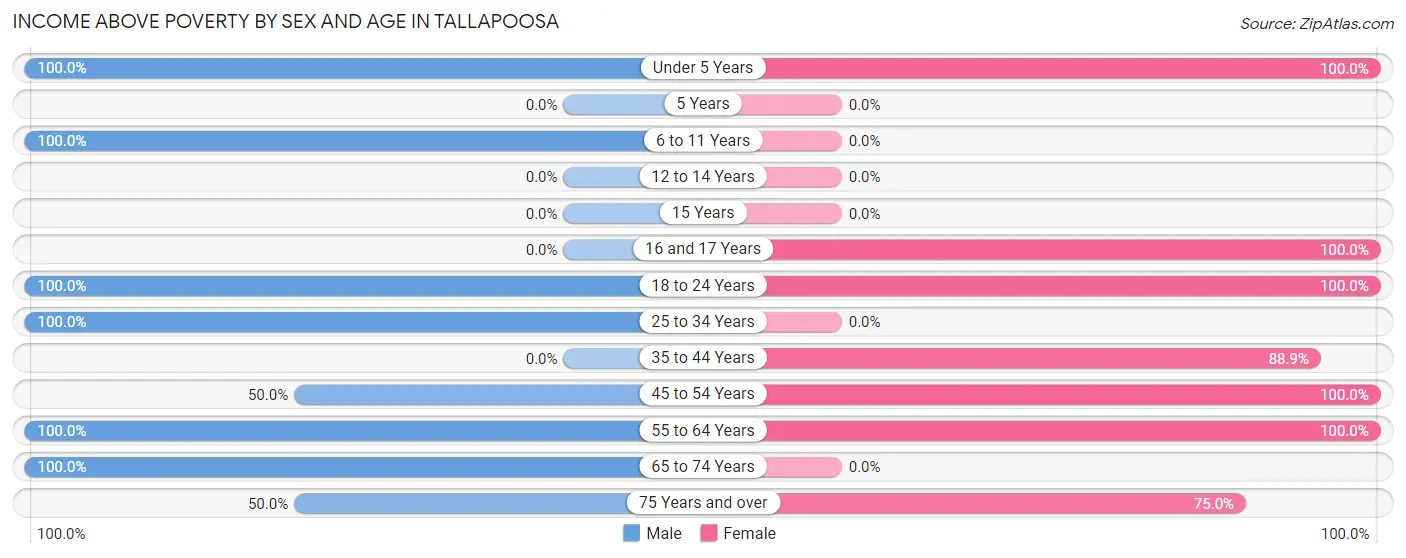
| Age Bracket | Male | Female |
| Under 5 Years | 2 (100.0%) | 1 (100.0%) |
| 5 Years | 0 (0.0%) | 0 (0.0%) |
| 6 to 11 Years | 7 (100.0%) | 0 (0.0%) |
| 12 to 14 Years | 0 (0.0%) | 0 (0.0%) |
| 15 Years | 0 (0.0%) | 0 (0.0%) |
| 16 and 17 Years | 0 (0.0%) | 6 (100.0%) |
| 18 to 24 Years | 5 (100.0%) | 2 (100.0%) |
| 25 to 34 Years | 1 (100.0%) | 0 (0.0%) |
| 35 to 44 Years | 0 (0.0%) | 8 (88.9%) |
| 45 to 54 Years | 6 (50.0%) | 11 (100.0%) |
| 55 to 64 Years | 4 (100.0%) | 5 (100.0%) |
| 65 to 74 Years | 6 (100.0%) | 0 (0.0%) |
| 75 Years and over | 1 (50.0%) | 3 (75.0%) |
| Total | 32 (76.2%) | 36 (94.7%) |
Income Below Poverty Among Married-Couple Families in Tallapoosa
The poverty statistics for married-couple families in Tallapoosa show that 18.2% or 4 of the total 22 families live below the poverty line. Families with no children have the highest poverty rate of 26.7%, comprising of 4 families. On the other hand, families with 1 or 2 children have the lowest poverty rate of 0.0%, which includes 0 families.
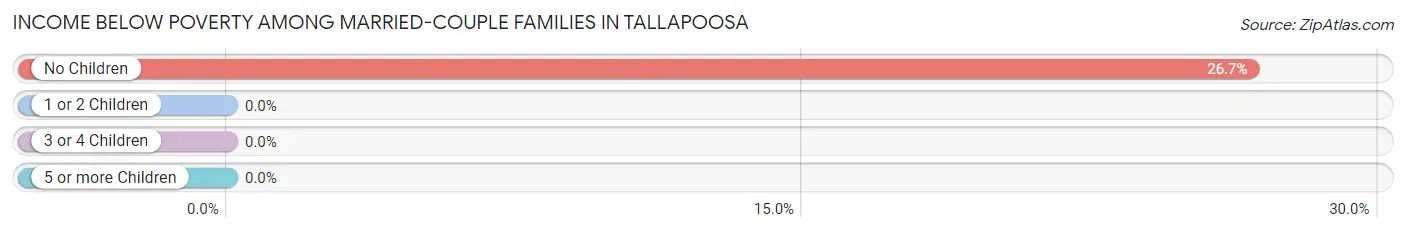
| Children | Above Poverty | Below Poverty |
| No Children | 11 (73.3%) | 4 (26.7%) |
| 1 or 2 Children | 7 (100.0%) | 0 (0.0%) |
| 3 or 4 Children | 0 (0.0%) | 0 (0.0%) |
| 5 or more Children | 0 (0.0%) | 0 (0.0%) |
| Total | 18 (81.8%) | 4 (18.2%) |
Income Below Poverty Among Single-Parent Households in Tallapoosa
| Children | Single Father | Single Mother |
| No Children | 0 (0.0%) | 0 (0.0%) |
| 1 or 2 Children | 0 (0.0%) | 0 (0.0%) |
| 3 or 4 Children | 0 (0.0%) | 0 (0.0%) |
| 5 or more Children | 0 (0.0%) | 0 (0.0%) |
| Total | 0 (0.0%) | 0 (0.0%) |
Income Below Poverty Among Married-Couple vs Single-Parent Households in Tallapoosa
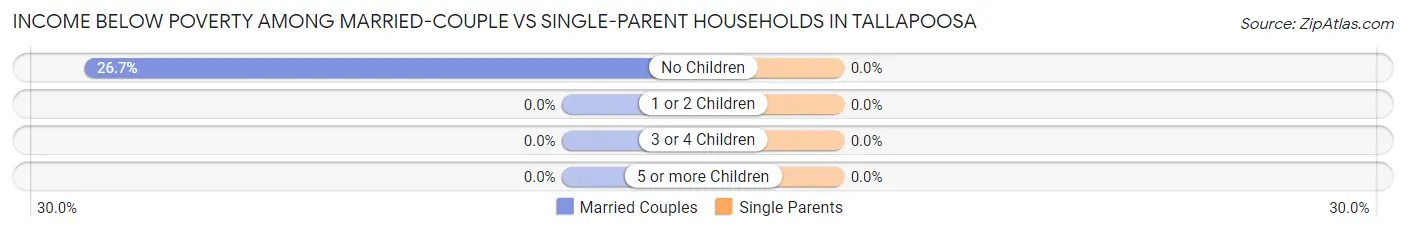
| Children | Married-Couple Families | Single-Parent Households |
| No Children | 4 (26.7%) | 0 (0.0%) |
| 1 or 2 Children | 0 (0.0%) | 0 (0.0%) |
| 3 or 4 Children | 0 (0.0%) | 0 (0.0%) |
| 5 or more Children | 0 (0.0%) | 0 (0.0%) |
| Total | 4 (18.2%) | 0 (0.0%) |
Race in Tallapoosa
The most populous races in Tallapoosa are White / Caucasian (80 | 100.0%), and Hispanic or Latino (1 | 1.3%).
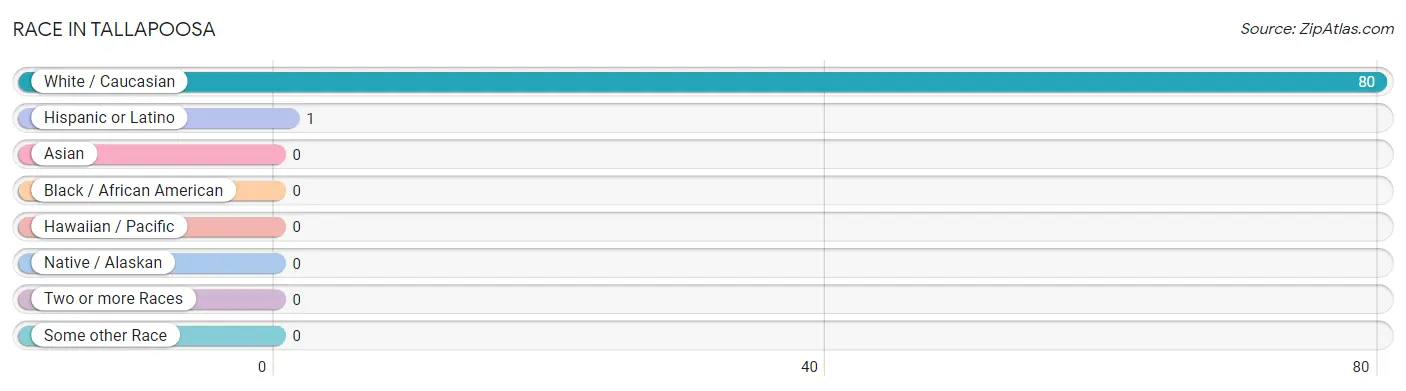
| Race | # Population | % Population |
| Asian | 0 | 0.0% |
| Black / African American | 0 | 0.0% |
| Hawaiian / Pacific | 0 | 0.0% |
| Hispanic or Latino | 1 | 1.3% |
| Native / Alaskan | 0 | 0.0% |
| White / Caucasian | 80 | 100.0% |
| Two or more Races | 0 | 0.0% |
| Some other Race | 0 | 0.0% |
| Total | 80 | 100.0% |
Ancestry in Tallapoosa
The most populous ancestries reported in Tallapoosa are Irish (40 | 50.0%), Dutch (11 | 13.8%), French (4 | 5.0%), Polish (4 | 5.0%), and German (3 | 3.7%), together accounting for 77.5% of all Tallapoosa residents.
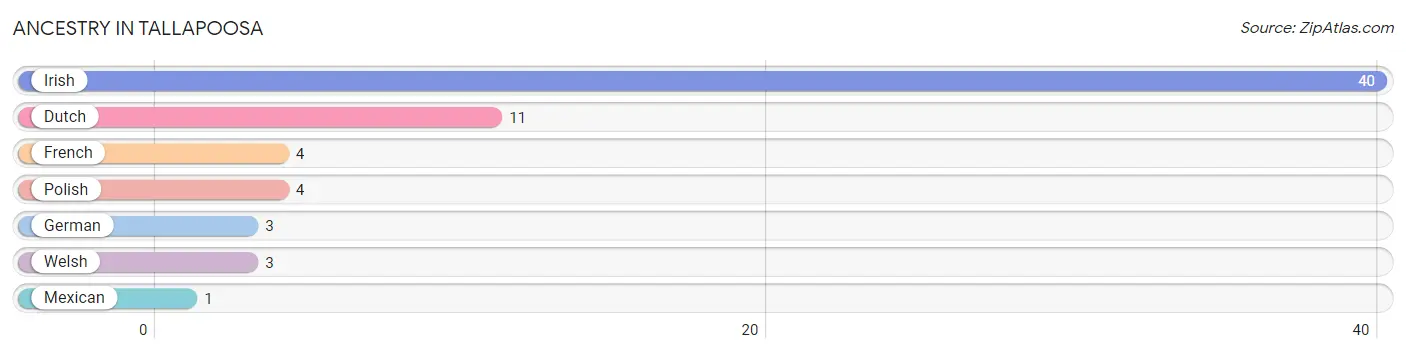
| Ancestry | # Population | % Population |
| Dutch | 11 | 13.8% |
| French | 4 | 5.0% |
| German | 3 | 3.7% |
| Irish | 40 | 50.0% |
| Mexican | 1 | 1.3% |
| Polish | 4 | 5.0% |
| Welsh | 3 | 3.7% | View All 7 Rows |
Immigrants in Tallapoosa

| Immigration Origin | # Population | % Population | View All 0 Rows |
Sex and Age in Tallapoosa
Sex and Age in Tallapoosa
The most populous age groups in Tallapoosa are 45 to 49 Years (12 | 28.6%) for men and 40 to 44 Years (8 | 21.0%) for women.
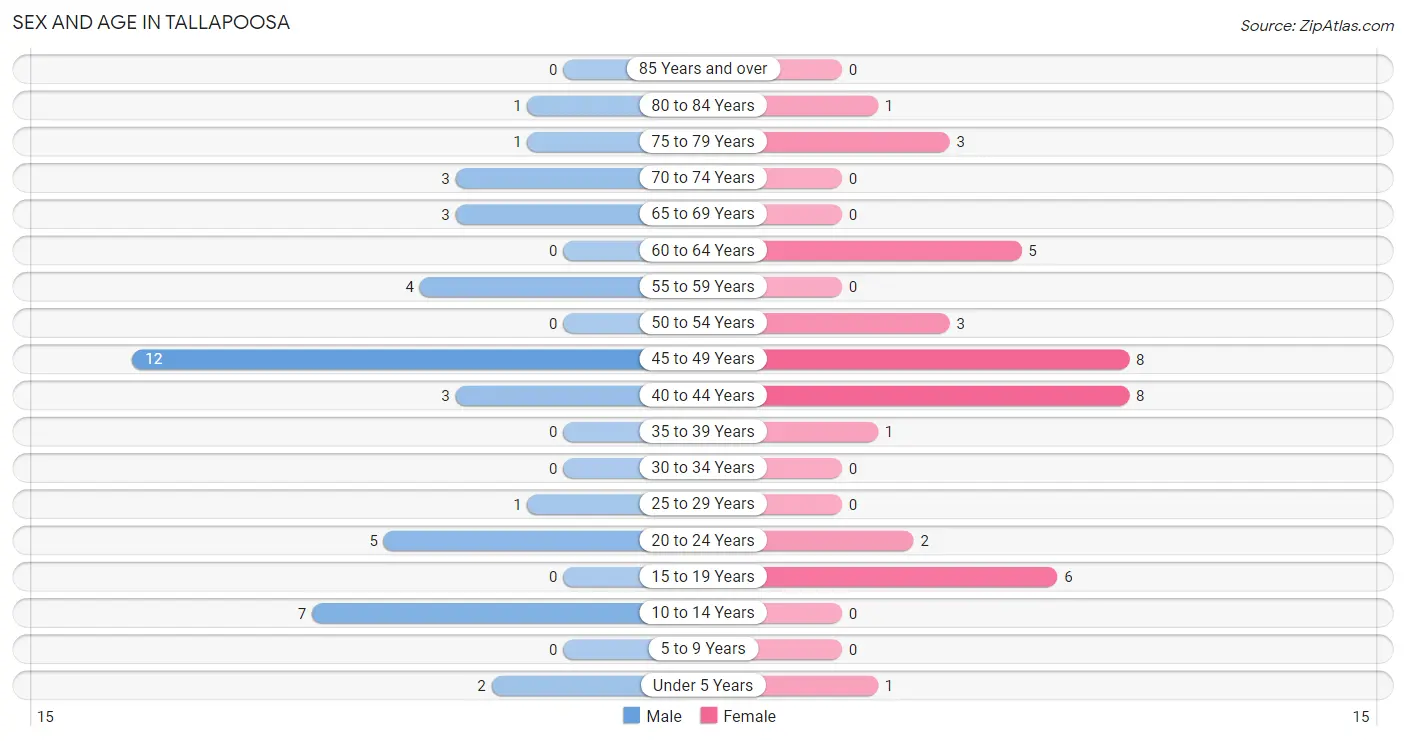
| Age Bracket | Male | Female |
| Under 5 Years | 2 (4.8%) | 1 (2.6%) |
| 5 to 9 Years | 0 (0.0%) | 0 (0.0%) |
| 10 to 14 Years | 7 (16.7%) | 0 (0.0%) |
| 15 to 19 Years | 0 (0.0%) | 6 (15.8%) |
| 20 to 24 Years | 5 (11.9%) | 2 (5.3%) |
| 25 to 29 Years | 1 (2.4%) | 0 (0.0%) |
| 30 to 34 Years | 0 (0.0%) | 0 (0.0%) |
| 35 to 39 Years | 0 (0.0%) | 1 (2.6%) |
| 40 to 44 Years | 3 (7.1%) | 8 (21.0%) |
| 45 to 49 Years | 12 (28.6%) | 8 (21.0%) |
| 50 to 54 Years | 0 (0.0%) | 3 (7.9%) |
| 55 to 59 Years | 4 (9.5%) | 0 (0.0%) |
| 60 to 64 Years | 0 (0.0%) | 5 (13.2%) |
| 65 to 69 Years | 3 (7.1%) | 0 (0.0%) |
| 70 to 74 Years | 3 (7.1%) | 0 (0.0%) |
| 75 to 79 Years | 1 (2.4%) | 3 (7.9%) |
| 80 to 84 Years | 1 (2.4%) | 1 (2.6%) |
| 85 Years and over | 0 (0.0%) | 0 (0.0%) |
| Total | 42 (100.0%) | 38 (100.0%) |
Families and Households in Tallapoosa
Median Family Size in Tallapoosa
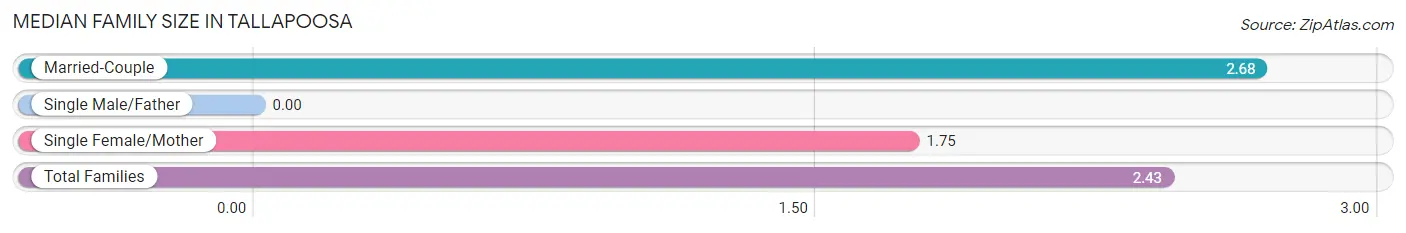
| Family Type | # Families | Family Size |
| Married-Couple | 22 (73.3%) | 2.68 |
| Single Male/Father | 0 (0.0%) | - |
| Single Female/Mother | 8 (26.7%) | 1.75 |
| Total Families | 30 (100.0%) | 2.43 |
Median Household Size in Tallapoosa
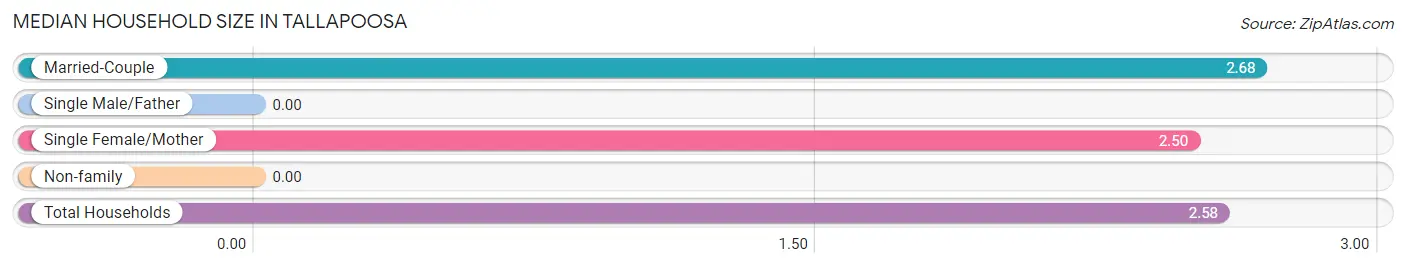
| Household Type | # Households | Household Size |
| Married-Couple | 22 (71.0%) | 2.68 |
| Single Male/Father | 0 (0.0%) | - |
| Single Female/Mother | 8 (25.8%) | 2.50 |
| Non-family | 1 (3.2%) | - |
| Total Households | 31 (100.0%) | 2.58 |
Household Size by Marriage Status in Tallapoosa
Out of a total of 31 households in Tallapoosa, 30 (96.8%) are family households, while 1 (3.2%) are nonfamily households. The most numerous type of family households are 2-person households, comprising 15, and the most common type of nonfamily households are 1-person households, comprising 1.
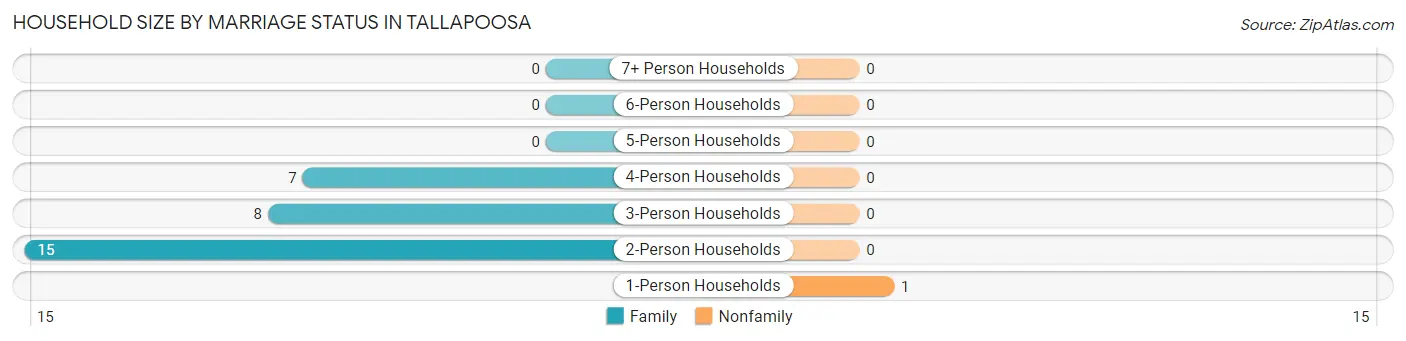
| Household Size | Family Households | Nonfamily Households |
| 1-Person Households | - | 1 (3.2%) |
| 2-Person Households | 15 (48.4%) | 0 (0.0%) |
| 3-Person Households | 8 (25.8%) | 0 (0.0%) |
| 4-Person Households | 7 (22.6%) | 0 (0.0%) |
| 5-Person Households | 0 (0.0%) | 0 (0.0%) |
| 6-Person Households | 0 (0.0%) | 0 (0.0%) |
| 7+ Person Households | 0 (0.0%) | 0 (0.0%) |
| Total | 30 (96.8%) | 1 (3.2%) |
Female Fertility in Tallapoosa
Fertility by Age in Tallapoosa
| Age Bracket | Women with Births | Births / 1,000 Women |
| 15 to 19 years | 0 (0.0%) | 0.0 |
| 20 to 34 years | 0 (0.0%) | 0.0 |
| 35 to 50 years | 0 (0.0%) | 0.0 |
| Total | 0 (0.0%) | 0.0 |
Fertility by Age by Marriage Status in Tallapoosa
| Age Bracket | Married | Unmarried |
| 15 to 19 years | 0 (0.0%) | 0 (0.0%) |
| 20 to 34 years | 0 (0.0%) | 0 (0.0%) |
| 35 to 50 years | 0 (0.0%) | 0 (0.0%) |
| Total | 0 (0.0%) | 0 (0.0%) |
Fertility by Education in Tallapoosa
| Educational Attainment | Women with Births | Births / 1,000 Women |
| Less than High School | 0 (0.0%) | 0.0 |
| High School Diploma | 0 (0.0%) | 0.0 |
| College or Associate's Degree | 0 (0.0%) | 0.0 |
| Bachelor's Degree | 0 (0.0%) | 0.0 |
| Graduate Degree | 0 (0.0%) | 0.0 |
| Total | 0 (0.0%) | 0.0 |
Fertility by Education by Marriage Status in Tallapoosa
| Educational Attainment | Married | Unmarried |
| Less than High School | 0 (0.0%) | 0 (0.0%) |
| High School Diploma | 0 (0.0%) | 0 (0.0%) |
| College or Associate's Degree | 0 (0.0%) | 0 (0.0%) |
| Bachelor's Degree | 0 (0.0%) | 0 (0.0%) |
| Graduate Degree | 0 (0.0%) | 0 (0.0%) |
| Total | 0 (0.0%) | 0 (0.0%) |
Employment Characteristics in Tallapoosa
Employment by Class of Employer in Tallapoosa
Among the 40 employed individuals in Tallapoosa, , and private company employees (40 | 100.0%) make up the most common classes of employment.
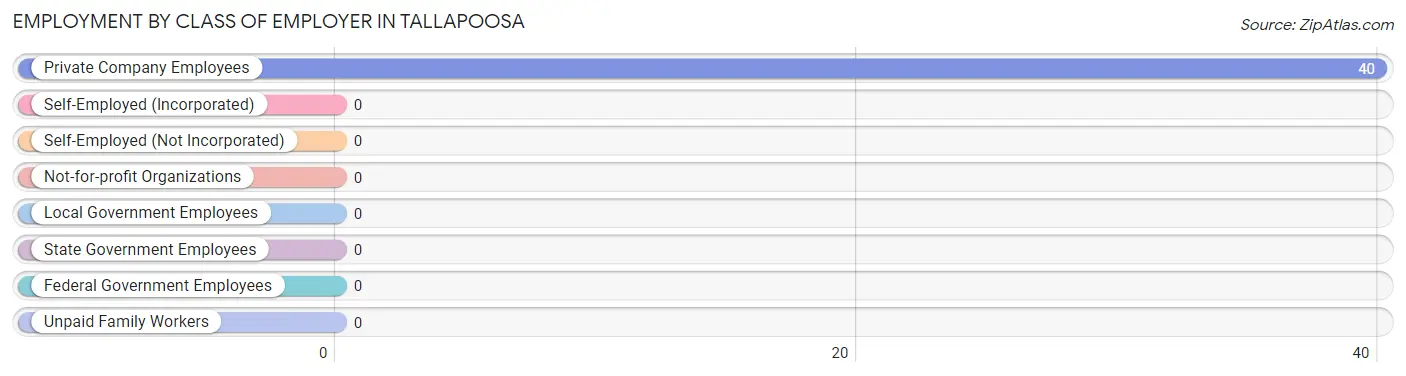
| Employer Class | # Employees | % Employees |
| Private Company Employees | 40 | 100.0% |
| Self-Employed (Incorporated) | 0 | 0.0% |
| Self-Employed (Not Incorporated) | 0 | 0.0% |
| Not-for-profit Organizations | 0 | 0.0% |
| Local Government Employees | 0 | 0.0% |
| State Government Employees | 0 | 0.0% |
| Federal Government Employees | 0 | 0.0% |
| Unpaid Family Workers | 0 | 0.0% |
| Total | 40 | 100.0% |
Employment Status by Age in Tallapoosa
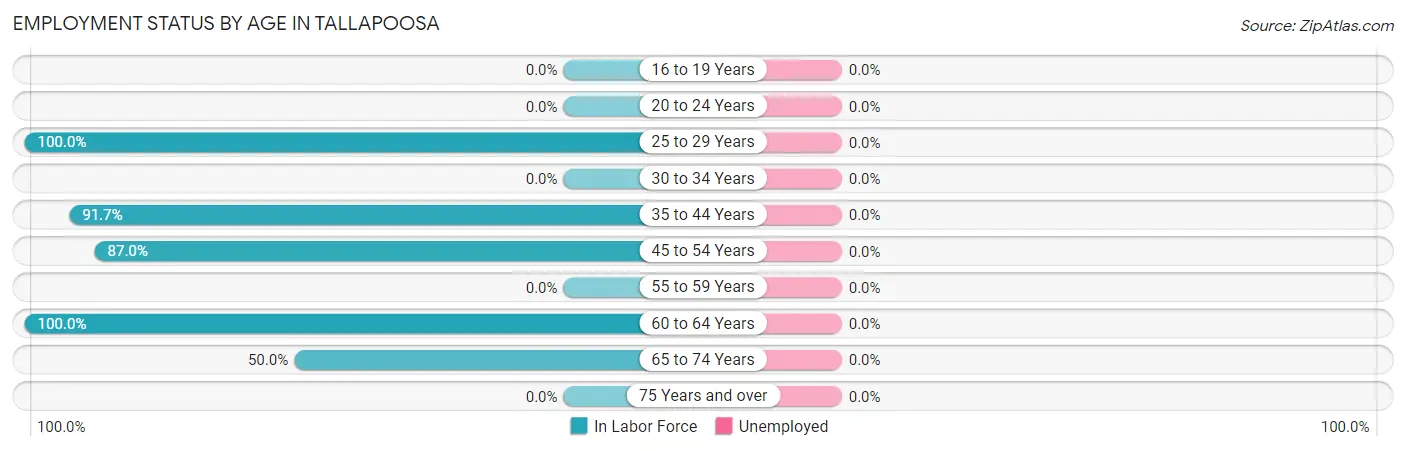
| Age Bracket | In Labor Force | Unemployed |
| 16 to 19 Years | 0 (0.0%) | 0 (0.0%) |
| 20 to 24 Years | 0 (0.0%) | 0 (0.0%) |
| 25 to 29 Years | 1 (100.0%) | 0 (0.0%) |
| 30 to 34 Years | 0 (0.0%) | 0 (0.0%) |
| 35 to 44 Years | 11 (91.7%) | 0 (0.0%) |
| 45 to 54 Years | 20 (87.0%) | 0 (0.0%) |
| 55 to 59 Years | 0 (0.0%) | 0 (0.0%) |
| 60 to 64 Years | 5 (100.0%) | 0 (0.0%) |
| 65 to 74 Years | 3 (50.0%) | 0 (0.0%) |
| 75 Years and over | 0 (0.0%) | 0 (0.0%) |
| Total | 40 (57.1%) | 0 (0.0%) |
Employment Status by Educational Attainment in Tallapoosa
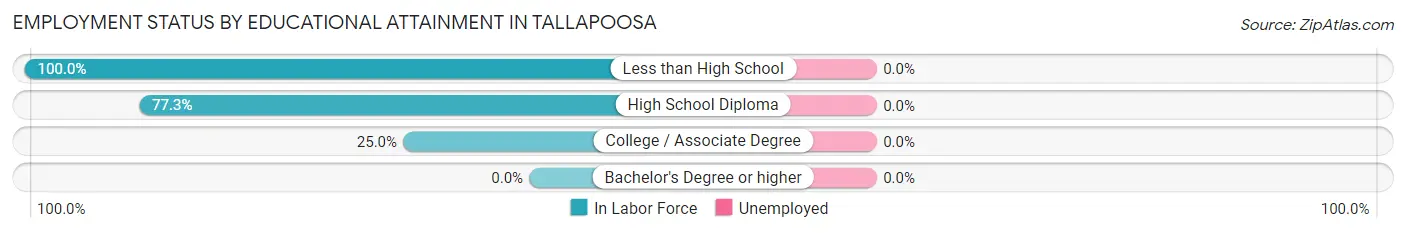
| Educational Attainment | In Labor Force | Unemployed |
| Less than High School | 19 (100.0%) | 0 (0.0%) |
| High School Diploma | 17 (77.3%) | 0 (0.0%) |
| College / Associate Degree | 1 (25.0%) | 0 (0.0%) |
| Bachelor's Degree or higher | 0 (0.0%) | 0 (0.0%) |
| Total | 37 (82.2%) | 0 (0.0%) |
Employment Occupations by Sex in Tallapoosa
Management, Business, Science and Arts Occupations
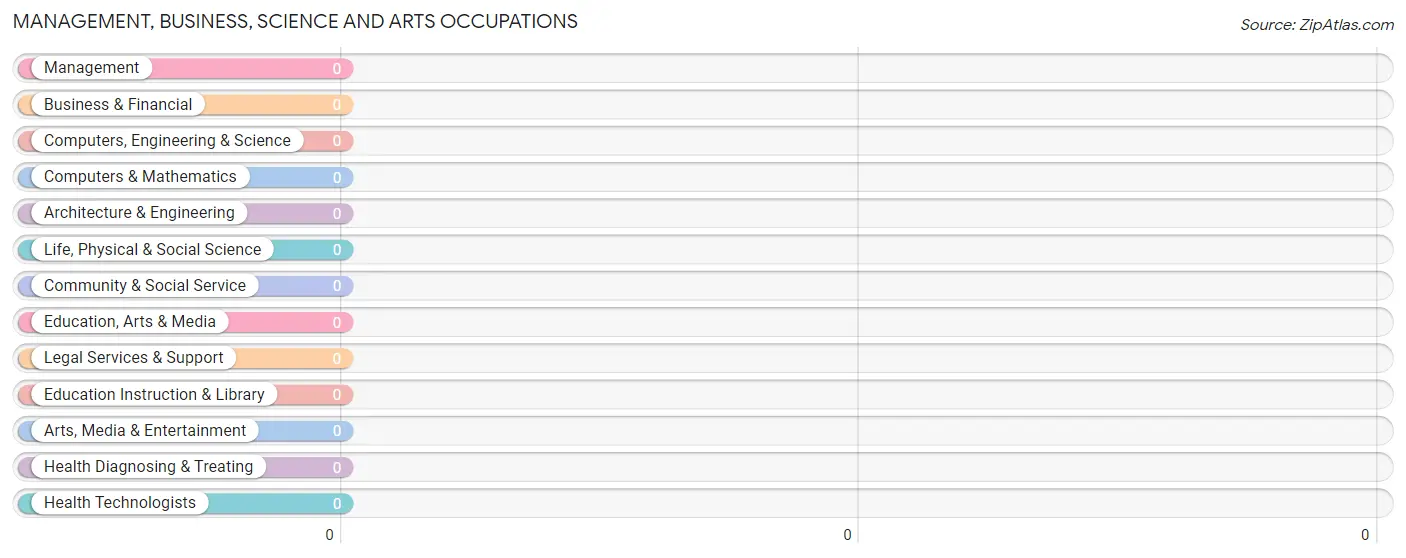
Management, Business, Science and Arts Occupations by Sex
| Occupation | Male | Female |
| Management | 0 (0.0%) | 0 (0.0%) |
| Business & Financial | 0 (0.0%) | 0 (0.0%) |
| Computers, Engineering & Science | 0 (0.0%) | 0 (0.0%) |
| Computers & Mathematics | 0 (0.0%) | 0 (0.0%) |
| Architecture & Engineering | 0 (0.0%) | 0 (0.0%) |
| Life, Physical & Social Science | 0 (0.0%) | 0 (0.0%) |
| Community & Social Service | 0 (0.0%) | 0 (0.0%) |
| Education, Arts & Media | 0 (0.0%) | 0 (0.0%) |
| Legal Services & Support | 0 (0.0%) | 0 (0.0%) |
| Education Instruction & Library | 0 (0.0%) | 0 (0.0%) |
| Arts, Media & Entertainment | 0 (0.0%) | 0 (0.0%) |
| Health Diagnosing & Treating | 0 (0.0%) | 0 (0.0%) |
| Health Technologists | 0 (0.0%) | 0 (0.0%) |
| Total (Category) | 0 (0.0%) | 0 (0.0%) |
| Total (Overall) | 19 (47.5%) | 21 (52.5%) |
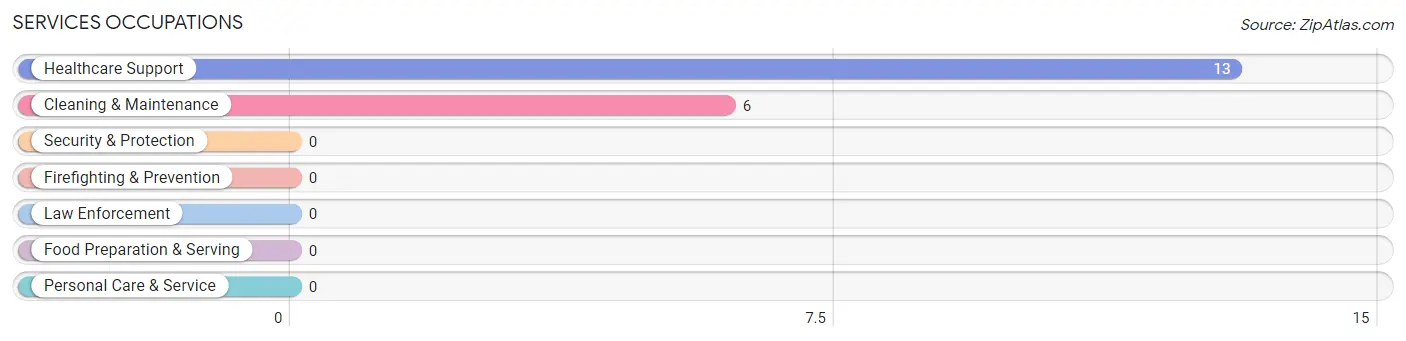
Services Occupations
The most common Services occupations in Tallapoosa are Healthcare Support (13 | 32.5%), and Cleaning & Maintenance (6 | 15.0%).
Services Occupations by Sex
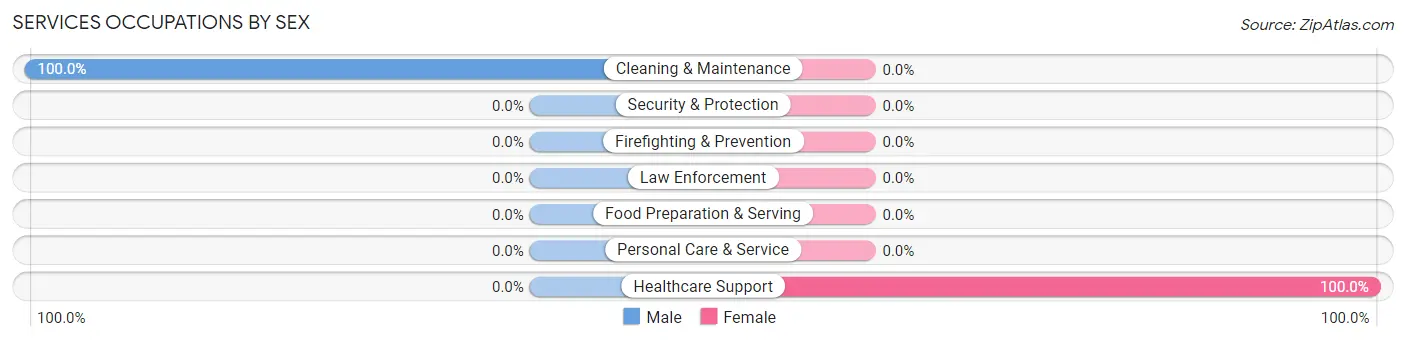
| Occupation | Male | Female |
| Healthcare Support | 0 (0.0%) | 13 (100.0%) |
| Security & Protection | 0 (0.0%) | 0 (0.0%) |
| Firefighting & Prevention | 0 (0.0%) | 0 (0.0%) |
| Law Enforcement | 0 (0.0%) | 0 (0.0%) |
| Food Preparation & Serving | 0 (0.0%) | 0 (0.0%) |
| Cleaning & Maintenance | 6 (100.0%) | 0 (0.0%) |
| Personal Care & Service | 0 (0.0%) | 0 (0.0%) |
| Total (Category) | 6 (31.6%) | 13 (68.4%) |
| Total (Overall) | 19 (47.5%) | 21 (52.5%) |
Sales and Office Occupations

Sales and Office Occupations by Sex

| Occupation | Male | Female |
| Sales & Related | 0 (0.0%) | 0 (0.0%) |
| Office & Administration | 0 (0.0%) | 0 (0.0%) |
| Total (Category) | 0 (0.0%) | 0 (0.0%) |
| Total (Overall) | 19 (47.5%) | 21 (52.5%) |
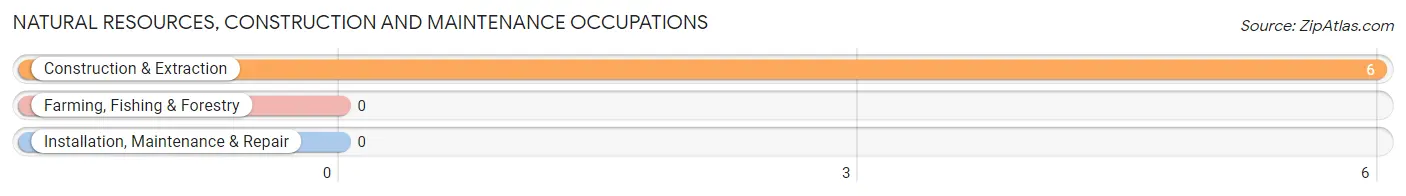
Natural Resources, Construction and Maintenance Occupations
The most common Natural Resources, Construction and Maintenance occupations in Tallapoosa are , and Construction & Extraction (6 | 15.0%).
Natural Resources, Construction and Maintenance Occupations by Sex

| Occupation | Male | Female |
| Farming, Fishing & Forestry | 0 (0.0%) | 0 (0.0%) |
| Construction & Extraction | 6 (100.0%) | 0 (0.0%) |
| Installation, Maintenance & Repair | 0 (0.0%) | 0 (0.0%) |
| Total (Category) | 6 (100.0%) | 0 (0.0%) |
| Total (Overall) | 19 (47.5%) | 21 (52.5%) |
Production, Transportation and Moving Occupations
The most common Production, Transportation and Moving occupations in Tallapoosa are Transportation (11 | 27.5%), and Production (4 | 10.0%).
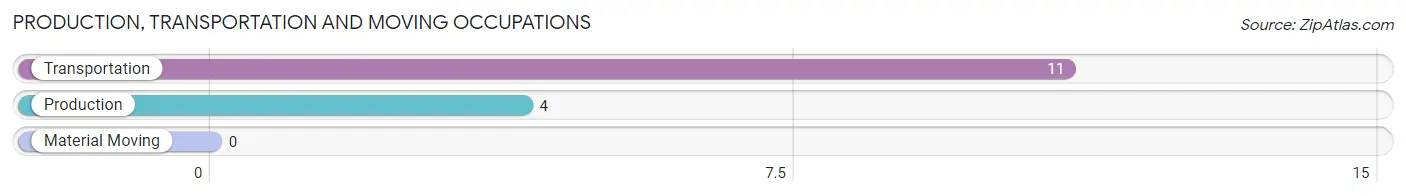
Production, Transportation and Moving Occupations by Sex
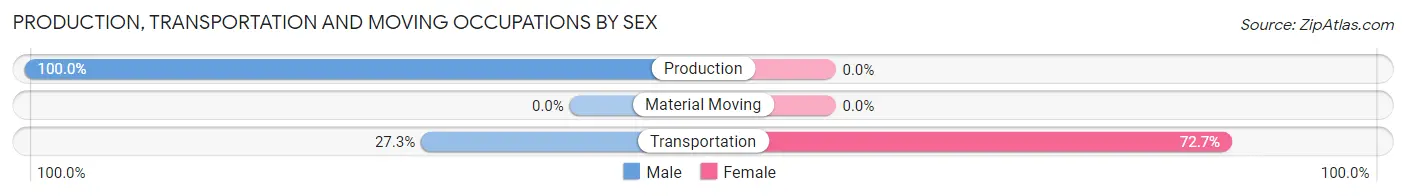
| Occupation | Male | Female |
| Production | 4 (100.0%) | 0 (0.0%) |
| Transportation | 3 (27.3%) | 8 (72.7%) |
| Material Moving | 0 (0.0%) | 0 (0.0%) |
| Total (Category) | 7 (46.7%) | 8 (53.3%) |
| Total (Overall) | 19 (47.5%) | 21 (52.5%) |
Employment Industries by Sex in Tallapoosa
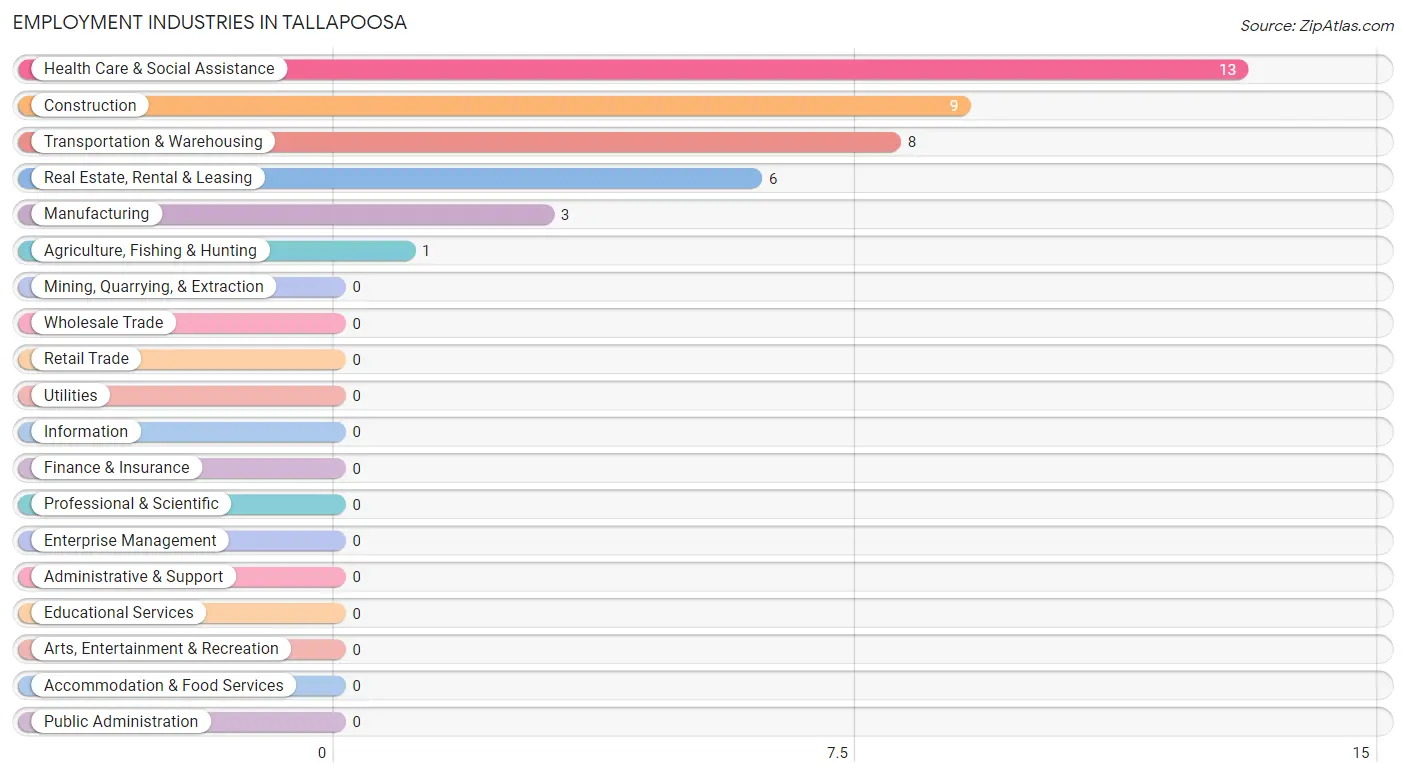
Employment Industries in Tallapoosa
The major employment industries in Tallapoosa include Health Care & Social Assistance (13 | 32.5%), Construction (9 | 22.5%), Transportation & Warehousing (8 | 20.0%), Real Estate, Rental & Leasing (6 | 15.0%), and Manufacturing (3 | 7.5%).
Employment Industries by Sex in Tallapoosa
The Tallapoosa industries that see more men than women are Agriculture, Fishing & Hunting (100.0%), Construction (100.0%), and Manufacturing (100.0%), whereas the industries that tend to have a higher number of women are Transportation & Warehousing (100.0%), and Health Care & Social Assistance (100.0%).
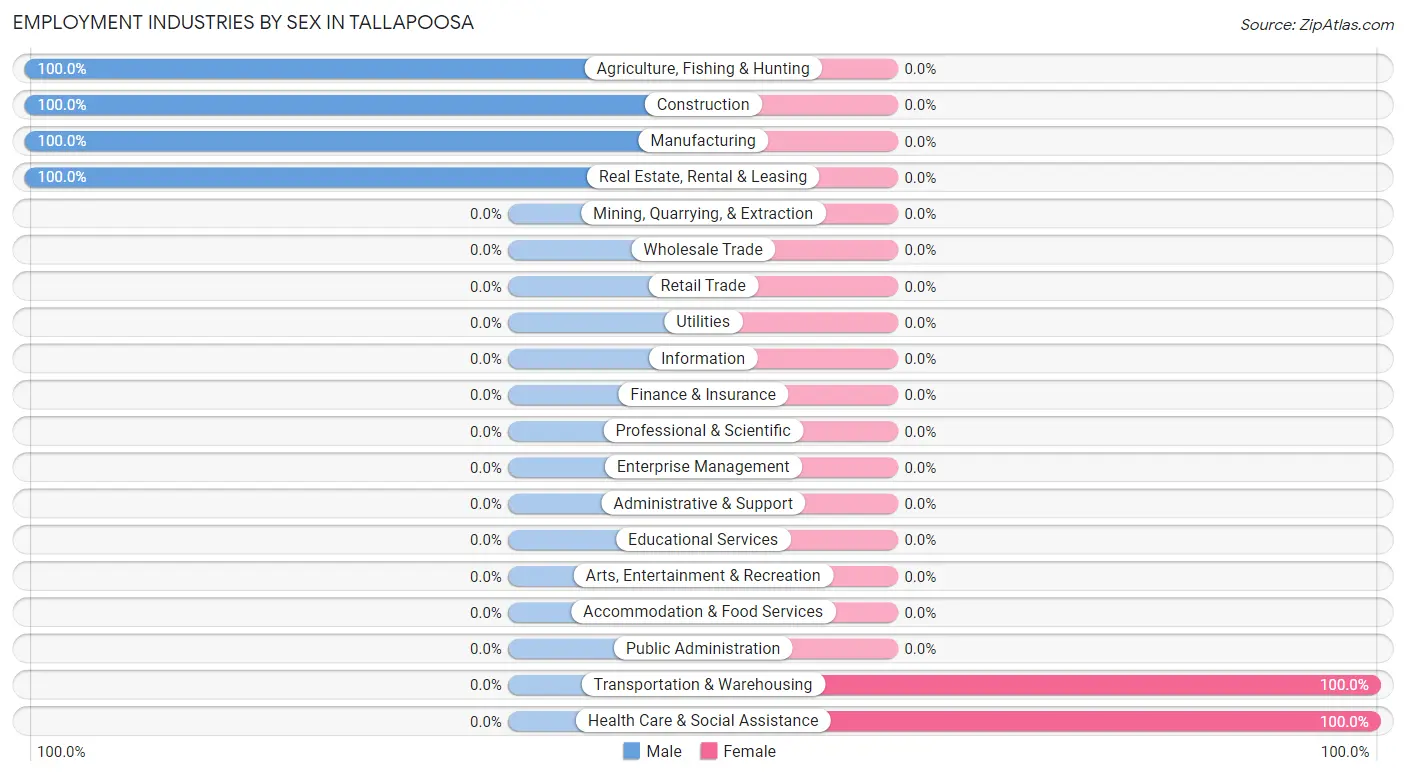
| Industry | Male | Female |
| Agriculture, Fishing & Hunting | 1 (100.0%) | 0 (0.0%) |
| Mining, Quarrying, & Extraction | 0 (0.0%) | 0 (0.0%) |
| Construction | 9 (100.0%) | 0 (0.0%) |
| Manufacturing | 3 (100.0%) | 0 (0.0%) |
| Wholesale Trade | 0 (0.0%) | 0 (0.0%) |
| Retail Trade | 0 (0.0%) | 0 (0.0%) |
| Transportation & Warehousing | 0 (0.0%) | 8 (100.0%) |
| Utilities | 0 (0.0%) | 0 (0.0%) |
| Information | 0 (0.0%) | 0 (0.0%) |
| Finance & Insurance | 0 (0.0%) | 0 (0.0%) |
| Real Estate, Rental & Leasing | 6 (100.0%) | 0 (0.0%) |
| Professional & Scientific | 0 (0.0%) | 0 (0.0%) |
| Enterprise Management | 0 (0.0%) | 0 (0.0%) |
| Administrative & Support | 0 (0.0%) | 0 (0.0%) |
| Educational Services | 0 (0.0%) | 0 (0.0%) |
| Health Care & Social Assistance | 0 (0.0%) | 13 (100.0%) |
| Arts, Entertainment & Recreation | 0 (0.0%) | 0 (0.0%) |
| Accommodation & Food Services | 0 (0.0%) | 0 (0.0%) |
| Public Administration | 0 (0.0%) | 0 (0.0%) |
| Total | 19 (47.5%) | 21 (52.5%) |
Education in Tallapoosa
School Enrollment in Tallapoosa
The most common levels of schooling among the 13 students in Tallapoosa are middle school (7 | 53.8%), and high school (6 | 46.2%).
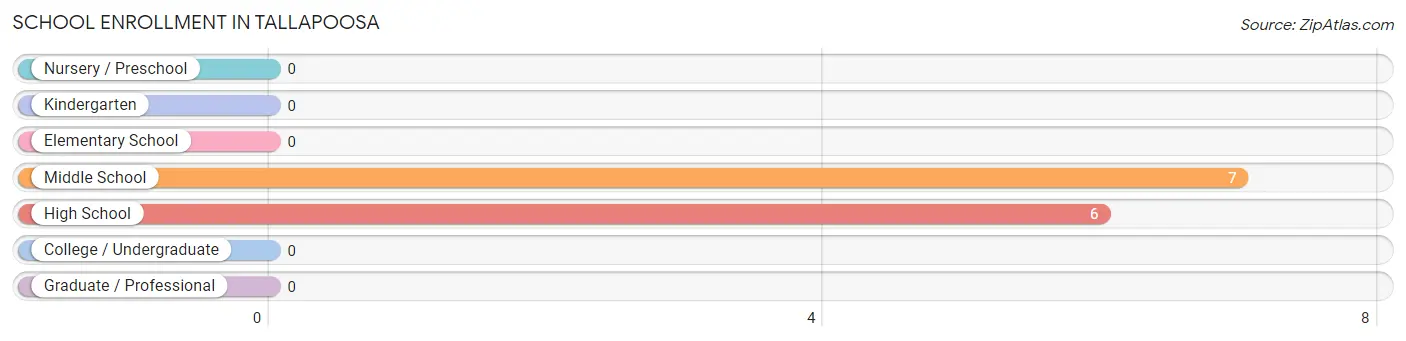
| School Level | # Students | % Students |
| Nursery / Preschool | 0 | 0.0% |
| Kindergarten | 0 | 0.0% |
| Elementary School | 0 | 0.0% |
| Middle School | 7 | 53.8% |
| High School | 6 | 46.2% |
| College / Undergraduate | 0 | 0.0% |
| Graduate / Professional | 0 | 0.0% |
| Total | 13 | 100.0% |
School Enrollment by Age by Funding Source in Tallapoosa
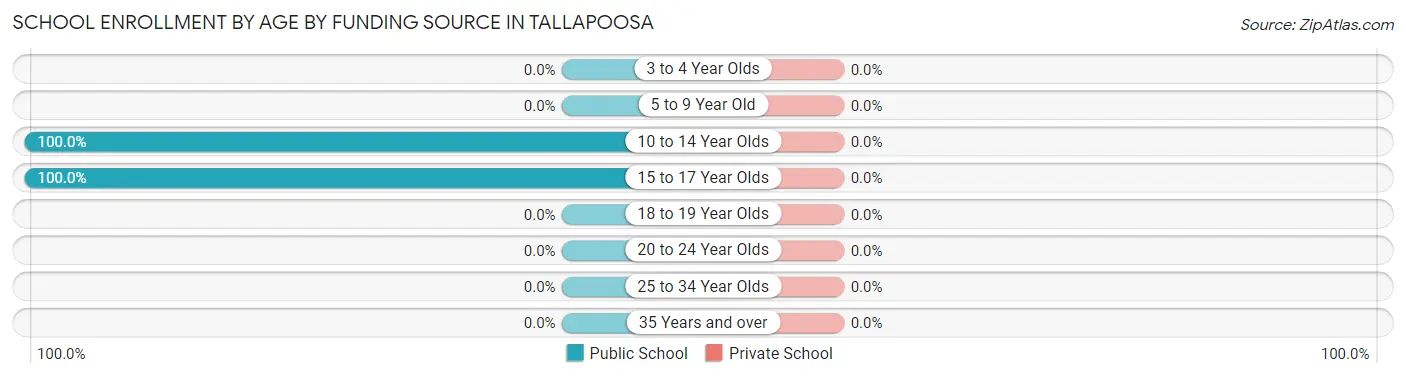
| Age Bracket | Public School | Private School |
| 3 to 4 Year Olds | 0 (0.0%) | 0 (0.0%) |
| 5 to 9 Year Old | 0 (0.0%) | 0 (0.0%) |
| 10 to 14 Year Olds | 7 (100.0%) | 0 (0.0%) |
| 15 to 17 Year Olds | 6 (100.0%) | 0 (0.0%) |
| 18 to 19 Year Olds | 0 (0.0%) | 0 (0.0%) |
| 20 to 24 Year Olds | 0 (0.0%) | 0 (0.0%) |
| 25 to 34 Year Olds | 0 (0.0%) | 0 (0.0%) |
| 35 Years and over | 0 (0.0%) | 0 (0.0%) |
| Total | 13 (100.0%) | 0 (0.0%) |
Educational Attainment by Field of Study in Tallapoosa
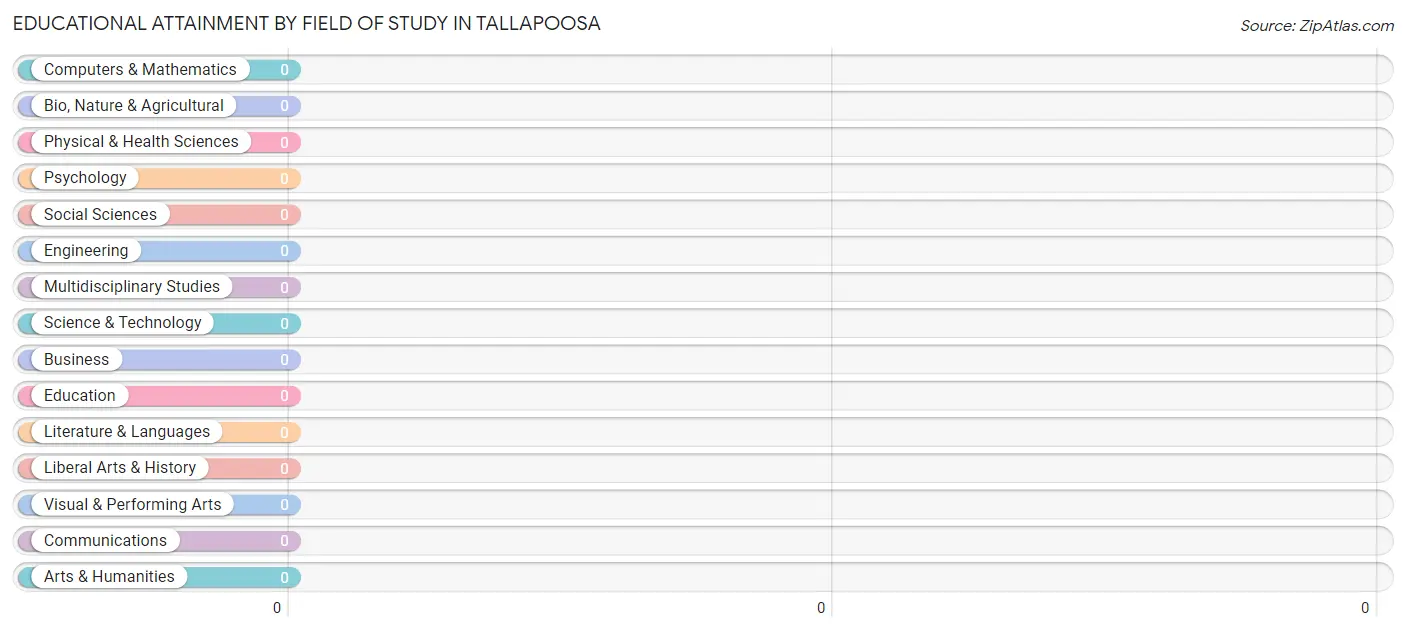
| Field of Study | # Graduates | % Graduates |
| Computers & Mathematics | 0 | 0.0% |
| Bio, Nature & Agricultural | 0 | 0.0% |
| Physical & Health Sciences | 0 | 0.0% |
| Psychology | 0 | 0.0% |
| Social Sciences | 0 | 0.0% |
| Engineering | 0 | 0.0% |
| Multidisciplinary Studies | 0 | 0.0% |
| Science & Technology | 0 | 0.0% |
| Business | 0 | 0.0% |
| Education | 0 | 0.0% |
| Literature & Languages | 0 | 0.0% |
| Liberal Arts & History | 0 | 0.0% |
| Visual & Performing Arts | 0 | 0.0% |
| Communications | 0 | 0.0% |
| Arts & Humanities | 0 | 0.0% |
| Total | 0 | 0.0% |
Transportation & Commute in Tallapoosa
Vehicle Availability by Sex in Tallapoosa
The most prevalent vehicle ownership categories in Tallapoosa are males with 2 vehicles (13, accounting for 68.4%) and females with 2 vehicles (13, making up 61.9%).
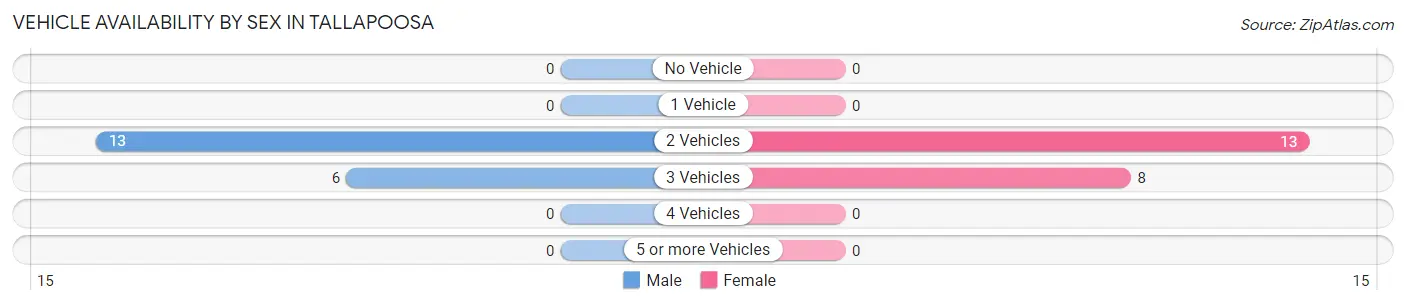
| Vehicles Available | Male | Female |
| No Vehicle | 0 (0.0%) | 0 (0.0%) |
| 1 Vehicle | 0 (0.0%) | 0 (0.0%) |
| 2 Vehicles | 13 (68.4%) | 13 (61.9%) |
| 3 Vehicles | 6 (31.6%) | 8 (38.1%) |
| 4 Vehicles | 0 (0.0%) | 0 (0.0%) |
| 5 or more Vehicles | 0 (0.0%) | 0 (0.0%) |
| Total | 19 (100.0%) | 21 (100.0%) |
Commute Time in Tallapoosa
The most frequently occuring commute durations in Tallapoosa are 45 to 59 minutes (22 commuters, 55.0%), 5 to 9 minutes (11 commuters, 27.5%), and 30 to 34 minutes (6 commuters, 15.0%).
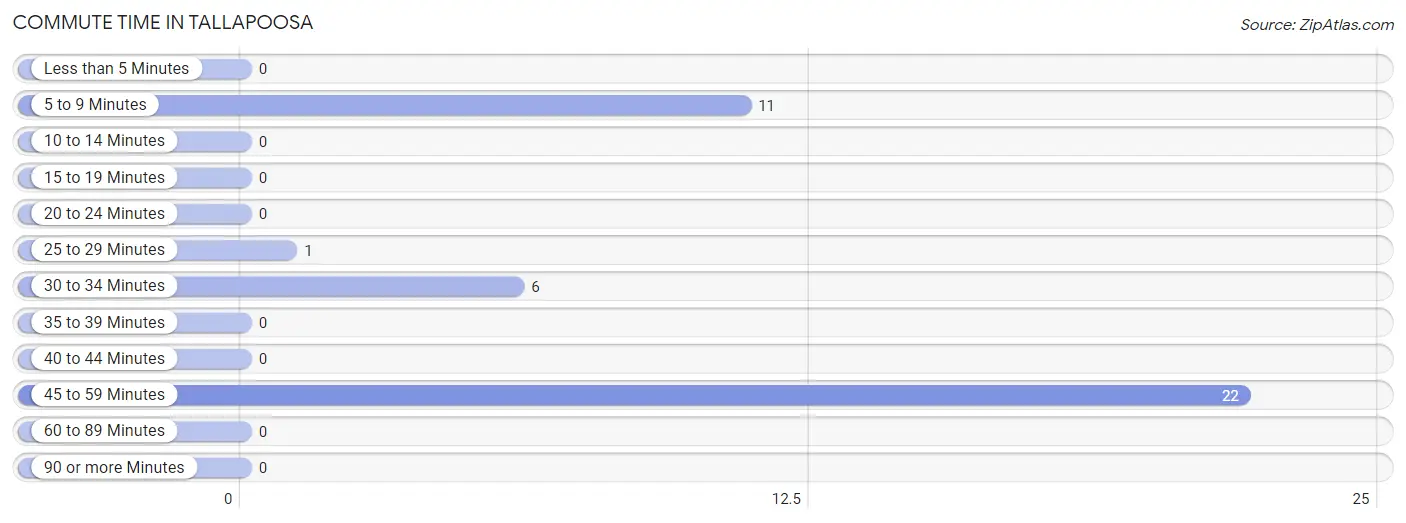
| Commute Time | # Commuters | % Commuters |
| Less than 5 Minutes | 0 | 0.0% |
| 5 to 9 Minutes | 11 | 27.5% |
| 10 to 14 Minutes | 0 | 0.0% |
| 15 to 19 Minutes | 0 | 0.0% |
| 20 to 24 Minutes | 0 | 0.0% |
| 25 to 29 Minutes | 1 | 2.5% |
| 30 to 34 Minutes | 6 | 15.0% |
| 35 to 39 Minutes | 0 | 0.0% |
| 40 to 44 Minutes | 0 | 0.0% |
| 45 to 59 Minutes | 22 | 55.0% |
| 60 to 89 Minutes | 0 | 0.0% |
| 90 or more Minutes | 0 | 0.0% |
Commute Time by Sex in Tallapoosa
The most common commute times in Tallapoosa are 5 to 9 minutes (6 commuters, 31.6%) for males and 45 to 59 minutes (16 commuters, 76.2%) for females.
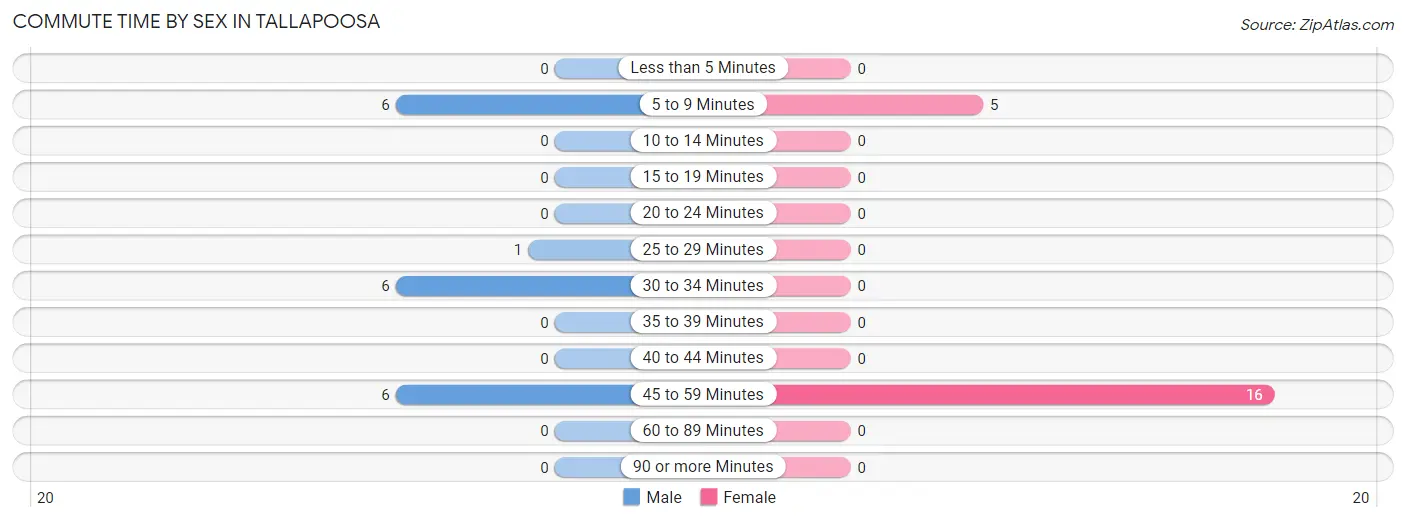
| Commute Time | Male | Female |
| Less than 5 Minutes | 0 (0.0%) | 0 (0.0%) |
| 5 to 9 Minutes | 6 (31.6%) | 5 (23.8%) |
| 10 to 14 Minutes | 0 (0.0%) | 0 (0.0%) |
| 15 to 19 Minutes | 0 (0.0%) | 0 (0.0%) |
| 20 to 24 Minutes | 0 (0.0%) | 0 (0.0%) |
| 25 to 29 Minutes | 1 (5.3%) | 0 (0.0%) |
| 30 to 34 Minutes | 6 (31.6%) | 0 (0.0%) |
| 35 to 39 Minutes | 0 (0.0%) | 0 (0.0%) |
| 40 to 44 Minutes | 0 (0.0%) | 0 (0.0%) |
| 45 to 59 Minutes | 6 (31.6%) | 16 (76.2%) |
| 60 to 89 Minutes | 0 (0.0%) | 0 (0.0%) |
| 90 or more Minutes | 0 (0.0%) | 0 (0.0%) |
Time of Departure to Work by Sex in Tallapoosa
The most frequent times of departure to work in Tallapoosa are 7:30 AM to 7:59 AM (12, 63.2%) for males and 6:00 AM to 6:29 AM (8, 38.1%) for females.
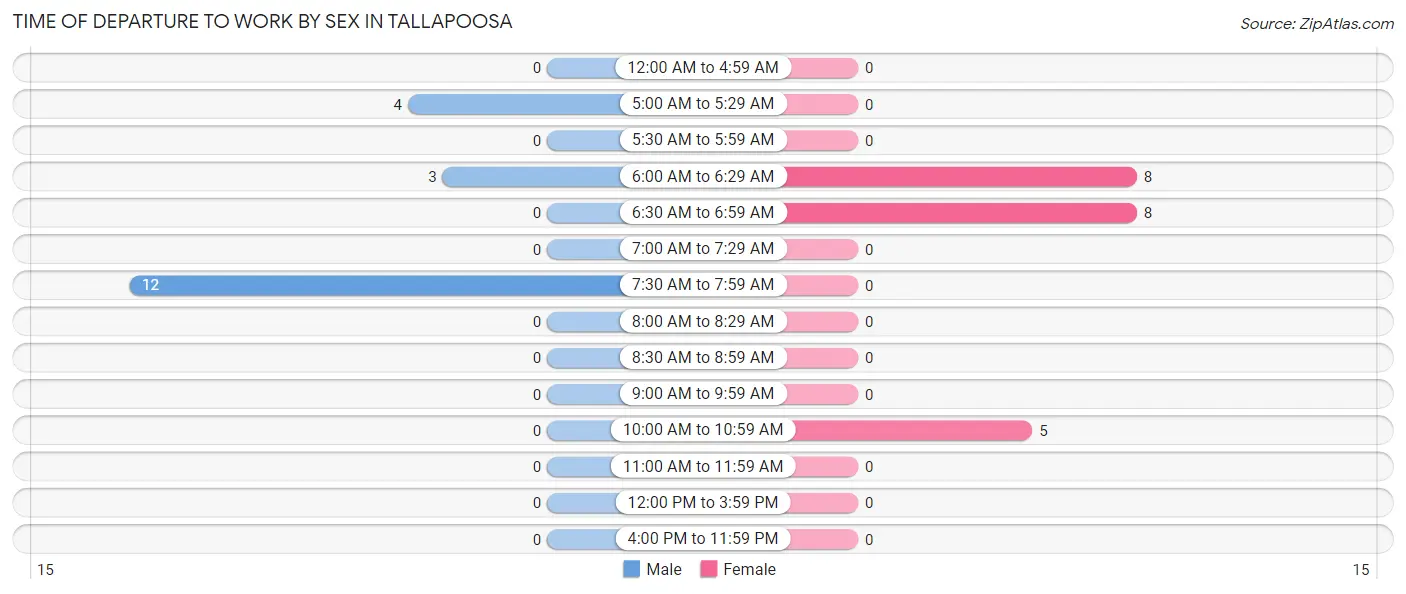
| Time of Departure | Male | Female |
| 12:00 AM to 4:59 AM | 0 (0.0%) | 0 (0.0%) |
| 5:00 AM to 5:29 AM | 4 (21.0%) | 0 (0.0%) |
| 5:30 AM to 5:59 AM | 0 (0.0%) | 0 (0.0%) |
| 6:00 AM to 6:29 AM | 3 (15.8%) | 8 (38.1%) |
| 6:30 AM to 6:59 AM | 0 (0.0%) | 8 (38.1%) |
| 7:00 AM to 7:29 AM | 0 (0.0%) | 0 (0.0%) |
| 7:30 AM to 7:59 AM | 12 (63.2%) | 0 (0.0%) |
| 8:00 AM to 8:29 AM | 0 (0.0%) | 0 (0.0%) |
| 8:30 AM to 8:59 AM | 0 (0.0%) | 0 (0.0%) |
| 9:00 AM to 9:59 AM | 0 (0.0%) | 0 (0.0%) |
| 10:00 AM to 10:59 AM | 0 (0.0%) | 5 (23.8%) |
| 11:00 AM to 11:59 AM | 0 (0.0%) | 0 (0.0%) |
| 12:00 PM to 3:59 PM | 0 (0.0%) | 0 (0.0%) |
| 4:00 PM to 11:59 PM | 0 (0.0%) | 0 (0.0%) |
| Total | 19 (100.0%) | 21 (100.0%) |
Housing Occupancy in Tallapoosa
Occupancy by Ownership in Tallapoosa
Of the total 31 dwellings in Tallapoosa, owner-occupied units account for 31 (100.0%), while renter-occupied units make up 0 (0.0%).
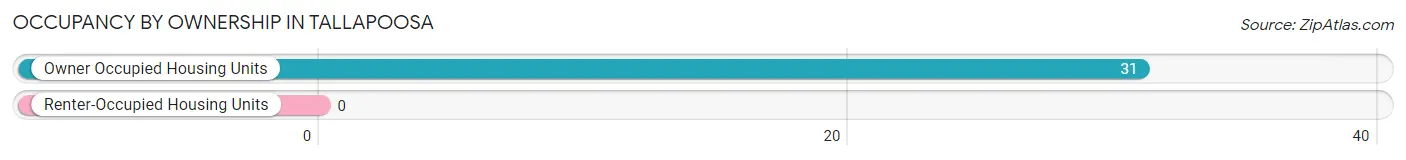
| Occupancy | # Housing Units | % Housing Units |
| Owner Occupied Housing Units | 31 | 100.0% |
| Renter-Occupied Housing Units | 0 | 0.0% |
| Total Occupied Housing Units | 31 | 100.0% |
Occupancy by Household Size in Tallapoosa
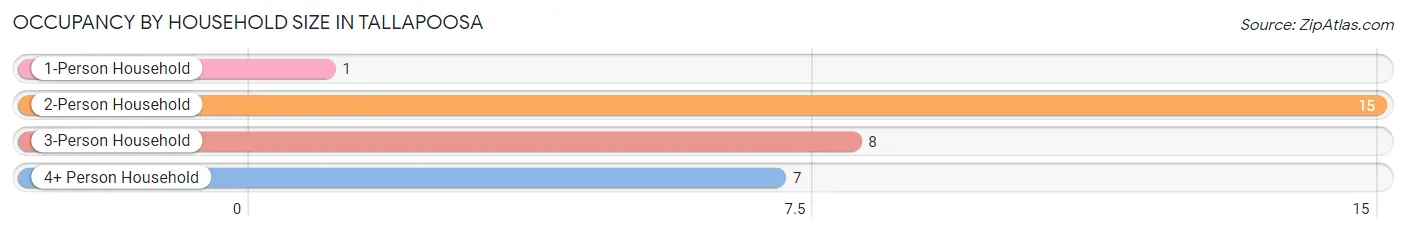
| Household Size | # Housing Units | % Housing Units |
| 1-Person Household | 1 | 3.2% |
| 2-Person Household | 15 | 48.4% |
| 3-Person Household | 8 | 25.8% |
| 4+ Person Household | 7 | 22.6% |
| Total Housing Units | 31 | 100.0% |
Occupancy by Ownership by Household Size in Tallapoosa
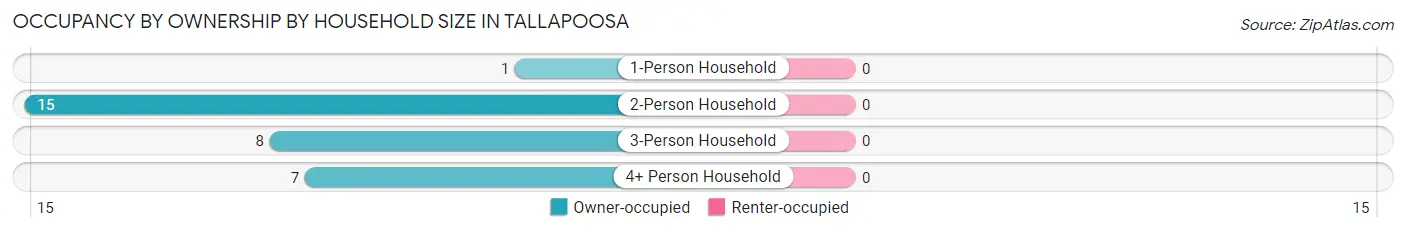
| Household Size | Owner-occupied | Renter-occupied |
| 1-Person Household | 1 (100.0%) | 0 (0.0%) |
| 2-Person Household | 15 (100.0%) | 0 (0.0%) |
| 3-Person Household | 8 (100.0%) | 0 (0.0%) |
| 4+ Person Household | 7 (100.0%) | 0 (0.0%) |
| Total Housing Units | 31 (100.0%) | 0 (0.0%) |
Occupancy by Educational Attainment in Tallapoosa
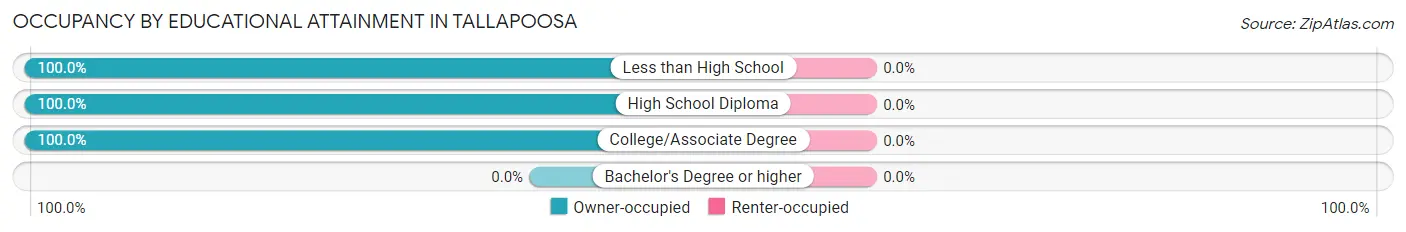
| Household Size | Owner-occupied | Renter-occupied |
| Less than High School | 19 (100.0%) | 0 (0.0%) |
| High School Diploma | 5 (100.0%) | 0 (0.0%) |
| College/Associate Degree | 7 (100.0%) | 0 (0.0%) |
| Bachelor's Degree or higher | 0 (0.0%) | 0 (0.0%) |
Occupancy by Age of Householder in Tallapoosa
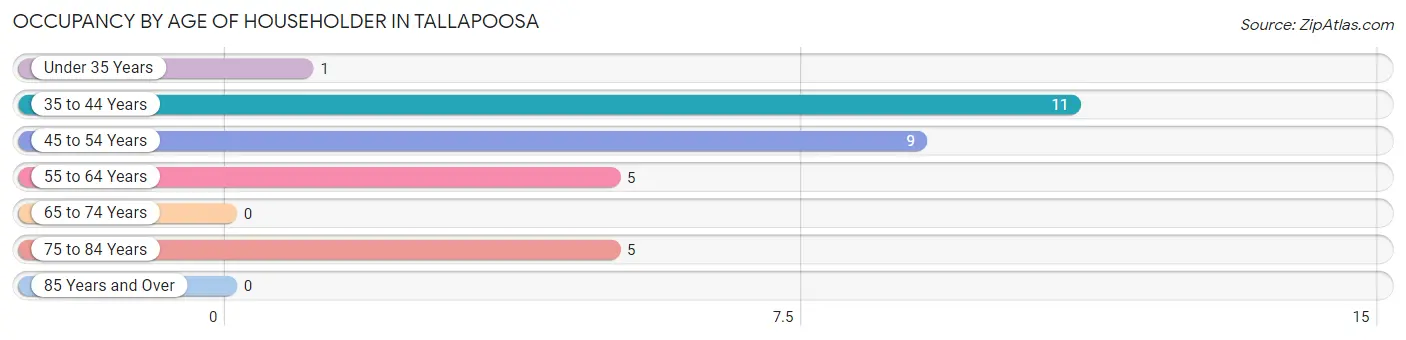
| Age Bracket | # Households | % Households |
| Under 35 Years | 1 | 3.2% |
| 35 to 44 Years | 11 | 35.5% |
| 45 to 54 Years | 9 | 29.0% |
| 55 to 64 Years | 5 | 16.1% |
| 65 to 74 Years | 0 | 0.0% |
| 75 to 84 Years | 5 | 16.1% |
| 85 Years and Over | 0 | 0.0% |
| Total | 31 | 100.0% |
Housing Finances in Tallapoosa
Median Income by Occupancy in Tallapoosa
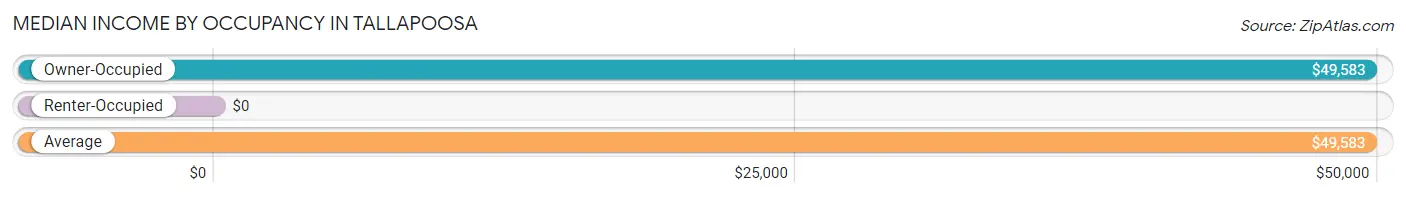
| Occupancy Type | # Households | Median Income |
| Owner-Occupied | 31 (100.0%) | $49,583 |
| Renter-Occupied | 0 (0.0%) | $0 |
| Average | 31 (100.0%) | $49,583 |
Occupancy by Householder Income Bracket in Tallapoosa
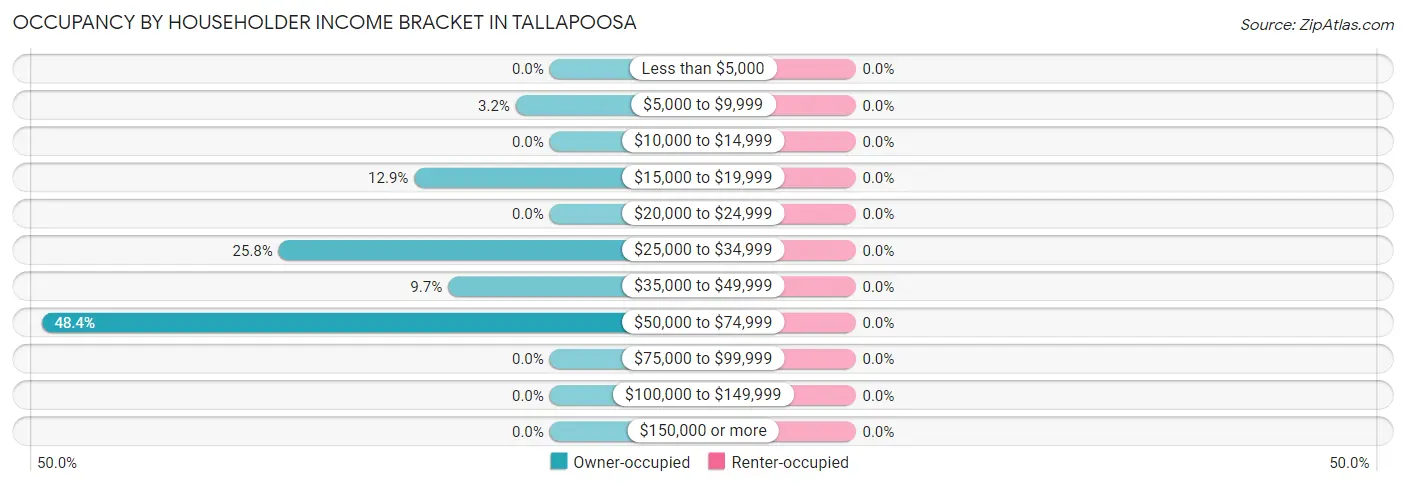
| Income Bracket | Owner-occupied | Renter-occupied |
| Less than $5,000 | 0 (0.0%) | 0 (0.0%) |
| $5,000 to $9,999 | 1 (3.2%) | 0 (0.0%) |
| $10,000 to $14,999 | 0 (0.0%) | 0 (0.0%) |
| $15,000 to $19,999 | 4 (12.9%) | 0 (0.0%) |
| $20,000 to $24,999 | 0 (0.0%) | 0 (0.0%) |
| $25,000 to $34,999 | 8 (25.8%) | 0 (0.0%) |
| $35,000 to $49,999 | 3 (9.7%) | 0 (0.0%) |
| $50,000 to $74,999 | 15 (48.4%) | 0 (0.0%) |
| $75,000 to $99,999 | 0 (0.0%) | 0 (0.0%) |
| $100,000 to $149,999 | 0 (0.0%) | 0 (0.0%) |
| $150,000 or more | 0 (0.0%) | 0 (0.0%) |
| Total | 31 (100.0%) | 0 (0.0%) |
Monthly Housing Cost Tiers in Tallapoosa
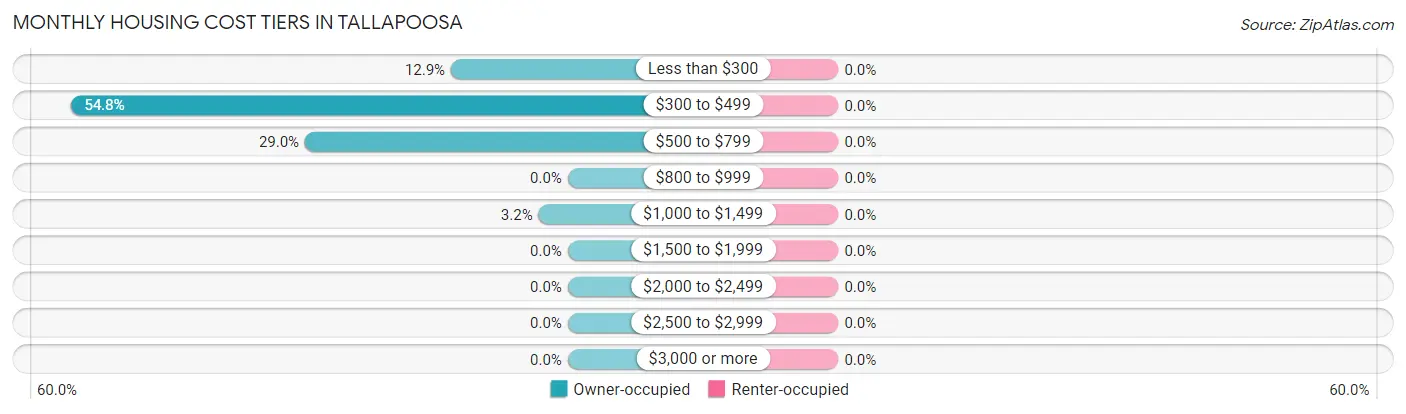
| Monthly Cost | Owner-occupied | Renter-occupied |
| Less than $300 | 4 (12.9%) | 0 (0.0%) |
| $300 to $499 | 17 (54.8%) | 0 (0.0%) |
| $500 to $799 | 9 (29.0%) | 0 (0.0%) |
| $800 to $999 | 0 (0.0%) | 0 (0.0%) |
| $1,000 to $1,499 | 1 (3.2%) | 0 (0.0%) |
| $1,500 to $1,999 | 0 (0.0%) | 0 (0.0%) |
| $2,000 to $2,499 | 0 (0.0%) | 0 (0.0%) |
| $2,500 to $2,999 | 0 (0.0%) | 0 (0.0%) |
| $3,000 or more | 0 (0.0%) | 0 (0.0%) |
| Total | 31 (100.0%) | 0 (0.0%) |
Physical Housing Characteristics in Tallapoosa
Housing Structures in Tallapoosa
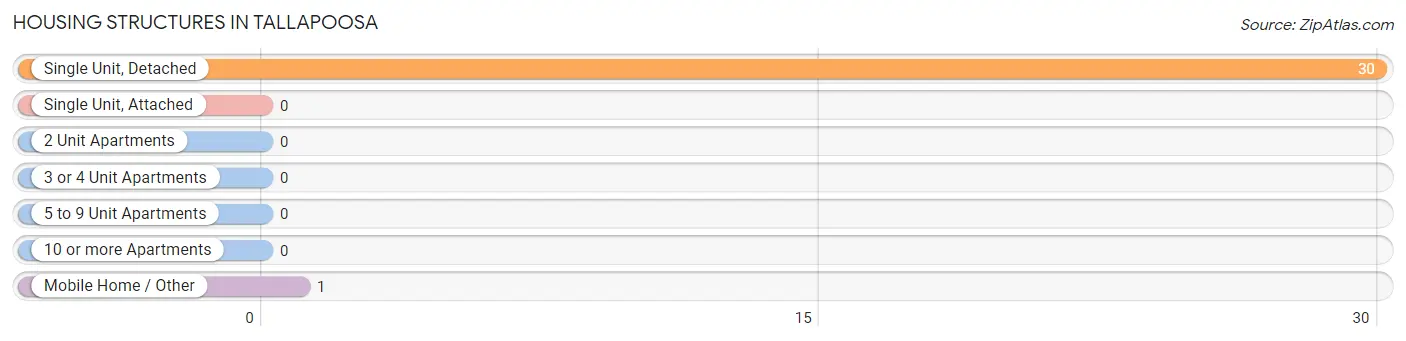
| Structure Type | # Housing Units | % Housing Units |
| Single Unit, Detached | 30 | 96.8% |
| Single Unit, Attached | 0 | 0.0% |
| 2 Unit Apartments | 0 | 0.0% |
| 3 or 4 Unit Apartments | 0 | 0.0% |
| 5 to 9 Unit Apartments | 0 | 0.0% |
| 10 or more Apartments | 0 | 0.0% |
| Mobile Home / Other | 1 | 3.2% |
| Total | 31 | 100.0% |
Housing Structures by Occupancy in Tallapoosa
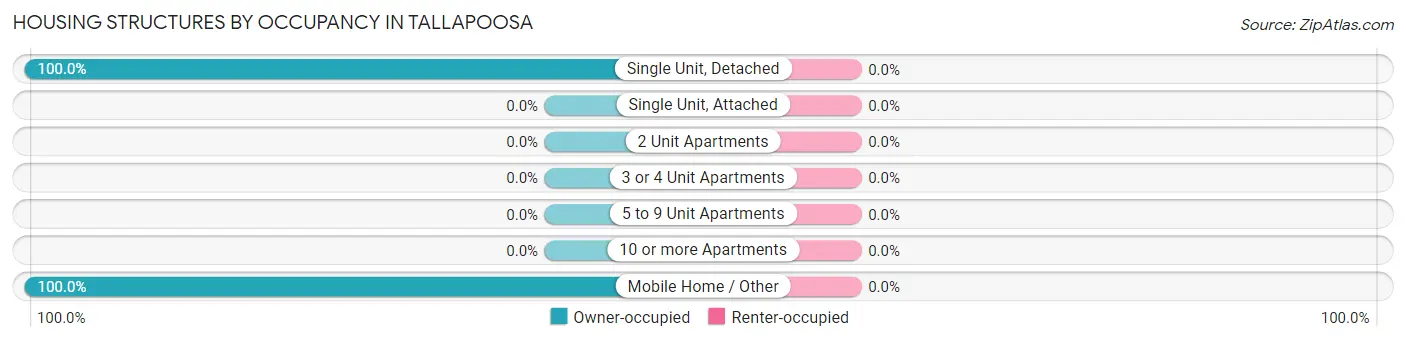
| Structure Type | Owner-occupied | Renter-occupied |
| Single Unit, Detached | 30 (100.0%) | 0 (0.0%) |
| Single Unit, Attached | 0 (0.0%) | 0 (0.0%) |
| 2 Unit Apartments | 0 (0.0%) | 0 (0.0%) |
| 3 or 4 Unit Apartments | 0 (0.0%) | 0 (0.0%) |
| 5 to 9 Unit Apartments | 0 (0.0%) | 0 (0.0%) |
| 10 or more Apartments | 0 (0.0%) | 0 (0.0%) |
| Mobile Home / Other | 1 (100.0%) | 0 (0.0%) |
| Total | 31 (100.0%) | 0 (0.0%) |
Housing Structures by Number of Rooms in Tallapoosa
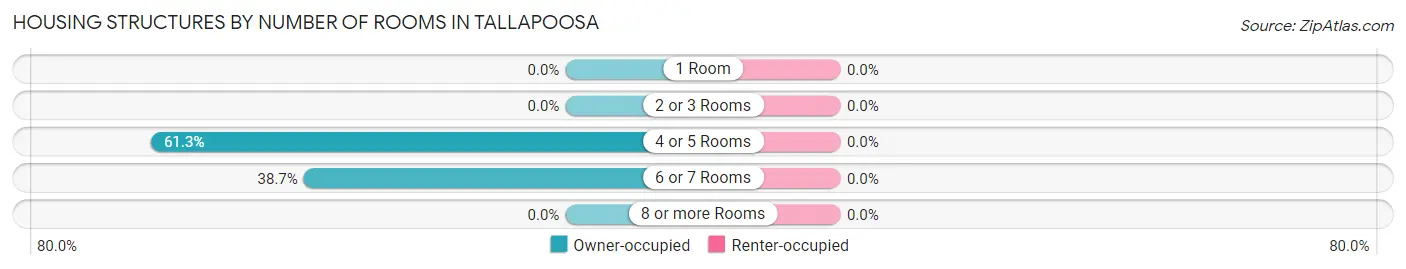
| Number of Rooms | Owner-occupied | Renter-occupied |
| 1 Room | 0 (0.0%) | 0 (0.0%) |
| 2 or 3 Rooms | 0 (0.0%) | 0 (0.0%) |
| 4 or 5 Rooms | 19 (61.3%) | 0 (0.0%) |
| 6 or 7 Rooms | 12 (38.7%) | 0 (0.0%) |
| 8 or more Rooms | 0 (0.0%) | 0 (0.0%) |
| Total | 31 (100.0%) | 0 (0.0%) |
Housing Structure by Heating Type in Tallapoosa
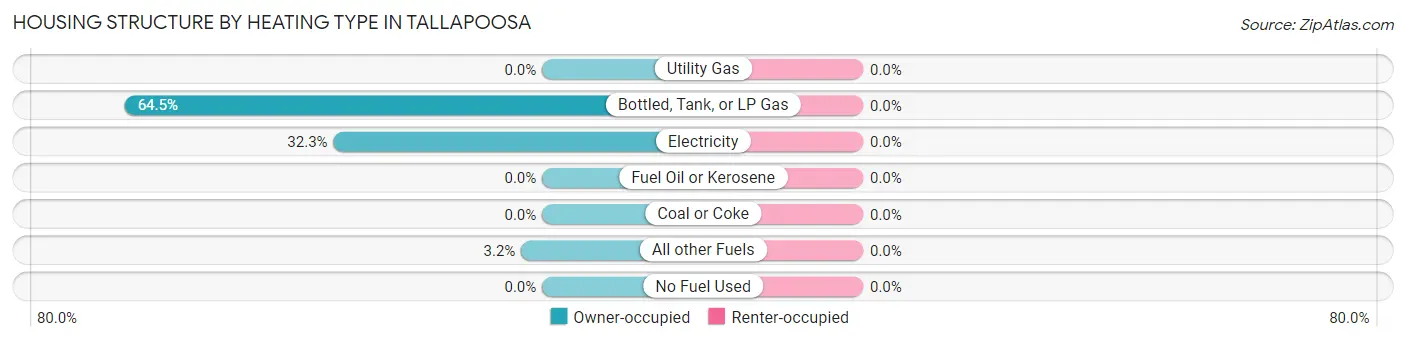
| Heating Type | Owner-occupied | Renter-occupied |
| Utility Gas | 0 (0.0%) | 0 (0.0%) |
| Bottled, Tank, or LP Gas | 20 (64.5%) | 0 (0.0%) |
| Electricity | 10 (32.3%) | 0 (0.0%) |
| Fuel Oil or Kerosene | 0 (0.0%) | 0 (0.0%) |
| Coal or Coke | 0 (0.0%) | 0 (0.0%) |
| All other Fuels | 1 (3.2%) | 0 (0.0%) |
| No Fuel Used | 0 (0.0%) | 0 (0.0%) |
| Total | 31 (100.0%) | 0 (0.0%) |
Household Vehicle Usage in Tallapoosa
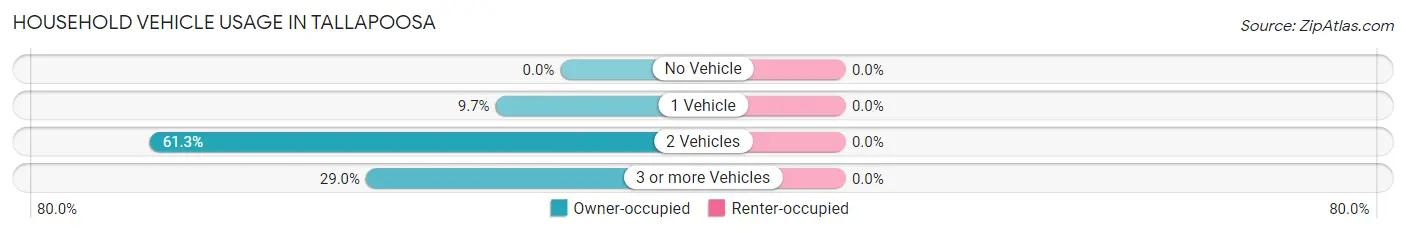
| Vehicles per Household | Owner-occupied | Renter-occupied |
| No Vehicle | 0 (0.0%) | 0 (0.0%) |
| 1 Vehicle | 3 (9.7%) | 0 (0.0%) |
| 2 Vehicles | 19 (61.3%) | 0 (0.0%) |
| 3 or more Vehicles | 9 (29.0%) | 0 (0.0%) |
| Total | 31 (100.0%) | 0 (0.0%) |
Real Estate & Mortgages in Tallapoosa
Real Estate and Mortgage Overview in Tallapoosa
| Characteristic | Without Mortgage | With Mortgage |
| Housing Units | 23 | 8 |
| Median Property Value | $28,100 | $0 |
| Median Household Income | $55,250 | $0 |
| Monthly Housing Costs | $327 | $0 |
| Real Estate Taxes | $414 | $0 |
Property Value by Mortgage Status in Tallapoosa
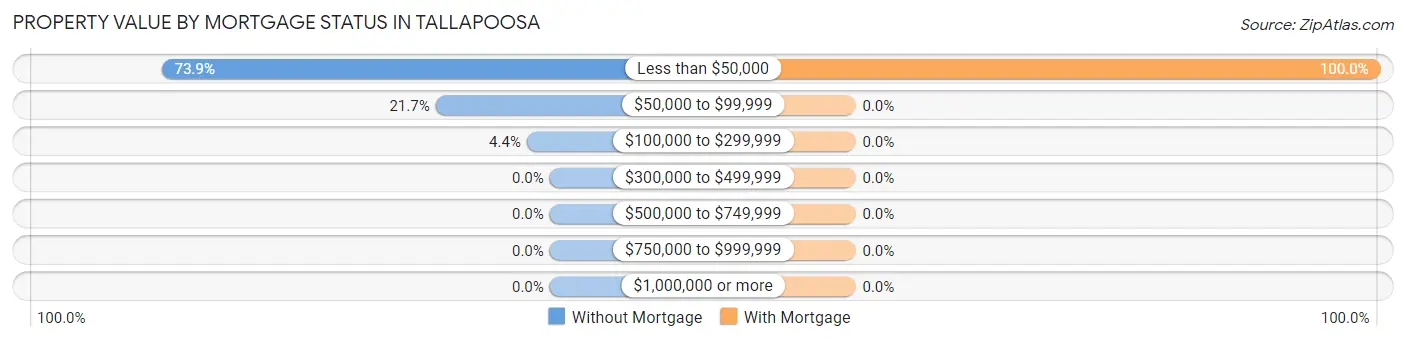
| Property Value | Without Mortgage | With Mortgage |
| Less than $50,000 | 17 (73.9%) | 8 (100.0%) |
| $50,000 to $99,999 | 5 (21.7%) | 0 (0.0%) |
| $100,000 to $299,999 | 1 (4.3%) | 0 (0.0%) |
| $300,000 to $499,999 | 0 (0.0%) | 0 (0.0%) |
| $500,000 to $749,999 | 0 (0.0%) | 0 (0.0%) |
| $750,000 to $999,999 | 0 (0.0%) | 0 (0.0%) |
| $1,000,000 or more | 0 (0.0%) | 0 (0.0%) |
| Total | 23 (100.0%) | 8 (100.0%) |
Household Income by Mortgage Status in Tallapoosa
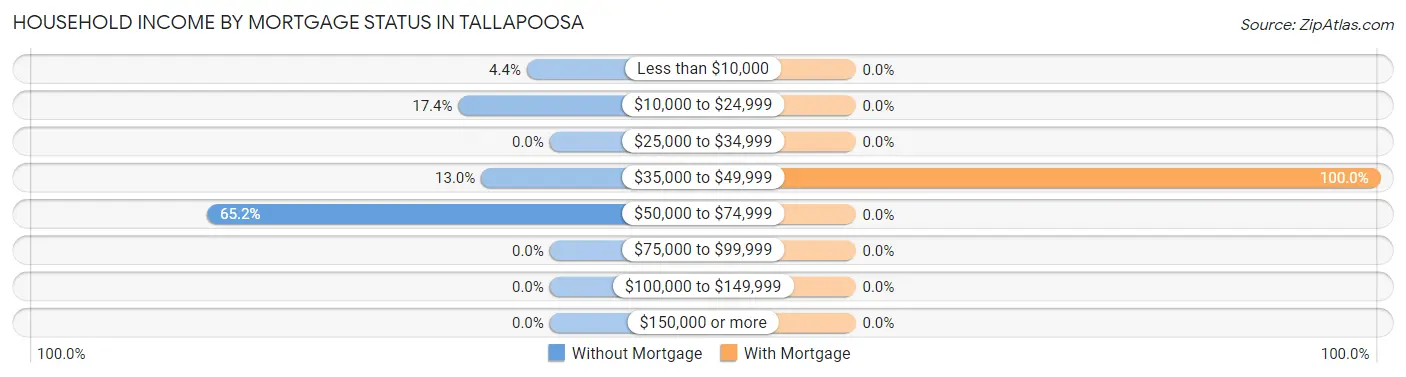
| Household Income | Without Mortgage | With Mortgage |
| Less than $10,000 | 1 (4.3%) | 0 (0.0%) |
| $10,000 to $24,999 | 4 (17.4%) | 0 (0.0%) |
| $25,000 to $34,999 | 0 (0.0%) | 0 (0.0%) |
| $35,000 to $49,999 | 3 (13.0%) | 8 (100.0%) |
| $50,000 to $74,999 | 15 (65.2%) | 0 (0.0%) |
| $75,000 to $99,999 | 0 (0.0%) | 0 (0.0%) |
| $100,000 to $149,999 | 0 (0.0%) | 0 (0.0%) |
| $150,000 or more | 0 (0.0%) | 0 (0.0%) |
| Total | 23 (100.0%) | 8 (100.0%) |
Property Value to Household Income Ratio in Tallapoosa
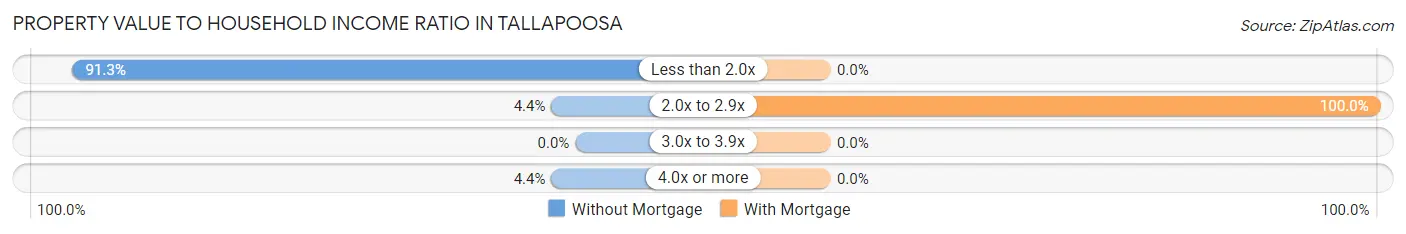
| Value-to-Income Ratio | Without Mortgage | With Mortgage |
| Less than 2.0x | 21 (91.3%) | 0 (0.0%) |
| 2.0x to 2.9x | 1 (4.3%) | 8 (100.0%) |
| 3.0x to 3.9x | 0 (0.0%) | 0 (0.0%) |
| 4.0x or more | 1 (4.3%) | 0 (0.0%) |
| Total | 23 (100.0%) | 8 (100.0%) |
Real Estate Taxes by Mortgage Status in Tallapoosa
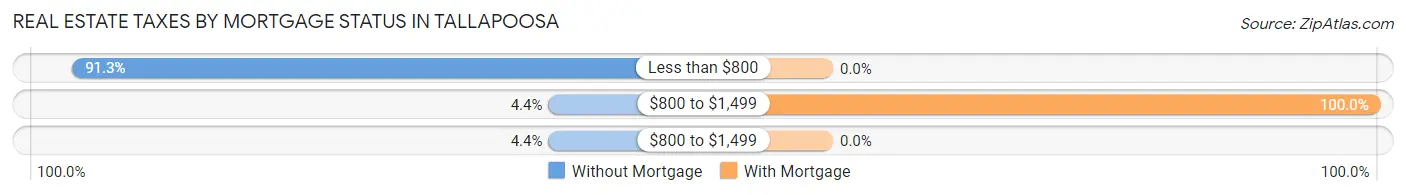
| Property Taxes | Without Mortgage | With Mortgage |
| Less than $800 | 21 (91.3%) | 0 (0.0%) |
| $800 to $1,499 | 1 (4.3%) | 8 (100.0%) |
| $800 to $1,499 | 1 (4.3%) | 0 (0.0%) |
| Total | 23 (100.0%) | 8 (100.0%) |
Health & Disability in Tallapoosa
Health Insurance Coverage by Age in Tallapoosa
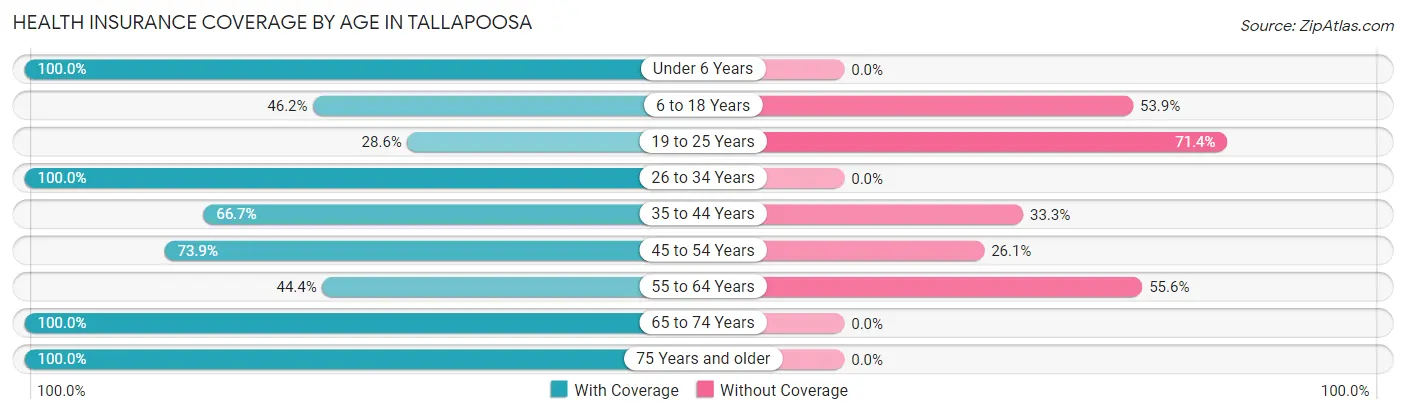
| Age Bracket | With Coverage | Without Coverage |
| Under 6 Years | 3 (100.0%) | 0 (0.0%) |
| 6 to 18 Years | 6 (46.2%) | 7 (53.8%) |
| 19 to 25 Years | 2 (28.6%) | 5 (71.4%) |
| 26 to 34 Years | 1 (100.0%) | 0 (0.0%) |
| 35 to 44 Years | 8 (66.7%) | 4 (33.3%) |
| 45 to 54 Years | 17 (73.9%) | 6 (26.1%) |
| 55 to 64 Years | 4 (44.4%) | 5 (55.6%) |
| 65 to 74 Years | 6 (100.0%) | 0 (0.0%) |
| 75 Years and older | 6 (100.0%) | 0 (0.0%) |
| Total | 53 (66.2%) | 27 (33.8%) |
Health Insurance Coverage by Citizenship Status in Tallapoosa
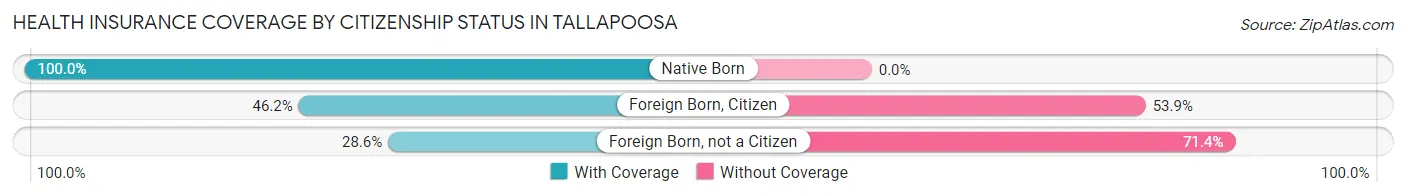
| Citizenship Status | With Coverage | Without Coverage |
| Native Born | 3 (100.0%) | 0 (0.0%) |
| Foreign Born, Citizen | 6 (46.2%) | 7 (53.8%) |
| Foreign Born, not a Citizen | 2 (28.6%) | 5 (71.4%) |
Health Insurance Coverage by Household Income in Tallapoosa
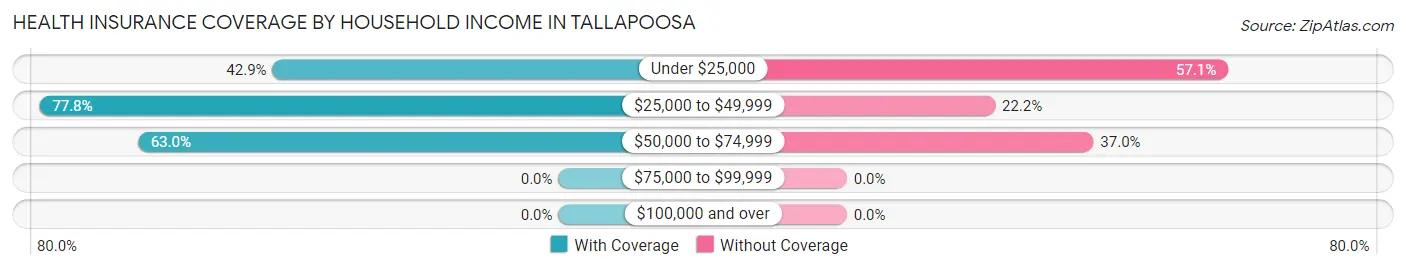
| Household Income | With Coverage | Without Coverage |
| Under $25,000 | 3 (42.9%) | 4 (57.1%) |
| $25,000 to $49,999 | 21 (77.8%) | 6 (22.2%) |
| $50,000 to $74,999 | 29 (63.0%) | 17 (37.0%) |
| $75,000 to $99,999 | 0 (0.0%) | 0 (0.0%) |
| $100,000 and over | 0 (0.0%) | 0 (0.0%) |
Public vs Private Health Insurance Coverage by Age in Tallapoosa
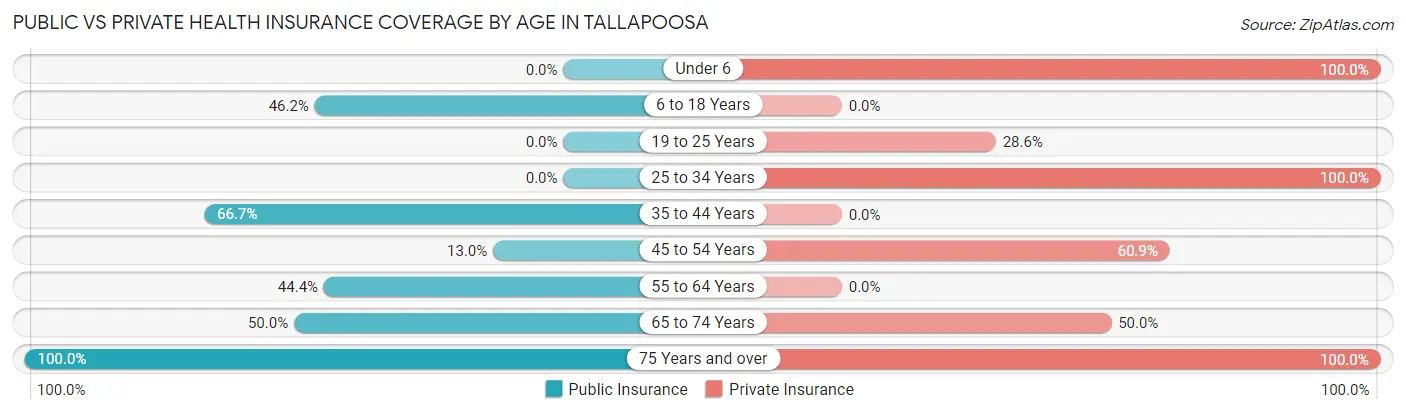
| Age Bracket | Public Insurance | Private Insurance |
| Under 6 | 0 (0.0%) | 3 (100.0%) |
| 6 to 18 Years | 6 (46.2%) | 0 (0.0%) |
| 19 to 25 Years | 0 (0.0%) | 2 (28.6%) |
| 25 to 34 Years | 0 (0.0%) | 1 (100.0%) |
| 35 to 44 Years | 8 (66.7%) | 0 (0.0%) |
| 45 to 54 Years | 3 (13.0%) | 14 (60.9%) |
| 55 to 64 Years | 4 (44.4%) | 0 (0.0%) |
| 65 to 74 Years | 3 (50.0%) | 3 (50.0%) |
| 75 Years and over | 6 (100.0%) | 6 (100.0%) |
| Total | 30 (37.5%) | 29 (36.2%) |
Disability Status by Sex by Age in Tallapoosa
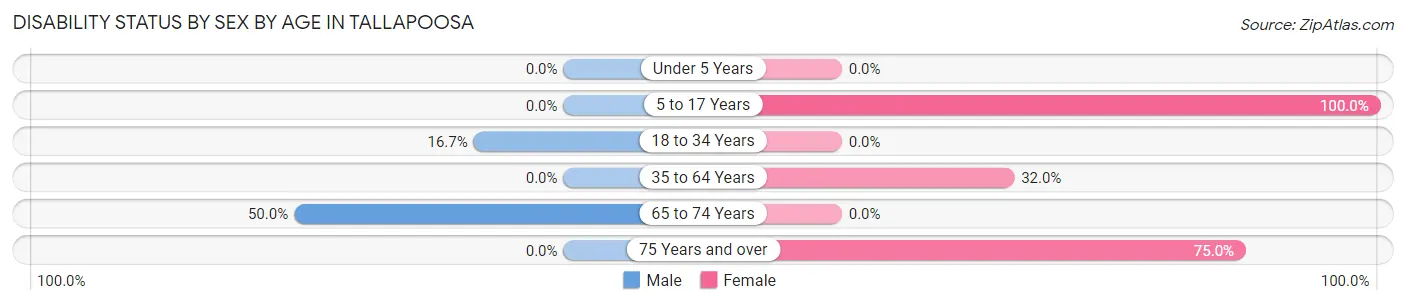
| Age Bracket | Male | Female |
| Under 5 Years | 0 (0.0%) | 0 (0.0%) |
| 5 to 17 Years | 0 (0.0%) | 6 (100.0%) |
| 18 to 34 Years | 1 (16.7%) | 0 (0.0%) |
| 35 to 64 Years | 0 (0.0%) | 8 (32.0%) |
| 65 to 74 Years | 3 (50.0%) | 0 (0.0%) |
| 75 Years and over | 0 (0.0%) | 3 (75.0%) |
Disability Class by Sex by Age in Tallapoosa
Disability Class: Hearing Difficulty
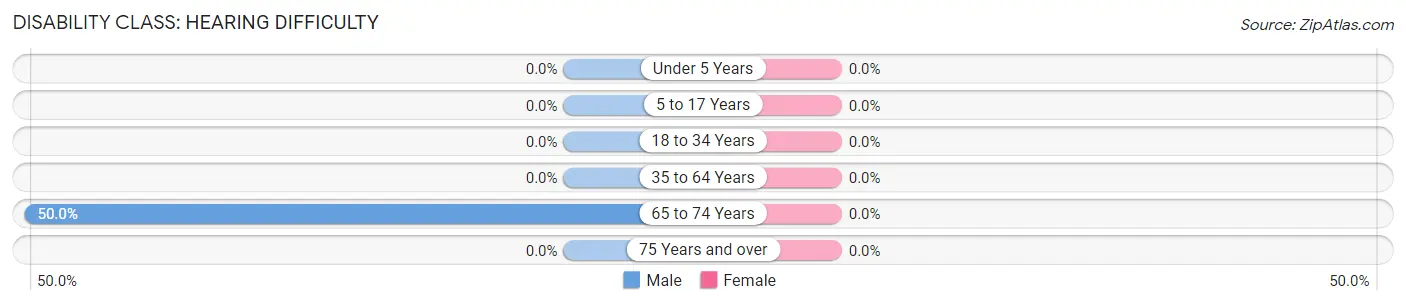
| Age Bracket | Male | Female |
| Under 5 Years | 0 (0.0%) | 0 (0.0%) |
| 5 to 17 Years | 0 (0.0%) | 0 (0.0%) |
| 18 to 34 Years | 0 (0.0%) | 0 (0.0%) |
| 35 to 64 Years | 0 (0.0%) | 0 (0.0%) |
| 65 to 74 Years | 3 (50.0%) | 0 (0.0%) |
| 75 Years and over | 0 (0.0%) | 0 (0.0%) |
Disability Class: Vision Difficulty
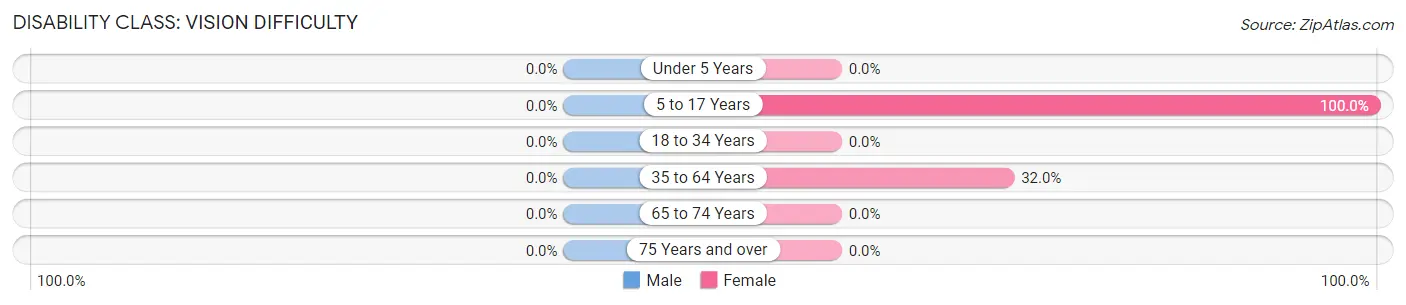
| Age Bracket | Male | Female |
| Under 5 Years | 0 (0.0%) | 0 (0.0%) |
| 5 to 17 Years | 0 (0.0%) | 6 (100.0%) |
| 18 to 34 Years | 0 (0.0%) | 0 (0.0%) |
| 35 to 64 Years | 0 (0.0%) | 8 (32.0%) |
| 65 to 74 Years | 0 (0.0%) | 0 (0.0%) |
| 75 Years and over | 0 (0.0%) | 0 (0.0%) |
Disability Class: Cognitive Difficulty
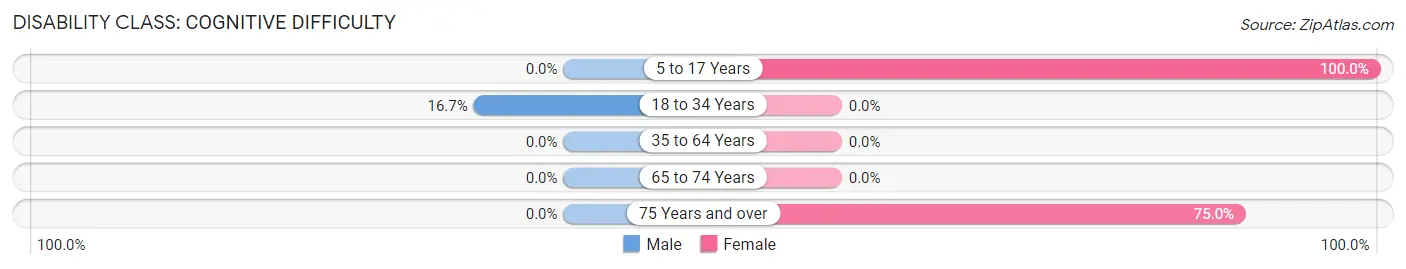
| Age Bracket | Male | Female |
| 5 to 17 Years | 0 (0.0%) | 6 (100.0%) |
| 18 to 34 Years | 1 (16.7%) | 0 (0.0%) |
| 35 to 64 Years | 0 (0.0%) | 0 (0.0%) |
| 65 to 74 Years | 0 (0.0%) | 0 (0.0%) |
| 75 Years and over | 0 (0.0%) | 3 (75.0%) |
Disability Class: Ambulatory Difficulty
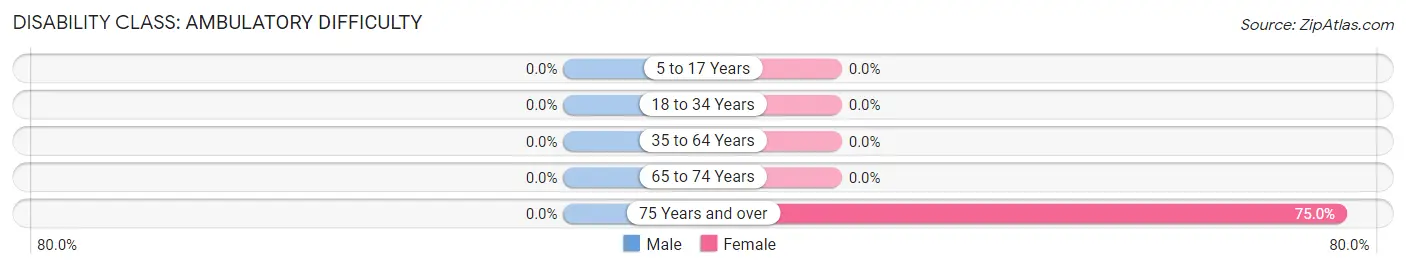
| Age Bracket | Male | Female |
| 5 to 17 Years | 0 (0.0%) | 0 (0.0%) |
| 18 to 34 Years | 0 (0.0%) | 0 (0.0%) |
| 35 to 64 Years | 0 (0.0%) | 0 (0.0%) |
| 65 to 74 Years | 0 (0.0%) | 0 (0.0%) |
| 75 Years and over | 0 (0.0%) | 3 (75.0%) |
Disability Class: Self-Care Difficulty
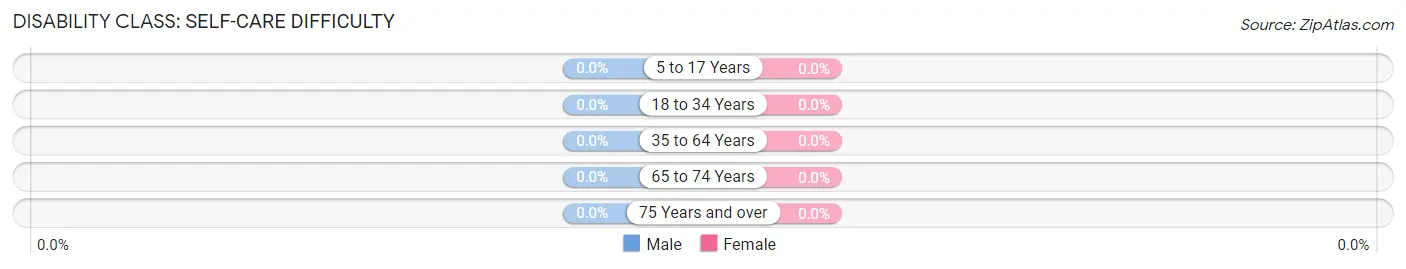
| Age Bracket | Male | Female |
| 5 to 17 Years | 0 (0.0%) | 0 (0.0%) |
| 18 to 34 Years | 0 (0.0%) | 0 (0.0%) |
| 35 to 64 Years | 0 (0.0%) | 0 (0.0%) |
| 65 to 74 Years | 0 (0.0%) | 0 (0.0%) |
| 75 Years and over | 0 (0.0%) | 0 (0.0%) |
Technology Access in Tallapoosa
Computing Device Access in Tallapoosa
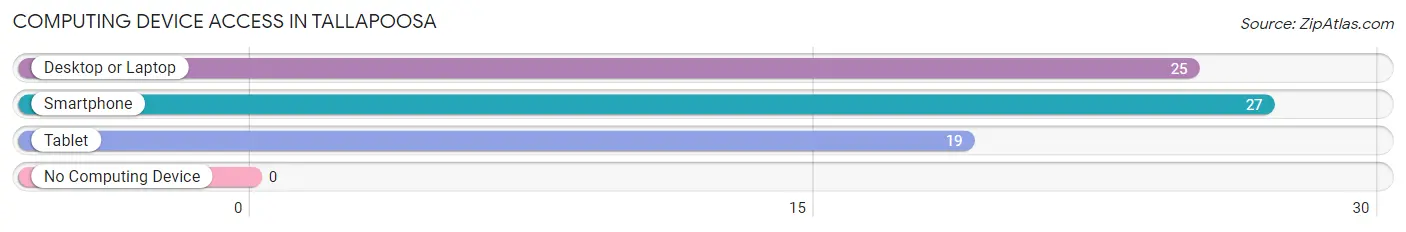
| Device Type | # Households | % Households |
| Desktop or Laptop | 25 | 80.6% |
| Smartphone | 27 | 87.1% |
| Tablet | 19 | 61.3% |
| No Computing Device | 0 | 0.0% |
| Total | 31 | 100.0% |
Internet Access in Tallapoosa
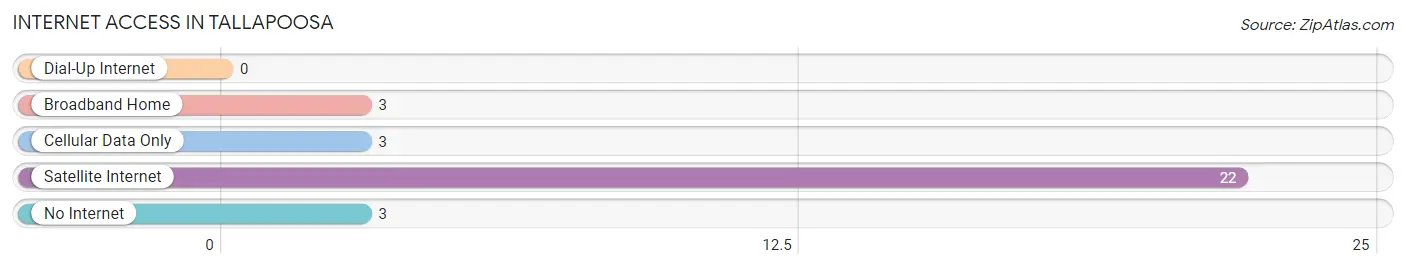
| Internet Type | # Households | % Households |
| Dial-Up Internet | 0 | 0.0% |
| Broadband Home | 3 | 9.7% |
| Cellular Data Only | 3 | 9.7% |
| Satellite Internet | 22 | 71.0% |
| No Internet | 3 | 9.7% |
| Total | 31 | 100.0% |
Tallapoosa Summary
Tallapoosa is a small town located in the southeastern corner of Missouri, in the United States. It is situated in the Ozark Mountains, and is part of the Ozark Plateau. The town is located in the county of St. Francois, and is part of the St. Louis metropolitan area. The population of Tallapoosa was estimated to be 1,072 in the year 2020.
History
Tallapoosa was founded in 1820 by a group of settlers from Tennessee. The town was named after the nearby Tallapoosa River, which was named after the Native American tribe of the same name. The town was originally a farming community, and the main crops grown were corn, wheat, and oats. The town was also known for its production of whiskey, which was made from the local corn and wheat.
In the late 1800s, the town began to grow and develop. The first school was built in 1876, and the first post office was established in 1877. The town also had a newspaper, the Tallapoosa Times, which was published from 1878 to 1883.
In the early 1900s, the town began to experience a period of growth and prosperity. The population increased from 1,000 in 1900 to 1,500 in 1910. The town also had a number of businesses, including a bank, a hotel, a general store, and a blacksmith shop.
In the 1920s, the town experienced a period of decline. The population decreased from 1,500 in 1910 to 1,000 in 1930. The Great Depression also had a negative effect on the town, and many businesses closed.
In the 1940s, the town began to experience a period of growth and development. The population increased from 1,000 in 1930 to 1,500 in 1950. The town also had a number of businesses, including a bank, a hotel, a general store, and a blacksmith shop.
In the 1950s, the town experienced a period of decline. The population decreased from 1,500 in 1950 to 1,000 in 1960. The town also had a number of businesses, including a bank, a hotel, a general store, and a blacksmith shop.
In the 1960s, the town began to experience a period of growth and development. The population increased from 1,000 in 1960 to 1,500 in 1970. The town also had a number of businesses, including a bank, a hotel, a general store, and a blacksmith shop.
In the 1970s, the town experienced a period of decline. The population decreased from 1,500 in 1970 to 1,000 in 1980. The town also had a number of businesses, including a bank, a hotel, a general store, and a blacksmith shop.
In the 1980s, the town began to experience a period of growth and development. The population increased from 1,000 in 1980 to 1,500 in 1990. The town also had a number of businesses, including a bank, a hotel, a general store, and a blacksmith shop.
Geography
Tallapoosa is located in the southeastern corner of Missouri, in the United States. It is situated in the Ozark Mountains, and is part of the Ozark Plateau. The town is located in the county of St. Francois, and is part of the St. Louis metropolitan area. The town is located at an elevation of 890 feet above sea level.
The town is located on the banks of the Tallapoosa River, which is a tributary of the Mississippi River. The town is surrounded by rolling hills and forests, and is home to a variety of wildlife, including deer, turkey, and other small game.
Economy
The economy of Tallapoosa is largely based on agriculture. The main crops grown in the area are corn, wheat, and oats. The town also has a number of businesses, including a bank, a hotel, a general store, and a blacksmith shop.
Demographics
The population of Tallapoosa was estimated to be 1,072 in the year 2020. The town has a population that is predominantly white, with a small percentage of African Americans and Hispanics. The median household income in the town is $37,000, and the median home value is $90,000. The town has a high school graduation rate of 87%, and the unemployment rate is 4.2%.
Common Questions
What is Per Capita Income in Tallapoosa?
Per Capita income in Tallapoosa is $17,629.
What is the Median Family Income in Tallapoosa?
Median Family Income in Tallapoosa is $50,000.
What is the Median Household income in Tallapoosa?
Median Household Income in Tallapoosa is $49,583.
What is Inequality or Gini Index in Tallapoosa?
Inequality or Gini Index in Tallapoosa is 0.23.
What is the Total Population of Tallapoosa?
Total Population of Tallapoosa is 80.
What is the Total Male Population of Tallapoosa?
Total Male Population of Tallapoosa is 42.
What is the Total Female Population of Tallapoosa?
Total Female Population of Tallapoosa is 38.
What is the Ratio of Males per 100 Females in Tallapoosa?
There are 110.53 Males per 100 Females in Tallapoosa.
What is the Ratio of Females per 100 Males in Tallapoosa?
There are 90.48 Females per 100 Males in Tallapoosa.
What is the Median Population Age in Tallapoosa?
Median Population Age in Tallapoosa is 45.5 Years.
What is the Average Family Size in Tallapoosa
Average Family Size in Tallapoosa is 2.4 People.
What is the Average Household Size in Tallapoosa
Average Household Size in Tallapoosa is 2.6 People.
How Large is the Labor Force in Tallapoosa?
There are 40 People in the Labor Forcein in Tallapoosa.
What is the Percentage of People in the Labor Force in Tallapoosa?
57.1% of People are in the Labor Force in Tallapoosa.