Sunrise Beach, MO Map & Demographics
Sunrise Beach Map
Sunrise Beach Overview
$28,632
PER CAPITA INCOME
$55,208
AVG FAMILY INCOME
$46,389
AVG HOUSEHOLD INCOME
22.2%
WAGE / INCOME GAP [ % ]
77.8¢/ $1
WAGE / INCOME GAP [ $ ]
0.42
INEQUALITY / GINI INDEX
463
TOTAL POPULATION
230
MALE POPULATION
233
FEMALE POPULATION
98.71
MALES / 100 FEMALES
101.30
FEMALES / 100 MALES
43.9
MEDIAN AGE
3.5
AVG FAMILY SIZE
2.7
AVG HOUSEHOLD SIZE
228
LABOR FORCE [ PEOPLE ]
59.1%
PERCENT IN LABOR FORCE
12.7%
UNEMPLOYMENT RATE
Sunrise Beach Zip Codes
Income in Sunrise Beach
Income Overview in Sunrise Beach
Per Capita Income in Sunrise Beach is $28,632, while median incomes of families and households are $55,208 and $46,389 respectively.
| Characteristic | Number | Measure |
| Per Capita Income | 463 | $28,632 |
| Median Family Income | 103 | $55,208 |
| Mean Family Income | 103 | $86,037 |
| Median Household Income | 174 | $46,389 |
| Mean Household Income | 174 | $70,599 |
| Income Deficit | 103 | $0 |
| Wage / Income Gap (%) | 463 | 22.22% |
| Wage / Income Gap ($) | 463 | 77.78¢ per $1 |
| Gini / Inequality Index | 463 | 0.42 |
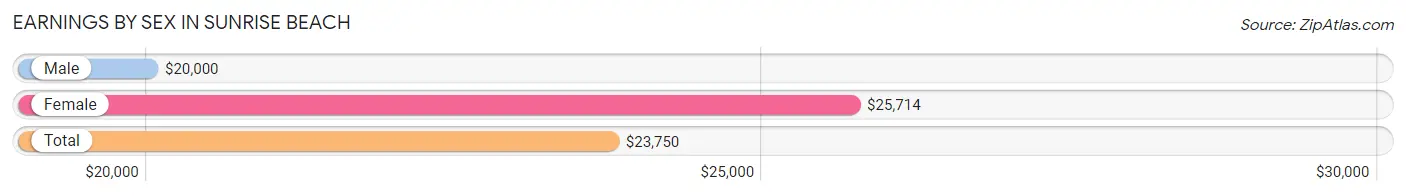
Earnings by Sex in Sunrise Beach
Average Earnings in Sunrise Beach are $23,750, $20,000 for men and $25,714 for women, a difference of 22.2%.
| Sex | Number | Average Earnings |
| Male | 136 (59.7%) | $20,000 |
| Female | 92 (40.4%) | $25,714 |
| Total | 228 (100.0%) | $23,750 |
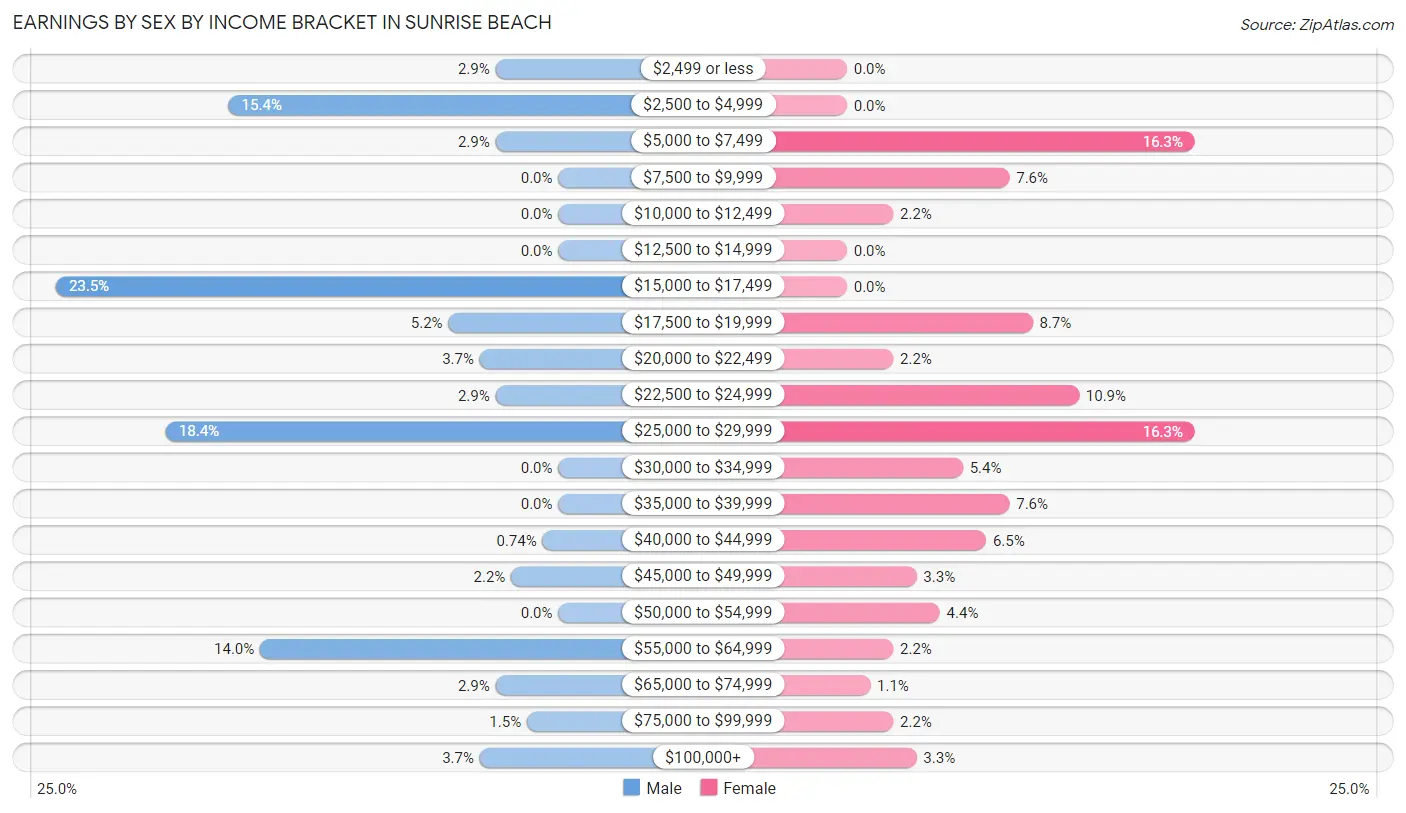
Earnings by Sex by Income Bracket in Sunrise Beach
The most common earnings brackets in Sunrise Beach are $15,000 to $17,499 for men (32 | 23.5%) and $5,000 to $7,499 for women (15 | 16.3%).
| Income | Male | Female |
| $2,499 or less | 4 (2.9%) | 0 (0.0%) |
| $2,500 to $4,999 | 21 (15.4%) | 0 (0.0%) |
| $5,000 to $7,499 | 4 (2.9%) | 15 (16.3%) |
| $7,500 to $9,999 | 0 (0.0%) | 7 (7.6%) |
| $10,000 to $12,499 | 0 (0.0%) | 2 (2.2%) |
| $12,500 to $14,999 | 0 (0.0%) | 0 (0.0%) |
| $15,000 to $17,499 | 32 (23.5%) | 0 (0.0%) |
| $17,500 to $19,999 | 7 (5.1%) | 8 (8.7%) |
| $20,000 to $22,499 | 5 (3.7%) | 2 (2.2%) |
| $22,500 to $24,999 | 4 (2.9%) | 10 (10.9%) |
| $25,000 to $29,999 | 25 (18.4%) | 15 (16.3%) |
| $30,000 to $34,999 | 0 (0.0%) | 5 (5.4%) |
| $35,000 to $39,999 | 0 (0.0%) | 7 (7.6%) |
| $40,000 to $44,999 | 1 (0.7%) | 6 (6.5%) |
| $45,000 to $49,999 | 3 (2.2%) | 3 (3.3%) |
| $50,000 to $54,999 | 0 (0.0%) | 4 (4.3%) |
| $55,000 to $64,999 | 19 (14.0%) | 2 (2.2%) |
| $65,000 to $74,999 | 4 (2.9%) | 1 (1.1%) |
| $75,000 to $99,999 | 2 (1.5%) | 2 (2.2%) |
| $100,000+ | 5 (3.7%) | 3 (3.3%) |
| Total | 136 (100.0%) | 92 (100.0%) |
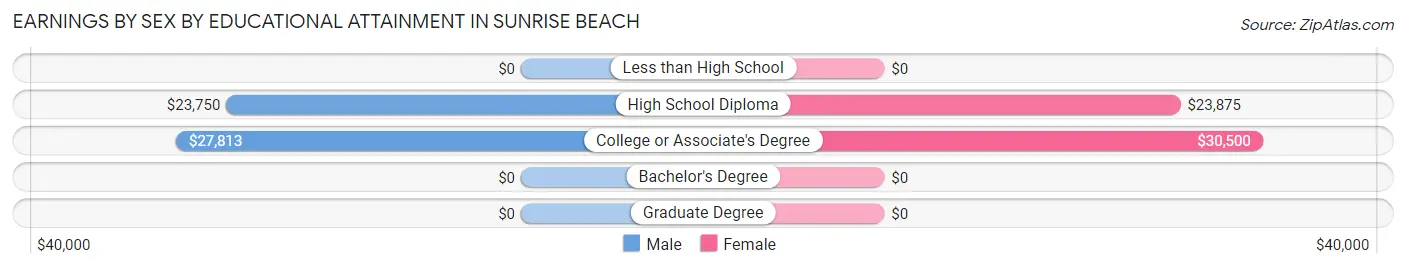
Earnings by Sex by Educational Attainment in Sunrise Beach
Average earnings in Sunrise Beach are $21,000 for men and $26,607 for women, a difference of 21.1%. Men with an educational attainment of college or associate's degree enjoy the highest average annual earnings of $27,813, while those with high school diploma education earn the least with $23,750. Women with an educational attainment of college or associate's degree earn the most with the average annual earnings of $30,500, while those with high school diploma education have the smallest earnings of $23,875.
| Educational Attainment | Male Income | Female Income |
| Less than High School | - | - |
| High School Diploma | $23,750 | $23,875 |
| College or Associate's Degree | $27,813 | $30,500 |
| Bachelor's Degree | - | - |
| Graduate Degree | - | - |
| Total | $21,000 | $26,607 |
Family Income in Sunrise Beach
Family Income Brackets in Sunrise Beach
According to the Sunrise Beach family income data, there are 37 families falling into the $35,000 to $49,999 income range, which is the most common income bracket and makes up 35.9% of all families.
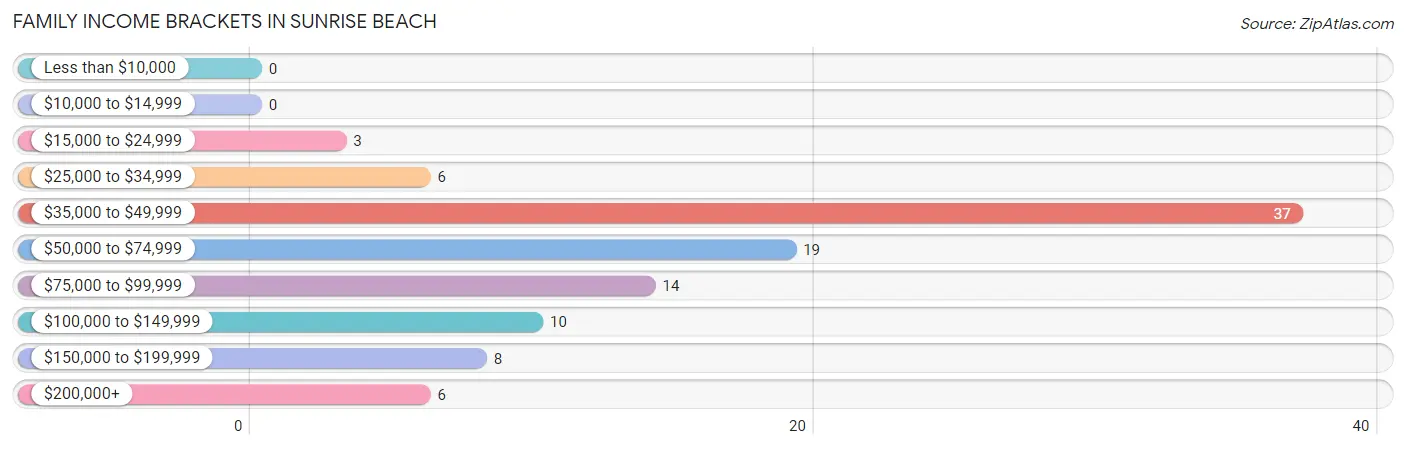
| Income Bracket | # Families | % Families |
| Less than $10,000 | 0 | 0.0% |
| $10,000 to $14,999 | 0 | 0.0% |
| $15,000 to $24,999 | 3 | 2.9% |
| $25,000 to $34,999 | 6 | 5.8% |
| $35,000 to $49,999 | 37 | 35.9% |
| $50,000 to $74,999 | 19 | 18.4% |
| $75,000 to $99,999 | 14 | 13.6% |
| $100,000 to $149,999 | 10 | 9.7% |
| $150,000 to $199,999 | 8 | 7.8% |
| $200,000+ | 6 | 5.8% |
Family Income by Famaliy Size in Sunrise Beach
2-person families (59 | 57.3%) account for the highest median family income in Sunrise Beach with $61,563 per family, while 2-person families (59 | 57.3%) have the highest median income of $30,782 per family member.
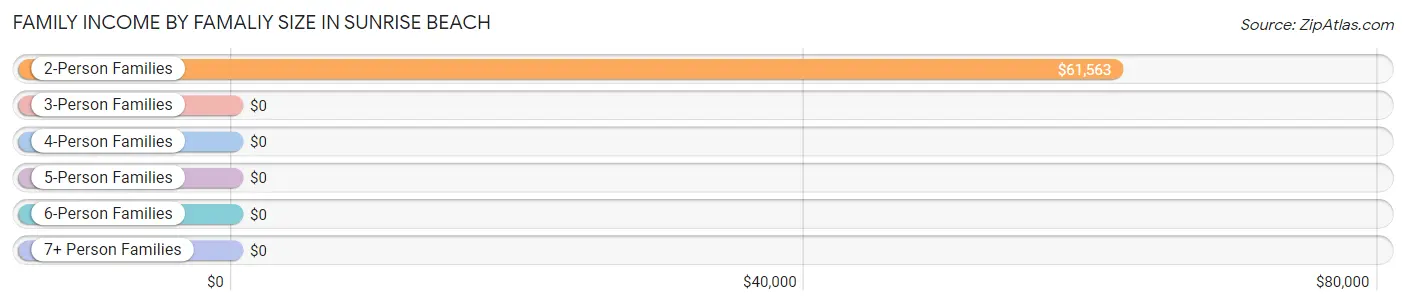
| Income Bracket | # Families | Median Income |
| 2-Person Families | 59 (57.3%) | $61,563 |
| 3-Person Families | 23 (22.3%) | $0 |
| 4-Person Families | 12 (11.7%) | $0 |
| 5-Person Families | 3 (2.9%) | $0 |
| 6-Person Families | 6 (5.8%) | $0 |
| 7+ Person Families | 0 (0.0%) | $0 |
| Total | 103 (100.0%) | $55,208 |
Family Income by Number of Earners in Sunrise Beach
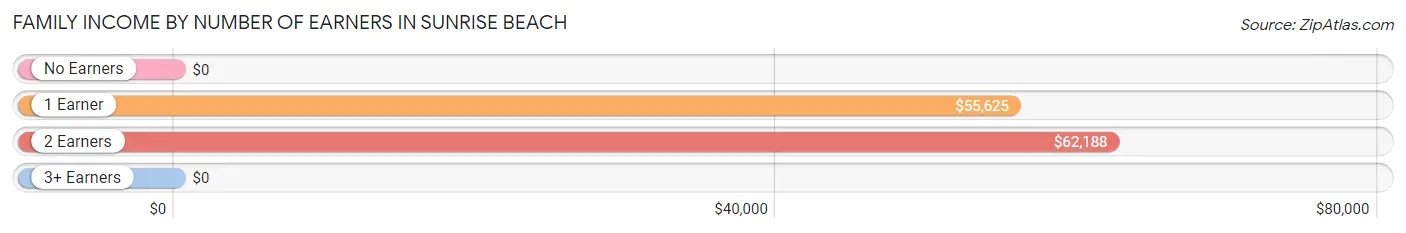
| Number of Earners | # Families | Median Income |
| No Earners | 18 (17.5%) | $0 |
| 1 Earner | 35 (34.0%) | $55,625 |
| 2 Earners | 45 (43.7%) | $62,188 |
| 3+ Earners | 5 (4.9%) | $0 |
| Total | 103 (100.0%) | $55,208 |
Household Income in Sunrise Beach
Household Income Brackets in Sunrise Beach
With 52 households falling in the category, the $35,000 to $49,999 income range is the most frequent in Sunrise Beach, accounting for 29.9% of all households. In contrast, only 3 households (1.7%) fall into the $10,000 to $14,999 income bracket, making it the least populous group.
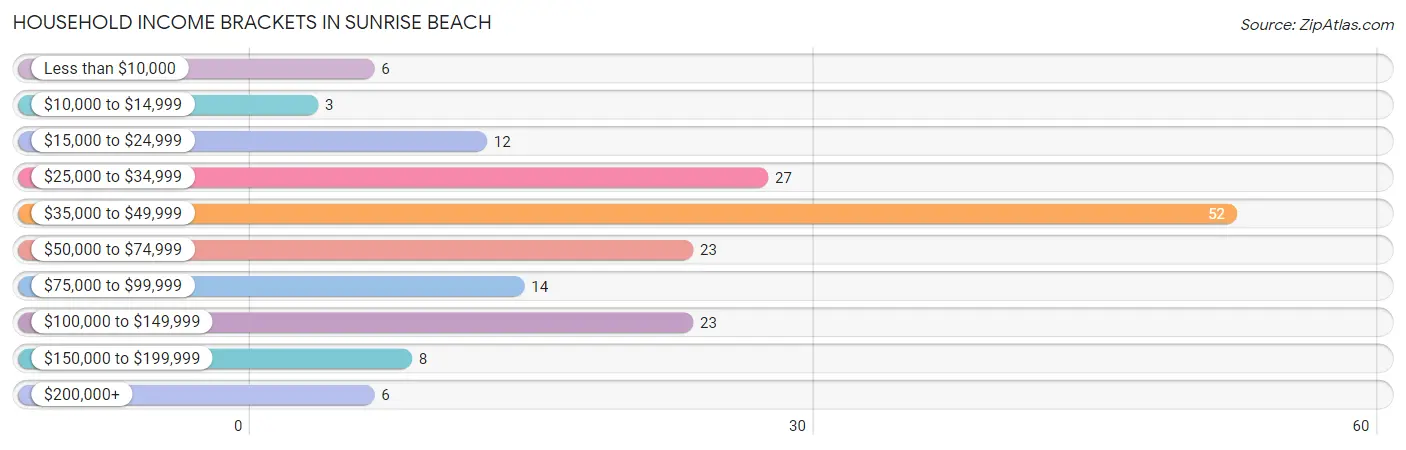
| Income Bracket | # Households | % Households |
| Less than $10,000 | 6 | 3.4% |
| $10,000 to $14,999 | 3 | 1.7% |
| $15,000 to $24,999 | 12 | 6.9% |
| $25,000 to $34,999 | 27 | 15.5% |
| $35,000 to $49,999 | 52 | 29.9% |
| $50,000 to $74,999 | 23 | 13.2% |
| $75,000 to $99,999 | 14 | 8.0% |
| $100,000 to $149,999 | 23 | 13.2% |
| $150,000 to $199,999 | 8 | 4.6% |
| $200,000+ | 6 | 3.4% |
Household Income by Householder Age in Sunrise Beach
The median household income in Sunrise Beach is $46,389, with the highest median household income of $97,917 found in the 45 to 64 years age bracket for the primary householder. A total of 63 households (36.2%) fall into this category.
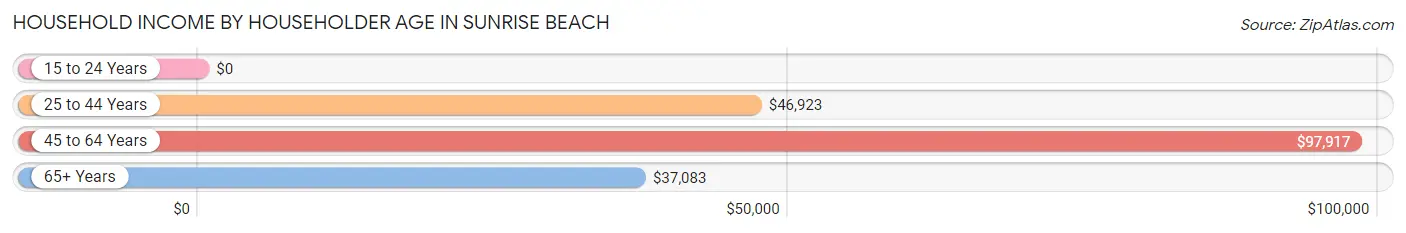
| Income Bracket | # Households | Median Income |
| 15 to 24 Years | 0 (0.0%) | $0 |
| 25 to 44 Years | 44 (25.3%) | $46,923 |
| 45 to 64 Years | 63 (36.2%) | $97,917 |
| 65+ Years | 67 (38.5%) | $37,083 |
| Total | 174 (100.0%) | $46,389 |
Poverty in Sunrise Beach
Income Below Poverty by Sex and Age in Sunrise Beach
With 3.5% poverty level for males and 12.4% for females among the residents of Sunrise Beach, under 5 year old males and 75 year old and over females are the most vulnerable to poverty, with 1 males (50.0%) and 2 females (28.6%) in their respective age groups living below the poverty level.
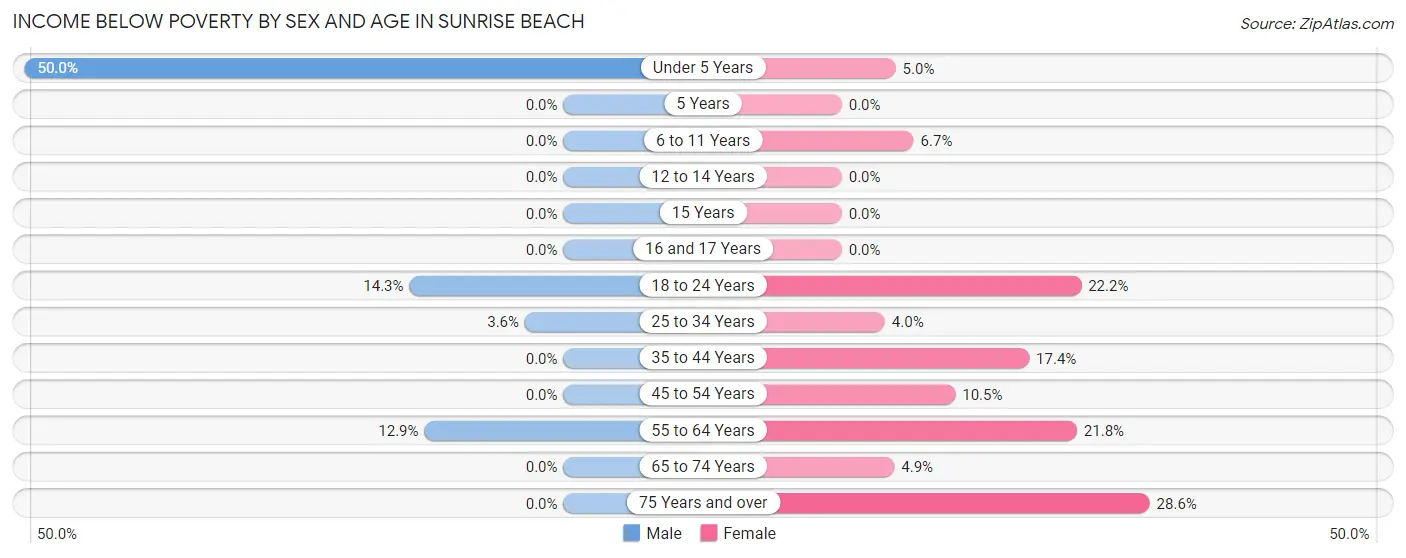
| Age Bracket | Male | Female |
| Under 5 Years | 1 (50.0%) | 1 (5.0%) |
| 5 Years | 0 (0.0%) | 0 (0.0%) |
| 6 to 11 Years | 0 (0.0%) | 1 (6.7%) |
| 12 to 14 Years | 0 (0.0%) | 0 (0.0%) |
| 15 Years | 0 (0.0%) | 0 (0.0%) |
| 16 and 17 Years | 0 (0.0%) | 0 (0.0%) |
| 18 to 24 Years | 2 (14.3%) | 4 (22.2%) |
| 25 to 34 Years | 1 (3.6%) | 1 (4.0%) |
| 35 to 44 Years | 0 (0.0%) | 4 (17.4%) |
| 45 to 54 Years | 0 (0.0%) | 2 (10.5%) |
| 55 to 64 Years | 4 (12.9%) | 12 (21.8%) |
| 65 to 74 Years | 0 (0.0%) | 2 (4.9%) |
| 75 Years and over | 0 (0.0%) | 2 (28.6%) |
| Total | 8 (3.5%) | 29 (12.4%) |
Income Above Poverty by Sex and Age in Sunrise Beach
According to the poverty statistics in Sunrise Beach, males aged 6 to 11 years and females aged 15 years are the age groups that are most secure financially, with 100.0% of males and 100.0% of females in these age groups living above the poverty line.
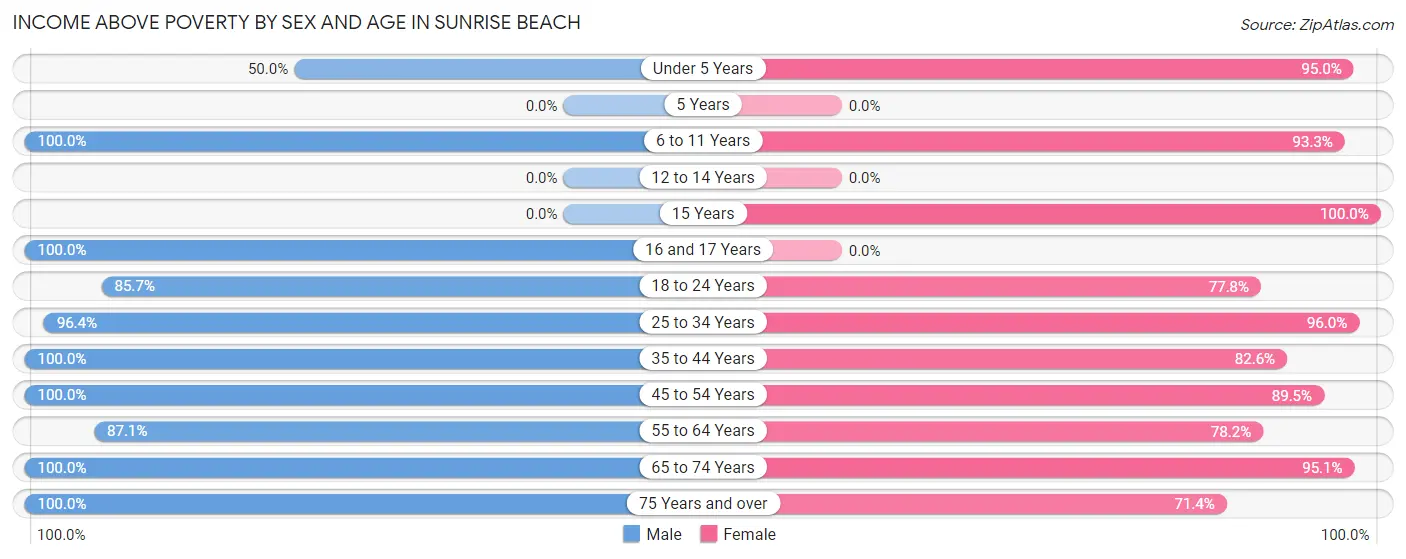
| Age Bracket | Male | Female |
| Under 5 Years | 1 (50.0%) | 19 (95.0%) |
| 5 Years | 0 (0.0%) | 0 (0.0%) |
| 6 to 11 Years | 30 (100.0%) | 14 (93.3%) |
| 12 to 14 Years | 0 (0.0%) | 0 (0.0%) |
| 15 Years | 0 (0.0%) | 10 (100.0%) |
| 16 and 17 Years | 8 (100.0%) | 0 (0.0%) |
| 18 to 24 Years | 12 (85.7%) | 14 (77.8%) |
| 25 to 34 Years | 27 (96.4%) | 24 (96.0%) |
| 35 to 44 Years | 39 (100.0%) | 19 (82.6%) |
| 45 to 54 Years | 42 (100.0%) | 17 (89.5%) |
| 55 to 64 Years | 27 (87.1%) | 43 (78.2%) |
| 65 to 74 Years | 18 (100.0%) | 39 (95.1%) |
| 75 Years and over | 18 (100.0%) | 5 (71.4%) |
| Total | 222 (96.5%) | 204 (87.5%) |
Income Below Poverty Among Married-Couple Families in Sunrise Beach
The poverty statistics for married-couple families in Sunrise Beach show that 1.3% or 1 of the total 74 families live below the poverty line. Families with 3 or 4 children have the highest poverty rate of 14.3%, comprising of 1 families. On the other hand, families with no children have the lowest poverty rate of 0.0%, which includes 0 families.
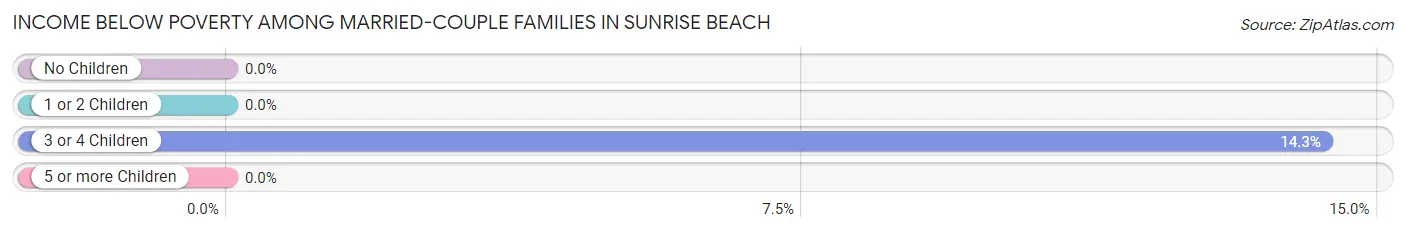
| Children | Above Poverty | Below Poverty |
| No Children | 43 (100.0%) | 0 (0.0%) |
| 1 or 2 Children | 24 (100.0%) | 0 (0.0%) |
| 3 or 4 Children | 6 (85.7%) | 1 (14.3%) |
| 5 or more Children | 0 (0.0%) | 0 (0.0%) |
| Total | 73 (98.7%) | 1 (1.3%) |
Income Below Poverty Among Single-Parent Households in Sunrise Beach
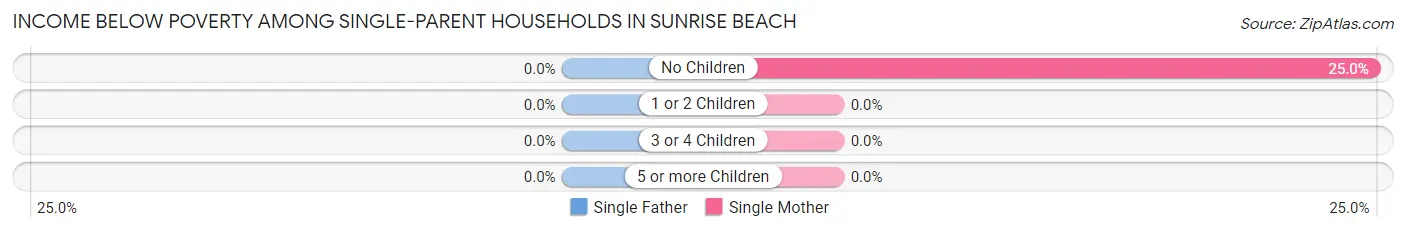
| Children | Single Father | Single Mother |
| No Children | 0 (0.0%) | 3 (25.0%) |
| 1 or 2 Children | 0 (0.0%) | 0 (0.0%) |
| 3 or 4 Children | 0 (0.0%) | 0 (0.0%) |
| 5 or more Children | 0 (0.0%) | 0 (0.0%) |
| Total | 0 (0.0%) | 3 (13.6%) |
Income Below Poverty Among Married-Couple vs Single-Parent Households in Sunrise Beach
The poverty data for Sunrise Beach shows that 1 of the married-couple family households (1.3%) and 3 of the single-parent households (10.3%) are living below the poverty level. Within the married-couple family households, those with 3 or 4 children have the highest poverty rate, with 1 households (14.3%) falling below the poverty line. Among the single-parent households, those with no children have the highest poverty rate, with 3 household (18.8%) living below poverty.
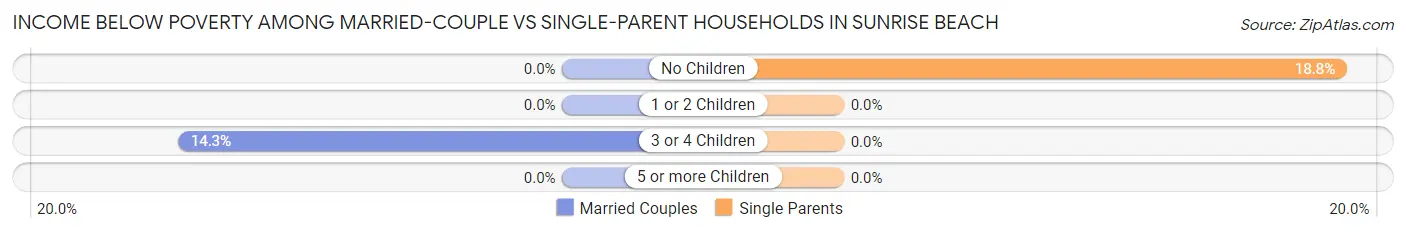
| Children | Married-Couple Families | Single-Parent Households |
| No Children | 0 (0.0%) | 3 (18.8%) |
| 1 or 2 Children | 0 (0.0%) | 0 (0.0%) |
| 3 or 4 Children | 1 (14.3%) | 0 (0.0%) |
| 5 or more Children | 0 (0.0%) | 0 (0.0%) |
| Total | 1 (1.3%) | 3 (10.3%) |
Race in Sunrise Beach
The most populous races in Sunrise Beach are White / Caucasian (426 | 92.0%), Hispanic or Latino (22 | 4.8%), and Some other Race (20 | 4.3%).
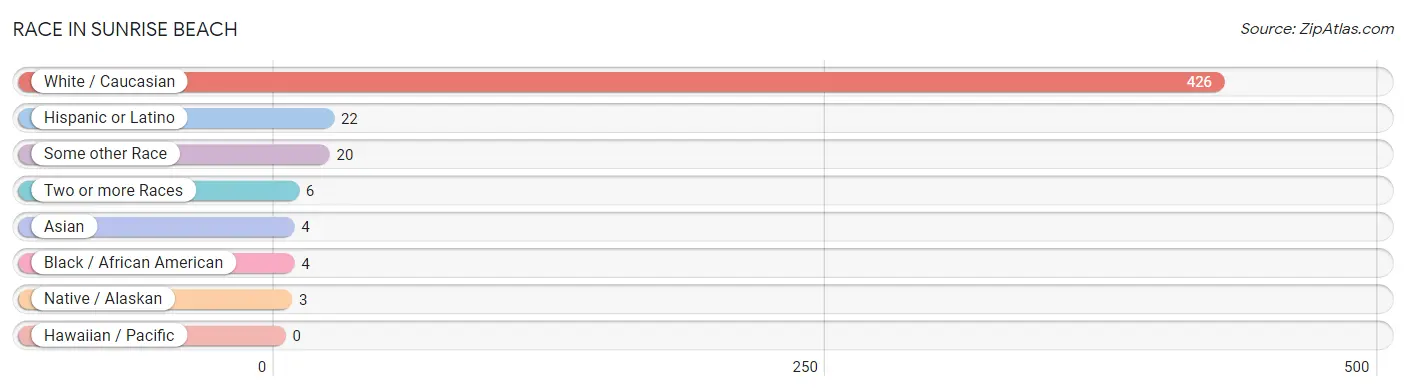
| Race | # Population | % Population |
| Asian | 4 | 0.9% |
| Black / African American | 4 | 0.9% |
| Hawaiian / Pacific | 0 | 0.0% |
| Hispanic or Latino | 22 | 4.8% |
| Native / Alaskan | 3 | 0.6% |
| White / Caucasian | 426 | 92.0% |
| Two or more Races | 6 | 1.3% |
| Some other Race | 20 | 4.3% |
| Total | 463 | 100.0% |
Ancestry in Sunrise Beach
The most populous ancestries reported in Sunrise Beach are German (116 | 25.1%), Irish (73 | 15.8%), French (43 | 9.3%), American (35 | 7.6%), and English (32 | 6.9%), together accounting for 64.6% of all Sunrise Beach residents.
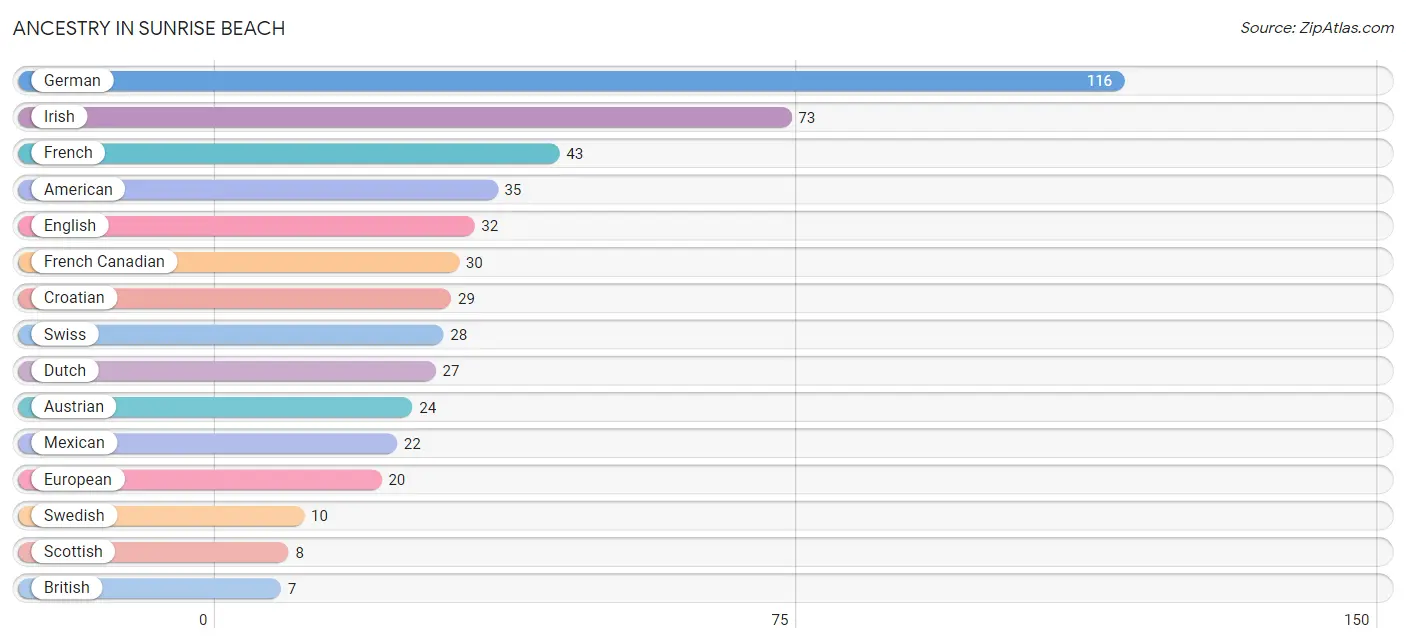
| Ancestry | # Population | % Population |
| American | 35 | 7.6% |
| Austrian | 24 | 5.2% |
| British | 7 | 1.5% |
| Choctaw | 2 | 0.4% |
| Croatian | 29 | 6.3% |
| Czech | 4 | 0.9% |
| Danish | 5 | 1.1% |
| Dutch | 27 | 5.8% |
| English | 32 | 6.9% |
| European | 20 | 4.3% |
| French | 43 | 9.3% |
| French Canadian | 30 | 6.5% |
| German | 116 | 25.1% |
| Indian (Asian) | 4 | 0.9% |
| Irish | 73 | 15.8% |
| Italian | 6 | 1.3% |
| Mexican | 22 | 4.8% |
| Norwegian | 3 | 0.6% |
| Polish | 2 | 0.4% |
| Scandinavian | 3 | 0.6% |
| Scottish | 8 | 1.7% |
| Swedish | 10 | 2.2% |
| Swiss | 28 | 6.0% | View All 23 Rows |
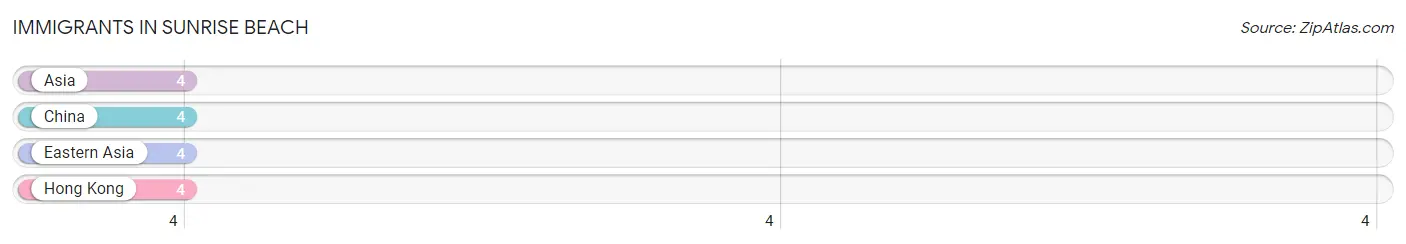
Immigrants in Sunrise Beach
The most numerous immigrant groups reported in Sunrise Beach came from Asia (4 | 0.9%), China (4 | 0.9%), Eastern Asia (4 | 0.9%), and Hong Kong (4 | 0.9%), together accounting for 3.4% of all Sunrise Beach residents.
| Immigration Origin | # Population | % Population |
| Asia | 4 | 0.9% |
| China | 4 | 0.9% |
| Eastern Asia | 4 | 0.9% |
| Hong Kong | 4 | 0.9% | View All 4 Rows |
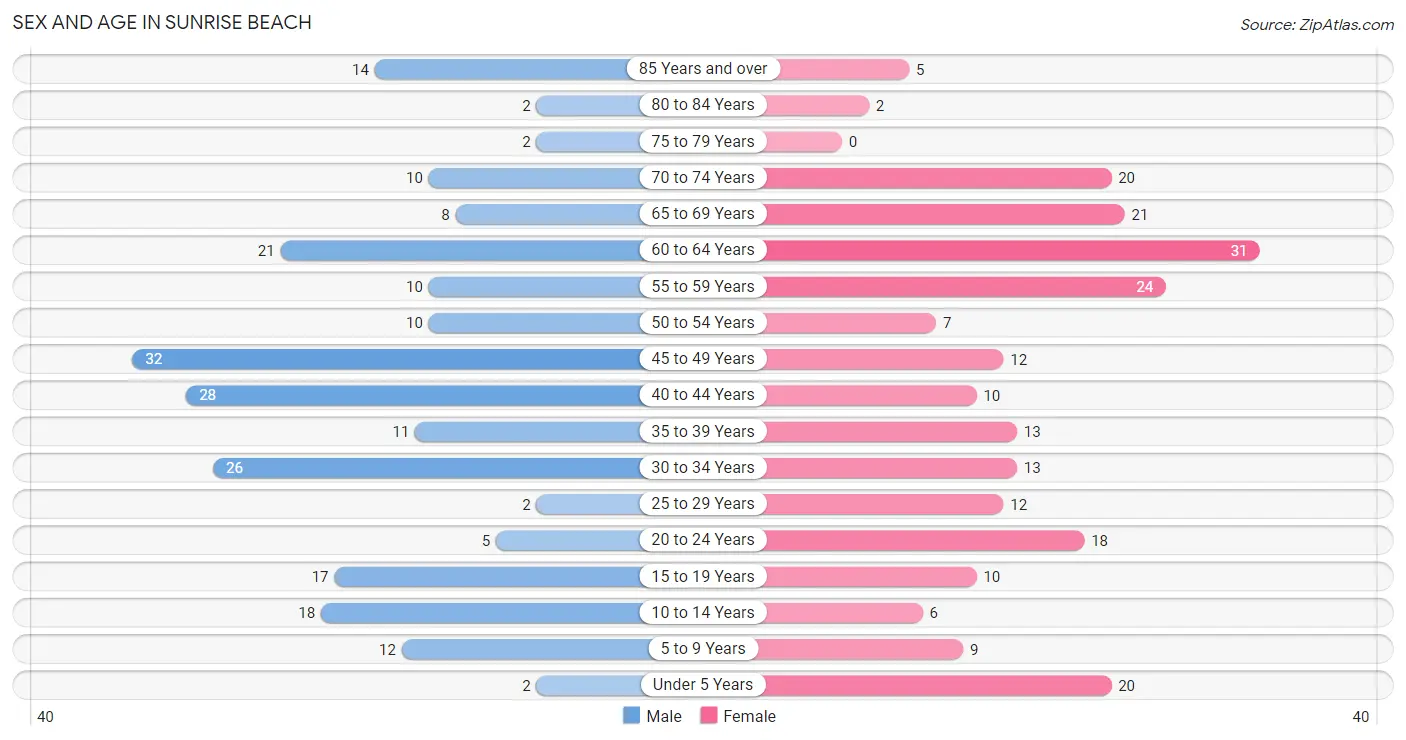
Sex and Age in Sunrise Beach
Sex and Age in Sunrise Beach
The most populous age groups in Sunrise Beach are 45 to 49 Years (32 | 13.9%) for men and 60 to 64 Years (31 | 13.3%) for women.
| Age Bracket | Male | Female |
| Under 5 Years | 2 (0.9%) | 20 (8.6%) |
| 5 to 9 Years | 12 (5.2%) | 9 (3.9%) |
| 10 to 14 Years | 18 (7.8%) | 6 (2.6%) |
| 15 to 19 Years | 17 (7.4%) | 10 (4.3%) |
| 20 to 24 Years | 5 (2.2%) | 18 (7.7%) |
| 25 to 29 Years | 2 (0.9%) | 12 (5.1%) |
| 30 to 34 Years | 26 (11.3%) | 13 (5.6%) |
| 35 to 39 Years | 11 (4.8%) | 13 (5.6%) |
| 40 to 44 Years | 28 (12.2%) | 10 (4.3%) |
| 45 to 49 Years | 32 (13.9%) | 12 (5.1%) |
| 50 to 54 Years | 10 (4.3%) | 7 (3.0%) |
| 55 to 59 Years | 10 (4.3%) | 24 (10.3%) |
| 60 to 64 Years | 21 (9.1%) | 31 (13.3%) |
| 65 to 69 Years | 8 (3.5%) | 21 (9.0%) |
| 70 to 74 Years | 10 (4.3%) | 20 (8.6%) |
| 75 to 79 Years | 2 (0.9%) | 0 (0.0%) |
| 80 to 84 Years | 2 (0.9%) | 2 (0.9%) |
| 85 Years and over | 14 (6.1%) | 5 (2.1%) |
| Total | 230 (100.0%) | 233 (100.0%) |
Families and Households in Sunrise Beach
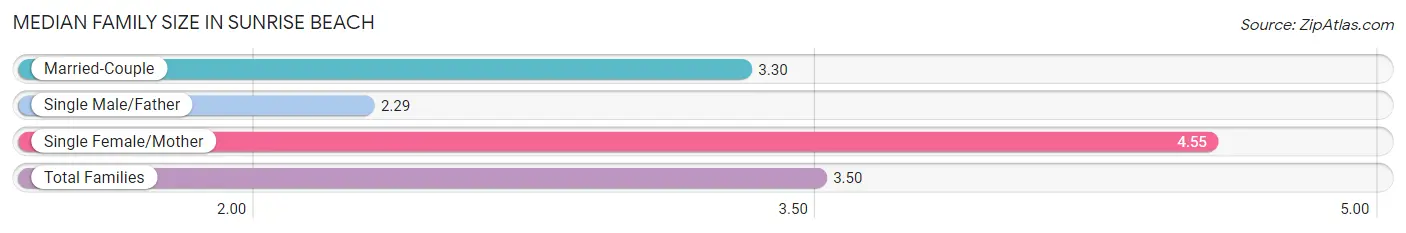
Median Family Size in Sunrise Beach
The median family size in Sunrise Beach is 3.50 persons per family, with single female/mother families (22 | 21.4%) accounting for the largest median family size of 4.55 persons per family. On the other hand, single male/father families (7 | 6.8%) represent the smallest median family size with 2.29 persons per family.
| Family Type | # Families | Family Size |
| Married-Couple | 74 (71.8%) | 3.30 |
| Single Male/Father | 7 (6.8%) | 2.29 |
| Single Female/Mother | 22 (21.4%) | 4.55 |
| Total Families | 103 (100.0%) | 3.50 |
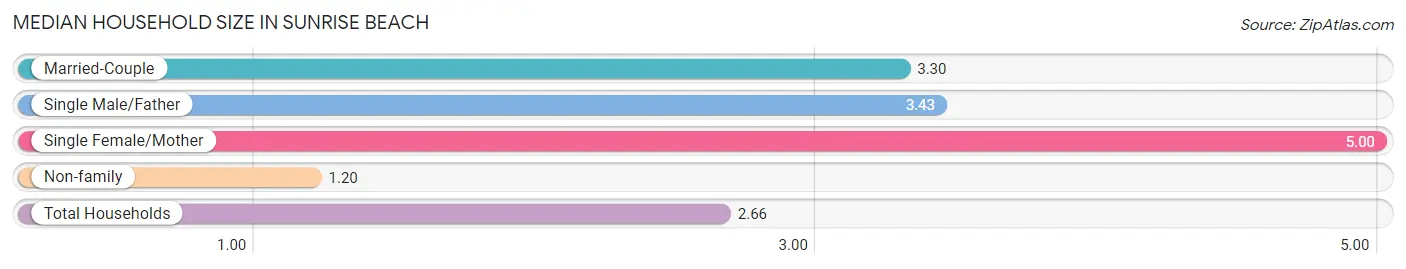
Median Household Size in Sunrise Beach
The median household size in Sunrise Beach is 2.66 persons per household, with single female/mother households (22 | 12.6%) accounting for the largest median household size of 5 persons per household. non-family households (71 | 40.8%) represent the smallest median household size with 1.20 persons per household.
| Household Type | # Households | Household Size |
| Married-Couple | 74 (42.5%) | 3.30 |
| Single Male/Father | 7 (4.0%) | 3.43 |
| Single Female/Mother | 22 (12.6%) | 5.00 |
| Non-family | 71 (40.8%) | 1.20 |
| Total Households | 174 (100.0%) | 2.66 |
Household Size by Marriage Status in Sunrise Beach
Out of a total of 174 households in Sunrise Beach, 103 (59.2%) are family households, while 71 (40.8%) are nonfamily households. The most numerous type of family households are 2-person households, comprising 49, and the most common type of nonfamily households are 1-person households, comprising 67.
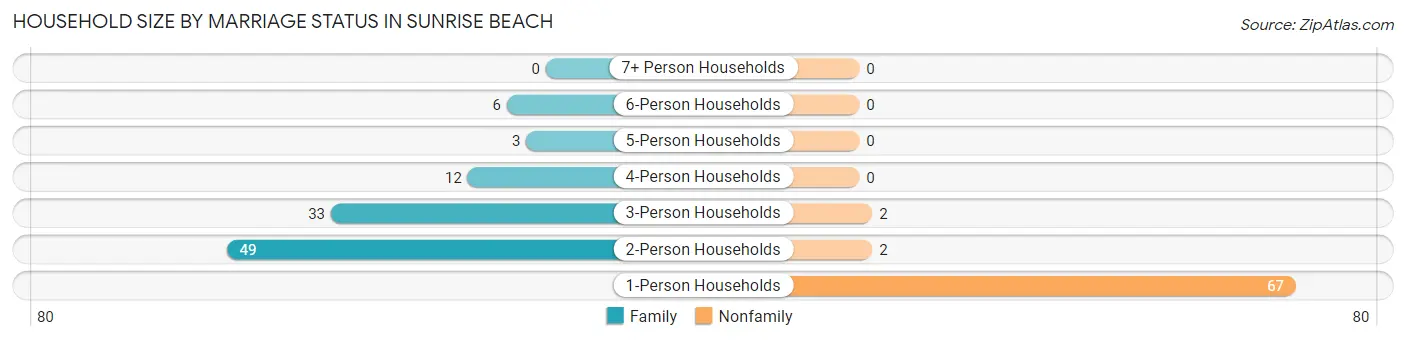
| Household Size | Family Households | Nonfamily Households |
| 1-Person Households | - | 67 (38.5%) |
| 2-Person Households | 49 (28.2%) | 2 (1.1%) |
| 3-Person Households | 33 (19.0%) | 2 (1.1%) |
| 4-Person Households | 12 (6.9%) | 0 (0.0%) |
| 5-Person Households | 3 (1.7%) | 0 (0.0%) |
| 6-Person Households | 6 (3.5%) | 0 (0.0%) |
| 7+ Person Households | 0 (0.0%) | 0 (0.0%) |
| Total | 103 (59.2%) | 71 (40.8%) |
Female Fertility in Sunrise Beach
Fertility by Age in Sunrise Beach
| Age Bracket | Women with Births | Births / 1,000 Women |
| 15 to 19 years | 0 (0.0%) | 0.0 |
| 20 to 34 years | 0 (0.0%) | 0.0 |
| 35 to 50 years | 0 (0.0%) | 0.0 |
| Total | 0 (0.0%) | 0.0 |
Fertility by Age by Marriage Status in Sunrise Beach
| Age Bracket | Married | Unmarried |
| 15 to 19 years | 0 (0.0%) | 0 (0.0%) |
| 20 to 34 years | 0 (0.0%) | 0 (0.0%) |
| 35 to 50 years | 0 (0.0%) | 0 (0.0%) |
| Total | 0 (0.0%) | 0 (0.0%) |
Fertility by Education in Sunrise Beach
| Educational Attainment | Women with Births | Births / 1,000 Women |
| Less than High School | 0 (0.0%) | 0.0 |
| High School Diploma | 0 (0.0%) | 0.0 |
| College or Associate's Degree | 0 (0.0%) | 0.0 |
| Bachelor's Degree | 0 (0.0%) | 0.0 |
| Graduate Degree | 0 (0.0%) | 0.0 |
| Total | 0 (0.0%) | 0.0 |
Fertility by Education by Marriage Status in Sunrise Beach
| Educational Attainment | Married | Unmarried |
| Less than High School | 0 (0.0%) | 0 (0.0%) |
| High School Diploma | 0 (0.0%) | 0 (0.0%) |
| College or Associate's Degree | 0 (0.0%) | 0 (0.0%) |
| Bachelor's Degree | 0 (0.0%) | 0 (0.0%) |
| Graduate Degree | 0 (0.0%) | 0 (0.0%) |
| Total | 0 (0.0%) | 0 (0.0%) |
Employment Characteristics in Sunrise Beach
Employment by Class of Employer in Sunrise Beach
Among the 191 employed individuals in Sunrise Beach, private company employees (142 | 74.4%), self-employed (not incorporated) (16 | 8.4%), and not-for-profit organizations (12 | 6.3%) make up the most common classes of employment.
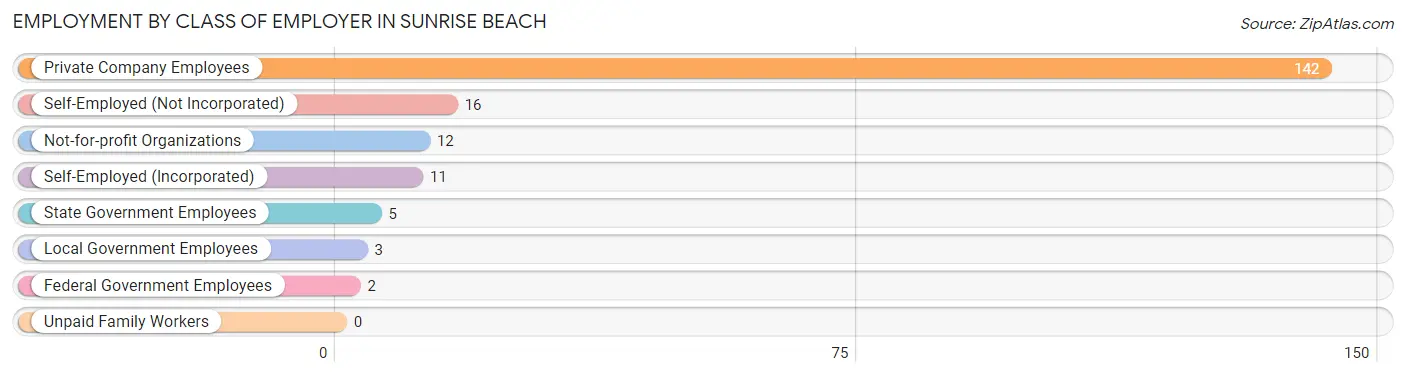
| Employer Class | # Employees | % Employees |
| Private Company Employees | 142 | 74.4% |
| Self-Employed (Incorporated) | 11 | 5.8% |
| Self-Employed (Not Incorporated) | 16 | 8.4% |
| Not-for-profit Organizations | 12 | 6.3% |
| Local Government Employees | 3 | 1.6% |
| State Government Employees | 5 | 2.6% |
| Federal Government Employees | 2 | 1.1% |
| Unpaid Family Workers | 0 | 0.0% |
| Total | 191 | 100.0% |
Employment Status by Age in Sunrise Beach
According to the labor force statistics for Sunrise Beach, out of the total population over 16 years of age (386), 59.1% or 228 individuals are in the labor force, with 12.7% or 29 of them unemployed. The age group with the highest labor force participation rate is 16 to 19 years, with 100.0% or 17 individuals in the labor force. Within the labor force, the 45 to 54 years age range has the highest percentage of unemployed individuals, with 53.7% or 29 of them being unemployed.
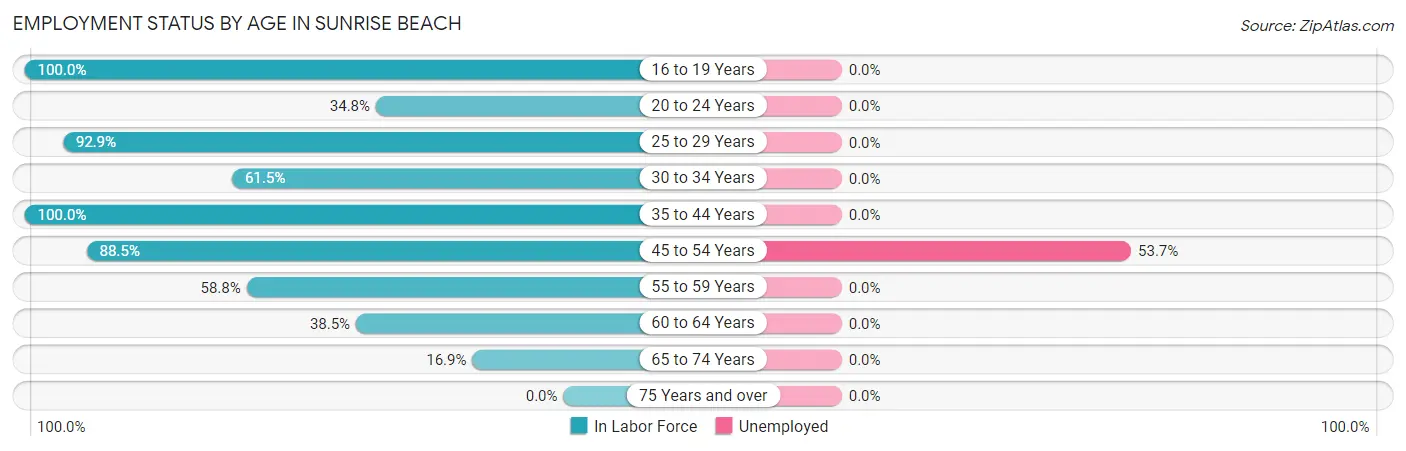
| Age Bracket | In Labor Force | Unemployed |
| 16 to 19 Years | 17 (100.0%) | 0 (0.0%) |
| 20 to 24 Years | 8 (34.8%) | 0 (0.0%) |
| 25 to 29 Years | 13 (92.9%) | 0 (0.0%) |
| 30 to 34 Years | 24 (61.5%) | 0 (0.0%) |
| 35 to 44 Years | 62 (100.0%) | 0 (0.0%) |
| 45 to 54 Years | 54 (88.5%) | 29 (53.7%) |
| 55 to 59 Years | 20 (58.8%) | 0 (0.0%) |
| 60 to 64 Years | 20 (38.5%) | 0 (0.0%) |
| 65 to 74 Years | 10 (16.9%) | 0 (0.0%) |
| 75 Years and over | 0 (0.0%) | 0 (0.0%) |
| Total | 228 (59.1%) | 29 (12.7%) |
Employment Status by Educational Attainment in Sunrise Beach
According to labor force statistics for Sunrise Beach, 73.7% of individuals (193) out of the total population between 25 and 64 years of age (262) are in the labor force, with 15.0% or 29 of them being unemployed. The group with the highest labor force participation rate are those with the educational attainment of less than high school, with 100.0% or 5 individuals in the labor force. Within the labor force, individuals with bachelor's degree or higher education have the highest percentage of unemployment, with 37.7% or 29 of them being unemployed.
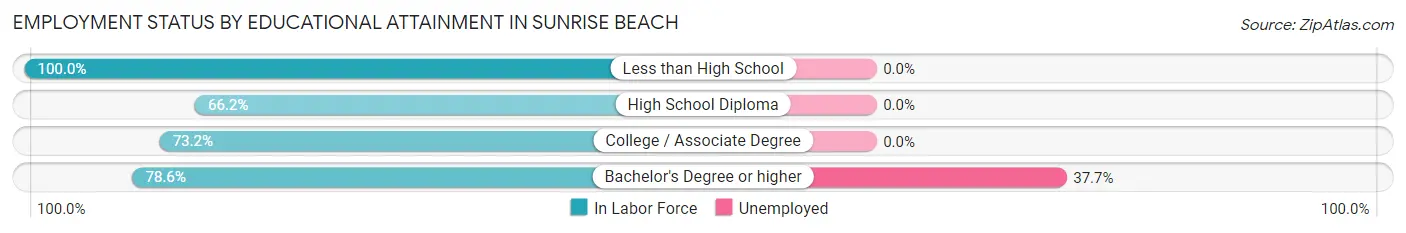
| Educational Attainment | In Labor Force | Unemployed |
| Less than High School | 5 (100.0%) | 0 (0.0%) |
| High School Diploma | 51 (66.2%) | 0 (0.0%) |
| College / Associate Degree | 60 (73.2%) | 0 (0.0%) |
| Bachelor's Degree or higher | 77 (78.6%) | 37 (37.7%) |
| Total | 193 (73.7%) | 39 (15.0%) |
Employment Occupations by Sex in Sunrise Beach
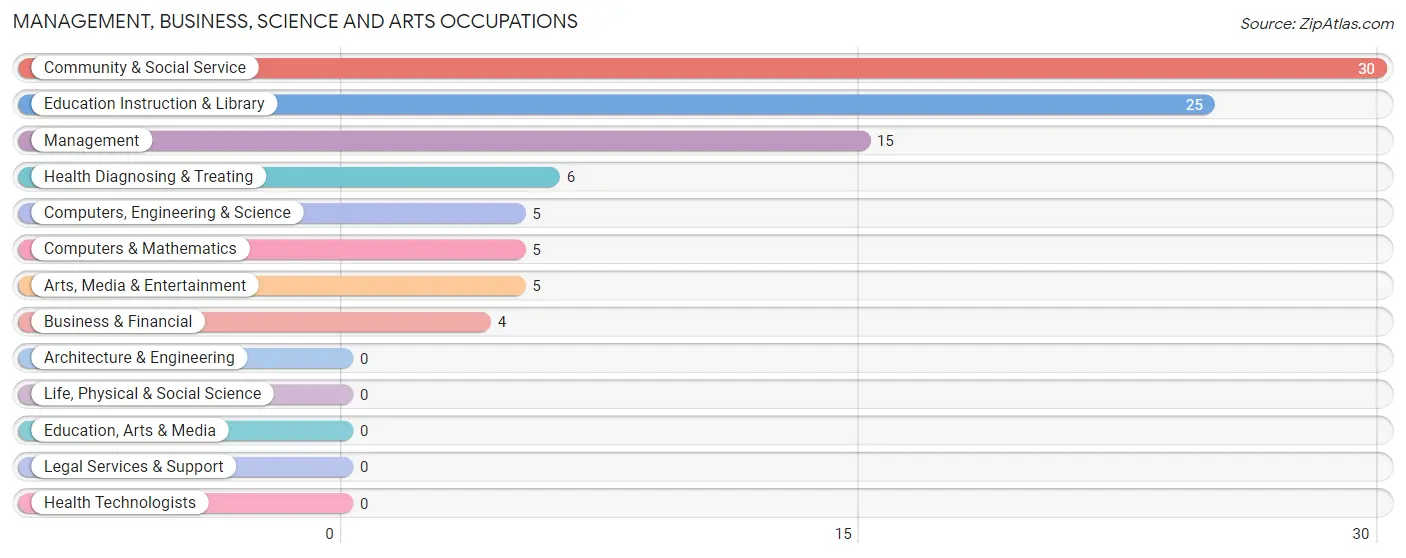
Management, Business, Science and Arts Occupations
The most common Management, Business, Science and Arts occupations in Sunrise Beach are Community & Social Service (30 | 15.1%), Education Instruction & Library (25 | 12.6%), Management (15 | 7.5%), Health Diagnosing & Treating (6 | 3.0%), and Computers, Engineering & Science (5 | 2.5%).
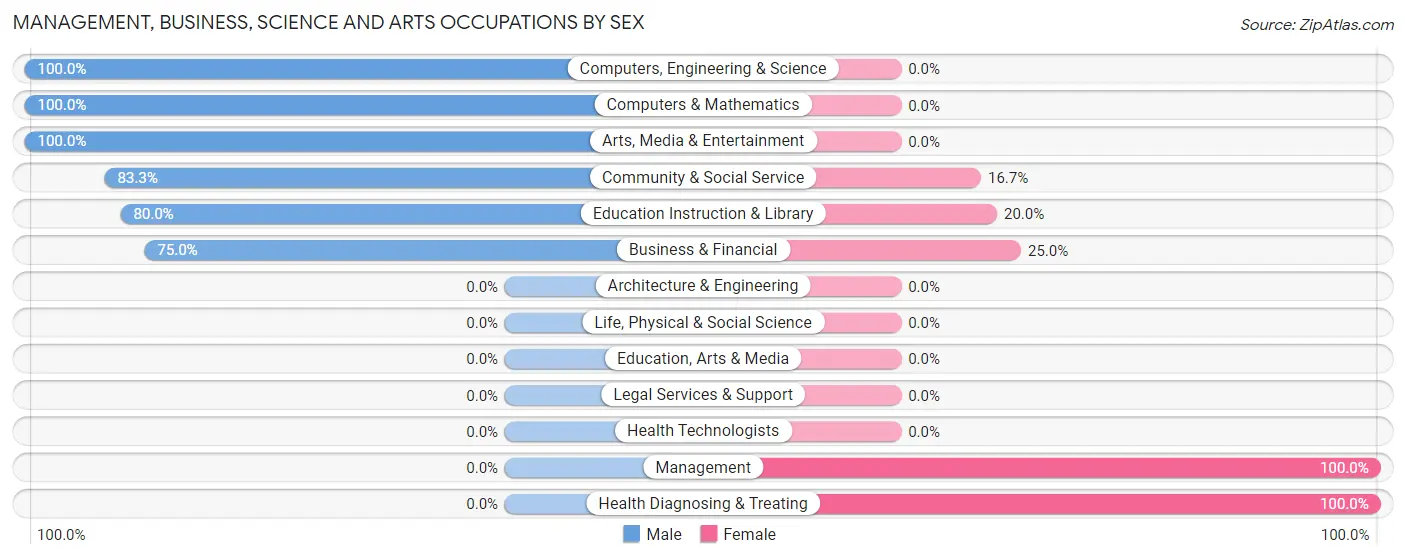
Management, Business, Science and Arts Occupations by Sex
Within the Management, Business, Science and Arts occupations in Sunrise Beach, the most male-oriented occupations are Computers, Engineering & Science (100.0%), Computers & Mathematics (100.0%), and Arts, Media & Entertainment (100.0%), while the most female-oriented occupations are Management (100.0%), Health Diagnosing & Treating (100.0%), and Business & Financial (25.0%).
| Occupation | Male | Female |
| Management | 0 (0.0%) | 15 (100.0%) |
| Business & Financial | 3 (75.0%) | 1 (25.0%) |
| Computers, Engineering & Science | 5 (100.0%) | 0 (0.0%) |
| Computers & Mathematics | 5 (100.0%) | 0 (0.0%) |
| Architecture & Engineering | 0 (0.0%) | 0 (0.0%) |
| Life, Physical & Social Science | 0 (0.0%) | 0 (0.0%) |
| Community & Social Service | 25 (83.3%) | 5 (16.7%) |
| Education, Arts & Media | 0 (0.0%) | 0 (0.0%) |
| Legal Services & Support | 0 (0.0%) | 0 (0.0%) |
| Education Instruction & Library | 20 (80.0%) | 5 (20.0%) |
| Arts, Media & Entertainment | 5 (100.0%) | 0 (0.0%) |
| Health Diagnosing & Treating | 0 (0.0%) | 6 (100.0%) |
| Health Technologists | 0 (0.0%) | 0 (0.0%) |
| Total (Category) | 33 (55.0%) | 27 (45.0%) |
| Total (Overall) | 107 (53.8%) | 92 (46.2%) |
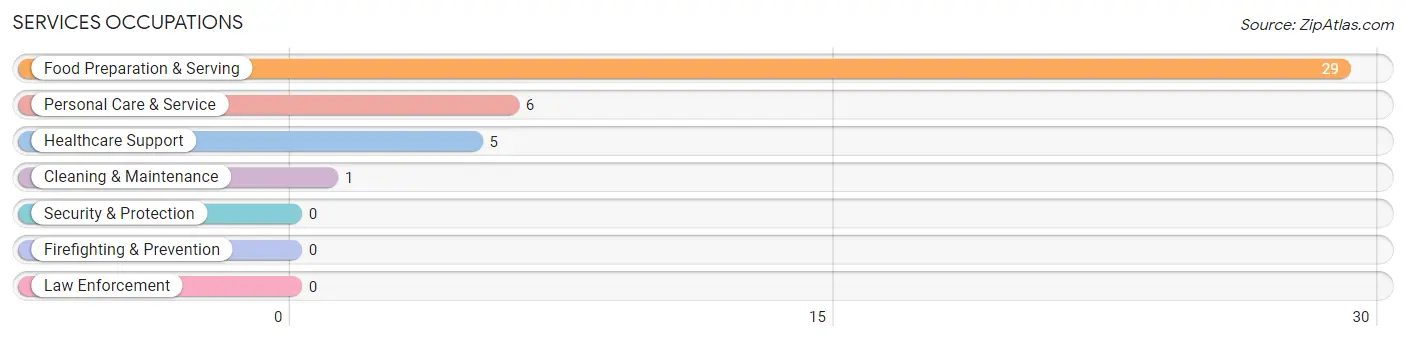
Services Occupations
The most common Services occupations in Sunrise Beach are Food Preparation & Serving (29 | 14.6%), Personal Care & Service (6 | 3.0%), Healthcare Support (5 | 2.5%), and Cleaning & Maintenance (1 | 0.5%).
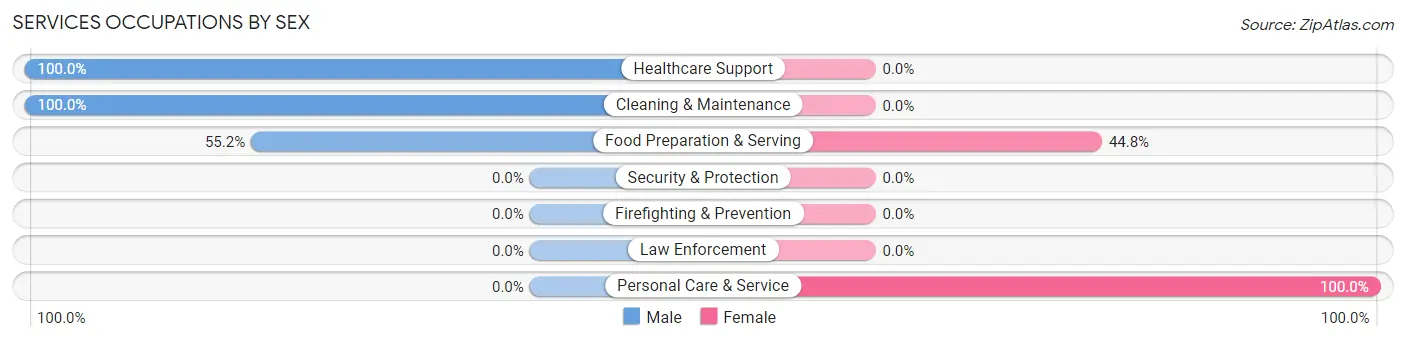
Services Occupations by Sex
Within the Services occupations in Sunrise Beach, the most male-oriented occupations are Healthcare Support (100.0%), Cleaning & Maintenance (100.0%), and Food Preparation & Serving (55.2%), while the most female-oriented occupations are Personal Care & Service (100.0%), and Food Preparation & Serving (44.8%).
| Occupation | Male | Female |
| Healthcare Support | 5 (100.0%) | 0 (0.0%) |
| Security & Protection | 0 (0.0%) | 0 (0.0%) |
| Firefighting & Prevention | 0 (0.0%) | 0 (0.0%) |
| Law Enforcement | 0 (0.0%) | 0 (0.0%) |
| Food Preparation & Serving | 16 (55.2%) | 13 (44.8%) |
| Cleaning & Maintenance | 1 (100.0%) | 0 (0.0%) |
| Personal Care & Service | 0 (0.0%) | 6 (100.0%) |
| Total (Category) | 22 (53.7%) | 19 (46.3%) |
| Total (Overall) | 107 (53.8%) | 92 (46.2%) |
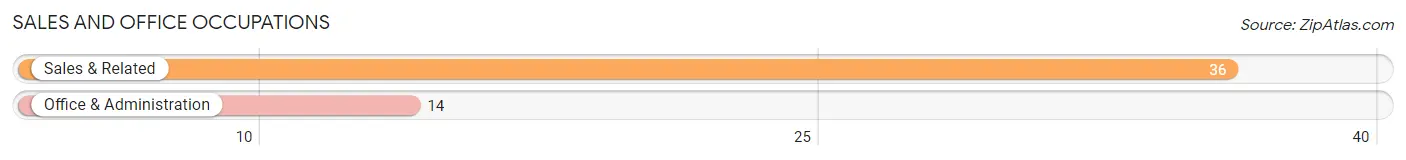
Sales and Office Occupations
The most common Sales and Office occupations in Sunrise Beach are Sales & Related (36 | 18.1%), and Office & Administration (14 | 7.0%).
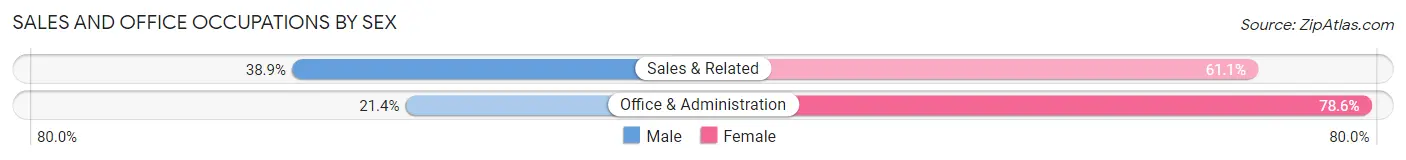
Sales and Office Occupations by Sex
| Occupation | Male | Female |
| Sales & Related | 14 (38.9%) | 22 (61.1%) |
| Office & Administration | 3 (21.4%) | 11 (78.6%) |
| Total (Category) | 17 (34.0%) | 33 (66.0%) |
| Total (Overall) | 107 (53.8%) | 92 (46.2%) |
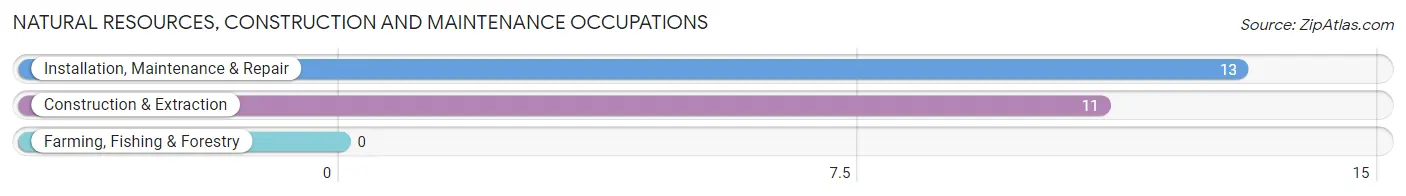
Natural Resources, Construction and Maintenance Occupations
The most common Natural Resources, Construction and Maintenance occupations in Sunrise Beach are Installation, Maintenance & Repair (13 | 6.5%), and Construction & Extraction (11 | 5.5%).
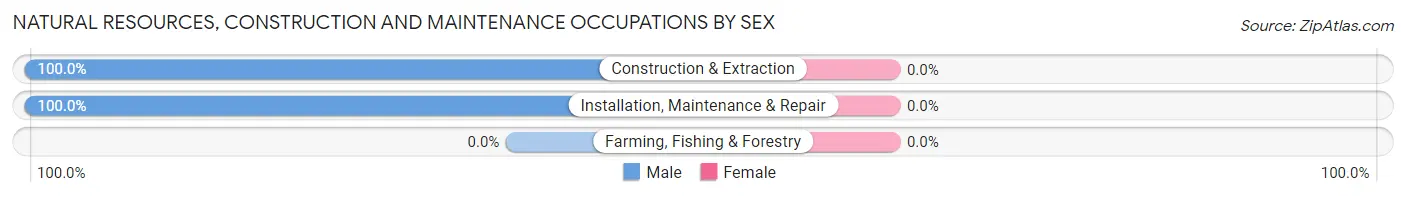
Natural Resources, Construction and Maintenance Occupations by Sex
| Occupation | Male | Female |
| Farming, Fishing & Forestry | 0 (0.0%) | 0 (0.0%) |
| Construction & Extraction | 11 (100.0%) | 0 (0.0%) |
| Installation, Maintenance & Repair | 13 (100.0%) | 0 (0.0%) |
| Total (Category) | 24 (100.0%) | 0 (0.0%) |
| Total (Overall) | 107 (53.8%) | 92 (46.2%) |
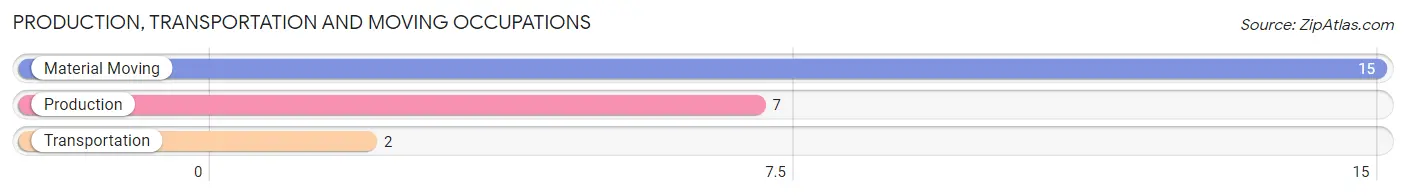
Production, Transportation and Moving Occupations
The most common Production, Transportation and Moving occupations in Sunrise Beach are Material Moving (15 | 7.5%), Production (7 | 3.5%), and Transportation (2 | 1.0%).
Production, Transportation and Moving Occupations by Sex
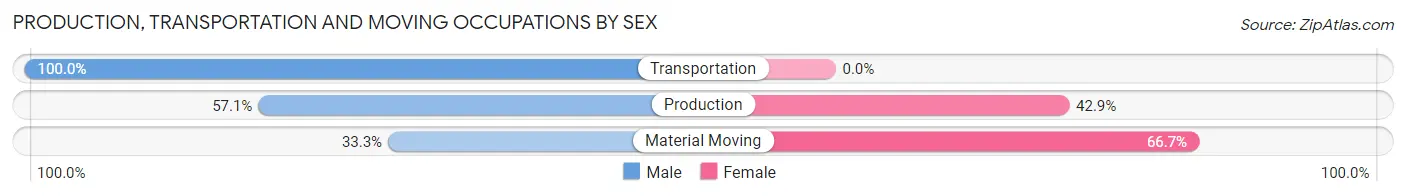
| Occupation | Male | Female |
| Production | 4 (57.1%) | 3 (42.9%) |
| Transportation | 2 (100.0%) | 0 (0.0%) |
| Material Moving | 5 (33.3%) | 10 (66.7%) |
| Total (Category) | 11 (45.8%) | 13 (54.2%) |
| Total (Overall) | 107 (53.8%) | 92 (46.2%) |
Employment Industries by Sex in Sunrise Beach
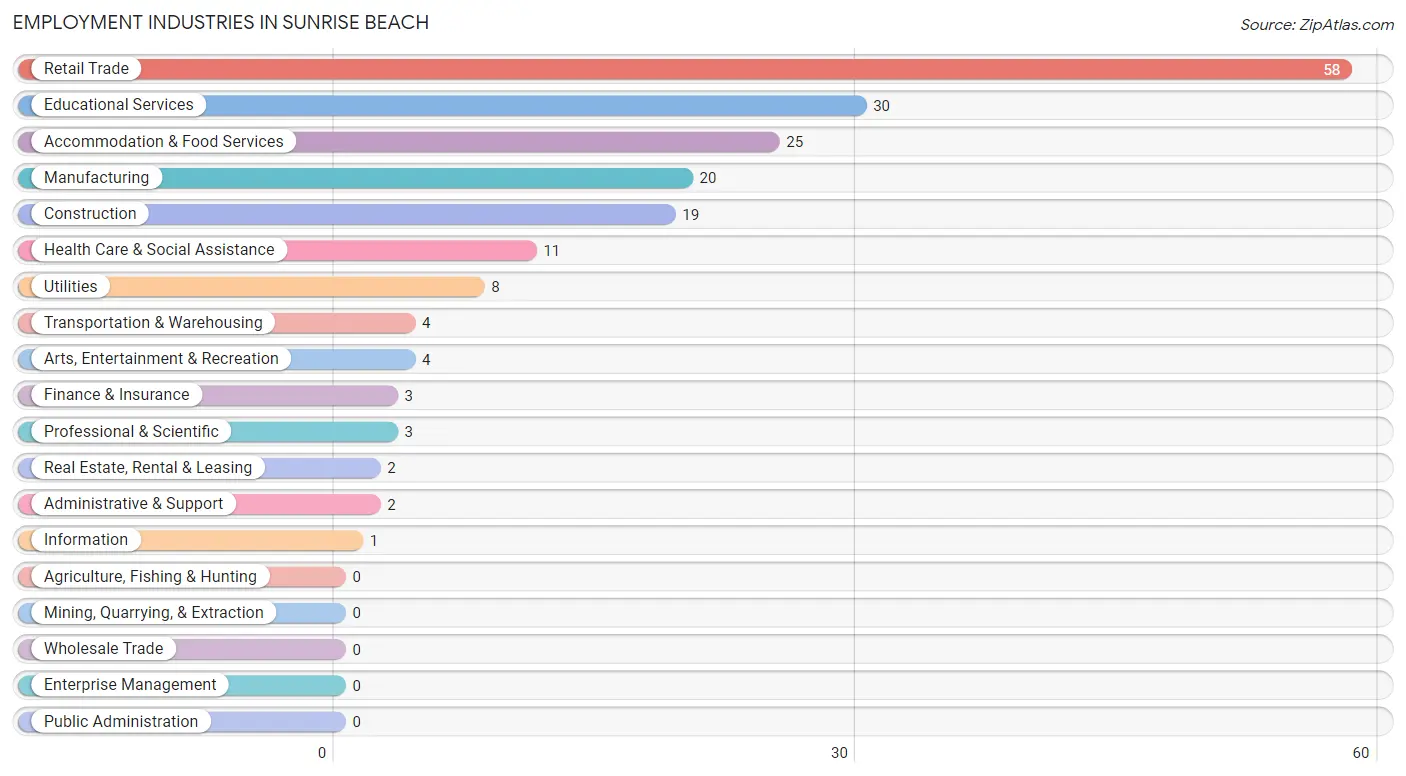
Employment Industries in Sunrise Beach
The major employment industries in Sunrise Beach include Retail Trade (58 | 29.1%), Educational Services (30 | 15.1%), Accommodation & Food Services (25 | 12.6%), Manufacturing (20 | 10.1%), and Construction (19 | 9.6%).
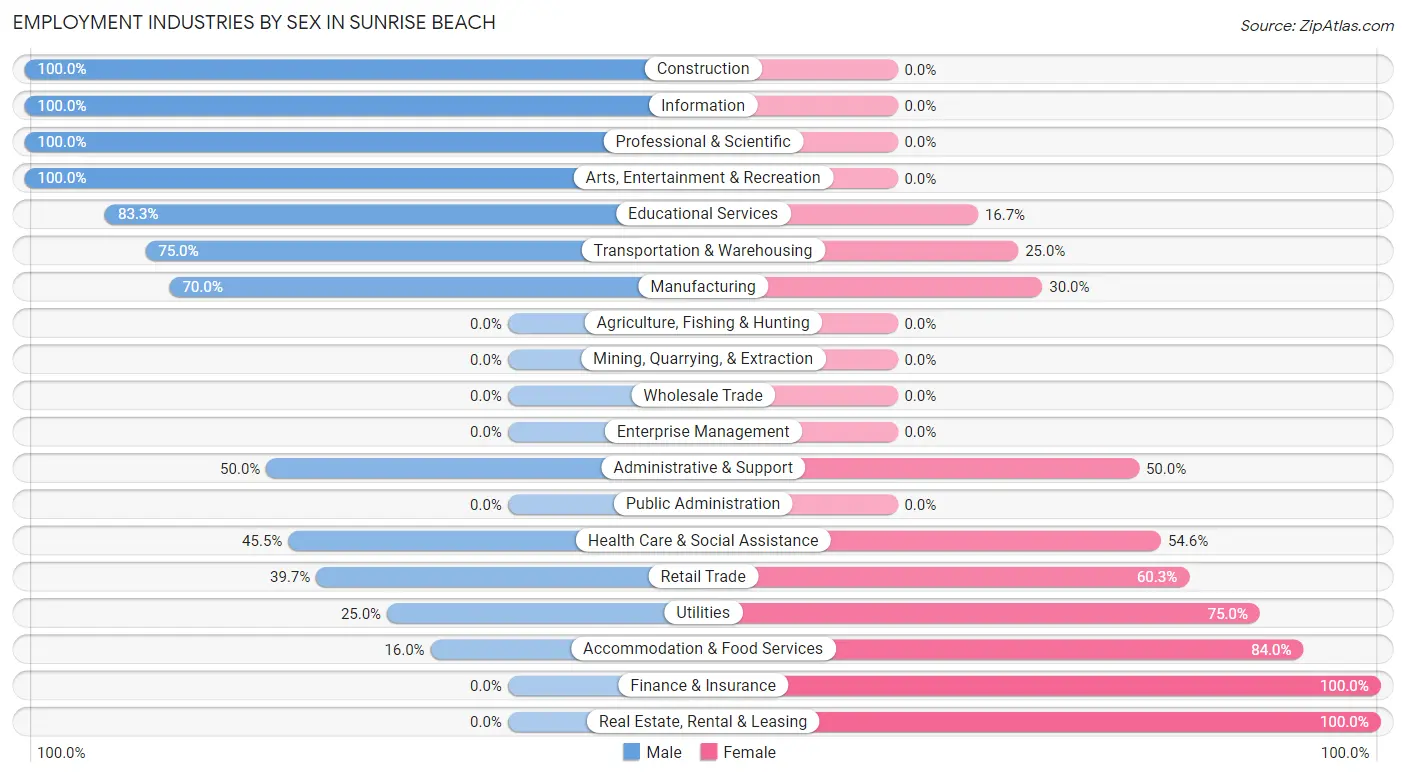
Employment Industries by Sex in Sunrise Beach
The Sunrise Beach industries that see more men than women are Construction (100.0%), Information (100.0%), and Professional & Scientific (100.0%), whereas the industries that tend to have a higher number of women are Finance & Insurance (100.0%), Real Estate, Rental & Leasing (100.0%), and Accommodation & Food Services (84.0%).
| Industry | Male | Female |
| Agriculture, Fishing & Hunting | 0 (0.0%) | 0 (0.0%) |
| Mining, Quarrying, & Extraction | 0 (0.0%) | 0 (0.0%) |
| Construction | 19 (100.0%) | 0 (0.0%) |
| Manufacturing | 14 (70.0%) | 6 (30.0%) |
| Wholesale Trade | 0 (0.0%) | 0 (0.0%) |
| Retail Trade | 23 (39.7%) | 35 (60.3%) |
| Transportation & Warehousing | 3 (75.0%) | 1 (25.0%) |
| Utilities | 2 (25.0%) | 6 (75.0%) |
| Information | 1 (100.0%) | 0 (0.0%) |
| Finance & Insurance | 0 (0.0%) | 3 (100.0%) |
| Real Estate, Rental & Leasing | 0 (0.0%) | 2 (100.0%) |
| Professional & Scientific | 3 (100.0%) | 0 (0.0%) |
| Enterprise Management | 0 (0.0%) | 0 (0.0%) |
| Administrative & Support | 1 (50.0%) | 1 (50.0%) |
| Educational Services | 25 (83.3%) | 5 (16.7%) |
| Health Care & Social Assistance | 5 (45.5%) | 6 (54.5%) |
| Arts, Entertainment & Recreation | 4 (100.0%) | 0 (0.0%) |
| Accommodation & Food Services | 4 (16.0%) | 21 (84.0%) |
| Public Administration | 0 (0.0%) | 0 (0.0%) |
| Total | 107 (53.8%) | 92 (46.2%) |
Education in Sunrise Beach
School Enrollment in Sunrise Beach
The most common levels of schooling among the 76 students in Sunrise Beach are elementary school (26 | 34.2%), middle school (18 | 23.7%), and high school (18 | 23.7%).
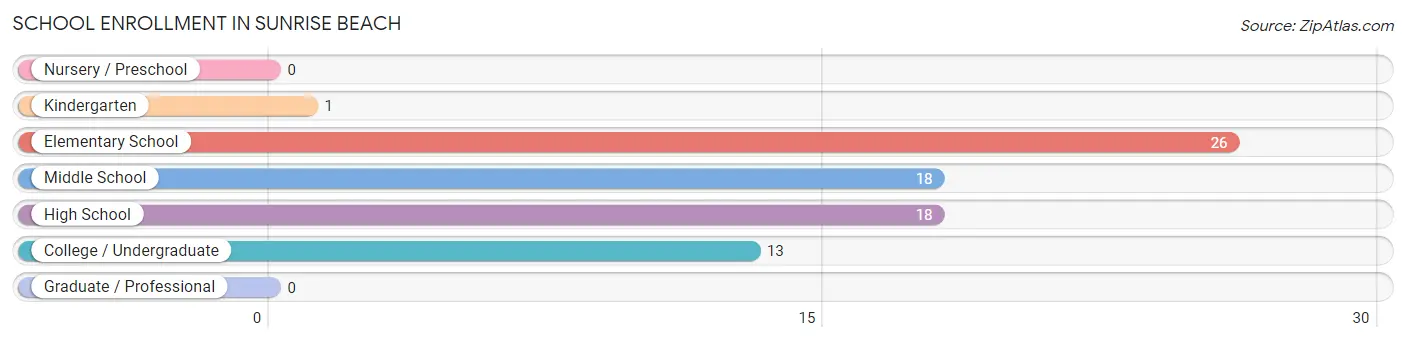
| School Level | # Students | % Students |
| Nursery / Preschool | 0 | 0.0% |
| Kindergarten | 1 | 1.3% |
| Elementary School | 26 | 34.2% |
| Middle School | 18 | 23.7% |
| High School | 18 | 23.7% |
| College / Undergraduate | 13 | 17.1% |
| Graduate / Professional | 0 | 0.0% |
| Total | 76 | 100.0% |
School Enrollment by Age by Funding Source in Sunrise Beach
Out of a total of 76 students who are enrolled in schools in Sunrise Beach, 8 (10.5%) attend a private institution, while the remaining 68 (89.5%) are enrolled in public schools. The age group of 20 to 24 year olds has the highest likelihood of being enrolled in private schools, with 3 (100.0% in the age bracket) enrolled. Conversely, the age group of 15 to 17 year olds has the lowest likelihood of being enrolled in a private school, with 18 (100.0% in the age bracket) attending a public institution.
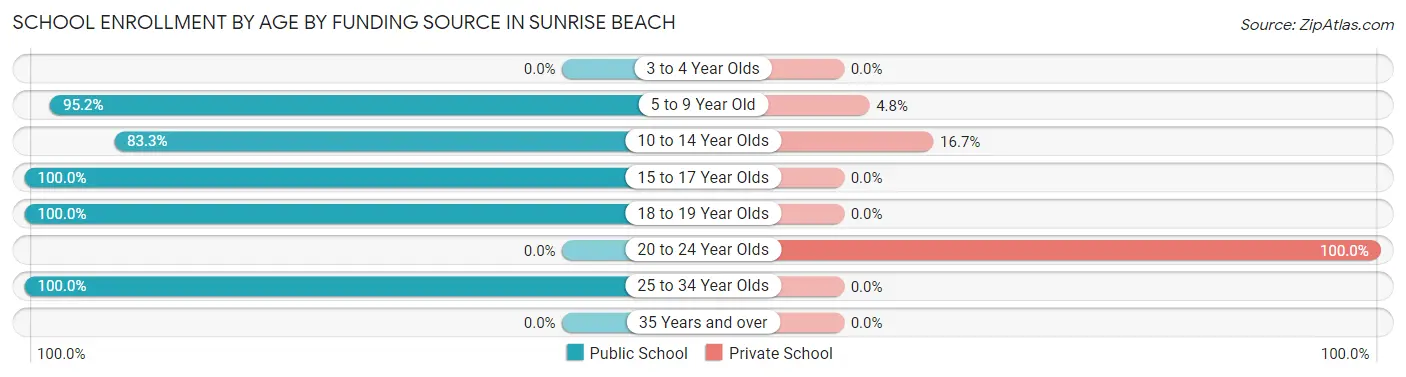
| Age Bracket | Public School | Private School |
| 3 to 4 Year Olds | 0 (0.0%) | 0 (0.0%) |
| 5 to 9 Year Old | 20 (95.2%) | 1 (4.8%) |
| 10 to 14 Year Olds | 20 (83.3%) | 4 (16.7%) |
| 15 to 17 Year Olds | 18 (100.0%) | 0 (0.0%) |
| 18 to 19 Year Olds | 4 (100.0%) | 0 (0.0%) |
| 20 to 24 Year Olds | 0 (0.0%) | 3 (100.0%) |
| 25 to 34 Year Olds | 6 (100.0%) | 0 (0.0%) |
| 35 Years and over | 0 (0.0%) | 0 (0.0%) |
| Total | 68 (89.5%) | 8 (10.5%) |
Educational Attainment by Field of Study in Sunrise Beach
Business (36 | 28.1%), liberal arts & history (31 | 24.2%), education (17 | 13.3%), arts & humanities (15 | 11.7%), and psychology (7 | 5.5%) are the most common fields of study among 128 individuals in Sunrise Beach who have obtained a bachelor's degree or higher.
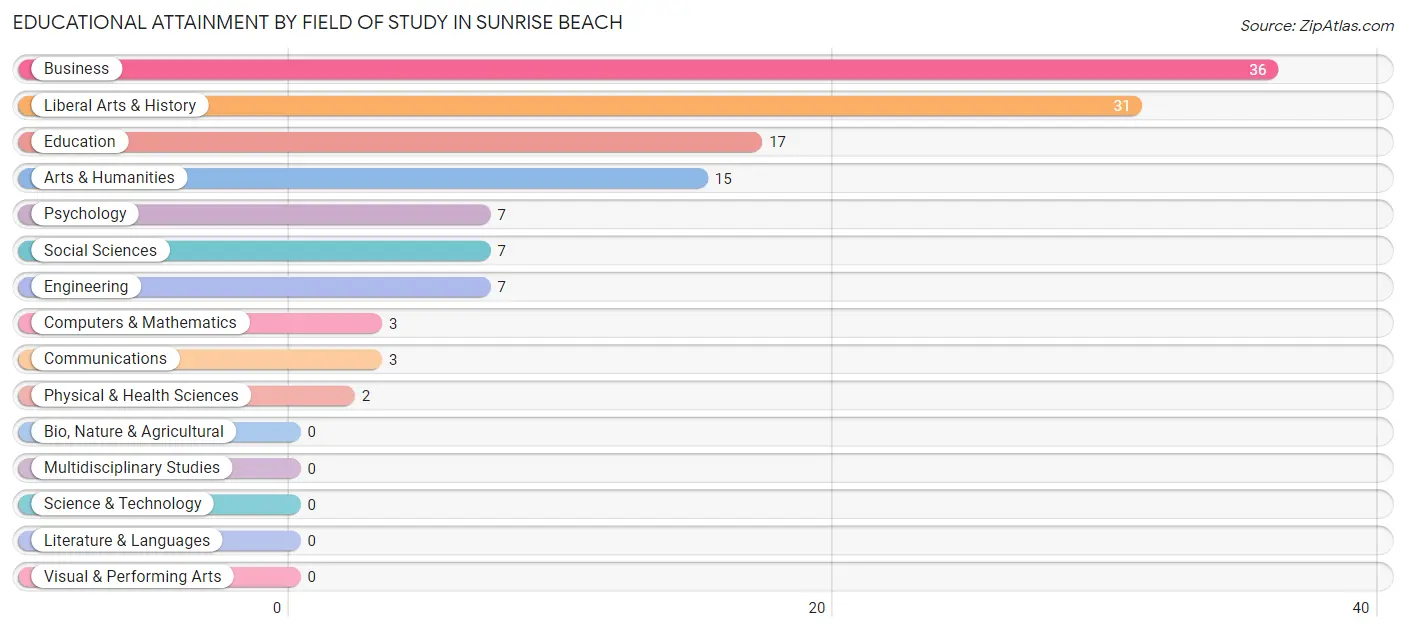
| Field of Study | # Graduates | % Graduates |
| Computers & Mathematics | 3 | 2.3% |
| Bio, Nature & Agricultural | 0 | 0.0% |
| Physical & Health Sciences | 2 | 1.6% |
| Psychology | 7 | 5.5% |
| Social Sciences | 7 | 5.5% |
| Engineering | 7 | 5.5% |
| Multidisciplinary Studies | 0 | 0.0% |
| Science & Technology | 0 | 0.0% |
| Business | 36 | 28.1% |
| Education | 17 | 13.3% |
| Literature & Languages | 0 | 0.0% |
| Liberal Arts & History | 31 | 24.2% |
| Visual & Performing Arts | 0 | 0.0% |
| Communications | 3 | 2.3% |
| Arts & Humanities | 15 | 11.7% |
| Total | 128 | 100.0% |
Transportation & Commute in Sunrise Beach
Vehicle Availability by Sex in Sunrise Beach
The most prevalent vehicle ownership categories in Sunrise Beach are males with 3 vehicles (37, accounting for 35.9%) and females with 3 vehicles (12, making up 42.0%).
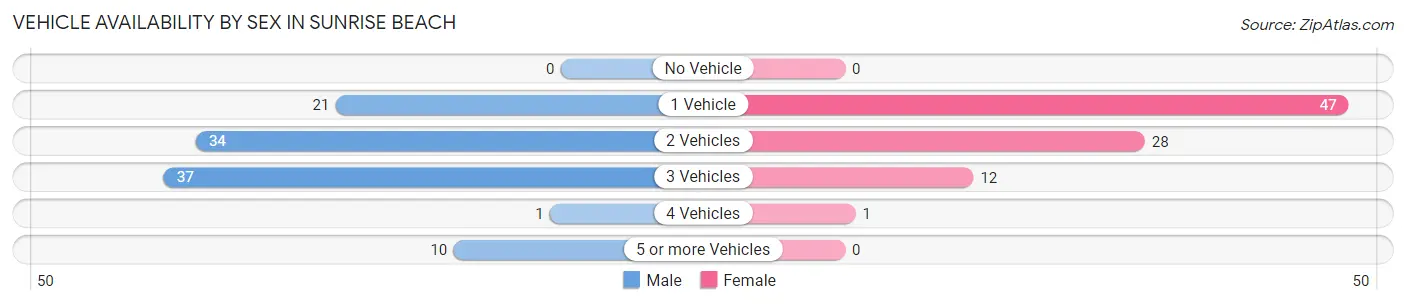
| Vehicles Available | Male | Female |
| No Vehicle | 0 (0.0%) | 0 (0.0%) |
| 1 Vehicle | 21 (20.4%) | 47 (53.4%) |
| 2 Vehicles | 34 (33.0%) | 28 (31.8%) |
| 3 Vehicles | 37 (35.9%) | 12 (13.6%) |
| 4 Vehicles | 1 (1.0%) | 1 (1.1%) |
| 5 or more Vehicles | 10 (9.7%) | 0 (0.0%) |
| Total | 103 (100.0%) | 88 (100.0%) |
Commute Time in Sunrise Beach
The most frequently occuring commute durations in Sunrise Beach are 30 to 34 minutes (47 commuters, 26.1%), 5 to 9 minutes (29 commuters, 16.1%), and less than 5 minutes (28 commuters, 15.6%).
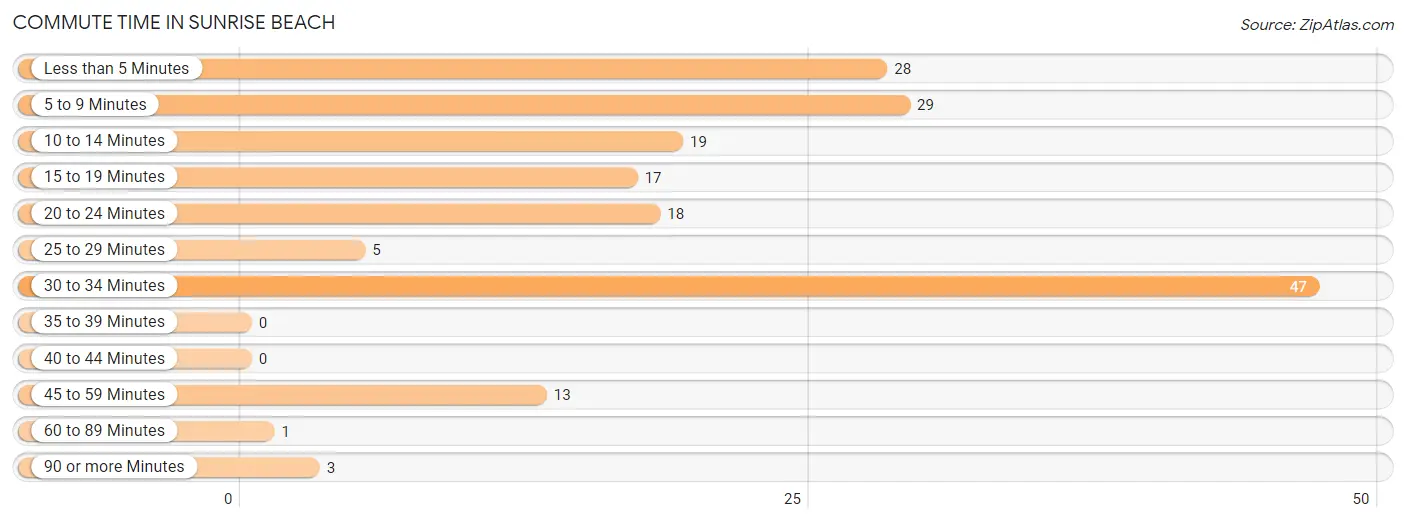
| Commute Time | # Commuters | % Commuters |
| Less than 5 Minutes | 28 | 15.6% |
| 5 to 9 Minutes | 29 | 16.1% |
| 10 to 14 Minutes | 19 | 10.6% |
| 15 to 19 Minutes | 17 | 9.4% |
| 20 to 24 Minutes | 18 | 10.0% |
| 25 to 29 Minutes | 5 | 2.8% |
| 30 to 34 Minutes | 47 | 26.1% |
| 35 to 39 Minutes | 0 | 0.0% |
| 40 to 44 Minutes | 0 | 0.0% |
| 45 to 59 Minutes | 13 | 7.2% |
| 60 to 89 Minutes | 1 | 0.6% |
| 90 or more Minutes | 3 | 1.7% |
Commute Time by Sex in Sunrise Beach
The most common commute times in Sunrise Beach are less than 5 minutes (23 commuters, 23.5%) for males and 30 to 34 minutes (33 commuters, 40.2%) for females.
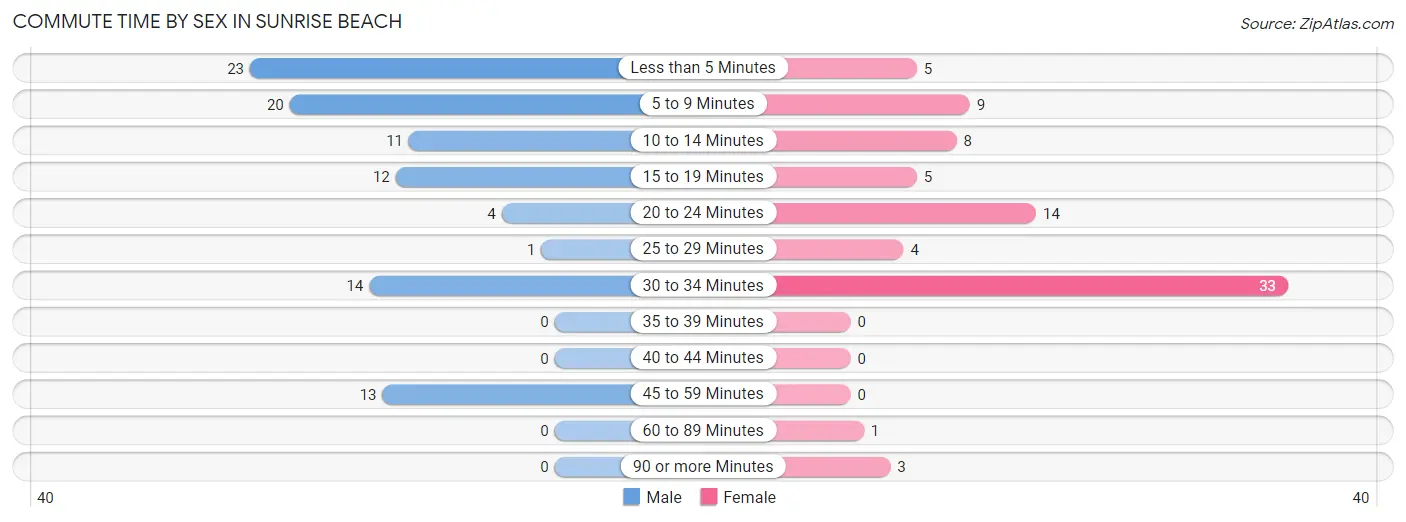
| Commute Time | Male | Female |
| Less than 5 Minutes | 23 (23.5%) | 5 (6.1%) |
| 5 to 9 Minutes | 20 (20.4%) | 9 (11.0%) |
| 10 to 14 Minutes | 11 (11.2%) | 8 (9.8%) |
| 15 to 19 Minutes | 12 (12.2%) | 5 (6.1%) |
| 20 to 24 Minutes | 4 (4.1%) | 14 (17.1%) |
| 25 to 29 Minutes | 1 (1.0%) | 4 (4.9%) |
| 30 to 34 Minutes | 14 (14.3%) | 33 (40.2%) |
| 35 to 39 Minutes | 0 (0.0%) | 0 (0.0%) |
| 40 to 44 Minutes | 0 (0.0%) | 0 (0.0%) |
| 45 to 59 Minutes | 13 (13.3%) | 0 (0.0%) |
| 60 to 89 Minutes | 0 (0.0%) | 1 (1.2%) |
| 90 or more Minutes | 0 (0.0%) | 3 (3.7%) |
Time of Departure to Work by Sex in Sunrise Beach
The most frequent times of departure to work in Sunrise Beach are 7:00 AM to 7:29 AM (19, 19.4%) for males and 7:30 AM to 7:59 AM (35, 42.7%) for females.
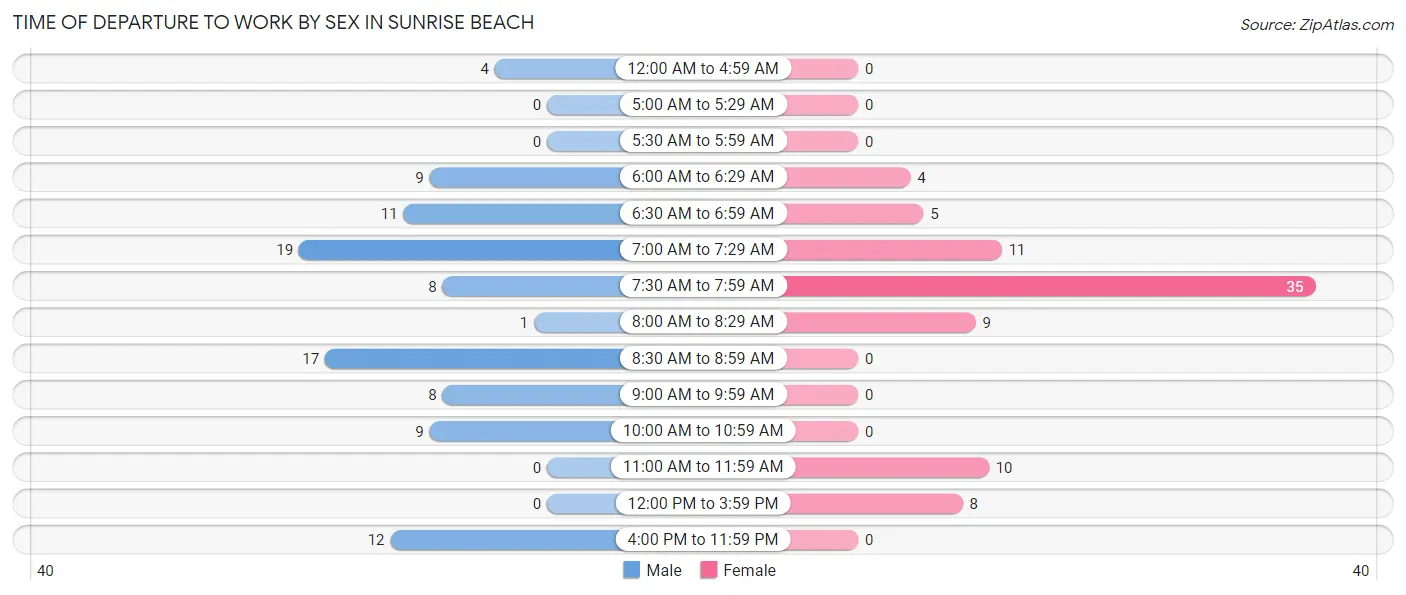
| Time of Departure | Male | Female |
| 12:00 AM to 4:59 AM | 4 (4.1%) | 0 (0.0%) |
| 5:00 AM to 5:29 AM | 0 (0.0%) | 0 (0.0%) |
| 5:30 AM to 5:59 AM | 0 (0.0%) | 0 (0.0%) |
| 6:00 AM to 6:29 AM | 9 (9.2%) | 4 (4.9%) |
| 6:30 AM to 6:59 AM | 11 (11.2%) | 5 (6.1%) |
| 7:00 AM to 7:29 AM | 19 (19.4%) | 11 (13.4%) |
| 7:30 AM to 7:59 AM | 8 (8.2%) | 35 (42.7%) |
| 8:00 AM to 8:29 AM | 1 (1.0%) | 9 (11.0%) |
| 8:30 AM to 8:59 AM | 17 (17.3%) | 0 (0.0%) |
| 9:00 AM to 9:59 AM | 8 (8.2%) | 0 (0.0%) |
| 10:00 AM to 10:59 AM | 9 (9.2%) | 0 (0.0%) |
| 11:00 AM to 11:59 AM | 0 (0.0%) | 10 (12.2%) |
| 12:00 PM to 3:59 PM | 0 (0.0%) | 8 (9.8%) |
| 4:00 PM to 11:59 PM | 12 (12.2%) | 0 (0.0%) |
| Total | 98 (100.0%) | 82 (100.0%) |
Housing Occupancy in Sunrise Beach
Occupancy by Ownership in Sunrise Beach
Of the total 174 dwellings in Sunrise Beach, owner-occupied units account for 130 (74.7%), while renter-occupied units make up 44 (25.3%).
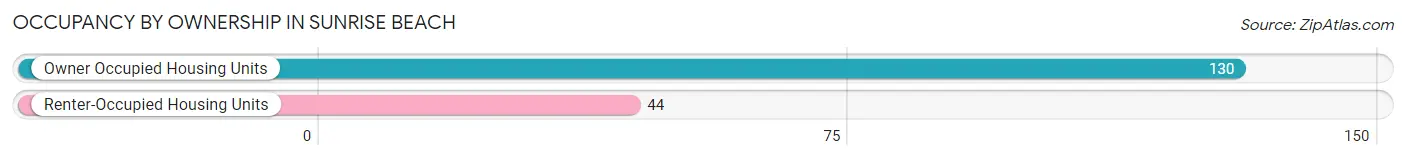
| Occupancy | # Housing Units | % Housing Units |
| Owner Occupied Housing Units | 130 | 74.7% |
| Renter-Occupied Housing Units | 44 | 25.3% |
| Total Occupied Housing Units | 174 | 100.0% |
Occupancy by Household Size in Sunrise Beach
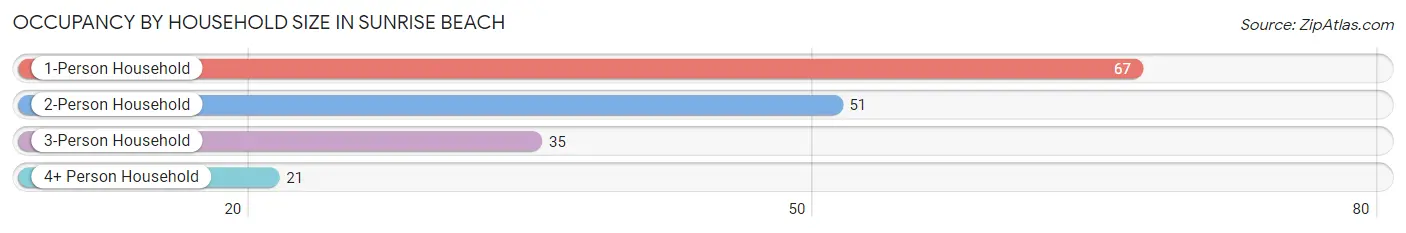
| Household Size | # Housing Units | % Housing Units |
| 1-Person Household | 67 | 38.5% |
| 2-Person Household | 51 | 29.3% |
| 3-Person Household | 35 | 20.1% |
| 4+ Person Household | 21 | 12.1% |
| Total Housing Units | 174 | 100.0% |
Occupancy by Ownership by Household Size in Sunrise Beach
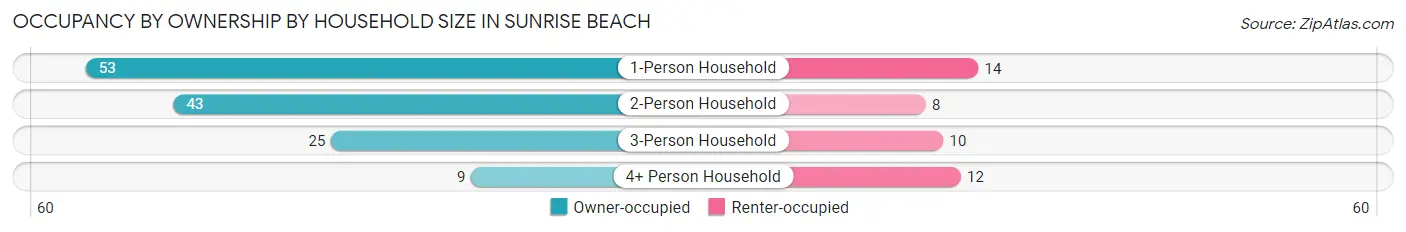
| Household Size | Owner-occupied | Renter-occupied |
| 1-Person Household | 53 (79.1%) | 14 (20.9%) |
| 2-Person Household | 43 (84.3%) | 8 (15.7%) |
| 3-Person Household | 25 (71.4%) | 10 (28.6%) |
| 4+ Person Household | 9 (42.9%) | 12 (57.1%) |
| Total Housing Units | 130 (74.7%) | 44 (25.3%) |
Occupancy by Educational Attainment in Sunrise Beach
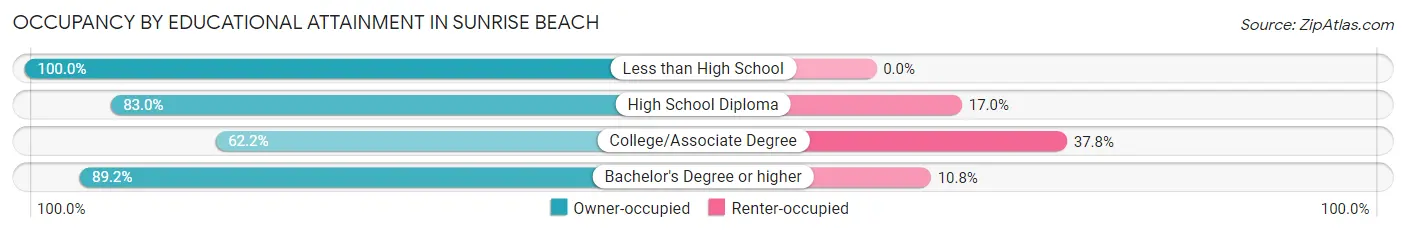
| Household Size | Owner-occupied | Renter-occupied |
| Less than High School | 2 (100.0%) | 0 (0.0%) |
| High School Diploma | 44 (83.0%) | 9 (17.0%) |
| College/Associate Degree | 51 (62.2%) | 31 (37.8%) |
| Bachelor's Degree or higher | 33 (89.2%) | 4 (10.8%) |
Occupancy by Age of Householder in Sunrise Beach
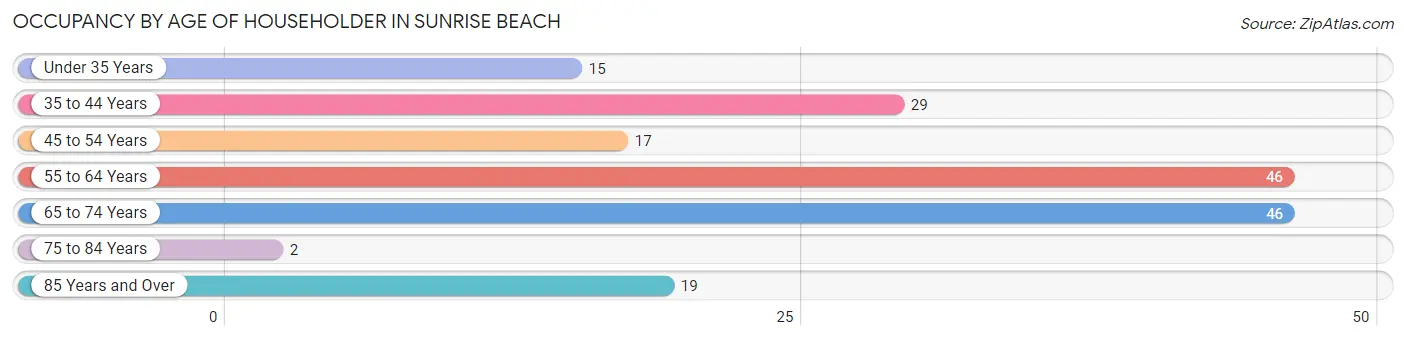
| Age Bracket | # Households | % Households |
| Under 35 Years | 15 | 8.6% |
| 35 to 44 Years | 29 | 16.7% |
| 45 to 54 Years | 17 | 9.8% |
| 55 to 64 Years | 46 | 26.4% |
| 65 to 74 Years | 46 | 26.4% |
| 75 to 84 Years | 2 | 1.1% |
| 85 Years and Over | 19 | 10.9% |
| Total | 174 | 100.0% |
Housing Finances in Sunrise Beach
Median Income by Occupancy in Sunrise Beach
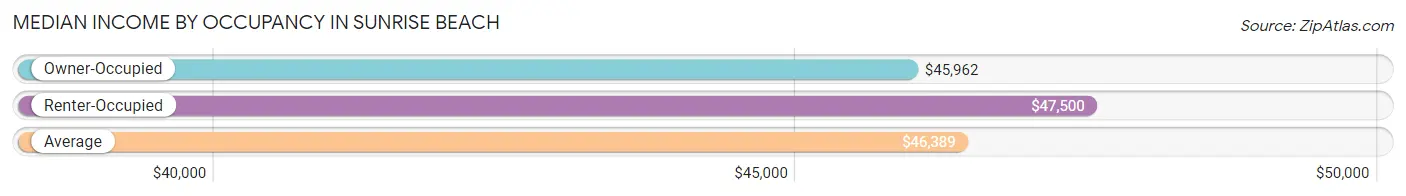
| Occupancy Type | # Households | Median Income |
| Owner-Occupied | 130 (74.7%) | $45,962 |
| Renter-Occupied | 44 (25.3%) | $47,500 |
| Average | 174 (100.0%) | $46,389 |
Occupancy by Householder Income Bracket in Sunrise Beach
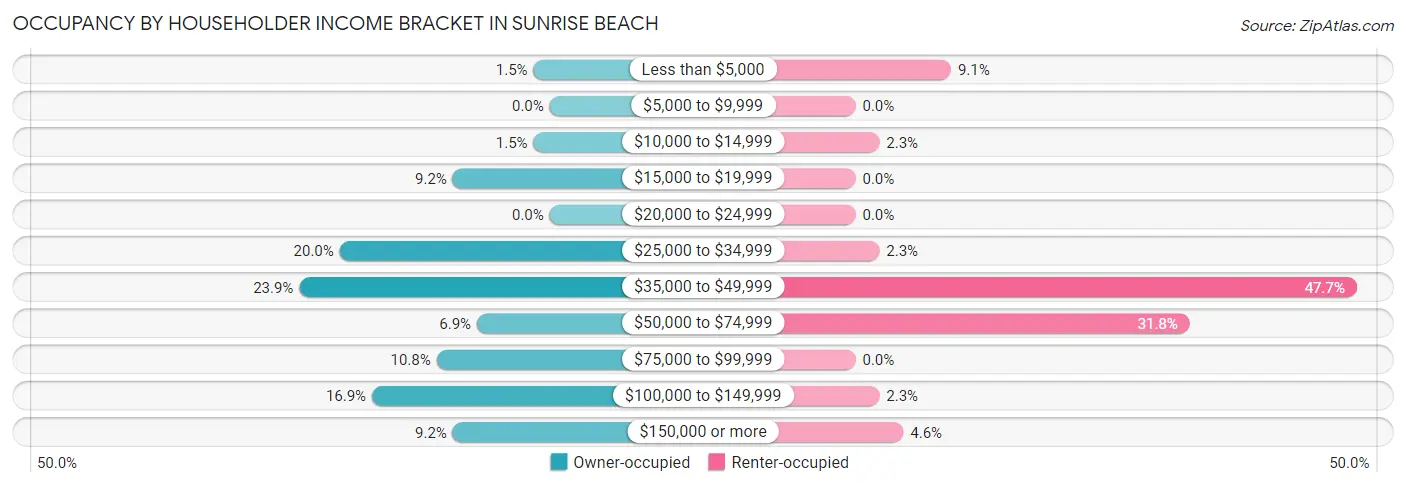
| Income Bracket | Owner-occupied | Renter-occupied |
| Less than $5,000 | 2 (1.5%) | 4 (9.1%) |
| $5,000 to $9,999 | 0 (0.0%) | 0 (0.0%) |
| $10,000 to $14,999 | 2 (1.5%) | 1 (2.3%) |
| $15,000 to $19,999 | 12 (9.2%) | 0 (0.0%) |
| $20,000 to $24,999 | 0 (0.0%) | 0 (0.0%) |
| $25,000 to $34,999 | 26 (20.0%) | 1 (2.3%) |
| $35,000 to $49,999 | 31 (23.8%) | 21 (47.7%) |
| $50,000 to $74,999 | 9 (6.9%) | 14 (31.8%) |
| $75,000 to $99,999 | 14 (10.8%) | 0 (0.0%) |
| $100,000 to $149,999 | 22 (16.9%) | 1 (2.3%) |
| $150,000 or more | 12 (9.2%) | 2 (4.5%) |
| Total | 130 (100.0%) | 44 (100.0%) |
Monthly Housing Cost Tiers in Sunrise Beach
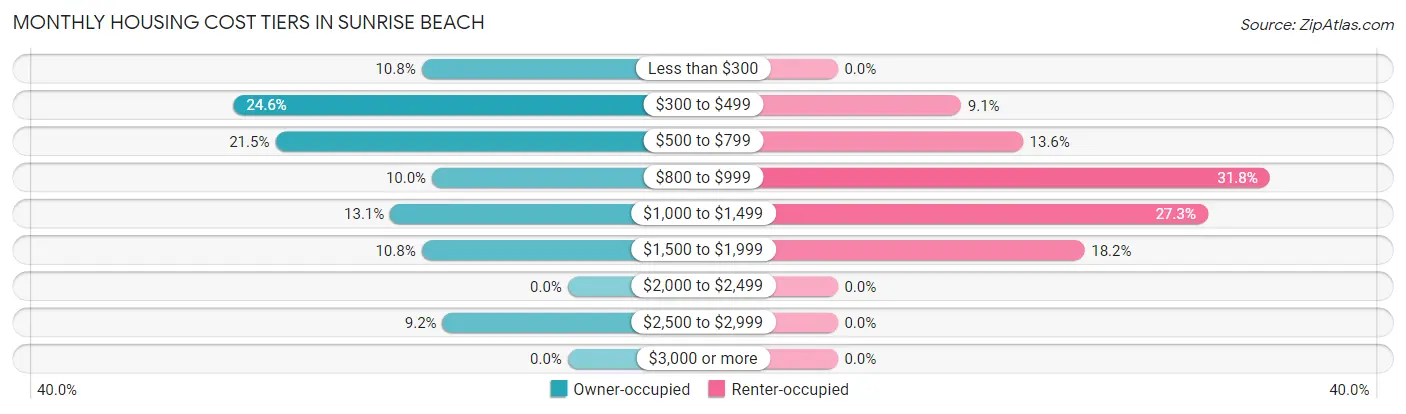
| Monthly Cost | Owner-occupied | Renter-occupied |
| Less than $300 | 14 (10.8%) | 0 (0.0%) |
| $300 to $499 | 32 (24.6%) | 4 (9.1%) |
| $500 to $799 | 28 (21.5%) | 6 (13.6%) |
| $800 to $999 | 13 (10.0%) | 14 (31.8%) |
| $1,000 to $1,499 | 17 (13.1%) | 12 (27.3%) |
| $1,500 to $1,999 | 14 (10.8%) | 8 (18.2%) |
| $2,000 to $2,499 | 0 (0.0%) | 0 (0.0%) |
| $2,500 to $2,999 | 12 (9.2%) | 0 (0.0%) |
| $3,000 or more | 0 (0.0%) | 0 (0.0%) |
| Total | 130 (100.0%) | 44 (100.0%) |
Physical Housing Characteristics in Sunrise Beach
Housing Structures in Sunrise Beach
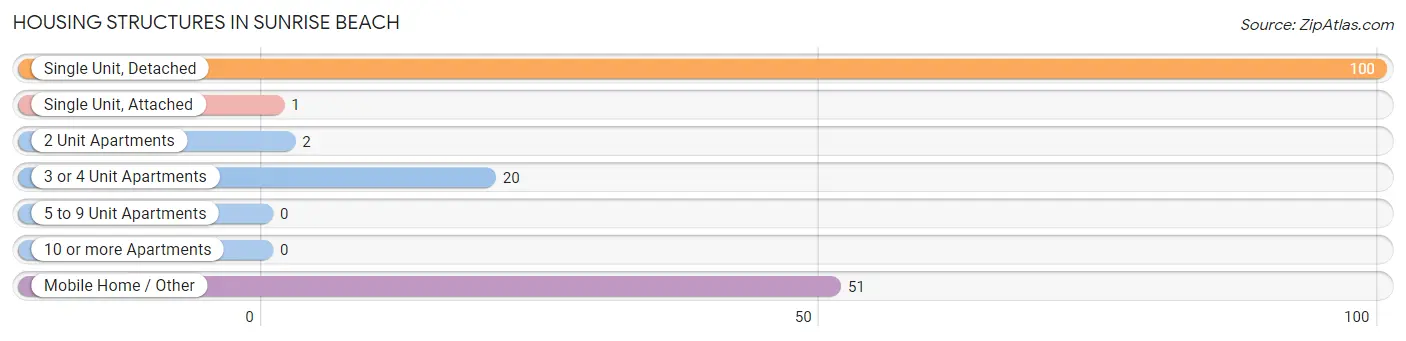
| Structure Type | # Housing Units | % Housing Units |
| Single Unit, Detached | 100 | 57.5% |
| Single Unit, Attached | 1 | 0.6% |
| 2 Unit Apartments | 2 | 1.1% |
| 3 or 4 Unit Apartments | 20 | 11.5% |
| 5 to 9 Unit Apartments | 0 | 0.0% |
| 10 or more Apartments | 0 | 0.0% |
| Mobile Home / Other | 51 | 29.3% |
| Total | 174 | 100.0% |
Housing Structures by Occupancy in Sunrise Beach
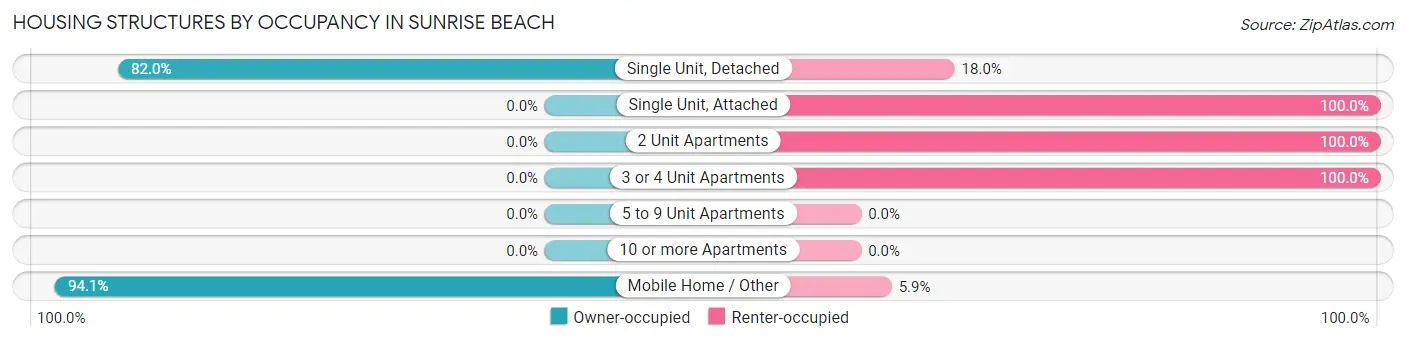
| Structure Type | Owner-occupied | Renter-occupied |
| Single Unit, Detached | 82 (82.0%) | 18 (18.0%) |
| Single Unit, Attached | 0 (0.0%) | 1 (100.0%) |
| 2 Unit Apartments | 0 (0.0%) | 2 (100.0%) |
| 3 or 4 Unit Apartments | 0 (0.0%) | 20 (100.0%) |
| 5 to 9 Unit Apartments | 0 (0.0%) | 0 (0.0%) |
| 10 or more Apartments | 0 (0.0%) | 0 (0.0%) |
| Mobile Home / Other | 48 (94.1%) | 3 (5.9%) |
| Total | 130 (74.7%) | 44 (25.3%) |
Housing Structures by Number of Rooms in Sunrise Beach
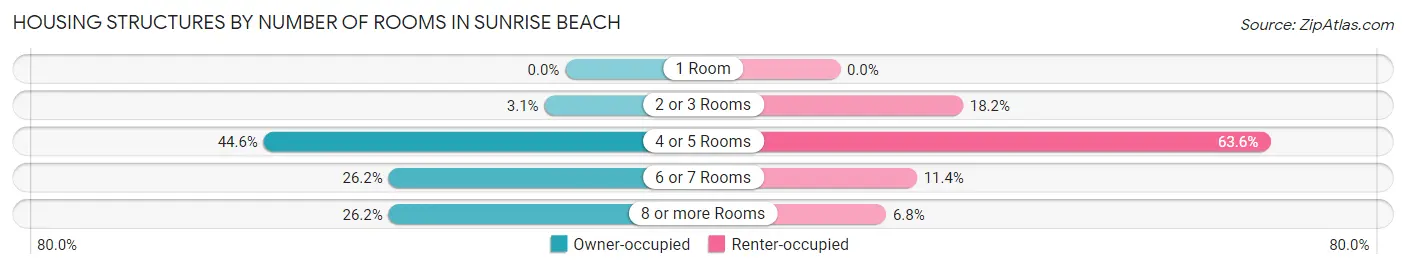
| Number of Rooms | Owner-occupied | Renter-occupied |
| 1 Room | 0 (0.0%) | 0 (0.0%) |
| 2 or 3 Rooms | 4 (3.1%) | 8 (18.2%) |
| 4 or 5 Rooms | 58 (44.6%) | 28 (63.6%) |
| 6 or 7 Rooms | 34 (26.2%) | 5 (11.4%) |
| 8 or more Rooms | 34 (26.2%) | 3 (6.8%) |
| Total | 130 (100.0%) | 44 (100.0%) |
Housing Structure by Heating Type in Sunrise Beach
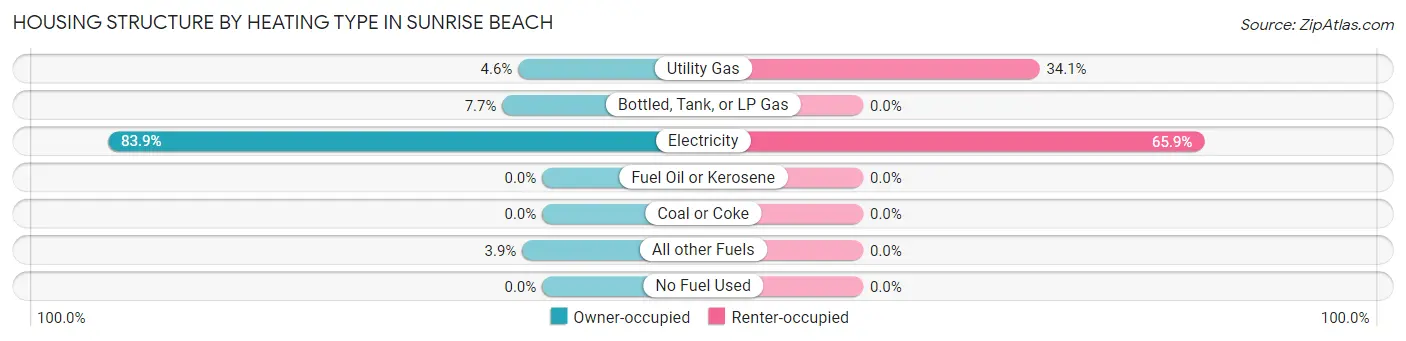
| Heating Type | Owner-occupied | Renter-occupied |
| Utility Gas | 6 (4.6%) | 15 (34.1%) |
| Bottled, Tank, or LP Gas | 10 (7.7%) | 0 (0.0%) |
| Electricity | 109 (83.9%) | 29 (65.9%) |
| Fuel Oil or Kerosene | 0 (0.0%) | 0 (0.0%) |
| Coal or Coke | 0 (0.0%) | 0 (0.0%) |
| All other Fuels | 5 (3.8%) | 0 (0.0%) |
| No Fuel Used | 0 (0.0%) | 0 (0.0%) |
| Total | 130 (100.0%) | 44 (100.0%) |
Household Vehicle Usage in Sunrise Beach
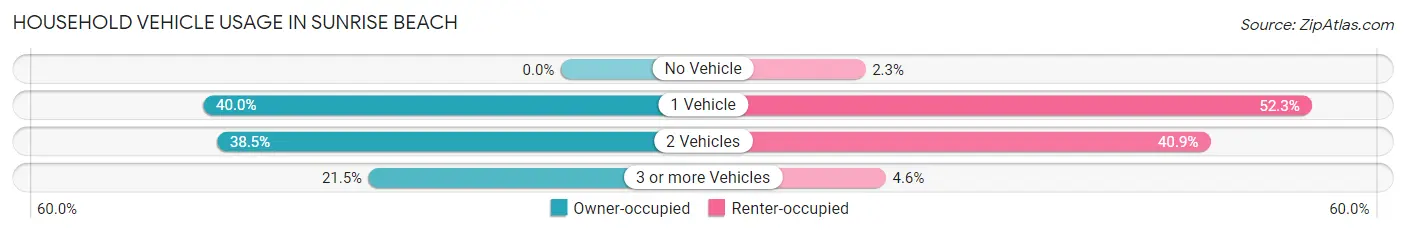
| Vehicles per Household | Owner-occupied | Renter-occupied |
| No Vehicle | 0 (0.0%) | 1 (2.3%) |
| 1 Vehicle | 52 (40.0%) | 23 (52.3%) |
| 2 Vehicles | 50 (38.5%) | 18 (40.9%) |
| 3 or more Vehicles | 28 (21.5%) | 2 (4.5%) |
| Total | 130 (100.0%) | 44 (100.0%) |
Real Estate & Mortgages in Sunrise Beach
Real Estate and Mortgage Overview in Sunrise Beach
| Characteristic | Without Mortgage | With Mortgage |
| Housing Units | 67 | 63 |
| Median Property Value | - | - |
| Median Household Income | $39,375 | $7 |
| Monthly Housing Costs | $440 | $0 |
| Real Estate Taxes | $408 | $4 |
Property Value by Mortgage Status in Sunrise Beach
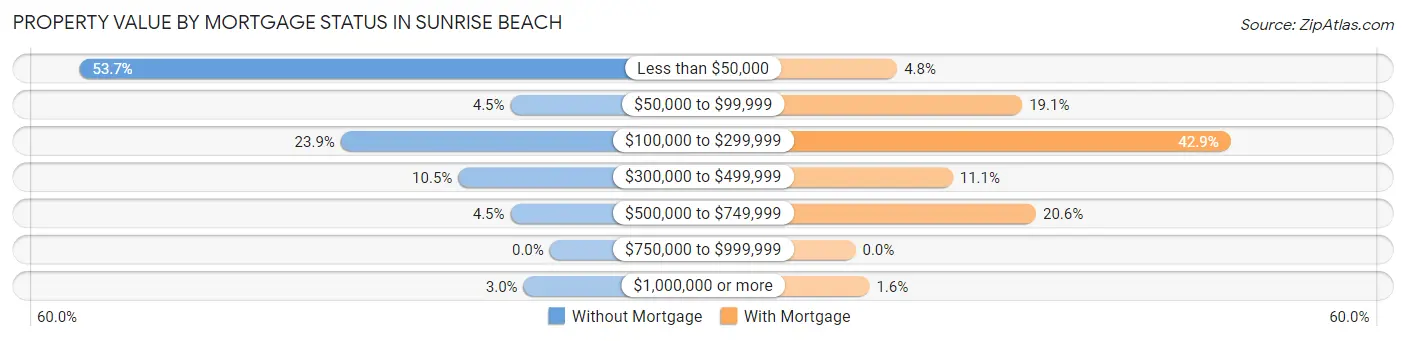
| Property Value | Without Mortgage | With Mortgage |
| Less than $50,000 | 36 (53.7%) | 3 (4.8%) |
| $50,000 to $99,999 | 3 (4.5%) | 12 (19.1%) |
| $100,000 to $299,999 | 16 (23.9%) | 27 (42.9%) |
| $300,000 to $499,999 | 7 (10.4%) | 7 (11.1%) |
| $500,000 to $749,999 | 3 (4.5%) | 13 (20.6%) |
| $750,000 to $999,999 | 0 (0.0%) | 0 (0.0%) |
| $1,000,000 or more | 2 (3.0%) | 1 (1.6%) |
| Total | 67 (100.0%) | 63 (100.0%) |
Household Income by Mortgage Status in Sunrise Beach
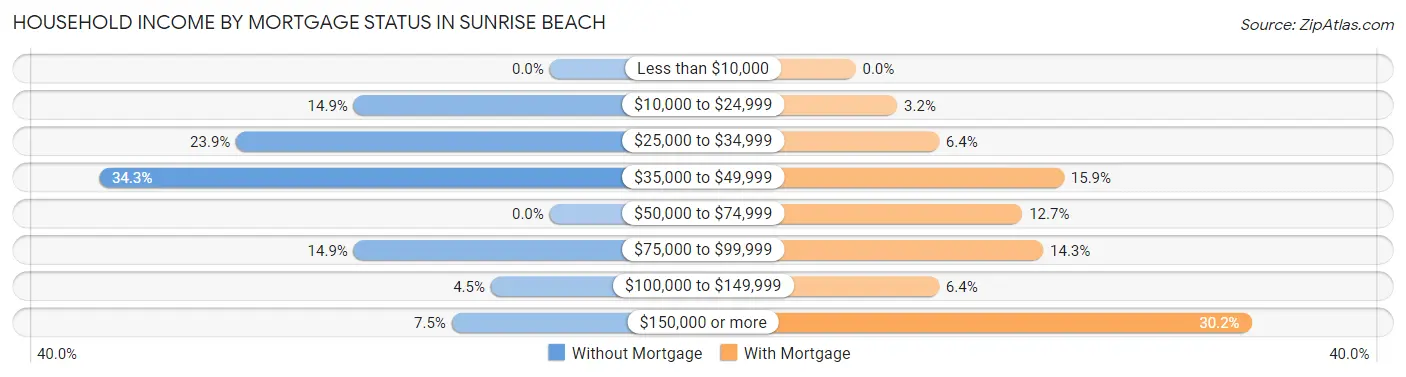
| Household Income | Without Mortgage | With Mortgage |
| Less than $10,000 | 0 (0.0%) | 0 (0.0%) |
| $10,000 to $24,999 | 10 (14.9%) | 2 (3.2%) |
| $25,000 to $34,999 | 16 (23.9%) | 4 (6.4%) |
| $35,000 to $49,999 | 23 (34.3%) | 10 (15.9%) |
| $50,000 to $74,999 | 0 (0.0%) | 8 (12.7%) |
| $75,000 to $99,999 | 10 (14.9%) | 9 (14.3%) |
| $100,000 to $149,999 | 3 (4.5%) | 4 (6.4%) |
| $150,000 or more | 5 (7.5%) | 19 (30.2%) |
| Total | 67 (100.0%) | 63 (100.0%) |
Property Value to Household Income Ratio in Sunrise Beach
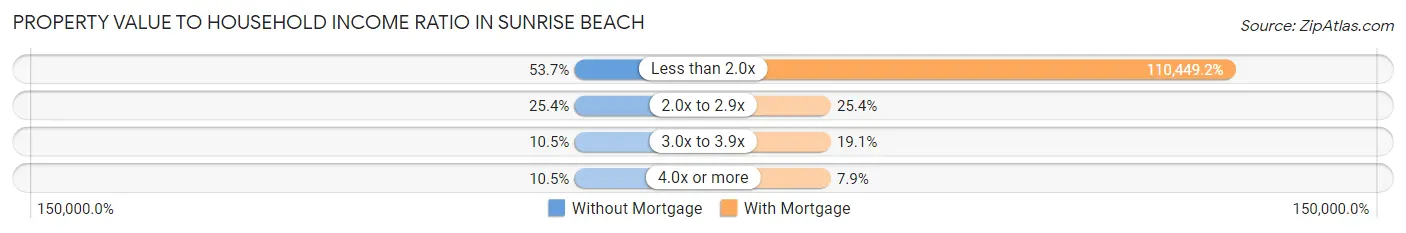
| Value-to-Income Ratio | Without Mortgage | With Mortgage |
| Less than 2.0x | 36 (53.7%) | 69,583 (110,449.2%) |
| 2.0x to 2.9x | 17 (25.4%) | 16 (25.4%) |
| 3.0x to 3.9x | 7 (10.4%) | 12 (19.1%) |
| 4.0x or more | 7 (10.4%) | 5 (7.9%) |
| Total | 67 (100.0%) | 63 (100.0%) |
Real Estate Taxes by Mortgage Status in Sunrise Beach
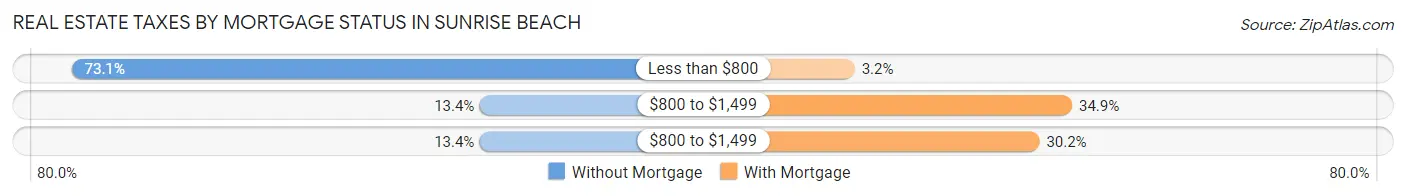
| Property Taxes | Without Mortgage | With Mortgage |
| Less than $800 | 49 (73.1%) | 2 (3.2%) |
| $800 to $1,499 | 9 (13.4%) | 22 (34.9%) |
| $800 to $1,499 | 9 (13.4%) | 19 (30.2%) |
| Total | 67 (100.0%) | 63 (100.0%) |
Health & Disability in Sunrise Beach
Health Insurance Coverage by Age in Sunrise Beach
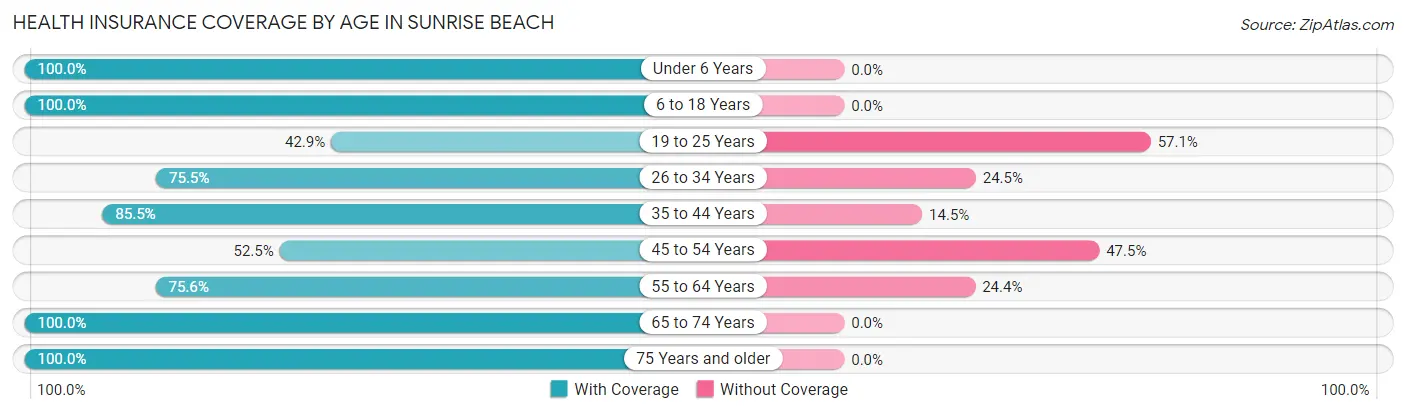
| Age Bracket | With Coverage | Without Coverage |
| Under 6 Years | 22 (100.0%) | 0 (0.0%) |
| 6 to 18 Years | 67 (100.0%) | 0 (0.0%) |
| 19 to 25 Years | 12 (42.9%) | 16 (57.1%) |
| 26 to 34 Years | 40 (75.5%) | 13 (24.5%) |
| 35 to 44 Years | 53 (85.5%) | 9 (14.5%) |
| 45 to 54 Years | 32 (52.5%) | 29 (47.5%) |
| 55 to 64 Years | 65 (75.6%) | 21 (24.4%) |
| 65 to 74 Years | 59 (100.0%) | 0 (0.0%) |
| 75 Years and older | 25 (100.0%) | 0 (0.0%) |
| Total | 375 (81.0%) | 88 (19.0%) |
Health Insurance Coverage by Citizenship Status in Sunrise Beach
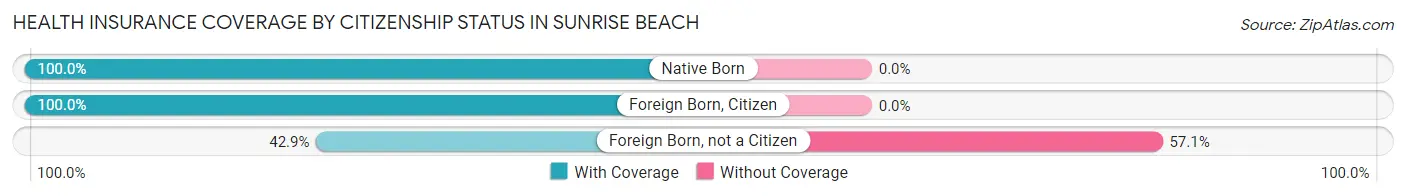
| Citizenship Status | With Coverage | Without Coverage |
| Native Born | 22 (100.0%) | 0 (0.0%) |
| Foreign Born, Citizen | 67 (100.0%) | 0 (0.0%) |
| Foreign Born, not a Citizen | 12 (42.9%) | 16 (57.1%) |
Health Insurance Coverage by Household Income in Sunrise Beach
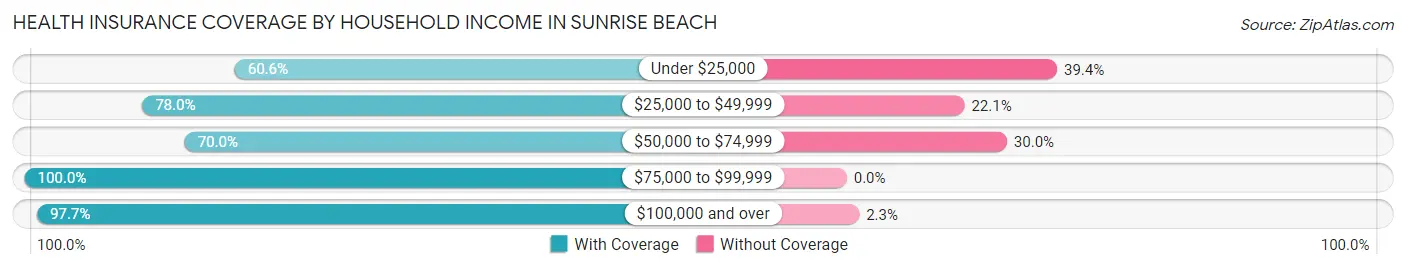
| Household Income | With Coverage | Without Coverage |
| Under $25,000 | 20 (60.6%) | 13 (39.4%) |
| $25,000 to $49,999 | 152 (77.9%) | 43 (22.1%) |
| $50,000 to $74,999 | 70 (70.0%) | 30 (30.0%) |
| $75,000 to $99,999 | 49 (100.0%) | 0 (0.0%) |
| $100,000 and over | 84 (97.7%) | 2 (2.3%) |
Public vs Private Health Insurance Coverage by Age in Sunrise Beach
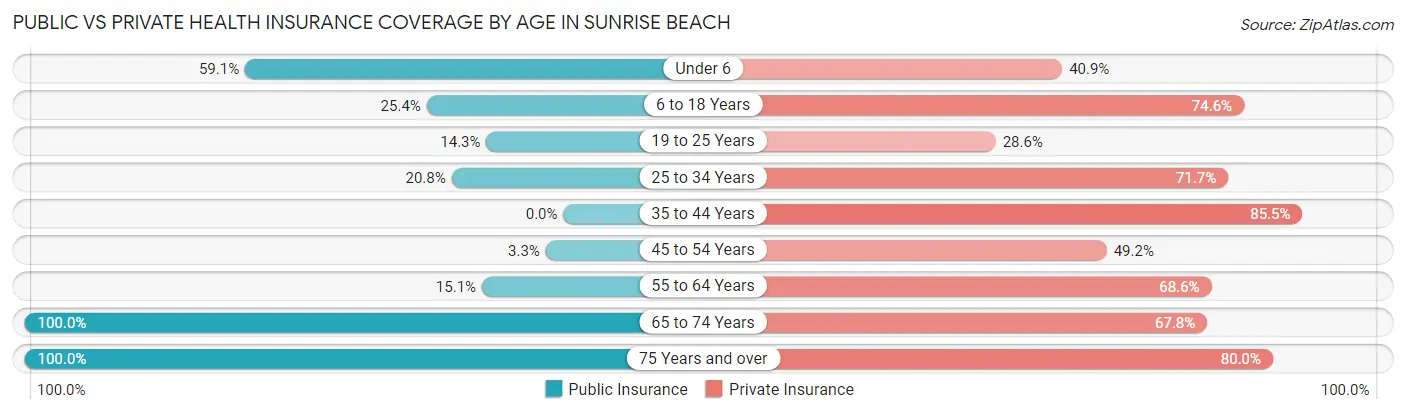
| Age Bracket | Public Insurance | Private Insurance |
| Under 6 | 13 (59.1%) | 9 (40.9%) |
| 6 to 18 Years | 17 (25.4%) | 50 (74.6%) |
| 19 to 25 Years | 4 (14.3%) | 8 (28.6%) |
| 25 to 34 Years | 11 (20.7%) | 38 (71.7%) |
| 35 to 44 Years | 0 (0.0%) | 53 (85.5%) |
| 45 to 54 Years | 2 (3.3%) | 30 (49.2%) |
| 55 to 64 Years | 13 (15.1%) | 59 (68.6%) |
| 65 to 74 Years | 59 (100.0%) | 40 (67.8%) |
| 75 Years and over | 25 (100.0%) | 20 (80.0%) |
| Total | 144 (31.1%) | 307 (66.3%) |
Disability Status by Sex by Age in Sunrise Beach
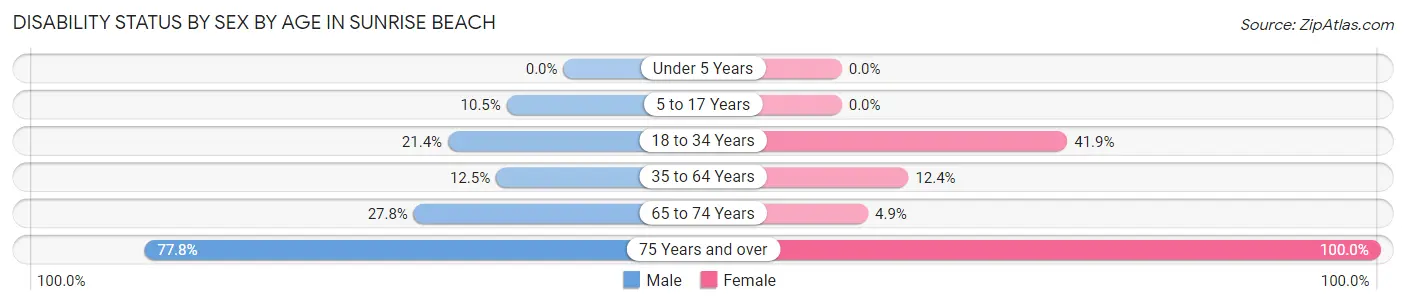
| Age Bracket | Male | Female |
| Under 5 Years | 0 (0.0%) | 0 (0.0%) |
| 5 to 17 Years | 4 (10.5%) | 0 (0.0%) |
| 18 to 34 Years | 9 (21.4%) | 18 (41.9%) |
| 35 to 64 Years | 14 (12.5%) | 12 (12.4%) |
| 65 to 74 Years | 5 (27.8%) | 2 (4.9%) |
| 75 Years and over | 14 (77.8%) | 7 (100.0%) |
Disability Class by Sex by Age in Sunrise Beach
Disability Class: Hearing Difficulty
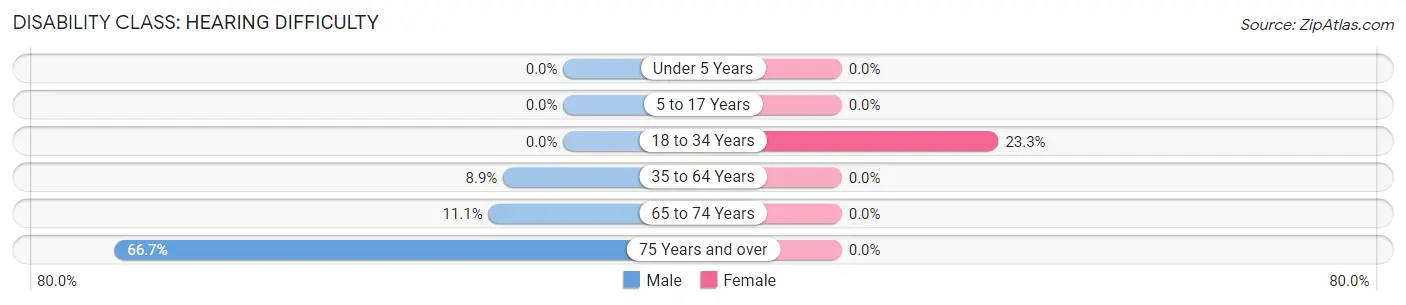
| Age Bracket | Male | Female |
| Under 5 Years | 0 (0.0%) | 0 (0.0%) |
| 5 to 17 Years | 0 (0.0%) | 0 (0.0%) |
| 18 to 34 Years | 0 (0.0%) | 10 (23.3%) |
| 35 to 64 Years | 10 (8.9%) | 0 (0.0%) |
| 65 to 74 Years | 2 (11.1%) | 0 (0.0%) |
| 75 Years and over | 12 (66.7%) | 0 (0.0%) |
Disability Class: Vision Difficulty
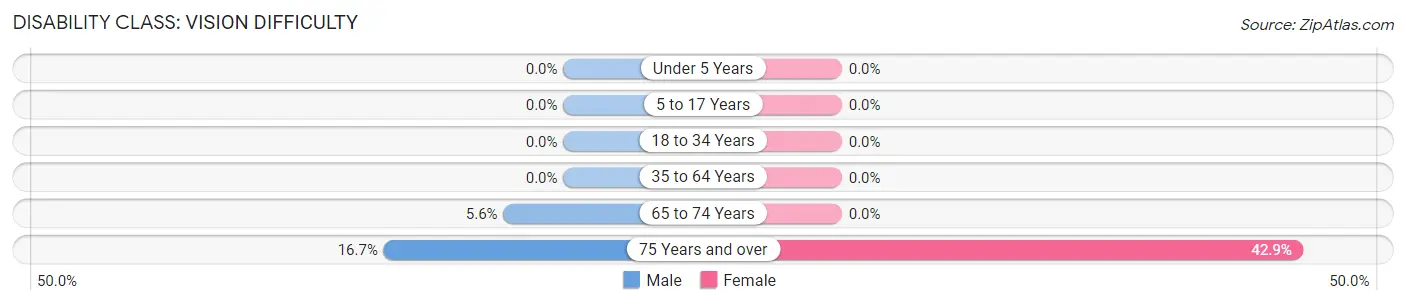
| Age Bracket | Male | Female |
| Under 5 Years | 0 (0.0%) | 0 (0.0%) |
| 5 to 17 Years | 0 (0.0%) | 0 (0.0%) |
| 18 to 34 Years | 0 (0.0%) | 0 (0.0%) |
| 35 to 64 Years | 0 (0.0%) | 0 (0.0%) |
| 65 to 74 Years | 1 (5.6%) | 0 (0.0%) |
| 75 Years and over | 3 (16.7%) | 3 (42.9%) |
Disability Class: Cognitive Difficulty
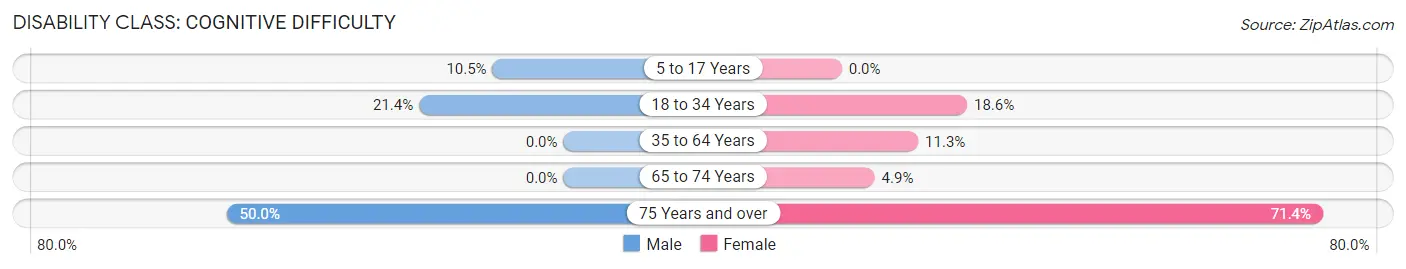
| Age Bracket | Male | Female |
| 5 to 17 Years | 4 (10.5%) | 0 (0.0%) |
| 18 to 34 Years | 9 (21.4%) | 8 (18.6%) |
| 35 to 64 Years | 0 (0.0%) | 11 (11.3%) |
| 65 to 74 Years | 0 (0.0%) | 2 (4.9%) |
| 75 Years and over | 9 (50.0%) | 5 (71.4%) |
Disability Class: Ambulatory Difficulty
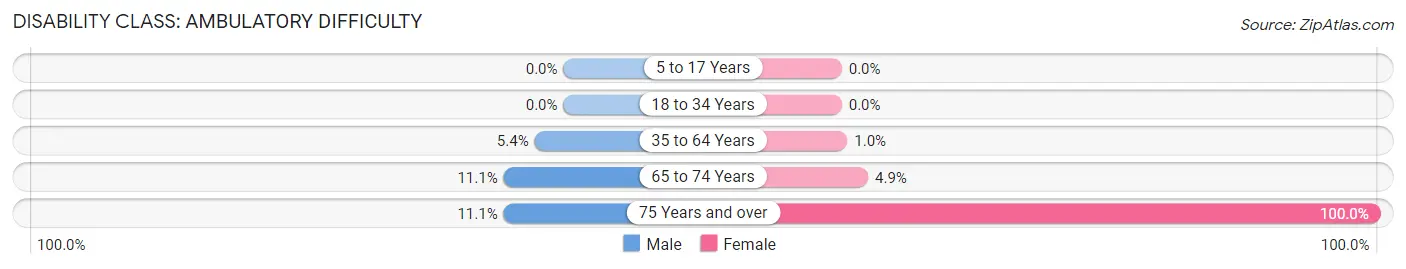
| Age Bracket | Male | Female |
| 5 to 17 Years | 0 (0.0%) | 0 (0.0%) |
| 18 to 34 Years | 0 (0.0%) | 0 (0.0%) |
| 35 to 64 Years | 6 (5.4%) | 1 (1.0%) |
| 65 to 74 Years | 2 (11.1%) | 2 (4.9%) |
| 75 Years and over | 2 (11.1%) | 7 (100.0%) |
Disability Class: Self-Care Difficulty
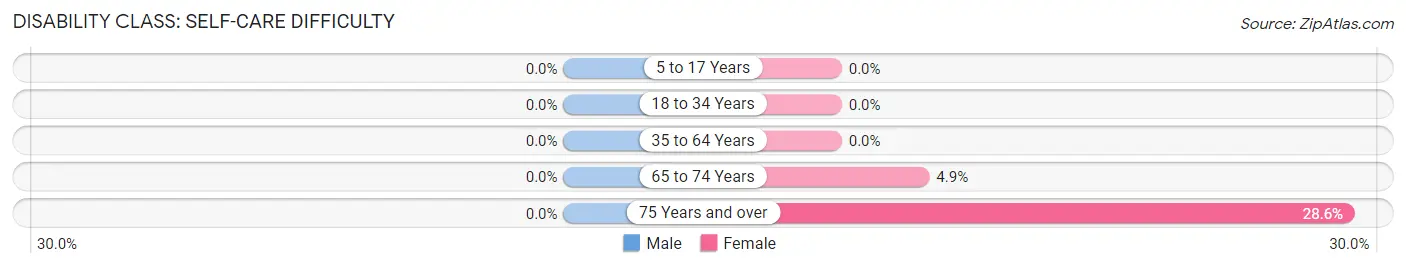
| Age Bracket | Male | Female |
| 5 to 17 Years | 0 (0.0%) | 0 (0.0%) |
| 18 to 34 Years | 0 (0.0%) | 0 (0.0%) |
| 35 to 64 Years | 0 (0.0%) | 0 (0.0%) |
| 65 to 74 Years | 0 (0.0%) | 2 (4.9%) |
| 75 Years and over | 0 (0.0%) | 2 (28.6%) |
Technology Access in Sunrise Beach
Computing Device Access in Sunrise Beach
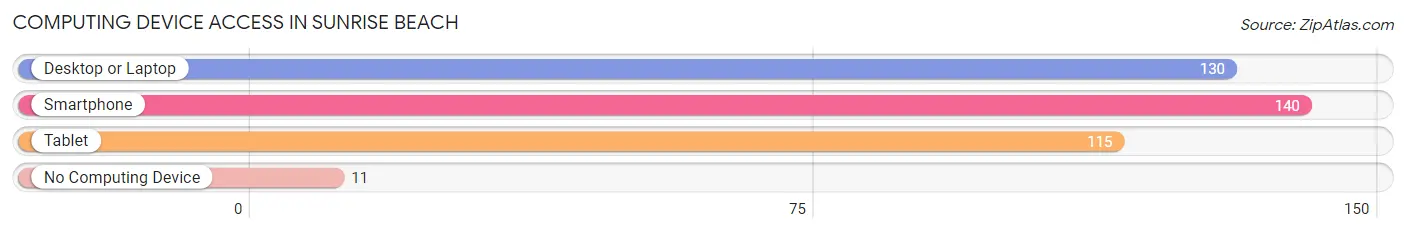
| Device Type | # Households | % Households |
| Desktop or Laptop | 130 | 74.7% |
| Smartphone | 140 | 80.5% |
| Tablet | 115 | 66.1% |
| No Computing Device | 11 | 6.3% |
| Total | 174 | 100.0% |
Internet Access in Sunrise Beach
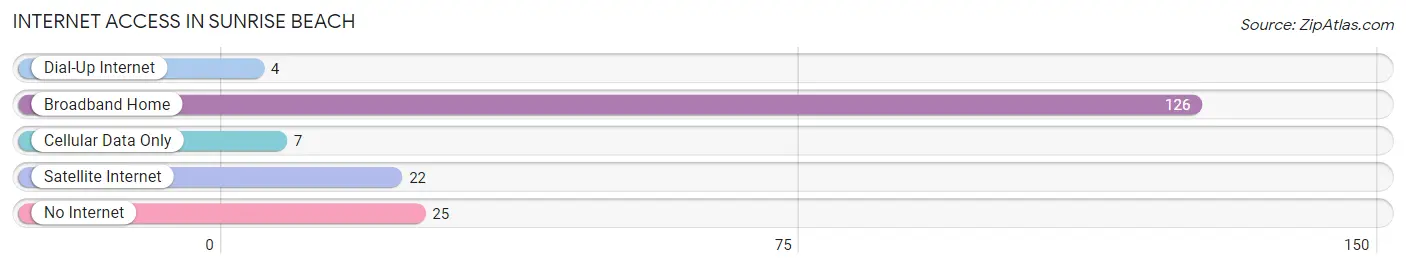
| Internet Type | # Households | % Households |
| Dial-Up Internet | 4 | 2.3% |
| Broadband Home | 126 | 72.4% |
| Cellular Data Only | 7 | 4.0% |
| Satellite Internet | 22 | 12.6% |
| No Internet | 25 | 14.4% |
| Total | 174 | 100.0% |
Sunrise Beach Summary
Sunrise Beach, Missouri is a small town located in Camden County, Missouri. It is situated on the shores of the Lake of the Ozarks, a large man-made lake that was created in 1931. The town has a population of approximately 1,500 people and is a popular tourist destination.
History
Sunrise Beach was founded in the late 1800s by a group of settlers who were looking for a place to settle and start a new life. The town was originally called “Sunrise” and was later changed to “Sunrise Beach” when the lake was created. The town was incorporated in 1945 and has since grown to become a popular tourist destination.
Geography
Sunrise Beach is located in Camden County, Missouri, on the shores of the Lake of the Ozarks. The town is situated on a peninsula that juts out into the lake, giving it a unique geography. The town is surrounded by the lake on three sides and is bordered by the Niangua River to the north. The town is located approximately 80 miles from St. Louis and is accessible by car or boat.
Economy
The economy of Sunrise Beach is largely based on tourism. The town is a popular destination for fishing, boating, and other outdoor activities. There are several marinas in the area, as well as a variety of restaurants, bars, and shops. The town also has a number of resorts and hotels that cater to tourists.
Demographics
As of the 2010 census, the population of Sunrise Beach was 1,500. The town is predominantly white, with a small percentage of African Americans and Hispanics. The median household income is $41,000, and the median age is 44. The town has a low unemployment rate and a high rate of homeownership.
Conclusion
Sunrise Beach, Missouri is a small town located on the shores of the Lake of the Ozarks. The town has a population of approximately 1,500 people and is a popular tourist destination. The economy of Sunrise Beach is largely based on tourism, and the town is predominantly white. The median household income is $41,000, and the median age is 44. Sunrise Beach is a great place to visit and live, and it is a great example of a small town with a thriving economy.
Common Questions
What is Per Capita Income in Sunrise Beach?
Per Capita income in Sunrise Beach is $28,632.
What is the Median Family Income in Sunrise Beach?
Median Family Income in Sunrise Beach is $55,208.
What is the Median Household income in Sunrise Beach?
Median Household Income in Sunrise Beach is $46,389.
What is Income or Wage Gap in Sunrise Beach?
Income or Wage Gap in Sunrise Beach is 22.2%.
Women in Sunrise Beach earn 77.8 cents for every dollar earned by a man.
What is Inequality or Gini Index in Sunrise Beach?
Inequality or Gini Index in Sunrise Beach is 0.42.
What is the Total Population of Sunrise Beach?
Total Population of Sunrise Beach is 463.
What is the Total Male Population of Sunrise Beach?
Total Male Population of Sunrise Beach is 230.
What is the Total Female Population of Sunrise Beach?
Total Female Population of Sunrise Beach is 233.
What is the Ratio of Males per 100 Females in Sunrise Beach?
There are 98.71 Males per 100 Females in Sunrise Beach.
What is the Ratio of Females per 100 Males in Sunrise Beach?
There are 101.30 Females per 100 Males in Sunrise Beach.
What is the Median Population Age in Sunrise Beach?
Median Population Age in Sunrise Beach is 43.9 Years.
What is the Average Family Size in Sunrise Beach
Average Family Size in Sunrise Beach is 3.5 People.
What is the Average Household Size in Sunrise Beach
Average Household Size in Sunrise Beach is 2.7 People.
How Large is the Labor Force in Sunrise Beach?
There are 228 People in the Labor Forcein in Sunrise Beach.
What is the Percentage of People in the Labor Force in Sunrise Beach?
59.1% of People are in the Labor Force in Sunrise Beach.
What is the Unemployment Rate in Sunrise Beach?
Unemployment Rate in Sunrise Beach is 12.7%.