Steele, MO Map & Demographics
Steele Map
Steele Overview
$25,339
PER CAPITA INCOME
$50,231
AVG FAMILY INCOME
$30,592
AVG HOUSEHOLD INCOME
13.6%
WAGE / INCOME GAP [ % ]
86.4¢/ $1
WAGE / INCOME GAP [ $ ]
0.54
INEQUALITY / GINI INDEX
1,375
TOTAL POPULATION
644
MALE POPULATION
731
FEMALE POPULATION
88.10
MALES / 100 FEMALES
113.51
FEMALES / 100 MALES
34.9
MEDIAN AGE
2.7
AVG FAMILY SIZE
2.3
AVG HOUSEHOLD SIZE
701
LABOR FORCE [ PEOPLE ]
62.3%
PERCENT IN LABOR FORCE
25.4%
UNEMPLOYMENT RATE
Steele Zip Codes
Steele Area Codes
Income in Steele
Income Overview in Steele
Per Capita Income in Steele is $25,339, while median incomes of families and households are $50,231 and $30,592 respectively.
| Characteristic | Number | Measure |
| Per Capita Income | 1,375 | $25,339 |
| Median Family Income | 379 | $50,231 |
| Mean Family Income | 379 | $67,539 |
| Median Household Income | 577 | $30,592 |
| Mean Household Income | 577 | $58,891 |
| Income Deficit | 379 | $0 |
| Wage / Income Gap (%) | 1,375 | 13.60% |
| Wage / Income Gap ($) | 1,375 | 86.40¢ per $1 |
| Gini / Inequality Index | 1,375 | 0.54 |
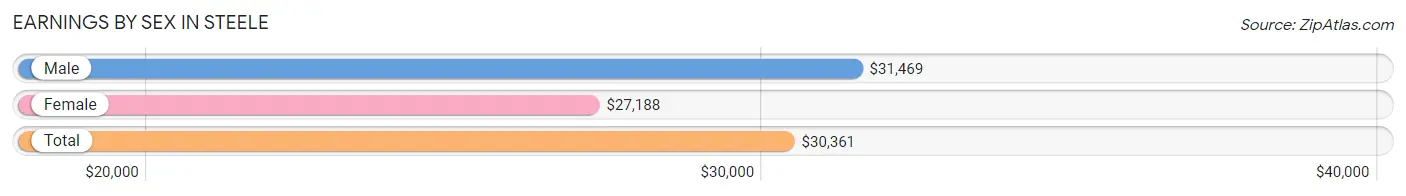
Earnings by Sex in Steele
Average Earnings in Steele are $30,361, $31,469 for men and $27,188 for women, a difference of 13.6%.
| Sex | Number | Average Earnings |
| Male | 363 (59.0%) | $31,469 |
| Female | 252 (41.0%) | $27,188 |
| Total | 615 (100.0%) | $30,361 |
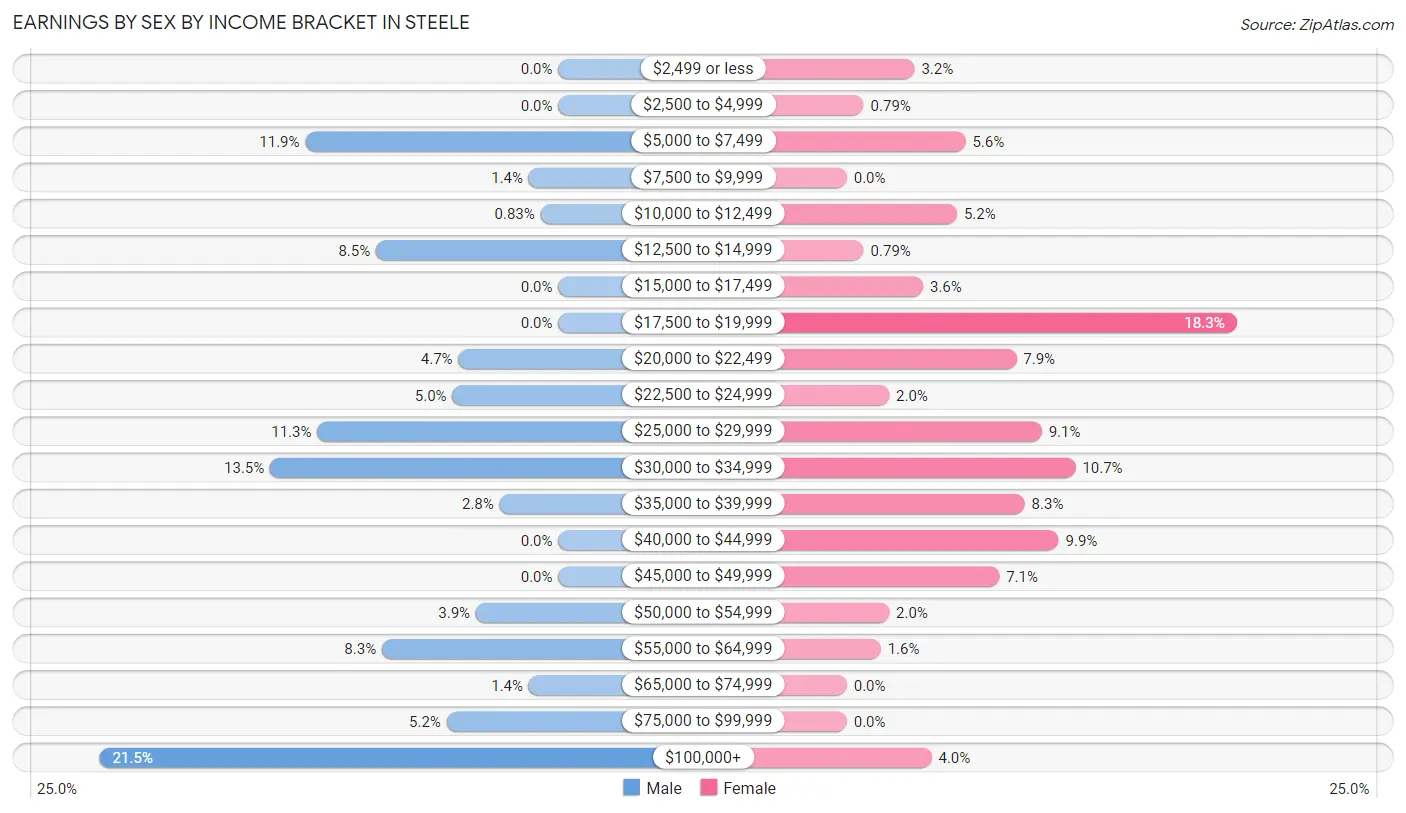
Earnings by Sex by Income Bracket in Steele
The most common earnings brackets in Steele are $100,000+ for men (78 | 21.5%) and $17,500 to $19,999 for women (46 | 18.2%).
| Income | Male | Female |
| $2,499 or less | 0 (0.0%) | 8 (3.2%) |
| $2,500 to $4,999 | 0 (0.0%) | 2 (0.8%) |
| $5,000 to $7,499 | 43 (11.8%) | 14 (5.6%) |
| $7,500 to $9,999 | 5 (1.4%) | 0 (0.0%) |
| $10,000 to $12,499 | 3 (0.8%) | 13 (5.2%) |
| $12,500 to $14,999 | 31 (8.5%) | 2 (0.8%) |
| $15,000 to $17,499 | 0 (0.0%) | 9 (3.6%) |
| $17,500 to $19,999 | 0 (0.0%) | 46 (18.2%) |
| $20,000 to $22,499 | 17 (4.7%) | 20 (7.9%) |
| $22,500 to $24,999 | 18 (5.0%) | 5 (2.0%) |
| $25,000 to $29,999 | 41 (11.3%) | 23 (9.1%) |
| $30,000 to $34,999 | 49 (13.5%) | 27 (10.7%) |
| $35,000 to $39,999 | 10 (2.8%) | 21 (8.3%) |
| $40,000 to $44,999 | 0 (0.0%) | 25 (9.9%) |
| $45,000 to $49,999 | 0 (0.0%) | 18 (7.1%) |
| $50,000 to $54,999 | 14 (3.9%) | 5 (2.0%) |
| $55,000 to $64,999 | 30 (8.3%) | 4 (1.6%) |
| $65,000 to $74,999 | 5 (1.4%) | 0 (0.0%) |
| $75,000 to $99,999 | 19 (5.2%) | 0 (0.0%) |
| $100,000+ | 78 (21.5%) | 10 (4.0%) |
| Total | 363 (100.0%) | 252 (100.0%) |
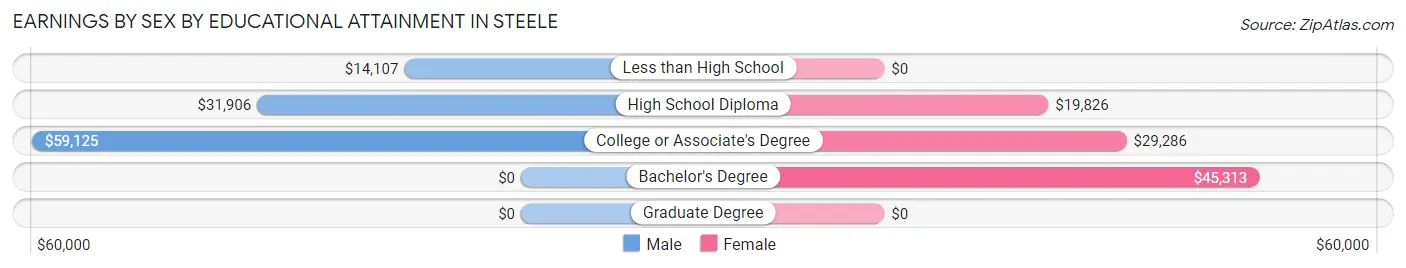
Earnings by Sex by Educational Attainment in Steele
Average earnings in Steele are $34,861 for men and $31,771 for women, a difference of 8.9%. Men with an educational attainment of college or associate's degree enjoy the highest average annual earnings of $59,125, while those with less than high school education earn the least with $14,107. Women with an educational attainment of bachelor's degree earn the most with the average annual earnings of $45,313, while those with high school diploma education have the smallest earnings of $19,826.
| Educational Attainment | Male Income | Female Income |
| Less than High School | $14,107 | $0 |
| High School Diploma | $31,906 | $19,826 |
| College or Associate's Degree | $59,125 | $29,286 |
| Bachelor's Degree | - | - |
| Graduate Degree | - | - |
| Total | $34,861 | $31,771 |
Family Income in Steele
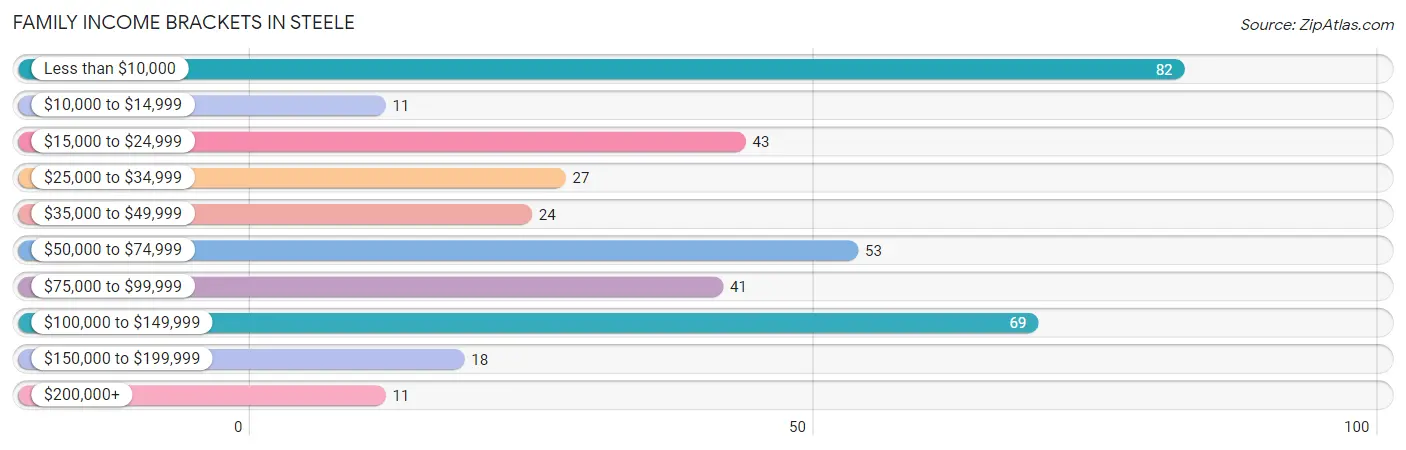
Family Income Brackets in Steele
According to the Steele family income data, there are 82 families falling into the less than $10,000 income range, which is the most common income bracket and makes up 21.6% of all families. Conversely, the $10,000 to $14,999 income bracket is the least frequent group with only 11 families (2.9%) belonging to this category.
| Income Bracket | # Families | % Families |
| Less than $10,000 | 82 | 21.6% |
| $10,000 to $14,999 | 11 | 2.9% |
| $15,000 to $24,999 | 43 | 11.3% |
| $25,000 to $34,999 | 27 | 7.1% |
| $35,000 to $49,999 | 24 | 6.3% |
| $50,000 to $74,999 | 53 | 14.0% |
| $75,000 to $99,999 | 41 | 10.8% |
| $100,000 to $149,999 | 69 | 18.2% |
| $150,000 to $199,999 | 18 | 4.7% |
| $200,000+ | 11 | 2.9% |
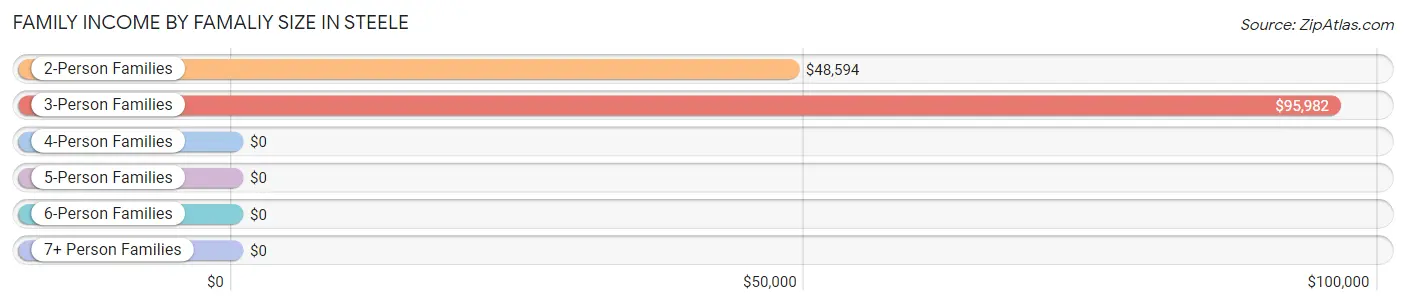
Family Income by Famaliy Size in Steele
3-person families (127 | 33.5%) account for the highest median family income in Steele with $95,982 per family, while 3-person families (127 | 33.5%) have the highest median income of $31,994 per family member.
| Income Bracket | # Families | Median Income |
| 2-Person Families | 143 (37.7%) | $48,594 |
| 3-Person Families | 127 (33.5%) | $95,982 |
| 4-Person Families | 96 (25.3%) | $0 |
| 5-Person Families | 11 (2.9%) | $0 |
| 6-Person Families | 0 (0.0%) | $0 |
| 7+ Person Families | 2 (0.5%) | $0 |
| Total | 379 (100.0%) | $50,231 |
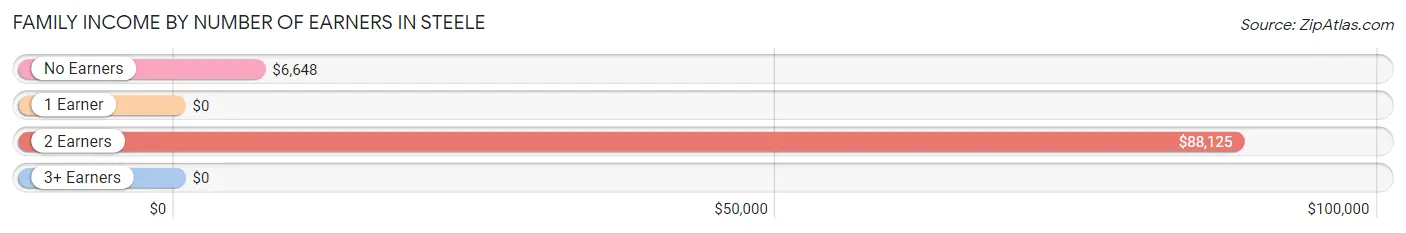
Family Income by Number of Earners in Steele
| Number of Earners | # Families | Median Income |
| No Earners | 119 (31.4%) | $6,648 |
| 1 Earner | 137 (36.1%) | $0 |
| 2 Earners | 107 (28.2%) | $88,125 |
| 3+ Earners | 16 (4.2%) | $0 |
| Total | 379 (100.0%) | $50,231 |
Household Income in Steele
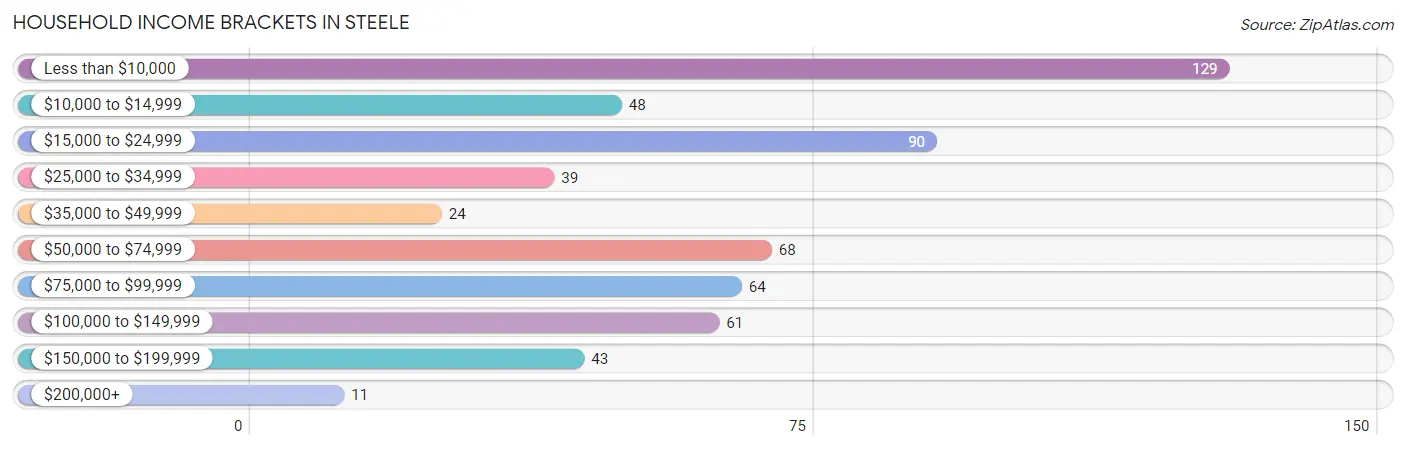
Household Income Brackets in Steele
With 129 households falling in the category, the less than $10,000 income range is the most frequent in Steele, accounting for 22.4% of all households. In contrast, only 11 households (1.9%) fall into the $200,000+ income bracket, making it the least populous group.
| Income Bracket | # Households | % Households |
| Less than $10,000 | 129 | 22.4% |
| $10,000 to $14,999 | 48 | 8.3% |
| $15,000 to $24,999 | 90 | 15.6% |
| $25,000 to $34,999 | 39 | 6.8% |
| $35,000 to $49,999 | 24 | 4.2% |
| $50,000 to $74,999 | 68 | 11.8% |
| $75,000 to $99,999 | 64 | 11.1% |
| $100,000 to $149,999 | 61 | 10.6% |
| $150,000 to $199,999 | 43 | 7.5% |
| $200,000+ | 11 | 1.9% |
Household Income by Householder Age in Steele
The median household income in Steele is $30,592, with the highest median household income of $51,719 found in the 45 to 64 years age bracket for the primary householder. A total of 209 households (36.2%) fall into this category. Meanwhile, the 25 to 44 years age bracket for the primary householder has the lowest median household income of $0, with 189 households (32.8%) in this group.
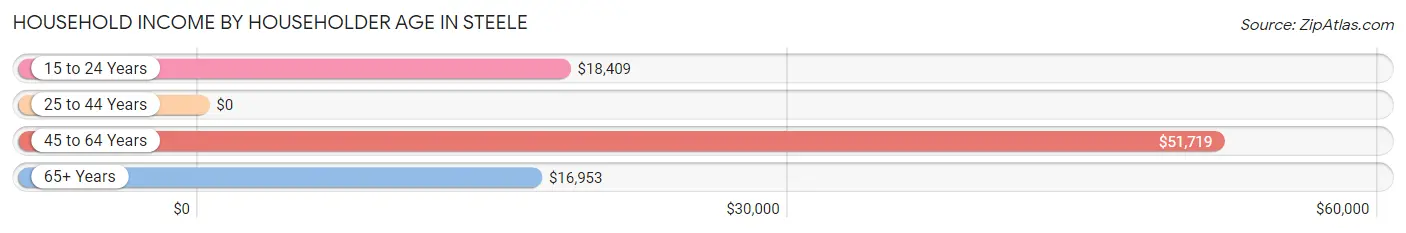
| Income Bracket | # Households | Median Income |
| 15 to 24 Years | 18 (3.1%) | $18,409 |
| 25 to 44 Years | 189 (32.8%) | $0 |
| 45 to 64 Years | 209 (36.2%) | $51,719 |
| 65+ Years | 161 (27.9%) | $16,953 |
| Total | 577 (100.0%) | $30,592 |
Poverty in Steele
Income Below Poverty by Sex and Age in Steele
With 21.7% poverty level for males and 38.3% for females among the residents of Steele, 12 to 14 year old males and 5 year old females are the most vulnerable to poverty, with 7 males (53.8%) and 6 females (100.0%) in their respective age groups living below the poverty level.
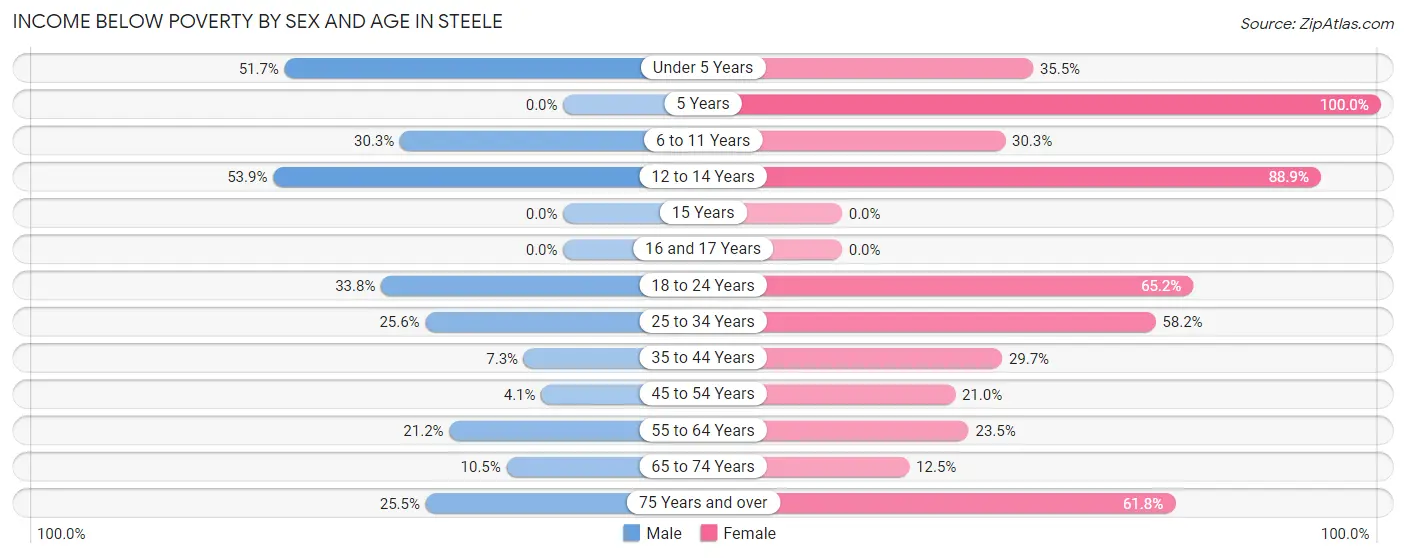
| Age Bracket | Male | Female |
| Under 5 Years | 15 (51.7%) | 33 (35.5%) |
| 5 Years | 0 (0.0%) | 6 (100.0%) |
| 6 to 11 Years | 10 (30.3%) | 10 (30.3%) |
| 12 to 14 Years | 7 (53.8%) | 8 (88.9%) |
| 15 Years | 0 (0.0%) | 0 (0.0%) |
| 16 and 17 Years | 0 (0.0%) | 0 (0.0%) |
| 18 to 24 Years | 24 (33.8%) | 30 (65.2%) |
| 25 to 34 Years | 43 (25.6%) | 78 (58.2%) |
| 35 to 44 Years | 3 (7.3%) | 11 (29.7%) |
| 45 to 54 Years | 4 (4.1%) | 25 (21.0%) |
| 55 to 64 Years | 11 (21.1%) | 16 (23.5%) |
| 65 to 74 Years | 6 (10.5%) | 4 (12.5%) |
| 75 Years and over | 12 (25.5%) | 47 (61.8%) |
| Total | 135 (21.7%) | 268 (38.3%) |
Income Above Poverty by Sex and Age in Steele
According to the poverty statistics in Steele, males aged 15 years and females aged 15 years are the age groups that are most secure financially, with 100.0% of males and 100.0% of females in these age groups living above the poverty line.
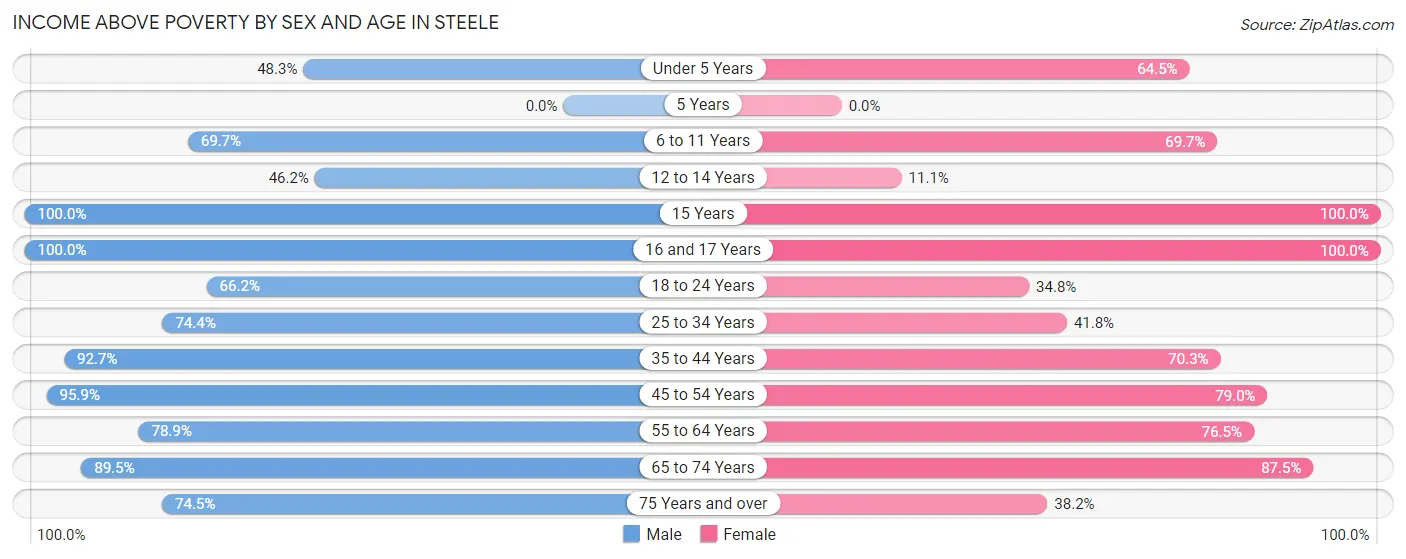
| Age Bracket | Male | Female |
| Under 5 Years | 14 (48.3%) | 60 (64.5%) |
| 5 Years | 0 (0.0%) | 0 (0.0%) |
| 6 to 11 Years | 23 (69.7%) | 23 (69.7%) |
| 12 to 14 Years | 6 (46.2%) | 1 (11.1%) |
| 15 Years | 4 (100.0%) | 29 (100.0%) |
| 16 and 17 Years | 10 (100.0%) | 17 (100.0%) |
| 18 to 24 Years | 47 (66.2%) | 16 (34.8%) |
| 25 to 34 Years | 125 (74.4%) | 56 (41.8%) |
| 35 to 44 Years | 38 (92.7%) | 26 (70.3%) |
| 45 to 54 Years | 94 (95.9%) | 94 (79.0%) |
| 55 to 64 Years | 41 (78.8%) | 52 (76.5%) |
| 65 to 74 Years | 51 (89.5%) | 28 (87.5%) |
| 75 Years and over | 35 (74.5%) | 29 (38.2%) |
| Total | 488 (78.3%) | 431 (61.7%) |
Income Below Poverty Among Married-Couple Families in Steele
The poverty statistics for married-couple families in Steele show that 29.7% or 72 of the total 242 families live below the poverty line. Families with 1 or 2 children have the highest poverty rate of 61.7%, comprising of 66 families. On the other hand, families with 3 or 4 children have the lowest poverty rate of 0.0%, which includes 0 families.
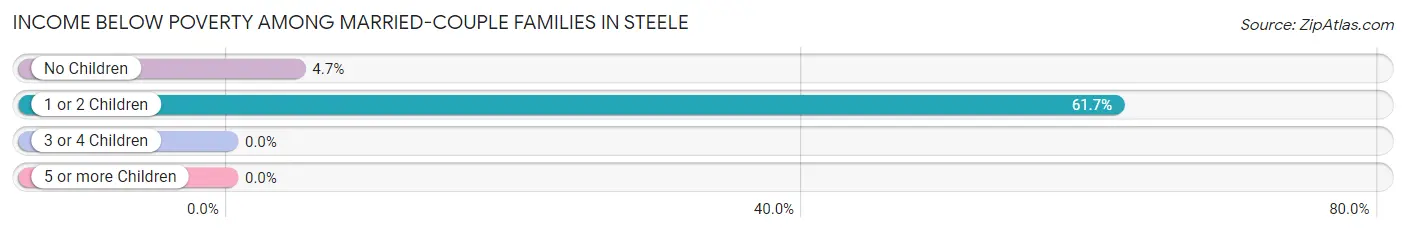
| Children | Above Poverty | Below Poverty |
| No Children | 122 (95.3%) | 6 (4.7%) |
| 1 or 2 Children | 41 (38.3%) | 66 (61.7%) |
| 3 or 4 Children | 5 (100.0%) | 0 (0.0%) |
| 5 or more Children | 2 (100.0%) | 0 (0.0%) |
| Total | 170 (70.3%) | 72 (29.7%) |
Income Below Poverty Among Single-Parent Households in Steele
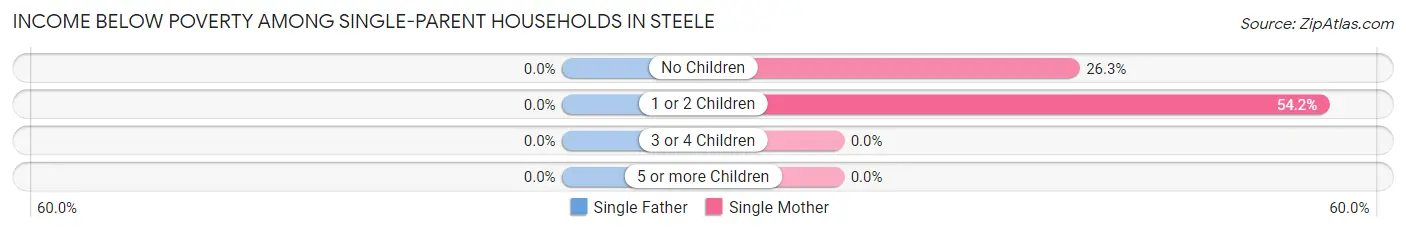
| Children | Single Father | Single Mother |
| No Children | 0 (0.0%) | 10 (26.3%) |
| 1 or 2 Children | 0 (0.0%) | 32 (54.2%) |
| 3 or 4 Children | 0 (0.0%) | 0 (0.0%) |
| 5 or more Children | 0 (0.0%) | 0 (0.0%) |
| Total | 0 (0.0%) | 42 (43.3%) |
Income Below Poverty Among Married-Couple vs Single-Parent Households in Steele
The poverty data for Steele shows that 72 of the married-couple family households (29.7%) and 42 of the single-parent households (30.7%) are living below the poverty level. Within the married-couple family households, those with 1 or 2 children have the highest poverty rate, with 66 households (61.7%) falling below the poverty line. Among the single-parent households, those with 1 or 2 children have the highest poverty rate, with 32 household (36.4%) living below poverty.
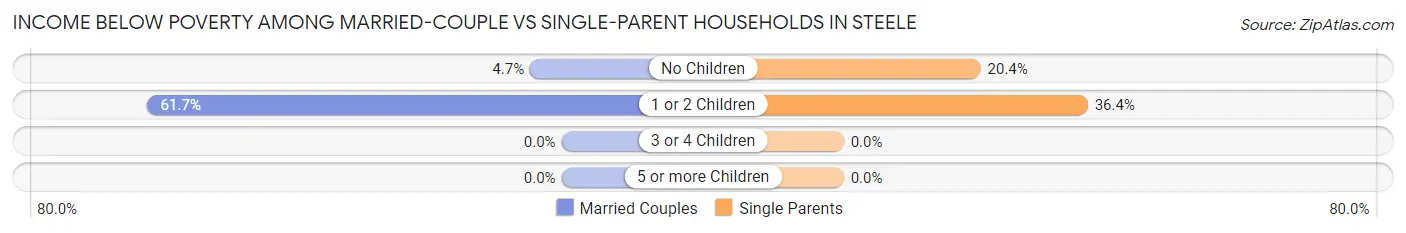
| Children | Married-Couple Families | Single-Parent Households |
| No Children | 6 (4.7%) | 10 (20.4%) |
| 1 or 2 Children | 66 (61.7%) | 32 (36.4%) |
| 3 or 4 Children | 0 (0.0%) | 0 (0.0%) |
| 5 or more Children | 0 (0.0%) | 0 (0.0%) |
| Total | 72 (29.7%) | 42 (30.7%) |
Race in Steele
The most populous races in Steele are White / Caucasian (1,063 | 77.3%), Black / African American (232 | 16.9%), and Two or more Races (80 | 5.8%).
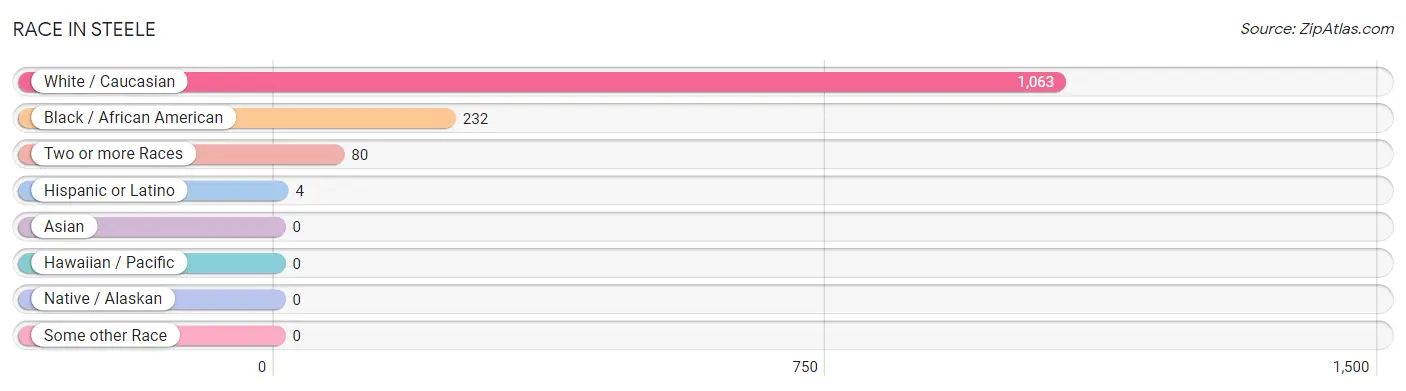
| Race | # Population | % Population |
| Asian | 0 | 0.0% |
| Black / African American | 232 | 16.9% |
| Hawaiian / Pacific | 0 | 0.0% |
| Hispanic or Latino | 4 | 0.3% |
| Native / Alaskan | 0 | 0.0% |
| White / Caucasian | 1,063 | 77.3% |
| Two or more Races | 80 | 5.8% |
| Some other Race | 0 | 0.0% |
| Total | 1,375 | 100.0% |
Ancestry in Steele
The most populous ancestries reported in Steele are Irish (135 | 9.8%), American (129 | 9.4%), German (118 | 8.6%), English (66 | 4.8%), and French (60 | 4.4%), together accounting for 36.9% of all Steele residents.
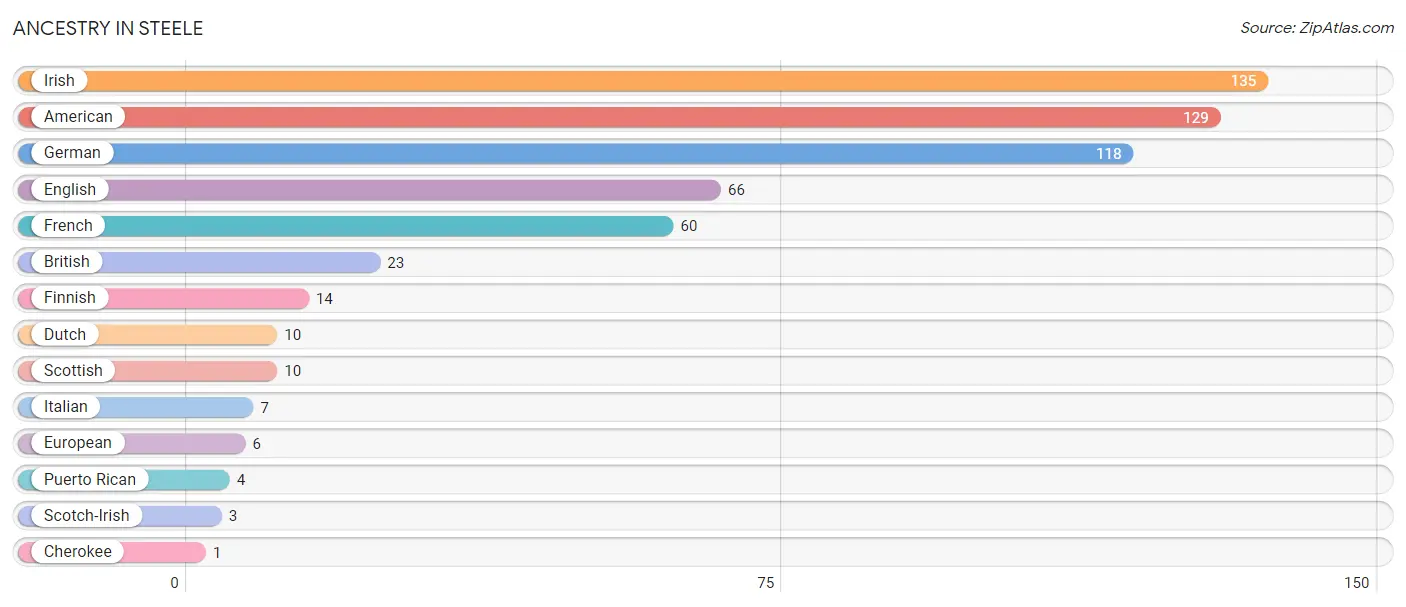
| Ancestry | # Population | % Population |
| American | 129 | 9.4% |
| British | 23 | 1.7% |
| Cherokee | 1 | 0.1% |
| Dutch | 10 | 0.7% |
| English | 66 | 4.8% |
| European | 6 | 0.4% |
| Finnish | 14 | 1.0% |
| French | 60 | 4.4% |
| German | 118 | 8.6% |
| Irish | 135 | 9.8% |
| Italian | 7 | 0.5% |
| Puerto Rican | 4 | 0.3% |
| Scotch-Irish | 3 | 0.2% |
| Scottish | 10 | 0.7% | View All 14 Rows |
Immigrants in Steele

| Immigration Origin | # Population | % Population | View All 0 Rows |
Sex and Age in Steele
Sex and Age in Steele
The most populous age groups in Steele are 30 to 34 Years (97 | 15.1%) for men and 30 to 34 Years (104 | 14.2%) for women.
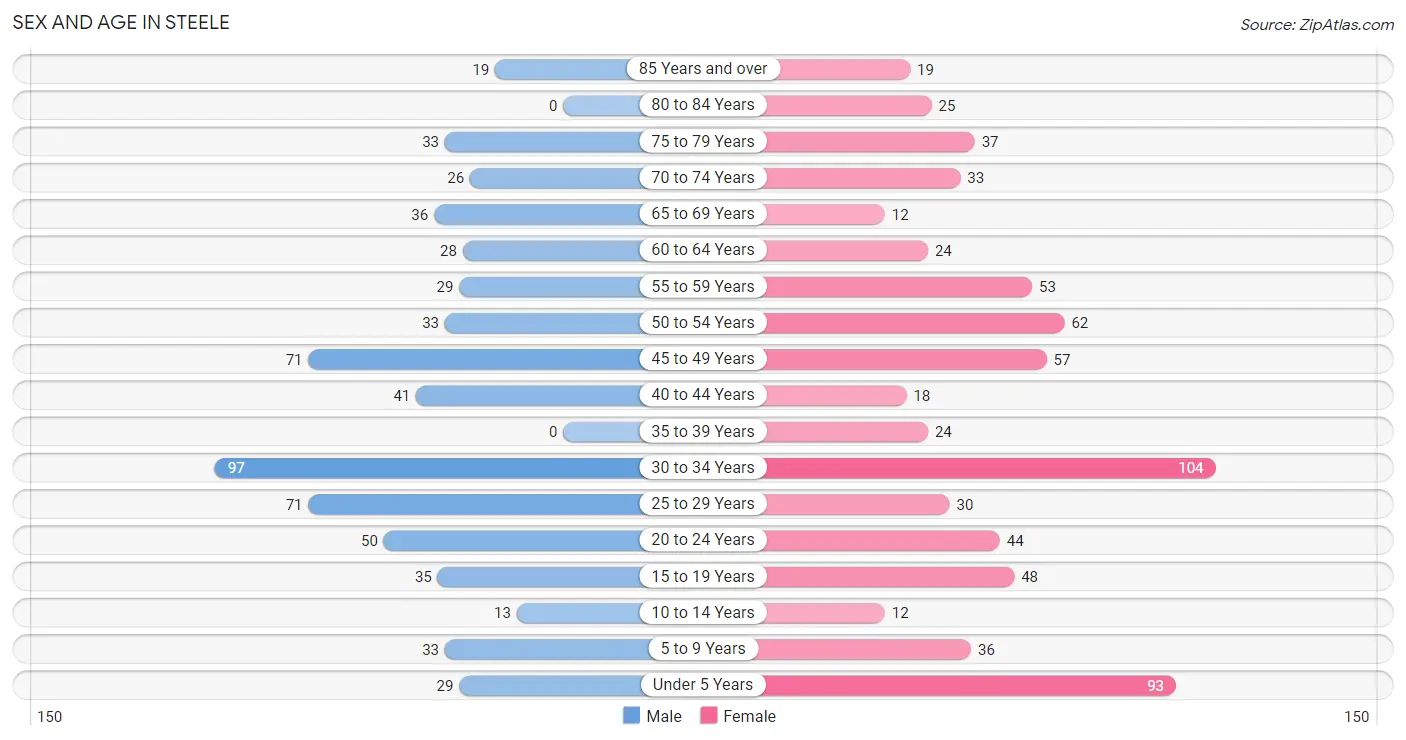
| Age Bracket | Male | Female |
| Under 5 Years | 29 (4.5%) | 93 (12.7%) |
| 5 to 9 Years | 33 (5.1%) | 36 (4.9%) |
| 10 to 14 Years | 13 (2.0%) | 12 (1.6%) |
| 15 to 19 Years | 35 (5.4%) | 48 (6.6%) |
| 20 to 24 Years | 50 (7.8%) | 44 (6.0%) |
| 25 to 29 Years | 71 (11.0%) | 30 (4.1%) |
| 30 to 34 Years | 97 (15.1%) | 104 (14.2%) |
| 35 to 39 Years | 0 (0.0%) | 24 (3.3%) |
| 40 to 44 Years | 41 (6.4%) | 18 (2.5%) |
| 45 to 49 Years | 71 (11.0%) | 57 (7.8%) |
| 50 to 54 Years | 33 (5.1%) | 62 (8.5%) |
| 55 to 59 Years | 29 (4.5%) | 53 (7.2%) |
| 60 to 64 Years | 28 (4.3%) | 24 (3.3%) |
| 65 to 69 Years | 36 (5.6%) | 12 (1.6%) |
| 70 to 74 Years | 26 (4.0%) | 33 (4.5%) |
| 75 to 79 Years | 33 (5.1%) | 37 (5.1%) |
| 80 to 84 Years | 0 (0.0%) | 25 (3.4%) |
| 85 Years and over | 19 (2.9%) | 19 (2.6%) |
| Total | 644 (100.0%) | 731 (100.0%) |
Families and Households in Steele
Median Family Size in Steele
The median family size in Steele is 2.70 persons per family, with single male/father families (40 | 10.5%) accounting for the largest median family size of 3.48 persons per family. On the other hand, married-couple families (242 | 63.8%) represent the smallest median family size with 2.59 persons per family.
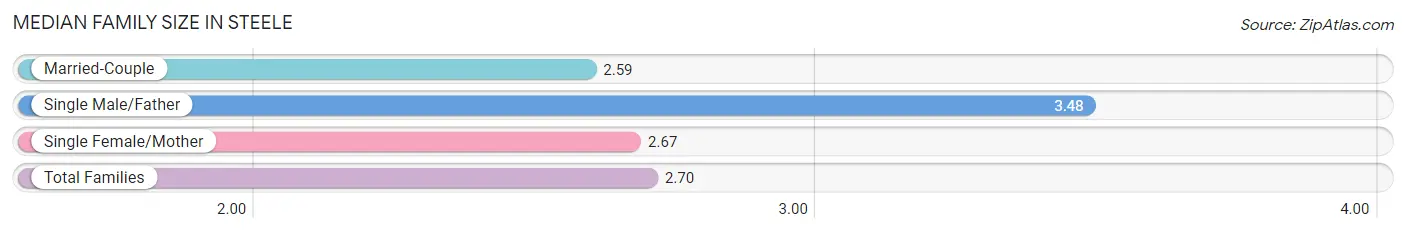
| Family Type | # Families | Family Size |
| Married-Couple | 242 (63.8%) | 2.59 |
| Single Male/Father | 40 (10.5%) | 3.48 |
| Single Female/Mother | 97 (25.6%) | 2.67 |
| Total Families | 379 (100.0%) | 2.70 |
Median Household Size in Steele
The median household size in Steele is 2.29 persons per household, with single male/father households (40 | 6.9%) accounting for the largest median household size of 4.33 persons per household. non-family households (198 | 34.3%) represent the smallest median household size with 1.27 persons per household.
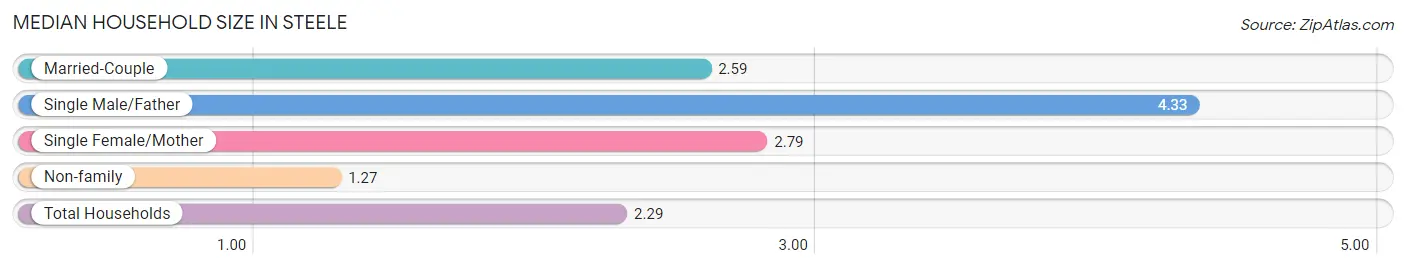
| Household Type | # Households | Household Size |
| Married-Couple | 242 (41.9%) | 2.59 |
| Single Male/Father | 40 (6.9%) | 4.33 |
| Single Female/Mother | 97 (16.8%) | 2.79 |
| Non-family | 198 (34.3%) | 1.27 |
| Total Households | 577 (100.0%) | 2.29 |
Household Size by Marriage Status in Steele
Out of a total of 577 households in Steele, 379 (65.7%) are family households, while 198 (34.3%) are nonfamily households. The most numerous type of family households are 4-person households, comprising 148, and the most common type of nonfamily households are 1-person households, comprising 153.
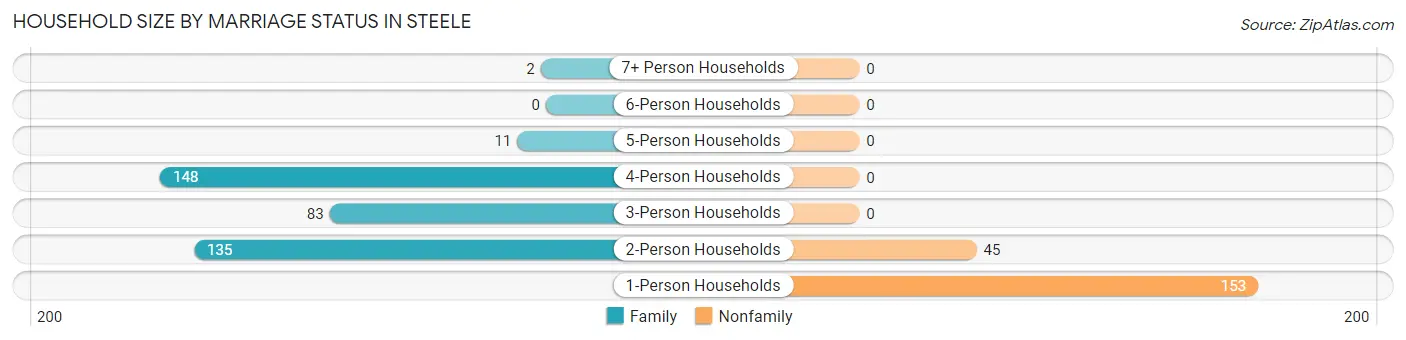
| Household Size | Family Households | Nonfamily Households |
| 1-Person Households | - | 153 (26.5%) |
| 2-Person Households | 135 (23.4%) | 45 (7.8%) |
| 3-Person Households | 83 (14.4%) | 0 (0.0%) |
| 4-Person Households | 148 (25.7%) | 0 (0.0%) |
| 5-Person Households | 11 (1.9%) | 0 (0.0%) |
| 6-Person Households | 0 (0.0%) | 0 (0.0%) |
| 7+ Person Households | 2 (0.4%) | 0 (0.0%) |
| Total | 379 (65.7%) | 198 (34.3%) |
Female Fertility in Steele
Fertility by Age in Steele
Average fertility rate in Steele is 58.0 births per 1,000 women. Women in the age bracket of 35 to 50 years have the highest fertility rate with 101.0 births per 1,000 women. Women in the age bracket of 35 to 50 years acount for 52.6% of all women with births.
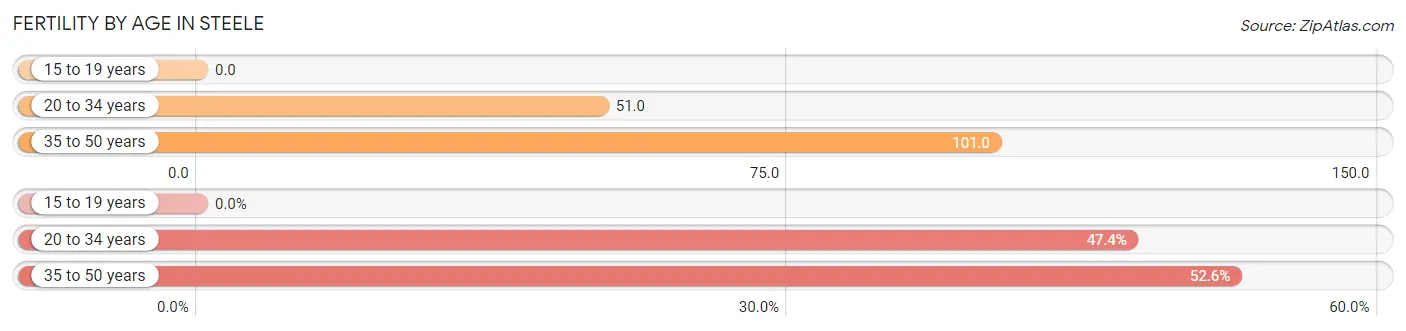
| Age Bracket | Women with Births | Births / 1,000 Women |
| 15 to 19 years | 0 (0.0%) | 0.0 |
| 20 to 34 years | 9 (47.4%) | 51.0 |
| 35 to 50 years | 10 (52.6%) | 101.0 |
| Total | 19 (100.0%) | 58.0 |
Fertility by Age by Marriage Status in Steele
63.2% of women with births (19) in Steele are married. The highest percentage of unmarried women with births falls into 20 to 34 years age bracket with 77.8% of them unmarried at the time of birth, while the lowest percentage of unmarried women with births belong to 35 to 50 years age bracket with 0.0% of them unmarried.
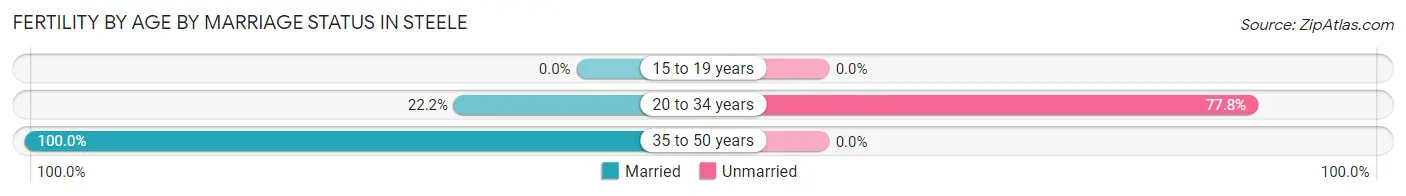
| Age Bracket | Married | Unmarried |
| 15 to 19 years | 0 (0.0%) | 0 (0.0%) |
| 20 to 34 years | 2 (22.2%) | 7 (77.8%) |
| 35 to 50 years | 10 (100.0%) | 0 (0.0%) |
| Total | 12 (63.2%) | 7 (36.8%) |
Fertility by Education in Steele
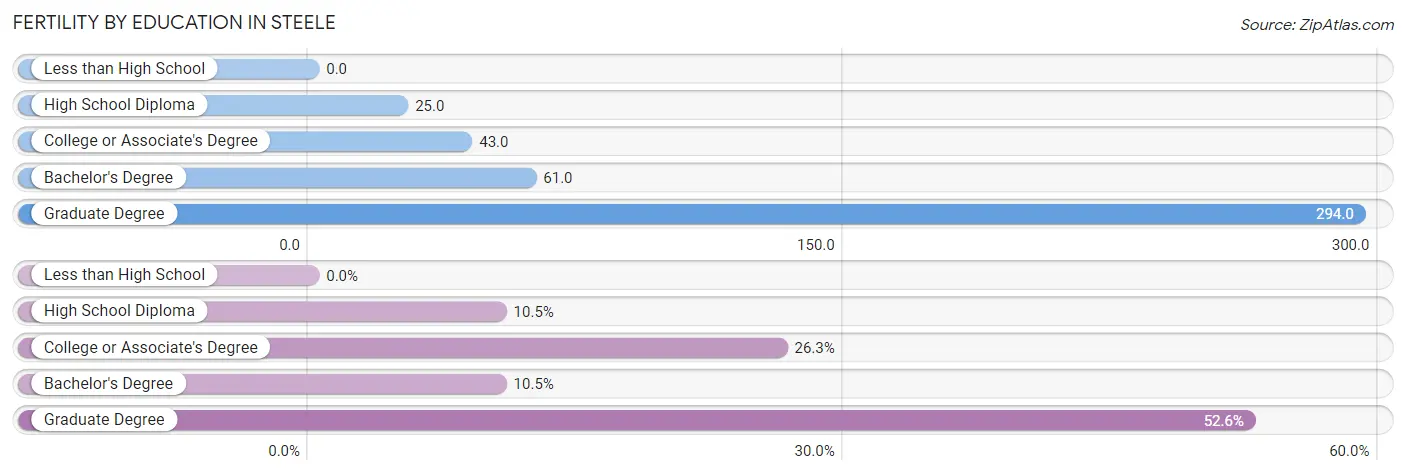
| Educational Attainment | Women with Births | Births / 1,000 Women |
| Less than High School | 0 (0.0%) | 0.0 |
| High School Diploma | 2 (10.5%) | 25.0 |
| College or Associate's Degree | 5 (26.3%) | 43.0 |
| Bachelor's Degree | 2 (10.5%) | 61.0 |
| Graduate Degree | 10 (52.6%) | 294.0 |
| Total | 19 (100.0%) | 58.0 |
Fertility by Education by Marriage Status in Steele
36.8% of women with births in Steele are unmarried. Women with the educational attainment of bachelor's degree are most likely to be married with 100.0% of them married at childbirth, while women with the educational attainment of high school diploma are least likely to be married with 100.0% of them unmarried at childbirth.
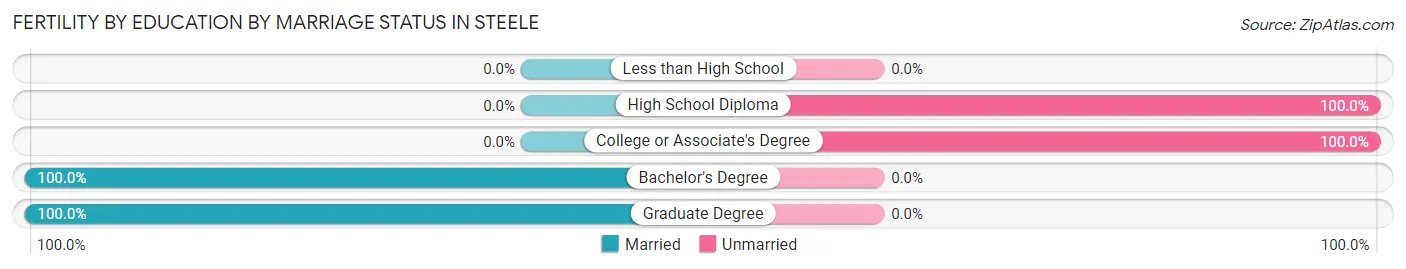
| Educational Attainment | Married | Unmarried |
| Less than High School | 0 (0.0%) | 0 (0.0%) |
| High School Diploma | 0 (0.0%) | 2 (100.0%) |
| College or Associate's Degree | 0 (0.0%) | 5 (100.0%) |
| Bachelor's Degree | 2 (100.0%) | 0 (0.0%) |
| Graduate Degree | 10 (100.0%) | 0 (0.0%) |
| Total | 12 (63.2%) | 7 (36.8%) |
Employment Characteristics in Steele
Employment by Class of Employer in Steele
Among the 523 employed individuals in Steele, private company employees (415 | 79.3%), local government employees (41 | 7.8%), and not-for-profit organizations (27 | 5.2%) make up the most common classes of employment.
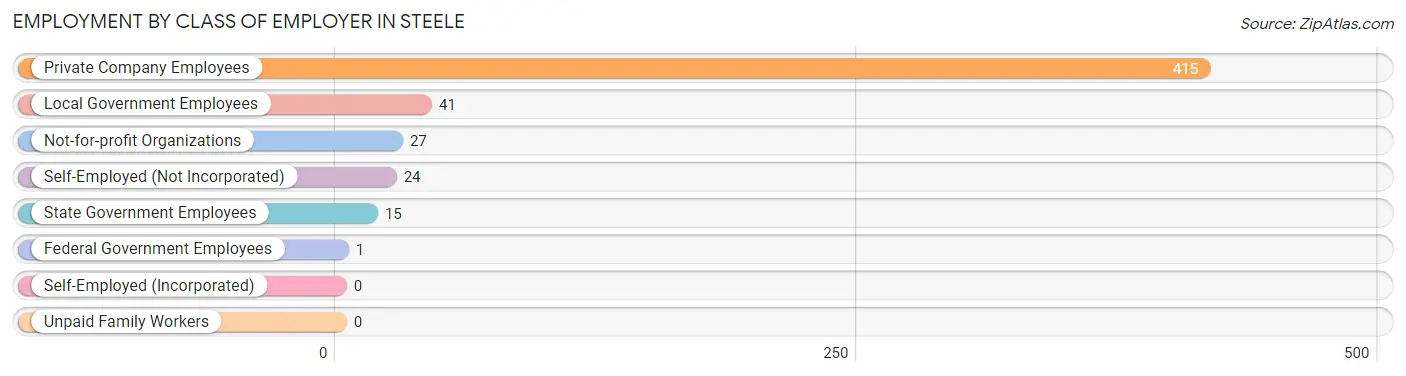
| Employer Class | # Employees | % Employees |
| Private Company Employees | 415 | 79.3% |
| Self-Employed (Incorporated) | 0 | 0.0% |
| Self-Employed (Not Incorporated) | 24 | 4.6% |
| Not-for-profit Organizations | 27 | 5.2% |
| Local Government Employees | 41 | 7.8% |
| State Government Employees | 15 | 2.9% |
| Federal Government Employees | 1 | 0.2% |
| Unpaid Family Workers | 0 | 0.0% |
| Total | 523 | 100.0% |
Employment Status by Age in Steele
According to the labor force statistics for Steele, out of the total population over 16 years of age (1,126), 62.3% or 701 individuals are in the labor force, with 25.4% or 178 of them unemployed. The age group with the highest labor force participation rate is 20 to 24 years, with 96.8% or 91 individuals in the labor force. Within the labor force, the 30 to 34 years age range has the highest percentage of unemployed individuals, with 63.6% or 117 of them being unemployed.
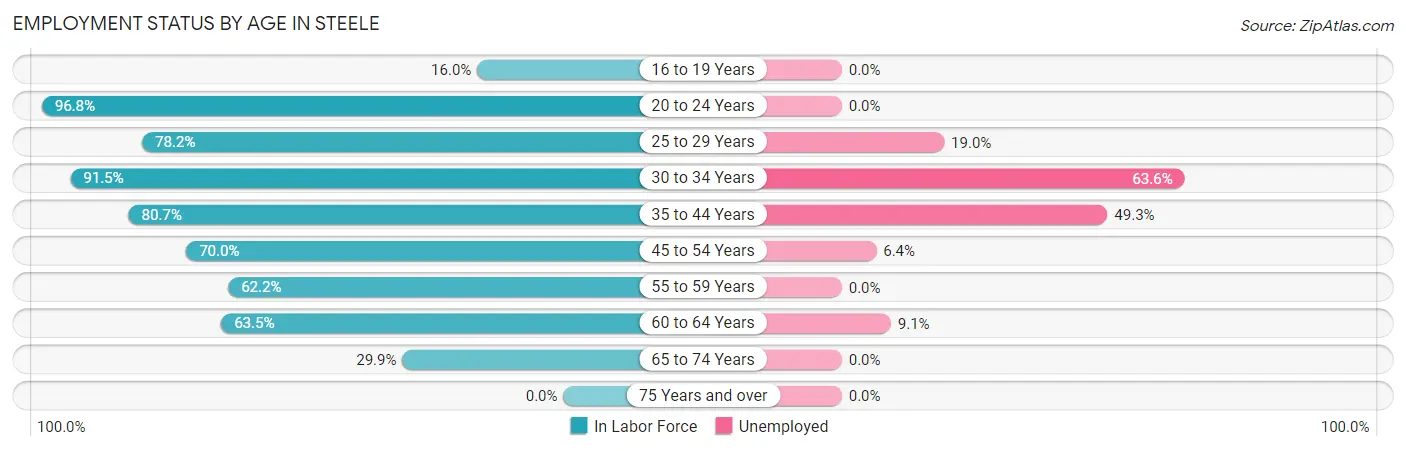
| Age Bracket | In Labor Force | Unemployed |
| 16 to 19 Years | 8 (16.0%) | 0 (0.0%) |
| 20 to 24 Years | 91 (96.8%) | 0 (0.0%) |
| 25 to 29 Years | 79 (78.2%) | 15 (19.0%) |
| 30 to 34 Years | 184 (91.5%) | 117 (63.6%) |
| 35 to 44 Years | 67 (80.7%) | 33 (49.3%) |
| 45 to 54 Years | 156 (70.0%) | 10 (6.4%) |
| 55 to 59 Years | 51 (62.2%) | 0 (0.0%) |
| 60 to 64 Years | 33 (63.5%) | 3 (9.1%) |
| 65 to 74 Years | 32 (29.9%) | 0 (0.0%) |
| 75 Years and over | 0 (0.0%) | 0 (0.0%) |
| Total | 701 (62.3%) | 178 (25.4%) |
Employment Status by Educational Attainment in Steele
According to labor force statistics for Steele, 76.8% of individuals (570) out of the total population between 25 and 64 years of age (742) are in the labor force, with 31.2% or 178 of them being unemployed. The group with the highest labor force participation rate are those with the educational attainment of college / associate degree, with 92.2% or 212 individuals in the labor force. Within the labor force, individuals with college / associate degree education have the highest percentage of unemployment, with 56.1% or 119 of them being unemployed.
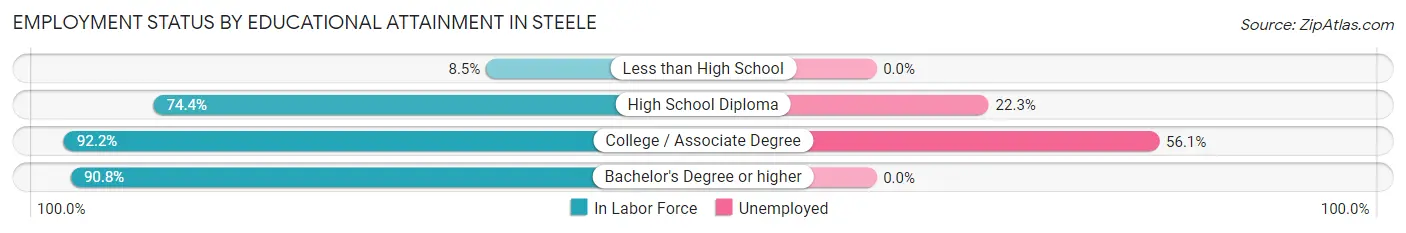
| Educational Attainment | In Labor Force | Unemployed |
| Less than High School | 5 (8.5%) | 0 (0.0%) |
| High School Diploma | 264 (74.4%) | 79 (22.3%) |
| College / Associate Degree | 212 (92.2%) | 129 (56.1%) |
| Bachelor's Degree or higher | 89 (90.8%) | 0 (0.0%) |
| Total | 570 (76.8%) | 232 (31.2%) |
Employment Occupations by Sex in Steele
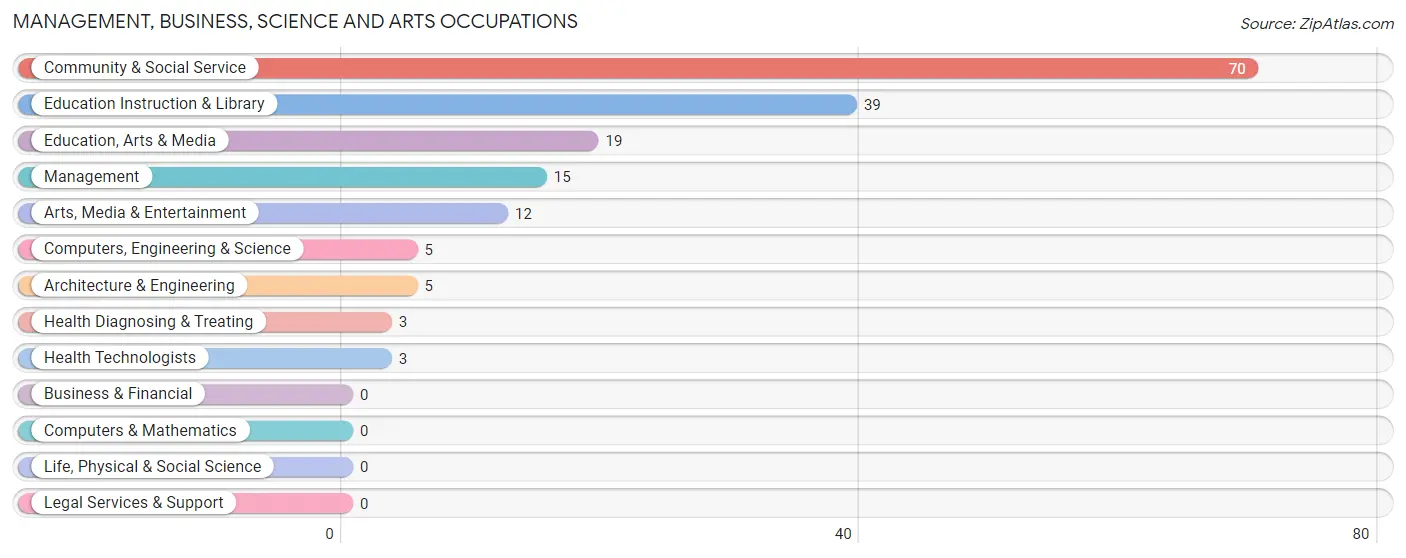
Management, Business, Science and Arts Occupations
The most common Management, Business, Science and Arts occupations in Steele are Community & Social Service (70 | 13.4%), Education Instruction & Library (39 | 7.5%), Education, Arts & Media (19 | 3.6%), Management (15 | 2.9%), and Arts, Media & Entertainment (12 | 2.3%).
Management, Business, Science and Arts Occupations by Sex
Within the Management, Business, Science and Arts occupations in Steele, the most male-oriented occupations are Management (100.0%), Computers, Engineering & Science (100.0%), and Architecture & Engineering (100.0%), while the most female-oriented occupations are Education, Arts & Media (100.0%), Health Diagnosing & Treating (100.0%), and Health Technologists (100.0%).
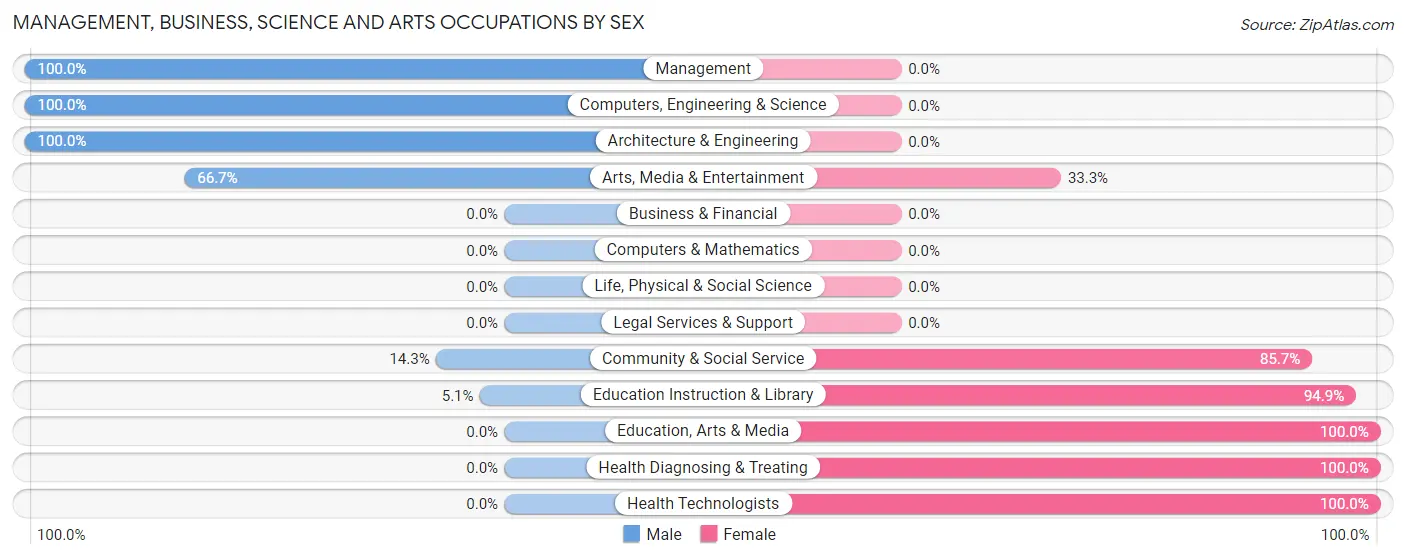
| Occupation | Male | Female |
| Management | 15 (100.0%) | 0 (0.0%) |
| Business & Financial | 0 (0.0%) | 0 (0.0%) |
| Computers, Engineering & Science | 5 (100.0%) | 0 (0.0%) |
| Computers & Mathematics | 0 (0.0%) | 0 (0.0%) |
| Architecture & Engineering | 5 (100.0%) | 0 (0.0%) |
| Life, Physical & Social Science | 0 (0.0%) | 0 (0.0%) |
| Community & Social Service | 10 (14.3%) | 60 (85.7%) |
| Education, Arts & Media | 0 (0.0%) | 19 (100.0%) |
| Legal Services & Support | 0 (0.0%) | 0 (0.0%) |
| Education Instruction & Library | 2 (5.1%) | 37 (94.9%) |
| Arts, Media & Entertainment | 8 (66.7%) | 4 (33.3%) |
| Health Diagnosing & Treating | 0 (0.0%) | 3 (100.0%) |
| Health Technologists | 0 (0.0%) | 3 (100.0%) |
| Total (Category) | 30 (32.3%) | 63 (67.7%) |
| Total (Overall) | 289 (55.3%) | 234 (44.7%) |
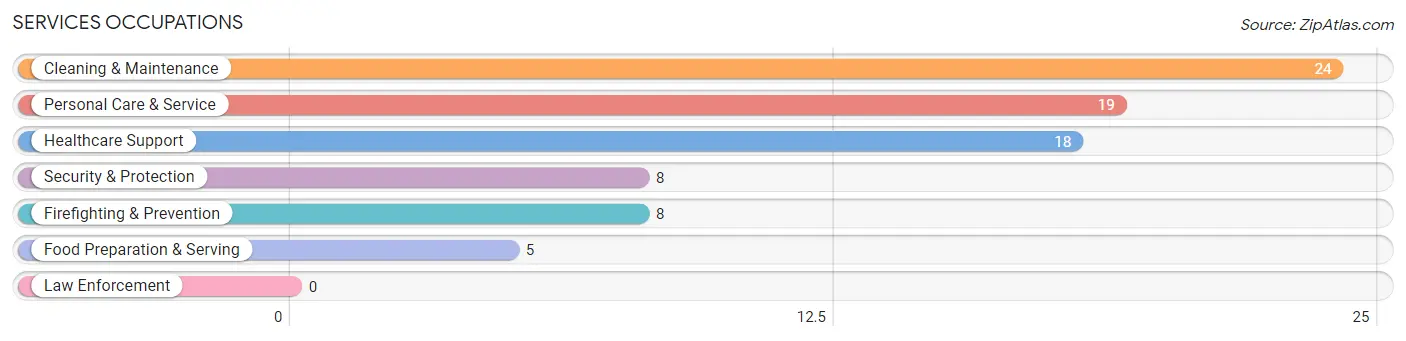
Services Occupations
The most common Services occupations in Steele are Cleaning & Maintenance (24 | 4.6%), Personal Care & Service (19 | 3.6%), Healthcare Support (18 | 3.4%), Security & Protection (8 | 1.5%), and Firefighting & Prevention (8 | 1.5%).
Services Occupations by Sex
Within the Services occupations in Steele, the most male-oriented occupations are Security & Protection (100.0%), and Firefighting & Prevention (100.0%), while the most female-oriented occupations are Healthcare Support (100.0%), Food Preparation & Serving (100.0%), and Cleaning & Maintenance (100.0%).
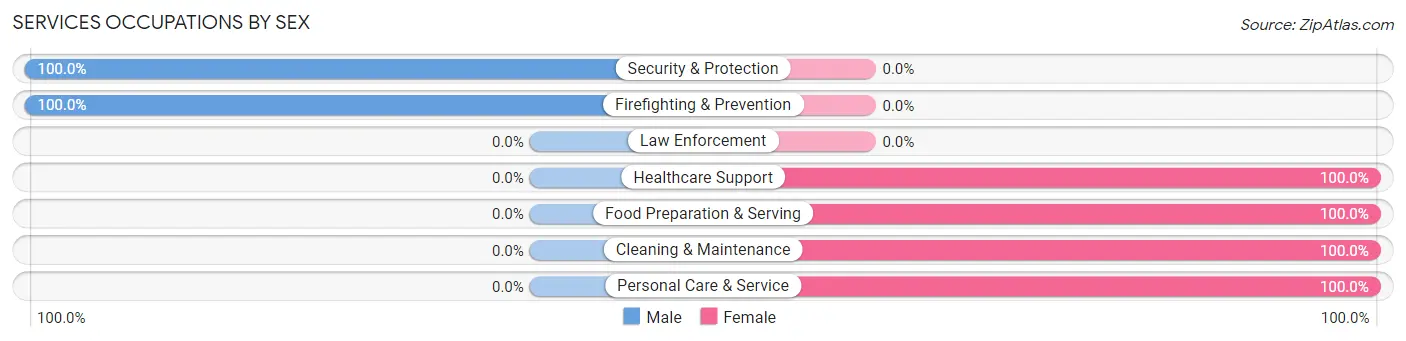
| Occupation | Male | Female |
| Healthcare Support | 0 (0.0%) | 18 (100.0%) |
| Security & Protection | 8 (100.0%) | 0 (0.0%) |
| Firefighting & Prevention | 8 (100.0%) | 0 (0.0%) |
| Law Enforcement | 0 (0.0%) | 0 (0.0%) |
| Food Preparation & Serving | 0 (0.0%) | 5 (100.0%) |
| Cleaning & Maintenance | 0 (0.0%) | 24 (100.0%) |
| Personal Care & Service | 0 (0.0%) | 19 (100.0%) |
| Total (Category) | 8 (10.8%) | 66 (89.2%) |
| Total (Overall) | 289 (55.3%) | 234 (44.7%) |
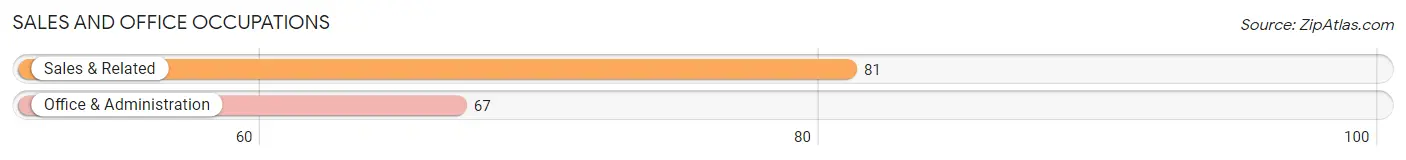
Sales and Office Occupations
The most common Sales and Office occupations in Steele are Sales & Related (81 | 15.5%), and Office & Administration (67 | 12.8%).
Sales and Office Occupations by Sex
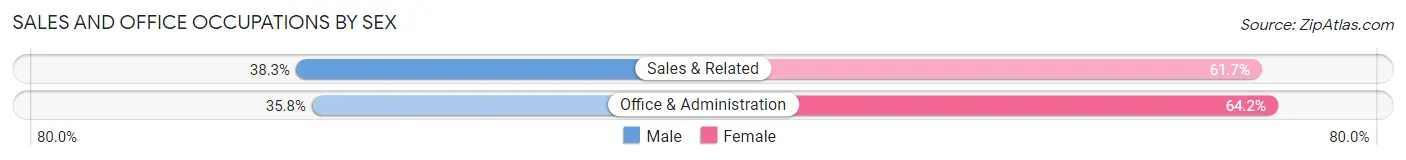
| Occupation | Male | Female |
| Sales & Related | 31 (38.3%) | 50 (61.7%) |
| Office & Administration | 24 (35.8%) | 43 (64.2%) |
| Total (Category) | 55 (37.2%) | 93 (62.8%) |
| Total (Overall) | 289 (55.3%) | 234 (44.7%) |
Natural Resources, Construction and Maintenance Occupations
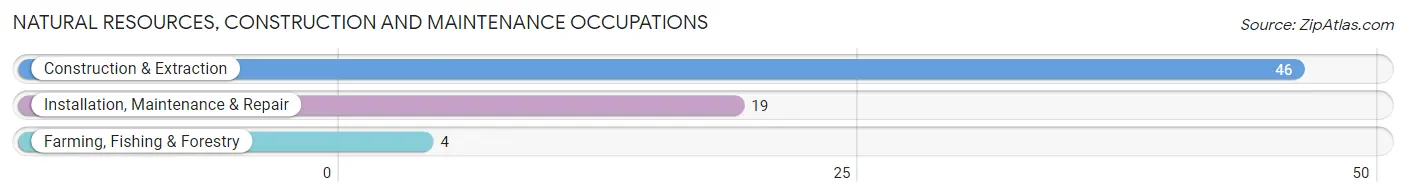
The most common Natural Resources, Construction and Maintenance occupations in Steele are Construction & Extraction (46 | 8.8%), Installation, Maintenance & Repair (19 | 3.6%), and Farming, Fishing & Forestry (4 | 0.8%).
Natural Resources, Construction and Maintenance Occupations by Sex
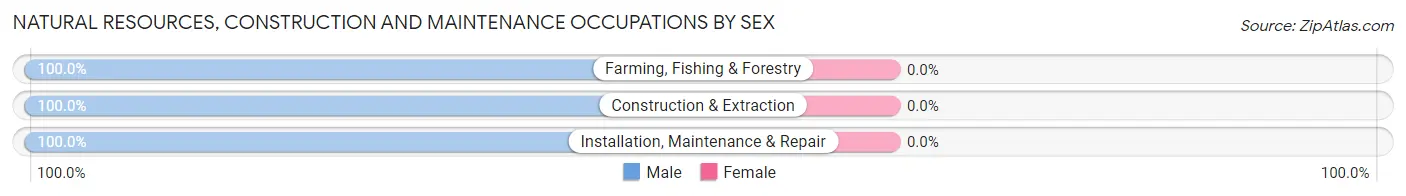
| Occupation | Male | Female |
| Farming, Fishing & Forestry | 4 (100.0%) | 0 (0.0%) |
| Construction & Extraction | 46 (100.0%) | 0 (0.0%) |
| Installation, Maintenance & Repair | 19 (100.0%) | 0 (0.0%) |
| Total (Category) | 69 (100.0%) | 0 (0.0%) |
| Total (Overall) | 289 (55.3%) | 234 (44.7%) |
Production, Transportation and Moving Occupations
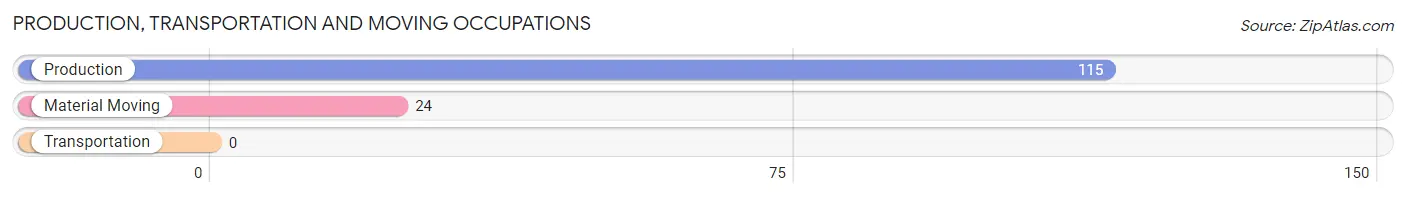
The most common Production, Transportation and Moving occupations in Steele are Production (115 | 22.0%), and Material Moving (24 | 4.6%).
Production, Transportation and Moving Occupations by Sex
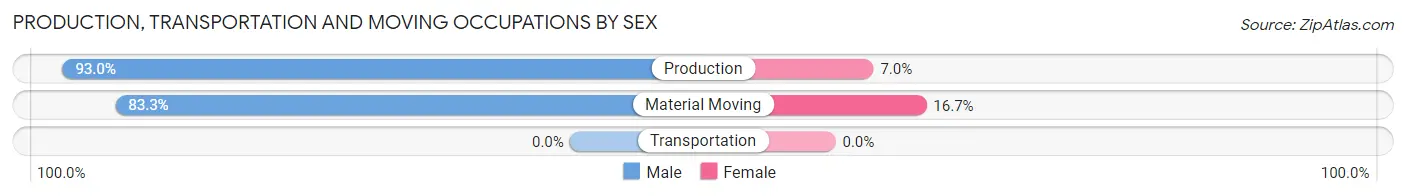
| Occupation | Male | Female |
| Production | 107 (93.0%) | 8 (7.0%) |
| Transportation | 0 (0.0%) | 0 (0.0%) |
| Material Moving | 20 (83.3%) | 4 (16.7%) |
| Total (Category) | 127 (91.4%) | 12 (8.6%) |
| Total (Overall) | 289 (55.3%) | 234 (44.7%) |
Employment Industries by Sex in Steele
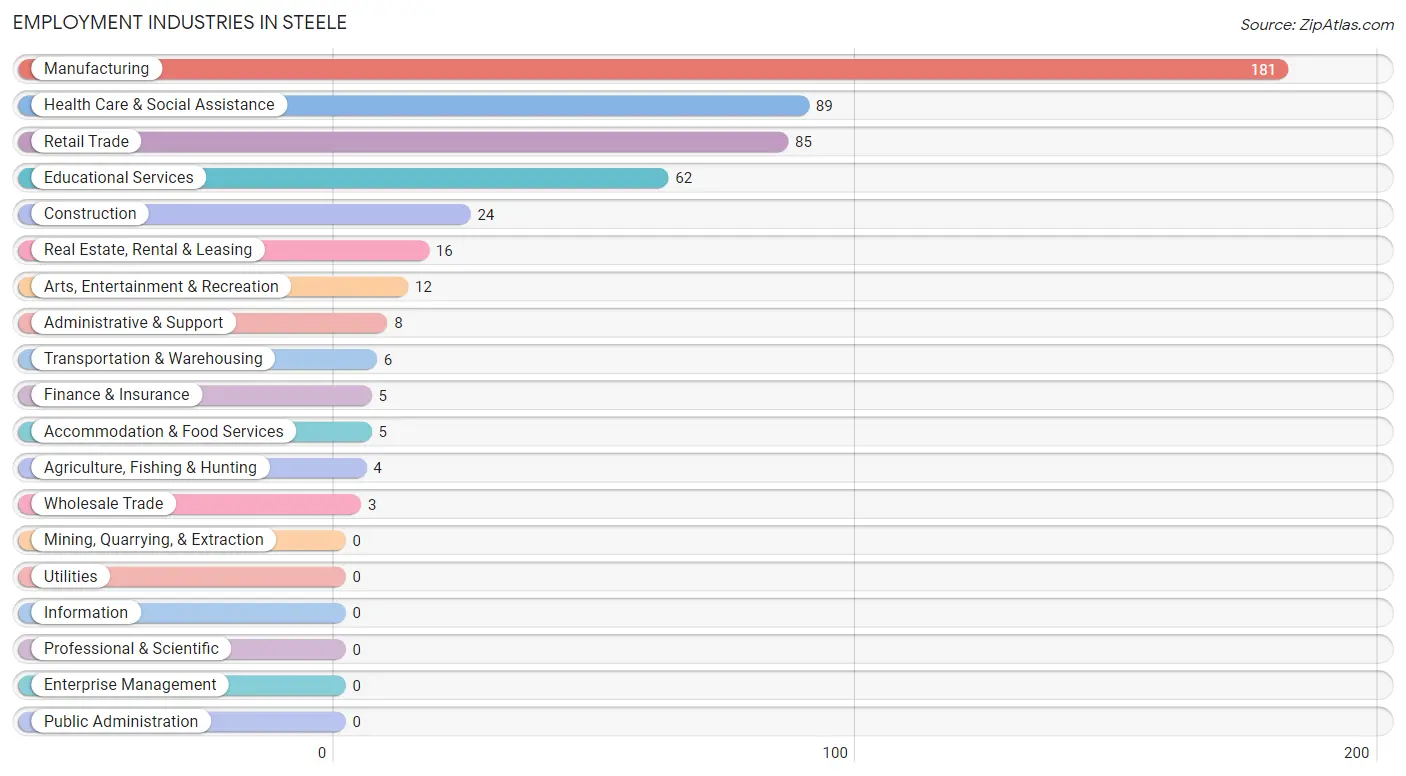
Employment Industries in Steele
The major employment industries in Steele include Manufacturing (181 | 34.6%), Health Care & Social Assistance (89 | 17.0%), Retail Trade (85 | 16.3%), Educational Services (62 | 11.8%), and Construction (24 | 4.6%).
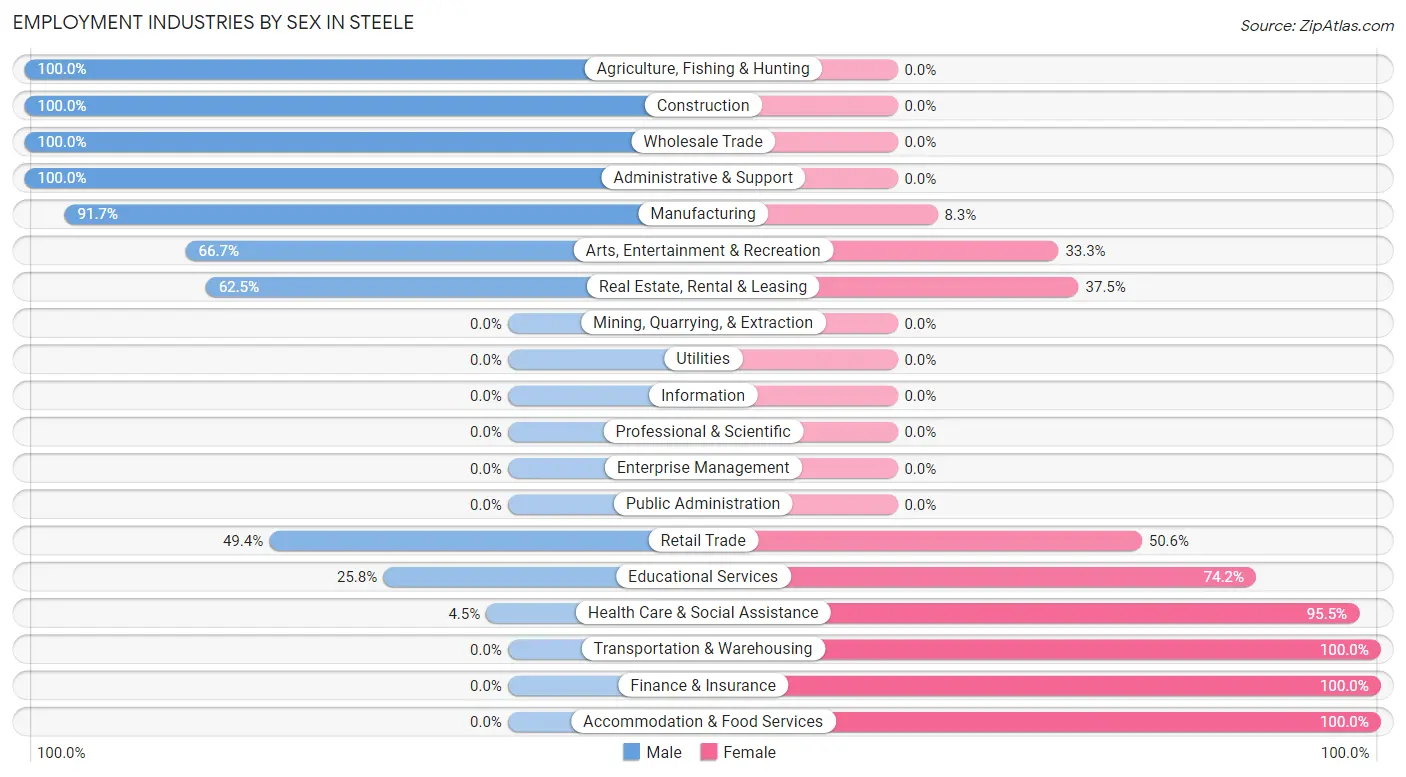
Employment Industries by Sex in Steele
The Steele industries that see more men than women are Agriculture, Fishing & Hunting (100.0%), Construction (100.0%), and Wholesale Trade (100.0%), whereas the industries that tend to have a higher number of women are Transportation & Warehousing (100.0%), Finance & Insurance (100.0%), and Accommodation & Food Services (100.0%).
| Industry | Male | Female |
| Agriculture, Fishing & Hunting | 4 (100.0%) | 0 (0.0%) |
| Mining, Quarrying, & Extraction | 0 (0.0%) | 0 (0.0%) |
| Construction | 24 (100.0%) | 0 (0.0%) |
| Manufacturing | 166 (91.7%) | 15 (8.3%) |
| Wholesale Trade | 3 (100.0%) | 0 (0.0%) |
| Retail Trade | 42 (49.4%) | 43 (50.6%) |
| Transportation & Warehousing | 0 (0.0%) | 6 (100.0%) |
| Utilities | 0 (0.0%) | 0 (0.0%) |
| Information | 0 (0.0%) | 0 (0.0%) |
| Finance & Insurance | 0 (0.0%) | 5 (100.0%) |
| Real Estate, Rental & Leasing | 10 (62.5%) | 6 (37.5%) |
| Professional & Scientific | 0 (0.0%) | 0 (0.0%) |
| Enterprise Management | 0 (0.0%) | 0 (0.0%) |
| Administrative & Support | 8 (100.0%) | 0 (0.0%) |
| Educational Services | 16 (25.8%) | 46 (74.2%) |
| Health Care & Social Assistance | 4 (4.5%) | 85 (95.5%) |
| Arts, Entertainment & Recreation | 8 (66.7%) | 4 (33.3%) |
| Accommodation & Food Services | 0 (0.0%) | 5 (100.0%) |
| Public Administration | 0 (0.0%) | 0 (0.0%) |
| Total | 289 (55.3%) | 234 (44.7%) |
Education in Steele
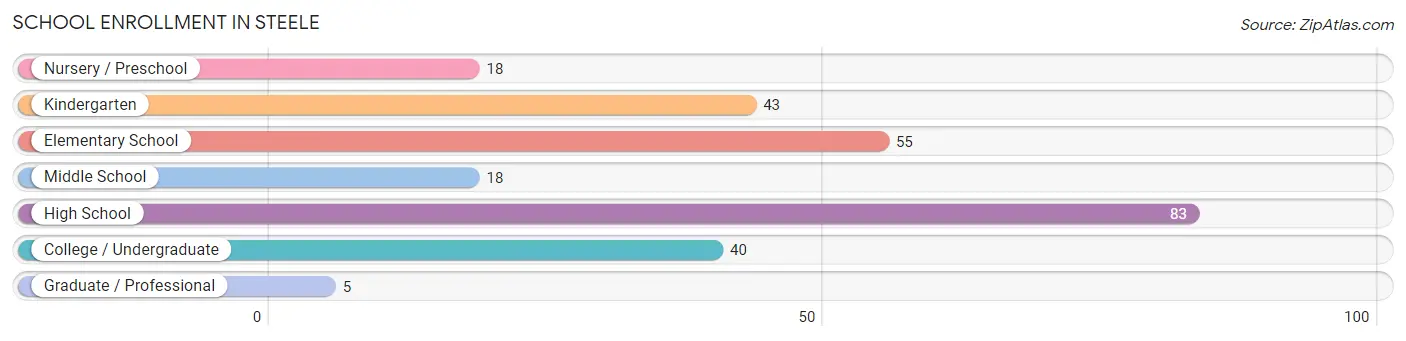
School Enrollment in Steele
The most common levels of schooling among the 262 students in Steele are high school (83 | 31.7%), elementary school (55 | 21.0%), and kindergarten (43 | 16.4%).
| School Level | # Students | % Students |
| Nursery / Preschool | 18 | 6.9% |
| Kindergarten | 43 | 16.4% |
| Elementary School | 55 | 21.0% |
| Middle School | 18 | 6.9% |
| High School | 83 | 31.7% |
| College / Undergraduate | 40 | 15.3% |
| Graduate / Professional | 5 | 1.9% |
| Total | 262 | 100.0% |
School Enrollment by Age by Funding Source in Steele
Out of a total of 262 students who are enrolled in schools in Steele, 12 (4.6%) attend a private institution, while the remaining 250 (95.4%) are enrolled in public schools. The age group of 10 to 14 year olds has the highest likelihood of being enrolled in private schools, with 8 (32.0% in the age bracket) enrolled. Conversely, the age group of 3 to 4 year olds has the lowest likelihood of being enrolled in a private school, with 47 (100.0% in the age bracket) attending a public institution.
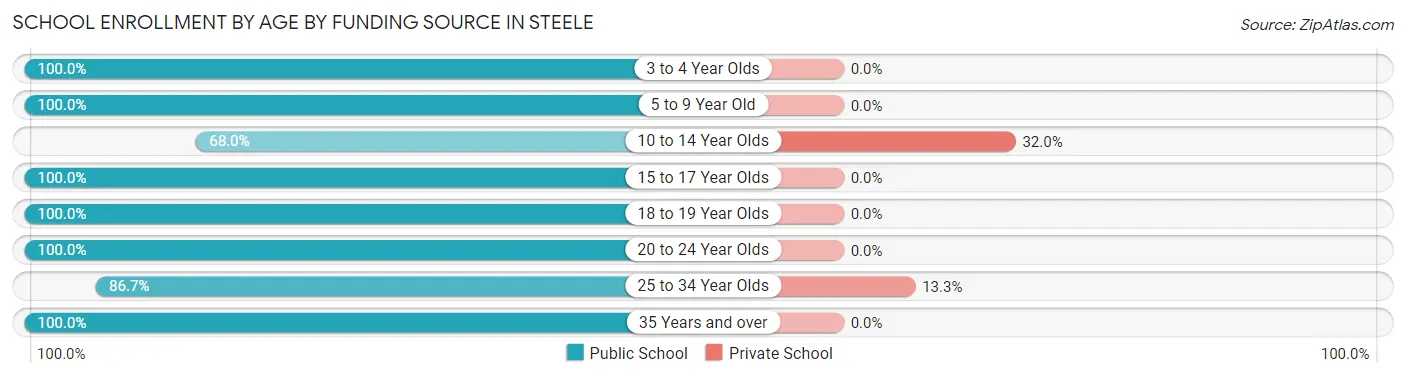
| Age Bracket | Public School | Private School |
| 3 to 4 Year Olds | 47 (100.0%) | 0 (0.0%) |
| 5 to 9 Year Old | 69 (100.0%) | 0 (0.0%) |
| 10 to 14 Year Olds | 17 (68.0%) | 8 (32.0%) |
| 15 to 17 Year Olds | 60 (100.0%) | 0 (0.0%) |
| 18 to 19 Year Olds | 16 (100.0%) | 0 (0.0%) |
| 20 to 24 Year Olds | 12 (100.0%) | 0 (0.0%) |
| 25 to 34 Year Olds | 26 (86.7%) | 4 (13.3%) |
| 35 Years and over | 3 (100.0%) | 0 (0.0%) |
| Total | 250 (95.4%) | 12 (4.6%) |
Educational Attainment by Field of Study in Steele
Education (61 | 57.6%), psychology (14 | 13.2%), engineering (10 | 9.4%), business (6 | 5.7%), and communications (5 | 4.7%) are the most common fields of study among 106 individuals in Steele who have obtained a bachelor's degree or higher.
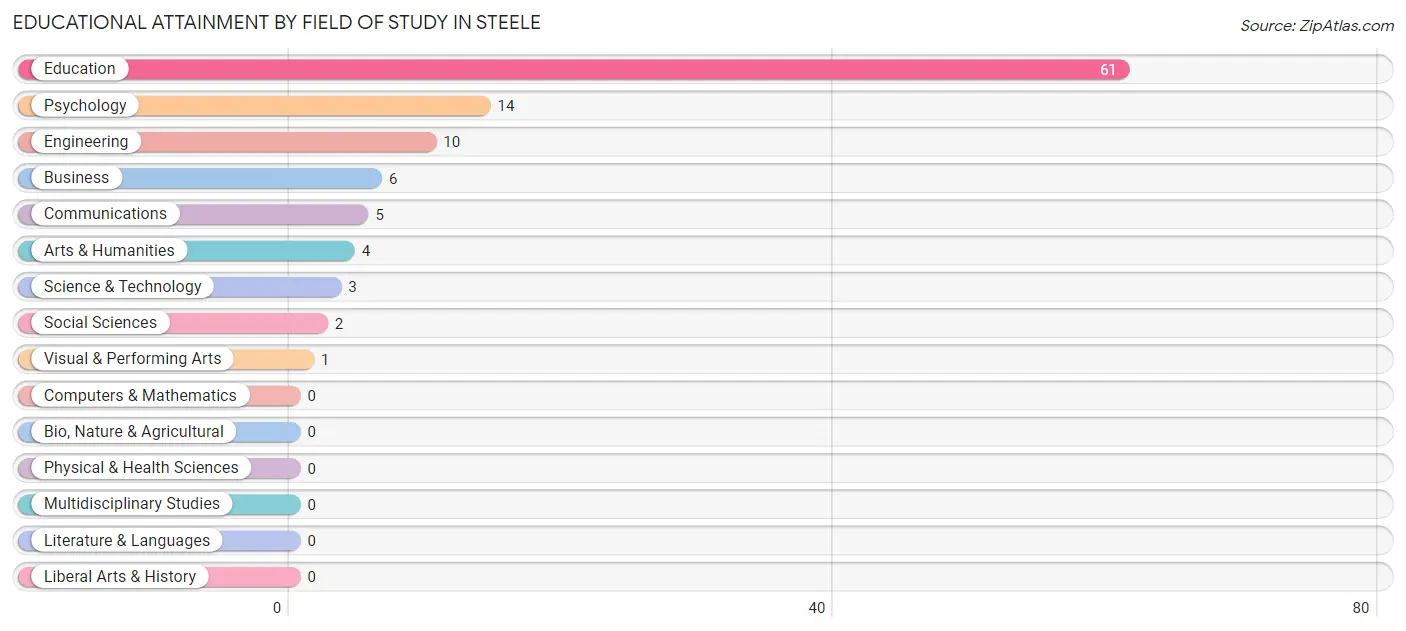
| Field of Study | # Graduates | % Graduates |
| Computers & Mathematics | 0 | 0.0% |
| Bio, Nature & Agricultural | 0 | 0.0% |
| Physical & Health Sciences | 0 | 0.0% |
| Psychology | 14 | 13.2% |
| Social Sciences | 2 | 1.9% |
| Engineering | 10 | 9.4% |
| Multidisciplinary Studies | 0 | 0.0% |
| Science & Technology | 3 | 2.8% |
| Business | 6 | 5.7% |
| Education | 61 | 57.6% |
| Literature & Languages | 0 | 0.0% |
| Liberal Arts & History | 0 | 0.0% |
| Visual & Performing Arts | 1 | 0.9% |
| Communications | 5 | 4.7% |
| Arts & Humanities | 4 | 3.8% |
| Total | 106 | 100.0% |
Transportation & Commute in Steele
Vehicle Availability by Sex in Steele
The most prevalent vehicle ownership categories in Steele are males with 2 vehicles (134, accounting for 46.4%) and females with 2 vehicles (121, making up 57.3%).
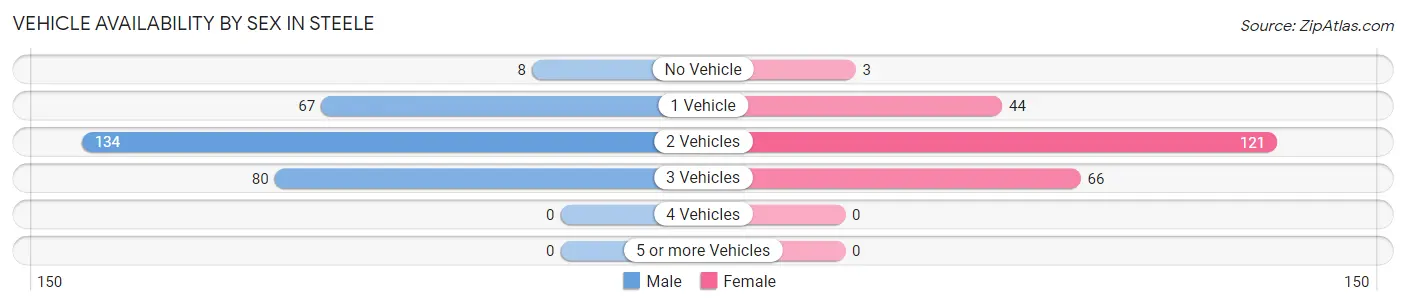
| Vehicles Available | Male | Female |
| No Vehicle | 8 (2.8%) | 3 (1.3%) |
| 1 Vehicle | 67 (23.2%) | 44 (18.8%) |
| 2 Vehicles | 134 (46.4%) | 121 (51.7%) |
| 3 Vehicles | 80 (27.7%) | 66 (28.2%) |
| 4 Vehicles | 0 (0.0%) | 0 (0.0%) |
| 5 or more Vehicles | 0 (0.0%) | 0 (0.0%) |
| Total | 289 (100.0%) | 234 (100.0%) |
Commute Time in Steele
The most frequently occuring commute durations in Steele are 20 to 24 minutes (207 commuters, 42.2%), 15 to 19 minutes (77 commuters, 15.7%), and less than 5 minutes (62 commuters, 12.7%).
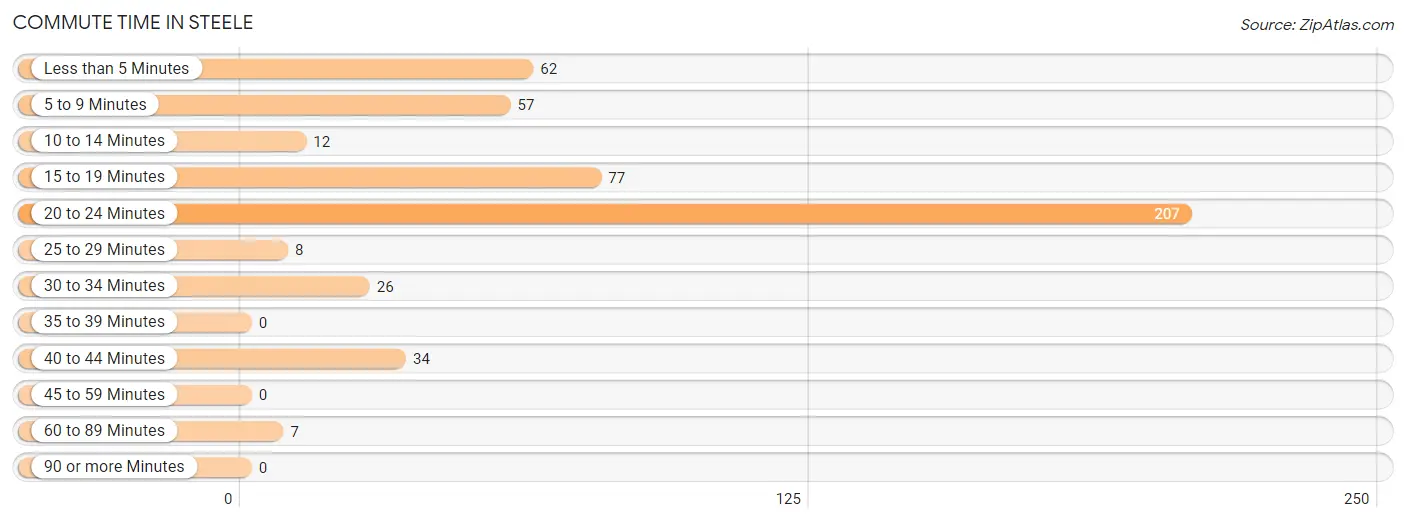
| Commute Time | # Commuters | % Commuters |
| Less than 5 Minutes | 62 | 12.7% |
| 5 to 9 Minutes | 57 | 11.6% |
| 10 to 14 Minutes | 12 | 2.5% |
| 15 to 19 Minutes | 77 | 15.7% |
| 20 to 24 Minutes | 207 | 42.2% |
| 25 to 29 Minutes | 8 | 1.6% |
| 30 to 34 Minutes | 26 | 5.3% |
| 35 to 39 Minutes | 0 | 0.0% |
| 40 to 44 Minutes | 34 | 6.9% |
| 45 to 59 Minutes | 0 | 0.0% |
| 60 to 89 Minutes | 7 | 1.4% |
| 90 or more Minutes | 0 | 0.0% |
Commute Time by Sex in Steele
The most common commute times in Steele are 20 to 24 minutes (150 commuters, 53.0%) for males and 20 to 24 minutes (57 commuters, 27.5%) for females.
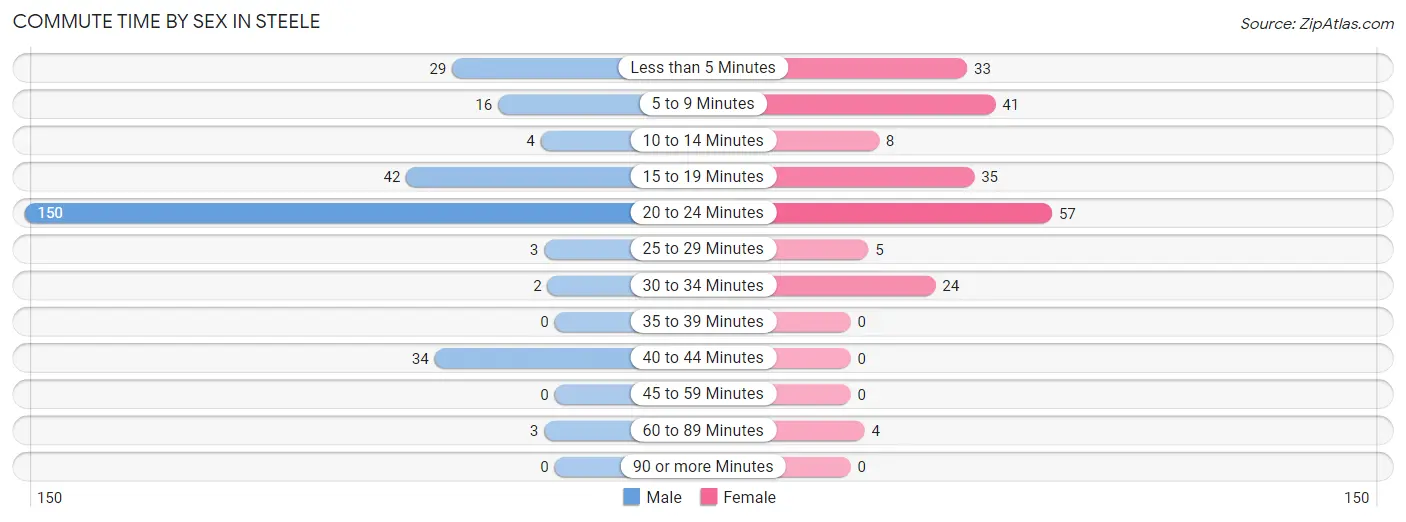
| Commute Time | Male | Female |
| Less than 5 Minutes | 29 (10.2%) | 33 (15.9%) |
| 5 to 9 Minutes | 16 (5.7%) | 41 (19.8%) |
| 10 to 14 Minutes | 4 (1.4%) | 8 (3.9%) |
| 15 to 19 Minutes | 42 (14.8%) | 35 (16.9%) |
| 20 to 24 Minutes | 150 (53.0%) | 57 (27.5%) |
| 25 to 29 Minutes | 3 (1.1%) | 5 (2.4%) |
| 30 to 34 Minutes | 2 (0.7%) | 24 (11.6%) |
| 35 to 39 Minutes | 0 (0.0%) | 0 (0.0%) |
| 40 to 44 Minutes | 34 (12.0%) | 0 (0.0%) |
| 45 to 59 Minutes | 0 (0.0%) | 0 (0.0%) |
| 60 to 89 Minutes | 3 (1.1%) | 4 (1.9%) |
| 90 or more Minutes | 0 (0.0%) | 0 (0.0%) |
Time of Departure to Work by Sex in Steele
The most frequent times of departure to work in Steele are 4:00 PM to 11:59 PM (55, 19.4%) for males and 7:00 AM to 7:29 AM (51, 24.6%) for females.
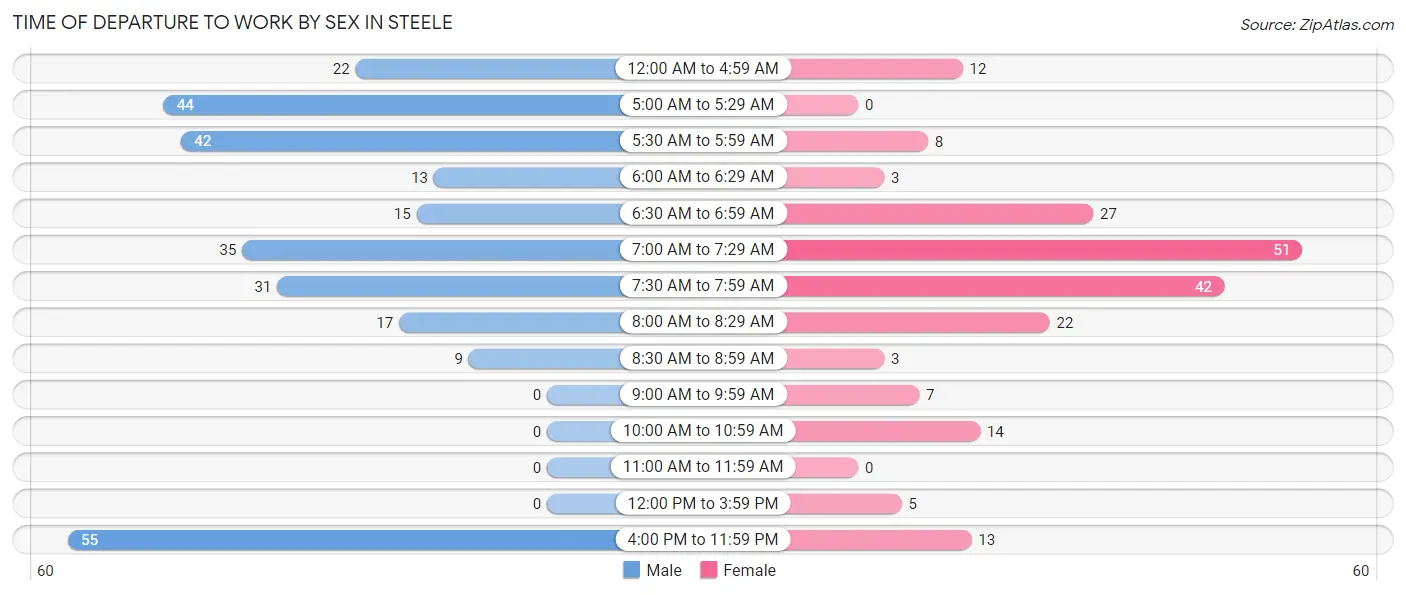
| Time of Departure | Male | Female |
| 12:00 AM to 4:59 AM | 22 (7.8%) | 12 (5.8%) |
| 5:00 AM to 5:29 AM | 44 (15.5%) | 0 (0.0%) |
| 5:30 AM to 5:59 AM | 42 (14.8%) | 8 (3.9%) |
| 6:00 AM to 6:29 AM | 13 (4.6%) | 3 (1.5%) |
| 6:30 AM to 6:59 AM | 15 (5.3%) | 27 (13.0%) |
| 7:00 AM to 7:29 AM | 35 (12.4%) | 51 (24.6%) |
| 7:30 AM to 7:59 AM | 31 (11.0%) | 42 (20.3%) |
| 8:00 AM to 8:29 AM | 17 (6.0%) | 22 (10.6%) |
| 8:30 AM to 8:59 AM | 9 (3.2%) | 3 (1.5%) |
| 9:00 AM to 9:59 AM | 0 (0.0%) | 7 (3.4%) |
| 10:00 AM to 10:59 AM | 0 (0.0%) | 14 (6.8%) |
| 11:00 AM to 11:59 AM | 0 (0.0%) | 0 (0.0%) |
| 12:00 PM to 3:59 PM | 0 (0.0%) | 5 (2.4%) |
| 4:00 PM to 11:59 PM | 55 (19.4%) | 13 (6.3%) |
| Total | 283 (100.0%) | 207 (100.0%) |
Housing Occupancy in Steele
Occupancy by Ownership in Steele
Of the total 577 dwellings in Steele, owner-occupied units account for 299 (51.8%), while renter-occupied units make up 278 (48.2%).
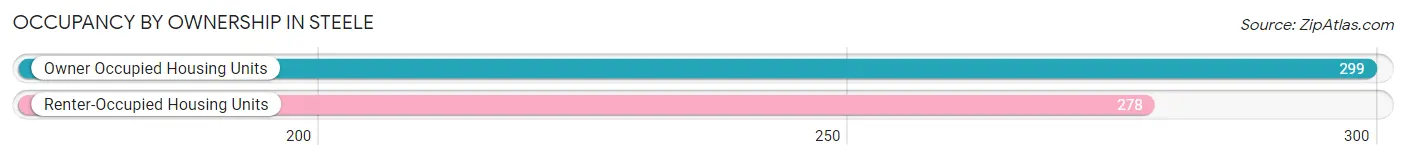
| Occupancy | # Housing Units | % Housing Units |
| Owner Occupied Housing Units | 299 | 51.8% |
| Renter-Occupied Housing Units | 278 | 48.2% |
| Total Occupied Housing Units | 577 | 100.0% |
Occupancy by Household Size in Steele
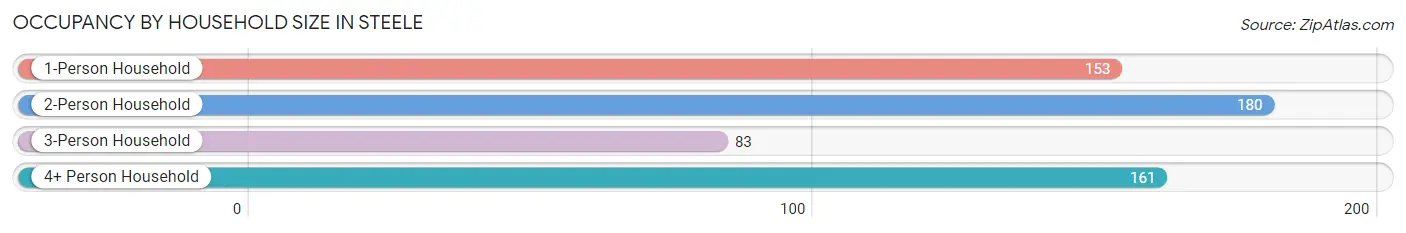
| Household Size | # Housing Units | % Housing Units |
| 1-Person Household | 153 | 26.5% |
| 2-Person Household | 180 | 31.2% |
| 3-Person Household | 83 | 14.4% |
| 4+ Person Household | 161 | 27.9% |
| Total Housing Units | 577 | 100.0% |
Occupancy by Ownership by Household Size in Steele
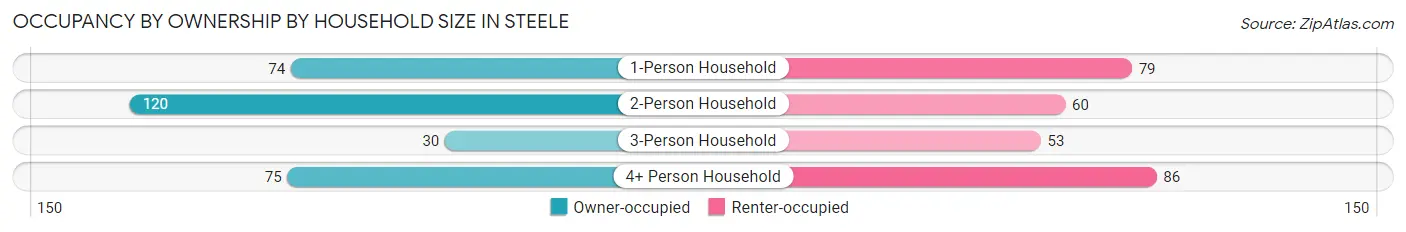
| Household Size | Owner-occupied | Renter-occupied |
| 1-Person Household | 74 (48.4%) | 79 (51.6%) |
| 2-Person Household | 120 (66.7%) | 60 (33.3%) |
| 3-Person Household | 30 (36.1%) | 53 (63.9%) |
| 4+ Person Household | 75 (46.6%) | 86 (53.4%) |
| Total Housing Units | 299 (51.8%) | 278 (48.2%) |
Occupancy by Educational Attainment in Steele
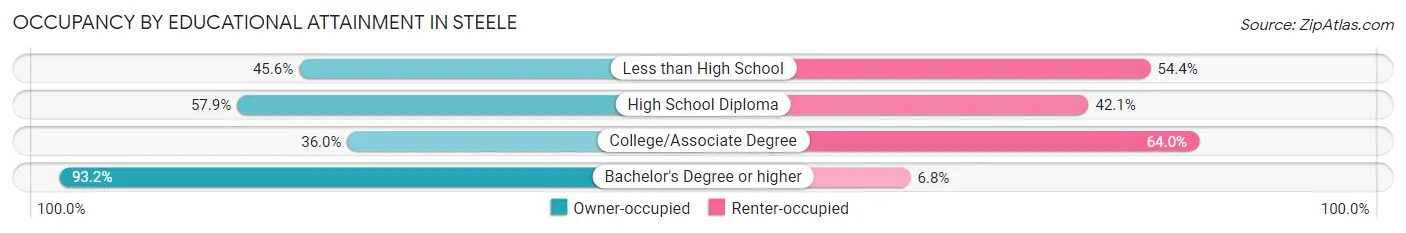
| Household Size | Owner-occupied | Renter-occupied |
| Less than High School | 57 (45.6%) | 68 (54.4%) |
| High School Diploma | 143 (57.9%) | 104 (42.1%) |
| College/Associate Degree | 58 (36.0%) | 103 (64.0%) |
| Bachelor's Degree or higher | 41 (93.2%) | 3 (6.8%) |
Occupancy by Age of Householder in Steele
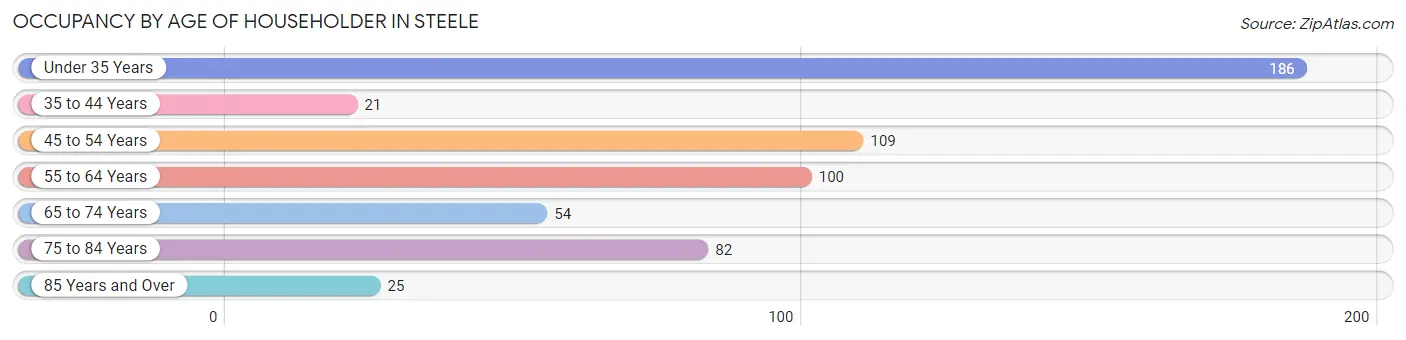
| Age Bracket | # Households | % Households |
| Under 35 Years | 186 | 32.2% |
| 35 to 44 Years | 21 | 3.6% |
| 45 to 54 Years | 109 | 18.9% |
| 55 to 64 Years | 100 | 17.3% |
| 65 to 74 Years | 54 | 9.4% |
| 75 to 84 Years | 82 | 14.2% |
| 85 Years and Over | 25 | 4.3% |
| Total | 577 | 100.0% |
Housing Finances in Steele
Median Income by Occupancy in Steele
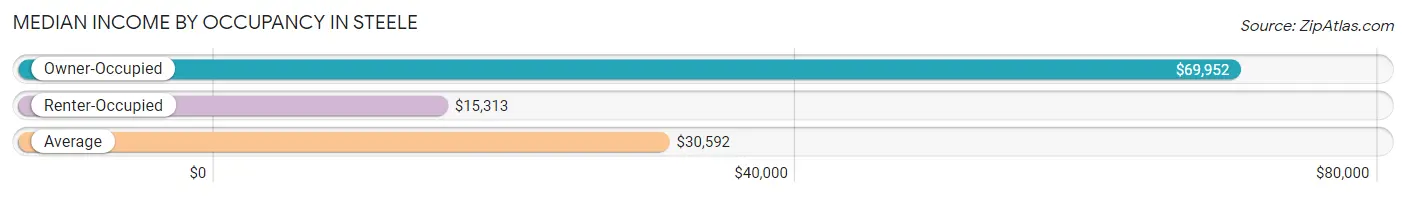
| Occupancy Type | # Households | Median Income |
| Owner-Occupied | 299 (51.8%) | $69,952 |
| Renter-Occupied | 278 (48.2%) | $15,313 |
| Average | 577 (100.0%) | $30,592 |
Occupancy by Householder Income Bracket in Steele
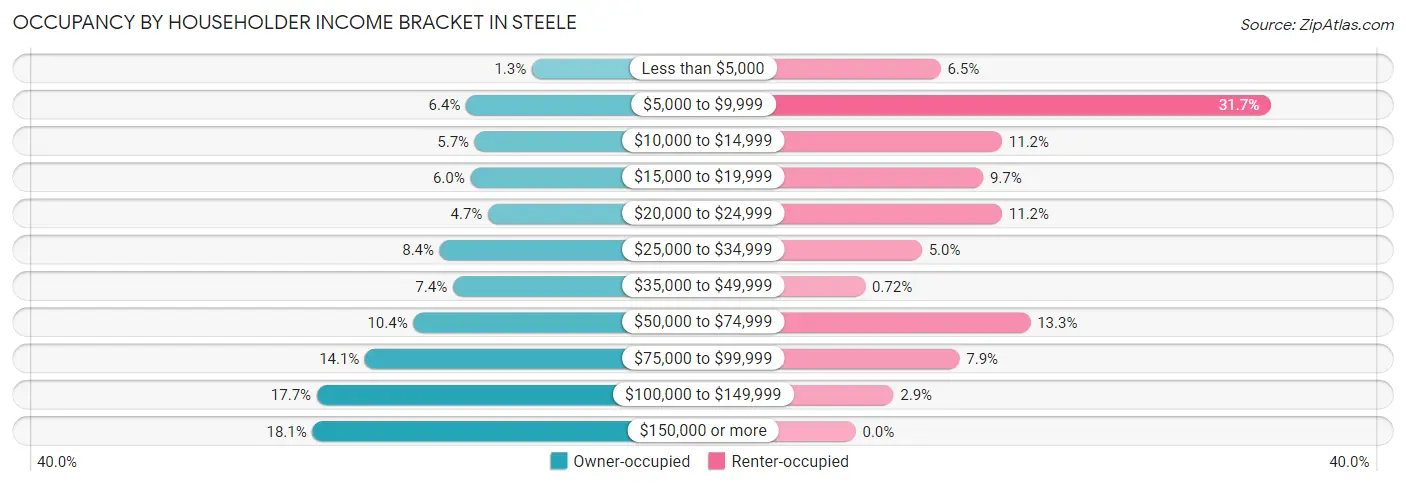
| Income Bracket | Owner-occupied | Renter-occupied |
| Less than $5,000 | 4 (1.3%) | 18 (6.5%) |
| $5,000 to $9,999 | 19 (6.4%) | 88 (31.7%) |
| $10,000 to $14,999 | 17 (5.7%) | 31 (11.2%) |
| $15,000 to $19,999 | 18 (6.0%) | 27 (9.7%) |
| $20,000 to $24,999 | 14 (4.7%) | 31 (11.2%) |
| $25,000 to $34,999 | 25 (8.4%) | 14 (5.0%) |
| $35,000 to $49,999 | 22 (7.4%) | 2 (0.7%) |
| $50,000 to $74,999 | 31 (10.4%) | 37 (13.3%) |
| $75,000 to $99,999 | 42 (14.1%) | 22 (7.9%) |
| $100,000 to $149,999 | 53 (17.7%) | 8 (2.9%) |
| $150,000 or more | 54 (18.1%) | 0 (0.0%) |
| Total | 299 (100.0%) | 278 (100.0%) |
Monthly Housing Cost Tiers in Steele
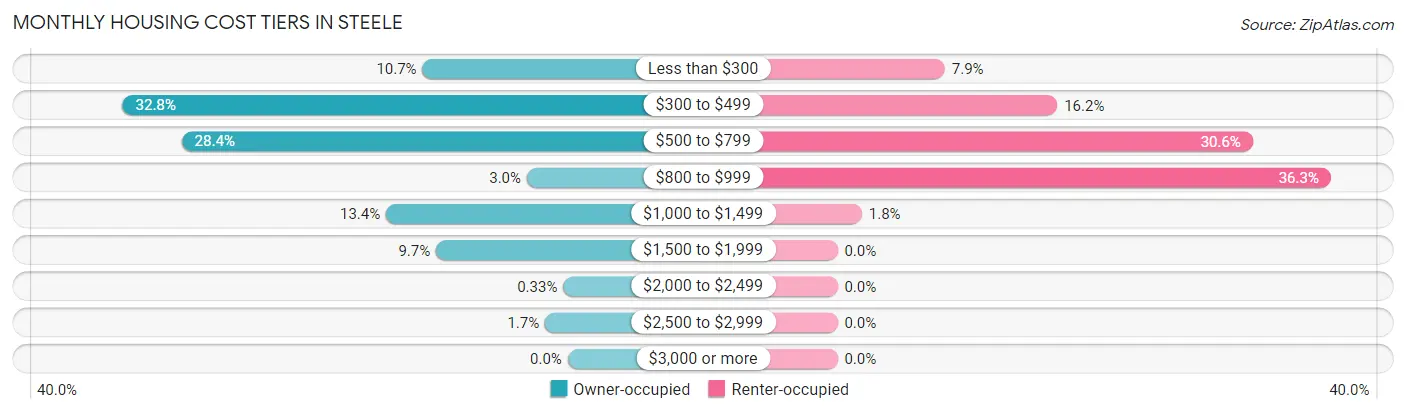
| Monthly Cost | Owner-occupied | Renter-occupied |
| Less than $300 | 32 (10.7%) | 22 (7.9%) |
| $300 to $499 | 98 (32.8%) | 45 (16.2%) |
| $500 to $799 | 85 (28.4%) | 85 (30.6%) |
| $800 to $999 | 9 (3.0%) | 101 (36.3%) |
| $1,000 to $1,499 | 40 (13.4%) | 5 (1.8%) |
| $1,500 to $1,999 | 29 (9.7%) | 0 (0.0%) |
| $2,000 to $2,499 | 1 (0.3%) | 0 (0.0%) |
| $2,500 to $2,999 | 5 (1.7%) | 0 (0.0%) |
| $3,000 or more | 0 (0.0%) | 0 (0.0%) |
| Total | 299 (100.0%) | 278 (100.0%) |
Physical Housing Characteristics in Steele
Housing Structures in Steele
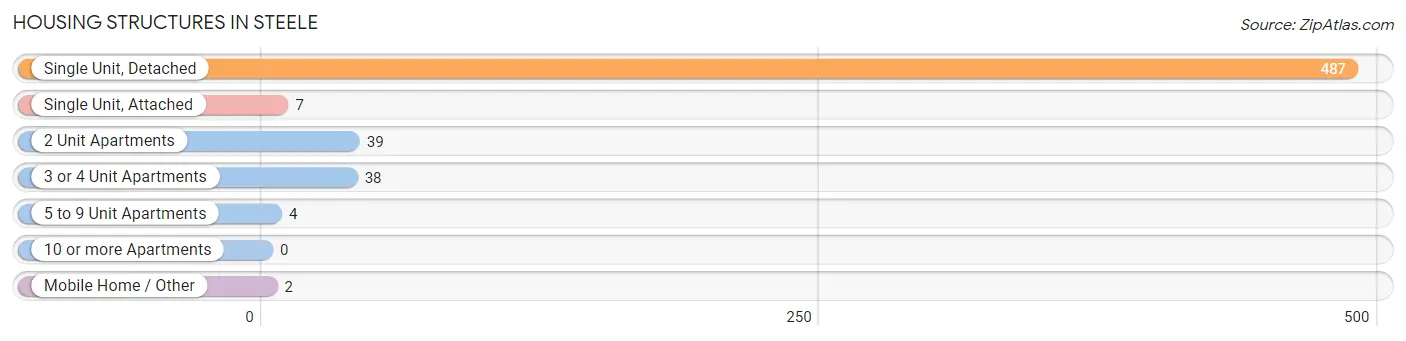
| Structure Type | # Housing Units | % Housing Units |
| Single Unit, Detached | 487 | 84.4% |
| Single Unit, Attached | 7 | 1.2% |
| 2 Unit Apartments | 39 | 6.8% |
| 3 or 4 Unit Apartments | 38 | 6.6% |
| 5 to 9 Unit Apartments | 4 | 0.7% |
| 10 or more Apartments | 0 | 0.0% |
| Mobile Home / Other | 2 | 0.4% |
| Total | 577 | 100.0% |
Housing Structures by Occupancy in Steele
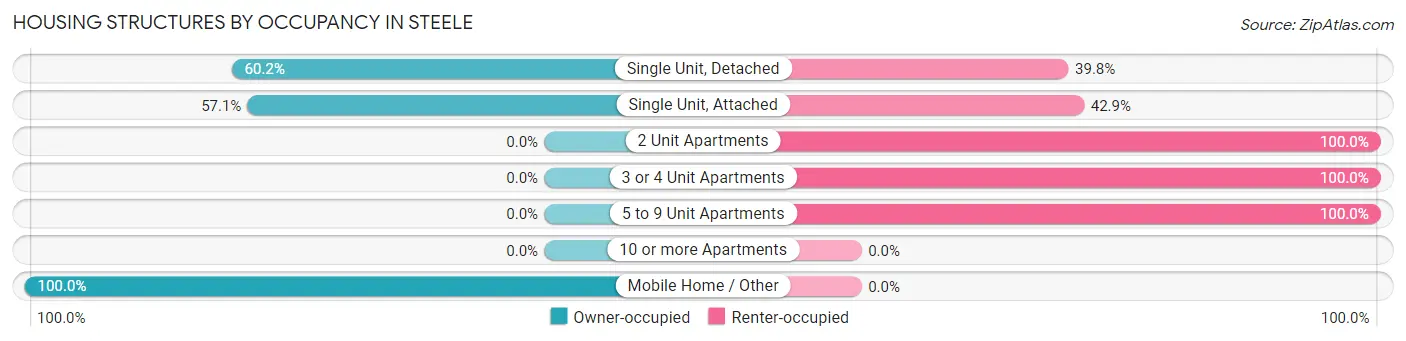
| Structure Type | Owner-occupied | Renter-occupied |
| Single Unit, Detached | 293 (60.2%) | 194 (39.8%) |
| Single Unit, Attached | 4 (57.1%) | 3 (42.9%) |
| 2 Unit Apartments | 0 (0.0%) | 39 (100.0%) |
| 3 or 4 Unit Apartments | 0 (0.0%) | 38 (100.0%) |
| 5 to 9 Unit Apartments | 0 (0.0%) | 4 (100.0%) |
| 10 or more Apartments | 0 (0.0%) | 0 (0.0%) |
| Mobile Home / Other | 2 (100.0%) | 0 (0.0%) |
| Total | 299 (51.8%) | 278 (48.2%) |
Housing Structures by Number of Rooms in Steele
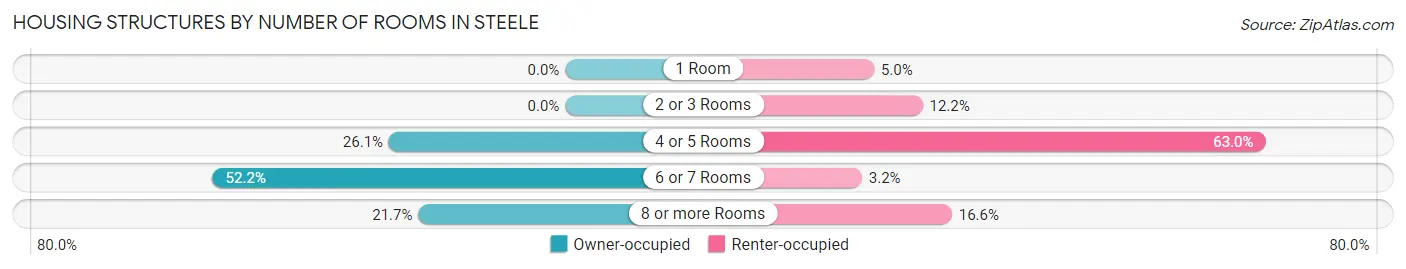
| Number of Rooms | Owner-occupied | Renter-occupied |
| 1 Room | 0 (0.0%) | 14 (5.0%) |
| 2 or 3 Rooms | 0 (0.0%) | 34 (12.2%) |
| 4 or 5 Rooms | 78 (26.1%) | 175 (62.9%) |
| 6 or 7 Rooms | 156 (52.2%) | 9 (3.2%) |
| 8 or more Rooms | 65 (21.7%) | 46 (16.6%) |
| Total | 299 (100.0%) | 278 (100.0%) |
Housing Structure by Heating Type in Steele
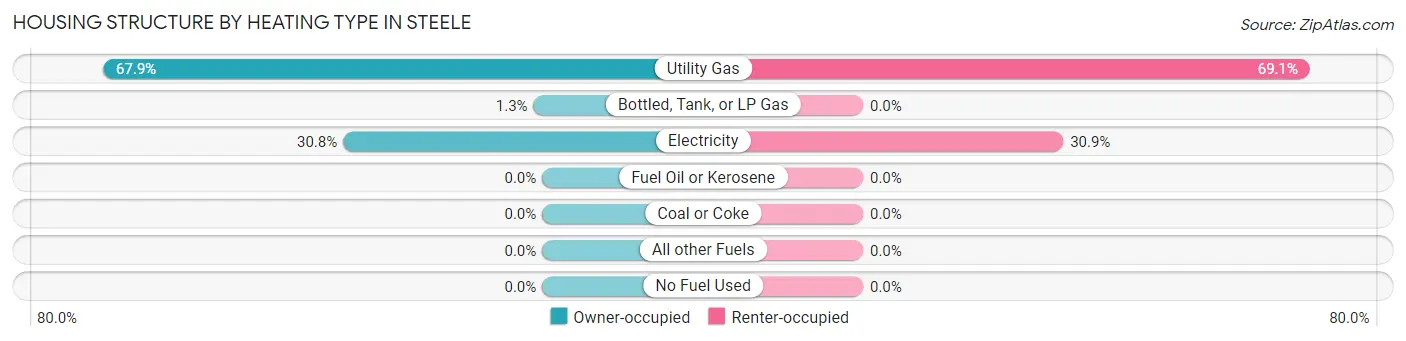
| Heating Type | Owner-occupied | Renter-occupied |
| Utility Gas | 203 (67.9%) | 192 (69.1%) |
| Bottled, Tank, or LP Gas | 4 (1.3%) | 0 (0.0%) |
| Electricity | 92 (30.8%) | 86 (30.9%) |
| Fuel Oil or Kerosene | 0 (0.0%) | 0 (0.0%) |
| Coal or Coke | 0 (0.0%) | 0 (0.0%) |
| All other Fuels | 0 (0.0%) | 0 (0.0%) |
| No Fuel Used | 0 (0.0%) | 0 (0.0%) |
| Total | 299 (100.0%) | 278 (100.0%) |
Household Vehicle Usage in Steele
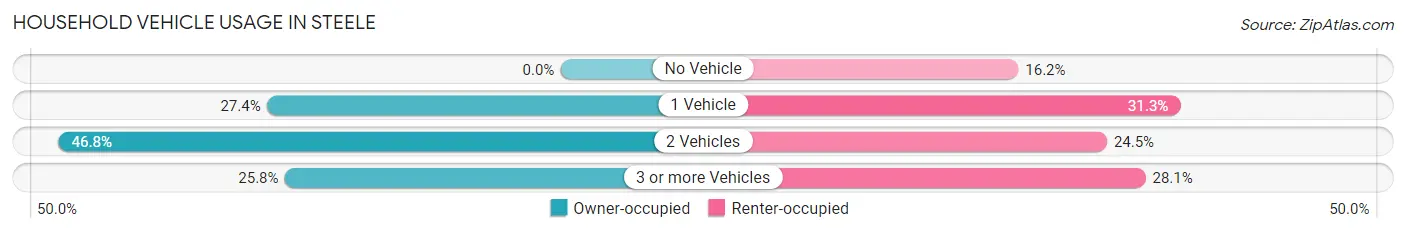
| Vehicles per Household | Owner-occupied | Renter-occupied |
| No Vehicle | 0 (0.0%) | 45 (16.2%) |
| 1 Vehicle | 82 (27.4%) | 87 (31.3%) |
| 2 Vehicles | 140 (46.8%) | 68 (24.5%) |
| 3 or more Vehicles | 77 (25.8%) | 78 (28.1%) |
| Total | 299 (100.0%) | 278 (100.0%) |
Real Estate & Mortgages in Steele
Real Estate and Mortgage Overview in Steele
| Characteristic | Without Mortgage | With Mortgage |
| Housing Units | 167 | 132 |
| Median Property Value | $80,800 | $118,800 |
| Median Household Income | $49,219 | $33 |
| Monthly Housing Costs | $393 | $0 |
| Real Estate Taxes | $633 | $0 |
Property Value by Mortgage Status in Steele
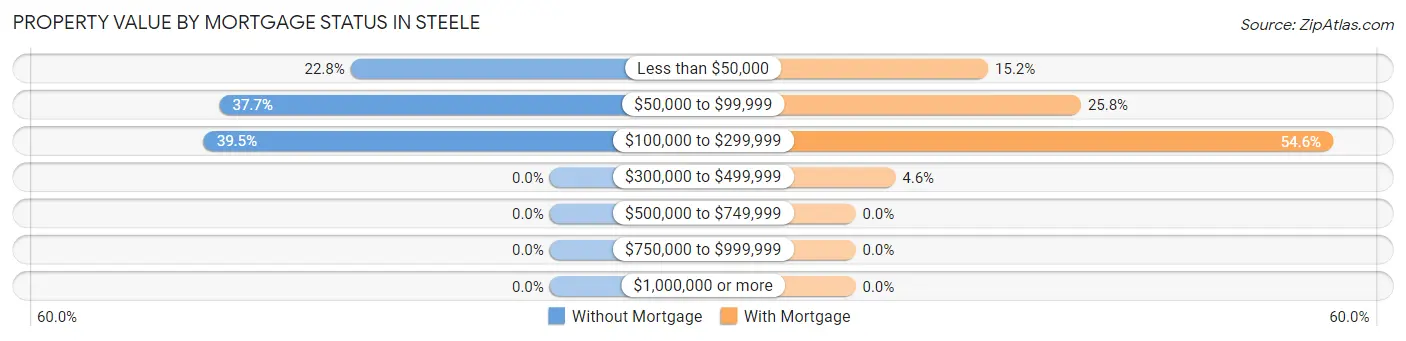
| Property Value | Without Mortgage | With Mortgage |
| Less than $50,000 | 38 (22.8%) | 20 (15.1%) |
| $50,000 to $99,999 | 63 (37.7%) | 34 (25.8%) |
| $100,000 to $299,999 | 66 (39.5%) | 72 (54.5%) |
| $300,000 to $499,999 | 0 (0.0%) | 6 (4.5%) |
| $500,000 to $749,999 | 0 (0.0%) | 0 (0.0%) |
| $750,000 to $999,999 | 0 (0.0%) | 0 (0.0%) |
| $1,000,000 or more | 0 (0.0%) | 0 (0.0%) |
| Total | 167 (100.0%) | 132 (100.0%) |
Household Income by Mortgage Status in Steele
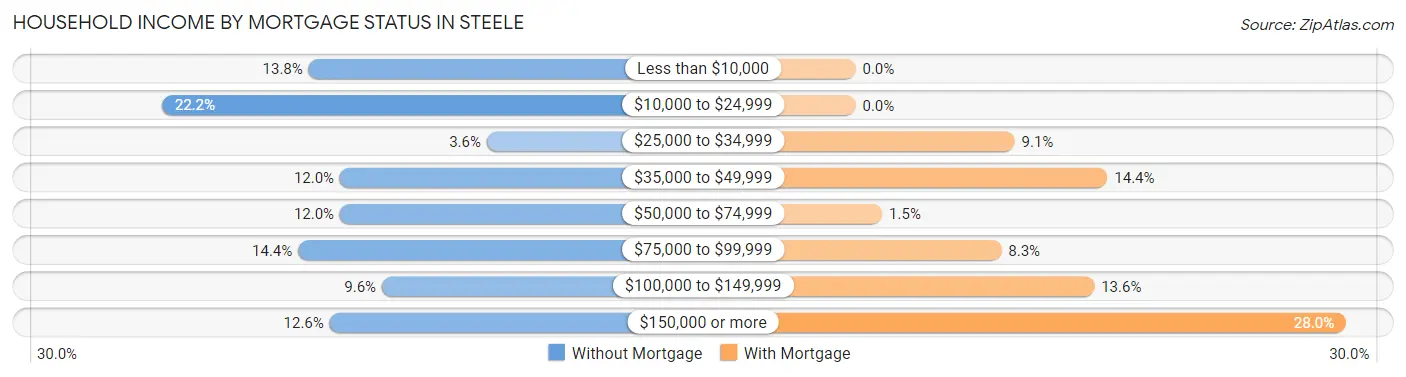
| Household Income | Without Mortgage | With Mortgage |
| Less than $10,000 | 23 (13.8%) | 0 (0.0%) |
| $10,000 to $24,999 | 37 (22.2%) | 0 (0.0%) |
| $25,000 to $34,999 | 6 (3.6%) | 12 (9.1%) |
| $35,000 to $49,999 | 20 (12.0%) | 19 (14.4%) |
| $50,000 to $74,999 | 20 (12.0%) | 2 (1.5%) |
| $75,000 to $99,999 | 24 (14.4%) | 11 (8.3%) |
| $100,000 to $149,999 | 16 (9.6%) | 18 (13.6%) |
| $150,000 or more | 21 (12.6%) | 37 (28.0%) |
| Total | 167 (100.0%) | 132 (100.0%) |
Property Value to Household Income Ratio in Steele
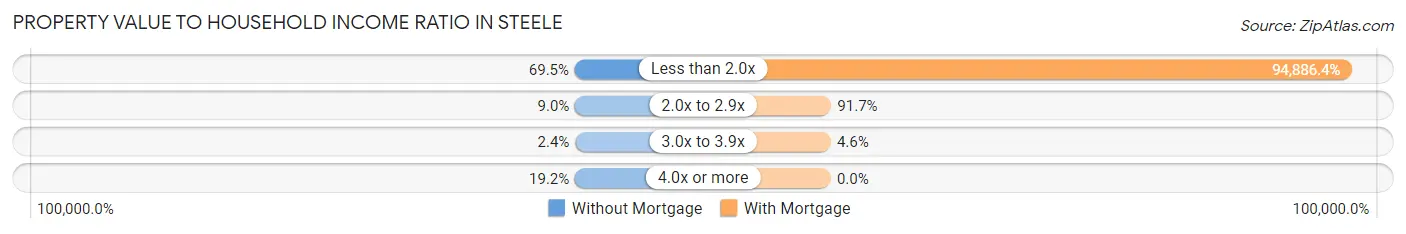
| Value-to-Income Ratio | Without Mortgage | With Mortgage |
| Less than 2.0x | 116 (69.5%) | 125,250 (94,886.4%) |
| 2.0x to 2.9x | 15 (9.0%) | 121 (91.7%) |
| 3.0x to 3.9x | 4 (2.4%) | 6 (4.5%) |
| 4.0x or more | 32 (19.2%) | 0 (0.0%) |
| Total | 167 (100.0%) | 132 (100.0%) |
Real Estate Taxes by Mortgage Status in Steele
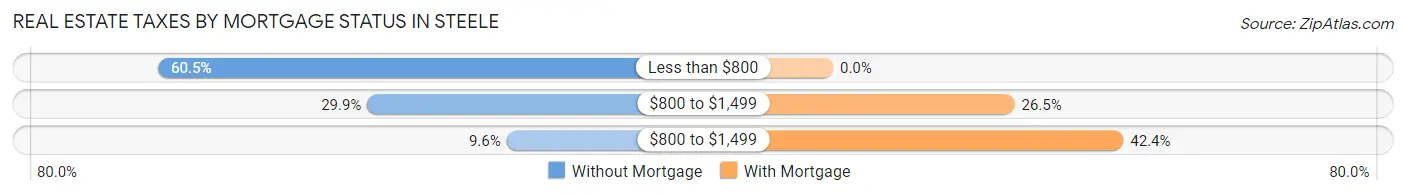
| Property Taxes | Without Mortgage | With Mortgage |
| Less than $800 | 101 (60.5%) | 0 (0.0%) |
| $800 to $1,499 | 50 (29.9%) | 35 (26.5%) |
| $800 to $1,499 | 16 (9.6%) | 56 (42.4%) |
| Total | 167 (100.0%) | 132 (100.0%) |
Health & Disability in Steele
Health Insurance Coverage by Age in Steele
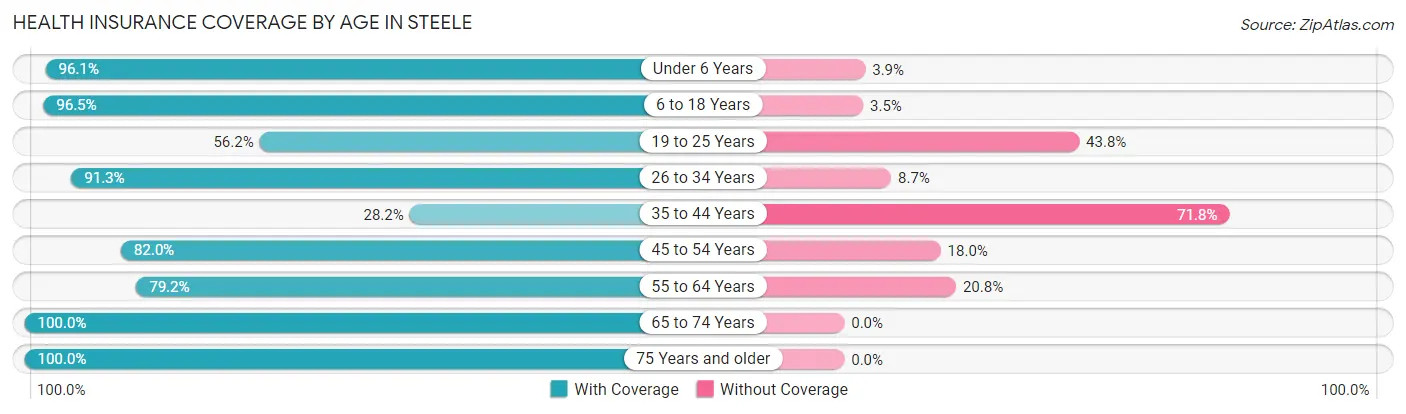
| Age Bracket | With Coverage | Without Coverage |
| Under 6 Years | 123 (96.1%) | 5 (3.9%) |
| 6 to 18 Years | 165 (96.5%) | 6 (3.5%) |
| 19 to 25 Years | 68 (56.2%) | 53 (43.8%) |
| 26 to 34 Years | 251 (91.3%) | 24 (8.7%) |
| 35 to 44 Years | 22 (28.2%) | 56 (71.8%) |
| 45 to 54 Years | 178 (82.0%) | 39 (18.0%) |
| 55 to 64 Years | 95 (79.2%) | 25 (20.8%) |
| 65 to 74 Years | 89 (100.0%) | 0 (0.0%) |
| 75 Years and older | 123 (100.0%) | 0 (0.0%) |
| Total | 1,114 (84.3%) | 208 (15.7%) |
Health Insurance Coverage by Citizenship Status in Steele
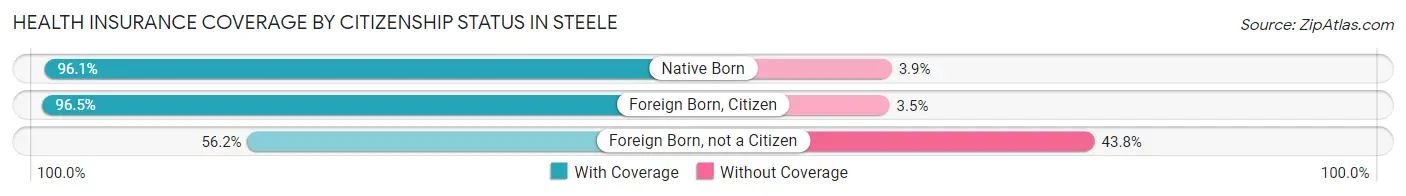
| Citizenship Status | With Coverage | Without Coverage |
| Native Born | 123 (96.1%) | 5 (3.9%) |
| Foreign Born, Citizen | 165 (96.5%) | 6 (3.5%) |
| Foreign Born, not a Citizen | 68 (56.2%) | 53 (43.8%) |
Health Insurance Coverage by Household Income in Steele
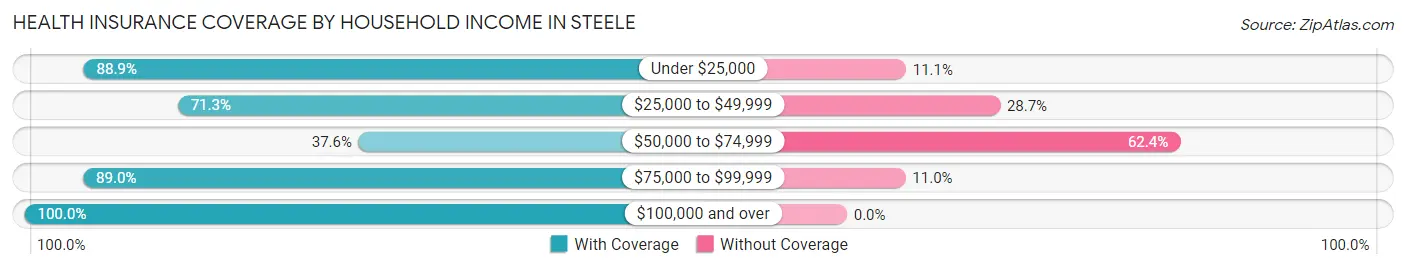
| Household Income | With Coverage | Without Coverage |
| Under $25,000 | 426 (88.9%) | 53 (11.1%) |
| $25,000 to $49,999 | 87 (71.3%) | 35 (28.7%) |
| $50,000 to $74,999 | 56 (37.6%) | 93 (62.4%) |
| $75,000 to $99,999 | 219 (89.0%) | 27 (11.0%) |
| $100,000 and over | 326 (100.0%) | 0 (0.0%) |
Public vs Private Health Insurance Coverage by Age in Steele
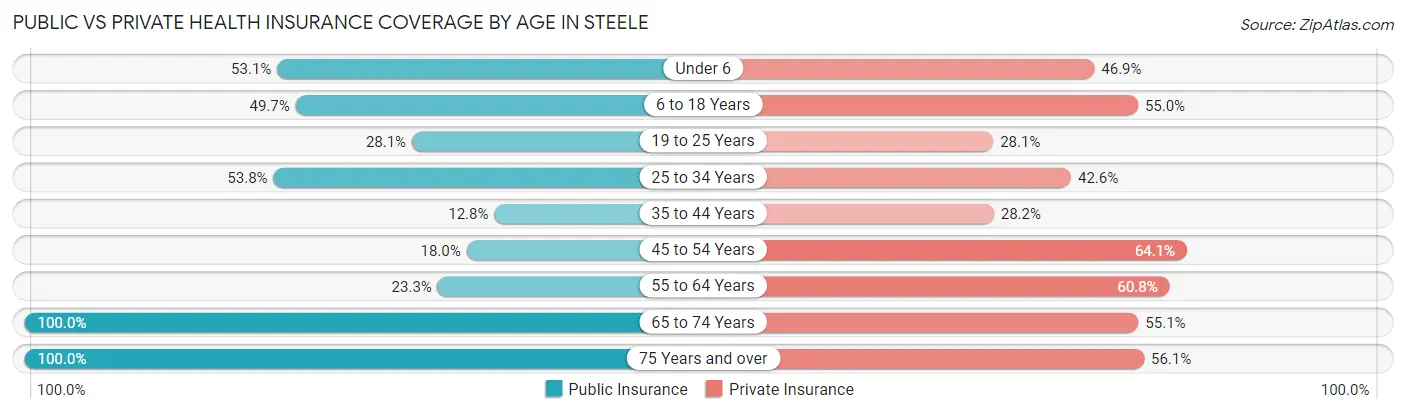
| Age Bracket | Public Insurance | Private Insurance |
| Under 6 | 68 (53.1%) | 60 (46.9%) |
| 6 to 18 Years | 85 (49.7%) | 94 (55.0%) |
| 19 to 25 Years | 34 (28.1%) | 34 (28.1%) |
| 25 to 34 Years | 148 (53.8%) | 117 (42.5%) |
| 35 to 44 Years | 10 (12.8%) | 22 (28.2%) |
| 45 to 54 Years | 39 (18.0%) | 139 (64.1%) |
| 55 to 64 Years | 28 (23.3%) | 73 (60.8%) |
| 65 to 74 Years | 89 (100.0%) | 49 (55.1%) |
| 75 Years and over | 123 (100.0%) | 69 (56.1%) |
| Total | 624 (47.2%) | 657 (49.7%) |
Disability Status by Sex by Age in Steele
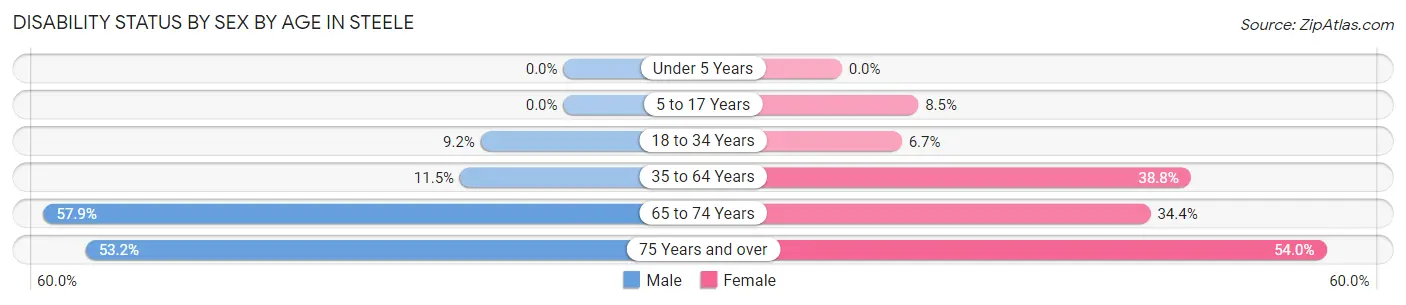
| Age Bracket | Male | Female |
| Under 5 Years | 0 (0.0%) | 0 (0.0%) |
| 5 to 17 Years | 0 (0.0%) | 8 (8.5%) |
| 18 to 34 Years | 22 (9.2%) | 12 (6.7%) |
| 35 to 64 Years | 22 (11.5%) | 87 (38.8%) |
| 65 to 74 Years | 33 (57.9%) | 11 (34.4%) |
| 75 Years and over | 25 (53.2%) | 41 (53.9%) |
Disability Class by Sex by Age in Steele
Disability Class: Hearing Difficulty
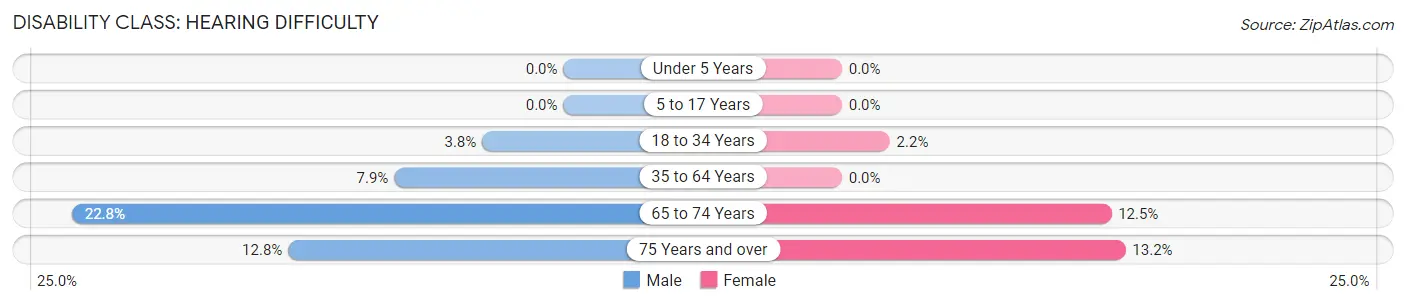
| Age Bracket | Male | Female |
| Under 5 Years | 0 (0.0%) | 0 (0.0%) |
| 5 to 17 Years | 0 (0.0%) | 0 (0.0%) |
| 18 to 34 Years | 9 (3.8%) | 4 (2.2%) |
| 35 to 64 Years | 15 (7.9%) | 0 (0.0%) |
| 65 to 74 Years | 13 (22.8%) | 4 (12.5%) |
| 75 Years and over | 6 (12.8%) | 10 (13.2%) |
Disability Class: Vision Difficulty
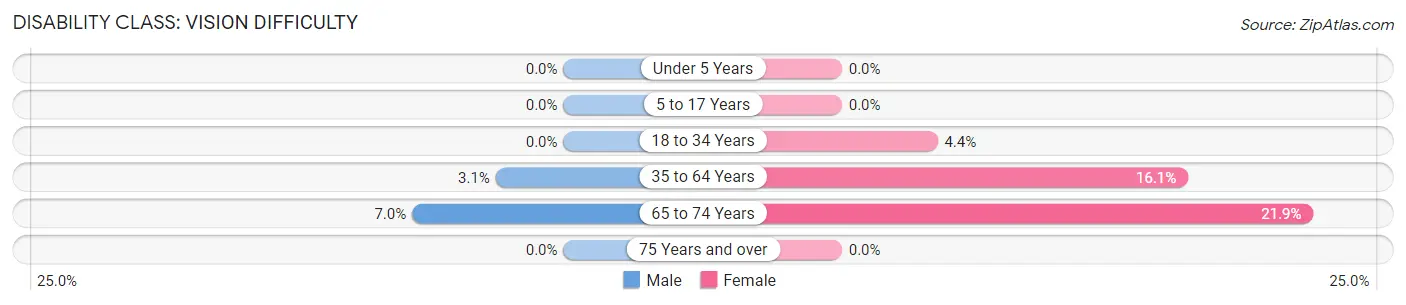
| Age Bracket | Male | Female |
| Under 5 Years | 0 (0.0%) | 0 (0.0%) |
| 5 to 17 Years | 0 (0.0%) | 0 (0.0%) |
| 18 to 34 Years | 0 (0.0%) | 8 (4.4%) |
| 35 to 64 Years | 6 (3.1%) | 36 (16.1%) |
| 65 to 74 Years | 4 (7.0%) | 7 (21.9%) |
| 75 Years and over | 0 (0.0%) | 0 (0.0%) |
Disability Class: Cognitive Difficulty
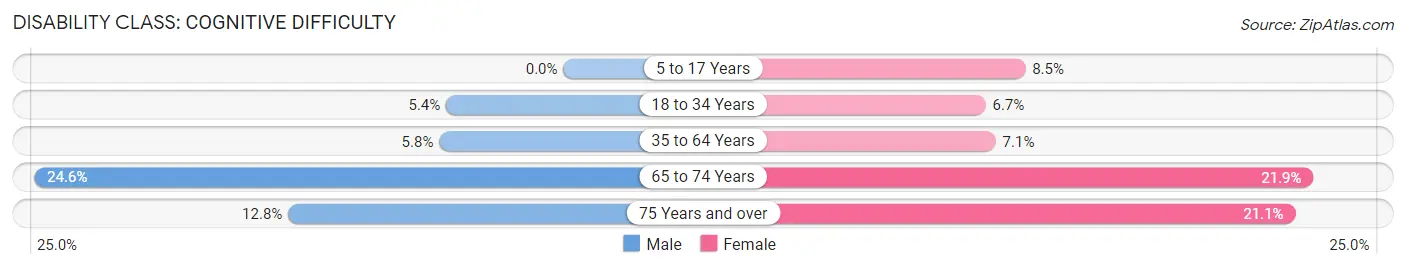
| Age Bracket | Male | Female |
| 5 to 17 Years | 0 (0.0%) | 8 (8.5%) |
| 18 to 34 Years | 13 (5.4%) | 12 (6.7%) |
| 35 to 64 Years | 11 (5.8%) | 16 (7.1%) |
| 65 to 74 Years | 14 (24.6%) | 7 (21.9%) |
| 75 Years and over | 6 (12.8%) | 16 (21.0%) |
Disability Class: Ambulatory Difficulty
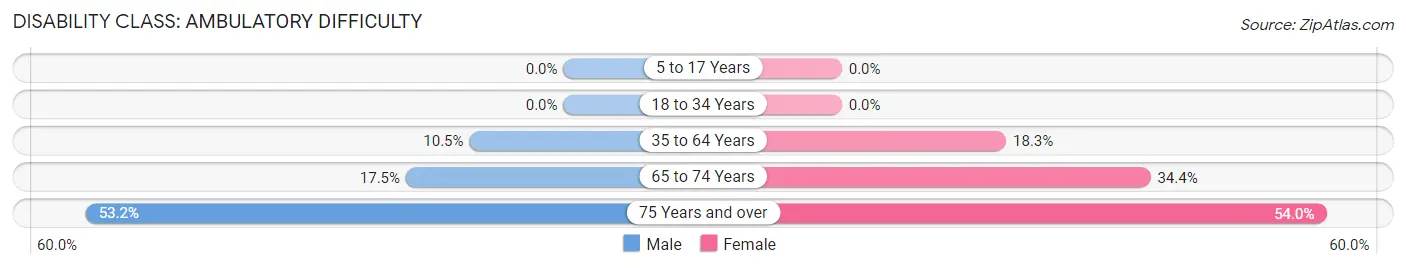
| Age Bracket | Male | Female |
| 5 to 17 Years | 0 (0.0%) | 0 (0.0%) |
| 18 to 34 Years | 0 (0.0%) | 0 (0.0%) |
| 35 to 64 Years | 20 (10.5%) | 41 (18.3%) |
| 65 to 74 Years | 10 (17.5%) | 11 (34.4%) |
| 75 Years and over | 25 (53.2%) | 41 (53.9%) |
Disability Class: Self-Care Difficulty
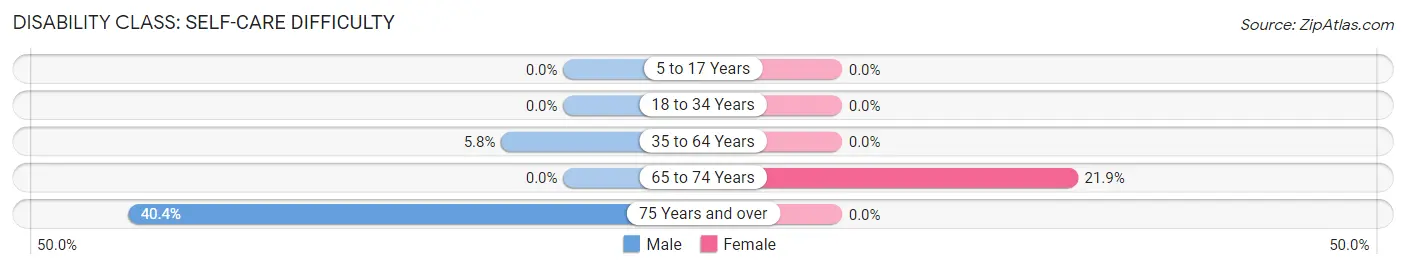
| Age Bracket | Male | Female |
| 5 to 17 Years | 0 (0.0%) | 0 (0.0%) |
| 18 to 34 Years | 0 (0.0%) | 0 (0.0%) |
| 35 to 64 Years | 11 (5.8%) | 0 (0.0%) |
| 65 to 74 Years | 0 (0.0%) | 7 (21.9%) |
| 75 Years and over | 19 (40.4%) | 0 (0.0%) |
Technology Access in Steele
Computing Device Access in Steele
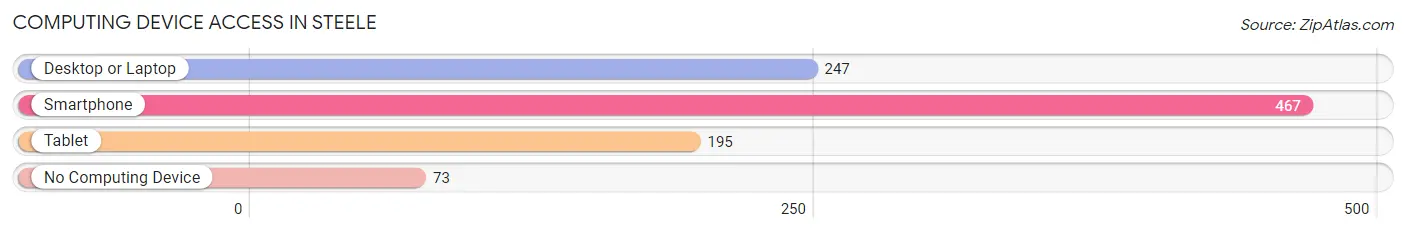
| Device Type | # Households | % Households |
| Desktop or Laptop | 247 | 42.8% |
| Smartphone | 467 | 80.9% |
| Tablet | 195 | 33.8% |
| No Computing Device | 73 | 12.7% |
| Total | 577 | 100.0% |
Internet Access in Steele
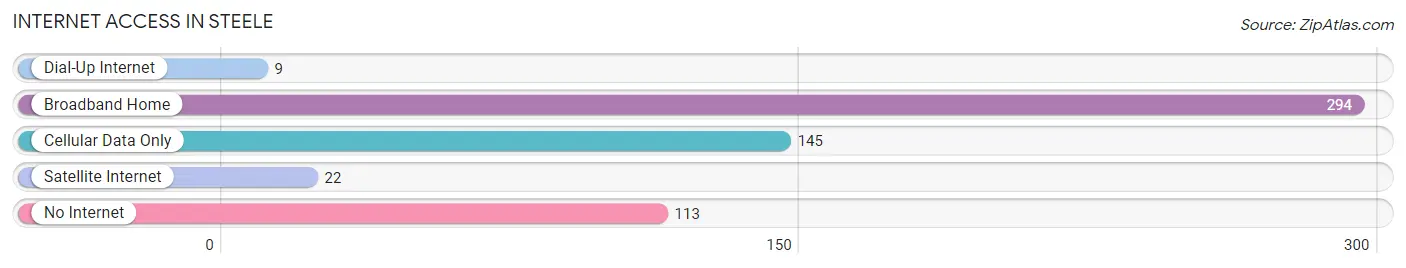
| Internet Type | # Households | % Households |
| Dial-Up Internet | 9 | 1.6% |
| Broadband Home | 294 | 50.9% |
| Cellular Data Only | 145 | 25.1% |
| Satellite Internet | 22 | 3.8% |
| No Internet | 113 | 19.6% |
| Total | 577 | 100.0% |
Steele Summary
Steele, Missouri is a small town located in Pemiscot County in the southeastern corner of the state. It is situated on the banks of the Mississippi River, just south of the Arkansas border. The town was founded in 1883 and has a population of approximately 1,500 people.
Steele is located in the Bootheel region of Missouri, which is known for its rich agricultural heritage. The town is surrounded by vast fields of cotton, soybeans, and corn, and is home to several large farms. The town is also home to a number of small businesses, including a grocery store, a hardware store, and a few restaurants.
The town of Steele is located in the Mississippi Alluvial Plain, which is a flat, low-lying area that is prone to flooding. The town is situated on a bluff overlooking the Mississippi River, and is protected from flooding by a levee system. The town is also located near the confluence of the St. Francis and White Rivers, which provide additional protection from flooding.
The economy of Steele is largely based on agriculture. The town is home to several large farms, which produce cotton, soybeans, and corn. The town also has a number of small businesses, including a grocery store, a hardware store, and a few restaurants.
The demographics of Steele are largely rural. The town is predominantly white, with a small African American population. The median household income is approximately $30,000, and the median age is around 40 years old.
Steele is a small town with a rich history and a strong sense of community. The town is home to a number of historic buildings, including the old courthouse, which was built in 1883. The town also has a number of parks and recreational areas, including a golf course and a swimming pool. The town is also home to a number of churches, including the First Baptist Church of Steele.
Steele is a small town with a rich history and a strong sense of community. The town is home to a number of historic buildings, including the old courthouse, which was built in 1883. The town also has a number of parks and recreational areas, including a golf course and a swimming pool. The town is also home to a number of churches, including the First Baptist Church of Steele. The town is also home to a number of small businesses, including a grocery store, a hardware store, and a few restaurants. The economy of Steele is largely based on agriculture, and the town is surrounded by vast fields of cotton, soybeans, and corn. The demographics of Steele are largely rural, with a predominantly white population and a small African American population. The median household income is approximately $30,000, and the median age is around 40 years old.
Common Questions
What is Per Capita Income in Steele?
Per Capita income in Steele is $25,339.
What is the Median Family Income in Steele?
Median Family Income in Steele is $50,231.
What is the Median Household income in Steele?
Median Household Income in Steele is $30,592.
What is Income or Wage Gap in Steele?
Income or Wage Gap in Steele is 13.6%.
Women in Steele earn 86.4 cents for every dollar earned by a man.
What is Inequality or Gini Index in Steele?
Inequality or Gini Index in Steele is 0.54.
What is the Total Population of Steele?
Total Population of Steele is 1,375.
What is the Total Male Population of Steele?
Total Male Population of Steele is 644.
What is the Total Female Population of Steele?
Total Female Population of Steele is 731.
What is the Ratio of Males per 100 Females in Steele?
There are 88.10 Males per 100 Females in Steele.
What is the Ratio of Females per 100 Males in Steele?
There are 113.51 Females per 100 Males in Steele.
What is the Median Population Age in Steele?
Median Population Age in Steele is 34.9 Years.
What is the Average Family Size in Steele
Average Family Size in Steele is 2.7 People.
What is the Average Household Size in Steele
Average Household Size in Steele is 2.3 People.
How Large is the Labor Force in Steele?
There are 701 People in the Labor Forcein in Steele.
What is the Percentage of People in the Labor Force in Steele?
62.3% of People are in the Labor Force in Steele.
What is the Unemployment Rate in Steele?
Unemployment Rate in Steele is 25.4%.