Senath, MO Map & Demographics
Senath Map
Senath Overview
$18,920
PER CAPITA INCOME
$52,500
AVG FAMILY INCOME
$40,000
AVG HOUSEHOLD INCOME
51.0%
WAGE / INCOME GAP [ % ]
49.0¢/ $1
WAGE / INCOME GAP [ $ ]
0.48
INEQUALITY / GINI INDEX
1,597
TOTAL POPULATION
807
MALE POPULATION
790
FEMALE POPULATION
102.15
MALES / 100 FEMALES
97.89
FEMALES / 100 MALES
34.9
MEDIAN AGE
3.6
AVG FAMILY SIZE
2.9
AVG HOUSEHOLD SIZE
566
LABOR FORCE [ PEOPLE ]
46.9%
PERCENT IN LABOR FORCE
4.9%
UNEMPLOYMENT RATE
Senath Zip Codes
Senath Area Codes
Income in Senath
Income Overview in Senath
Per Capita Income in Senath is $18,920, while median incomes of families and households are $52,500 and $40,000 respectively.
| Characteristic | Number | Measure |
| Per Capita Income | 1,597 | $18,920 |
| Median Family Income | 370 | $52,500 |
| Mean Family Income | 370 | $69,429 |
| Median Household Income | 512 | $40,000 |
| Mean Household Income | 512 | $59,819 |
| Income Deficit | 370 | $0 |
| Wage / Income Gap (%) | 1,597 | 51.05% |
| Wage / Income Gap ($) | 1,597 | 48.95¢ per $1 |
| Gini / Inequality Index | 1,597 | 0.48 |
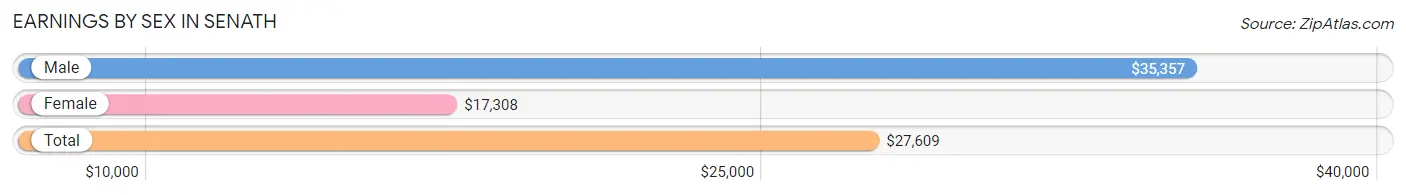
Earnings by Sex in Senath
Average Earnings in Senath are $27,609, $35,357 for men and $17,308 for women, a difference of 51.0%.
| Sex | Number | Average Earnings |
| Male | 400 (63.5%) | $35,357 |
| Female | 230 (36.5%) | $17,308 |
| Total | 630 (100.0%) | $27,609 |
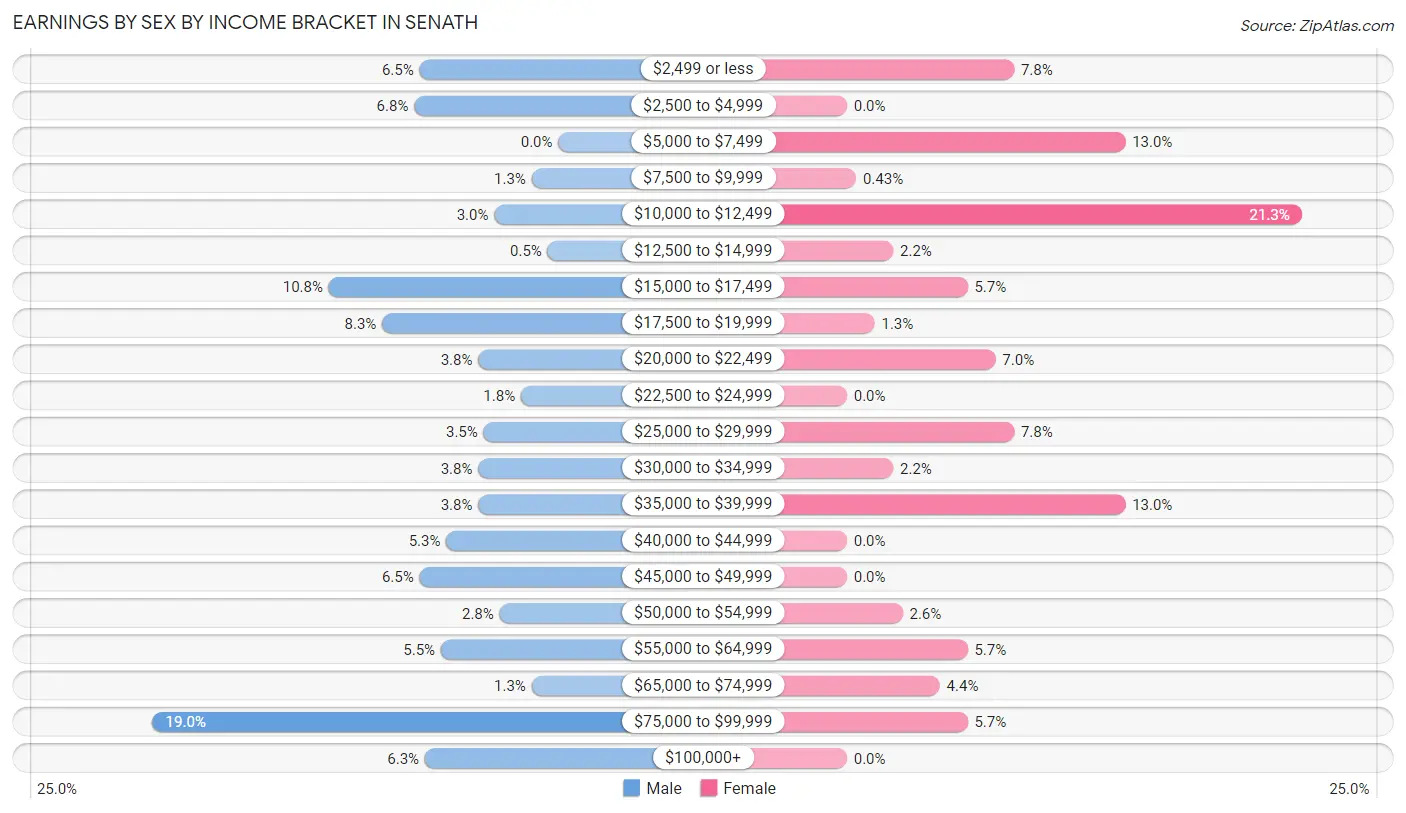
Earnings by Sex by Income Bracket in Senath
The most common earnings brackets in Senath are $75,000 to $99,999 for men (76 | 19.0%) and $10,000 to $12,499 for women (49 | 21.3%).
| Income | Male | Female |
| $2,499 or less | 26 (6.5%) | 18 (7.8%) |
| $2,500 to $4,999 | 27 (6.8%) | 0 (0.0%) |
| $5,000 to $7,499 | 0 (0.0%) | 30 (13.0%) |
| $7,500 to $9,999 | 5 (1.3%) | 1 (0.4%) |
| $10,000 to $12,499 | 12 (3.0%) | 49 (21.3%) |
| $12,500 to $14,999 | 2 (0.5%) | 5 (2.2%) |
| $15,000 to $17,499 | 43 (10.7%) | 13 (5.7%) |
| $17,500 to $19,999 | 33 (8.3%) | 3 (1.3%) |
| $20,000 to $22,499 | 15 (3.7%) | 16 (7.0%) |
| $22,500 to $24,999 | 7 (1.8%) | 0 (0.0%) |
| $25,000 to $29,999 | 14 (3.5%) | 18 (7.8%) |
| $30,000 to $34,999 | 15 (3.7%) | 5 (2.2%) |
| $35,000 to $39,999 | 15 (3.7%) | 30 (13.0%) |
| $40,000 to $44,999 | 21 (5.2%) | 0 (0.0%) |
| $45,000 to $49,999 | 26 (6.5%) | 0 (0.0%) |
| $50,000 to $54,999 | 11 (2.8%) | 6 (2.6%) |
| $55,000 to $64,999 | 22 (5.5%) | 13 (5.7%) |
| $65,000 to $74,999 | 5 (1.3%) | 10 (4.3%) |
| $75,000 to $99,999 | 76 (19.0%) | 13 (5.7%) |
| $100,000+ | 25 (6.2%) | 0 (0.0%) |
| Total | 400 (100.0%) | 230 (100.0%) |
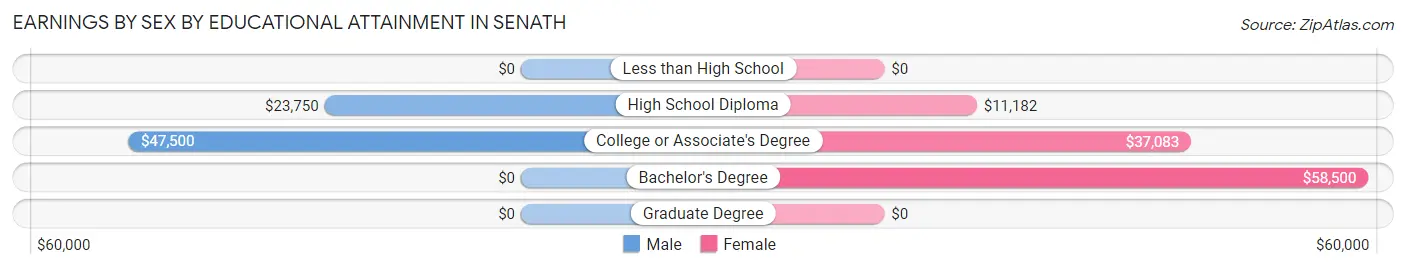
Earnings by Sex by Educational Attainment in Senath
Average earnings in Senath are $40,536 for men and $17,115 for women, a difference of 57.8%. Men with an educational attainment of college or associate's degree enjoy the highest average annual earnings of $47,500, while those with high school diploma education earn the least with $23,750. Women with an educational attainment of bachelor's degree earn the most with the average annual earnings of $58,500, while those with high school diploma education have the smallest earnings of $11,182.
| Educational Attainment | Male Income | Female Income |
| Less than High School | - | - |
| High School Diploma | $23,750 | $11,182 |
| College or Associate's Degree | $47,500 | $37,083 |
| Bachelor's Degree | - | - |
| Graduate Degree | - | - |
| Total | $40,536 | $17,115 |
Family Income in Senath
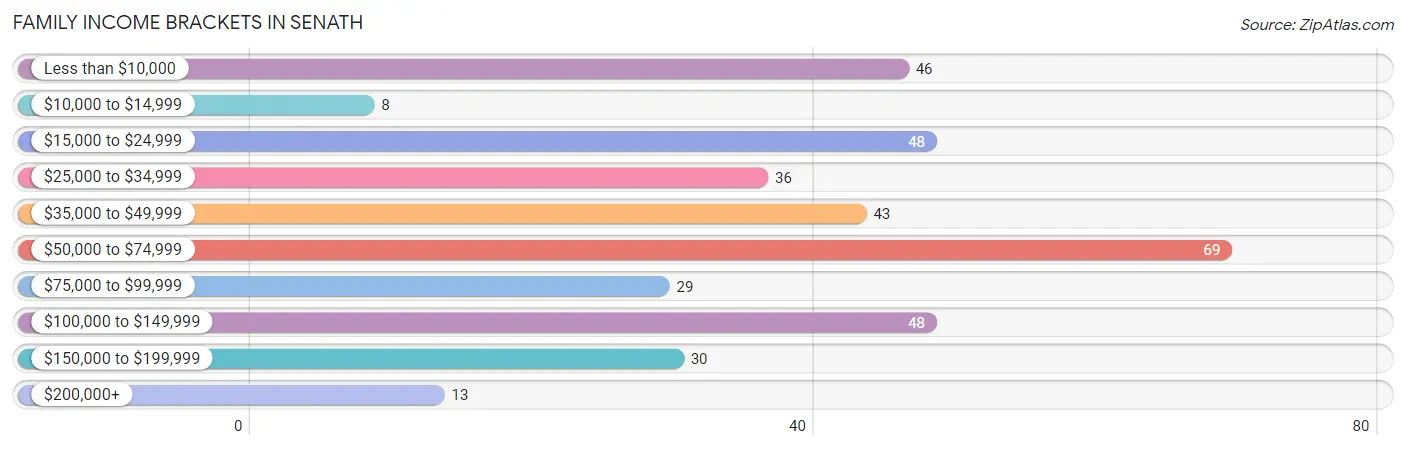
Family Income Brackets in Senath
According to the Senath family income data, there are 69 families falling into the $50,000 to $74,999 income range, which is the most common income bracket and makes up 18.6% of all families. Conversely, the $10,000 to $14,999 income bracket is the least frequent group with only 8 families (2.2%) belonging to this category.
| Income Bracket | # Families | % Families |
| Less than $10,000 | 46 | 12.4% |
| $10,000 to $14,999 | 8 | 2.2% |
| $15,000 to $24,999 | 48 | 13.0% |
| $25,000 to $34,999 | 36 | 9.7% |
| $35,000 to $49,999 | 43 | 11.6% |
| $50,000 to $74,999 | 69 | 18.6% |
| $75,000 to $99,999 | 29 | 7.8% |
| $100,000 to $149,999 | 48 | 13.0% |
| $150,000 to $199,999 | 30 | 8.1% |
| $200,000+ | 13 | 3.5% |
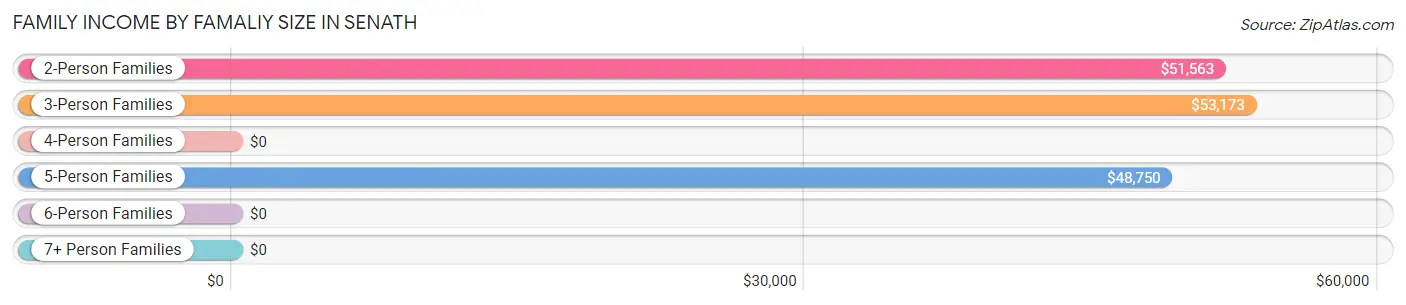
Family Income by Famaliy Size in Senath
3-person families (105 | 28.4%) account for the highest median family income in Senath with $53,173 per family, while 2-person families (135 | 36.5%) have the highest median income of $25,782 per family member.
| Income Bracket | # Families | Median Income |
| 2-Person Families | 135 (36.5%) | $51,563 |
| 3-Person Families | 105 (28.4%) | $53,173 |
| 4-Person Families | 109 (29.5%) | $0 |
| 5-Person Families | 14 (3.8%) | $48,750 |
| 6-Person Families | 7 (1.9%) | $0 |
| 7+ Person Families | 0 (0.0%) | $0 |
| Total | 370 (100.0%) | $52,500 |
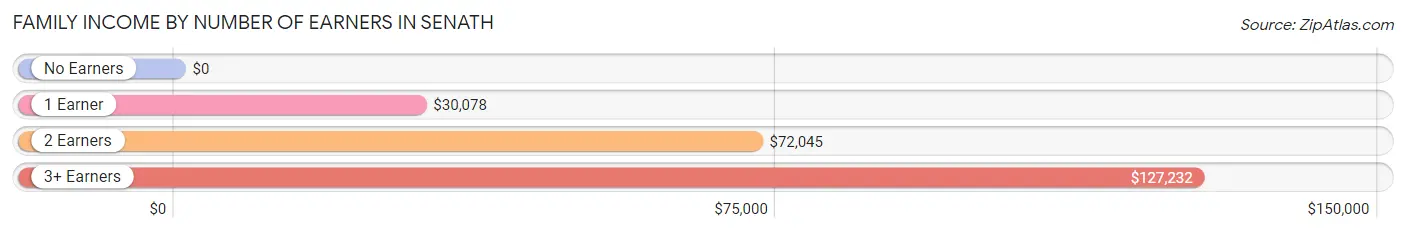
Family Income by Number of Earners in Senath
| Number of Earners | # Families | Median Income |
| No Earners | 68 (18.4%) | $0 |
| 1 Earner | 95 (25.7%) | $30,078 |
| 2 Earners | 182 (49.2%) | $72,045 |
| 3+ Earners | 25 (6.8%) | $127,232 |
| Total | 370 (100.0%) | $52,500 |
Household Income in Senath
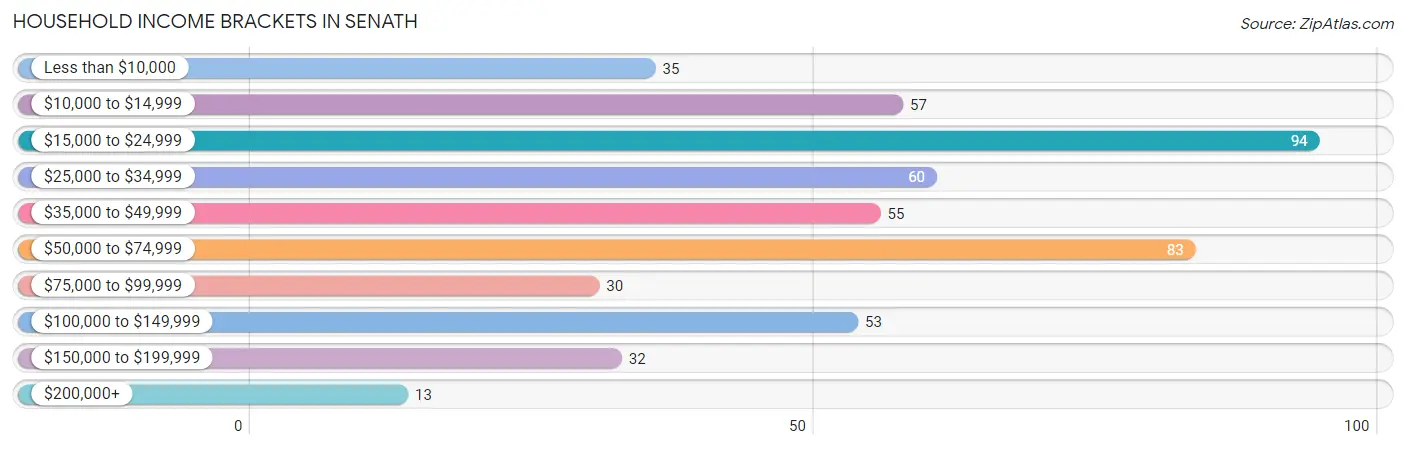
Household Income Brackets in Senath
With 94 households falling in the category, the $15,000 to $24,999 income range is the most frequent in Senath, accounting for 18.4% of all households. In contrast, only 13 households (2.5%) fall into the $200,000+ income bracket, making it the least populous group.
| Income Bracket | # Households | % Households |
| Less than $10,000 | 35 | 6.8% |
| $10,000 to $14,999 | 57 | 11.1% |
| $15,000 to $24,999 | 94 | 18.4% |
| $25,000 to $34,999 | 60 | 11.7% |
| $35,000 to $49,999 | 55 | 10.7% |
| $50,000 to $74,999 | 83 | 16.2% |
| $75,000 to $99,999 | 30 | 5.9% |
| $100,000 to $149,999 | 53 | 10.4% |
| $150,000 to $199,999 | 32 | 6.3% |
| $200,000+ | 13 | 2.5% |
Household Income by Householder Age in Senath
The median household income in Senath is $40,000, with the highest median household income of $60,250 found in the 45 to 64 years age bracket for the primary householder. A total of 210 households (41.0%) fall into this category. Meanwhile, the 65+ years age bracket for the primary householder has the lowest median household income of $22,917, with 124 households (24.2%) in this group.
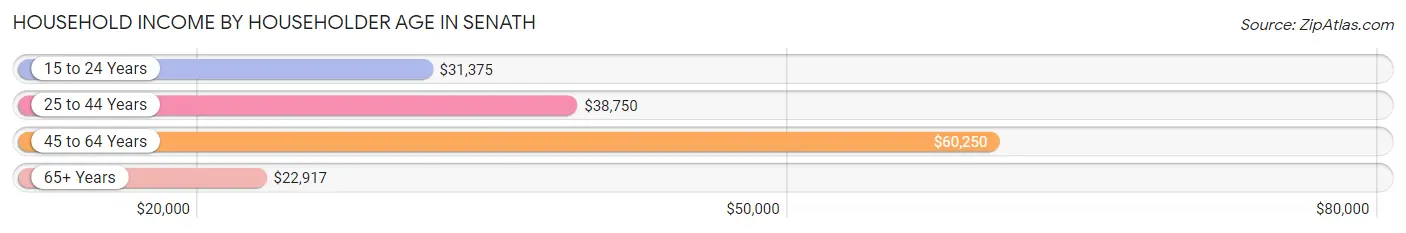
| Income Bracket | # Households | Median Income |
| 15 to 24 Years | 27 (5.3%) | $31,375 |
| 25 to 44 Years | 151 (29.5%) | $38,750 |
| 45 to 64 Years | 210 (41.0%) | $60,250 |
| 65+ Years | 124 (24.2%) | $22,917 |
| Total | 512 (100.0%) | $40,000 |
Poverty in Senath
Income Below Poverty by Sex and Age in Senath
With 13.5% poverty level for males and 27.0% for females among the residents of Senath, 6 to 11 year old males and under 5 year old females are the most vulnerable to poverty, with 31 males (47.7%) and 24 females (46.2%) in their respective age groups living below the poverty level.
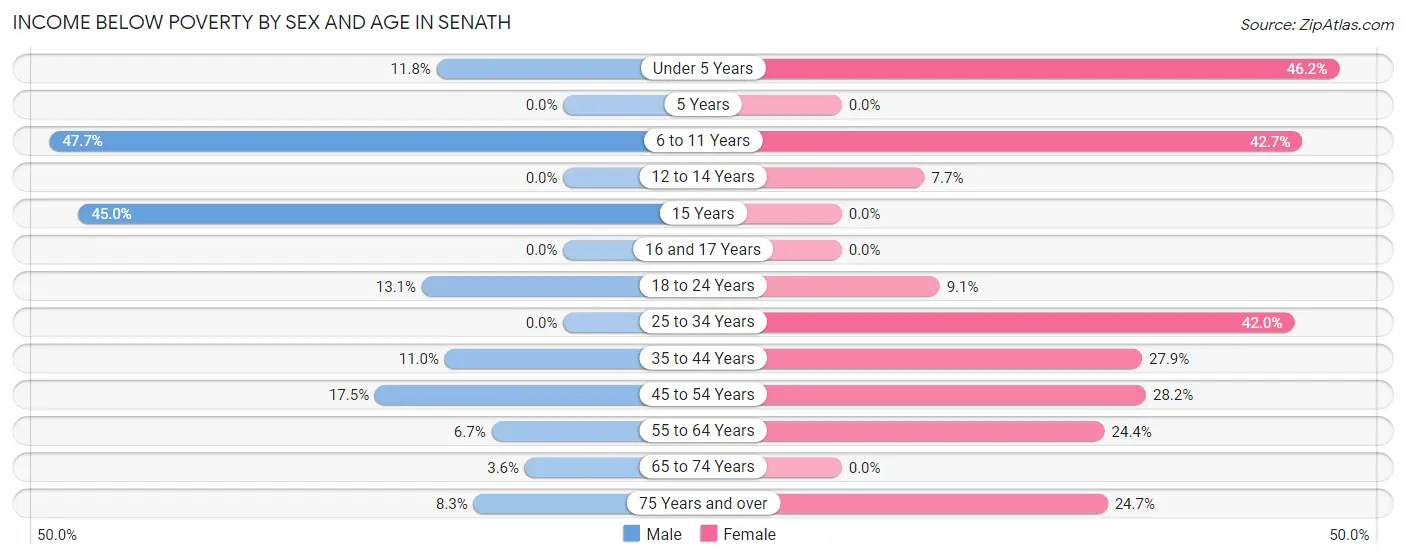
| Age Bracket | Male | Female |
| Under 5 Years | 10 (11.8%) | 24 (46.2%) |
| 5 Years | 0 (0.0%) | 0 (0.0%) |
| 6 to 11 Years | 31 (47.7%) | 47 (42.7%) |
| 12 to 14 Years | 0 (0.0%) | 2 (7.7%) |
| 15 Years | 9 (45.0%) | 0 (0.0%) |
| 16 and 17 Years | 0 (0.0%) | 0 (0.0%) |
| 18 to 24 Years | 13 (13.1%) | 5 (9.1%) |
| 25 to 34 Years | 0 (0.0%) | 34 (42.0%) |
| 35 to 44 Years | 11 (11.0%) | 17 (27.9%) |
| 45 to 54 Years | 18 (17.5%) | 37 (28.2%) |
| 55 to 64 Years | 5 (6.7%) | 20 (24.4%) |
| 65 to 74 Years | 2 (3.6%) | 0 (0.0%) |
| 75 Years and over | 1 (8.3%) | 19 (24.7%) |
| Total | 100 (13.5%) | 205 (27.0%) |
Income Above Poverty by Sex and Age in Senath
According to the poverty statistics in Senath, males aged 12 to 14 years and females aged 5 years are the age groups that are most secure financially, with 100.0% of males and 100.0% of females in these age groups living above the poverty line.
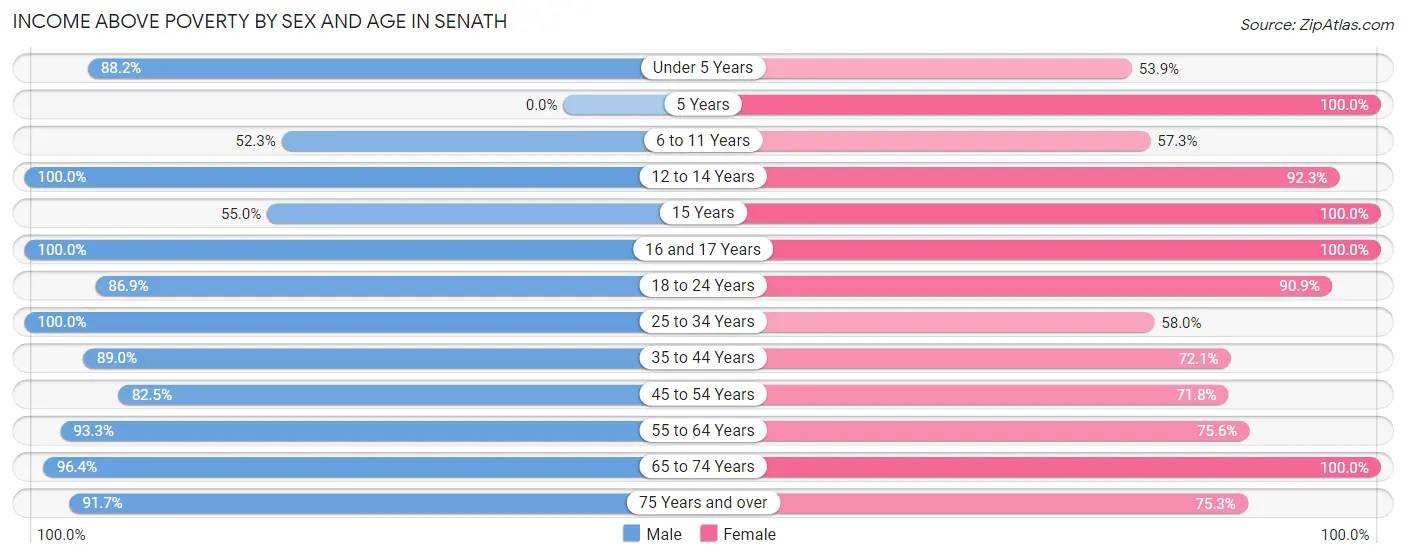
| Age Bracket | Male | Female |
| Under 5 Years | 75 (88.2%) | 28 (53.8%) |
| 5 Years | 0 (0.0%) | 5 (100.0%) |
| 6 to 11 Years | 34 (52.3%) | 63 (57.3%) |
| 12 to 14 Years | 15 (100.0%) | 24 (92.3%) |
| 15 Years | 11 (55.0%) | 13 (100.0%) |
| 16 and 17 Years | 39 (100.0%) | 27 (100.0%) |
| 18 to 24 Years | 86 (86.9%) | 50 (90.9%) |
| 25 to 34 Years | 72 (100.0%) | 47 (58.0%) |
| 35 to 44 Years | 89 (89.0%) | 44 (72.1%) |
| 45 to 54 Years | 85 (82.5%) | 94 (71.8%) |
| 55 to 64 Years | 70 (93.3%) | 62 (75.6%) |
| 65 to 74 Years | 54 (96.4%) | 38 (100.0%) |
| 75 Years and over | 11 (91.7%) | 58 (75.3%) |
| Total | 641 (86.5%) | 553 (73.0%) |
Income Below Poverty Among Married-Couple Families in Senath
The poverty statistics for married-couple families in Senath show that 5.2% or 13 of the total 252 families live below the poverty line. Families with 1 or 2 children have the highest poverty rate of 11.6%, comprising of 10 families. On the other hand, families with 3 or 4 children have the lowest poverty rate of 0.0%, which includes 0 families.
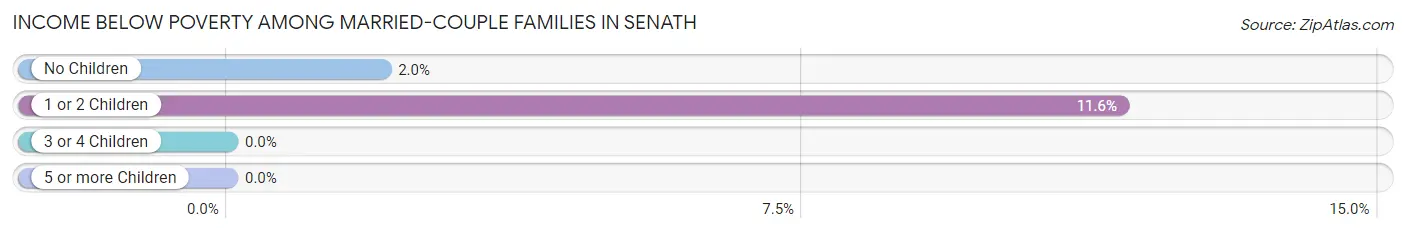
| Children | Above Poverty | Below Poverty |
| No Children | 147 (98.0%) | 3 (2.0%) |
| 1 or 2 Children | 76 (88.4%) | 10 (11.6%) |
| 3 or 4 Children | 16 (100.0%) | 0 (0.0%) |
| 5 or more Children | 0 (0.0%) | 0 (0.0%) |
| Total | 239 (94.8%) | 13 (5.2%) |
Income Below Poverty Among Single-Parent Households in Senath
According to the poverty data in Senath, 40.0% or 12 single-father households and 60.2% or 53 single-mother households are living below the poverty line. Among single-father households, those with 3 or 4 children have the highest poverty rate, with 11 households (100.0%) experiencing poverty. Likewise, among single-mother households, those with 3 or 4 children have the highest poverty rate, with 26 households (100.0%) falling below the poverty line.
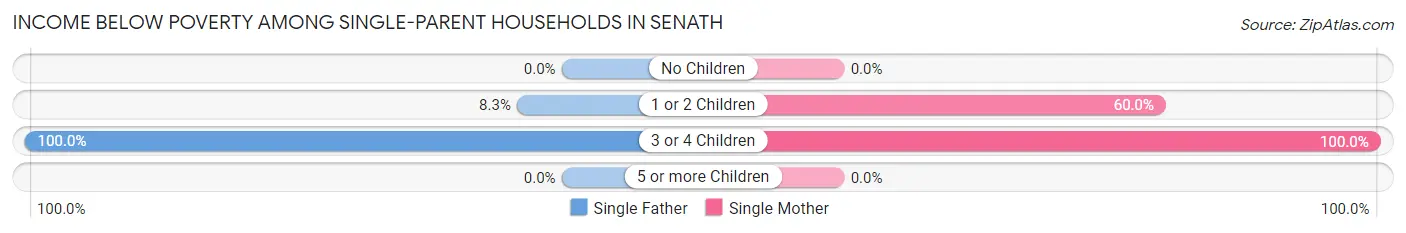
| Children | Single Father | Single Mother |
| No Children | 0 (0.0%) | 0 (0.0%) |
| 1 or 2 Children | 1 (8.3%) | 27 (60.0%) |
| 3 or 4 Children | 11 (100.0%) | 26 (100.0%) |
| 5 or more Children | 0 (0.0%) | 0 (0.0%) |
| Total | 12 (40.0%) | 53 (60.2%) |
Income Below Poverty Among Married-Couple vs Single-Parent Households in Senath
The poverty data for Senath shows that 13 of the married-couple family households (5.2%) and 65 of the single-parent households (55.1%) are living below the poverty level. Within the married-couple family households, those with 1 or 2 children have the highest poverty rate, with 10 households (11.6%) falling below the poverty line. Among the single-parent households, those with 3 or 4 children have the highest poverty rate, with 37 household (100.0%) living below poverty.
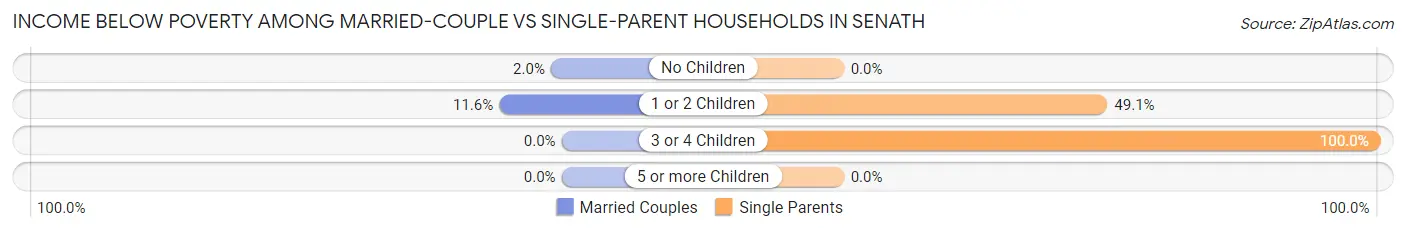
| Children | Married-Couple Families | Single-Parent Households |
| No Children | 3 (2.0%) | 0 (0.0%) |
| 1 or 2 Children | 10 (11.6%) | 28 (49.1%) |
| 3 or 4 Children | 0 (0.0%) | 37 (100.0%) |
| 5 or more Children | 0 (0.0%) | 0 (0.0%) |
| Total | 13 (5.2%) | 65 (55.1%) |
Race in Senath
The most populous races in Senath are White / Caucasian (1,062 | 66.5%), Hispanic or Latino (736 | 46.1%), and Two or more Races (478 | 29.9%).
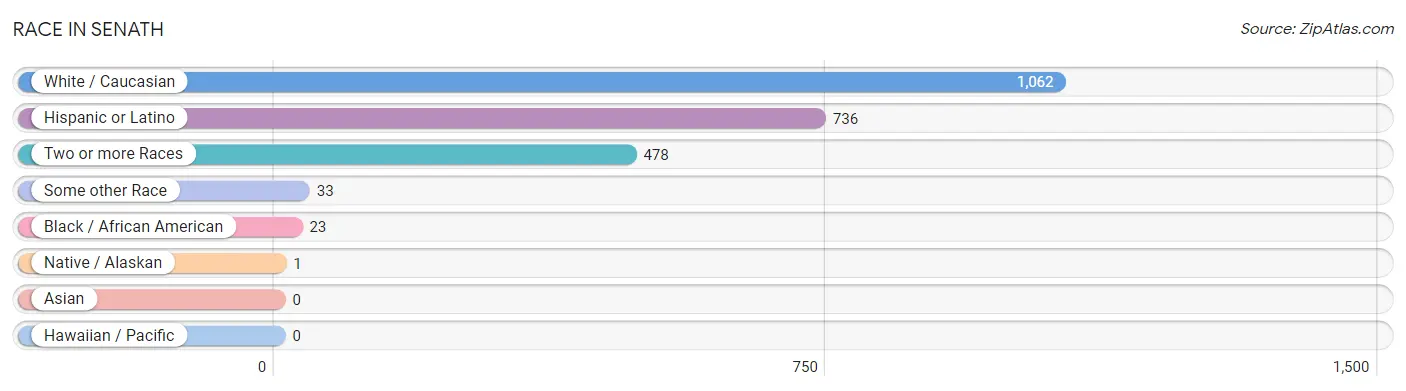
| Race | # Population | % Population |
| Asian | 0 | 0.0% |
| Black / African American | 23 | 1.4% |
| Hawaiian / Pacific | 0 | 0.0% |
| Hispanic or Latino | 736 | 46.1% |
| Native / Alaskan | 1 | 0.1% |
| White / Caucasian | 1,062 | 66.5% |
| Two or more Races | 478 | 29.9% |
| Some other Race | 33 | 2.1% |
| Total | 1,597 | 100.0% |
Ancestry in Senath
The most populous ancestries reported in Senath are Mexican (736 | 46.1%), Irish (160 | 10.0%), American (87 | 5.4%), German (83 | 5.2%), and English (62 | 3.9%), together accounting for 70.6% of all Senath residents.
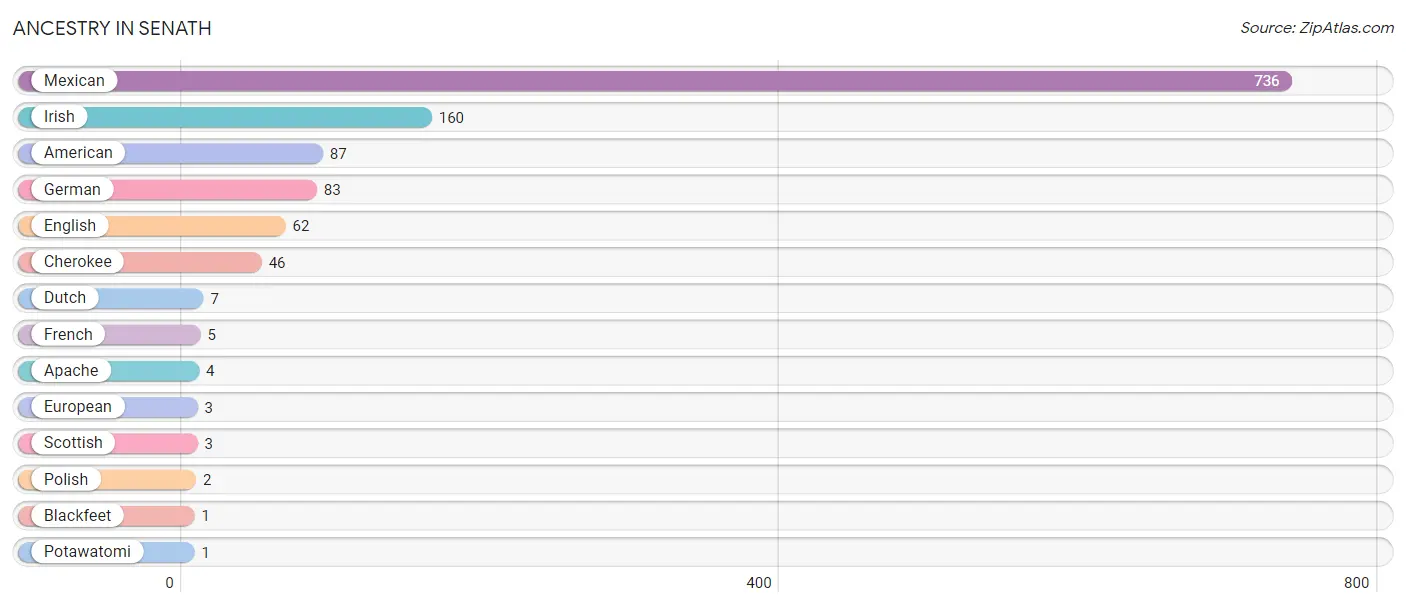
| Ancestry | # Population | % Population |
| American | 87 | 5.4% |
| Apache | 4 | 0.3% |
| Blackfeet | 1 | 0.1% |
| Cherokee | 46 | 2.9% |
| Dutch | 7 | 0.4% |
| English | 62 | 3.9% |
| European | 3 | 0.2% |
| French | 5 | 0.3% |
| German | 83 | 5.2% |
| Irish | 160 | 10.0% |
| Mexican | 736 | 46.1% |
| Polish | 2 | 0.1% |
| Potawatomi | 1 | 0.1% |
| Scottish | 3 | 0.2% | View All 14 Rows |
Immigrants in Senath
The most numerous immigrant groups reported in Senath came from Central America (318 | 19.9%), Latin America (318 | 19.9%), and Mexico (318 | 19.9%), together accounting for 59.7% of all Senath residents.
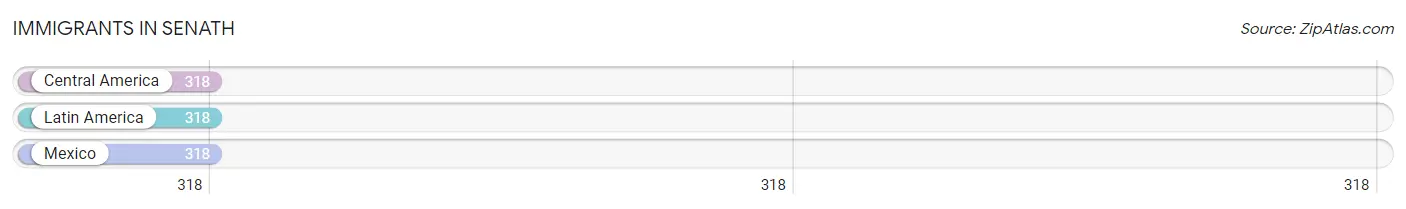
| Immigration Origin | # Population | % Population |
| Central America | 318 | 19.9% |
| Latin America | 318 | 19.9% |
| Mexico | 318 | 19.9% | View All 3 Rows |
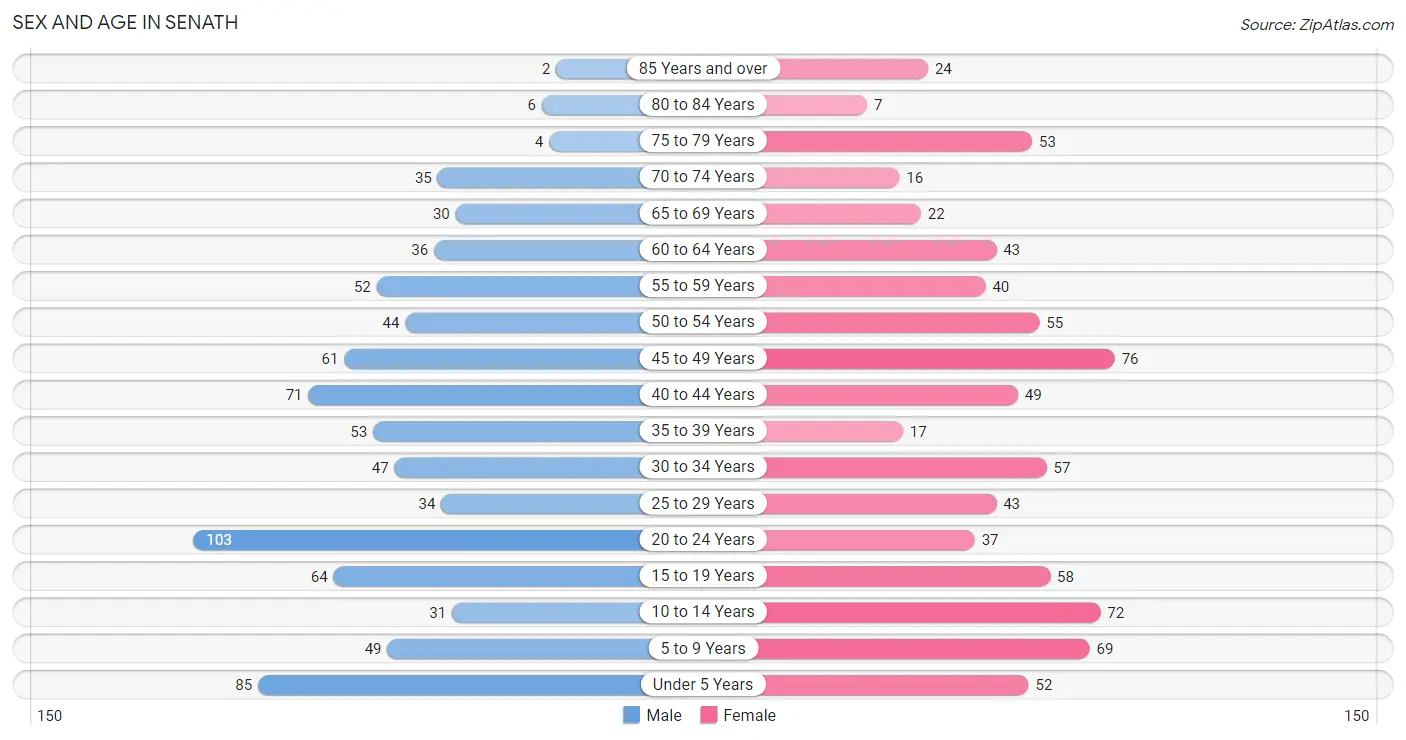
Sex and Age in Senath
Sex and Age in Senath
The most populous age groups in Senath are 20 to 24 Years (103 | 12.8%) for men and 45 to 49 Years (76 | 9.6%) for women.
| Age Bracket | Male | Female |
| Under 5 Years | 85 (10.5%) | 52 (6.6%) |
| 5 to 9 Years | 49 (6.1%) | 69 (8.7%) |
| 10 to 14 Years | 31 (3.8%) | 72 (9.1%) |
| 15 to 19 Years | 64 (7.9%) | 58 (7.3%) |
| 20 to 24 Years | 103 (12.8%) | 37 (4.7%) |
| 25 to 29 Years | 34 (4.2%) | 43 (5.4%) |
| 30 to 34 Years | 47 (5.8%) | 57 (7.2%) |
| 35 to 39 Years | 53 (6.6%) | 17 (2.1%) |
| 40 to 44 Years | 71 (8.8%) | 49 (6.2%) |
| 45 to 49 Years | 61 (7.6%) | 76 (9.6%) |
| 50 to 54 Years | 44 (5.4%) | 55 (7.0%) |
| 55 to 59 Years | 52 (6.4%) | 40 (5.1%) |
| 60 to 64 Years | 36 (4.5%) | 43 (5.4%) |
| 65 to 69 Years | 30 (3.7%) | 22 (2.8%) |
| 70 to 74 Years | 35 (4.3%) | 16 (2.0%) |
| 75 to 79 Years | 4 (0.5%) | 53 (6.7%) |
| 80 to 84 Years | 6 (0.7%) | 7 (0.9%) |
| 85 Years and over | 2 (0.3%) | 24 (3.0%) |
| Total | 807 (100.0%) | 790 (100.0%) |
Families and Households in Senath
Median Family Size in Senath
The median family size in Senath is 3.58 persons per family, with single male/father families (30 | 8.1%) accounting for the largest median family size of 4.07 persons per family. On the other hand, single female/mother families (88 | 23.8%) represent the smallest median family size with 2.82 persons per family.
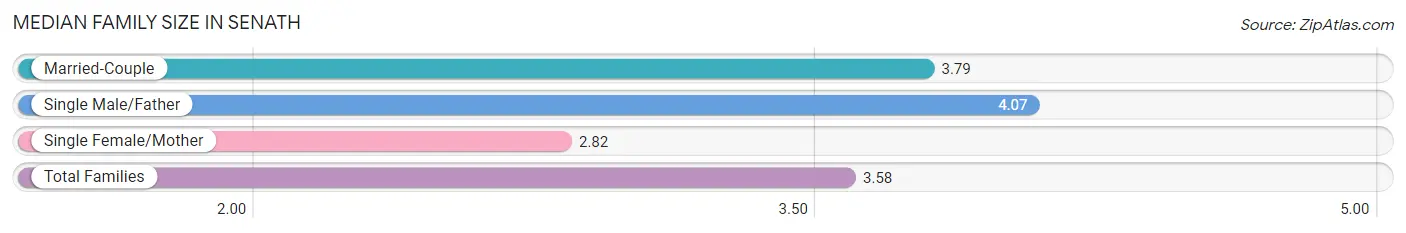
| Family Type | # Families | Family Size |
| Married-Couple | 252 (68.1%) | 3.79 |
| Single Male/Father | 30 (8.1%) | 4.07 |
| Single Female/Mother | 88 (23.8%) | 2.82 |
| Total Families | 370 (100.0%) | 3.58 |
Median Household Size in Senath
The median household size in Senath is 2.93 persons per household, with single male/father households (30 | 5.9%) accounting for the largest median household size of 4.6 persons per household. non-family households (142 | 27.7%) represent the smallest median household size with 1.02 persons per household.
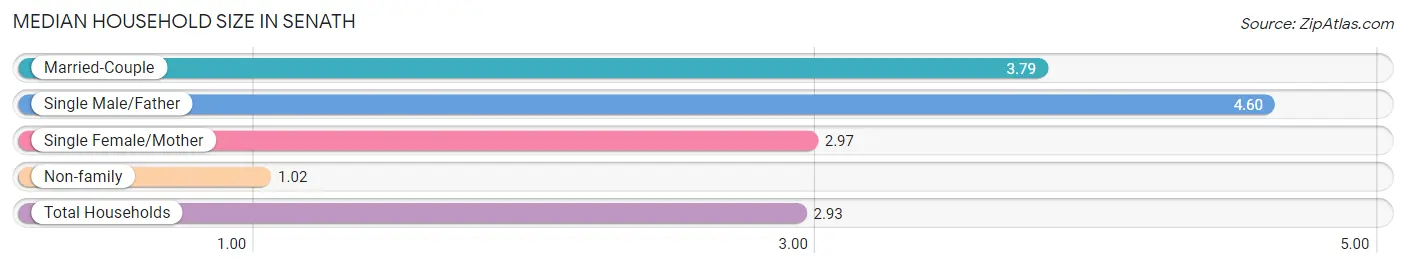
| Household Type | # Households | Household Size |
| Married-Couple | 252 (49.2%) | 3.79 |
| Single Male/Father | 30 (5.9%) | 4.60 |
| Single Female/Mother | 88 (17.2%) | 2.97 |
| Non-family | 142 (27.7%) | 1.02 |
| Total Households | 512 (100.0%) | 2.93 |
Household Size by Marriage Status in Senath
Out of a total of 512 households in Senath, 370 (72.3%) are family households, while 142 (27.7%) are nonfamily households. The most numerous type of family households are 2-person households, comprising 132, and the most common type of nonfamily households are 1-person households, comprising 139.
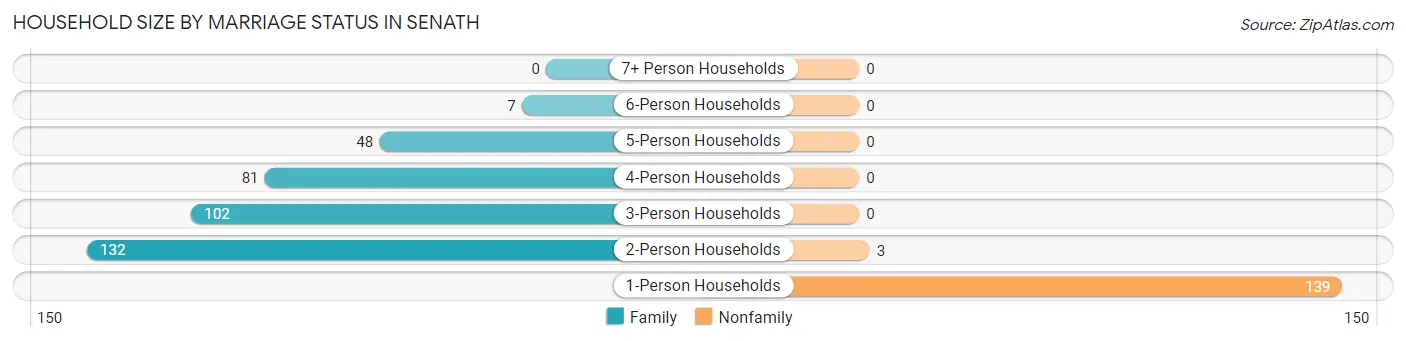
| Household Size | Family Households | Nonfamily Households |
| 1-Person Households | - | 139 (27.2%) |
| 2-Person Households | 132 (25.8%) | 3 (0.6%) |
| 3-Person Households | 102 (19.9%) | 0 (0.0%) |
| 4-Person Households | 81 (15.8%) | 0 (0.0%) |
| 5-Person Households | 48 (9.4%) | 0 (0.0%) |
| 6-Person Households | 7 (1.4%) | 0 (0.0%) |
| 7+ Person Households | 0 (0.0%) | 0 (0.0%) |
| Total | 370 (72.3%) | 142 (27.7%) |
Female Fertility in Senath
Fertility by Age in Senath
Average fertility rate in Senath is 17.0 births per 1,000 women. Women in the age bracket of 20 to 34 years have the highest fertility rate with 44.0 births per 1,000 women. Women in the age bracket of 20 to 34 years acount for 100.0% of all women with births.
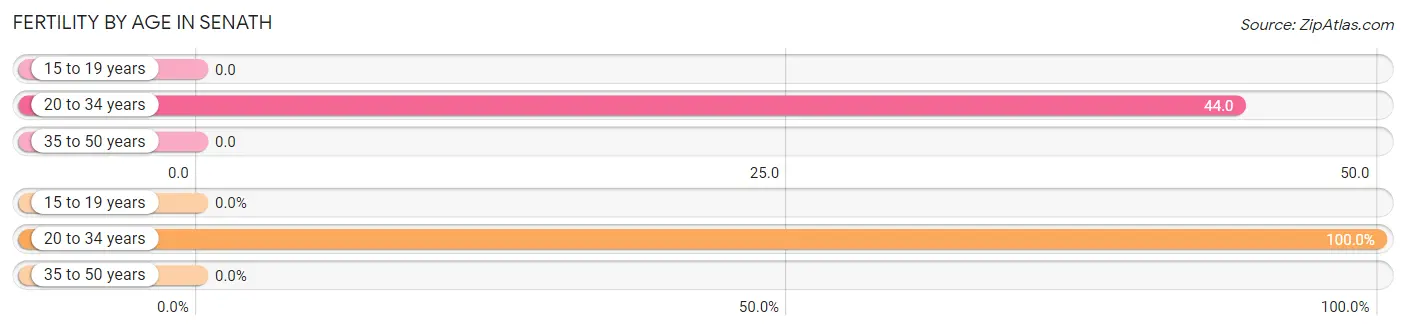
| Age Bracket | Women with Births | Births / 1,000 Women |
| 15 to 19 years | 0 (0.0%) | 0.0 |
| 20 to 34 years | 6 (100.0%) | 44.0 |
| 35 to 50 years | 0 (0.0%) | 0.0 |
| Total | 6 (100.0%) | 17.0 |
Fertility by Age by Marriage Status in Senath
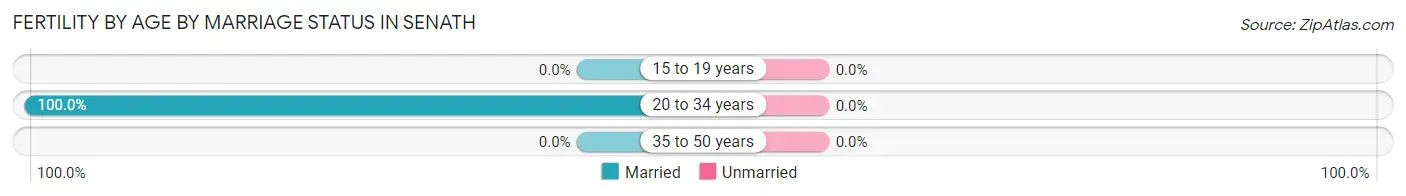
| Age Bracket | Married | Unmarried |
| 15 to 19 years | 0 (0.0%) | 0 (0.0%) |
| 20 to 34 years | 6 (100.0%) | 0 (0.0%) |
| 35 to 50 years | 0 (0.0%) | 0 (0.0%) |
| Total | 6 (100.0%) | 0 (0.0%) |
Fertility by Education in Senath
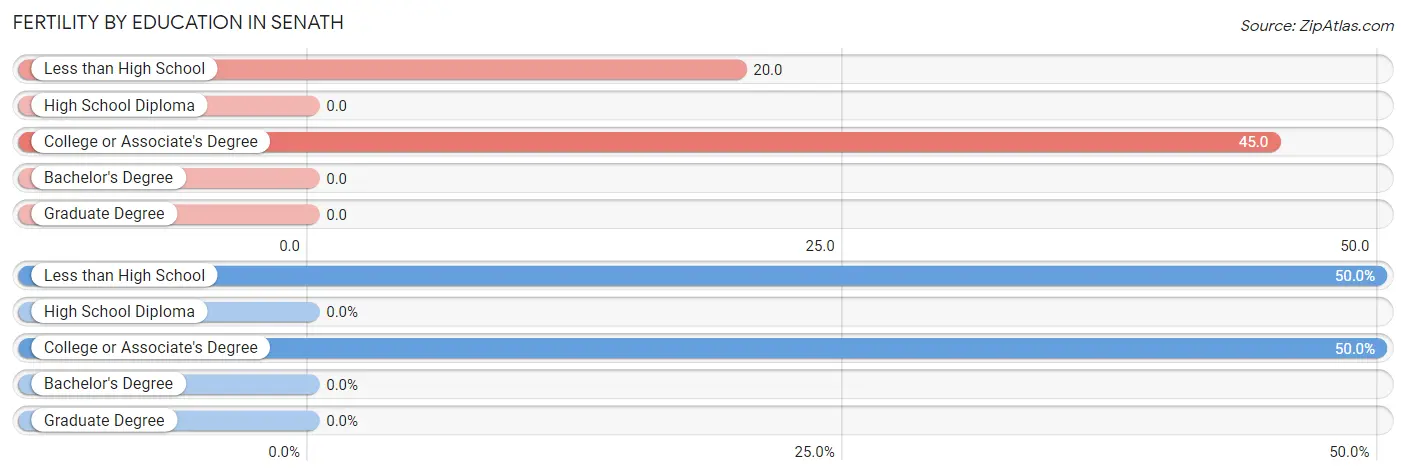
| Educational Attainment | Women with Births | Births / 1,000 Women |
| Less than High School | 3 (50.0%) | 20.0 |
| High School Diploma | 0 (0.0%) | 0.0 |
| College or Associate's Degree | 3 (50.0%) | 45.0 |
| Bachelor's Degree | 0 (0.0%) | 0.0 |
| Graduate Degree | 0 (0.0%) | 0.0 |
| Total | 6 (100.0%) | 17.0 |
Fertility by Education by Marriage Status in Senath
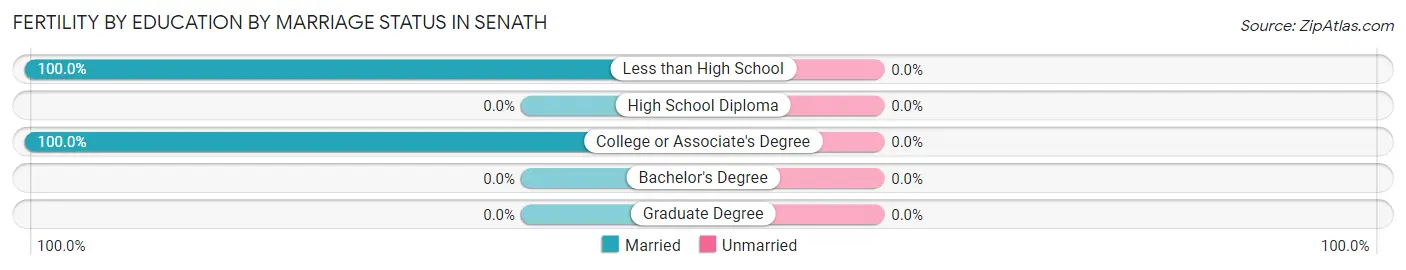
| Educational Attainment | Married | Unmarried |
| Less than High School | 3 (100.0%) | 0 (0.0%) |
| High School Diploma | 0 (0.0%) | 0 (0.0%) |
| College or Associate's Degree | 3 (100.0%) | 0 (0.0%) |
| Bachelor's Degree | 0 (0.0%) | 0 (0.0%) |
| Graduate Degree | 0 (0.0%) | 0 (0.0%) |
| Total | 6 (100.0%) | 0 (0.0%) |
Employment Characteristics in Senath
Employment by Class of Employer in Senath
Among the 523 employed individuals in Senath, private company employees (419 | 80.1%), state government employees (34 | 6.5%), and self-employed (not incorporated) (26 | 5.0%) make up the most common classes of employment.
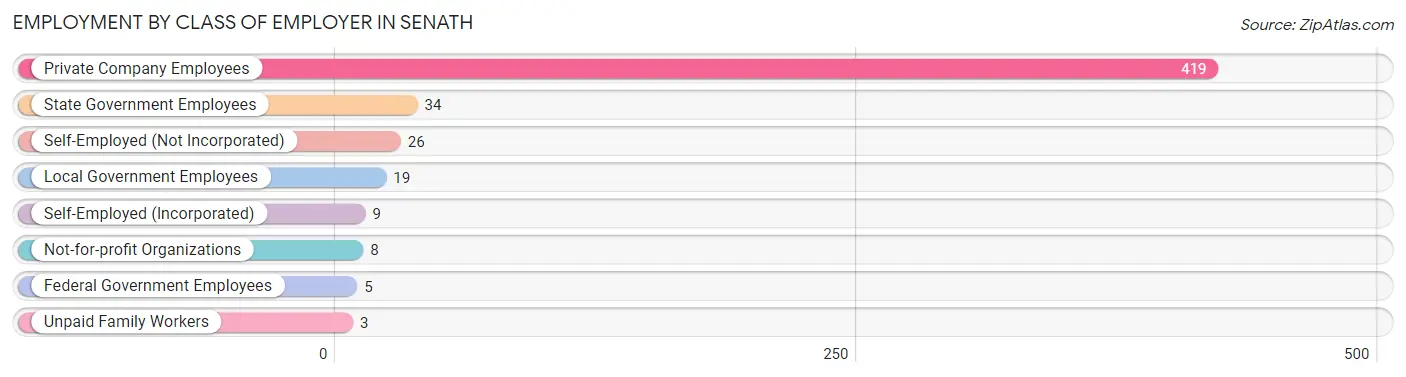
| Employer Class | # Employees | % Employees |
| Private Company Employees | 419 | 80.1% |
| Self-Employed (Incorporated) | 9 | 1.7% |
| Self-Employed (Not Incorporated) | 26 | 5.0% |
| Not-for-profit Organizations | 8 | 1.5% |
| Local Government Employees | 19 | 3.6% |
| State Government Employees | 34 | 6.5% |
| Federal Government Employees | 5 | 1.0% |
| Unpaid Family Workers | 3 | 0.6% |
| Total | 523 | 100.0% |
Employment Status by Age in Senath
According to the labor force statistics for Senath, out of the total population over 16 years of age (1,206), 46.9% or 566 individuals are in the labor force, with 4.9% or 28 of them unemployed. The age group with the highest labor force participation rate is 30 to 34 years, with 80.8% or 84 individuals in the labor force. Within the labor force, the 30 to 34 years age range has the highest percentage of unemployed individuals, with 27.4% or 23 of them being unemployed.
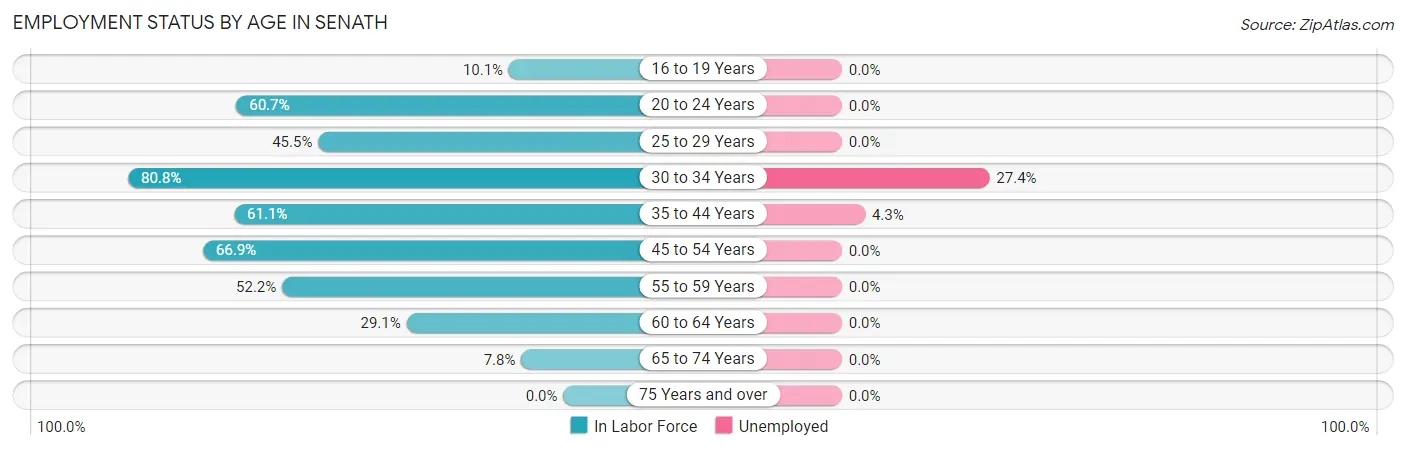
| Age Bracket | In Labor Force | Unemployed |
| 16 to 19 Years | 9 (10.1%) | 0 (0.0%) |
| 20 to 24 Years | 85 (60.7%) | 0 (0.0%) |
| 25 to 29 Years | 35 (45.5%) | 0 (0.0%) |
| 30 to 34 Years | 84 (80.8%) | 23 (27.4%) |
| 35 to 44 Years | 116 (61.1%) | 5 (4.3%) |
| 45 to 54 Years | 158 (66.9%) | 0 (0.0%) |
| 55 to 59 Years | 48 (52.2%) | 0 (0.0%) |
| 60 to 64 Years | 23 (29.1%) | 0 (0.0%) |
| 65 to 74 Years | 8 (7.8%) | 0 (0.0%) |
| 75 Years and over | 0 (0.0%) | 0 (0.0%) |
| Total | 566 (46.9%) | 28 (4.9%) |
Employment Status by Educational Attainment in Senath
According to labor force statistics for Senath, 59.6% of individuals (464) out of the total population between 25 and 64 years of age (778) are in the labor force, with 6.0% or 28 of them being unemployed. The group with the highest labor force participation rate are those with the educational attainment of college / associate degree, with 81.5% or 119 individuals in the labor force. Within the labor force, individuals with college / associate degree education have the highest percentage of unemployment, with 10.9% or 13 of them being unemployed.
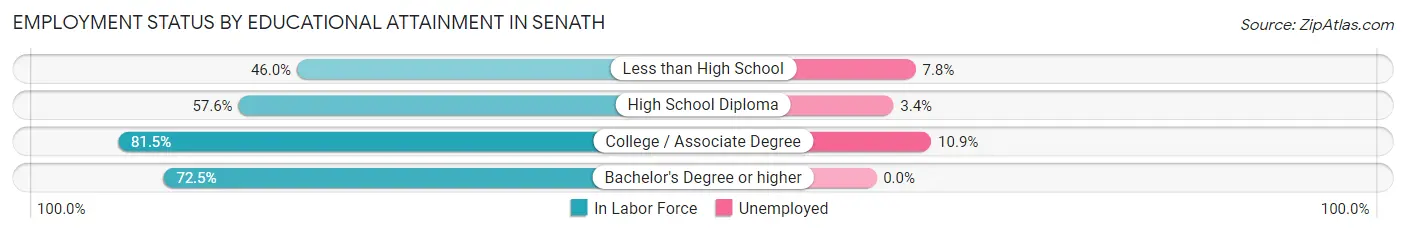
| Educational Attainment | In Labor Force | Unemployed |
| Less than High School | 116 (46.0%) | 20 (7.8%) |
| High School Diploma | 179 (57.6%) | 11 (3.4%) |
| College / Associate Degree | 119 (81.5%) | 16 (10.9%) |
| Bachelor's Degree or higher | 50 (72.5%) | 0 (0.0%) |
| Total | 464 (59.6%) | 47 (6.0%) |
Employment Occupations by Sex in Senath
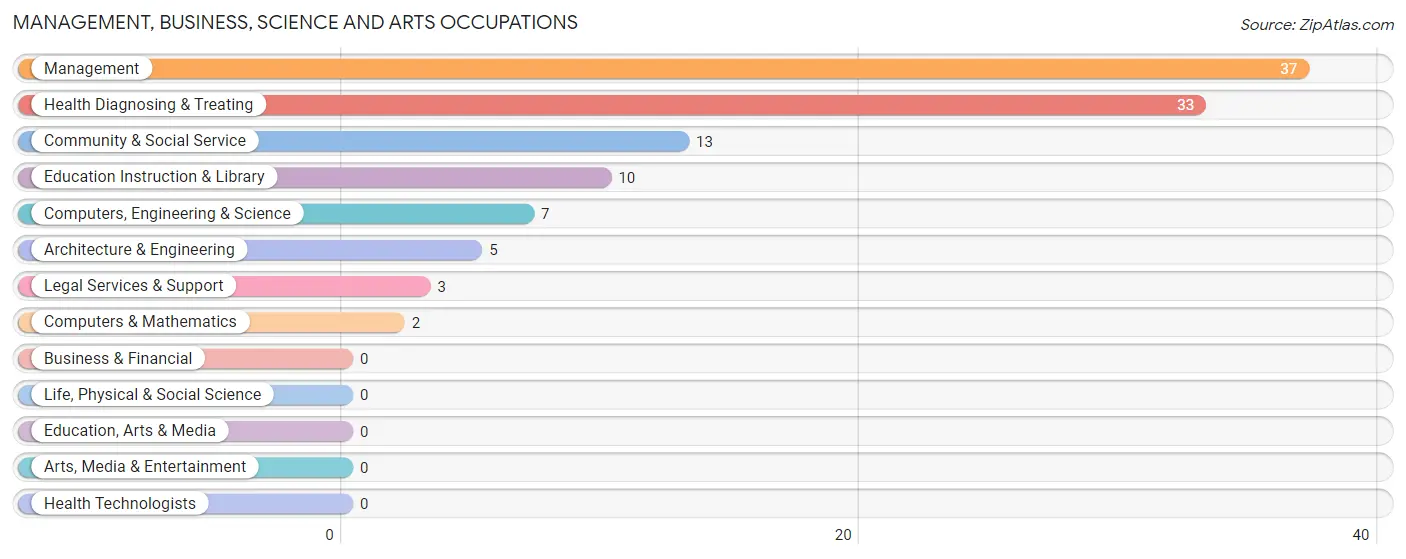
Management, Business, Science and Arts Occupations
The most common Management, Business, Science and Arts occupations in Senath are Management (37 | 6.9%), Health Diagnosing & Treating (33 | 6.1%), Community & Social Service (13 | 2.4%), Education Instruction & Library (10 | 1.9%), and Computers, Engineering & Science (7 | 1.3%).
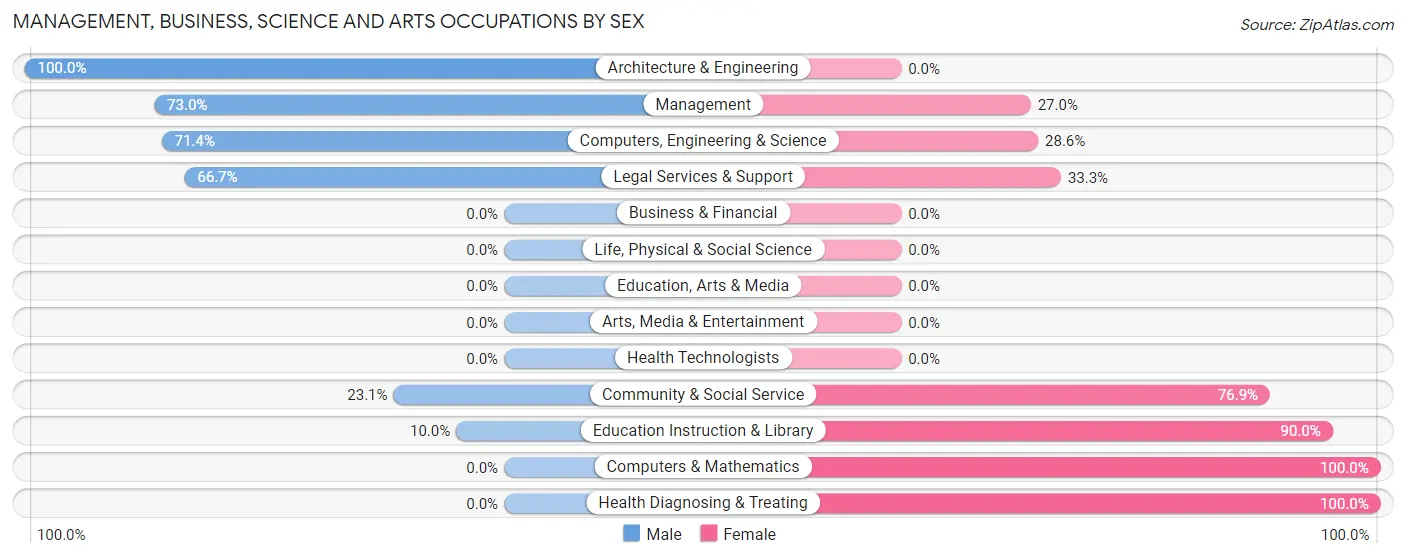
Management, Business, Science and Arts Occupations by Sex
Within the Management, Business, Science and Arts occupations in Senath, the most male-oriented occupations are Architecture & Engineering (100.0%), Management (73.0%), and Computers, Engineering & Science (71.4%), while the most female-oriented occupations are Computers & Mathematics (100.0%), Health Diagnosing & Treating (100.0%), and Education Instruction & Library (90.0%).
| Occupation | Male | Female |
| Management | 27 (73.0%) | 10 (27.0%) |
| Business & Financial | 0 (0.0%) | 0 (0.0%) |
| Computers, Engineering & Science | 5 (71.4%) | 2 (28.6%) |
| Computers & Mathematics | 0 (0.0%) | 2 (100.0%) |
| Architecture & Engineering | 5 (100.0%) | 0 (0.0%) |
| Life, Physical & Social Science | 0 (0.0%) | 0 (0.0%) |
| Community & Social Service | 3 (23.1%) | 10 (76.9%) |
| Education, Arts & Media | 0 (0.0%) | 0 (0.0%) |
| Legal Services & Support | 2 (66.7%) | 1 (33.3%) |
| Education Instruction & Library | 1 (10.0%) | 9 (90.0%) |
| Arts, Media & Entertainment | 0 (0.0%) | 0 (0.0%) |
| Health Diagnosing & Treating | 0 (0.0%) | 33 (100.0%) |
| Health Technologists | 0 (0.0%) | 0 (0.0%) |
| Total (Category) | 35 (38.9%) | 55 (61.1%) |
| Total (Overall) | 361 (67.1%) | 177 (32.9%) |
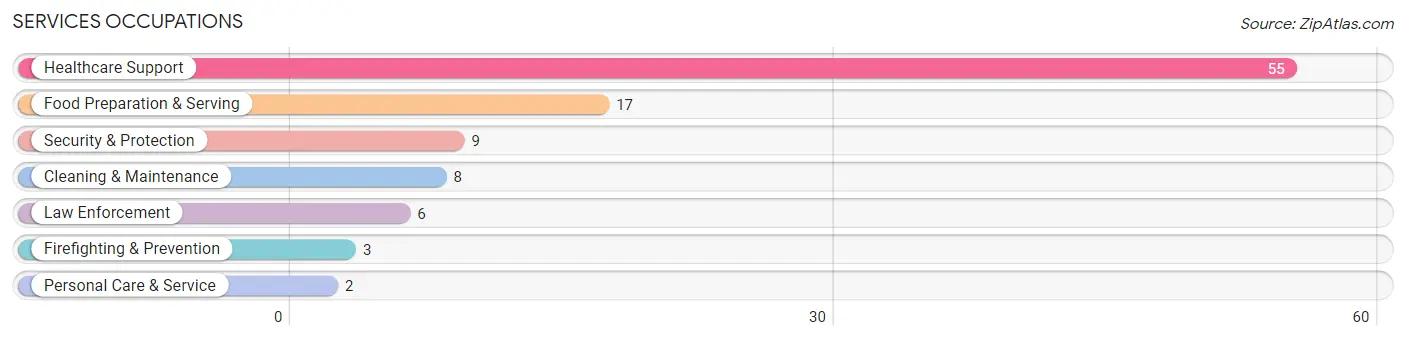
Services Occupations
The most common Services occupations in Senath are Healthcare Support (55 | 10.2%), Food Preparation & Serving (17 | 3.2%), Security & Protection (9 | 1.7%), Cleaning & Maintenance (8 | 1.5%), and Law Enforcement (6 | 1.1%).
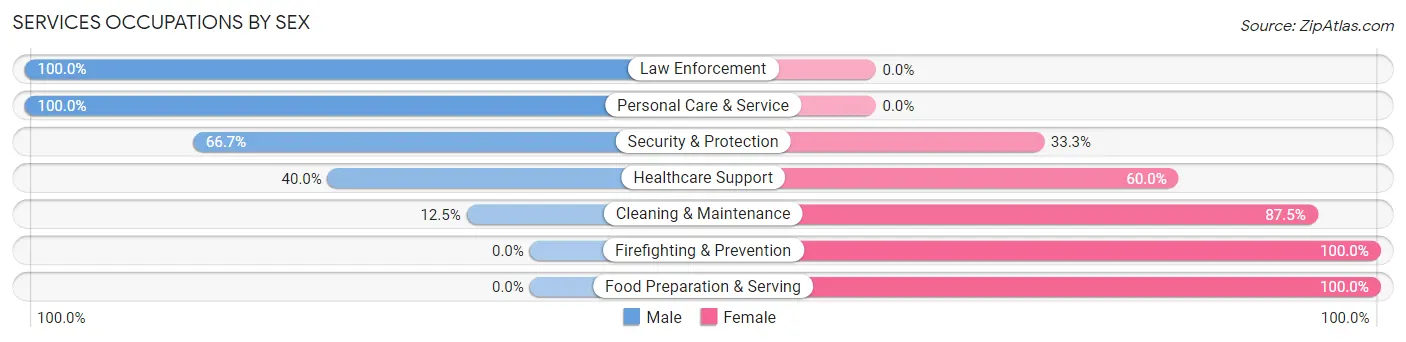
Services Occupations by Sex
Within the Services occupations in Senath, the most male-oriented occupations are Law Enforcement (100.0%), Personal Care & Service (100.0%), and Security & Protection (66.7%), while the most female-oriented occupations are Firefighting & Prevention (100.0%), Food Preparation & Serving (100.0%), and Cleaning & Maintenance (87.5%).
| Occupation | Male | Female |
| Healthcare Support | 22 (40.0%) | 33 (60.0%) |
| Security & Protection | 6 (66.7%) | 3 (33.3%) |
| Firefighting & Prevention | 0 (0.0%) | 3 (100.0%) |
| Law Enforcement | 6 (100.0%) | 0 (0.0%) |
| Food Preparation & Serving | 0 (0.0%) | 17 (100.0%) |
| Cleaning & Maintenance | 1 (12.5%) | 7 (87.5%) |
| Personal Care & Service | 2 (100.0%) | 0 (0.0%) |
| Total (Category) | 31 (34.1%) | 60 (65.9%) |
| Total (Overall) | 361 (67.1%) | 177 (32.9%) |
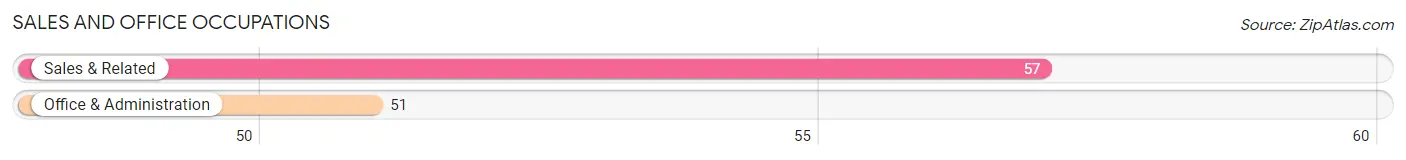
Sales and Office Occupations
The most common Sales and Office occupations in Senath are Sales & Related (57 | 10.6%), and Office & Administration (51 | 9.5%).
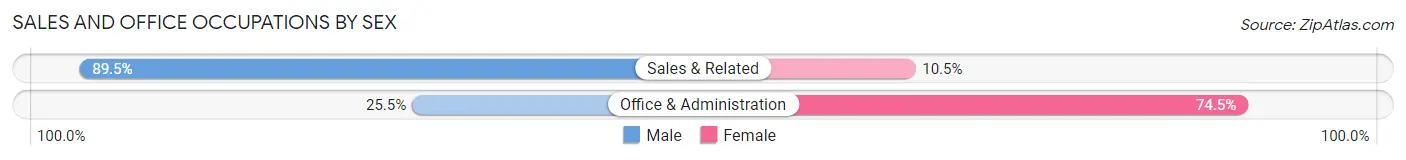
Sales and Office Occupations by Sex
| Occupation | Male | Female |
| Sales & Related | 51 (89.5%) | 6 (10.5%) |
| Office & Administration | 13 (25.5%) | 38 (74.5%) |
| Total (Category) | 64 (59.3%) | 44 (40.7%) |
| Total (Overall) | 361 (67.1%) | 177 (32.9%) |
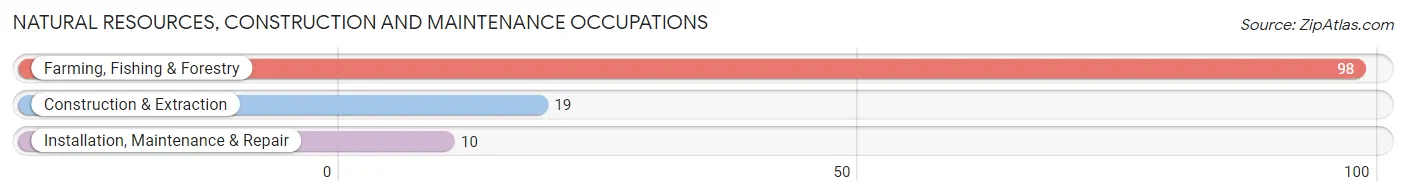
Natural Resources, Construction and Maintenance Occupations
The most common Natural Resources, Construction and Maintenance occupations in Senath are Farming, Fishing & Forestry (98 | 18.2%), Construction & Extraction (19 | 3.5%), and Installation, Maintenance & Repair (10 | 1.9%).
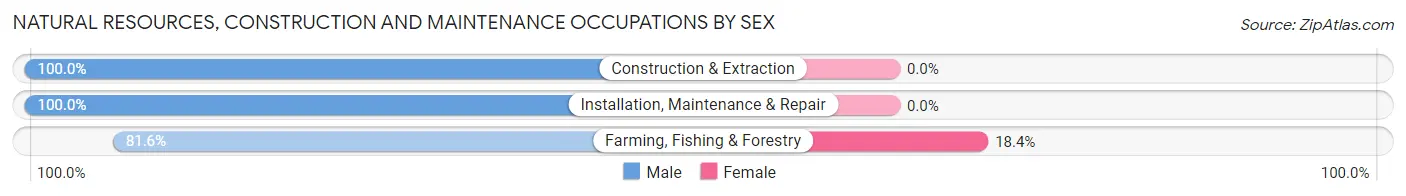
Natural Resources, Construction and Maintenance Occupations by Sex
| Occupation | Male | Female |
| Farming, Fishing & Forestry | 80 (81.6%) | 18 (18.4%) |
| Construction & Extraction | 19 (100.0%) | 0 (0.0%) |
| Installation, Maintenance & Repair | 10 (100.0%) | 0 (0.0%) |
| Total (Category) | 109 (85.8%) | 18 (14.2%) |
| Total (Overall) | 361 (67.1%) | 177 (32.9%) |
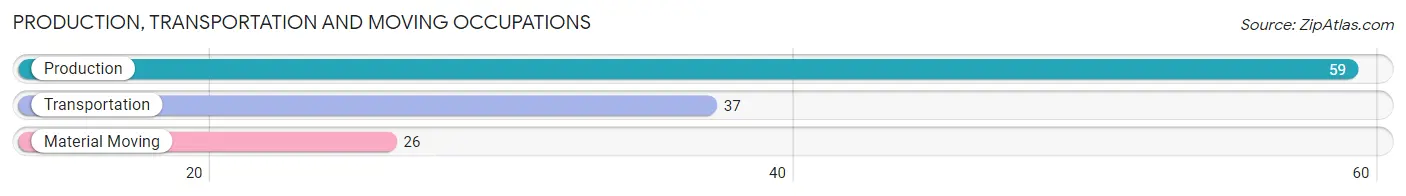
Production, Transportation and Moving Occupations
The most common Production, Transportation and Moving occupations in Senath are Production (59 | 11.0%), Transportation (37 | 6.9%), and Material Moving (26 | 4.8%).
Production, Transportation and Moving Occupations by Sex
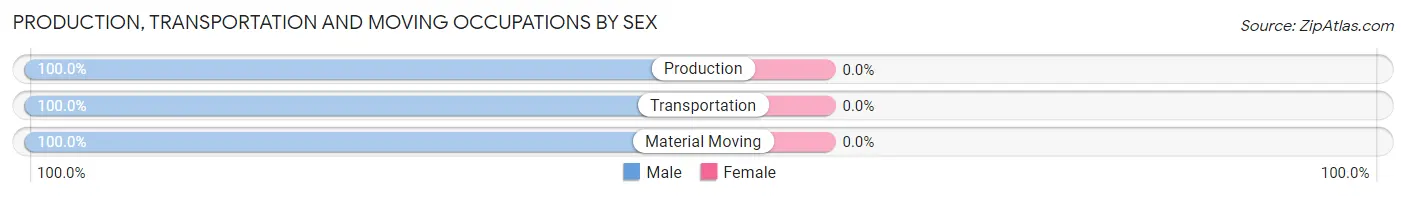
| Occupation | Male | Female |
| Production | 59 (100.0%) | 0 (0.0%) |
| Transportation | 37 (100.0%) | 0 (0.0%) |
| Material Moving | 26 (100.0%) | 0 (0.0%) |
| Total (Category) | 122 (100.0%) | 0 (0.0%) |
| Total (Overall) | 361 (67.1%) | 177 (32.9%) |
Employment Industries by Sex in Senath
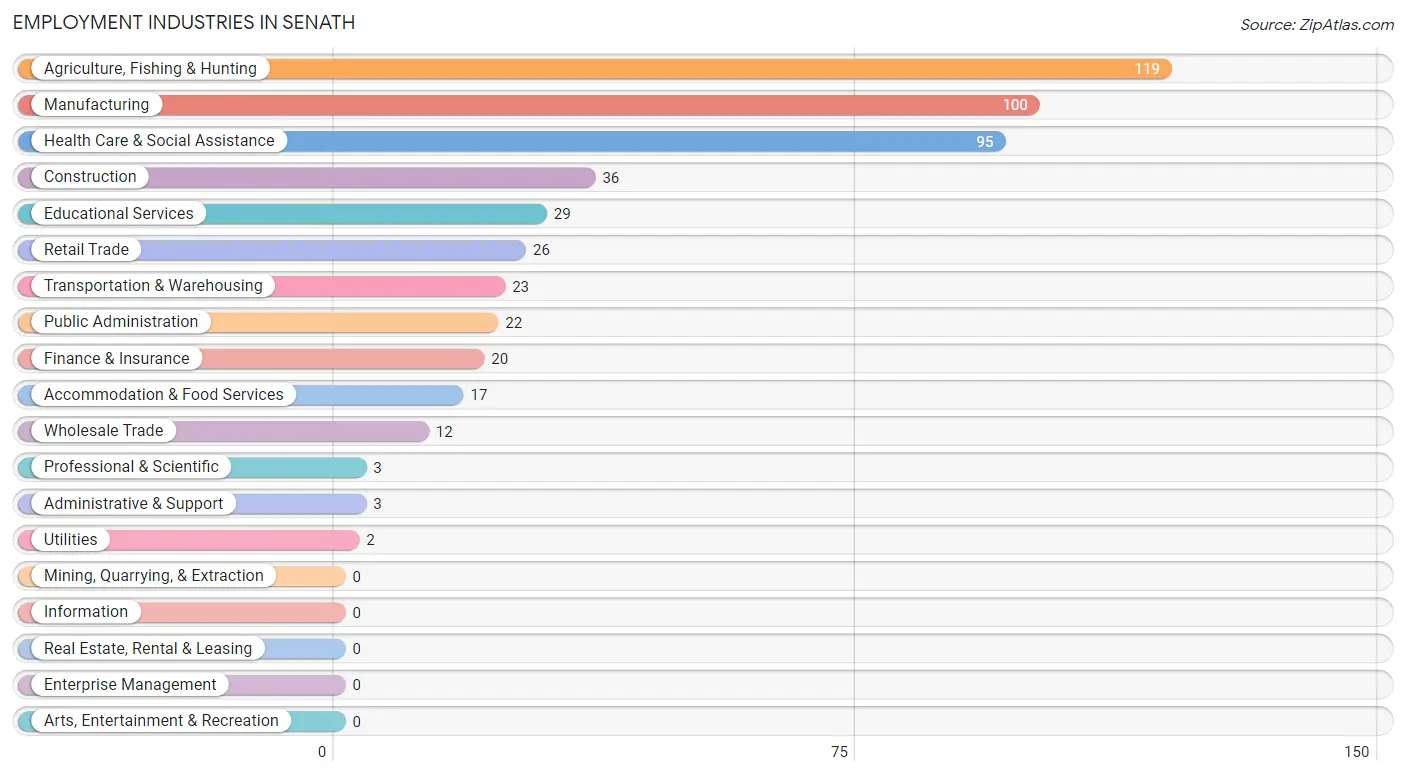
Employment Industries in Senath
The major employment industries in Senath include Agriculture, Fishing & Hunting (119 | 22.1%), Manufacturing (100 | 18.6%), Health Care & Social Assistance (95 | 17.7%), Construction (36 | 6.7%), and Educational Services (29 | 5.4%).
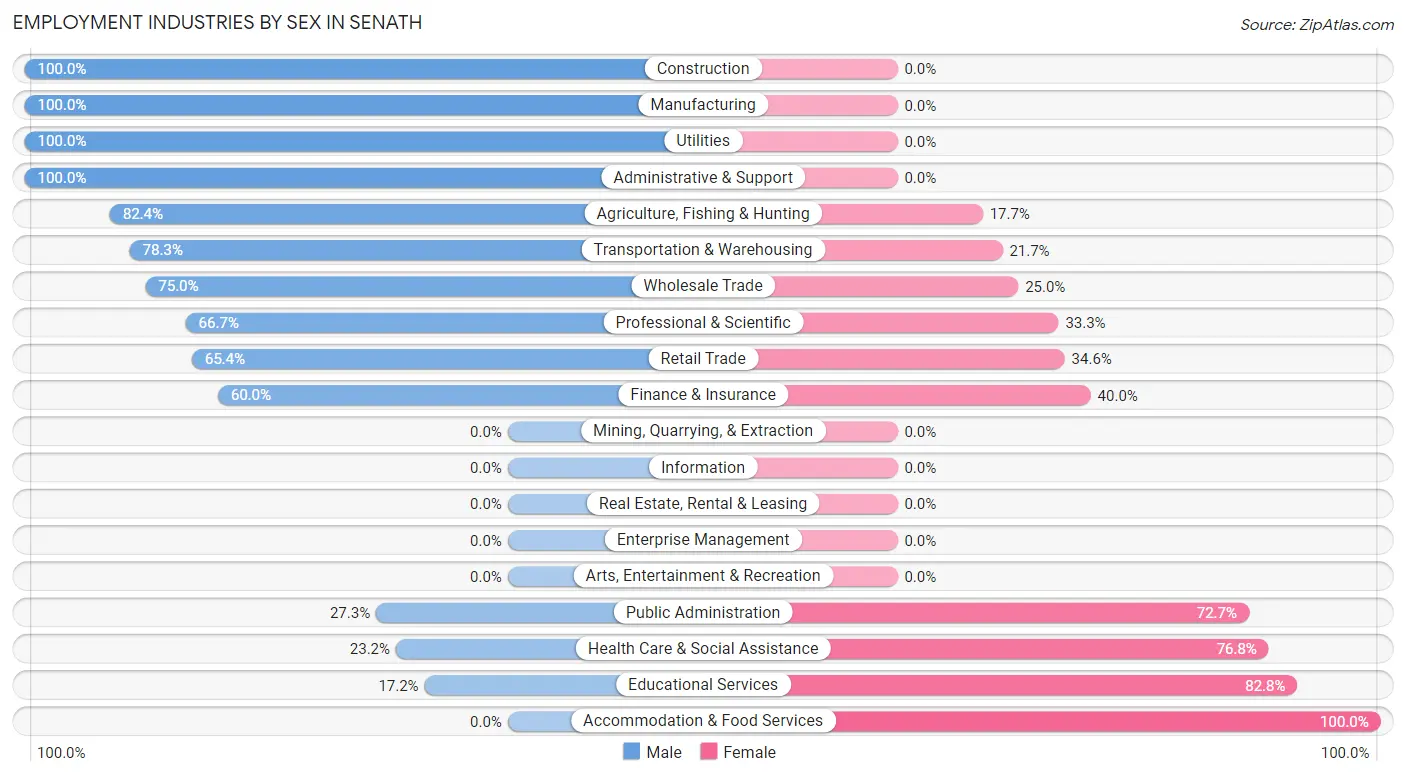
Employment Industries by Sex in Senath
The Senath industries that see more men than women are Construction (100.0%), Manufacturing (100.0%), and Utilities (100.0%), whereas the industries that tend to have a higher number of women are Accommodation & Food Services (100.0%), Educational Services (82.8%), and Health Care & Social Assistance (76.8%).
| Industry | Male | Female |
| Agriculture, Fishing & Hunting | 98 (82.4%) | 21 (17.6%) |
| Mining, Quarrying, & Extraction | 0 (0.0%) | 0 (0.0%) |
| Construction | 36 (100.0%) | 0 (0.0%) |
| Manufacturing | 100 (100.0%) | 0 (0.0%) |
| Wholesale Trade | 9 (75.0%) | 3 (25.0%) |
| Retail Trade | 17 (65.4%) | 9 (34.6%) |
| Transportation & Warehousing | 18 (78.3%) | 5 (21.7%) |
| Utilities | 2 (100.0%) | 0 (0.0%) |
| Information | 0 (0.0%) | 0 (0.0%) |
| Finance & Insurance | 12 (60.0%) | 8 (40.0%) |
| Real Estate, Rental & Leasing | 0 (0.0%) | 0 (0.0%) |
| Professional & Scientific | 2 (66.7%) | 1 (33.3%) |
| Enterprise Management | 0 (0.0%) | 0 (0.0%) |
| Administrative & Support | 3 (100.0%) | 0 (0.0%) |
| Educational Services | 5 (17.2%) | 24 (82.8%) |
| Health Care & Social Assistance | 22 (23.2%) | 73 (76.8%) |
| Arts, Entertainment & Recreation | 0 (0.0%) | 0 (0.0%) |
| Accommodation & Food Services | 0 (0.0%) | 17 (100.0%) |
| Public Administration | 6 (27.3%) | 16 (72.7%) |
| Total | 361 (67.1%) | 177 (32.9%) |
Education in Senath
School Enrollment in Senath
The most common levels of schooling among the 411 students in Senath are elementary school (133 | 32.4%), high school (101 | 24.6%), and nursery / preschool (74 | 18.0%).
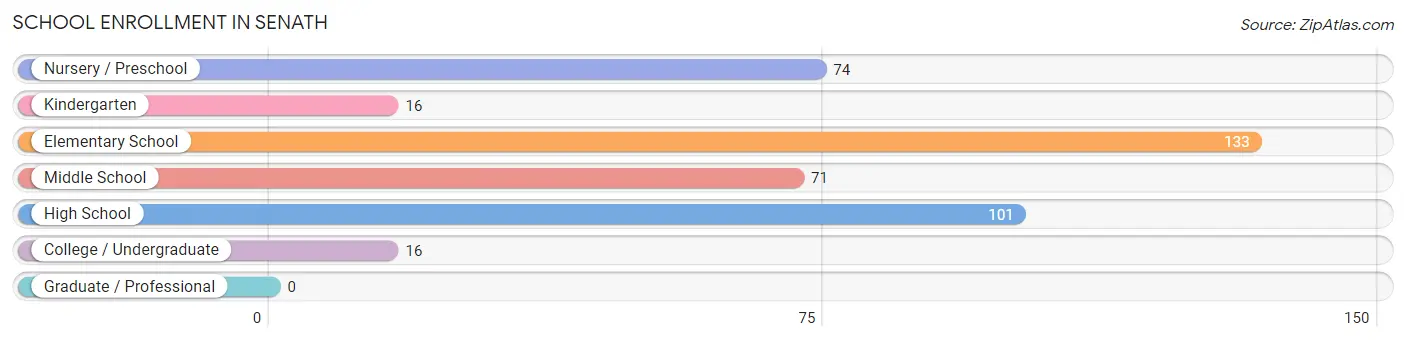
| School Level | # Students | % Students |
| Nursery / Preschool | 74 | 18.0% |
| Kindergarten | 16 | 3.9% |
| Elementary School | 133 | 32.4% |
| Middle School | 71 | 17.3% |
| High School | 101 | 24.6% |
| College / Undergraduate | 16 | 3.9% |
| Graduate / Professional | 0 | 0.0% |
| Total | 411 | 100.0% |
School Enrollment by Age by Funding Source in Senath
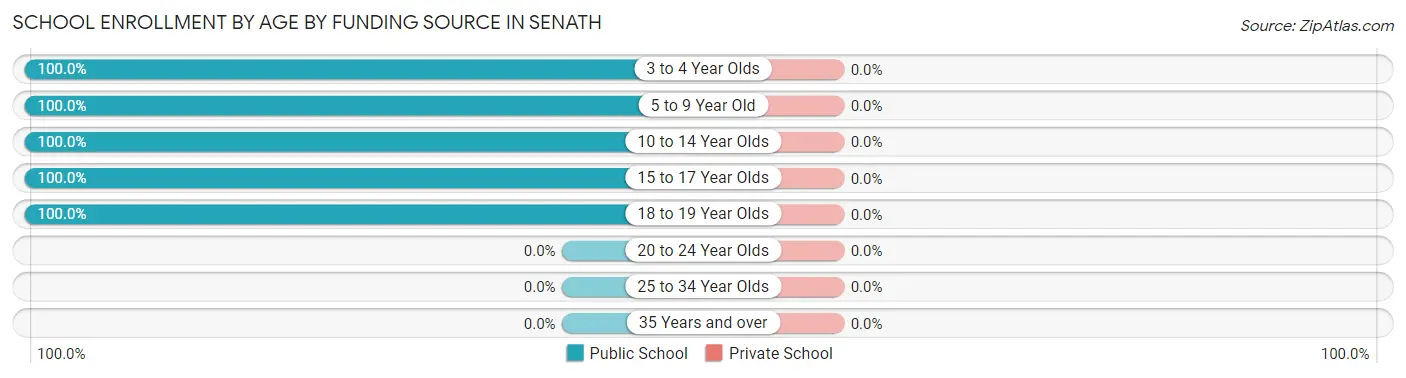
| Age Bracket | Public School | Private School |
| 3 to 4 Year Olds | 78 (100.0%) | 0 (0.0%) |
| 5 to 9 Year Old | 118 (100.0%) | 0 (0.0%) |
| 10 to 14 Year Olds | 103 (100.0%) | 0 (0.0%) |
| 15 to 17 Year Olds | 89 (100.0%) | 0 (0.0%) |
| 18 to 19 Year Olds | 23 (100.0%) | 0 (0.0%) |
| 20 to 24 Year Olds | 0 (0.0%) | 0 (0.0%) |
| 25 to 34 Year Olds | 0 (0.0%) | 0 (0.0%) |
| 35 Years and over | 0 (0.0%) | 0 (0.0%) |
| Total | 411 (100.0%) | 0 (0.0%) |
Educational Attainment by Field of Study in Senath
Education (40 | 43.5%), science & technology (10 | 10.9%), arts & humanities (10 | 10.9%), engineering (9 | 9.8%), and computers & mathematics (7 | 7.6%) are the most common fields of study among 92 individuals in Senath who have obtained a bachelor's degree or higher.
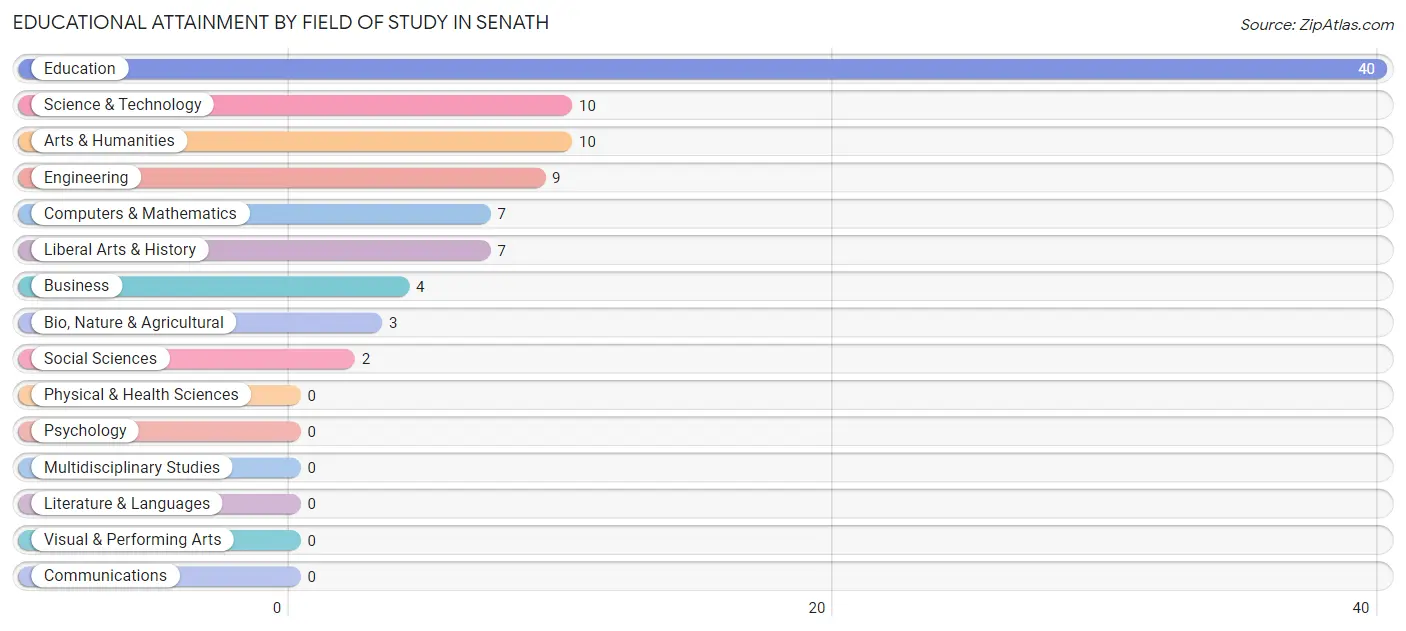
| Field of Study | # Graduates | % Graduates |
| Computers & Mathematics | 7 | 7.6% |
| Bio, Nature & Agricultural | 3 | 3.3% |
| Physical & Health Sciences | 0 | 0.0% |
| Psychology | 0 | 0.0% |
| Social Sciences | 2 | 2.2% |
| Engineering | 9 | 9.8% |
| Multidisciplinary Studies | 0 | 0.0% |
| Science & Technology | 10 | 10.9% |
| Business | 4 | 4.3% |
| Education | 40 | 43.5% |
| Literature & Languages | 0 | 0.0% |
| Liberal Arts & History | 7 | 7.6% |
| Visual & Performing Arts | 0 | 0.0% |
| Communications | 0 | 0.0% |
| Arts & Humanities | 10 | 10.9% |
| Total | 92 | 100.0% |
Transportation & Commute in Senath
Vehicle Availability by Sex in Senath
The most prevalent vehicle ownership categories in Senath are males with 3 vehicles (111, accounting for 30.7%) and females with 3 vehicles (42, making up 68.5%).
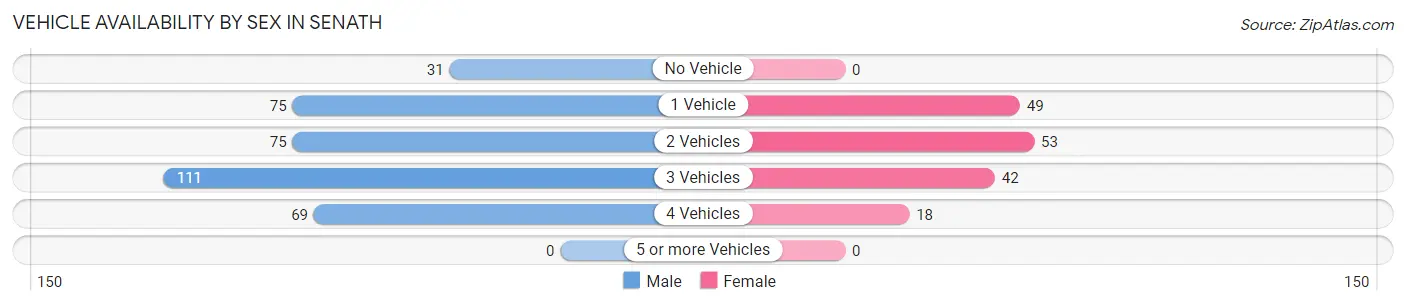
| Vehicles Available | Male | Female |
| No Vehicle | 31 (8.6%) | 0 (0.0%) |
| 1 Vehicle | 75 (20.8%) | 49 (30.2%) |
| 2 Vehicles | 75 (20.8%) | 53 (32.7%) |
| 3 Vehicles | 111 (30.7%) | 42 (25.9%) |
| 4 Vehicles | 69 (19.1%) | 18 (11.1%) |
| 5 or more Vehicles | 0 (0.0%) | 0 (0.0%) |
| Total | 361 (100.0%) | 162 (100.0%) |
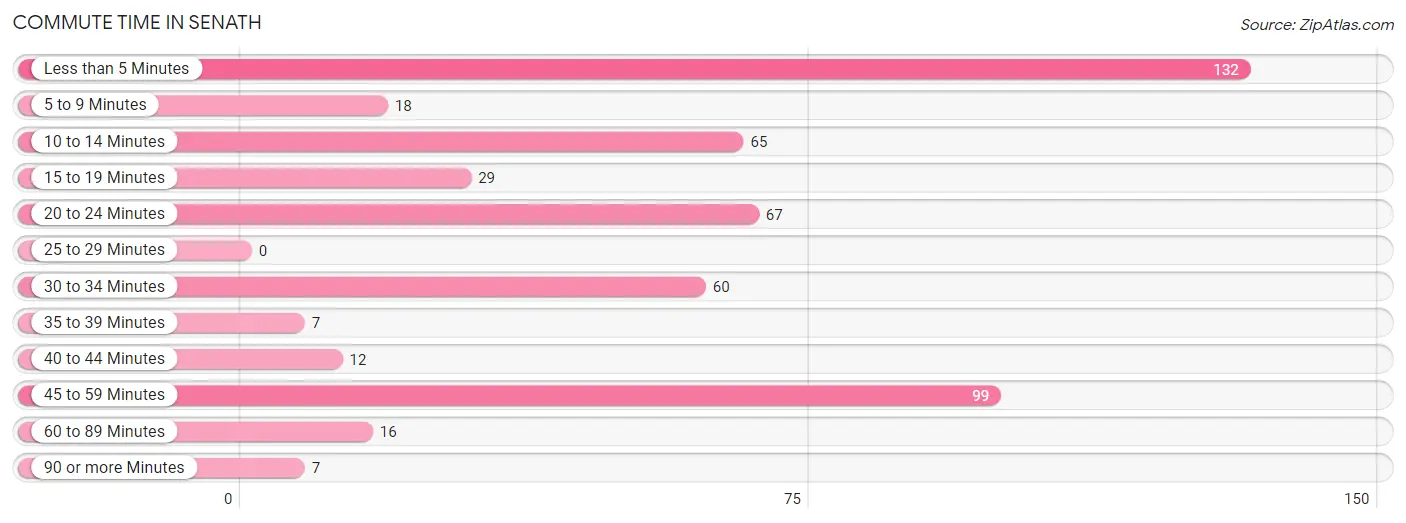
Commute Time in Senath
The most frequently occuring commute durations in Senath are less than 5 minutes (132 commuters, 25.8%), 45 to 59 minutes (99 commuters, 19.3%), and 20 to 24 minutes (67 commuters, 13.1%).
| Commute Time | # Commuters | % Commuters |
| Less than 5 Minutes | 132 | 25.8% |
| 5 to 9 Minutes | 18 | 3.5% |
| 10 to 14 Minutes | 65 | 12.7% |
| 15 to 19 Minutes | 29 | 5.7% |
| 20 to 24 Minutes | 67 | 13.1% |
| 25 to 29 Minutes | 0 | 0.0% |
| 30 to 34 Minutes | 60 | 11.7% |
| 35 to 39 Minutes | 7 | 1.4% |
| 40 to 44 Minutes | 12 | 2.3% |
| 45 to 59 Minutes | 99 | 19.3% |
| 60 to 89 Minutes | 16 | 3.1% |
| 90 or more Minutes | 7 | 1.4% |
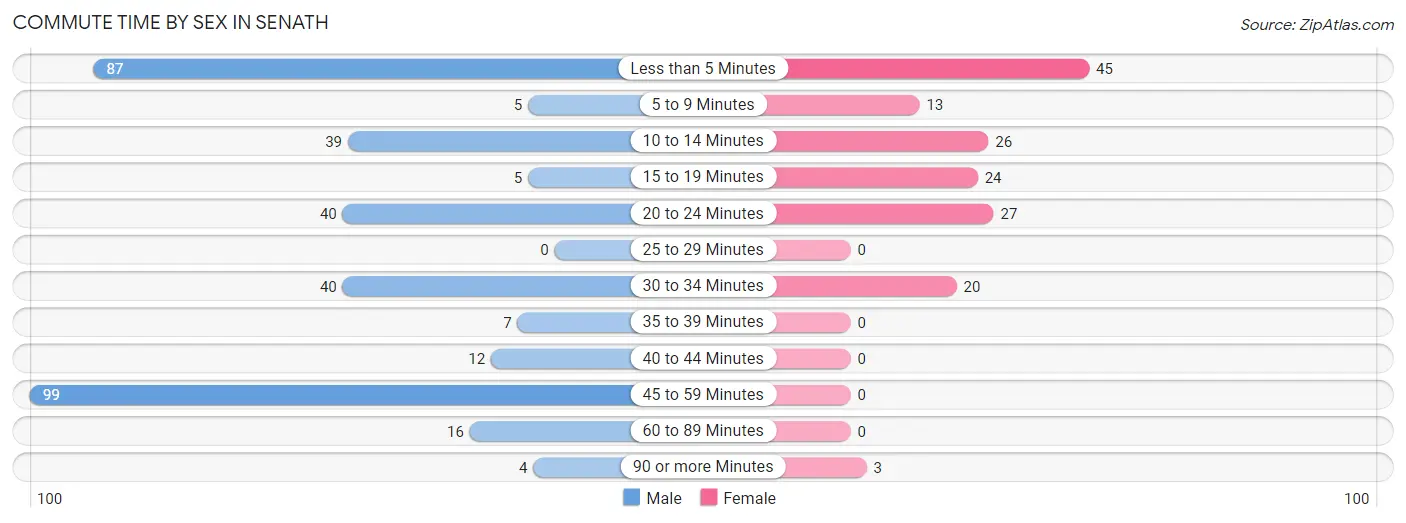
Commute Time by Sex in Senath
The most common commute times in Senath are 45 to 59 minutes (99 commuters, 28.0%) for males and less than 5 minutes (45 commuters, 28.5%) for females.
| Commute Time | Male | Female |
| Less than 5 Minutes | 87 (24.6%) | 45 (28.5%) |
| 5 to 9 Minutes | 5 (1.4%) | 13 (8.2%) |
| 10 to 14 Minutes | 39 (11.0%) | 26 (16.5%) |
| 15 to 19 Minutes | 5 (1.4%) | 24 (15.2%) |
| 20 to 24 Minutes | 40 (11.3%) | 27 (17.1%) |
| 25 to 29 Minutes | 0 (0.0%) | 0 (0.0%) |
| 30 to 34 Minutes | 40 (11.3%) | 20 (12.7%) |
| 35 to 39 Minutes | 7 (2.0%) | 0 (0.0%) |
| 40 to 44 Minutes | 12 (3.4%) | 0 (0.0%) |
| 45 to 59 Minutes | 99 (28.0%) | 0 (0.0%) |
| 60 to 89 Minutes | 16 (4.5%) | 0 (0.0%) |
| 90 or more Minutes | 4 (1.1%) | 3 (1.9%) |
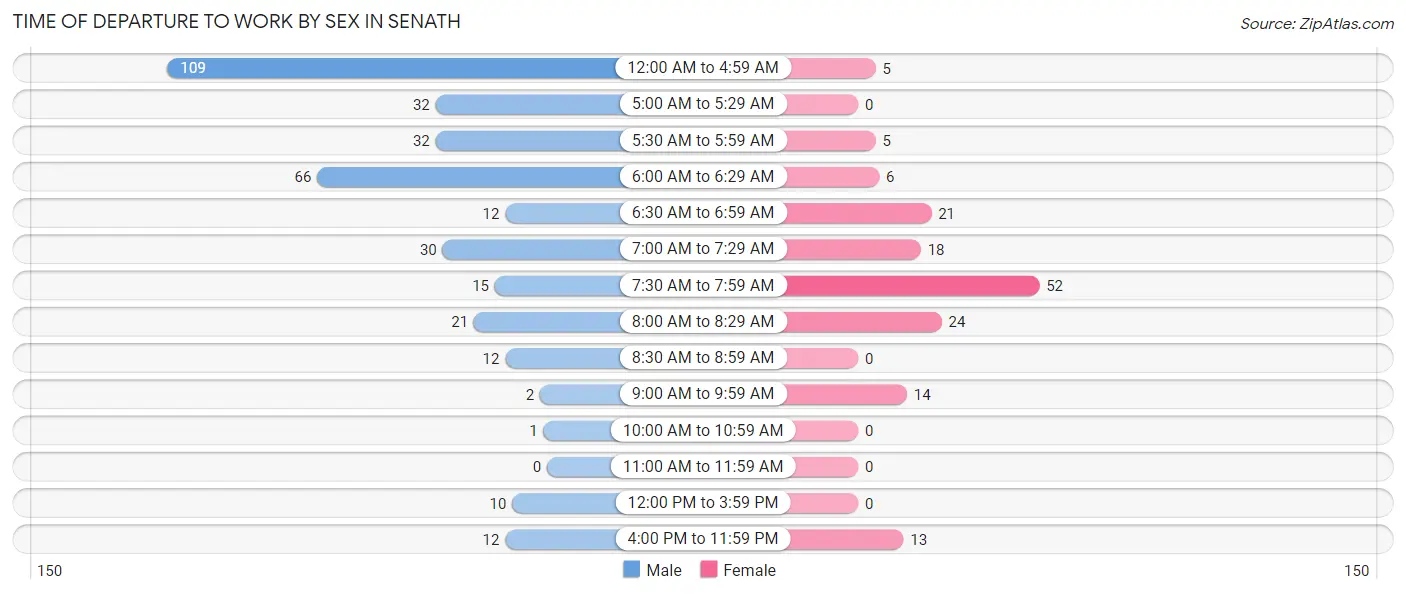
Time of Departure to Work by Sex in Senath
The most frequent times of departure to work in Senath are 12:00 AM to 4:59 AM (109, 30.8%) for males and 7:30 AM to 7:59 AM (52, 32.9%) for females.
| Time of Departure | Male | Female |
| 12:00 AM to 4:59 AM | 109 (30.8%) | 5 (3.2%) |
| 5:00 AM to 5:29 AM | 32 (9.0%) | 0 (0.0%) |
| 5:30 AM to 5:59 AM | 32 (9.0%) | 5 (3.2%) |
| 6:00 AM to 6:29 AM | 66 (18.6%) | 6 (3.8%) |
| 6:30 AM to 6:59 AM | 12 (3.4%) | 21 (13.3%) |
| 7:00 AM to 7:29 AM | 30 (8.5%) | 18 (11.4%) |
| 7:30 AM to 7:59 AM | 15 (4.2%) | 52 (32.9%) |
| 8:00 AM to 8:29 AM | 21 (5.9%) | 24 (15.2%) |
| 8:30 AM to 8:59 AM | 12 (3.4%) | 0 (0.0%) |
| 9:00 AM to 9:59 AM | 2 (0.6%) | 14 (8.9%) |
| 10:00 AM to 10:59 AM | 1 (0.3%) | 0 (0.0%) |
| 11:00 AM to 11:59 AM | 0 (0.0%) | 0 (0.0%) |
| 12:00 PM to 3:59 PM | 10 (2.8%) | 0 (0.0%) |
| 4:00 PM to 11:59 PM | 12 (3.4%) | 13 (8.2%) |
| Total | 354 (100.0%) | 158 (100.0%) |
Housing Occupancy in Senath
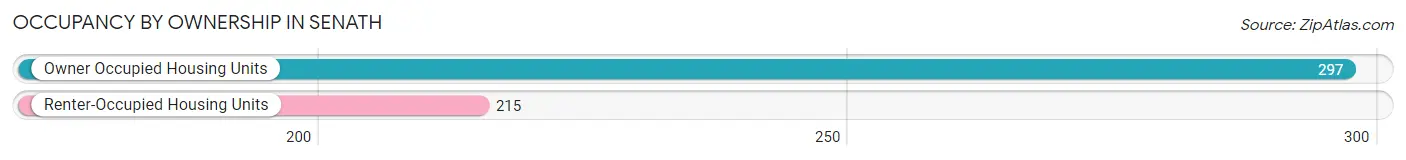
Occupancy by Ownership in Senath
Of the total 512 dwellings in Senath, owner-occupied units account for 297 (58.0%), while renter-occupied units make up 215 (42.0%).
| Occupancy | # Housing Units | % Housing Units |
| Owner Occupied Housing Units | 297 | 58.0% |
| Renter-Occupied Housing Units | 215 | 42.0% |
| Total Occupied Housing Units | 512 | 100.0% |
Occupancy by Household Size in Senath
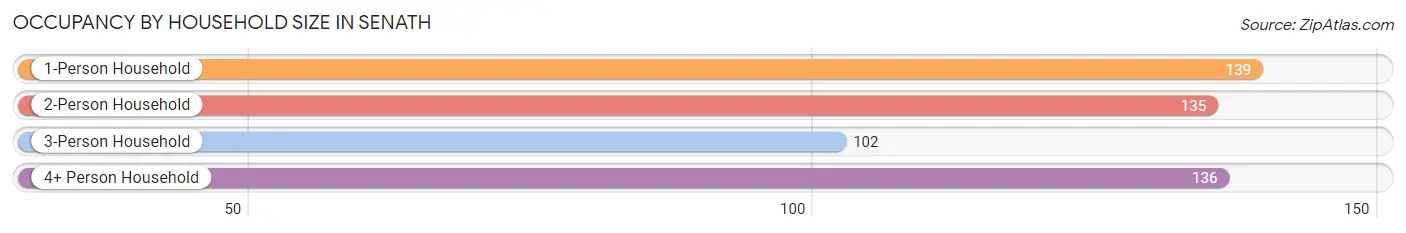
| Household Size | # Housing Units | % Housing Units |
| 1-Person Household | 139 | 27.2% |
| 2-Person Household | 135 | 26.4% |
| 3-Person Household | 102 | 19.9% |
| 4+ Person Household | 136 | 26.6% |
| Total Housing Units | 512 | 100.0% |
Occupancy by Ownership by Household Size in Senath
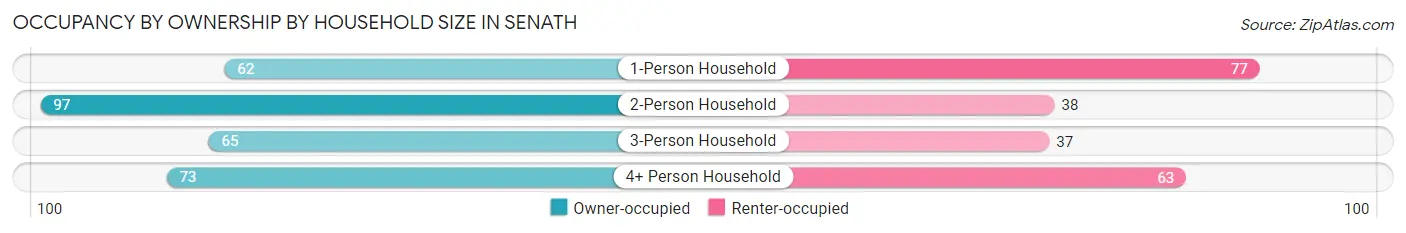
| Household Size | Owner-occupied | Renter-occupied |
| 1-Person Household | 62 (44.6%) | 77 (55.4%) |
| 2-Person Household | 97 (71.9%) | 38 (28.1%) |
| 3-Person Household | 65 (63.7%) | 37 (36.3%) |
| 4+ Person Household | 73 (53.7%) | 63 (46.3%) |
| Total Housing Units | 297 (58.0%) | 215 (42.0%) |
Occupancy by Educational Attainment in Senath
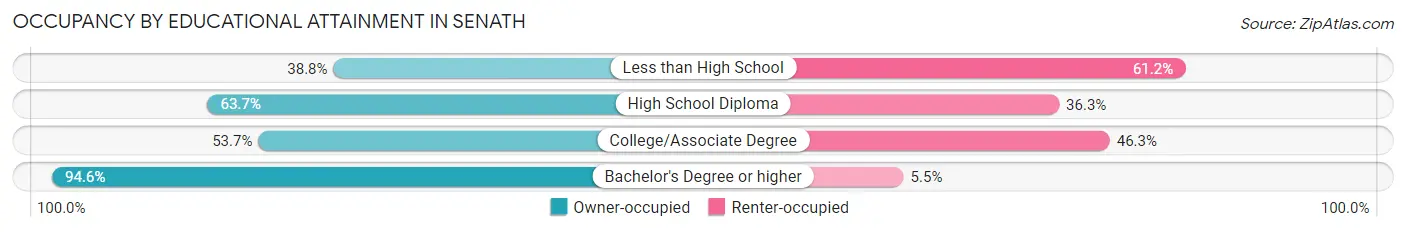
| Household Size | Owner-occupied | Renter-occupied |
| Less than High School | 57 (38.8%) | 90 (61.2%) |
| High School Diploma | 137 (63.7%) | 78 (36.3%) |
| College/Associate Degree | 51 (53.7%) | 44 (46.3%) |
| Bachelor's Degree or higher | 52 (94.6%) | 3 (5.4%) |
Occupancy by Age of Householder in Senath
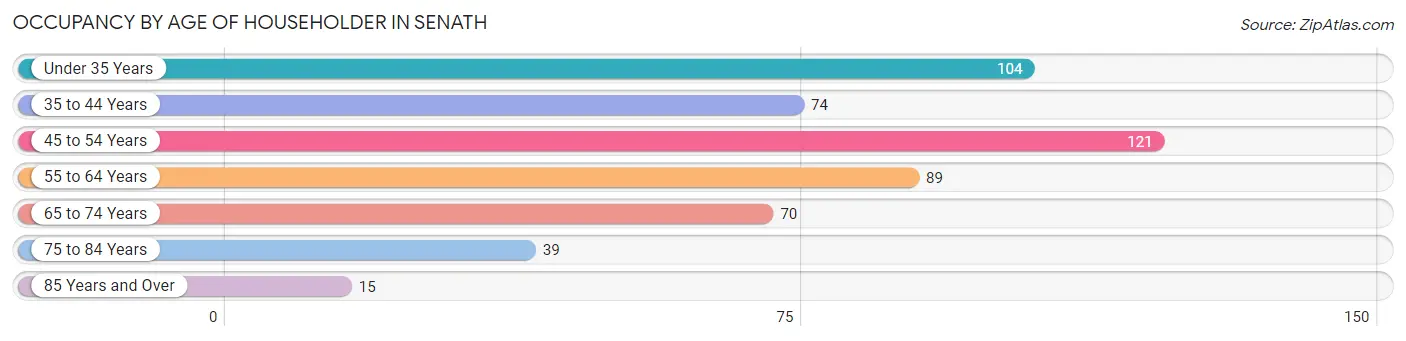
| Age Bracket | # Households | % Households |
| Under 35 Years | 104 | 20.3% |
| 35 to 44 Years | 74 | 14.4% |
| 45 to 54 Years | 121 | 23.6% |
| 55 to 64 Years | 89 | 17.4% |
| 65 to 74 Years | 70 | 13.7% |
| 75 to 84 Years | 39 | 7.6% |
| 85 Years and Over | 15 | 2.9% |
| Total | 512 | 100.0% |
Housing Finances in Senath
Median Income by Occupancy in Senath
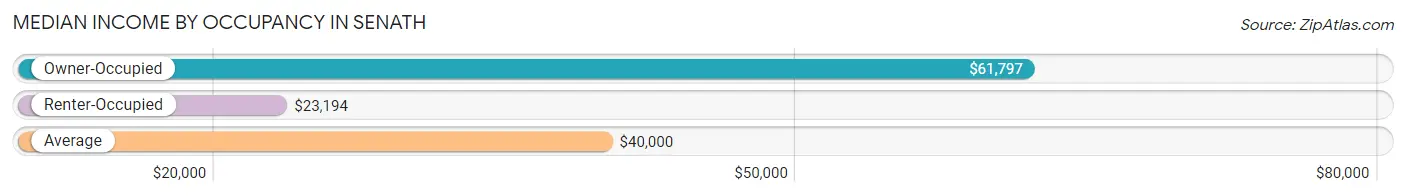
| Occupancy Type | # Households | Median Income |
| Owner-Occupied | 297 (58.0%) | $61,797 |
| Renter-Occupied | 215 (42.0%) | $23,194 |
| Average | 512 (100.0%) | $40,000 |
Occupancy by Householder Income Bracket in Senath
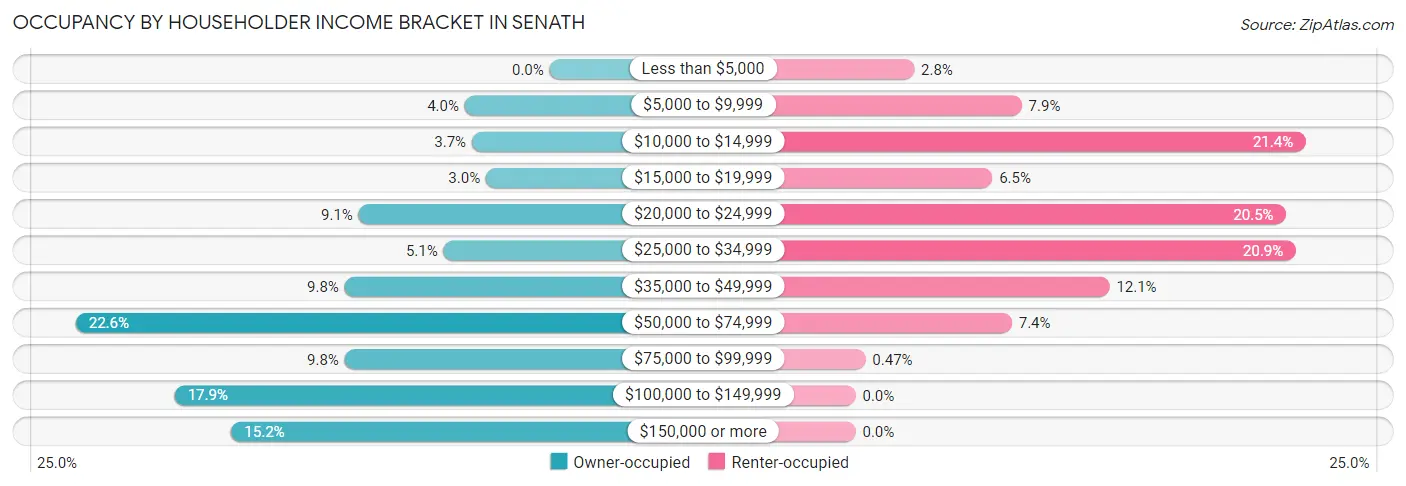
| Income Bracket | Owner-occupied | Renter-occupied |
| Less than $5,000 | 0 (0.0%) | 6 (2.8%) |
| $5,000 to $9,999 | 12 (4.0%) | 17 (7.9%) |
| $10,000 to $14,999 | 11 (3.7%) | 46 (21.4%) |
| $15,000 to $19,999 | 9 (3.0%) | 14 (6.5%) |
| $20,000 to $24,999 | 27 (9.1%) | 44 (20.5%) |
| $25,000 to $34,999 | 15 (5.1%) | 45 (20.9%) |
| $35,000 to $49,999 | 29 (9.8%) | 26 (12.1%) |
| $50,000 to $74,999 | 67 (22.6%) | 16 (7.4%) |
| $75,000 to $99,999 | 29 (9.8%) | 1 (0.5%) |
| $100,000 to $149,999 | 53 (17.8%) | 0 (0.0%) |
| $150,000 or more | 45 (15.1%) | 0 (0.0%) |
| Total | 297 (100.0%) | 215 (100.0%) |
Monthly Housing Cost Tiers in Senath
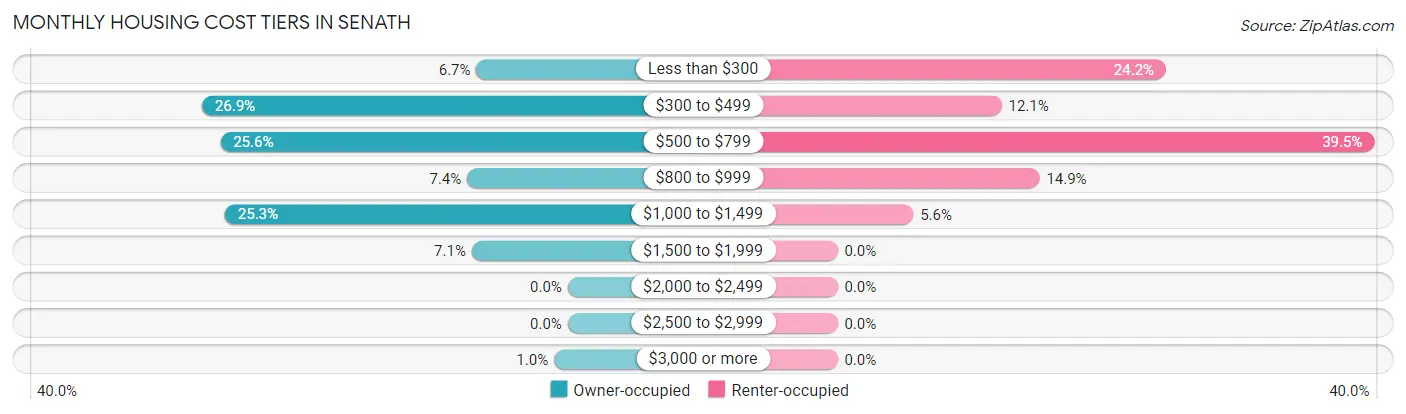
| Monthly Cost | Owner-occupied | Renter-occupied |
| Less than $300 | 20 (6.7%) | 52 (24.2%) |
| $300 to $499 | 80 (26.9%) | 26 (12.1%) |
| $500 to $799 | 76 (25.6%) | 85 (39.5%) |
| $800 to $999 | 22 (7.4%) | 32 (14.9%) |
| $1,000 to $1,499 | 75 (25.3%) | 12 (5.6%) |
| $1,500 to $1,999 | 21 (7.1%) | 0 (0.0%) |
| $2,000 to $2,499 | 0 (0.0%) | 0 (0.0%) |
| $2,500 to $2,999 | 0 (0.0%) | 0 (0.0%) |
| $3,000 or more | 3 (1.0%) | 0 (0.0%) |
| Total | 297 (100.0%) | 215 (100.0%) |
Physical Housing Characteristics in Senath
Housing Structures in Senath
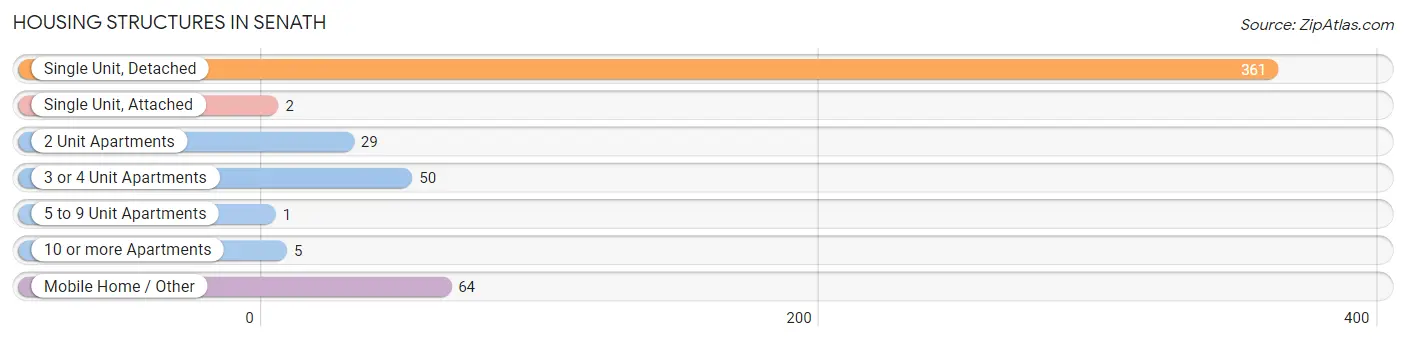
| Structure Type | # Housing Units | % Housing Units |
| Single Unit, Detached | 361 | 70.5% |
| Single Unit, Attached | 2 | 0.4% |
| 2 Unit Apartments | 29 | 5.7% |
| 3 or 4 Unit Apartments | 50 | 9.8% |
| 5 to 9 Unit Apartments | 1 | 0.2% |
| 10 or more Apartments | 5 | 1.0% |
| Mobile Home / Other | 64 | 12.5% |
| Total | 512 | 100.0% |
Housing Structures by Occupancy in Senath
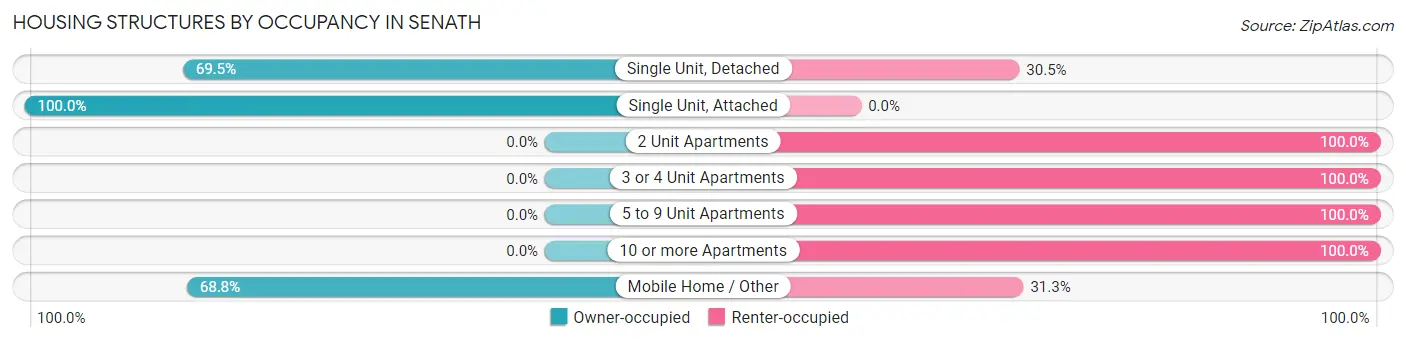
| Structure Type | Owner-occupied | Renter-occupied |
| Single Unit, Detached | 251 (69.5%) | 110 (30.5%) |
| Single Unit, Attached | 2 (100.0%) | 0 (0.0%) |
| 2 Unit Apartments | 0 (0.0%) | 29 (100.0%) |
| 3 or 4 Unit Apartments | 0 (0.0%) | 50 (100.0%) |
| 5 to 9 Unit Apartments | 0 (0.0%) | 1 (100.0%) |
| 10 or more Apartments | 0 (0.0%) | 5 (100.0%) |
| Mobile Home / Other | 44 (68.8%) | 20 (31.2%) |
| Total | 297 (58.0%) | 215 (42.0%) |
Housing Structures by Number of Rooms in Senath
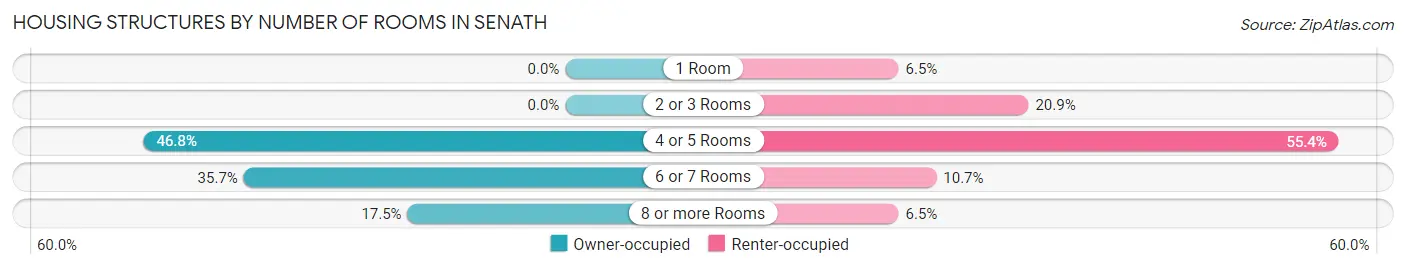
| Number of Rooms | Owner-occupied | Renter-occupied |
| 1 Room | 0 (0.0%) | 14 (6.5%) |
| 2 or 3 Rooms | 0 (0.0%) | 45 (20.9%) |
| 4 or 5 Rooms | 139 (46.8%) | 119 (55.3%) |
| 6 or 7 Rooms | 106 (35.7%) | 23 (10.7%) |
| 8 or more Rooms | 52 (17.5%) | 14 (6.5%) |
| Total | 297 (100.0%) | 215 (100.0%) |
Housing Structure by Heating Type in Senath
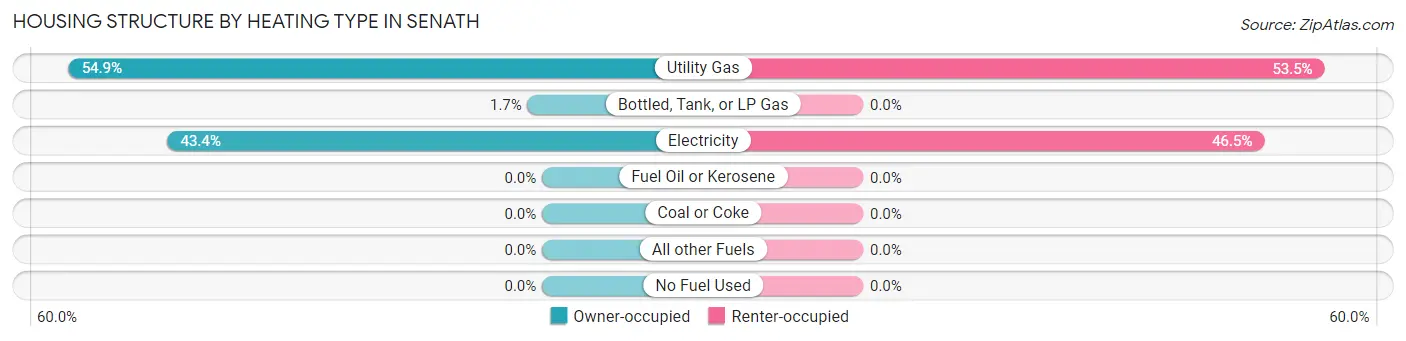
| Heating Type | Owner-occupied | Renter-occupied |
| Utility Gas | 163 (54.9%) | 115 (53.5%) |
| Bottled, Tank, or LP Gas | 5 (1.7%) | 0 (0.0%) |
| Electricity | 129 (43.4%) | 100 (46.5%) |
| Fuel Oil or Kerosene | 0 (0.0%) | 0 (0.0%) |
| Coal or Coke | 0 (0.0%) | 0 (0.0%) |
| All other Fuels | 0 (0.0%) | 0 (0.0%) |
| No Fuel Used | 0 (0.0%) | 0 (0.0%) |
| Total | 297 (100.0%) | 215 (100.0%) |
Household Vehicle Usage in Senath
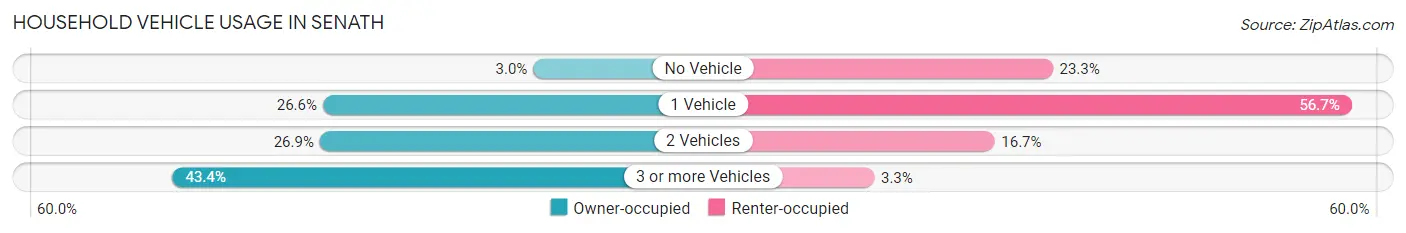
| Vehicles per Household | Owner-occupied | Renter-occupied |
| No Vehicle | 9 (3.0%) | 50 (23.3%) |
| 1 Vehicle | 79 (26.6%) | 122 (56.7%) |
| 2 Vehicles | 80 (26.9%) | 36 (16.7%) |
| 3 or more Vehicles | 129 (43.4%) | 7 (3.3%) |
| Total | 297 (100.0%) | 215 (100.0%) |
Real Estate & Mortgages in Senath
Real Estate and Mortgage Overview in Senath
| Characteristic | Without Mortgage | With Mortgage |
| Housing Units | 139 | 158 |
| Median Property Value | - | - |
| Median Household Income | $41,750 | $39 |
| Monthly Housing Costs | $448 | $0 |
| Real Estate Taxes | $375 | $0 |
Property Value by Mortgage Status in Senath
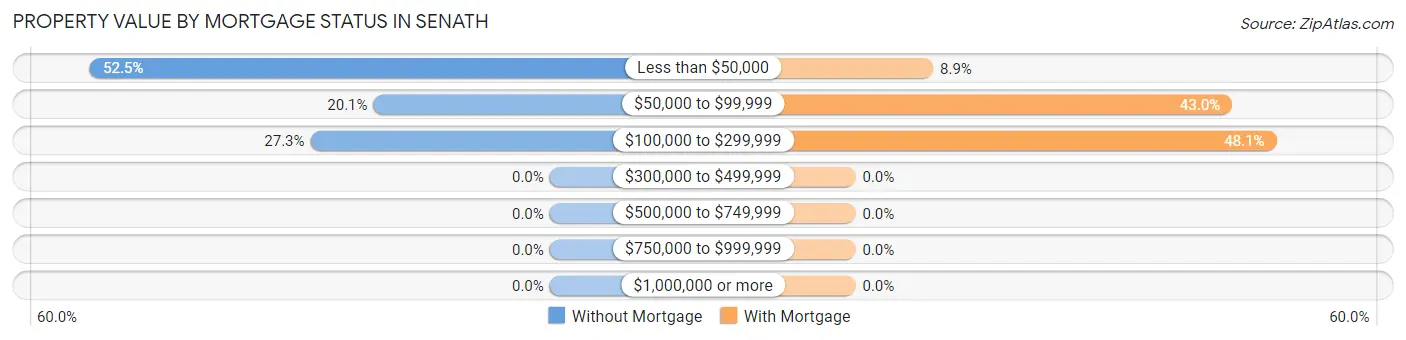
| Property Value | Without Mortgage | With Mortgage |
| Less than $50,000 | 73 (52.5%) | 14 (8.9%) |
| $50,000 to $99,999 | 28 (20.1%) | 68 (43.0%) |
| $100,000 to $299,999 | 38 (27.3%) | 76 (48.1%) |
| $300,000 to $499,999 | 0 (0.0%) | 0 (0.0%) |
| $500,000 to $749,999 | 0 (0.0%) | 0 (0.0%) |
| $750,000 to $999,999 | 0 (0.0%) | 0 (0.0%) |
| $1,000,000 or more | 0 (0.0%) | 0 (0.0%) |
| Total | 139 (100.0%) | 158 (100.0%) |
Household Income by Mortgage Status in Senath
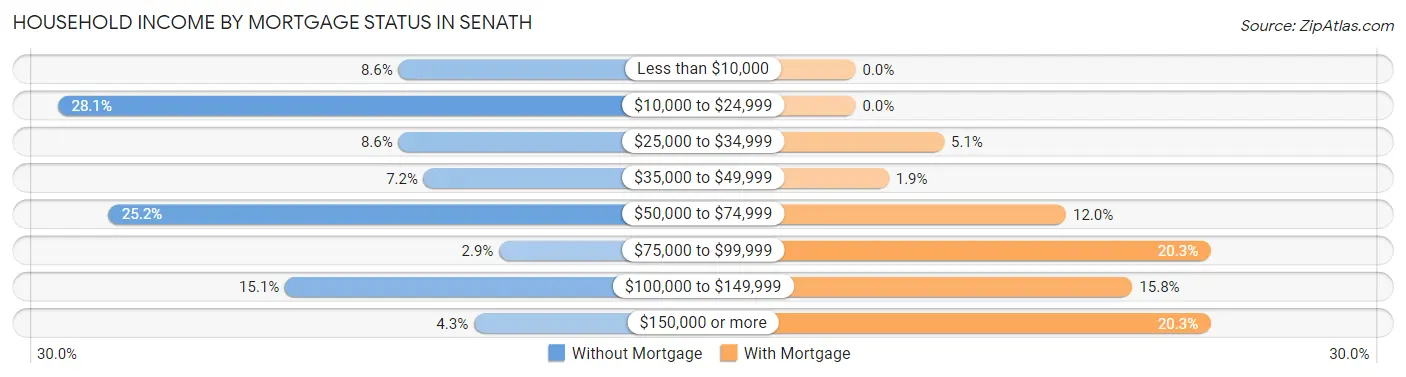
| Household Income | Without Mortgage | With Mortgage |
| Less than $10,000 | 12 (8.6%) | 0 (0.0%) |
| $10,000 to $24,999 | 39 (28.1%) | 0 (0.0%) |
| $25,000 to $34,999 | 12 (8.6%) | 8 (5.1%) |
| $35,000 to $49,999 | 10 (7.2%) | 3 (1.9%) |
| $50,000 to $74,999 | 35 (25.2%) | 19 (12.0%) |
| $75,000 to $99,999 | 4 (2.9%) | 32 (20.3%) |
| $100,000 to $149,999 | 21 (15.1%) | 25 (15.8%) |
| $150,000 or more | 6 (4.3%) | 32 (20.3%) |
| Total | 139 (100.0%) | 158 (100.0%) |
Property Value to Household Income Ratio in Senath
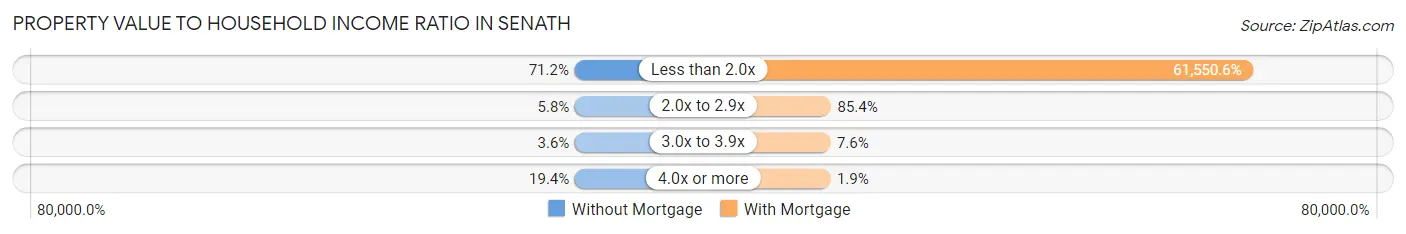
| Value-to-Income Ratio | Without Mortgage | With Mortgage |
| Less than 2.0x | 99 (71.2%) | 97,250 (61,550.6%) |
| 2.0x to 2.9x | 8 (5.8%) | 135 (85.4%) |
| 3.0x to 3.9x | 5 (3.6%) | 12 (7.6%) |
| 4.0x or more | 27 (19.4%) | 3 (1.9%) |
| Total | 139 (100.0%) | 158 (100.0%) |
Real Estate Taxes by Mortgage Status in Senath
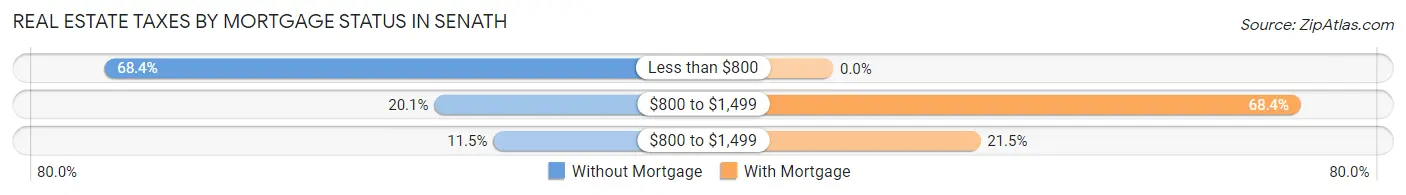
| Property Taxes | Without Mortgage | With Mortgage |
| Less than $800 | 95 (68.3%) | 0 (0.0%) |
| $800 to $1,499 | 28 (20.1%) | 108 (68.3%) |
| $800 to $1,499 | 16 (11.5%) | 34 (21.5%) |
| Total | 139 (100.0%) | 158 (100.0%) |
Health & Disability in Senath
Health Insurance Coverage by Age in Senath
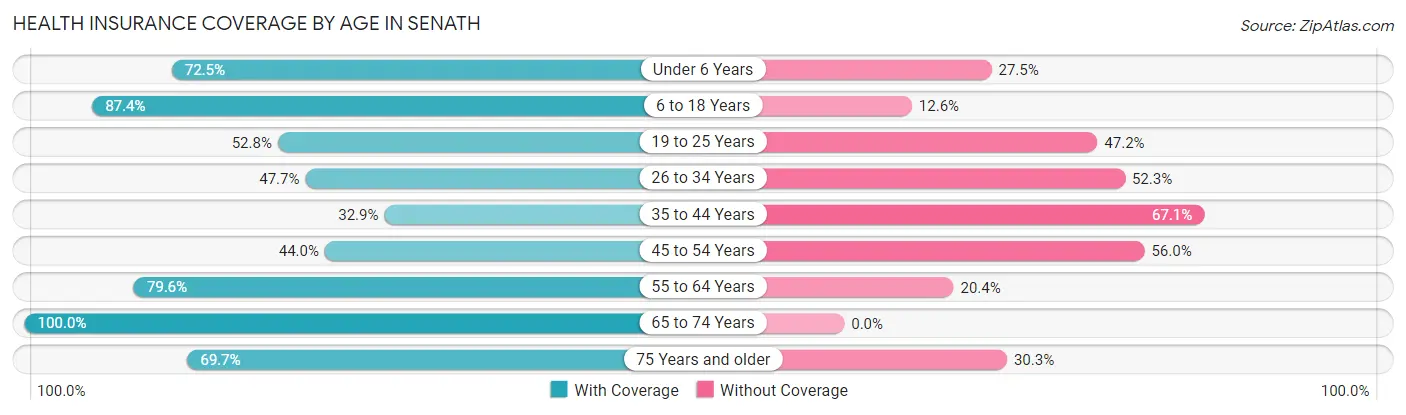
| Age Bracket | With Coverage | Without Coverage |
| Under 6 Years | 103 (72.5%) | 39 (27.5%) |
| 6 to 18 Years | 291 (87.4%) | 42 (12.6%) |
| 19 to 25 Years | 85 (52.8%) | 76 (47.2%) |
| 26 to 34 Years | 61 (47.7%) | 67 (52.3%) |
| 35 to 44 Years | 53 (32.9%) | 108 (67.1%) |
| 45 to 54 Years | 103 (44.0%) | 131 (56.0%) |
| 55 to 64 Years | 125 (79.6%) | 32 (20.4%) |
| 65 to 74 Years | 94 (100.0%) | 0 (0.0%) |
| 75 Years and older | 62 (69.7%) | 27 (30.3%) |
| Total | 977 (65.2%) | 522 (34.8%) |
Health Insurance Coverage by Citizenship Status in Senath
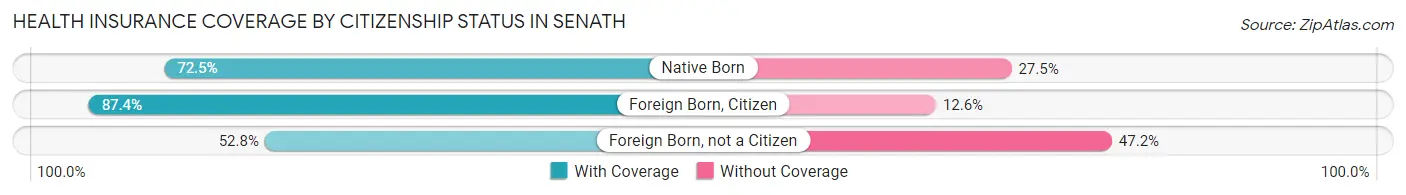
| Citizenship Status | With Coverage | Without Coverage |
| Native Born | 103 (72.5%) | 39 (27.5%) |
| Foreign Born, Citizen | 291 (87.4%) | 42 (12.6%) |
| Foreign Born, not a Citizen | 85 (52.8%) | 76 (47.2%) |
Health Insurance Coverage by Household Income in Senath
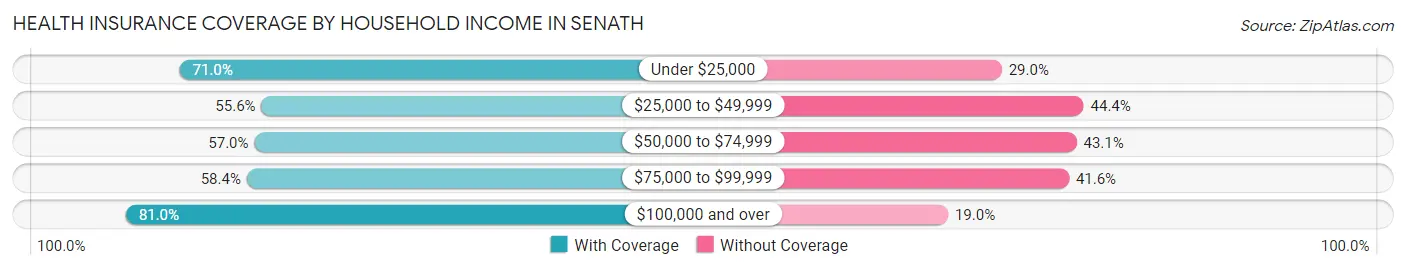
| Household Income | With Coverage | Without Coverage |
| Under $25,000 | 242 (71.0%) | 99 (29.0%) |
| $25,000 to $49,999 | 242 (55.6%) | 193 (44.4%) |
| $50,000 to $74,999 | 127 (57.0%) | 96 (43.0%) |
| $75,000 to $99,999 | 101 (58.4%) | 72 (41.6%) |
| $100,000 and over | 265 (81.0%) | 62 (19.0%) |
Public vs Private Health Insurance Coverage by Age in Senath
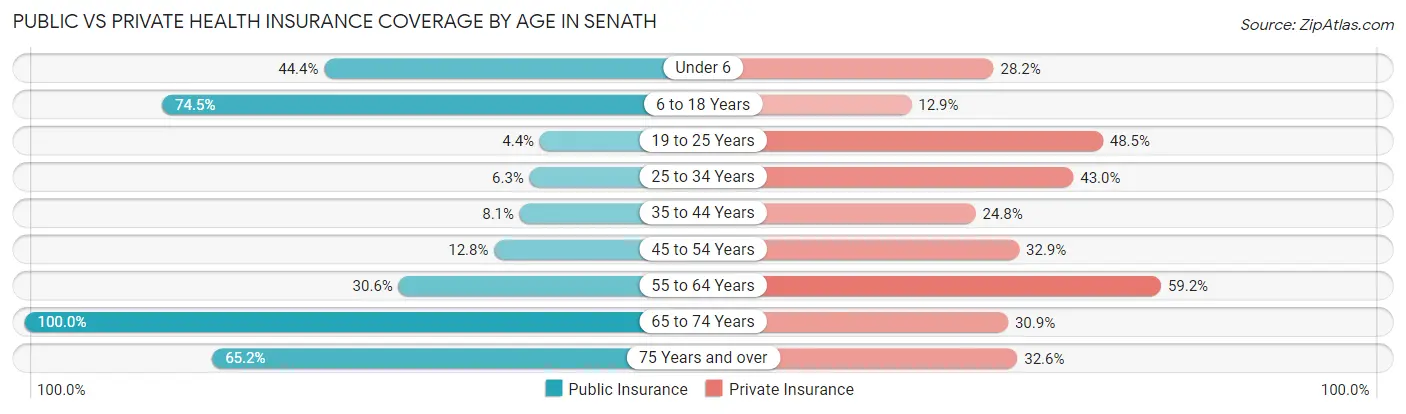
| Age Bracket | Public Insurance | Private Insurance |
| Under 6 | 63 (44.4%) | 40 (28.2%) |
| 6 to 18 Years | 248 (74.5%) | 43 (12.9%) |
| 19 to 25 Years | 7 (4.3%) | 78 (48.4%) |
| 25 to 34 Years | 8 (6.2%) | 55 (43.0%) |
| 35 to 44 Years | 13 (8.1%) | 40 (24.8%) |
| 45 to 54 Years | 30 (12.8%) | 77 (32.9%) |
| 55 to 64 Years | 48 (30.6%) | 93 (59.2%) |
| 65 to 74 Years | 94 (100.0%) | 29 (30.8%) |
| 75 Years and over | 58 (65.2%) | 29 (32.6%) |
| Total | 569 (38.0%) | 484 (32.3%) |
Disability Status by Sex by Age in Senath
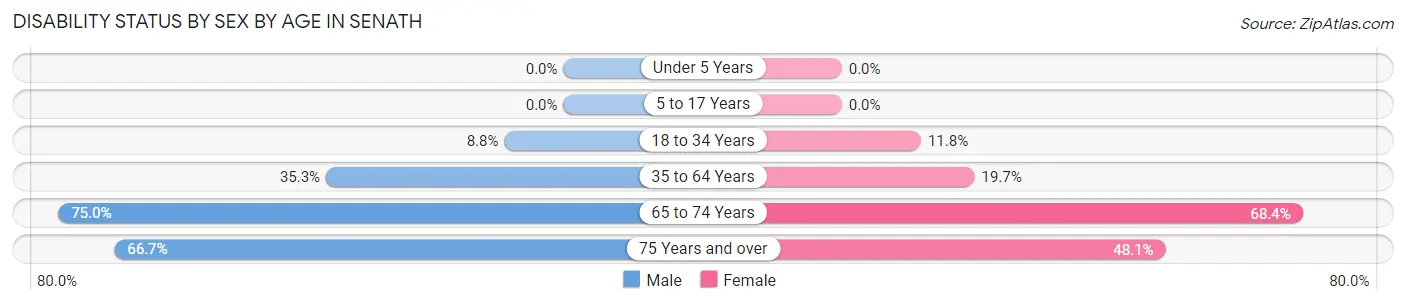
| Age Bracket | Male | Female |
| Under 5 Years | 0 (0.0%) | 0 (0.0%) |
| 5 to 17 Years | 0 (0.0%) | 0 (0.0%) |
| 18 to 34 Years | 15 (8.8%) | 16 (11.8%) |
| 35 to 64 Years | 98 (35.2%) | 54 (19.7%) |
| 65 to 74 Years | 42 (75.0%) | 26 (68.4%) |
| 75 Years and over | 8 (66.7%) | 37 (48.0%) |
Disability Class by Sex by Age in Senath
Disability Class: Hearing Difficulty
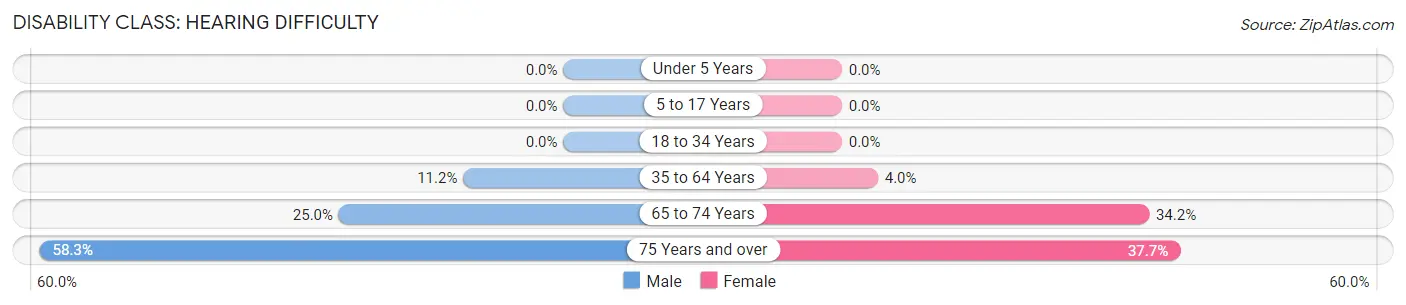
| Age Bracket | Male | Female |
| Under 5 Years | 0 (0.0%) | 0 (0.0%) |
| 5 to 17 Years | 0 (0.0%) | 0 (0.0%) |
| 18 to 34 Years | 0 (0.0%) | 0 (0.0%) |
| 35 to 64 Years | 31 (11.2%) | 11 (4.0%) |
| 65 to 74 Years | 14 (25.0%) | 13 (34.2%) |
| 75 Years and over | 7 (58.3%) | 29 (37.7%) |
Disability Class: Vision Difficulty
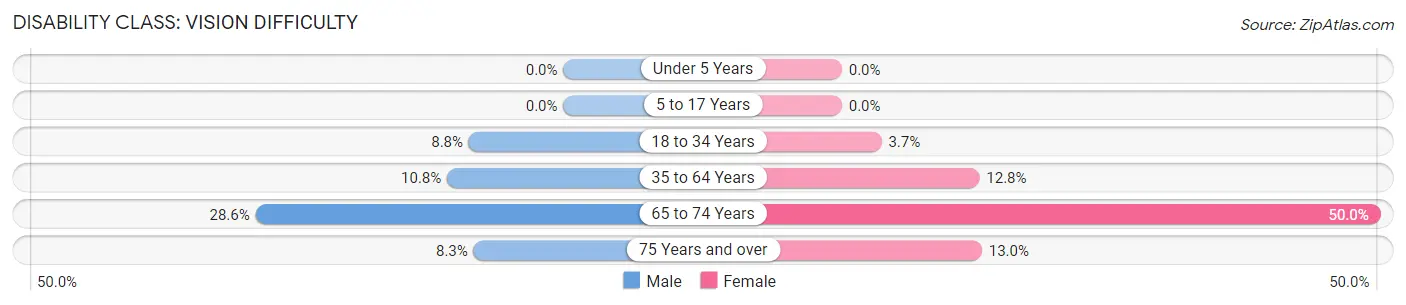
| Age Bracket | Male | Female |
| Under 5 Years | 0 (0.0%) | 0 (0.0%) |
| 5 to 17 Years | 0 (0.0%) | 0 (0.0%) |
| 18 to 34 Years | 15 (8.8%) | 5 (3.7%) |
| 35 to 64 Years | 30 (10.8%) | 35 (12.8%) |
| 65 to 74 Years | 16 (28.6%) | 19 (50.0%) |
| 75 Years and over | 1 (8.3%) | 10 (13.0%) |
Disability Class: Cognitive Difficulty
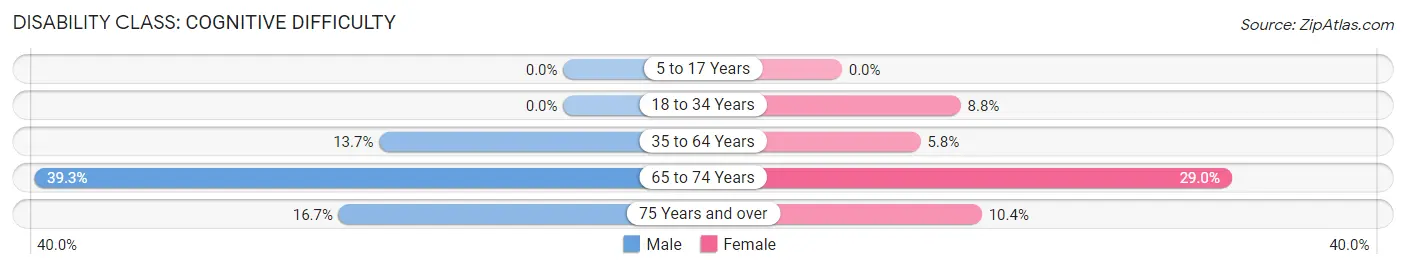
| Age Bracket | Male | Female |
| 5 to 17 Years | 0 (0.0%) | 0 (0.0%) |
| 18 to 34 Years | 0 (0.0%) | 12 (8.8%) |
| 35 to 64 Years | 38 (13.7%) | 16 (5.8%) |
| 65 to 74 Years | 22 (39.3%) | 11 (28.9%) |
| 75 Years and over | 2 (16.7%) | 8 (10.4%) |
Disability Class: Ambulatory Difficulty
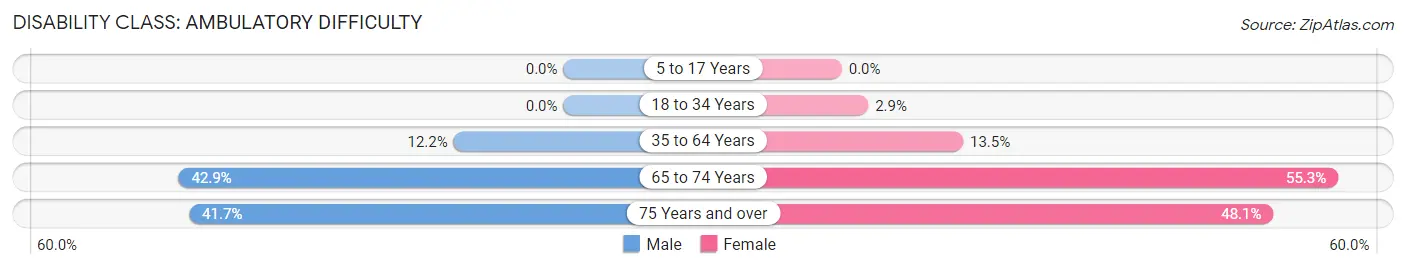
| Age Bracket | Male | Female |
| 5 to 17 Years | 0 (0.0%) | 0 (0.0%) |
| 18 to 34 Years | 0 (0.0%) | 4 (2.9%) |
| 35 to 64 Years | 34 (12.2%) | 37 (13.5%) |
| 65 to 74 Years | 24 (42.9%) | 21 (55.3%) |
| 75 Years and over | 5 (41.7%) | 37 (48.0%) |
Disability Class: Self-Care Difficulty
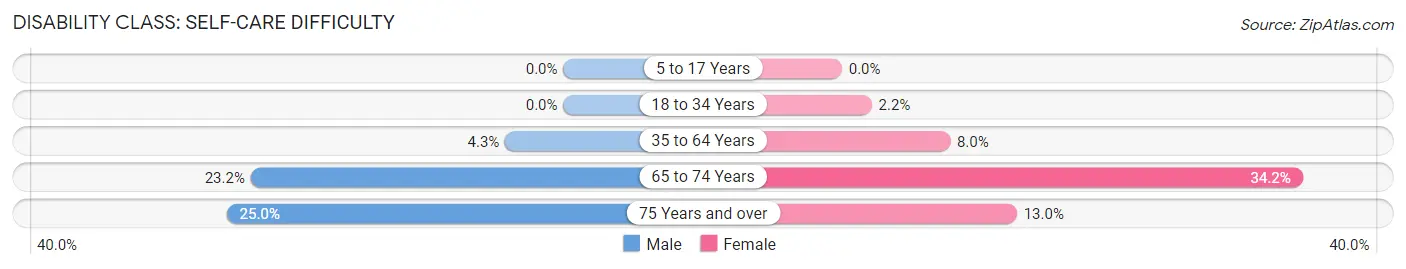
| Age Bracket | Male | Female |
| 5 to 17 Years | 0 (0.0%) | 0 (0.0%) |
| 18 to 34 Years | 0 (0.0%) | 3 (2.2%) |
| 35 to 64 Years | 12 (4.3%) | 22 (8.0%) |
| 65 to 74 Years | 13 (23.2%) | 13 (34.2%) |
| 75 Years and over | 3 (25.0%) | 10 (13.0%) |
Technology Access in Senath
Computing Device Access in Senath
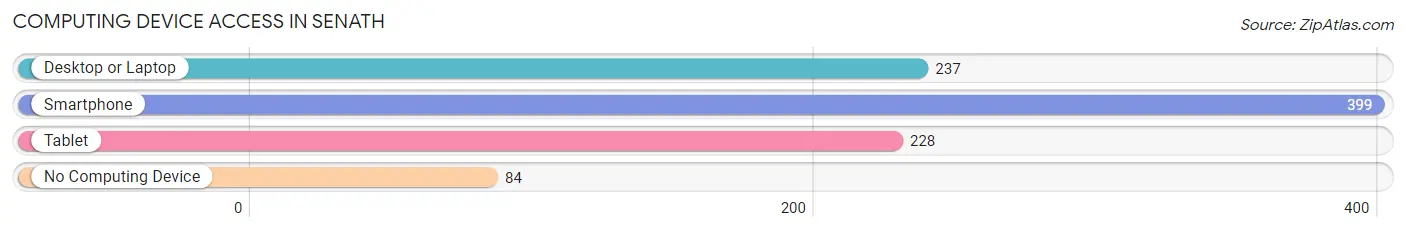
| Device Type | # Households | % Households |
| Desktop or Laptop | 237 | 46.3% |
| Smartphone | 399 | 77.9% |
| Tablet | 228 | 44.5% |
| No Computing Device | 84 | 16.4% |
| Total | 512 | 100.0% |
Internet Access in Senath
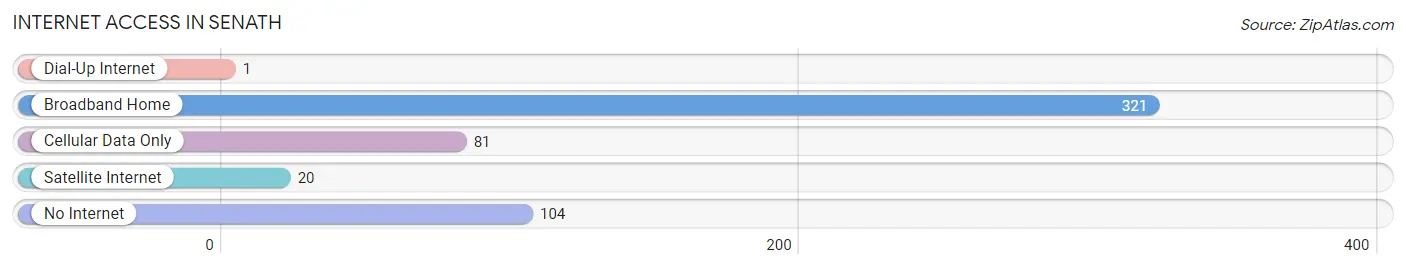
| Internet Type | # Households | % Households |
| Dial-Up Internet | 1 | 0.2% |
| Broadband Home | 321 | 62.7% |
| Cellular Data Only | 81 | 15.8% |
| Satellite Internet | 20 | 3.9% |
| No Internet | 104 | 20.3% |
| Total | 512 | 100.0% |
Senath Summary
Senath, Missouri is a small town located in Dunklin County in the southeastern corner of the state. It is situated on the banks of the St. Francis River, and is approximately 10 miles from the Arkansas border. The town was founded in 1883 and was named after the Senath family, who were early settlers in the area.
History
The first settlers in the area were the Senath family, who arrived in 1883. They were followed by other families, including the Smiths, the Thompsons, and the Johnsons. The town was officially incorporated in 1887, and the first post office was established in 1888.
The town grew slowly but steadily, and by the early 1900s, it had become a thriving agricultural community. Cotton was the main crop, and the town was home to several cotton gins and a cottonseed oil mill. The town also had a number of stores, a bank, a hotel, and a newspaper.
In the 1920s, the town began to experience a decline in population as many of the young people left to find work in larger cities. This trend continued until the 1950s, when the town began to experience a resurgence. The population began to grow again, and the town was revitalized with the construction of a new school and a new hospital.
Geography
Senath is located in the southeastern corner of Missouri, approximately 10 miles from the Arkansas border. It is situated on the banks of the St. Francis River, and is surrounded by rolling hills and farmland. The town is located in the Bootheel region of the state, which is known for its fertile soil and mild climate.
The town is located at an elevation of approximately 300 feet above sea level, and the average annual temperature is around 60 degrees Fahrenheit. The town receives an average of 45 inches of precipitation each year, and the area is prone to severe thunderstorms and tornadoes.
Economy
The economy of Senath is largely based on agriculture. Cotton is the main crop, and the town is home to several cotton gins and a cottonseed oil mill. The town also has a number of stores, a bank, a hotel, and a newspaper.
The town is also home to a number of small businesses, including a lumber yard, a hardware store, and a feed store. The town is also home to a number of manufacturing companies, including a furniture factory and a plastics factory.
Demographics
As of the 2010 census, the population of Senath was 1,845. The town is approximately 75% white, 20% African American, and 5% Hispanic. The median household income is $30,000, and the median home value is $80,000.
The town is served by the Senath-Hornersville Consolidated School District, which includes two elementary schools, a middle school, and a high school. The town is also home to a number of churches, including Baptist, Methodist, and Catholic.
Conclusion
Senath, Missouri is a small town located in Dunklin County in the southeastern corner of the state. It is situated on the banks of the St. Francis River, and is approximately 10 miles from the Arkansas border. The town was founded in 1883 and was named after the Senath family, who were early settlers in the area. The economy of Senath is largely based on agriculture, and the town is home to a number of small businesses. The population of Senath is approximately 1,845, and the town is served by the Senath-Hornersville Consolidated School District.
Common Questions
What is Per Capita Income in Senath?
Per Capita income in Senath is $18,920.
What is the Median Family Income in Senath?
Median Family Income in Senath is $52,500.
What is the Median Household income in Senath?
Median Household Income in Senath is $40,000.
What is Income or Wage Gap in Senath?
Income or Wage Gap in Senath is 51.0%.
Women in Senath earn 49.0 cents for every dollar earned by a man.
What is Inequality or Gini Index in Senath?
Inequality or Gini Index in Senath is 0.48.
What is the Total Population of Senath?
Total Population of Senath is 1,597.
What is the Total Male Population of Senath?
Total Male Population of Senath is 807.
What is the Total Female Population of Senath?
Total Female Population of Senath is 790.
What is the Ratio of Males per 100 Females in Senath?
There are 102.15 Males per 100 Females in Senath.
What is the Ratio of Females per 100 Males in Senath?
There are 97.89 Females per 100 Males in Senath.
What is the Median Population Age in Senath?
Median Population Age in Senath is 34.9 Years.
What is the Average Family Size in Senath
Average Family Size in Senath is 3.6 People.
What is the Average Household Size in Senath
Average Household Size in Senath is 2.9 People.
How Large is the Labor Force in Senath?
There are 566 People in the Labor Forcein in Senath.
What is the Percentage of People in the Labor Force in Senath?
46.9% of People are in the Labor Force in Senath.
What is the Unemployment Rate in Senath?
Unemployment Rate in Senath is 4.9%.