Salem, MO Map & Demographics
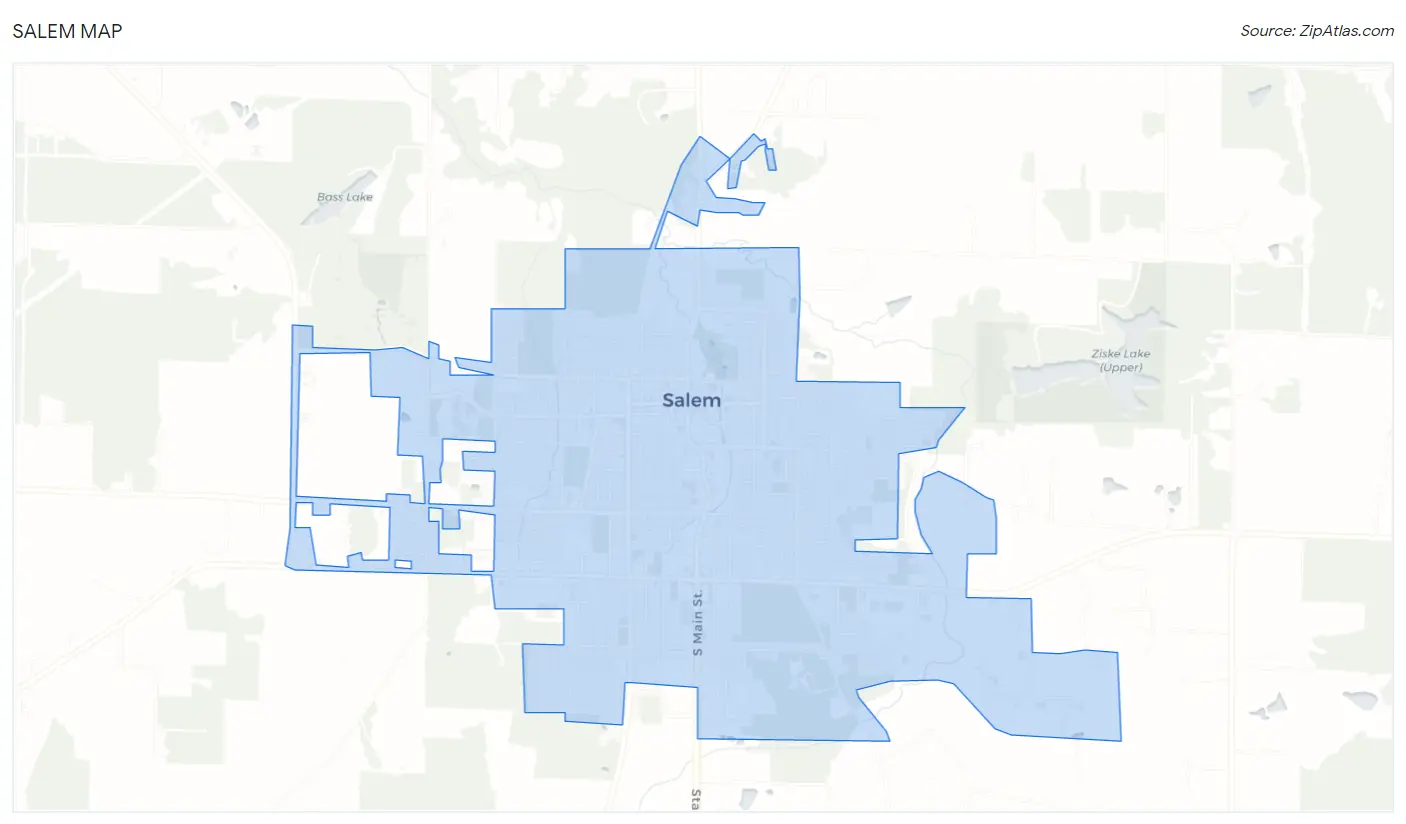
Salem Map
Salem Overview
$24,565
PER CAPITA INCOME
$51,028
AVG FAMILY INCOME
$35,413
AVG HOUSEHOLD INCOME
32.4%
WAGE / INCOME GAP [ % ]
67.6¢/ $1
WAGE / INCOME GAP [ $ ]
0.49
INEQUALITY / GINI INDEX
4,673
TOTAL POPULATION
1,958
MALE POPULATION
2,715
FEMALE POPULATION
72.12
MALES / 100 FEMALES
138.66
FEMALES / 100 MALES
42.4
MEDIAN AGE
3.3
AVG FAMILY SIZE
2.2
AVG HOUSEHOLD SIZE
2,055
LABOR FORCE [ PEOPLE ]
55.0%
PERCENT IN LABOR FORCE
7.0%
UNEMPLOYMENT RATE
Salem Zip Codes
Salem Area Codes
Income in Salem
Income Overview in Salem
Per Capita Income in Salem is $24,565, while median incomes of families and households are $51,028 and $35,413 respectively.
| Characteristic | Number | Measure |
| Per Capita Income | 4,673 | $24,565 |
| Median Family Income | 1,017 | $51,028 |
| Mean Family Income | 1,017 | $59,087 |
| Median Household Income | 2,053 | $35,413 |
| Mean Household Income | 2,053 | $50,845 |
| Income Deficit | 1,017 | $0 |
| Wage / Income Gap (%) | 4,673 | 32.35% |
| Wage / Income Gap ($) | 4,673 | 67.65¢ per $1 |
| Gini / Inequality Index | 4,673 | 0.49 |
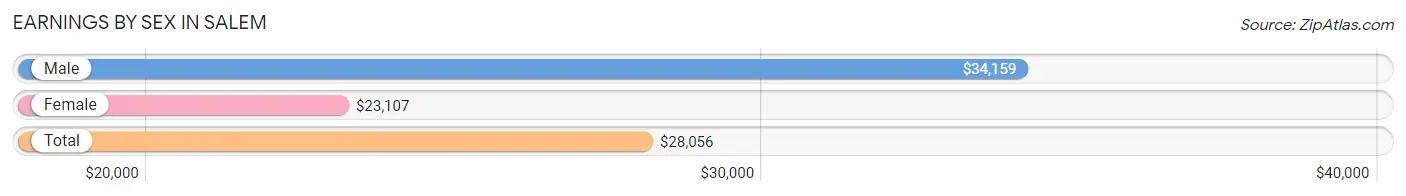
Earnings by Sex in Salem
Average Earnings in Salem are $28,056, $34,159 for men and $23,107 for women, a difference of 32.4%.
| Sex | Number | Average Earnings |
| Male | 998 (46.3%) | $34,159 |
| Female | 1,158 (53.7%) | $23,107 |
| Total | 2,156 (100.0%) | $28,056 |
Earnings by Sex by Income Bracket in Salem
The most common earnings brackets in Salem are $35,000 to $39,999 for men (155 | 15.5%) and $7,500 to $9,999 for women (125 | 10.8%).
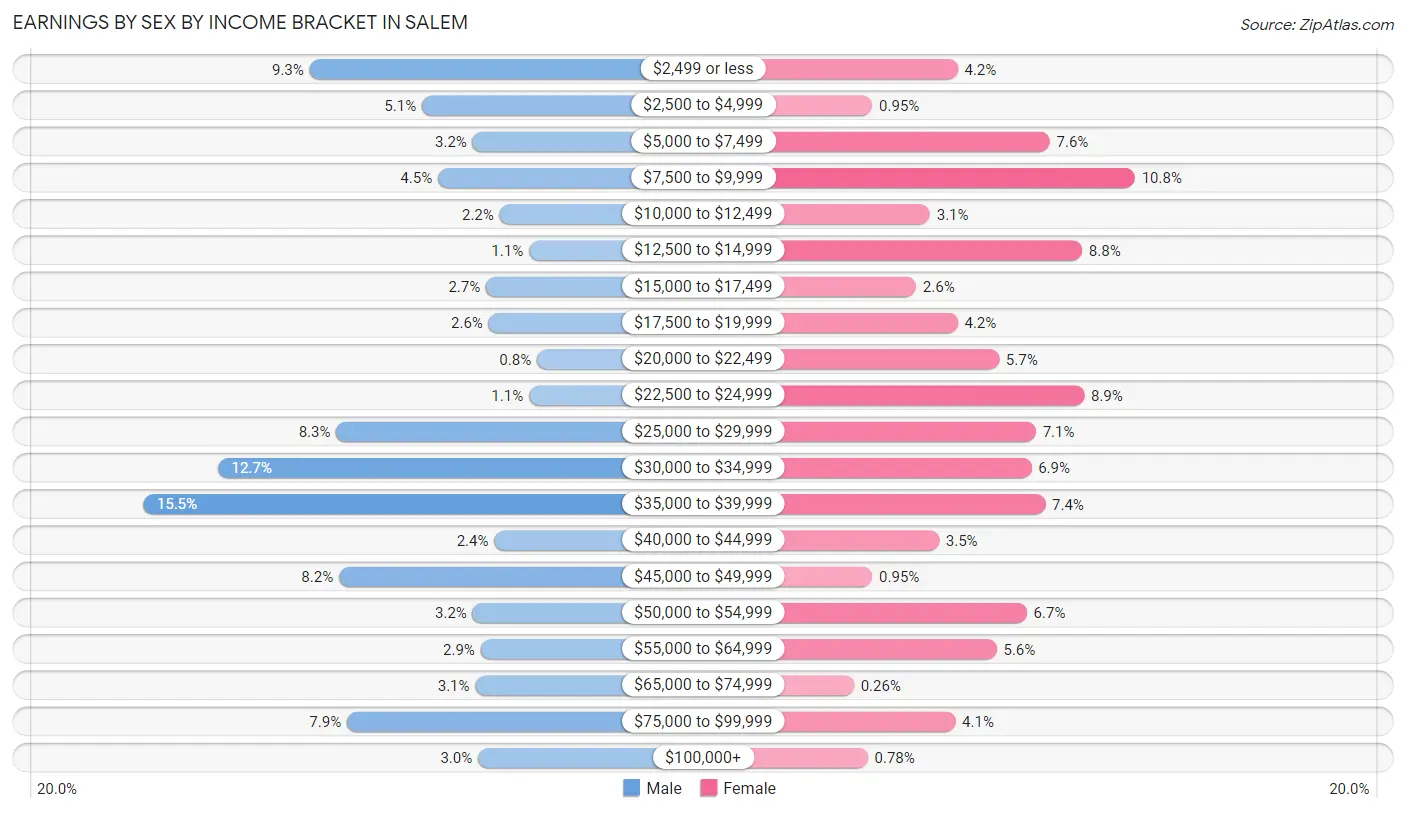
| Income | Male | Female |
| $2,499 or less | 93 (9.3%) | 48 (4.2%) |
| $2,500 to $4,999 | 51 (5.1%) | 11 (0.9%) |
| $5,000 to $7,499 | 32 (3.2%) | 88 (7.6%) |
| $7,500 to $9,999 | 45 (4.5%) | 125 (10.8%) |
| $10,000 to $12,499 | 22 (2.2%) | 36 (3.1%) |
| $12,500 to $14,999 | 11 (1.1%) | 102 (8.8%) |
| $15,000 to $17,499 | 27 (2.7%) | 30 (2.6%) |
| $17,500 to $19,999 | 26 (2.6%) | 48 (4.2%) |
| $20,000 to $22,499 | 8 (0.8%) | 66 (5.7%) |
| $22,500 to $24,999 | 11 (1.1%) | 103 (8.9%) |
| $25,000 to $29,999 | 83 (8.3%) | 82 (7.1%) |
| $30,000 to $34,999 | 127 (12.7%) | 80 (6.9%) |
| $35,000 to $39,999 | 155 (15.5%) | 86 (7.4%) |
| $40,000 to $44,999 | 24 (2.4%) | 40 (3.5%) |
| $45,000 to $49,999 | 82 (8.2%) | 11 (0.9%) |
| $50,000 to $54,999 | 32 (3.2%) | 78 (6.7%) |
| $55,000 to $64,999 | 29 (2.9%) | 65 (5.6%) |
| $65,000 to $74,999 | 31 (3.1%) | 3 (0.3%) |
| $75,000 to $99,999 | 79 (7.9%) | 47 (4.1%) |
| $100,000+ | 30 (3.0%) | 9 (0.8%) |
| Total | 998 (100.0%) | 1,158 (100.0%) |
Earnings by Sex by Educational Attainment in Salem
Average earnings in Salem are $34,398 for men and $25,783 for women, a difference of 25.1%. Men with an educational attainment of bachelor's degree enjoy the highest average annual earnings of $49,643, while those with high school diploma education earn the least with $28,333. Women with an educational attainment of graduate degree earn the most with the average annual earnings of $58,750, while those with high school diploma education have the smallest earnings of $19,821.
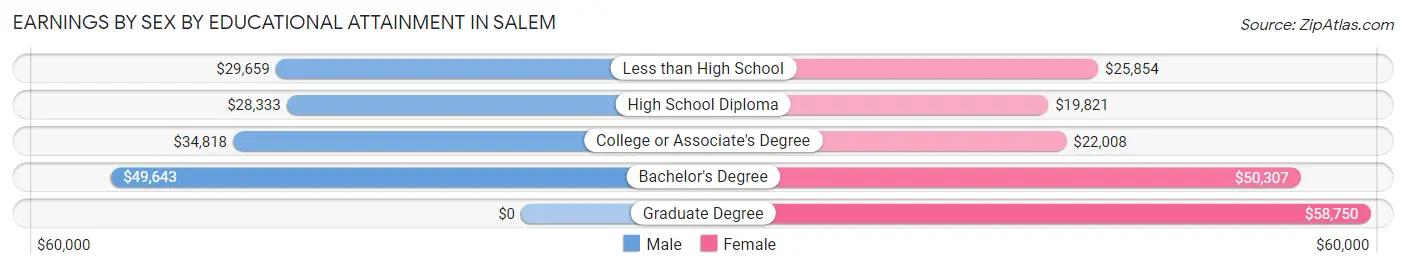
| Educational Attainment | Male Income | Female Income |
| Less than High School | $29,659 | $25,854 |
| High School Diploma | $28,333 | $19,821 |
| College or Associate's Degree | $34,818 | $22,008 |
| Bachelor's Degree | $49,643 | $50,307 |
| Graduate Degree | - | - |
| Total | $34,398 | $25,783 |
Family Income in Salem
Family Income Brackets in Salem
According to the Salem family income data, there are 261 families falling into the $50,000 to $74,999 income range, which is the most common income bracket and makes up 25.7% of all families.
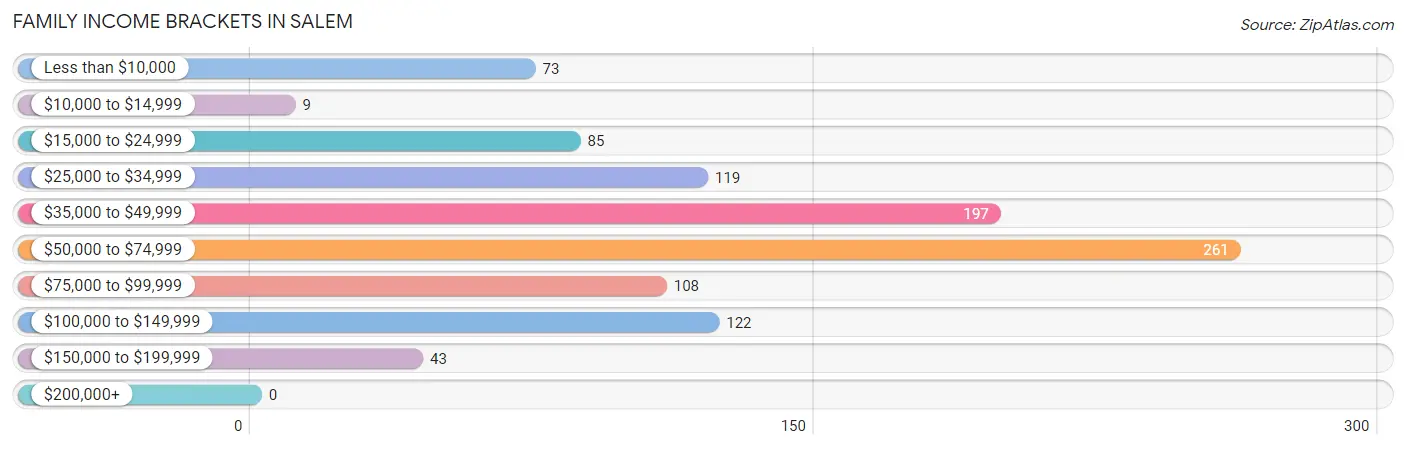
| Income Bracket | # Families | % Families |
| Less than $10,000 | 73 | 7.2% |
| $10,000 to $14,999 | 9 | 0.9% |
| $15,000 to $24,999 | 85 | 8.4% |
| $25,000 to $34,999 | 119 | 11.7% |
| $35,000 to $49,999 | 197 | 19.4% |
| $50,000 to $74,999 | 261 | 25.7% |
| $75,000 to $99,999 | 108 | 10.6% |
| $100,000 to $149,999 | 122 | 12.0% |
| $150,000 to $199,999 | 43 | 4.2% |
| $200,000+ | 0 | 0.0% |
Family Income by Famaliy Size in Salem
6-person families (36 | 3.5%) account for the highest median family income in Salem with $110,625 per family, while 2-person families (460 | 45.2%) have the highest median income of $21,458 per family member.
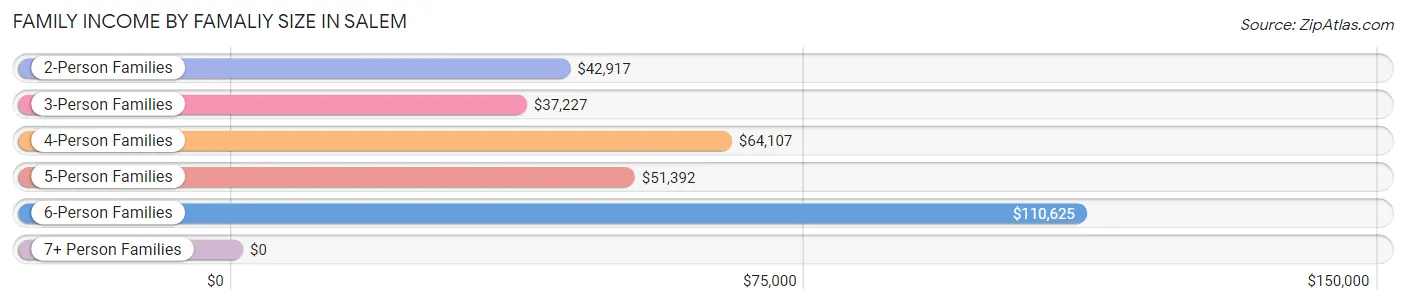
| Income Bracket | # Families | Median Income |
| 2-Person Families | 460 (45.2%) | $42,917 |
| 3-Person Families | 250 (24.6%) | $37,227 |
| 4-Person Families | 175 (17.2%) | $64,107 |
| 5-Person Families | 85 (8.4%) | $51,392 |
| 6-Person Families | 36 (3.5%) | $110,625 |
| 7+ Person Families | 11 (1.1%) | $0 |
| Total | 1,017 (100.0%) | $51,028 |
Family Income by Number of Earners in Salem
The median family income in Salem is $51,028, with families comprising 3+ earners (109) having the highest median family income of $120,486, while families with 1 earner (312) have the lowest median family income of $35,982, accounting for 10.7% and 30.7% of families, respectively.
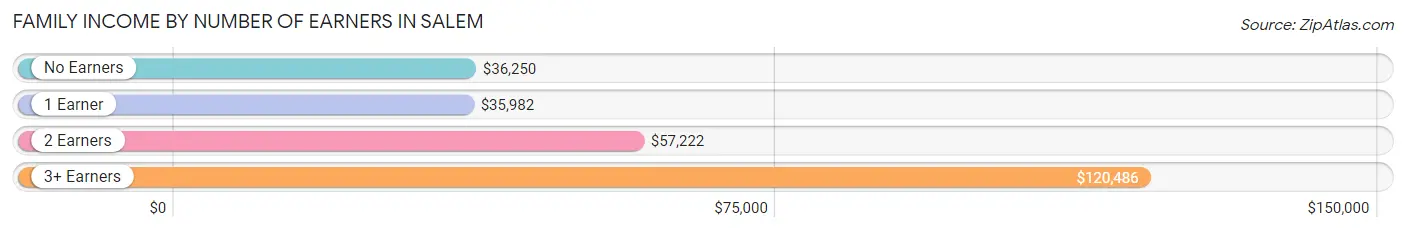
| Number of Earners | # Families | Median Income |
| No Earners | 134 (13.2%) | $36,250 |
| 1 Earner | 312 (30.7%) | $35,982 |
| 2 Earners | 462 (45.4%) | $57,222 |
| 3+ Earners | 109 (10.7%) | $120,486 |
| Total | 1,017 (100.0%) | $51,028 |
Household Income in Salem
Household Income Brackets in Salem
With 380 households falling in the category, the $50,000 to $74,999 income range is the most frequent in Salem, accounting for 18.5% of all households. In contrast, only 16 households (0.8%) fall into the $200,000+ income bracket, making it the least populous group.
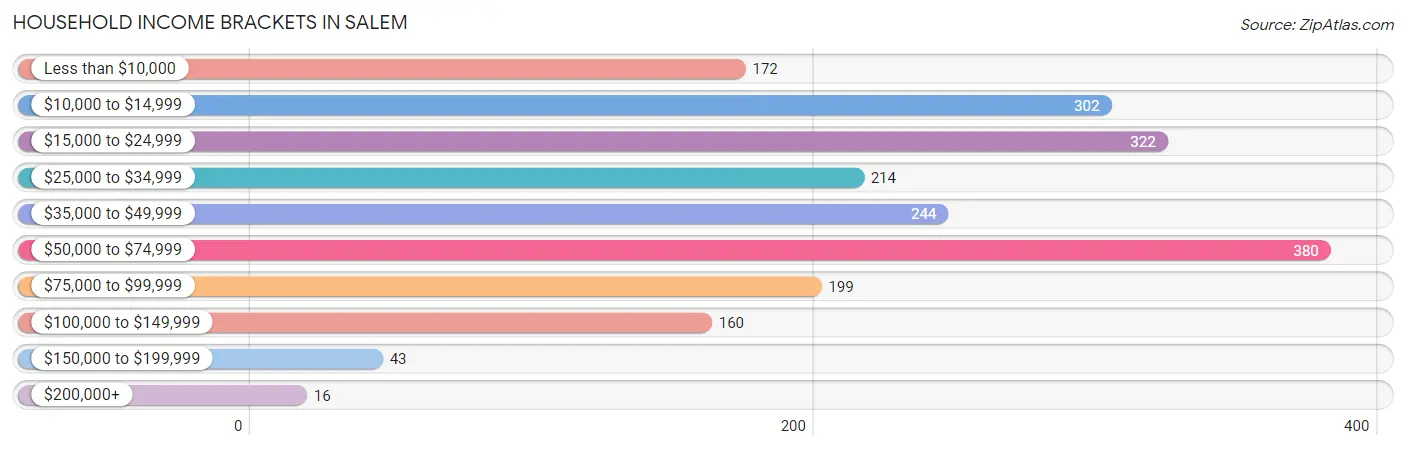
| Income Bracket | # Households | % Households |
| Less than $10,000 | 172 | 8.4% |
| $10,000 to $14,999 | 302 | 14.7% |
| $15,000 to $24,999 | 322 | 15.7% |
| $25,000 to $34,999 | 214 | 10.4% |
| $35,000 to $49,999 | 244 | 11.9% |
| $50,000 to $74,999 | 380 | 18.5% |
| $75,000 to $99,999 | 199 | 9.7% |
| $100,000 to $149,999 | 160 | 7.8% |
| $150,000 to $199,999 | 43 | 2.1% |
| $200,000+ | 16 | 0.8% |
Household Income by Householder Age in Salem
The median household income in Salem is $35,413, with the highest median household income of $60,385 found in the 25 to 44 years age bracket for the primary householder. A total of 472 households (23.0%) fall into this category. Meanwhile, the 65+ years age bracket for the primary householder has the lowest median household income of $21,971, with 781 households (38.0%) in this group.
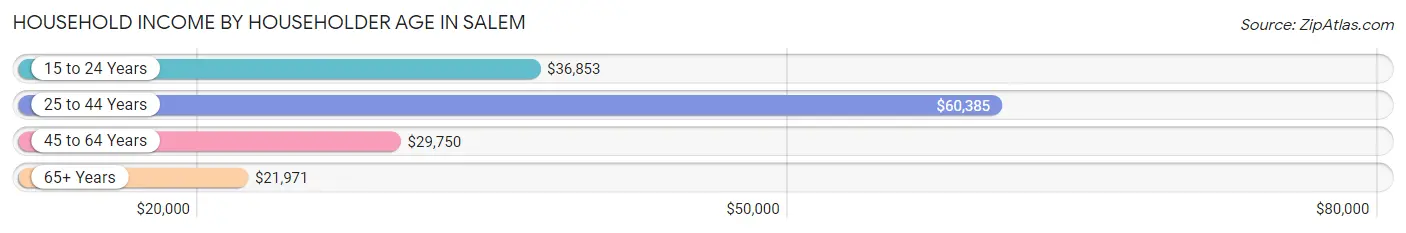
| Income Bracket | # Households | Median Income |
| 15 to 24 Years | 113 (5.5%) | $36,853 |
| 25 to 44 Years | 472 (23.0%) | $60,385 |
| 45 to 64 Years | 687 (33.5%) | $29,750 |
| 65+ Years | 781 (38.0%) | $21,971 |
| Total | 2,053 (100.0%) | $35,413 |
Poverty in Salem
Income Below Poverty by Sex and Age in Salem
With 16.5% poverty level for males and 18.5% for females among the residents of Salem, 5 year old males and 5 year old females are the most vulnerable to poverty, with 22 males (100.0%) and 7 females (100.0%) in their respective age groups living below the poverty level.
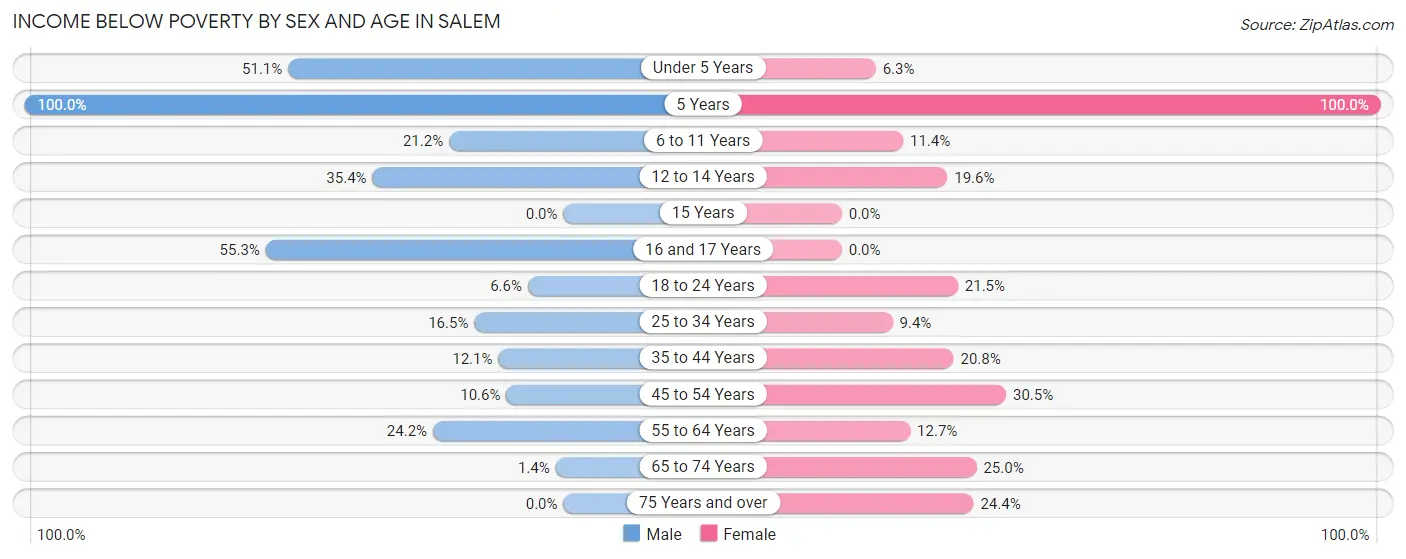
| Age Bracket | Male | Female |
| Under 5 Years | 47 (51.1%) | 11 (6.3%) |
| 5 Years | 22 (100.0%) | 7 (100.0%) |
| 6 to 11 Years | 31 (21.2%) | 24 (11.4%) |
| 12 to 14 Years | 28 (35.4%) | 19 (19.6%) |
| 15 Years | 0 (0.0%) | 0 (0.0%) |
| 16 and 17 Years | 21 (55.3%) | 0 (0.0%) |
| 18 to 24 Years | 20 (6.6%) | 42 (21.5%) |
| 25 to 34 Years | 21 (16.5%) | 20 (9.4%) |
| 35 to 44 Years | 35 (12.1%) | 66 (20.7%) |
| 45 to 54 Years | 18 (10.6%) | 100 (30.5%) |
| 55 to 64 Years | 69 (24.2%) | 33 (12.7%) |
| 65 to 74 Years | 3 (1.4%) | 105 (25.0%) |
| 75 Years and over | 0 (0.0%) | 66 (24.4%) |
| Total | 315 (16.5%) | 493 (18.5%) |
Income Above Poverty by Sex and Age in Salem
According to the poverty statistics in Salem, males aged 15 years and females aged 15 years are the age groups that are most secure financially, with 100.0% of males and 100.0% of females in these age groups living above the poverty line.
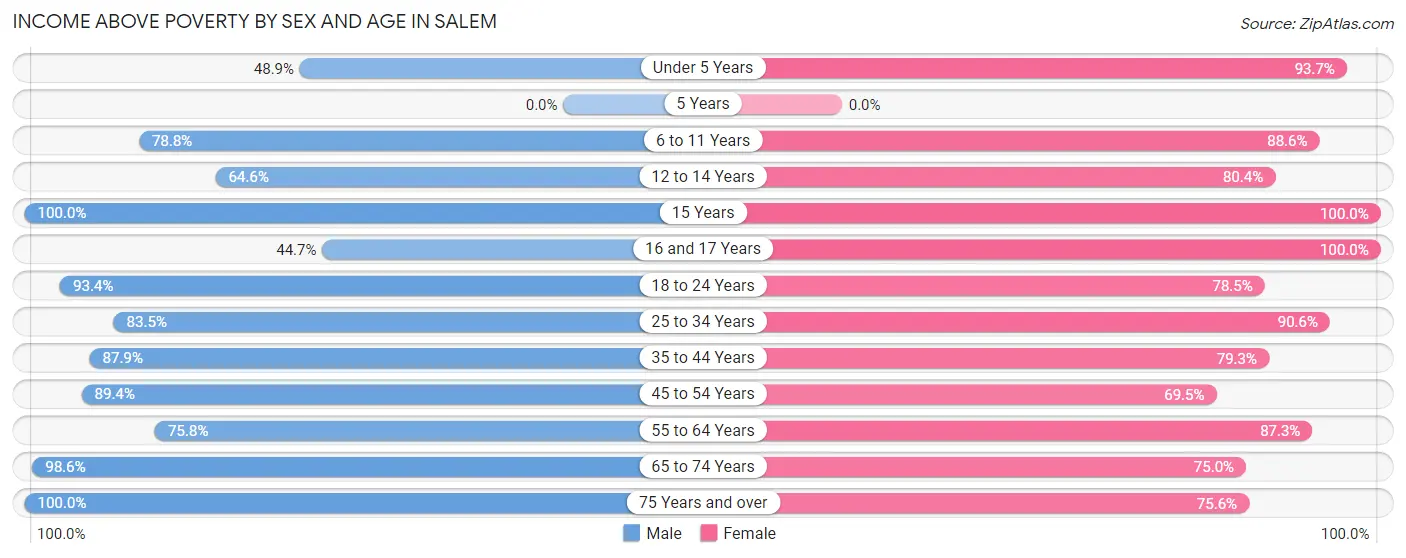
| Age Bracket | Male | Female |
| Under 5 Years | 45 (48.9%) | 164 (93.7%) |
| 5 Years | 0 (0.0%) | 0 (0.0%) |
| 6 to 11 Years | 115 (78.8%) | 187 (88.6%) |
| 12 to 14 Years | 51 (64.6%) | 78 (80.4%) |
| 15 Years | 38 (100.0%) | 62 (100.0%) |
| 16 and 17 Years | 17 (44.7%) | 112 (100.0%) |
| 18 to 24 Years | 283 (93.4%) | 153 (78.5%) |
| 25 to 34 Years | 106 (83.5%) | 192 (90.6%) |
| 35 to 44 Years | 255 (87.9%) | 252 (79.2%) |
| 45 to 54 Years | 152 (89.4%) | 228 (69.5%) |
| 55 to 64 Years | 216 (75.8%) | 227 (87.3%) |
| 65 to 74 Years | 205 (98.6%) | 315 (75.0%) |
| 75 Years and over | 115 (100.0%) | 204 (75.6%) |
| Total | 1,598 (83.5%) | 2,174 (81.5%) |
Income Below Poverty Among Married-Couple Families in Salem
The poverty statistics for married-couple families in Salem show that 6.4% or 38 of the total 590 families live below the poverty line. Families with 1 or 2 children have the highest poverty rate of 10.8%, comprising of 18 families. On the other hand, families with no children have the lowest poverty rate of 2.9%, which includes 9 families.
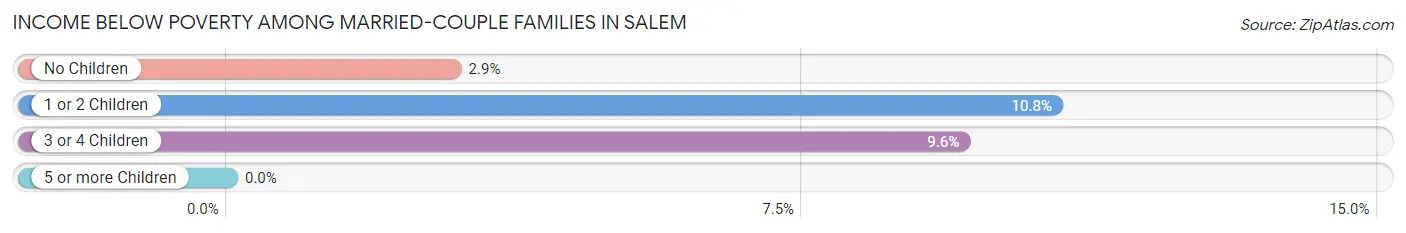
| Children | Above Poverty | Below Poverty |
| No Children | 299 (97.1%) | 9 (2.9%) |
| 1 or 2 Children | 149 (89.2%) | 18 (10.8%) |
| 3 or 4 Children | 104 (90.4%) | 11 (9.6%) |
| 5 or more Children | 0 (0.0%) | 0 (0.0%) |
| Total | 552 (93.6%) | 38 (6.4%) |
Income Below Poverty Among Single-Parent Households in Salem
According to the poverty data in Salem, 14.9% or 7 single-father households and 21.0% or 80 single-mother households are living below the poverty line. Among single-father households, those with 3 or 4 children have the highest poverty rate, with 7 households (100.0%) experiencing poverty. Likewise, among single-mother households, those with 3 or 4 children have the highest poverty rate, with 9 households (45.0%) falling below the poverty line.
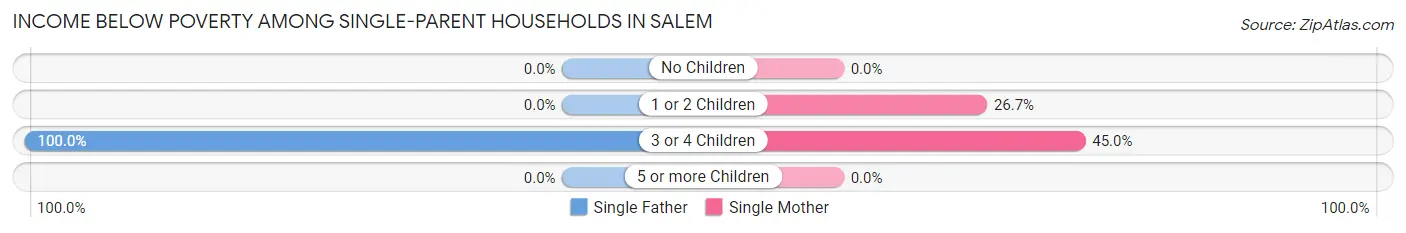
| Children | Single Father | Single Mother |
| No Children | 0 (0.0%) | 0 (0.0%) |
| 1 or 2 Children | 0 (0.0%) | 71 (26.7%) |
| 3 or 4 Children | 7 (100.0%) | 9 (45.0%) |
| 5 or more Children | 0 (0.0%) | 0 (0.0%) |
| Total | 7 (14.9%) | 80 (21.0%) |
Income Below Poverty Among Married-Couple vs Single-Parent Households in Salem
The poverty data for Salem shows that 38 of the married-couple family households (6.4%) and 87 of the single-parent households (20.4%) are living below the poverty level. Within the married-couple family households, those with 1 or 2 children have the highest poverty rate, with 18 households (10.8%) falling below the poverty line. Among the single-parent households, those with 3 or 4 children have the highest poverty rate, with 16 household (59.3%) living below poverty.
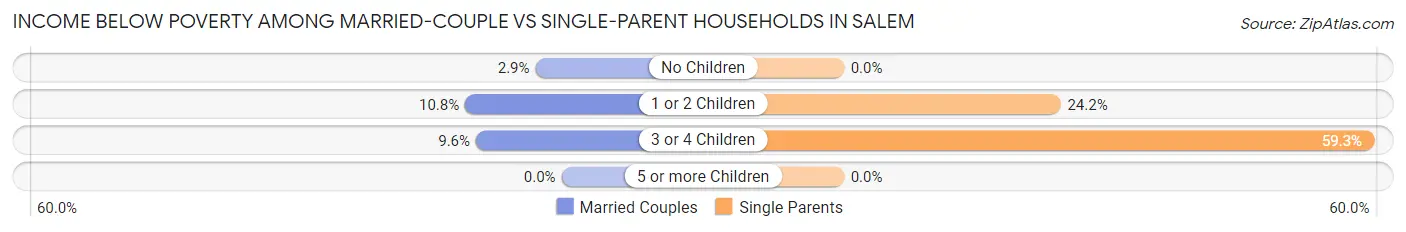
| Children | Married-Couple Families | Single-Parent Households |
| No Children | 9 (2.9%) | 0 (0.0%) |
| 1 or 2 Children | 18 (10.8%) | 71 (24.2%) |
| 3 or 4 Children | 11 (9.6%) | 16 (59.3%) |
| 5 or more Children | 0 (0.0%) | 0 (0.0%) |
| Total | 38 (6.4%) | 87 (20.4%) |
Race in Salem
The most populous races in Salem are White / Caucasian (4,330 | 92.7%), Two or more Races (290 | 6.2%), and Hispanic or Latino (54 | 1.2%).
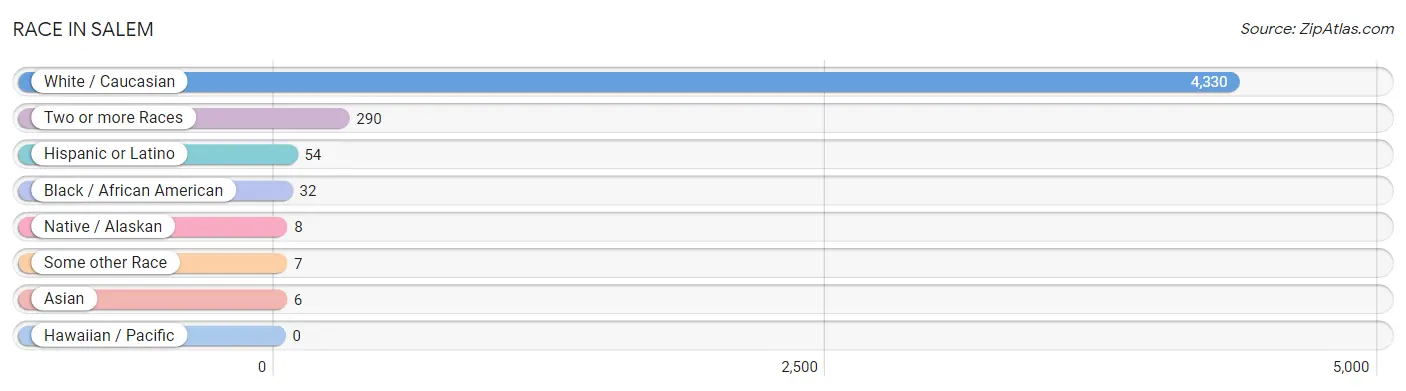
| Race | # Population | % Population |
| Asian | 6 | 0.1% |
| Black / African American | 32 | 0.7% |
| Hawaiian / Pacific | 0 | 0.0% |
| Hispanic or Latino | 54 | 1.2% |
| Native / Alaskan | 8 | 0.2% |
| White / Caucasian | 4,330 | 92.7% |
| Two or more Races | 290 | 6.2% |
| Some other Race | 7 | 0.2% |
| Total | 4,673 | 100.0% |
Ancestry in Salem
The most populous ancestries reported in Salem are German (477 | 10.2%), Irish (409 | 8.7%), English (335 | 7.2%), American (286 | 6.1%), and Dutch (218 | 4.7%), together accounting for 36.9% of all Salem residents.
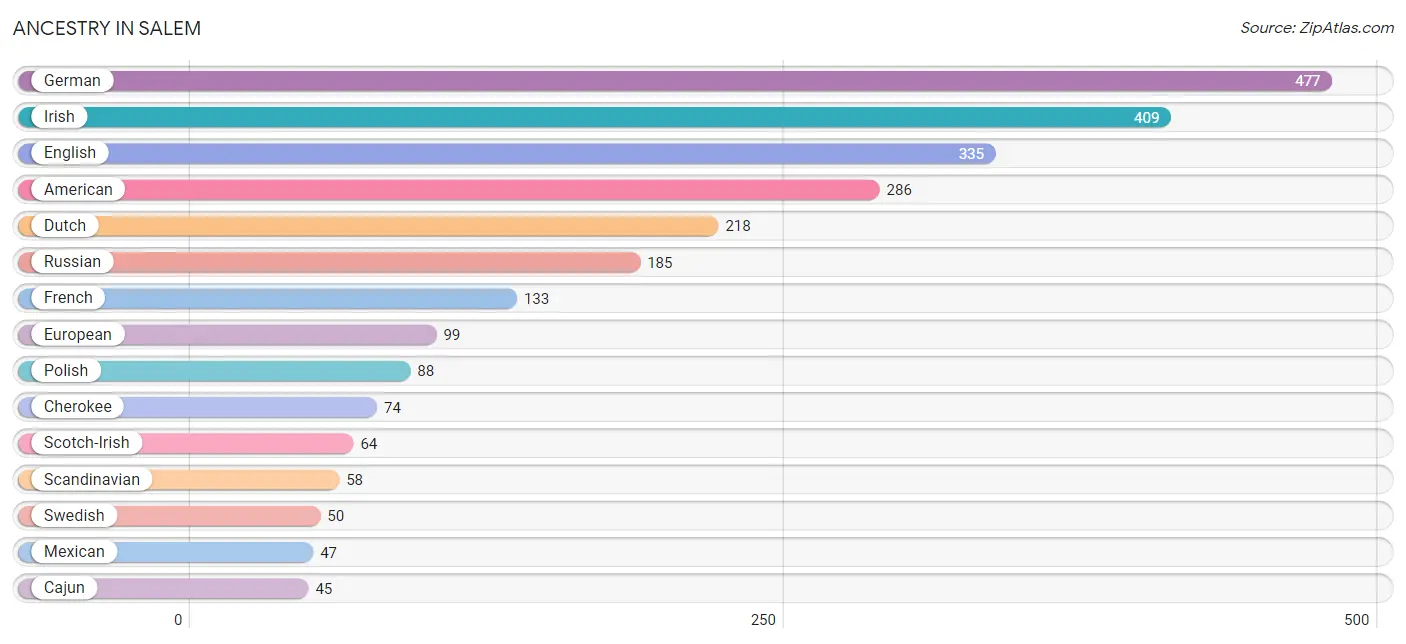
| Ancestry | # Population | % Population |
| American | 286 | 6.1% |
| Apache | 12 | 0.3% |
| Austrian | 11 | 0.2% |
| British | 41 | 0.9% |
| Cajun | 45 | 1.0% |
| Cherokee | 74 | 1.6% |
| Choctaw | 17 | 0.4% |
| Danish | 14 | 0.3% |
| Dutch | 218 | 4.7% |
| Eastern European | 7 | 0.2% |
| English | 335 | 7.2% |
| European | 99 | 2.1% |
| French | 133 | 2.9% |
| French Canadian | 3 | 0.1% |
| German | 477 | 10.2% |
| Hungarian | 35 | 0.7% |
| Indian (Asian) | 25 | 0.5% |
| Irish | 409 | 8.7% |
| Italian | 7 | 0.2% |
| Mexican | 47 | 1.0% |
| Norwegian | 34 | 0.7% |
| Polish | 88 | 1.9% |
| Puerto Rican | 7 | 0.2% |
| Russian | 185 | 4.0% |
| Scandinavian | 58 | 1.2% |
| Scotch-Irish | 64 | 1.4% |
| Scottish | 45 | 1.0% |
| Sri Lankan | 6 | 0.1% |
| Swedish | 50 | 1.1% |
| Swiss | 11 | 0.2% |
| Welsh | 43 | 0.9% | View All 31 Rows |
Immigrants in Salem
The most numerous immigrant groups reported in Salem came from , and Canada (22 | 0.5%), together accounting for 0.5% of all Salem residents.

| Immigration Origin | # Population | % Population |
| Canada | 22 | 0.5% | View All 1 Rows |
Sex and Age in Salem
Sex and Age in Salem
The most populous age groups in Salem are 20 to 24 Years (201 | 10.3%) for men and 70 to 74 Years (239 | 8.8%) for women.
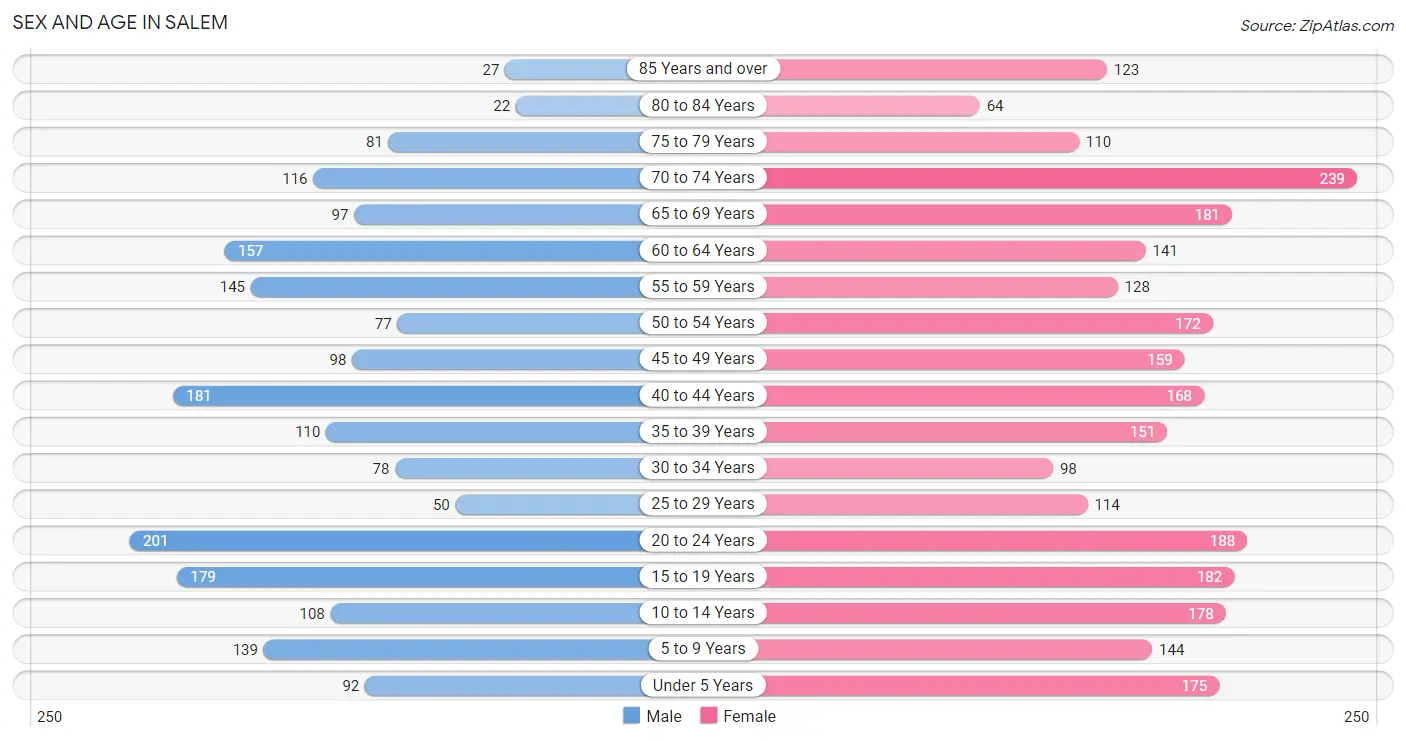
| Age Bracket | Male | Female |
| Under 5 Years | 92 (4.7%) | 175 (6.5%) |
| 5 to 9 Years | 139 (7.1%) | 144 (5.3%) |
| 10 to 14 Years | 108 (5.5%) | 178 (6.6%) |
| 15 to 19 Years | 179 (9.1%) | 182 (6.7%) |
| 20 to 24 Years | 201 (10.3%) | 188 (6.9%) |
| 25 to 29 Years | 50 (2.5%) | 114 (4.2%) |
| 30 to 34 Years | 78 (4.0%) | 98 (3.6%) |
| 35 to 39 Years | 110 (5.6%) | 151 (5.6%) |
| 40 to 44 Years | 181 (9.2%) | 168 (6.2%) |
| 45 to 49 Years | 98 (5.0%) | 159 (5.9%) |
| 50 to 54 Years | 77 (3.9%) | 172 (6.3%) |
| 55 to 59 Years | 145 (7.4%) | 128 (4.7%) |
| 60 to 64 Years | 157 (8.0%) | 141 (5.2%) |
| 65 to 69 Years | 97 (5.0%) | 181 (6.7%) |
| 70 to 74 Years | 116 (5.9%) | 239 (8.8%) |
| 75 to 79 Years | 81 (4.1%) | 110 (4.1%) |
| 80 to 84 Years | 22 (1.1%) | 64 (2.4%) |
| 85 Years and over | 27 (1.4%) | 123 (4.5%) |
| Total | 1,958 (100.0%) | 2,715 (100.0%) |
Families and Households in Salem
Median Family Size in Salem
The median family size in Salem is 3.30 persons per family, with single male/father families (47 | 4.6%) accounting for the largest median family size of 4.02 persons per family. On the other hand, single female/mother families (380 | 37.4%) represent the smallest median family size with 3.14 persons per family.
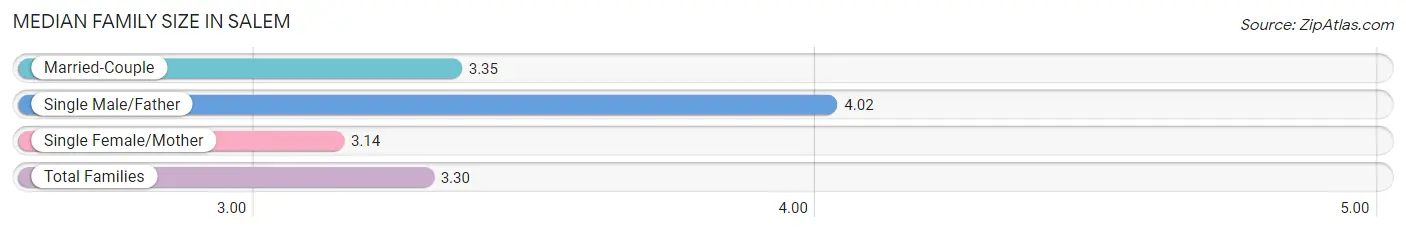
| Family Type | # Families | Family Size |
| Married-Couple | 590 (58.0%) | 3.35 |
| Single Male/Father | 47 (4.6%) | 4.02 |
| Single Female/Mother | 380 (37.4%) | 3.14 |
| Total Families | 1,017 (100.0%) | 3.30 |
Median Household Size in Salem
The median household size in Salem is 2.22 persons per household, with single male/father households (47 | 2.3%) accounting for the largest median household size of 4.77 persons per household. non-family households (1,036 | 50.5%) represent the smallest median household size with 1.01 persons per household.
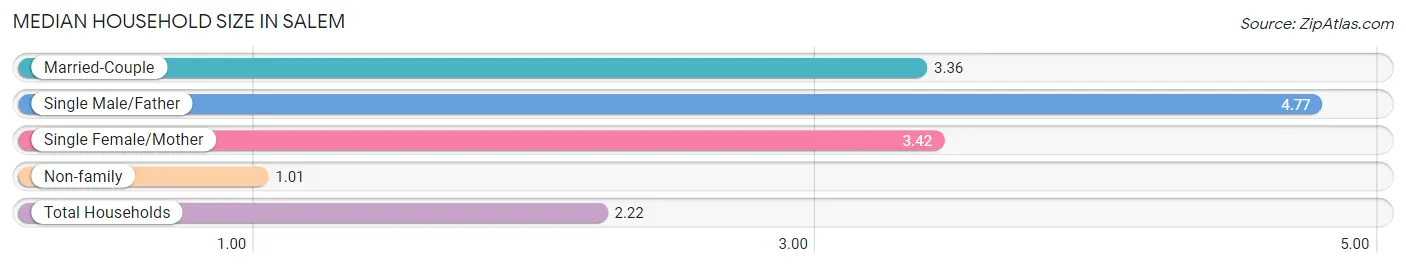
| Household Type | # Households | Household Size |
| Married-Couple | 590 (28.7%) | 3.36 |
| Single Male/Father | 47 (2.3%) | 4.77 |
| Single Female/Mother | 380 (18.5%) | 3.42 |
| Non-family | 1,036 (50.5%) | 1.01 |
| Total Households | 2,053 (100.0%) | 2.22 |
Household Size by Marriage Status in Salem
Out of a total of 2,053 households in Salem, 1,017 (49.5%) are family households, while 1,036 (50.5%) are nonfamily households. The most numerous type of family households are 2-person households, comprising 451, and the most common type of nonfamily households are 1-person households, comprising 1,024.
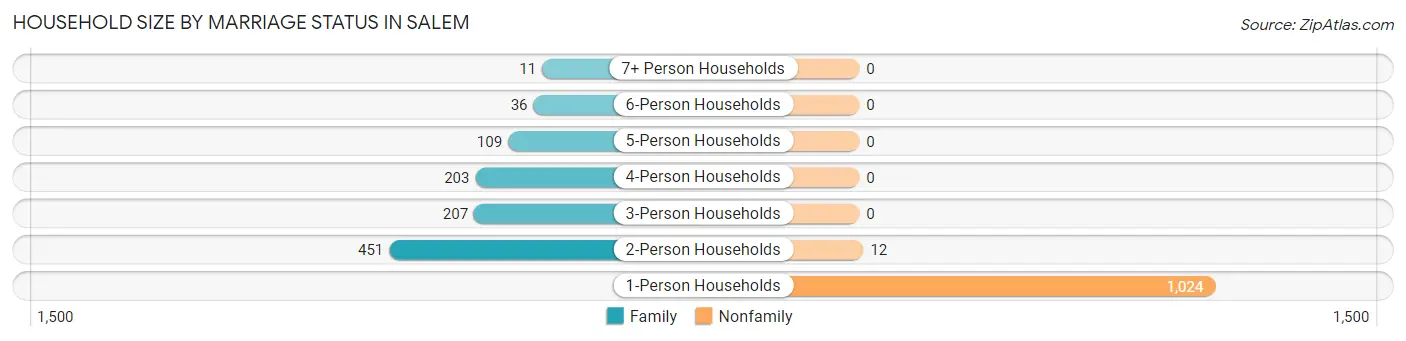
| Household Size | Family Households | Nonfamily Households |
| 1-Person Households | - | 1,024 (49.9%) |
| 2-Person Households | 451 (22.0%) | 12 (0.6%) |
| 3-Person Households | 207 (10.1%) | 0 (0.0%) |
| 4-Person Households | 203 (9.9%) | 0 (0.0%) |
| 5-Person Households | 109 (5.3%) | 0 (0.0%) |
| 6-Person Households | 36 (1.8%) | 0 (0.0%) |
| 7+ Person Households | 11 (0.5%) | 0 (0.0%) |
| Total | 1,017 (49.5%) | 1,036 (50.5%) |
Female Fertility in Salem
Fertility by Age in Salem
Average fertility rate in Salem is 73.0 births per 1,000 women. Women in the age bracket of 20 to 34 years have the highest fertility rate with 105.0 births per 1,000 women. Women in the age bracket of 20 to 34 years acount for 50.6% of all women with births.
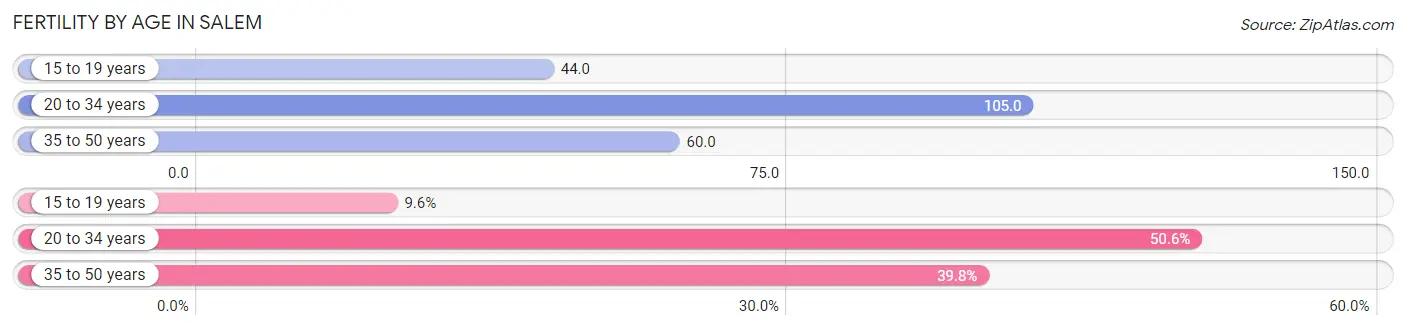
| Age Bracket | Women with Births | Births / 1,000 Women |
| 15 to 19 years | 8 (9.6%) | 44.0 |
| 20 to 34 years | 42 (50.6%) | 105.0 |
| 35 to 50 years | 33 (39.8%) | 60.0 |
| Total | 83 (100.0%) | 73.0 |
Fertility by Age by Marriage Status in Salem
26.5% of women with births (83) in Salem are married. The highest percentage of unmarried women with births falls into 15 to 19 years age bracket with 100.0% of them unmarried at the time of birth, while the lowest percentage of unmarried women with births belong to 20 to 34 years age bracket with 47.6% of them unmarried.
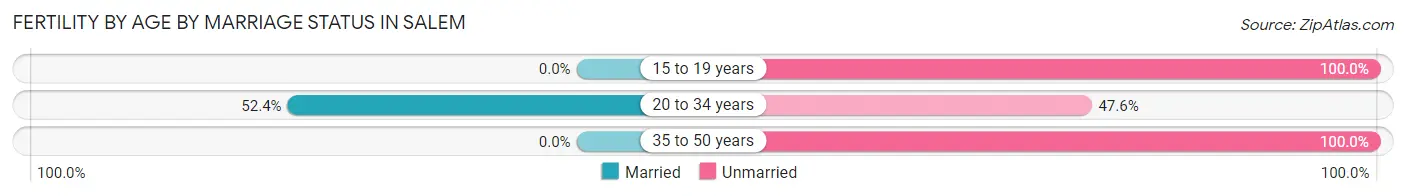
| Age Bracket | Married | Unmarried |
| 15 to 19 years | 0 (0.0%) | 8 (100.0%) |
| 20 to 34 years | 22 (52.4%) | 20 (47.6%) |
| 35 to 50 years | 0 (0.0%) | 33 (100.0%) |
| Total | 22 (26.5%) | 61 (73.5%) |
Fertility by Education in Salem
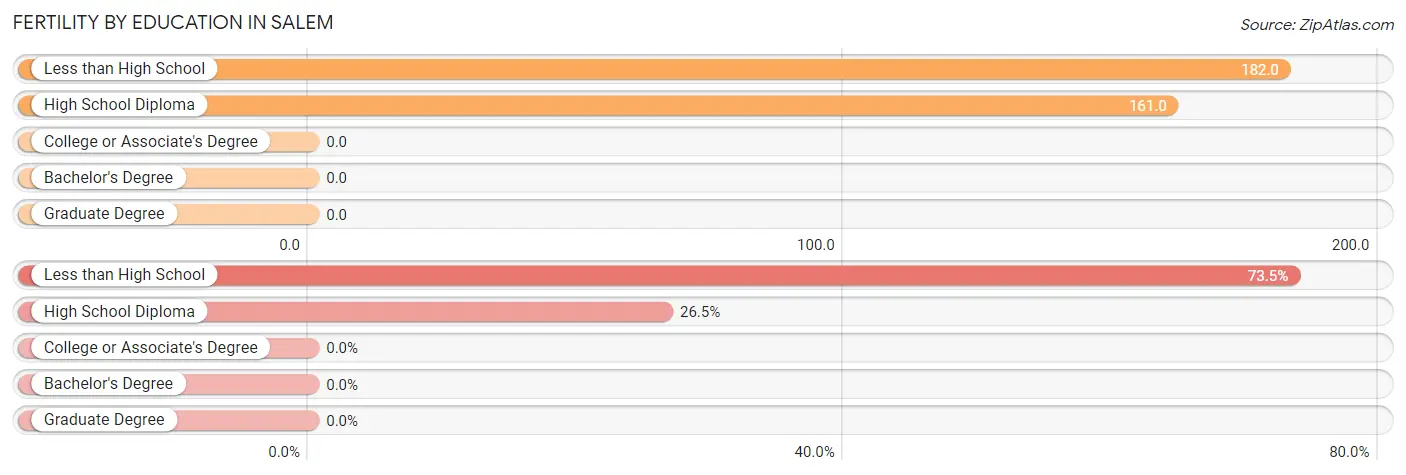
| Educational Attainment | Women with Births | Births / 1,000 Women |
| Less than High School | 61 (73.5%) | 182.0 |
| High School Diploma | 22 (26.5%) | 161.0 |
| College or Associate's Degree | 0 (0.0%) | 0.0 |
| Bachelor's Degree | 0 (0.0%) | 0.0 |
| Graduate Degree | 0 (0.0%) | 0.0 |
| Total | 83 (100.0%) | 73.0 |
Fertility by Education by Marriage Status in Salem
73.5% of women with births in Salem are unmarried. Women with the educational attainment of high school diploma are most likely to be married with 63.6% of them married at childbirth, while women with the educational attainment of less than high school are least likely to be married with 86.9% of them unmarried at childbirth.
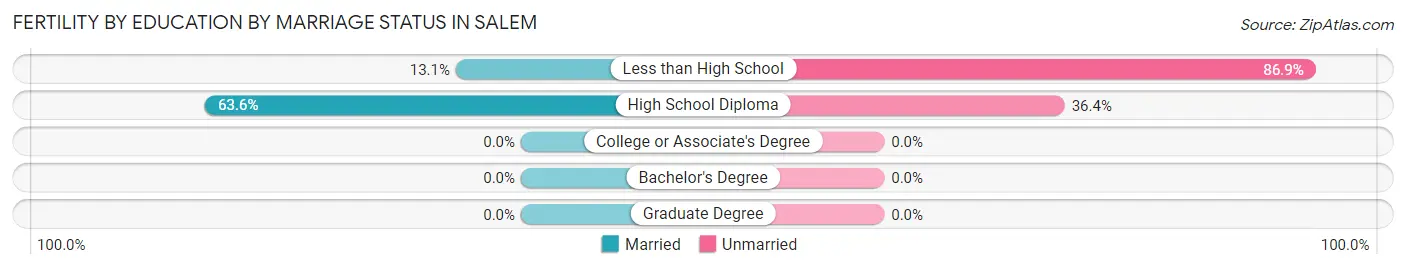
| Educational Attainment | Married | Unmarried |
| Less than High School | 8 (13.1%) | 53 (86.9%) |
| High School Diploma | 14 (63.6%) | 8 (36.4%) |
| College or Associate's Degree | 0 (0.0%) | 0 (0.0%) |
| Bachelor's Degree | 0 (0.0%) | 0 (0.0%) |
| Graduate Degree | 0 (0.0%) | 0 (0.0%) |
| Total | 22 (26.5%) | 61 (73.5%) |
Employment Characteristics in Salem
Employment by Class of Employer in Salem
Among the 1,724 employed individuals in Salem, private company employees (1,069 | 62.0%), local government employees (266 | 15.4%), and state government employees (145 | 8.4%) make up the most common classes of employment.
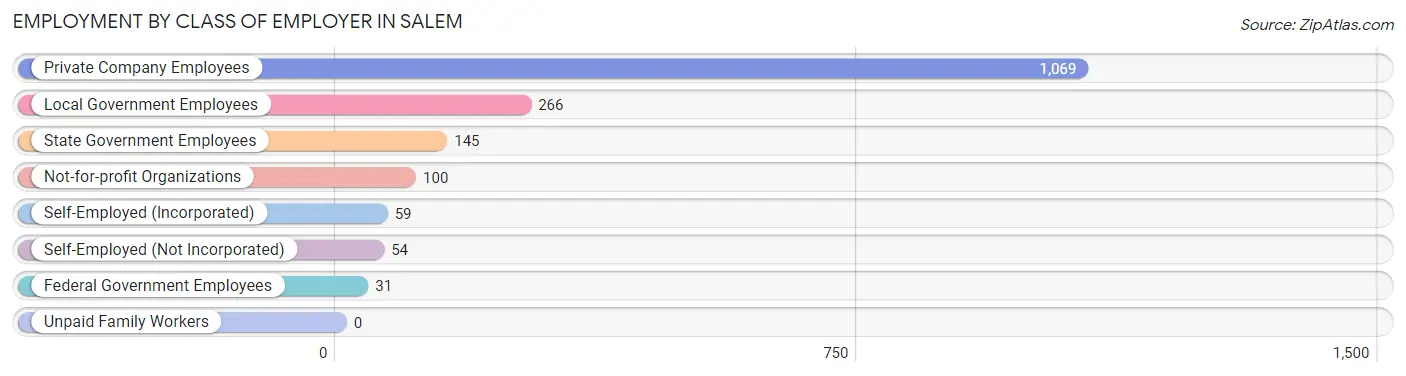
| Employer Class | # Employees | % Employees |
| Private Company Employees | 1,069 | 62.0% |
| Self-Employed (Incorporated) | 59 | 3.4% |
| Self-Employed (Not Incorporated) | 54 | 3.1% |
| Not-for-profit Organizations | 100 | 5.8% |
| Local Government Employees | 266 | 15.4% |
| State Government Employees | 145 | 8.4% |
| Federal Government Employees | 31 | 1.8% |
| Unpaid Family Workers | 0 | 0.0% |
| Total | 1,724 | 100.0% |
Employment Status by Age in Salem
According to the labor force statistics for Salem, out of the total population over 16 years of age (3,737), 55.0% or 2,055 individuals are in the labor force, with 7.0% or 144 of them unemployed. The age group with the highest labor force participation rate is 25 to 29 years, with 99.4% or 163 individuals in the labor force. Within the labor force, the 20 to 24 years age range has the highest percentage of unemployed individuals, with 17.8% or 58 of them being unemployed.
| Age Bracket | In Labor Force | Unemployed |
| 16 to 19 Years | 169 (64.8%) | 28 (16.6%) |
| 20 to 24 Years | 326 (83.8%) | 58 (17.8%) |
| 25 to 29 Years | 163 (99.4%) | 19 (11.7%) |
| 30 to 34 Years | 163 (92.6%) | 0 (0.0%) |
| 35 to 44 Years | 546 (89.5%) | 17 (3.1%) |
| 45 to 54 Years | 339 (67.0%) | 15 (4.4%) |
| 55 to 59 Years | 153 (56.0%) | 6 (3.9%) |
| 60 to 64 Years | 81 (27.2%) | 0 (0.0%) |
| 65 to 74 Years | 86 (13.6%) | 0 (0.0%) |
| 75 Years and over | 28 (6.6%) | 0 (0.0%) |
| Total | 2,055 (55.0%) | 144 (7.0%) |
Employment Status by Educational Attainment in Salem
According to labor force statistics for Salem, 71.3% of individuals (1,445) out of the total population between 25 and 64 years of age (2,027) are in the labor force, with 3.9% or 56 of them being unemployed. The group with the highest labor force participation rate are those with the educational attainment of college / associate degree, with 84.1% or 565 individuals in the labor force. Within the labor force, individuals with high school diploma education have the highest percentage of unemployment, with 10.1% or 40 of them being unemployed.
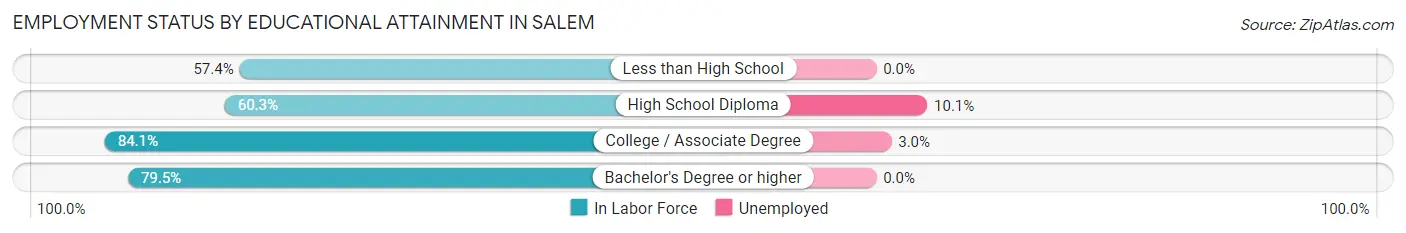
| Educational Attainment | In Labor Force | Unemployed |
| Less than High School | 186 (57.4%) | 0 (0.0%) |
| High School Diploma | 395 (60.3%) | 66 (10.1%) |
| College / Associate Degree | 565 (84.1%) | 20 (3.0%) |
| Bachelor's Degree or higher | 299 (79.5%) | 0 (0.0%) |
| Total | 1,445 (71.3%) | 79 (3.9%) |
Employment Occupations by Sex in Salem
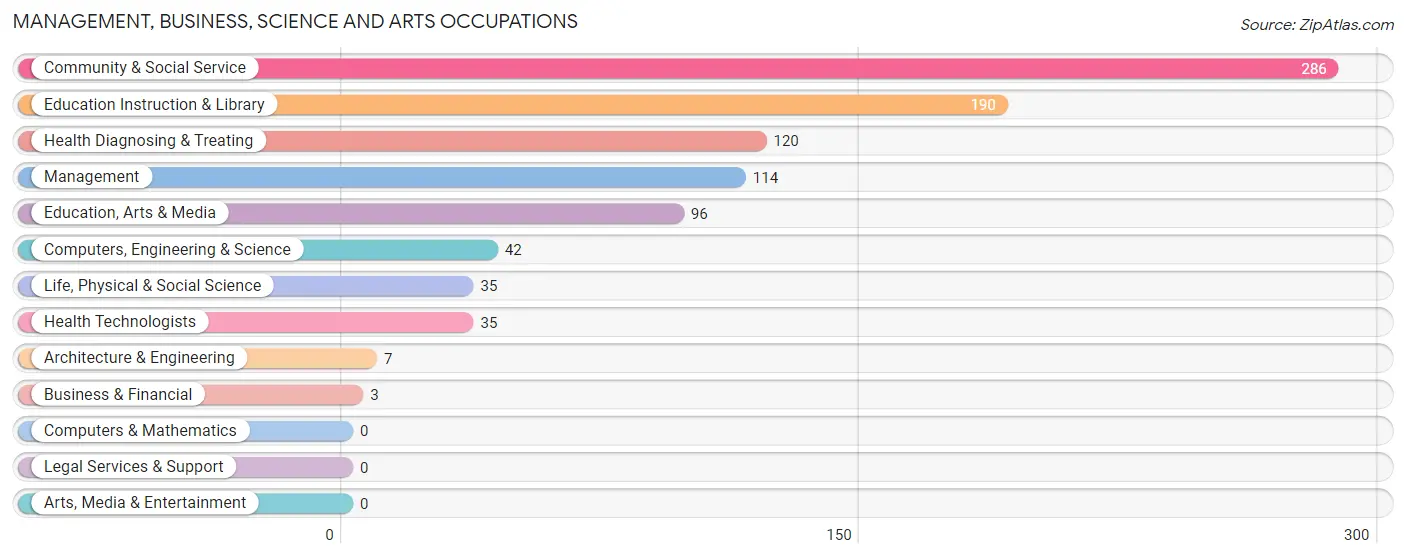
Management, Business, Science and Arts Occupations
The most common Management, Business, Science and Arts occupations in Salem are Community & Social Service (286 | 15.0%), Education Instruction & Library (190 | 9.9%), Health Diagnosing & Treating (120 | 6.3%), Management (114 | 6.0%), and Education, Arts & Media (96 | 5.0%).
Management, Business, Science and Arts Occupations by Sex
Within the Management, Business, Science and Arts occupations in Salem, the most male-oriented occupations are Business & Financial (100.0%), Architecture & Engineering (100.0%), and Education, Arts & Media (34.4%), while the most female-oriented occupations are Life, Physical & Social Science (100.0%), Health Diagnosing & Treating (100.0%), and Health Technologists (100.0%).
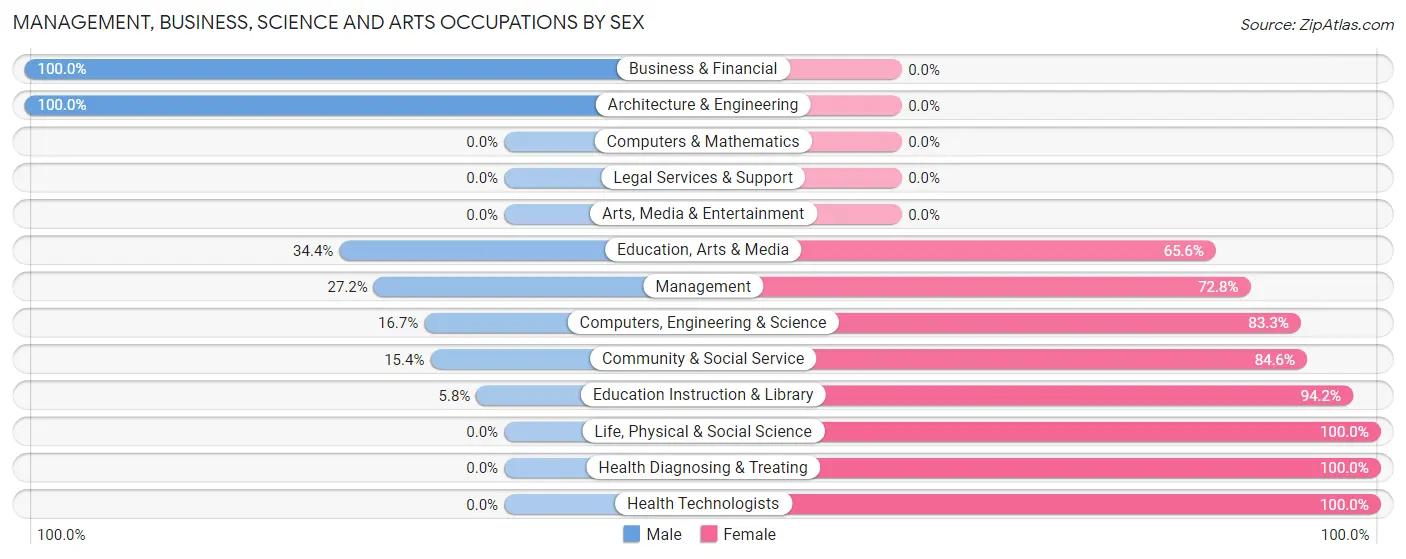
| Occupation | Male | Female |
| Management | 31 (27.2%) | 83 (72.8%) |
| Business & Financial | 3 (100.0%) | 0 (0.0%) |
| Computers, Engineering & Science | 7 (16.7%) | 35 (83.3%) |
| Computers & Mathematics | 0 (0.0%) | 0 (0.0%) |
| Architecture & Engineering | 7 (100.0%) | 0 (0.0%) |
| Life, Physical & Social Science | 0 (0.0%) | 35 (100.0%) |
| Community & Social Service | 44 (15.4%) | 242 (84.6%) |
| Education, Arts & Media | 33 (34.4%) | 63 (65.6%) |
| Legal Services & Support | 0 (0.0%) | 0 (0.0%) |
| Education Instruction & Library | 11 (5.8%) | 179 (94.2%) |
| Arts, Media & Entertainment | 0 (0.0%) | 0 (0.0%) |
| Health Diagnosing & Treating | 0 (0.0%) | 120 (100.0%) |
| Health Technologists | 0 (0.0%) | 35 (100.0%) |
| Total (Category) | 85 (15.0%) | 480 (85.0%) |
| Total (Overall) | 823 (43.1%) | 1,088 (56.9%) |
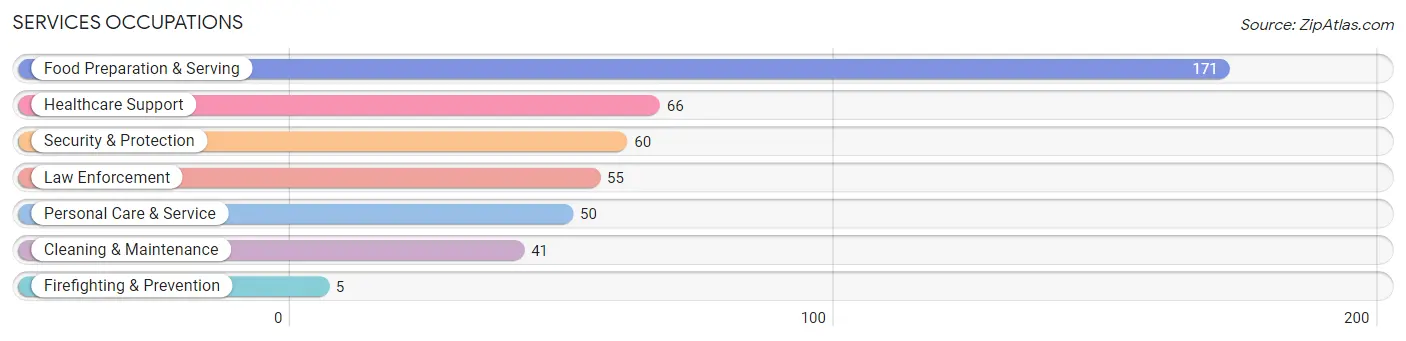
Services Occupations
The most common Services occupations in Salem are Food Preparation & Serving (171 | 8.9%), Healthcare Support (66 | 3.5%), Security & Protection (60 | 3.1%), Law Enforcement (55 | 2.9%), and Personal Care & Service (50 | 2.6%).
Services Occupations by Sex
Within the Services occupations in Salem, the most male-oriented occupations are Firefighting & Prevention (100.0%), Security & Protection (83.3%), and Law Enforcement (81.8%), while the most female-oriented occupations are Healthcare Support (100.0%), Personal Care & Service (100.0%), and Food Preparation & Serving (81.3%).
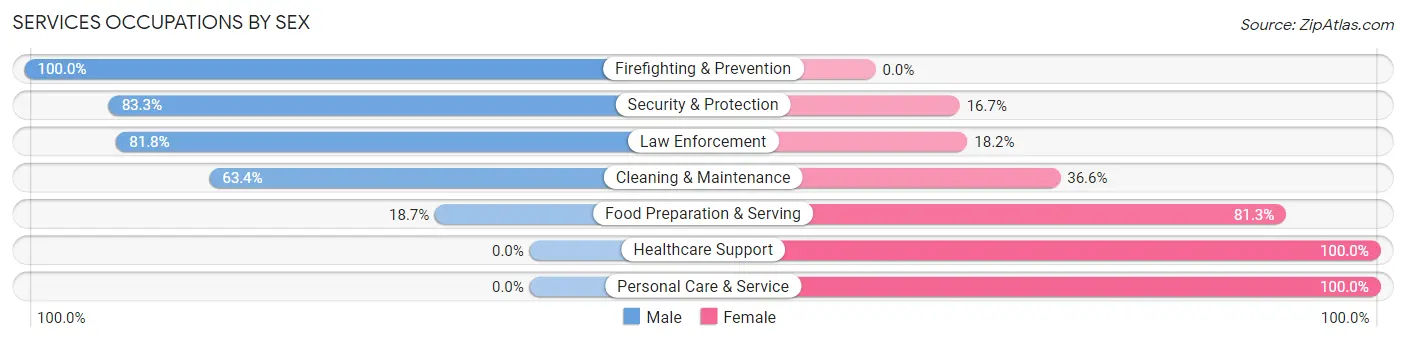
| Occupation | Male | Female |
| Healthcare Support | 0 (0.0%) | 66 (100.0%) |
| Security & Protection | 50 (83.3%) | 10 (16.7%) |
| Firefighting & Prevention | 5 (100.0%) | 0 (0.0%) |
| Law Enforcement | 45 (81.8%) | 10 (18.2%) |
| Food Preparation & Serving | 32 (18.7%) | 139 (81.3%) |
| Cleaning & Maintenance | 26 (63.4%) | 15 (36.6%) |
| Personal Care & Service | 0 (0.0%) | 50 (100.0%) |
| Total (Category) | 108 (27.8%) | 280 (72.2%) |
| Total (Overall) | 823 (43.1%) | 1,088 (56.9%) |
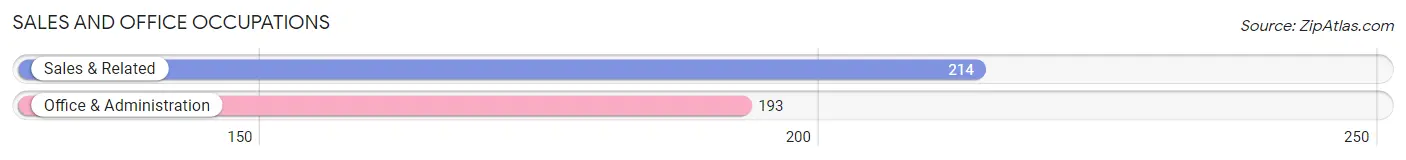
Sales and Office Occupations
The most common Sales and Office occupations in Salem are Sales & Related (214 | 11.2%), and Office & Administration (193 | 10.1%).
Sales and Office Occupations by Sex
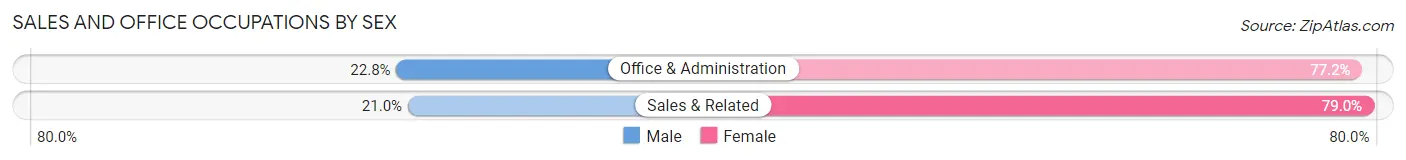
| Occupation | Male | Female |
| Sales & Related | 45 (21.0%) | 169 (79.0%) |
| Office & Administration | 44 (22.8%) | 149 (77.2%) |
| Total (Category) | 89 (21.9%) | 318 (78.1%) |
| Total (Overall) | 823 (43.1%) | 1,088 (56.9%) |
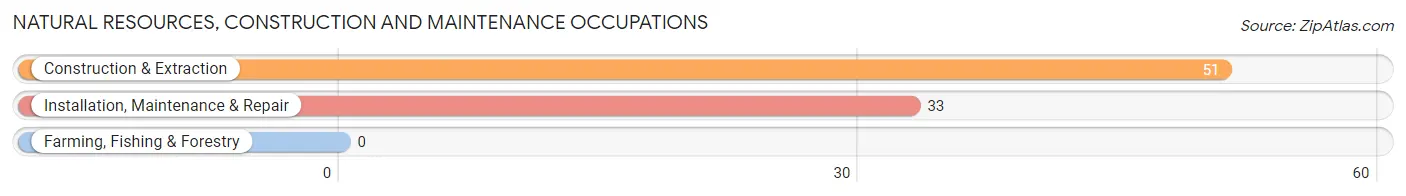
Natural Resources, Construction and Maintenance Occupations
The most common Natural Resources, Construction and Maintenance occupations in Salem are Construction & Extraction (51 | 2.7%), and Installation, Maintenance & Repair (33 | 1.7%).
Natural Resources, Construction and Maintenance Occupations by Sex
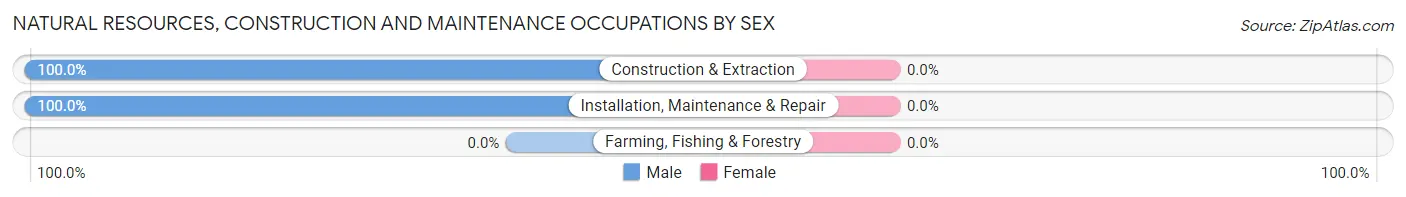
| Occupation | Male | Female |
| Farming, Fishing & Forestry | 0 (0.0%) | 0 (0.0%) |
| Construction & Extraction | 51 (100.0%) | 0 (0.0%) |
| Installation, Maintenance & Repair | 33 (100.0%) | 0 (0.0%) |
| Total (Category) | 84 (100.0%) | 0 (0.0%) |
| Total (Overall) | 823 (43.1%) | 1,088 (56.9%) |
Production, Transportation and Moving Occupations
The most common Production, Transportation and Moving occupations in Salem are Production (224 | 11.7%), Material Moving (161 | 8.4%), and Transportation (82 | 4.3%).
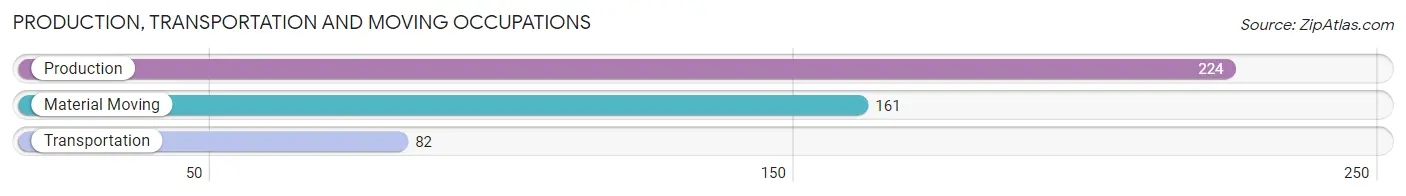
Production, Transportation and Moving Occupations by Sex
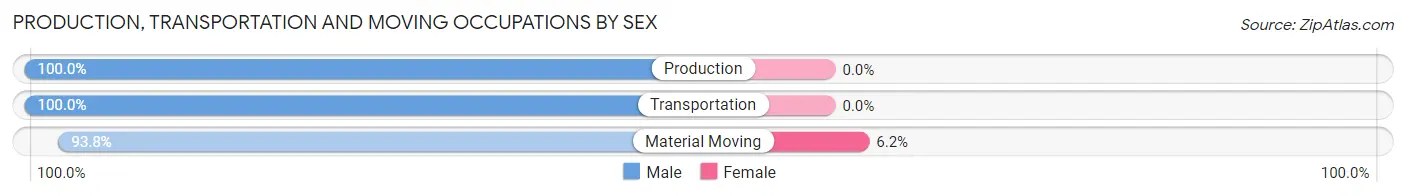
| Occupation | Male | Female |
| Production | 224 (100.0%) | 0 (0.0%) |
| Transportation | 82 (100.0%) | 0 (0.0%) |
| Material Moving | 151 (93.8%) | 10 (6.2%) |
| Total (Category) | 457 (97.9%) | 10 (2.1%) |
| Total (Overall) | 823 (43.1%) | 1,088 (56.9%) |
Employment Industries by Sex in Salem
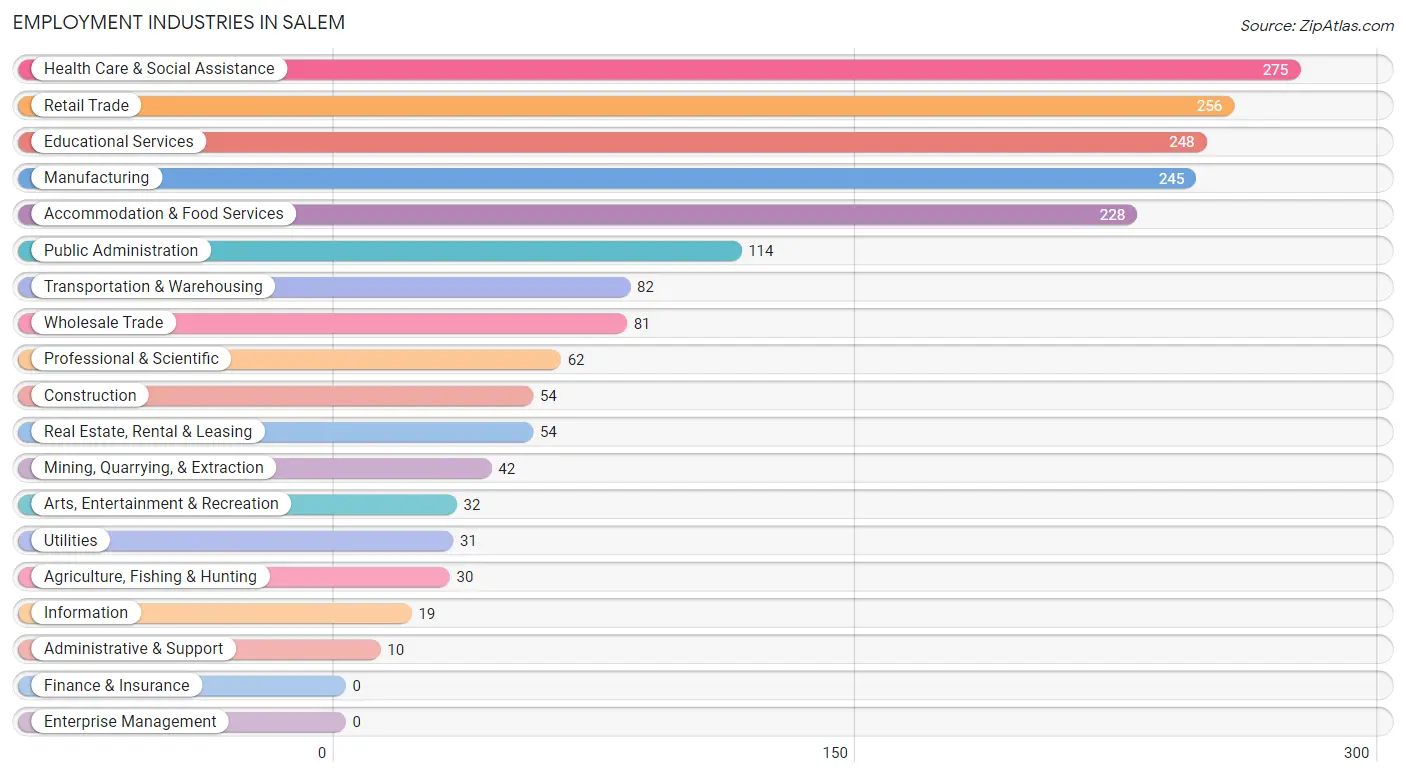
Employment Industries in Salem
The major employment industries in Salem include Health Care & Social Assistance (275 | 14.4%), Retail Trade (256 | 13.4%), Educational Services (248 | 13.0%), Manufacturing (245 | 12.8%), and Accommodation & Food Services (228 | 11.9%).
Employment Industries by Sex in Salem
The Salem industries that see more men than women are Agriculture, Fishing & Hunting (100.0%), Construction (100.0%), and Wholesale Trade (100.0%), whereas the industries that tend to have a higher number of women are Health Care & Social Assistance (94.2%), Educational Services (90.3%), and Arts, Entertainment & Recreation (87.5%).
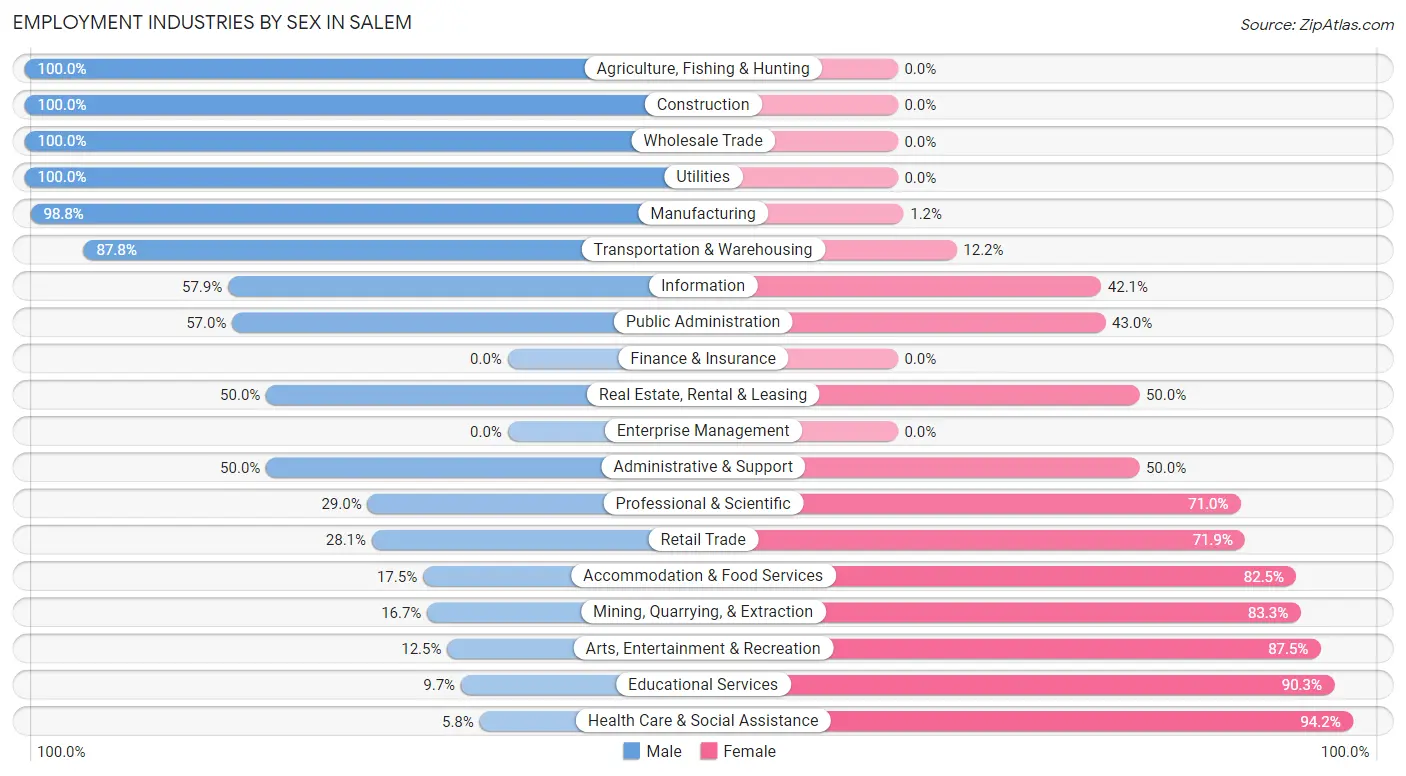
| Industry | Male | Female |
| Agriculture, Fishing & Hunting | 30 (100.0%) | 0 (0.0%) |
| Mining, Quarrying, & Extraction | 7 (16.7%) | 35 (83.3%) |
| Construction | 54 (100.0%) | 0 (0.0%) |
| Manufacturing | 242 (98.8%) | 3 (1.2%) |
| Wholesale Trade | 81 (100.0%) | 0 (0.0%) |
| Retail Trade | 72 (28.1%) | 184 (71.9%) |
| Transportation & Warehousing | 72 (87.8%) | 10 (12.2%) |
| Utilities | 31 (100.0%) | 0 (0.0%) |
| Information | 11 (57.9%) | 8 (42.1%) |
| Finance & Insurance | 0 (0.0%) | 0 (0.0%) |
| Real Estate, Rental & Leasing | 27 (50.0%) | 27 (50.0%) |
| Professional & Scientific | 18 (29.0%) | 44 (71.0%) |
| Enterprise Management | 0 (0.0%) | 0 (0.0%) |
| Administrative & Support | 5 (50.0%) | 5 (50.0%) |
| Educational Services | 24 (9.7%) | 224 (90.3%) |
| Health Care & Social Assistance | 16 (5.8%) | 259 (94.2%) |
| Arts, Entertainment & Recreation | 4 (12.5%) | 28 (87.5%) |
| Accommodation & Food Services | 40 (17.5%) | 188 (82.5%) |
| Public Administration | 65 (57.0%) | 49 (43.0%) |
| Total | 823 (43.1%) | 1,088 (56.9%) |
Education in Salem
School Enrollment in Salem
The most common levels of schooling among the 1,271 students in Salem are college / undergraduate (297 | 23.4%), elementary school (273 | 21.5%), and middle school (247 | 19.4%).
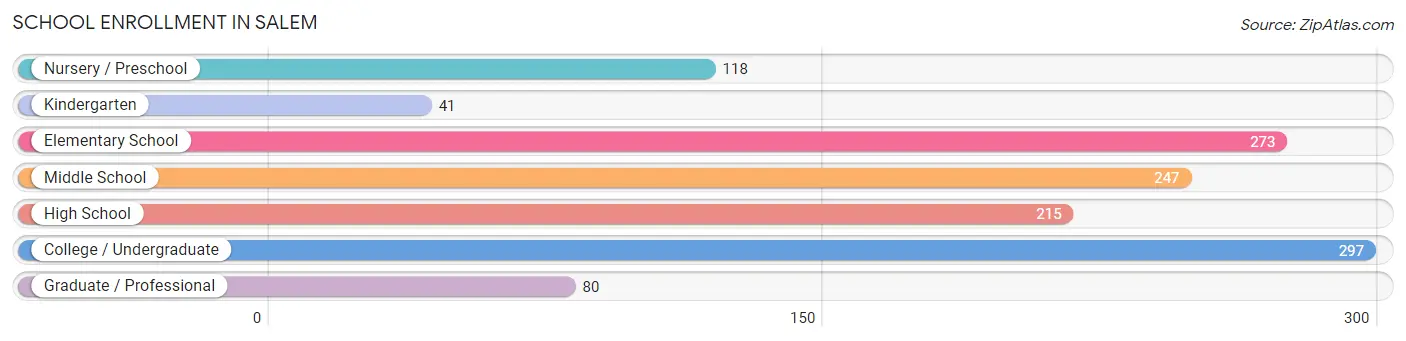
| School Level | # Students | % Students |
| Nursery / Preschool | 118 | 9.3% |
| Kindergarten | 41 | 3.2% |
| Elementary School | 273 | 21.5% |
| Middle School | 247 | 19.4% |
| High School | 215 | 16.9% |
| College / Undergraduate | 297 | 23.4% |
| Graduate / Professional | 80 | 6.3% |
| Total | 1,271 | 100.0% |
School Enrollment by Age by Funding Source in Salem
Out of a total of 1,271 students who are enrolled in schools in Salem, 348 (27.4%) attend a private institution, while the remaining 923 (72.6%) are enrolled in public schools. The age group of 35 years and over has the highest likelihood of being enrolled in private schools, with 61 (75.3% in the age bracket) enrolled. Conversely, the age group of 10 to 14 year olds has the lowest likelihood of being enrolled in a private school, with 282 (100.0% in the age bracket) attending a public institution.
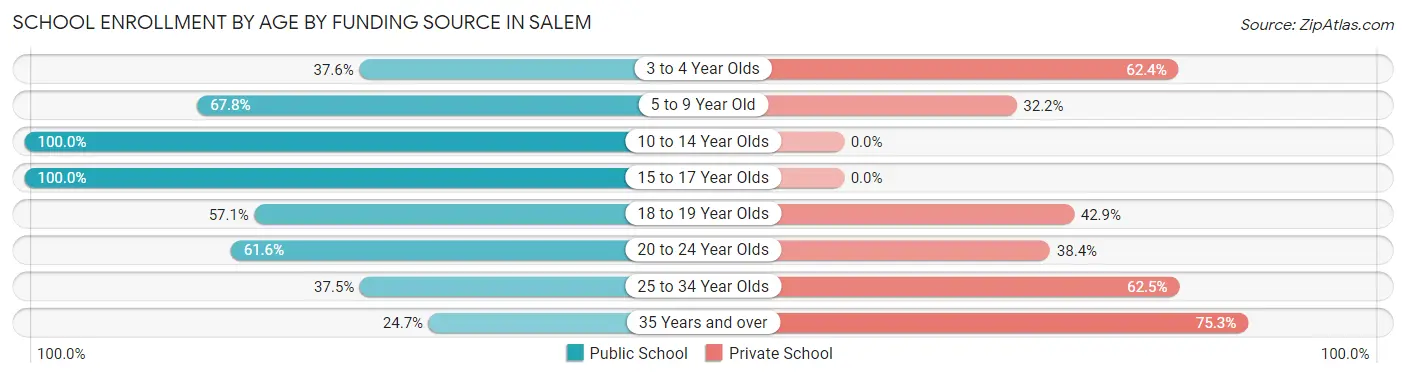
| Age Bracket | Public School | Private School |
| 3 to 4 Year Olds | 38 (37.6%) | 63 (62.4%) |
| 5 to 9 Year Old | 192 (67.8%) | 91 (32.2%) |
| 10 to 14 Year Olds | 282 (100.0%) | 0 (0.0%) |
| 15 to 17 Year Olds | 237 (100.0%) | 0 (0.0%) |
| 18 to 19 Year Olds | 20 (57.1%) | 15 (42.9%) |
| 20 to 24 Year Olds | 101 (61.6%) | 63 (38.4%) |
| 25 to 34 Year Olds | 33 (37.5%) | 55 (62.5%) |
| 35 Years and over | 20 (24.7%) | 61 (75.3%) |
| Total | 923 (72.6%) | 348 (27.4%) |
Educational Attainment by Field of Study in Salem
Education (146 | 31.2%), business (65 | 13.9%), engineering (52 | 11.1%), psychology (47 | 10.0%), and literature & languages (38 | 8.1%) are the most common fields of study among 468 individuals in Salem who have obtained a bachelor's degree or higher.
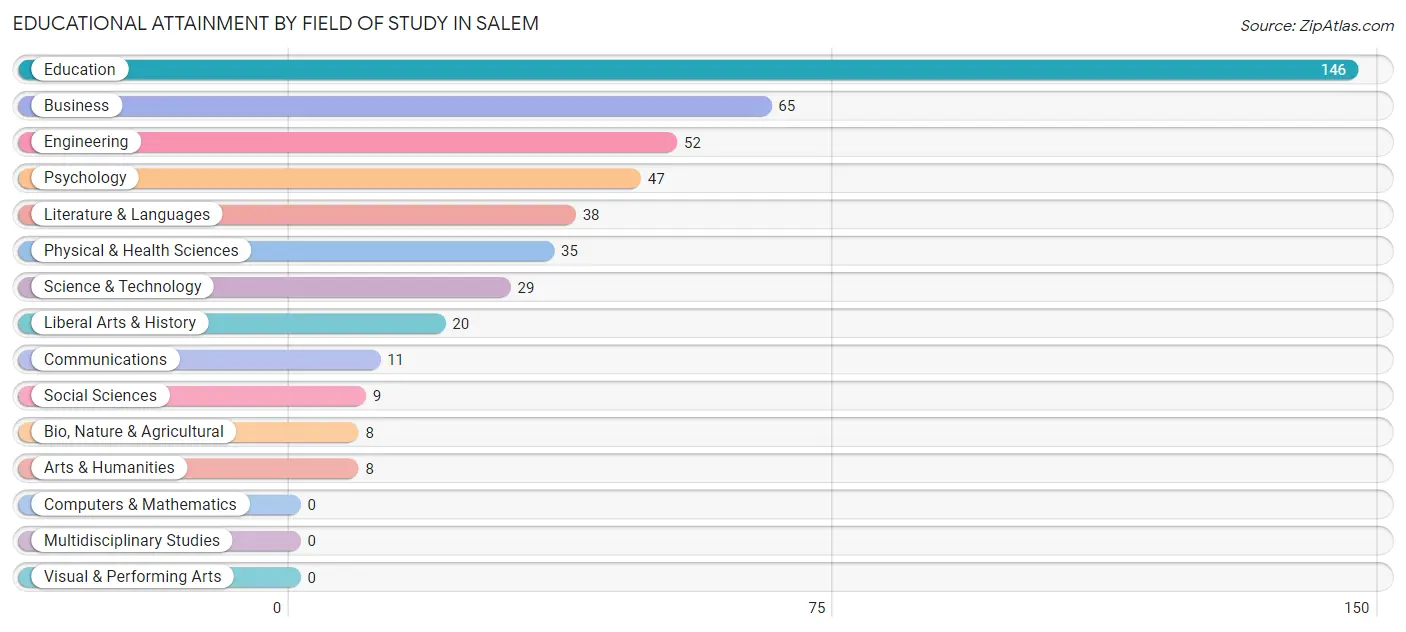
| Field of Study | # Graduates | % Graduates |
| Computers & Mathematics | 0 | 0.0% |
| Bio, Nature & Agricultural | 8 | 1.7% |
| Physical & Health Sciences | 35 | 7.5% |
| Psychology | 47 | 10.0% |
| Social Sciences | 9 | 1.9% |
| Engineering | 52 | 11.1% |
| Multidisciplinary Studies | 0 | 0.0% |
| Science & Technology | 29 | 6.2% |
| Business | 65 | 13.9% |
| Education | 146 | 31.2% |
| Literature & Languages | 38 | 8.1% |
| Liberal Arts & History | 20 | 4.3% |
| Visual & Performing Arts | 0 | 0.0% |
| Communications | 11 | 2.4% |
| Arts & Humanities | 8 | 1.7% |
| Total | 468 | 100.0% |
Transportation & Commute in Salem
Vehicle Availability by Sex in Salem
The most prevalent vehicle ownership categories in Salem are males with 2 vehicles (353, accounting for 50.4%) and females with 2 vehicles (453, making up 34.5%).
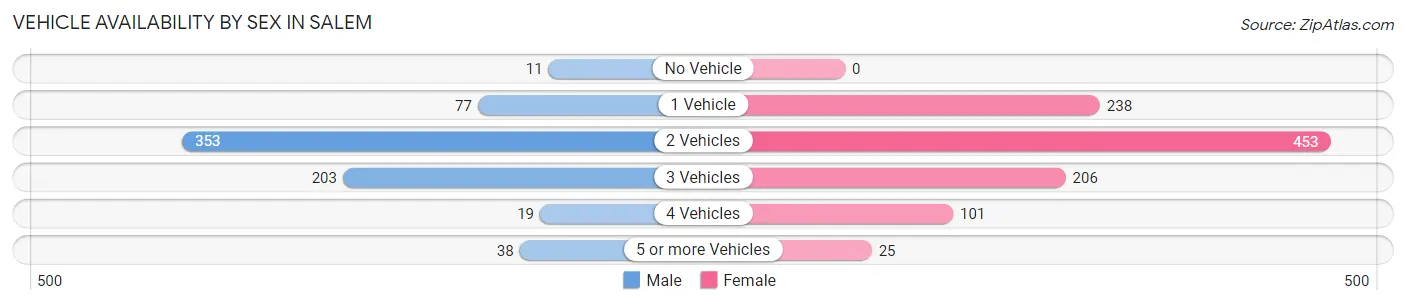
| Vehicles Available | Male | Female |
| No Vehicle | 11 (1.6%) | 0 (0.0%) |
| 1 Vehicle | 77 (11.0%) | 238 (23.3%) |
| 2 Vehicles | 353 (50.4%) | 453 (44.3%) |
| 3 Vehicles | 203 (29.0%) | 206 (20.1%) |
| 4 Vehicles | 19 (2.7%) | 101 (9.9%) |
| 5 or more Vehicles | 38 (5.4%) | 25 (2.4%) |
| Total | 701 (100.0%) | 1,023 (100.0%) |
Commute Time in Salem
The most frequently occuring commute durations in Salem are 5 to 9 minutes (554 commuters, 32.4%), 10 to 14 minutes (300 commuters, 17.5%), and less than 5 minutes (274 commuters, 16.0%).
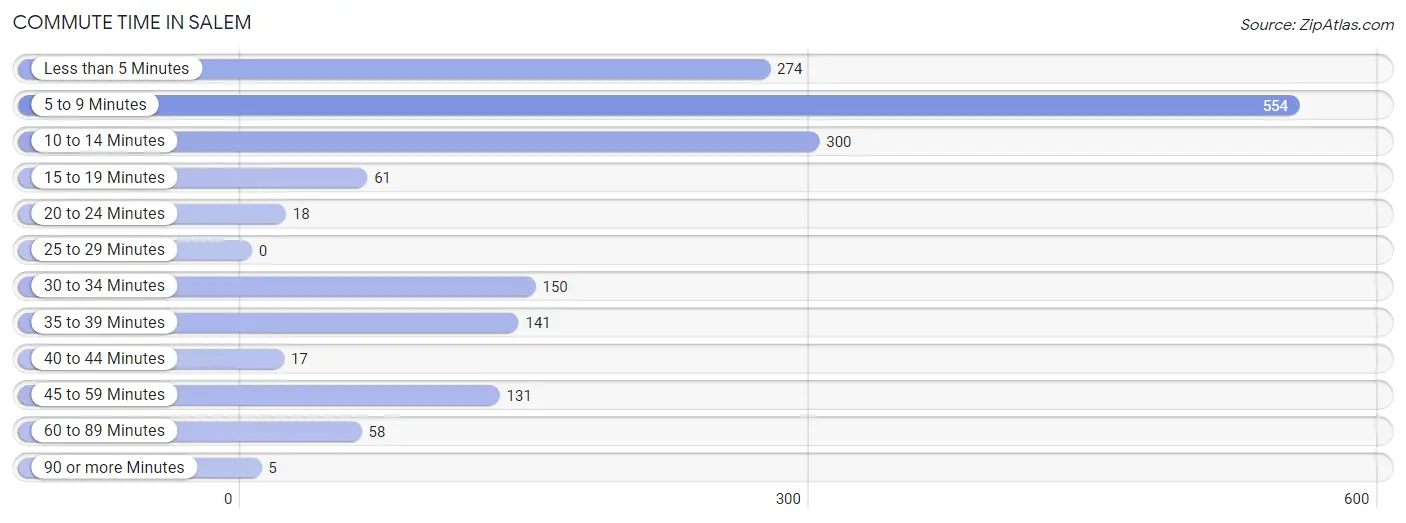
| Commute Time | # Commuters | % Commuters |
| Less than 5 Minutes | 274 | 16.0% |
| 5 to 9 Minutes | 554 | 32.4% |
| 10 to 14 Minutes | 300 | 17.5% |
| 15 to 19 Minutes | 61 | 3.6% |
| 20 to 24 Minutes | 18 | 1.1% |
| 25 to 29 Minutes | 0 | 0.0% |
| 30 to 34 Minutes | 150 | 8.8% |
| 35 to 39 Minutes | 141 | 8.3% |
| 40 to 44 Minutes | 17 | 1.0% |
| 45 to 59 Minutes | 131 | 7.7% |
| 60 to 89 Minutes | 58 | 3.4% |
| 90 or more Minutes | 5 | 0.3% |
Commute Time by Sex in Salem
The most common commute times in Salem are 5 to 9 minutes (145 commuters, 20.8%) for males and 5 to 9 minutes (409 commuters, 40.5%) for females.
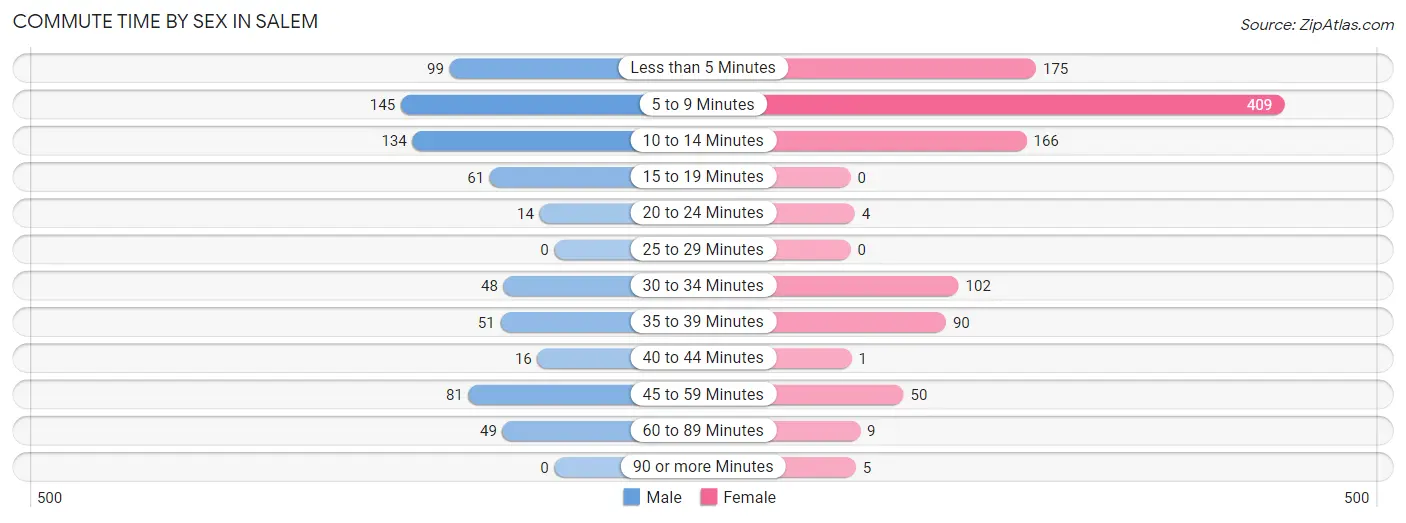
| Commute Time | Male | Female |
| Less than 5 Minutes | 99 (14.2%) | 175 (17.3%) |
| 5 to 9 Minutes | 145 (20.8%) | 409 (40.5%) |
| 10 to 14 Minutes | 134 (19.2%) | 166 (16.4%) |
| 15 to 19 Minutes | 61 (8.7%) | 0 (0.0%) |
| 20 to 24 Minutes | 14 (2.0%) | 4 (0.4%) |
| 25 to 29 Minutes | 0 (0.0%) | 0 (0.0%) |
| 30 to 34 Minutes | 48 (6.9%) | 102 (10.1%) |
| 35 to 39 Minutes | 51 (7.3%) | 90 (8.9%) |
| 40 to 44 Minutes | 16 (2.3%) | 1 (0.1%) |
| 45 to 59 Minutes | 81 (11.6%) | 50 (5.0%) |
| 60 to 89 Minutes | 49 (7.0%) | 9 (0.9%) |
| 90 or more Minutes | 0 (0.0%) | 5 (0.5%) |
Time of Departure to Work by Sex in Salem
The most frequent times of departure to work in Salem are 4:00 PM to 11:59 PM (133, 19.1%) for males and 7:00 AM to 7:29 AM (216, 21.4%) for females.
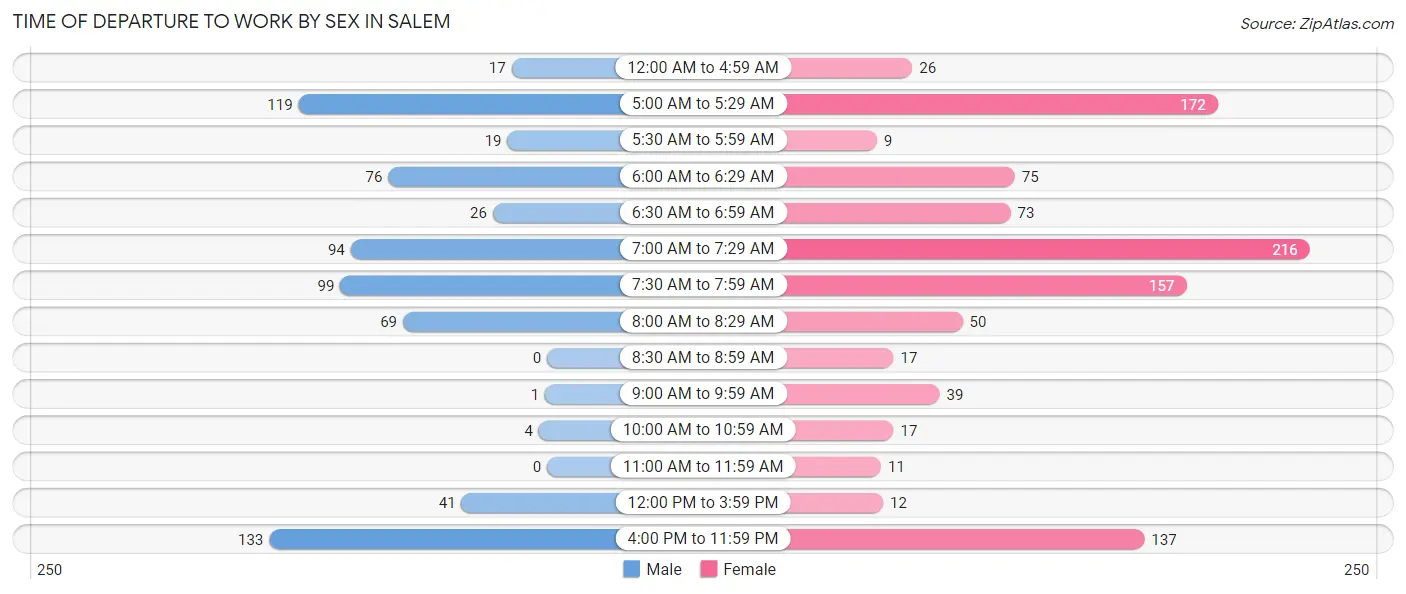
| Time of Departure | Male | Female |
| 12:00 AM to 4:59 AM | 17 (2.4%) | 26 (2.6%) |
| 5:00 AM to 5:29 AM | 119 (17.1%) | 172 (17.0%) |
| 5:30 AM to 5:59 AM | 19 (2.7%) | 9 (0.9%) |
| 6:00 AM to 6:29 AM | 76 (10.9%) | 75 (7.4%) |
| 6:30 AM to 6:59 AM | 26 (3.7%) | 73 (7.2%) |
| 7:00 AM to 7:29 AM | 94 (13.5%) | 216 (21.4%) |
| 7:30 AM to 7:59 AM | 99 (14.2%) | 157 (15.5%) |
| 8:00 AM to 8:29 AM | 69 (9.9%) | 50 (5.0%) |
| 8:30 AM to 8:59 AM | 0 (0.0%) | 17 (1.7%) |
| 9:00 AM to 9:59 AM | 1 (0.1%) | 39 (3.9%) |
| 10:00 AM to 10:59 AM | 4 (0.6%) | 17 (1.7%) |
| 11:00 AM to 11:59 AM | 0 (0.0%) | 11 (1.1%) |
| 12:00 PM to 3:59 PM | 41 (5.9%) | 12 (1.2%) |
| 4:00 PM to 11:59 PM | 133 (19.1%) | 137 (13.6%) |
| Total | 698 (100.0%) | 1,011 (100.0%) |
Housing Occupancy in Salem
Occupancy by Ownership in Salem
Of the total 2,053 dwellings in Salem, owner-occupied units account for 1,020 (49.7%), while renter-occupied units make up 1,033 (50.3%).
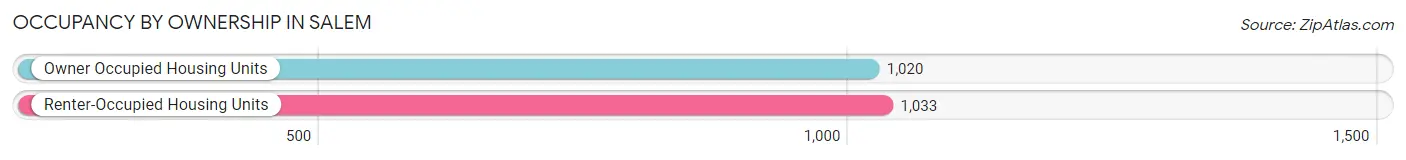
| Occupancy | # Housing Units | % Housing Units |
| Owner Occupied Housing Units | 1,020 | 49.7% |
| Renter-Occupied Housing Units | 1,033 | 50.3% |
| Total Occupied Housing Units | 2,053 | 100.0% |
Occupancy by Household Size in Salem
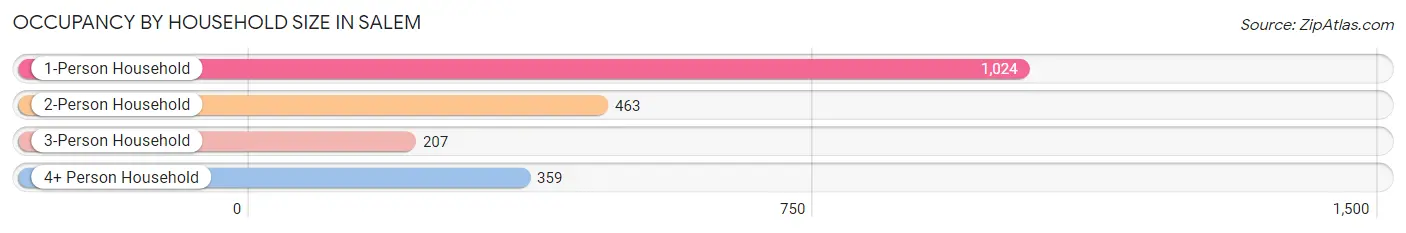
| Household Size | # Housing Units | % Housing Units |
| 1-Person Household | 1,024 | 49.9% |
| 2-Person Household | 463 | 22.6% |
| 3-Person Household | 207 | 10.1% |
| 4+ Person Household | 359 | 17.5% |
| Total Housing Units | 2,053 | 100.0% |
Occupancy by Ownership by Household Size in Salem
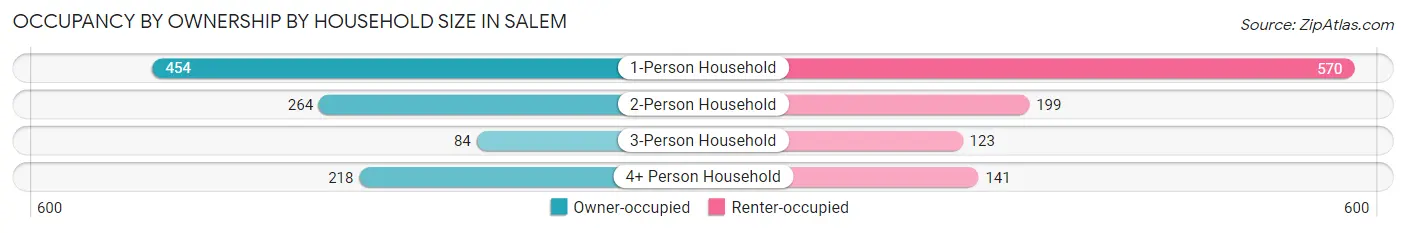
| Household Size | Owner-occupied | Renter-occupied |
| 1-Person Household | 454 (44.3%) | 570 (55.7%) |
| 2-Person Household | 264 (57.0%) | 199 (43.0%) |
| 3-Person Household | 84 (40.6%) | 123 (59.4%) |
| 4+ Person Household | 218 (60.7%) | 141 (39.3%) |
| Total Housing Units | 1,020 (49.7%) | 1,033 (50.3%) |
Occupancy by Educational Attainment in Salem
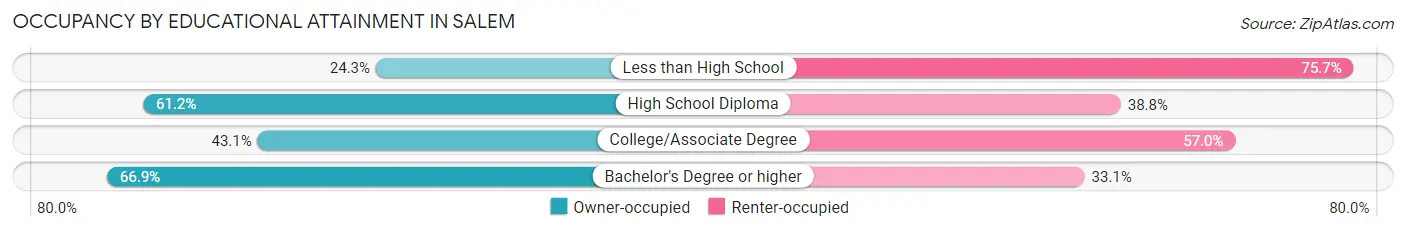
| Household Size | Owner-occupied | Renter-occupied |
| Less than High School | 85 (24.3%) | 265 (75.7%) |
| High School Diploma | 481 (61.2%) | 305 (38.8%) |
| College/Associate Degree | 288 (43.0%) | 381 (57.0%) |
| Bachelor's Degree or higher | 166 (66.9%) | 82 (33.1%) |
Occupancy by Age of Householder in Salem
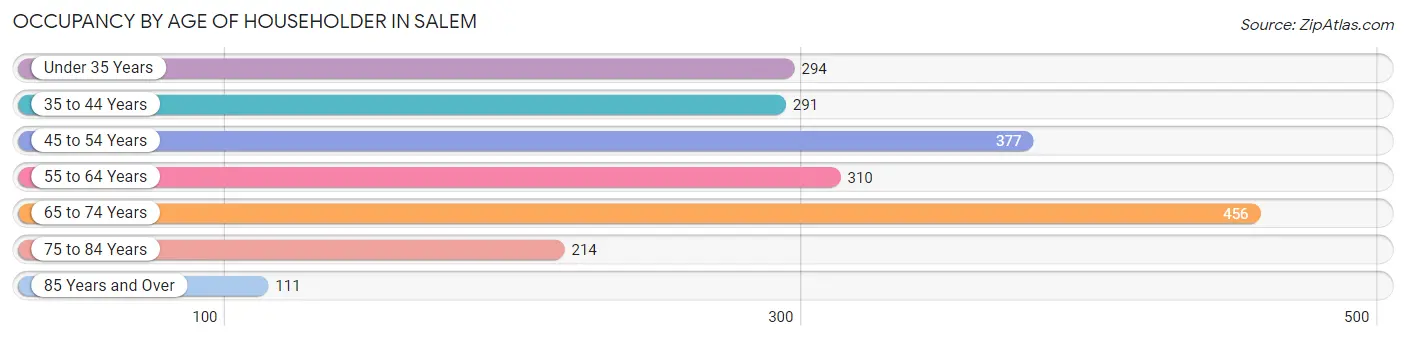
| Age Bracket | # Households | % Households |
| Under 35 Years | 294 | 14.3% |
| 35 to 44 Years | 291 | 14.2% |
| 45 to 54 Years | 377 | 18.4% |
| 55 to 64 Years | 310 | 15.1% |
| 65 to 74 Years | 456 | 22.2% |
| 75 to 84 Years | 214 | 10.4% |
| 85 Years and Over | 111 | 5.4% |
| Total | 2,053 | 100.0% |
Housing Finances in Salem
Median Income by Occupancy in Salem
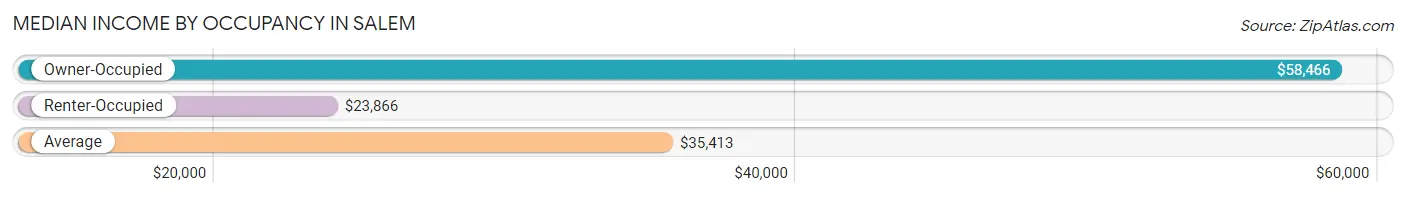
| Occupancy Type | # Households | Median Income |
| Owner-Occupied | 1,020 (49.7%) | $58,466 |
| Renter-Occupied | 1,033 (50.3%) | $23,866 |
| Average | 2,053 (100.0%) | $35,413 |
Occupancy by Householder Income Bracket in Salem
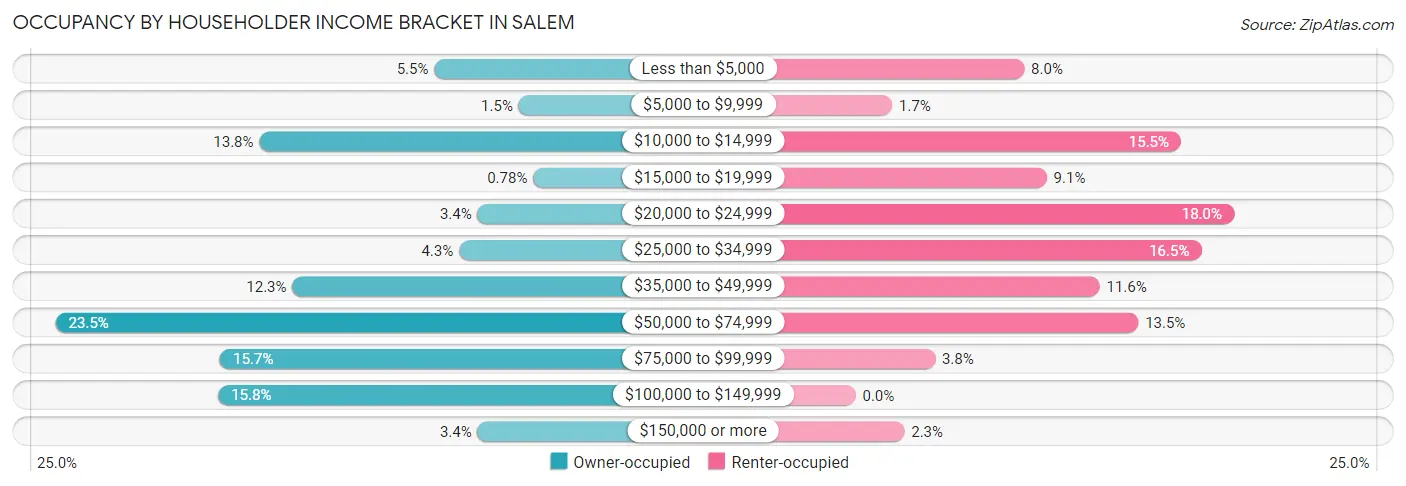
| Income Bracket | Owner-occupied | Renter-occupied |
| Less than $5,000 | 56 (5.5%) | 83 (8.0%) |
| $5,000 to $9,999 | 15 (1.5%) | 18 (1.7%) |
| $10,000 to $14,999 | 141 (13.8%) | 160 (15.5%) |
| $15,000 to $19,999 | 8 (0.8%) | 94 (9.1%) |
| $20,000 to $24,999 | 35 (3.4%) | 186 (18.0%) |
| $25,000 to $34,999 | 44 (4.3%) | 170 (16.5%) |
| $35,000 to $49,999 | 125 (12.2%) | 120 (11.6%) |
| $50,000 to $74,999 | 240 (23.5%) | 139 (13.5%) |
| $75,000 to $99,999 | 160 (15.7%) | 39 (3.8%) |
| $100,000 to $149,999 | 161 (15.8%) | 0 (0.0%) |
| $150,000 or more | 35 (3.4%) | 24 (2.3%) |
| Total | 1,020 (100.0%) | 1,033 (100.0%) |
Monthly Housing Cost Tiers in Salem
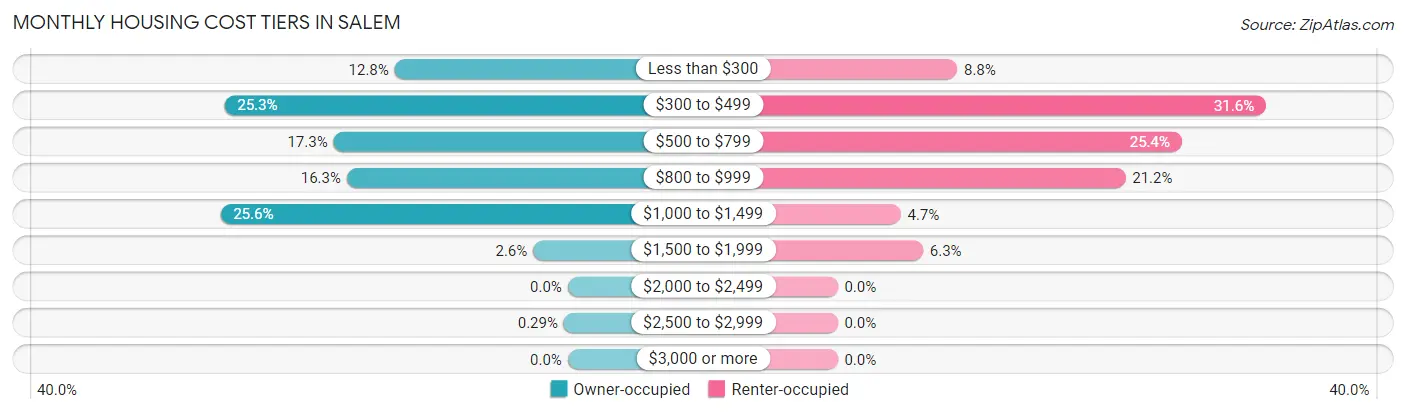
| Monthly Cost | Owner-occupied | Renter-occupied |
| Less than $300 | 130 (12.8%) | 91 (8.8%) |
| $300 to $499 | 258 (25.3%) | 326 (31.6%) |
| $500 to $799 | 176 (17.2%) | 262 (25.4%) |
| $800 to $999 | 166 (16.3%) | 219 (21.2%) |
| $1,000 to $1,499 | 261 (25.6%) | 48 (4.6%) |
| $1,500 to $1,999 | 26 (2.5%) | 65 (6.3%) |
| $2,000 to $2,499 | 0 (0.0%) | 0 (0.0%) |
| $2,500 to $2,999 | 3 (0.3%) | 0 (0.0%) |
| $3,000 or more | 0 (0.0%) | 0 (0.0%) |
| Total | 1,020 (100.0%) | 1,033 (100.0%) |
Physical Housing Characteristics in Salem
Housing Structures in Salem
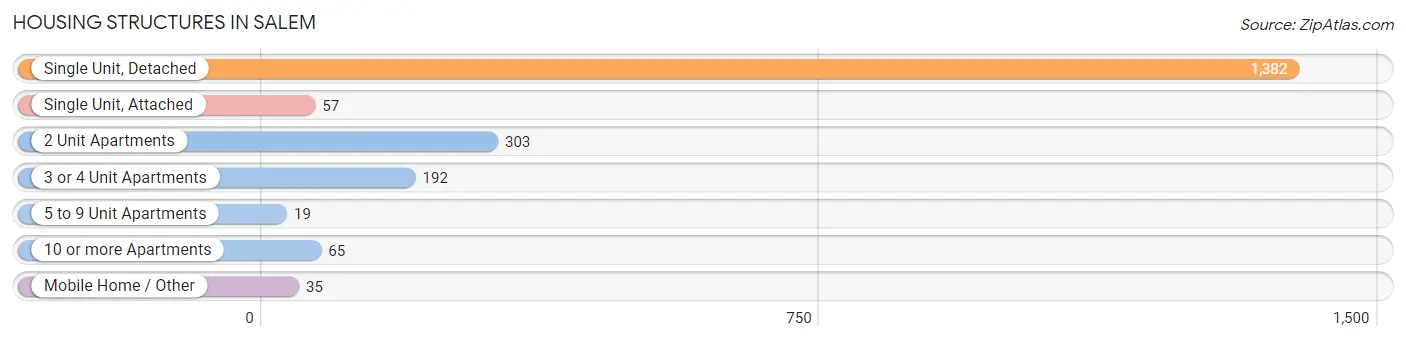
| Structure Type | # Housing Units | % Housing Units |
| Single Unit, Detached | 1,382 | 67.3% |
| Single Unit, Attached | 57 | 2.8% |
| 2 Unit Apartments | 303 | 14.8% |
| 3 or 4 Unit Apartments | 192 | 9.3% |
| 5 to 9 Unit Apartments | 19 | 0.9% |
| 10 or more Apartments | 65 | 3.2% |
| Mobile Home / Other | 35 | 1.7% |
| Total | 2,053 | 100.0% |
Housing Structures by Occupancy in Salem
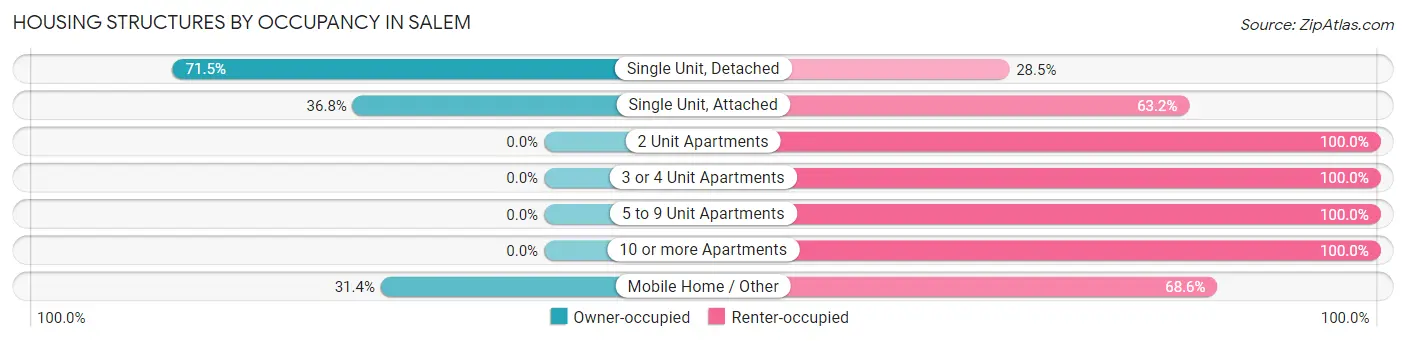
| Structure Type | Owner-occupied | Renter-occupied |
| Single Unit, Detached | 988 (71.5%) | 394 (28.5%) |
| Single Unit, Attached | 21 (36.8%) | 36 (63.2%) |
| 2 Unit Apartments | 0 (0.0%) | 303 (100.0%) |
| 3 or 4 Unit Apartments | 0 (0.0%) | 192 (100.0%) |
| 5 to 9 Unit Apartments | 0 (0.0%) | 19 (100.0%) |
| 10 or more Apartments | 0 (0.0%) | 65 (100.0%) |
| Mobile Home / Other | 11 (31.4%) | 24 (68.6%) |
| Total | 1,020 (49.7%) | 1,033 (50.3%) |
Housing Structures by Number of Rooms in Salem
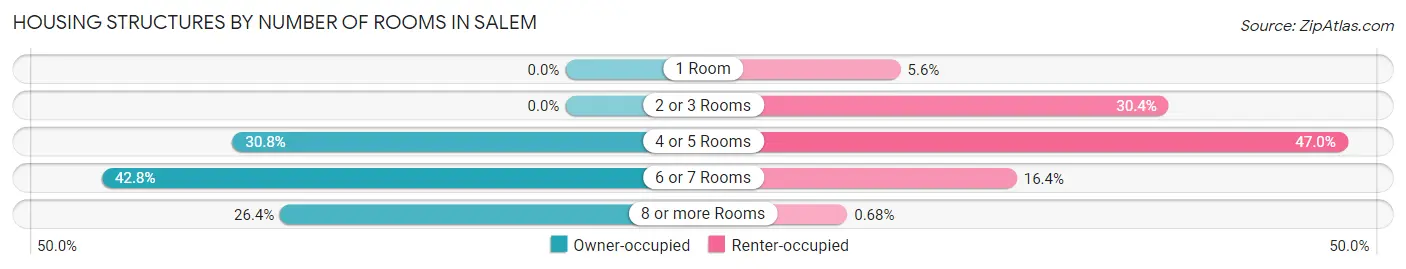
| Number of Rooms | Owner-occupied | Renter-occupied |
| 1 Room | 0 (0.0%) | 58 (5.6%) |
| 2 or 3 Rooms | 0 (0.0%) | 314 (30.4%) |
| 4 or 5 Rooms | 314 (30.8%) | 485 (46.9%) |
| 6 or 7 Rooms | 437 (42.8%) | 169 (16.4%) |
| 8 or more Rooms | 269 (26.4%) | 7 (0.7%) |
| Total | 1,020 (100.0%) | 1,033 (100.0%) |
Housing Structure by Heating Type in Salem
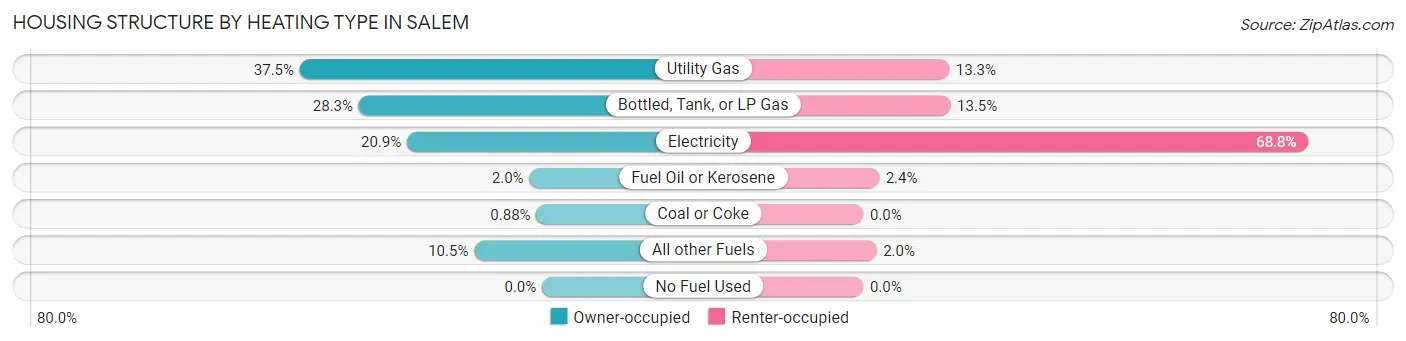
| Heating Type | Owner-occupied | Renter-occupied |
| Utility Gas | 382 (37.4%) | 137 (13.3%) |
| Bottled, Tank, or LP Gas | 289 (28.3%) | 139 (13.5%) |
| Electricity | 213 (20.9%) | 711 (68.8%) |
| Fuel Oil or Kerosene | 20 (2.0%) | 25 (2.4%) |
| Coal or Coke | 9 (0.9%) | 0 (0.0%) |
| All other Fuels | 107 (10.5%) | 21 (2.0%) |
| No Fuel Used | 0 (0.0%) | 0 (0.0%) |
| Total | 1,020 (100.0%) | 1,033 (100.0%) |
Household Vehicle Usage in Salem
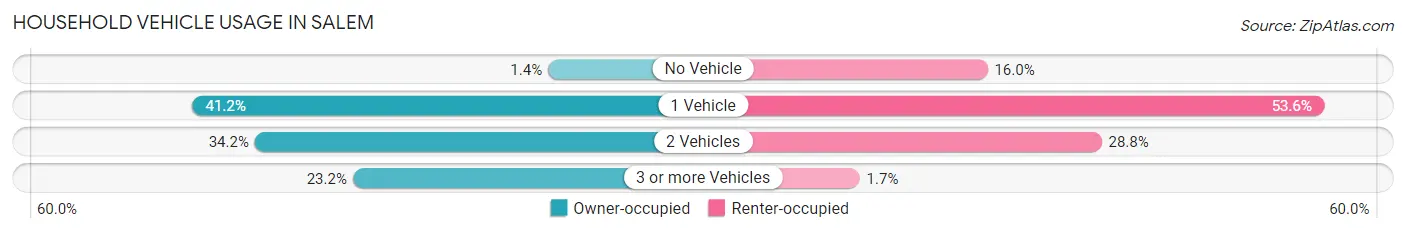
| Vehicles per Household | Owner-occupied | Renter-occupied |
| No Vehicle | 14 (1.4%) | 165 (16.0%) |
| 1 Vehicle | 420 (41.2%) | 554 (53.6%) |
| 2 Vehicles | 349 (34.2%) | 297 (28.7%) |
| 3 or more Vehicles | 237 (23.2%) | 17 (1.7%) |
| Total | 1,020 (100.0%) | 1,033 (100.0%) |
Real Estate & Mortgages in Salem
Real Estate and Mortgage Overview in Salem
| Characteristic | Without Mortgage | With Mortgage |
| Housing Units | 438 | 582 |
| Median Property Value | $88,400 | $86,500 |
| Median Household Income | $39,833 | $19 |
| Monthly Housing Costs | $362 | $0 |
| Real Estate Taxes | $696 | $0 |
Property Value by Mortgage Status in Salem
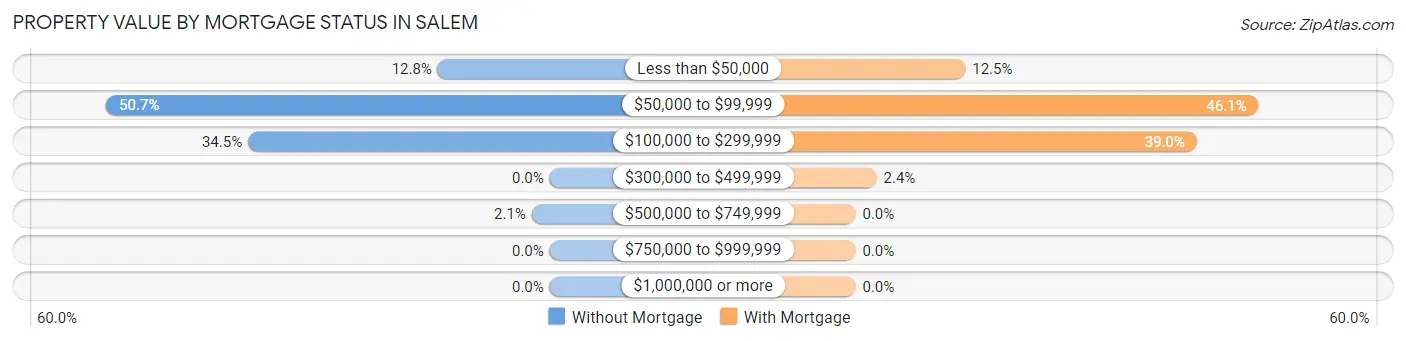
| Property Value | Without Mortgage | With Mortgage |
| Less than $50,000 | 56 (12.8%) | 73 (12.5%) |
| $50,000 to $99,999 | 222 (50.7%) | 268 (46.1%) |
| $100,000 to $299,999 | 151 (34.5%) | 227 (39.0%) |
| $300,000 to $499,999 | 0 (0.0%) | 14 (2.4%) |
| $500,000 to $749,999 | 9 (2.1%) | 0 (0.0%) |
| $750,000 to $999,999 | 0 (0.0%) | 0 (0.0%) |
| $1,000,000 or more | 0 (0.0%) | 0 (0.0%) |
| Total | 438 (100.0%) | 582 (100.0%) |
Household Income by Mortgage Status in Salem
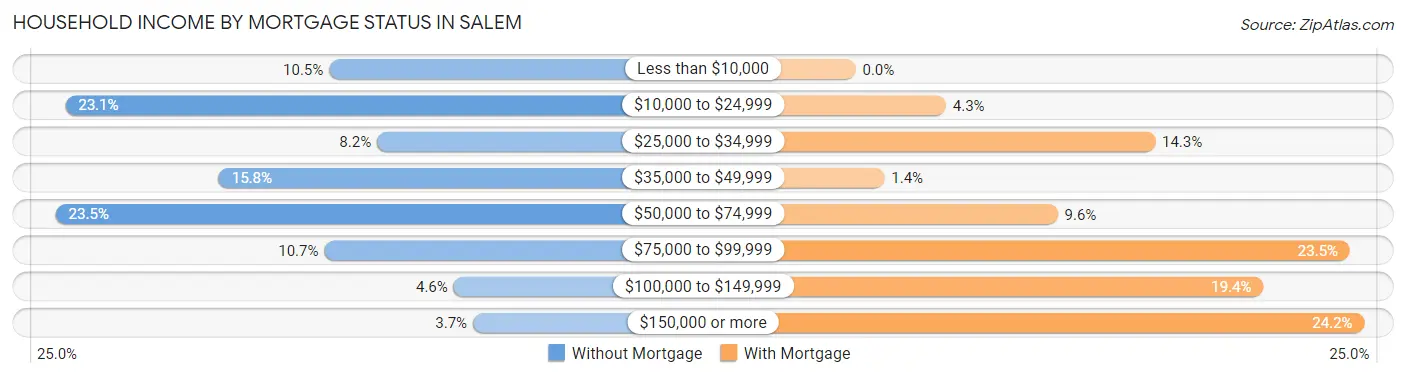
| Household Income | Without Mortgage | With Mortgage |
| Less than $10,000 | 46 (10.5%) | 0 (0.0%) |
| $10,000 to $24,999 | 101 (23.1%) | 25 (4.3%) |
| $25,000 to $34,999 | 36 (8.2%) | 83 (14.3%) |
| $35,000 to $49,999 | 69 (15.8%) | 8 (1.4%) |
| $50,000 to $74,999 | 103 (23.5%) | 56 (9.6%) |
| $75,000 to $99,999 | 47 (10.7%) | 137 (23.5%) |
| $100,000 to $149,999 | 20 (4.6%) | 113 (19.4%) |
| $150,000 or more | 16 (3.6%) | 141 (24.2%) |
| Total | 438 (100.0%) | 582 (100.0%) |
Property Value to Household Income Ratio in Salem
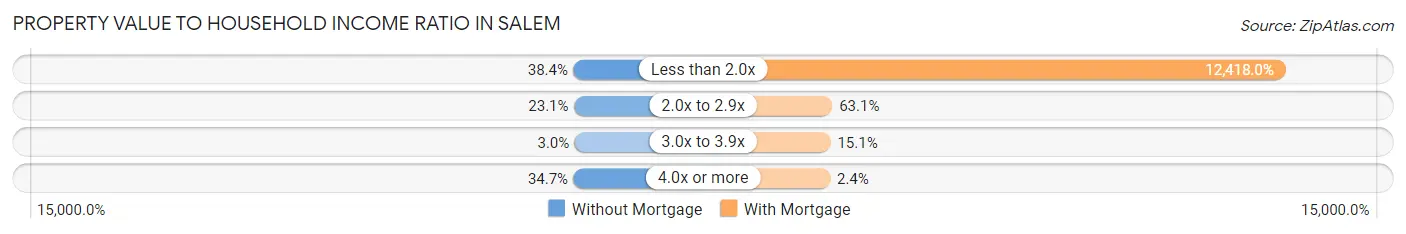
| Value-to-Income Ratio | Without Mortgage | With Mortgage |
| Less than 2.0x | 168 (38.4%) | 72,273 (12,418.0%) |
| 2.0x to 2.9x | 101 (23.1%) | 367 (63.1%) |
| 3.0x to 3.9x | 13 (3.0%) | 88 (15.1%) |
| 4.0x or more | 152 (34.7%) | 14 (2.4%) |
| Total | 438 (100.0%) | 582 (100.0%) |
Real Estate Taxes by Mortgage Status in Salem
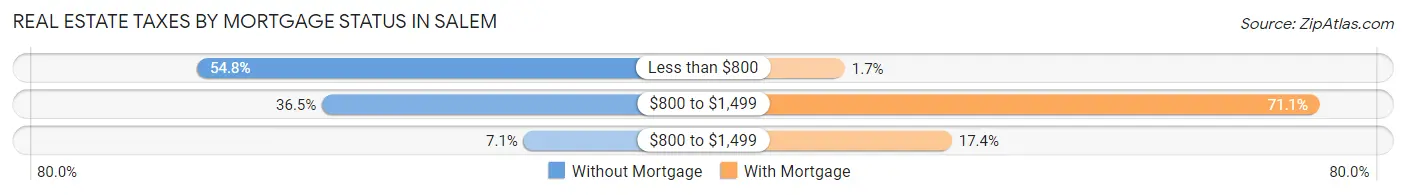
| Property Taxes | Without Mortgage | With Mortgage |
| Less than $800 | 240 (54.8%) | 10 (1.7%) |
| $800 to $1,499 | 160 (36.5%) | 414 (71.1%) |
| $800 to $1,499 | 31 (7.1%) | 101 (17.3%) |
| Total | 438 (100.0%) | 582 (100.0%) |
Health & Disability in Salem
Health Insurance Coverage by Age in Salem
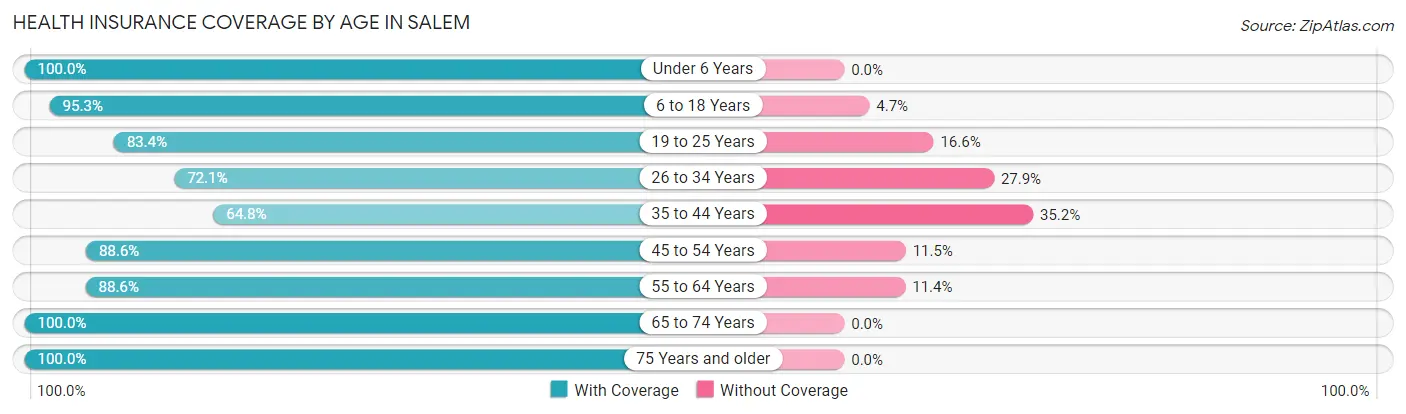
| Age Bracket | With Coverage | Without Coverage |
| Under 6 Years | 296 (100.0%) | 0 (0.0%) |
| 6 to 18 Years | 817 (95.3%) | 40 (4.7%) |
| 19 to 25 Years | 391 (83.4%) | 78 (16.6%) |
| 26 to 34 Years | 217 (72.1%) | 84 (27.9%) |
| 35 to 44 Years | 394 (64.8%) | 214 (35.2%) |
| 45 to 54 Years | 441 (88.5%) | 57 (11.5%) |
| 55 to 64 Years | 483 (88.6%) | 62 (11.4%) |
| 65 to 74 Years | 628 (100.0%) | 0 (0.0%) |
| 75 Years and older | 385 (100.0%) | 0 (0.0%) |
| Total | 4,052 (88.3%) | 535 (11.7%) |
Health Insurance Coverage by Citizenship Status in Salem
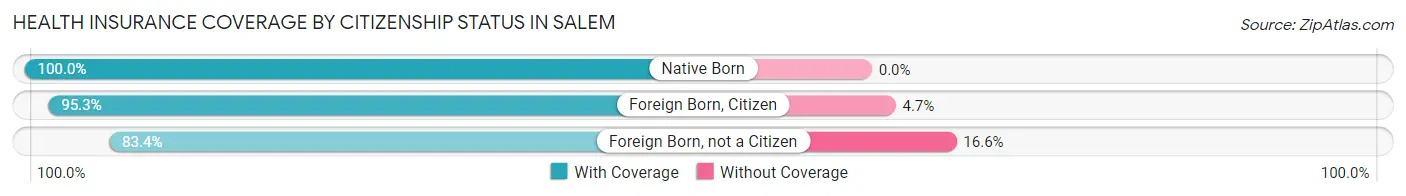
| Citizenship Status | With Coverage | Without Coverage |
| Native Born | 296 (100.0%) | 0 (0.0%) |
| Foreign Born, Citizen | 817 (95.3%) | 40 (4.7%) |
| Foreign Born, not a Citizen | 391 (83.4%) | 78 (16.6%) |
Health Insurance Coverage by Household Income in Salem
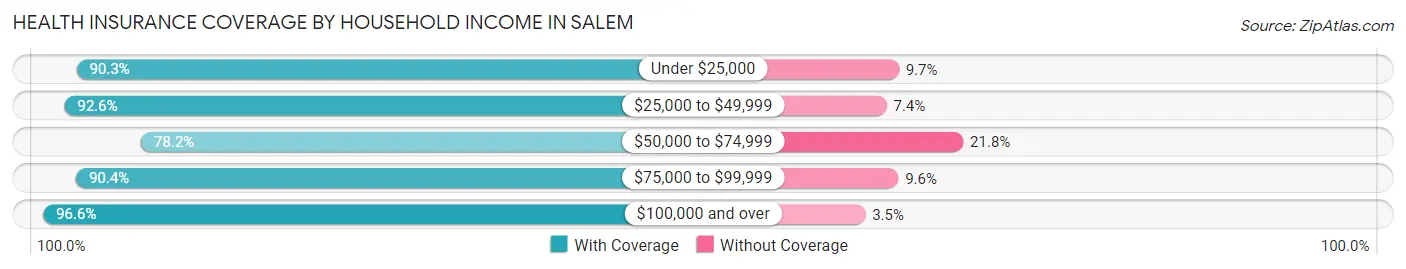
| Household Income | With Coverage | Without Coverage |
| Under $25,000 | 1,068 (90.3%) | 115 (9.7%) |
| $25,000 to $49,999 | 784 (92.6%) | 63 (7.4%) |
| $50,000 to $74,999 | 1,008 (78.2%) | 281 (21.8%) |
| $75,000 to $99,999 | 488 (90.4%) | 52 (9.6%) |
| $100,000 and over | 672 (96.6%) | 24 (3.5%) |
Public vs Private Health Insurance Coverage by Age in Salem
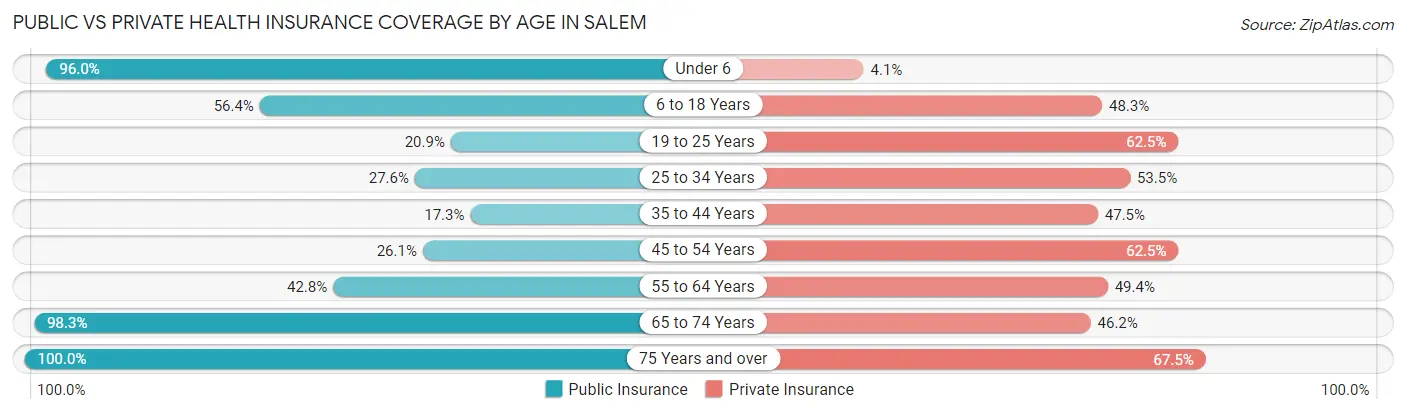
| Age Bracket | Public Insurance | Private Insurance |
| Under 6 | 284 (96.0%) | 12 (4.1%) |
| 6 to 18 Years | 483 (56.4%) | 414 (48.3%) |
| 19 to 25 Years | 98 (20.9%) | 293 (62.5%) |
| 25 to 34 Years | 83 (27.6%) | 161 (53.5%) |
| 35 to 44 Years | 105 (17.3%) | 289 (47.5%) |
| 45 to 54 Years | 130 (26.1%) | 311 (62.5%) |
| 55 to 64 Years | 233 (42.7%) | 269 (49.4%) |
| 65 to 74 Years | 617 (98.3%) | 290 (46.2%) |
| 75 Years and over | 385 (100.0%) | 260 (67.5%) |
| Total | 2,418 (52.7%) | 2,299 (50.1%) |
Disability Status by Sex by Age in Salem
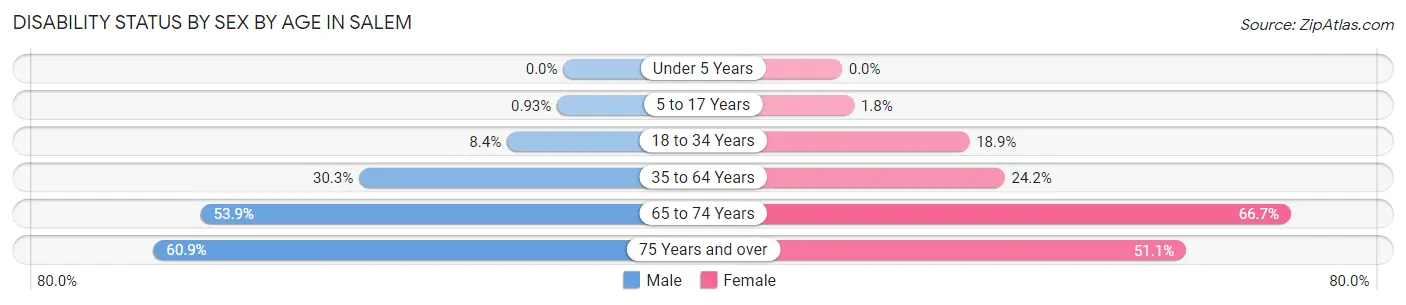
| Age Bracket | Male | Female |
| Under 5 Years | 0 (0.0%) | 0 (0.0%) |
| 5 to 17 Years | 3 (0.9%) | 9 (1.8%) |
| 18 to 34 Years | 36 (8.4%) | 77 (18.9%) |
| 35 to 64 Years | 226 (30.3%) | 219 (24.2%) |
| 65 to 74 Years | 112 (53.8%) | 280 (66.7%) |
| 75 Years and over | 70 (60.9%) | 138 (51.1%) |
Disability Class by Sex by Age in Salem
Disability Class: Hearing Difficulty
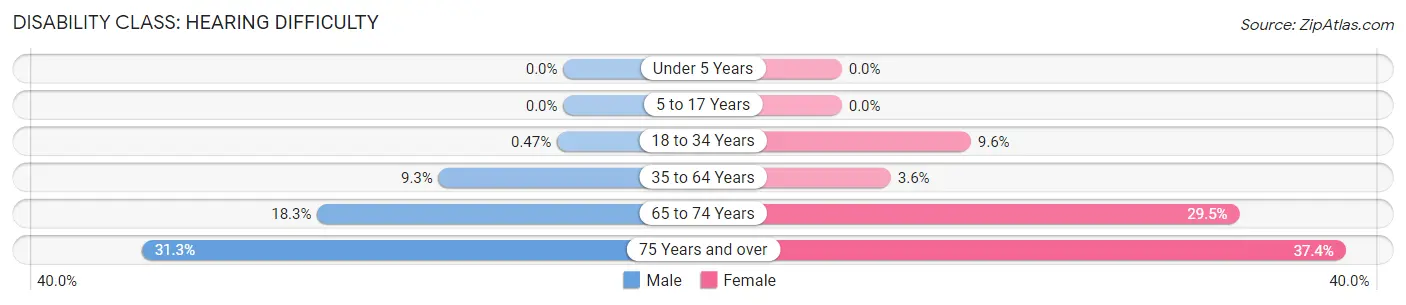
| Age Bracket | Male | Female |
| Under 5 Years | 0 (0.0%) | 0 (0.0%) |
| 5 to 17 Years | 0 (0.0%) | 0 (0.0%) |
| 18 to 34 Years | 2 (0.5%) | 39 (9.6%) |
| 35 to 64 Years | 69 (9.3%) | 33 (3.6%) |
| 65 to 74 Years | 38 (18.3%) | 124 (29.5%) |
| 75 Years and over | 36 (31.3%) | 101 (37.4%) |
Disability Class: Vision Difficulty
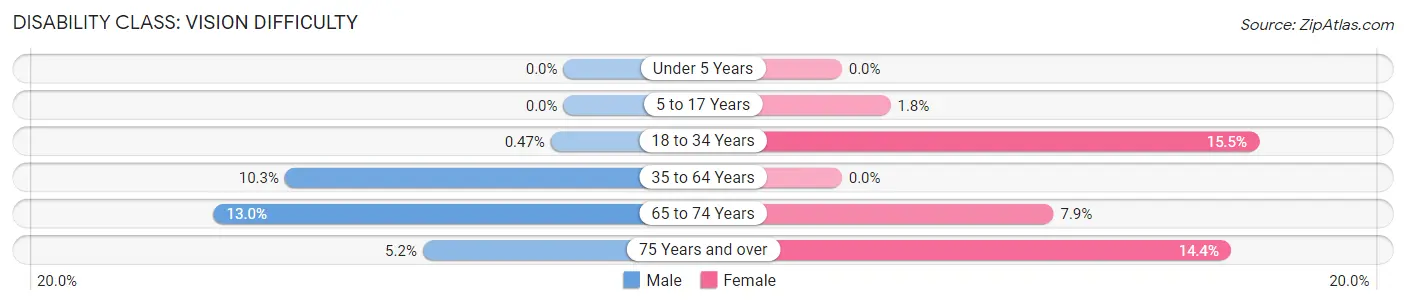
| Age Bracket | Male | Female |
| Under 5 Years | 0 (0.0%) | 0 (0.0%) |
| 5 to 17 Years | 0 (0.0%) | 9 (1.8%) |
| 18 to 34 Years | 2 (0.5%) | 63 (15.5%) |
| 35 to 64 Years | 77 (10.3%) | 0 (0.0%) |
| 65 to 74 Years | 27 (13.0%) | 33 (7.9%) |
| 75 Years and over | 6 (5.2%) | 39 (14.4%) |
Disability Class: Cognitive Difficulty
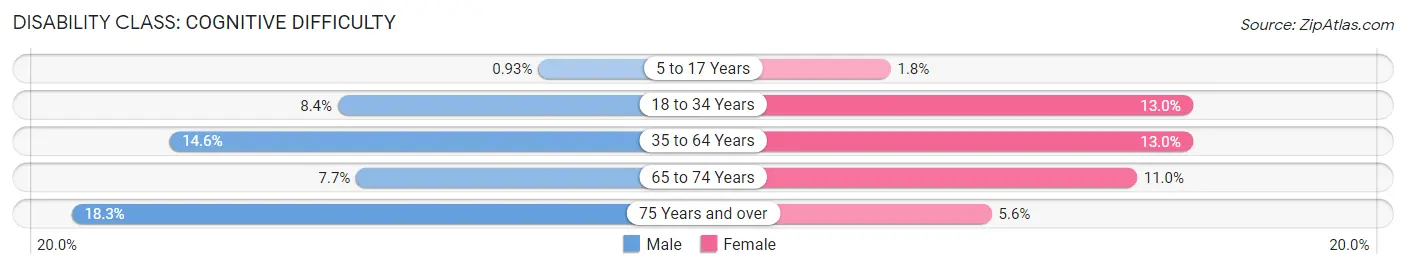
| Age Bracket | Male | Female |
| 5 to 17 Years | 3 (0.9%) | 9 (1.8%) |
| 18 to 34 Years | 36 (8.4%) | 53 (13.0%) |
| 35 to 64 Years | 109 (14.6%) | 118 (13.0%) |
| 65 to 74 Years | 16 (7.7%) | 46 (11.0%) |
| 75 Years and over | 21 (18.3%) | 15 (5.6%) |
Disability Class: Ambulatory Difficulty
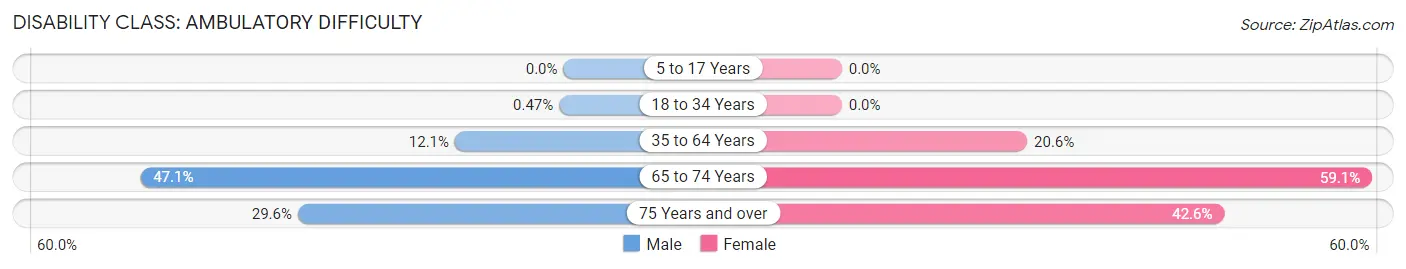
| Age Bracket | Male | Female |
| 5 to 17 Years | 0 (0.0%) | 0 (0.0%) |
| 18 to 34 Years | 2 (0.5%) | 0 (0.0%) |
| 35 to 64 Years | 90 (12.1%) | 187 (20.6%) |
| 65 to 74 Years | 98 (47.1%) | 248 (59.1%) |
| 75 Years and over | 34 (29.6%) | 115 (42.6%) |
Disability Class: Self-Care Difficulty
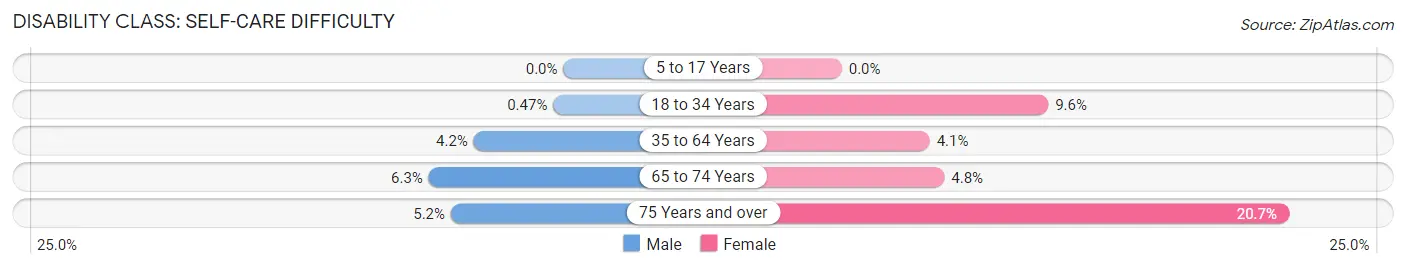
| Age Bracket | Male | Female |
| 5 to 17 Years | 0 (0.0%) | 0 (0.0%) |
| 18 to 34 Years | 2 (0.5%) | 39 (9.6%) |
| 35 to 64 Years | 31 (4.2%) | 37 (4.1%) |
| 65 to 74 Years | 13 (6.2%) | 20 (4.8%) |
| 75 Years and over | 6 (5.2%) | 56 (20.7%) |
Technology Access in Salem
Computing Device Access in Salem
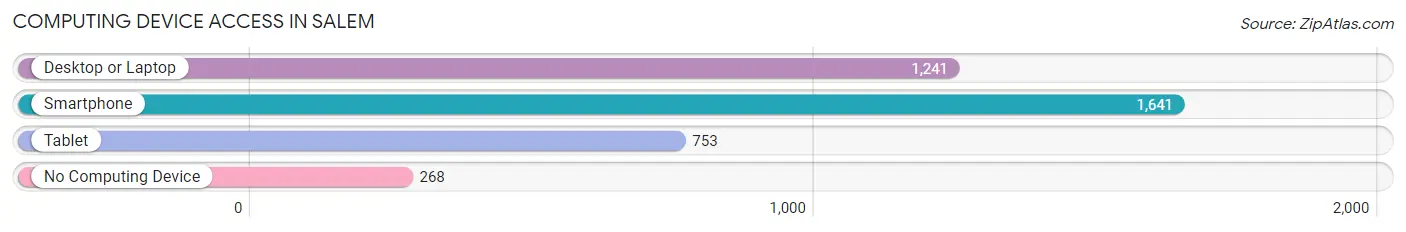
| Device Type | # Households | % Households |
| Desktop or Laptop | 1,241 | 60.5% |
| Smartphone | 1,641 | 79.9% |
| Tablet | 753 | 36.7% |
| No Computing Device | 268 | 13.1% |
| Total | 2,053 | 100.0% |
Internet Access in Salem
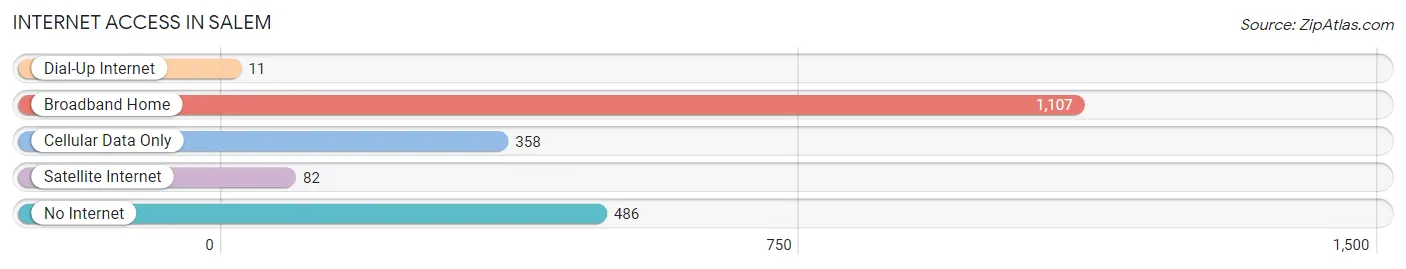
| Internet Type | # Households | % Households |
| Dial-Up Internet | 11 | 0.5% |
| Broadband Home | 1,107 | 53.9% |
| Cellular Data Only | 358 | 17.4% |
| Satellite Internet | 82 | 4.0% |
| No Internet | 486 | 23.7% |
| Total | 2,053 | 100.0% |
Salem Summary
Salem, Missouri is a small city located in Dent County, in the south-central part of the state. It is the county seat and the largest city in the county. The city is situated in the Ozark Mountains, and is surrounded by rolling hills and forests. The population of Salem was 6,941 at the 2010 census, making it the largest city in Dent County.
Geography
Salem is located at 37°41'25" North, 91°45'17" West (37.690278, -91.754722). According to the United States Census Bureau, the city has a total area of 5.2 square miles (13.4 km2), all of it land.
The city is located in the Ozark Mountains, and is surrounded by rolling hills and forests. The city is situated on the banks of the Courtois Creek, which flows through the city. The city is located near the Mark Twain National Forest, which provides a variety of recreational activities.
Economy
Salem is a small city with a diverse economy. The city is home to a variety of businesses, including manufacturing, retail, and service industries. The city is also home to a number of small businesses, including restaurants, shops, and other services.
The city is home to several large employers, including the Salem-based Missouri Department of Corrections, which employs over 1,000 people. The city is also home to a number of smaller employers, including a variety of manufacturing and service businesses.
Demographics
As of the 2010 census, there were 6,941 people, 2,845 households, and 1,845 families residing in the city. The population density was 1,338.2 people per square mile (517.7/km2). There were 3,093 housing units at an average density of 597.2 per square mile (230.7/km2). The racial makeup of the city was 95.2% White, 0.7% African American, 0.4% Native American, 0.3% Asian, 0.1% Pacific Islander, 1.3% from other races, and 2.1% from two or more races. Hispanic or Latino of any race were 3.2% of the population.
There were 2,845 households, out of which 28.7% had children under the age of 18 living with them, 46.2% were married couples living together, 13.2% had a female householder with no husband present, and 36.2% were non-families. 32.2% of all households were made up of individuals, and 15.2% had someone living alone who was 65 years of age or older. The average household size was 2.35 and the average family size was 2.94.
In the city, the population was spread out, with 24.2% under the age of 18, 8.2% from 18 to 24, 25.2% from 25 to 44, 22.7% from 45 to 64, and 19.7% who were 65 years of age or older. The median age was 39 years. For every 100 females, there were 87.2 males. For every 100 females age 18 and over, there were 82.3 males.
The median income for a household in the city was $27,917, and the median income for a family was $35,938. Males had a median income of $27,917 versus $20,938 for females. The per capita income for the city was $15,945. About 14.2% of families and 17.7% of the population were below the poverty line, including 24.2% of those under age 18 and 14.2% of those age 65 or over.
Common Questions
What is Per Capita Income in Salem?
Per Capita income in Salem is $24,565.
What is the Median Family Income in Salem?
Median Family Income in Salem is $51,028.
What is the Median Household income in Salem?
Median Household Income in Salem is $35,413.
What is Income or Wage Gap in Salem?
Income or Wage Gap in Salem is 32.4%.
Women in Salem earn 67.6 cents for every dollar earned by a man.
What is Inequality or Gini Index in Salem?
Inequality or Gini Index in Salem is 0.49.
What is the Total Population of Salem?
Total Population of Salem is 4,673.
What is the Total Male Population of Salem?
Total Male Population of Salem is 1,958.
What is the Total Female Population of Salem?
Total Female Population of Salem is 2,715.
What is the Ratio of Males per 100 Females in Salem?
There are 72.12 Males per 100 Females in Salem.
What is the Ratio of Females per 100 Males in Salem?
There are 138.66 Females per 100 Males in Salem.
What is the Median Population Age in Salem?
Median Population Age in Salem is 42.4 Years.
What is the Average Family Size in Salem
Average Family Size in Salem is 3.3 People.
What is the Average Household Size in Salem
Average Household Size in Salem is 2.2 People.
How Large is the Labor Force in Salem?
There are 2,055 People in the Labor Forcein in Salem.
What is the Percentage of People in the Labor Force in Salem?
55.0% of People are in the Labor Force in Salem.
What is the Unemployment Rate in Salem?
Unemployment Rate in Salem is 7.0%.