Ridgeway, MO Map & Demographics
Ridgeway Map
Ridgeway Overview
$22,827
PER CAPITA INCOME
$47,188
AVG FAMILY INCOME
$36,500
AVG HOUSEHOLD INCOME
48.6%
WAGE / INCOME GAP [ % ]
51.4¢/ $1
WAGE / INCOME GAP [ $ ]
$11,371
FAMILY INCOME DEFICIT
0.39
INEQUALITY / GINI INDEX
516
TOTAL POPULATION
248
MALE POPULATION
268
FEMALE POPULATION
92.54
MALES / 100 FEMALES
108.06
FEMALES / 100 MALES
42.0
MEDIAN AGE
5.8
AVG FAMILY SIZE
3.6
AVG HOUSEHOLD SIZE
168
LABOR FORCE [ PEOPLE ]
40.2%
PERCENT IN LABOR FORCE
11.3%
UNEMPLOYMENT RATE
Ridgeway Zip Codes
Ridgeway Area Codes
Income in Ridgeway
Income Overview in Ridgeway
Per Capita Income in Ridgeway is $22,827, while median incomes of families and households are $47,188 and $36,500 respectively.
| Characteristic | Number | Measure |
| Per Capita Income | 516 | $22,827 |
| Median Family Income | 75 | $47,188 |
| Mean Family Income | 75 | $63,084 |
| Median Household Income | 142 | $36,500 |
| Mean Household Income | 142 | $49,951 |
| Income Deficit | 75 | $11,371 |
| Wage / Income Gap (%) | 516 | 48.57% |
| Wage / Income Gap ($) | 516 | 51.43¢ per $1 |
| Gini / Inequality Index | 516 | 0.39 |
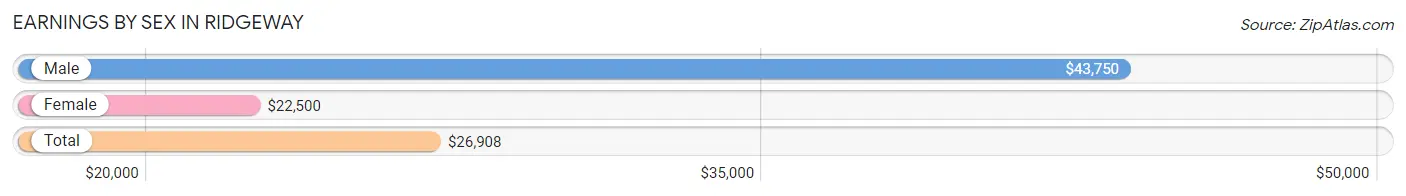
Earnings by Sex in Ridgeway
Average Earnings in Ridgeway are $26,908, $43,750 for men and $22,500 for women, a difference of 48.6%.
| Sex | Number | Average Earnings |
| Male | 140 (58.8%) | $43,750 |
| Female | 98 (41.2%) | $22,500 |
| Total | 238 (100.0%) | $26,908 |
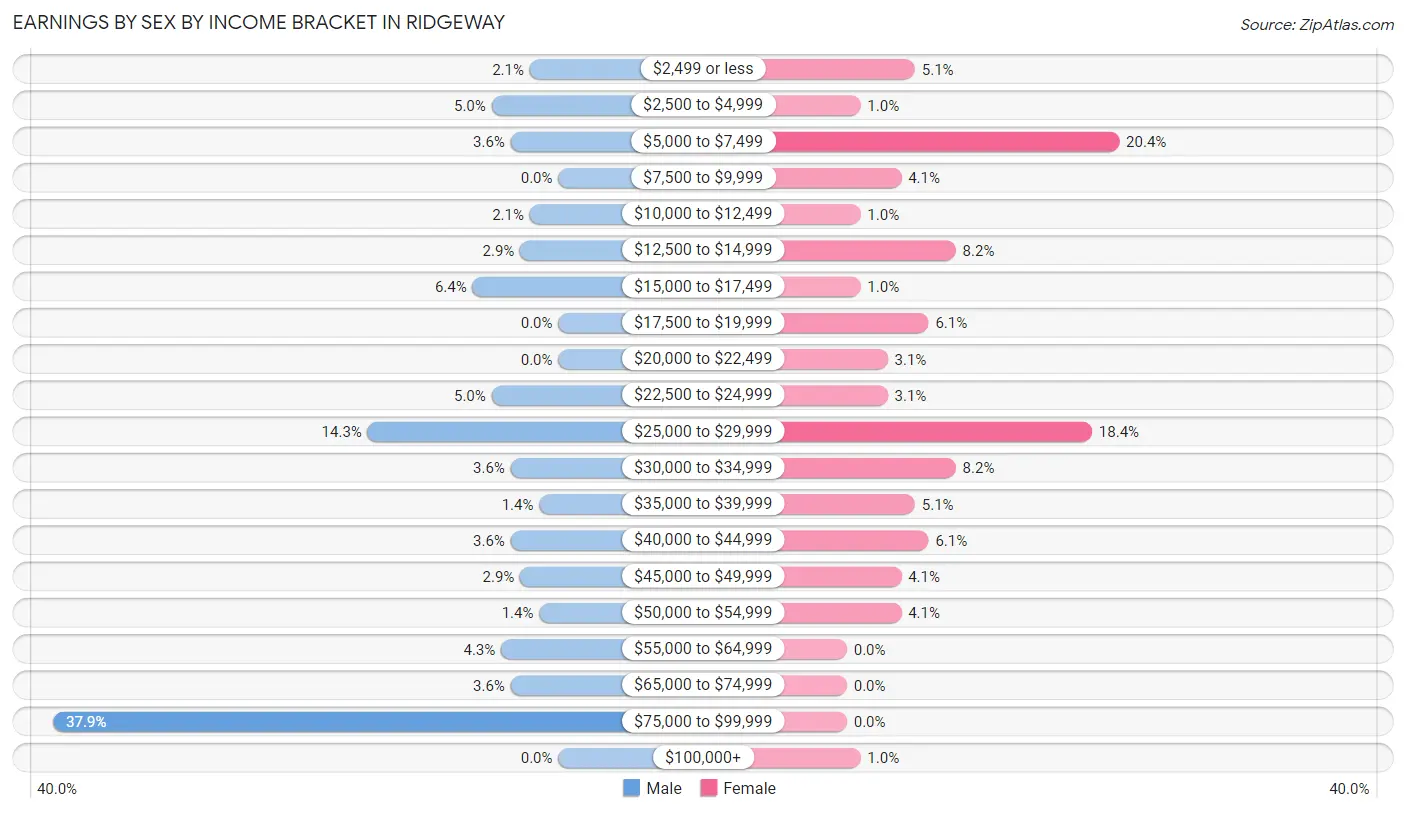
Earnings by Sex by Income Bracket in Ridgeway
The most common earnings brackets in Ridgeway are $75,000 to $99,999 for men (53 | 37.9%) and $5,000 to $7,499 for women (20 | 20.4%).
| Income | Male | Female |
| $2,499 or less | 3 (2.1%) | 5 (5.1%) |
| $2,500 to $4,999 | 7 (5.0%) | 1 (1.0%) |
| $5,000 to $7,499 | 5 (3.6%) | 20 (20.4%) |
| $7,500 to $9,999 | 0 (0.0%) | 4 (4.1%) |
| $10,000 to $12,499 | 3 (2.1%) | 1 (1.0%) |
| $12,500 to $14,999 | 4 (2.9%) | 8 (8.2%) |
| $15,000 to $17,499 | 9 (6.4%) | 1 (1.0%) |
| $17,500 to $19,999 | 0 (0.0%) | 6 (6.1%) |
| $20,000 to $22,499 | 0 (0.0%) | 3 (3.1%) |
| $22,500 to $24,999 | 7 (5.0%) | 3 (3.1%) |
| $25,000 to $29,999 | 20 (14.3%) | 18 (18.4%) |
| $30,000 to $34,999 | 5 (3.6%) | 8 (8.2%) |
| $35,000 to $39,999 | 2 (1.4%) | 5 (5.1%) |
| $40,000 to $44,999 | 5 (3.6%) | 6 (6.1%) |
| $45,000 to $49,999 | 4 (2.9%) | 4 (4.1%) |
| $50,000 to $54,999 | 2 (1.4%) | 4 (4.1%) |
| $55,000 to $64,999 | 6 (4.3%) | 0 (0.0%) |
| $65,000 to $74,999 | 5 (3.6%) | 0 (0.0%) |
| $75,000 to $99,999 | 53 (37.9%) | 0 (0.0%) |
| $100,000+ | 0 (0.0%) | 1 (1.0%) |
| Total | 140 (100.0%) | 98 (100.0%) |
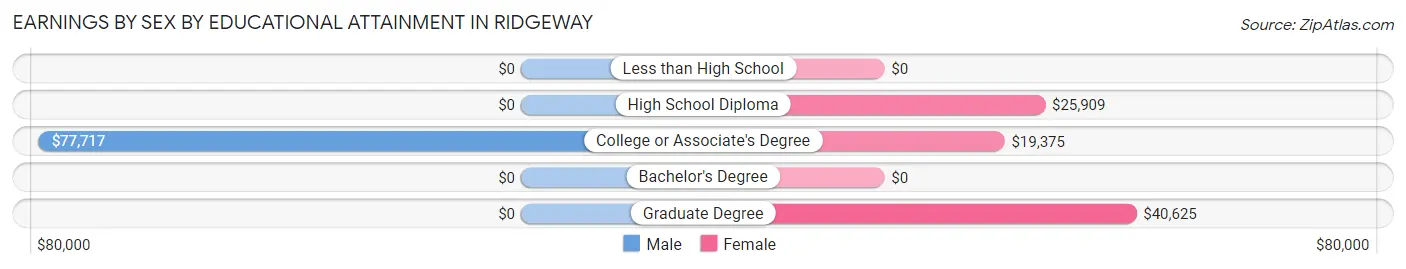
Earnings by Sex by Educational Attainment in Ridgeway
Average earnings in Ridgeway are $47,500 for men and $22,500 for women, a difference of 52.6%. Men with an educational attainment of college or associate's degree enjoy the highest average annual earnings of $77,717, while those with college or associate's degree education earn the least with $77,717. Women with an educational attainment of graduate degree earn the most with the average annual earnings of $40,625, while those with college or associate's degree education have the smallest earnings of $19,375.
| Educational Attainment | Male Income | Female Income |
| Less than High School | - | - |
| High School Diploma | - | - |
| College or Associate's Degree | $77,717 | $19,375 |
| Bachelor's Degree | - | - |
| Graduate Degree | - | - |
| Total | $47,500 | $22,500 |
Family Income in Ridgeway
Family Income Brackets in Ridgeway
According to the Ridgeway family income data, there are 20 families falling into the $100,000 to $149,999 income range, which is the most common income bracket and makes up 26.7% of all families.
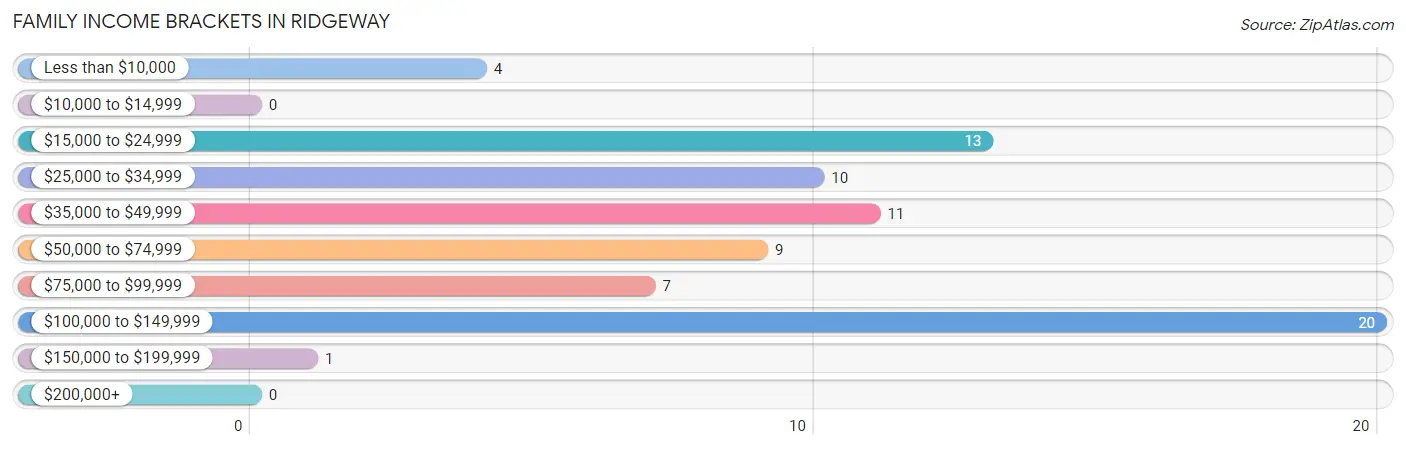
| Income Bracket | # Families | % Families |
| Less than $10,000 | 4 | 5.3% |
| $10,000 to $14,999 | 0 | 0.0% |
| $15,000 to $24,999 | 13 | 17.3% |
| $25,000 to $34,999 | 10 | 13.3% |
| $35,000 to $49,999 | 11 | 14.7% |
| $50,000 to $74,999 | 9 | 12.0% |
| $75,000 to $99,999 | 7 | 9.3% |
| $100,000 to $149,999 | 20 | 26.7% |
| $150,000 to $199,999 | 1 | 1.3% |
| $200,000+ | 0 | 0.0% |
Family Income by Famaliy Size in Ridgeway
3-person families (24 | 32.0%) account for the highest median family income in Ridgeway with $105,625 per family, while 3-person families (24 | 32.0%) have the highest median income of $35,208 per family member.
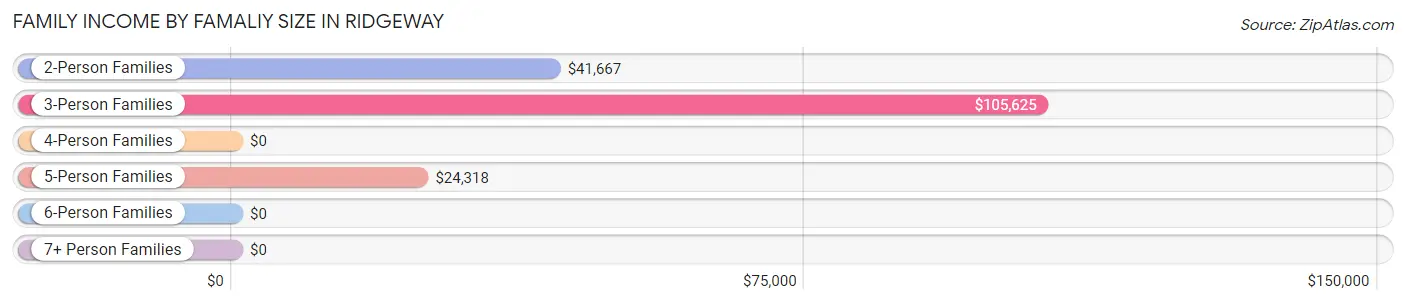
| Income Bracket | # Families | Median Income |
| 2-Person Families | 26 (34.7%) | $41,667 |
| 3-Person Families | 24 (32.0%) | $105,625 |
| 4-Person Families | 0 (0.0%) | $0 |
| 5-Person Families | 16 (21.3%) | $24,318 |
| 6-Person Families | 3 (4.0%) | $0 |
| 7+ Person Families | 6 (8.0%) | $0 |
| Total | 75 (100.0%) | $47,188 |
Family Income by Number of Earners in Ridgeway
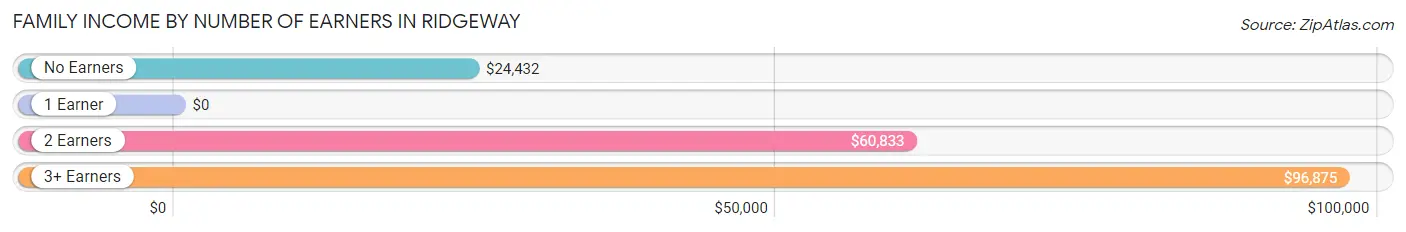
| Number of Earners | # Families | Median Income |
| No Earners | 25 (33.3%) | $24,432 |
| 1 Earner | 11 (14.7%) | $0 |
| 2 Earners | 24 (32.0%) | $60,833 |
| 3+ Earners | 15 (20.0%) | $96,875 |
| Total | 75 (100.0%) | $47,188 |
Household Income in Ridgeway
Household Income Brackets in Ridgeway
With 32 households falling in the category, the $15,000 to $24,999 income range is the most frequent in Ridgeway, accounting for 22.5% of all households.
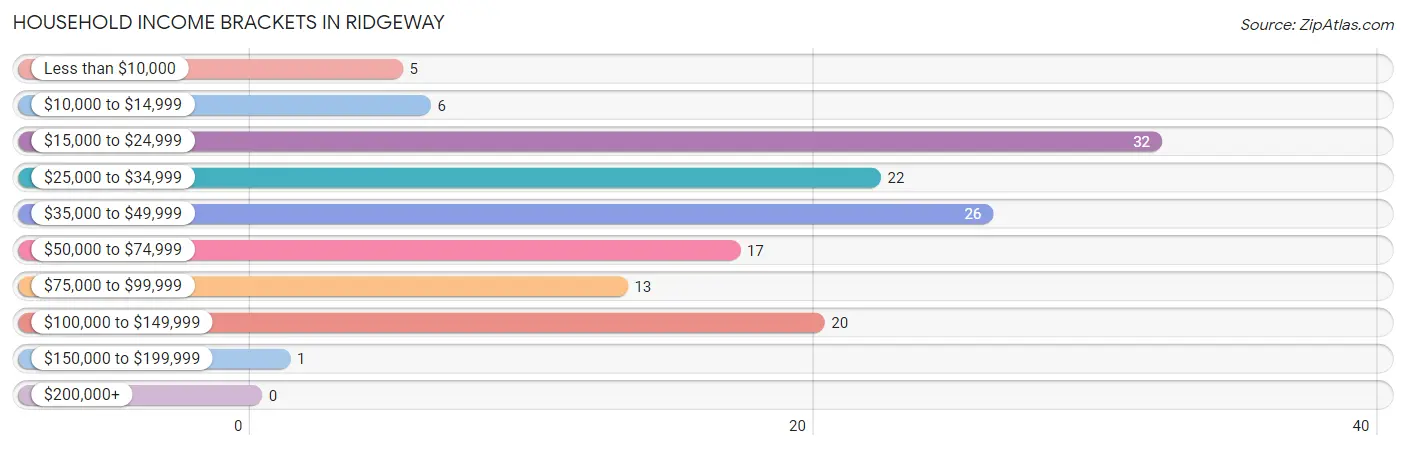
| Income Bracket | # Households | % Households |
| Less than $10,000 | 5 | 3.5% |
| $10,000 to $14,999 | 6 | 4.2% |
| $15,000 to $24,999 | 32 | 22.5% |
| $25,000 to $34,999 | 22 | 15.5% |
| $35,000 to $49,999 | 26 | 18.3% |
| $50,000 to $74,999 | 17 | 12.0% |
| $75,000 to $99,999 | 13 | 9.2% |
| $100,000 to $149,999 | 20 | 14.1% |
| $150,000 to $199,999 | 1 | 0.7% |
| $200,000+ | 0 | 0.0% |
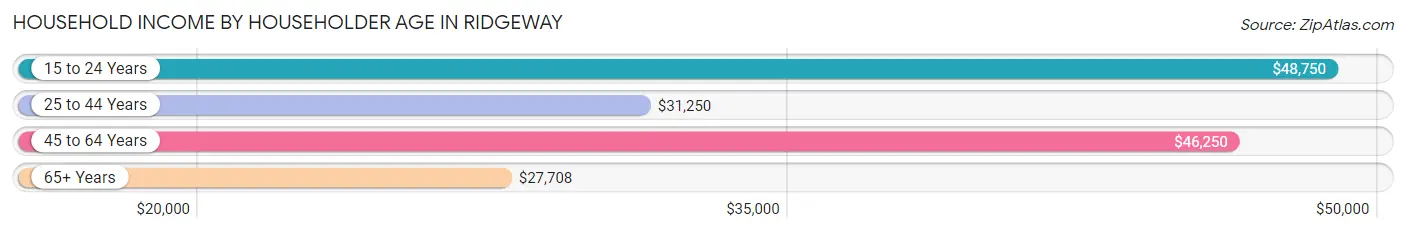
Household Income by Householder Age in Ridgeway
The median household income in Ridgeway is $36,500, with the highest median household income of $48,750 found in the 15 to 24 years age bracket for the primary householder. A total of 3 households (2.1%) fall into this category. Meanwhile, the 65+ years age bracket for the primary householder has the lowest median household income of $27,708, with 57 households (40.1%) in this group.
| Income Bracket | # Households | Median Income |
| 15 to 24 Years | 3 (2.1%) | $48,750 |
| 25 to 44 Years | 36 (25.4%) | $31,250 |
| 45 to 64 Years | 46 (32.4%) | $46,250 |
| 65+ Years | 57 (40.1%) | $27,708 |
| Total | 142 (100.0%) | $36,500 |
Poverty in Ridgeway
Income Below Poverty by Sex and Age in Ridgeway
With 8.1% poverty level for males and 33.2% for females among the residents of Ridgeway, 35 to 44 year old males and 5 year old females are the most vulnerable to poverty, with 11 males (57.9%) and 1 females (100.0%) in their respective age groups living below the poverty level.
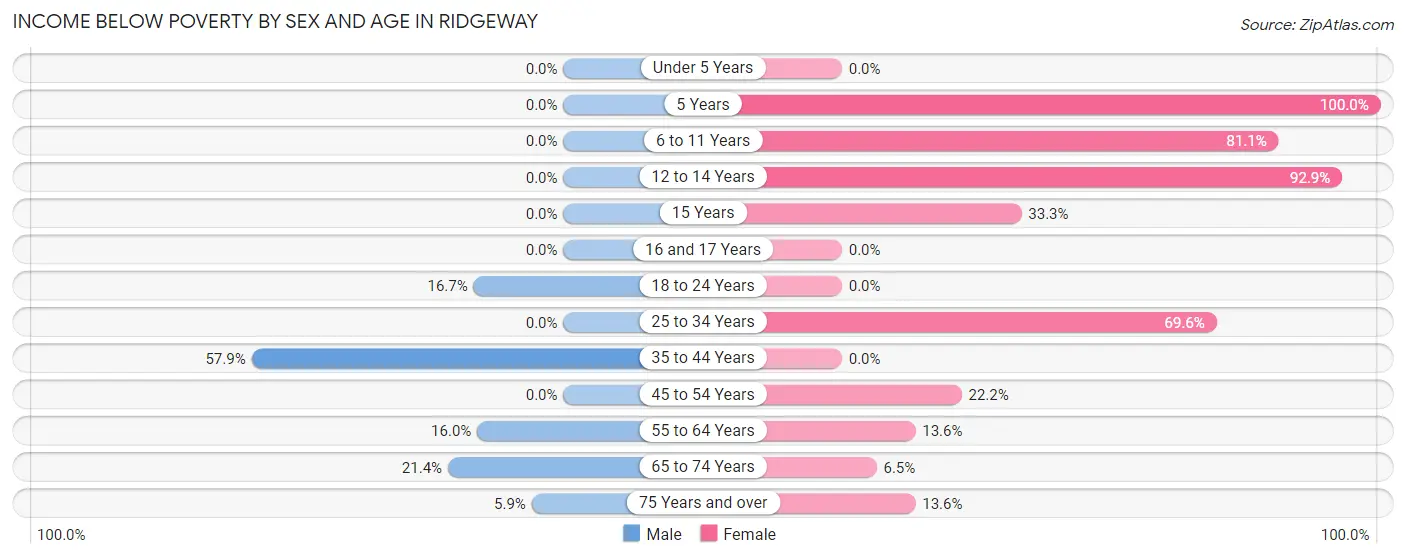
| Age Bracket | Male | Female |
| Under 5 Years | 0 (0.0%) | 0 (0.0%) |
| 5 Years | 0 (0.0%) | 1 (100.0%) |
| 6 to 11 Years | 0 (0.0%) | 30 (81.1%) |
| 12 to 14 Years | 0 (0.0%) | 13 (92.9%) |
| 15 Years | 0 (0.0%) | 1 (33.3%) |
| 16 and 17 Years | 0 (0.0%) | 0 (0.0%) |
| 18 to 24 Years | 1 (16.7%) | 0 (0.0%) |
| 25 to 34 Years | 0 (0.0%) | 32 (69.6%) |
| 35 to 44 Years | 11 (57.9%) | 0 (0.0%) |
| 45 to 54 Years | 0 (0.0%) | 4 (22.2%) |
| 55 to 64 Years | 4 (16.0%) | 3 (13.6%) |
| 65 to 74 Years | 3 (21.4%) | 2 (6.5%) |
| 75 Years and over | 1 (5.9%) | 3 (13.6%) |
| Total | 20 (8.1%) | 89 (33.2%) |
Income Above Poverty by Sex and Age in Ridgeway
According to the poverty statistics in Ridgeway, males aged under 5 years and females aged under 5 years are the age groups that are most secure financially, with 100.0% of males and 100.0% of females in these age groups living above the poverty line.
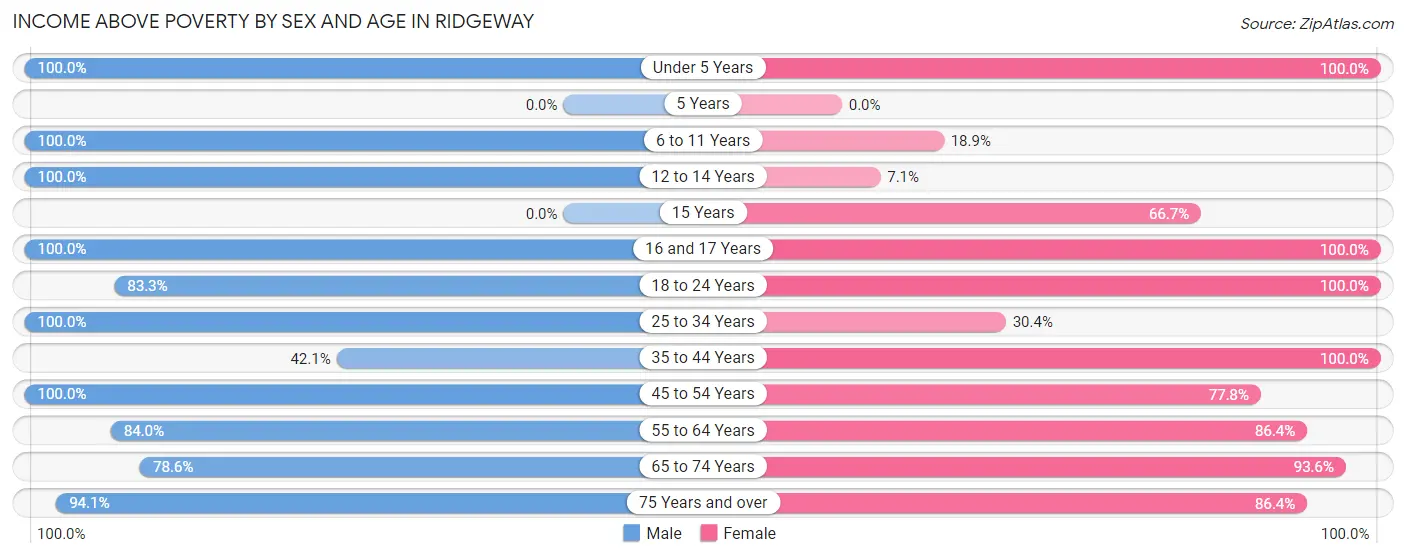
| Age Bracket | Male | Female |
| Under 5 Years | 2 (100.0%) | 22 (100.0%) |
| 5 Years | 0 (0.0%) | 0 (0.0%) |
| 6 to 11 Years | 8 (100.0%) | 7 (18.9%) |
| 12 to 14 Years | 11 (100.0%) | 1 (7.1%) |
| 15 Years | 0 (0.0%) | 2 (66.7%) |
| 16 and 17 Years | 8 (100.0%) | 10 (100.0%) |
| 18 to 24 Years | 5 (83.3%) | 9 (100.0%) |
| 25 to 34 Years | 47 (100.0%) | 14 (30.4%) |
| 35 to 44 Years | 8 (42.1%) | 33 (100.0%) |
| 45 to 54 Years | 91 (100.0%) | 14 (77.8%) |
| 55 to 64 Years | 21 (84.0%) | 19 (86.4%) |
| 65 to 74 Years | 11 (78.6%) | 29 (93.5%) |
| 75 Years and over | 16 (94.1%) | 19 (86.4%) |
| Total | 228 (91.9%) | 179 (66.8%) |
Income Below Poverty Among Married-Couple Families in Ridgeway
The poverty statistics for married-couple families in Ridgeway show that 29.8% or 17 of the total 57 families live below the poverty line. Families with 3 or 4 children have the highest poverty rate of 55.0%, comprising of 11 families. On the other hand, families with no children have the lowest poverty rate of 13.8%, which includes 4 families.
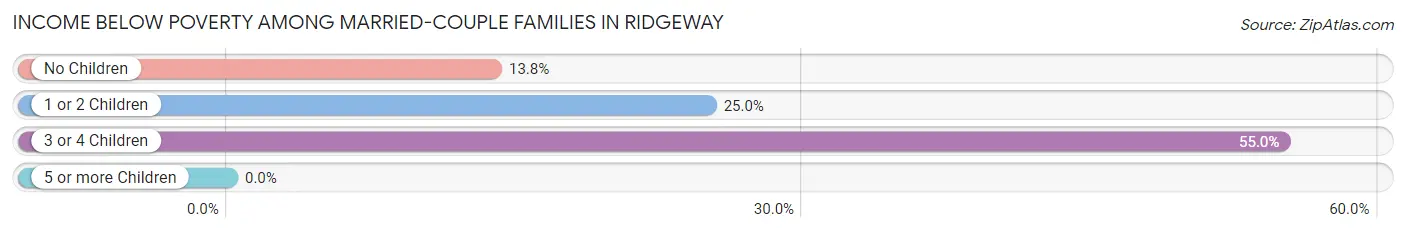
| Children | Above Poverty | Below Poverty |
| No Children | 25 (86.2%) | 4 (13.8%) |
| 1 or 2 Children | 6 (75.0%) | 2 (25.0%) |
| 3 or 4 Children | 9 (45.0%) | 11 (55.0%) |
| 5 or more Children | 0 (0.0%) | 0 (0.0%) |
| Total | 40 (70.2%) | 17 (29.8%) |
Income Below Poverty Among Single-Parent Households in Ridgeway
| Children | Single Father | Single Mother |
| No Children | 0 (0.0%) | 0 (0.0%) |
| 1 or 2 Children | 0 (0.0%) | 0 (0.0%) |
| 3 or 4 Children | 0 (0.0%) | 0 (0.0%) |
| 5 or more Children | 0 (0.0%) | 0 (0.0%) |
| Total | 0 (0.0%) | 0 (0.0%) |
Income Below Poverty Among Married-Couple vs Single-Parent Households in Ridgeway
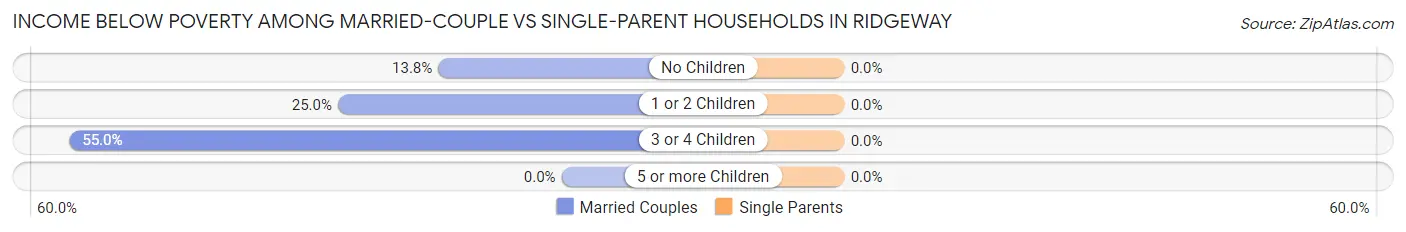
| Children | Married-Couple Families | Single-Parent Households |
| No Children | 4 (13.8%) | 0 (0.0%) |
| 1 or 2 Children | 2 (25.0%) | 0 (0.0%) |
| 3 or 4 Children | 11 (55.0%) | 0 (0.0%) |
| 5 or more Children | 0 (0.0%) | 0 (0.0%) |
| Total | 17 (29.8%) | 0 (0.0%) |
Race in Ridgeway
The most populous races in Ridgeway are White / Caucasian (508 | 98.5%), Two or more Races (6 | 1.2%), and Asian (1 | 0.2%).
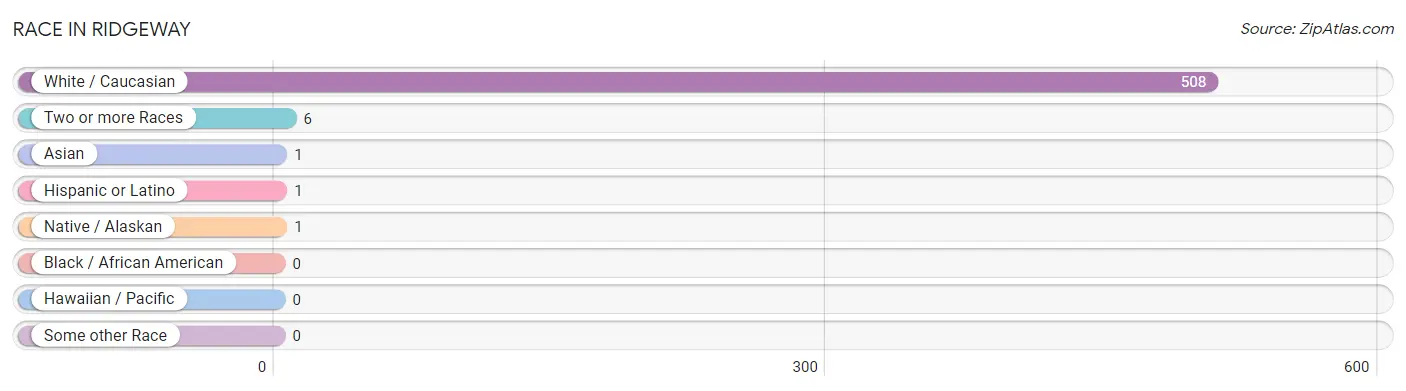
| Race | # Population | % Population |
| Asian | 1 | 0.2% |
| Black / African American | 0 | 0.0% |
| Hawaiian / Pacific | 0 | 0.0% |
| Hispanic or Latino | 1 | 0.2% |
| Native / Alaskan | 1 | 0.2% |
| White / Caucasian | 508 | 98.5% |
| Two or more Races | 6 | 1.2% |
| Some other Race | 0 | 0.0% |
| Total | 516 | 100.0% |
Ancestry in Ridgeway
The most populous ancestries reported in Ridgeway are American (114 | 22.1%), English (106 | 20.5%), Irish (43 | 8.3%), German (30 | 5.8%), and European (6 | 1.2%), together accounting for 57.9% of all Ridgeway residents.
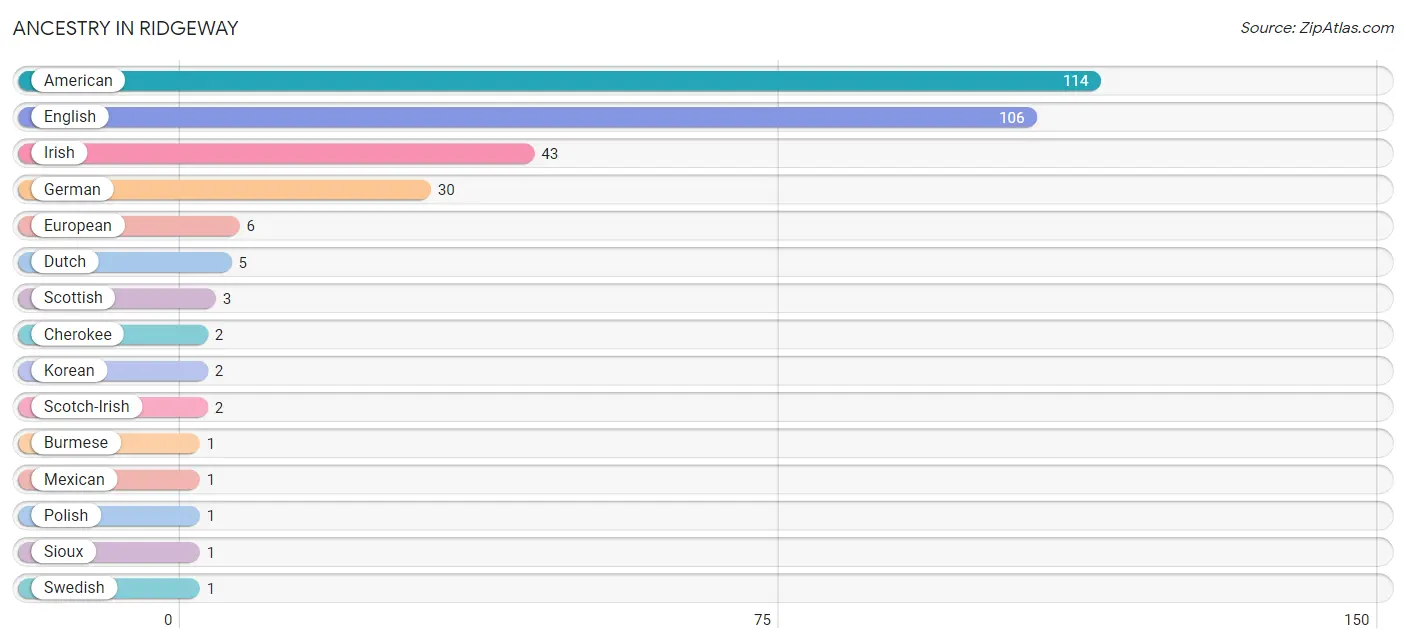
| Ancestry | # Population | % Population |
| American | 114 | 22.1% |
| Burmese | 1 | 0.2% |
| Cherokee | 2 | 0.4% |
| Dutch | 5 | 1.0% |
| English | 106 | 20.5% |
| European | 6 | 1.2% |
| German | 30 | 5.8% |
| Irish | 43 | 8.3% |
| Korean | 2 | 0.4% |
| Mexican | 1 | 0.2% |
| Polish | 1 | 0.2% |
| Scotch-Irish | 2 | 0.4% |
| Scottish | 3 | 0.6% |
| Sioux | 1 | 0.2% |
| Swedish | 1 | 0.2% | View All 15 Rows |
Immigrants in Ridgeway

| Immigration Origin | # Population | % Population | View All 0 Rows |
Sex and Age in Ridgeway
Sex and Age in Ridgeway
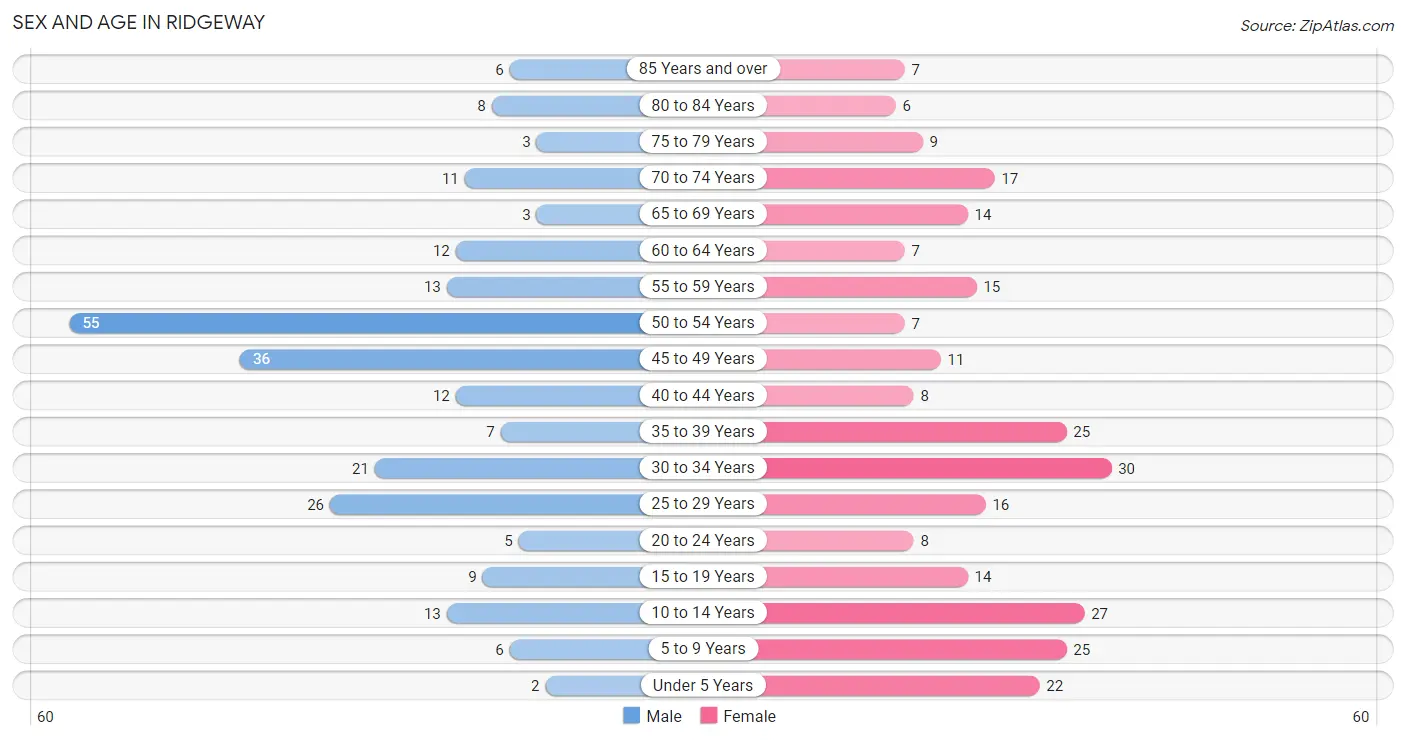
The most populous age groups in Ridgeway are 50 to 54 Years (55 | 22.2%) for men and 30 to 34 Years (30 | 11.2%) for women.
| Age Bracket | Male | Female |
| Under 5 Years | 2 (0.8%) | 22 (8.2%) |
| 5 to 9 Years | 6 (2.4%) | 25 (9.3%) |
| 10 to 14 Years | 13 (5.2%) | 27 (10.1%) |
| 15 to 19 Years | 9 (3.6%) | 14 (5.2%) |
| 20 to 24 Years | 5 (2.0%) | 8 (3.0%) |
| 25 to 29 Years | 26 (10.5%) | 16 (6.0%) |
| 30 to 34 Years | 21 (8.5%) | 30 (11.2%) |
| 35 to 39 Years | 7 (2.8%) | 25 (9.3%) |
| 40 to 44 Years | 12 (4.8%) | 8 (3.0%) |
| 45 to 49 Years | 36 (14.5%) | 11 (4.1%) |
| 50 to 54 Years | 55 (22.2%) | 7 (2.6%) |
| 55 to 59 Years | 13 (5.2%) | 15 (5.6%) |
| 60 to 64 Years | 12 (4.8%) | 7 (2.6%) |
| 65 to 69 Years | 3 (1.2%) | 14 (5.2%) |
| 70 to 74 Years | 11 (4.4%) | 17 (6.3%) |
| 75 to 79 Years | 3 (1.2%) | 9 (3.4%) |
| 80 to 84 Years | 8 (3.2%) | 6 (2.2%) |
| 85 Years and over | 6 (2.4%) | 7 (2.6%) |
| Total | 248 (100.0%) | 268 (100.0%) |
Families and Households in Ridgeway
Median Family Size in Ridgeway
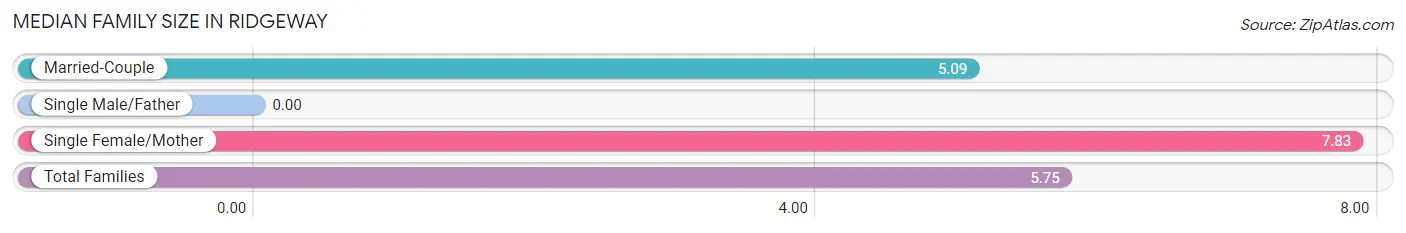
| Family Type | # Families | Family Size |
| Married-Couple | 57 (76.0%) | 5.09 |
| Single Male/Father | 0 (0.0%) | - |
| Single Female/Mother | 18 (24.0%) | 7.83 |
| Total Families | 75 (100.0%) | 5.75 |
Median Household Size in Ridgeway
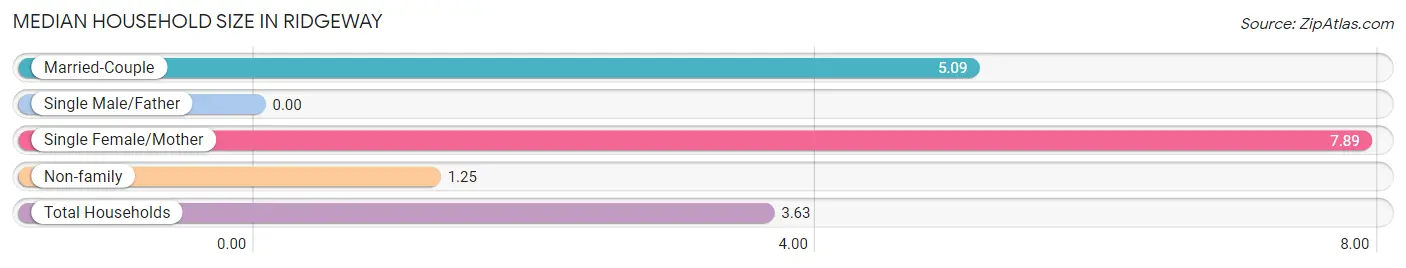
| Household Type | # Households | Household Size |
| Married-Couple | 57 (40.1%) | 5.09 |
| Single Male/Father | 0 (0.0%) | - |
| Single Female/Mother | 18 (12.7%) | 7.89 |
| Non-family | 67 (47.2%) | 1.25 |
| Total Households | 142 (100.0%) | 3.63 |
Household Size by Marriage Status in Ridgeway
Out of a total of 142 households in Ridgeway, 75 (52.8%) are family households, while 67 (47.2%) are nonfamily households. The most numerous type of family households are 2-person households, comprising 26, and the most common type of nonfamily households are 1-person households, comprising 47.
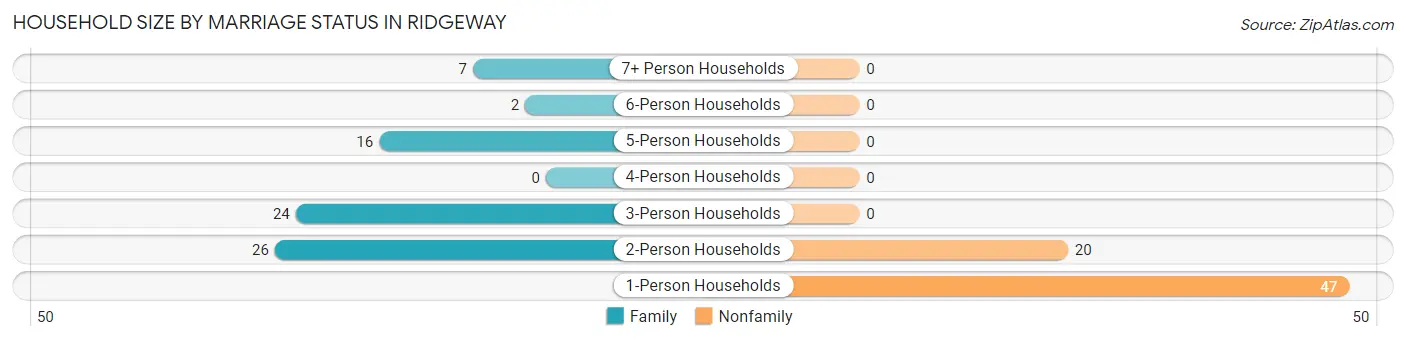
| Household Size | Family Households | Nonfamily Households |
| 1-Person Households | - | 47 (33.1%) |
| 2-Person Households | 26 (18.3%) | 20 (14.1%) |
| 3-Person Households | 24 (16.9%) | 0 (0.0%) |
| 4-Person Households | 0 (0.0%) | 0 (0.0%) |
| 5-Person Households | 16 (11.3%) | 0 (0.0%) |
| 6-Person Households | 2 (1.4%) | 0 (0.0%) |
| 7+ Person Households | 7 (4.9%) | 0 (0.0%) |
| Total | 75 (52.8%) | 67 (47.2%) |
Female Fertility in Ridgeway
Fertility by Age in Ridgeway
Average fertility rate in Ridgeway is 27.0 births per 1,000 women. Women in the age bracket of 20 to 34 years have the highest fertility rate with 56.0 births per 1,000 women. Women in the age bracket of 20 to 34 years acount for 100.0% of all women with births.
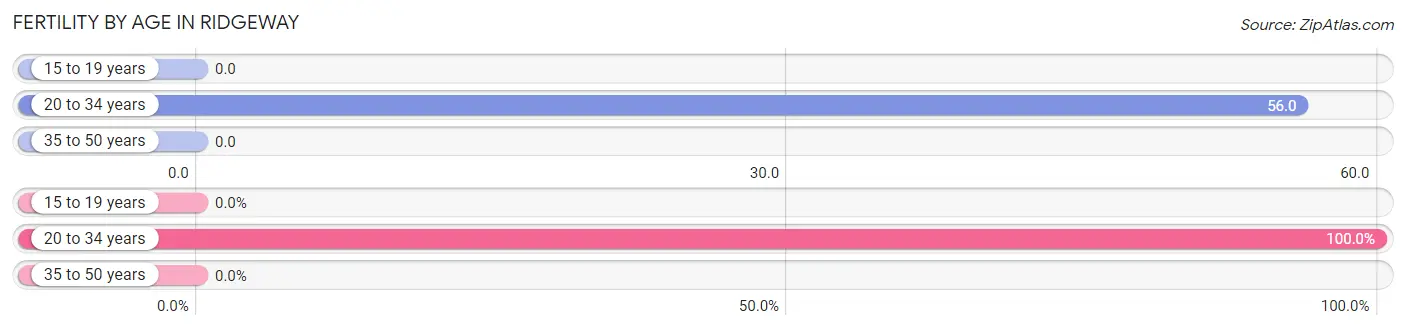
| Age Bracket | Women with Births | Births / 1,000 Women |
| 15 to 19 years | 0 (0.0%) | 0.0 |
| 20 to 34 years | 3 (100.0%) | 56.0 |
| 35 to 50 years | 0 (0.0%) | 0.0 |
| Total | 3 (100.0%) | 27.0 |
Fertility by Age by Marriage Status in Ridgeway
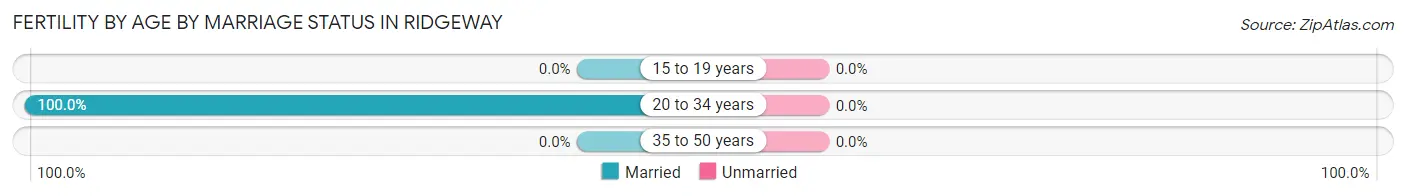
| Age Bracket | Married | Unmarried |
| 15 to 19 years | 0 (0.0%) | 0 (0.0%) |
| 20 to 34 years | 3 (100.0%) | 0 (0.0%) |
| 35 to 50 years | 0 (0.0%) | 0 (0.0%) |
| Total | 3 (100.0%) | 0 (0.0%) |
Fertility by Education in Ridgeway
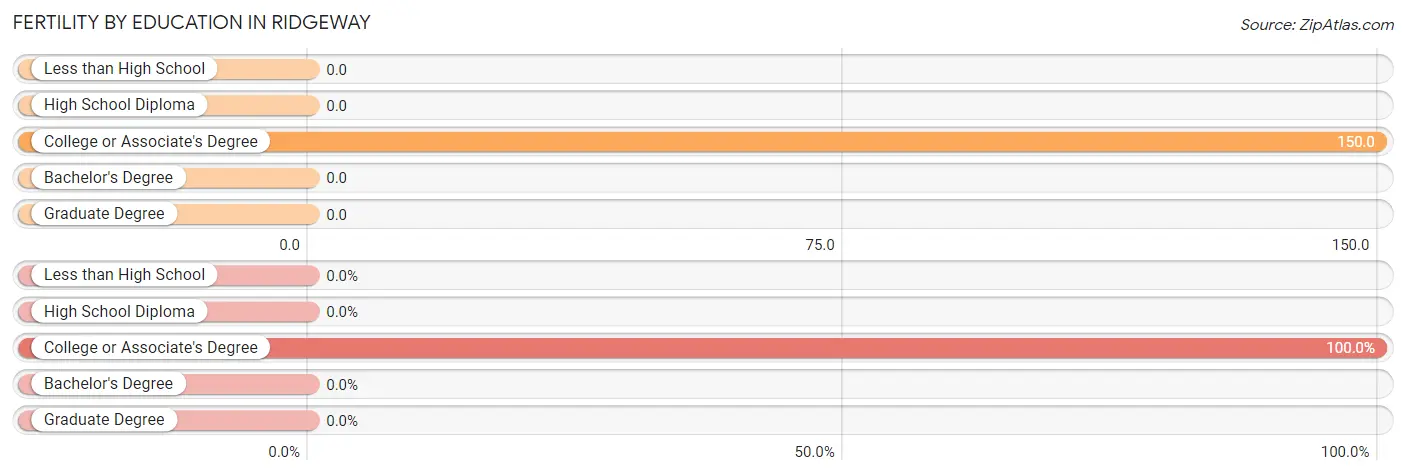
| Educational Attainment | Women with Births | Births / 1,000 Women |
| Less than High School | 0 (0.0%) | 0.0 |
| High School Diploma | 0 (0.0%) | 0.0 |
| College or Associate's Degree | 3 (100.0%) | 150.0 |
| Bachelor's Degree | 0 (0.0%) | 0.0 |
| Graduate Degree | 0 (0.0%) | 0.0 |
| Total | 3 (100.0%) | 27.0 |
Fertility by Education by Marriage Status in Ridgeway
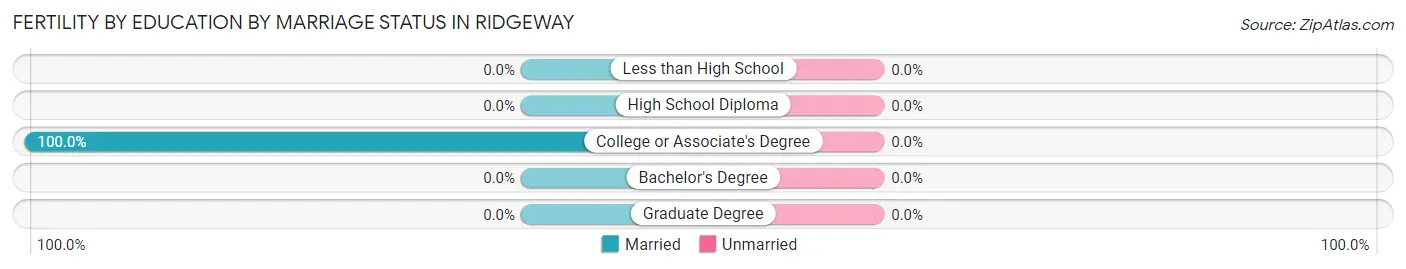
| Educational Attainment | Married | Unmarried |
| Less than High School | 0 (0.0%) | 0 (0.0%) |
| High School Diploma | 0 (0.0%) | 0 (0.0%) |
| College or Associate's Degree | 3 (100.0%) | 0 (0.0%) |
| Bachelor's Degree | 0 (0.0%) | 0 (0.0%) |
| Graduate Degree | 0 (0.0%) | 0 (0.0%) |
| Total | 3 (100.0%) | 0 (0.0%) |
Employment Characteristics in Ridgeway
Employment by Class of Employer in Ridgeway
Among the 148 employed individuals in Ridgeway, private company employees (100 | 67.6%), local government employees (22 | 14.9%), and self-employed (not incorporated) (16 | 10.8%) make up the most common classes of employment.
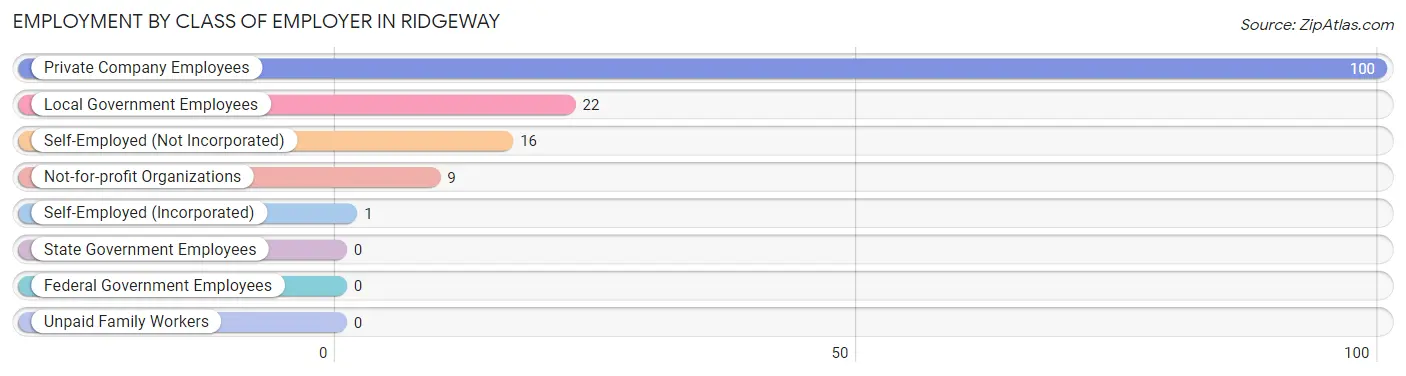
| Employer Class | # Employees | % Employees |
| Private Company Employees | 100 | 67.6% |
| Self-Employed (Incorporated) | 1 | 0.7% |
| Self-Employed (Not Incorporated) | 16 | 10.8% |
| Not-for-profit Organizations | 9 | 6.1% |
| Local Government Employees | 22 | 14.9% |
| State Government Employees | 0 | 0.0% |
| Federal Government Employees | 0 | 0.0% |
| Unpaid Family Workers | 0 | 0.0% |
| Total | 148 | 100.0% |
Employment Status by Age in Ridgeway
According to the labor force statistics for Ridgeway, out of the total population over 16 years of age (418), 40.2% or 168 individuals are in the labor force, with 11.3% or 19 of them unemployed. The age group with the highest labor force participation rate is 20 to 24 years, with 100.0% or 13 individuals in the labor force. Within the labor force, the 30 to 34 years age range has the highest percentage of unemployed individuals, with 90.5% or 19 of them being unemployed.
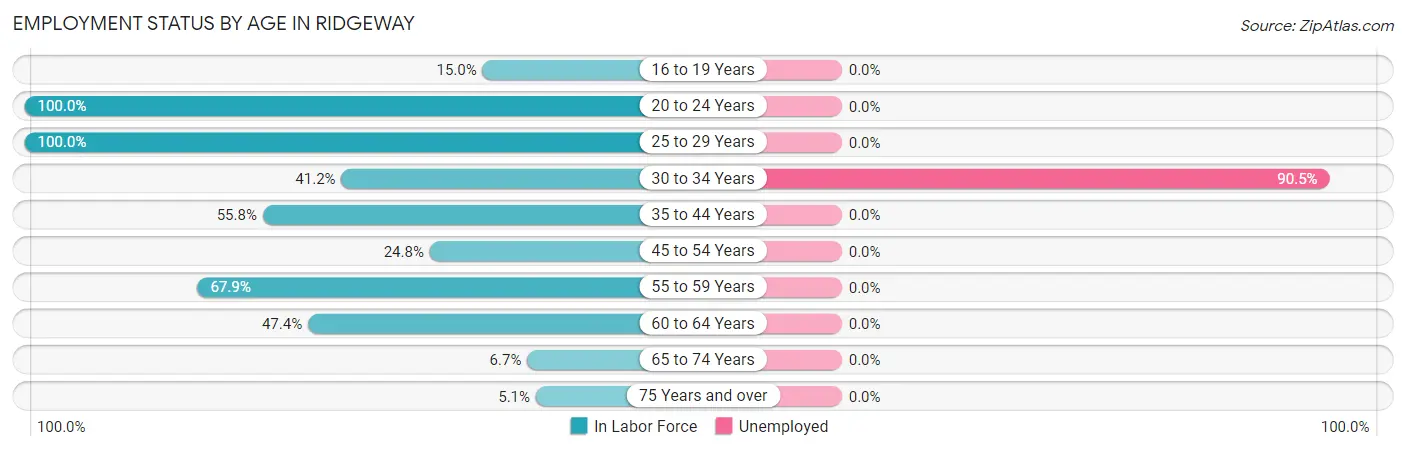
| Age Bracket | In Labor Force | Unemployed |
| 16 to 19 Years | 3 (15.0%) | 0 (0.0%) |
| 20 to 24 Years | 13 (100.0%) | 0 (0.0%) |
| 25 to 29 Years | 42 (100.0%) | 0 (0.0%) |
| 30 to 34 Years | 21 (41.2%) | 19 (90.5%) |
| 35 to 44 Years | 29 (55.8%) | 0 (0.0%) |
| 45 to 54 Years | 27 (24.8%) | 0 (0.0%) |
| 55 to 59 Years | 19 (67.9%) | 0 (0.0%) |
| 60 to 64 Years | 9 (47.4%) | 0 (0.0%) |
| 65 to 74 Years | 3 (6.7%) | 0 (0.0%) |
| 75 Years and over | 2 (5.1%) | 0 (0.0%) |
| Total | 168 (40.2%) | 19 (11.3%) |
Employment Status by Educational Attainment in Ridgeway
According to labor force statistics for Ridgeway, 48.8% of individuals (147) out of the total population between 25 and 64 years of age (301) are in the labor force, with 12.9% or 19 of them being unemployed. The group with the highest labor force participation rate are those with the educational attainment of bachelor's degree or higher, with 92.0% or 23 individuals in the labor force. Within the labor force, individuals with college / associate degree education have the highest percentage of unemployment, with 31.1% or 19 of them being unemployed.
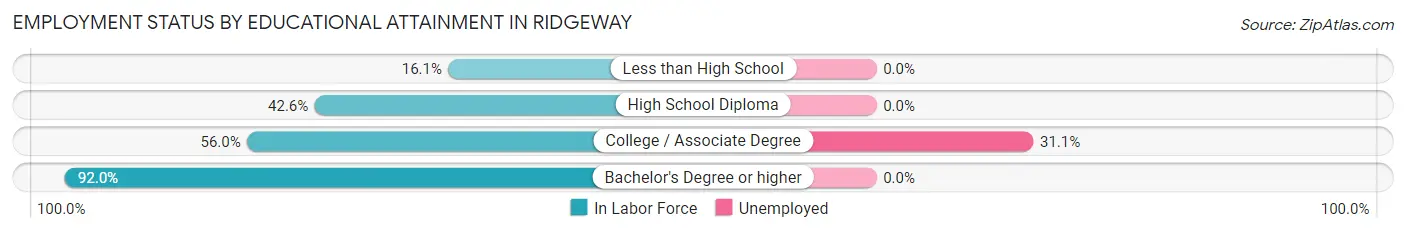
| Educational Attainment | In Labor Force | Unemployed |
| Less than High School | 5 (16.1%) | 0 (0.0%) |
| High School Diploma | 58 (42.6%) | 0 (0.0%) |
| College / Associate Degree | 61 (56.0%) | 34 (31.1%) |
| Bachelor's Degree or higher | 23 (92.0%) | 0 (0.0%) |
| Total | 147 (48.8%) | 39 (12.9%) |
Employment Occupations by Sex in Ridgeway
Management, Business, Science and Arts Occupations
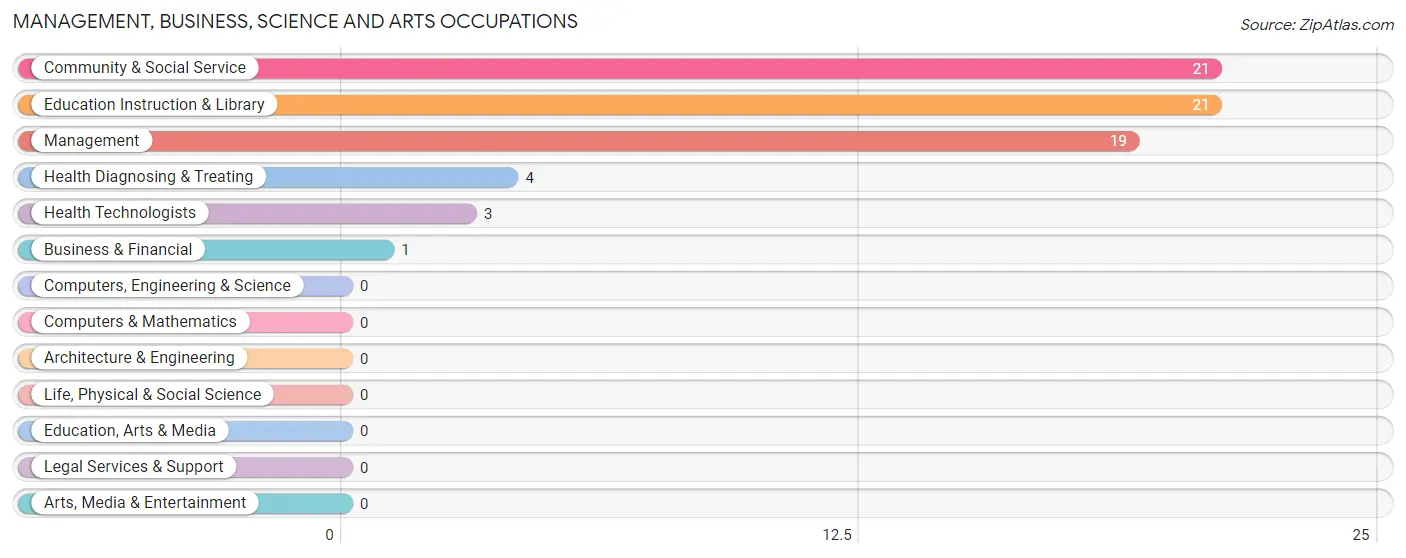
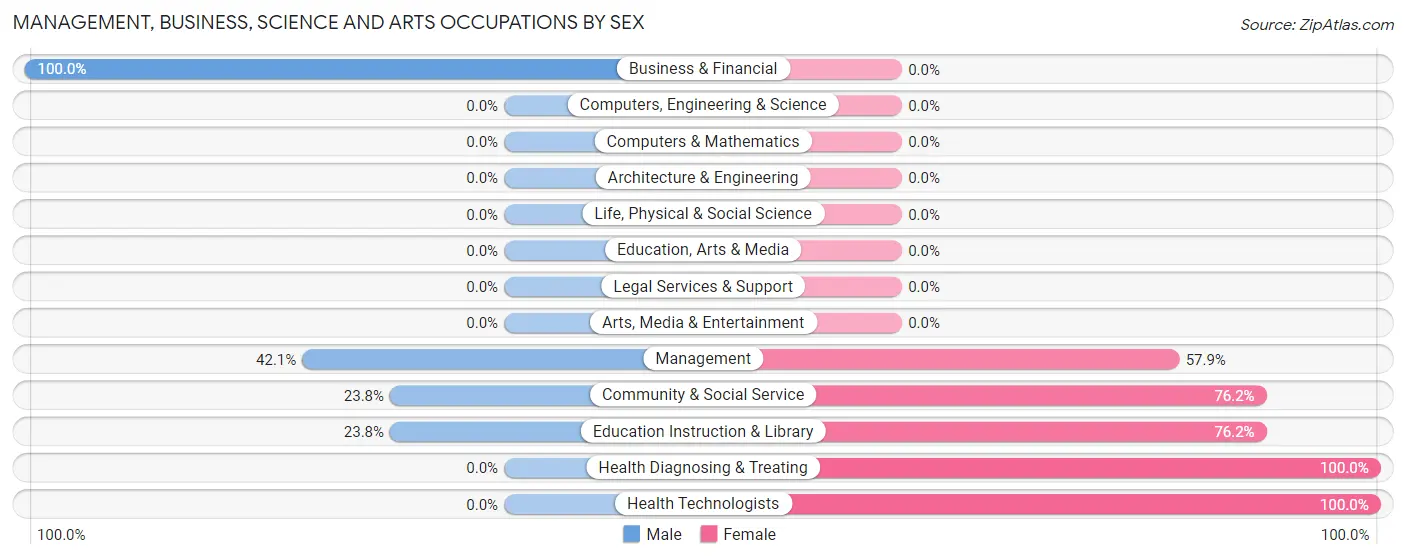
The most common Management, Business, Science and Arts occupations in Ridgeway are Community & Social Service (21 | 14.1%), Education Instruction & Library (21 | 14.1%), Management (19 | 12.8%), Health Diagnosing & Treating (4 | 2.7%), and Health Technologists (3 | 2.0%).
Management, Business, Science and Arts Occupations by Sex
Within the Management, Business, Science and Arts occupations in Ridgeway, the most male-oriented occupations are Business & Financial (100.0%), Management (42.1%), and Community & Social Service (23.8%), while the most female-oriented occupations are Health Diagnosing & Treating (100.0%), Health Technologists (100.0%), and Community & Social Service (76.2%).
| Occupation | Male | Female |
| Management | 8 (42.1%) | 11 (57.9%) |
| Business & Financial | 1 (100.0%) | 0 (0.0%) |
| Computers, Engineering & Science | 0 (0.0%) | 0 (0.0%) |
| Computers & Mathematics | 0 (0.0%) | 0 (0.0%) |
| Architecture & Engineering | 0 (0.0%) | 0 (0.0%) |
| Life, Physical & Social Science | 0 (0.0%) | 0 (0.0%) |
| Community & Social Service | 5 (23.8%) | 16 (76.2%) |
| Education, Arts & Media | 0 (0.0%) | 0 (0.0%) |
| Legal Services & Support | 0 (0.0%) | 0 (0.0%) |
| Education Instruction & Library | 5 (23.8%) | 16 (76.2%) |
| Arts, Media & Entertainment | 0 (0.0%) | 0 (0.0%) |
| Health Diagnosing & Treating | 0 (0.0%) | 4 (100.0%) |
| Health Technologists | 0 (0.0%) | 3 (100.0%) |
| Total (Category) | 14 (31.1%) | 31 (68.9%) |
| Total (Overall) | 73 (49.0%) | 76 (51.0%) |
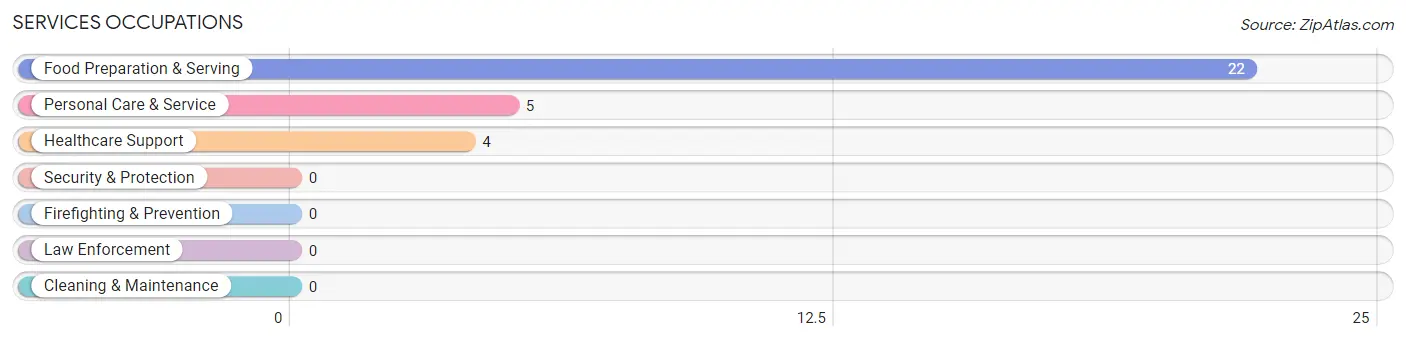
Services Occupations
The most common Services occupations in Ridgeway are Food Preparation & Serving (22 | 14.8%), Personal Care & Service (5 | 3.4%), and Healthcare Support (4 | 2.7%).
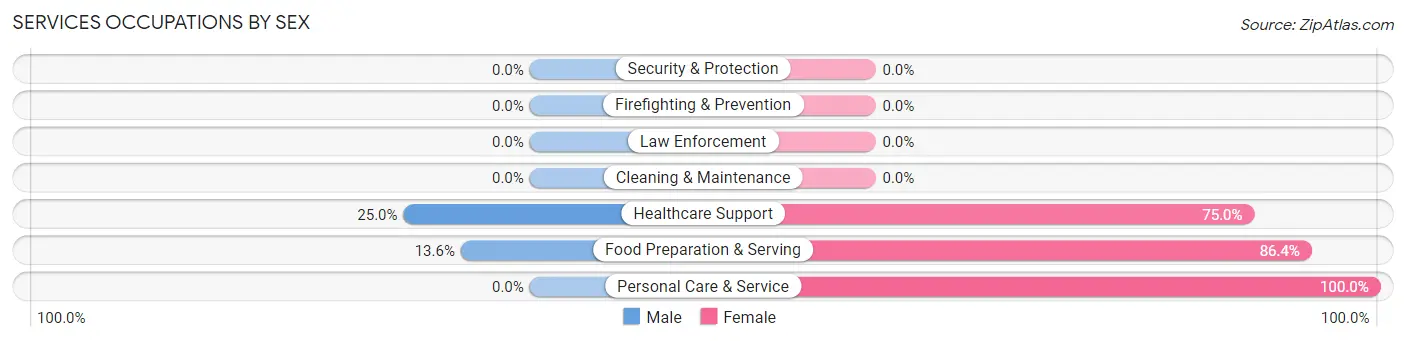
Services Occupations by Sex
Within the Services occupations in Ridgeway, the most male-oriented occupations are Healthcare Support (25.0%), and Food Preparation & Serving (13.6%), while the most female-oriented occupations are Personal Care & Service (100.0%), Food Preparation & Serving (86.4%), and Healthcare Support (75.0%).
| Occupation | Male | Female |
| Healthcare Support | 1 (25.0%) | 3 (75.0%) |
| Security & Protection | 0 (0.0%) | 0 (0.0%) |
| Firefighting & Prevention | 0 (0.0%) | 0 (0.0%) |
| Law Enforcement | 0 (0.0%) | 0 (0.0%) |
| Food Preparation & Serving | 3 (13.6%) | 19 (86.4%) |
| Cleaning & Maintenance | 0 (0.0%) | 0 (0.0%) |
| Personal Care & Service | 0 (0.0%) | 5 (100.0%) |
| Total (Category) | 4 (12.9%) | 27 (87.1%) |
| Total (Overall) | 73 (49.0%) | 76 (51.0%) |
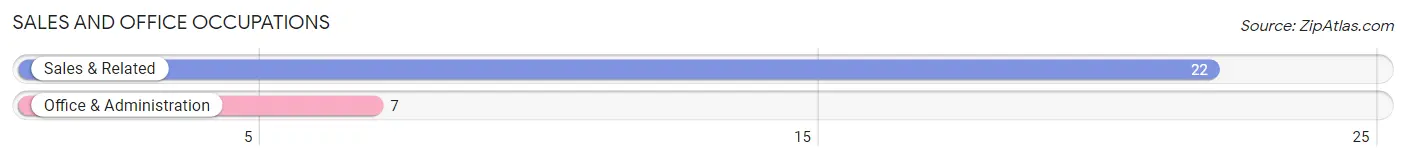
Sales and Office Occupations
The most common Sales and Office occupations in Ridgeway are Sales & Related (22 | 14.8%), and Office & Administration (7 | 4.7%).
Sales and Office Occupations by Sex
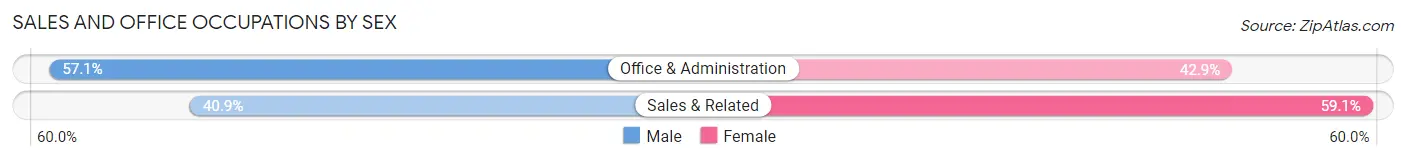
| Occupation | Male | Female |
| Sales & Related | 9 (40.9%) | 13 (59.1%) |
| Office & Administration | 4 (57.1%) | 3 (42.9%) |
| Total (Category) | 13 (44.8%) | 16 (55.2%) |
| Total (Overall) | 73 (49.0%) | 76 (51.0%) |
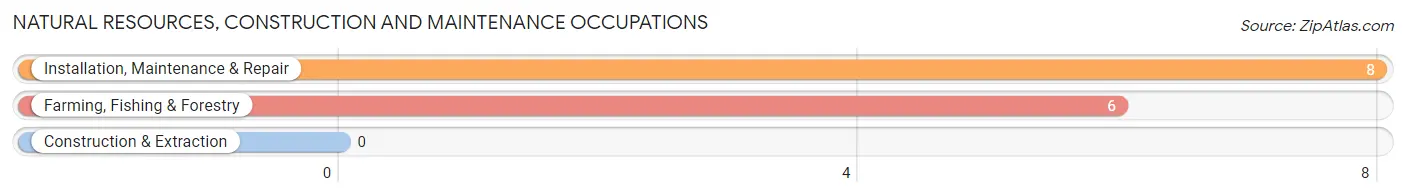
Natural Resources, Construction and Maintenance Occupations
The most common Natural Resources, Construction and Maintenance occupations in Ridgeway are Installation, Maintenance & Repair (8 | 5.4%), and Farming, Fishing & Forestry (6 | 4.0%).
Natural Resources, Construction and Maintenance Occupations by Sex
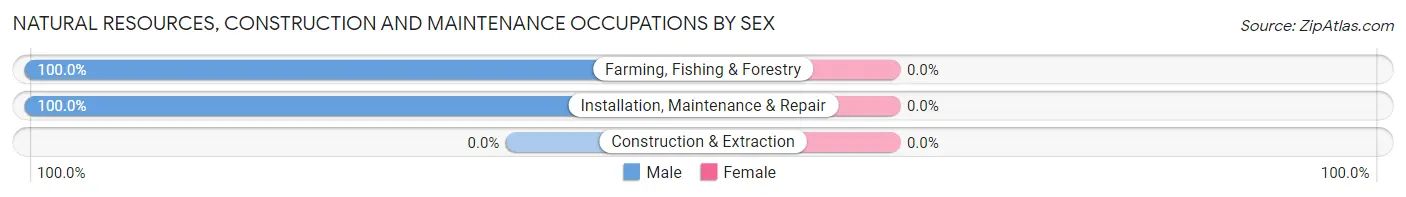
| Occupation | Male | Female |
| Farming, Fishing & Forestry | 6 (100.0%) | 0 (0.0%) |
| Construction & Extraction | 0 (0.0%) | 0 (0.0%) |
| Installation, Maintenance & Repair | 8 (100.0%) | 0 (0.0%) |
| Total (Category) | 14 (100.0%) | 0 (0.0%) |
| Total (Overall) | 73 (49.0%) | 76 (51.0%) |
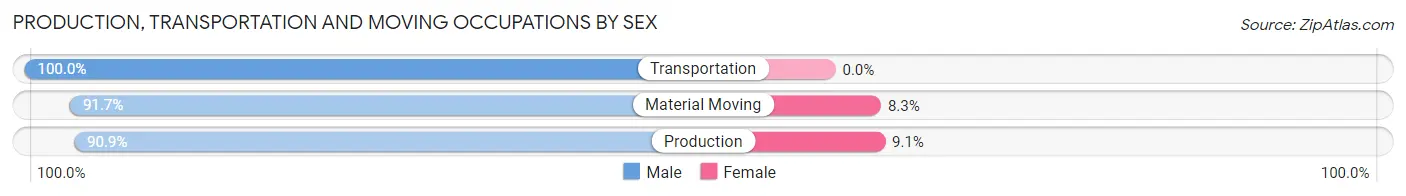
Production, Transportation and Moving Occupations
The most common Production, Transportation and Moving occupations in Ridgeway are Material Moving (12 | 8.1%), Production (11 | 7.4%), and Transportation (7 | 4.7%).
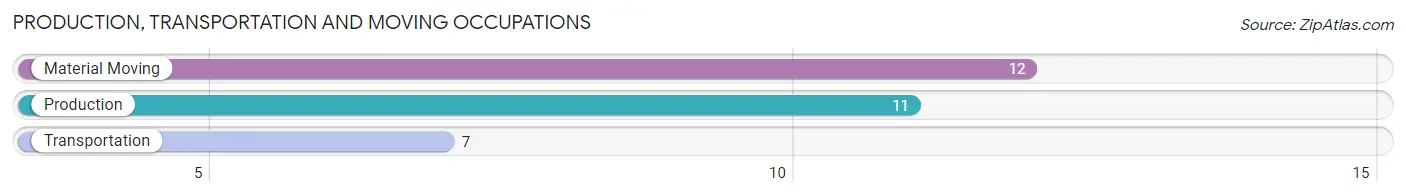
Production, Transportation and Moving Occupations by Sex
| Occupation | Male | Female |
| Production | 10 (90.9%) | 1 (9.1%) |
| Transportation | 7 (100.0%) | 0 (0.0%) |
| Material Moving | 11 (91.7%) | 1 (8.3%) |
| Total (Category) | 28 (93.3%) | 2 (6.7%) |
| Total (Overall) | 73 (49.0%) | 76 (51.0%) |
Employment Industries by Sex in Ridgeway
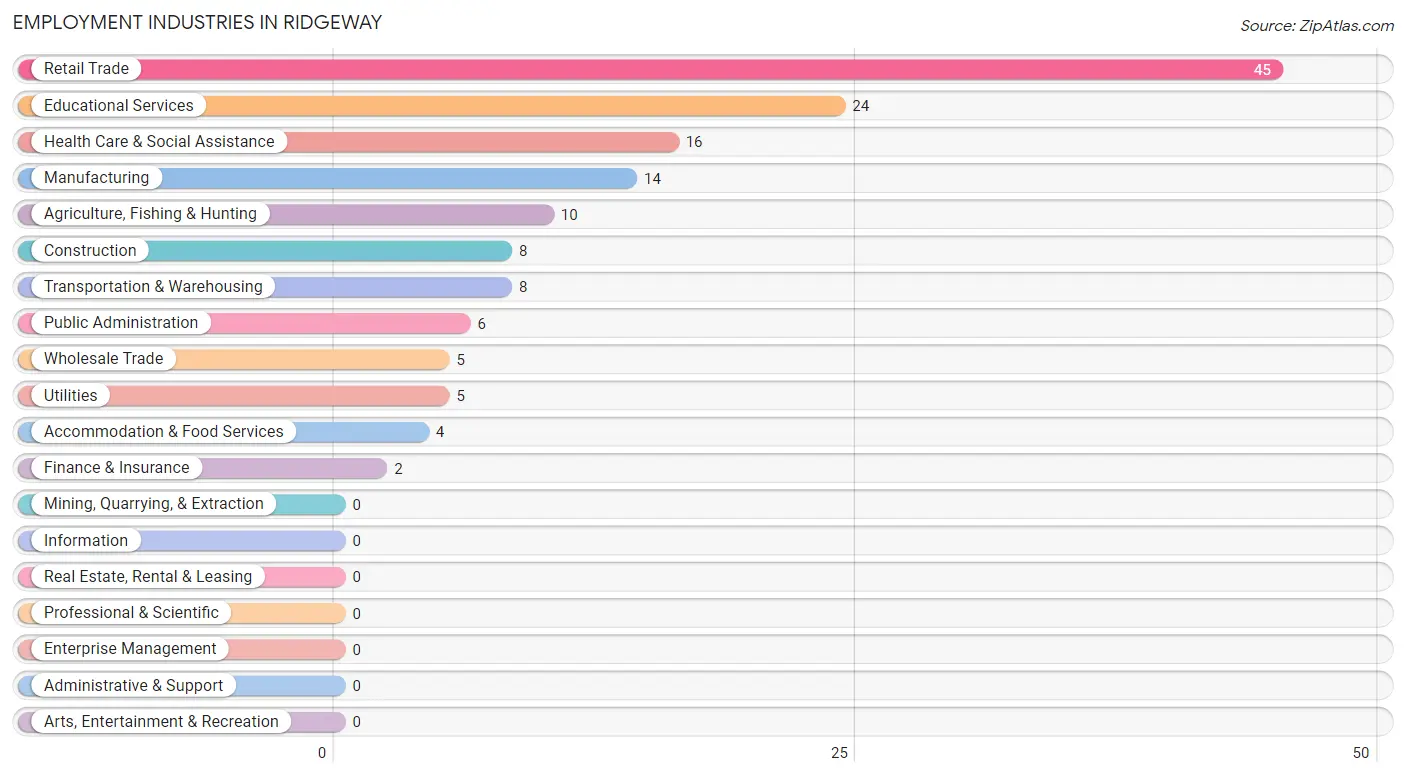
Employment Industries in Ridgeway
The major employment industries in Ridgeway include Retail Trade (45 | 30.2%), Educational Services (24 | 16.1%), Health Care & Social Assistance (16 | 10.7%), Manufacturing (14 | 9.4%), and Agriculture, Fishing & Hunting (10 | 6.7%).
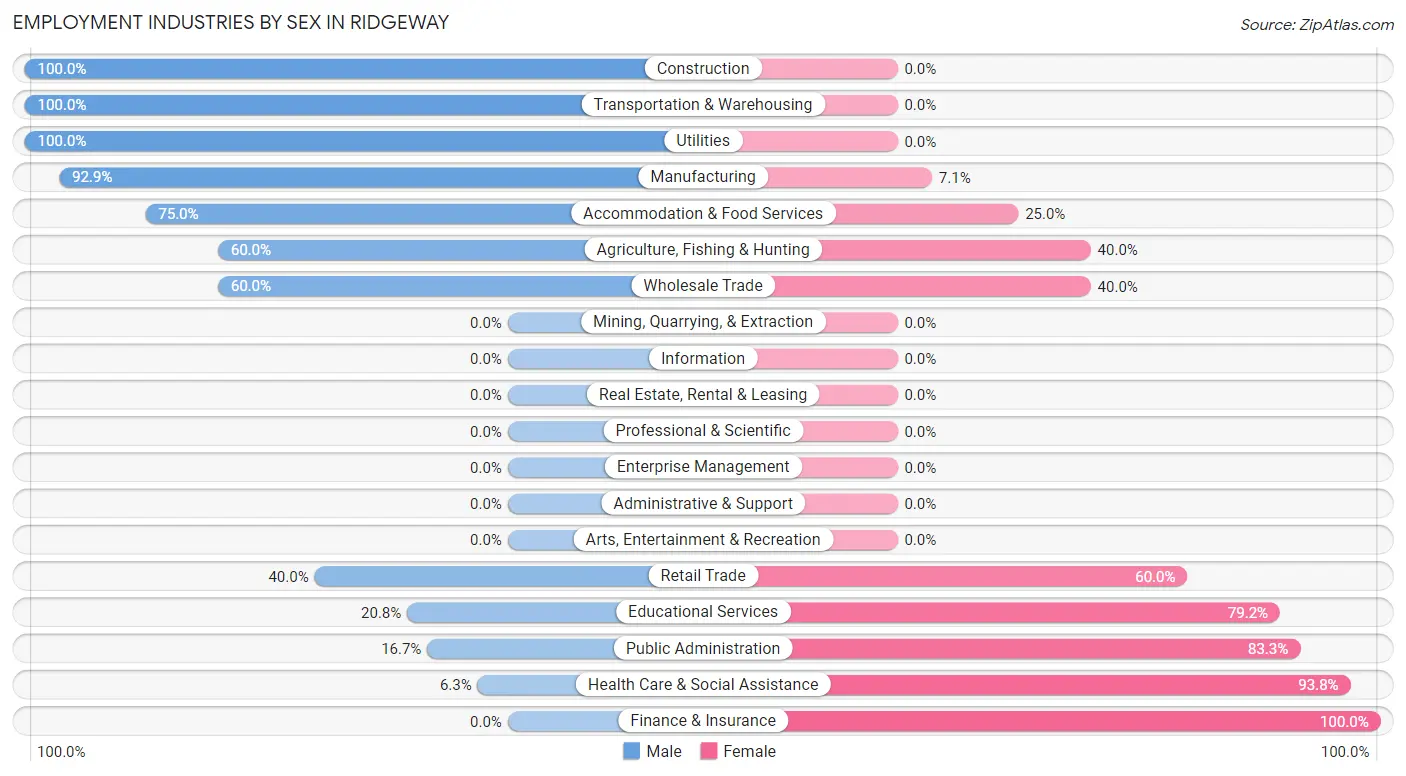
Employment Industries by Sex in Ridgeway
The Ridgeway industries that see more men than women are Construction (100.0%), Transportation & Warehousing (100.0%), and Utilities (100.0%), whereas the industries that tend to have a higher number of women are Finance & Insurance (100.0%), Health Care & Social Assistance (93.8%), and Public Administration (83.3%).
| Industry | Male | Female |
| Agriculture, Fishing & Hunting | 6 (60.0%) | 4 (40.0%) |
| Mining, Quarrying, & Extraction | 0 (0.0%) | 0 (0.0%) |
| Construction | 8 (100.0%) | 0 (0.0%) |
| Manufacturing | 13 (92.9%) | 1 (7.1%) |
| Wholesale Trade | 3 (60.0%) | 2 (40.0%) |
| Retail Trade | 18 (40.0%) | 27 (60.0%) |
| Transportation & Warehousing | 8 (100.0%) | 0 (0.0%) |
| Utilities | 5 (100.0%) | 0 (0.0%) |
| Information | 0 (0.0%) | 0 (0.0%) |
| Finance & Insurance | 0 (0.0%) | 2 (100.0%) |
| Real Estate, Rental & Leasing | 0 (0.0%) | 0 (0.0%) |
| Professional & Scientific | 0 (0.0%) | 0 (0.0%) |
| Enterprise Management | 0 (0.0%) | 0 (0.0%) |
| Administrative & Support | 0 (0.0%) | 0 (0.0%) |
| Educational Services | 5 (20.8%) | 19 (79.2%) |
| Health Care & Social Assistance | 1 (6.2%) | 15 (93.8%) |
| Arts, Entertainment & Recreation | 0 (0.0%) | 0 (0.0%) |
| Accommodation & Food Services | 3 (75.0%) | 1 (25.0%) |
| Public Administration | 1 (16.7%) | 5 (83.3%) |
| Total | 73 (49.0%) | 76 (51.0%) |
Education in Ridgeway
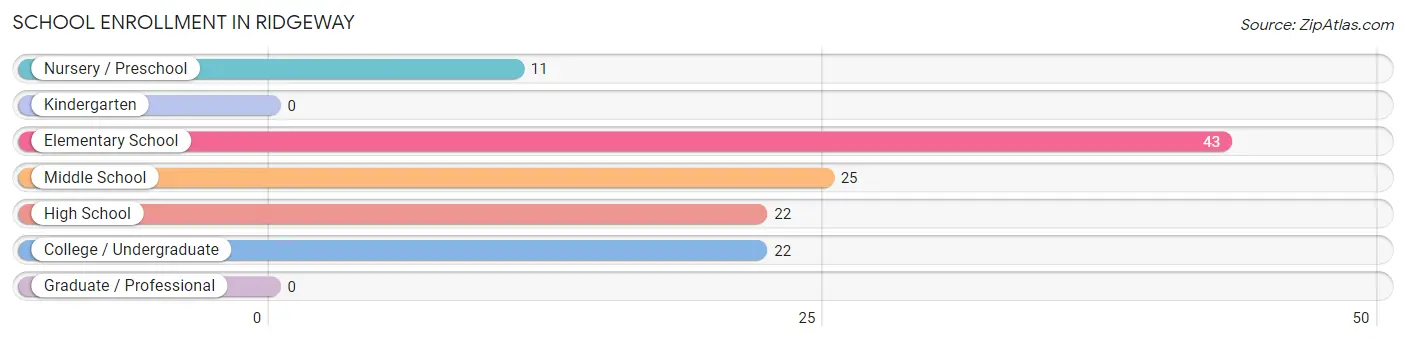
School Enrollment in Ridgeway
The most common levels of schooling among the 123 students in Ridgeway are elementary school (43 | 35.0%), middle school (25 | 20.3%), and high school (22 | 17.9%).
| School Level | # Students | % Students |
| Nursery / Preschool | 11 | 8.9% |
| Kindergarten | 0 | 0.0% |
| Elementary School | 43 | 35.0% |
| Middle School | 25 | 20.3% |
| High School | 22 | 17.9% |
| College / Undergraduate | 22 | 17.9% |
| Graduate / Professional | 0 | 0.0% |
| Total | 123 | 100.0% |
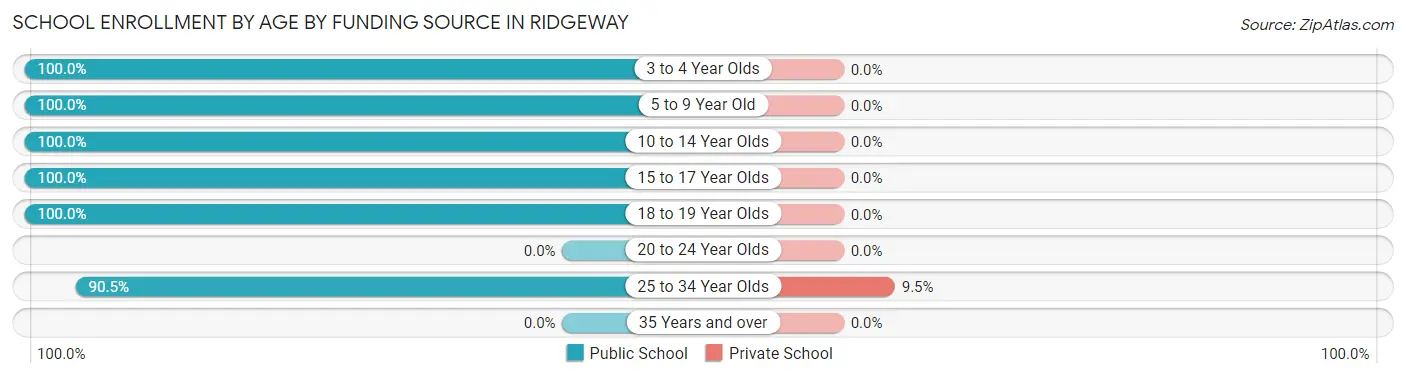
School Enrollment by Age by Funding Source in Ridgeway
Out of a total of 123 students who are enrolled in schools in Ridgeway, 2 (1.6%) attend a private institution, while the remaining 121 (98.4%) are enrolled in public schools. The age group of 25 to 34 year olds has the highest likelihood of being enrolled in private schools, with 2 (9.5% in the age bracket) enrolled. Conversely, the age group of 3 to 4 year olds has the lowest likelihood of being enrolled in a private school, with 11 (100.0% in the age bracket) attending a public institution.
| Age Bracket | Public School | Private School |
| 3 to 4 Year Olds | 11 (100.0%) | 0 (0.0%) |
| 5 to 9 Year Old | 30 (100.0%) | 0 (0.0%) |
| 10 to 14 Year Olds | 40 (100.0%) | 0 (0.0%) |
| 15 to 17 Year Olds | 20 (100.0%) | 0 (0.0%) |
| 18 to 19 Year Olds | 1 (100.0%) | 0 (0.0%) |
| 20 to 24 Year Olds | 0 (0.0%) | 0 (0.0%) |
| 25 to 34 Year Olds | 19 (90.5%) | 2 (9.5%) |
| 35 Years and over | 0 (0.0%) | 0 (0.0%) |
| Total | 121 (98.4%) | 2 (1.6%) |
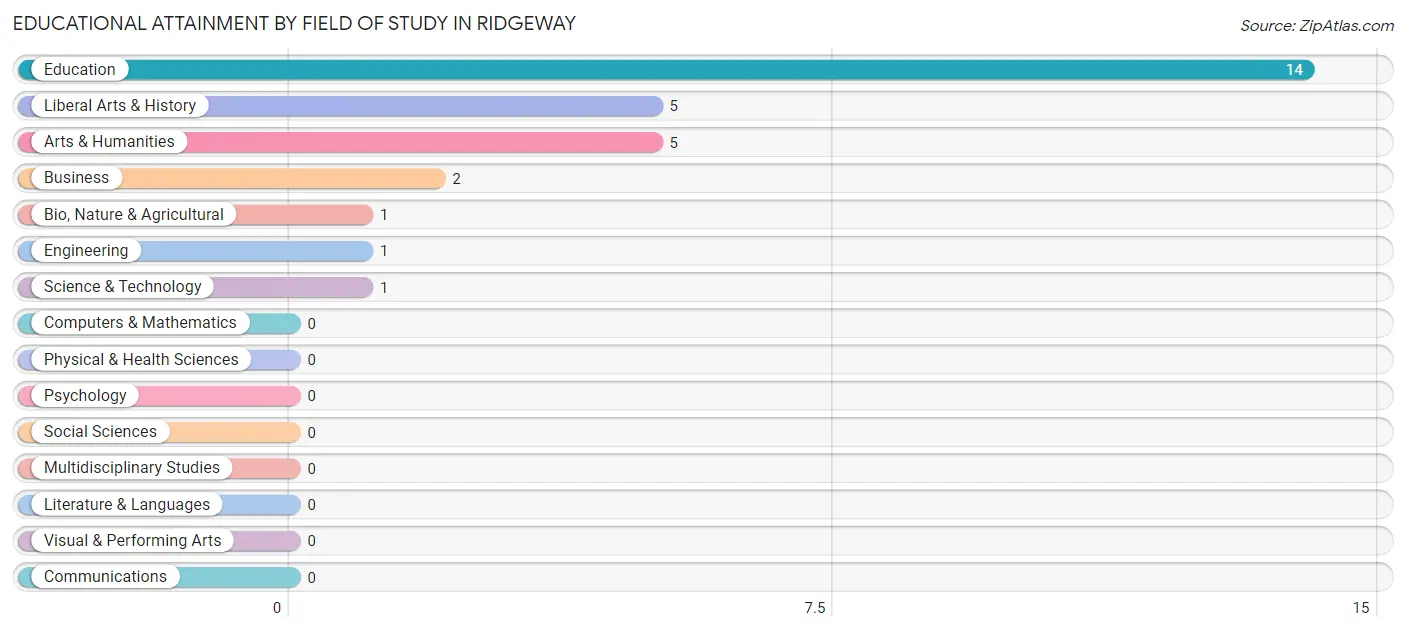
Educational Attainment by Field of Study in Ridgeway
Education (14 | 48.3%), liberal arts & history (5 | 17.2%), arts & humanities (5 | 17.2%), business (2 | 6.9%), and bio, nature & agricultural (1 | 3.5%) are the most common fields of study among 29 individuals in Ridgeway who have obtained a bachelor's degree or higher.
| Field of Study | # Graduates | % Graduates |
| Computers & Mathematics | 0 | 0.0% |
| Bio, Nature & Agricultural | 1 | 3.5% |
| Physical & Health Sciences | 0 | 0.0% |
| Psychology | 0 | 0.0% |
| Social Sciences | 0 | 0.0% |
| Engineering | 1 | 3.5% |
| Multidisciplinary Studies | 0 | 0.0% |
| Science & Technology | 1 | 3.5% |
| Business | 2 | 6.9% |
| Education | 14 | 48.3% |
| Literature & Languages | 0 | 0.0% |
| Liberal Arts & History | 5 | 17.2% |
| Visual & Performing Arts | 0 | 0.0% |
| Communications | 0 | 0.0% |
| Arts & Humanities | 5 | 17.2% |
| Total | 29 | 100.0% |
Transportation & Commute in Ridgeway
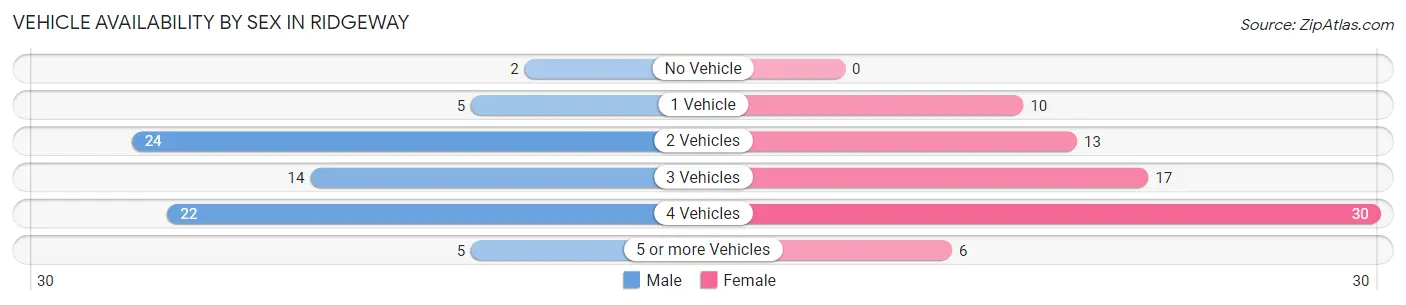
Vehicle Availability by Sex in Ridgeway
The most prevalent vehicle ownership categories in Ridgeway are males with 2 vehicles (24, accounting for 33.3%) and females with 2 vehicles (13, making up 31.6%).
| Vehicles Available | Male | Female |
| No Vehicle | 2 (2.8%) | 0 (0.0%) |
| 1 Vehicle | 5 (6.9%) | 10 (13.2%) |
| 2 Vehicles | 24 (33.3%) | 13 (17.1%) |
| 3 Vehicles | 14 (19.4%) | 17 (22.4%) |
| 4 Vehicles | 22 (30.6%) | 30 (39.5%) |
| 5 or more Vehicles | 5 (6.9%) | 6 (7.9%) |
| Total | 72 (100.0%) | 76 (100.0%) |
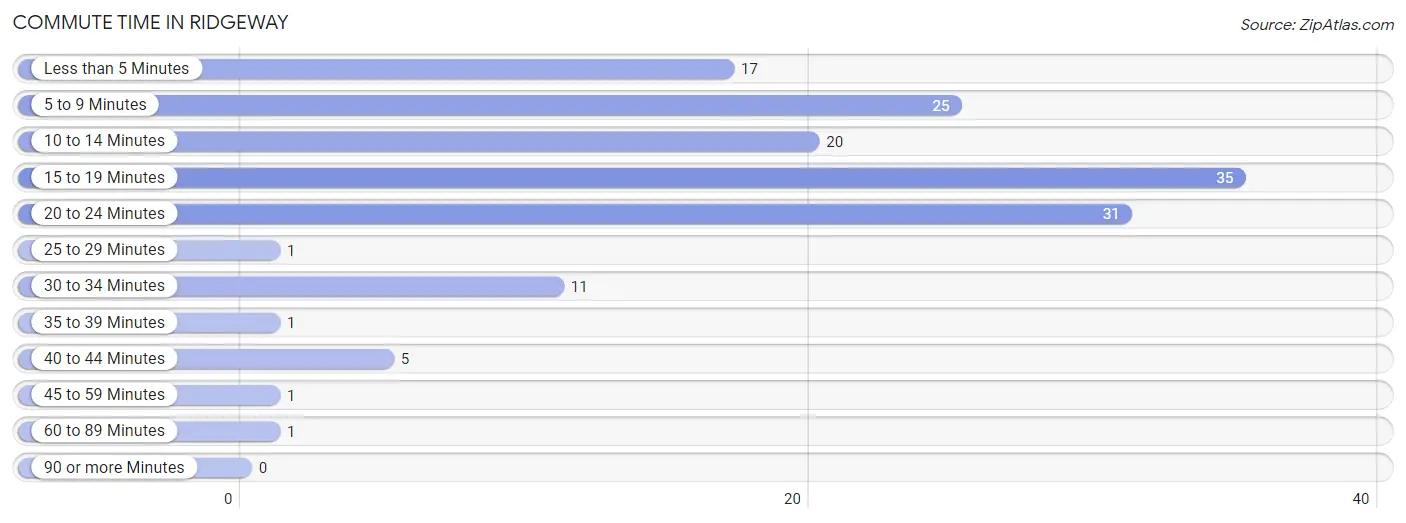
Commute Time in Ridgeway
The most frequently occuring commute durations in Ridgeway are 15 to 19 minutes (35 commuters, 23.6%), 20 to 24 minutes (31 commuters, 20.9%), and 5 to 9 minutes (25 commuters, 16.9%).
| Commute Time | # Commuters | % Commuters |
| Less than 5 Minutes | 17 | 11.5% |
| 5 to 9 Minutes | 25 | 16.9% |
| 10 to 14 Minutes | 20 | 13.5% |
| 15 to 19 Minutes | 35 | 23.6% |
| 20 to 24 Minutes | 31 | 20.9% |
| 25 to 29 Minutes | 1 | 0.7% |
| 30 to 34 Minutes | 11 | 7.4% |
| 35 to 39 Minutes | 1 | 0.7% |
| 40 to 44 Minutes | 5 | 3.4% |
| 45 to 59 Minutes | 1 | 0.7% |
| 60 to 89 Minutes | 1 | 0.7% |
| 90 or more Minutes | 0 | 0.0% |
Commute Time by Sex in Ridgeway
The most common commute times in Ridgeway are 15 to 19 minutes (19 commuters, 26.4%) for males and 20 to 24 minutes (23 commuters, 30.3%) for females.
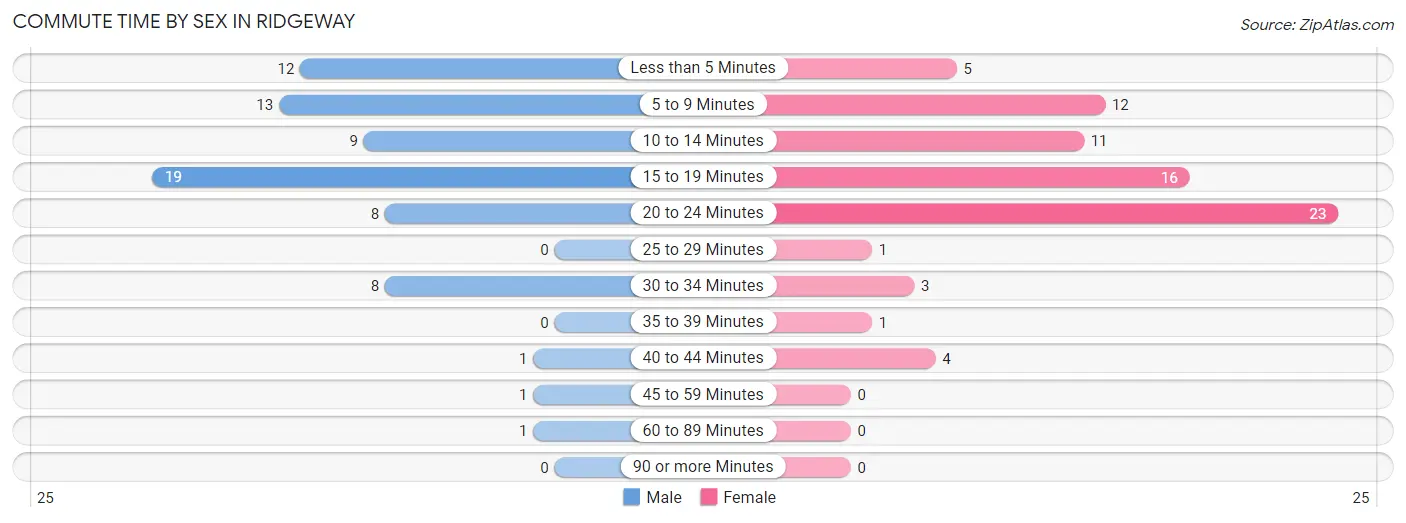
| Commute Time | Male | Female |
| Less than 5 Minutes | 12 (16.7%) | 5 (6.6%) |
| 5 to 9 Minutes | 13 (18.1%) | 12 (15.8%) |
| 10 to 14 Minutes | 9 (12.5%) | 11 (14.5%) |
| 15 to 19 Minutes | 19 (26.4%) | 16 (21.0%) |
| 20 to 24 Minutes | 8 (11.1%) | 23 (30.3%) |
| 25 to 29 Minutes | 0 (0.0%) | 1 (1.3%) |
| 30 to 34 Minutes | 8 (11.1%) | 3 (4.0%) |
| 35 to 39 Minutes | 0 (0.0%) | 1 (1.3%) |
| 40 to 44 Minutes | 1 (1.4%) | 4 (5.3%) |
| 45 to 59 Minutes | 1 (1.4%) | 0 (0.0%) |
| 60 to 89 Minutes | 1 (1.4%) | 0 (0.0%) |
| 90 or more Minutes | 0 (0.0%) | 0 (0.0%) |
Time of Departure to Work by Sex in Ridgeway
The most frequent times of departure to work in Ridgeway are 7:30 AM to 7:59 AM (18, 25.0%) for males and 4:00 PM to 11:59 PM (21, 27.6%) for females.
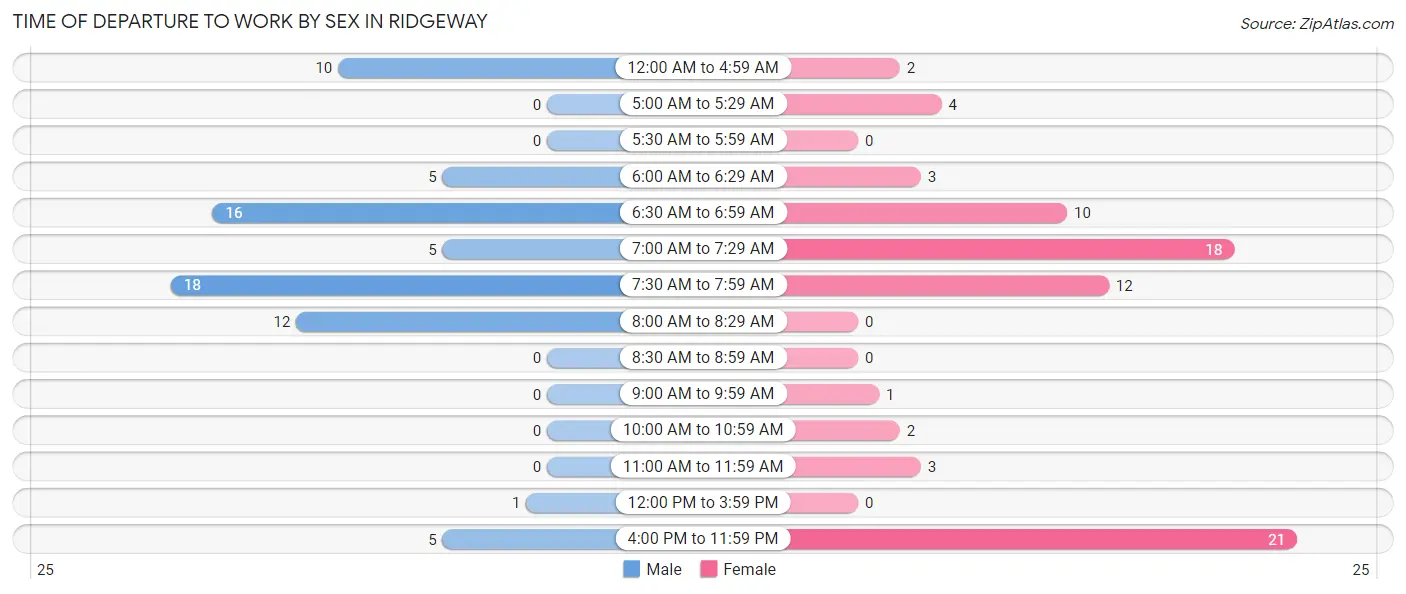
| Time of Departure | Male | Female |
| 12:00 AM to 4:59 AM | 10 (13.9%) | 2 (2.6%) |
| 5:00 AM to 5:29 AM | 0 (0.0%) | 4 (5.3%) |
| 5:30 AM to 5:59 AM | 0 (0.0%) | 0 (0.0%) |
| 6:00 AM to 6:29 AM | 5 (6.9%) | 3 (4.0%) |
| 6:30 AM to 6:59 AM | 16 (22.2%) | 10 (13.2%) |
| 7:00 AM to 7:29 AM | 5 (6.9%) | 18 (23.7%) |
| 7:30 AM to 7:59 AM | 18 (25.0%) | 12 (15.8%) |
| 8:00 AM to 8:29 AM | 12 (16.7%) | 0 (0.0%) |
| 8:30 AM to 8:59 AM | 0 (0.0%) | 0 (0.0%) |
| 9:00 AM to 9:59 AM | 0 (0.0%) | 1 (1.3%) |
| 10:00 AM to 10:59 AM | 0 (0.0%) | 2 (2.6%) |
| 11:00 AM to 11:59 AM | 0 (0.0%) | 3 (4.0%) |
| 12:00 PM to 3:59 PM | 1 (1.4%) | 0 (0.0%) |
| 4:00 PM to 11:59 PM | 5 (6.9%) | 21 (27.6%) |
| Total | 72 (100.0%) | 76 (100.0%) |
Housing Occupancy in Ridgeway
Occupancy by Ownership in Ridgeway
Of the total 142 dwellings in Ridgeway, owner-occupied units account for 99 (69.7%), while renter-occupied units make up 43 (30.3%).
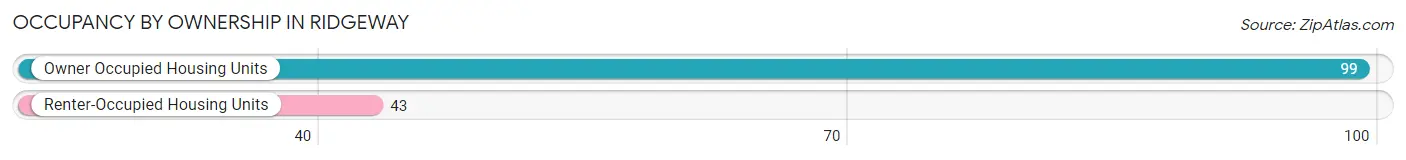
| Occupancy | # Housing Units | % Housing Units |
| Owner Occupied Housing Units | 99 | 69.7% |
| Renter-Occupied Housing Units | 43 | 30.3% |
| Total Occupied Housing Units | 142 | 100.0% |
Occupancy by Household Size in Ridgeway
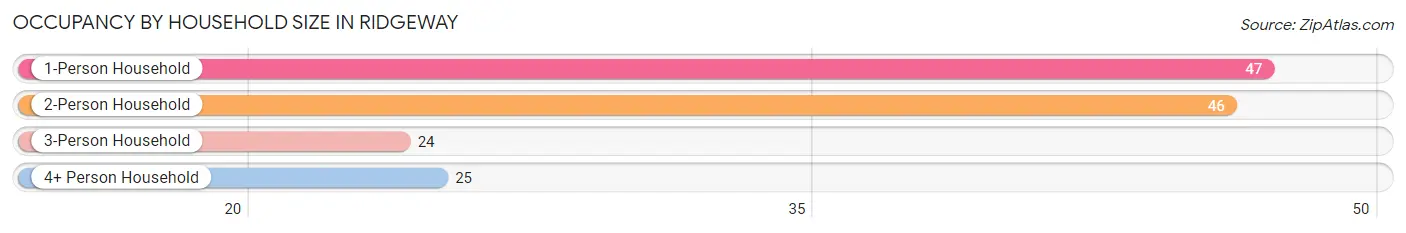
| Household Size | # Housing Units | % Housing Units |
| 1-Person Household | 47 | 33.1% |
| 2-Person Household | 46 | 32.4% |
| 3-Person Household | 24 | 16.9% |
| 4+ Person Household | 25 | 17.6% |
| Total Housing Units | 142 | 100.0% |
Occupancy by Ownership by Household Size in Ridgeway
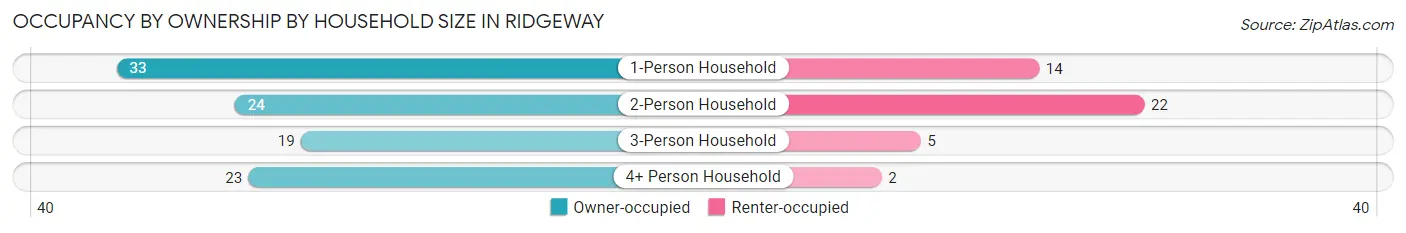
| Household Size | Owner-occupied | Renter-occupied |
| 1-Person Household | 33 (70.2%) | 14 (29.8%) |
| 2-Person Household | 24 (52.2%) | 22 (47.8%) |
| 3-Person Household | 19 (79.2%) | 5 (20.8%) |
| 4+ Person Household | 23 (92.0%) | 2 (8.0%) |
| Total Housing Units | 99 (69.7%) | 43 (30.3%) |
Occupancy by Educational Attainment in Ridgeway
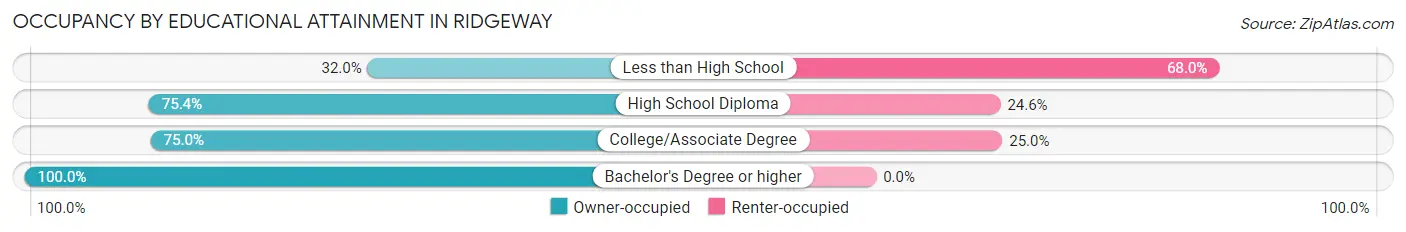
| Household Size | Owner-occupied | Renter-occupied |
| Less than High School | 8 (32.0%) | 17 (68.0%) |
| High School Diploma | 52 (75.4%) | 17 (24.6%) |
| College/Associate Degree | 27 (75.0%) | 9 (25.0%) |
| Bachelor's Degree or higher | 12 (100.0%) | 0 (0.0%) |
Occupancy by Age of Householder in Ridgeway
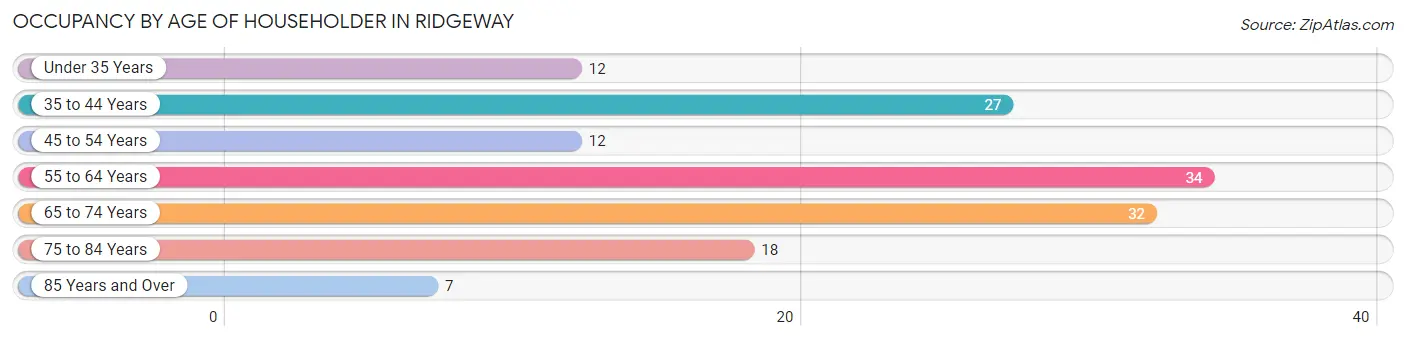
| Age Bracket | # Households | % Households |
| Under 35 Years | 12 | 8.5% |
| 35 to 44 Years | 27 | 19.0% |
| 45 to 54 Years | 12 | 8.5% |
| 55 to 64 Years | 34 | 23.9% |
| 65 to 74 Years | 32 | 22.5% |
| 75 to 84 Years | 18 | 12.7% |
| 85 Years and Over | 7 | 4.9% |
| Total | 142 | 100.0% |
Housing Finances in Ridgeway
Median Income by Occupancy in Ridgeway
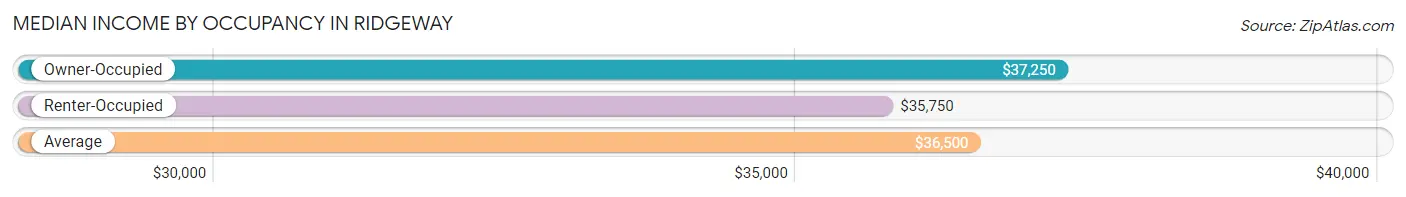
| Occupancy Type | # Households | Median Income |
| Owner-Occupied | 99 (69.7%) | $37,250 |
| Renter-Occupied | 43 (30.3%) | $35,750 |
| Average | 142 (100.0%) | $36,500 |
Occupancy by Householder Income Bracket in Ridgeway
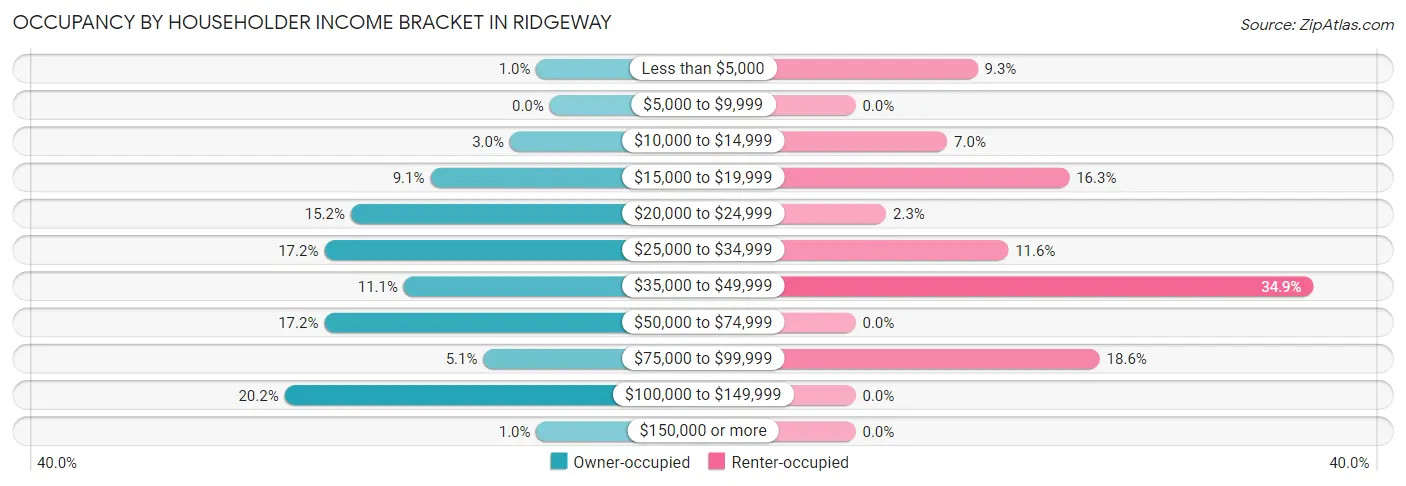
| Income Bracket | Owner-occupied | Renter-occupied |
| Less than $5,000 | 1 (1.0%) | 4 (9.3%) |
| $5,000 to $9,999 | 0 (0.0%) | 0 (0.0%) |
| $10,000 to $14,999 | 3 (3.0%) | 3 (7.0%) |
| $15,000 to $19,999 | 9 (9.1%) | 7 (16.3%) |
| $20,000 to $24,999 | 15 (15.1%) | 1 (2.3%) |
| $25,000 to $34,999 | 17 (17.2%) | 5 (11.6%) |
| $35,000 to $49,999 | 11 (11.1%) | 15 (34.9%) |
| $50,000 to $74,999 | 17 (17.2%) | 0 (0.0%) |
| $75,000 to $99,999 | 5 (5.1%) | 8 (18.6%) |
| $100,000 to $149,999 | 20 (20.2%) | 0 (0.0%) |
| $150,000 or more | 1 (1.0%) | 0 (0.0%) |
| Total | 99 (100.0%) | 43 (100.0%) |
Monthly Housing Cost Tiers in Ridgeway
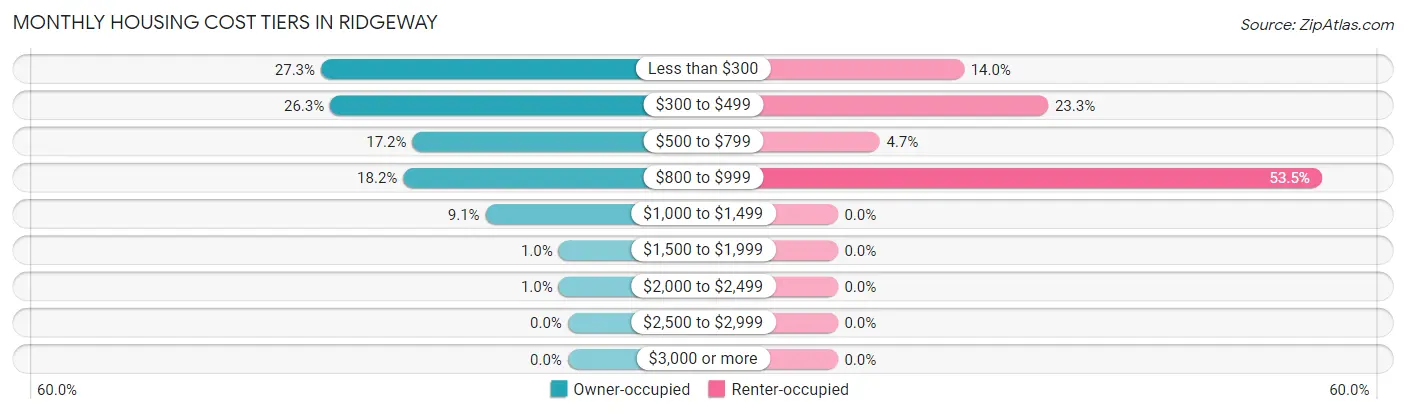
| Monthly Cost | Owner-occupied | Renter-occupied |
| Less than $300 | 27 (27.3%) | 6 (14.0%) |
| $300 to $499 | 26 (26.3%) | 10 (23.3%) |
| $500 to $799 | 17 (17.2%) | 2 (4.6%) |
| $800 to $999 | 18 (18.2%) | 23 (53.5%) |
| $1,000 to $1,499 | 9 (9.1%) | 0 (0.0%) |
| $1,500 to $1,999 | 1 (1.0%) | 0 (0.0%) |
| $2,000 to $2,499 | 1 (1.0%) | 0 (0.0%) |
| $2,500 to $2,999 | 0 (0.0%) | 0 (0.0%) |
| $3,000 or more | 0 (0.0%) | 0 (0.0%) |
| Total | 99 (100.0%) | 43 (100.0%) |
Physical Housing Characteristics in Ridgeway
Housing Structures in Ridgeway
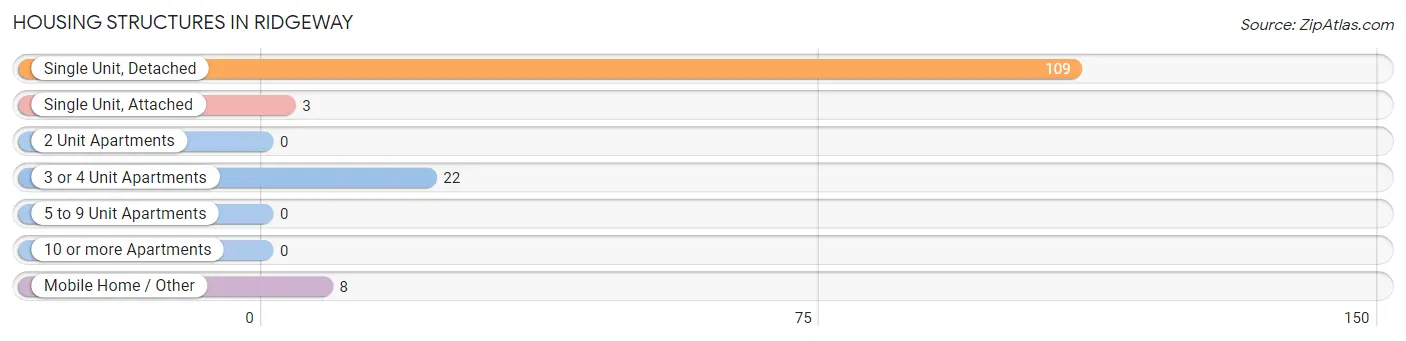
| Structure Type | # Housing Units | % Housing Units |
| Single Unit, Detached | 109 | 76.8% |
| Single Unit, Attached | 3 | 2.1% |
| 2 Unit Apartments | 0 | 0.0% |
| 3 or 4 Unit Apartments | 22 | 15.5% |
| 5 to 9 Unit Apartments | 0 | 0.0% |
| 10 or more Apartments | 0 | 0.0% |
| Mobile Home / Other | 8 | 5.6% |
| Total | 142 | 100.0% |
Housing Structures by Occupancy in Ridgeway
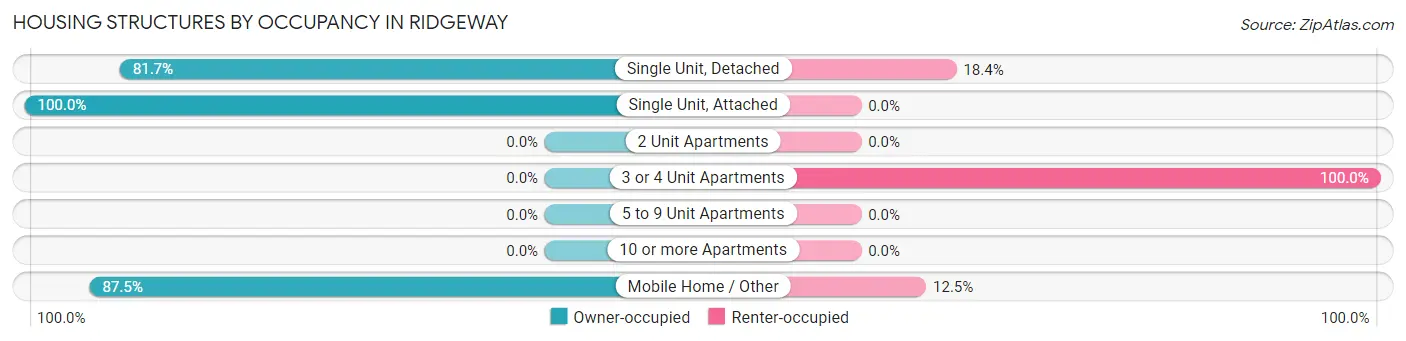
| Structure Type | Owner-occupied | Renter-occupied |
| Single Unit, Detached | 89 (81.7%) | 20 (18.3%) |
| Single Unit, Attached | 3 (100.0%) | 0 (0.0%) |
| 2 Unit Apartments | 0 (0.0%) | 0 (0.0%) |
| 3 or 4 Unit Apartments | 0 (0.0%) | 22 (100.0%) |
| 5 to 9 Unit Apartments | 0 (0.0%) | 0 (0.0%) |
| 10 or more Apartments | 0 (0.0%) | 0 (0.0%) |
| Mobile Home / Other | 7 (87.5%) | 1 (12.5%) |
| Total | 99 (69.7%) | 43 (30.3%) |
Housing Structures by Number of Rooms in Ridgeway
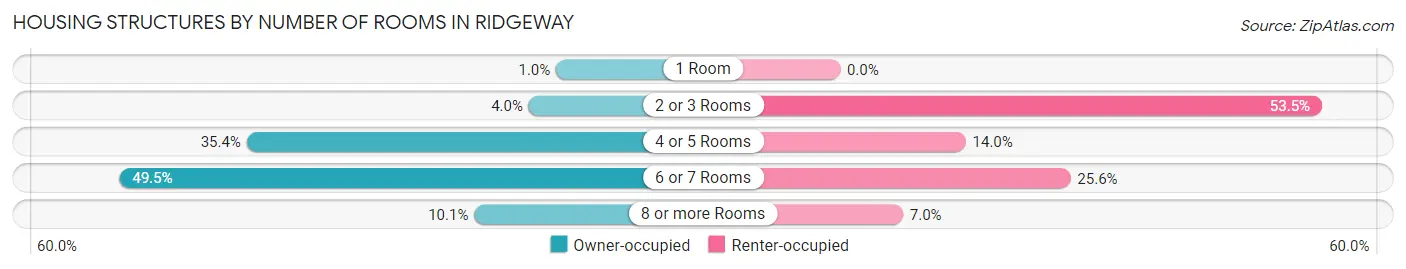
| Number of Rooms | Owner-occupied | Renter-occupied |
| 1 Room | 1 (1.0%) | 0 (0.0%) |
| 2 or 3 Rooms | 4 (4.0%) | 23 (53.5%) |
| 4 or 5 Rooms | 35 (35.3%) | 6 (14.0%) |
| 6 or 7 Rooms | 49 (49.5%) | 11 (25.6%) |
| 8 or more Rooms | 10 (10.1%) | 3 (7.0%) |
| Total | 99 (100.0%) | 43 (100.0%) |
Housing Structure by Heating Type in Ridgeway
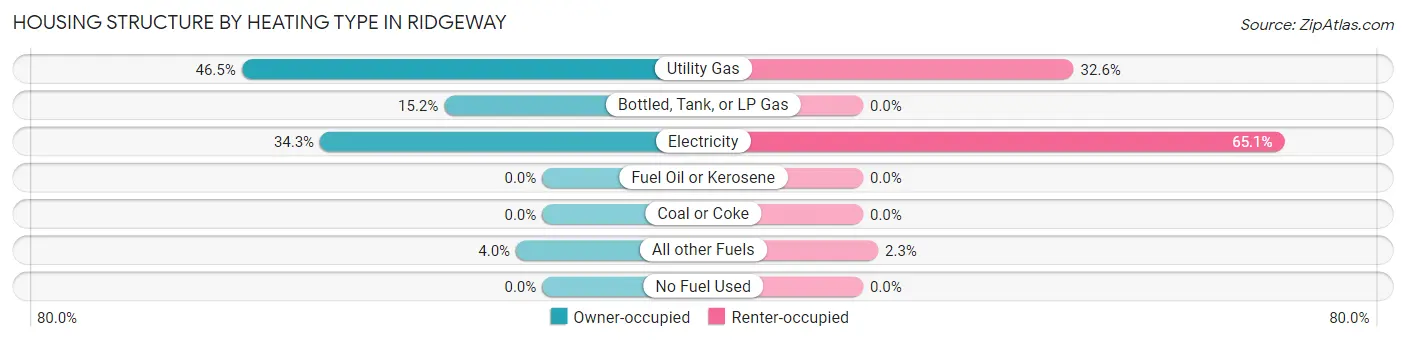
| Heating Type | Owner-occupied | Renter-occupied |
| Utility Gas | 46 (46.5%) | 14 (32.6%) |
| Bottled, Tank, or LP Gas | 15 (15.1%) | 0 (0.0%) |
| Electricity | 34 (34.3%) | 28 (65.1%) |
| Fuel Oil or Kerosene | 0 (0.0%) | 0 (0.0%) |
| Coal or Coke | 0 (0.0%) | 0 (0.0%) |
| All other Fuels | 4 (4.0%) | 1 (2.3%) |
| No Fuel Used | 0 (0.0%) | 0 (0.0%) |
| Total | 99 (100.0%) | 43 (100.0%) |
Household Vehicle Usage in Ridgeway
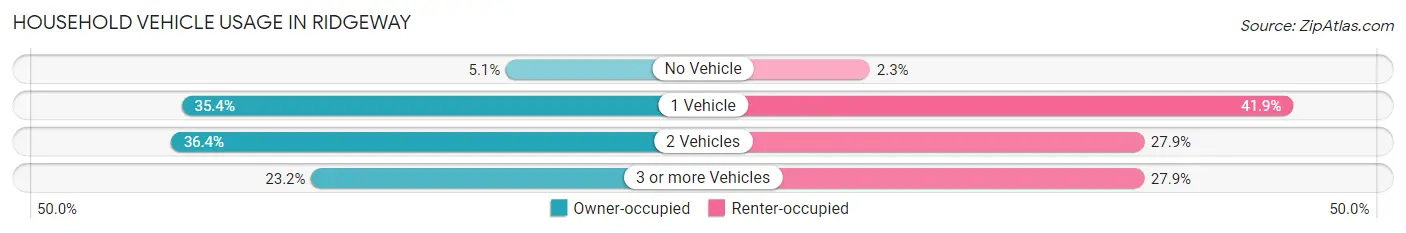
| Vehicles per Household | Owner-occupied | Renter-occupied |
| No Vehicle | 5 (5.1%) | 1 (2.3%) |
| 1 Vehicle | 35 (35.3%) | 18 (41.9%) |
| 2 Vehicles | 36 (36.4%) | 12 (27.9%) |
| 3 or more Vehicles | 23 (23.2%) | 12 (27.9%) |
| Total | 99 (100.0%) | 43 (100.0%) |
Real Estate & Mortgages in Ridgeway
Real Estate and Mortgage Overview in Ridgeway
| Characteristic | Without Mortgage | With Mortgage |
| Housing Units | 60 | 39 |
| Median Property Value | $48,000 | $95,600 |
| Median Household Income | $26,250 | $1 |
| Monthly Housing Costs | $330 | $0 |
| Real Estate Taxes | $536 | $0 |
Property Value by Mortgage Status in Ridgeway
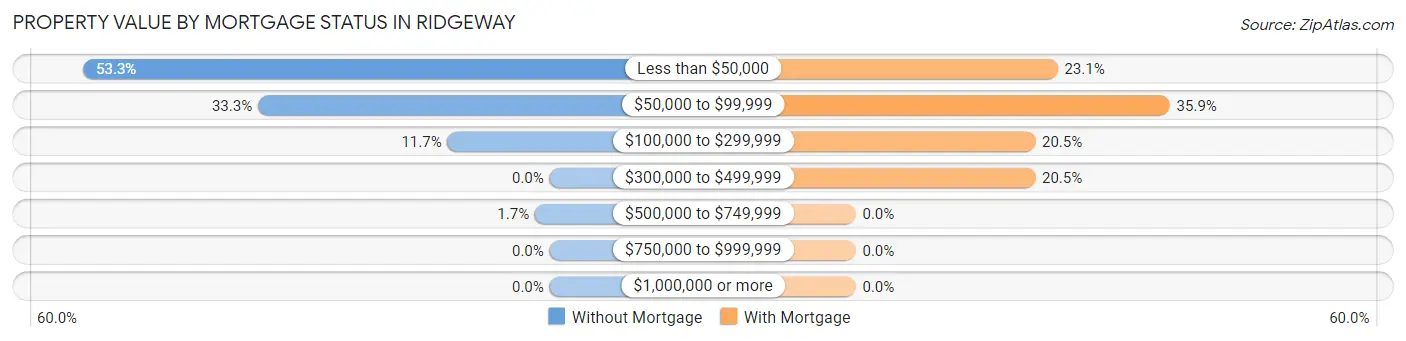
| Property Value | Without Mortgage | With Mortgage |
| Less than $50,000 | 32 (53.3%) | 9 (23.1%) |
| $50,000 to $99,999 | 20 (33.3%) | 14 (35.9%) |
| $100,000 to $299,999 | 7 (11.7%) | 8 (20.5%) |
| $300,000 to $499,999 | 0 (0.0%) | 8 (20.5%) |
| $500,000 to $749,999 | 1 (1.7%) | 0 (0.0%) |
| $750,000 to $999,999 | 0 (0.0%) | 0 (0.0%) |
| $1,000,000 or more | 0 (0.0%) | 0 (0.0%) |
| Total | 60 (100.0%) | 39 (100.0%) |
Household Income by Mortgage Status in Ridgeway
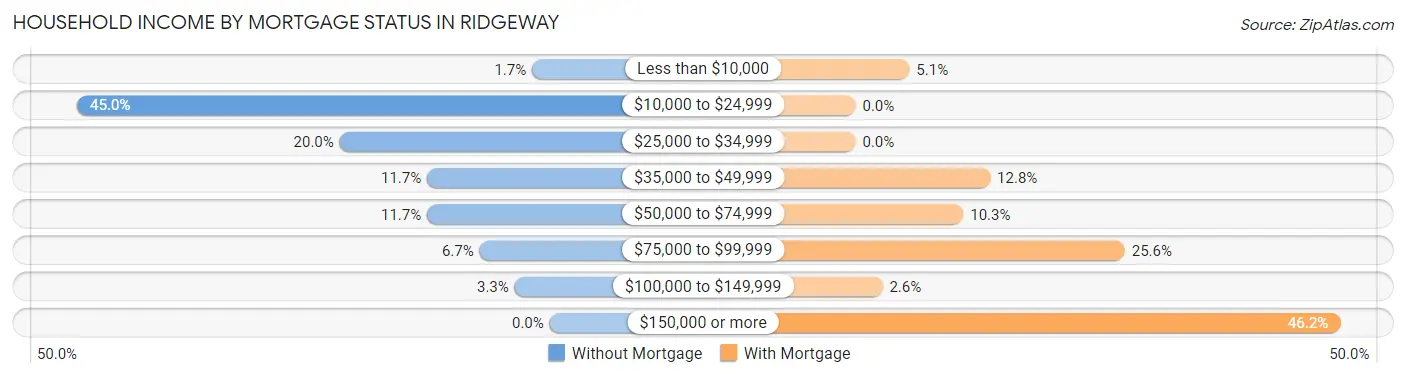
| Household Income | Without Mortgage | With Mortgage |
| Less than $10,000 | 1 (1.7%) | 2 (5.1%) |
| $10,000 to $24,999 | 27 (45.0%) | 0 (0.0%) |
| $25,000 to $34,999 | 12 (20.0%) | 0 (0.0%) |
| $35,000 to $49,999 | 7 (11.7%) | 5 (12.8%) |
| $50,000 to $74,999 | 7 (11.7%) | 4 (10.3%) |
| $75,000 to $99,999 | 4 (6.7%) | 10 (25.6%) |
| $100,000 to $149,999 | 2 (3.3%) | 1 (2.6%) |
| $150,000 or more | 0 (0.0%) | 18 (46.2%) |
| Total | 60 (100.0%) | 39 (100.0%) |
Property Value to Household Income Ratio in Ridgeway
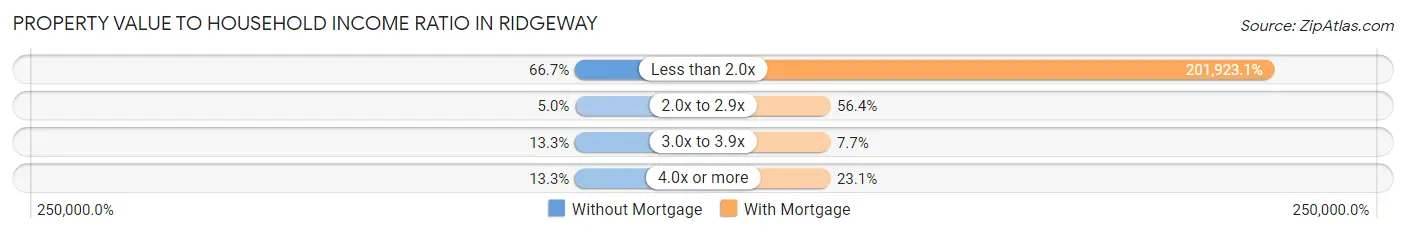
| Value-to-Income Ratio | Without Mortgage | With Mortgage |
| Less than 2.0x | 40 (66.7%) | 78,750 (201,923.1%) |
| 2.0x to 2.9x | 3 (5.0%) | 22 (56.4%) |
| 3.0x to 3.9x | 8 (13.3%) | 3 (7.7%) |
| 4.0x or more | 8 (13.3%) | 9 (23.1%) |
| Total | 60 (100.0%) | 39 (100.0%) |
Real Estate Taxes by Mortgage Status in Ridgeway
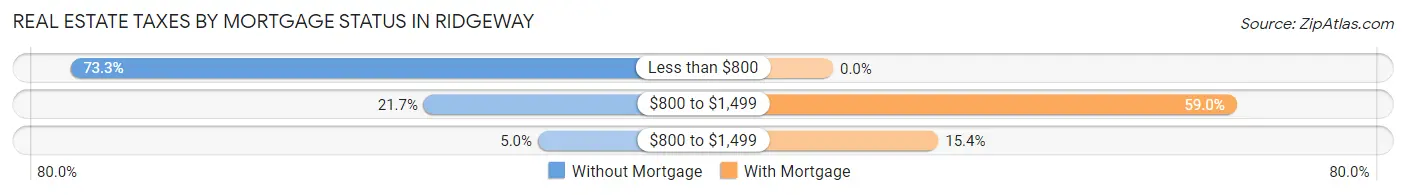
| Property Taxes | Without Mortgage | With Mortgage |
| Less than $800 | 44 (73.3%) | 0 (0.0%) |
| $800 to $1,499 | 13 (21.7%) | 23 (59.0%) |
| $800 to $1,499 | 3 (5.0%) | 6 (15.4%) |
| Total | 60 (100.0%) | 39 (100.0%) |
Health & Disability in Ridgeway
Health Insurance Coverage by Age in Ridgeway
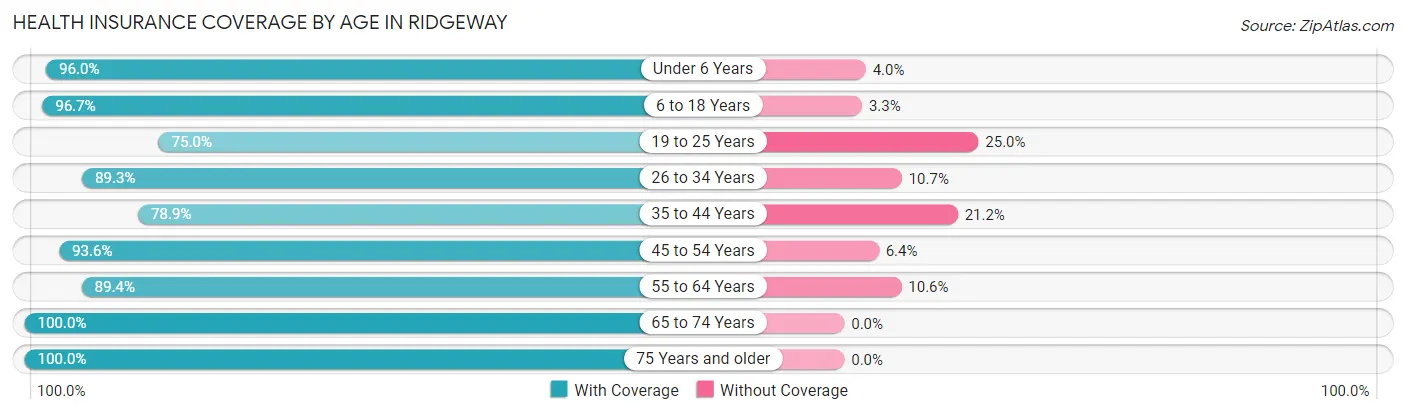
| Age Bracket | With Coverage | Without Coverage |
| Under 6 Years | 24 (96.0%) | 1 (4.0%) |
| 6 to 18 Years | 88 (96.7%) | 3 (3.3%) |
| 19 to 25 Years | 18 (75.0%) | 6 (25.0%) |
| 26 to 34 Years | 75 (89.3%) | 9 (10.7%) |
| 35 to 44 Years | 41 (78.8%) | 11 (21.1%) |
| 45 to 54 Years | 102 (93.6%) | 7 (6.4%) |
| 55 to 64 Years | 42 (89.4%) | 5 (10.6%) |
| 65 to 74 Years | 45 (100.0%) | 0 (0.0%) |
| 75 Years and older | 39 (100.0%) | 0 (0.0%) |
| Total | 474 (91.9%) | 42 (8.1%) |
Health Insurance Coverage by Citizenship Status in Ridgeway
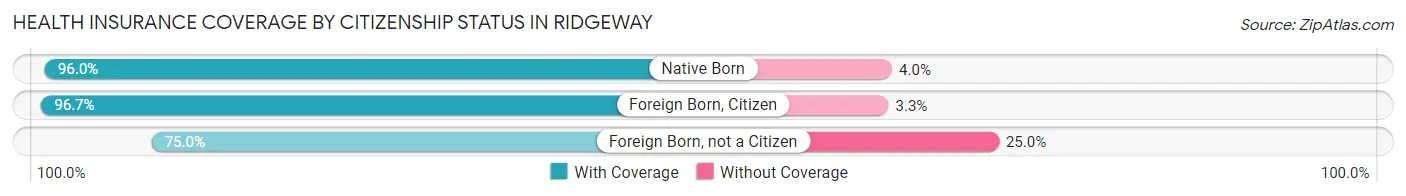
| Citizenship Status | With Coverage | Without Coverage |
| Native Born | 24 (96.0%) | 1 (4.0%) |
| Foreign Born, Citizen | 88 (96.7%) | 3 (3.3%) |
| Foreign Born, not a Citizen | 18 (75.0%) | 6 (25.0%) |
Health Insurance Coverage by Household Income in Ridgeway
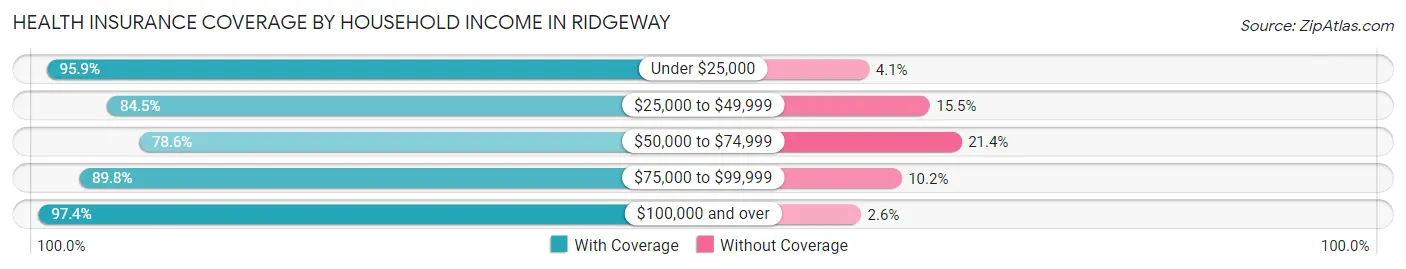
| Household Income | With Coverage | Without Coverage |
| Under $25,000 | 116 (95.9%) | 5 (4.1%) |
| $25,000 to $49,999 | 82 (84.5%) | 15 (15.5%) |
| $50,000 to $74,999 | 44 (78.6%) | 12 (21.4%) |
| $75,000 to $99,999 | 44 (89.8%) | 5 (10.2%) |
| $100,000 and over | 188 (97.4%) | 5 (2.6%) |
Public vs Private Health Insurance Coverage by Age in Ridgeway
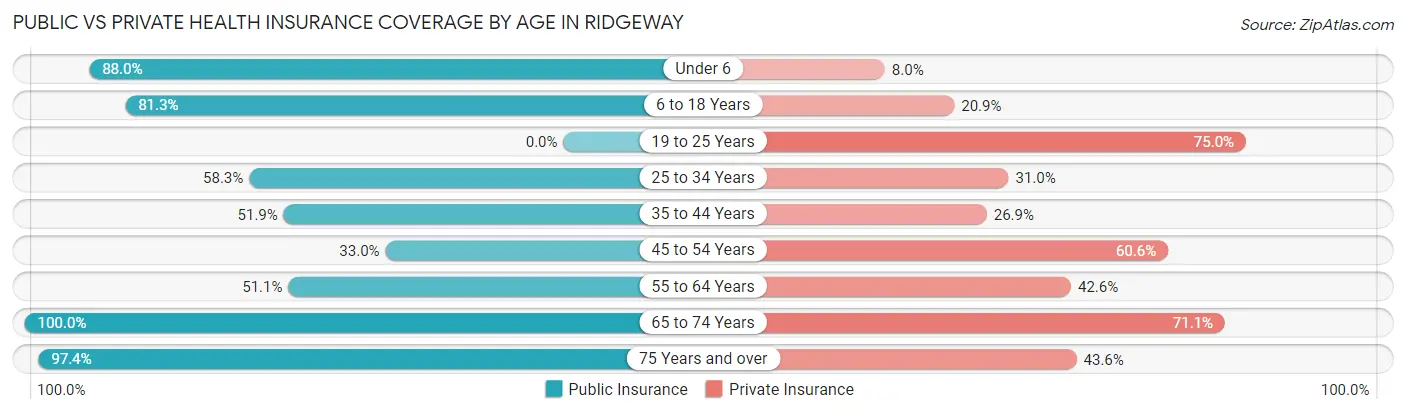
| Age Bracket | Public Insurance | Private Insurance |
| Under 6 | 22 (88.0%) | 2 (8.0%) |
| 6 to 18 Years | 74 (81.3%) | 19 (20.9%) |
| 19 to 25 Years | 0 (0.0%) | 18 (75.0%) |
| 25 to 34 Years | 49 (58.3%) | 26 (30.9%) |
| 35 to 44 Years | 27 (51.9%) | 14 (26.9%) |
| 45 to 54 Years | 36 (33.0%) | 66 (60.6%) |
| 55 to 64 Years | 24 (51.1%) | 20 (42.5%) |
| 65 to 74 Years | 45 (100.0%) | 32 (71.1%) |
| 75 Years and over | 38 (97.4%) | 17 (43.6%) |
| Total | 315 (61.1%) | 214 (41.5%) |
Disability Status by Sex by Age in Ridgeway
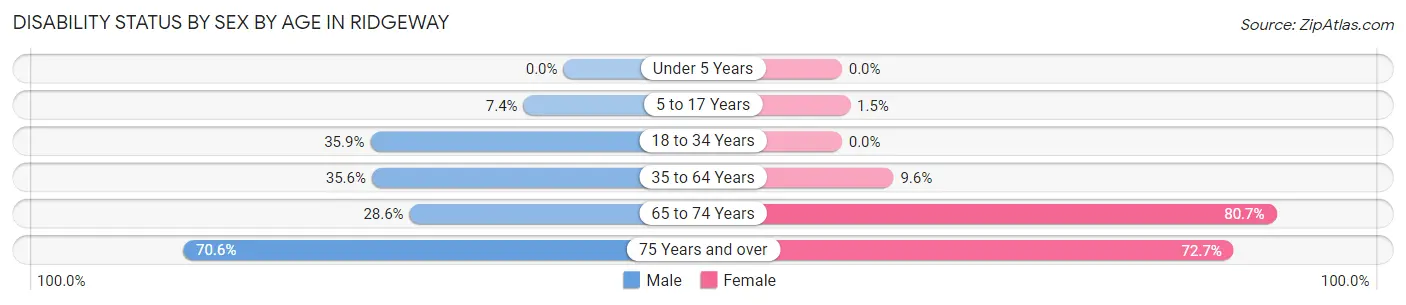
| Age Bracket | Male | Female |
| Under 5 Years | 0 (0.0%) | 0 (0.0%) |
| 5 to 17 Years | 2 (7.4%) | 1 (1.5%) |
| 18 to 34 Years | 19 (35.8%) | 0 (0.0%) |
| 35 to 64 Years | 48 (35.6%) | 7 (9.6%) |
| 65 to 74 Years | 4 (28.6%) | 25 (80.6%) |
| 75 Years and over | 12 (70.6%) | 16 (72.7%) |
Disability Class by Sex by Age in Ridgeway
Disability Class: Hearing Difficulty
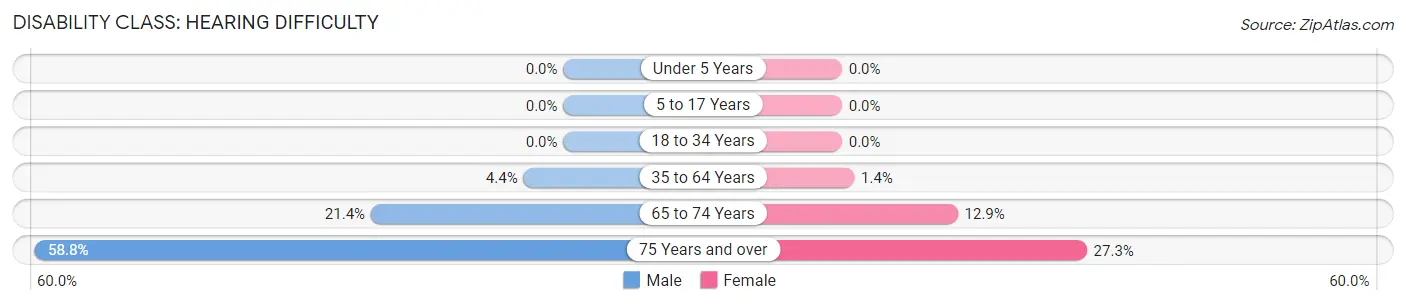
| Age Bracket | Male | Female |
| Under 5 Years | 0 (0.0%) | 0 (0.0%) |
| 5 to 17 Years | 0 (0.0%) | 0 (0.0%) |
| 18 to 34 Years | 0 (0.0%) | 0 (0.0%) |
| 35 to 64 Years | 6 (4.4%) | 1 (1.4%) |
| 65 to 74 Years | 3 (21.4%) | 4 (12.9%) |
| 75 Years and over | 10 (58.8%) | 6 (27.3%) |
Disability Class: Vision Difficulty
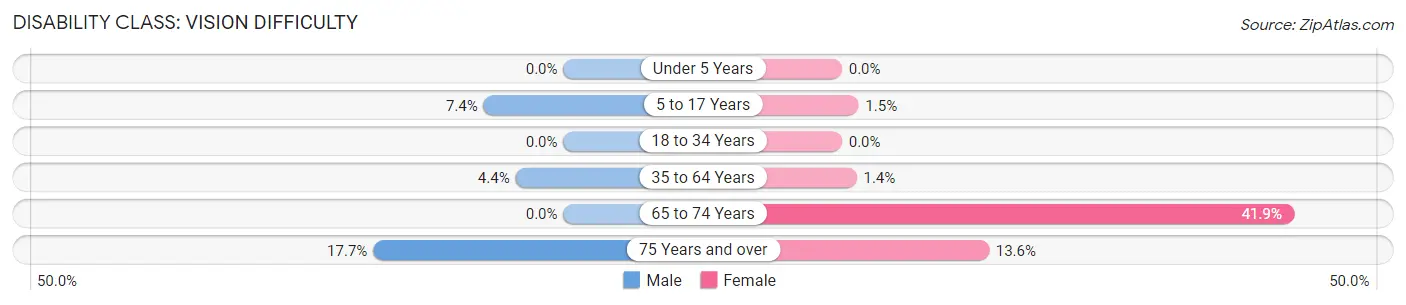
| Age Bracket | Male | Female |
| Under 5 Years | 0 (0.0%) | 0 (0.0%) |
| 5 to 17 Years | 2 (7.4%) | 1 (1.5%) |
| 18 to 34 Years | 0 (0.0%) | 0 (0.0%) |
| 35 to 64 Years | 6 (4.4%) | 1 (1.4%) |
| 65 to 74 Years | 0 (0.0%) | 13 (41.9%) |
| 75 Years and over | 3 (17.6%) | 3 (13.6%) |
Disability Class: Cognitive Difficulty
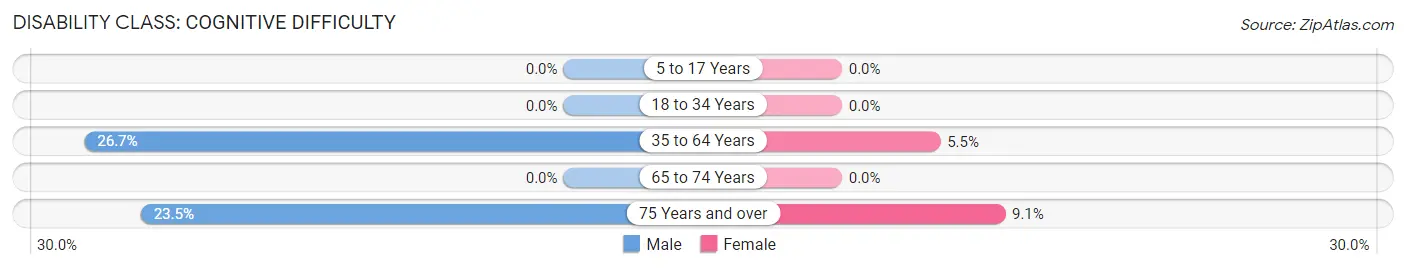
| Age Bracket | Male | Female |
| 5 to 17 Years | 0 (0.0%) | 0 (0.0%) |
| 18 to 34 Years | 0 (0.0%) | 0 (0.0%) |
| 35 to 64 Years | 36 (26.7%) | 4 (5.5%) |
| 65 to 74 Years | 0 (0.0%) | 0 (0.0%) |
| 75 Years and over | 4 (23.5%) | 2 (9.1%) |
Disability Class: Ambulatory Difficulty
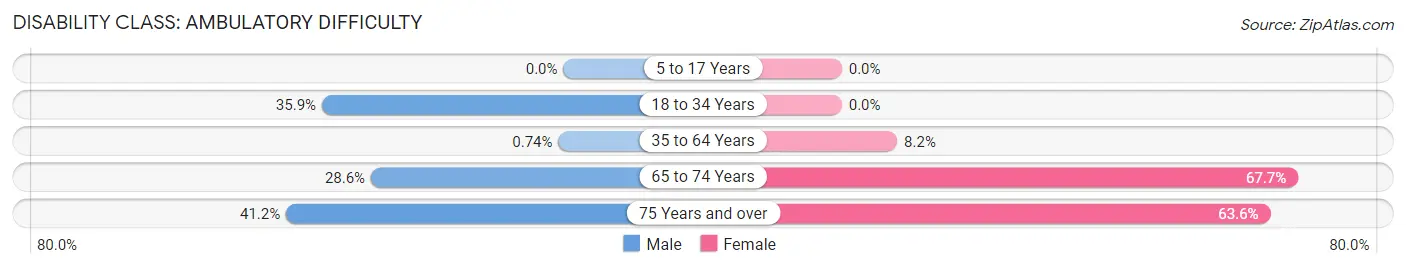
| Age Bracket | Male | Female |
| 5 to 17 Years | 0 (0.0%) | 0 (0.0%) |
| 18 to 34 Years | 19 (35.8%) | 0 (0.0%) |
| 35 to 64 Years | 1 (0.7%) | 6 (8.2%) |
| 65 to 74 Years | 4 (28.6%) | 21 (67.7%) |
| 75 Years and over | 7 (41.2%) | 14 (63.6%) |
Disability Class: Self-Care Difficulty
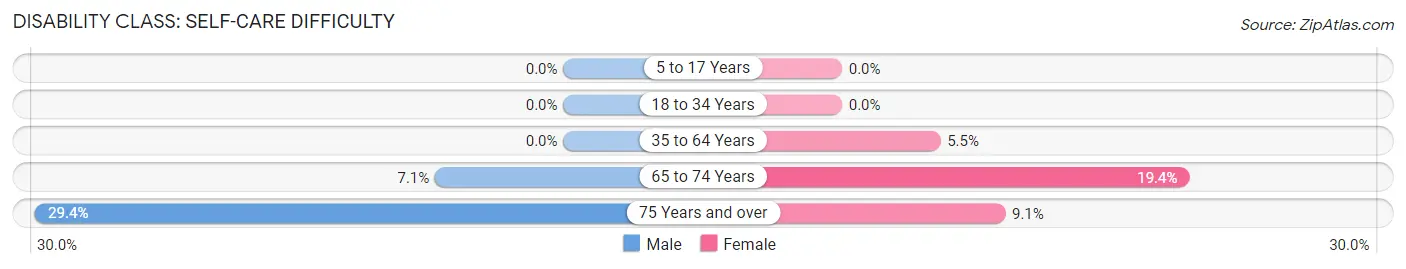
| Age Bracket | Male | Female |
| 5 to 17 Years | 0 (0.0%) | 0 (0.0%) |
| 18 to 34 Years | 0 (0.0%) | 0 (0.0%) |
| 35 to 64 Years | 0 (0.0%) | 4 (5.5%) |
| 65 to 74 Years | 1 (7.1%) | 6 (19.4%) |
| 75 Years and over | 5 (29.4%) | 2 (9.1%) |
Technology Access in Ridgeway
Computing Device Access in Ridgeway
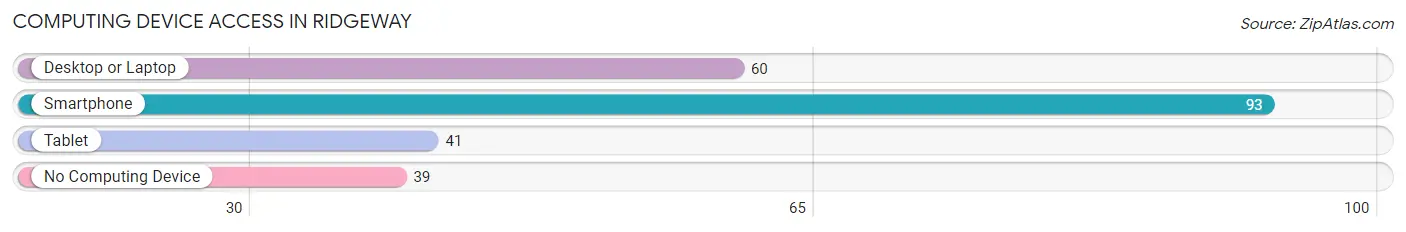
| Device Type | # Households | % Households |
| Desktop or Laptop | 60 | 42.2% |
| Smartphone | 93 | 65.5% |
| Tablet | 41 | 28.9% |
| No Computing Device | 39 | 27.5% |
| Total | 142 | 100.0% |
Internet Access in Ridgeway
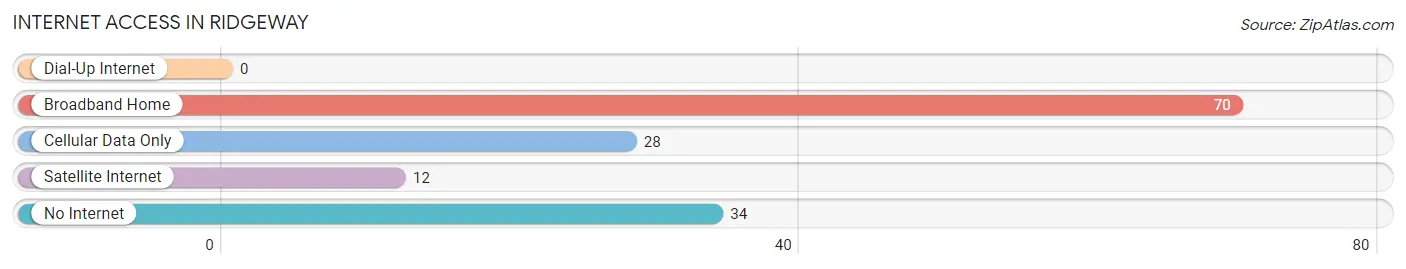
| Internet Type | # Households | % Households |
| Dial-Up Internet | 0 | 0.0% |
| Broadband Home | 70 | 49.3% |
| Cellular Data Only | 28 | 19.7% |
| Satellite Internet | 12 | 8.5% |
| No Internet | 34 | 23.9% |
| Total | 142 | 100.0% |
Ridgeway Summary
Ridgeway is a small town located in the state of Missouri, in the United States. It is situated in the northwest corner of the state, in the Ozark Mountains. The town has a population of just over 500 people, and is part of the larger Ozark region.
History
Ridgeway was founded in 1883 by a group of settlers from the nearby town of Ozark. The town was named after the nearby ridge, which was used as a landmark for the settlers. The town was originally a farming community, and the main crops grown were corn, wheat, and oats. The town also had a small sawmill, which provided lumber for the local area.
In the early 1900s, the town began to grow and develop. A post office was established in 1906, and a school was built in 1908. The town also had a general store, a blacksmith shop, and a few other businesses.
In the 1920s, the town began to decline. The sawmill closed, and the population began to decline. The town was nearly abandoned by the 1940s, but a few families remained.
In the 1950s, the town began to experience a revival. The population began to grow, and new businesses opened. The town also began to attract tourists, as the nearby Ozark Mountains became a popular destination for outdoor recreation.
Geography
Ridgeway is located in the Ozark Mountains, in the northwest corner of Missouri. The town is situated in a valley, surrounded by hills and mountains. The town is located near the Mark Twain National Forest, which provides a variety of outdoor activities.
The town is located near several rivers, including the White River, the Big Piney River, and the Gasconade River. The town is also located near several lakes, including Table Rock Lake, Bull Shoals Lake, and Lake Taneycomo.
Economy
The economy of Ridgeway is largely based on tourism. The town is a popular destination for outdoor recreation, and the nearby Ozark Mountains provide a variety of activities. The town also has several restaurants, shops, and other businesses that cater to tourists.
The town also has a few small businesses, including a general store, a hardware store, and a few other shops. The town also has a few small manufacturing businesses, which produce a variety of products.
Demographics
As of the 2010 census, the population of Ridgeway was 514. The town has a median age of 44.7 years, and the median household income is $37,500. The town is predominantly white, with 95.3% of the population identifying as white. The town also has a small Hispanic population, with 2.7% of the population identifying as Hispanic or Latino.
Conclusion
Ridgeway is a small town located in the Ozark Mountains of Missouri. The town has a population of just over 500 people, and is a popular destination for outdoor recreation. The town has a largely white population, and the median household income is $37,500. The town is also home to several small businesses, which provide a variety of products and services.
Common Questions
What is Per Capita Income in Ridgeway?
Per Capita income in Ridgeway is $22,827.
What is the Median Family Income in Ridgeway?
Median Family Income in Ridgeway is $47,188.
What is the Median Household income in Ridgeway?
Median Household Income in Ridgeway is $36,500.
What is Income or Wage Gap in Ridgeway?
Income or Wage Gap in Ridgeway is 48.6%.
Women in Ridgeway earn 51.4 cents for every dollar earned by a man.
What is Family Income Deficit in Ridgeway?
Family Income Deficit in Ridgeway is $11,371.
Families that are below poverty line in Ridgeway earn $11,371 less on average than the poverty threshold level.
What is Inequality or Gini Index in Ridgeway?
Inequality or Gini Index in Ridgeway is 0.39.
What is the Total Population of Ridgeway?
Total Population of Ridgeway is 516.
What is the Total Male Population of Ridgeway?
Total Male Population of Ridgeway is 248.
What is the Total Female Population of Ridgeway?
Total Female Population of Ridgeway is 268.
What is the Ratio of Males per 100 Females in Ridgeway?
There are 92.54 Males per 100 Females in Ridgeway.
What is the Ratio of Females per 100 Males in Ridgeway?
There are 108.06 Females per 100 Males in Ridgeway.
What is the Median Population Age in Ridgeway?
Median Population Age in Ridgeway is 42.0 Years.
What is the Average Family Size in Ridgeway
Average Family Size in Ridgeway is 5.8 People.
What is the Average Household Size in Ridgeway
Average Household Size in Ridgeway is 3.6 People.
How Large is the Labor Force in Ridgeway?
There are 168 People in the Labor Forcein in Ridgeway.
What is the Percentage of People in the Labor Force in Ridgeway?
40.2% of People are in the Labor Force in Ridgeway.
What is the Unemployment Rate in Ridgeway?
Unemployment Rate in Ridgeway is 11.3%.