Portageville, MO Map & Demographics
Portageville Map
Portageville Overview
$27,524
PER CAPITA INCOME
$42,008
AVG FAMILY INCOME
$34,105
AVG HOUSEHOLD INCOME
26.0%
WAGE / INCOME GAP [ % ]
74.0¢/ $1
WAGE / INCOME GAP [ $ ]
$11,336
FAMILY INCOME DEFICIT
0.55
INEQUALITY / GINI INDEX
2,918
TOTAL POPULATION
1,333
MALE POPULATION
1,585
FEMALE POPULATION
84.10
MALES / 100 FEMALES
118.90
FEMALES / 100 MALES
43.4
MEDIAN AGE
2.8
AVG FAMILY SIZE
2.2
AVG HOUSEHOLD SIZE
1,323
LABOR FORCE [ PEOPLE ]
55.5%
PERCENT IN LABOR FORCE
4.5%
UNEMPLOYMENT RATE
Portageville Zip Codes
Portageville Area Codes
Income in Portageville
Income Overview in Portageville
Per Capita Income in Portageville is $27,524, while median incomes of families and households are $42,008 and $34,105 respectively.
| Characteristic | Number | Measure |
| Per Capita Income | 2,918 | $27,524 |
| Median Family Income | 809 | $42,008 |
| Mean Family Income | 809 | $77,153 |
| Median Household Income | 1,320 | $34,105 |
| Mean Household Income | 1,320 | $60,280 |
| Income Deficit | 809 | $11,336 |
| Wage / Income Gap (%) | 2,918 | 25.99% |
| Wage / Income Gap ($) | 2,918 | 74.01¢ per $1 |
| Gini / Inequality Index | 2,918 | 0.55 |
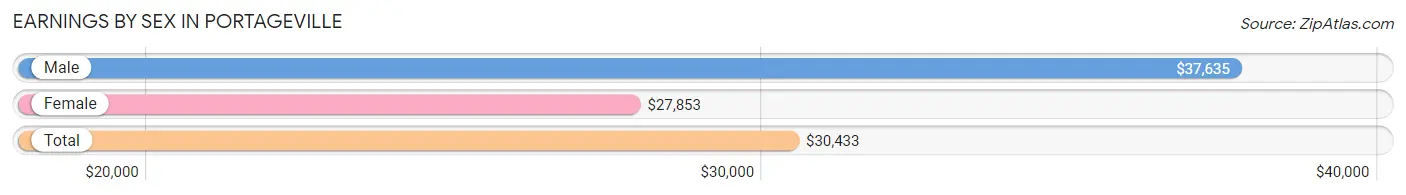
Earnings by Sex in Portageville
Average Earnings in Portageville are $30,433, $37,635 for men and $27,853 for women, a difference of 26.0%.
| Sex | Number | Average Earnings |
| Male | 698 (47.4%) | $37,635 |
| Female | 775 (52.6%) | $27,853 |
| Total | 1,473 (100.0%) | $30,433 |
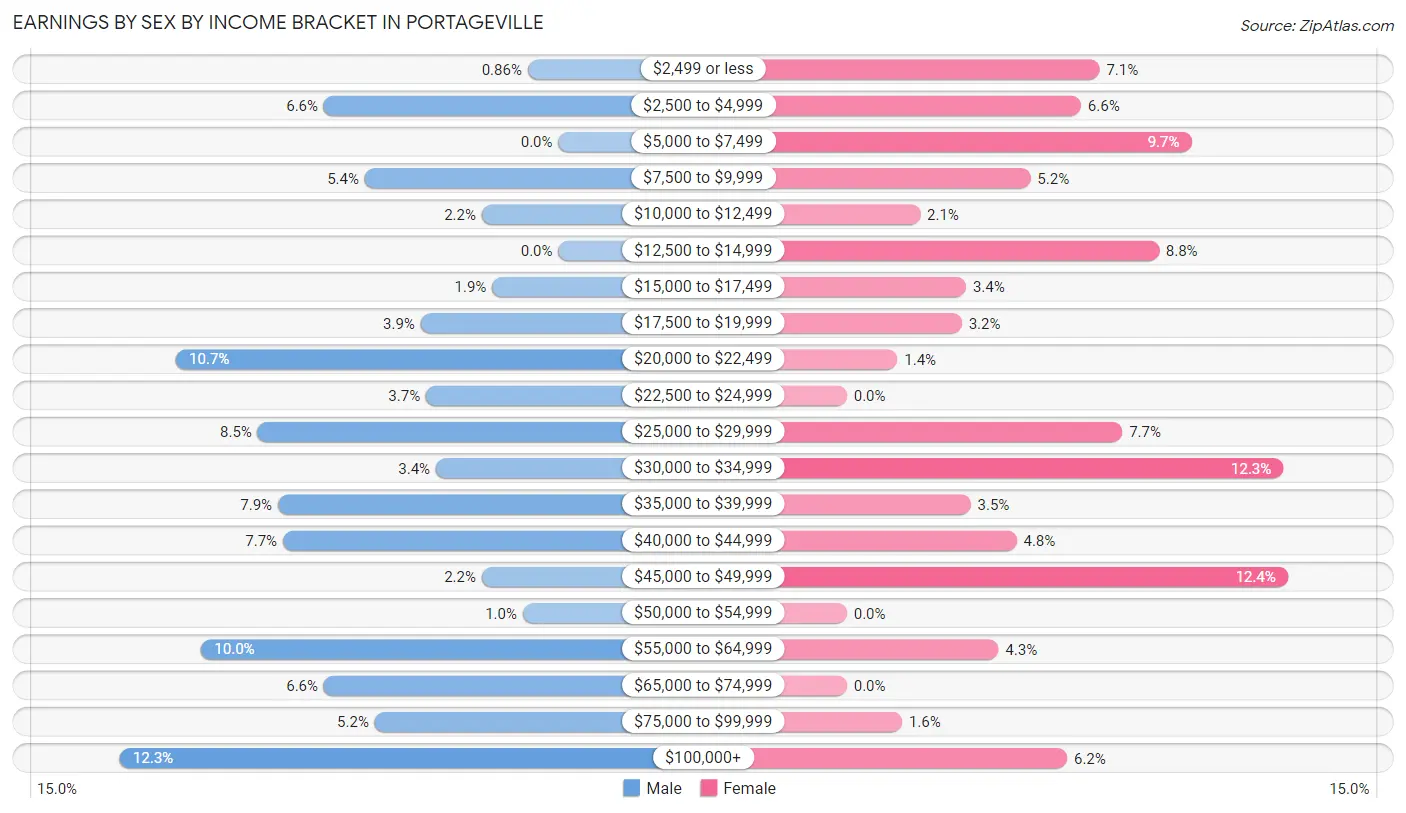
Earnings by Sex by Income Bracket in Portageville
The most common earnings brackets in Portageville are $100,000+ for men (86 | 12.3%) and $45,000 to $49,999 for women (96 | 12.4%).
| Income | Male | Female |
| $2,499 or less | 6 (0.9%) | 55 (7.1%) |
| $2,500 to $4,999 | 46 (6.6%) | 51 (6.6%) |
| $5,000 to $7,499 | 0 (0.0%) | 75 (9.7%) |
| $7,500 to $9,999 | 38 (5.4%) | 40 (5.2%) |
| $10,000 to $12,499 | 15 (2.1%) | 16 (2.1%) |
| $12,500 to $14,999 | 0 (0.0%) | 68 (8.8%) |
| $15,000 to $17,499 | 13 (1.9%) | 26 (3.4%) |
| $17,500 to $19,999 | 27 (3.9%) | 25 (3.2%) |
| $20,000 to $22,499 | 75 (10.7%) | 11 (1.4%) |
| $22,500 to $24,999 | 26 (3.7%) | 0 (0.0%) |
| $25,000 to $29,999 | 59 (8.5%) | 60 (7.7%) |
| $30,000 to $34,999 | 24 (3.4%) | 95 (12.3%) |
| $35,000 to $39,999 | 55 (7.9%) | 27 (3.5%) |
| $40,000 to $44,999 | 54 (7.7%) | 37 (4.8%) |
| $45,000 to $49,999 | 15 (2.1%) | 96 (12.4%) |
| $50,000 to $54,999 | 7 (1.0%) | 0 (0.0%) |
| $55,000 to $64,999 | 70 (10.0%) | 33 (4.3%) |
| $65,000 to $74,999 | 46 (6.6%) | 0 (0.0%) |
| $75,000 to $99,999 | 36 (5.2%) | 12 (1.5%) |
| $100,000+ | 86 (12.3%) | 48 (6.2%) |
| Total | 698 (100.0%) | 775 (100.0%) |
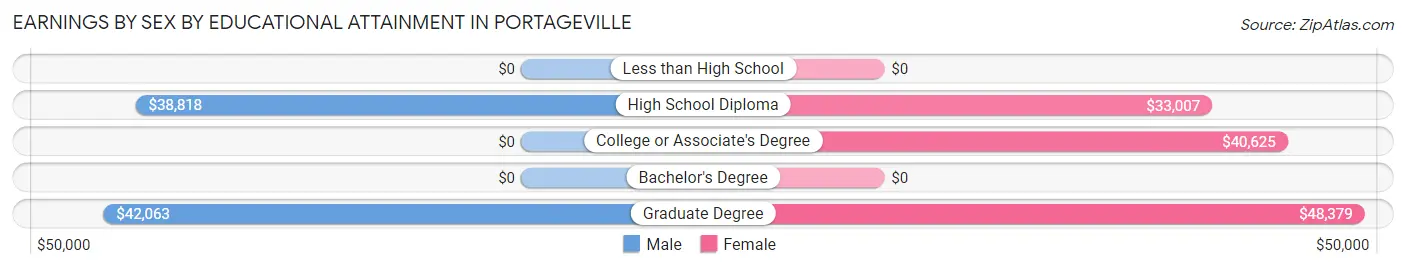
Earnings by Sex by Educational Attainment in Portageville
Average earnings in Portageville are $41,875 for men and $31,827 for women, a difference of 24.0%. Men with an educational attainment of graduate degree enjoy the highest average annual earnings of $42,063, while those with high school diploma education earn the least with $38,818. Women with an educational attainment of graduate degree earn the most with the average annual earnings of $48,379, while those with high school diploma education have the smallest earnings of $33,007.
| Educational Attainment | Male Income | Female Income |
| Less than High School | - | - |
| High School Diploma | $38,818 | $33,007 |
| College or Associate's Degree | - | - |
| Bachelor's Degree | - | - |
| Graduate Degree | $42,063 | $48,379 |
| Total | $41,875 | $31,827 |
Family Income in Portageville
Family Income Brackets in Portageville
According to the Portageville family income data, there are 148 families falling into the $25,000 to $34,999 income range, which is the most common income bracket and makes up 18.3% of all families. Conversely, the $200,000+ income bracket is the least frequent group with only 21 families (2.6%) belonging to this category.
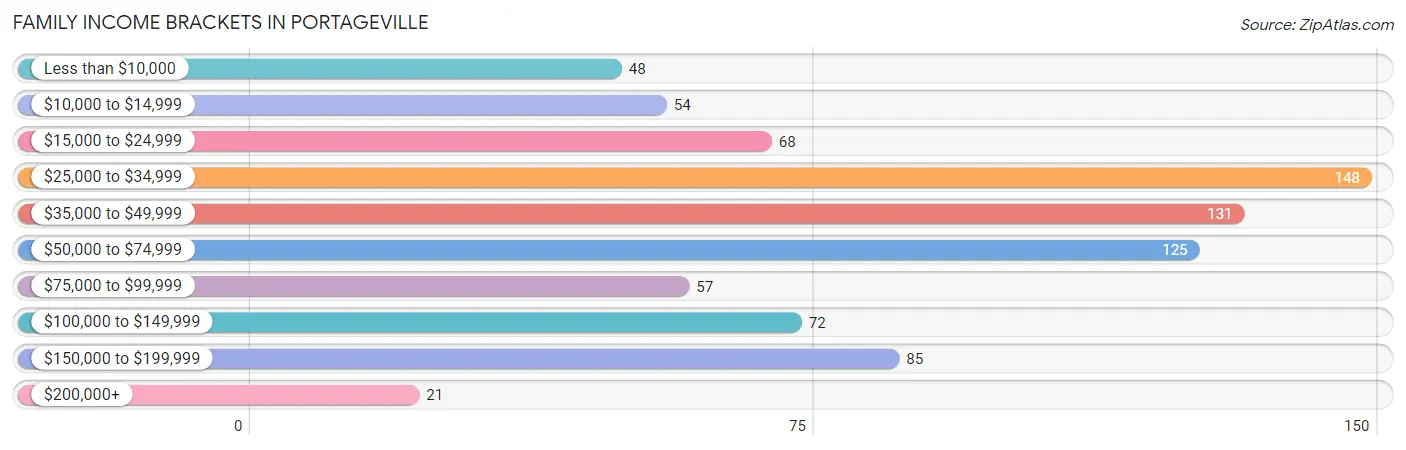
| Income Bracket | # Families | % Families |
| Less than $10,000 | 48 | 5.9% |
| $10,000 to $14,999 | 54 | 6.7% |
| $15,000 to $24,999 | 68 | 8.4% |
| $25,000 to $34,999 | 148 | 18.3% |
| $35,000 to $49,999 | 131 | 16.2% |
| $50,000 to $74,999 | 125 | 15.5% |
| $75,000 to $99,999 | 57 | 7.0% |
| $100,000 to $149,999 | 72 | 8.9% |
| $150,000 to $199,999 | 85 | 10.5% |
| $200,000+ | 21 | 2.6% |
Family Income by Famaliy Size in Portageville
4-person families (234 | 28.9%) account for the highest median family income in Portageville with $120,076 per family, while 4-person families (234 | 28.9%) have the highest median income of $30,019 per family member.
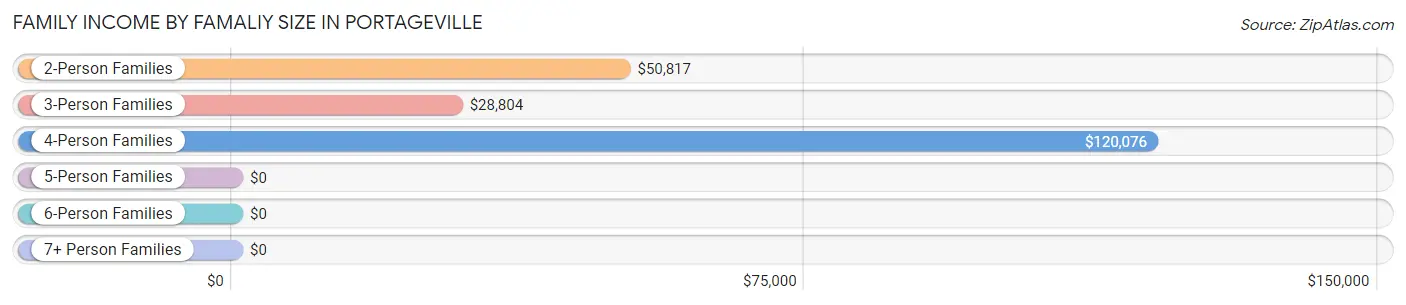
| Income Bracket | # Families | Median Income |
| 2-Person Families | 371 (45.9%) | $50,817 |
| 3-Person Families | 192 (23.7%) | $28,804 |
| 4-Person Families | 234 (28.9%) | $120,076 |
| 5-Person Families | 12 (1.5%) | $0 |
| 6-Person Families | 0 (0.0%) | $0 |
| 7+ Person Families | 0 (0.0%) | $0 |
| Total | 809 (100.0%) | $42,008 |
Family Income by Number of Earners in Portageville
The median family income in Portageville is $42,008, with families comprising 3+ earners (89) having the highest median family income of $176,637, while families with 1 earner (280) have the lowest median family income of $32,531, accounting for 11.0% and 34.6% of families, respectively.
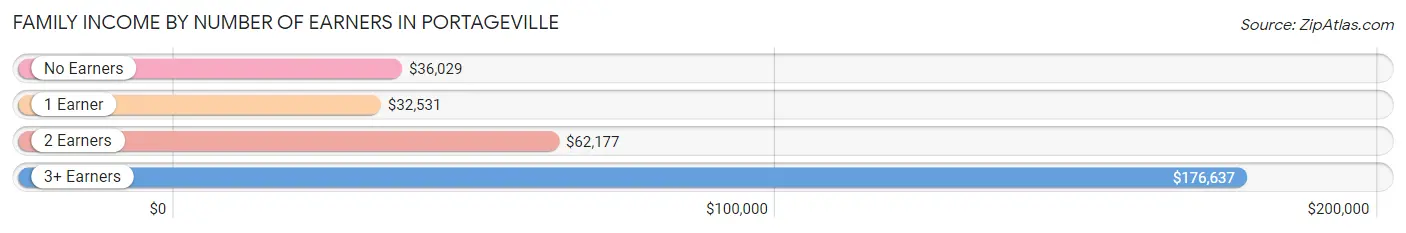
| Number of Earners | # Families | Median Income |
| No Earners | 134 (16.6%) | $36,029 |
| 1 Earner | 280 (34.6%) | $32,531 |
| 2 Earners | 306 (37.8%) | $62,177 |
| 3+ Earners | 89 (11.0%) | $176,637 |
| Total | 809 (100.0%) | $42,008 |
Household Income in Portageville
Household Income Brackets in Portageville
With 234 households falling in the category, the $15,000 to $24,999 income range is the most frequent in Portageville, accounting for 17.7% of all households. In contrast, only 21 households (1.6%) fall into the $200,000+ income bracket, making it the least populous group.
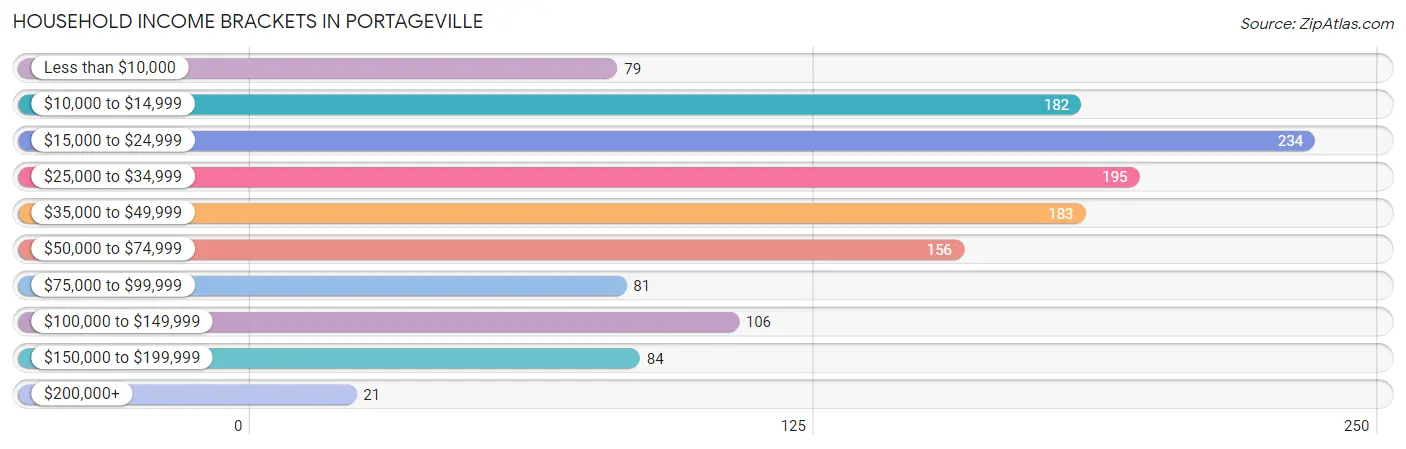
| Income Bracket | # Households | % Households |
| Less than $10,000 | 79 | 6.0% |
| $10,000 to $14,999 | 182 | 13.8% |
| $15,000 to $24,999 | 234 | 17.7% |
| $25,000 to $34,999 | 195 | 14.8% |
| $35,000 to $49,999 | 183 | 13.9% |
| $50,000 to $74,999 | 156 | 11.8% |
| $75,000 to $99,999 | 81 | 6.1% |
| $100,000 to $149,999 | 106 | 8.0% |
| $150,000 to $199,999 | 84 | 6.4% |
| $200,000+ | 21 | 1.6% |
Household Income by Householder Age in Portageville
The median household income in Portageville is $34,105, with the highest median household income of $43,424 found in the 45 to 64 years age bracket for the primary householder. A total of 605 households (45.8%) fall into this category. Meanwhile, the 15 to 24 years age bracket for the primary householder has the lowest median household income of $0, with 26 households (2.0%) in this group.

| Income Bracket | # Households | Median Income |
| 15 to 24 Years | 26 (2.0%) | $0 |
| 25 to 44 Years | 363 (27.5%) | $34,063 |
| 45 to 64 Years | 605 (45.8%) | $43,424 |
| 65+ Years | 326 (24.7%) | $26,316 |
| Total | 1,320 (100.0%) | $34,105 |
Poverty in Portageville
Income Below Poverty by Sex and Age in Portageville
With 18.6% poverty level for males and 20.5% for females among the residents of Portageville, under 5 year old males and 45 to 54 year old females are the most vulnerable to poverty, with 66 males (64.7%) and 136 females (50.0%) in their respective age groups living below the poverty level.
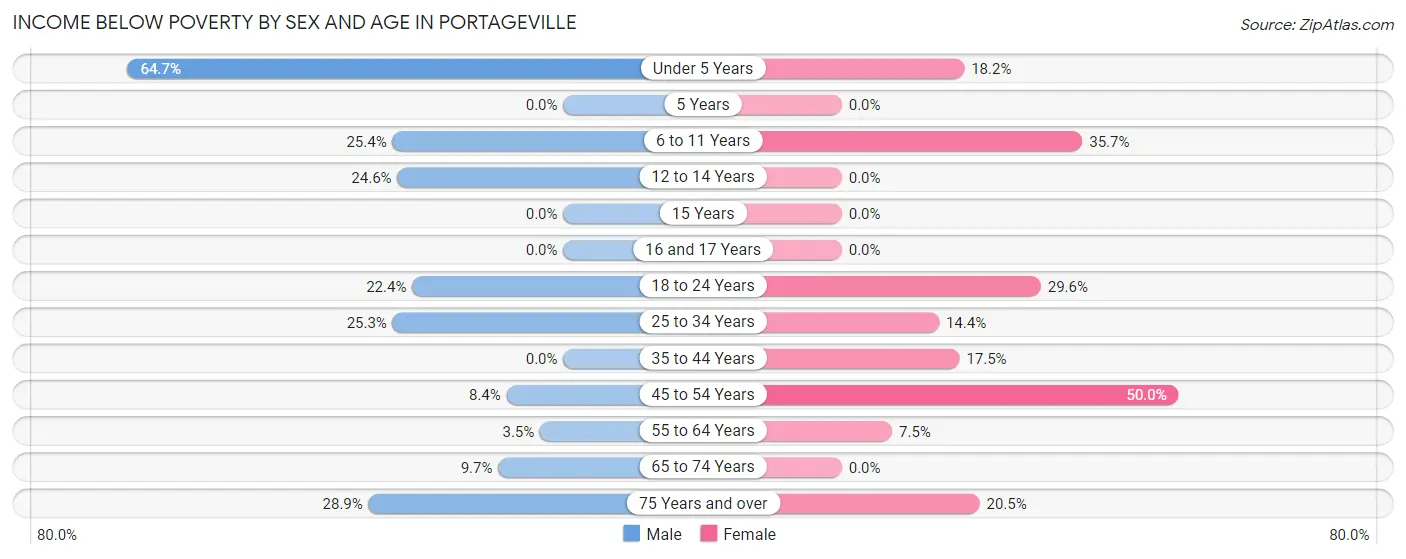
| Age Bracket | Male | Female |
| Under 5 Years | 66 (64.7%) | 14 (18.2%) |
| 5 Years | 0 (0.0%) | 0 (0.0%) |
| 6 to 11 Years | 17 (25.4%) | 40 (35.7%) |
| 12 to 14 Years | 17 (24.6%) | 0 (0.0%) |
| 15 Years | 0 (0.0%) | 0 (0.0%) |
| 16 and 17 Years | 0 (0.0%) | 0 (0.0%) |
| 18 to 24 Years | 46 (22.4%) | 26 (29.5%) |
| 25 to 34 Years | 37 (25.3%) | 14 (14.4%) |
| 35 to 44 Years | 0 (0.0%) | 40 (17.5%) |
| 45 to 54 Years | 16 (8.4%) | 136 (50.0%) |
| 55 to 64 Years | 4 (3.5%) | 23 (7.5%) |
| 65 to 74 Years | 14 (9.7%) | 0 (0.0%) |
| 75 Years and over | 24 (28.9%) | 27 (20.4%) |
| Total | 241 (18.6%) | 320 (20.5%) |
Income Above Poverty by Sex and Age in Portageville
According to the poverty statistics in Portageville, males aged 5 years and females aged 12 to 14 years are the age groups that are most secure financially, with 100.0% of males and 100.0% of females in these age groups living above the poverty line.
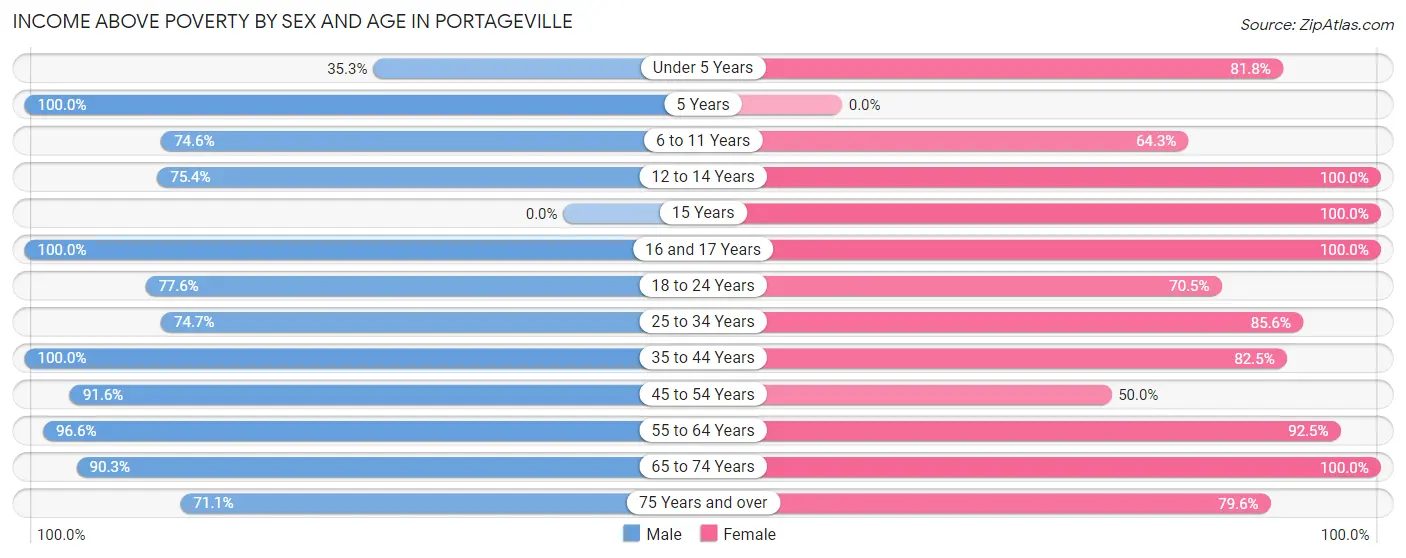
| Age Bracket | Male | Female |
| Under 5 Years | 36 (35.3%) | 63 (81.8%) |
| 5 Years | 42 (100.0%) | 0 (0.0%) |
| 6 to 11 Years | 50 (74.6%) | 72 (64.3%) |
| 12 to 14 Years | 52 (75.4%) | 46 (100.0%) |
| 15 Years | 0 (0.0%) | 9 (100.0%) |
| 16 and 17 Years | 3 (100.0%) | 120 (100.0%) |
| 18 to 24 Years | 159 (77.6%) | 62 (70.5%) |
| 25 to 34 Years | 109 (74.7%) | 83 (85.6%) |
| 35 to 44 Years | 128 (100.0%) | 189 (82.5%) |
| 45 to 54 Years | 174 (91.6%) | 136 (50.0%) |
| 55 to 64 Years | 112 (96.6%) | 285 (92.5%) |
| 65 to 74 Years | 131 (90.3%) | 68 (100.0%) |
| 75 Years and over | 59 (71.1%) | 105 (79.5%) |
| Total | 1,055 (81.4%) | 1,238 (79.5%) |
Income Below Poverty Among Married-Couple Families in Portageville
The poverty statistics for married-couple families in Portageville show that 6.3% or 26 of the total 415 families live below the poverty line. Families with 3 or 4 children have the highest poverty rate of 100.0%, comprising of 8 families. On the other hand, families with no children have the lowest poverty rate of 2.1%, which includes 4 families.
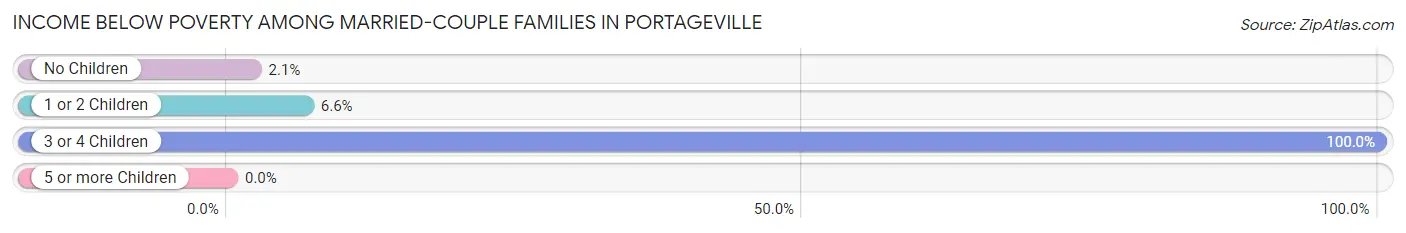
| Children | Above Poverty | Below Poverty |
| No Children | 191 (98.0%) | 4 (2.1%) |
| 1 or 2 Children | 198 (93.4%) | 14 (6.6%) |
| 3 or 4 Children | 0 (0.0%) | 8 (100.0%) |
| 5 or more Children | 0 (0.0%) | 0 (0.0%) |
| Total | 389 (93.7%) | 26 (6.3%) |
Income Below Poverty Among Single-Parent Households in Portageville
According to the poverty data in Portageville, 28.4% or 23 single-father households and 31.0% or 97 single-mother households are living below the poverty line. Among single-father households, those with 1 or 2 children have the highest poverty rate, with 23 households (28.4%) experiencing poverty. Likewise, among single-mother households, those with 1 or 2 children have the highest poverty rate, with 52 households (40.9%) falling below the poverty line.
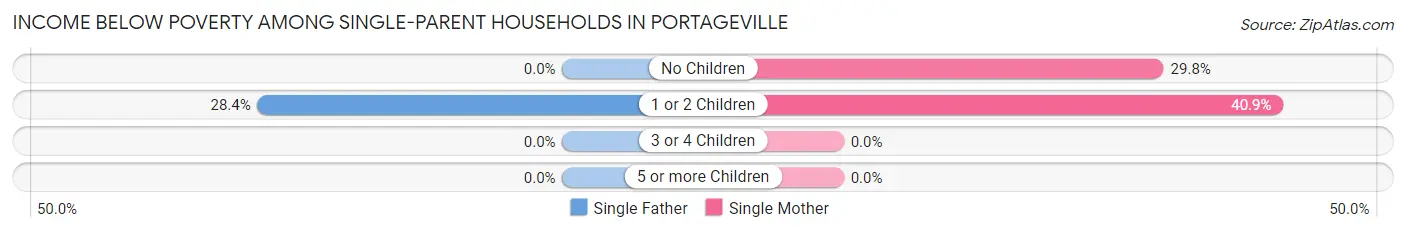
| Children | Single Father | Single Mother |
| No Children | 0 (0.0%) | 45 (29.8%) |
| 1 or 2 Children | 23 (28.4%) | 52 (40.9%) |
| 3 or 4 Children | 0 (0.0%) | 0 (0.0%) |
| 5 or more Children | 0 (0.0%) | 0 (0.0%) |
| Total | 23 (28.4%) | 97 (31.0%) |
Income Below Poverty Among Married-Couple vs Single-Parent Households in Portageville
The poverty data for Portageville shows that 26 of the married-couple family households (6.3%) and 120 of the single-parent households (30.5%) are living below the poverty level. Within the married-couple family households, those with 3 or 4 children have the highest poverty rate, with 8 households (100.0%) falling below the poverty line. Among the single-parent households, those with 1 or 2 children have the highest poverty rate, with 75 household (36.1%) living below poverty.
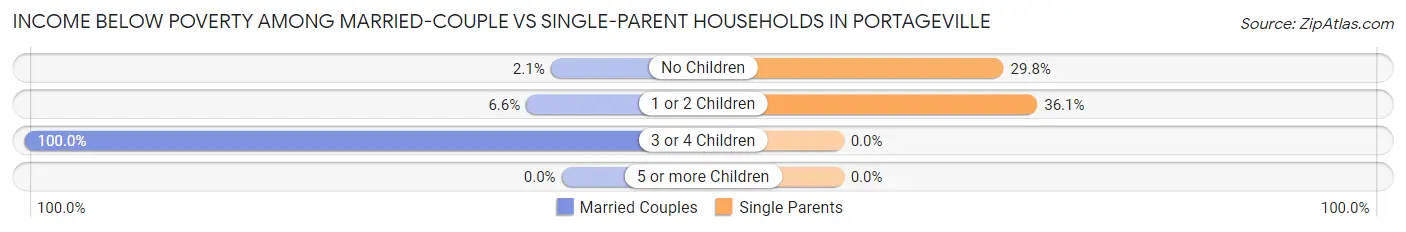
| Children | Married-Couple Families | Single-Parent Households |
| No Children | 4 (2.1%) | 45 (29.8%) |
| 1 or 2 Children | 14 (6.6%) | 75 (36.1%) |
| 3 or 4 Children | 8 (100.0%) | 0 (0.0%) |
| 5 or more Children | 0 (0.0%) | 0 (0.0%) |
| Total | 26 (6.3%) | 120 (30.5%) |
Race in Portageville
The most populous races in Portageville are White / Caucasian (1,951 | 66.9%), Two or more Races (609 | 20.9%), and Black / African American (352 | 12.1%).
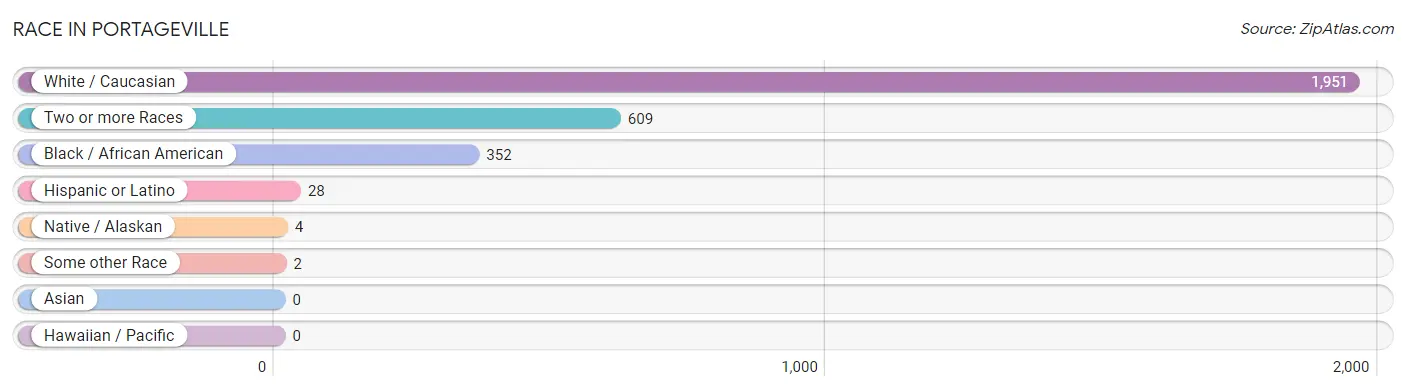
| Race | # Population | % Population |
| Asian | 0 | 0.0% |
| Black / African American | 352 | 12.1% |
| Hawaiian / Pacific | 0 | 0.0% |
| Hispanic or Latino | 28 | 1.0% |
| Native / Alaskan | 4 | 0.1% |
| White / Caucasian | 1,951 | 66.9% |
| Two or more Races | 609 | 20.9% |
| Some other Race | 2 | 0.1% |
| Total | 2,918 | 100.0% |
Ancestry in Portageville
The most populous ancestries reported in Portageville are Irish (762 | 26.1%), German (546 | 18.7%), English (332 | 11.4%), French (247 | 8.5%), and American (231 | 7.9%), together accounting for 72.6% of all Portageville residents.
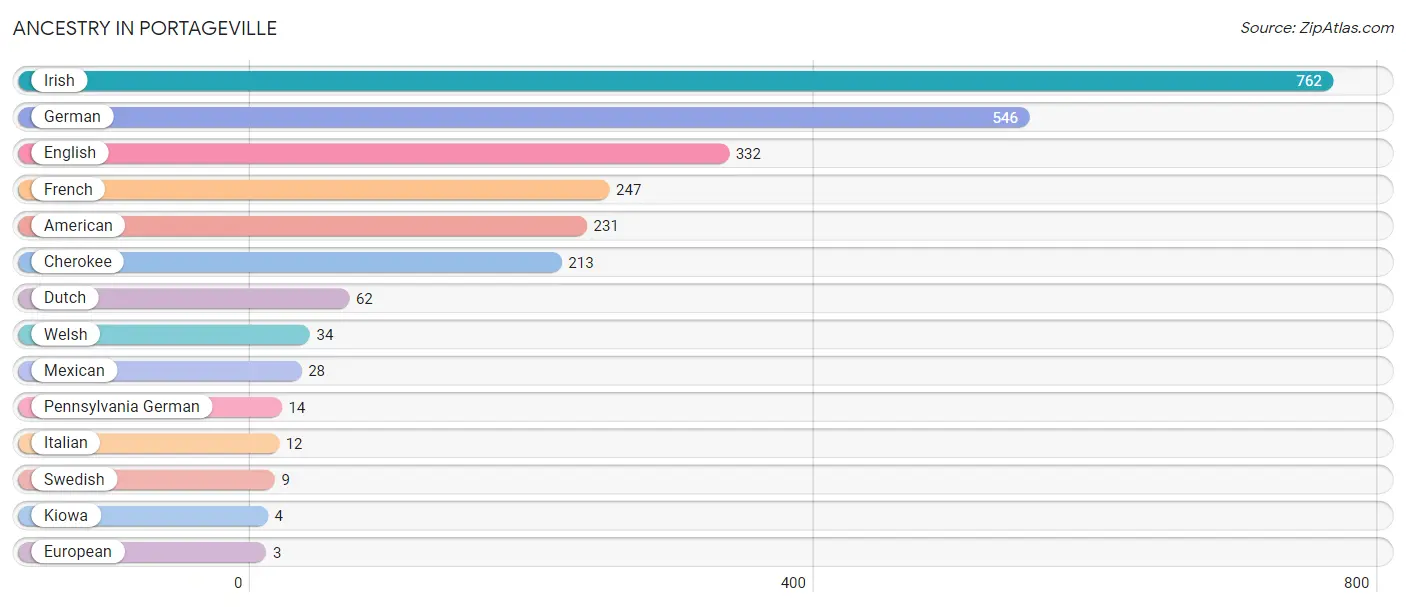
| Ancestry | # Population | % Population |
| American | 231 | 7.9% |
| Cherokee | 213 | 7.3% |
| Dutch | 62 | 2.1% |
| English | 332 | 11.4% |
| European | 3 | 0.1% |
| French | 247 | 8.5% |
| German | 546 | 18.7% |
| Irish | 762 | 26.1% |
| Italian | 12 | 0.4% |
| Kiowa | 4 | 0.1% |
| Mexican | 28 | 1.0% |
| Pennsylvania German | 14 | 0.5% |
| Swedish | 9 | 0.3% |
| Welsh | 34 | 1.2% | View All 14 Rows |
Immigrants in Portageville
The most numerous immigrant groups reported in Portageville came from Europe (34 | 1.2%), Northern Europe (34 | 1.2%), and Canada (15 | 0.5%), together accounting for 2.9% of all Portageville residents.
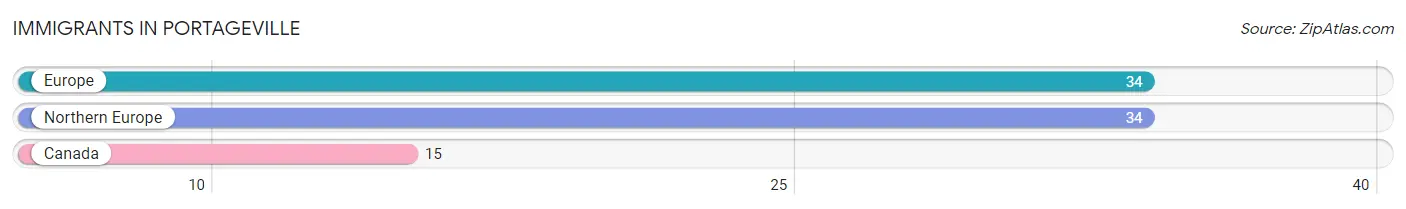
| Immigration Origin | # Population | % Population |
| Canada | 15 | 0.5% |
| Europe | 34 | 1.2% |
| Northern Europe | 34 | 1.2% | View All 3 Rows |
Sex and Age in Portageville
Sex and Age in Portageville
The most populous age groups in Portageville are 20 to 24 Years (132 | 9.9%) for men and 55 to 59 Years (222 | 14.0%) for women.
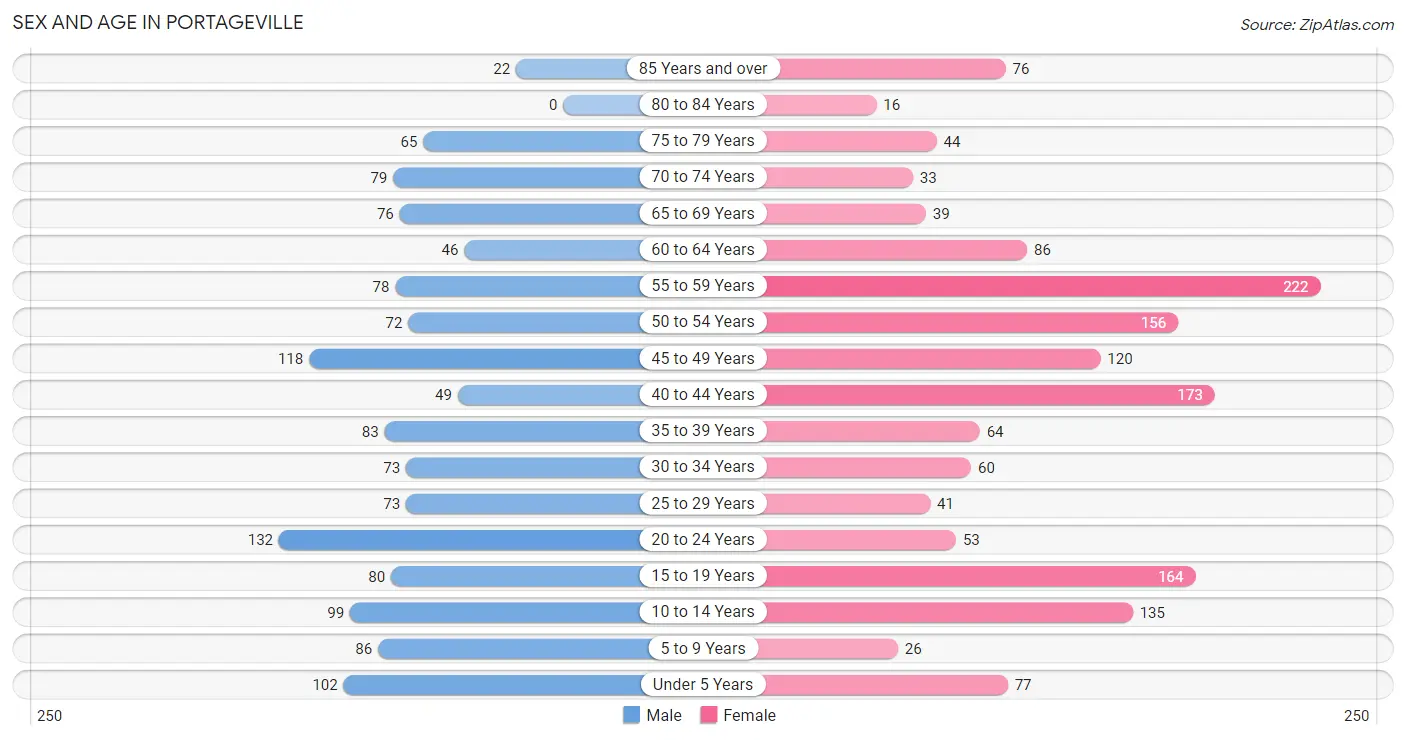
| Age Bracket | Male | Female |
| Under 5 Years | 102 (7.6%) | 77 (4.9%) |
| 5 to 9 Years | 86 (6.5%) | 26 (1.6%) |
| 10 to 14 Years | 99 (7.4%) | 135 (8.5%) |
| 15 to 19 Years | 80 (6.0%) | 164 (10.3%) |
| 20 to 24 Years | 132 (9.9%) | 53 (3.3%) |
| 25 to 29 Years | 73 (5.5%) | 41 (2.6%) |
| 30 to 34 Years | 73 (5.5%) | 60 (3.8%) |
| 35 to 39 Years | 83 (6.2%) | 64 (4.0%) |
| 40 to 44 Years | 49 (3.7%) | 173 (10.9%) |
| 45 to 49 Years | 118 (8.8%) | 120 (7.6%) |
| 50 to 54 Years | 72 (5.4%) | 156 (9.8%) |
| 55 to 59 Years | 78 (5.9%) | 222 (14.0%) |
| 60 to 64 Years | 46 (3.5%) | 86 (5.4%) |
| 65 to 69 Years | 76 (5.7%) | 39 (2.5%) |
| 70 to 74 Years | 79 (5.9%) | 33 (2.1%) |
| 75 to 79 Years | 65 (4.9%) | 44 (2.8%) |
| 80 to 84 Years | 0 (0.0%) | 16 (1.0%) |
| 85 Years and over | 22 (1.7%) | 76 (4.8%) |
| Total | 1,333 (100.0%) | 1,585 (100.0%) |
Families and Households in Portageville
Median Family Size in Portageville
The median family size in Portageville is 2.81 persons per family, with married-couple families (415 | 51.3%) accounting for the largest median family size of 3.26 persons per family. On the other hand, single male/father families (81 | 10.0%) represent the smallest median family size with 2.19 persons per family.
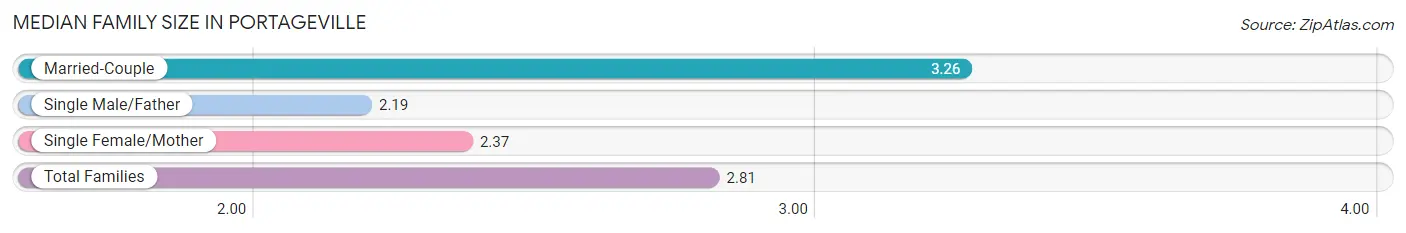
| Family Type | # Families | Family Size |
| Married-Couple | 415 (51.3%) | 3.26 |
| Single Male/Father | 81 (10.0%) | 2.19 |
| Single Female/Mother | 313 (38.7%) | 2.37 |
| Total Families | 809 (100.0%) | 2.81 |
Median Household Size in Portageville
The median household size in Portageville is 2.17 persons per household, with married-couple households (415 | 31.4%) accounting for the largest median household size of 3.35 persons per household. non-family households (511 | 38.7%) represent the smallest median household size with 1.07 persons per household.
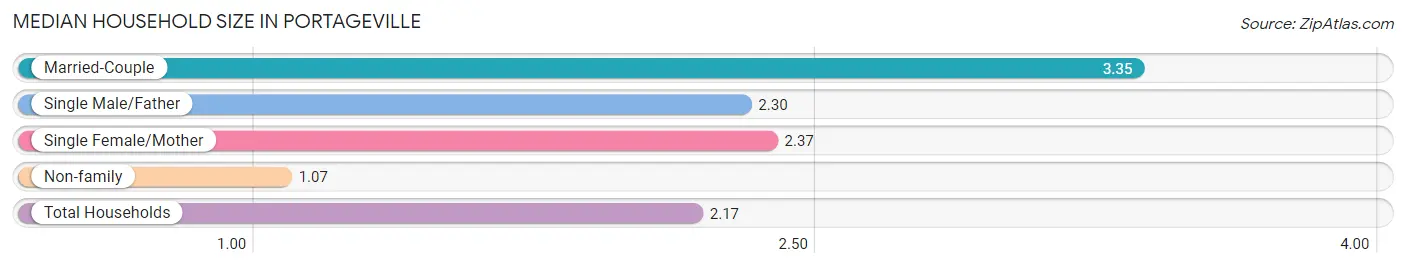
| Household Type | # Households | Household Size |
| Married-Couple | 415 (31.4%) | 3.35 |
| Single Male/Father | 81 (6.1%) | 2.30 |
| Single Female/Mother | 313 (23.7%) | 2.37 |
| Non-family | 511 (38.7%) | 1.07 |
| Total Households | 1,320 (100.0%) | 2.17 |
Household Size by Marriage Status in Portageville
Out of a total of 1,320 households in Portageville, 809 (61.3%) are family households, while 511 (38.7%) are nonfamily households. The most numerous type of family households are 2-person households, comprising 369, and the most common type of nonfamily households are 1-person households, comprising 477.
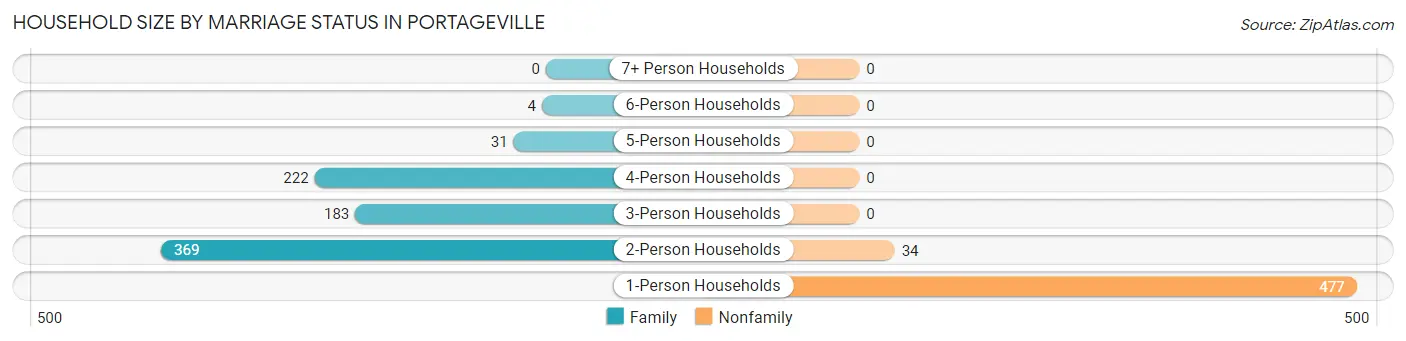
| Household Size | Family Households | Nonfamily Households |
| 1-Person Households | - | 477 (36.1%) |
| 2-Person Households | 369 (28.0%) | 34 (2.6%) |
| 3-Person Households | 183 (13.9%) | 0 (0.0%) |
| 4-Person Households | 222 (16.8%) | 0 (0.0%) |
| 5-Person Households | 31 (2.4%) | 0 (0.0%) |
| 6-Person Households | 4 (0.3%) | 0 (0.0%) |
| 7+ Person Households | 0 (0.0%) | 0 (0.0%) |
| Total | 809 (61.3%) | 511 (38.7%) |
Female Fertility in Portageville
Fertility by Age in Portageville
Average fertility rate in Portageville is 102.0 births per 1,000 women. Women in the age bracket of 20 to 34 years have the highest fertility rate with 494.0 births per 1,000 women. Women in the age bracket of 20 to 34 years acount for 100.0% of all women with births.
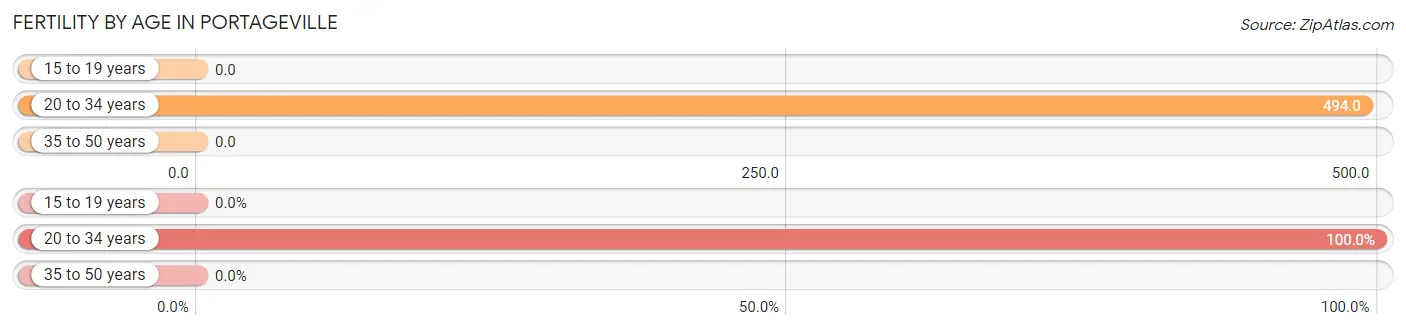
| Age Bracket | Women with Births | Births / 1,000 Women |
| 15 to 19 years | 0 (0.0%) | 0.0 |
| 20 to 34 years | 76 (100.0%) | 494.0 |
| 35 to 50 years | 0 (0.0%) | 0.0 |
| Total | 76 (100.0%) | 102.0 |
Fertility by Age by Marriage Status in Portageville
46.1% of women with births (76) in Portageville are married. The highest percentage of unmarried women with births falls into 20 to 34 years age bracket with 53.9% of them unmarried at the time of birth, while the lowest percentage of unmarried women with births belong to 20 to 34 years age bracket with 53.9% of them unmarried.
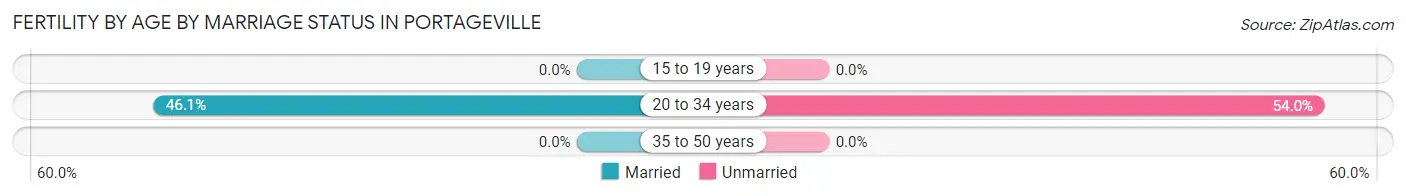
| Age Bracket | Married | Unmarried |
| 15 to 19 years | 0 (0.0%) | 0 (0.0%) |
| 20 to 34 years | 35 (46.1%) | 41 (53.9%) |
| 35 to 50 years | 0 (0.0%) | 0 (0.0%) |
| Total | 35 (46.1%) | 41 (53.9%) |
Fertility by Education in Portageville
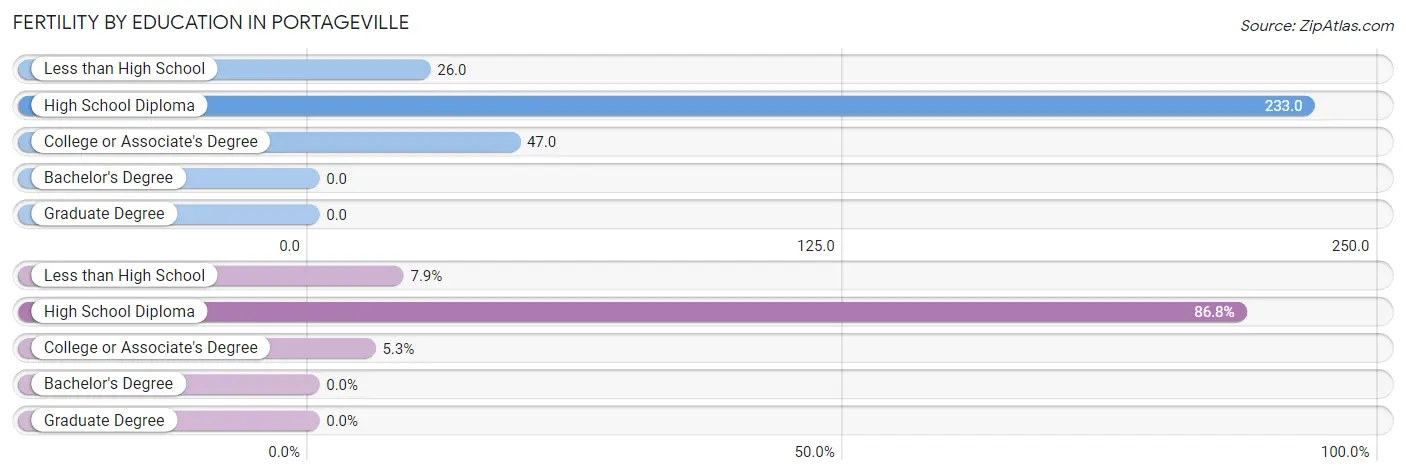
| Educational Attainment | Women with Births | Births / 1,000 Women |
| Less than High School | 6 (7.9%) | 26.0 |
| High School Diploma | 66 (86.8%) | 233.0 |
| College or Associate's Degree | 4 (5.3%) | 47.0 |
| Bachelor's Degree | 0 (0.0%) | 0.0 |
| Graduate Degree | 0 (0.0%) | 0.0 |
| Total | 76 (100.0%) | 102.0 |
Fertility by Education by Marriage Status in Portageville
53.9% of women with births in Portageville are unmarried. Women with the educational attainment of high school diploma are most likely to be married with 53.0% of them married at childbirth, while women with the educational attainment of less than high school are least likely to be married with 100.0% of them unmarried at childbirth.
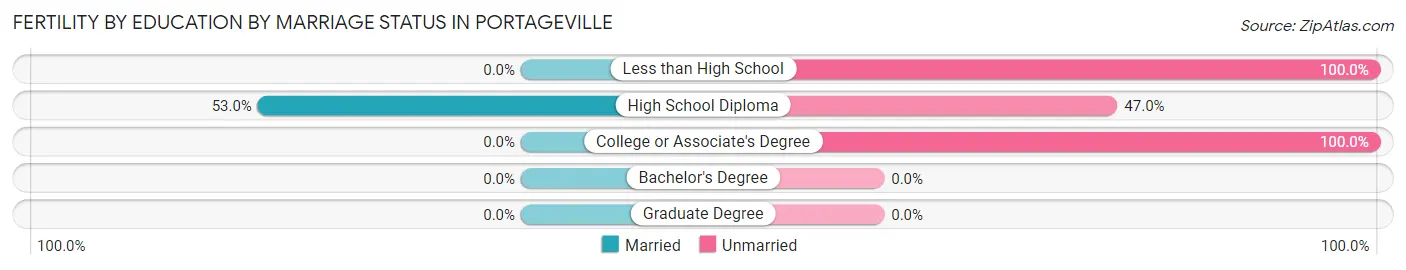
| Educational Attainment | Married | Unmarried |
| Less than High School | 0 (0.0%) | 6 (100.0%) |
| High School Diploma | 35 (53.0%) | 31 (47.0%) |
| College or Associate's Degree | 0 (0.0%) | 4 (100.0%) |
| Bachelor's Degree | 0 (0.0%) | 0 (0.0%) |
| Graduate Degree | 0 (0.0%) | 0 (0.0%) |
| Total | 35 (46.1%) | 41 (53.9%) |
Employment Characteristics in Portageville
Employment by Class of Employer in Portageville
Among the 1,256 employed individuals in Portageville, private company employees (728 | 58.0%), self-employed (not incorporated) (218 | 17.4%), and local government employees (133 | 10.6%) make up the most common classes of employment.
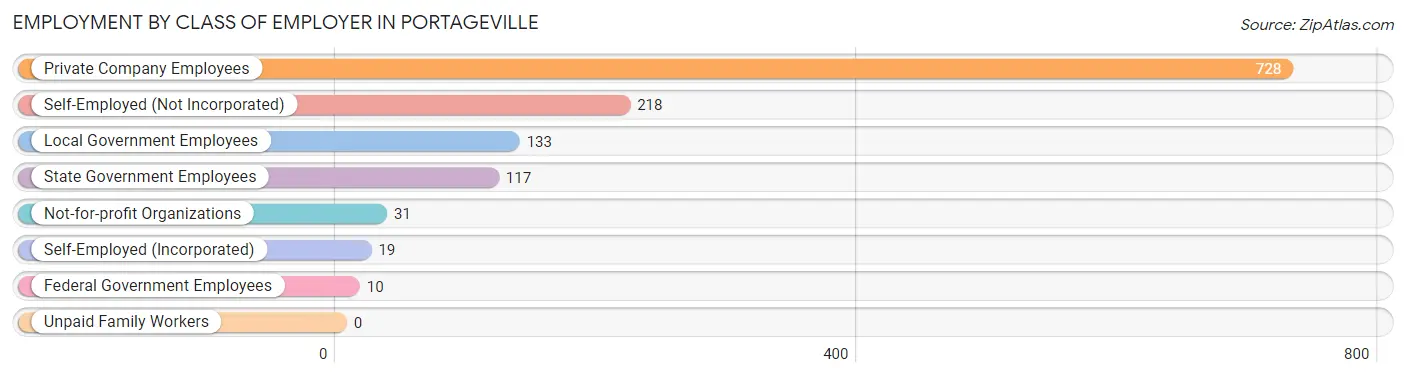
| Employer Class | # Employees | % Employees |
| Private Company Employees | 728 | 58.0% |
| Self-Employed (Incorporated) | 19 | 1.5% |
| Self-Employed (Not Incorporated) | 218 | 17.4% |
| Not-for-profit Organizations | 31 | 2.5% |
| Local Government Employees | 133 | 10.6% |
| State Government Employees | 117 | 9.3% |
| Federal Government Employees | 10 | 0.8% |
| Unpaid Family Workers | 0 | 0.0% |
| Total | 1,256 | 100.0% |
Employment Status by Age in Portageville
According to the labor force statistics for Portageville, out of the total population over 16 years of age (2,384), 55.5% or 1,323 individuals are in the labor force, with 4.5% or 60 of them unemployed. The age group with the highest labor force participation rate is 25 to 29 years, with 96.5% or 110 individuals in the labor force. Within the labor force, the 25 to 29 years age range has the highest percentage of unemployed individuals, with 22.7% or 25 of them being unemployed.
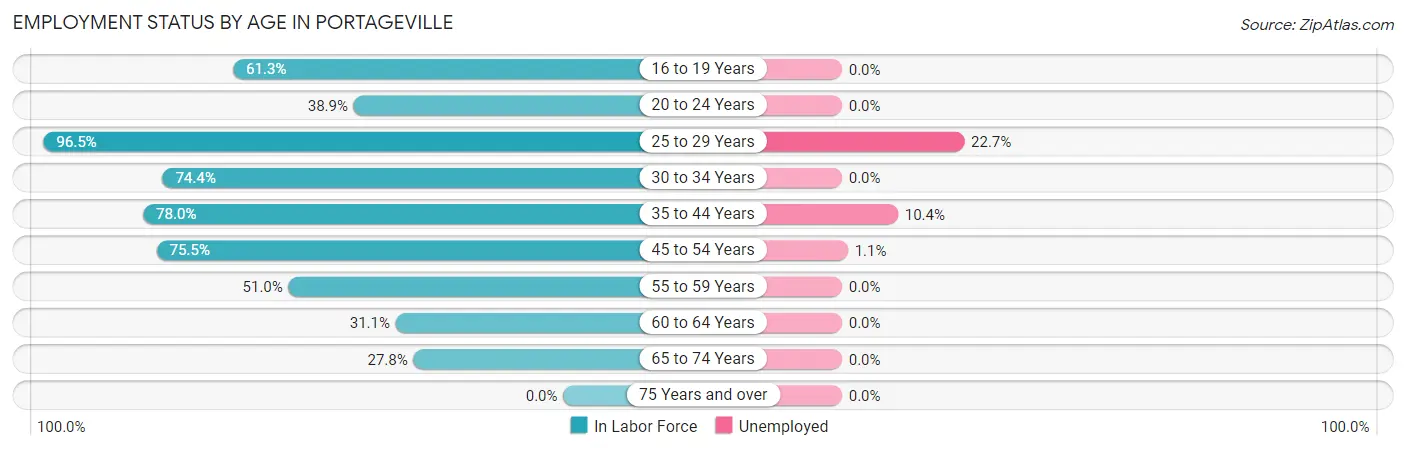
| Age Bracket | In Labor Force | Unemployed |
| 16 to 19 Years | 144 (61.3%) | 0 (0.0%) |
| 20 to 24 Years | 72 (38.9%) | 0 (0.0%) |
| 25 to 29 Years | 110 (96.5%) | 25 (22.7%) |
| 30 to 34 Years | 99 (74.4%) | 0 (0.0%) |
| 35 to 44 Years | 288 (78.0%) | 30 (10.4%) |
| 45 to 54 Years | 352 (75.5%) | 4 (1.1%) |
| 55 to 59 Years | 153 (51.0%) | 0 (0.0%) |
| 60 to 64 Years | 41 (31.1%) | 0 (0.0%) |
| 65 to 74 Years | 63 (27.8%) | 0 (0.0%) |
| 75 Years and over | 0 (0.0%) | 0 (0.0%) |
| Total | 1,323 (55.5%) | 60 (4.5%) |
Employment Status by Educational Attainment in Portageville
According to labor force statistics for Portageville, 68.9% of individuals (1,043) out of the total population between 25 and 64 years of age (1,514) are in the labor force, with 5.7% or 59 of them being unemployed. The group with the highest labor force participation rate are those with the educational attainment of college / associate degree, with 91.2% or 321 individuals in the labor force. Within the labor force, individuals with college / associate degree education have the highest percentage of unemployment, with 13.7% or 44 of them being unemployed.
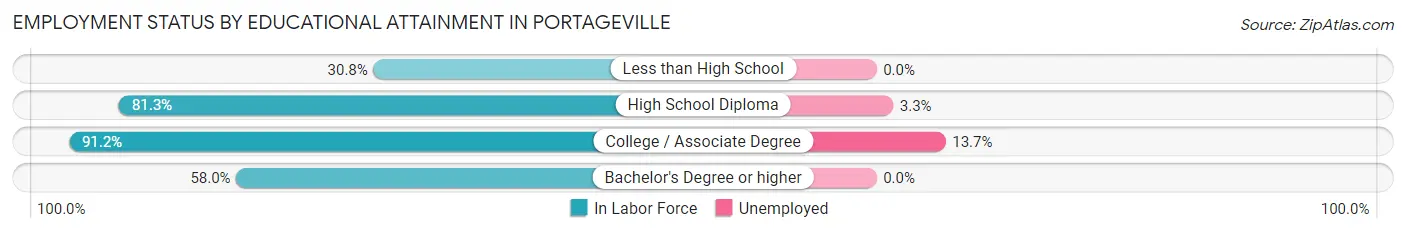
| Educational Attainment | In Labor Force | Unemployed |
| Less than High School | 94 (30.8%) | 0 (0.0%) |
| High School Diploma | 457 (81.3%) | 19 (3.3%) |
| College / Associate Degree | 321 (91.2%) | 48 (13.7%) |
| Bachelor's Degree or higher | 171 (58.0%) | 0 (0.0%) |
| Total | 1,043 (68.9%) | 86 (5.7%) |
Employment Occupations by Sex in Portageville
Management, Business, Science and Arts Occupations
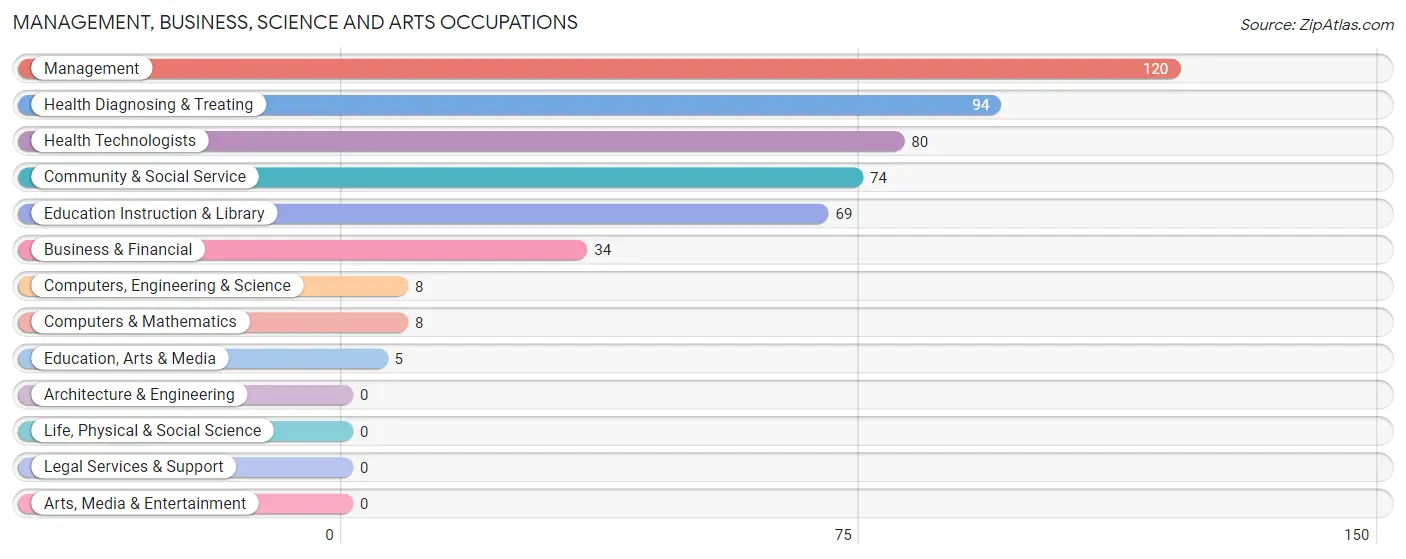
The most common Management, Business, Science and Arts occupations in Portageville are Management (120 | 9.5%), Health Diagnosing & Treating (94 | 7.4%), Health Technologists (80 | 6.3%), Community & Social Service (74 | 5.9%), and Education Instruction & Library (69 | 5.5%).
Management, Business, Science and Arts Occupations by Sex
Within the Management, Business, Science and Arts occupations in Portageville, the most male-oriented occupations are Education, Arts & Media (100.0%), Business & Financial (85.3%), and Management (75.0%), while the most female-oriented occupations are Computers, Engineering & Science (100.0%), Computers & Mathematics (100.0%), and Health Diagnosing & Treating (100.0%).
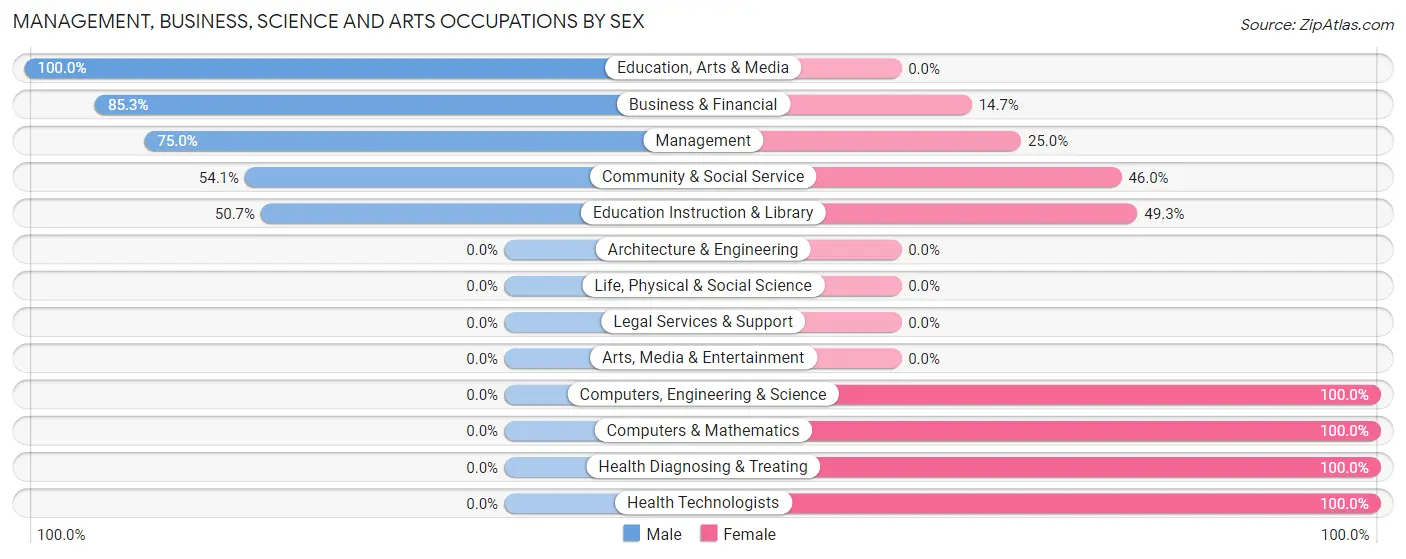
| Occupation | Male | Female |
| Management | 90 (75.0%) | 30 (25.0%) |
| Business & Financial | 29 (85.3%) | 5 (14.7%) |
| Computers, Engineering & Science | 0 (0.0%) | 8 (100.0%) |
| Computers & Mathematics | 0 (0.0%) | 8 (100.0%) |
| Architecture & Engineering | 0 (0.0%) | 0 (0.0%) |
| Life, Physical & Social Science | 0 (0.0%) | 0 (0.0%) |
| Community & Social Service | 40 (54.0%) | 34 (46.0%) |
| Education, Arts & Media | 5 (100.0%) | 0 (0.0%) |
| Legal Services & Support | 0 (0.0%) | 0 (0.0%) |
| Education Instruction & Library | 35 (50.7%) | 34 (49.3%) |
| Arts, Media & Entertainment | 0 (0.0%) | 0 (0.0%) |
| Health Diagnosing & Treating | 0 (0.0%) | 94 (100.0%) |
| Health Technologists | 0 (0.0%) | 80 (100.0%) |
| Total (Category) | 159 (48.2%) | 171 (51.8%) |
| Total (Overall) | 594 (47.0%) | 669 (53.0%) |
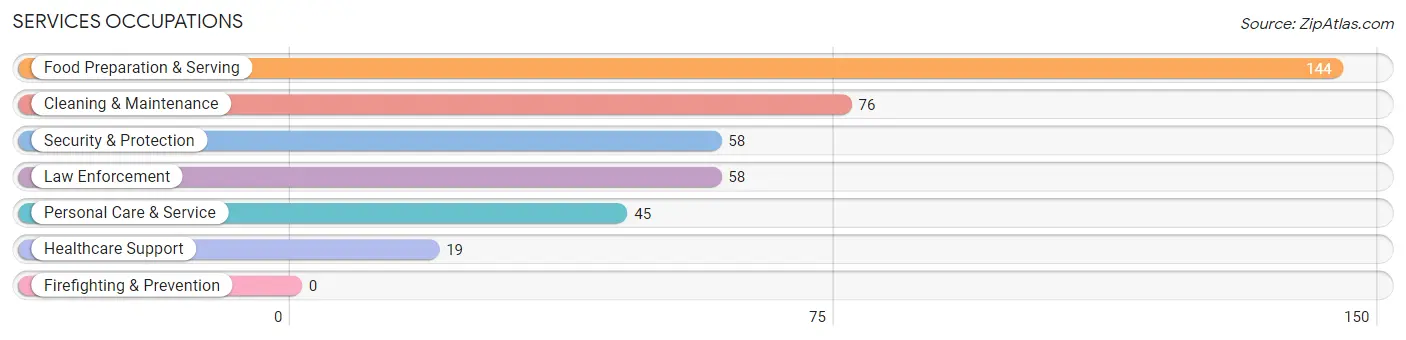
Services Occupations
The most common Services occupations in Portageville are Food Preparation & Serving (144 | 11.4%), Cleaning & Maintenance (76 | 6.0%), Security & Protection (58 | 4.6%), Law Enforcement (58 | 4.6%), and Personal Care & Service (45 | 3.6%).
Services Occupations by Sex
Within the Services occupations in Portageville, the most male-oriented occupations are Security & Protection (86.2%), Law Enforcement (86.2%), and Healthcare Support (15.8%), while the most female-oriented occupations are Cleaning & Maintenance (100.0%), Personal Care & Service (100.0%), and Food Preparation & Serving (97.9%).
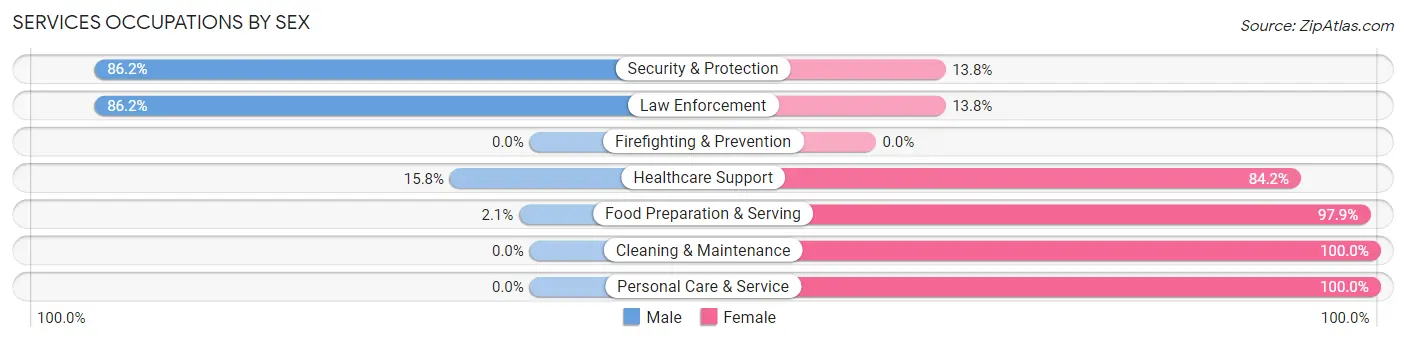
| Occupation | Male | Female |
| Healthcare Support | 3 (15.8%) | 16 (84.2%) |
| Security & Protection | 50 (86.2%) | 8 (13.8%) |
| Firefighting & Prevention | 0 (0.0%) | 0 (0.0%) |
| Law Enforcement | 50 (86.2%) | 8 (13.8%) |
| Food Preparation & Serving | 3 (2.1%) | 141 (97.9%) |
| Cleaning & Maintenance | 0 (0.0%) | 76 (100.0%) |
| Personal Care & Service | 0 (0.0%) | 45 (100.0%) |
| Total (Category) | 56 (16.4%) | 286 (83.6%) |
| Total (Overall) | 594 (47.0%) | 669 (53.0%) |
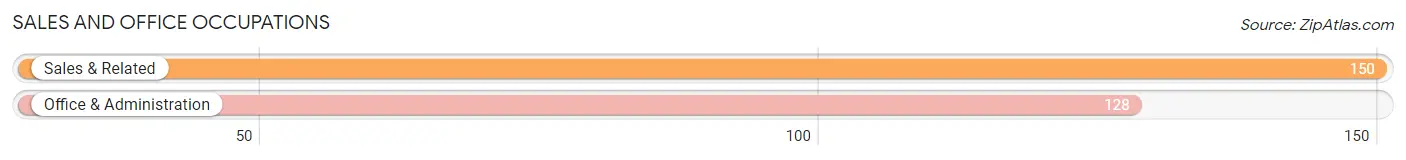
Sales and Office Occupations
The most common Sales and Office occupations in Portageville are Sales & Related (150 | 11.9%), and Office & Administration (128 | 10.1%).
Sales and Office Occupations by Sex
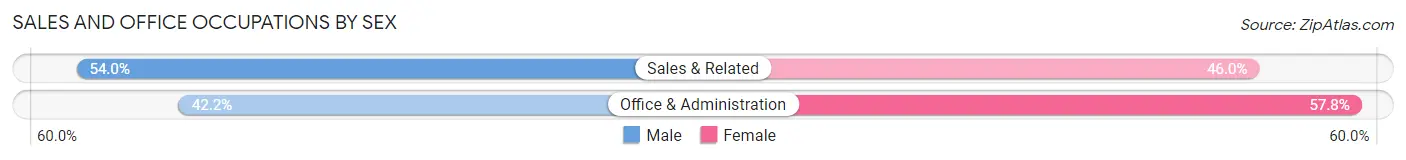
| Occupation | Male | Female |
| Sales & Related | 81 (54.0%) | 69 (46.0%) |
| Office & Administration | 54 (42.2%) | 74 (57.8%) |
| Total (Category) | 135 (48.6%) | 143 (51.4%) |
| Total (Overall) | 594 (47.0%) | 669 (53.0%) |
Natural Resources, Construction and Maintenance Occupations
The most common Natural Resources, Construction and Maintenance occupations in Portageville are Installation, Maintenance & Repair (64 | 5.1%), and Construction & Extraction (42 | 3.3%).

Natural Resources, Construction and Maintenance Occupations by Sex
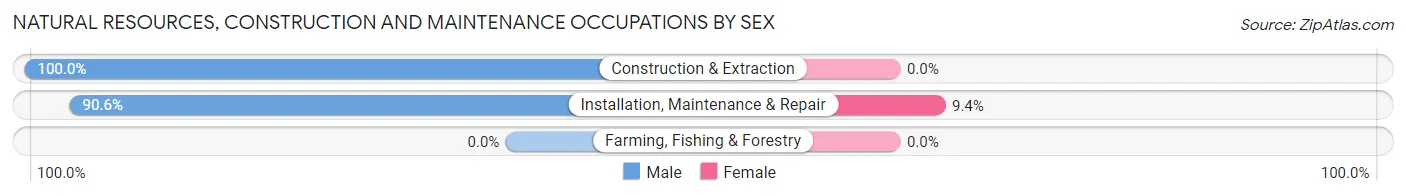
| Occupation | Male | Female |
| Farming, Fishing & Forestry | 0 (0.0%) | 0 (0.0%) |
| Construction & Extraction | 42 (100.0%) | 0 (0.0%) |
| Installation, Maintenance & Repair | 58 (90.6%) | 6 (9.4%) |
| Total (Category) | 100 (94.3%) | 6 (5.7%) |
| Total (Overall) | 594 (47.0%) | 669 (53.0%) |
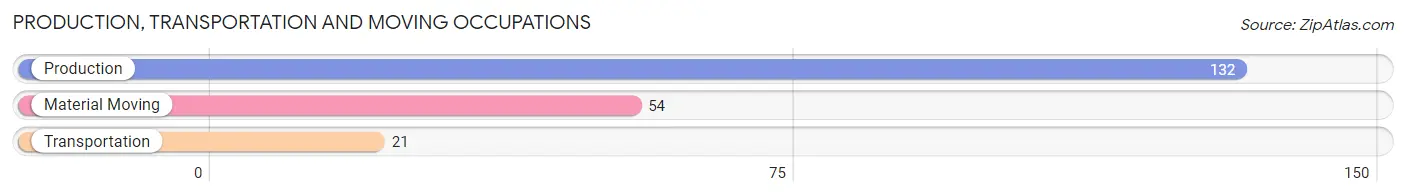
Production, Transportation and Moving Occupations
The most common Production, Transportation and Moving occupations in Portageville are Production (132 | 10.4%), Material Moving (54 | 4.3%), and Transportation (21 | 1.7%).
Production, Transportation and Moving Occupations by Sex
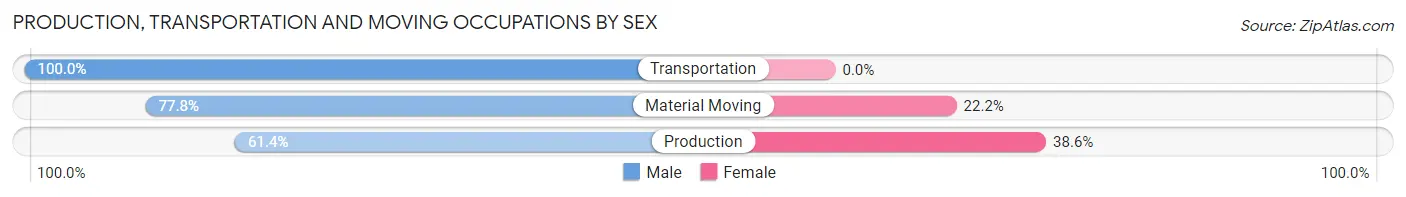
| Occupation | Male | Female |
| Production | 81 (61.4%) | 51 (38.6%) |
| Transportation | 21 (100.0%) | 0 (0.0%) |
| Material Moving | 42 (77.8%) | 12 (22.2%) |
| Total (Category) | 144 (69.6%) | 63 (30.4%) |
| Total (Overall) | 594 (47.0%) | 669 (53.0%) |
Employment Industries by Sex in Portageville
Employment Industries in Portageville
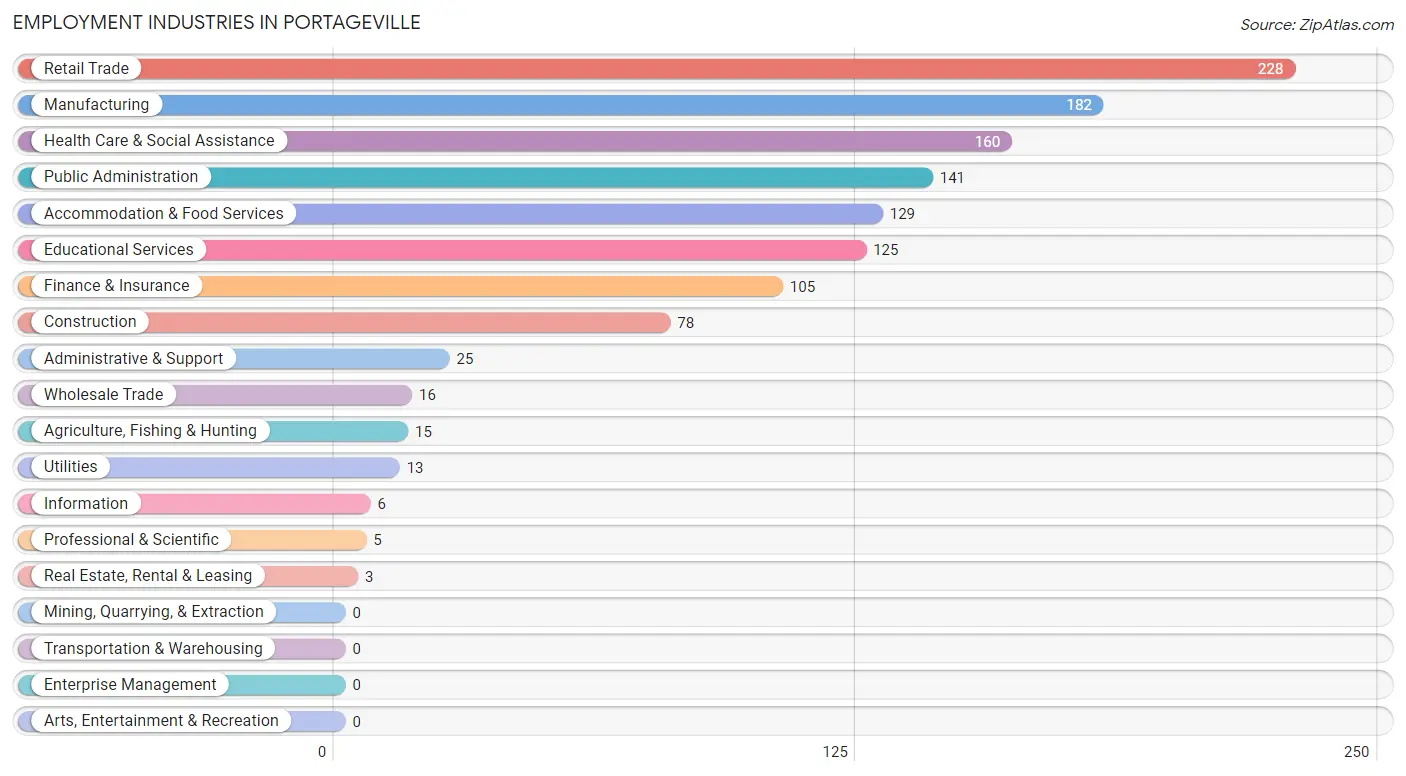
The major employment industries in Portageville include Retail Trade (228 | 18.0%), Manufacturing (182 | 14.4%), Health Care & Social Assistance (160 | 12.7%), Public Administration (141 | 11.2%), and Accommodation & Food Services (129 | 10.2%).
Employment Industries by Sex in Portageville
The Portageville industries that see more men than women are Agriculture, Fishing & Hunting (100.0%), Construction (100.0%), and Wholesale Trade (100.0%), whereas the industries that tend to have a higher number of women are Information (100.0%), Professional & Scientific (100.0%), and Administrative & Support (100.0%).
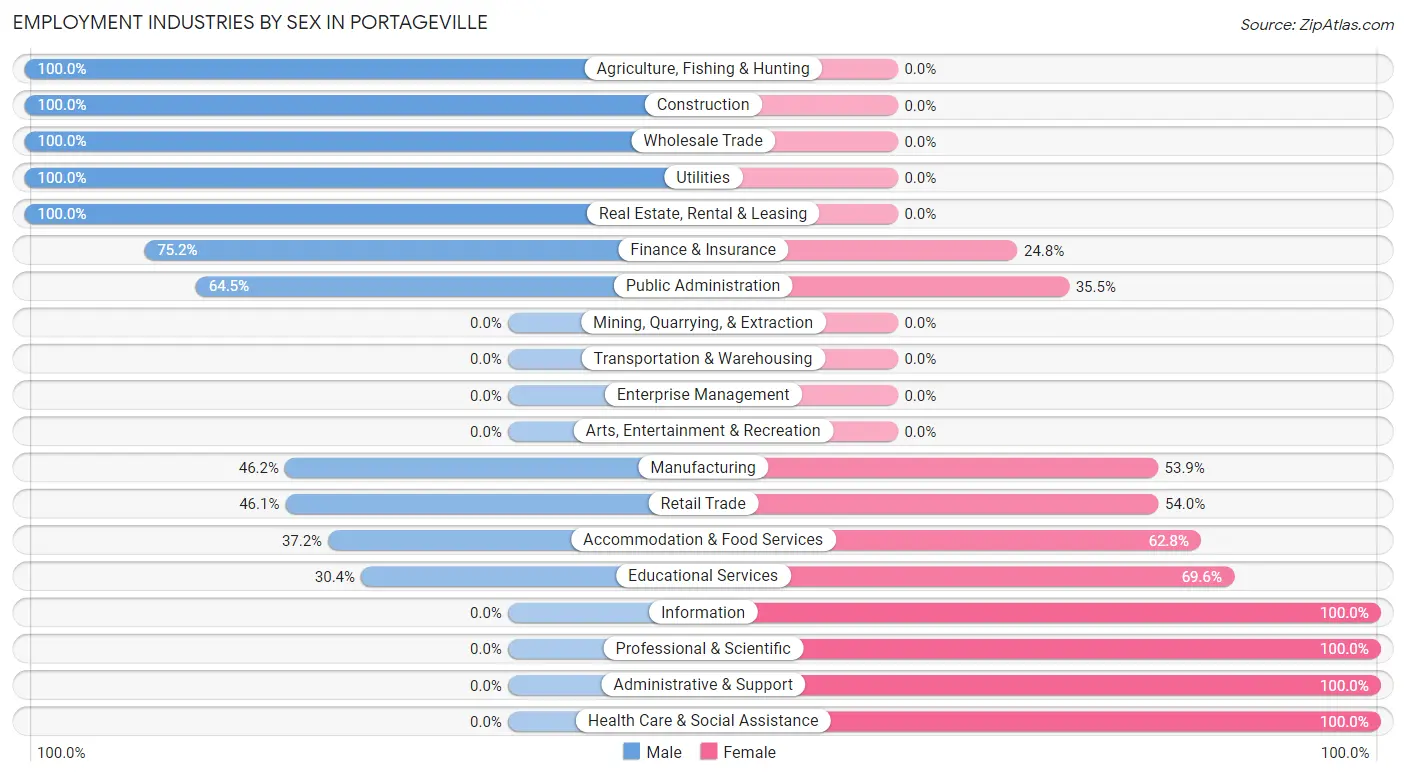
| Industry | Male | Female |
| Agriculture, Fishing & Hunting | 15 (100.0%) | 0 (0.0%) |
| Mining, Quarrying, & Extraction | 0 (0.0%) | 0 (0.0%) |
| Construction | 78 (100.0%) | 0 (0.0%) |
| Manufacturing | 84 (46.2%) | 98 (53.8%) |
| Wholesale Trade | 16 (100.0%) | 0 (0.0%) |
| Retail Trade | 105 (46.1%) | 123 (53.9%) |
| Transportation & Warehousing | 0 (0.0%) | 0 (0.0%) |
| Utilities | 13 (100.0%) | 0 (0.0%) |
| Information | 0 (0.0%) | 6 (100.0%) |
| Finance & Insurance | 79 (75.2%) | 26 (24.8%) |
| Real Estate, Rental & Leasing | 3 (100.0%) | 0 (0.0%) |
| Professional & Scientific | 0 (0.0%) | 5 (100.0%) |
| Enterprise Management | 0 (0.0%) | 0 (0.0%) |
| Administrative & Support | 0 (0.0%) | 25 (100.0%) |
| Educational Services | 38 (30.4%) | 87 (69.6%) |
| Health Care & Social Assistance | 0 (0.0%) | 160 (100.0%) |
| Arts, Entertainment & Recreation | 0 (0.0%) | 0 (0.0%) |
| Accommodation & Food Services | 48 (37.2%) | 81 (62.8%) |
| Public Administration | 91 (64.5%) | 50 (35.5%) |
| Total | 594 (47.0%) | 669 (53.0%) |
Education in Portageville
School Enrollment in Portageville
The most common levels of schooling among the 658 students in Portageville are high school (206 | 31.3%), middle school (179 | 27.2%), and college / undergraduate (141 | 21.4%).
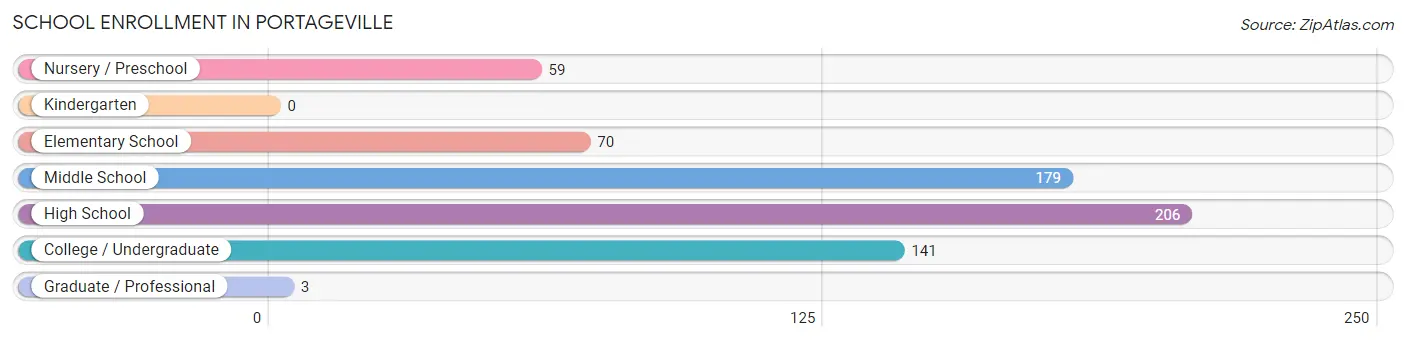
| School Level | # Students | % Students |
| Nursery / Preschool | 59 | 9.0% |
| Kindergarten | 0 | 0.0% |
| Elementary School | 70 | 10.6% |
| Middle School | 179 | 27.2% |
| High School | 206 | 31.3% |
| College / Undergraduate | 141 | 21.4% |
| Graduate / Professional | 3 | 0.5% |
| Total | 658 | 100.0% |
School Enrollment by Age by Funding Source in Portageville
Out of a total of 658 students who are enrolled in schools in Portageville, 83 (12.6%) attend a private institution, while the remaining 575 (87.4%) are enrolled in public schools. The age group of 20 to 24 year olds has the highest likelihood of being enrolled in private schools, with 29 (70.7% in the age bracket) enrolled. Conversely, the age group of 3 to 4 year olds has the lowest likelihood of being enrolled in a private school, with 17 (100.0% in the age bracket) attending a public institution.
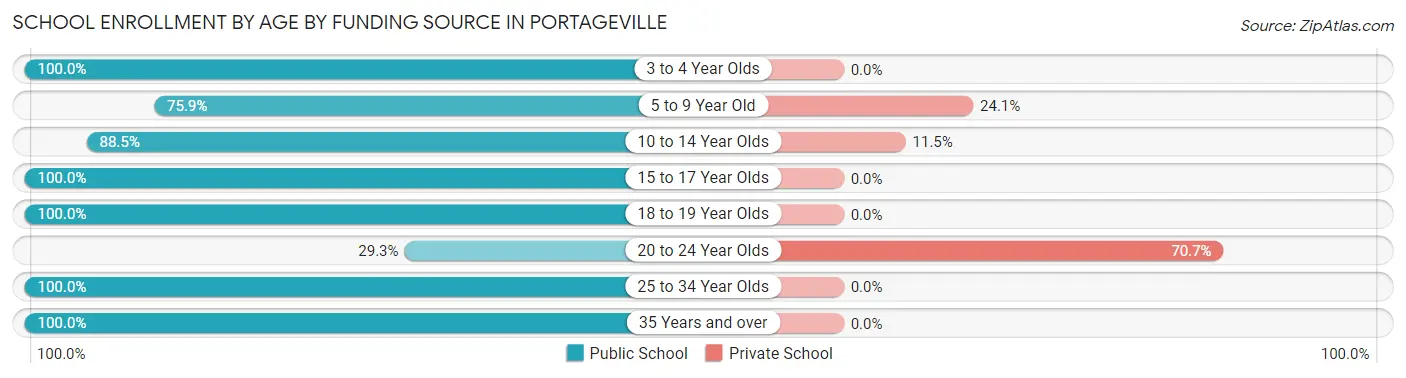
| Age Bracket | Public School | Private School |
| 3 to 4 Year Olds | 17 (100.0%) | 0 (0.0%) |
| 5 to 9 Year Old | 85 (75.9%) | 27 (24.1%) |
| 10 to 14 Year Olds | 207 (88.5%) | 27 (11.5%) |
| 15 to 17 Year Olds | 132 (100.0%) | 0 (0.0%) |
| 18 to 19 Year Olds | 45 (100.0%) | 0 (0.0%) |
| 20 to 24 Year Olds | 12 (29.3%) | 29 (70.7%) |
| 25 to 34 Year Olds | 8 (100.0%) | 0 (0.0%) |
| 35 Years and over | 69 (100.0%) | 0 (0.0%) |
| Total | 575 (87.4%) | 83 (12.6%) |
Educational Attainment by Field of Study in Portageville
Education (114 | 35.3%), business (94 | 29.1%), science & technology (49 | 15.2%), social sciences (45 | 13.9%), and bio, nature & agricultural (12 | 3.7%) are the most common fields of study among 323 individuals in Portageville who have obtained a bachelor's degree or higher.
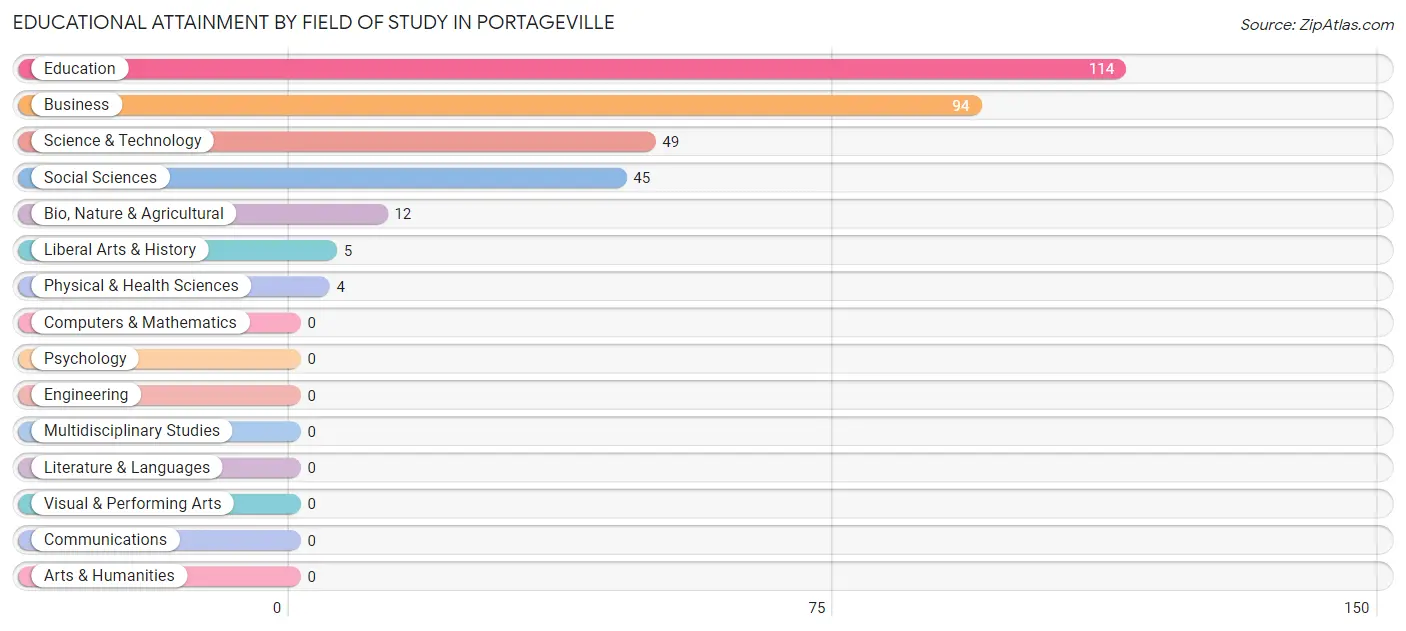
| Field of Study | # Graduates | % Graduates |
| Computers & Mathematics | 0 | 0.0% |
| Bio, Nature & Agricultural | 12 | 3.7% |
| Physical & Health Sciences | 4 | 1.2% |
| Psychology | 0 | 0.0% |
| Social Sciences | 45 | 13.9% |
| Engineering | 0 | 0.0% |
| Multidisciplinary Studies | 0 | 0.0% |
| Science & Technology | 49 | 15.2% |
| Business | 94 | 29.1% |
| Education | 114 | 35.3% |
| Literature & Languages | 0 | 0.0% |
| Liberal Arts & History | 5 | 1.5% |
| Visual & Performing Arts | 0 | 0.0% |
| Communications | 0 | 0.0% |
| Arts & Humanities | 0 | 0.0% |
| Total | 323 | 100.0% |
Transportation & Commute in Portageville
Vehicle Availability by Sex in Portageville
The most prevalent vehicle ownership categories in Portageville are males with 2 vehicles (268, accounting for 45.7%) and females with 2 vehicles (300, making up 40.1%).
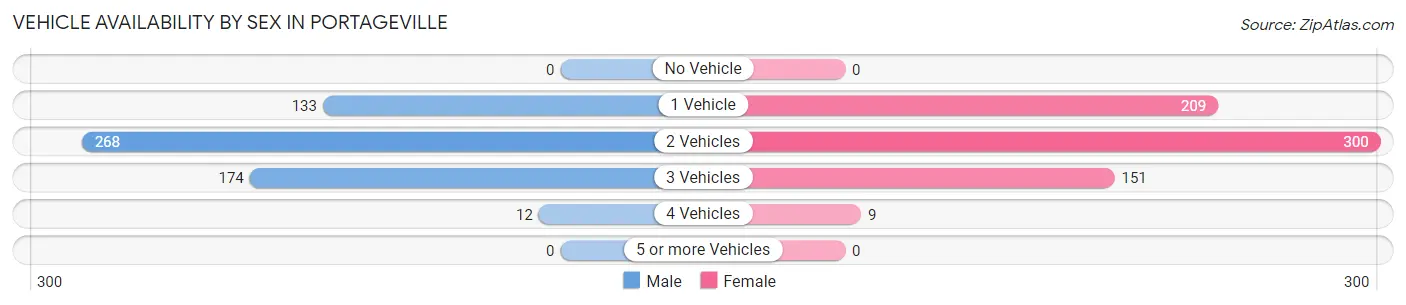
| Vehicles Available | Male | Female |
| No Vehicle | 0 (0.0%) | 0 (0.0%) |
| 1 Vehicle | 133 (22.7%) | 209 (31.2%) |
| 2 Vehicles | 268 (45.7%) | 300 (44.8%) |
| 3 Vehicles | 174 (29.6%) | 151 (22.6%) |
| 4 Vehicles | 12 (2.0%) | 9 (1.3%) |
| 5 or more Vehicles | 0 (0.0%) | 0 (0.0%) |
| Total | 587 (100.0%) | 669 (100.0%) |
Commute Time in Portageville
The most frequently occuring commute durations in Portageville are 5 to 9 minutes (355 commuters, 31.2%), less than 5 minutes (241 commuters, 21.2%), and 20 to 24 minutes (164 commuters, 14.4%).
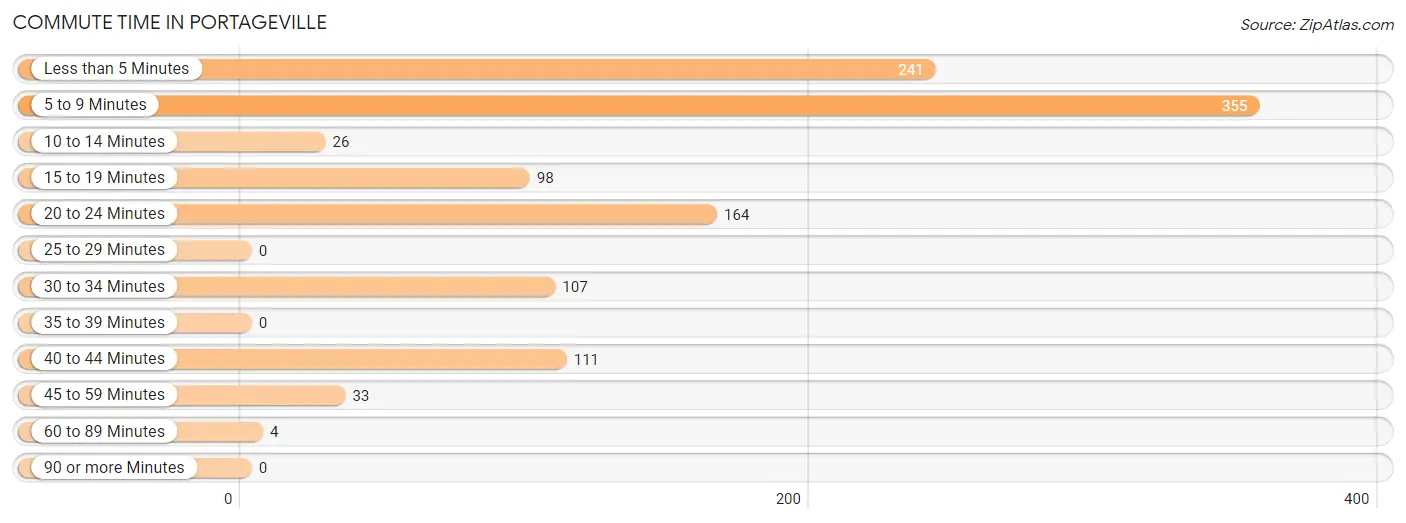
| Commute Time | # Commuters | % Commuters |
| Less than 5 Minutes | 241 | 21.2% |
| 5 to 9 Minutes | 355 | 31.2% |
| 10 to 14 Minutes | 26 | 2.3% |
| 15 to 19 Minutes | 98 | 8.6% |
| 20 to 24 Minutes | 164 | 14.4% |
| 25 to 29 Minutes | 0 | 0.0% |
| 30 to 34 Minutes | 107 | 9.4% |
| 35 to 39 Minutes | 0 | 0.0% |
| 40 to 44 Minutes | 111 | 9.8% |
| 45 to 59 Minutes | 33 | 2.9% |
| 60 to 89 Minutes | 4 | 0.4% |
| 90 or more Minutes | 0 | 0.0% |
Commute Time by Sex in Portageville
The most common commute times in Portageville are less than 5 minutes (159 commuters, 30.0%) for males and 5 to 9 minutes (281 commuters, 46.1%) for females.
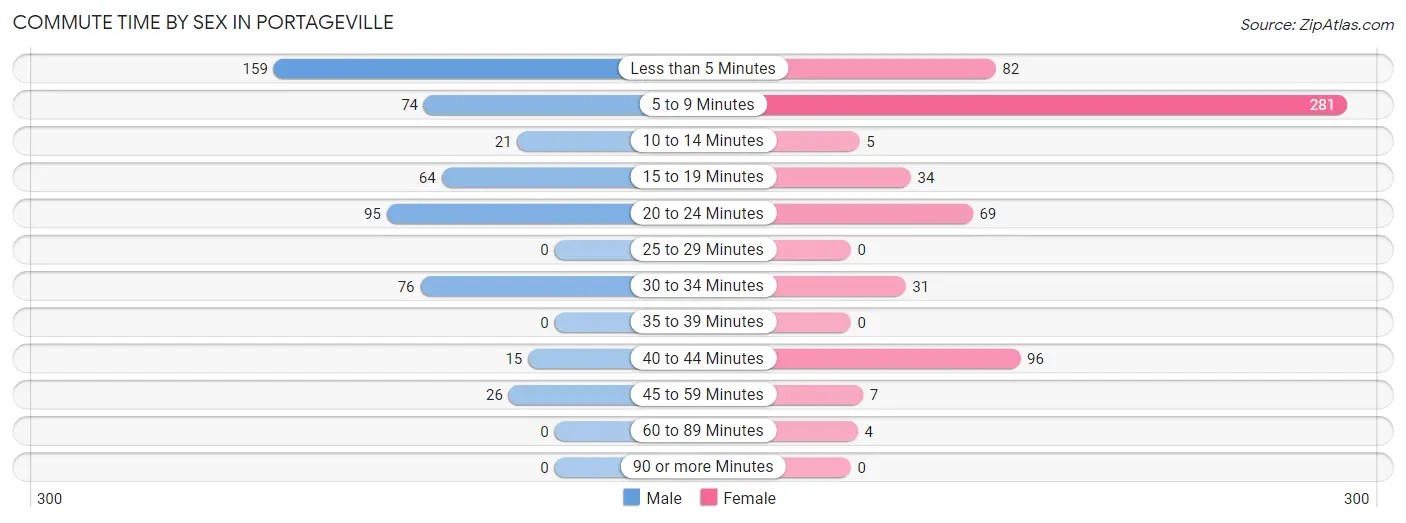
| Commute Time | Male | Female |
| Less than 5 Minutes | 159 (30.0%) | 82 (13.5%) |
| 5 to 9 Minutes | 74 (14.0%) | 281 (46.1%) |
| 10 to 14 Minutes | 21 (4.0%) | 5 (0.8%) |
| 15 to 19 Minutes | 64 (12.1%) | 34 (5.6%) |
| 20 to 24 Minutes | 95 (17.9%) | 69 (11.3%) |
| 25 to 29 Minutes | 0 (0.0%) | 0 (0.0%) |
| 30 to 34 Minutes | 76 (14.3%) | 31 (5.1%) |
| 35 to 39 Minutes | 0 (0.0%) | 0 (0.0%) |
| 40 to 44 Minutes | 15 (2.8%) | 96 (15.8%) |
| 45 to 59 Minutes | 26 (4.9%) | 7 (1.1%) |
| 60 to 89 Minutes | 0 (0.0%) | 4 (0.7%) |
| 90 or more Minutes | 0 (0.0%) | 0 (0.0%) |
Time of Departure to Work by Sex in Portageville
The most frequent times of departure to work in Portageville are 7:00 AM to 7:29 AM (188, 35.5%) for males and 7:30 AM to 7:59 AM (114, 18.7%) for females.
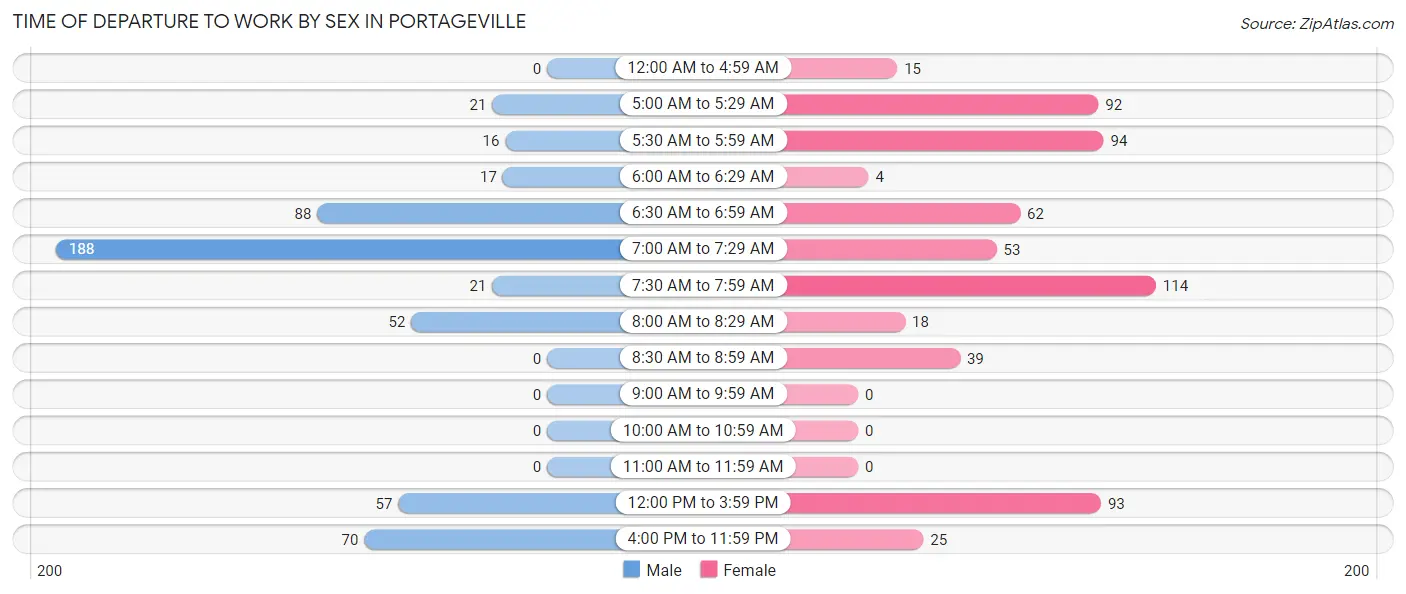
| Time of Departure | Male | Female |
| 12:00 AM to 4:59 AM | 0 (0.0%) | 15 (2.5%) |
| 5:00 AM to 5:29 AM | 21 (4.0%) | 92 (15.1%) |
| 5:30 AM to 5:59 AM | 16 (3.0%) | 94 (15.4%) |
| 6:00 AM to 6:29 AM | 17 (3.2%) | 4 (0.7%) |
| 6:30 AM to 6:59 AM | 88 (16.6%) | 62 (10.2%) |
| 7:00 AM to 7:29 AM | 188 (35.5%) | 53 (8.7%) |
| 7:30 AM to 7:59 AM | 21 (4.0%) | 114 (18.7%) |
| 8:00 AM to 8:29 AM | 52 (9.8%) | 18 (3.0%) |
| 8:30 AM to 8:59 AM | 0 (0.0%) | 39 (6.4%) |
| 9:00 AM to 9:59 AM | 0 (0.0%) | 0 (0.0%) |
| 10:00 AM to 10:59 AM | 0 (0.0%) | 0 (0.0%) |
| 11:00 AM to 11:59 AM | 0 (0.0%) | 0 (0.0%) |
| 12:00 PM to 3:59 PM | 57 (10.7%) | 93 (15.3%) |
| 4:00 PM to 11:59 PM | 70 (13.2%) | 25 (4.1%) |
| Total | 530 (100.0%) | 609 (100.0%) |
Housing Occupancy in Portageville
Occupancy by Ownership in Portageville
Of the total 1,320 dwellings in Portageville, owner-occupied units account for 757 (57.4%), while renter-occupied units make up 563 (42.6%).
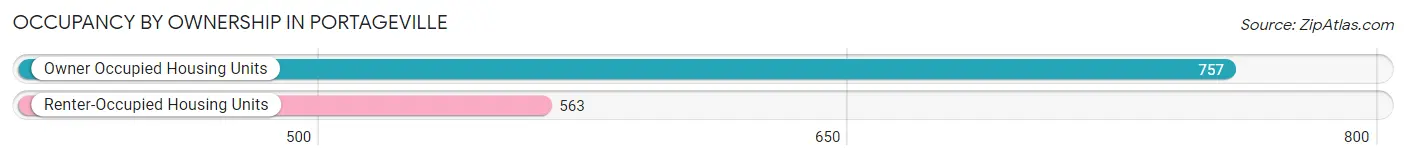
| Occupancy | # Housing Units | % Housing Units |
| Owner Occupied Housing Units | 757 | 57.4% |
| Renter-Occupied Housing Units | 563 | 42.6% |
| Total Occupied Housing Units | 1,320 | 100.0% |
Occupancy by Household Size in Portageville

| Household Size | # Housing Units | % Housing Units |
| 1-Person Household | 477 | 36.1% |
| 2-Person Household | 403 | 30.5% |
| 3-Person Household | 183 | 13.9% |
| 4+ Person Household | 257 | 19.5% |
| Total Housing Units | 1,320 | 100.0% |
Occupancy by Ownership by Household Size in Portageville
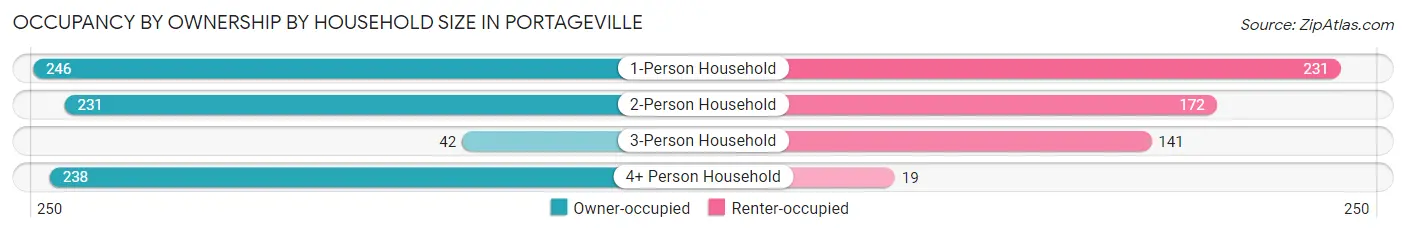
| Household Size | Owner-occupied | Renter-occupied |
| 1-Person Household | 246 (51.6%) | 231 (48.4%) |
| 2-Person Household | 231 (57.3%) | 172 (42.7%) |
| 3-Person Household | 42 (23.0%) | 141 (77.0%) |
| 4+ Person Household | 238 (92.6%) | 19 (7.4%) |
| Total Housing Units | 757 (57.4%) | 563 (42.6%) |
Occupancy by Educational Attainment in Portageville
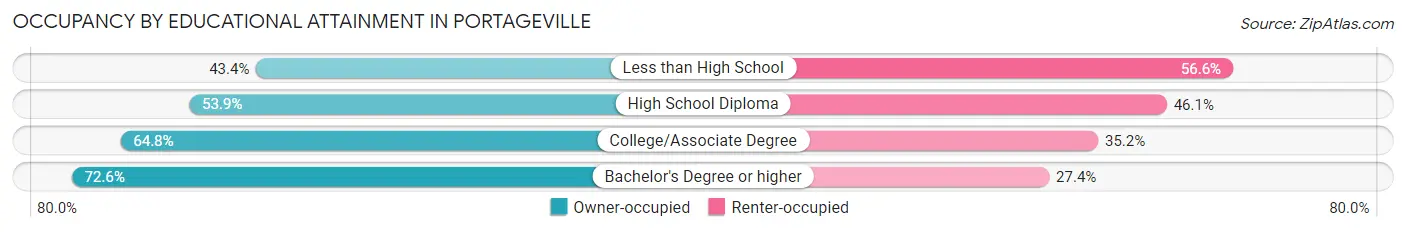
| Household Size | Owner-occupied | Renter-occupied |
| Less than High School | 132 (43.4%) | 172 (56.6%) |
| High School Diploma | 248 (53.9%) | 212 (46.1%) |
| College/Associate Degree | 221 (64.8%) | 120 (35.2%) |
| Bachelor's Degree or higher | 156 (72.6%) | 59 (27.4%) |
Occupancy by Age of Householder in Portageville
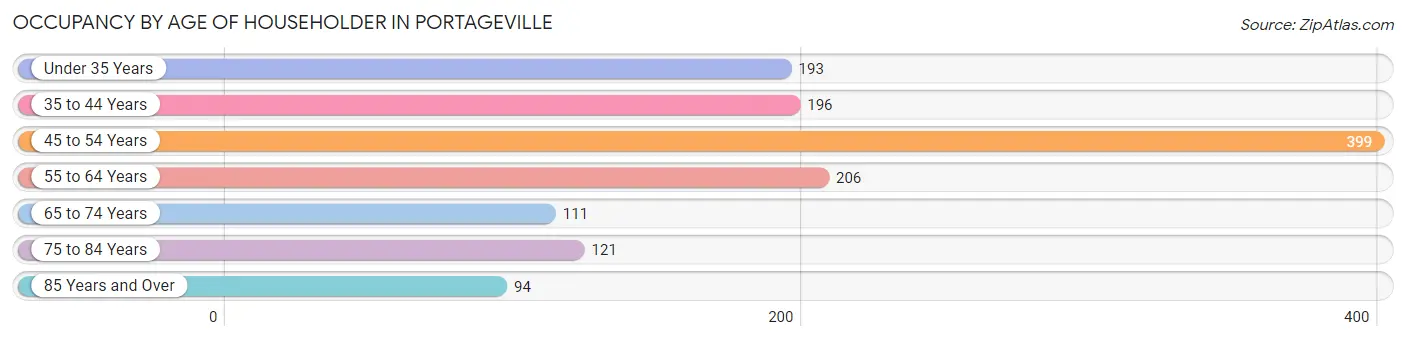
| Age Bracket | # Households | % Households |
| Under 35 Years | 193 | 14.6% |
| 35 to 44 Years | 196 | 14.8% |
| 45 to 54 Years | 399 | 30.2% |
| 55 to 64 Years | 206 | 15.6% |
| 65 to 74 Years | 111 | 8.4% |
| 75 to 84 Years | 121 | 9.2% |
| 85 Years and Over | 94 | 7.1% |
| Total | 1,320 | 100.0% |
Housing Finances in Portageville
Median Income by Occupancy in Portageville
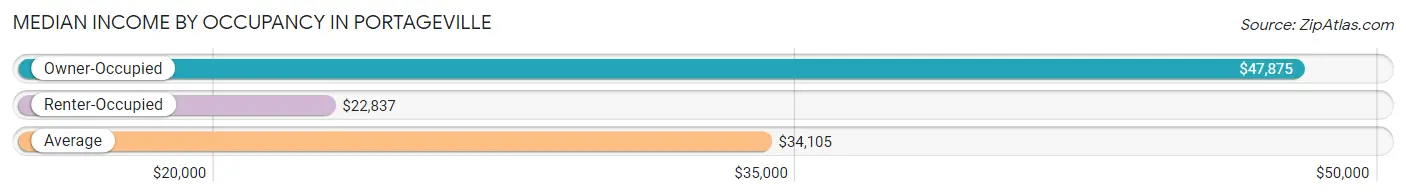
| Occupancy Type | # Households | Median Income |
| Owner-Occupied | 757 (57.4%) | $47,875 |
| Renter-Occupied | 563 (42.6%) | $22,837 |
| Average | 1,320 (100.0%) | $34,105 |
Occupancy by Householder Income Bracket in Portageville
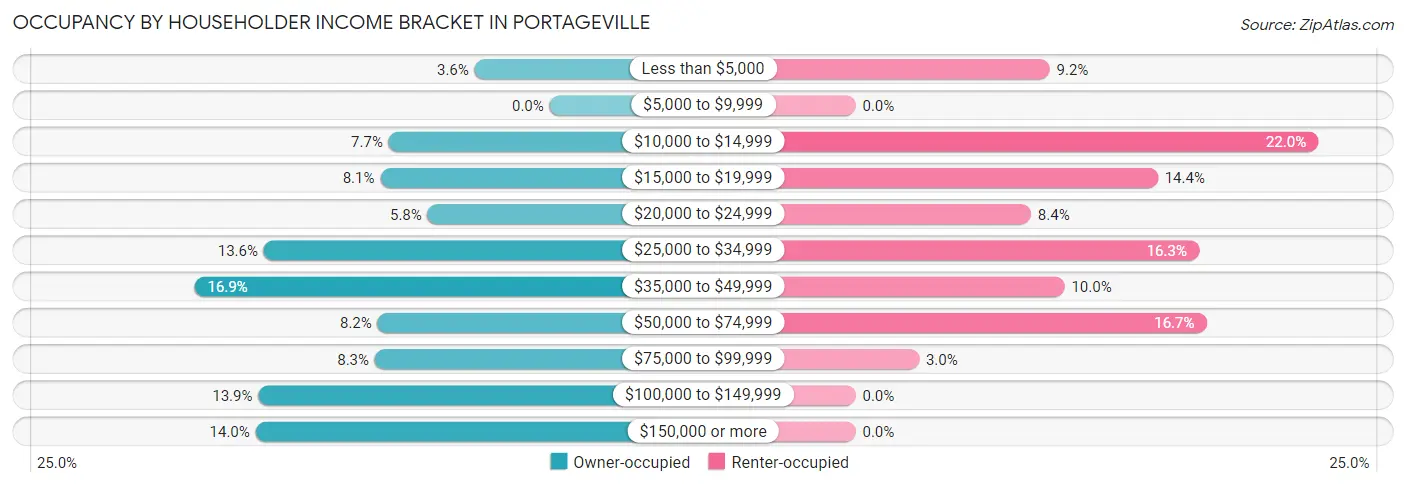
| Income Bracket | Owner-occupied | Renter-occupied |
| Less than $5,000 | 27 (3.6%) | 52 (9.2%) |
| $5,000 to $9,999 | 0 (0.0%) | 0 (0.0%) |
| $10,000 to $14,999 | 58 (7.7%) | 124 (22.0%) |
| $15,000 to $19,999 | 61 (8.1%) | 81 (14.4%) |
| $20,000 to $24,999 | 44 (5.8%) | 47 (8.4%) |
| $25,000 to $34,999 | 103 (13.6%) | 92 (16.3%) |
| $35,000 to $49,999 | 128 (16.9%) | 56 (10.0%) |
| $50,000 to $74,999 | 62 (8.2%) | 94 (16.7%) |
| $75,000 to $99,999 | 63 (8.3%) | 17 (3.0%) |
| $100,000 to $149,999 | 105 (13.9%) | 0 (0.0%) |
| $150,000 or more | 106 (14.0%) | 0 (0.0%) |
| Total | 757 (100.0%) | 563 (100.0%) |
Monthly Housing Cost Tiers in Portageville
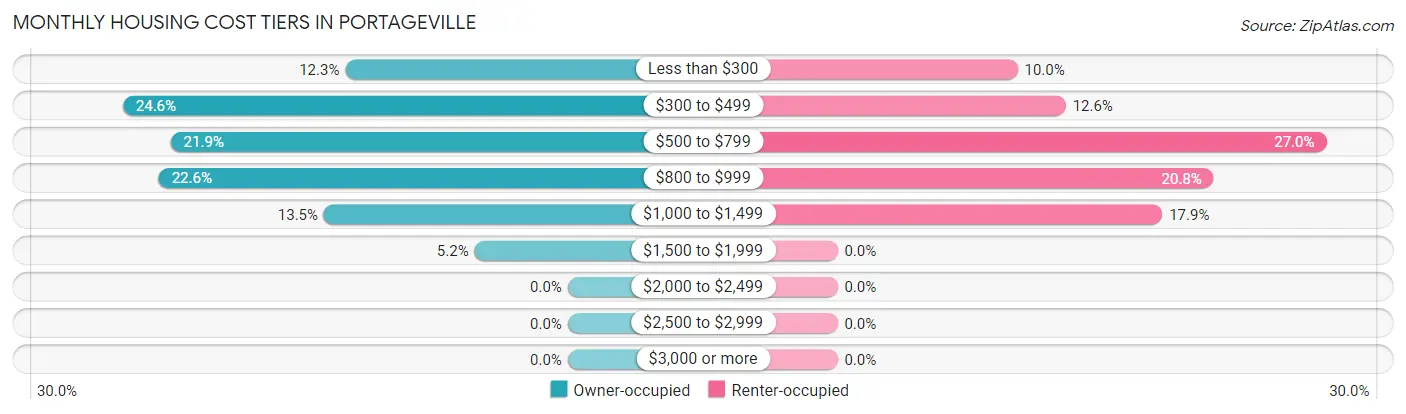
| Monthly Cost | Owner-occupied | Renter-occupied |
| Less than $300 | 93 (12.3%) | 56 (10.0%) |
| $300 to $499 | 186 (24.6%) | 71 (12.6%) |
| $500 to $799 | 166 (21.9%) | 152 (27.0%) |
| $800 to $999 | 171 (22.6%) | 117 (20.8%) |
| $1,000 to $1,499 | 102 (13.5%) | 101 (17.9%) |
| $1,500 to $1,999 | 39 (5.1%) | 0 (0.0%) |
| $2,000 to $2,499 | 0 (0.0%) | 0 (0.0%) |
| $2,500 to $2,999 | 0 (0.0%) | 0 (0.0%) |
| $3,000 or more | 0 (0.0%) | 0 (0.0%) |
| Total | 757 (100.0%) | 563 (100.0%) |
Physical Housing Characteristics in Portageville
Housing Structures in Portageville
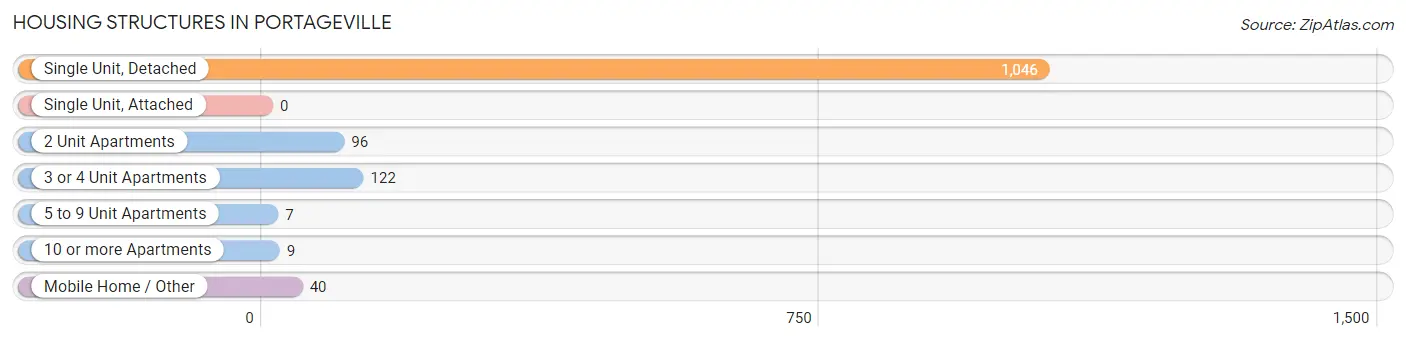
| Structure Type | # Housing Units | % Housing Units |
| Single Unit, Detached | 1,046 | 79.2% |
| Single Unit, Attached | 0 | 0.0% |
| 2 Unit Apartments | 96 | 7.3% |
| 3 or 4 Unit Apartments | 122 | 9.2% |
| 5 to 9 Unit Apartments | 7 | 0.5% |
| 10 or more Apartments | 9 | 0.7% |
| Mobile Home / Other | 40 | 3.0% |
| Total | 1,320 | 100.0% |
Housing Structures by Occupancy in Portageville
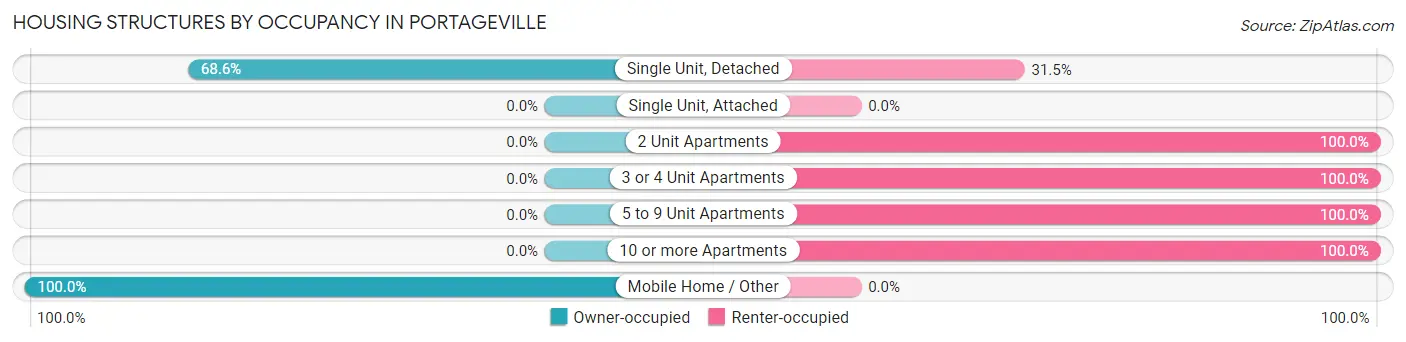
| Structure Type | Owner-occupied | Renter-occupied |
| Single Unit, Detached | 717 (68.5%) | 329 (31.5%) |
| Single Unit, Attached | 0 (0.0%) | 0 (0.0%) |
| 2 Unit Apartments | 0 (0.0%) | 96 (100.0%) |
| 3 or 4 Unit Apartments | 0 (0.0%) | 122 (100.0%) |
| 5 to 9 Unit Apartments | 0 (0.0%) | 7 (100.0%) |
| 10 or more Apartments | 0 (0.0%) | 9 (100.0%) |
| Mobile Home / Other | 40 (100.0%) | 0 (0.0%) |
| Total | 757 (57.4%) | 563 (42.6%) |
Housing Structures by Number of Rooms in Portageville
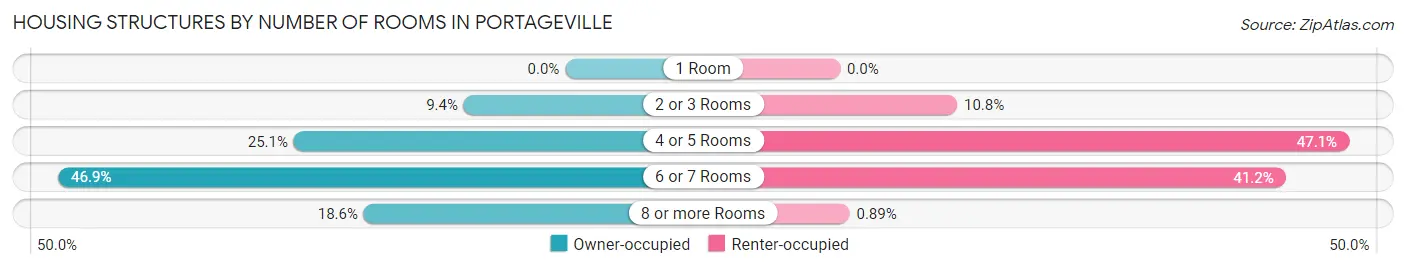
| Number of Rooms | Owner-occupied | Renter-occupied |
| 1 Room | 0 (0.0%) | 0 (0.0%) |
| 2 or 3 Rooms | 71 (9.4%) | 61 (10.8%) |
| 4 or 5 Rooms | 190 (25.1%) | 265 (47.1%) |
| 6 or 7 Rooms | 355 (46.9%) | 232 (41.2%) |
| 8 or more Rooms | 141 (18.6%) | 5 (0.9%) |
| Total | 757 (100.0%) | 563 (100.0%) |
Housing Structure by Heating Type in Portageville
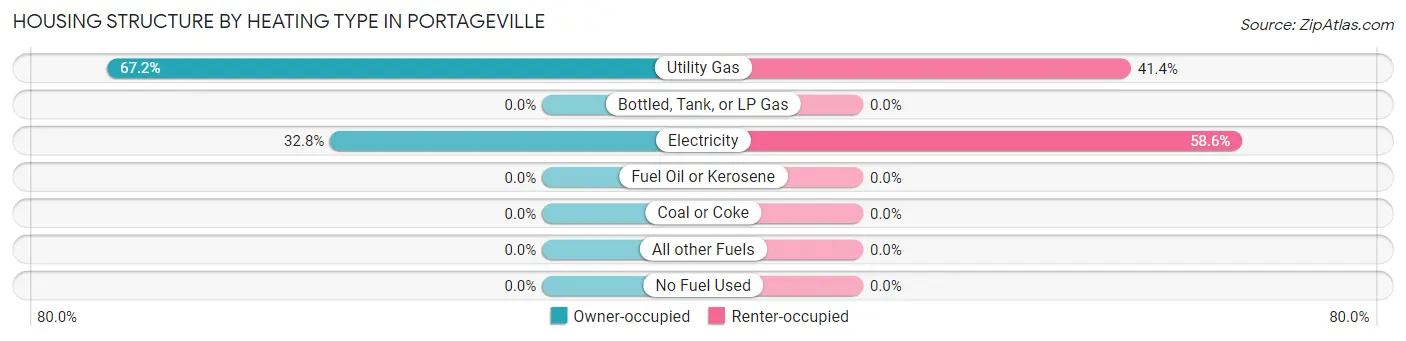
| Heating Type | Owner-occupied | Renter-occupied |
| Utility Gas | 509 (67.2%) | 233 (41.4%) |
| Bottled, Tank, or LP Gas | 0 (0.0%) | 0 (0.0%) |
| Electricity | 248 (32.8%) | 330 (58.6%) |
| Fuel Oil or Kerosene | 0 (0.0%) | 0 (0.0%) |
| Coal or Coke | 0 (0.0%) | 0 (0.0%) |
| All other Fuels | 0 (0.0%) | 0 (0.0%) |
| No Fuel Used | 0 (0.0%) | 0 (0.0%) |
| Total | 757 (100.0%) | 563 (100.0%) |
Household Vehicle Usage in Portageville
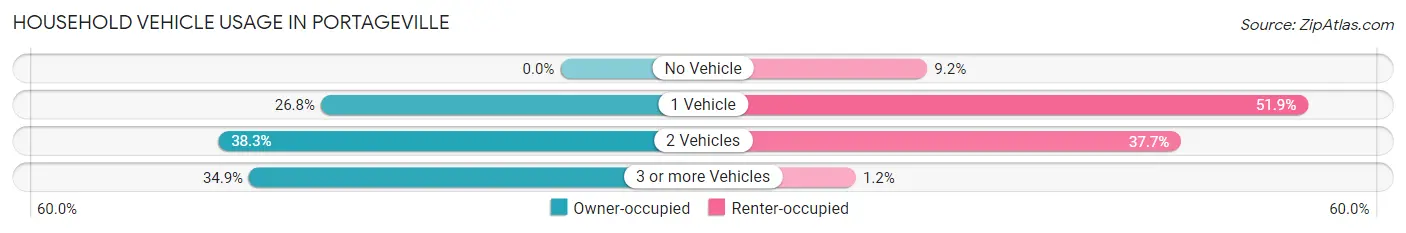
| Vehicles per Household | Owner-occupied | Renter-occupied |
| No Vehicle | 0 (0.0%) | 52 (9.2%) |
| 1 Vehicle | 203 (26.8%) | 292 (51.9%) |
| 2 Vehicles | 290 (38.3%) | 212 (37.7%) |
| 3 or more Vehicles | 264 (34.9%) | 7 (1.2%) |
| Total | 757 (100.0%) | 563 (100.0%) |
Real Estate & Mortgages in Portageville
Real Estate and Mortgage Overview in Portageville
| Characteristic | Without Mortgage | With Mortgage |
| Housing Units | 403 | 354 |
| Median Property Value | $145,100 | $110,700 |
| Median Household Income | $41,326 | $68 |
| Monthly Housing Costs | $361 | $0 |
| Real Estate Taxes | $762 | $0 |
Property Value by Mortgage Status in Portageville
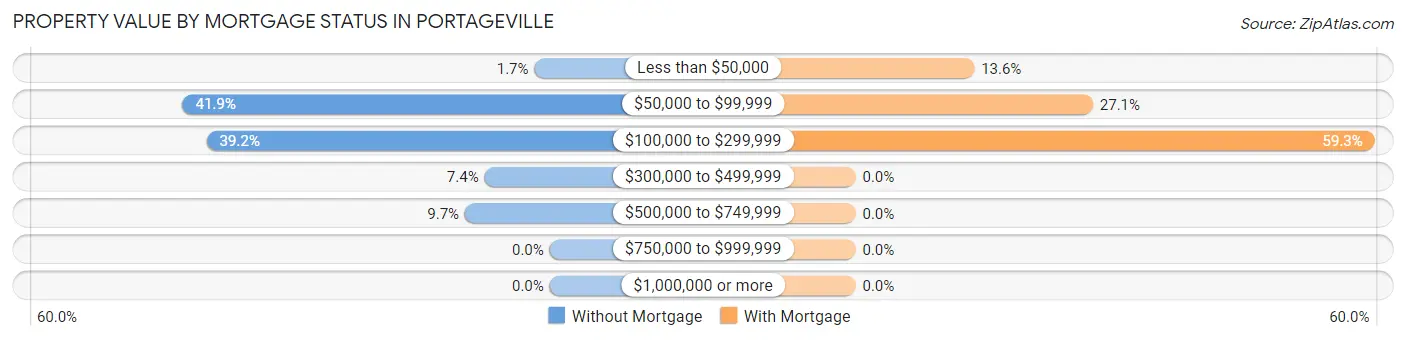
| Property Value | Without Mortgage | With Mortgage |
| Less than $50,000 | 7 (1.7%) | 48 (13.6%) |
| $50,000 to $99,999 | 169 (41.9%) | 96 (27.1%) |
| $100,000 to $299,999 | 158 (39.2%) | 210 (59.3%) |
| $300,000 to $499,999 | 30 (7.4%) | 0 (0.0%) |
| $500,000 to $749,999 | 39 (9.7%) | 0 (0.0%) |
| $750,000 to $999,999 | 0 (0.0%) | 0 (0.0%) |
| $1,000,000 or more | 0 (0.0%) | 0 (0.0%) |
| Total | 403 (100.0%) | 354 (100.0%) |
Household Income by Mortgage Status in Portageville
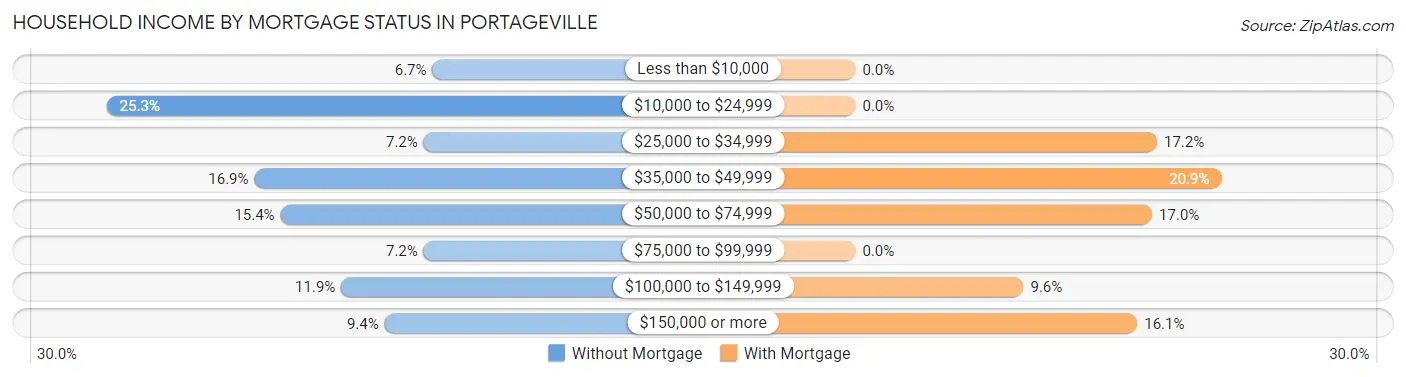
| Household Income | Without Mortgage | With Mortgage |
| Less than $10,000 | 27 (6.7%) | 0 (0.0%) |
| $10,000 to $24,999 | 102 (25.3%) | 0 (0.0%) |
| $25,000 to $34,999 | 29 (7.2%) | 61 (17.2%) |
| $35,000 to $49,999 | 68 (16.9%) | 74 (20.9%) |
| $50,000 to $74,999 | 62 (15.4%) | 60 (17.0%) |
| $75,000 to $99,999 | 29 (7.2%) | 0 (0.0%) |
| $100,000 to $149,999 | 48 (11.9%) | 34 (9.6%) |
| $150,000 or more | 38 (9.4%) | 57 (16.1%) |
| Total | 403 (100.0%) | 354 (100.0%) |
Property Value to Household Income Ratio in Portageville
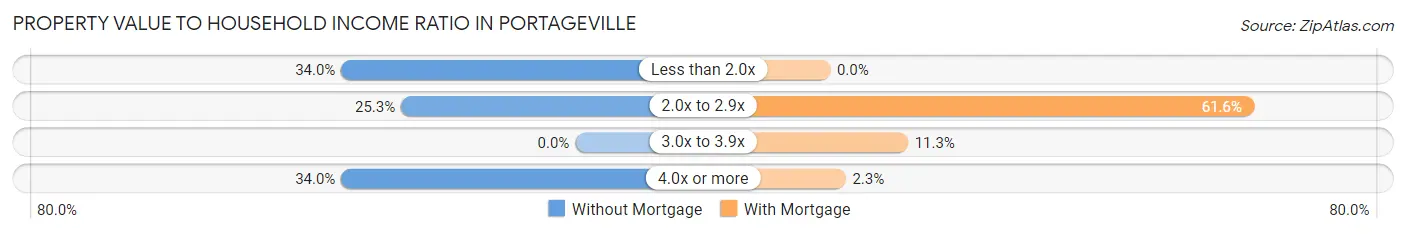
| Value-to-Income Ratio | Without Mortgage | With Mortgage |
| Less than 2.0x | 137 (34.0%) | 0 (0.0%) |
| 2.0x to 2.9x | 102 (25.3%) | 218 (61.6%) |
| 3.0x to 3.9x | 0 (0.0%) | 40 (11.3%) |
| 4.0x or more | 137 (34.0%) | 8 (2.3%) |
| Total | 403 (100.0%) | 354 (100.0%) |
Real Estate Taxes by Mortgage Status in Portageville
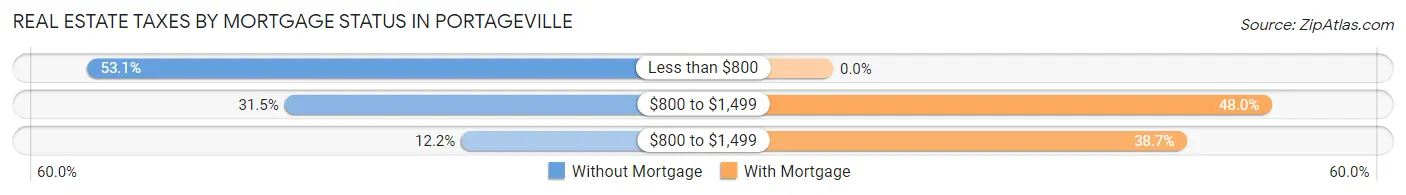
| Property Taxes | Without Mortgage | With Mortgage |
| Less than $800 | 214 (53.1%) | 0 (0.0%) |
| $800 to $1,499 | 127 (31.5%) | 170 (48.0%) |
| $800 to $1,499 | 49 (12.2%) | 137 (38.7%) |
| Total | 403 (100.0%) | 354 (100.0%) |
Health & Disability in Portageville
Health Insurance Coverage by Age in Portageville
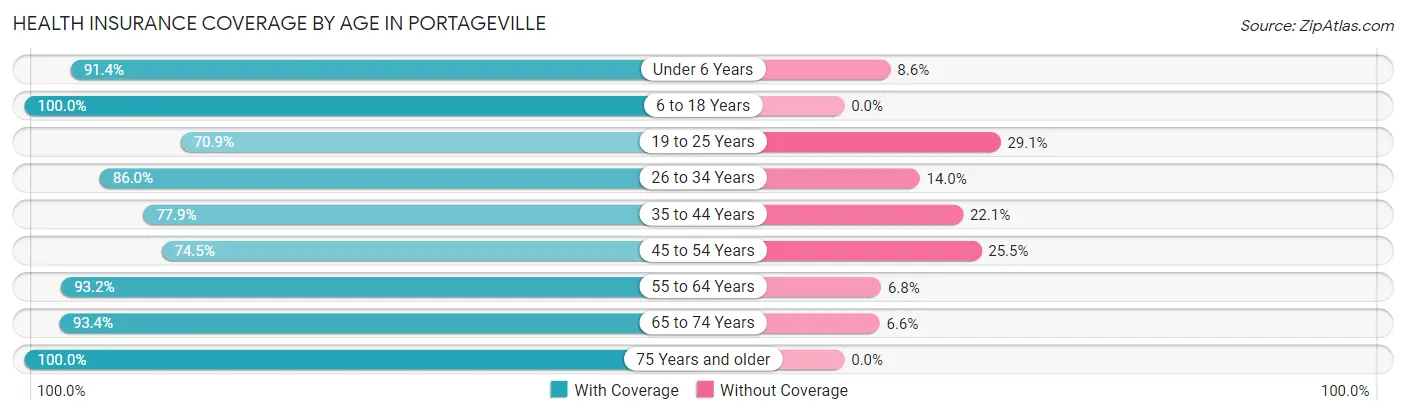
| Age Bracket | With Coverage | Without Coverage |
| Under 6 Years | 202 (91.4%) | 19 (8.6%) |
| 6 to 18 Years | 476 (100.0%) | 0 (0.0%) |
| 19 to 25 Years | 185 (70.9%) | 76 (29.1%) |
| 26 to 34 Years | 202 (86.0%) | 33 (14.0%) |
| 35 to 44 Years | 278 (77.9%) | 79 (22.1%) |
| 45 to 54 Years | 344 (74.5%) | 118 (25.5%) |
| 55 to 64 Years | 395 (93.2%) | 29 (6.8%) |
| 65 to 74 Years | 199 (93.4%) | 14 (6.6%) |
| 75 Years and older | 215 (100.0%) | 0 (0.0%) |
| Total | 2,496 (87.2%) | 368 (12.9%) |
Health Insurance Coverage by Citizenship Status in Portageville
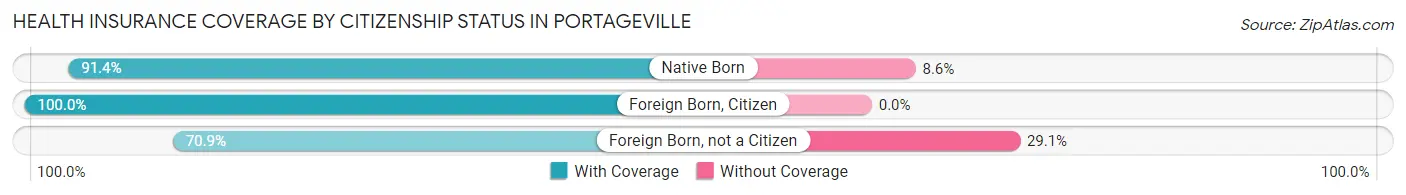
| Citizenship Status | With Coverage | Without Coverage |
| Native Born | 202 (91.4%) | 19 (8.6%) |
| Foreign Born, Citizen | 476 (100.0%) | 0 (0.0%) |
| Foreign Born, not a Citizen | 185 (70.9%) | 76 (29.1%) |
Health Insurance Coverage by Household Income in Portageville
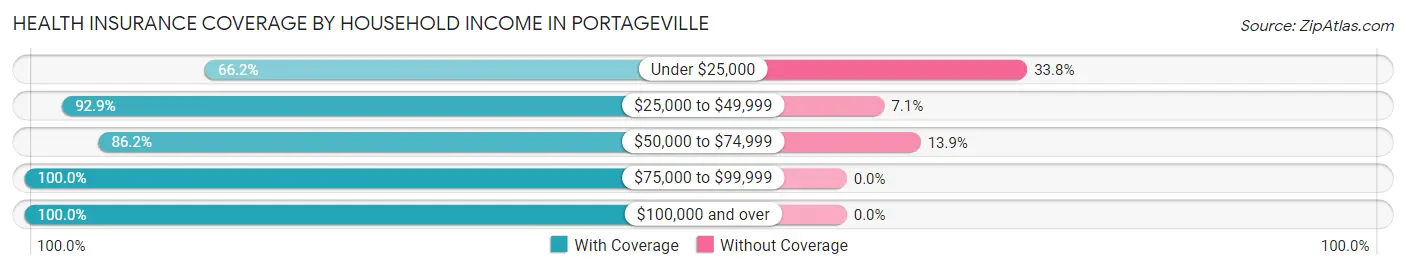
| Household Income | With Coverage | Without Coverage |
| Under $25,000 | 505 (66.2%) | 258 (33.8%) |
| $25,000 to $49,999 | 856 (92.9%) | 65 (7.1%) |
| $50,000 to $74,999 | 280 (86.2%) | 45 (13.9%) |
| $75,000 to $99,999 | 272 (100.0%) | 0 (0.0%) |
| $100,000 and over | 583 (100.0%) | 0 (0.0%) |
Public vs Private Health Insurance Coverage by Age in Portageville
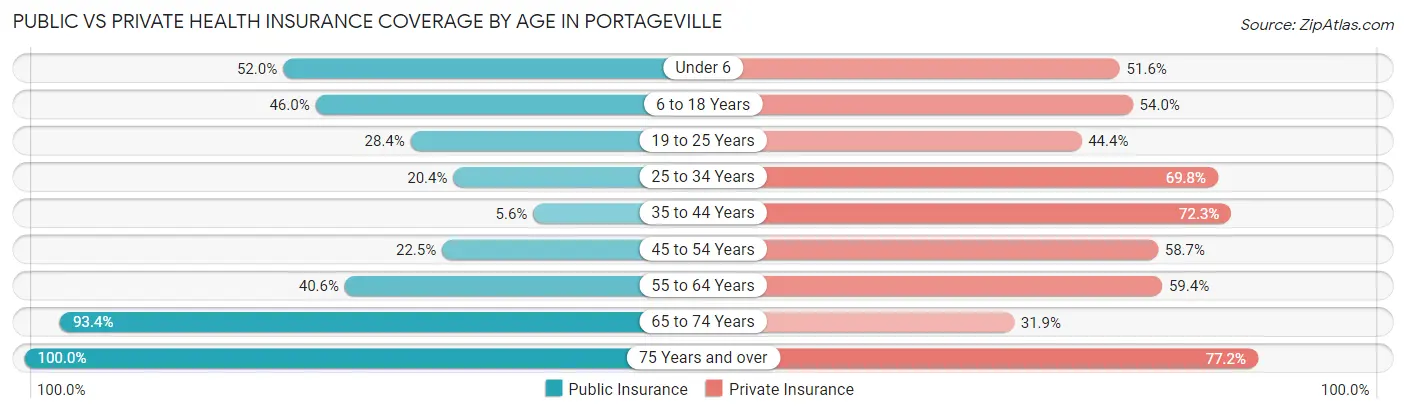
| Age Bracket | Public Insurance | Private Insurance |
| Under 6 | 115 (52.0%) | 114 (51.6%) |
| 6 to 18 Years | 219 (46.0%) | 257 (54.0%) |
| 19 to 25 Years | 74 (28.3%) | 116 (44.4%) |
| 25 to 34 Years | 48 (20.4%) | 164 (69.8%) |
| 35 to 44 Years | 20 (5.6%) | 258 (72.3%) |
| 45 to 54 Years | 104 (22.5%) | 271 (58.7%) |
| 55 to 64 Years | 172 (40.6%) | 252 (59.4%) |
| 65 to 74 Years | 199 (93.4%) | 68 (31.9%) |
| 75 Years and over | 215 (100.0%) | 166 (77.2%) |
| Total | 1,166 (40.7%) | 1,666 (58.2%) |
Disability Status by Sex by Age in Portageville
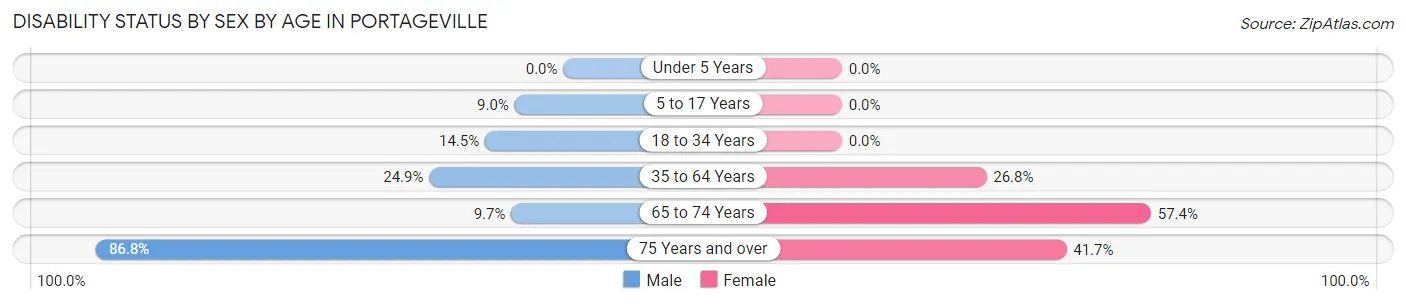
| Age Bracket | Male | Female |
| Under 5 Years | 0 (0.0%) | 0 (0.0%) |
| 5 to 17 Years | 17 (9.0%) | 0 (0.0%) |
| 18 to 34 Years | 51 (14.5%) | 0 (0.0%) |
| 35 to 64 Years | 108 (24.9%) | 217 (26.8%) |
| 65 to 74 Years | 14 (9.7%) | 39 (57.4%) |
| 75 Years and over | 72 (86.8%) | 55 (41.7%) |
Disability Class by Sex by Age in Portageville
Disability Class: Hearing Difficulty
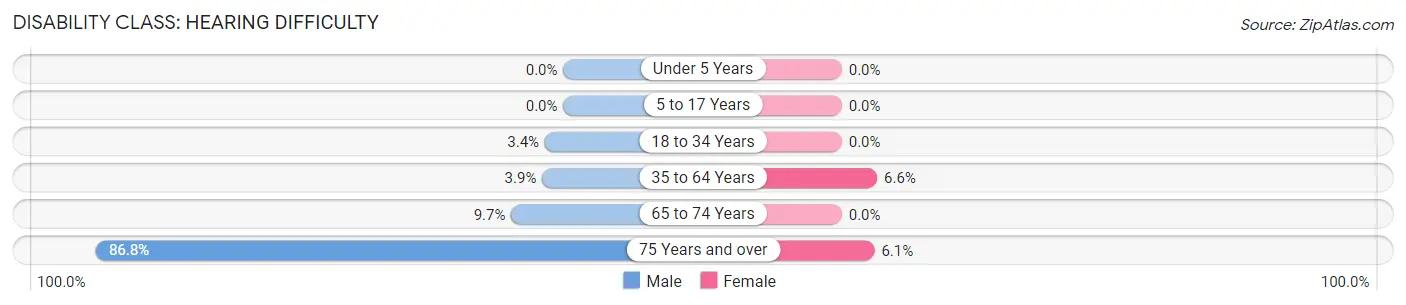
| Age Bracket | Male | Female |
| Under 5 Years | 0 (0.0%) | 0 (0.0%) |
| 5 to 17 Years | 0 (0.0%) | 0 (0.0%) |
| 18 to 34 Years | 12 (3.4%) | 0 (0.0%) |
| 35 to 64 Years | 17 (3.9%) | 53 (6.6%) |
| 65 to 74 Years | 14 (9.7%) | 0 (0.0%) |
| 75 Years and over | 72 (86.8%) | 8 (6.1%) |
Disability Class: Vision Difficulty
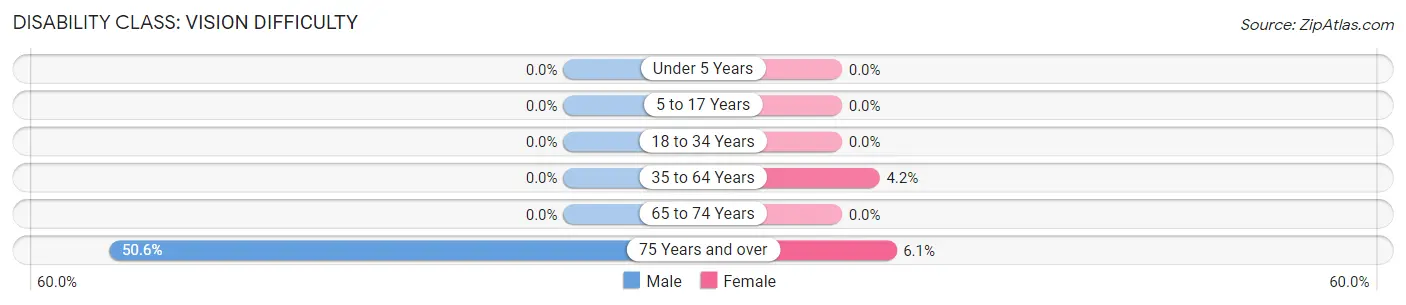
| Age Bracket | Male | Female |
| Under 5 Years | 0 (0.0%) | 0 (0.0%) |
| 5 to 17 Years | 0 (0.0%) | 0 (0.0%) |
| 18 to 34 Years | 0 (0.0%) | 0 (0.0%) |
| 35 to 64 Years | 0 (0.0%) | 34 (4.2%) |
| 65 to 74 Years | 0 (0.0%) | 0 (0.0%) |
| 75 Years and over | 42 (50.6%) | 8 (6.1%) |
Disability Class: Cognitive Difficulty
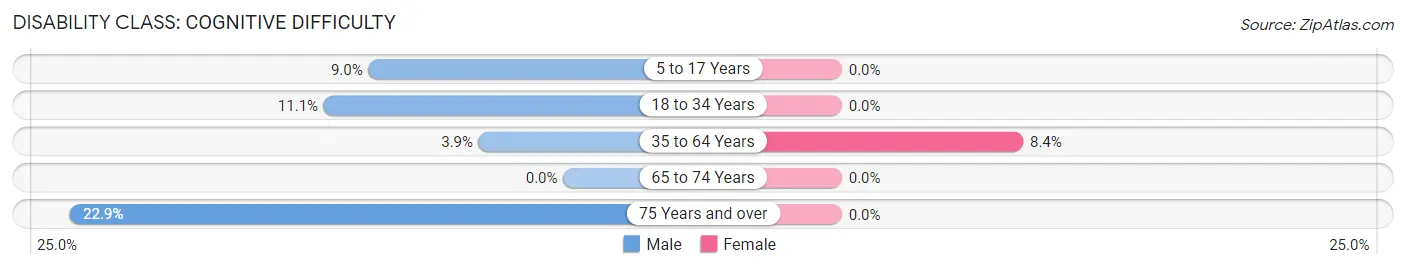
| Age Bracket | Male | Female |
| 5 to 17 Years | 17 (9.0%) | 0 (0.0%) |
| 18 to 34 Years | 39 (11.1%) | 0 (0.0%) |
| 35 to 64 Years | 17 (3.9%) | 68 (8.4%) |
| 65 to 74 Years | 0 (0.0%) | 0 (0.0%) |
| 75 Years and over | 19 (22.9%) | 0 (0.0%) |
Disability Class: Ambulatory Difficulty
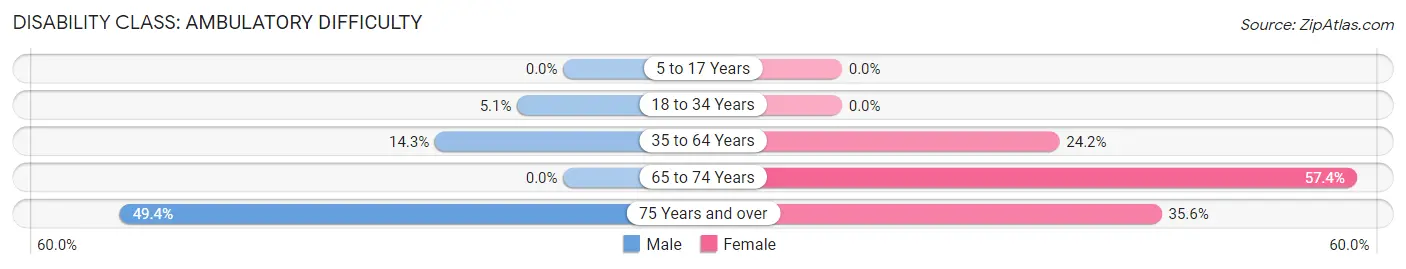
| Age Bracket | Male | Female |
| 5 to 17 Years | 0 (0.0%) | 0 (0.0%) |
| 18 to 34 Years | 18 (5.1%) | 0 (0.0%) |
| 35 to 64 Years | 62 (14.3%) | 196 (24.2%) |
| 65 to 74 Years | 0 (0.0%) | 39 (57.4%) |
| 75 Years and over | 41 (49.4%) | 47 (35.6%) |
Disability Class: Self-Care Difficulty
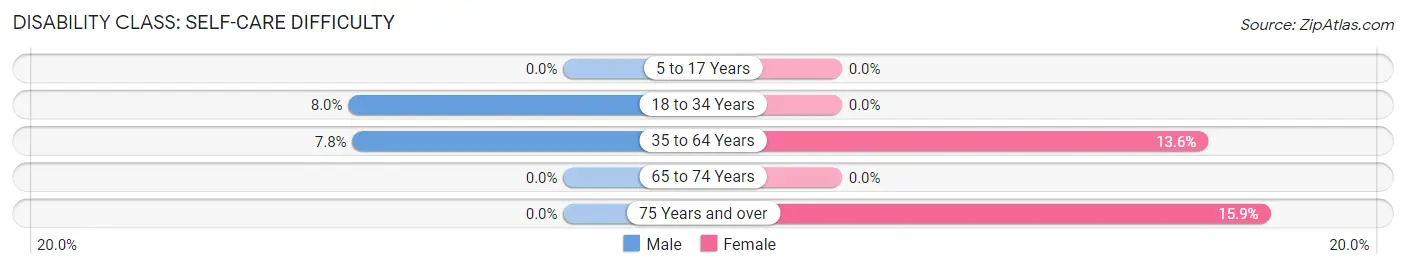
| Age Bracket | Male | Female |
| 5 to 17 Years | 0 (0.0%) | 0 (0.0%) |
| 18 to 34 Years | 28 (8.0%) | 0 (0.0%) |
| 35 to 64 Years | 34 (7.8%) | 110 (13.6%) |
| 65 to 74 Years | 0 (0.0%) | 0 (0.0%) |
| 75 Years and over | 0 (0.0%) | 21 (15.9%) |
Technology Access in Portageville
Computing Device Access in Portageville
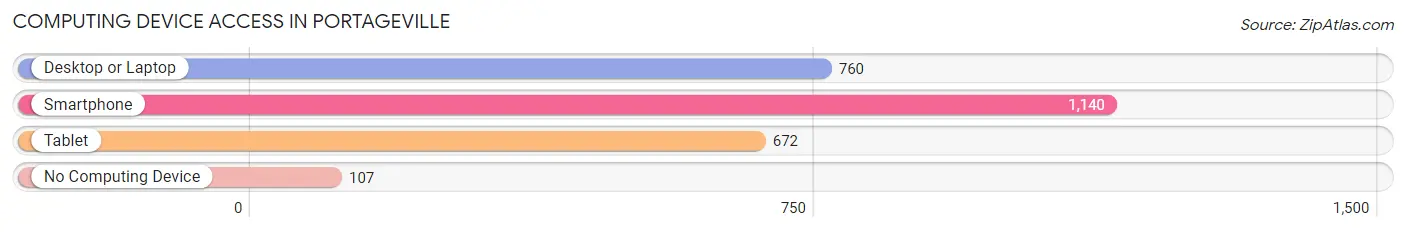
| Device Type | # Households | % Households |
| Desktop or Laptop | 760 | 57.6% |
| Smartphone | 1,140 | 86.4% |
| Tablet | 672 | 50.9% |
| No Computing Device | 107 | 8.1% |
| Total | 1,320 | 100.0% |
Internet Access in Portageville
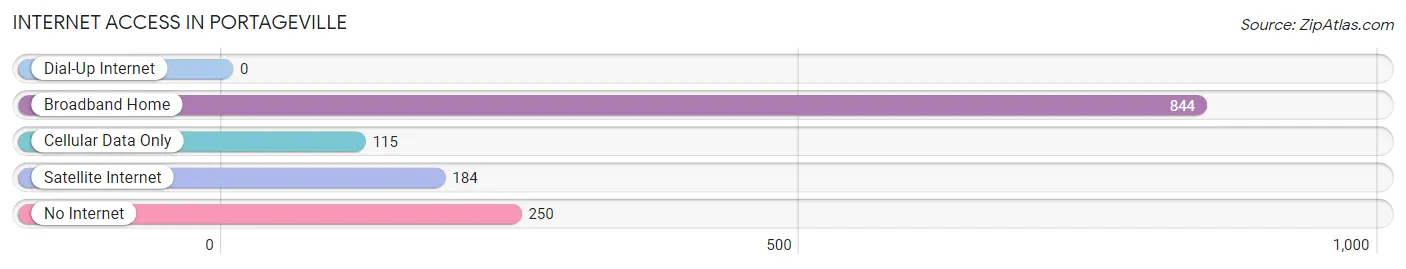
| Internet Type | # Households | % Households |
| Dial-Up Internet | 0 | 0.0% |
| Broadband Home | 844 | 63.9% |
| Cellular Data Only | 115 | 8.7% |
| Satellite Internet | 184 | 13.9% |
| No Internet | 250 | 18.9% |
| Total | 1,320 | 100.0% |
Portageville Summary
Portageville, Missouri is a small town located in the southeastern corner of the state, in Pemiscot County. It is situated on the banks of the Mississippi River, and is the county seat of Pemiscot County. The town was founded in 1837, and was named after the nearby Portage des Sioux, a Native American trading post. The town has a population of 2,845, according to the 2010 census.
Geography
Portageville is located at 36°25'25"N 89°41'45"W (36.423, -89.695). It is situated on the banks of the Mississippi River, and is the county seat of Pemiscot County. The town is located in the southeastern corner of the state, and is bordered by the states of Arkansas and Tennessee. The town is located in the Bootheel region of Missouri, and is part of the Mississippi Alluvial Plain. The town is located in the humid subtropical climate zone, and has hot, humid summers and mild winters.
The town is located in the Mississippi Delta, and is surrounded by agricultural land. The town is located on the banks of the Mississippi River, and is home to several parks and recreational areas. The town is also home to the Portageville Wildlife Refuge, which is a protected area of wetlands and woodlands.
Economy
The economy of Portageville is largely based on agriculture. The town is located in the Mississippi Delta, and is surrounded by agricultural land. The town is home to several large farms, and is a major producer of cotton, soybeans, corn, and rice. The town is also home to several manufacturing companies, including a paper mill, a furniture factory, and a plastics factory.
The town is also home to several retail stores, restaurants, and other businesses. The town is home to several banks, and is a major center for banking and finance in the region. The town is also home to several medical facilities, including a hospital and several clinics.
Demographics
According to the 2010 census, the population of Portageville was 2,845. The racial makeup of the town was 79.3% White, 18.2% African American, 0.3% Native American, 0.2% Asian, 0.1% Pacific Islander, 0.7% from other races, and 1.4% from two or more races. Hispanic or Latino of any race were 1.7% of the population.
The median income for a household in the town was $30,938, and the median income for a family was $37,917. The per capita income for the town was $15,945. About 17.2% of families and 20.3% of the population were below the poverty line, including 28.2% of those under age 18 and 16.2% of those age 65 or over.
Conclusion
Portageville, Missouri is a small town located in the southeastern corner of the state, in Pemiscot County. It is situated on the banks of the Mississippi River, and is the county seat of Pemiscot County. The town was founded in 1837, and was named after the nearby Portage des Sioux, a Native American trading post. The town has a population of 2,845, according to the 2010 census. The economy of Portageville is largely based on agriculture, and the town is home to several large farms, manufacturing companies, retail stores, restaurants, and other businesses. The racial makeup of the town was 79.3% White, 18.2% African American, 0.3% Native American, 0.2% Asian, 0.1% Pacific Islander, 0.7% from other races, and 1.4% from two or more races. The median income for a household in the town was $30,938, and the median income for a family was $37,917. About 17.2% of families and 20.3% of the population were below the poverty line. Portageville is a small town with a rich history and a vibrant economy.
Common Questions
What is Per Capita Income in Portageville?
Per Capita income in Portageville is $27,524.
What is the Median Family Income in Portageville?
Median Family Income in Portageville is $42,008.
What is the Median Household income in Portageville?
Median Household Income in Portageville is $34,105.
What is Income or Wage Gap in Portageville?
Income or Wage Gap in Portageville is 26.0%.
Women in Portageville earn 74.0 cents for every dollar earned by a man.
What is Family Income Deficit in Portageville?
Family Income Deficit in Portageville is $11,336.
Families that are below poverty line in Portageville earn $11,336 less on average than the poverty threshold level.
What is Inequality or Gini Index in Portageville?
Inequality or Gini Index in Portageville is 0.55.
What is the Total Population of Portageville?
Total Population of Portageville is 2,918.
What is the Total Male Population of Portageville?
Total Male Population of Portageville is 1,333.
What is the Total Female Population of Portageville?
Total Female Population of Portageville is 1,585.
What is the Ratio of Males per 100 Females in Portageville?
There are 84.10 Males per 100 Females in Portageville.
What is the Ratio of Females per 100 Males in Portageville?
There are 118.90 Females per 100 Males in Portageville.
What is the Median Population Age in Portageville?
Median Population Age in Portageville is 43.4 Years.
What is the Average Family Size in Portageville
Average Family Size in Portageville is 2.8 People.
What is the Average Household Size in Portageville
Average Household Size in Portageville is 2.2 People.
How Large is the Labor Force in Portageville?
There are 1,323 People in the Labor Forcein in Portageville.
What is the Percentage of People in the Labor Force in Portageville?
55.5% of People are in the Labor Force in Portageville.
What is the Unemployment Rate in Portageville?
Unemployment Rate in Portageville is 4.5%.