Pilot Knob, MO Map & Demographics
Pilot Knob Map
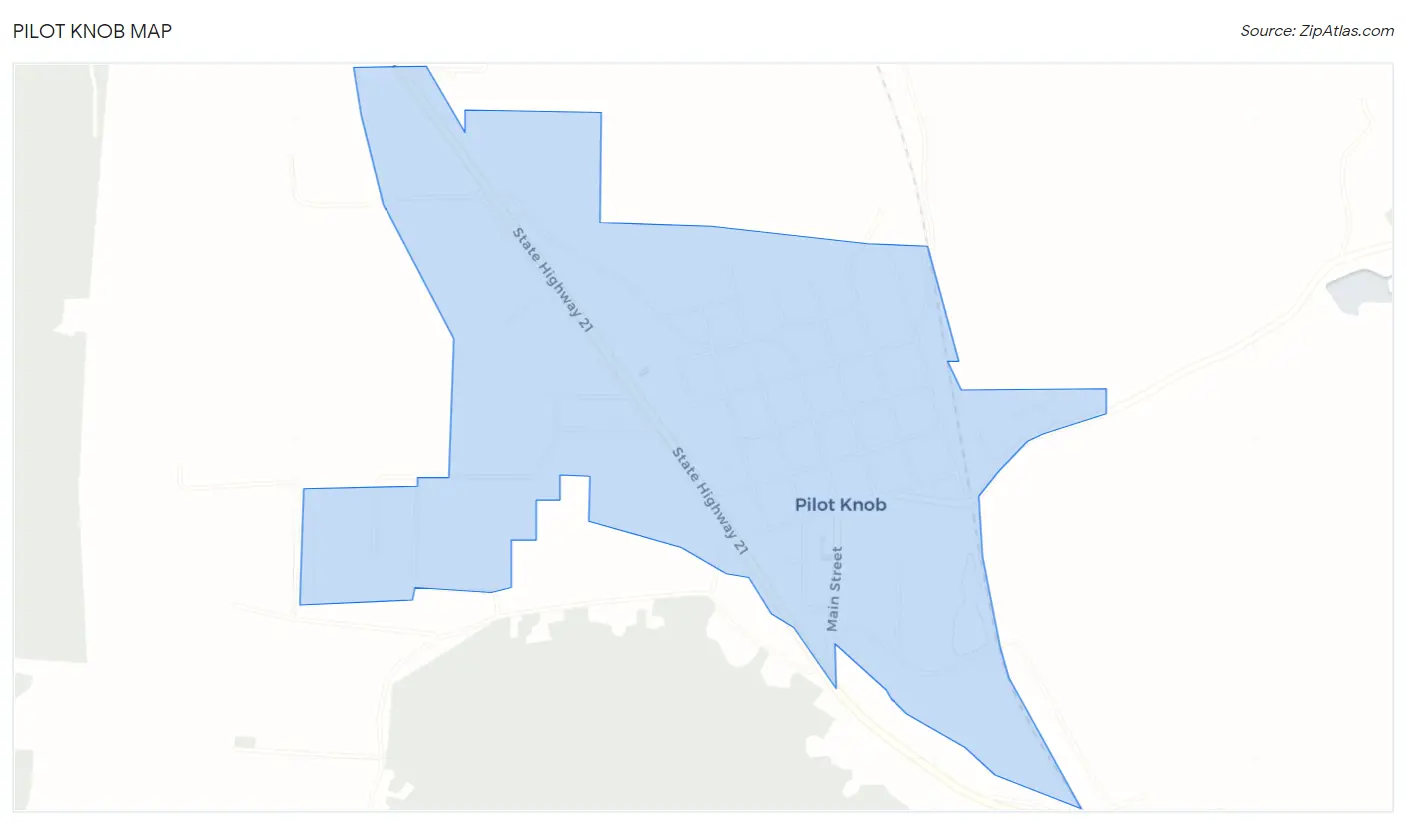
Pilot Knob Overview
$24,449
PER CAPITA INCOME
$68,438
AVG FAMILY INCOME
$44,375
AVG HOUSEHOLD INCOME
23.7%
WAGE / INCOME GAP [ % ]
76.3¢/ $1
WAGE / INCOME GAP [ $ ]
0.39
INEQUALITY / GINI INDEX
773
TOTAL POPULATION
363
MALE POPULATION
410
FEMALE POPULATION
88.54
MALES / 100 FEMALES
112.95
FEMALES / 100 MALES
45.1
MEDIAN AGE
2.6
AVG FAMILY SIZE
2.2
AVG HOUSEHOLD SIZE
390
LABOR FORCE [ PEOPLE ]
61.0%
PERCENT IN LABOR FORCE
8.5%
UNEMPLOYMENT RATE
Pilot Knob Zip Codes
Pilot Knob Area Codes
Income in Pilot Knob
Income Overview in Pilot Knob
Per Capita Income in Pilot Knob is $24,449, while median incomes of families and households are $68,438 and $44,375 respectively.
| Characteristic | Number | Measure |
| Per Capita Income | 773 | $24,449 |
| Median Family Income | 229 | $68,438 |
| Mean Family Income | 229 | $70,838 |
| Median Household Income | 338 | $44,375 |
| Mean Household Income | 338 | $59,081 |
| Income Deficit | 229 | $0 |
| Wage / Income Gap (%) | 773 | 23.66% |
| Wage / Income Gap ($) | 773 | 76.34¢ per $1 |
| Gini / Inequality Index | 773 | 0.39 |
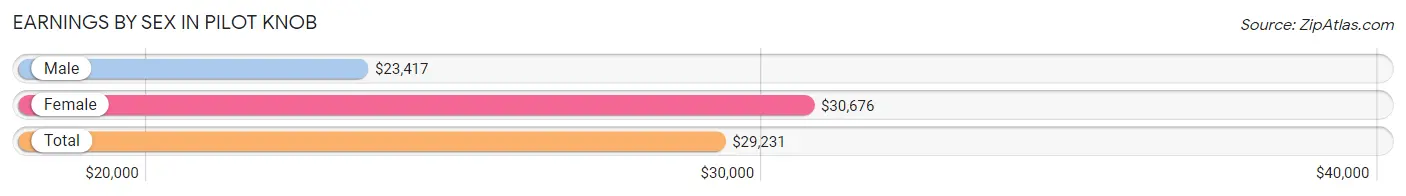
Earnings by Sex in Pilot Knob
Average Earnings in Pilot Knob are $29,231, $23,417 for men and $30,676 for women, a difference of 23.7%.
| Sex | Number | Average Earnings |
| Male | 179 (44.1%) | $23,417 |
| Female | 227 (55.9%) | $30,676 |
| Total | 406 (100.0%) | $29,231 |
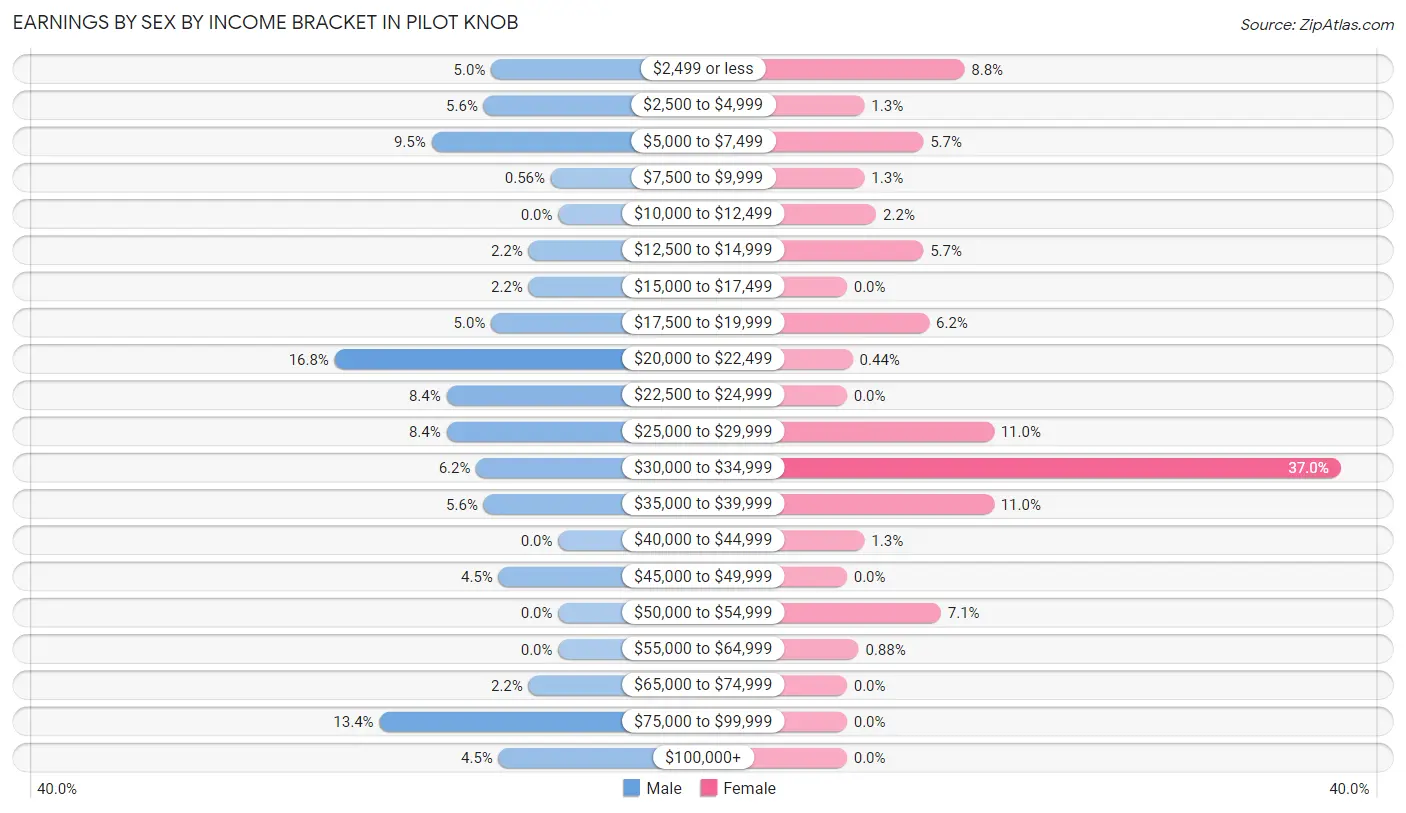
Earnings by Sex by Income Bracket in Pilot Knob
The most common earnings brackets in Pilot Knob are $20,000 to $22,499 for men (30 | 16.8%) and $30,000 to $34,999 for women (84 | 37.0%).
| Income | Male | Female |
| $2,499 or less | 9 (5.0%) | 20 (8.8%) |
| $2,500 to $4,999 | 10 (5.6%) | 3 (1.3%) |
| $5,000 to $7,499 | 17 (9.5%) | 13 (5.7%) |
| $7,500 to $9,999 | 1 (0.6%) | 3 (1.3%) |
| $10,000 to $12,499 | 0 (0.0%) | 5 (2.2%) |
| $12,500 to $14,999 | 4 (2.2%) | 13 (5.7%) |
| $15,000 to $17,499 | 4 (2.2%) | 0 (0.0%) |
| $17,500 to $19,999 | 9 (5.0%) | 14 (6.2%) |
| $20,000 to $22,499 | 30 (16.8%) | 1 (0.4%) |
| $22,500 to $24,999 | 15 (8.4%) | 0 (0.0%) |
| $25,000 to $29,999 | 15 (8.4%) | 25 (11.0%) |
| $30,000 to $34,999 | 11 (6.1%) | 84 (37.0%) |
| $35,000 to $39,999 | 10 (5.6%) | 25 (11.0%) |
| $40,000 to $44,999 | 0 (0.0%) | 3 (1.3%) |
| $45,000 to $49,999 | 8 (4.5%) | 0 (0.0%) |
| $50,000 to $54,999 | 0 (0.0%) | 16 (7.0%) |
| $55,000 to $64,999 | 0 (0.0%) | 2 (0.9%) |
| $65,000 to $74,999 | 4 (2.2%) | 0 (0.0%) |
| $75,000 to $99,999 | 24 (13.4%) | 0 (0.0%) |
| $100,000+ | 8 (4.5%) | 0 (0.0%) |
| Total | 179 (100.0%) | 227 (100.0%) |
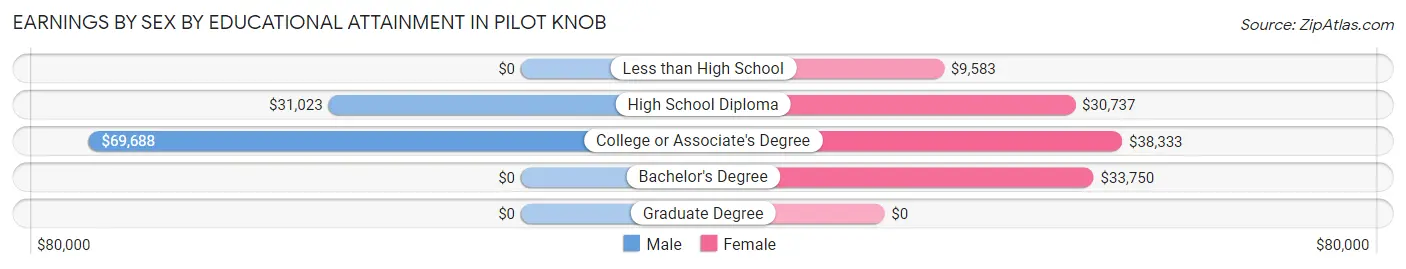
Earnings by Sex by Educational Attainment in Pilot Knob
Average earnings in Pilot Knob are $32,386 for men and $31,332 for women, a difference of 3.3%. Men with an educational attainment of college or associate's degree enjoy the highest average annual earnings of $69,688, while those with high school diploma education earn the least with $31,023. Women with an educational attainment of college or associate's degree earn the most with the average annual earnings of $38,333, while those with less than high school education have the smallest earnings of $9,583.
| Educational Attainment | Male Income | Female Income |
| Less than High School | - | - |
| High School Diploma | $31,023 | $30,737 |
| College or Associate's Degree | $69,688 | $38,333 |
| Bachelor's Degree | - | - |
| Graduate Degree | - | - |
| Total | $32,386 | $31,332 |
Family Income in Pilot Knob
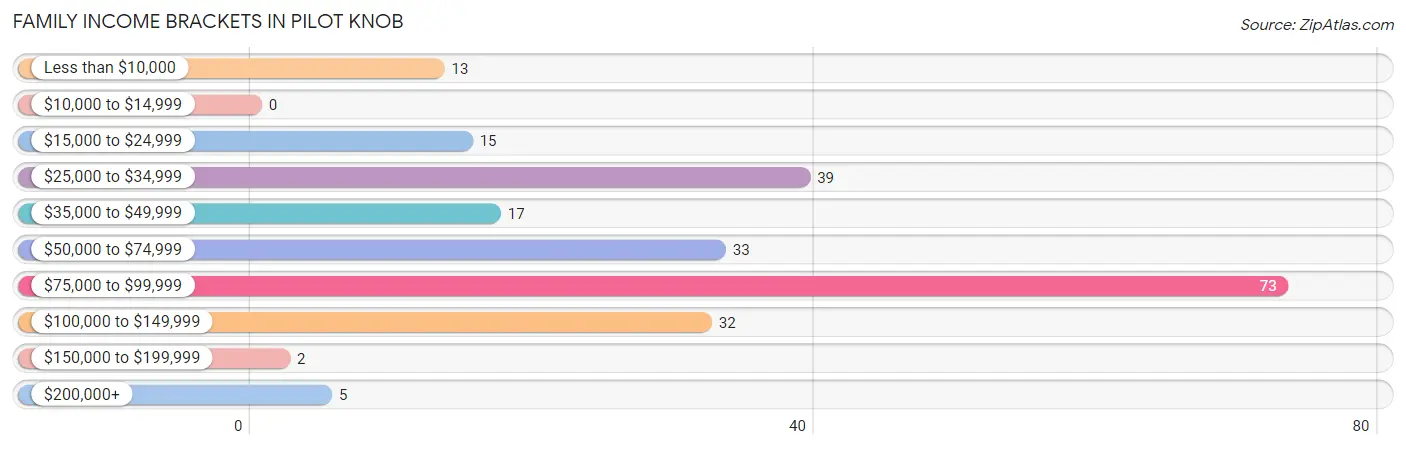
Family Income Brackets in Pilot Knob
According to the Pilot Knob family income data, there are 73 families falling into the $75,000 to $99,999 income range, which is the most common income bracket and makes up 31.9% of all families.
| Income Bracket | # Families | % Families |
| Less than $10,000 | 13 | 5.7% |
| $10,000 to $14,999 | 0 | 0.0% |
| $15,000 to $24,999 | 15 | 6.6% |
| $25,000 to $34,999 | 39 | 17.0% |
| $35,000 to $49,999 | 17 | 7.4% |
| $50,000 to $74,999 | 33 | 14.4% |
| $75,000 to $99,999 | 73 | 31.9% |
| $100,000 to $149,999 | 32 | 14.0% |
| $150,000 to $199,999 | 2 | 0.9% |
| $200,000+ | 5 | 2.2% |
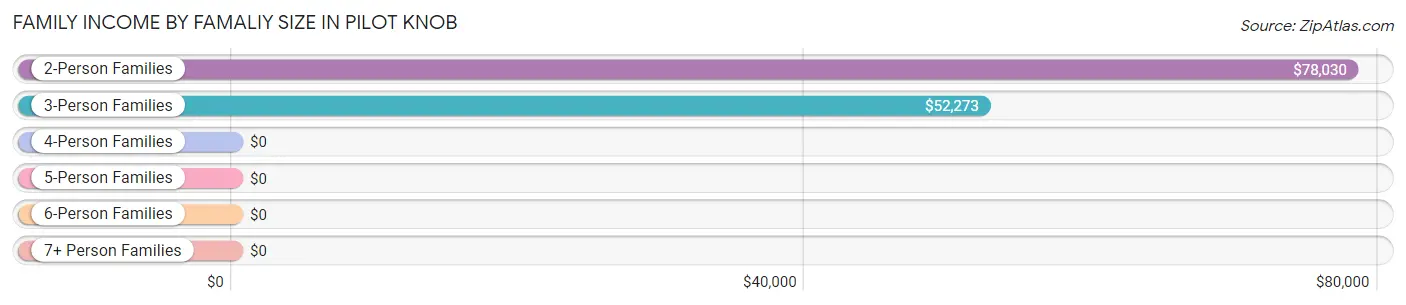
Family Income by Famaliy Size in Pilot Knob
2-person families (153 | 66.8%) account for the highest median family income in Pilot Knob with $78,030 per family, while 2-person families (153 | 66.8%) have the highest median income of $39,015 per family member.
| Income Bracket | # Families | Median Income |
| 2-Person Families | 153 (66.8%) | $78,030 |
| 3-Person Families | 50 (21.8%) | $52,273 |
| 4-Person Families | 8 (3.5%) | $0 |
| 5-Person Families | 18 (7.9%) | $0 |
| 6-Person Families | 0 (0.0%) | $0 |
| 7+ Person Families | 0 (0.0%) | $0 |
| Total | 229 (100.0%) | $68,438 |
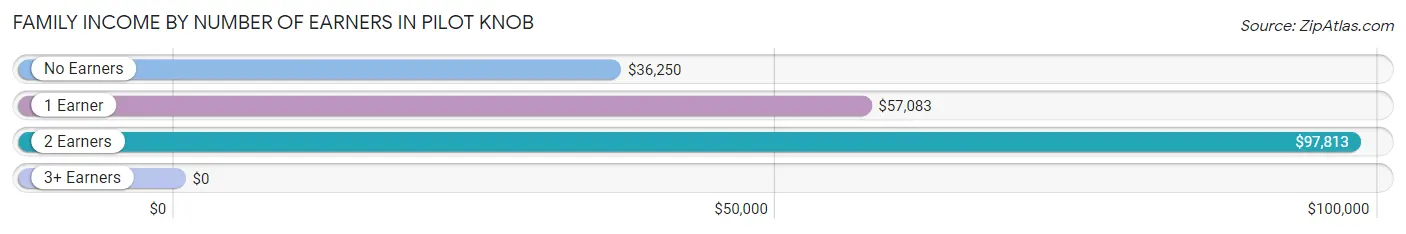
Family Income by Number of Earners in Pilot Knob
| Number of Earners | # Families | Median Income |
| No Earners | 29 (12.7%) | $36,250 |
| 1 Earner | 141 (61.6%) | $57,083 |
| 2 Earners | 49 (21.4%) | $97,813 |
| 3+ Earners | 10 (4.4%) | $0 |
| Total | 229 (100.0%) | $68,438 |
Household Income in Pilot Knob
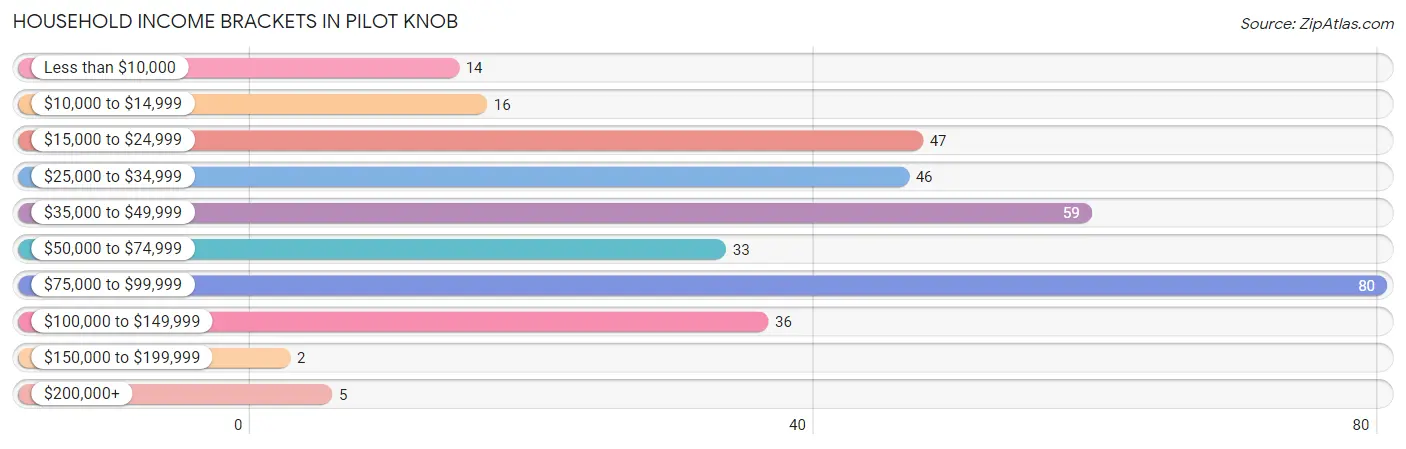
Household Income Brackets in Pilot Knob
With 80 households falling in the category, the $75,000 to $99,999 income range is the most frequent in Pilot Knob, accounting for 23.7% of all households. In contrast, only 2 households (0.6%) fall into the $150,000 to $199,999 income bracket, making it the least populous group.
| Income Bracket | # Households | % Households |
| Less than $10,000 | 14 | 4.1% |
| $10,000 to $14,999 | 16 | 4.7% |
| $15,000 to $24,999 | 47 | 13.9% |
| $25,000 to $34,999 | 46 | 13.6% |
| $35,000 to $49,999 | 59 | 17.5% |
| $50,000 to $74,999 | 33 | 9.8% |
| $75,000 to $99,999 | 80 | 23.7% |
| $100,000 to $149,999 | 36 | 10.7% |
| $150,000 to $199,999 | 2 | 0.6% |
| $200,000+ | 5 | 1.5% |
Household Income by Householder Age in Pilot Knob
The median household income in Pilot Knob is $44,375, with the highest median household income of $65,833 found in the 45 to 64 years age bracket for the primary householder. A total of 188 households (55.6%) fall into this category. Meanwhile, the 15 to 24 years age bracket for the primary householder has the lowest median household income of $21,726, with 29 households (8.6%) in this group.
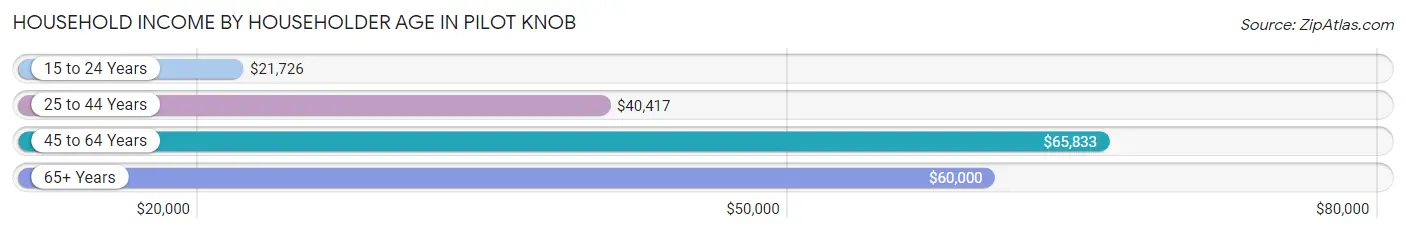
| Income Bracket | # Households | Median Income |
| 15 to 24 Years | 29 (8.6%) | $21,726 |
| 25 to 44 Years | 67 (19.8%) | $40,417 |
| 45 to 64 Years | 188 (55.6%) | $65,833 |
| 65+ Years | 54 (16.0%) | $60,000 |
| Total | 338 (100.0%) | $44,375 |
Poverty in Pilot Knob
Income Below Poverty by Sex and Age in Pilot Knob
With 15.7% poverty level for males and 22.1% for females among the residents of Pilot Knob, 5 year old males and 5 year old females are the most vulnerable to poverty, with 4 males (100.0%) and 5 females (100.0%) in their respective age groups living below the poverty level.
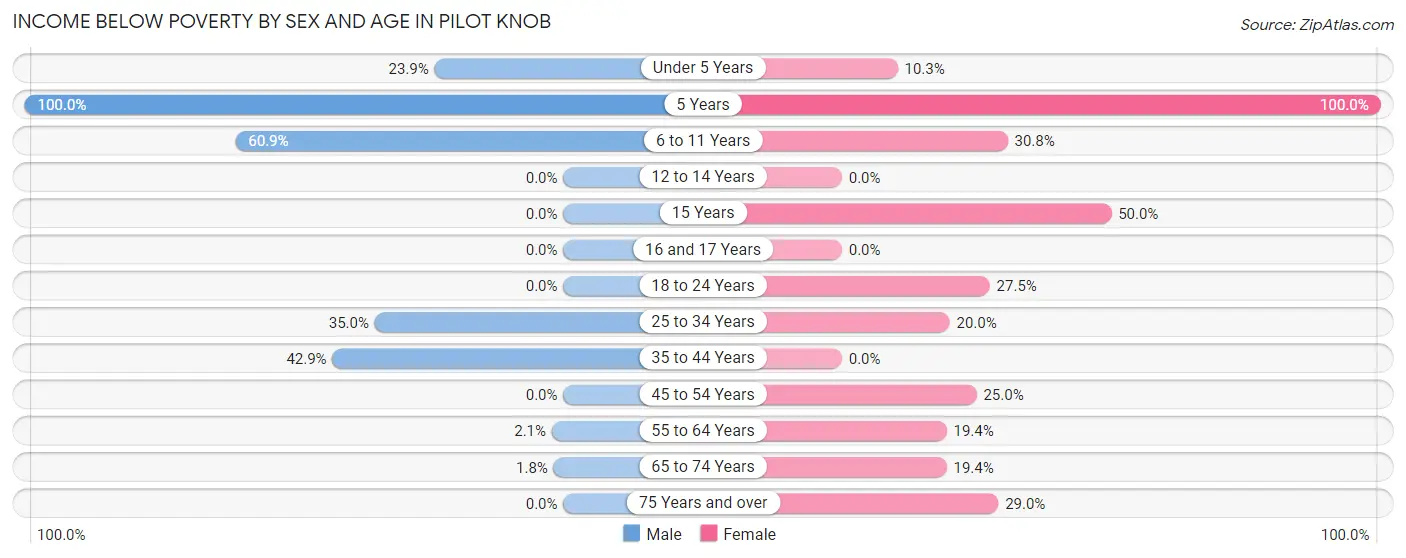
| Age Bracket | Male | Female |
| Under 5 Years | 11 (23.9%) | 3 (10.3%) |
| 5 Years | 4 (100.0%) | 5 (100.0%) |
| 6 to 11 Years | 14 (60.9%) | 4 (30.8%) |
| 12 to 14 Years | 0 (0.0%) | 0 (0.0%) |
| 15 Years | 0 (0.0%) | 4 (50.0%) |
| 16 and 17 Years | 0 (0.0%) | 0 (0.0%) |
| 18 to 24 Years | 0 (0.0%) | 14 (27.5%) |
| 25 to 34 Years | 7 (35.0%) | 8 (20.0%) |
| 35 to 44 Years | 18 (42.9%) | 0 (0.0%) |
| 45 to 54 Years | 0 (0.0%) | 15 (25.0%) |
| 55 to 64 Years | 1 (2.1%) | 21 (19.4%) |
| 65 to 74 Years | 1 (1.8%) | 7 (19.4%) |
| 75 Years and over | 0 (0.0%) | 9 (29.0%) |
| Total | 56 (15.7%) | 90 (22.1%) |
Income Above Poverty by Sex and Age in Pilot Knob
According to the poverty statistics in Pilot Knob, males aged 18 to 24 years and females aged 16 and 17 years are the age groups that are most secure financially, with 100.0% of males and 100.0% of females in these age groups living above the poverty line.
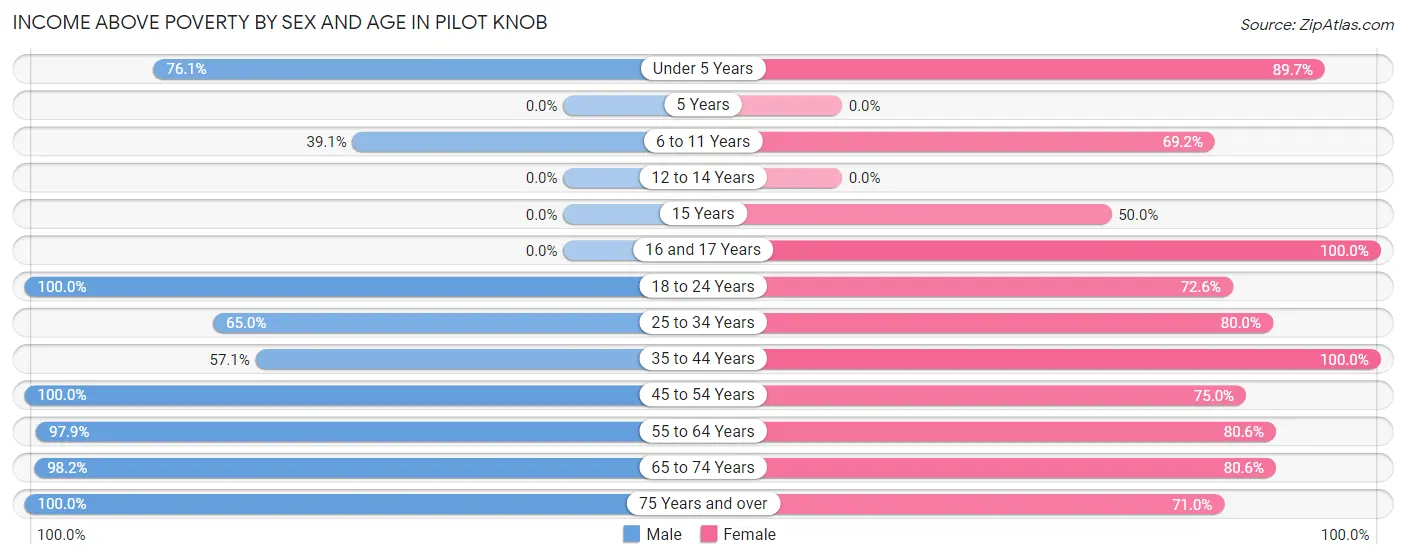
| Age Bracket | Male | Female |
| Under 5 Years | 35 (76.1%) | 26 (89.7%) |
| 5 Years | 0 (0.0%) | 0 (0.0%) |
| 6 to 11 Years | 9 (39.1%) | 9 (69.2%) |
| 12 to 14 Years | 0 (0.0%) | 0 (0.0%) |
| 15 Years | 0 (0.0%) | 4 (50.0%) |
| 16 and 17 Years | 0 (0.0%) | 8 (100.0%) |
| 18 to 24 Years | 73 (100.0%) | 37 (72.6%) |
| 25 to 34 Years | 13 (65.0%) | 32 (80.0%) |
| 35 to 44 Years | 24 (57.1%) | 18 (100.0%) |
| 45 to 54 Years | 28 (100.0%) | 45 (75.0%) |
| 55 to 64 Years | 46 (97.9%) | 87 (80.6%) |
| 65 to 74 Years | 55 (98.2%) | 29 (80.6%) |
| 75 Years and over | 18 (100.0%) | 22 (71.0%) |
| Total | 301 (84.3%) | 317 (77.9%) |
Income Below Poverty Among Married-Couple Families in Pilot Knob
The poverty statistics for married-couple families in Pilot Knob show that 4.2% or 6 of the total 143 families live below the poverty line. Families with 1 or 2 children have the highest poverty rate of 28.6%, comprising of 6 families. On the other hand, families with no children have the lowest poverty rate of 0.0%, which includes 0 families.
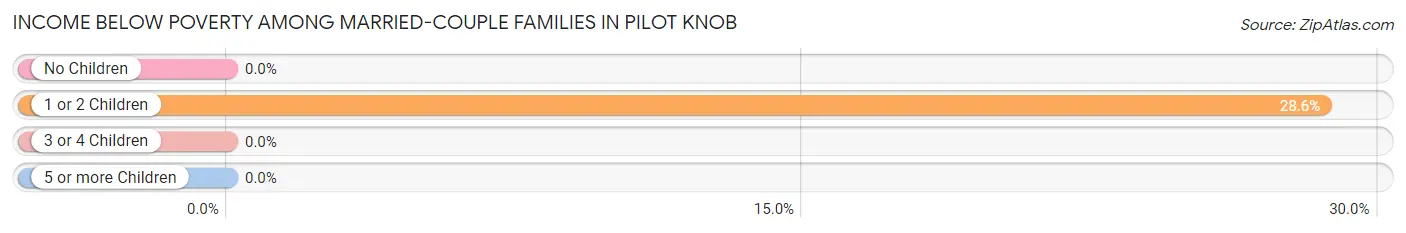
| Children | Above Poverty | Below Poverty |
| No Children | 118 (100.0%) | 0 (0.0%) |
| 1 or 2 Children | 15 (71.4%) | 6 (28.6%) |
| 3 or 4 Children | 4 (100.0%) | 0 (0.0%) |
| 5 or more Children | 0 (0.0%) | 0 (0.0%) |
| Total | 137 (95.8%) | 6 (4.2%) |
Income Below Poverty Among Single-Parent Households in Pilot Knob
According to the poverty data in Pilot Knob, 24.4% or 10 single-father households and 6.7% or 3 single-mother households are living below the poverty line. Among single-father households, those with 3 or 4 children have the highest poverty rate, with 3 households (100.0%) experiencing poverty. Likewise, among single-mother households, those with 3 or 4 children have the highest poverty rate, with 3 households (100.0%) falling below the poverty line.
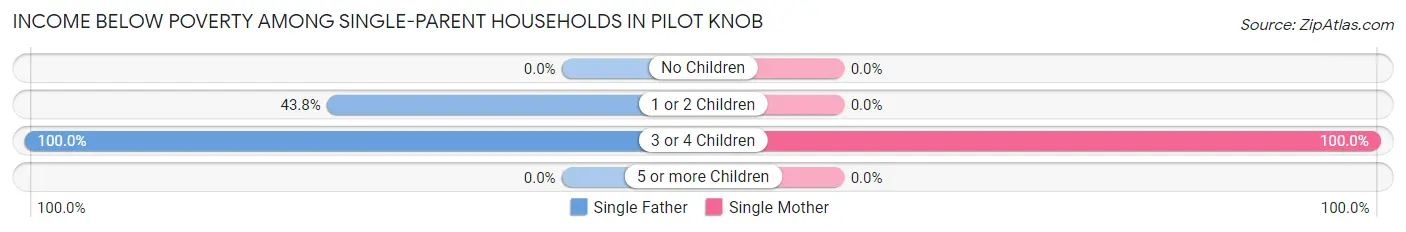
| Children | Single Father | Single Mother |
| No Children | 0 (0.0%) | 0 (0.0%) |
| 1 or 2 Children | 7 (43.8%) | 0 (0.0%) |
| 3 or 4 Children | 3 (100.0%) | 3 (100.0%) |
| 5 or more Children | 0 (0.0%) | 0 (0.0%) |
| Total | 10 (24.4%) | 3 (6.7%) |
Income Below Poverty Among Married-Couple vs Single-Parent Households in Pilot Knob
The poverty data for Pilot Knob shows that 6 of the married-couple family households (4.2%) and 13 of the single-parent households (15.1%) are living below the poverty level. Within the married-couple family households, those with 1 or 2 children have the highest poverty rate, with 6 households (28.6%) falling below the poverty line. Among the single-parent households, those with 3 or 4 children have the highest poverty rate, with 6 household (100.0%) living below poverty.
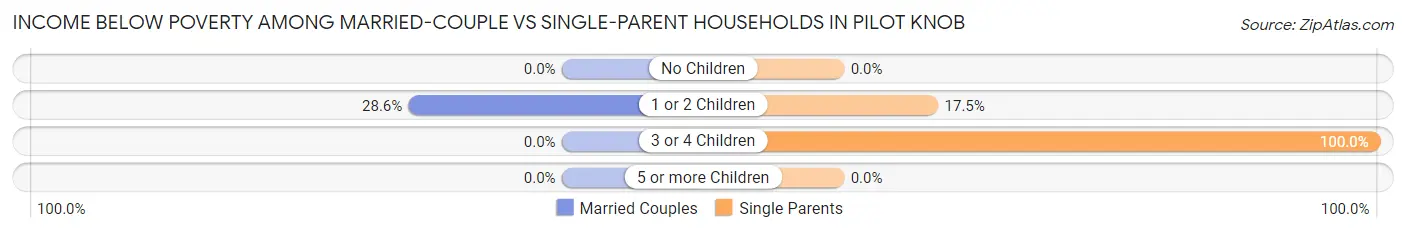
| Children | Married-Couple Families | Single-Parent Households |
| No Children | 0 (0.0%) | 0 (0.0%) |
| 1 or 2 Children | 6 (28.6%) | 7 (17.5%) |
| 3 or 4 Children | 0 (0.0%) | 6 (100.0%) |
| 5 or more Children | 0 (0.0%) | 0 (0.0%) |
| Total | 6 (4.2%) | 13 (15.1%) |
Race in Pilot Knob
The most populous races in Pilot Knob are White / Caucasian (656 | 84.9%), Two or more Races (104 | 13.5%), and Hispanic or Latino (66 | 8.5%).
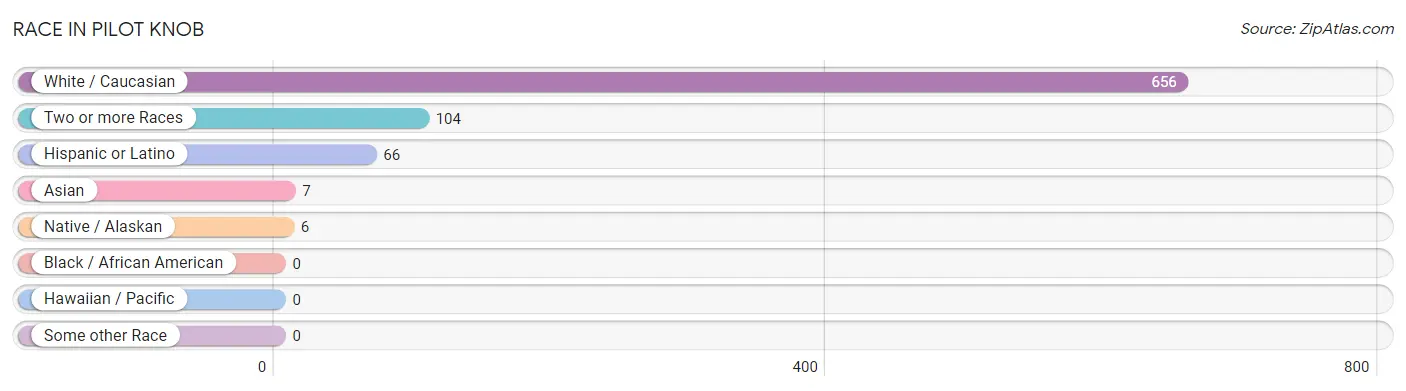
| Race | # Population | % Population |
| Asian | 7 | 0.9% |
| Black / African American | 0 | 0.0% |
| Hawaiian / Pacific | 0 | 0.0% |
| Hispanic or Latino | 66 | 8.5% |
| Native / Alaskan | 6 | 0.8% |
| White / Caucasian | 656 | 84.9% |
| Two or more Races | 104 | 13.5% |
| Some other Race | 0 | 0.0% |
| Total | 773 | 100.0% |
Ancestry in Pilot Knob
The most populous ancestries reported in Pilot Knob are German (136 | 17.6%), Irish (133 | 17.2%), Mexican (66 | 8.5%), English (55 | 7.1%), and Dutch (32 | 4.1%), together accounting for 54.6% of all Pilot Knob residents.
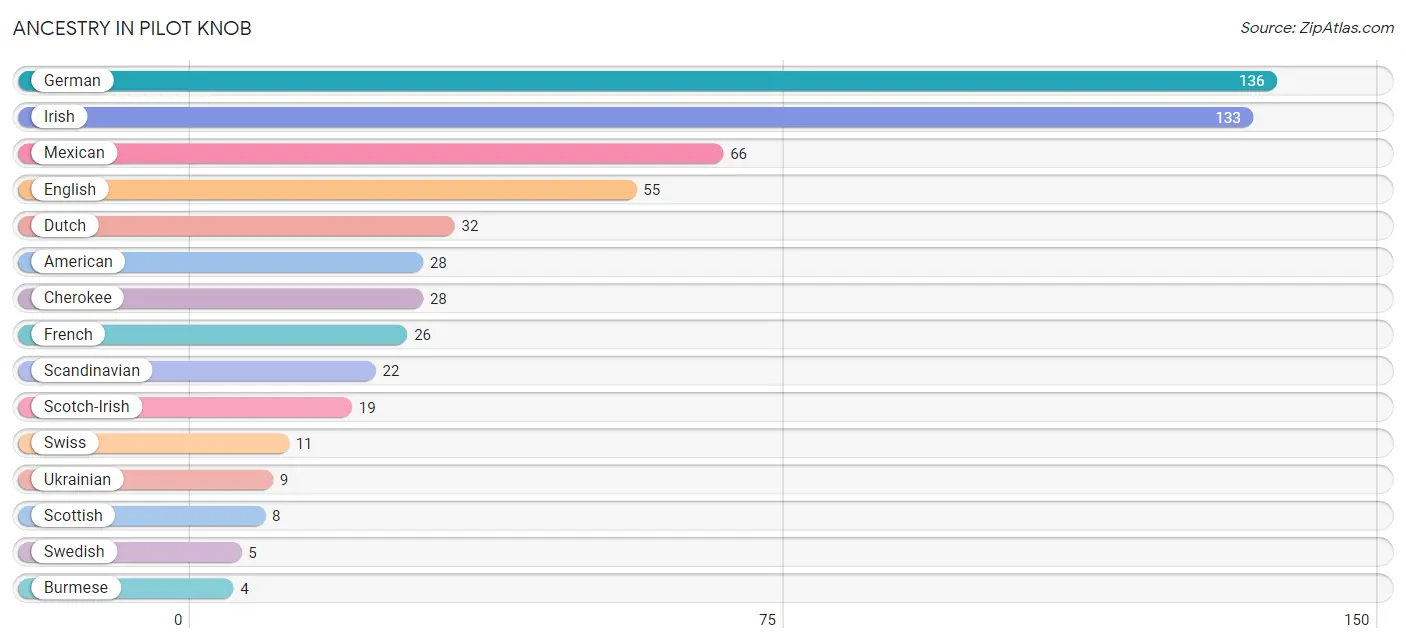
| Ancestry | # Population | % Population |
| American | 28 | 3.6% |
| Apache | 1 | 0.1% |
| Burmese | 4 | 0.5% |
| Cherokee | 28 | 3.6% |
| Dutch | 32 | 4.1% |
| English | 55 | 7.1% |
| French | 26 | 3.4% |
| German | 136 | 17.6% |
| Hopi | 3 | 0.4% |
| Irish | 133 | 17.2% |
| Korean | 3 | 0.4% |
| Mexican | 66 | 8.5% |
| Native Hawaiian | 3 | 0.4% |
| Scandinavian | 22 | 2.9% |
| Scotch-Irish | 19 | 2.5% |
| Scottish | 8 | 1.0% |
| Slovak | 2 | 0.3% |
| Swedish | 5 | 0.6% |
| Swiss | 11 | 1.4% |
| Ukrainian | 9 | 1.2% | View All 20 Rows |
Immigrants in Pilot Knob
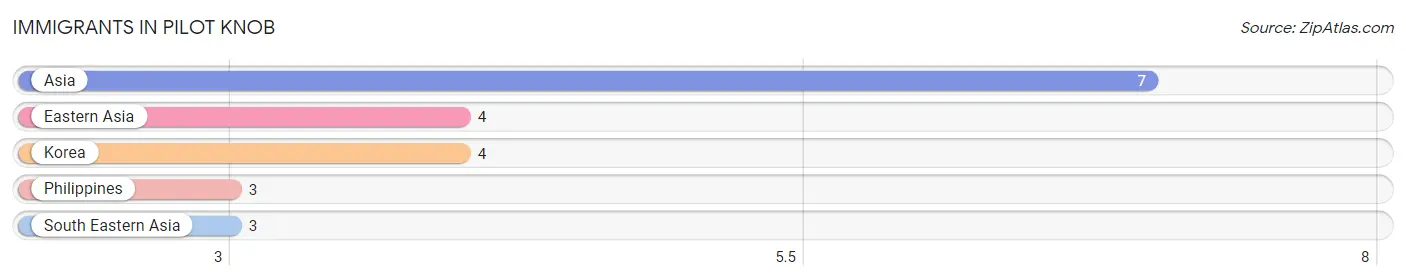
The most numerous immigrant groups reported in Pilot Knob came from Asia (7 | 0.9%), Eastern Asia (4 | 0.5%), Korea (4 | 0.5%), Philippines (3 | 0.4%), and South Eastern Asia (3 | 0.4%), together accounting for 2.7% of all Pilot Knob residents.
| Immigration Origin | # Population | % Population |
| Asia | 7 | 0.9% |
| Eastern Asia | 4 | 0.5% |
| Korea | 4 | 0.5% |
| Philippines | 3 | 0.4% |
| South Eastern Asia | 3 | 0.4% | View All 5 Rows |
Sex and Age in Pilot Knob
Sex and Age in Pilot Knob
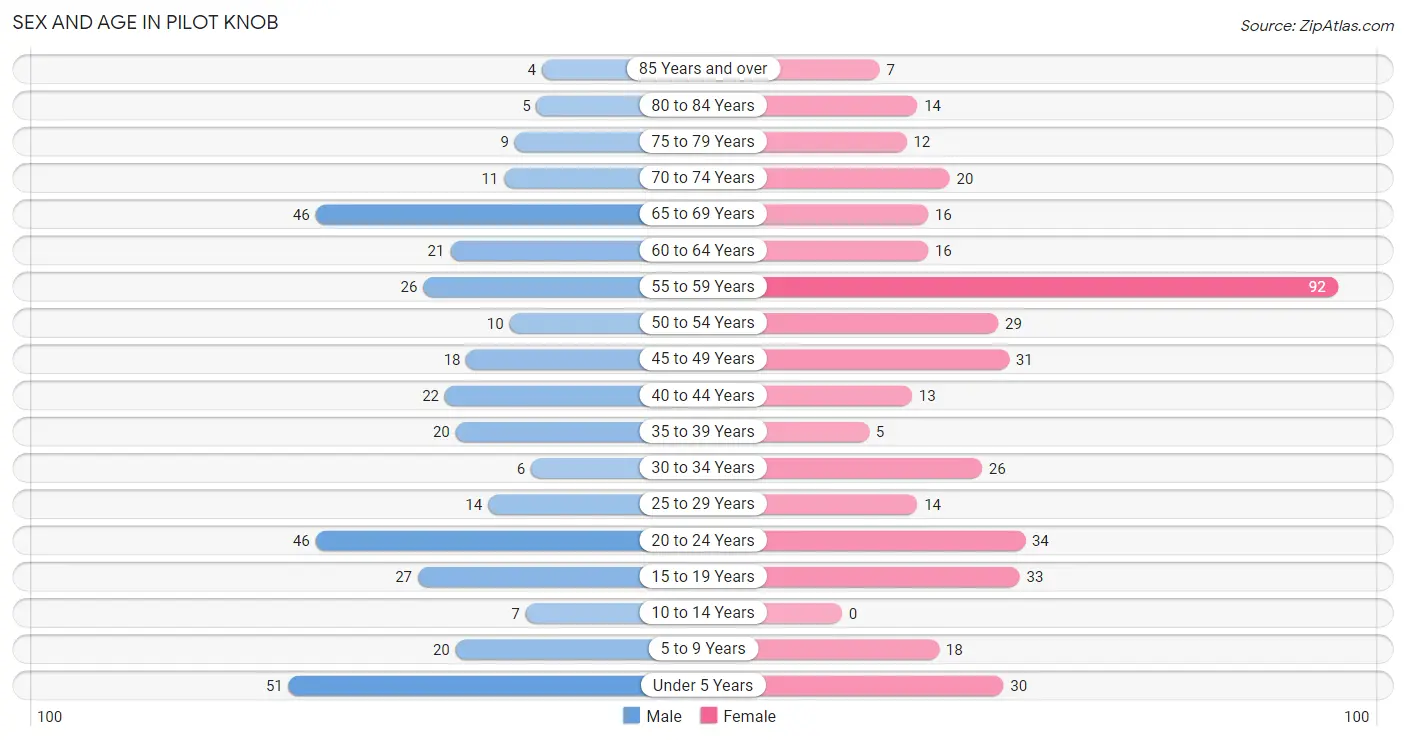
The most populous age groups in Pilot Knob are Under 5 Years (51 | 14.1%) for men and 55 to 59 Years (92 | 22.4%) for women.
| Age Bracket | Male | Female |
| Under 5 Years | 51 (14.1%) | 30 (7.3%) |
| 5 to 9 Years | 20 (5.5%) | 18 (4.4%) |
| 10 to 14 Years | 7 (1.9%) | 0 (0.0%) |
| 15 to 19 Years | 27 (7.4%) | 33 (8.1%) |
| 20 to 24 Years | 46 (12.7%) | 34 (8.3%) |
| 25 to 29 Years | 14 (3.9%) | 14 (3.4%) |
| 30 to 34 Years | 6 (1.7%) | 26 (6.3%) |
| 35 to 39 Years | 20 (5.5%) | 5 (1.2%) |
| 40 to 44 Years | 22 (6.1%) | 13 (3.2%) |
| 45 to 49 Years | 18 (5.0%) | 31 (7.6%) |
| 50 to 54 Years | 10 (2.8%) | 29 (7.1%) |
| 55 to 59 Years | 26 (7.2%) | 92 (22.4%) |
| 60 to 64 Years | 21 (5.8%) | 16 (3.9%) |
| 65 to 69 Years | 46 (12.7%) | 16 (3.9%) |
| 70 to 74 Years | 11 (3.0%) | 20 (4.9%) |
| 75 to 79 Years | 9 (2.5%) | 12 (2.9%) |
| 80 to 84 Years | 5 (1.4%) | 14 (3.4%) |
| 85 Years and over | 4 (1.1%) | 7 (1.7%) |
| Total | 363 (100.0%) | 410 (100.0%) |
Families and Households in Pilot Knob
Median Family Size in Pilot Knob
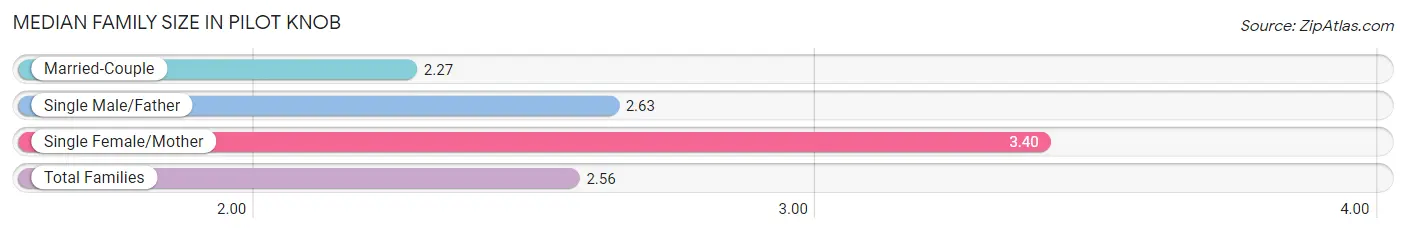
The median family size in Pilot Knob is 2.56 persons per family, with single female/mother families (45 | 19.7%) accounting for the largest median family size of 3.4 persons per family. On the other hand, married-couple families (143 | 62.5%) represent the smallest median family size with 2.27 persons per family.
| Family Type | # Families | Family Size |
| Married-Couple | 143 (62.5%) | 2.27 |
| Single Male/Father | 41 (17.9%) | 2.63 |
| Single Female/Mother | 45 (19.7%) | 3.40 |
| Total Families | 229 (100.0%) | 2.56 |
Median Household Size in Pilot Knob
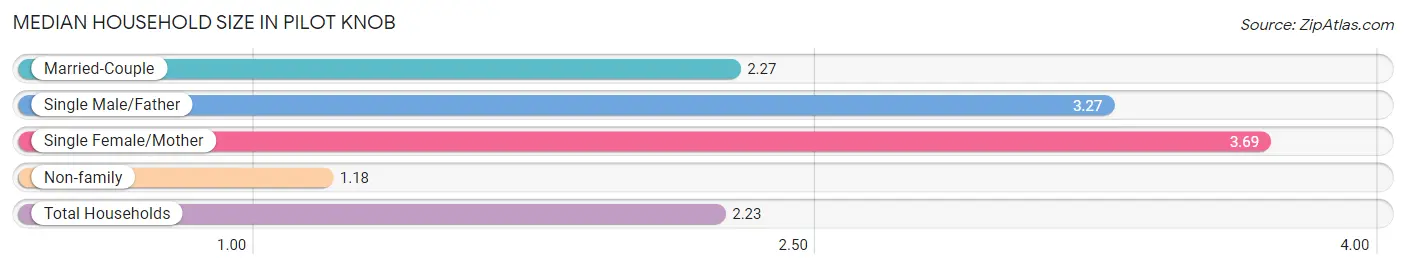
The median household size in Pilot Knob is 2.23 persons per household, with single female/mother households (45 | 13.3%) accounting for the largest median household size of 3.69 persons per household. non-family households (109 | 32.3%) represent the smallest median household size with 1.18 persons per household.
| Household Type | # Households | Household Size |
| Married-Couple | 143 (42.3%) | 2.27 |
| Single Male/Father | 41 (12.1%) | 3.27 |
| Single Female/Mother | 45 (13.3%) | 3.69 |
| Non-family | 109 (32.3%) | 1.18 |
| Total Households | 338 (100.0%) | 2.23 |
Household Size by Marriage Status in Pilot Knob
Out of a total of 338 households in Pilot Knob, 229 (67.7%) are family households, while 109 (32.3%) are nonfamily households. The most numerous type of family households are 2-person households, comprising 147, and the most common type of nonfamily households are 1-person households, comprising 89.
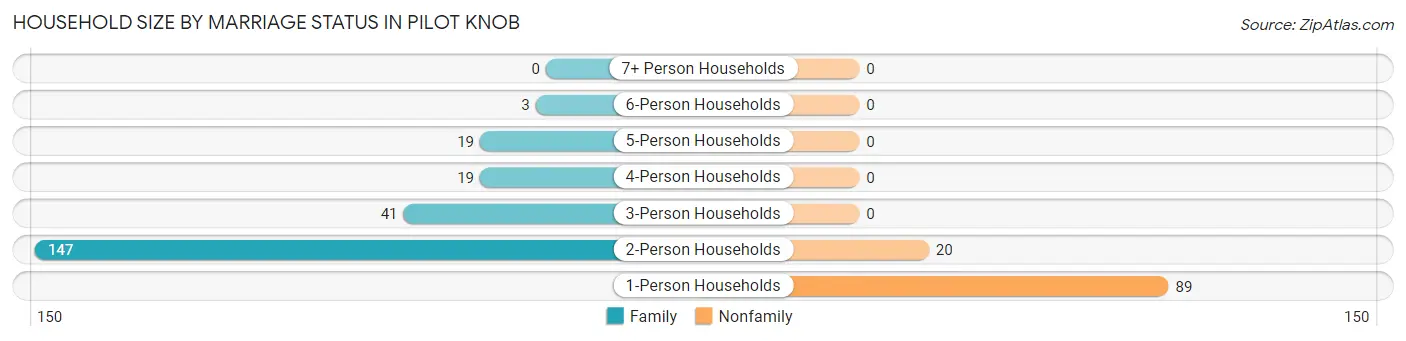
| Household Size | Family Households | Nonfamily Households |
| 1-Person Households | - | 89 (26.3%) |
| 2-Person Households | 147 (43.5%) | 20 (5.9%) |
| 3-Person Households | 41 (12.1%) | 0 (0.0%) |
| 4-Person Households | 19 (5.6%) | 0 (0.0%) |
| 5-Person Households | 19 (5.6%) | 0 (0.0%) |
| 6-Person Households | 3 (0.9%) | 0 (0.0%) |
| 7+ Person Households | 0 (0.0%) | 0 (0.0%) |
| Total | 229 (67.7%) | 109 (32.3%) |
Female Fertility in Pilot Knob
Fertility by Age in Pilot Knob
Average fertility rate in Pilot Knob is 36.0 births per 1,000 women. Women in the age bracket of 20 to 34 years have the highest fertility rate with 81.0 births per 1,000 women. Women in the age bracket of 20 to 34 years acount for 100.0% of all women with births.
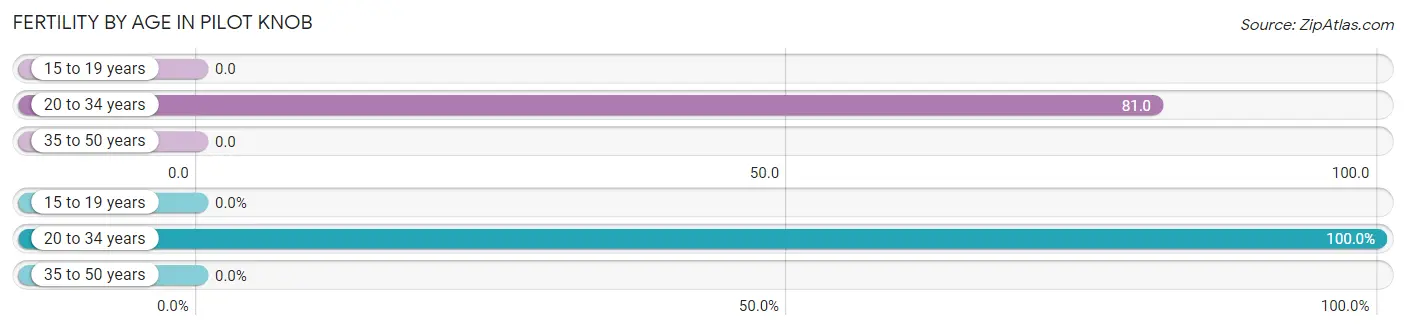
| Age Bracket | Women with Births | Births / 1,000 Women |
| 15 to 19 years | 0 (0.0%) | 0.0 |
| 20 to 34 years | 6 (100.0%) | 81.0 |
| 35 to 50 years | 0 (0.0%) | 0.0 |
| Total | 6 (100.0%) | 36.0 |
Fertility by Age by Marriage Status in Pilot Knob
50.0% of women with births (6) in Pilot Knob are married. The highest percentage of unmarried women with births falls into 20 to 34 years age bracket with 50.0% of them unmarried at the time of birth, while the lowest percentage of unmarried women with births belong to 20 to 34 years age bracket with 50.0% of them unmarried.
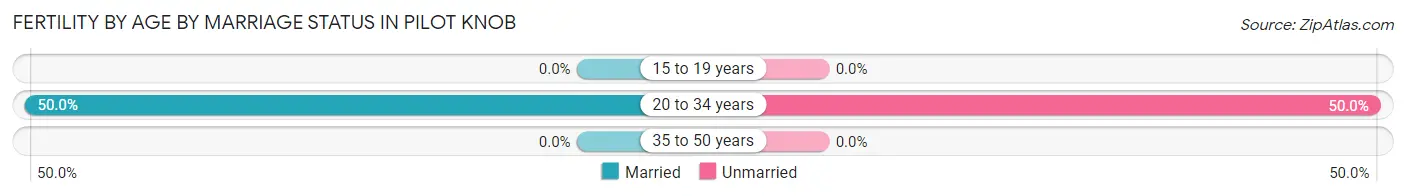
| Age Bracket | Married | Unmarried |
| 15 to 19 years | 0 (0.0%) | 0 (0.0%) |
| 20 to 34 years | 3 (50.0%) | 3 (50.0%) |
| 35 to 50 years | 0 (0.0%) | 0 (0.0%) |
| Total | 3 (50.0%) | 3 (50.0%) |
Fertility by Education in Pilot Knob
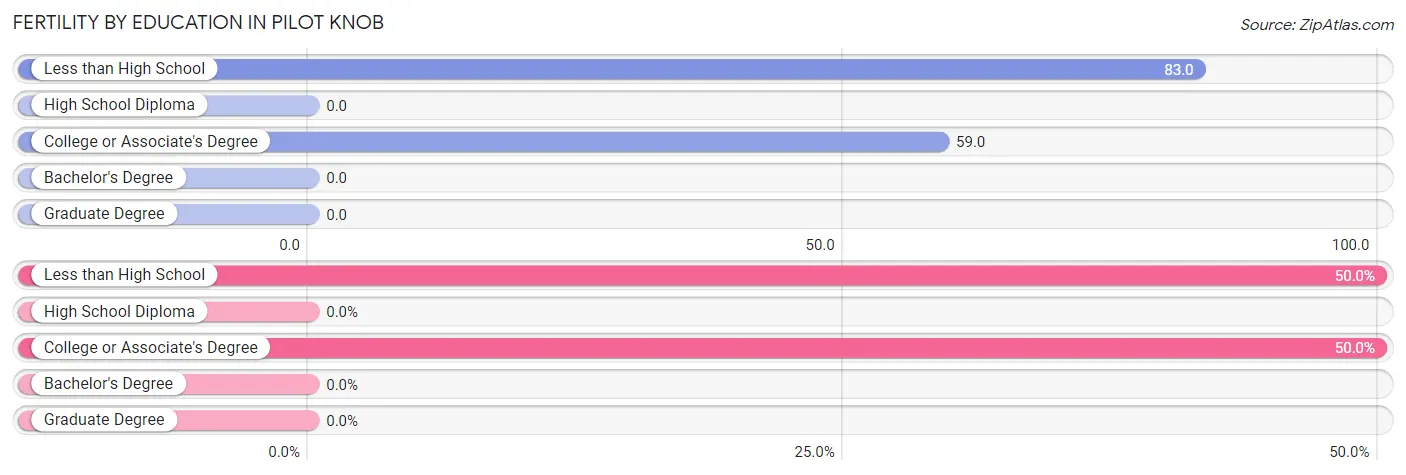
| Educational Attainment | Women with Births | Births / 1,000 Women |
| Less than High School | 3 (50.0%) | 83.0 |
| High School Diploma | 0 (0.0%) | 0.0 |
| College or Associate's Degree | 3 (50.0%) | 59.0 |
| Bachelor's Degree | 0 (0.0%) | 0.0 |
| Graduate Degree | 0 (0.0%) | 0.0 |
| Total | 6 (100.0%) | 36.0 |
Fertility by Education by Marriage Status in Pilot Knob
50.0% of women with births in Pilot Knob are unmarried. Women with the educational attainment of less than high school are most likely to be married with 100.0% of them married at childbirth, while women with the educational attainment of college or associate's degree are least likely to be married with 100.0% of them unmarried at childbirth.
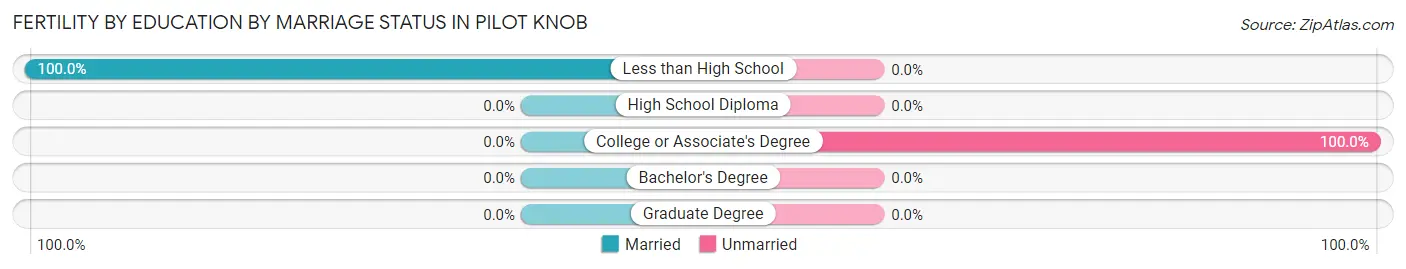
| Educational Attainment | Married | Unmarried |
| Less than High School | 3 (100.0%) | 0 (0.0%) |
| High School Diploma | 0 (0.0%) | 0 (0.0%) |
| College or Associate's Degree | 0 (0.0%) | 3 (100.0%) |
| Bachelor's Degree | 0 (0.0%) | 0 (0.0%) |
| Graduate Degree | 0 (0.0%) | 0 (0.0%) |
| Total | 3 (50.0%) | 3 (50.0%) |
Employment Characteristics in Pilot Knob
Employment by Class of Employer in Pilot Knob
Among the 355 employed individuals in Pilot Knob, private company employees (201 | 56.6%), self-employed (incorporated) (56 | 15.8%), and state government employees (51 | 14.4%) make up the most common classes of employment.
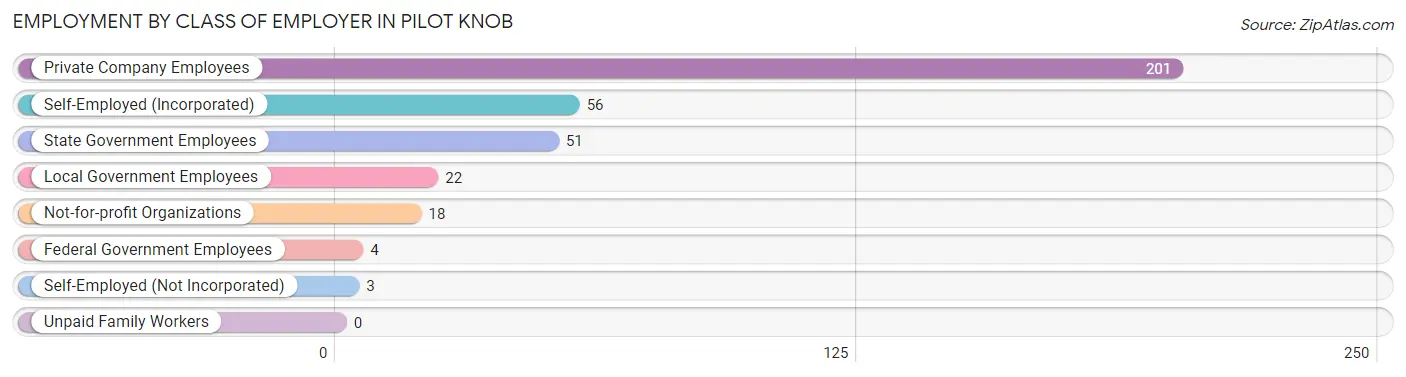
| Employer Class | # Employees | % Employees |
| Private Company Employees | 201 | 56.6% |
| Self-Employed (Incorporated) | 56 | 15.8% |
| Self-Employed (Not Incorporated) | 3 | 0.9% |
| Not-for-profit Organizations | 18 | 5.1% |
| Local Government Employees | 22 | 6.2% |
| State Government Employees | 51 | 14.4% |
| Federal Government Employees | 4 | 1.1% |
| Unpaid Family Workers | 0 | 0.0% |
| Total | 355 | 100.0% |
Employment Status by Age in Pilot Knob
According to the labor force statistics for Pilot Knob, out of the total population over 16 years of age (639), 61.0% or 390 individuals are in the labor force, with 8.5% or 33 of them unemployed. The age group with the highest labor force participation rate is 20 to 24 years, with 93.8% or 75 individuals in the labor force. Within the labor force, the 30 to 34 years age range has the highest percentage of unemployed individuals, with 20.0% or 6 of them being unemployed.
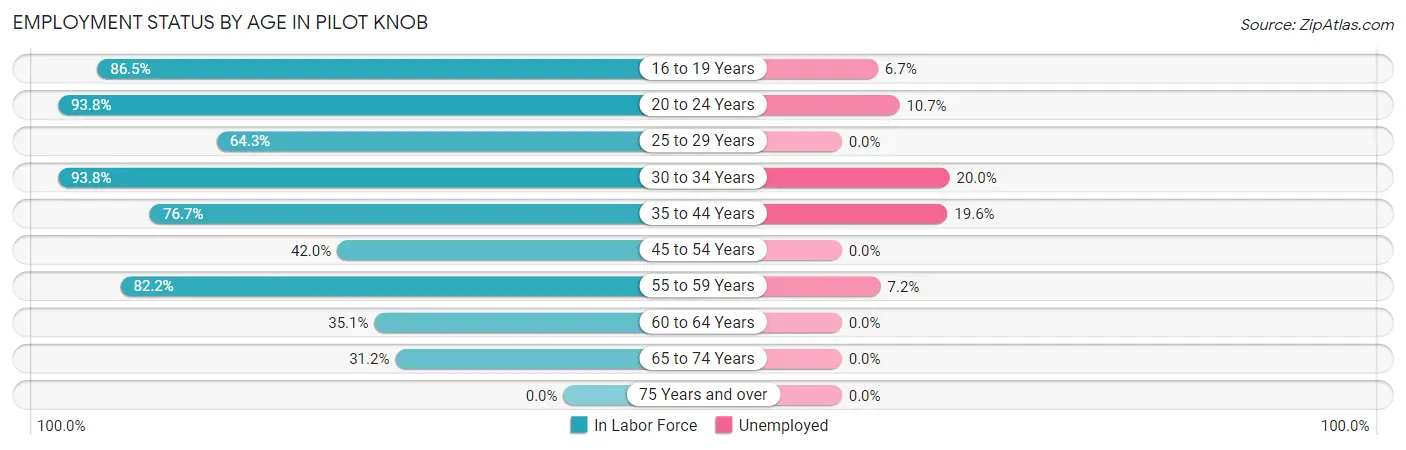
| Age Bracket | In Labor Force | Unemployed |
| 16 to 19 Years | 45 (86.5%) | 3 (6.7%) |
| 20 to 24 Years | 75 (93.8%) | 8 (10.7%) |
| 25 to 29 Years | 18 (64.3%) | 0 (0.0%) |
| 30 to 34 Years | 30 (93.8%) | 6 (20.0%) |
| 35 to 44 Years | 46 (76.7%) | 9 (19.6%) |
| 45 to 54 Years | 37 (42.0%) | 0 (0.0%) |
| 55 to 59 Years | 97 (82.2%) | 7 (7.2%) |
| 60 to 64 Years | 13 (35.1%) | 0 (0.0%) |
| 65 to 74 Years | 29 (31.2%) | 0 (0.0%) |
| 75 Years and over | 0 (0.0%) | 0 (0.0%) |
| Total | 390 (61.0%) | 33 (8.5%) |
Employment Status by Educational Attainment in Pilot Knob
According to labor force statistics for Pilot Knob, 66.4% of individuals (241) out of the total population between 25 and 64 years of age (363) are in the labor force, with 9.1% or 22 of them being unemployed. The group with the highest labor force participation rate are those with the educational attainment of college / associate degree, with 82.9% or 68 individuals in the labor force. Within the labor force, individuals with high school diploma education have the highest percentage of unemployment, with 12.9% or 17 of them being unemployed.
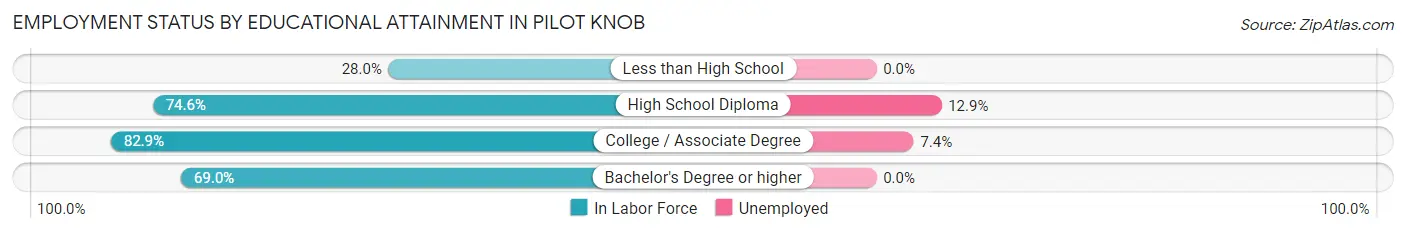
| Educational Attainment | In Labor Force | Unemployed |
| Less than High School | 21 (28.0%) | 0 (0.0%) |
| High School Diploma | 132 (74.6%) | 23 (12.9%) |
| College / Associate Degree | 68 (82.9%) | 6 (7.4%) |
| Bachelor's Degree or higher | 20 (69.0%) | 0 (0.0%) |
| Total | 241 (66.4%) | 33 (9.1%) |
Employment Occupations by Sex in Pilot Knob
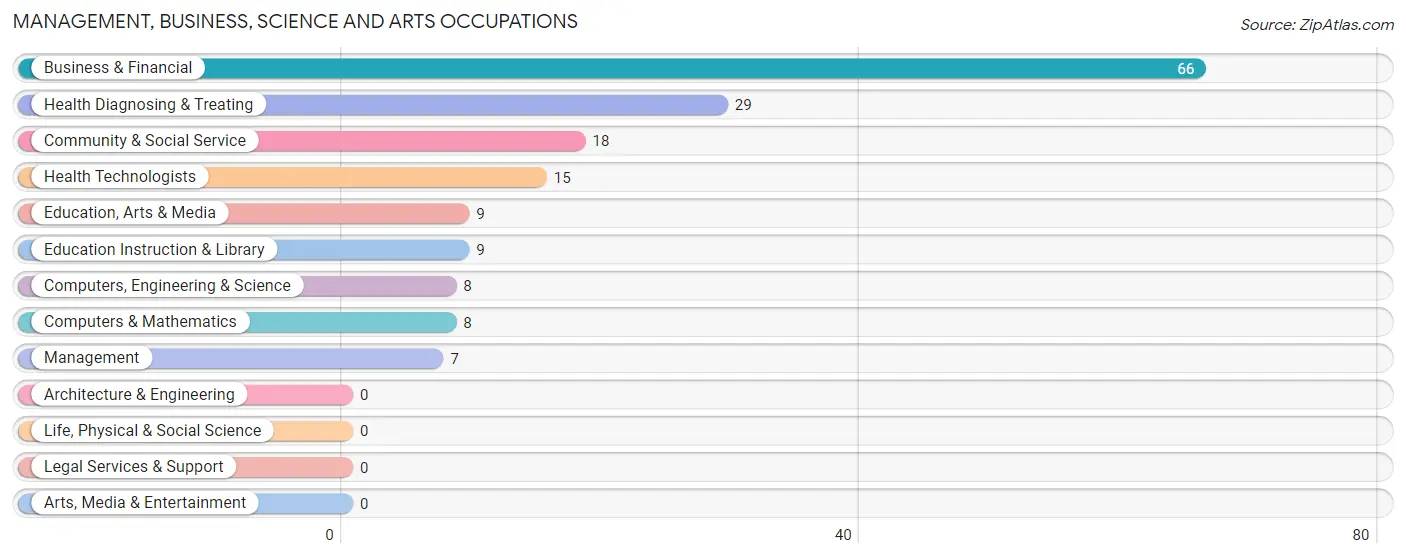
Management, Business, Science and Arts Occupations
The most common Management, Business, Science and Arts occupations in Pilot Knob are Business & Financial (66 | 18.5%), Health Diagnosing & Treating (29 | 8.1%), Community & Social Service (18 | 5.0%), Health Technologists (15 | 4.2%), and Education, Arts & Media (9 | 2.5%).
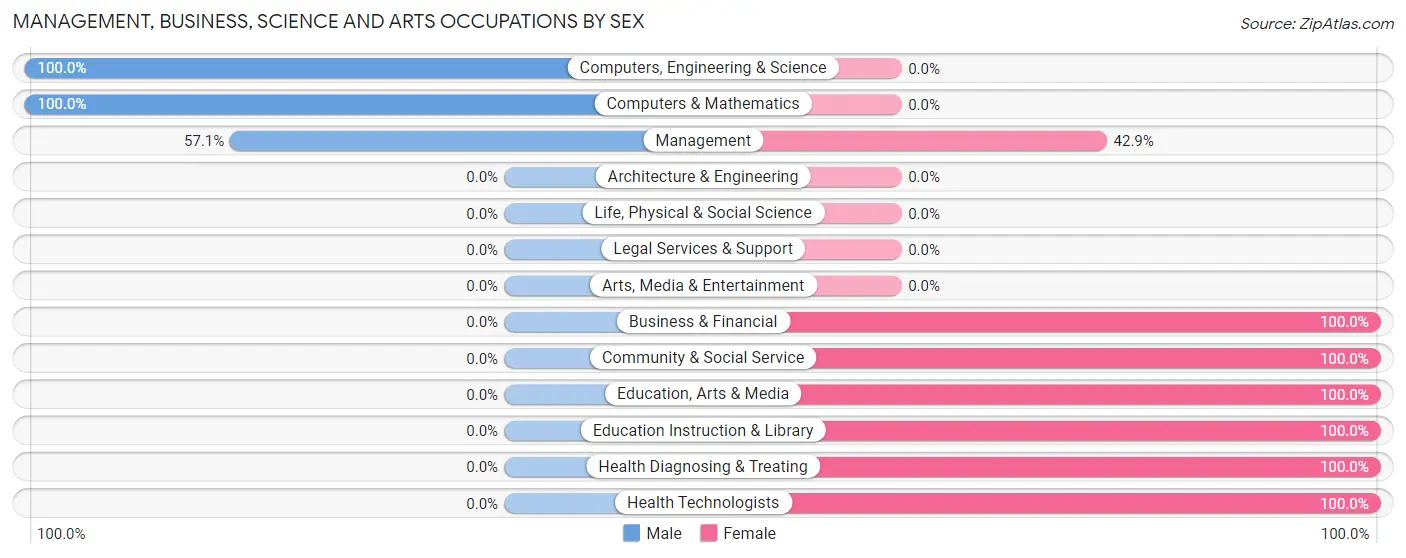
Management, Business, Science and Arts Occupations by Sex
Within the Management, Business, Science and Arts occupations in Pilot Knob, the most male-oriented occupations are Computers, Engineering & Science (100.0%), Computers & Mathematics (100.0%), and Management (57.1%), while the most female-oriented occupations are Business & Financial (100.0%), Community & Social Service (100.0%), and Education, Arts & Media (100.0%).
| Occupation | Male | Female |
| Management | 4 (57.1%) | 3 (42.9%) |
| Business & Financial | 0 (0.0%) | 66 (100.0%) |
| Computers, Engineering & Science | 8 (100.0%) | 0 (0.0%) |
| Computers & Mathematics | 8 (100.0%) | 0 (0.0%) |
| Architecture & Engineering | 0 (0.0%) | 0 (0.0%) |
| Life, Physical & Social Science | 0 (0.0%) | 0 (0.0%) |
| Community & Social Service | 0 (0.0%) | 18 (100.0%) |
| Education, Arts & Media | 0 (0.0%) | 9 (100.0%) |
| Legal Services & Support | 0 (0.0%) | 0 (0.0%) |
| Education Instruction & Library | 0 (0.0%) | 9 (100.0%) |
| Arts, Media & Entertainment | 0 (0.0%) | 0 (0.0%) |
| Health Diagnosing & Treating | 0 (0.0%) | 29 (100.0%) |
| Health Technologists | 0 (0.0%) | 15 (100.0%) |
| Total (Category) | 12 (9.4%) | 116 (90.6%) |
| Total (Overall) | 147 (41.2%) | 210 (58.8%) |
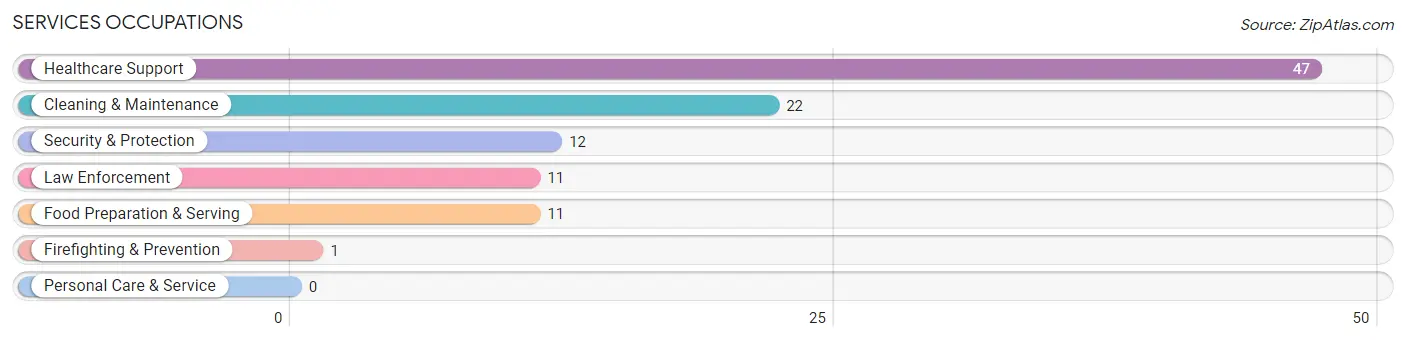
Services Occupations
The most common Services occupations in Pilot Knob are Healthcare Support (47 | 13.2%), Cleaning & Maintenance (22 | 6.2%), Security & Protection (12 | 3.4%), Law Enforcement (11 | 3.1%), and Food Preparation & Serving (11 | 3.1%).
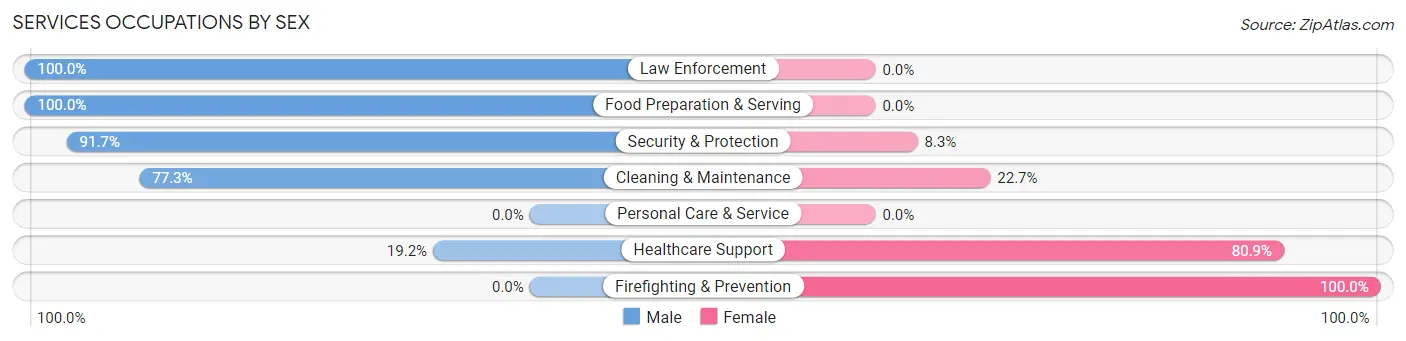
Services Occupations by Sex
Within the Services occupations in Pilot Knob, the most male-oriented occupations are Law Enforcement (100.0%), Food Preparation & Serving (100.0%), and Security & Protection (91.7%), while the most female-oriented occupations are Firefighting & Prevention (100.0%), Healthcare Support (80.8%), and Cleaning & Maintenance (22.7%).
| Occupation | Male | Female |
| Healthcare Support | 9 (19.2%) | 38 (80.8%) |
| Security & Protection | 11 (91.7%) | 1 (8.3%) |
| Firefighting & Prevention | 0 (0.0%) | 1 (100.0%) |
| Law Enforcement | 11 (100.0%) | 0 (0.0%) |
| Food Preparation & Serving | 11 (100.0%) | 0 (0.0%) |
| Cleaning & Maintenance | 17 (77.3%) | 5 (22.7%) |
| Personal Care & Service | 0 (0.0%) | 0 (0.0%) |
| Total (Category) | 48 (52.2%) | 44 (47.8%) |
| Total (Overall) | 147 (41.2%) | 210 (58.8%) |
Sales and Office Occupations
The most common Sales and Office occupations in Pilot Knob are Office & Administration (15 | 4.2%), and Sales & Related (10 | 2.8%).
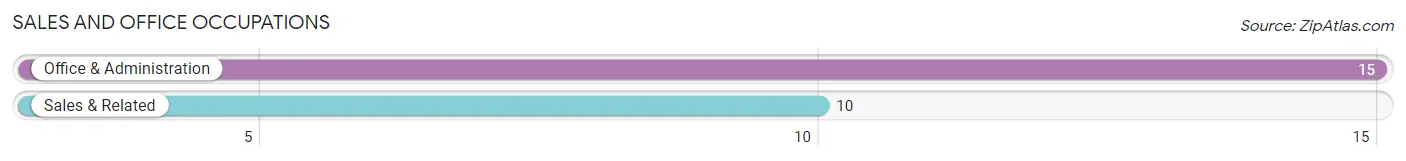
Sales and Office Occupations by Sex
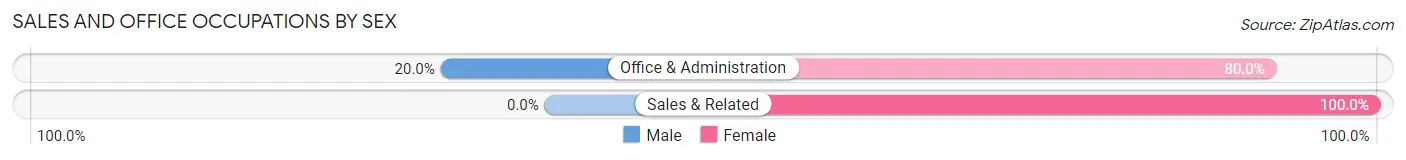
| Occupation | Male | Female |
| Sales & Related | 0 (0.0%) | 10 (100.0%) |
| Office & Administration | 3 (20.0%) | 12 (80.0%) |
| Total (Category) | 3 (12.0%) | 22 (88.0%) |
| Total (Overall) | 147 (41.2%) | 210 (58.8%) |
Natural Resources, Construction and Maintenance Occupations
The most common Natural Resources, Construction and Maintenance occupations in Pilot Knob are Construction & Extraction (28 | 7.8%), and Installation, Maintenance & Repair (23 | 6.4%).
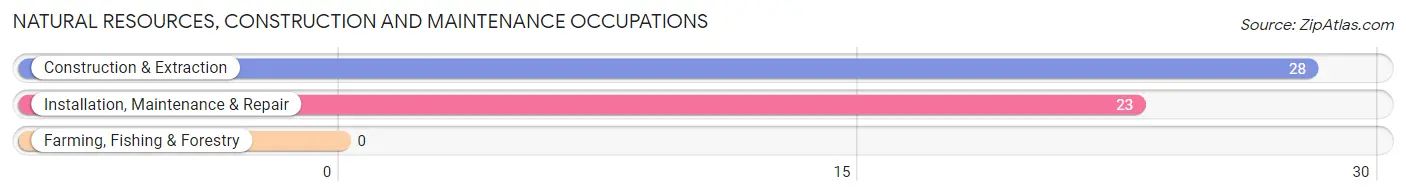
Natural Resources, Construction and Maintenance Occupations by Sex
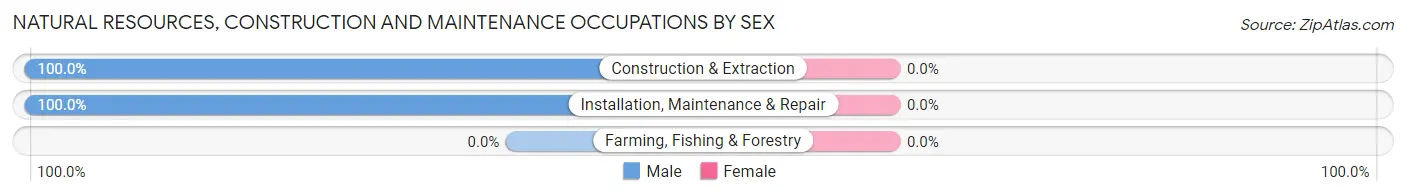
| Occupation | Male | Female |
| Farming, Fishing & Forestry | 0 (0.0%) | 0 (0.0%) |
| Construction & Extraction | 28 (100.0%) | 0 (0.0%) |
| Installation, Maintenance & Repair | 23 (100.0%) | 0 (0.0%) |
| Total (Category) | 51 (100.0%) | 0 (0.0%) |
| Total (Overall) | 147 (41.2%) | 210 (58.8%) |
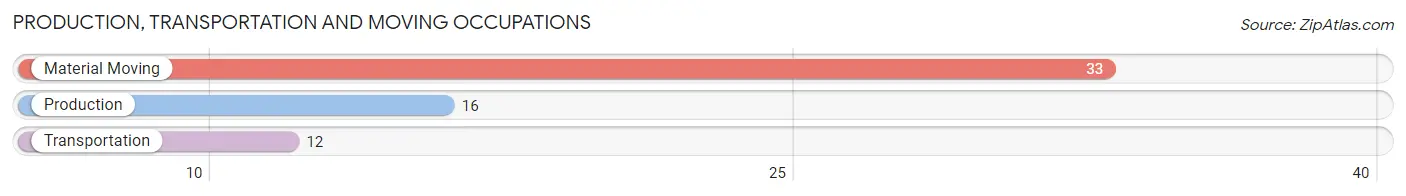
Production, Transportation and Moving Occupations
The most common Production, Transportation and Moving occupations in Pilot Knob are Material Moving (33 | 9.2%), Production (16 | 4.5%), and Transportation (12 | 3.4%).
Production, Transportation and Moving Occupations by Sex
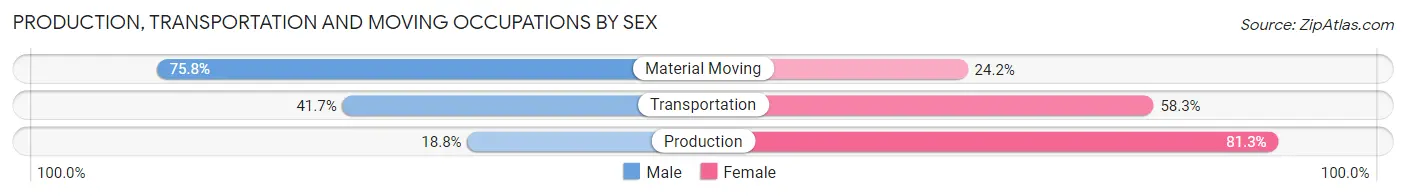
| Occupation | Male | Female |
| Production | 3 (18.8%) | 13 (81.2%) |
| Transportation | 5 (41.7%) | 7 (58.3%) |
| Material Moving | 25 (75.8%) | 8 (24.2%) |
| Total (Category) | 33 (54.1%) | 28 (45.9%) |
| Total (Overall) | 147 (41.2%) | 210 (58.8%) |
Employment Industries by Sex in Pilot Knob
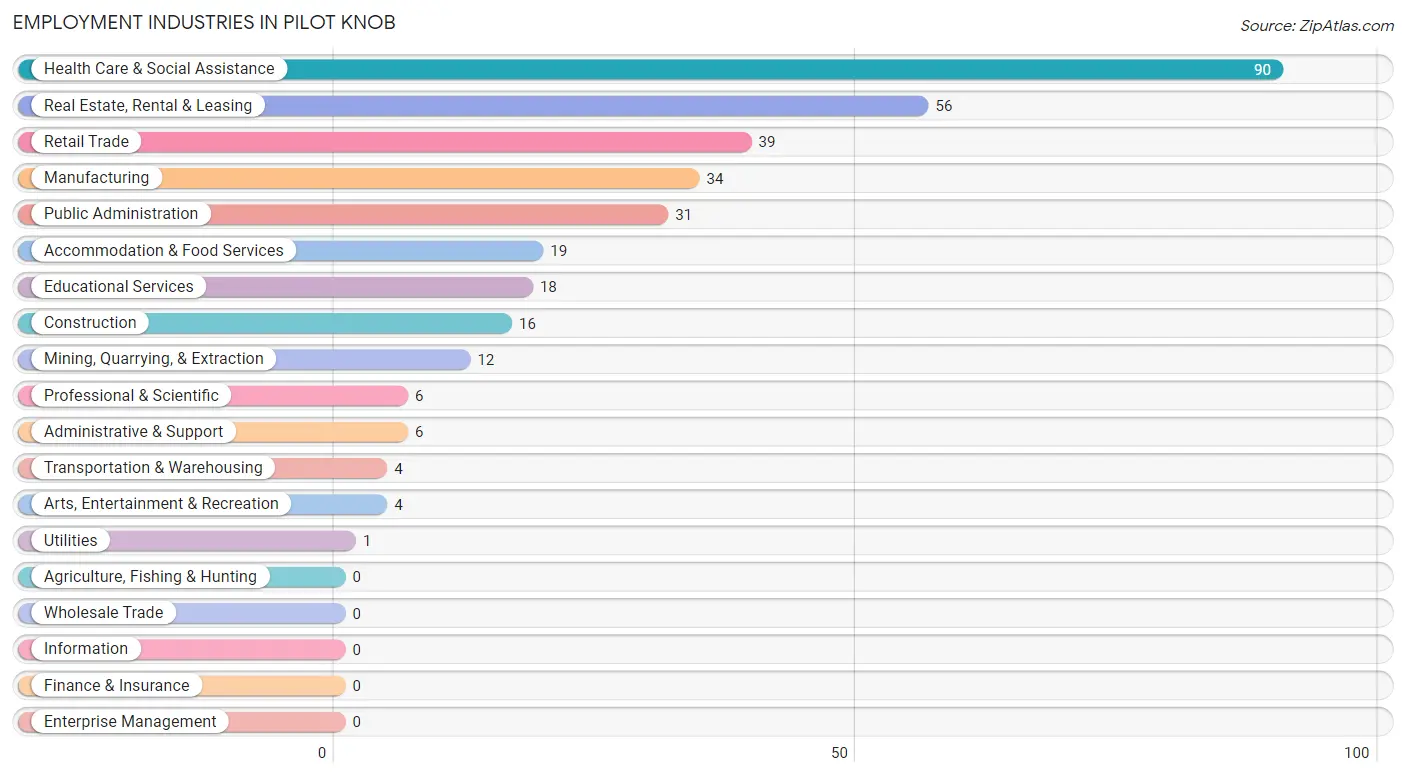
Employment Industries in Pilot Knob
The major employment industries in Pilot Knob include Health Care & Social Assistance (90 | 25.2%), Real Estate, Rental & Leasing (56 | 15.7%), Retail Trade (39 | 10.9%), Manufacturing (34 | 9.5%), and Public Administration (31 | 8.7%).
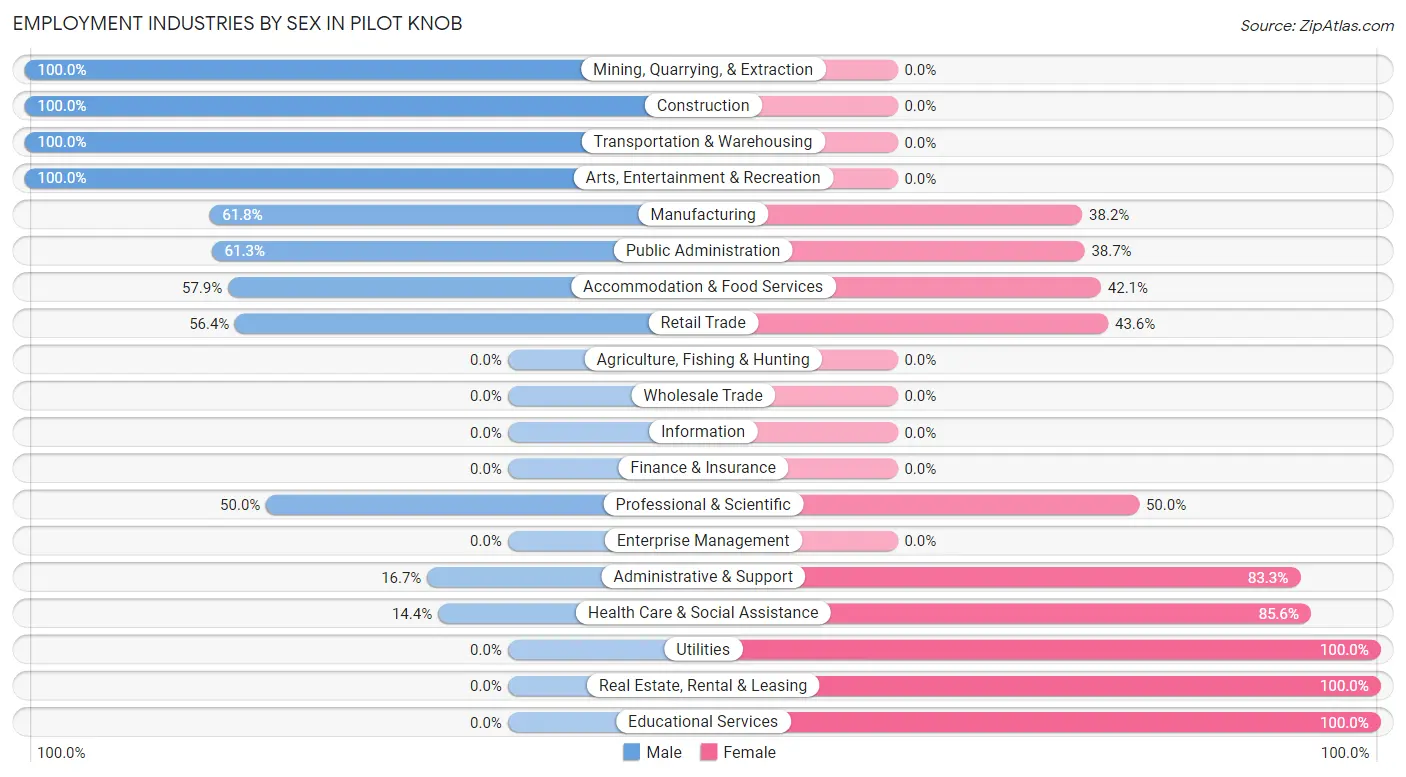
Employment Industries by Sex in Pilot Knob
The Pilot Knob industries that see more men than women are Mining, Quarrying, & Extraction (100.0%), Construction (100.0%), and Transportation & Warehousing (100.0%), whereas the industries that tend to have a higher number of women are Utilities (100.0%), Real Estate, Rental & Leasing (100.0%), and Educational Services (100.0%).
| Industry | Male | Female |
| Agriculture, Fishing & Hunting | 0 (0.0%) | 0 (0.0%) |
| Mining, Quarrying, & Extraction | 12 (100.0%) | 0 (0.0%) |
| Construction | 16 (100.0%) | 0 (0.0%) |
| Manufacturing | 21 (61.8%) | 13 (38.2%) |
| Wholesale Trade | 0 (0.0%) | 0 (0.0%) |
| Retail Trade | 22 (56.4%) | 17 (43.6%) |
| Transportation & Warehousing | 4 (100.0%) | 0 (0.0%) |
| Utilities | 0 (0.0%) | 1 (100.0%) |
| Information | 0 (0.0%) | 0 (0.0%) |
| Finance & Insurance | 0 (0.0%) | 0 (0.0%) |
| Real Estate, Rental & Leasing | 0 (0.0%) | 56 (100.0%) |
| Professional & Scientific | 3 (50.0%) | 3 (50.0%) |
| Enterprise Management | 0 (0.0%) | 0 (0.0%) |
| Administrative & Support | 1 (16.7%) | 5 (83.3%) |
| Educational Services | 0 (0.0%) | 18 (100.0%) |
| Health Care & Social Assistance | 13 (14.4%) | 77 (85.6%) |
| Arts, Entertainment & Recreation | 4 (100.0%) | 0 (0.0%) |
| Accommodation & Food Services | 11 (57.9%) | 8 (42.1%) |
| Public Administration | 19 (61.3%) | 12 (38.7%) |
| Total | 147 (41.2%) | 210 (58.8%) |
Education in Pilot Knob
School Enrollment in Pilot Knob
The most common levels of schooling among the 96 students in Pilot Knob are college / undergraduate (32 | 33.3%), elementary school (27 | 28.1%), and nursery / preschool (12 | 12.5%).
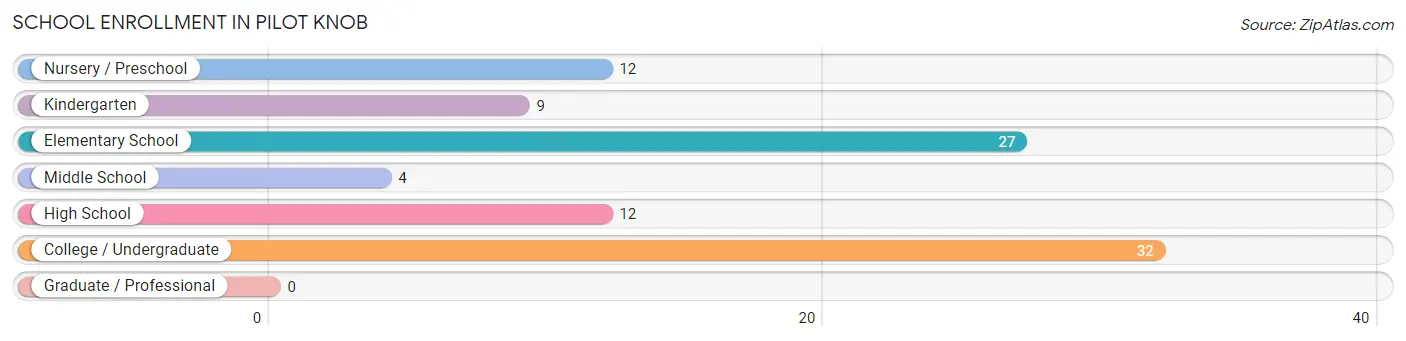
| School Level | # Students | % Students |
| Nursery / Preschool | 12 | 12.5% |
| Kindergarten | 9 | 9.4% |
| Elementary School | 27 | 28.1% |
| Middle School | 4 | 4.2% |
| High School | 12 | 12.5% |
| College / Undergraduate | 32 | 33.3% |
| Graduate / Professional | 0 | 0.0% |
| Total | 96 | 100.0% |
School Enrollment by Age by Funding Source in Pilot Knob
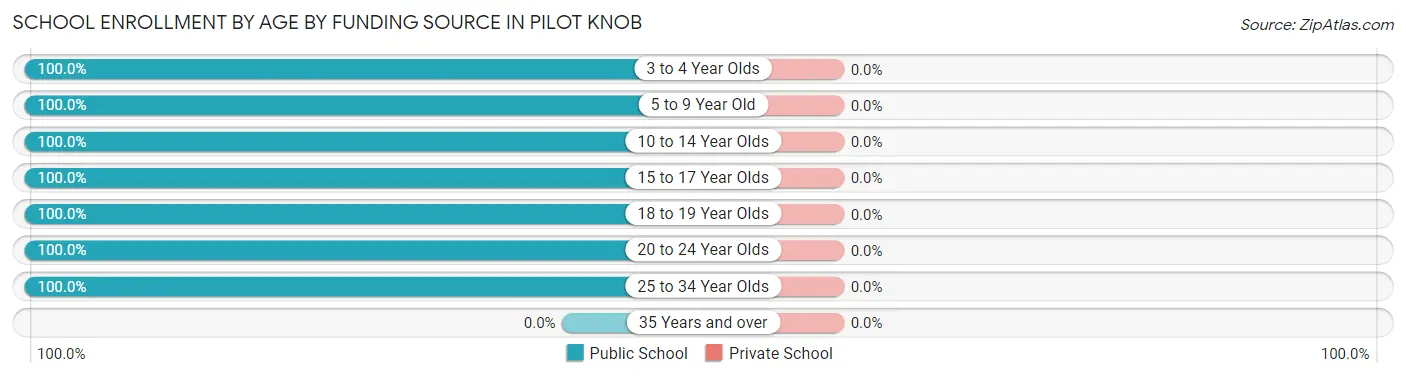
| Age Bracket | Public School | Private School |
| 3 to 4 Year Olds | 12 (100.0%) | 0 (0.0%) |
| 5 to 9 Year Old | 33 (100.0%) | 0 (0.0%) |
| 10 to 14 Year Olds | 7 (100.0%) | 0 (0.0%) |
| 15 to 17 Year Olds | 12 (100.0%) | 0 (0.0%) |
| 18 to 19 Year Olds | 9 (100.0%) | 0 (0.0%) |
| 20 to 24 Year Olds | 7 (100.0%) | 0 (0.0%) |
| 25 to 34 Year Olds | 16 (100.0%) | 0 (0.0%) |
| 35 Years and over | 0 (0.0%) | 0 (0.0%) |
| Total | 96 (100.0%) | 0 (0.0%) |
Educational Attainment by Field of Study in Pilot Knob
Education (12 | 24.5%), social sciences (7 | 14.3%), science & technology (7 | 14.3%), physical & health sciences (6 | 12.2%), and engineering (5 | 10.2%) are the most common fields of study among 49 individuals in Pilot Knob who have obtained a bachelor's degree or higher.
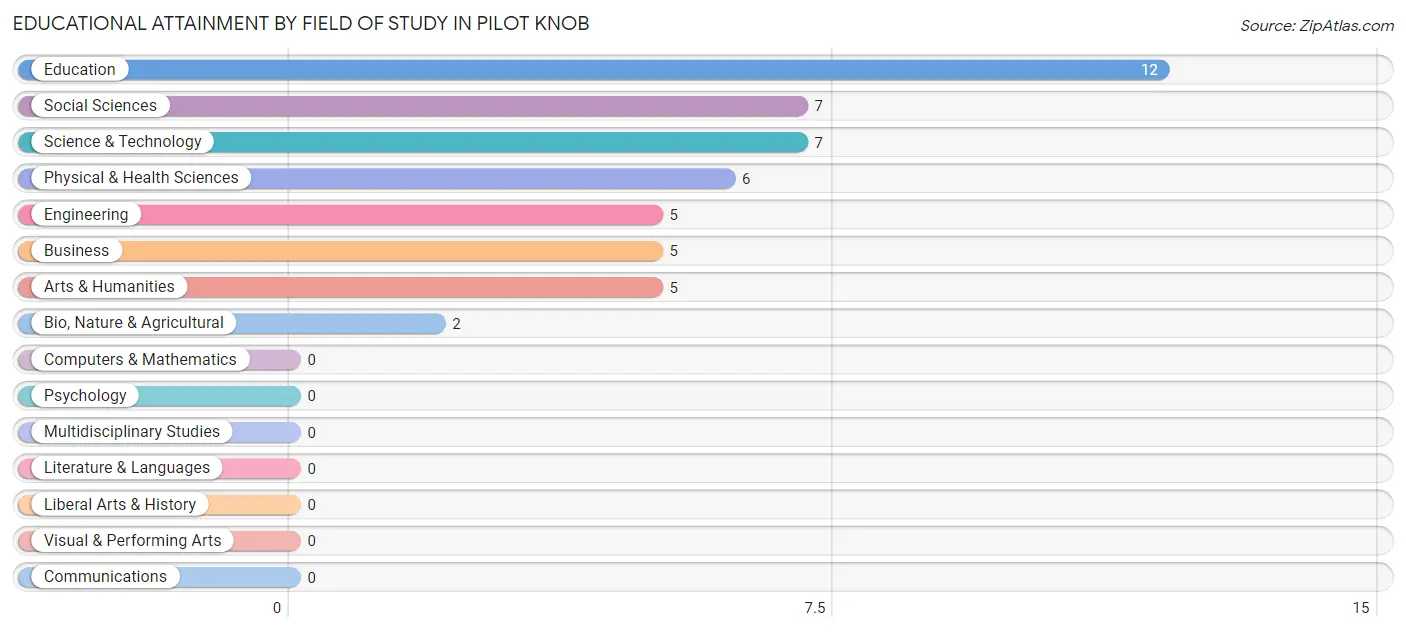
| Field of Study | # Graduates | % Graduates |
| Computers & Mathematics | 0 | 0.0% |
| Bio, Nature & Agricultural | 2 | 4.1% |
| Physical & Health Sciences | 6 | 12.2% |
| Psychology | 0 | 0.0% |
| Social Sciences | 7 | 14.3% |
| Engineering | 5 | 10.2% |
| Multidisciplinary Studies | 0 | 0.0% |
| Science & Technology | 7 | 14.3% |
| Business | 5 | 10.2% |
| Education | 12 | 24.5% |
| Literature & Languages | 0 | 0.0% |
| Liberal Arts & History | 0 | 0.0% |
| Visual & Performing Arts | 0 | 0.0% |
| Communications | 0 | 0.0% |
| Arts & Humanities | 5 | 10.2% |
| Total | 49 | 100.0% |
Transportation & Commute in Pilot Knob
Vehicle Availability by Sex in Pilot Knob
The most prevalent vehicle ownership categories in Pilot Knob are males with 1 vehicle (59, accounting for 40.1%) and females with 1 vehicle (65, making up 28.4%).
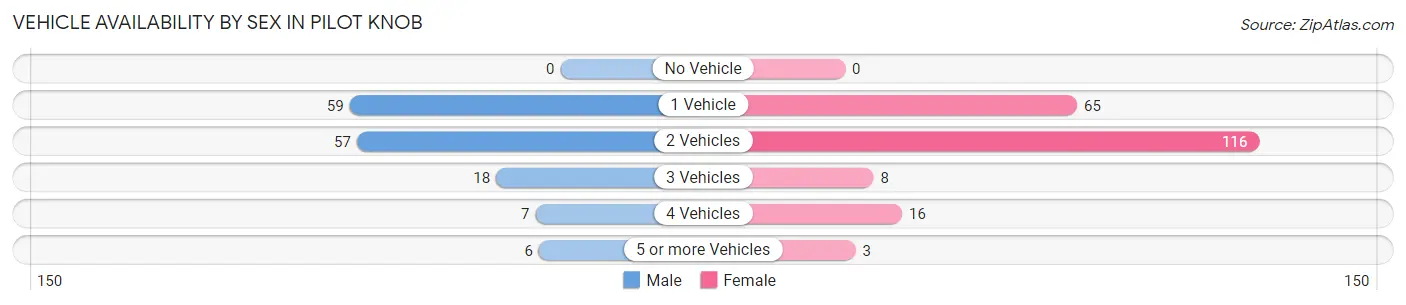
| Vehicles Available | Male | Female |
| No Vehicle | 0 (0.0%) | 0 (0.0%) |
| 1 Vehicle | 59 (40.1%) | 65 (31.2%) |
| 2 Vehicles | 57 (38.8%) | 116 (55.8%) |
| 3 Vehicles | 18 (12.2%) | 8 (3.8%) |
| 4 Vehicles | 7 (4.8%) | 16 (7.7%) |
| 5 or more Vehicles | 6 (4.1%) | 3 (1.4%) |
| Total | 147 (100.0%) | 208 (100.0%) |
Commute Time in Pilot Knob
The most frequently occuring commute durations in Pilot Knob are 5 to 9 minutes (113 commuters, 32.7%), 30 to 34 minutes (66 commuters, 19.1%), and 20 to 24 minutes (39 commuters, 11.3%).
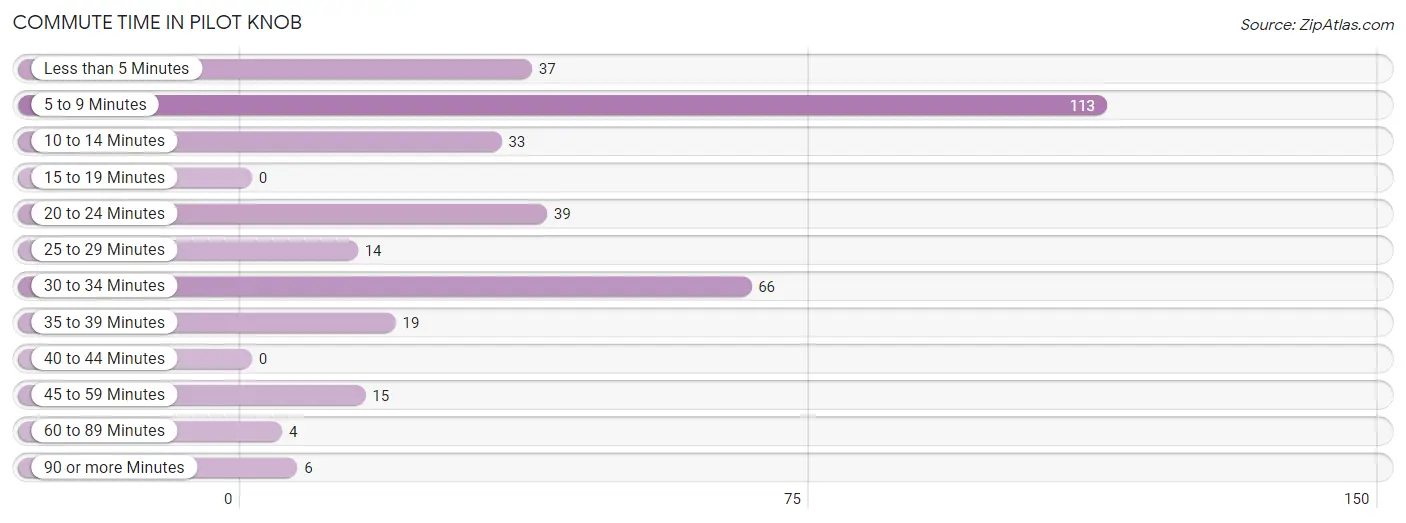
| Commute Time | # Commuters | % Commuters |
| Less than 5 Minutes | 37 | 10.7% |
| 5 to 9 Minutes | 113 | 32.7% |
| 10 to 14 Minutes | 33 | 9.5% |
| 15 to 19 Minutes | 0 | 0.0% |
| 20 to 24 Minutes | 39 | 11.3% |
| 25 to 29 Minutes | 14 | 4.1% |
| 30 to 34 Minutes | 66 | 19.1% |
| 35 to 39 Minutes | 19 | 5.5% |
| 40 to 44 Minutes | 0 | 0.0% |
| 45 to 59 Minutes | 15 | 4.3% |
| 60 to 89 Minutes | 4 | 1.2% |
| 90 or more Minutes | 6 | 1.7% |
Commute Time by Sex in Pilot Knob
The most common commute times in Pilot Knob are 5 to 9 minutes (47 commuters, 32.0%) for males and 5 to 9 minutes (66 commuters, 33.2%) for females.
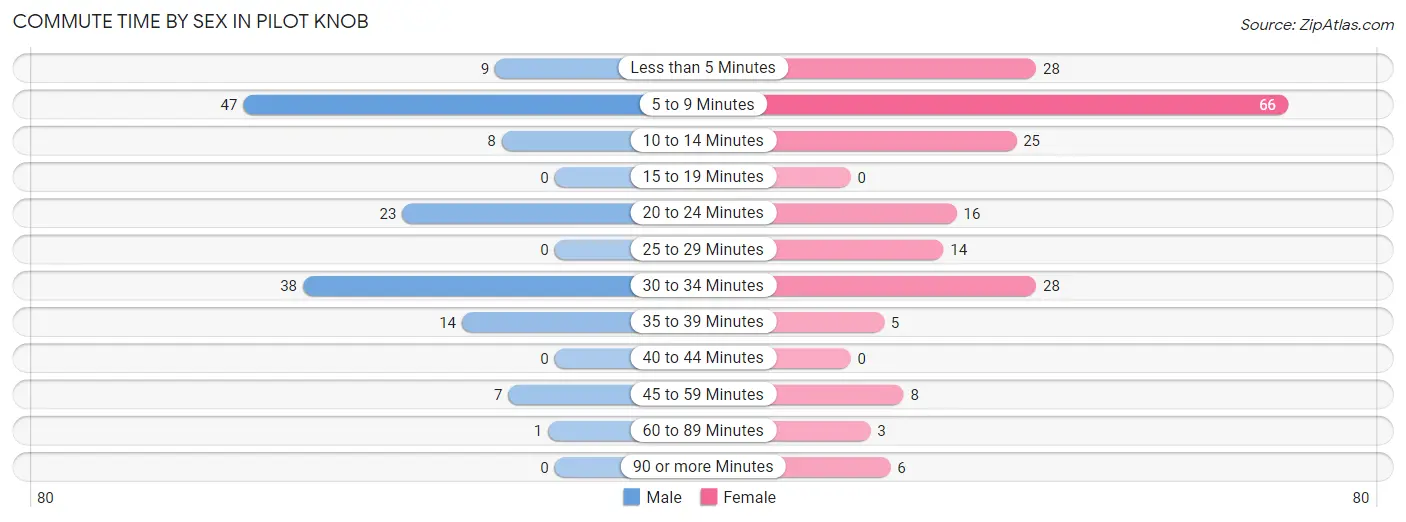
| Commute Time | Male | Female |
| Less than 5 Minutes | 9 (6.1%) | 28 (14.1%) |
| 5 to 9 Minutes | 47 (32.0%) | 66 (33.2%) |
| 10 to 14 Minutes | 8 (5.4%) | 25 (12.6%) |
| 15 to 19 Minutes | 0 (0.0%) | 0 (0.0%) |
| 20 to 24 Minutes | 23 (15.7%) | 16 (8.0%) |
| 25 to 29 Minutes | 0 (0.0%) | 14 (7.0%) |
| 30 to 34 Minutes | 38 (25.9%) | 28 (14.1%) |
| 35 to 39 Minutes | 14 (9.5%) | 5 (2.5%) |
| 40 to 44 Minutes | 0 (0.0%) | 0 (0.0%) |
| 45 to 59 Minutes | 7 (4.8%) | 8 (4.0%) |
| 60 to 89 Minutes | 1 (0.7%) | 3 (1.5%) |
| 90 or more Minutes | 0 (0.0%) | 6 (3.0%) |
Time of Departure to Work by Sex in Pilot Knob
The most frequent times of departure to work in Pilot Knob are 4:00 PM to 11:59 PM (31, 21.1%) for males and 12:00 AM to 4:59 AM (76, 38.2%) for females.
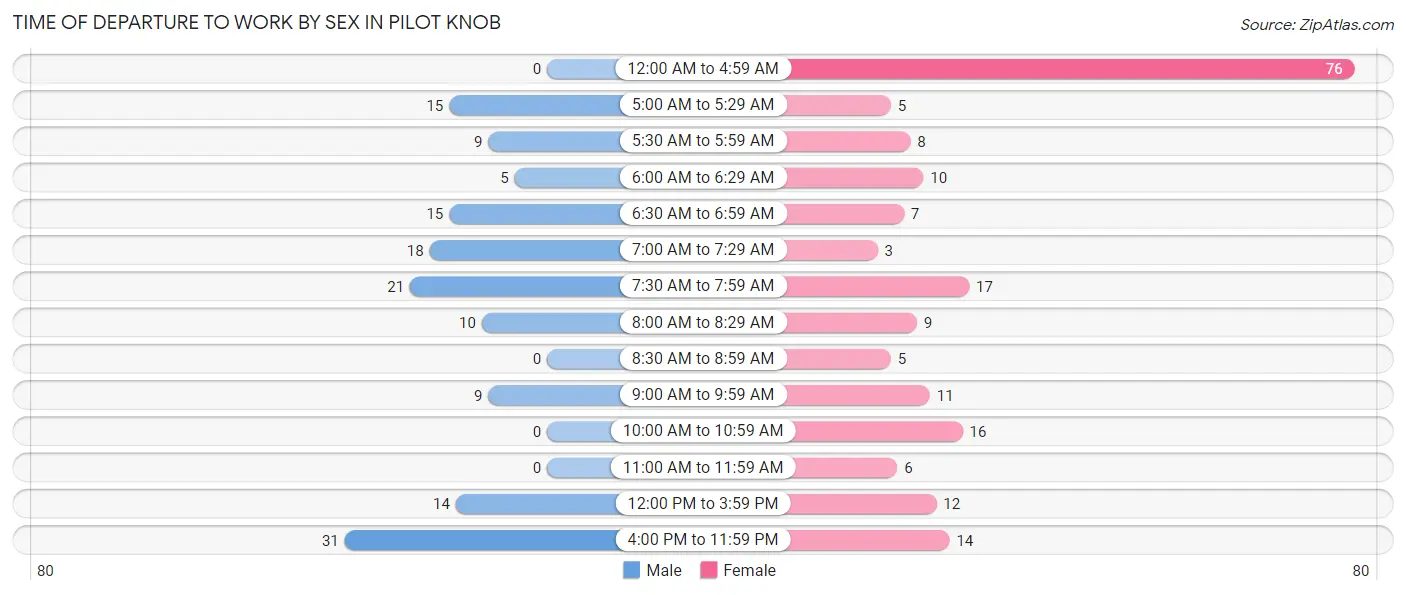
| Time of Departure | Male | Female |
| 12:00 AM to 4:59 AM | 0 (0.0%) | 76 (38.2%) |
| 5:00 AM to 5:29 AM | 15 (10.2%) | 5 (2.5%) |
| 5:30 AM to 5:59 AM | 9 (6.1%) | 8 (4.0%) |
| 6:00 AM to 6:29 AM | 5 (3.4%) | 10 (5.0%) |
| 6:30 AM to 6:59 AM | 15 (10.2%) | 7 (3.5%) |
| 7:00 AM to 7:29 AM | 18 (12.2%) | 3 (1.5%) |
| 7:30 AM to 7:59 AM | 21 (14.3%) | 17 (8.5%) |
| 8:00 AM to 8:29 AM | 10 (6.8%) | 9 (4.5%) |
| 8:30 AM to 8:59 AM | 0 (0.0%) | 5 (2.5%) |
| 9:00 AM to 9:59 AM | 9 (6.1%) | 11 (5.5%) |
| 10:00 AM to 10:59 AM | 0 (0.0%) | 16 (8.0%) |
| 11:00 AM to 11:59 AM | 0 (0.0%) | 6 (3.0%) |
| 12:00 PM to 3:59 PM | 14 (9.5%) | 12 (6.0%) |
| 4:00 PM to 11:59 PM | 31 (21.1%) | 14 (7.0%) |
| Total | 147 (100.0%) | 199 (100.0%) |
Housing Occupancy in Pilot Knob
Occupancy by Ownership in Pilot Knob
Of the total 338 dwellings in Pilot Knob, owner-occupied units account for 199 (58.9%), while renter-occupied units make up 139 (41.1%).
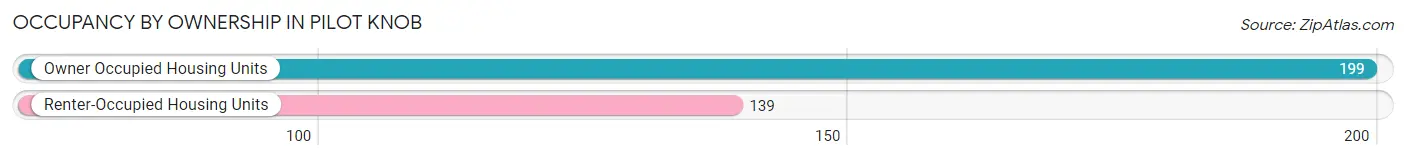
| Occupancy | # Housing Units | % Housing Units |
| Owner Occupied Housing Units | 199 | 58.9% |
| Renter-Occupied Housing Units | 139 | 41.1% |
| Total Occupied Housing Units | 338 | 100.0% |
Occupancy by Household Size in Pilot Knob
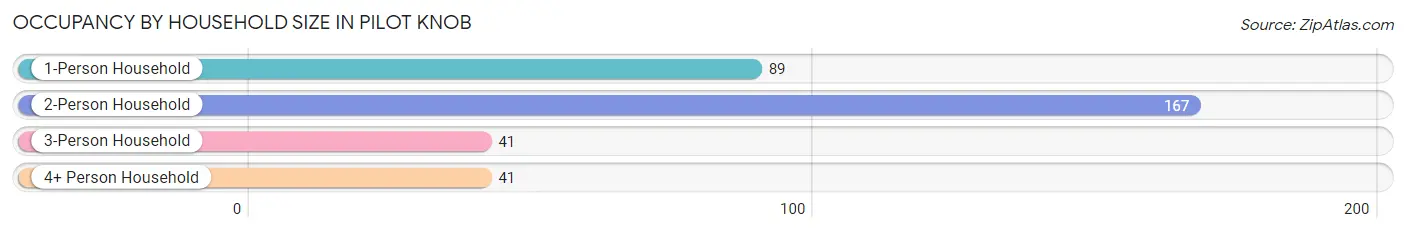
| Household Size | # Housing Units | % Housing Units |
| 1-Person Household | 89 | 26.3% |
| 2-Person Household | 167 | 49.4% |
| 3-Person Household | 41 | 12.1% |
| 4+ Person Household | 41 | 12.1% |
| Total Housing Units | 338 | 100.0% |
Occupancy by Ownership by Household Size in Pilot Knob
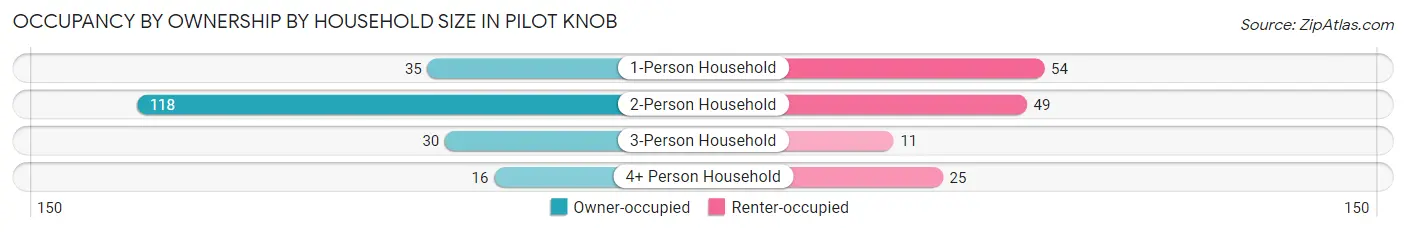
| Household Size | Owner-occupied | Renter-occupied |
| 1-Person Household | 35 (39.3%) | 54 (60.7%) |
| 2-Person Household | 118 (70.7%) | 49 (29.3%) |
| 3-Person Household | 30 (73.2%) | 11 (26.8%) |
| 4+ Person Household | 16 (39.0%) | 25 (61.0%) |
| Total Housing Units | 199 (58.9%) | 139 (41.1%) |
Occupancy by Educational Attainment in Pilot Knob
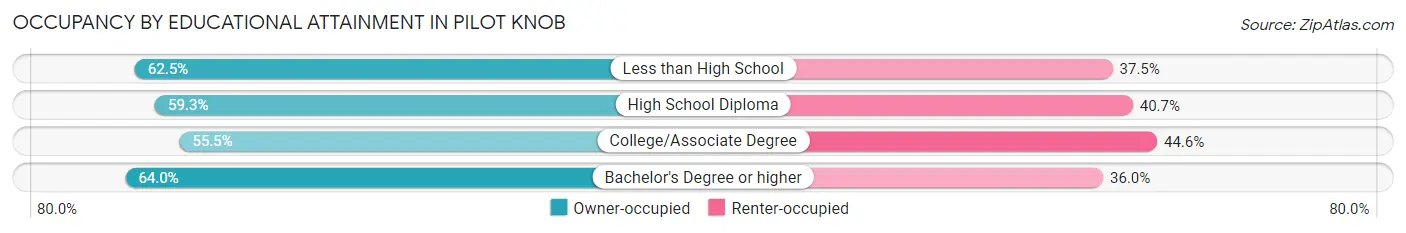
| Household Size | Owner-occupied | Renter-occupied |
| Less than High School | 25 (62.5%) | 15 (37.5%) |
| High School Diploma | 102 (59.3%) | 70 (40.7%) |
| College/Associate Degree | 56 (55.4%) | 45 (44.6%) |
| Bachelor's Degree or higher | 16 (64.0%) | 9 (36.0%) |
Occupancy by Age of Householder in Pilot Knob
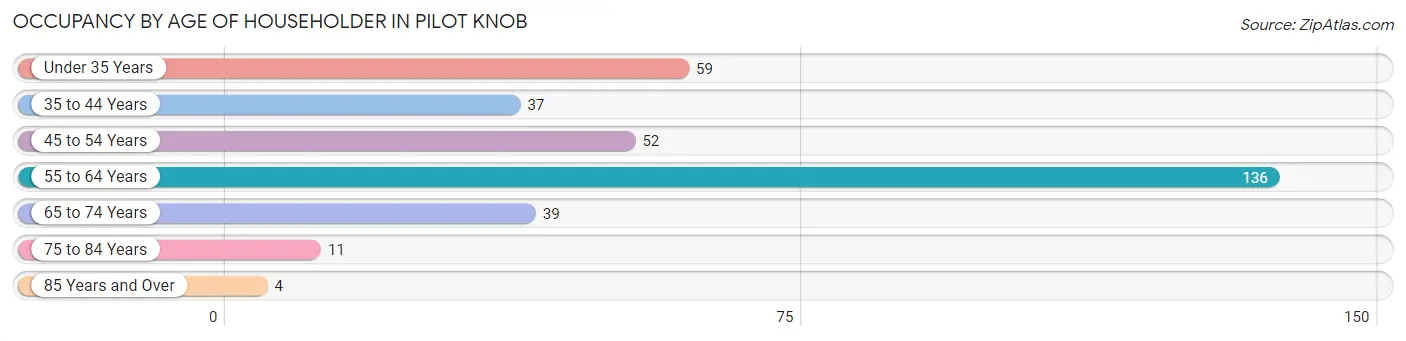
| Age Bracket | # Households | % Households |
| Under 35 Years | 59 | 17.5% |
| 35 to 44 Years | 37 | 11.0% |
| 45 to 54 Years | 52 | 15.4% |
| 55 to 64 Years | 136 | 40.2% |
| 65 to 74 Years | 39 | 11.5% |
| 75 to 84 Years | 11 | 3.3% |
| 85 Years and Over | 4 | 1.2% |
| Total | 338 | 100.0% |
Housing Finances in Pilot Knob
Median Income by Occupancy in Pilot Knob
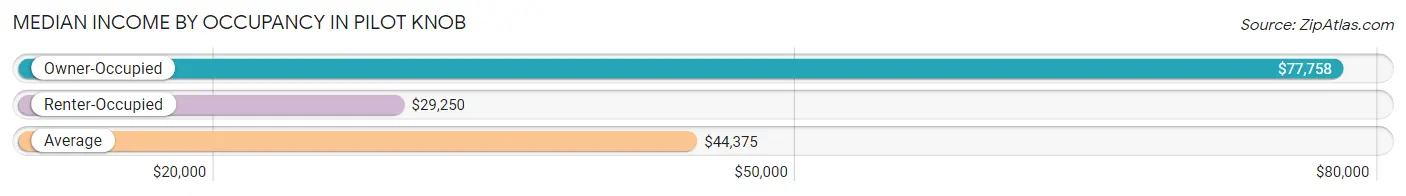
| Occupancy Type | # Households | Median Income |
| Owner-Occupied | 199 (58.9%) | $77,758 |
| Renter-Occupied | 139 (41.1%) | $29,250 |
| Average | 338 (100.0%) | $44,375 |
Occupancy by Householder Income Bracket in Pilot Knob
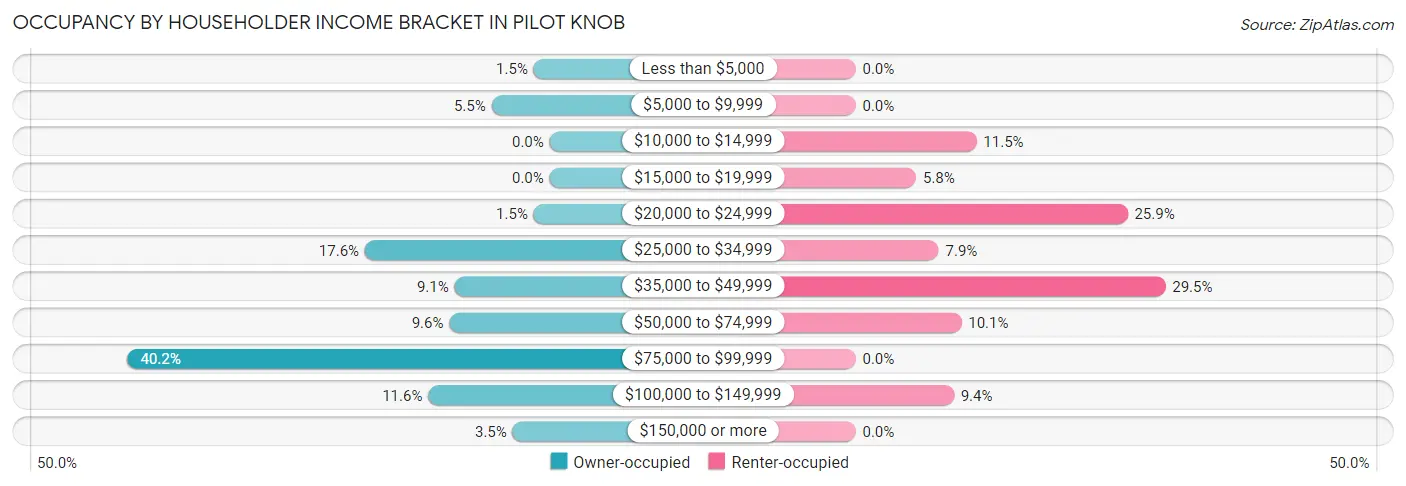
| Income Bracket | Owner-occupied | Renter-occupied |
| Less than $5,000 | 3 (1.5%) | 0 (0.0%) |
| $5,000 to $9,999 | 11 (5.5%) | 0 (0.0%) |
| $10,000 to $14,999 | 0 (0.0%) | 16 (11.5%) |
| $15,000 to $19,999 | 0 (0.0%) | 8 (5.8%) |
| $20,000 to $24,999 | 3 (1.5%) | 36 (25.9%) |
| $25,000 to $34,999 | 35 (17.6%) | 11 (7.9%) |
| $35,000 to $49,999 | 18 (9.0%) | 41 (29.5%) |
| $50,000 to $74,999 | 19 (9.6%) | 14 (10.1%) |
| $75,000 to $99,999 | 80 (40.2%) | 0 (0.0%) |
| $100,000 to $149,999 | 23 (11.6%) | 13 (9.3%) |
| $150,000 or more | 7 (3.5%) | 0 (0.0%) |
| Total | 199 (100.0%) | 139 (100.0%) |
Monthly Housing Cost Tiers in Pilot Knob
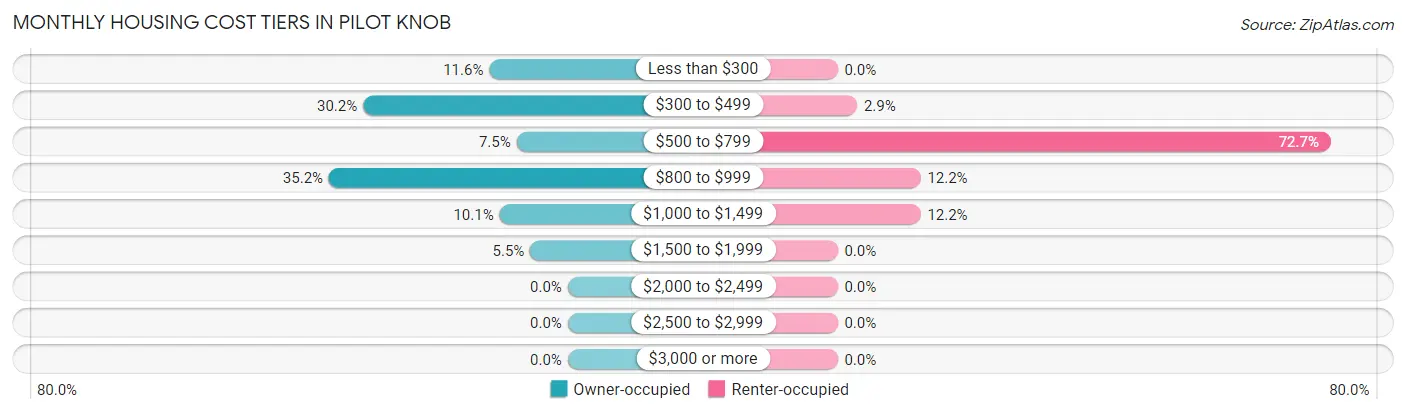
| Monthly Cost | Owner-occupied | Renter-occupied |
| Less than $300 | 23 (11.6%) | 0 (0.0%) |
| $300 to $499 | 60 (30.1%) | 4 (2.9%) |
| $500 to $799 | 15 (7.5%) | 101 (72.7%) |
| $800 to $999 | 70 (35.2%) | 17 (12.2%) |
| $1,000 to $1,499 | 20 (10.1%) | 17 (12.2%) |
| $1,500 to $1,999 | 11 (5.5%) | 0 (0.0%) |
| $2,000 to $2,499 | 0 (0.0%) | 0 (0.0%) |
| $2,500 to $2,999 | 0 (0.0%) | 0 (0.0%) |
| $3,000 or more | 0 (0.0%) | 0 (0.0%) |
| Total | 199 (100.0%) | 139 (100.0%) |
Physical Housing Characteristics in Pilot Knob
Housing Structures in Pilot Knob
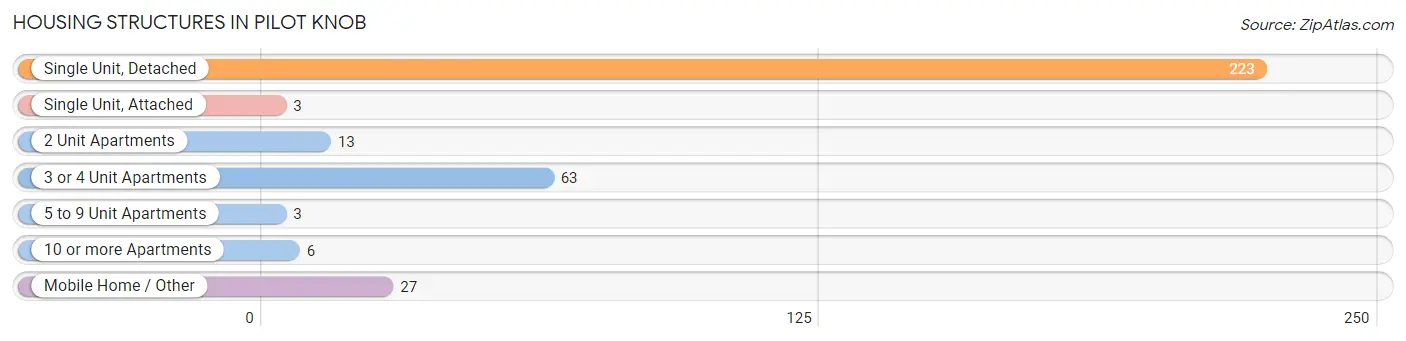
| Structure Type | # Housing Units | % Housing Units |
| Single Unit, Detached | 223 | 66.0% |
| Single Unit, Attached | 3 | 0.9% |
| 2 Unit Apartments | 13 | 3.8% |
| 3 or 4 Unit Apartments | 63 | 18.6% |
| 5 to 9 Unit Apartments | 3 | 0.9% |
| 10 or more Apartments | 6 | 1.8% |
| Mobile Home / Other | 27 | 8.0% |
| Total | 338 | 100.0% |
Housing Structures by Occupancy in Pilot Knob
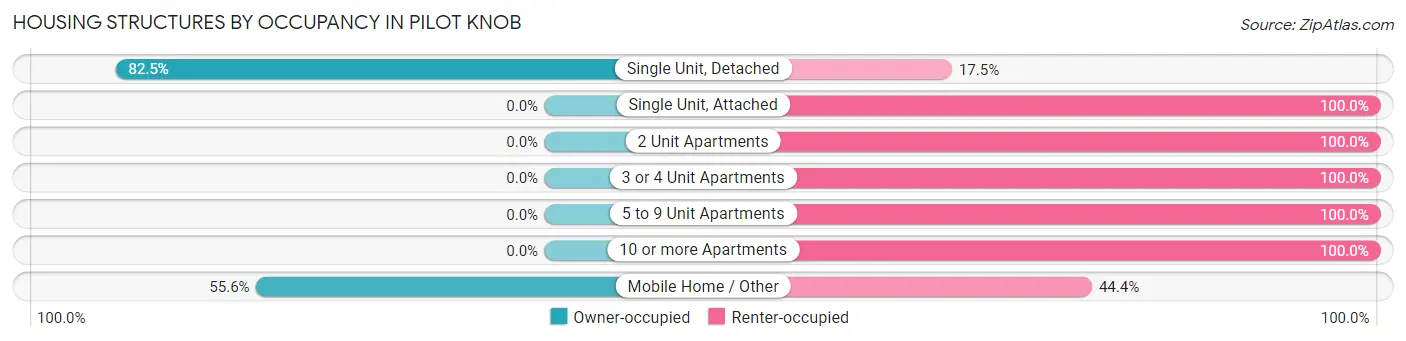
| Structure Type | Owner-occupied | Renter-occupied |
| Single Unit, Detached | 184 (82.5%) | 39 (17.5%) |
| Single Unit, Attached | 0 (0.0%) | 3 (100.0%) |
| 2 Unit Apartments | 0 (0.0%) | 13 (100.0%) |
| 3 or 4 Unit Apartments | 0 (0.0%) | 63 (100.0%) |
| 5 to 9 Unit Apartments | 0 (0.0%) | 3 (100.0%) |
| 10 or more Apartments | 0 (0.0%) | 6 (100.0%) |
| Mobile Home / Other | 15 (55.6%) | 12 (44.4%) |
| Total | 199 (58.9%) | 139 (41.1%) |
Housing Structures by Number of Rooms in Pilot Knob
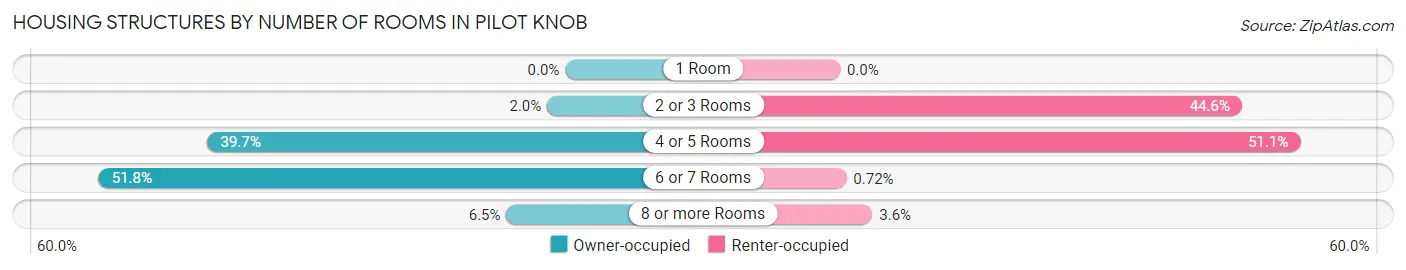
| Number of Rooms | Owner-occupied | Renter-occupied |
| 1 Room | 0 (0.0%) | 0 (0.0%) |
| 2 or 3 Rooms | 4 (2.0%) | 62 (44.6%) |
| 4 or 5 Rooms | 79 (39.7%) | 71 (51.1%) |
| 6 or 7 Rooms | 103 (51.8%) | 1 (0.7%) |
| 8 or more Rooms | 13 (6.5%) | 5 (3.6%) |
| Total | 199 (100.0%) | 139 (100.0%) |
Housing Structure by Heating Type in Pilot Knob
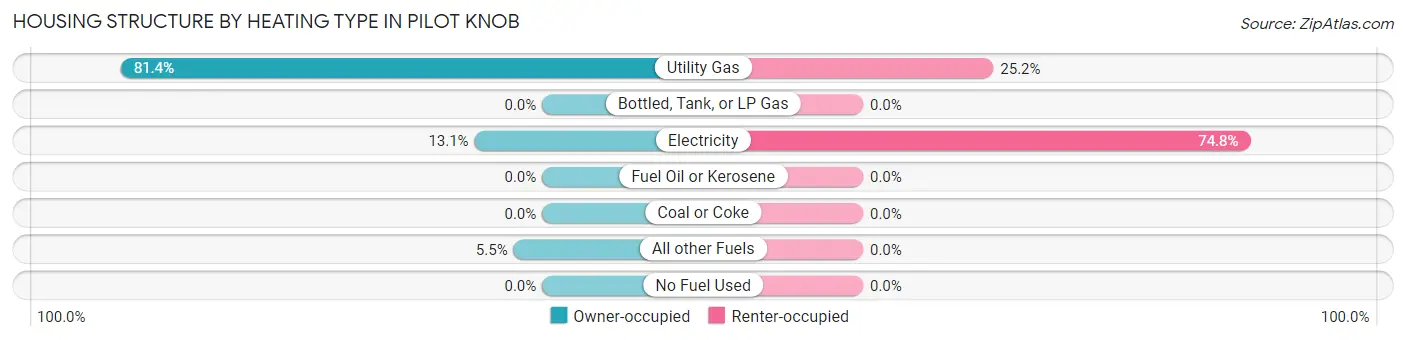
| Heating Type | Owner-occupied | Renter-occupied |
| Utility Gas | 162 (81.4%) | 35 (25.2%) |
| Bottled, Tank, or LP Gas | 0 (0.0%) | 0 (0.0%) |
| Electricity | 26 (13.1%) | 104 (74.8%) |
| Fuel Oil or Kerosene | 0 (0.0%) | 0 (0.0%) |
| Coal or Coke | 0 (0.0%) | 0 (0.0%) |
| All other Fuels | 11 (5.5%) | 0 (0.0%) |
| No Fuel Used | 0 (0.0%) | 0 (0.0%) |
| Total | 199 (100.0%) | 139 (100.0%) |
Household Vehicle Usage in Pilot Knob
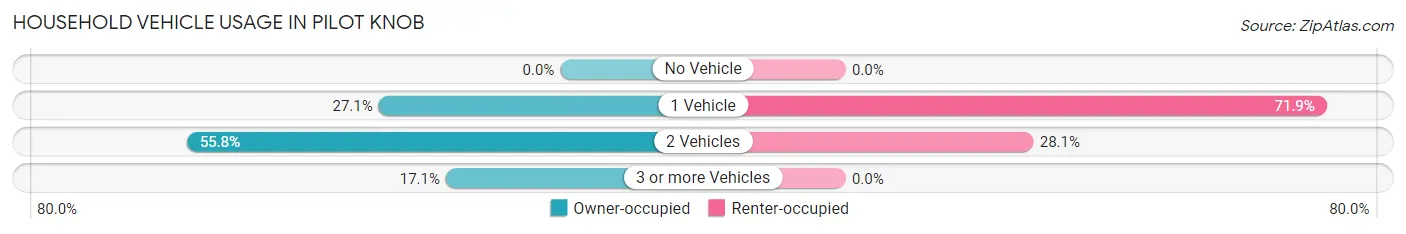
| Vehicles per Household | Owner-occupied | Renter-occupied |
| No Vehicle | 0 (0.0%) | 0 (0.0%) |
| 1 Vehicle | 54 (27.1%) | 100 (71.9%) |
| 2 Vehicles | 111 (55.8%) | 39 (28.1%) |
| 3 or more Vehicles | 34 (17.1%) | 0 (0.0%) |
| Total | 199 (100.0%) | 139 (100.0%) |
Real Estate & Mortgages in Pilot Knob
Real Estate and Mortgage Overview in Pilot Knob
| Characteristic | Without Mortgage | With Mortgage |
| Housing Units | 89 | 110 |
| Median Property Value | $72,800 | $113,200 |
| Median Household Income | - | - |
| Monthly Housing Costs | $354 | $0 |
| Real Estate Taxes | $515 | $5 |
Property Value by Mortgage Status in Pilot Knob
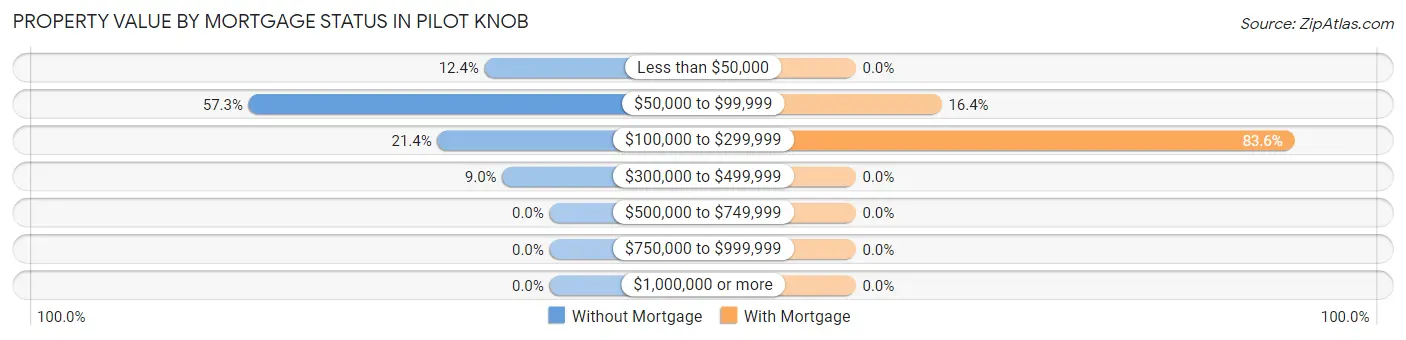
| Property Value | Without Mortgage | With Mortgage |
| Less than $50,000 | 11 (12.4%) | 0 (0.0%) |
| $50,000 to $99,999 | 51 (57.3%) | 18 (16.4%) |
| $100,000 to $299,999 | 19 (21.3%) | 92 (83.6%) |
| $300,000 to $499,999 | 8 (9.0%) | 0 (0.0%) |
| $500,000 to $749,999 | 0 (0.0%) | 0 (0.0%) |
| $750,000 to $999,999 | 0 (0.0%) | 0 (0.0%) |
| $1,000,000 or more | 0 (0.0%) | 0 (0.0%) |
| Total | 89 (100.0%) | 110 (100.0%) |
Household Income by Mortgage Status in Pilot Knob
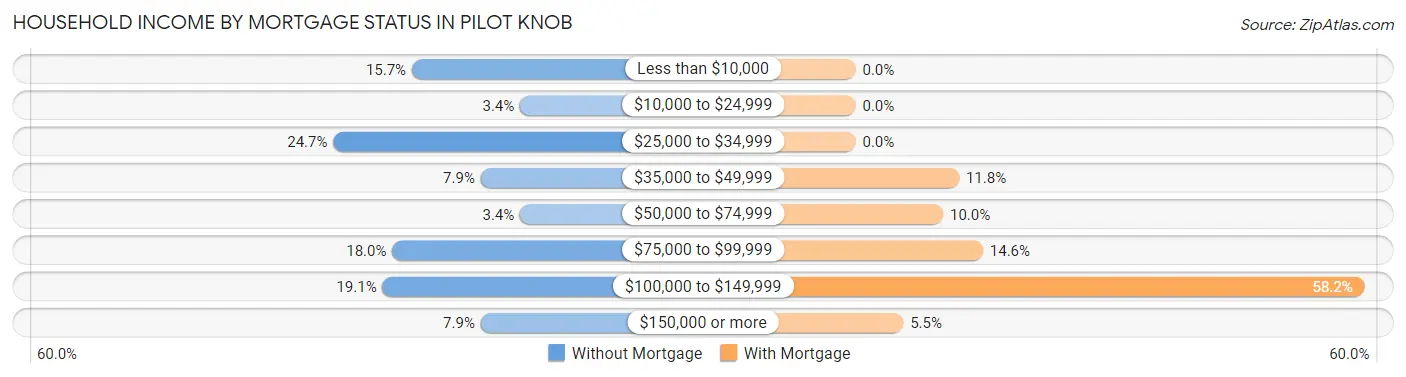
| Household Income | Without Mortgage | With Mortgage |
| Less than $10,000 | 14 (15.7%) | 0 (0.0%) |
| $10,000 to $24,999 | 3 (3.4%) | 0 (0.0%) |
| $25,000 to $34,999 | 22 (24.7%) | 0 (0.0%) |
| $35,000 to $49,999 | 7 (7.9%) | 13 (11.8%) |
| $50,000 to $74,999 | 3 (3.4%) | 11 (10.0%) |
| $75,000 to $99,999 | 16 (18.0%) | 16 (14.5%) |
| $100,000 to $149,999 | 17 (19.1%) | 64 (58.2%) |
| $150,000 or more | 7 (7.9%) | 6 (5.4%) |
| Total | 89 (100.0%) | 110 (100.0%) |
Property Value to Household Income Ratio in Pilot Knob
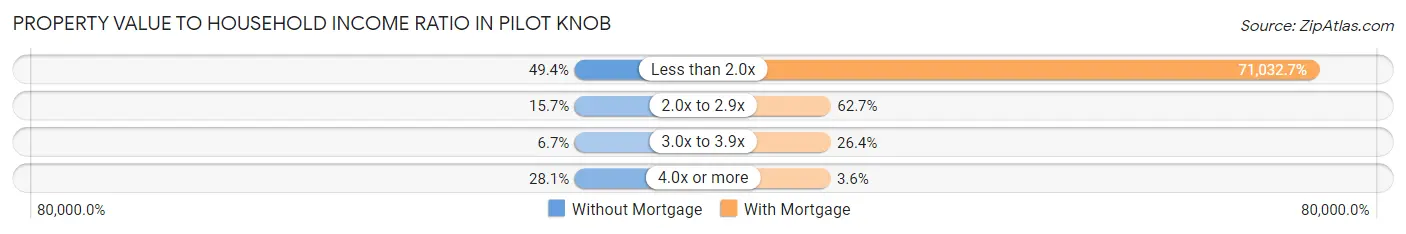
| Value-to-Income Ratio | Without Mortgage | With Mortgage |
| Less than 2.0x | 44 (49.4%) | 78,136 (71,032.7%) |
| 2.0x to 2.9x | 14 (15.7%) | 69 (62.7%) |
| 3.0x to 3.9x | 6 (6.7%) | 29 (26.4%) |
| 4.0x or more | 25 (28.1%) | 4 (3.6%) |
| Total | 89 (100.0%) | 110 (100.0%) |
Real Estate Taxes by Mortgage Status in Pilot Knob
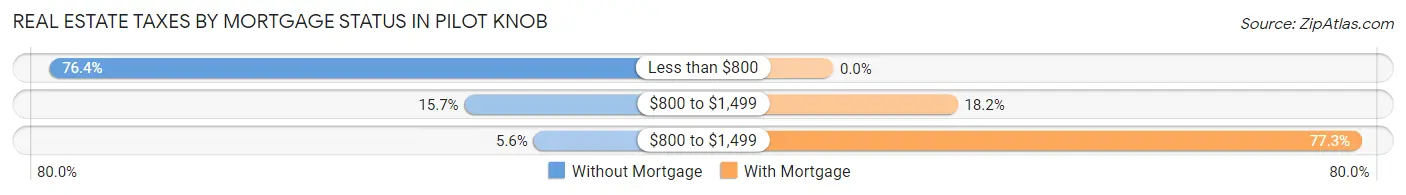
| Property Taxes | Without Mortgage | With Mortgage |
| Less than $800 | 68 (76.4%) | 0 (0.0%) |
| $800 to $1,499 | 14 (15.7%) | 20 (18.2%) |
| $800 to $1,499 | 5 (5.6%) | 85 (77.3%) |
| Total | 89 (100.0%) | 110 (100.0%) |
Health & Disability in Pilot Knob
Health Insurance Coverage by Age in Pilot Knob
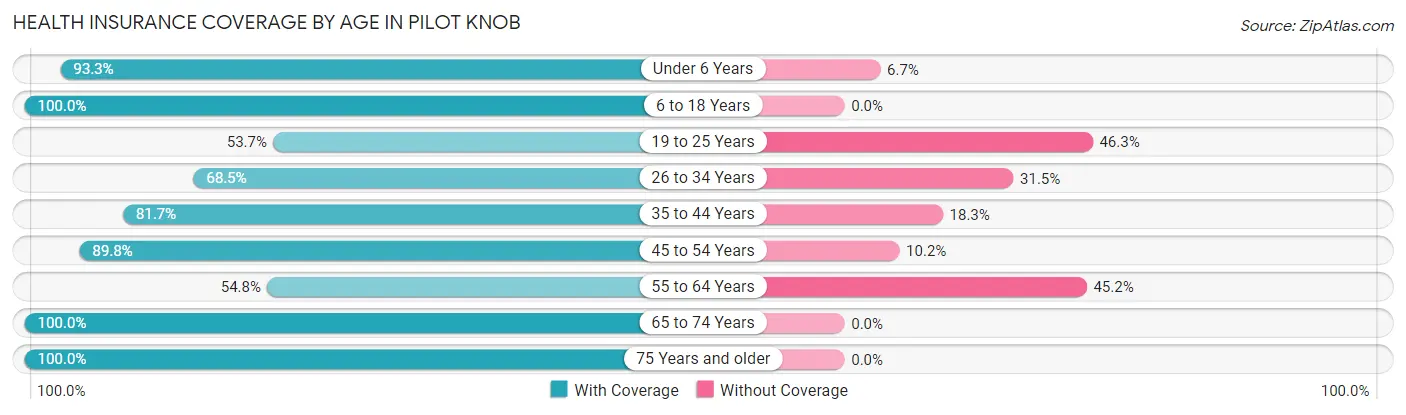
| Age Bracket | With Coverage | Without Coverage |
| Under 6 Years | 84 (93.3%) | 6 (6.7%) |
| 6 to 18 Years | 61 (100.0%) | 0 (0.0%) |
| 19 to 25 Years | 65 (53.7%) | 56 (46.3%) |
| 26 to 34 Years | 37 (68.5%) | 17 (31.5%) |
| 35 to 44 Years | 49 (81.7%) | 11 (18.3%) |
| 45 to 54 Years | 79 (89.8%) | 9 (10.2%) |
| 55 to 64 Years | 85 (54.8%) | 70 (45.2%) |
| 65 to 74 Years | 92 (100.0%) | 0 (0.0%) |
| 75 Years and older | 49 (100.0%) | 0 (0.0%) |
| Total | 601 (78.0%) | 169 (22.0%) |
Health Insurance Coverage by Citizenship Status in Pilot Knob
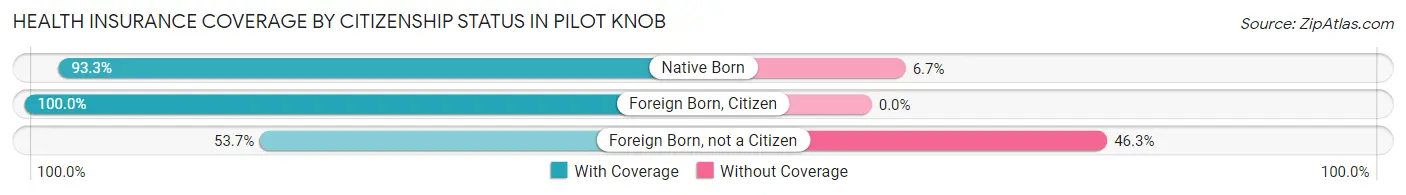
| Citizenship Status | With Coverage | Without Coverage |
| Native Born | 84 (93.3%) | 6 (6.7%) |
| Foreign Born, Citizen | 61 (100.0%) | 0 (0.0%) |
| Foreign Born, not a Citizen | 65 (53.7%) | 56 (46.3%) |
Health Insurance Coverage by Household Income in Pilot Knob
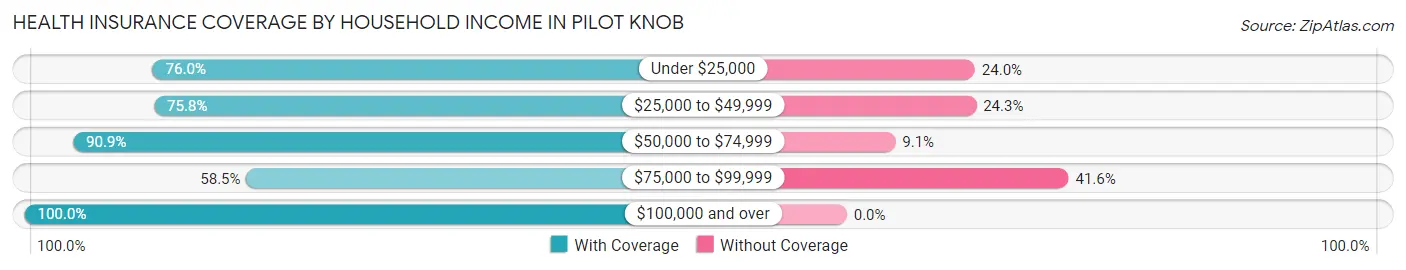
| Household Income | With Coverage | Without Coverage |
| Under $25,000 | 95 (76.0%) | 30 (24.0%) |
| $25,000 to $49,999 | 228 (75.7%) | 73 (24.2%) |
| $50,000 to $74,999 | 70 (90.9%) | 7 (9.1%) |
| $75,000 to $99,999 | 83 (58.5%) | 59 (41.5%) |
| $100,000 and over | 109 (100.0%) | 0 (0.0%) |
Public vs Private Health Insurance Coverage by Age in Pilot Knob
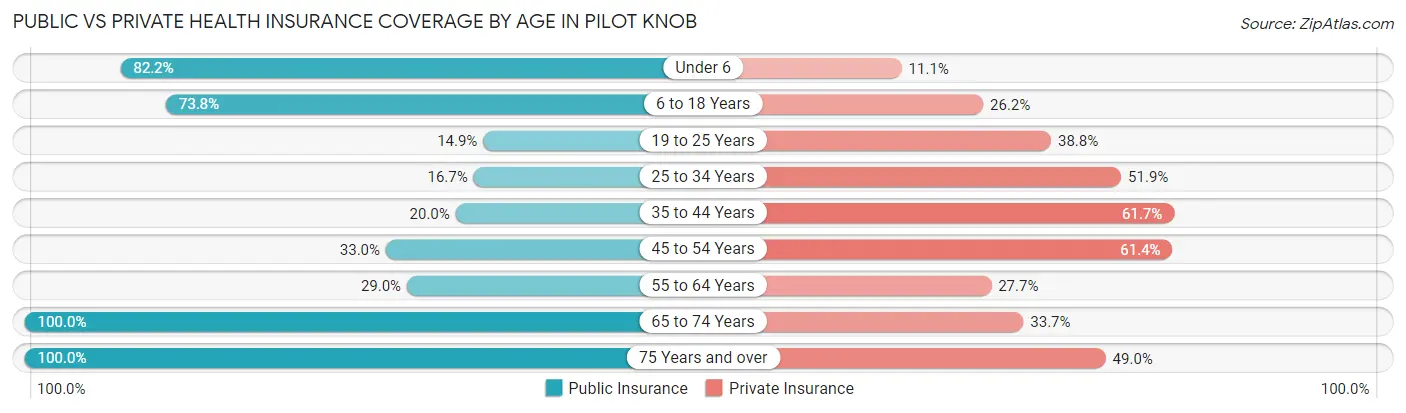
| Age Bracket | Public Insurance | Private Insurance |
| Under 6 | 74 (82.2%) | 10 (11.1%) |
| 6 to 18 Years | 45 (73.8%) | 16 (26.2%) |
| 19 to 25 Years | 18 (14.9%) | 47 (38.8%) |
| 25 to 34 Years | 9 (16.7%) | 28 (51.8%) |
| 35 to 44 Years | 12 (20.0%) | 37 (61.7%) |
| 45 to 54 Years | 29 (33.0%) | 54 (61.4%) |
| 55 to 64 Years | 45 (29.0%) | 43 (27.7%) |
| 65 to 74 Years | 92 (100.0%) | 31 (33.7%) |
| 75 Years and over | 49 (100.0%) | 24 (49.0%) |
| Total | 373 (48.4%) | 290 (37.7%) |
Disability Status by Sex by Age in Pilot Knob
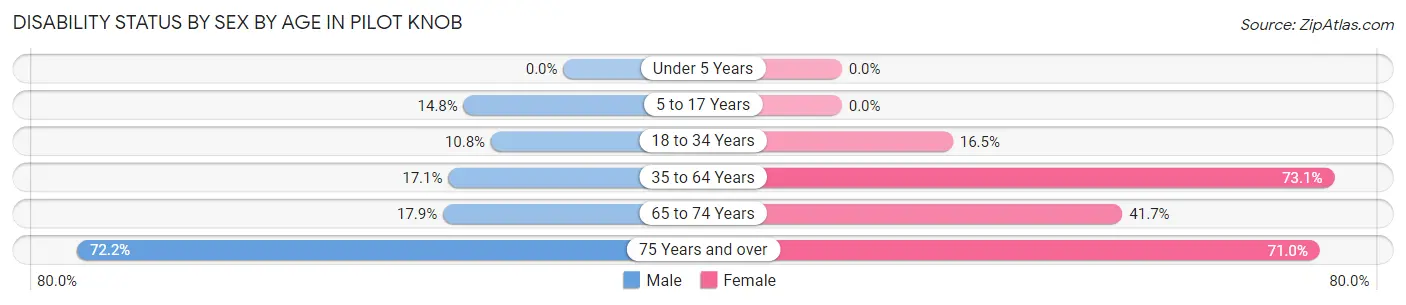
| Age Bracket | Male | Female |
| Under 5 Years | 0 (0.0%) | 0 (0.0%) |
| 5 to 17 Years | 4 (14.8%) | 0 (0.0%) |
| 18 to 34 Years | 10 (10.7%) | 15 (16.5%) |
| 35 to 64 Years | 20 (17.1%) | 136 (73.1%) |
| 65 to 74 Years | 10 (17.9%) | 15 (41.7%) |
| 75 Years and over | 13 (72.2%) | 22 (71.0%) |
Disability Class by Sex by Age in Pilot Knob
Disability Class: Hearing Difficulty
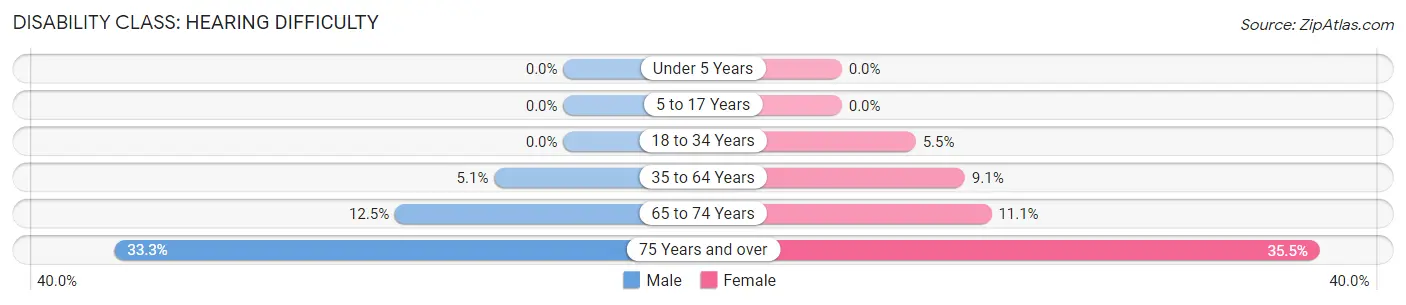
| Age Bracket | Male | Female |
| Under 5 Years | 0 (0.0%) | 0 (0.0%) |
| 5 to 17 Years | 0 (0.0%) | 0 (0.0%) |
| 18 to 34 Years | 0 (0.0%) | 5 (5.5%) |
| 35 to 64 Years | 6 (5.1%) | 17 (9.1%) |
| 65 to 74 Years | 7 (12.5%) | 4 (11.1%) |
| 75 Years and over | 6 (33.3%) | 11 (35.5%) |
Disability Class: Vision Difficulty
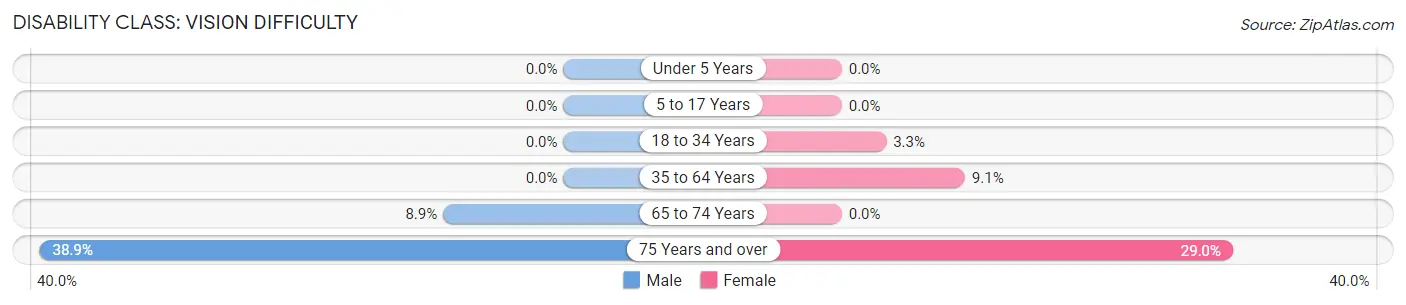
| Age Bracket | Male | Female |
| Under 5 Years | 0 (0.0%) | 0 (0.0%) |
| 5 to 17 Years | 0 (0.0%) | 0 (0.0%) |
| 18 to 34 Years | 0 (0.0%) | 3 (3.3%) |
| 35 to 64 Years | 0 (0.0%) | 17 (9.1%) |
| 65 to 74 Years | 5 (8.9%) | 0 (0.0%) |
| 75 Years and over | 7 (38.9%) | 9 (29.0%) |
Disability Class: Cognitive Difficulty
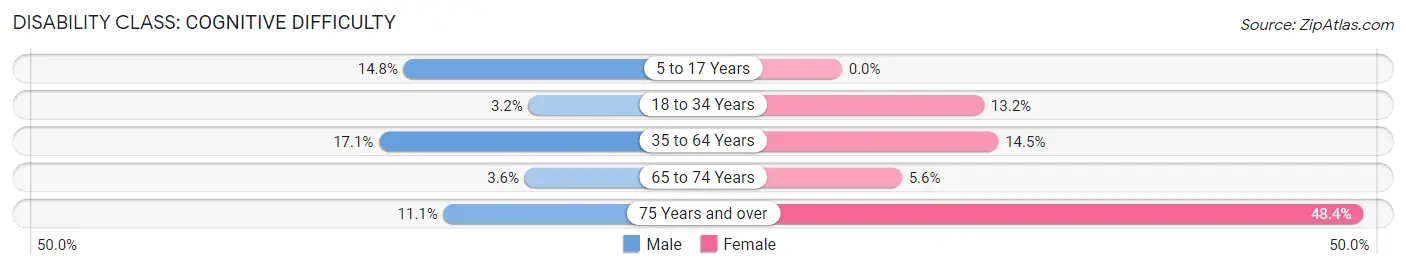
| Age Bracket | Male | Female |
| 5 to 17 Years | 4 (14.8%) | 0 (0.0%) |
| 18 to 34 Years | 3 (3.2%) | 12 (13.2%) |
| 35 to 64 Years | 20 (17.1%) | 27 (14.5%) |
| 65 to 74 Years | 2 (3.6%) | 2 (5.6%) |
| 75 Years and over | 2 (11.1%) | 15 (48.4%) |
Disability Class: Ambulatory Difficulty
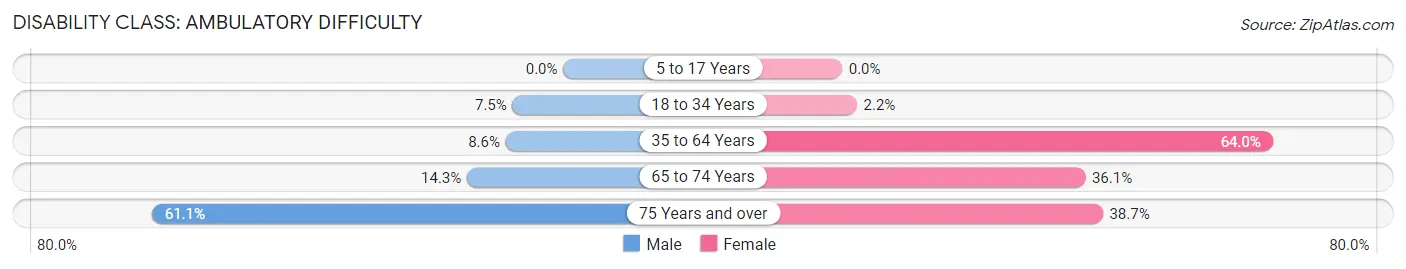
| Age Bracket | Male | Female |
| 5 to 17 Years | 0 (0.0%) | 0 (0.0%) |
| 18 to 34 Years | 7 (7.5%) | 2 (2.2%) |
| 35 to 64 Years | 10 (8.6%) | 119 (64.0%) |
| 65 to 74 Years | 8 (14.3%) | 13 (36.1%) |
| 75 Years and over | 11 (61.1%) | 12 (38.7%) |
Disability Class: Self-Care Difficulty
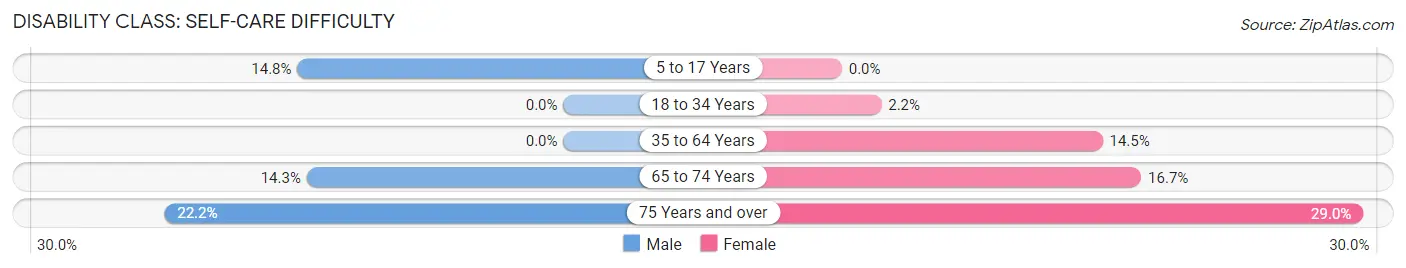
| Age Bracket | Male | Female |
| 5 to 17 Years | 4 (14.8%) | 0 (0.0%) |
| 18 to 34 Years | 0 (0.0%) | 2 (2.2%) |
| 35 to 64 Years | 0 (0.0%) | 27 (14.5%) |
| 65 to 74 Years | 8 (14.3%) | 6 (16.7%) |
| 75 Years and over | 4 (22.2%) | 9 (29.0%) |
Technology Access in Pilot Knob
Computing Device Access in Pilot Knob
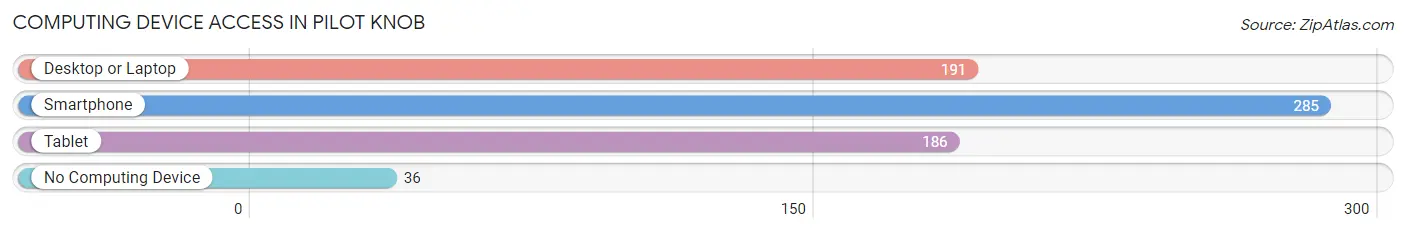
| Device Type | # Households | % Households |
| Desktop or Laptop | 191 | 56.5% |
| Smartphone | 285 | 84.3% |
| Tablet | 186 | 55.0% |
| No Computing Device | 36 | 10.6% |
| Total | 338 | 100.0% |
Internet Access in Pilot Knob
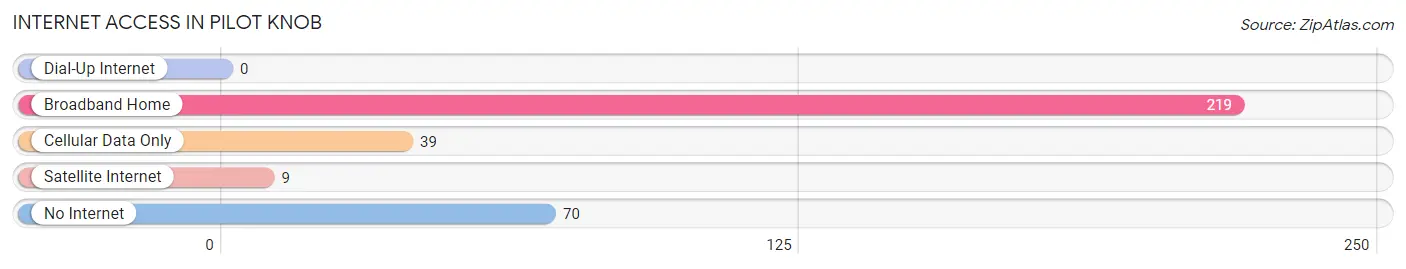
| Internet Type | # Households | % Households |
| Dial-Up Internet | 0 | 0.0% |
| Broadband Home | 219 | 64.8% |
| Cellular Data Only | 39 | 11.5% |
| Satellite Internet | 9 | 2.7% |
| No Internet | 70 | 20.7% |
| Total | 338 | 100.0% |
Pilot Knob Summary
Pilot Knob, Missouri is a small town located in Iron County, Missouri. It is situated in the foothills of the Ozark Mountains, approximately 30 miles south of St. Louis. The town was founded in 1858 and was named after a nearby mountain peak. The population of Pilot Knob was 1,072 at the 2010 census.
Geography
Pilot Knob is located at 37°45'25" North, 90°45'25" West (37.756944, -90.756944). The town is situated in the foothills of the Ozark Mountains, approximately 30 miles south of St. Louis. The town is located on the banks of the Big River, which flows through the area. The town is surrounded by rolling hills and forests.
Economy
Pilot Knob is a small rural town with a limited economy. The town is home to several small businesses, including a grocery store, a hardware store, a gas station, and a few restaurants. The town also has a few small manufacturing companies. The town is also home to a small airport, which serves the local area.
Demographics
As of the 2010 census, the population of Pilot Knob was 1,072. The racial makeup of the town was 97.2% White, 0.7% African American, 0.2% Native American, 0.2% Asian, 0.2% from other races, and 1.7% from two or more races. Hispanic or Latino of any race were 0.7% of the population.
The median income for a household in Pilot Knob was $35,625, and the median income for a family was $41,250. Males had a median income of $30,000 versus $21,250 for females. The per capita income for the town was $17,845. About 11.2% of families and 13.2% of the population were below the poverty line, including 16.7% of those under age 18 and 8.3% of those age 65 or over.
History
Pilot Knob was founded in 1858 and was named after a nearby mountain peak. The town was originally a mining town, with the main industry being iron ore mining. The town was also home to a large iron smelting plant. The town was also home to a large number of saloons and brothels.
In the late 19th century, the town began to decline as the iron ore mines began to run out of ore. The town was also hit hard by the Great Depression. In the 1940s, the town began to experience a resurgence as the nearby military base, Fort Leonard Wood, began to expand. The town was also home to a large number of veterans who had served in World War II.
In the 1950s, the town began to experience a decline as the military base began to downsize. The town was also hit hard by the decline of the iron ore industry. In the 1970s, the town began to experience a resurgence as the nearby Mark Twain National Forest began to attract tourists. The town is now home to a number of small businesses and is a popular tourist destination.
Common Questions
What is Per Capita Income in Pilot Knob?
Per Capita income in Pilot Knob is $24,449.
What is the Median Family Income in Pilot Knob?
Median Family Income in Pilot Knob is $68,438.
What is the Median Household income in Pilot Knob?
Median Household Income in Pilot Knob is $44,375.
What is Income or Wage Gap in Pilot Knob?
Income or Wage Gap in Pilot Knob is 23.7%.
Women in Pilot Knob earn 76.3 cents for every dollar earned by a man.
What is Inequality or Gini Index in Pilot Knob?
Inequality or Gini Index in Pilot Knob is 0.39.
What is the Total Population of Pilot Knob?
Total Population of Pilot Knob is 773.
What is the Total Male Population of Pilot Knob?
Total Male Population of Pilot Knob is 363.
What is the Total Female Population of Pilot Knob?
Total Female Population of Pilot Knob is 410.
What is the Ratio of Males per 100 Females in Pilot Knob?
There are 88.54 Males per 100 Females in Pilot Knob.
What is the Ratio of Females per 100 Males in Pilot Knob?
There are 112.95 Females per 100 Males in Pilot Knob.
What is the Median Population Age in Pilot Knob?
Median Population Age in Pilot Knob is 45.1 Years.
What is the Average Family Size in Pilot Knob
Average Family Size in Pilot Knob is 2.6 People.
What is the Average Household Size in Pilot Knob
Average Household Size in Pilot Knob is 2.2 People.
How Large is the Labor Force in Pilot Knob?
There are 390 People in the Labor Forcein in Pilot Knob.
What is the Percentage of People in the Labor Force in Pilot Knob?
61.0% of People are in the Labor Force in Pilot Knob.
What is the Unemployment Rate in Pilot Knob?
Unemployment Rate in Pilot Knob is 8.5%.