Piedmont, MO Map & Demographics
Piedmont Map
Piedmont Overview
$16,717
PER CAPITA INCOME
$55,074
AVG FAMILY INCOME
$35,341
AVG HOUSEHOLD INCOME
0.46
INEQUALITY / GINI INDEX
2,739
TOTAL POPULATION
1,323
MALE POPULATION
1,416
FEMALE POPULATION
93.43
MALES / 100 FEMALES
107.03
FEMALES / 100 MALES
39.8
MEDIAN AGE
4.1
AVG FAMILY SIZE
2.7
AVG HOUSEHOLD SIZE
804
LABOR FORCE [ PEOPLE ]
37.4%
PERCENT IN LABOR FORCE
5.8%
UNEMPLOYMENT RATE
Piedmont Zip Codes
Piedmont Area Codes
Income in Piedmont
Income Overview in Piedmont
Per Capita Income in Piedmont is $16,717, while median incomes of families and households are $55,074 and $35,341 respectively.
| Characteristic | Number | Measure |
| Per Capita Income | 2,739 | $16,717 |
| Median Family Income | 499 | $55,074 |
| Mean Family Income | 499 | $54,007 |
| Median Household Income | 994 | $35,341 |
| Mean Household Income | 994 | $41,503 |
| Income Deficit | 499 | $0 |
| Wage / Income Gap (%) | 2,739 | 0.00% |
| Wage / Income Gap ($) | 2,739 | 100.00¢ per $1 |
| Gini / Inequality Index | 2,739 | 0.46 |
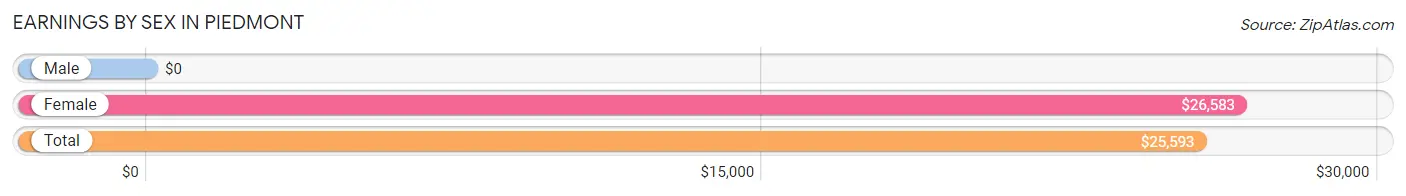
Earnings by Sex in Piedmont
| Sex | Number | Average Earnings |
| Male | 502 (52.1%) | $0 |
| Female | 461 (47.9%) | $26,583 |
| Total | 963 (100.0%) | $25,593 |
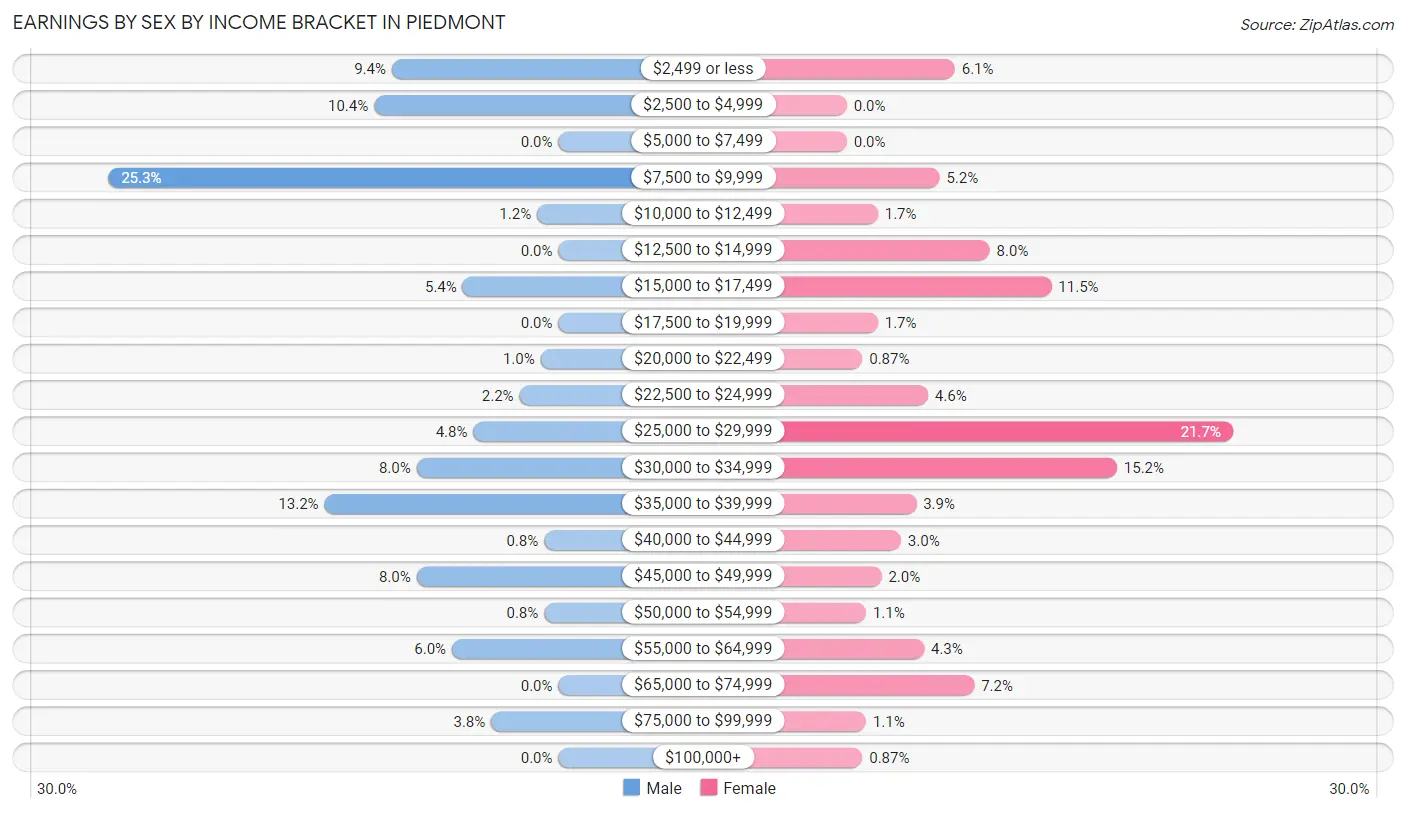
Earnings by Sex by Income Bracket in Piedmont
The most common earnings brackets in Piedmont are $7,500 to $9,999 for men (127 | 25.3%) and $25,000 to $29,999 for women (100 | 21.7%).
| Income | Male | Female |
| $2,499 or less | 47 (9.4%) | 28 (6.1%) |
| $2,500 to $4,999 | 52 (10.4%) | 0 (0.0%) |
| $5,000 to $7,499 | 0 (0.0%) | 0 (0.0%) |
| $7,500 to $9,999 | 127 (25.3%) | 24 (5.2%) |
| $10,000 to $12,499 | 6 (1.2%) | 8 (1.7%) |
| $12,500 to $14,999 | 0 (0.0%) | 37 (8.0%) |
| $15,000 to $17,499 | 27 (5.4%) | 53 (11.5%) |
| $17,500 to $19,999 | 0 (0.0%) | 8 (1.7%) |
| $20,000 to $22,499 | 5 (1.0%) | 4 (0.9%) |
| $22,500 to $24,999 | 11 (2.2%) | 21 (4.6%) |
| $25,000 to $29,999 | 24 (4.8%) | 100 (21.7%) |
| $30,000 to $34,999 | 40 (8.0%) | 70 (15.2%) |
| $35,000 to $39,999 | 66 (13.2%) | 18 (3.9%) |
| $40,000 to $44,999 | 4 (0.8%) | 14 (3.0%) |
| $45,000 to $49,999 | 40 (8.0%) | 9 (1.9%) |
| $50,000 to $54,999 | 4 (0.8%) | 5 (1.1%) |
| $55,000 to $64,999 | 30 (6.0%) | 20 (4.3%) |
| $65,000 to $74,999 | 0 (0.0%) | 33 (7.2%) |
| $75,000 to $99,999 | 19 (3.8%) | 5 (1.1%) |
| $100,000+ | 0 (0.0%) | 4 (0.9%) |
| Total | 502 (100.0%) | 461 (100.0%) |
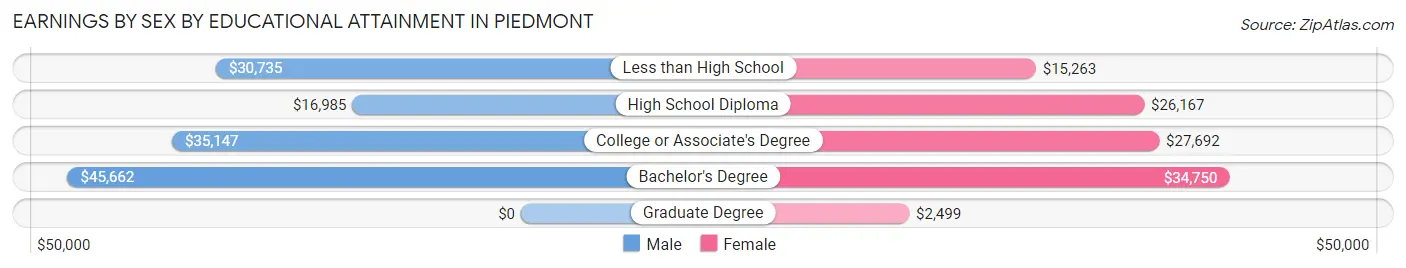
Earnings by Sex by Educational Attainment in Piedmont
Average earnings in Piedmont are $31,912 for men and $26,783 for women, a difference of 16.1%. Men with an educational attainment of bachelor's degree enjoy the highest average annual earnings of $45,662, while those with high school diploma education earn the least with $16,985. Women with an educational attainment of bachelor's degree earn the most with the average annual earnings of $34,750, while those with graduate degree education have the smallest earnings of $2,499.
| Educational Attainment | Male Income | Female Income |
| Less than High School | $30,735 | $15,263 |
| High School Diploma | $16,985 | $26,167 |
| College or Associate's Degree | $35,147 | $27,692 |
| Bachelor's Degree | $45,662 | $34,750 |
| Graduate Degree | - | - |
| Total | $31,912 | $26,783 |
Family Income in Piedmont
Family Income Brackets in Piedmont
According to the Piedmont family income data, there are 142 families falling into the $50,000 to $74,999 income range, which is the most common income bracket and makes up 28.5% of all families.
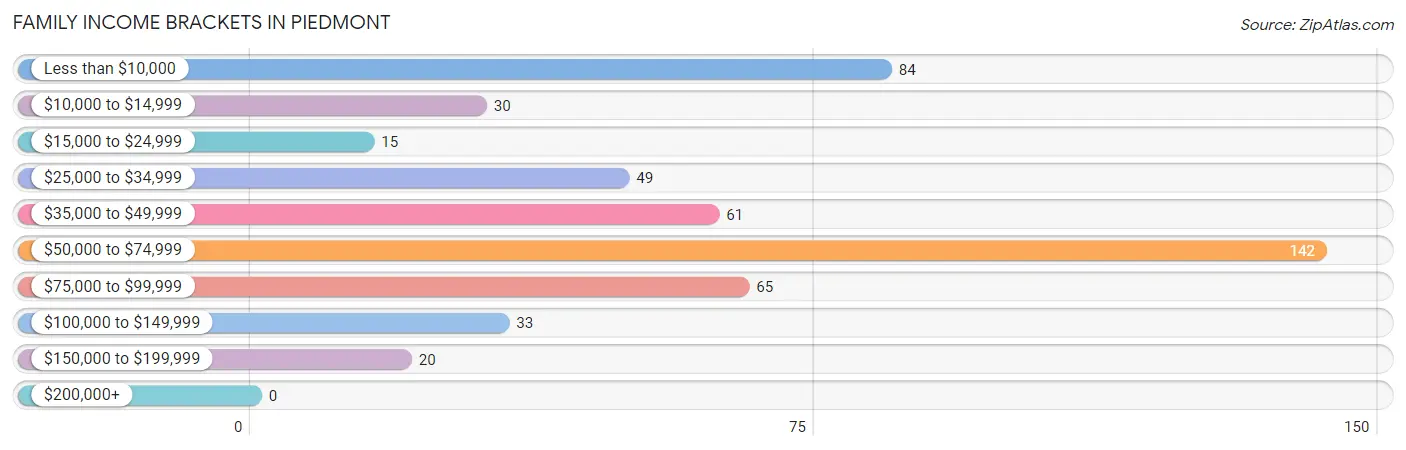
| Income Bracket | # Families | % Families |
| Less than $10,000 | 84 | 16.8% |
| $10,000 to $14,999 | 30 | 6.0% |
| $15,000 to $24,999 | 15 | 3.0% |
| $25,000 to $34,999 | 49 | 9.8% |
| $35,000 to $49,999 | 61 | 12.2% |
| $50,000 to $74,999 | 142 | 28.5% |
| $75,000 to $99,999 | 65 | 13.0% |
| $100,000 to $149,999 | 33 | 6.6% |
| $150,000 to $199,999 | 20 | 4.0% |
| $200,000+ | 0 | 0.0% |
Family Income by Famaliy Size in Piedmont
3-person families (43 | 8.6%) account for the highest median family income in Piedmont with $58,250 per family, while 3-person families (43 | 8.6%) have the highest median income of $19,417 per family member.
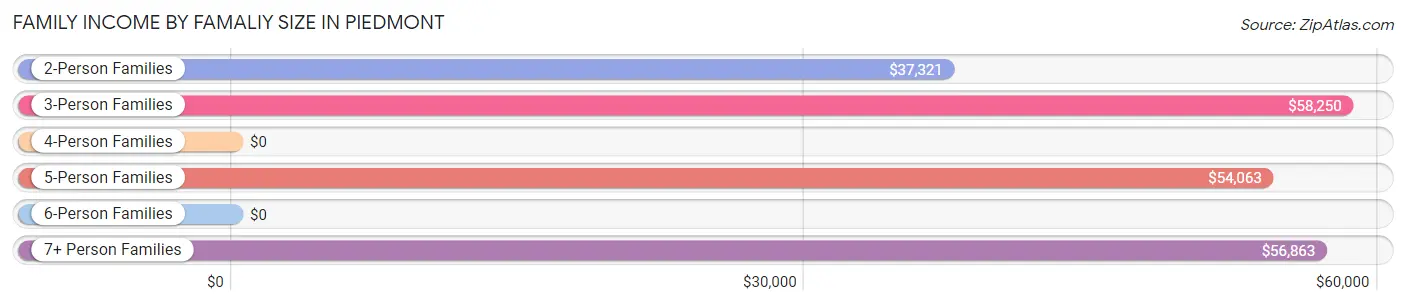
| Income Bracket | # Families | Median Income |
| 2-Person Families | 272 (54.5%) | $37,321 |
| 3-Person Families | 43 (8.6%) | $58,250 |
| 4-Person Families | 66 (13.2%) | $0 |
| 5-Person Families | 23 (4.6%) | $54,063 |
| 6-Person Families | 19 (3.8%) | $0 |
| 7+ Person Families | 76 (15.2%) | $56,863 |
| Total | 499 (100.0%) | $55,074 |
Family Income by Number of Earners in Piedmont
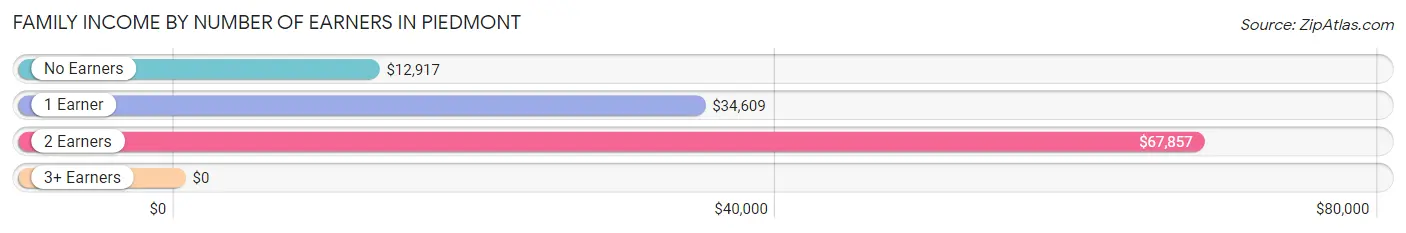
| Number of Earners | # Families | Median Income |
| No Earners | 87 (17.4%) | $12,917 |
| 1 Earner | 175 (35.1%) | $34,609 |
| 2 Earners | 196 (39.3%) | $67,857 |
| 3+ Earners | 41 (8.2%) | $0 |
| Total | 499 (100.0%) | $55,074 |
Household Income in Piedmont
Household Income Brackets in Piedmont
With 197 households falling in the category, the $50,000 to $74,999 income range is the most frequent in Piedmont, accounting for 19.8% of all households. In contrast, only 4 households (0.4%) fall into the $200,000+ income bracket, making it the least populous group.
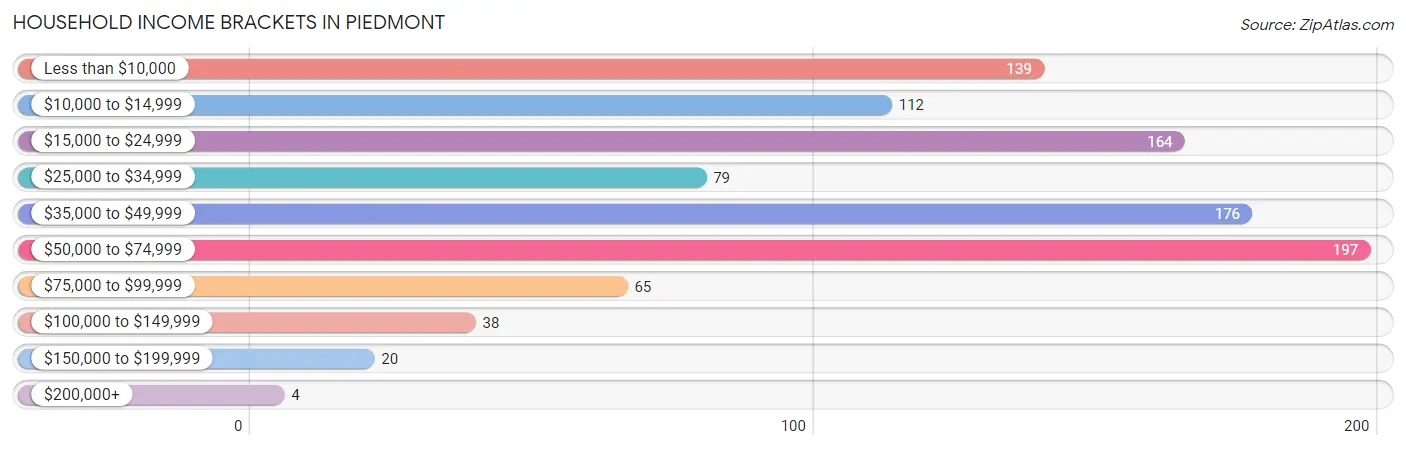
| Income Bracket | # Households | % Households |
| Less than $10,000 | 139 | 14.0% |
| $10,000 to $14,999 | 112 | 11.3% |
| $15,000 to $24,999 | 164 | 16.5% |
| $25,000 to $34,999 | 79 | 7.9% |
| $35,000 to $49,999 | 176 | 17.7% |
| $50,000 to $74,999 | 197 | 19.8% |
| $75,000 to $99,999 | 65 | 6.5% |
| $100,000 to $149,999 | 38 | 3.8% |
| $150,000 to $199,999 | 20 | 2.0% |
| $200,000+ | 4 | 0.4% |
Household Income by Householder Age in Piedmont
The median household income in Piedmont is $35,341, with the highest median household income of $55,477 found in the 25 to 44 years age bracket for the primary householder. A total of 279 households (28.1%) fall into this category. Meanwhile, the 15 to 24 years age bracket for the primary householder has the lowest median household income of $0, with 6 households (0.6%) in this group.
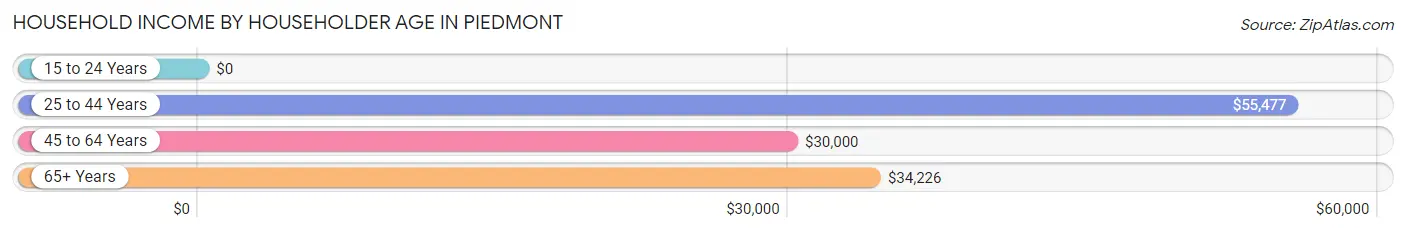
| Income Bracket | # Households | Median Income |
| 15 to 24 Years | 6 (0.6%) | $0 |
| 25 to 44 Years | 279 (28.1%) | $55,477 |
| 45 to 64 Years | 380 (38.2%) | $30,000 |
| 65+ Years | 329 (33.1%) | $34,226 |
| Total | 994 (100.0%) | $35,341 |
Poverty in Piedmont
Income Below Poverty by Sex and Age in Piedmont
With 51.9% poverty level for males and 42.0% for females among the residents of Piedmont, 6 to 11 year old males and 5 year old females are the most vulnerable to poverty, with 100 males (71.9%) and 18 females (100.0%) in their respective age groups living below the poverty level.
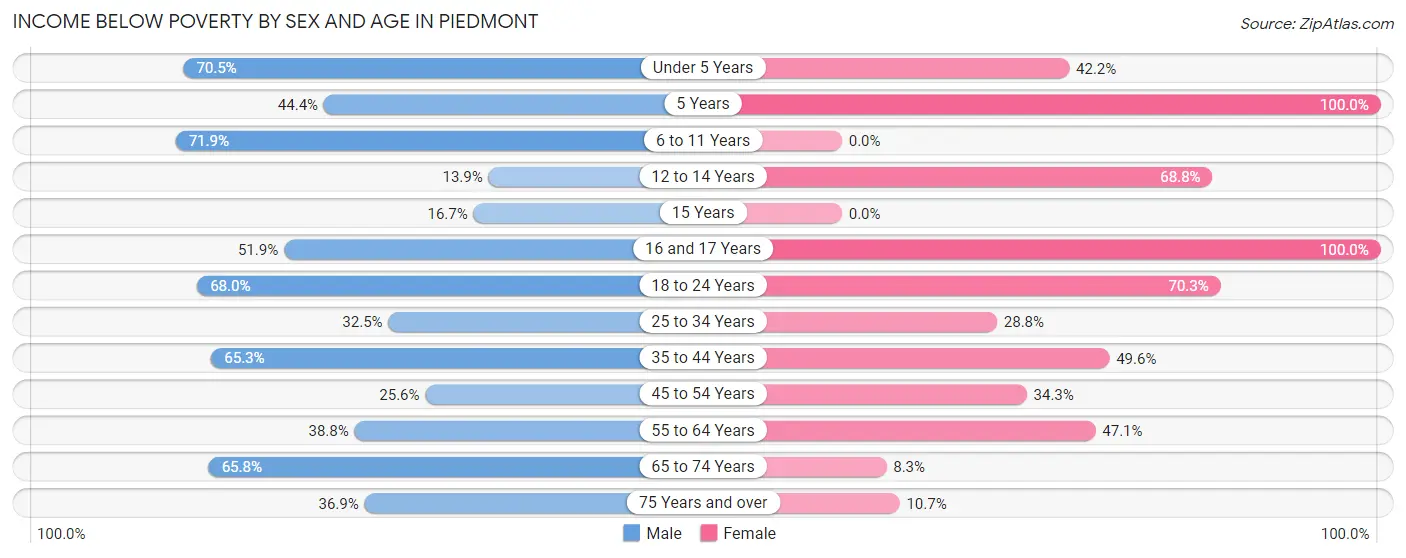
| Age Bracket | Male | Female |
| Under 5 Years | 55 (70.5%) | 27 (42.2%) |
| 5 Years | 4 (44.4%) | 18 (100.0%) |
| 6 to 11 Years | 100 (71.9%) | 0 (0.0%) |
| 12 to 14 Years | 5 (13.9%) | 130 (68.8%) |
| 15 Years | 4 (16.7%) | 0 (0.0%) |
| 16 and 17 Years | 14 (51.8%) | 37 (100.0%) |
| 18 to 24 Years | 106 (67.9%) | 71 (70.3%) |
| 25 to 34 Years | 50 (32.5%) | 40 (28.8%) |
| 35 to 44 Years | 130 (65.3%) | 68 (49.6%) |
| 45 to 54 Years | 21 (25.6%) | 59 (34.3%) |
| 55 to 64 Years | 69 (38.8%) | 112 (47.1%) |
| 65 to 74 Years | 77 (65.8%) | 9 (8.3%) |
| 75 Years and over | 31 (36.9%) | 18 (10.7%) |
| Total | 666 (51.9%) | 589 (42.0%) |
Income Above Poverty by Sex and Age in Piedmont
According to the poverty statistics in Piedmont, males aged 12 to 14 years and females aged 6 to 11 years are the age groups that are most secure financially, with 86.1% of males and 100.0% of females in these age groups living above the poverty line.
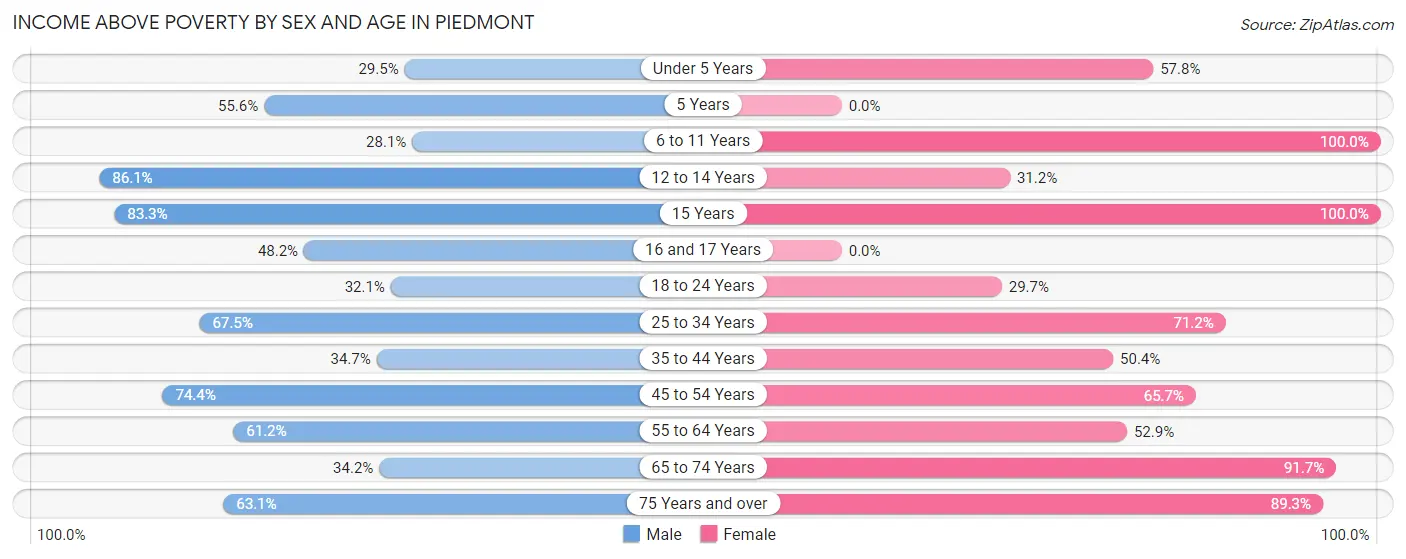
| Age Bracket | Male | Female |
| Under 5 Years | 23 (29.5%) | 37 (57.8%) |
| 5 Years | 5 (55.6%) | 0 (0.0%) |
| 6 to 11 Years | 39 (28.1%) | 13 (100.0%) |
| 12 to 14 Years | 31 (86.1%) | 59 (31.2%) |
| 15 Years | 20 (83.3%) | 16 (100.0%) |
| 16 and 17 Years | 13 (48.1%) | 0 (0.0%) |
| 18 to 24 Years | 50 (32.1%) | 30 (29.7%) |
| 25 to 34 Years | 104 (67.5%) | 99 (71.2%) |
| 35 to 44 Years | 69 (34.7%) | 69 (50.4%) |
| 45 to 54 Years | 61 (74.4%) | 113 (65.7%) |
| 55 to 64 Years | 109 (61.2%) | 126 (52.9%) |
| 65 to 74 Years | 40 (34.2%) | 100 (91.7%) |
| 75 Years and over | 53 (63.1%) | 150 (89.3%) |
| Total | 617 (48.1%) | 812 (58.0%) |
Income Below Poverty Among Married-Couple Families in Piedmont
The poverty statistics for married-couple families in Piedmont show that 31.6% or 118 of the total 373 families live below the poverty line. Families with 5 or more children have the highest poverty rate of 83.6%, comprising of 51 families. On the other hand, families with 3 or 4 children have the lowest poverty rate of 0.0%, which includes 0 families.
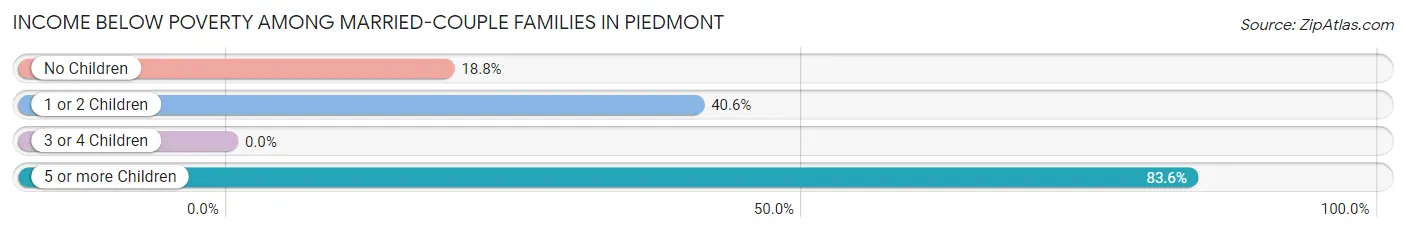
| Children | Above Poverty | Below Poverty |
| No Children | 168 (81.2%) | 39 (18.8%) |
| 1 or 2 Children | 41 (59.4%) | 28 (40.6%) |
| 3 or 4 Children | 36 (100.0%) | 0 (0.0%) |
| 5 or more Children | 10 (16.4%) | 51 (83.6%) |
| Total | 255 (68.4%) | 118 (31.6%) |
Income Below Poverty Among Single-Parent Households in Piedmont
According to the poverty data in Piedmont, 60.0% or 6 single-father households and 61.2% or 71 single-mother households are living below the poverty line. Among single-father households, those with no children have the highest poverty rate, with 6 households (100.0%) experiencing poverty. Likewise, among single-mother households, those with 3 or 4 children have the highest poverty rate, with 19 households (100.0%) falling below the poverty line.
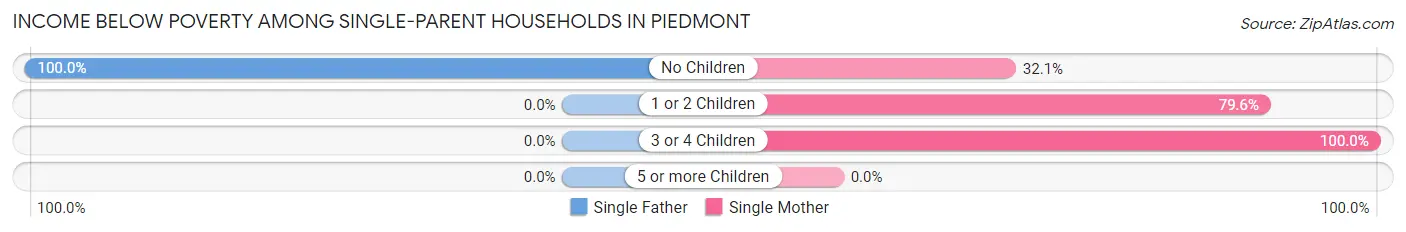
| Children | Single Father | Single Mother |
| No Children | 6 (100.0%) | 17 (32.1%) |
| 1 or 2 Children | 0 (0.0%) | 35 (79.5%) |
| 3 or 4 Children | 0 (0.0%) | 19 (100.0%) |
| 5 or more Children | 0 (0.0%) | 0 (0.0%) |
| Total | 6 (60.0%) | 71 (61.2%) |
Income Below Poverty Among Married-Couple vs Single-Parent Households in Piedmont
The poverty data for Piedmont shows that 118 of the married-couple family households (31.6%) and 77 of the single-parent households (61.1%) are living below the poverty level. Within the married-couple family households, those with 5 or more children have the highest poverty rate, with 51 households (83.6%) falling below the poverty line. Among the single-parent households, those with 3 or 4 children have the highest poverty rate, with 19 household (100.0%) living below poverty.
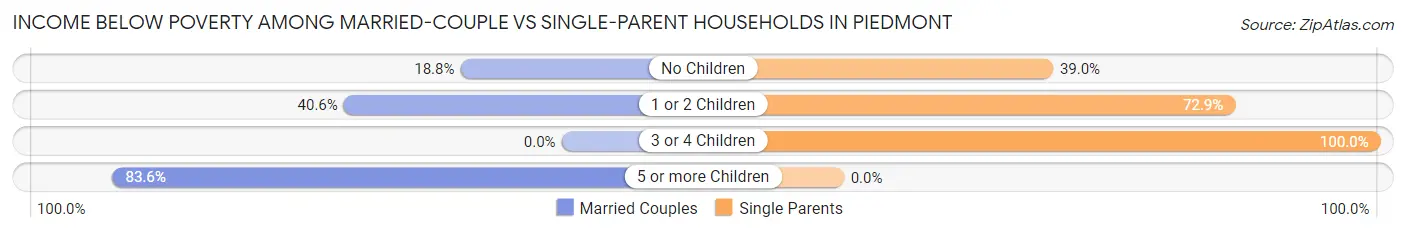
| Children | Married-Couple Families | Single-Parent Households |
| No Children | 39 (18.8%) | 23 (39.0%) |
| 1 or 2 Children | 28 (40.6%) | 35 (72.9%) |
| 3 or 4 Children | 0 (0.0%) | 19 (100.0%) |
| 5 or more Children | 51 (83.6%) | 0 (0.0%) |
| Total | 118 (31.6%) | 77 (61.1%) |
Race in Piedmont
The most populous races in Piedmont are White / Caucasian (2,537 | 92.6%), Two or more Races (102 | 3.7%), and Black / African American (57 | 2.1%).
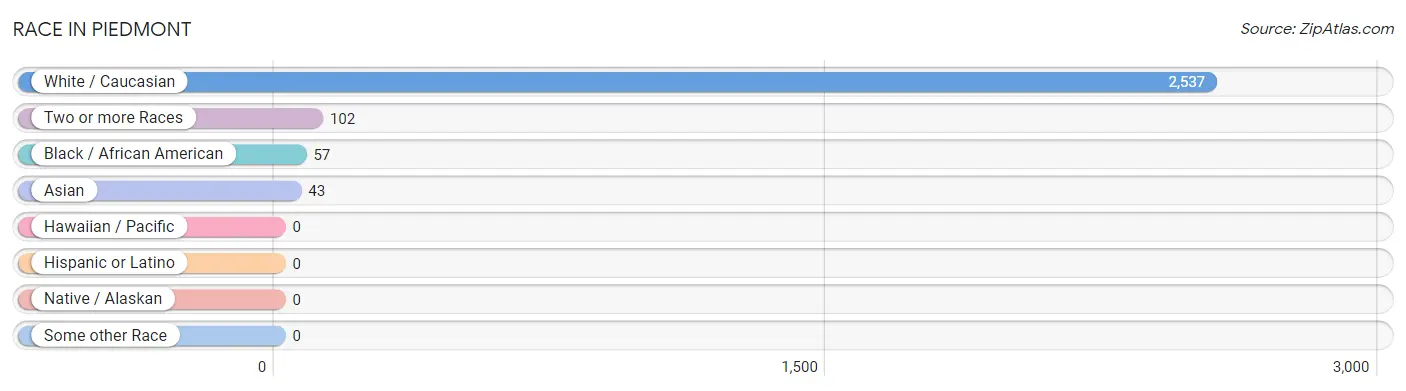
| Race | # Population | % Population |
| Asian | 43 | 1.6% |
| Black / African American | 57 | 2.1% |
| Hawaiian / Pacific | 0 | 0.0% |
| Hispanic or Latino | 0 | 0.0% |
| Native / Alaskan | 0 | 0.0% |
| White / Caucasian | 2,537 | 92.6% |
| Two or more Races | 102 | 3.7% |
| Some other Race | 0 | 0.0% |
| Total | 2,739 | 100.0% |
Ancestry in Piedmont
The most populous ancestries reported in Piedmont are Irish (355 | 13.0%), American (280 | 10.2%), German (211 | 7.7%), English (130 | 4.8%), and French (84 | 3.1%), together accounting for 38.7% of all Piedmont residents.
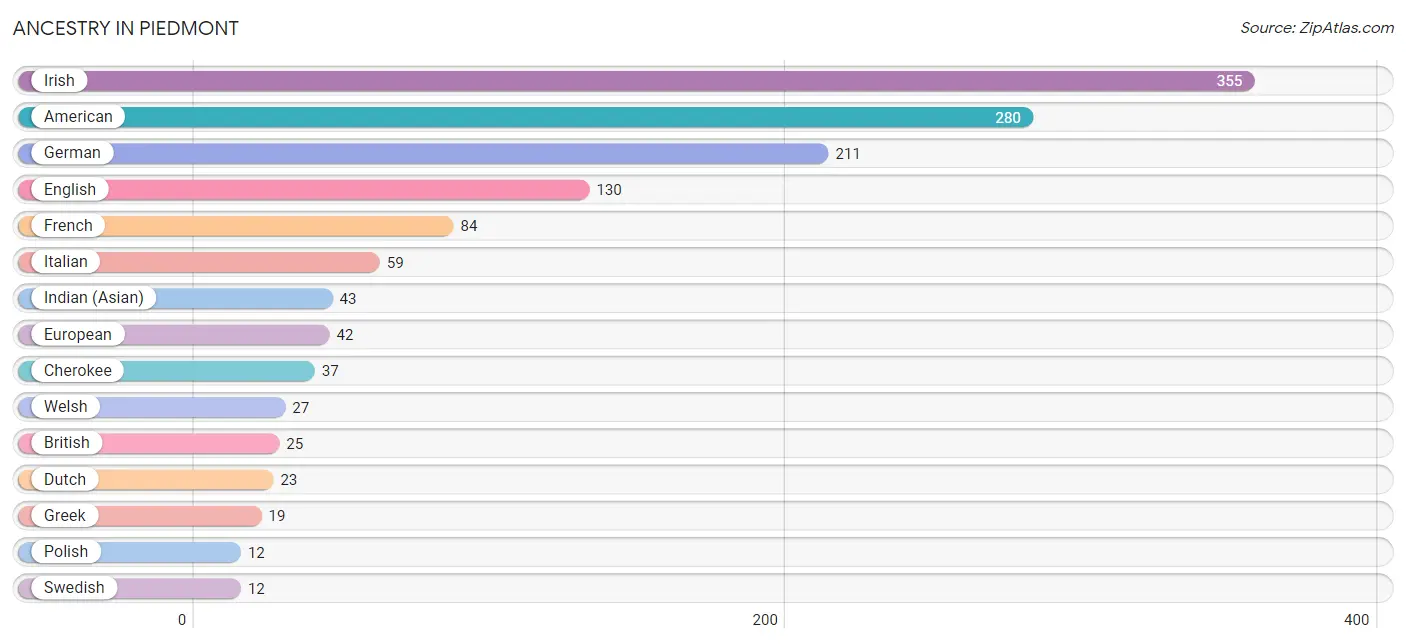
| Ancestry | # Population | % Population |
| American | 280 | 10.2% |
| British | 25 | 0.9% |
| Cherokee | 37 | 1.3% |
| Czech | 11 | 0.4% |
| Dutch | 23 | 0.8% |
| Eastern European | 3 | 0.1% |
| English | 130 | 4.8% |
| European | 42 | 1.5% |
| French | 84 | 3.1% |
| German | 211 | 7.7% |
| Greek | 19 | 0.7% |
| Indian (Asian) | 43 | 1.6% |
| Irish | 355 | 13.0% |
| Italian | 59 | 2.1% |
| Luxembourger | 4 | 0.2% |
| Northern European | 7 | 0.3% |
| Polish | 12 | 0.4% |
| Scandinavian | 10 | 0.4% |
| Scotch-Irish | 8 | 0.3% |
| Scottish | 3 | 0.1% |
| Swedish | 12 | 0.4% |
| Welsh | 27 | 1.0% | View All 22 Rows |
Immigrants in Piedmont
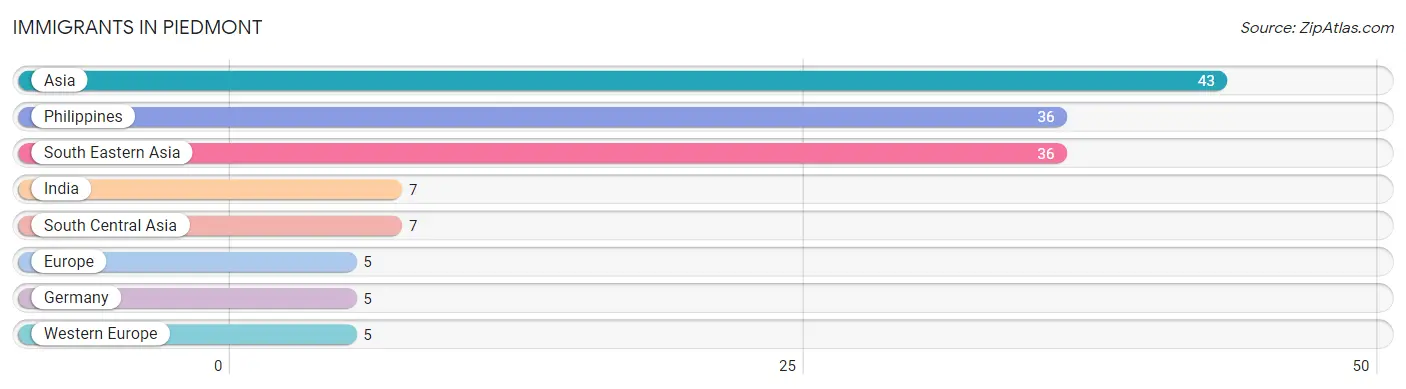
The most numerous immigrant groups reported in Piedmont came from Asia (43 | 1.6%), Philippines (36 | 1.3%), South Eastern Asia (36 | 1.3%), India (7 | 0.3%), and South Central Asia (7 | 0.3%), together accounting for 4.7% of all Piedmont residents.
| Immigration Origin | # Population | % Population |
| Asia | 43 | 1.6% |
| Europe | 5 | 0.2% |
| Germany | 5 | 0.2% |
| India | 7 | 0.3% |
| Philippines | 36 | 1.3% |
| South Central Asia | 7 | 0.3% |
| South Eastern Asia | 36 | 1.3% |
| Western Europe | 5 | 0.2% | View All 8 Rows |
Sex and Age in Piedmont
Sex and Age in Piedmont
The most populous age groups in Piedmont are 20 to 24 Years (129 | 9.8%) for men and 10 to 14 Years (189 | 13.4%) for women.
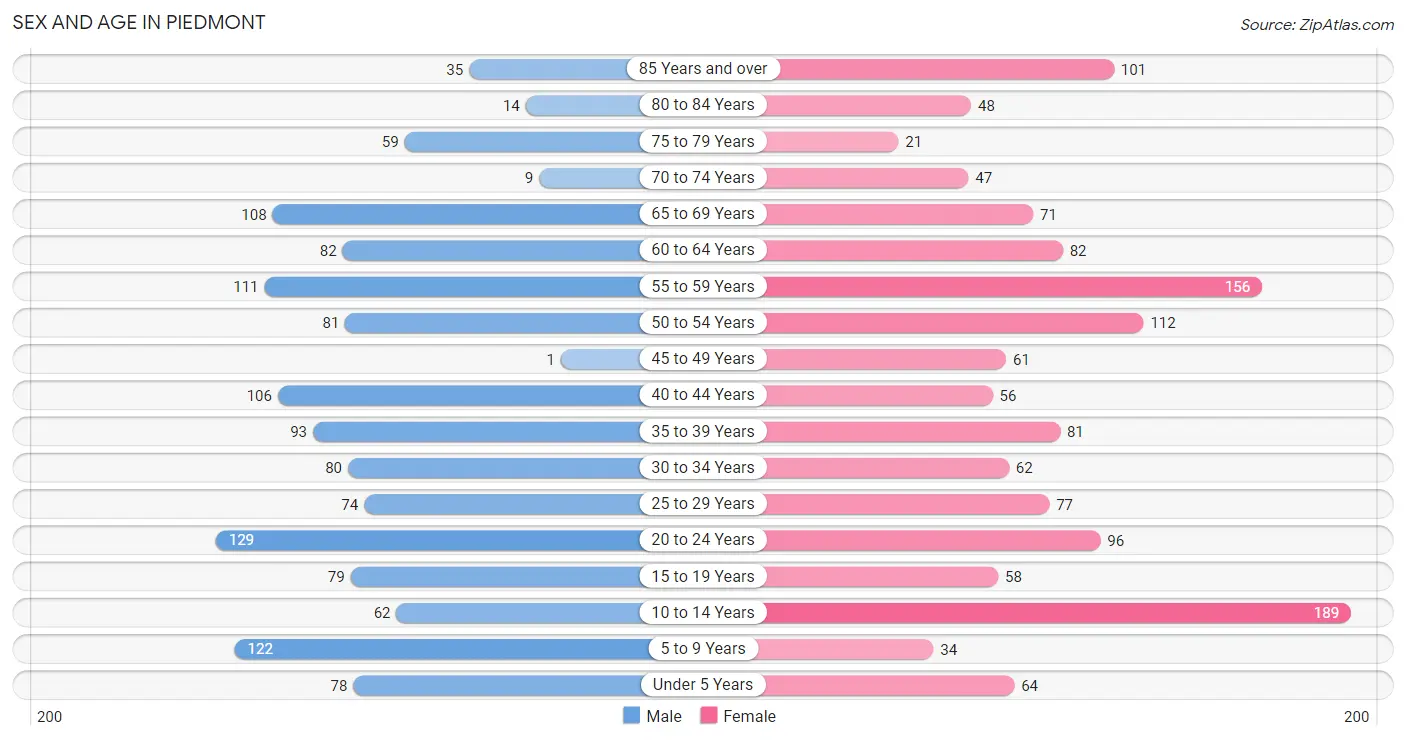
| Age Bracket | Male | Female |
| Under 5 Years | 78 (5.9%) | 64 (4.5%) |
| 5 to 9 Years | 122 (9.2%) | 34 (2.4%) |
| 10 to 14 Years | 62 (4.7%) | 189 (13.4%) |
| 15 to 19 Years | 79 (6.0%) | 58 (4.1%) |
| 20 to 24 Years | 129 (9.8%) | 96 (6.8%) |
| 25 to 29 Years | 74 (5.6%) | 77 (5.4%) |
| 30 to 34 Years | 80 (6.0%) | 62 (4.4%) |
| 35 to 39 Years | 93 (7.0%) | 81 (5.7%) |
| 40 to 44 Years | 106 (8.0%) | 56 (4.0%) |
| 45 to 49 Years | 1 (0.1%) | 61 (4.3%) |
| 50 to 54 Years | 81 (6.1%) | 112 (7.9%) |
| 55 to 59 Years | 111 (8.4%) | 156 (11.0%) |
| 60 to 64 Years | 82 (6.2%) | 82 (5.8%) |
| 65 to 69 Years | 108 (8.2%) | 71 (5.0%) |
| 70 to 74 Years | 9 (0.7%) | 47 (3.3%) |
| 75 to 79 Years | 59 (4.5%) | 21 (1.5%) |
| 80 to 84 Years | 14 (1.1%) | 48 (3.4%) |
| 85 Years and over | 35 (2.6%) | 101 (7.1%) |
| Total | 1,323 (100.0%) | 1,416 (100.0%) |
Families and Households in Piedmont
Median Family Size in Piedmont
The median family size in Piedmont is 4.12 persons per family, with married-couple families (373 | 74.8%) accounting for the largest median family size of 4.35 persons per family. On the other hand, single male/father families (10 | 2.0%) represent the smallest median family size with 2.00 persons per family.
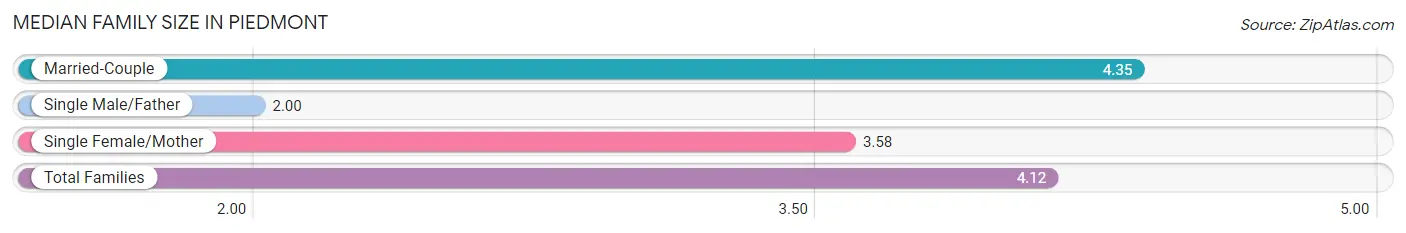
| Family Type | # Families | Family Size |
| Married-Couple | 373 (74.8%) | 4.35 |
| Single Male/Father | 10 (2.0%) | 2.00 |
| Single Female/Mother | 116 (23.3%) | 3.58 |
| Total Families | 499 (100.0%) | 4.12 |
Median Household Size in Piedmont
The median household size in Piedmont is 2.70 persons per household, with married-couple households (373 | 37.5%) accounting for the largest median household size of 4.35 persons per household. non-family households (495 | 49.8%) represent the smallest median household size with 1.23 persons per household.
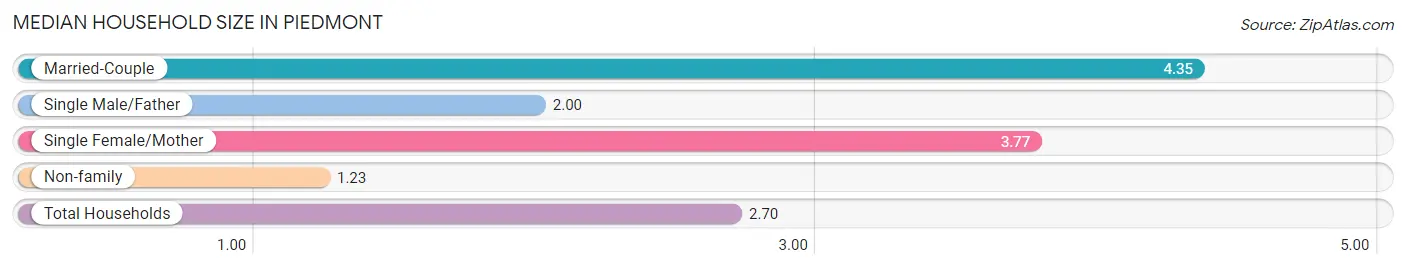
| Household Type | # Households | Household Size |
| Married-Couple | 373 (37.5%) | 4.35 |
| Single Male/Father | 10 (1.0%) | 2.00 |
| Single Female/Mother | 116 (11.7%) | 3.77 |
| Non-family | 495 (49.8%) | 1.23 |
| Total Households | 994 (100.0%) | 2.70 |
Household Size by Marriage Status in Piedmont
Out of a total of 994 households in Piedmont, 499 (50.2%) are family households, while 495 (49.8%) are nonfamily households. The most numerous type of family households are 2-person households, comprising 255, and the most common type of nonfamily households are 1-person households, comprising 441.
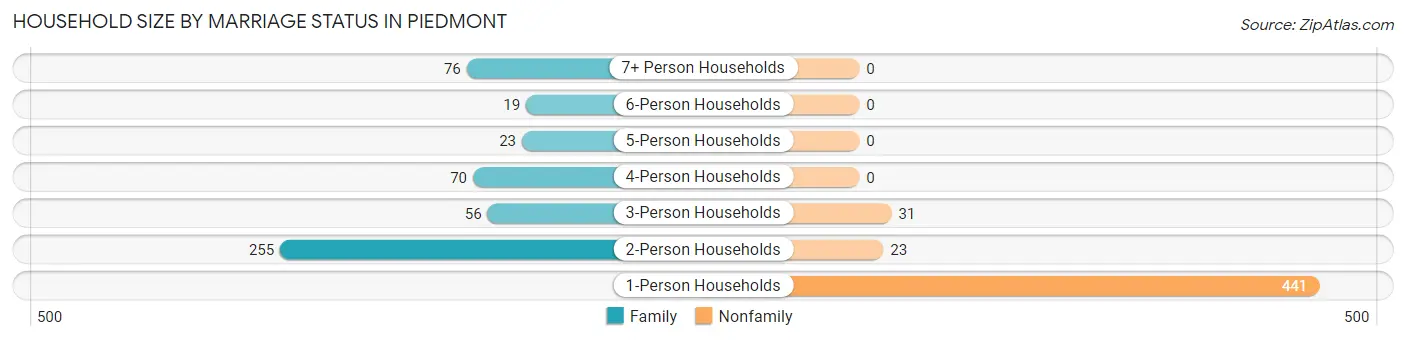
| Household Size | Family Households | Nonfamily Households |
| 1-Person Households | - | 441 (44.4%) |
| 2-Person Households | 255 (25.7%) | 23 (2.3%) |
| 3-Person Households | 56 (5.6%) | 31 (3.1%) |
| 4-Person Households | 70 (7.0%) | 0 (0.0%) |
| 5-Person Households | 23 (2.3%) | 0 (0.0%) |
| 6-Person Households | 19 (1.9%) | 0 (0.0%) |
| 7+ Person Households | 76 (7.6%) | 0 (0.0%) |
| Total | 499 (50.2%) | 495 (49.8%) |
Female Fertility in Piedmont
Fertility by Age in Piedmont
Average fertility rate in Piedmont is 59.0 births per 1,000 women. Women in the age bracket of 20 to 34 years have the highest fertility rate with 123.0 births per 1,000 women. Women in the age bracket of 20 to 34 years acount for 100.0% of all women with births.
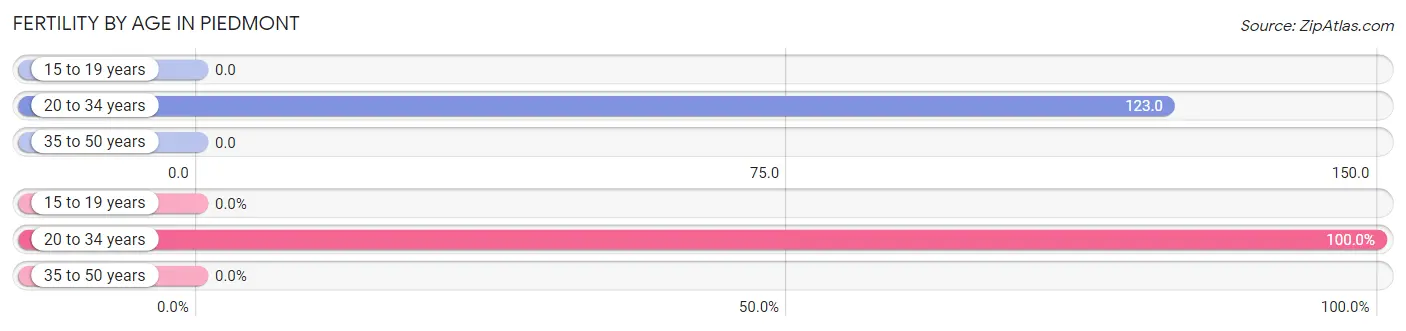
| Age Bracket | Women with Births | Births / 1,000 Women |
| 15 to 19 years | 0 (0.0%) | 0.0 |
| 20 to 34 years | 29 (100.0%) | 123.0 |
| 35 to 50 years | 0 (0.0%) | 0.0 |
| Total | 29 (100.0%) | 59.0 |
Fertility by Age by Marriage Status in Piedmont
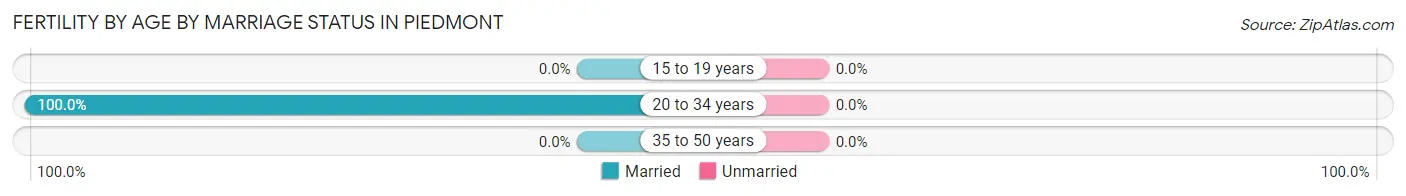
| Age Bracket | Married | Unmarried |
| 15 to 19 years | 0 (0.0%) | 0 (0.0%) |
| 20 to 34 years | 29 (100.0%) | 0 (0.0%) |
| 35 to 50 years | 0 (0.0%) | 0 (0.0%) |
| Total | 29 (100.0%) | 0 (0.0%) |
Fertility by Education in Piedmont
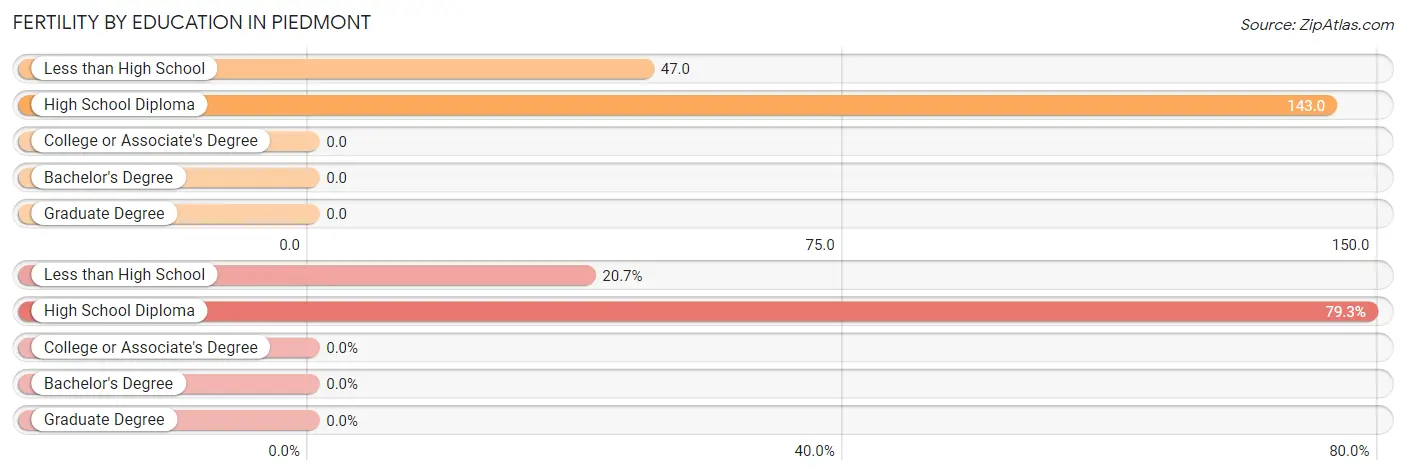
| Educational Attainment | Women with Births | Births / 1,000 Women |
| Less than High School | 6 (20.7%) | 47.0 |
| High School Diploma | 23 (79.3%) | 143.0 |
| College or Associate's Degree | 0 (0.0%) | 0.0 |
| Bachelor's Degree | 0 (0.0%) | 0.0 |
| Graduate Degree | 0 (0.0%) | 0.0 |
| Total | 29 (100.0%) | 59.0 |
Fertility by Education by Marriage Status in Piedmont
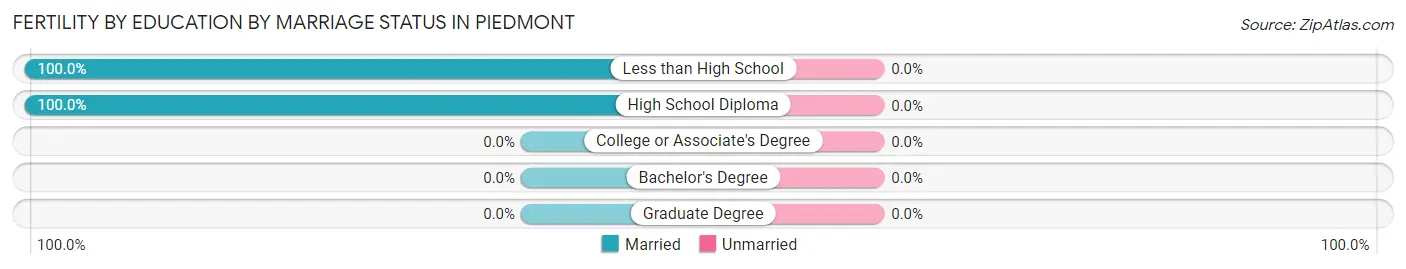
| Educational Attainment | Married | Unmarried |
| Less than High School | 6 (100.0%) | 0 (0.0%) |
| High School Diploma | 23 (100.0%) | 0 (0.0%) |
| College or Associate's Degree | 0 (0.0%) | 0 (0.0%) |
| Bachelor's Degree | 0 (0.0%) | 0 (0.0%) |
| Graduate Degree | 0 (0.0%) | 0 (0.0%) |
| Total | 29 (100.0%) | 0 (0.0%) |
Employment Characteristics in Piedmont
Employment by Class of Employer in Piedmont
Among the 747 employed individuals in Piedmont, private company employees (515 | 68.9%), local government employees (79 | 10.6%), and state government employees (73 | 9.8%) make up the most common classes of employment.
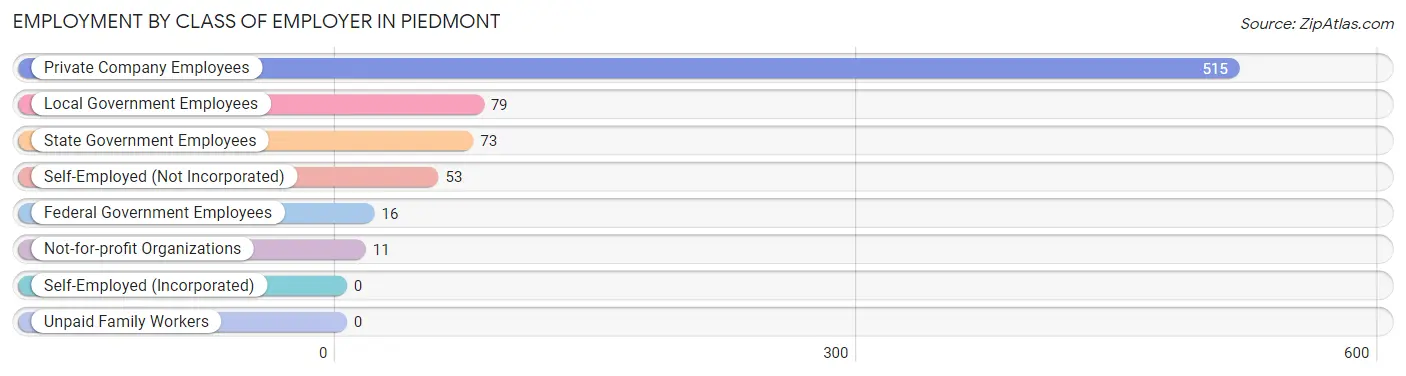
| Employer Class | # Employees | % Employees |
| Private Company Employees | 515 | 68.9% |
| Self-Employed (Incorporated) | 0 | 0.0% |
| Self-Employed (Not Incorporated) | 53 | 7.1% |
| Not-for-profit Organizations | 11 | 1.5% |
| Local Government Employees | 79 | 10.6% |
| State Government Employees | 73 | 9.8% |
| Federal Government Employees | 16 | 2.1% |
| Unpaid Family Workers | 0 | 0.0% |
| Total | 747 | 100.0% |
Employment Status by Age in Piedmont
According to the labor force statistics for Piedmont, out of the total population over 16 years of age (2,150), 37.4% or 804 individuals are in the labor force, with 5.8% or 47 of them unemployed. The age group with the highest labor force participation rate is 30 to 34 years, with 89.4% or 127 individuals in the labor force. Within the labor force, the 25 to 29 years age range has the highest percentage of unemployed individuals, with 27.2% or 28 of them being unemployed.
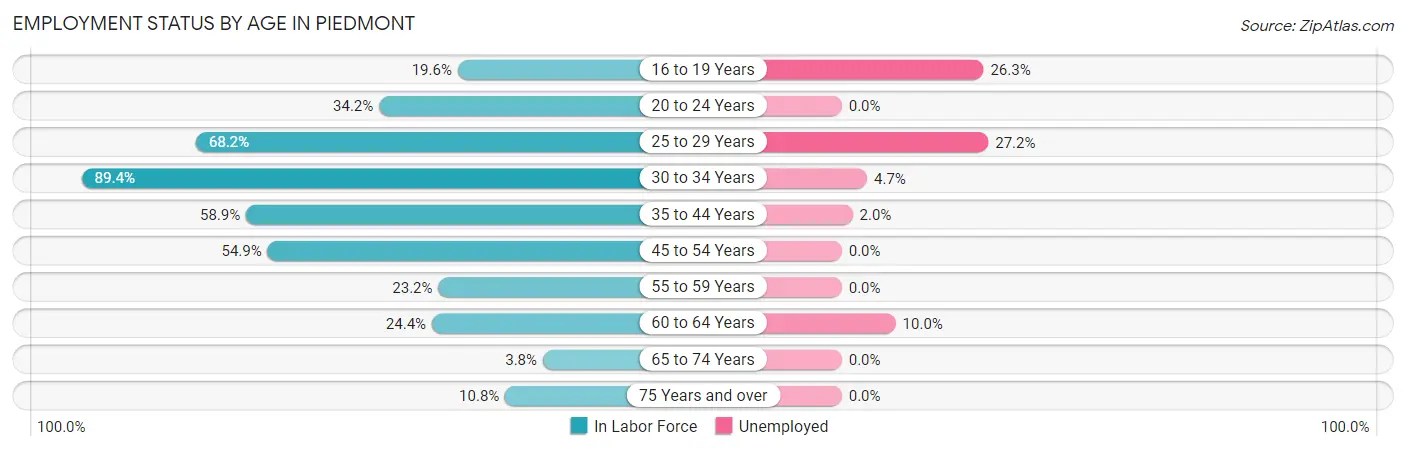
| Age Bracket | In Labor Force | Unemployed |
| 16 to 19 Years | 19 (19.6%) | 5 (26.3%) |
| 20 to 24 Years | 77 (34.2%) | 0 (0.0%) |
| 25 to 29 Years | 103 (68.2%) | 28 (27.2%) |
| 30 to 34 Years | 127 (89.4%) | 6 (4.7%) |
| 35 to 44 Years | 198 (58.9%) | 4 (2.0%) |
| 45 to 54 Years | 140 (54.9%) | 0 (0.0%) |
| 55 to 59 Years | 62 (23.2%) | 0 (0.0%) |
| 60 to 64 Years | 40 (24.4%) | 4 (10.0%) |
| 65 to 74 Years | 9 (3.8%) | 0 (0.0%) |
| 75 Years and over | 30 (10.8%) | 0 (0.0%) |
| Total | 804 (37.4%) | 47 (5.8%) |
Employment Status by Educational Attainment in Piedmont
According to labor force statistics for Piedmont, 51.0% of individuals (671) out of the total population between 25 and 64 years of age (1,315) are in the labor force, with 6.3% or 42 of them being unemployed. The group with the highest labor force participation rate are those with the educational attainment of bachelor's degree or higher, with 74.7% or 139 individuals in the labor force. Within the labor force, individuals with less than high school education have the highest percentage of unemployment, with 21.8% or 24 of them being unemployed.
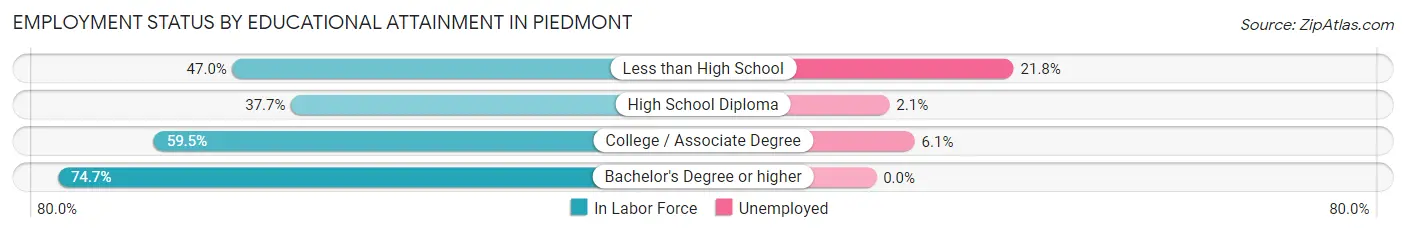
| Educational Attainment | In Labor Force | Unemployed |
| Less than High School | 110 (47.0%) | 51 (21.8%) |
| High School Diploma | 193 (37.7%) | 11 (2.1%) |
| College / Associate Degree | 228 (59.5%) | 23 (6.1%) |
| Bachelor's Degree or higher | 139 (74.7%) | 0 (0.0%) |
| Total | 671 (51.0%) | 83 (6.3%) |
Employment Occupations by Sex in Piedmont
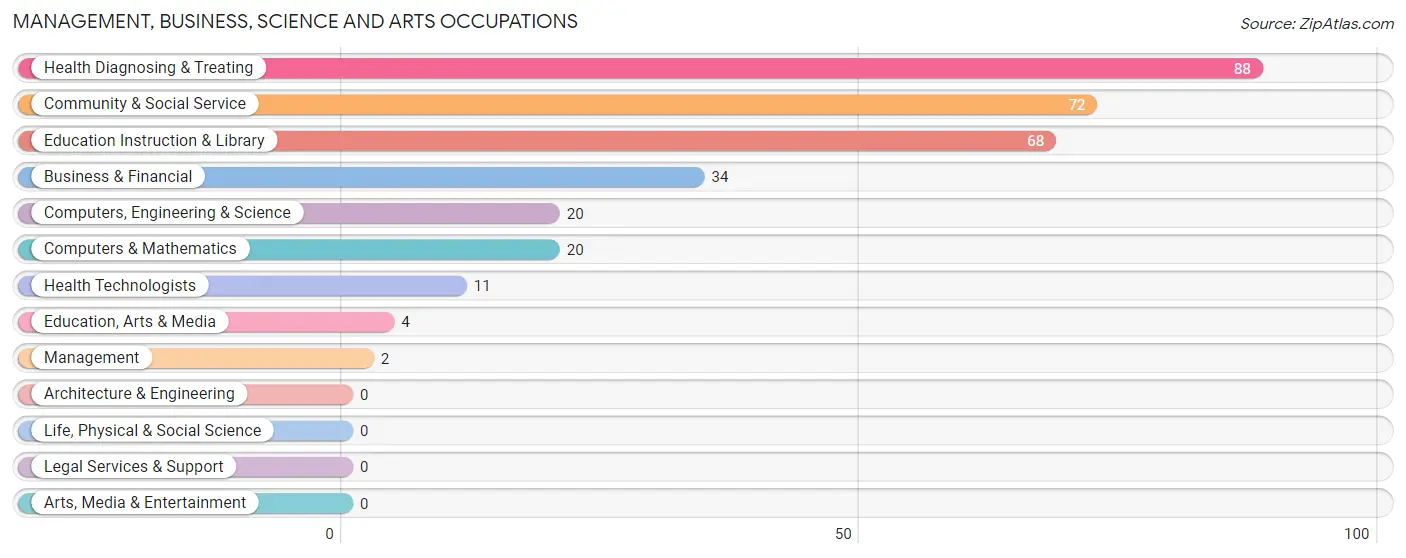
Management, Business, Science and Arts Occupations
The most common Management, Business, Science and Arts occupations in Piedmont are Health Diagnosing & Treating (88 | 11.6%), Community & Social Service (72 | 9.5%), Education Instruction & Library (68 | 9.0%), Business & Financial (34 | 4.5%), and Computers, Engineering & Science (20 | 2.6%).
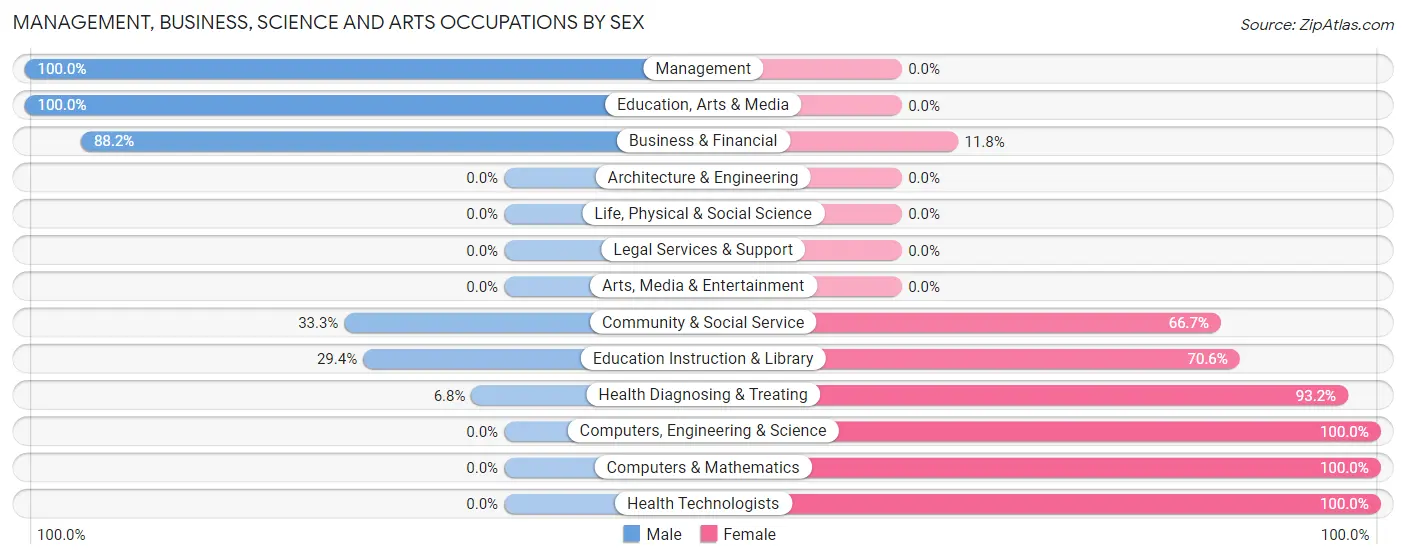
Management, Business, Science and Arts Occupations by Sex
Within the Management, Business, Science and Arts occupations in Piedmont, the most male-oriented occupations are Management (100.0%), Education, Arts & Media (100.0%), and Business & Financial (88.2%), while the most female-oriented occupations are Computers, Engineering & Science (100.0%), Computers & Mathematics (100.0%), and Health Technologists (100.0%).
| Occupation | Male | Female |
| Management | 2 (100.0%) | 0 (0.0%) |
| Business & Financial | 30 (88.2%) | 4 (11.8%) |
| Computers, Engineering & Science | 0 (0.0%) | 20 (100.0%) |
| Computers & Mathematics | 0 (0.0%) | 20 (100.0%) |
| Architecture & Engineering | 0 (0.0%) | 0 (0.0%) |
| Life, Physical & Social Science | 0 (0.0%) | 0 (0.0%) |
| Community & Social Service | 24 (33.3%) | 48 (66.7%) |
| Education, Arts & Media | 4 (100.0%) | 0 (0.0%) |
| Legal Services & Support | 0 (0.0%) | 0 (0.0%) |
| Education Instruction & Library | 20 (29.4%) | 48 (70.6%) |
| Arts, Media & Entertainment | 0 (0.0%) | 0 (0.0%) |
| Health Diagnosing & Treating | 6 (6.8%) | 82 (93.2%) |
| Health Technologists | 0 (0.0%) | 11 (100.0%) |
| Total (Category) | 62 (28.7%) | 154 (71.3%) |
| Total (Overall) | 340 (44.9%) | 418 (55.1%) |
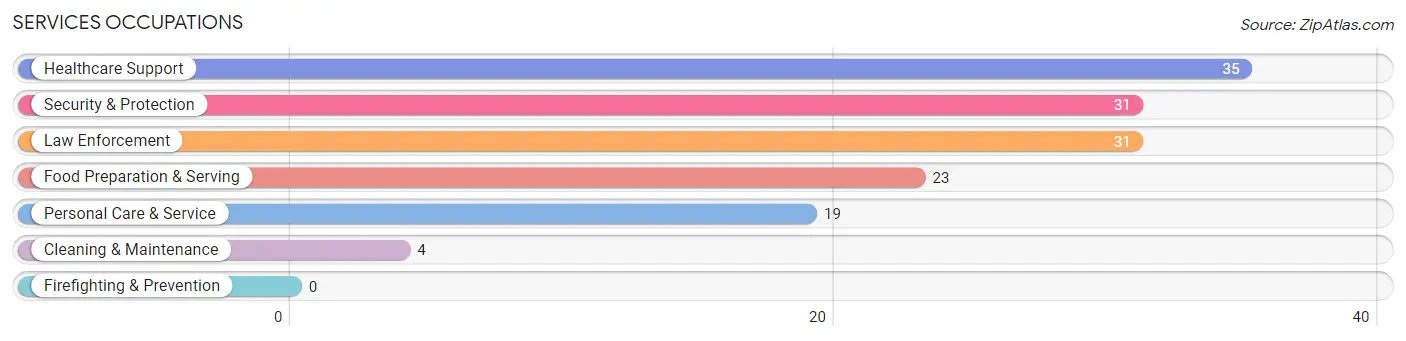
Services Occupations
The most common Services occupations in Piedmont are Healthcare Support (35 | 4.6%), Security & Protection (31 | 4.1%), Law Enforcement (31 | 4.1%), Food Preparation & Serving (23 | 3.0%), and Personal Care & Service (19 | 2.5%).
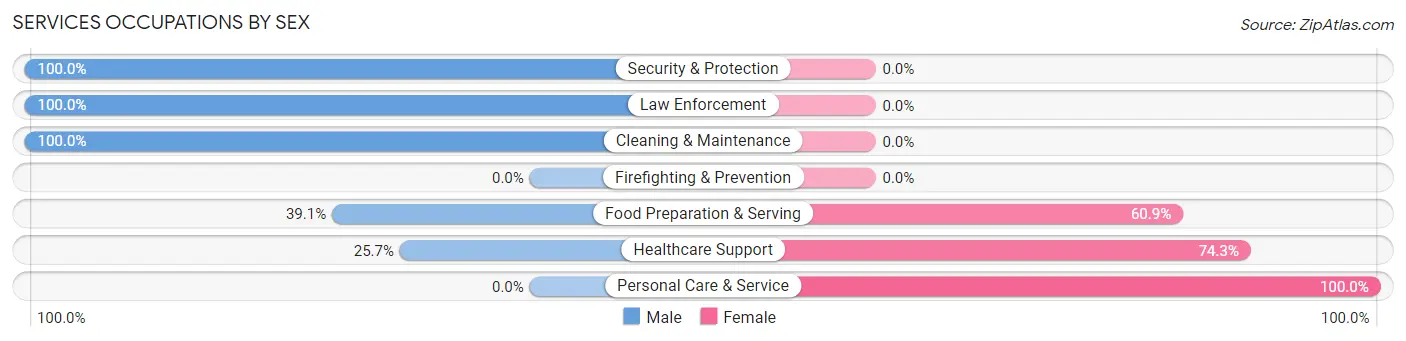
Services Occupations by Sex
Within the Services occupations in Piedmont, the most male-oriented occupations are Security & Protection (100.0%), Law Enforcement (100.0%), and Cleaning & Maintenance (100.0%), while the most female-oriented occupations are Personal Care & Service (100.0%), Healthcare Support (74.3%), and Food Preparation & Serving (60.9%).
| Occupation | Male | Female |
| Healthcare Support | 9 (25.7%) | 26 (74.3%) |
| Security & Protection | 31 (100.0%) | 0 (0.0%) |
| Firefighting & Prevention | 0 (0.0%) | 0 (0.0%) |
| Law Enforcement | 31 (100.0%) | 0 (0.0%) |
| Food Preparation & Serving | 9 (39.1%) | 14 (60.9%) |
| Cleaning & Maintenance | 4 (100.0%) | 0 (0.0%) |
| Personal Care & Service | 0 (0.0%) | 19 (100.0%) |
| Total (Category) | 53 (47.3%) | 59 (52.7%) |
| Total (Overall) | 340 (44.9%) | 418 (55.1%) |
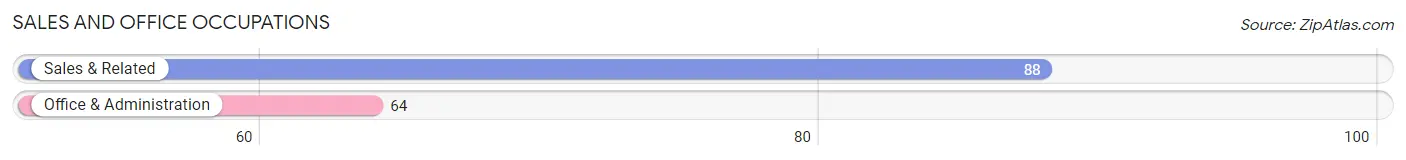
Sales and Office Occupations
The most common Sales and Office occupations in Piedmont are Sales & Related (88 | 11.6%), and Office & Administration (64 | 8.4%).
Sales and Office Occupations by Sex
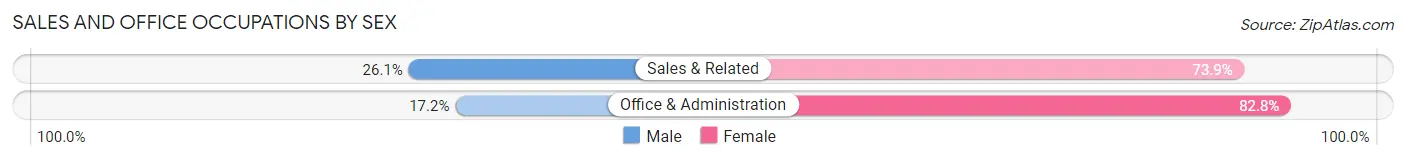
| Occupation | Male | Female |
| Sales & Related | 23 (26.1%) | 65 (73.9%) |
| Office & Administration | 11 (17.2%) | 53 (82.8%) |
| Total (Category) | 34 (22.4%) | 118 (77.6%) |
| Total (Overall) | 340 (44.9%) | 418 (55.1%) |
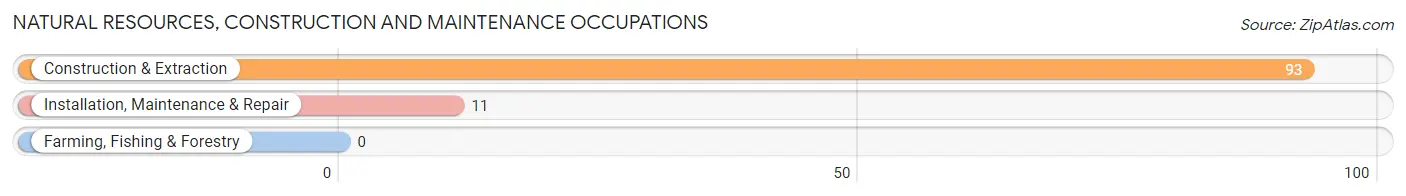
Natural Resources, Construction and Maintenance Occupations
The most common Natural Resources, Construction and Maintenance occupations in Piedmont are Construction & Extraction (93 | 12.3%), and Installation, Maintenance & Repair (11 | 1.5%).
Natural Resources, Construction and Maintenance Occupations by Sex
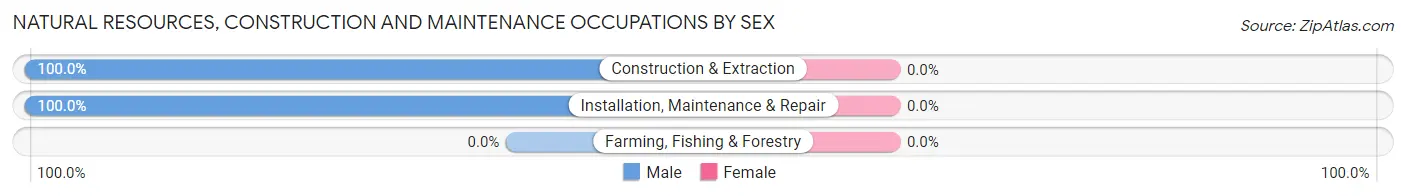
| Occupation | Male | Female |
| Farming, Fishing & Forestry | 0 (0.0%) | 0 (0.0%) |
| Construction & Extraction | 93 (100.0%) | 0 (0.0%) |
| Installation, Maintenance & Repair | 11 (100.0%) | 0 (0.0%) |
| Total (Category) | 104 (100.0%) | 0 (0.0%) |
| Total (Overall) | 340 (44.9%) | 418 (55.1%) |
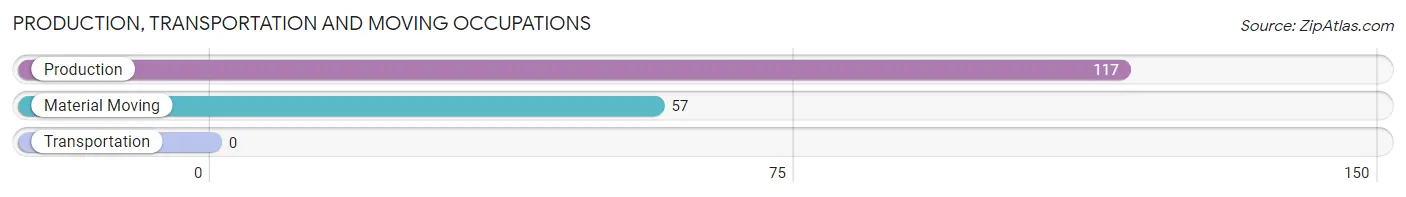
Production, Transportation and Moving Occupations
The most common Production, Transportation and Moving occupations in Piedmont are Production (117 | 15.4%), and Material Moving (57 | 7.5%).
Production, Transportation and Moving Occupations by Sex
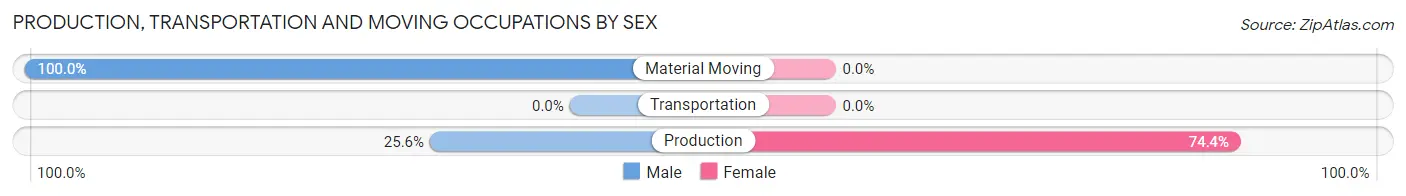
| Occupation | Male | Female |
| Production | 30 (25.6%) | 87 (74.4%) |
| Transportation | 0 (0.0%) | 0 (0.0%) |
| Material Moving | 57 (100.0%) | 0 (0.0%) |
| Total (Category) | 87 (50.0%) | 87 (50.0%) |
| Total (Overall) | 340 (44.9%) | 418 (55.1%) |
Employment Industries by Sex in Piedmont
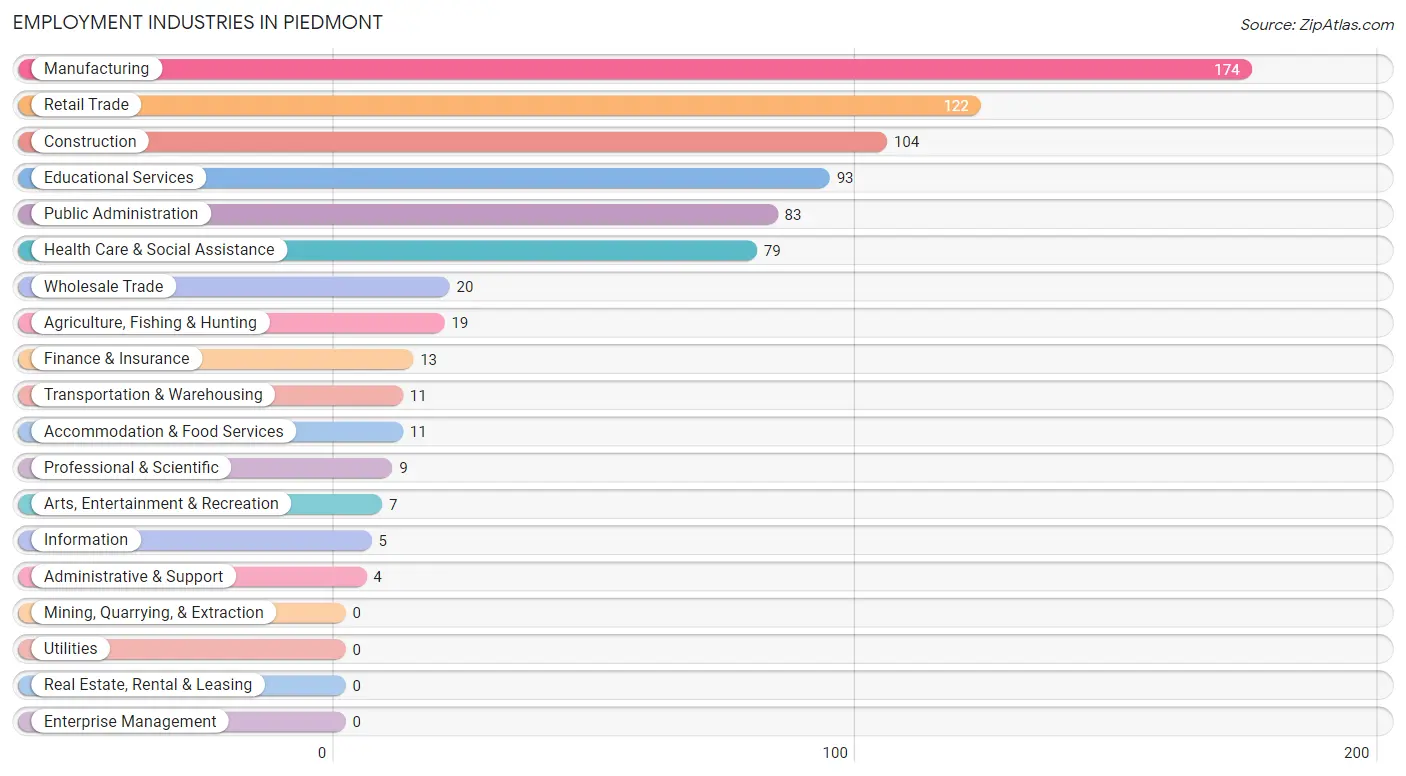
Employment Industries in Piedmont
The major employment industries in Piedmont include Manufacturing (174 | 23.0%), Retail Trade (122 | 16.1%), Construction (104 | 13.7%), Educational Services (93 | 12.3%), and Public Administration (83 | 11.0%).
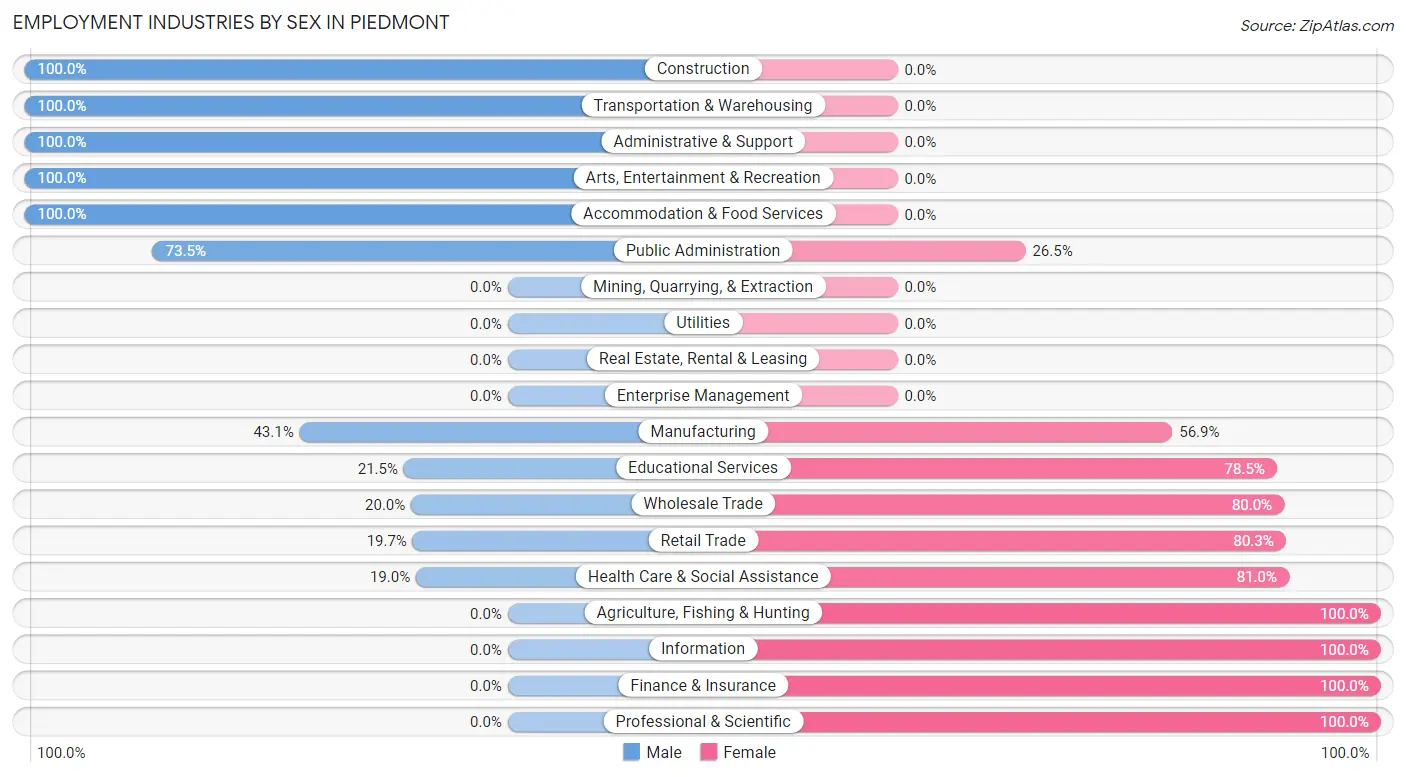
Employment Industries by Sex in Piedmont
The Piedmont industries that see more men than women are Construction (100.0%), Transportation & Warehousing (100.0%), and Administrative & Support (100.0%), whereas the industries that tend to have a higher number of women are Agriculture, Fishing & Hunting (100.0%), Information (100.0%), and Finance & Insurance (100.0%).
| Industry | Male | Female |
| Agriculture, Fishing & Hunting | 0 (0.0%) | 19 (100.0%) |
| Mining, Quarrying, & Extraction | 0 (0.0%) | 0 (0.0%) |
| Construction | 104 (100.0%) | 0 (0.0%) |
| Manufacturing | 75 (43.1%) | 99 (56.9%) |
| Wholesale Trade | 4 (20.0%) | 16 (80.0%) |
| Retail Trade | 24 (19.7%) | 98 (80.3%) |
| Transportation & Warehousing | 11 (100.0%) | 0 (0.0%) |
| Utilities | 0 (0.0%) | 0 (0.0%) |
| Information | 0 (0.0%) | 5 (100.0%) |
| Finance & Insurance | 0 (0.0%) | 13 (100.0%) |
| Real Estate, Rental & Leasing | 0 (0.0%) | 0 (0.0%) |
| Professional & Scientific | 0 (0.0%) | 9 (100.0%) |
| Enterprise Management | 0 (0.0%) | 0 (0.0%) |
| Administrative & Support | 4 (100.0%) | 0 (0.0%) |
| Educational Services | 20 (21.5%) | 73 (78.5%) |
| Health Care & Social Assistance | 15 (19.0%) | 64 (81.0%) |
| Arts, Entertainment & Recreation | 7 (100.0%) | 0 (0.0%) |
| Accommodation & Food Services | 11 (100.0%) | 0 (0.0%) |
| Public Administration | 61 (73.5%) | 22 (26.5%) |
| Total | 340 (44.9%) | 418 (55.1%) |
Education in Piedmont
School Enrollment in Piedmont
The most common levels of schooling among the 610 students in Piedmont are middle school (235 | 38.5%), high school (118 | 19.3%), and elementary school (112 | 18.4%).
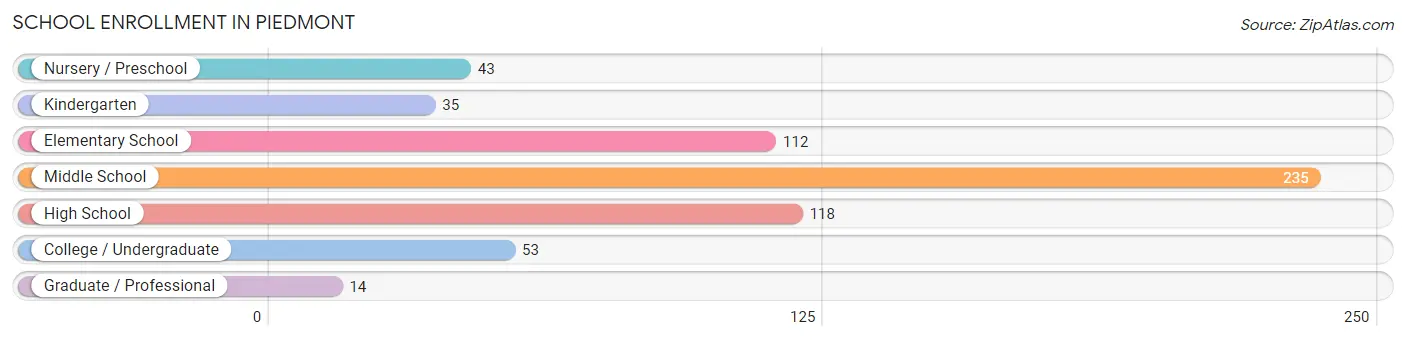
| School Level | # Students | % Students |
| Nursery / Preschool | 43 | 7.0% |
| Kindergarten | 35 | 5.7% |
| Elementary School | 112 | 18.4% |
| Middle School | 235 | 38.5% |
| High School | 118 | 19.3% |
| College / Undergraduate | 53 | 8.7% |
| Graduate / Professional | 14 | 2.3% |
| Total | 610 | 100.0% |
School Enrollment by Age by Funding Source in Piedmont
Out of a total of 610 students who are enrolled in schools in Piedmont, 28 (4.6%) attend a private institution, while the remaining 582 (95.4%) are enrolled in public schools. The age group of 25 to 34 year olds has the highest likelihood of being enrolled in private schools, with 14 (73.7% in the age bracket) enrolled. Conversely, the age group of 10 to 14 year olds has the lowest likelihood of being enrolled in a private school, with 245 (100.0% in the age bracket) attending a public institution.
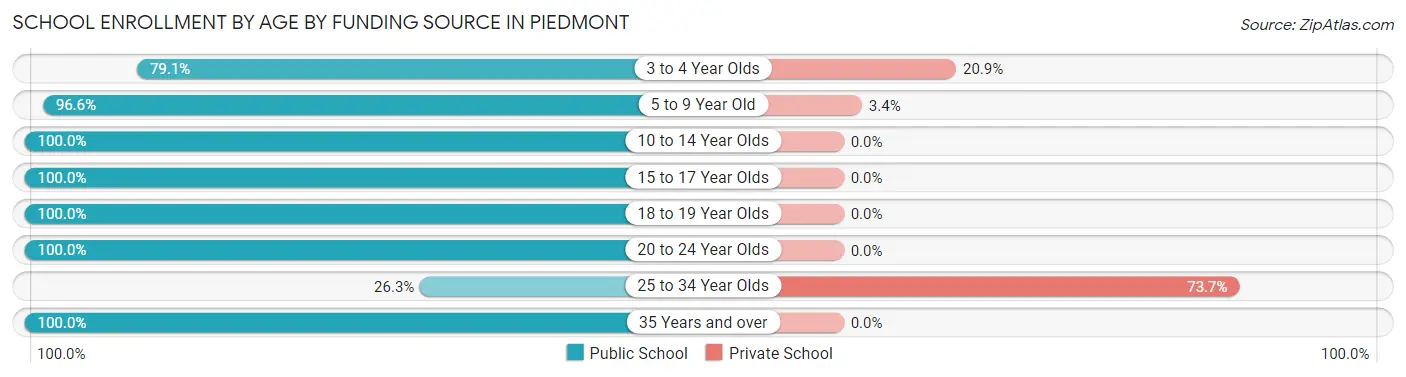
| Age Bracket | Public School | Private School |
| 3 to 4 Year Olds | 34 (79.1%) | 9 (20.9%) |
| 5 to 9 Year Old | 142 (96.6%) | 5 (3.4%) |
| 10 to 14 Year Olds | 245 (100.0%) | 0 (0.0%) |
| 15 to 17 Year Olds | 104 (100.0%) | 0 (0.0%) |
| 18 to 19 Year Olds | 14 (100.0%) | 0 (0.0%) |
| 20 to 24 Year Olds | 30 (100.0%) | 0 (0.0%) |
| 25 to 34 Year Olds | 5 (26.3%) | 14 (73.7%) |
| 35 Years and over | 8 (100.0%) | 0 (0.0%) |
| Total | 582 (95.4%) | 28 (4.6%) |
Educational Attainment by Field of Study in Piedmont
Education (70 | 34.8%), science & technology (39 | 19.4%), communications (33 | 16.4%), engineering (16 | 8.0%), and arts & humanities (14 | 7.0%) are the most common fields of study among 201 individuals in Piedmont who have obtained a bachelor's degree or higher.
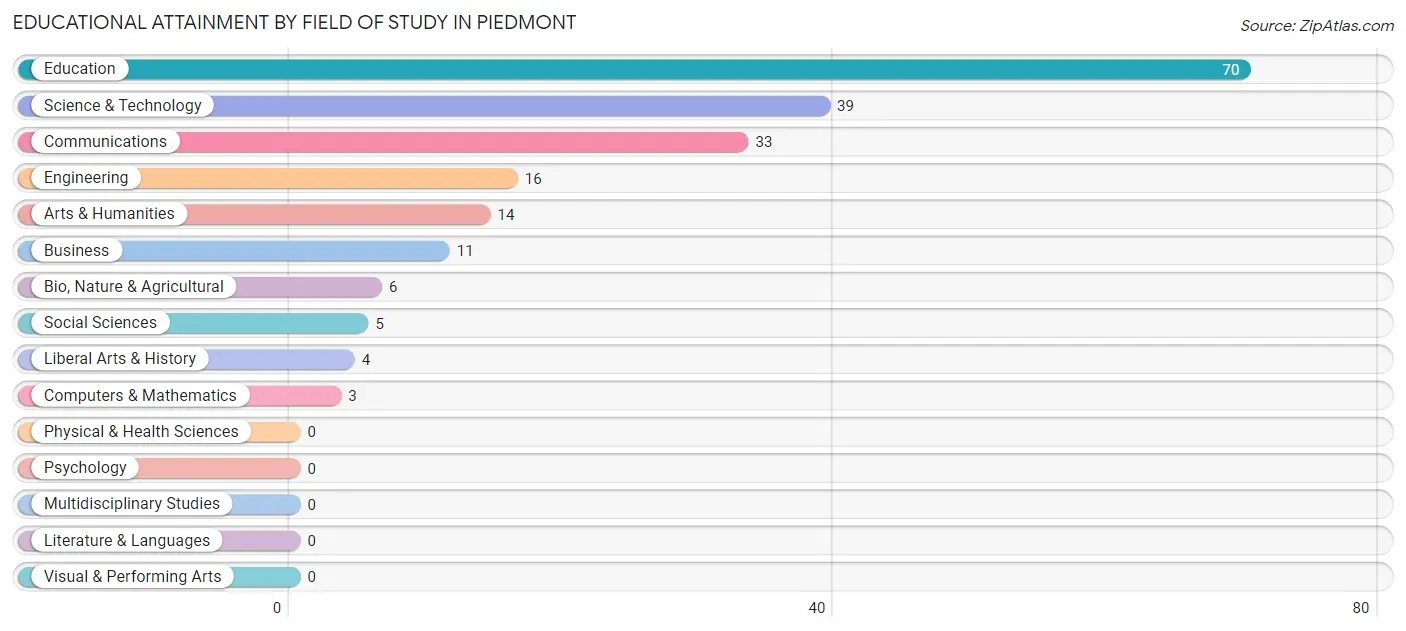
| Field of Study | # Graduates | % Graduates |
| Computers & Mathematics | 3 | 1.5% |
| Bio, Nature & Agricultural | 6 | 3.0% |
| Physical & Health Sciences | 0 | 0.0% |
| Psychology | 0 | 0.0% |
| Social Sciences | 5 | 2.5% |
| Engineering | 16 | 8.0% |
| Multidisciplinary Studies | 0 | 0.0% |
| Science & Technology | 39 | 19.4% |
| Business | 11 | 5.5% |
| Education | 70 | 34.8% |
| Literature & Languages | 0 | 0.0% |
| Liberal Arts & History | 4 | 2.0% |
| Visual & Performing Arts | 0 | 0.0% |
| Communications | 33 | 16.4% |
| Arts & Humanities | 14 | 7.0% |
| Total | 201 | 100.0% |
Transportation & Commute in Piedmont
Vehicle Availability by Sex in Piedmont
The most prevalent vehicle ownership categories in Piedmont are males with 1 vehicle (135, accounting for 39.7%) and females with 1 vehicle (19, making up 33.2%).
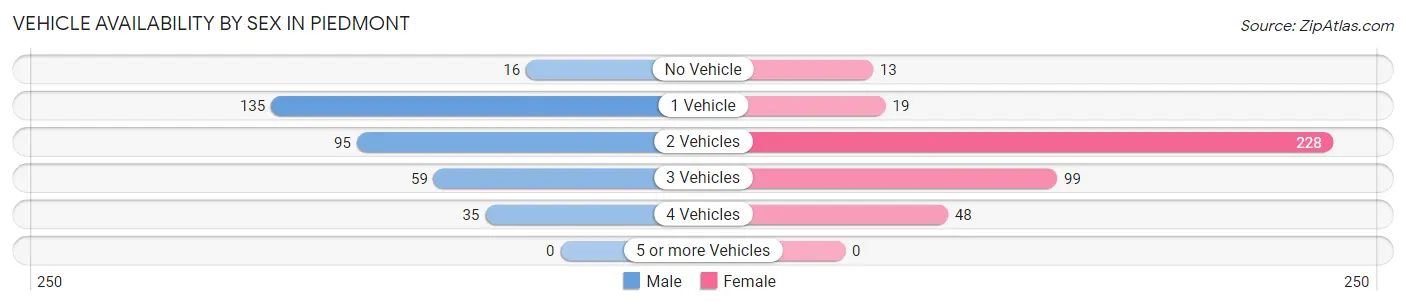
| Vehicles Available | Male | Female |
| No Vehicle | 16 (4.7%) | 13 (3.2%) |
| 1 Vehicle | 135 (39.7%) | 19 (4.7%) |
| 2 Vehicles | 95 (27.9%) | 228 (56.0%) |
| 3 Vehicles | 59 (17.3%) | 99 (24.3%) |
| 4 Vehicles | 35 (10.3%) | 48 (11.8%) |
| 5 or more Vehicles | 0 (0.0%) | 0 (0.0%) |
| Total | 340 (100.0%) | 407 (100.0%) |
Commute Time in Piedmont
The most frequently occuring commute durations in Piedmont are 5 to 9 minutes (269 commuters, 36.4%), 10 to 14 minutes (164 commuters, 22.2%), and 45 to 59 minutes (70 commuters, 9.5%).
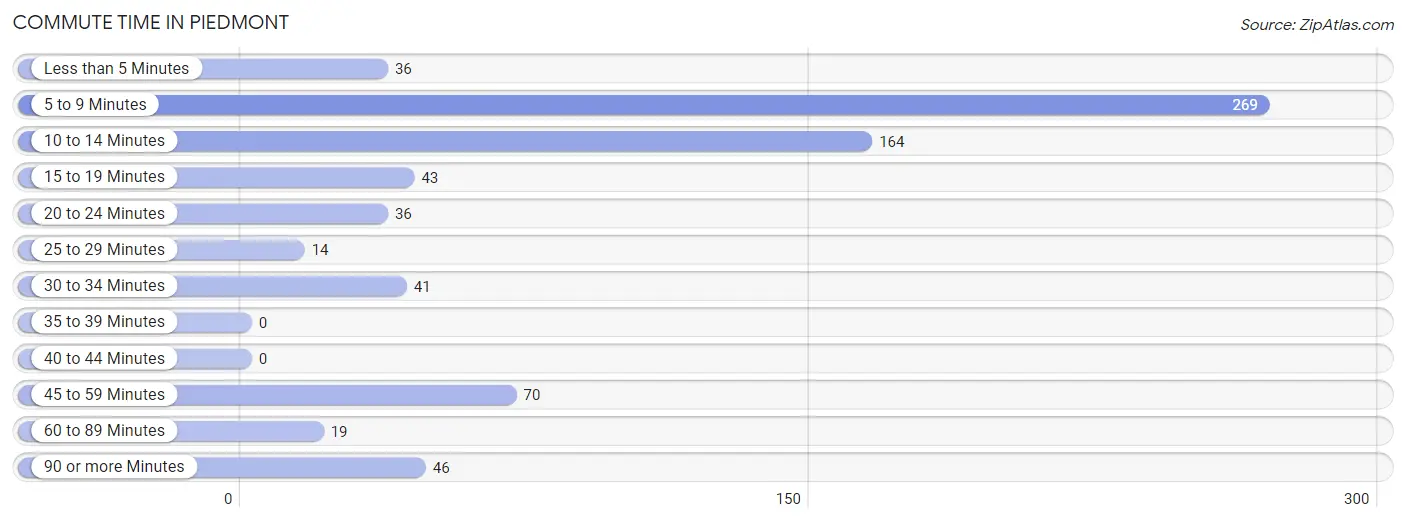
| Commute Time | # Commuters | % Commuters |
| Less than 5 Minutes | 36 | 4.9% |
| 5 to 9 Minutes | 269 | 36.4% |
| 10 to 14 Minutes | 164 | 22.2% |
| 15 to 19 Minutes | 43 | 5.8% |
| 20 to 24 Minutes | 36 | 4.9% |
| 25 to 29 Minutes | 14 | 1.9% |
| 30 to 34 Minutes | 41 | 5.6% |
| 35 to 39 Minutes | 0 | 0.0% |
| 40 to 44 Minutes | 0 | 0.0% |
| 45 to 59 Minutes | 70 | 9.5% |
| 60 to 89 Minutes | 19 | 2.6% |
| 90 or more Minutes | 46 | 6.2% |
Commute Time by Sex in Piedmont
The most common commute times in Piedmont are 5 to 9 minutes (99 commuters, 29.1%) for males and 5 to 9 minutes (170 commuters, 42.7%) for females.
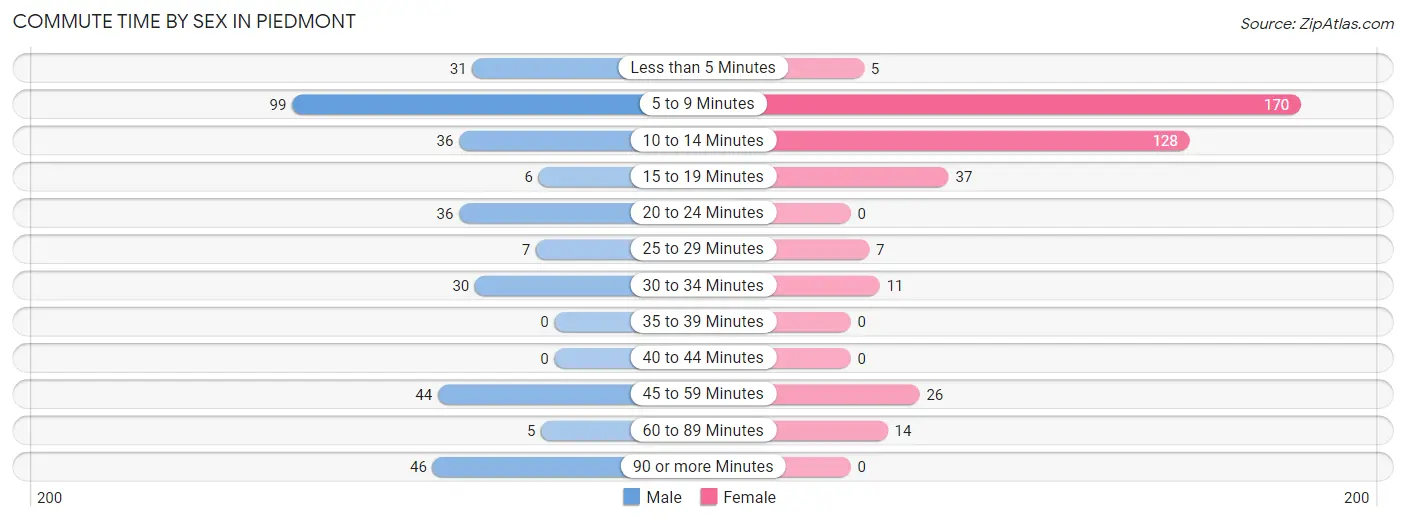
| Commute Time | Male | Female |
| Less than 5 Minutes | 31 (9.1%) | 5 (1.3%) |
| 5 to 9 Minutes | 99 (29.1%) | 170 (42.7%) |
| 10 to 14 Minutes | 36 (10.6%) | 128 (32.2%) |
| 15 to 19 Minutes | 6 (1.8%) | 37 (9.3%) |
| 20 to 24 Minutes | 36 (10.6%) | 0 (0.0%) |
| 25 to 29 Minutes | 7 (2.1%) | 7 (1.8%) |
| 30 to 34 Minutes | 30 (8.8%) | 11 (2.8%) |
| 35 to 39 Minutes | 0 (0.0%) | 0 (0.0%) |
| 40 to 44 Minutes | 0 (0.0%) | 0 (0.0%) |
| 45 to 59 Minutes | 44 (12.9%) | 26 (6.5%) |
| 60 to 89 Minutes | 5 (1.5%) | 14 (3.5%) |
| 90 or more Minutes | 46 (13.5%) | 0 (0.0%) |
Time of Departure to Work by Sex in Piedmont
The most frequent times of departure to work in Piedmont are 6:00 AM to 6:29 AM (70, 20.6%) for males and 7:00 AM to 7:29 AM (83, 20.8%) for females.
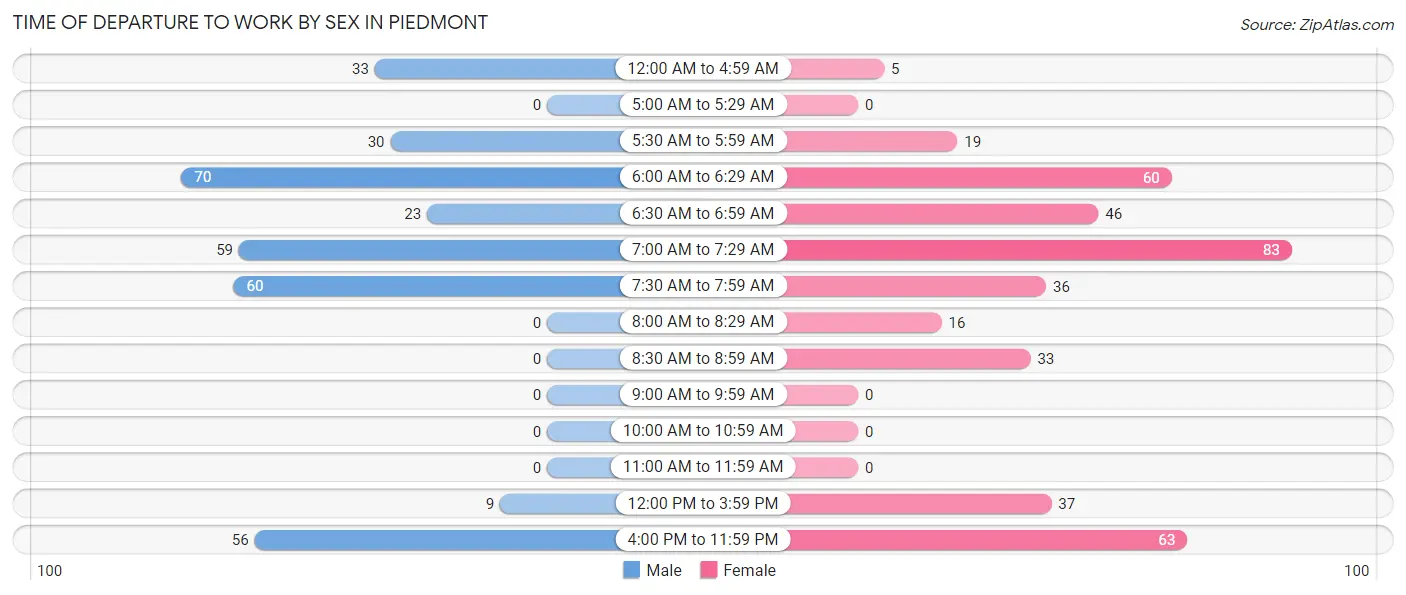
| Time of Departure | Male | Female |
| 12:00 AM to 4:59 AM | 33 (9.7%) | 5 (1.3%) |
| 5:00 AM to 5:29 AM | 0 (0.0%) | 0 (0.0%) |
| 5:30 AM to 5:59 AM | 30 (8.8%) | 19 (4.8%) |
| 6:00 AM to 6:29 AM | 70 (20.6%) | 60 (15.1%) |
| 6:30 AM to 6:59 AM | 23 (6.8%) | 46 (11.6%) |
| 7:00 AM to 7:29 AM | 59 (17.3%) | 83 (20.8%) |
| 7:30 AM to 7:59 AM | 60 (17.6%) | 36 (9.0%) |
| 8:00 AM to 8:29 AM | 0 (0.0%) | 16 (4.0%) |
| 8:30 AM to 8:59 AM | 0 (0.0%) | 33 (8.3%) |
| 9:00 AM to 9:59 AM | 0 (0.0%) | 0 (0.0%) |
| 10:00 AM to 10:59 AM | 0 (0.0%) | 0 (0.0%) |
| 11:00 AM to 11:59 AM | 0 (0.0%) | 0 (0.0%) |
| 12:00 PM to 3:59 PM | 9 (2.6%) | 37 (9.3%) |
| 4:00 PM to 11:59 PM | 56 (16.5%) | 63 (15.8%) |
| Total | 340 (100.0%) | 398 (100.0%) |
Housing Occupancy in Piedmont
Occupancy by Ownership in Piedmont
Of the total 994 dwellings in Piedmont, owner-occupied units account for 545 (54.8%), while renter-occupied units make up 449 (45.2%).
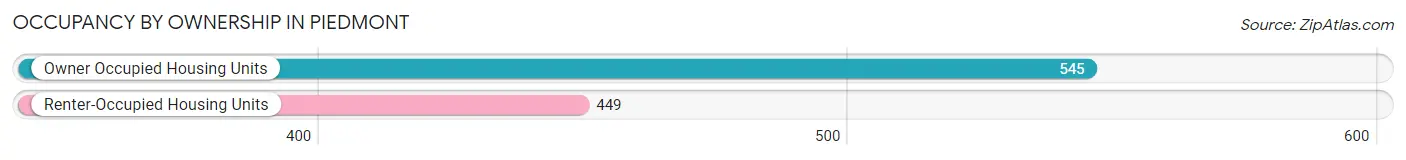
| Occupancy | # Housing Units | % Housing Units |
| Owner Occupied Housing Units | 545 | 54.8% |
| Renter-Occupied Housing Units | 449 | 45.2% |
| Total Occupied Housing Units | 994 | 100.0% |
Occupancy by Household Size in Piedmont
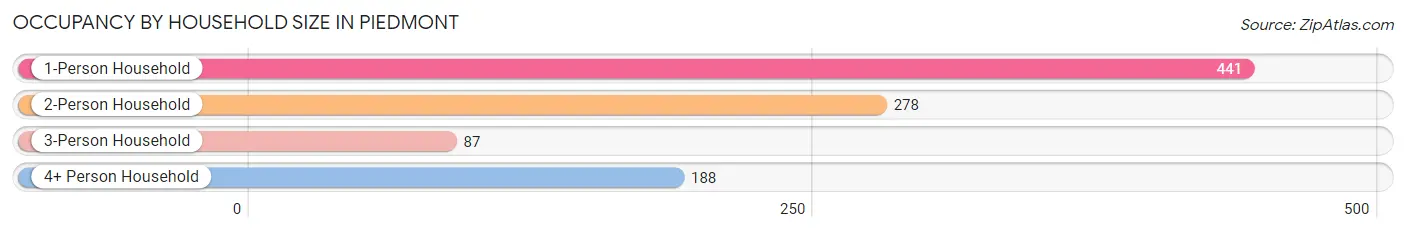
| Household Size | # Housing Units | % Housing Units |
| 1-Person Household | 441 | 44.4% |
| 2-Person Household | 278 | 28.0% |
| 3-Person Household | 87 | 8.7% |
| 4+ Person Household | 188 | 18.9% |
| Total Housing Units | 994 | 100.0% |
Occupancy by Ownership by Household Size in Piedmont
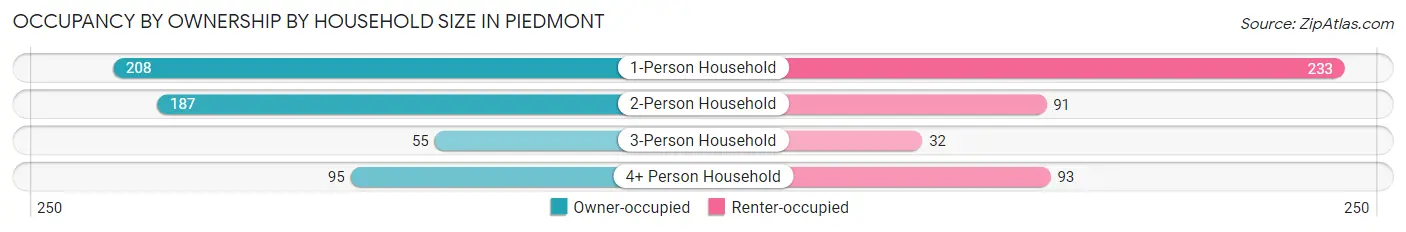
| Household Size | Owner-occupied | Renter-occupied |
| 1-Person Household | 208 (47.2%) | 233 (52.8%) |
| 2-Person Household | 187 (67.3%) | 91 (32.7%) |
| 3-Person Household | 55 (63.2%) | 32 (36.8%) |
| 4+ Person Household | 95 (50.5%) | 93 (49.5%) |
| Total Housing Units | 545 (54.8%) | 449 (45.2%) |
Occupancy by Educational Attainment in Piedmont
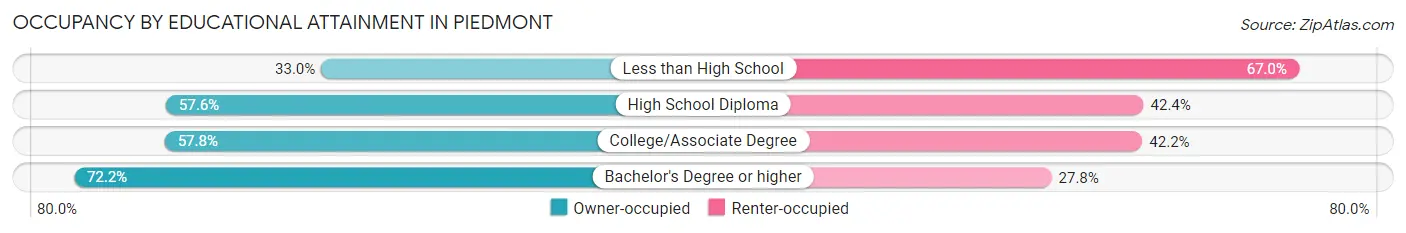
| Household Size | Owner-occupied | Renter-occupied |
| Less than High School | 60 (33.0%) | 122 (67.0%) |
| High School Diploma | 190 (57.6%) | 140 (42.4%) |
| College/Associate Degree | 212 (57.8%) | 155 (42.2%) |
| Bachelor's Degree or higher | 83 (72.2%) | 32 (27.8%) |
Occupancy by Age of Householder in Piedmont
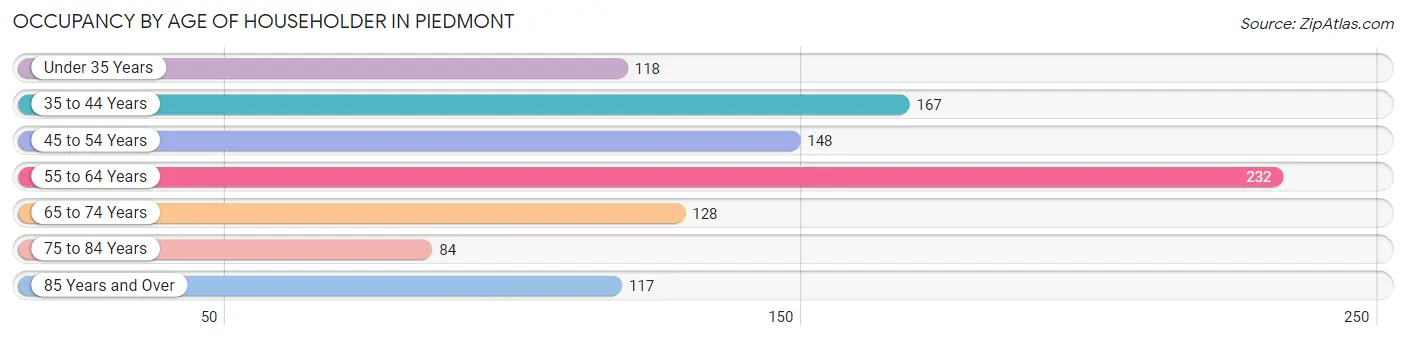
| Age Bracket | # Households | % Households |
| Under 35 Years | 118 | 11.9% |
| 35 to 44 Years | 167 | 16.8% |
| 45 to 54 Years | 148 | 14.9% |
| 55 to 64 Years | 232 | 23.3% |
| 65 to 74 Years | 128 | 12.9% |
| 75 to 84 Years | 84 | 8.5% |
| 85 Years and Over | 117 | 11.8% |
| Total | 994 | 100.0% |
Housing Finances in Piedmont
Median Income by Occupancy in Piedmont
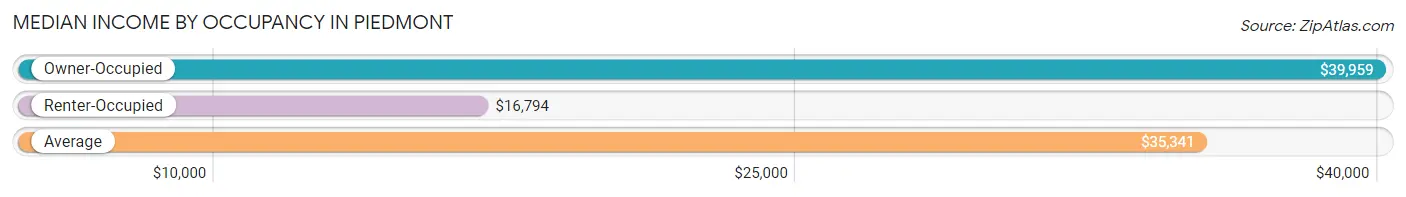
| Occupancy Type | # Households | Median Income |
| Owner-Occupied | 545 (54.8%) | $39,959 |
| Renter-Occupied | 449 (45.2%) | $16,794 |
| Average | 994 (100.0%) | $35,341 |
Occupancy by Householder Income Bracket in Piedmont
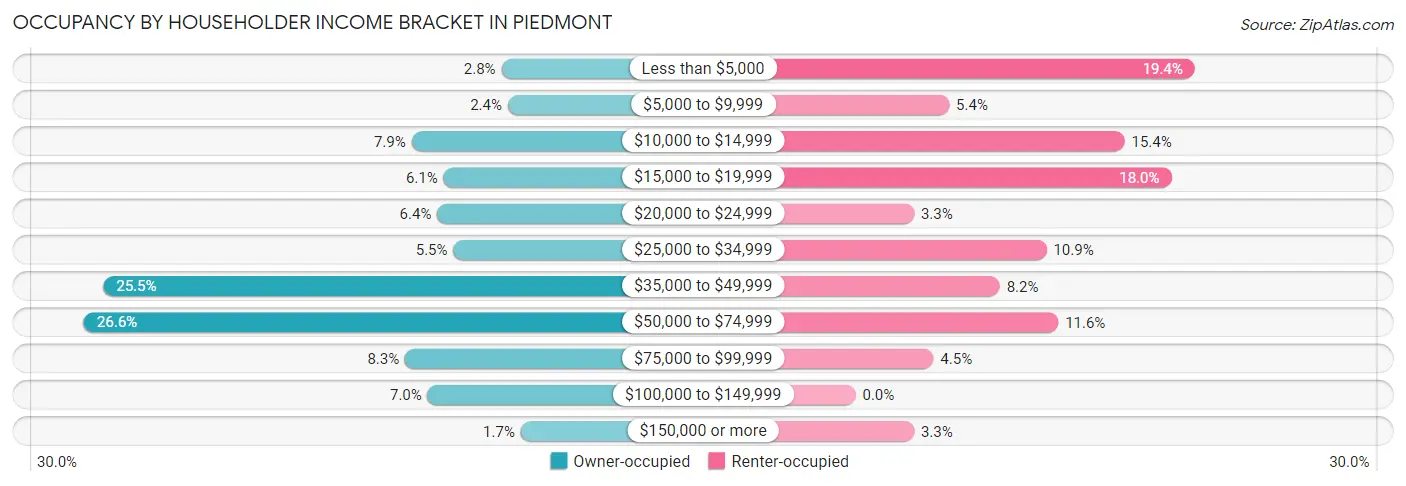
| Income Bracket | Owner-occupied | Renter-occupied |
| Less than $5,000 | 15 (2.8%) | 87 (19.4%) |
| $5,000 to $9,999 | 13 (2.4%) | 24 (5.3%) |
| $10,000 to $14,999 | 43 (7.9%) | 69 (15.4%) |
| $15,000 to $19,999 | 33 (6.1%) | 81 (18.0%) |
| $20,000 to $24,999 | 35 (6.4%) | 15 (3.3%) |
| $25,000 to $34,999 | 30 (5.5%) | 49 (10.9%) |
| $35,000 to $49,999 | 139 (25.5%) | 37 (8.2%) |
| $50,000 to $74,999 | 145 (26.6%) | 52 (11.6%) |
| $75,000 to $99,999 | 45 (8.3%) | 20 (4.4%) |
| $100,000 to $149,999 | 38 (7.0%) | 0 (0.0%) |
| $150,000 or more | 9 (1.7%) | 15 (3.3%) |
| Total | 545 (100.0%) | 449 (100.0%) |
Monthly Housing Cost Tiers in Piedmont
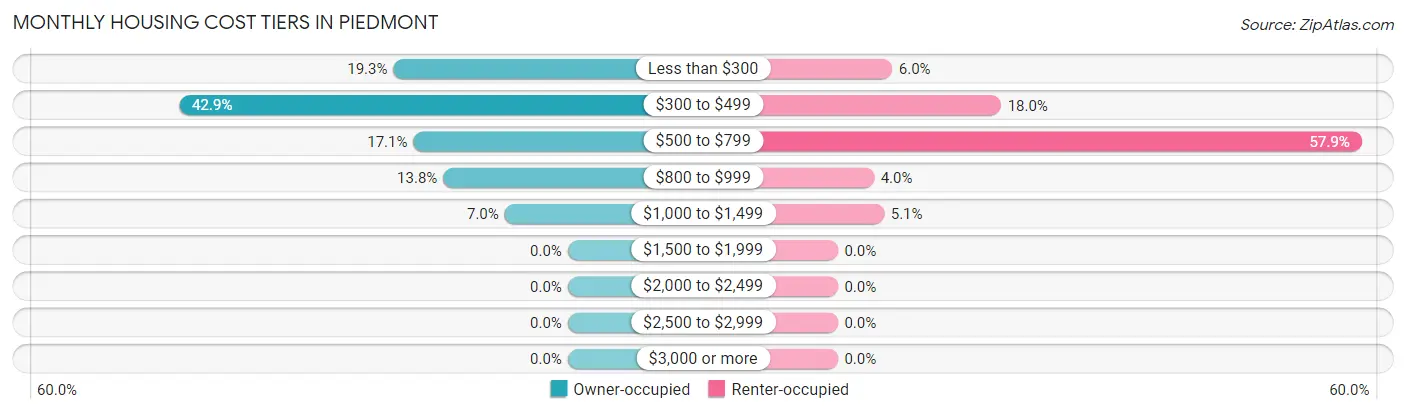
| Monthly Cost | Owner-occupied | Renter-occupied |
| Less than $300 | 105 (19.3%) | 27 (6.0%) |
| $300 to $499 | 234 (42.9%) | 81 (18.0%) |
| $500 to $799 | 93 (17.1%) | 260 (57.9%) |
| $800 to $999 | 75 (13.8%) | 18 (4.0%) |
| $1,000 to $1,499 | 38 (7.0%) | 23 (5.1%) |
| $1,500 to $1,999 | 0 (0.0%) | 0 (0.0%) |
| $2,000 to $2,499 | 0 (0.0%) | 0 (0.0%) |
| $2,500 to $2,999 | 0 (0.0%) | 0 (0.0%) |
| $3,000 or more | 0 (0.0%) | 0 (0.0%) |
| Total | 545 (100.0%) | 449 (100.0%) |
Physical Housing Characteristics in Piedmont
Housing Structures in Piedmont
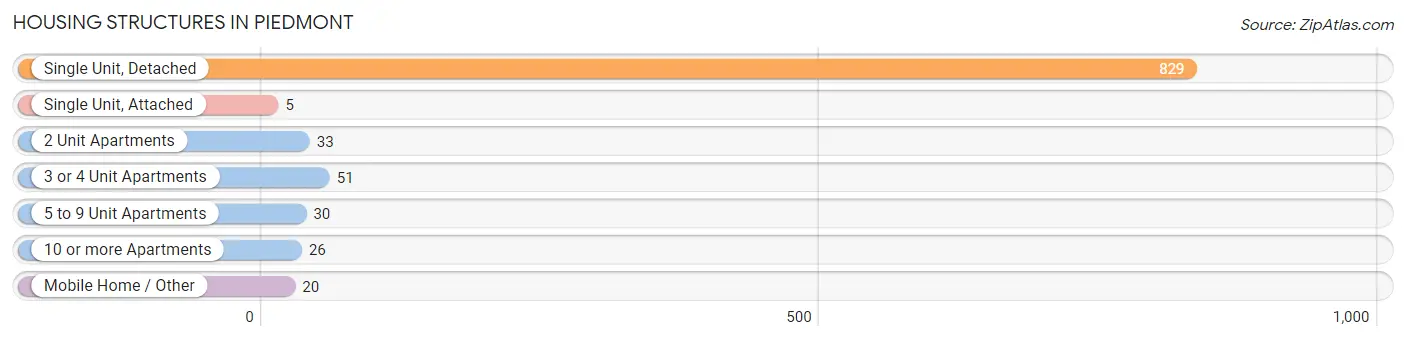
| Structure Type | # Housing Units | % Housing Units |
| Single Unit, Detached | 829 | 83.4% |
| Single Unit, Attached | 5 | 0.5% |
| 2 Unit Apartments | 33 | 3.3% |
| 3 or 4 Unit Apartments | 51 | 5.1% |
| 5 to 9 Unit Apartments | 30 | 3.0% |
| 10 or more Apartments | 26 | 2.6% |
| Mobile Home / Other | 20 | 2.0% |
| Total | 994 | 100.0% |
Housing Structures by Occupancy in Piedmont
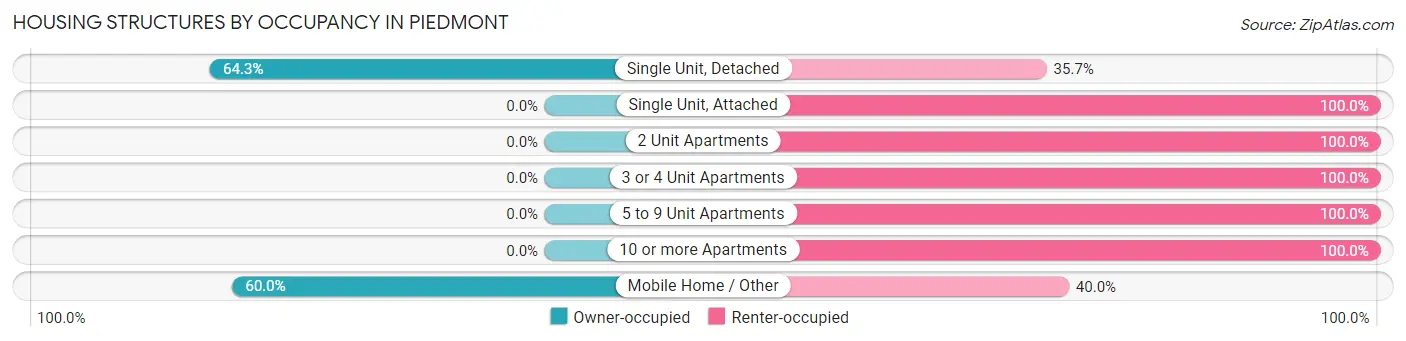
| Structure Type | Owner-occupied | Renter-occupied |
| Single Unit, Detached | 533 (64.3%) | 296 (35.7%) |
| Single Unit, Attached | 0 (0.0%) | 5 (100.0%) |
| 2 Unit Apartments | 0 (0.0%) | 33 (100.0%) |
| 3 or 4 Unit Apartments | 0 (0.0%) | 51 (100.0%) |
| 5 to 9 Unit Apartments | 0 (0.0%) | 30 (100.0%) |
| 10 or more Apartments | 0 (0.0%) | 26 (100.0%) |
| Mobile Home / Other | 12 (60.0%) | 8 (40.0%) |
| Total | 545 (54.8%) | 449 (45.2%) |
Housing Structures by Number of Rooms in Piedmont
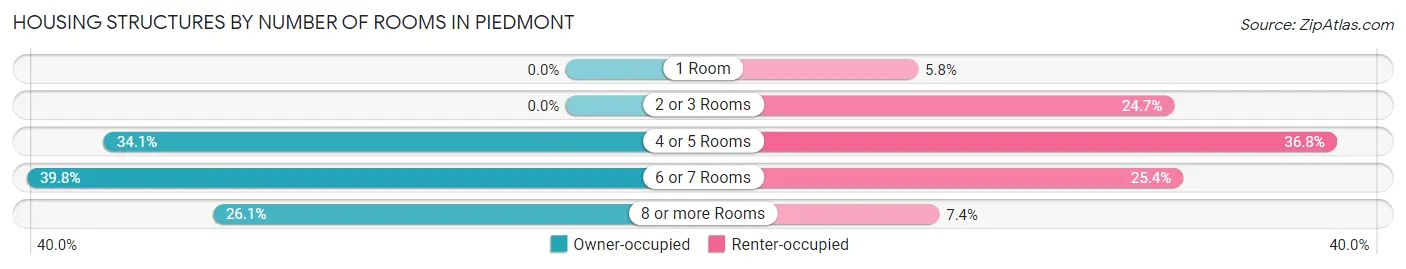
| Number of Rooms | Owner-occupied | Renter-occupied |
| 1 Room | 0 (0.0%) | 26 (5.8%) |
| 2 or 3 Rooms | 0 (0.0%) | 111 (24.7%) |
| 4 or 5 Rooms | 186 (34.1%) | 165 (36.7%) |
| 6 or 7 Rooms | 217 (39.8%) | 114 (25.4%) |
| 8 or more Rooms | 142 (26.1%) | 33 (7.3%) |
| Total | 545 (100.0%) | 449 (100.0%) |
Housing Structure by Heating Type in Piedmont
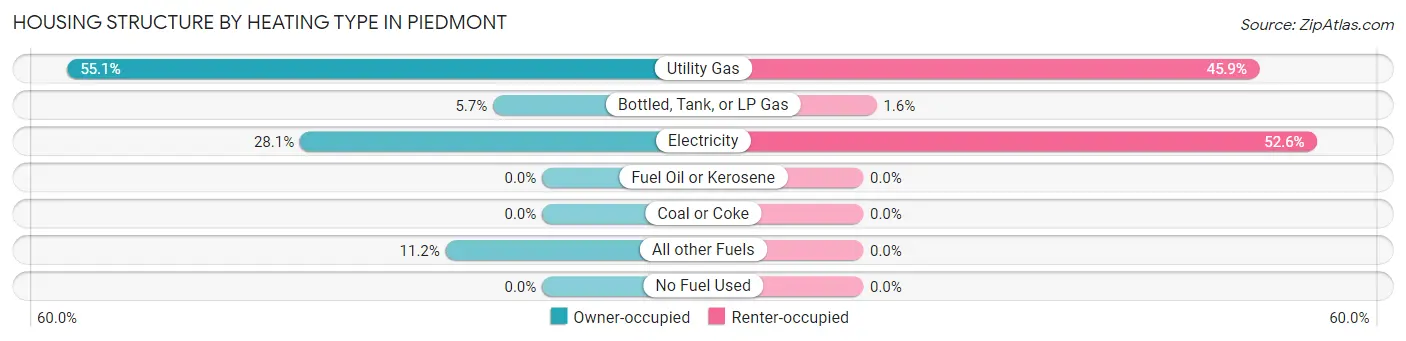
| Heating Type | Owner-occupied | Renter-occupied |
| Utility Gas | 300 (55.0%) | 206 (45.9%) |
| Bottled, Tank, or LP Gas | 31 (5.7%) | 7 (1.6%) |
| Electricity | 153 (28.1%) | 236 (52.6%) |
| Fuel Oil or Kerosene | 0 (0.0%) | 0 (0.0%) |
| Coal or Coke | 0 (0.0%) | 0 (0.0%) |
| All other Fuels | 61 (11.2%) | 0 (0.0%) |
| No Fuel Used | 0 (0.0%) | 0 (0.0%) |
| Total | 545 (100.0%) | 449 (100.0%) |
Household Vehicle Usage in Piedmont
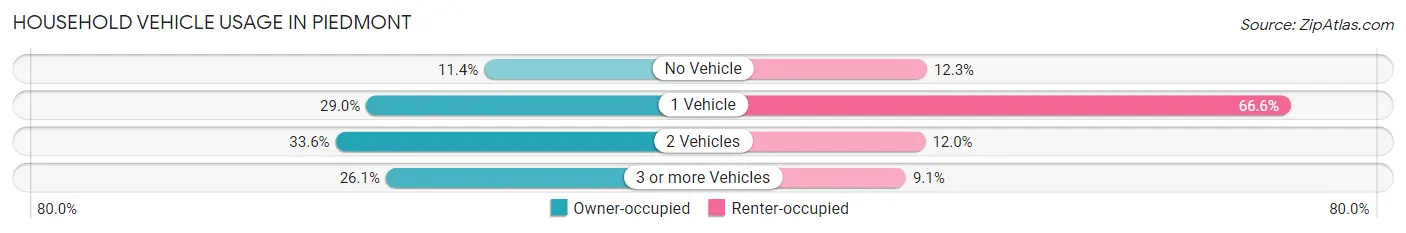
| Vehicles per Household | Owner-occupied | Renter-occupied |
| No Vehicle | 62 (11.4%) | 55 (12.2%) |
| 1 Vehicle | 158 (29.0%) | 299 (66.6%) |
| 2 Vehicles | 183 (33.6%) | 54 (12.0%) |
| 3 or more Vehicles | 142 (26.1%) | 41 (9.1%) |
| Total | 545 (100.0%) | 449 (100.0%) |
Real Estate & Mortgages in Piedmont
Real Estate and Mortgage Overview in Piedmont
| Characteristic | Without Mortgage | With Mortgage |
| Housing Units | 407 | 138 |
| Median Property Value | $98,800 | $82,700 |
| Median Household Income | $38,668 | $9 |
| Monthly Housing Costs | $366 | $0 |
| Real Estate Taxes | $551 | $0 |
Property Value by Mortgage Status in Piedmont
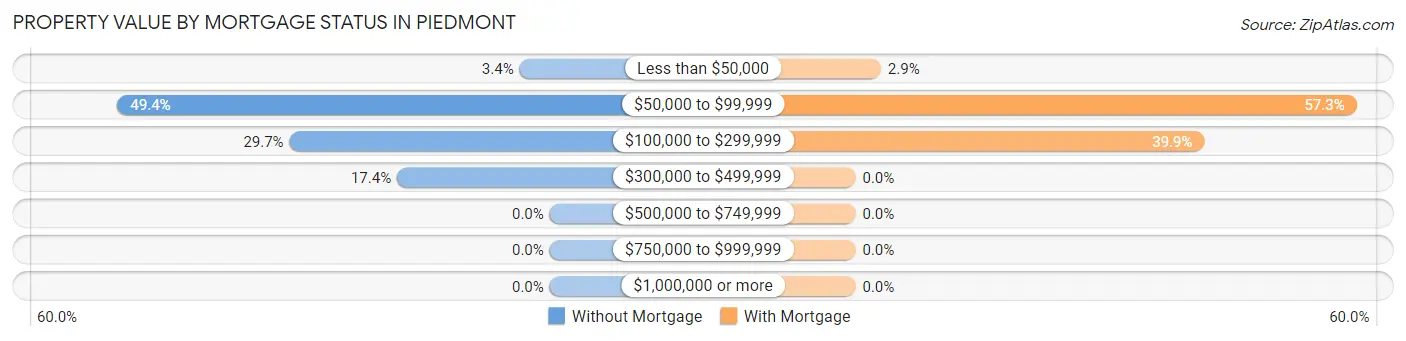
| Property Value | Without Mortgage | With Mortgage |
| Less than $50,000 | 14 (3.4%) | 4 (2.9%) |
| $50,000 to $99,999 | 201 (49.4%) | 79 (57.3%) |
| $100,000 to $299,999 | 121 (29.7%) | 55 (39.9%) |
| $300,000 to $499,999 | 71 (17.4%) | 0 (0.0%) |
| $500,000 to $749,999 | 0 (0.0%) | 0 (0.0%) |
| $750,000 to $999,999 | 0 (0.0%) | 0 (0.0%) |
| $1,000,000 or more | 0 (0.0%) | 0 (0.0%) |
| Total | 407 (100.0%) | 138 (100.0%) |
Household Income by Mortgage Status in Piedmont
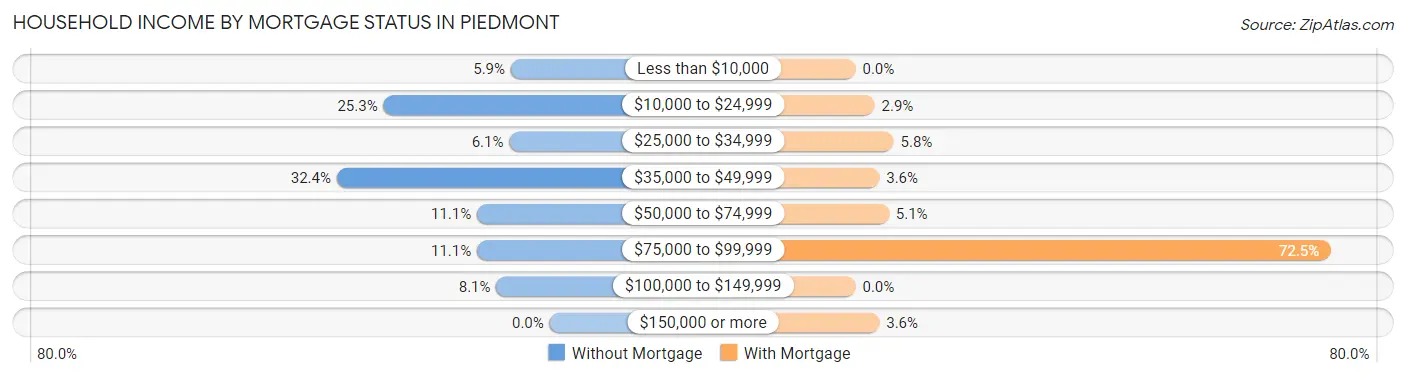
| Household Income | Without Mortgage | With Mortgage |
| Less than $10,000 | 24 (5.9%) | 0 (0.0%) |
| $10,000 to $24,999 | 103 (25.3%) | 4 (2.9%) |
| $25,000 to $34,999 | 25 (6.1%) | 8 (5.8%) |
| $35,000 to $49,999 | 132 (32.4%) | 5 (3.6%) |
| $50,000 to $74,999 | 45 (11.1%) | 7 (5.1%) |
| $75,000 to $99,999 | 45 (11.1%) | 100 (72.5%) |
| $100,000 to $149,999 | 33 (8.1%) | 0 (0.0%) |
| $150,000 or more | 0 (0.0%) | 5 (3.6%) |
| Total | 407 (100.0%) | 138 (100.0%) |
Property Value to Household Income Ratio in Piedmont
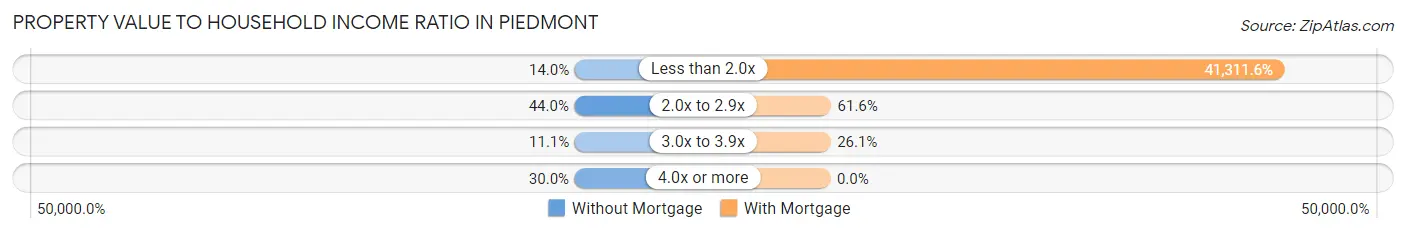
| Value-to-Income Ratio | Without Mortgage | With Mortgage |
| Less than 2.0x | 57 (14.0%) | 57,010 (41,311.6%) |
| 2.0x to 2.9x | 179 (44.0%) | 85 (61.6%) |
| 3.0x to 3.9x | 45 (11.1%) | 36 (26.1%) |
| 4.0x or more | 122 (30.0%) | 0 (0.0%) |
| Total | 407 (100.0%) | 138 (100.0%) |
Real Estate Taxes by Mortgage Status in Piedmont
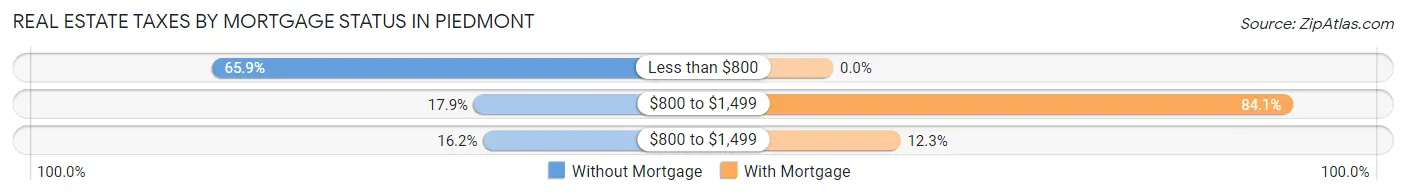
| Property Taxes | Without Mortgage | With Mortgage |
| Less than $800 | 268 (65.8%) | 0 (0.0%) |
| $800 to $1,499 | 73 (17.9%) | 116 (84.1%) |
| $800 to $1,499 | 66 (16.2%) | 17 (12.3%) |
| Total | 407 (100.0%) | 138 (100.0%) |
Health & Disability in Piedmont
Health Insurance Coverage by Age in Piedmont
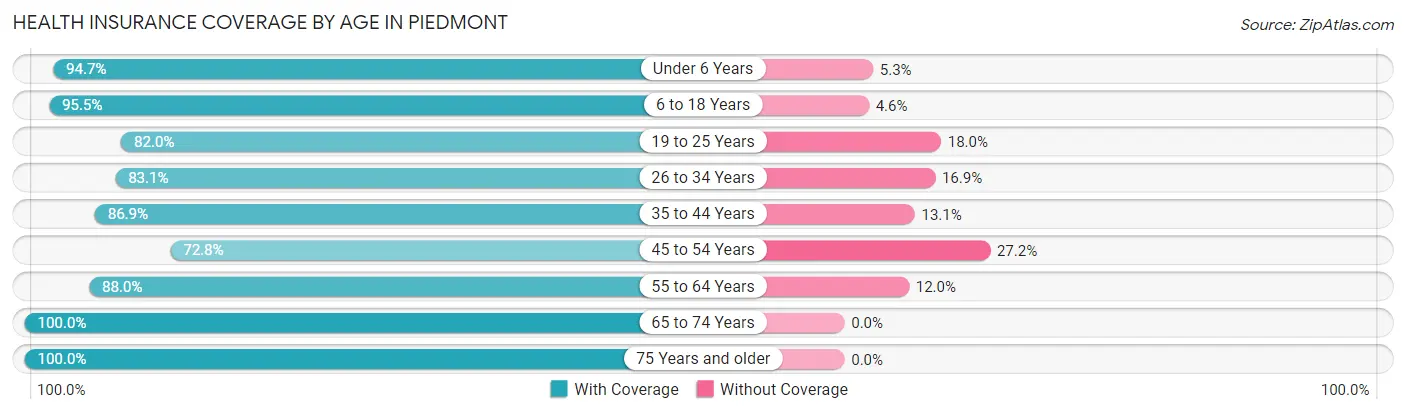
| Age Bracket | With Coverage | Without Coverage |
| Under 6 Years | 160 (94.7%) | 9 (5.3%) |
| 6 to 18 Years | 462 (95.5%) | 22 (4.5%) |
| 19 to 25 Years | 228 (82.0%) | 50 (18.0%) |
| 26 to 34 Years | 226 (83.1%) | 46 (16.9%) |
| 35 to 44 Years | 292 (86.9%) | 44 (13.1%) |
| 45 to 54 Years | 185 (72.8%) | 69 (27.2%) |
| 55 to 64 Years | 366 (88.0%) | 50 (12.0%) |
| 65 to 74 Years | 226 (100.0%) | 0 (0.0%) |
| 75 Years and older | 252 (100.0%) | 0 (0.0%) |
| Total | 2,397 (89.2%) | 290 (10.8%) |
Health Insurance Coverage by Citizenship Status in Piedmont
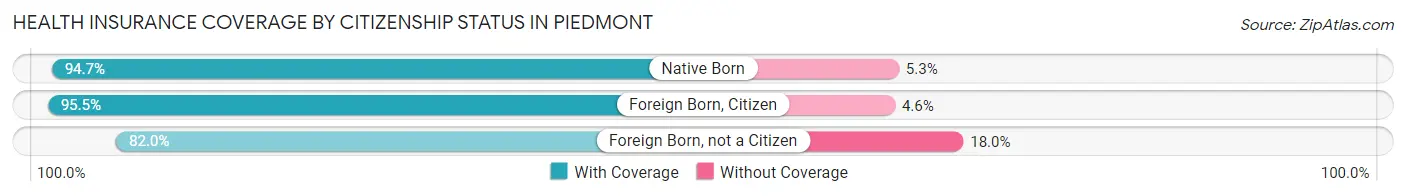
| Citizenship Status | With Coverage | Without Coverage |
| Native Born | 160 (94.7%) | 9 (5.3%) |
| Foreign Born, Citizen | 462 (95.5%) | 22 (4.5%) |
| Foreign Born, not a Citizen | 228 (82.0%) | 50 (18.0%) |
Health Insurance Coverage by Household Income in Piedmont
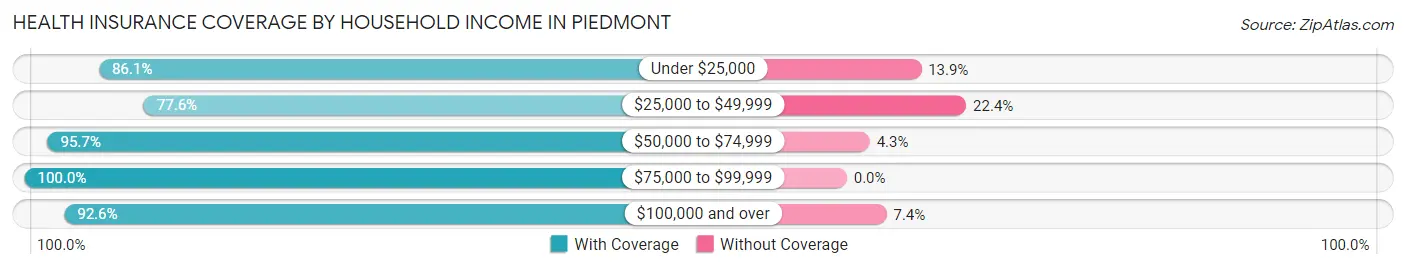
| Household Income | With Coverage | Without Coverage |
| Under $25,000 | 531 (86.1%) | 86 (13.9%) |
| $25,000 to $49,999 | 514 (77.6%) | 148 (22.4%) |
| $50,000 to $74,999 | 891 (95.7%) | 40 (4.3%) |
| $75,000 to $99,999 | 262 (100.0%) | 0 (0.0%) |
| $100,000 and over | 199 (92.6%) | 16 (7.4%) |
Public vs Private Health Insurance Coverage by Age in Piedmont
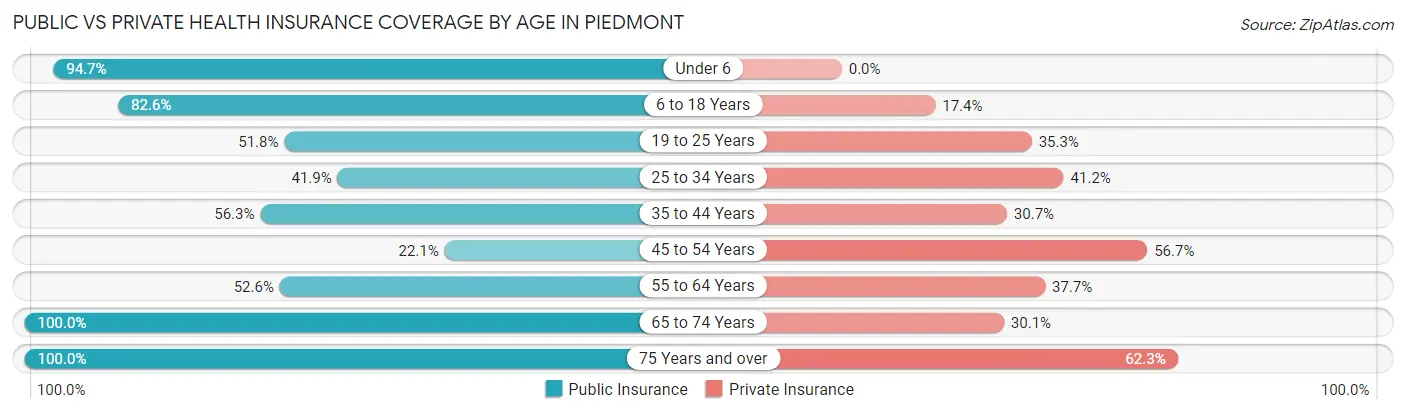
| Age Bracket | Public Insurance | Private Insurance |
| Under 6 | 160 (94.7%) | 0 (0.0%) |
| 6 to 18 Years | 400 (82.6%) | 84 (17.4%) |
| 19 to 25 Years | 144 (51.8%) | 98 (35.2%) |
| 25 to 34 Years | 114 (41.9%) | 112 (41.2%) |
| 35 to 44 Years | 189 (56.2%) | 103 (30.6%) |
| 45 to 54 Years | 56 (22.1%) | 144 (56.7%) |
| 55 to 64 Years | 219 (52.6%) | 157 (37.7%) |
| 65 to 74 Years | 226 (100.0%) | 68 (30.1%) |
| 75 Years and over | 252 (100.0%) | 157 (62.3%) |
| Total | 1,760 (65.5%) | 923 (34.4%) |
Disability Status by Sex by Age in Piedmont
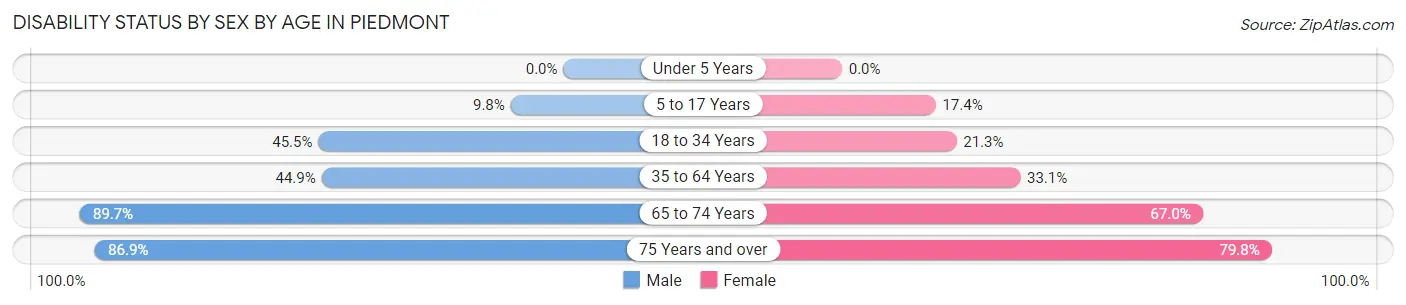
| Age Bracket | Male | Female |
| Under 5 Years | 0 (0.0%) | 0 (0.0%) |
| 5 to 17 Years | 23 (9.8%) | 48 (17.4%) |
| 18 to 34 Years | 141 (45.5%) | 51 (21.2%) |
| 35 to 64 Years | 206 (44.9%) | 181 (33.1%) |
| 65 to 74 Years | 105 (89.7%) | 73 (67.0%) |
| 75 Years and over | 73 (86.9%) | 134 (79.8%) |
Disability Class by Sex by Age in Piedmont
Disability Class: Hearing Difficulty
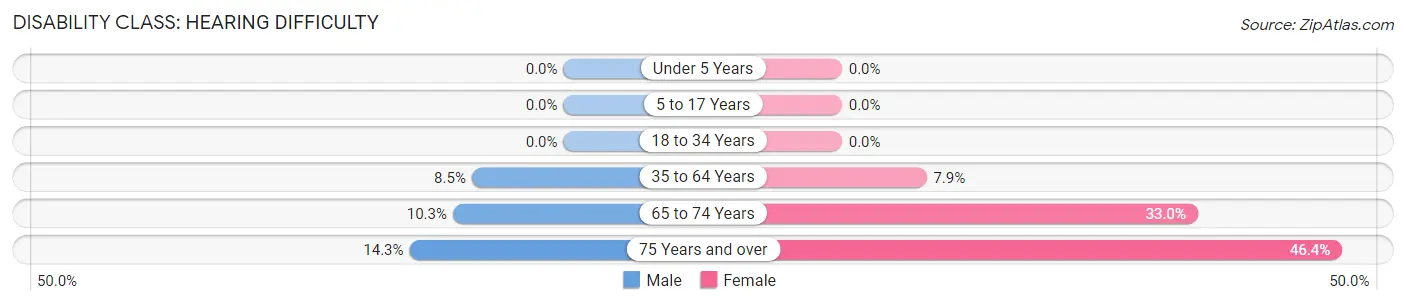
| Age Bracket | Male | Female |
| Under 5 Years | 0 (0.0%) | 0 (0.0%) |
| 5 to 17 Years | 0 (0.0%) | 0 (0.0%) |
| 18 to 34 Years | 0 (0.0%) | 0 (0.0%) |
| 35 to 64 Years | 39 (8.5%) | 43 (7.9%) |
| 65 to 74 Years | 12 (10.3%) | 36 (33.0%) |
| 75 Years and over | 12 (14.3%) | 78 (46.4%) |
Disability Class: Vision Difficulty
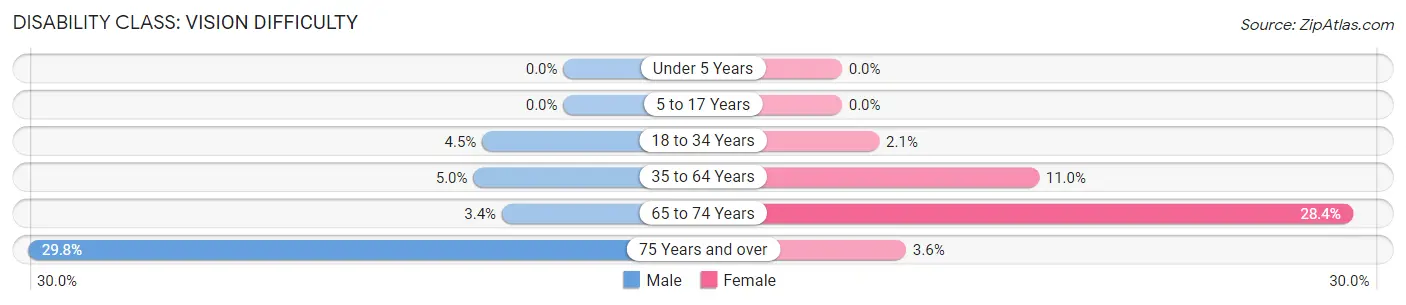
| Age Bracket | Male | Female |
| Under 5 Years | 0 (0.0%) | 0 (0.0%) |
| 5 to 17 Years | 0 (0.0%) | 0 (0.0%) |
| 18 to 34 Years | 14 (4.5%) | 5 (2.1%) |
| 35 to 64 Years | 23 (5.0%) | 60 (11.0%) |
| 65 to 74 Years | 4 (3.4%) | 31 (28.4%) |
| 75 Years and over | 25 (29.8%) | 6 (3.6%) |
Disability Class: Cognitive Difficulty
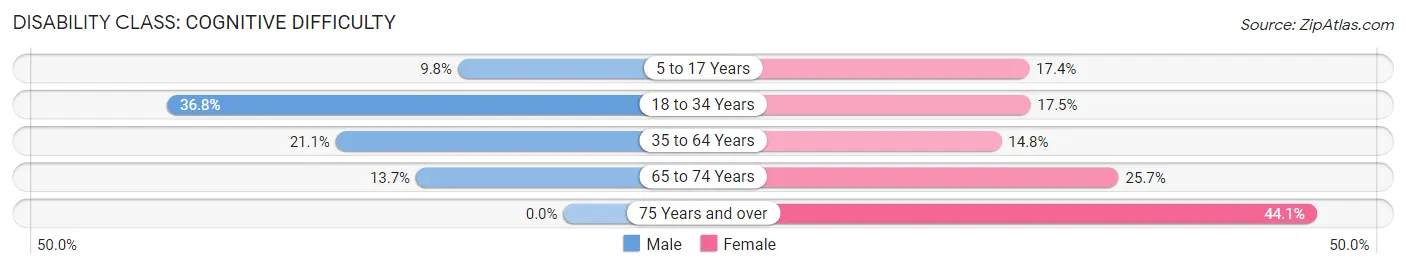
| Age Bracket | Male | Female |
| 5 to 17 Years | 23 (9.8%) | 48 (17.4%) |
| 18 to 34 Years | 114 (36.8%) | 42 (17.5%) |
| 35 to 64 Years | 97 (21.1%) | 81 (14.8%) |
| 65 to 74 Years | 16 (13.7%) | 28 (25.7%) |
| 75 Years and over | 0 (0.0%) | 74 (44.1%) |
Disability Class: Ambulatory Difficulty
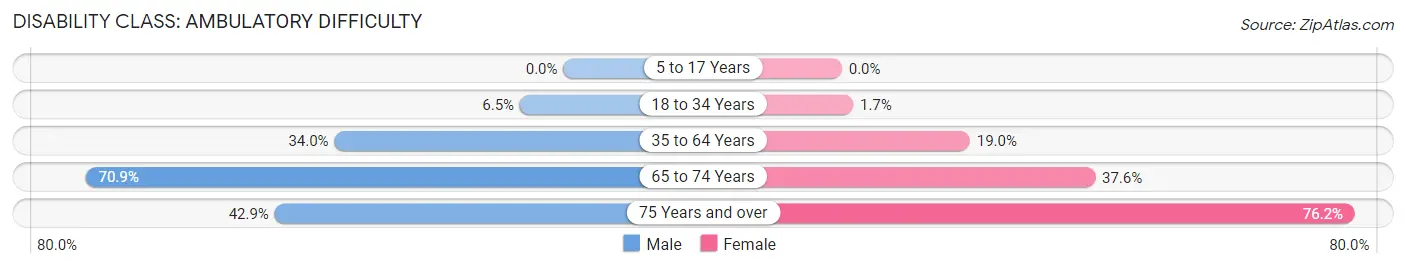
| Age Bracket | Male | Female |
| 5 to 17 Years | 0 (0.0%) | 0 (0.0%) |
| 18 to 34 Years | 20 (6.5%) | 4 (1.7%) |
| 35 to 64 Years | 156 (34.0%) | 104 (19.0%) |
| 65 to 74 Years | 83 (70.9%) | 41 (37.6%) |
| 75 Years and over | 36 (42.9%) | 128 (76.2%) |
Disability Class: Self-Care Difficulty
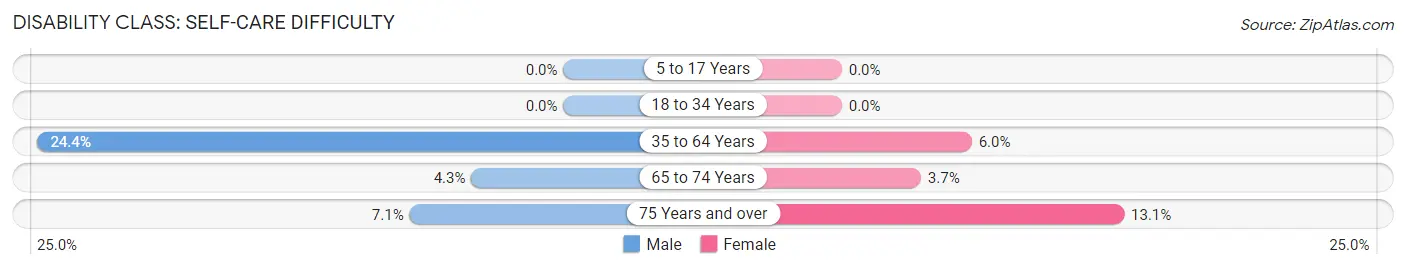
| Age Bracket | Male | Female |
| 5 to 17 Years | 0 (0.0%) | 0 (0.0%) |
| 18 to 34 Years | 0 (0.0%) | 0 (0.0%) |
| 35 to 64 Years | 112 (24.4%) | 33 (6.0%) |
| 65 to 74 Years | 5 (4.3%) | 4 (3.7%) |
| 75 Years and over | 6 (7.1%) | 22 (13.1%) |
Technology Access in Piedmont
Computing Device Access in Piedmont
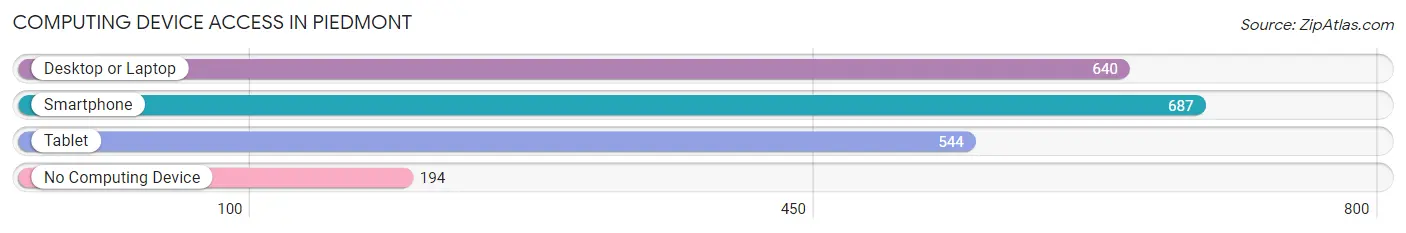
| Device Type | # Households | % Households |
| Desktop or Laptop | 640 | 64.4% |
| Smartphone | 687 | 69.1% |
| Tablet | 544 | 54.7% |
| No Computing Device | 194 | 19.5% |
| Total | 994 | 100.0% |
Internet Access in Piedmont
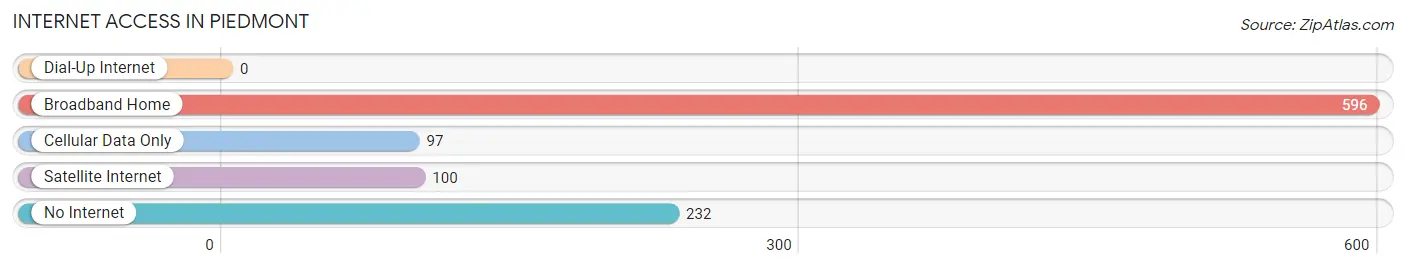
| Internet Type | # Households | % Households |
| Dial-Up Internet | 0 | 0.0% |
| Broadband Home | 596 | 60.0% |
| Cellular Data Only | 97 | 9.8% |
| Satellite Internet | 100 | 10.1% |
| No Internet | 232 | 23.3% |
| Total | 994 | 100.0% |
Piedmont Summary
Piedmont, Missouri is a small town located in the Ozark Mountains of the southeastern corner of the state. It is situated in Wayne County, and is the county seat. The town was founded in 1871 and has a population of approximately 1,000 people.
Geography
Piedmont is located in the Ozark Mountains of southeastern Missouri. It is situated in Wayne County, and is the county seat. The town is located at the intersection of Missouri State Highways 34 and 49. The town is surrounded by rolling hills and is situated in a valley. The town is located at an elevation of 890 feet above sea level.
The climate in Piedmont is humid subtropical, with hot summers and mild winters. The average annual temperature is around 60 degrees Fahrenheit. The average annual precipitation is around 45 inches.
History
Piedmont was founded in 1871 by a group of settlers from Kentucky. The town was named after the French word for “high mountain”. The town was originally a farming community, and the main crops grown were corn, wheat, and oats.
In the late 19th century, the town began to grow and develop. The first school was built in 1876, and the first church was built in 1877. The first newspaper, the Piedmont Herald, was established in 1878.
In the early 20th century, the town began to experience a period of growth and prosperity. The first bank was established in 1906, and the first telephone service was established in 1908. The first electric service was established in 1910.
In the mid-20th century, the town experienced a period of decline. The population decreased from 1,500 in 1950 to 1,000 in 2000.
Economy
The economy of Piedmont is largely based on agriculture. The main crops grown are corn, wheat, and oats. The town also has a small manufacturing sector, which produces furniture, clothing, and other goods.
The town also has a small tourism industry. The town is home to several historic sites, including the Piedmont Historical Museum and the Piedmont Opera House.
Demographics
As of the 2010 census, the population of Piedmont was 1,000. The racial makeup of the town was 97.2% White, 0.7% African American, 0.2% Native American, 0.2% Asian, 0.2% from other races, and 1.7% from two or more races. Hispanic or Latino of any race were 0.7% of the population.
The median income for a household in Piedmont was $30,000, and the median income for a family was $35,000. The per capita income for the town was $15,000. About 15.7% of families and 18.2% of the population were below the poverty line, including 25.0% of those under age 18 and 10.0% of those age 65 or over.
Conclusion
Piedmont, Missouri is a small town located in the Ozark Mountains of the southeastern corner of the state. It is situated in Wayne County, and is the county seat. The town was founded in 1871 and has a population of approximately 1,000 people. The economy of Piedmont is largely based on agriculture, with a small manufacturing and tourism sector. The racial makeup of the town is predominantly White, with a small percentage of African American, Native American, and Asian residents. The median income for a household in Piedmont is $30,000, and the median income for a family is $35,000.
Common Questions
What is Per Capita Income in Piedmont?
Per Capita income in Piedmont is $16,717.
What is the Median Family Income in Piedmont?
Median Family Income in Piedmont is $55,074.
What is the Median Household income in Piedmont?
Median Household Income in Piedmont is $35,341.
What is Inequality or Gini Index in Piedmont?
Inequality or Gini Index in Piedmont is 0.46.
What is the Total Population of Piedmont?
Total Population of Piedmont is 2,739.
What is the Total Male Population of Piedmont?
Total Male Population of Piedmont is 1,323.
What is the Total Female Population of Piedmont?
Total Female Population of Piedmont is 1,416.
What is the Ratio of Males per 100 Females in Piedmont?
There are 93.43 Males per 100 Females in Piedmont.
What is the Ratio of Females per 100 Males in Piedmont?
There are 107.03 Females per 100 Males in Piedmont.
What is the Median Population Age in Piedmont?
Median Population Age in Piedmont is 39.8 Years.
What is the Average Family Size in Piedmont
Average Family Size in Piedmont is 4.1 People.
What is the Average Household Size in Piedmont
Average Household Size in Piedmont is 2.7 People.
How Large is the Labor Force in Piedmont?
There are 804 People in the Labor Forcein in Piedmont.
What is the Percentage of People in the Labor Force in Piedmont?
37.4% of People are in the Labor Force in Piedmont.
What is the Unemployment Rate in Piedmont?
Unemployment Rate in Piedmont is 5.8%.