Perryville, MO Map & Demographics
Perryville Map
Perryville Overview
$26,684
PER CAPITA INCOME
$69,180
AVG FAMILY INCOME
$52,500
AVG HOUSEHOLD INCOME
37.5%
WAGE / INCOME GAP [ % ]
62.5¢/ $1
WAGE / INCOME GAP [ $ ]
0.43
INEQUALITY / GINI INDEX
8,536
TOTAL POPULATION
3,885
MALE POPULATION
4,651
FEMALE POPULATION
83.53
MALES / 100 FEMALES
119.72
FEMALES / 100 MALES
38.2
MEDIAN AGE
3.2
AVG FAMILY SIZE
2.6
AVG HOUSEHOLD SIZE
4,039
LABOR FORCE [ PEOPLE ]
61.1%
PERCENT IN LABOR FORCE
6.4%
UNEMPLOYMENT RATE
Perryville Zip Codes
Perryville Area Codes
Income in Perryville
Income Overview in Perryville
Per Capita Income in Perryville is $26,684, while median incomes of families and households are $69,180 and $52,500 respectively.
| Characteristic | Number | Measure |
| Per Capita Income | 8,536 | $26,684 |
| Median Family Income | 1,991 | $69,180 |
| Mean Family Income | 1,991 | $80,535 |
| Median Household Income | 3,204 | $52,500 |
| Mean Household Income | 3,204 | $67,646 |
| Income Deficit | 1,991 | $0 |
| Wage / Income Gap (%) | 8,536 | 37.47% |
| Wage / Income Gap ($) | 8,536 | 62.53¢ per $1 |
| Gini / Inequality Index | 8,536 | 0.43 |
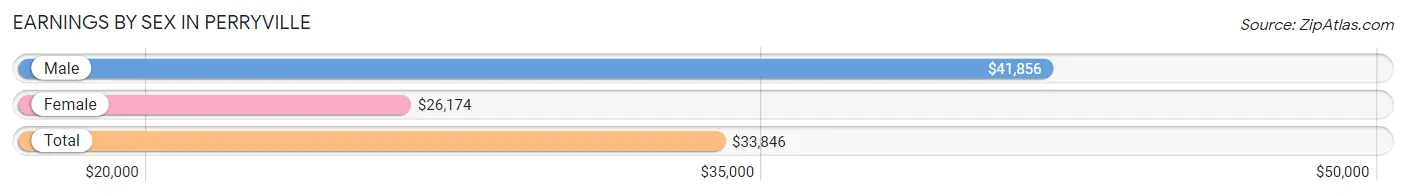
Earnings by Sex in Perryville
Average Earnings in Perryville are $33,846, $41,856 for men and $26,174 for women, a difference of 37.5%.
| Sex | Number | Average Earnings |
| Male | 2,029 (48.4%) | $41,856 |
| Female | 2,165 (51.6%) | $26,174 |
| Total | 4,194 (100.0%) | $33,846 |
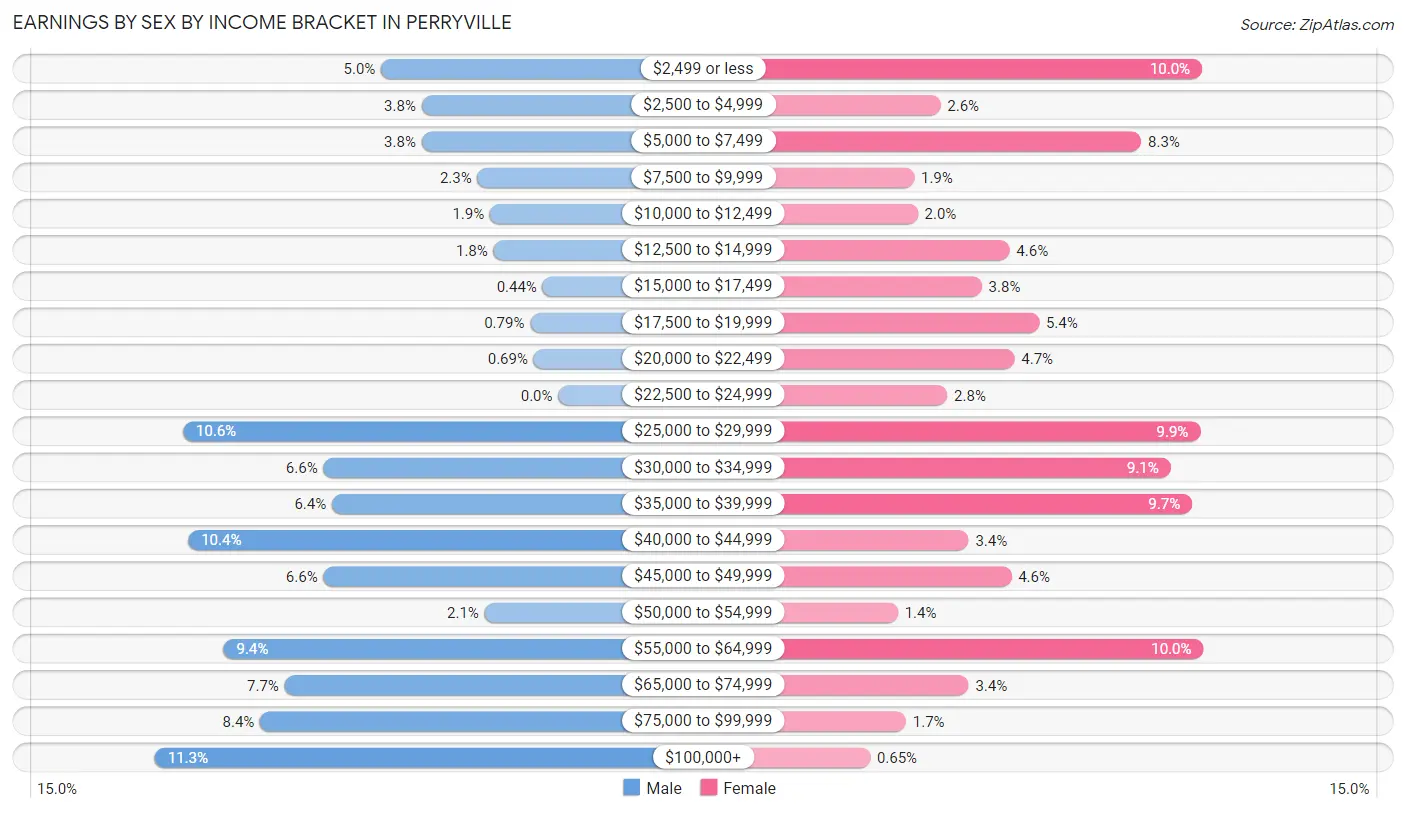
Earnings by Sex by Income Bracket in Perryville
The most common earnings brackets in Perryville are $100,000+ for men (230 | 11.3%) and $55,000 to $64,999 for women (217 | 10.0%).
| Income | Male | Female |
| $2,499 or less | 101 (5.0%) | 216 (10.0%) |
| $2,500 to $4,999 | 78 (3.8%) | 57 (2.6%) |
| $5,000 to $7,499 | 78 (3.8%) | 179 (8.3%) |
| $7,500 to $9,999 | 46 (2.3%) | 41 (1.9%) |
| $10,000 to $12,499 | 39 (1.9%) | 43 (2.0%) |
| $12,500 to $14,999 | 37 (1.8%) | 99 (4.6%) |
| $15,000 to $17,499 | 9 (0.4%) | 82 (3.8%) |
| $17,500 to $19,999 | 16 (0.8%) | 117 (5.4%) |
| $20,000 to $22,499 | 14 (0.7%) | 102 (4.7%) |
| $22,500 to $24,999 | 0 (0.0%) | 61 (2.8%) |
| $25,000 to $29,999 | 214 (10.5%) | 215 (9.9%) |
| $30,000 to $34,999 | 134 (6.6%) | 197 (9.1%) |
| $35,000 to $39,999 | 129 (6.4%) | 210 (9.7%) |
| $40,000 to $44,999 | 211 (10.4%) | 74 (3.4%) |
| $45,000 to $49,999 | 134 (6.6%) | 100 (4.6%) |
| $50,000 to $54,999 | 42 (2.1%) | 31 (1.4%) |
| $55,000 to $64,999 | 191 (9.4%) | 217 (10.0%) |
| $65,000 to $74,999 | 156 (7.7%) | 74 (3.4%) |
| $75,000 to $99,999 | 170 (8.4%) | 36 (1.7%) |
| $100,000+ | 230 (11.3%) | 14 (0.6%) |
| Total | 2,029 (100.0%) | 2,165 (100.0%) |
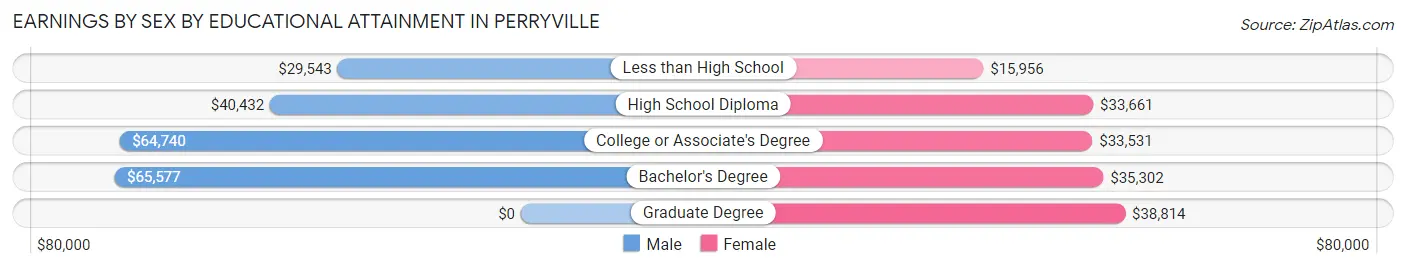
Earnings by Sex by Educational Attainment in Perryville
Average earnings in Perryville are $44,225 for men and $33,078 for women, a difference of 25.2%. Men with an educational attainment of bachelor's degree enjoy the highest average annual earnings of $65,577, while those with less than high school education earn the least with $29,543. Women with an educational attainment of graduate degree earn the most with the average annual earnings of $38,814, while those with less than high school education have the smallest earnings of $15,956.
| Educational Attainment | Male Income | Female Income |
| Less than High School | $29,543 | $15,956 |
| High School Diploma | $40,432 | $33,661 |
| College or Associate's Degree | $64,740 | $33,531 |
| Bachelor's Degree | $65,577 | $35,302 |
| Graduate Degree | - | - |
| Total | $44,225 | $33,078 |
Family Income in Perryville
Family Income Brackets in Perryville
According to the Perryville family income data, there are 418 families falling into the $100,000 to $149,999 income range, which is the most common income bracket and makes up 21.0% of all families. Conversely, the $10,000 to $14,999 income bracket is the least frequent group with only 16 families (0.8%) belonging to this category.
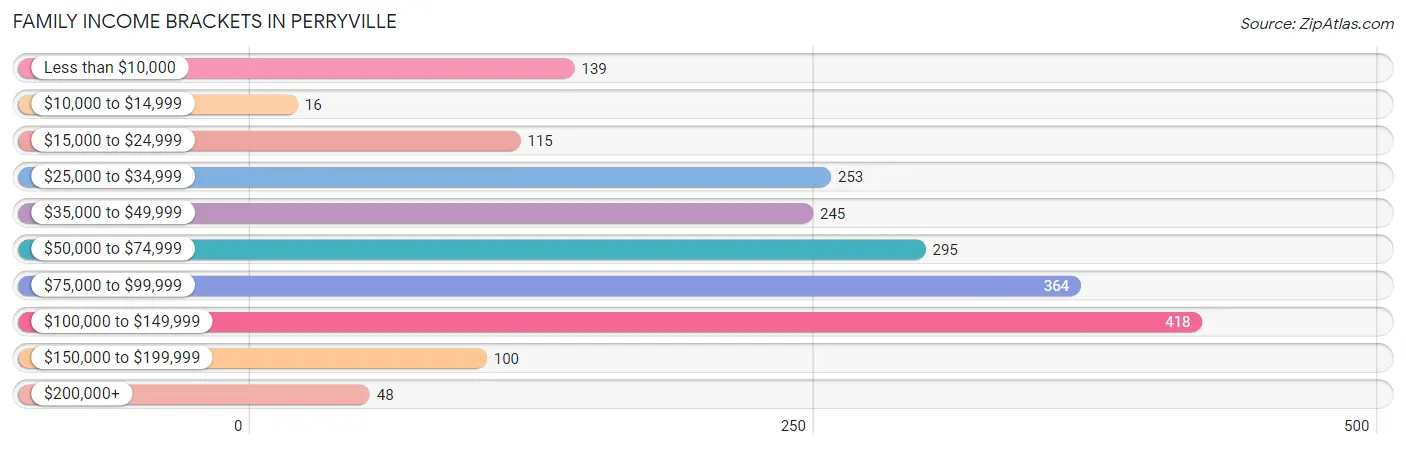
| Income Bracket | # Families | % Families |
| Less than $10,000 | 139 | 7.0% |
| $10,000 to $14,999 | 16 | 0.8% |
| $15,000 to $24,999 | 115 | 5.8% |
| $25,000 to $34,999 | 253 | 12.7% |
| $35,000 to $49,999 | 245 | 12.3% |
| $50,000 to $74,999 | 295 | 14.8% |
| $75,000 to $99,999 | 364 | 18.3% |
| $100,000 to $149,999 | 418 | 21.0% |
| $150,000 to $199,999 | 100 | 5.0% |
| $200,000+ | 48 | 2.4% |
Family Income by Famaliy Size in Perryville
5-person families (265 | 13.3%) account for the highest median family income in Perryville with $86,250 per family, while 3-person families (432 | 21.7%) have the highest median income of $28,185 per family member.
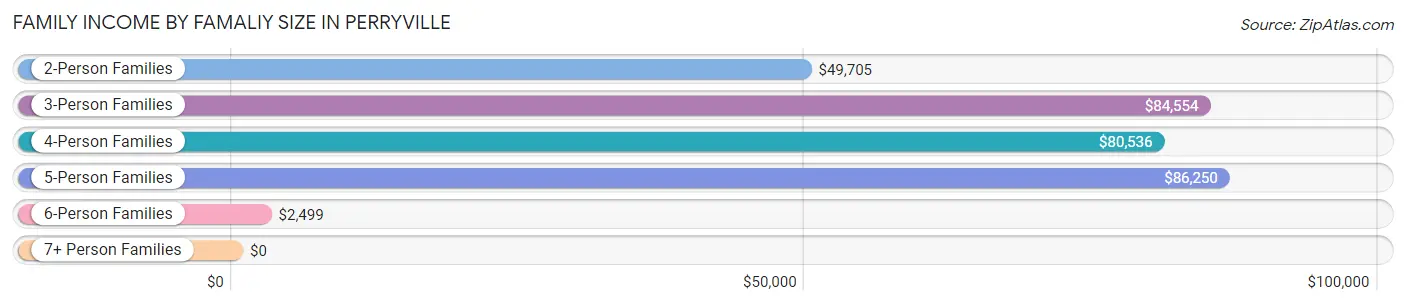
| Income Bracket | # Families | Median Income |
| 2-Person Families | 993 (49.9%) | $49,705 |
| 3-Person Families | 432 (21.7%) | $84,554 |
| 4-Person Families | 249 (12.5%) | $80,536 |
| 5-Person Families | 265 (13.3%) | $86,250 |
| 6-Person Families | 35 (1.8%) | $2,499 |
| 7+ Person Families | 17 (0.9%) | $0 |
| Total | 1,991 (100.0%) | $69,180 |
Family Income by Number of Earners in Perryville
The median family income in Perryville is $69,180, with families comprising 3+ earners (167) having the highest median family income of $102,440, while families with no earners (288) have the lowest median family income of $32,632, accounting for 8.4% and 14.5% of families, respectively.
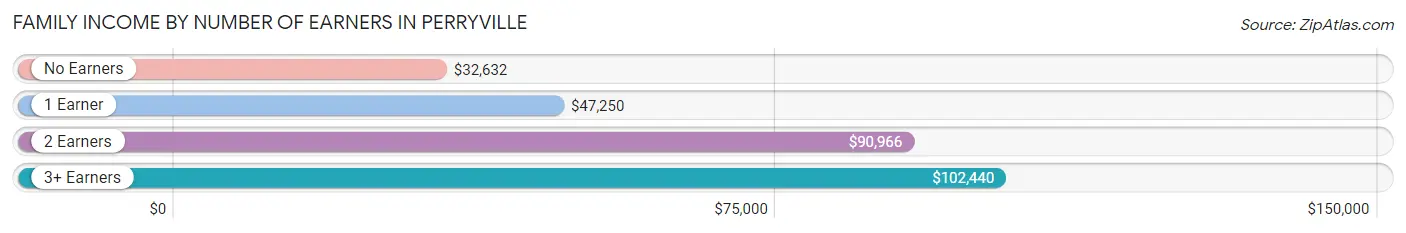
| Number of Earners | # Families | Median Income |
| No Earners | 288 (14.5%) | $32,632 |
| 1 Earner | 693 (34.8%) | $47,250 |
| 2 Earners | 843 (42.3%) | $90,966 |
| 3+ Earners | 167 (8.4%) | $102,440 |
| Total | 1,991 (100.0%) | $69,180 |
Household Income in Perryville
Household Income Brackets in Perryville
With 554 households falling in the category, the $50,000 to $74,999 income range is the most frequent in Perryville, accounting for 17.3% of all households. In contrast, only 74 households (2.3%) fall into the $200,000+ income bracket, making it the least populous group.
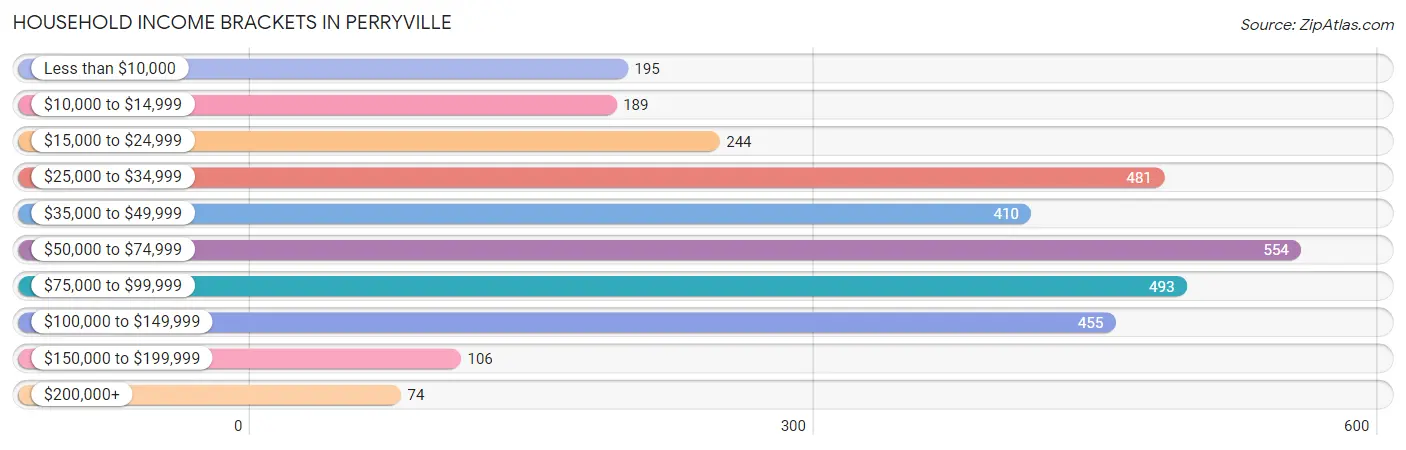
| Income Bracket | # Households | % Households |
| Less than $10,000 | 195 | 6.1% |
| $10,000 to $14,999 | 189 | 5.9% |
| $15,000 to $24,999 | 244 | 7.6% |
| $25,000 to $34,999 | 481 | 15.0% |
| $35,000 to $49,999 | 410 | 12.8% |
| $50,000 to $74,999 | 554 | 17.3% |
| $75,000 to $99,999 | 493 | 15.4% |
| $100,000 to $149,999 | 455 | 14.2% |
| $150,000 to $199,999 | 106 | 3.3% |
| $200,000+ | 74 | 2.3% |
Household Income by Householder Age in Perryville
The median household income in Perryville is $52,500, with the highest median household income of $70,385 found in the 25 to 44 years age bracket for the primary householder. A total of 952 households (29.7%) fall into this category. Meanwhile, the 65+ years age bracket for the primary householder has the lowest median household income of $34,006, with 803 households (25.1%) in this group.
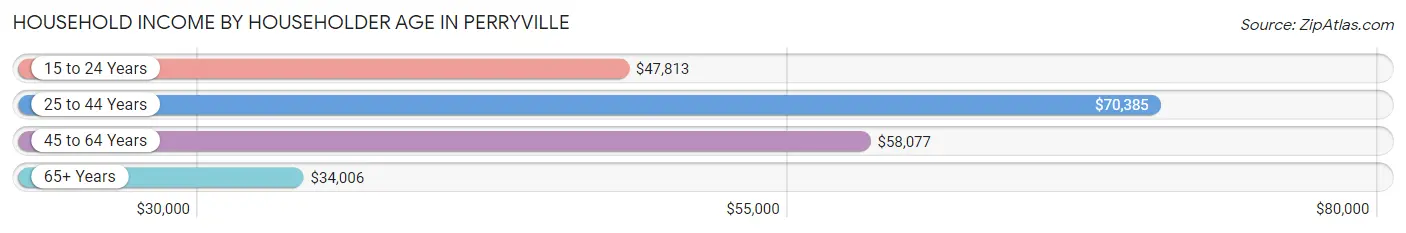
| Income Bracket | # Households | Median Income |
| 15 to 24 Years | 183 (5.7%) | $47,813 |
| 25 to 44 Years | 952 (29.7%) | $70,385 |
| 45 to 64 Years | 1,266 (39.5%) | $58,077 |
| 65+ Years | 803 (25.1%) | $34,006 |
| Total | 3,204 (100.0%) | $52,500 |
Poverty in Perryville
Income Below Poverty by Sex and Age in Perryville
With 16.6% poverty level for males and 18.5% for females among the residents of Perryville, 15 year old males and 5 year old females are the most vulnerable to poverty, with 55 males (71.4%) and 39 females (37.5%) in their respective age groups living below the poverty level.
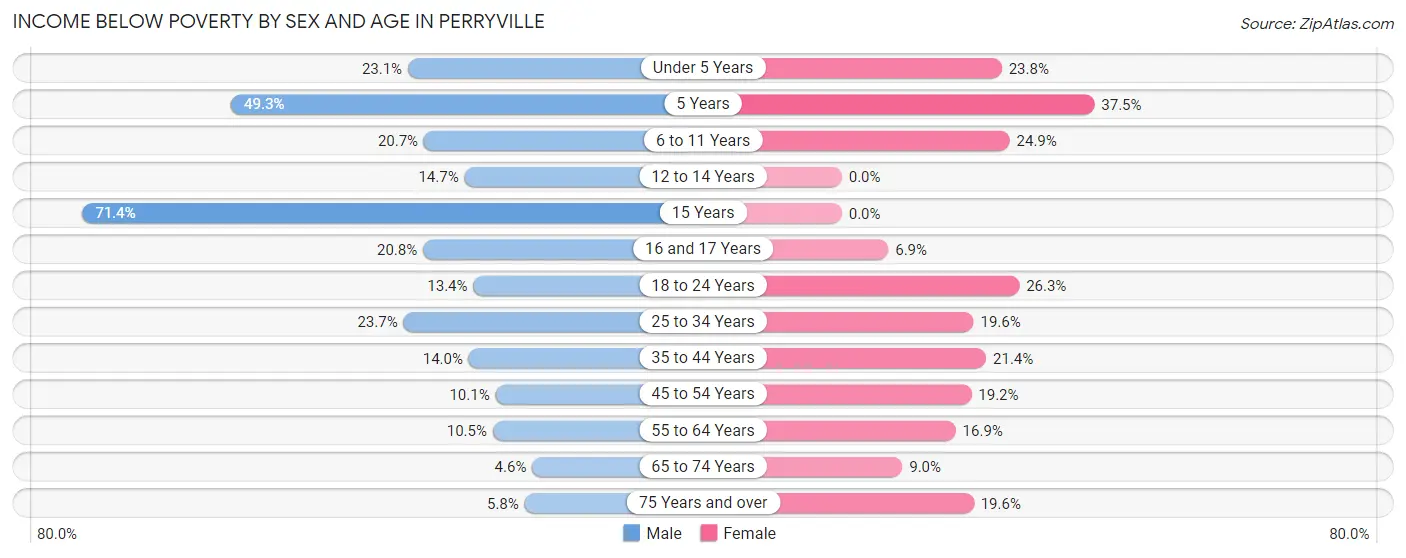
| Age Bracket | Male | Female |
| Under 5 Years | 63 (23.1%) | 57 (23.7%) |
| 5 Years | 36 (49.3%) | 39 (37.5%) |
| 6 to 11 Years | 77 (20.7%) | 79 (24.9%) |
| 12 to 14 Years | 16 (14.7%) | 0 (0.0%) |
| 15 Years | 55 (71.4%) | 0 (0.0%) |
| 16 and 17 Years | 15 (20.8%) | 10 (6.9%) |
| 18 to 24 Years | 39 (13.4%) | 123 (26.3%) |
| 25 to 34 Years | 132 (23.7%) | 99 (19.6%) |
| 35 to 44 Years | 72 (14.0%) | 114 (21.4%) |
| 45 to 54 Years | 49 (10.1%) | 86 (19.2%) |
| 55 to 64 Years | 48 (10.5%) | 117 (16.9%) |
| 65 to 74 Years | 12 (4.6%) | 37 (9.0%) |
| 75 Years and over | 13 (5.8%) | 57 (19.6%) |
| Total | 627 (16.6%) | 818 (18.5%) |
Income Above Poverty by Sex and Age in Perryville
According to the poverty statistics in Perryville, males aged 65 to 74 years and females aged 12 to 14 years are the age groups that are most secure financially, with 95.4% of males and 100.0% of females in these age groups living above the poverty line.
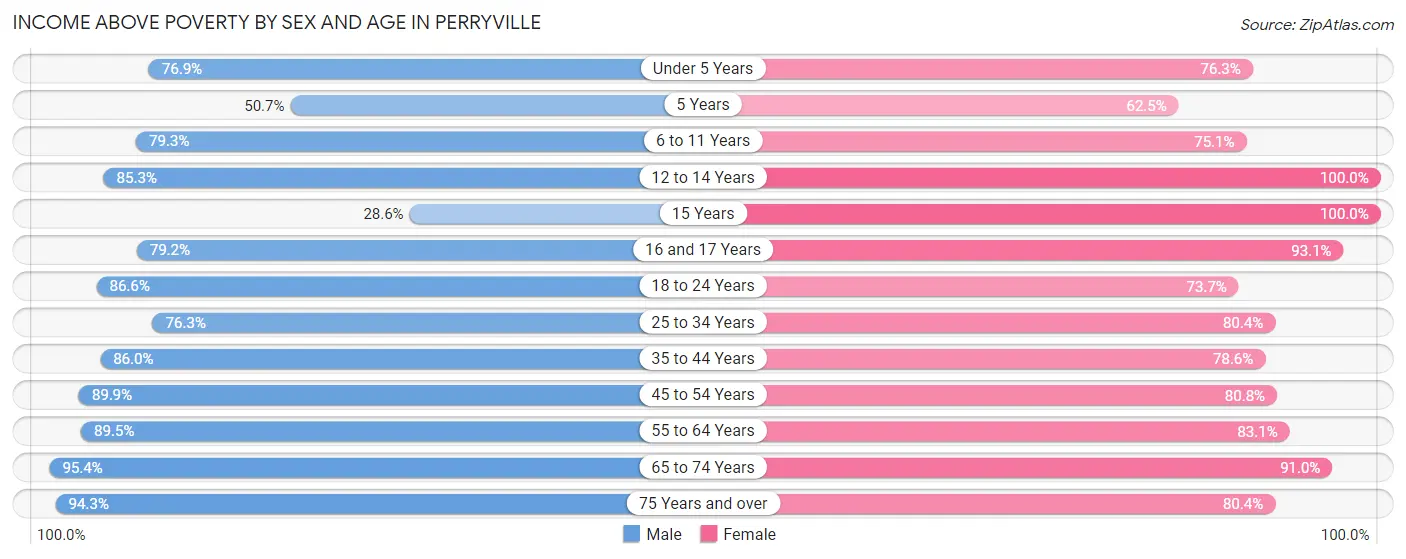
| Age Bracket | Male | Female |
| Under 5 Years | 210 (76.9%) | 183 (76.2%) |
| 5 Years | 37 (50.7%) | 65 (62.5%) |
| 6 to 11 Years | 295 (79.3%) | 238 (75.1%) |
| 12 to 14 Years | 93 (85.3%) | 239 (100.0%) |
| 15 Years | 22 (28.6%) | 35 (100.0%) |
| 16 and 17 Years | 57 (79.2%) | 135 (93.1%) |
| 18 to 24 Years | 253 (86.6%) | 344 (73.7%) |
| 25 to 34 Years | 424 (76.3%) | 407 (80.4%) |
| 35 to 44 Years | 441 (86.0%) | 418 (78.6%) |
| 45 to 54 Years | 437 (89.9%) | 361 (80.8%) |
| 55 to 64 Years | 410 (89.5%) | 575 (83.1%) |
| 65 to 74 Years | 248 (95.4%) | 375 (91.0%) |
| 75 Years and over | 213 (94.3%) | 234 (80.4%) |
| Total | 3,140 (83.4%) | 3,609 (81.5%) |
Income Below Poverty Among Married-Couple Families in Perryville
The poverty statistics for married-couple families in Perryville show that 5.8% or 81 of the total 1,408 families live below the poverty line. Families with 3 or 4 children have the highest poverty rate of 22.1%, comprising of 48 families. On the other hand, families with 5 or more children have the lowest poverty rate of 0.0%, which includes 0 families.
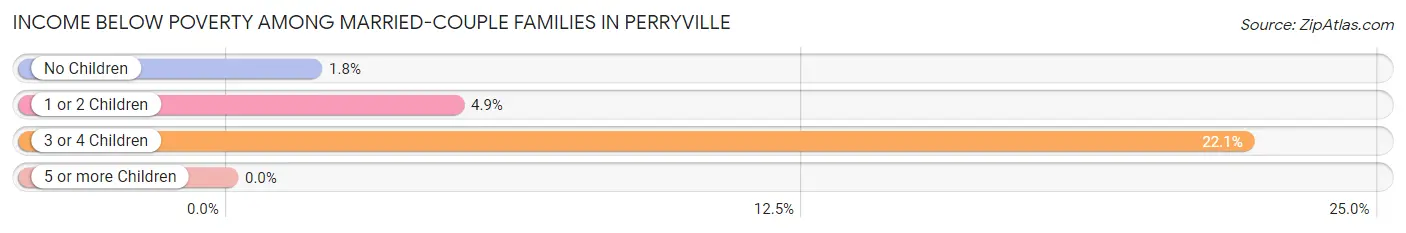
| Children | Above Poverty | Below Poverty |
| No Children | 804 (98.2%) | 15 (1.8%) |
| 1 or 2 Children | 348 (95.1%) | 18 (4.9%) |
| 3 or 4 Children | 169 (77.9%) | 48 (22.1%) |
| 5 or more Children | 6 (100.0%) | 0 (0.0%) |
| Total | 1,327 (94.3%) | 81 (5.8%) |
Income Below Poverty Among Single-Parent Households in Perryville
According to the poverty data in Perryville, 8.6% or 8 single-father households and 40.6% or 199 single-mother households are living below the poverty line. Among single-father households, those with no children have the highest poverty rate, with 8 households (16.0%) experiencing poverty. Likewise, among single-mother households, those with 3 or 4 children have the highest poverty rate, with 9 households (100.0%) falling below the poverty line.
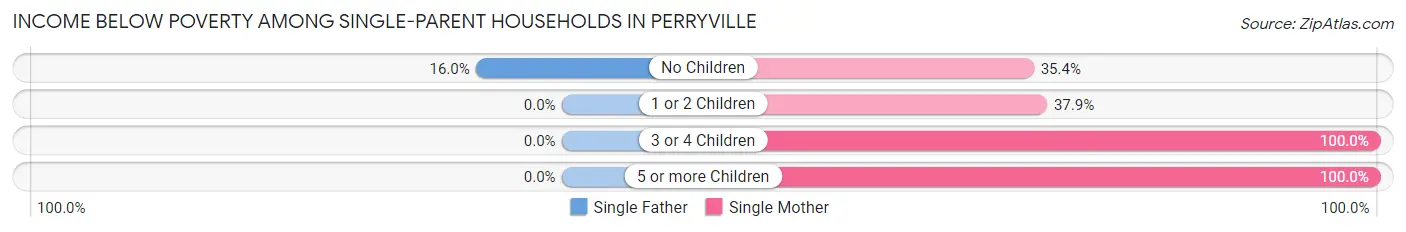
| Children | Single Father | Single Mother |
| No Children | 8 (16.0%) | 57 (35.4%) |
| 1 or 2 Children | 0 (0.0%) | 114 (37.9%) |
| 3 or 4 Children | 0 (0.0%) | 9 (100.0%) |
| 5 or more Children | 0 (0.0%) | 19 (100.0%) |
| Total | 8 (8.6%) | 199 (40.6%) |
Income Below Poverty Among Married-Couple vs Single-Parent Households in Perryville
The poverty data for Perryville shows that 81 of the married-couple family households (5.8%) and 207 of the single-parent households (35.5%) are living below the poverty level. Within the married-couple family households, those with 3 or 4 children have the highest poverty rate, with 48 households (22.1%) falling below the poverty line. Among the single-parent households, those with 3 or 4 children have the highest poverty rate, with 9 household (100.0%) living below poverty.
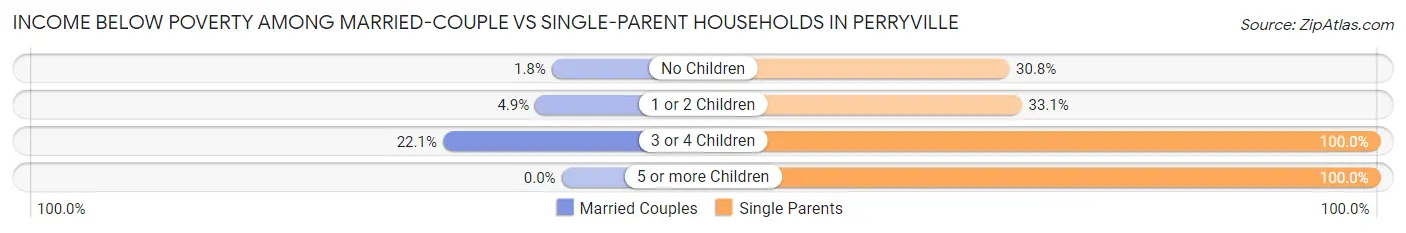
| Children | Married-Couple Families | Single-Parent Households |
| No Children | 15 (1.8%) | 65 (30.8%) |
| 1 or 2 Children | 18 (4.9%) | 114 (33.1%) |
| 3 or 4 Children | 48 (22.1%) | 9 (100.0%) |
| 5 or more Children | 0 (0.0%) | 19 (100.0%) |
| Total | 81 (5.8%) | 207 (35.5%) |
Race in Perryville
The most populous races in Perryville are White / Caucasian (7,790 | 91.3%), Two or more Races (425 | 5.0%), and Hispanic or Latino (347 | 4.1%).
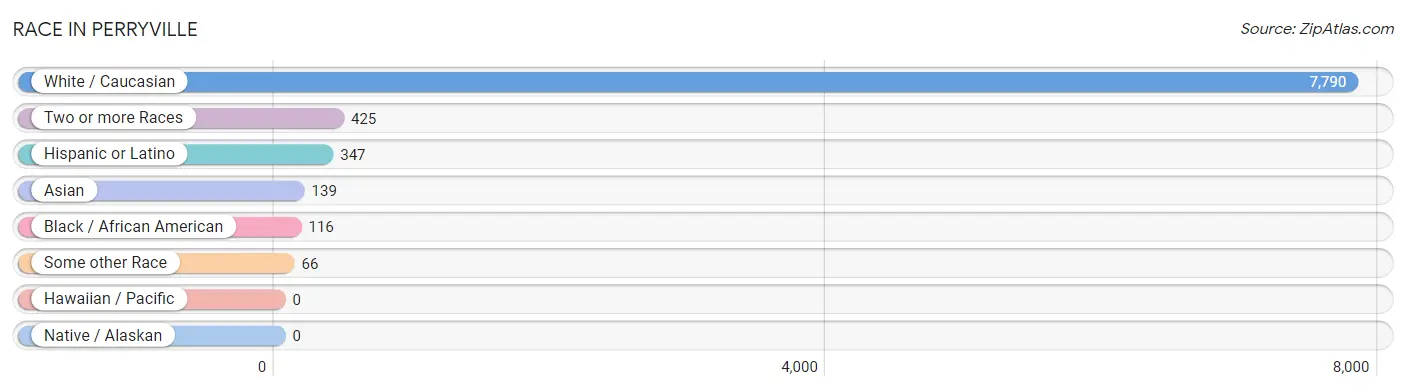
| Race | # Population | % Population |
| Asian | 139 | 1.6% |
| Black / African American | 116 | 1.4% |
| Hawaiian / Pacific | 0 | 0.0% |
| Hispanic or Latino | 347 | 4.1% |
| Native / Alaskan | 0 | 0.0% |
| White / Caucasian | 7,790 | 91.3% |
| Two or more Races | 425 | 5.0% |
| Some other Race | 66 | 0.8% |
| Total | 8,536 | 100.0% |
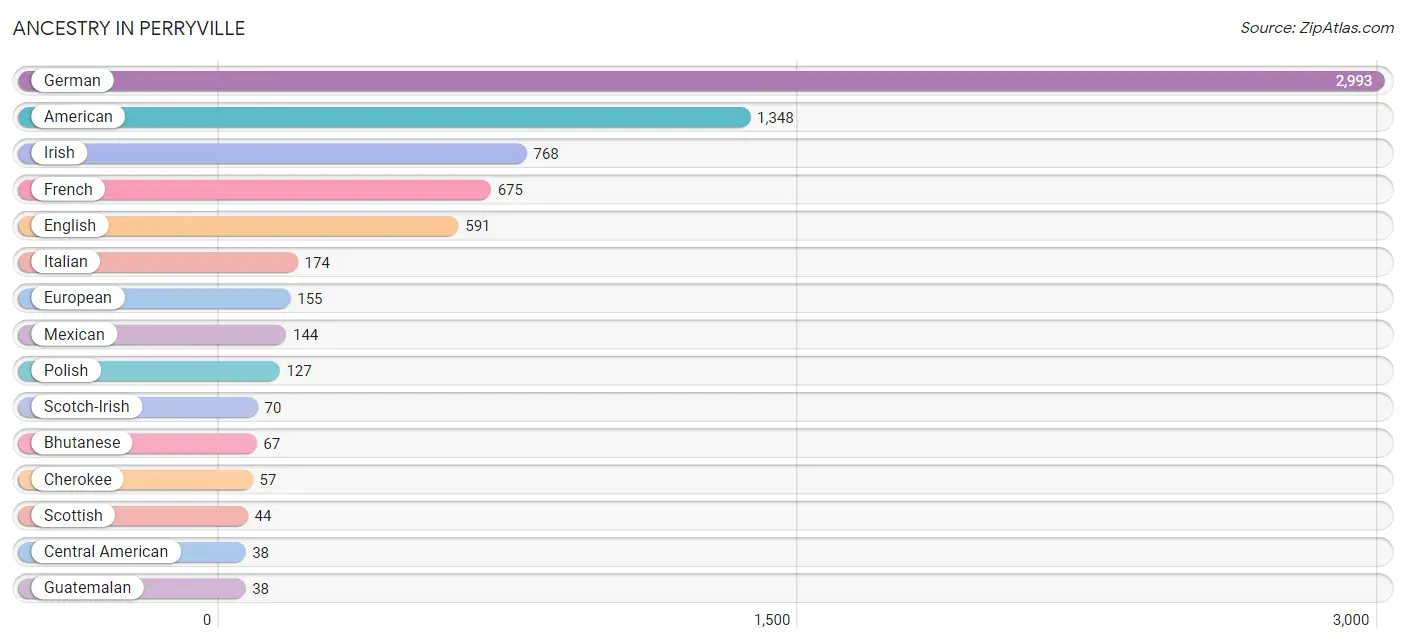
Ancestry in Perryville
The most populous ancestries reported in Perryville are German (2,993 | 35.1%), American (1,348 | 15.8%), Irish (768 | 9.0%), French (675 | 7.9%), and English (591 | 6.9%), together accounting for 74.7% of all Perryville residents.
| Ancestry | # Population | % Population |
| American | 1,348 | 15.8% |
| Austrian | 10 | 0.1% |
| Belgian | 19 | 0.2% |
| Bhutanese | 67 | 0.8% |
| British | 14 | 0.2% |
| Burmese | 21 | 0.3% |
| Canadian | 6 | 0.1% |
| Central American | 38 | 0.4% |
| Cherokee | 57 | 0.7% |
| Croatian | 22 | 0.3% |
| Cuban | 24 | 0.3% |
| Czech | 16 | 0.2% |
| Dutch | 26 | 0.3% |
| English | 591 | 6.9% |
| European | 155 | 1.8% |
| French | 675 | 7.9% |
| German | 2,993 | 35.1% |
| Guatemalan | 38 | 0.4% |
| Hungarian | 13 | 0.2% |
| Indian (Asian) | 16 | 0.2% |
| Irish | 768 | 9.0% |
| Italian | 174 | 2.0% |
| Korean | 24 | 0.3% |
| Mexican | 144 | 1.7% |
| Native Hawaiian | 31 | 0.4% |
| Norwegian | 29 | 0.3% |
| Polish | 127 | 1.5% |
| Romanian | 3 | 0.0% |
| Scandinavian | 22 | 0.3% |
| Scotch-Irish | 70 | 0.8% |
| Scottish | 44 | 0.5% |
| Spaniard | 5 | 0.1% |
| Sri Lankan | 11 | 0.1% |
| Swedish | 17 | 0.2% | View All 34 Rows |
Immigrants in Perryville
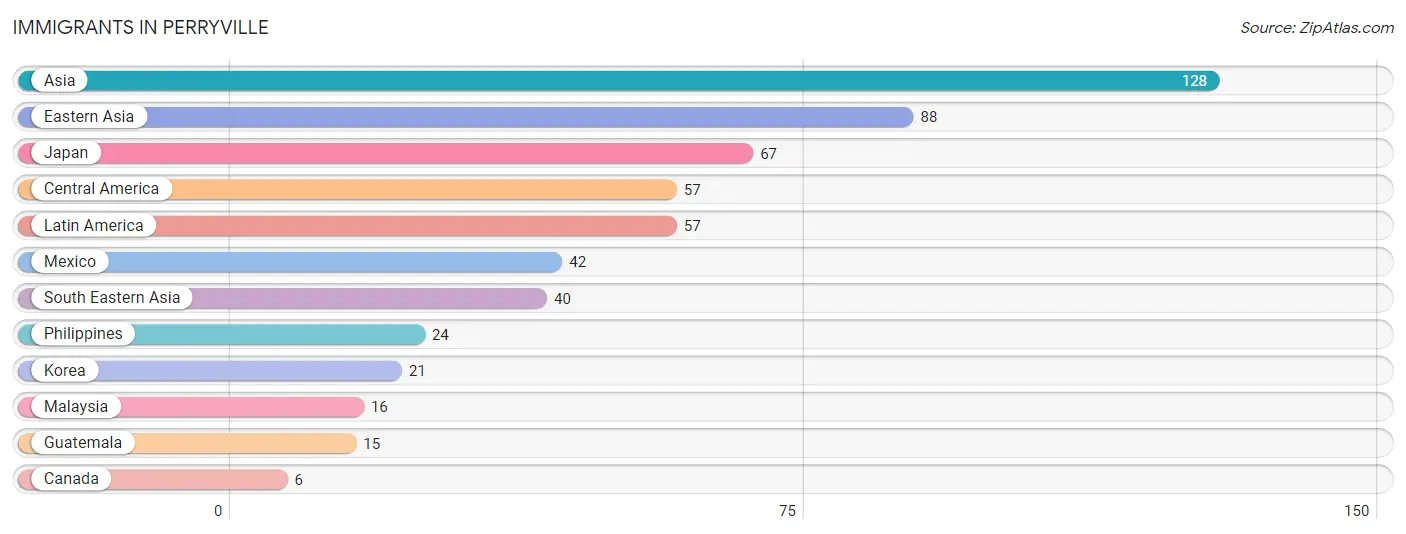
The most numerous immigrant groups reported in Perryville came from Asia (128 | 1.5%), Eastern Asia (88 | 1.0%), Japan (67 | 0.8%), Central America (57 | 0.7%), and Latin America (57 | 0.7%), together accounting for 4.6% of all Perryville residents.
| Immigration Origin | # Population | % Population |
| Asia | 128 | 1.5% |
| Canada | 6 | 0.1% |
| Central America | 57 | 0.7% |
| Eastern Asia | 88 | 1.0% |
| Guatemala | 15 | 0.2% |
| Japan | 67 | 0.8% |
| Korea | 21 | 0.3% |
| Latin America | 57 | 0.7% |
| Malaysia | 16 | 0.2% |
| Mexico | 42 | 0.5% |
| Philippines | 24 | 0.3% |
| South Eastern Asia | 40 | 0.5% | View All 12 Rows |
Sex and Age in Perryville
Sex and Age in Perryville
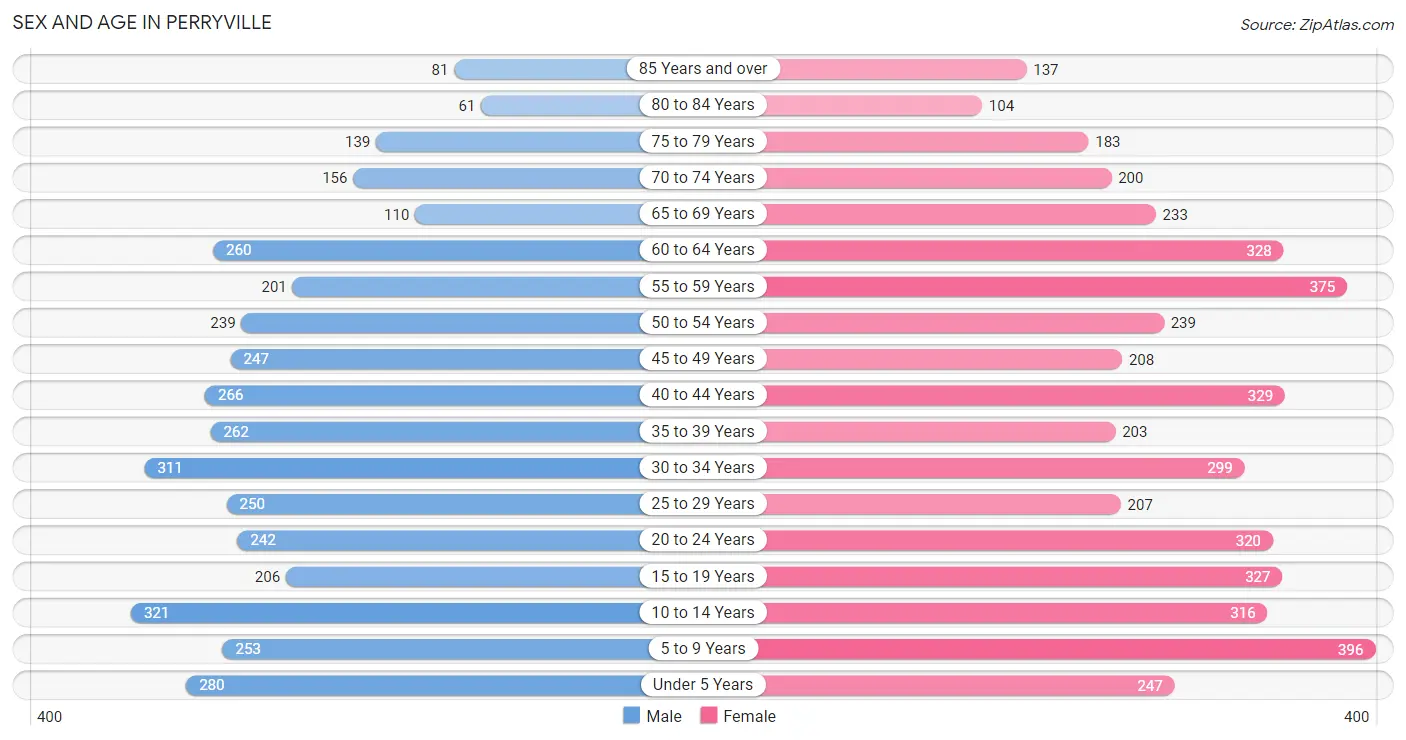
The most populous age groups in Perryville are 10 to 14 Years (321 | 8.3%) for men and 5 to 9 Years (396 | 8.5%) for women.
| Age Bracket | Male | Female |
| Under 5 Years | 280 (7.2%) | 247 (5.3%) |
| 5 to 9 Years | 253 (6.5%) | 396 (8.5%) |
| 10 to 14 Years | 321 (8.3%) | 316 (6.8%) |
| 15 to 19 Years | 206 (5.3%) | 327 (7.0%) |
| 20 to 24 Years | 242 (6.2%) | 320 (6.9%) |
| 25 to 29 Years | 250 (6.4%) | 207 (4.4%) |
| 30 to 34 Years | 311 (8.0%) | 299 (6.4%) |
| 35 to 39 Years | 262 (6.7%) | 203 (4.4%) |
| 40 to 44 Years | 266 (6.9%) | 329 (7.1%) |
| 45 to 49 Years | 247 (6.4%) | 208 (4.5%) |
| 50 to 54 Years | 239 (6.1%) | 239 (5.1%) |
| 55 to 59 Years | 201 (5.2%) | 375 (8.1%) |
| 60 to 64 Years | 260 (6.7%) | 328 (7.0%) |
| 65 to 69 Years | 110 (2.8%) | 233 (5.0%) |
| 70 to 74 Years | 156 (4.0%) | 200 (4.3%) |
| 75 to 79 Years | 139 (3.6%) | 183 (3.9%) |
| 80 to 84 Years | 61 (1.6%) | 104 (2.2%) |
| 85 Years and over | 81 (2.1%) | 137 (2.9%) |
| Total | 3,885 (100.0%) | 4,651 (100.0%) |
Families and Households in Perryville
Median Family Size in Perryville
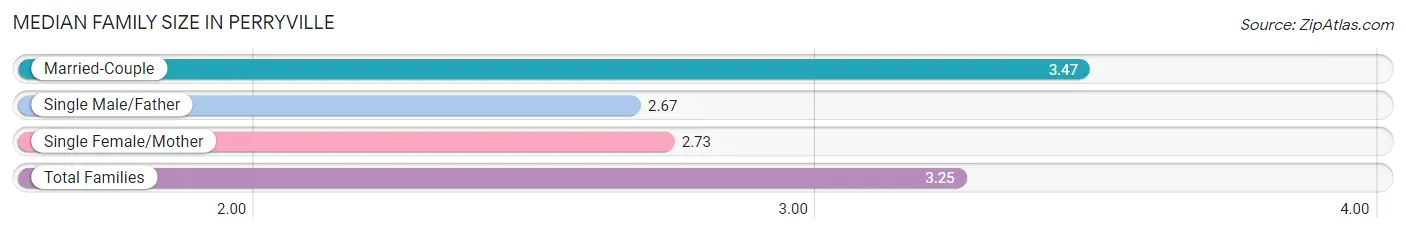
The median family size in Perryville is 3.25 persons per family, with married-couple families (1,408 | 70.7%) accounting for the largest median family size of 3.47 persons per family. On the other hand, single male/father families (93 | 4.7%) represent the smallest median family size with 2.67 persons per family.
| Family Type | # Families | Family Size |
| Married-Couple | 1,408 (70.7%) | 3.47 |
| Single Male/Father | 93 (4.7%) | 2.67 |
| Single Female/Mother | 490 (24.6%) | 2.73 |
| Total Families | 1,991 (100.0%) | 3.25 |
Median Household Size in Perryville
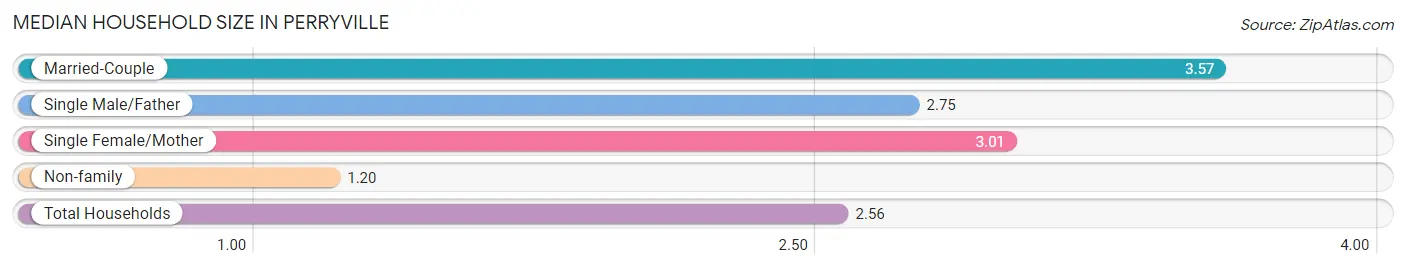
The median household size in Perryville is 2.56 persons per household, with married-couple households (1,408 | 44.0%) accounting for the largest median household size of 3.57 persons per household. non-family households (1,213 | 37.9%) represent the smallest median household size with 1.20 persons per household.
| Household Type | # Households | Household Size |
| Married-Couple | 1,408 (44.0%) | 3.57 |
| Single Male/Father | 93 (2.9%) | 2.75 |
| Single Female/Mother | 490 (15.3%) | 3.01 |
| Non-family | 1,213 (37.9%) | 1.20 |
| Total Households | 3,204 (100.0%) | 2.56 |
Household Size by Marriage Status in Perryville
Out of a total of 3,204 households in Perryville, 1,991 (62.1%) are family households, while 1,213 (37.9%) are nonfamily households. The most numerous type of family households are 2-person households, comprising 902, and the most common type of nonfamily households are 1-person households, comprising 1,017.
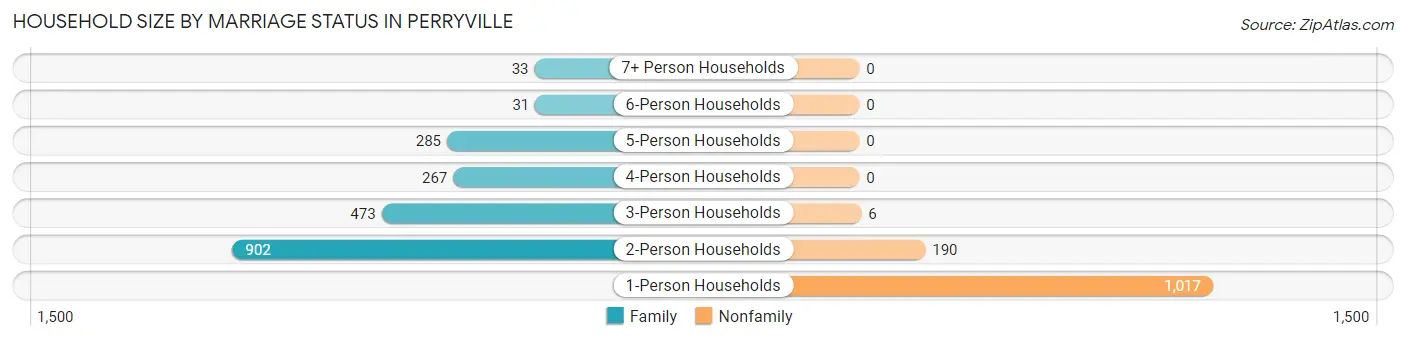
| Household Size | Family Households | Nonfamily Households |
| 1-Person Households | - | 1,017 (31.7%) |
| 2-Person Households | 902 (28.1%) | 190 (5.9%) |
| 3-Person Households | 473 (14.8%) | 6 (0.2%) |
| 4-Person Households | 267 (8.3%) | 0 (0.0%) |
| 5-Person Households | 285 (8.9%) | 0 (0.0%) |
| 6-Person Households | 31 (1.0%) | 0 (0.0%) |
| 7+ Person Households | 33 (1.0%) | 0 (0.0%) |
| Total | 1,991 (62.1%) | 1,213 (37.9%) |
Female Fertility in Perryville
Fertility by Age in Perryville
Average fertility rate in Perryville is 39.0 births per 1,000 women. Women in the age bracket of 20 to 34 years have the highest fertility rate with 90.0 births per 1,000 women. Women in the age bracket of 20 to 34 years acount for 100.0% of all women with births.
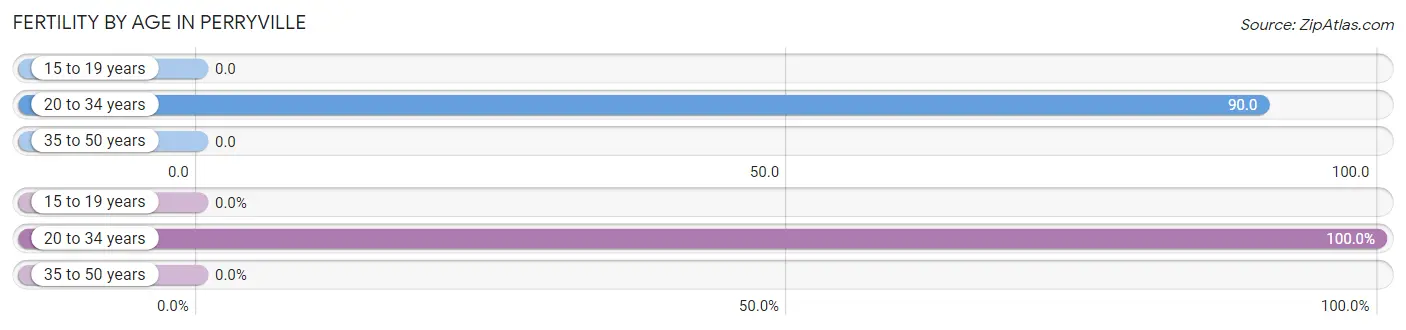
| Age Bracket | Women with Births | Births / 1,000 Women |
| 15 to 19 years | 0 (0.0%) | 0.0 |
| 20 to 34 years | 74 (100.0%) | 90.0 |
| 35 to 50 years | 0 (0.0%) | 0.0 |
| Total | 74 (100.0%) | 39.0 |
Fertility by Age by Marriage Status in Perryville
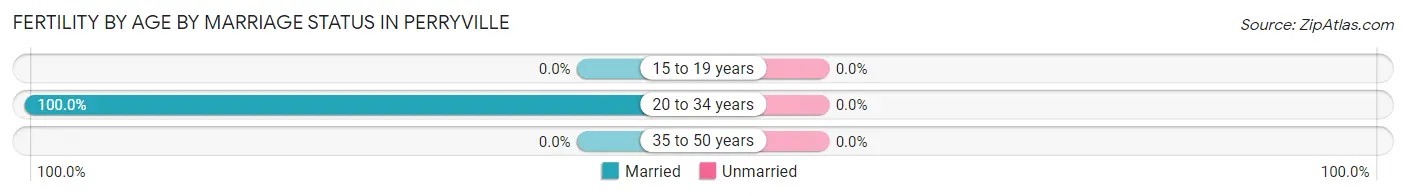
| Age Bracket | Married | Unmarried |
| 15 to 19 years | 0 (0.0%) | 0 (0.0%) |
| 20 to 34 years | 74 (100.0%) | 0 (0.0%) |
| 35 to 50 years | 0 (0.0%) | 0 (0.0%) |
| Total | 74 (100.0%) | 0 (0.0%) |
Fertility by Education in Perryville
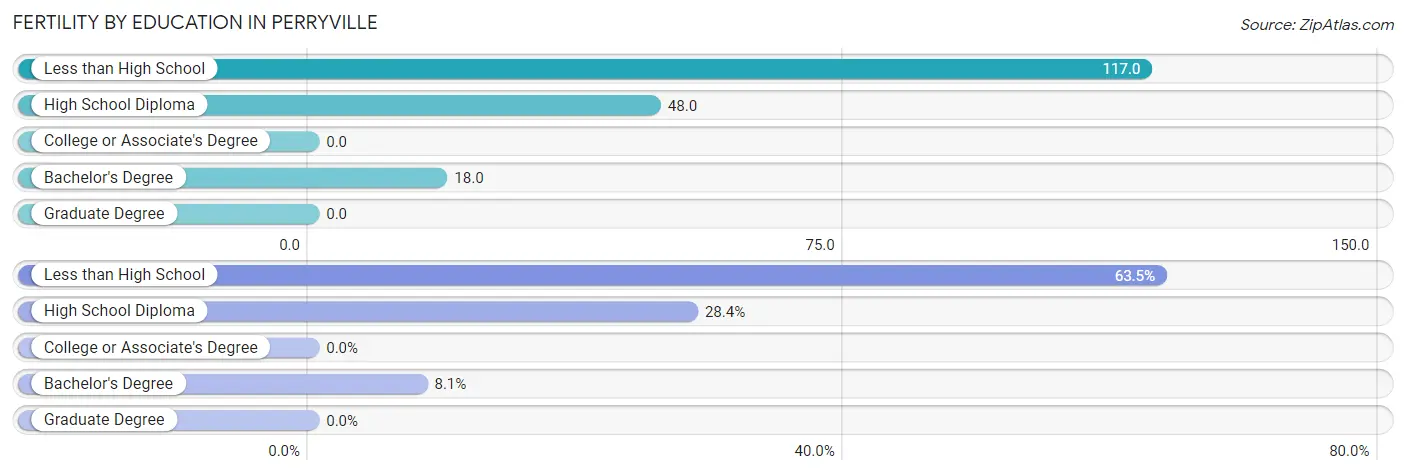
| Educational Attainment | Women with Births | Births / 1,000 Women |
| Less than High School | 47 (63.5%) | 117.0 |
| High School Diploma | 21 (28.4%) | 48.0 |
| College or Associate's Degree | 0 (0.0%) | 0.0 |
| Bachelor's Degree | 6 (8.1%) | 18.0 |
| Graduate Degree | 0 (0.0%) | 0.0 |
| Total | 74 (100.0%) | 39.0 |
Fertility by Education by Marriage Status in Perryville
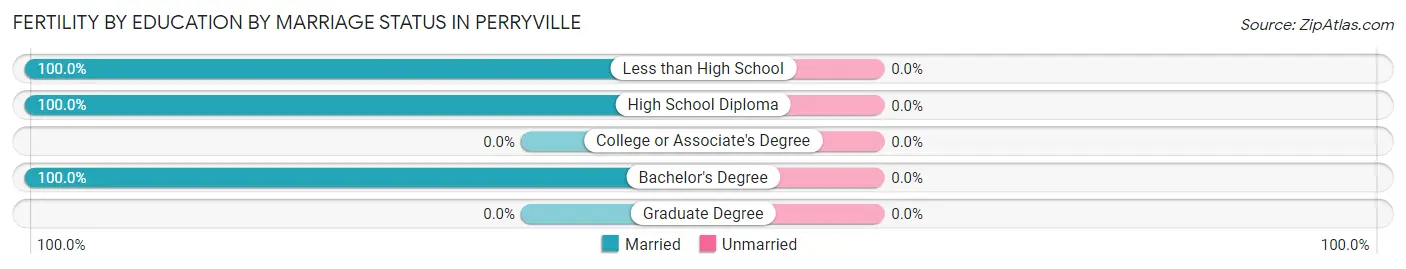
| Educational Attainment | Married | Unmarried |
| Less than High School | 47 (100.0%) | 0 (0.0%) |
| High School Diploma | 21 (100.0%) | 0 (0.0%) |
| College or Associate's Degree | 0 (0.0%) | 0 (0.0%) |
| Bachelor's Degree | 6 (100.0%) | 0 (0.0%) |
| Graduate Degree | 0 (0.0%) | 0 (0.0%) |
| Total | 74 (100.0%) | 0 (0.0%) |
Employment Characteristics in Perryville
Employment by Class of Employer in Perryville
Among the 3,718 employed individuals in Perryville, private company employees (2,704 | 72.7%), not-for-profit organizations (322 | 8.7%), and local government employees (253 | 6.8%) make up the most common classes of employment.
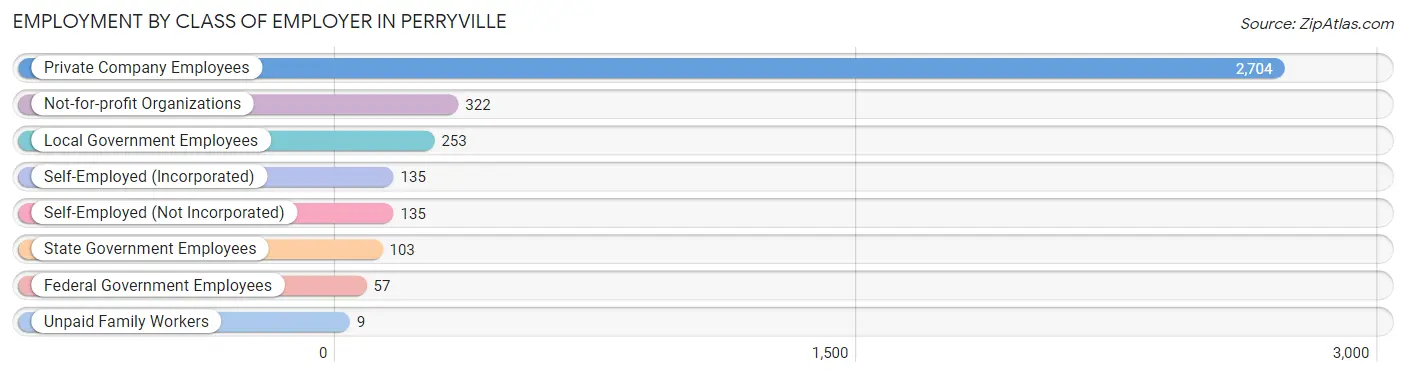
| Employer Class | # Employees | % Employees |
| Private Company Employees | 2,704 | 72.7% |
| Self-Employed (Incorporated) | 135 | 3.6% |
| Self-Employed (Not Incorporated) | 135 | 3.6% |
| Not-for-profit Organizations | 322 | 8.7% |
| Local Government Employees | 253 | 6.8% |
| State Government Employees | 103 | 2.8% |
| Federal Government Employees | 57 | 1.5% |
| Unpaid Family Workers | 9 | 0.2% |
| Total | 3,718 | 100.0% |
Employment Status by Age in Perryville
According to the labor force statistics for Perryville, out of the total population over 16 years of age (6,611), 61.1% or 4,039 individuals are in the labor force, with 6.4% or 258 of them unemployed. The age group with the highest labor force participation rate is 20 to 24 years, with 91.8% or 516 individuals in the labor force. Within the labor force, the 16 to 19 years age range has the highest percentage of unemployed individuals, with 35.6% or 48 of them being unemployed.
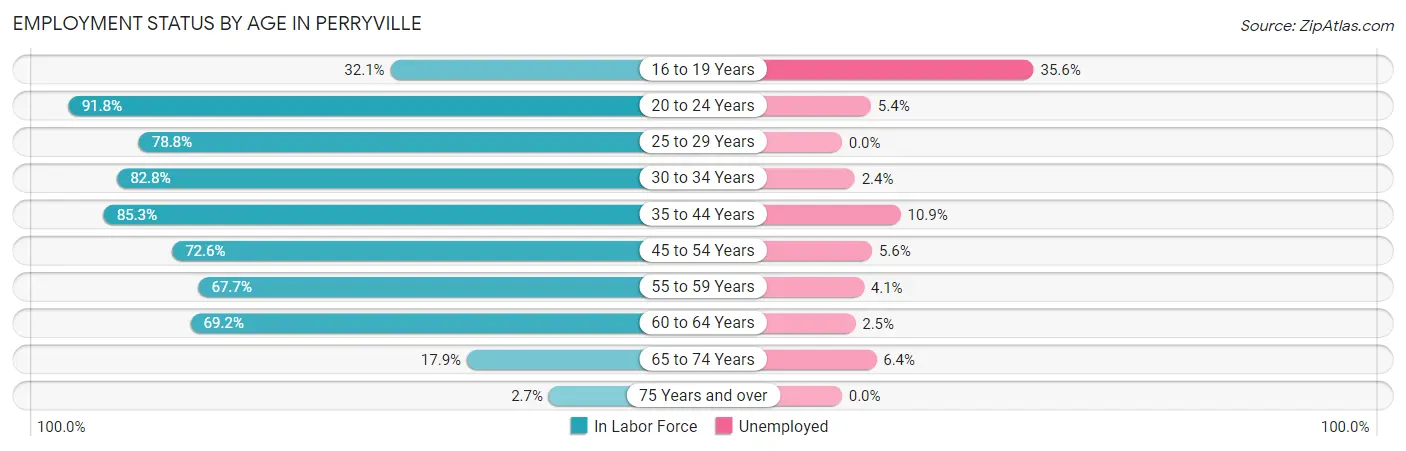
| Age Bracket | In Labor Force | Unemployed |
| 16 to 19 Years | 135 (32.1%) | 48 (35.6%) |
| 20 to 24 Years | 516 (91.8%) | 28 (5.4%) |
| 25 to 29 Years | 360 (78.8%) | 0 (0.0%) |
| 30 to 34 Years | 505 (82.8%) | 12 (2.4%) |
| 35 to 44 Years | 904 (85.3%) | 99 (10.9%) |
| 45 to 54 Years | 677 (72.6%) | 38 (5.6%) |
| 55 to 59 Years | 390 (67.7%) | 16 (4.1%) |
| 60 to 64 Years | 407 (69.2%) | 10 (2.5%) |
| 65 to 74 Years | 125 (17.9%) | 8 (6.4%) |
| 75 Years and over | 19 (2.7%) | 0 (0.0%) |
| Total | 4,039 (61.1%) | 258 (6.4%) |
Employment Status by Educational Attainment in Perryville
According to labor force statistics for Perryville, 76.8% of individuals (3,244) out of the total population between 25 and 64 years of age (4,224) are in the labor force, with 5.3% or 172 of them being unemployed. The group with the highest labor force participation rate are those with the educational attainment of bachelor's degree or higher, with 84.4% or 768 individuals in the labor force. Within the labor force, individuals with college / associate degree education have the highest percentage of unemployment, with 9.4% or 83 of them being unemployed.
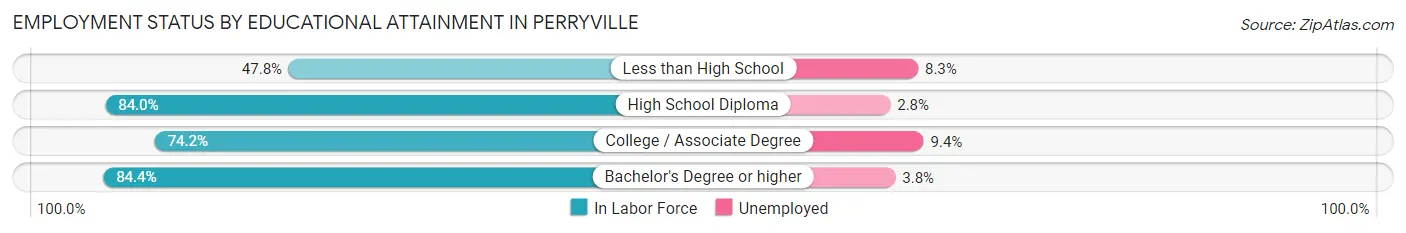
| Educational Attainment | In Labor Force | Unemployed |
| Less than High School | 253 (47.8%) | 44 (8.3%) |
| High School Diploma | 1,336 (84.0%) | 45 (2.8%) |
| College / Associate Degree | 886 (74.2%) | 112 (9.4%) |
| Bachelor's Degree or higher | 768 (84.4%) | 35 (3.8%) |
| Total | 3,244 (76.8%) | 224 (5.3%) |
Employment Occupations by Sex in Perryville
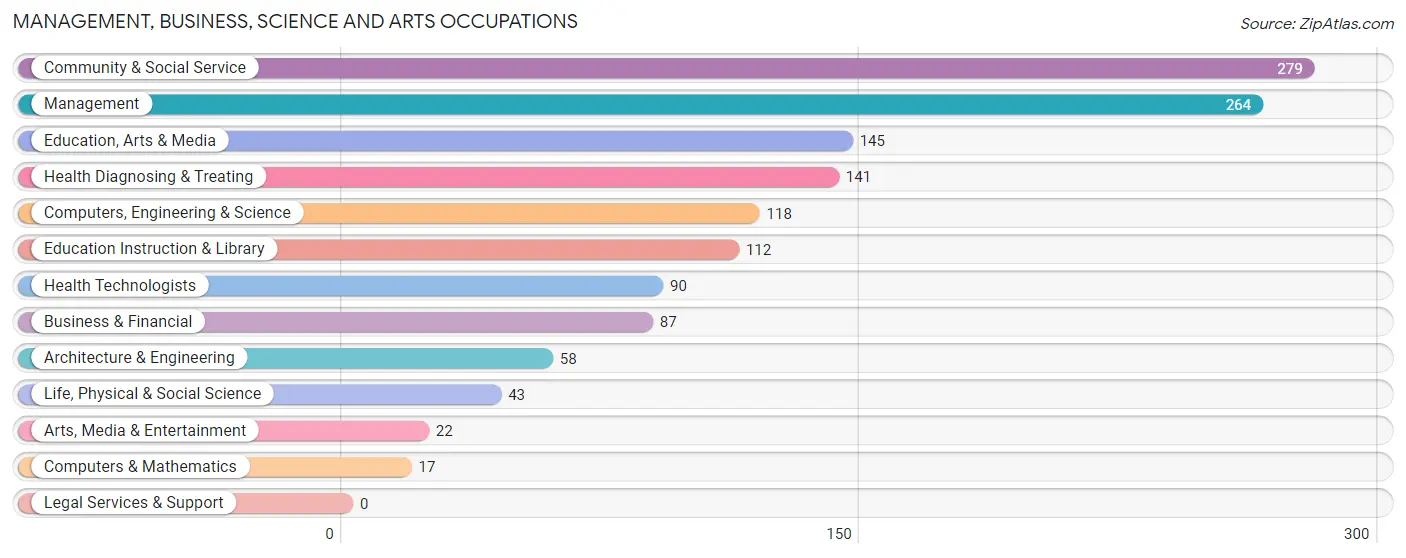
Management, Business, Science and Arts Occupations
The most common Management, Business, Science and Arts occupations in Perryville are Community & Social Service (279 | 7.4%), Management (264 | 7.0%), Education, Arts & Media (145 | 3.9%), Health Diagnosing & Treating (141 | 3.8%), and Computers, Engineering & Science (118 | 3.2%).
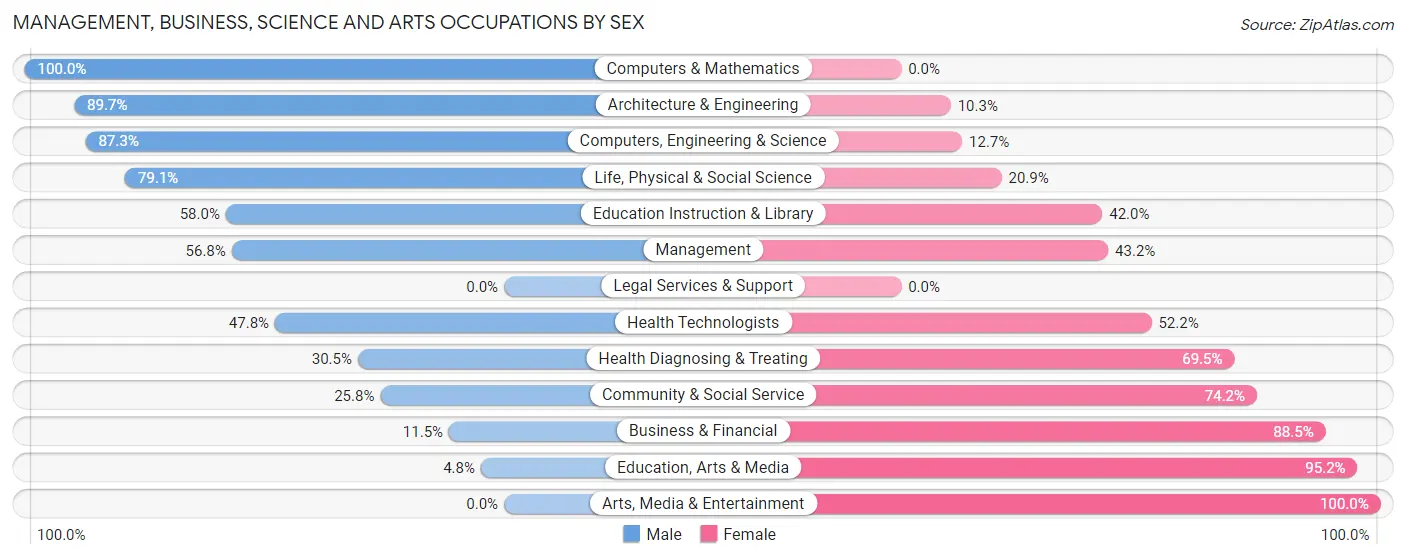
Management, Business, Science and Arts Occupations by Sex
Within the Management, Business, Science and Arts occupations in Perryville, the most male-oriented occupations are Computers & Mathematics (100.0%), Architecture & Engineering (89.7%), and Computers, Engineering & Science (87.3%), while the most female-oriented occupations are Arts, Media & Entertainment (100.0%), Education, Arts & Media (95.2%), and Business & Financial (88.5%).
| Occupation | Male | Female |
| Management | 150 (56.8%) | 114 (43.2%) |
| Business & Financial | 10 (11.5%) | 77 (88.5%) |
| Computers, Engineering & Science | 103 (87.3%) | 15 (12.7%) |
| Computers & Mathematics | 17 (100.0%) | 0 (0.0%) |
| Architecture & Engineering | 52 (89.7%) | 6 (10.3%) |
| Life, Physical & Social Science | 34 (79.1%) | 9 (20.9%) |
| Community & Social Service | 72 (25.8%) | 207 (74.2%) |
| Education, Arts & Media | 7 (4.8%) | 138 (95.2%) |
| Legal Services & Support | 0 (0.0%) | 0 (0.0%) |
| Education Instruction & Library | 65 (58.0%) | 47 (42.0%) |
| Arts, Media & Entertainment | 0 (0.0%) | 22 (100.0%) |
| Health Diagnosing & Treating | 43 (30.5%) | 98 (69.5%) |
| Health Technologists | 43 (47.8%) | 47 (52.2%) |
| Total (Category) | 378 (42.5%) | 511 (57.5%) |
| Total (Overall) | 1,850 (49.4%) | 1,894 (50.6%) |
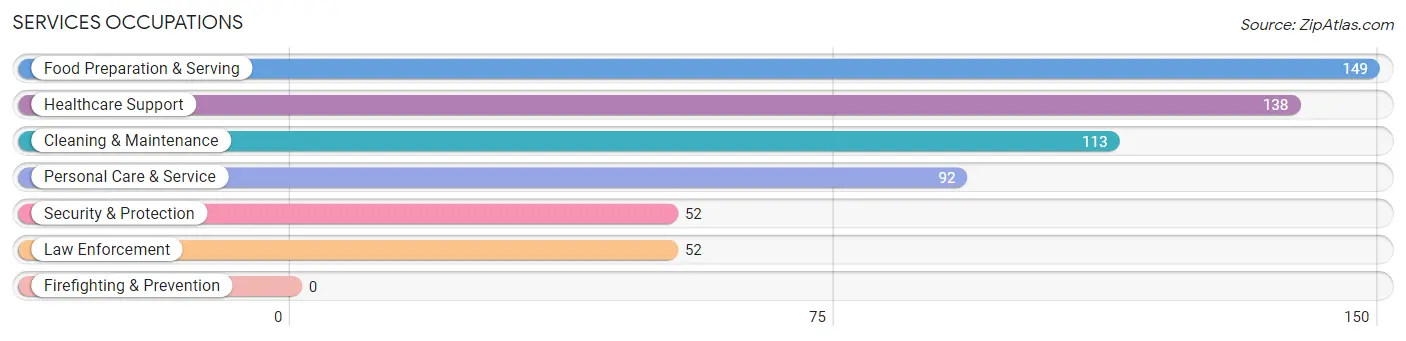
Services Occupations
The most common Services occupations in Perryville are Food Preparation & Serving (149 | 4.0%), Healthcare Support (138 | 3.7%), Cleaning & Maintenance (113 | 3.0%), Personal Care & Service (92 | 2.5%), and Security & Protection (52 | 1.4%).
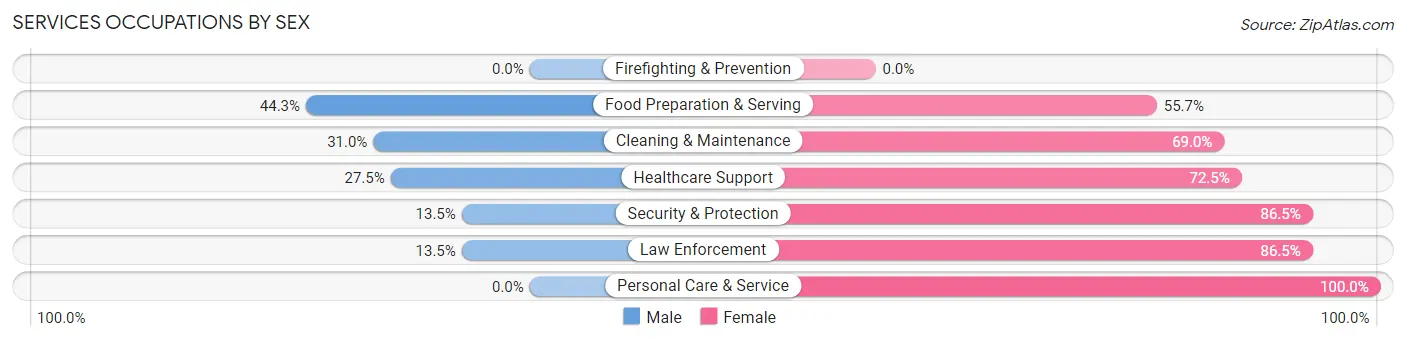
Services Occupations by Sex
Within the Services occupations in Perryville, the most male-oriented occupations are Food Preparation & Serving (44.3%), Cleaning & Maintenance (31.0%), and Healthcare Support (27.5%), while the most female-oriented occupations are Personal Care & Service (100.0%), Security & Protection (86.5%), and Law Enforcement (86.5%).
| Occupation | Male | Female |
| Healthcare Support | 38 (27.5%) | 100 (72.5%) |
| Security & Protection | 7 (13.5%) | 45 (86.5%) |
| Firefighting & Prevention | 0 (0.0%) | 0 (0.0%) |
| Law Enforcement | 7 (13.5%) | 45 (86.5%) |
| Food Preparation & Serving | 66 (44.3%) | 83 (55.7%) |
| Cleaning & Maintenance | 35 (31.0%) | 78 (69.0%) |
| Personal Care & Service | 0 (0.0%) | 92 (100.0%) |
| Total (Category) | 146 (26.8%) | 398 (73.2%) |
| Total (Overall) | 1,850 (49.4%) | 1,894 (50.6%) |
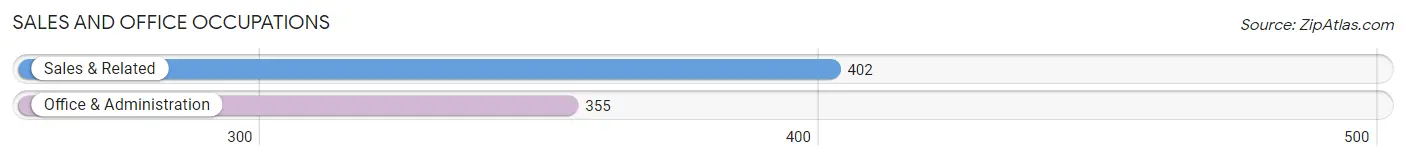
Sales and Office Occupations
The most common Sales and Office occupations in Perryville are Sales & Related (402 | 10.7%), and Office & Administration (355 | 9.5%).
Sales and Office Occupations by Sex
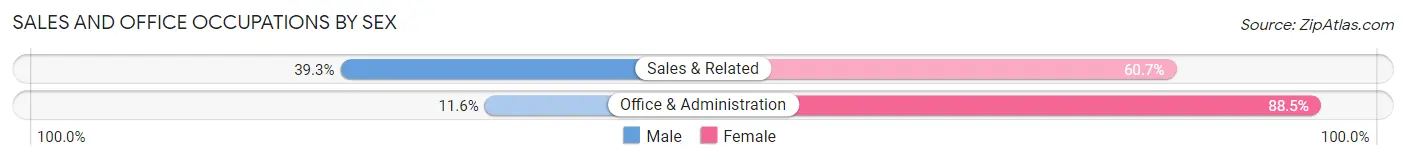
| Occupation | Male | Female |
| Sales & Related | 158 (39.3%) | 244 (60.7%) |
| Office & Administration | 41 (11.6%) | 314 (88.4%) |
| Total (Category) | 199 (26.3%) | 558 (73.7%) |
| Total (Overall) | 1,850 (49.4%) | 1,894 (50.6%) |
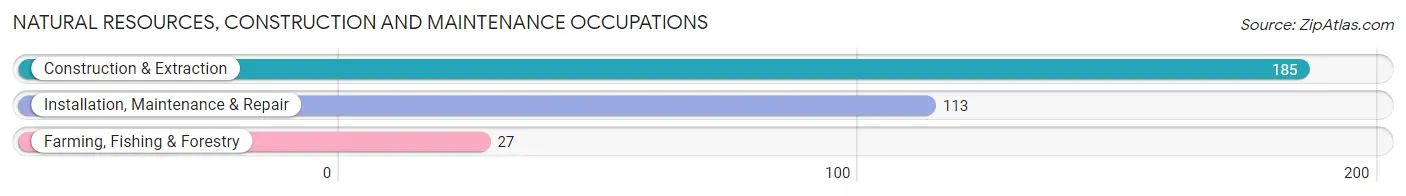
Natural Resources, Construction and Maintenance Occupations
The most common Natural Resources, Construction and Maintenance occupations in Perryville are Construction & Extraction (185 | 4.9%), Installation, Maintenance & Repair (113 | 3.0%), and Farming, Fishing & Forestry (27 | 0.7%).
Natural Resources, Construction and Maintenance Occupations by Sex

| Occupation | Male | Female |
| Farming, Fishing & Forestry | 27 (100.0%) | 0 (0.0%) |
| Construction & Extraction | 185 (100.0%) | 0 (0.0%) |
| Installation, Maintenance & Repair | 101 (89.4%) | 12 (10.6%) |
| Total (Category) | 313 (96.3%) | 12 (3.7%) |
| Total (Overall) | 1,850 (49.4%) | 1,894 (50.6%) |
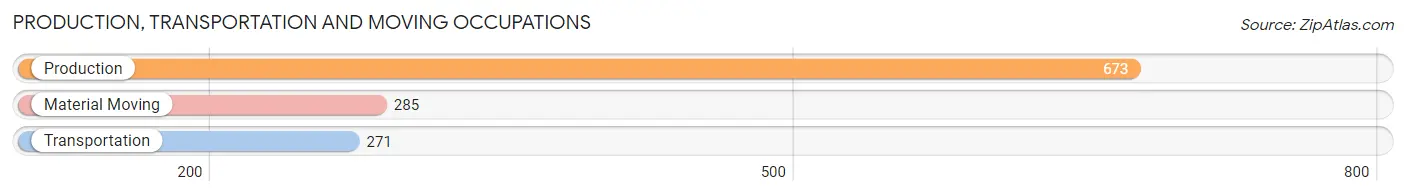
Production, Transportation and Moving Occupations
The most common Production, Transportation and Moving occupations in Perryville are Production (673 | 18.0%), Material Moving (285 | 7.6%), and Transportation (271 | 7.2%).
Production, Transportation and Moving Occupations by Sex
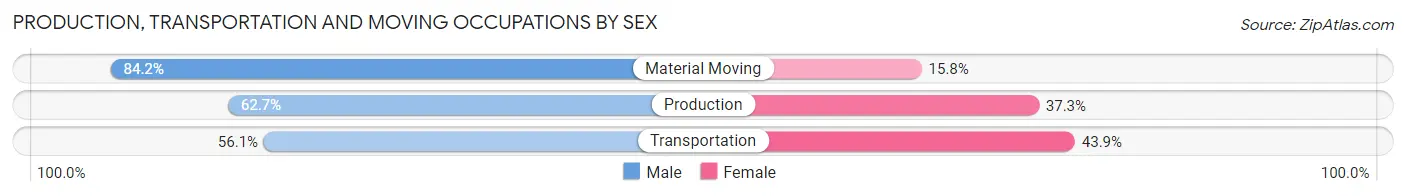
| Occupation | Male | Female |
| Production | 422 (62.7%) | 251 (37.3%) |
| Transportation | 152 (56.1%) | 119 (43.9%) |
| Material Moving | 240 (84.2%) | 45 (15.8%) |
| Total (Category) | 814 (66.2%) | 415 (33.8%) |
| Total (Overall) | 1,850 (49.4%) | 1,894 (50.6%) |
Employment Industries by Sex in Perryville
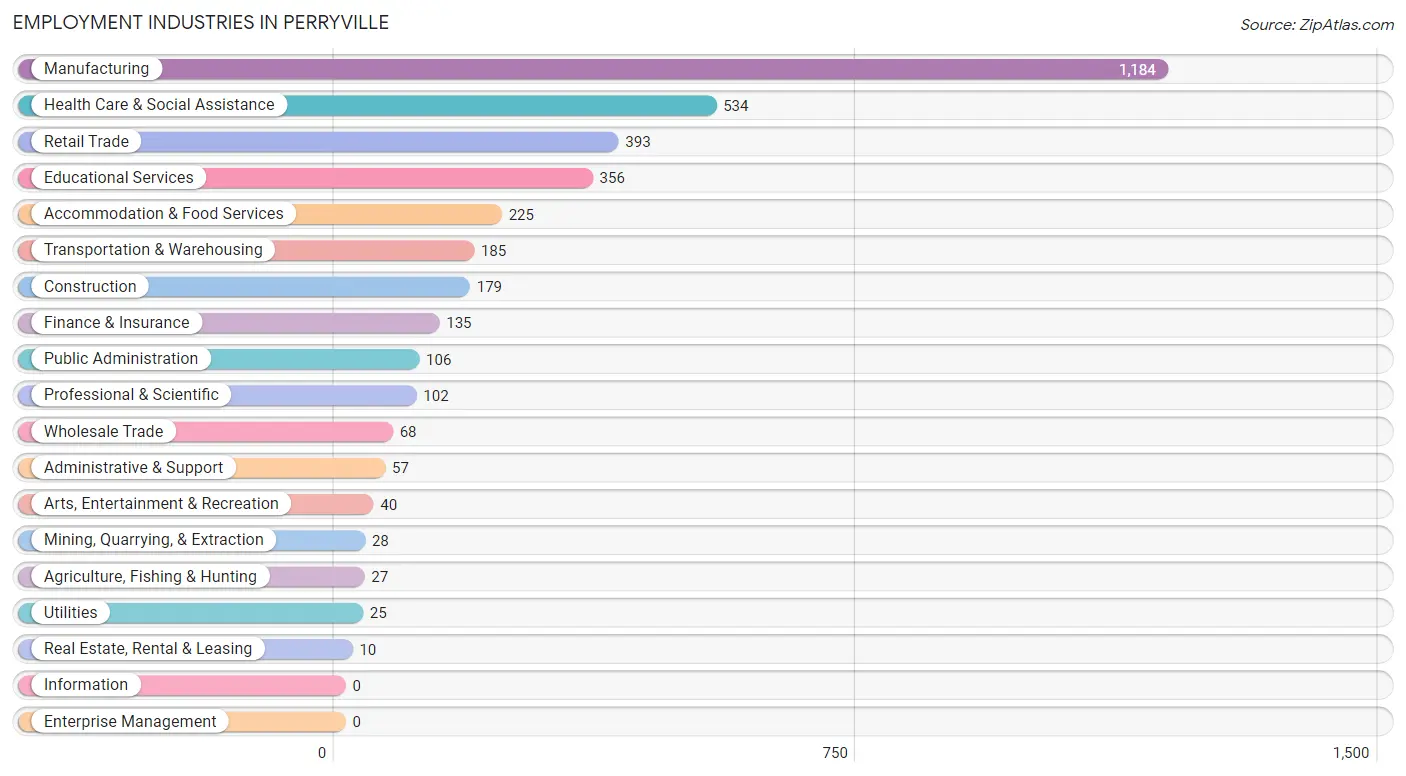
Employment Industries in Perryville
The major employment industries in Perryville include Manufacturing (1,184 | 31.6%), Health Care & Social Assistance (534 | 14.3%), Retail Trade (393 | 10.5%), Educational Services (356 | 9.5%), and Accommodation & Food Services (225 | 6.0%).
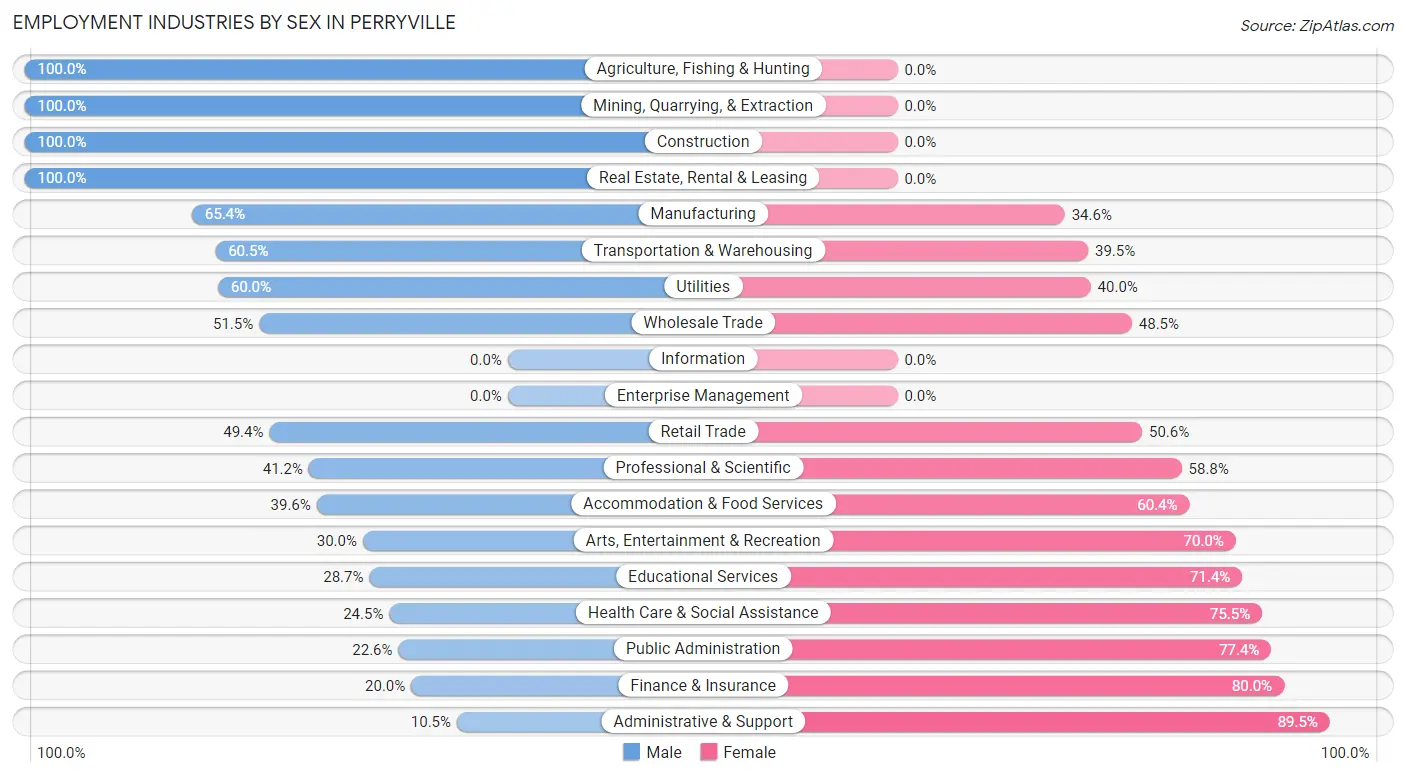
Employment Industries by Sex in Perryville
The Perryville industries that see more men than women are Agriculture, Fishing & Hunting (100.0%), Mining, Quarrying, & Extraction (100.0%), and Construction (100.0%), whereas the industries that tend to have a higher number of women are Administrative & Support (89.5%), Finance & Insurance (80.0%), and Public Administration (77.4%).
| Industry | Male | Female |
| Agriculture, Fishing & Hunting | 27 (100.0%) | 0 (0.0%) |
| Mining, Quarrying, & Extraction | 28 (100.0%) | 0 (0.0%) |
| Construction | 179 (100.0%) | 0 (0.0%) |
| Manufacturing | 774 (65.4%) | 410 (34.6%) |
| Wholesale Trade | 35 (51.5%) | 33 (48.5%) |
| Retail Trade | 194 (49.4%) | 199 (50.6%) |
| Transportation & Warehousing | 112 (60.5%) | 73 (39.5%) |
| Utilities | 15 (60.0%) | 10 (40.0%) |
| Information | 0 (0.0%) | 0 (0.0%) |
| Finance & Insurance | 27 (20.0%) | 108 (80.0%) |
| Real Estate, Rental & Leasing | 10 (100.0%) | 0 (0.0%) |
| Professional & Scientific | 42 (41.2%) | 60 (58.8%) |
| Enterprise Management | 0 (0.0%) | 0 (0.0%) |
| Administrative & Support | 6 (10.5%) | 51 (89.5%) |
| Educational Services | 102 (28.6%) | 254 (71.4%) |
| Health Care & Social Assistance | 131 (24.5%) | 403 (75.5%) |
| Arts, Entertainment & Recreation | 12 (30.0%) | 28 (70.0%) |
| Accommodation & Food Services | 89 (39.6%) | 136 (60.4%) |
| Public Administration | 24 (22.6%) | 82 (77.4%) |
| Total | 1,850 (49.4%) | 1,894 (50.6%) |
Education in Perryville
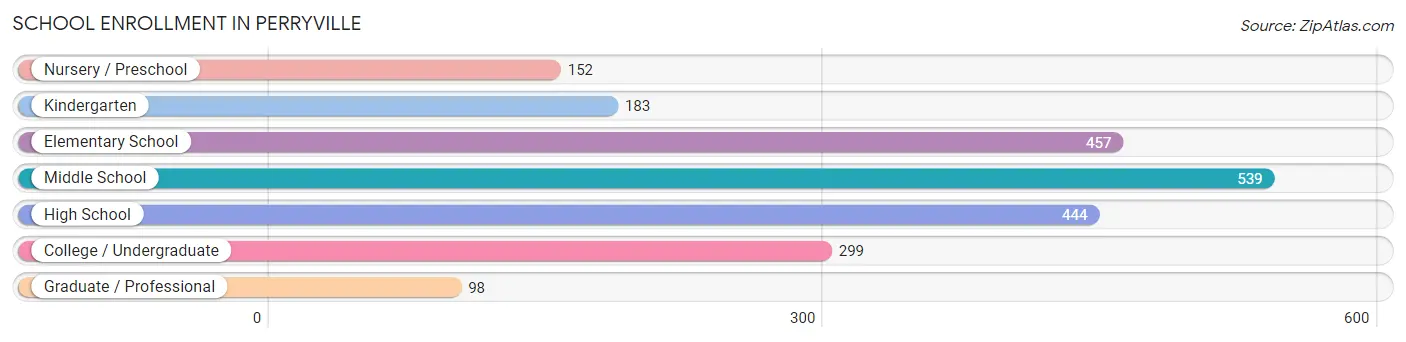
School Enrollment in Perryville
The most common levels of schooling among the 2,172 students in Perryville are middle school (539 | 24.8%), elementary school (457 | 21.0%), and high school (444 | 20.4%).
| School Level | # Students | % Students |
| Nursery / Preschool | 152 | 7.0% |
| Kindergarten | 183 | 8.4% |
| Elementary School | 457 | 21.0% |
| Middle School | 539 | 24.8% |
| High School | 444 | 20.4% |
| College / Undergraduate | 299 | 13.8% |
| Graduate / Professional | 98 | 4.5% |
| Total | 2,172 | 100.0% |
School Enrollment by Age by Funding Source in Perryville
Out of a total of 2,172 students who are enrolled in schools in Perryville, 484 (22.3%) attend a private institution, while the remaining 1,688 (77.7%) are enrolled in public schools. The age group of 3 to 4 year olds has the highest likelihood of being enrolled in private schools, with 49 (63.6% in the age bracket) enrolled. Conversely, the age group of 35 years and over has the lowest likelihood of being enrolled in a private school, with 35 (100.0% in the age bracket) attending a public institution.
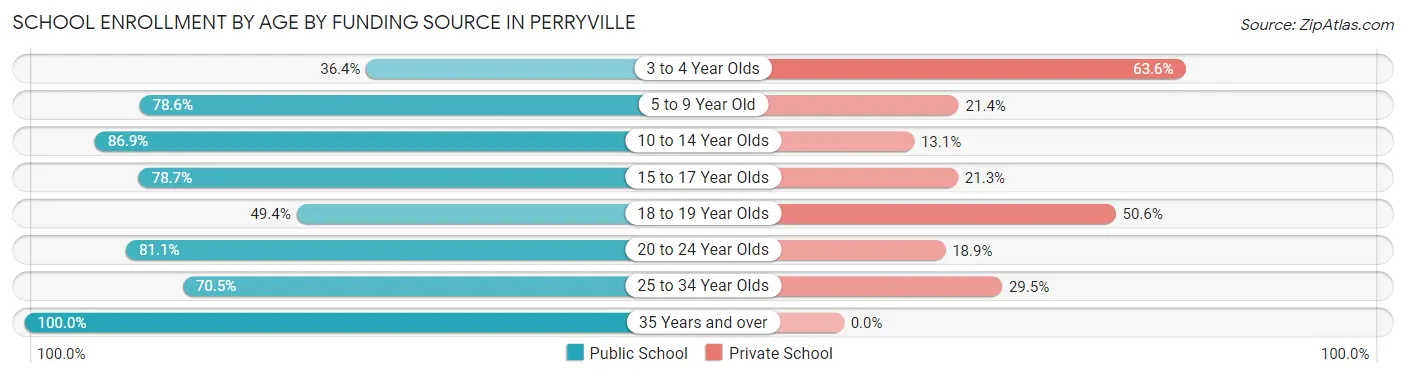
| Age Bracket | Public School | Private School |
| 3 to 4 Year Olds | 28 (36.4%) | 49 (63.6%) |
| 5 to 9 Year Old | 510 (78.6%) | 139 (21.4%) |
| 10 to 14 Year Olds | 544 (86.9%) | 82 (13.1%) |
| 15 to 17 Year Olds | 259 (78.7%) | 70 (21.3%) |
| 18 to 19 Year Olds | 77 (49.4%) | 79 (50.6%) |
| 20 to 24 Year Olds | 180 (81.1%) | 42 (18.9%) |
| 25 to 34 Year Olds | 55 (70.5%) | 23 (29.5%) |
| 35 Years and over | 35 (100.0%) | 0 (0.0%) |
| Total | 1,688 (77.7%) | 484 (22.3%) |
Educational Attainment by Field of Study in Perryville
Education (257 | 22.3%), business (250 | 21.6%), science & technology (152 | 13.2%), bio, nature & agricultural (93 | 8.1%), and liberal arts & history (82 | 7.1%) are the most common fields of study among 1,155 individuals in Perryville who have obtained a bachelor's degree or higher.
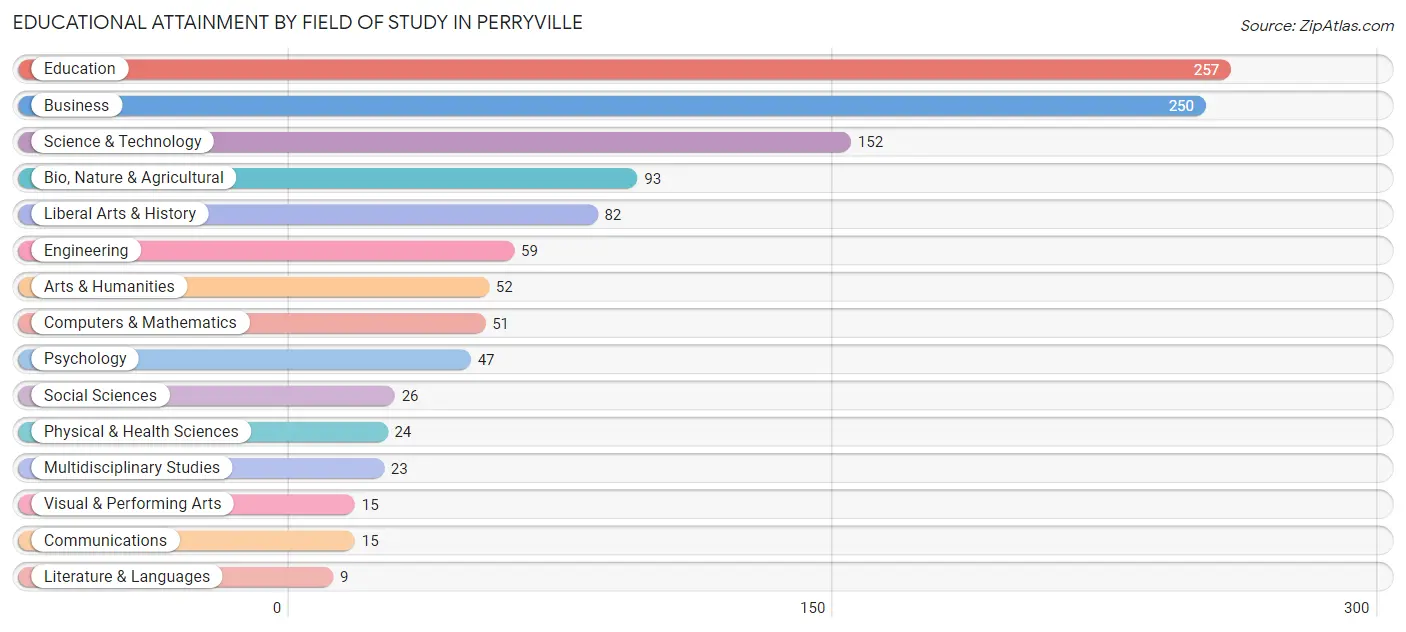
| Field of Study | # Graduates | % Graduates |
| Computers & Mathematics | 51 | 4.4% |
| Bio, Nature & Agricultural | 93 | 8.1% |
| Physical & Health Sciences | 24 | 2.1% |
| Psychology | 47 | 4.1% |
| Social Sciences | 26 | 2.2% |
| Engineering | 59 | 5.1% |
| Multidisciplinary Studies | 23 | 2.0% |
| Science & Technology | 152 | 13.2% |
| Business | 250 | 21.6% |
| Education | 257 | 22.3% |
| Literature & Languages | 9 | 0.8% |
| Liberal Arts & History | 82 | 7.1% |
| Visual & Performing Arts | 15 | 1.3% |
| Communications | 15 | 1.3% |
| Arts & Humanities | 52 | 4.5% |
| Total | 1,155 | 100.0% |
Transportation & Commute in Perryville
Vehicle Availability by Sex in Perryville
The most prevalent vehicle ownership categories in Perryville are males with 2 vehicles (830, accounting for 44.7%) and females with 2 vehicles (906, making up 44.7%).
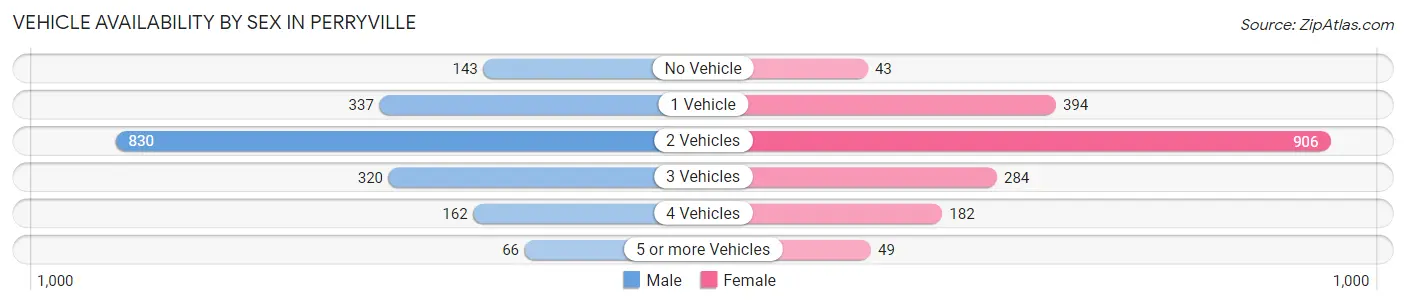
| Vehicles Available | Male | Female |
| No Vehicle | 143 (7.7%) | 43 (2.3%) |
| 1 Vehicle | 337 (18.1%) | 394 (21.2%) |
| 2 Vehicles | 830 (44.7%) | 906 (48.8%) |
| 3 Vehicles | 320 (17.2%) | 284 (15.3%) |
| 4 Vehicles | 162 (8.7%) | 182 (9.8%) |
| 5 or more Vehicles | 66 (3.5%) | 49 (2.6%) |
| Total | 1,858 (100.0%) | 1,858 (100.0%) |
Commute Time in Perryville
The most frequently occuring commute durations in Perryville are 5 to 9 minutes (1,488 commuters, 41.4%), 10 to 14 minutes (525 commuters, 14.6%), and less than 5 minutes (413 commuters, 11.5%).
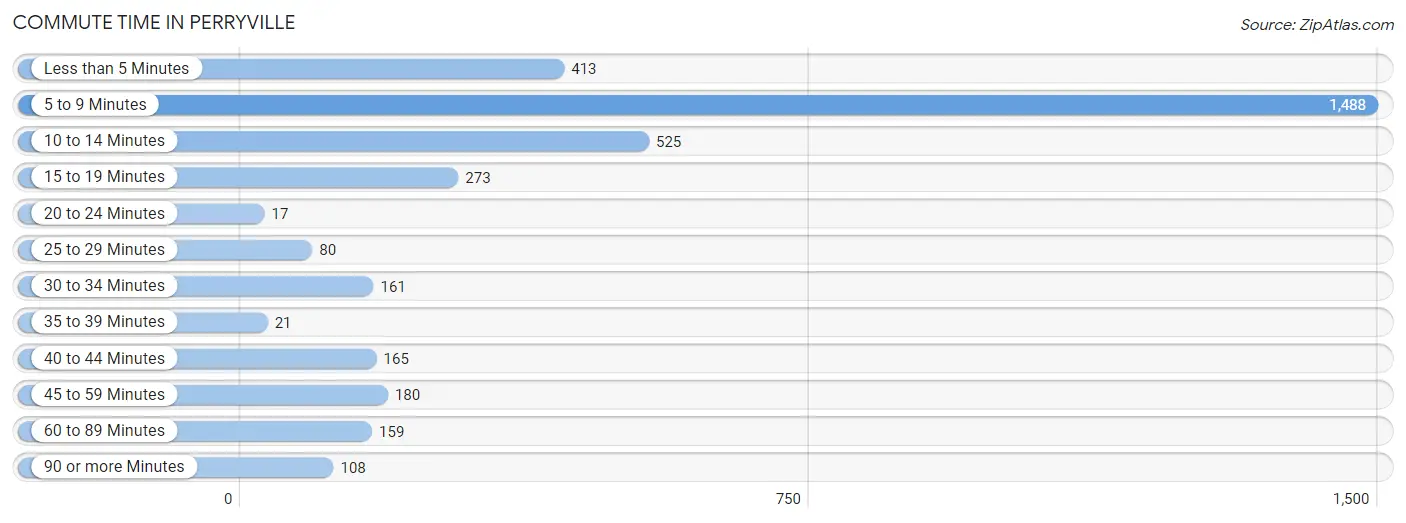
| Commute Time | # Commuters | % Commuters |
| Less than 5 Minutes | 413 | 11.5% |
| 5 to 9 Minutes | 1,488 | 41.4% |
| 10 to 14 Minutes | 525 | 14.6% |
| 15 to 19 Minutes | 273 | 7.6% |
| 20 to 24 Minutes | 17 | 0.5% |
| 25 to 29 Minutes | 80 | 2.2% |
| 30 to 34 Minutes | 161 | 4.5% |
| 35 to 39 Minutes | 21 | 0.6% |
| 40 to 44 Minutes | 165 | 4.6% |
| 45 to 59 Minutes | 180 | 5.0% |
| 60 to 89 Minutes | 159 | 4.4% |
| 90 or more Minutes | 108 | 3.0% |
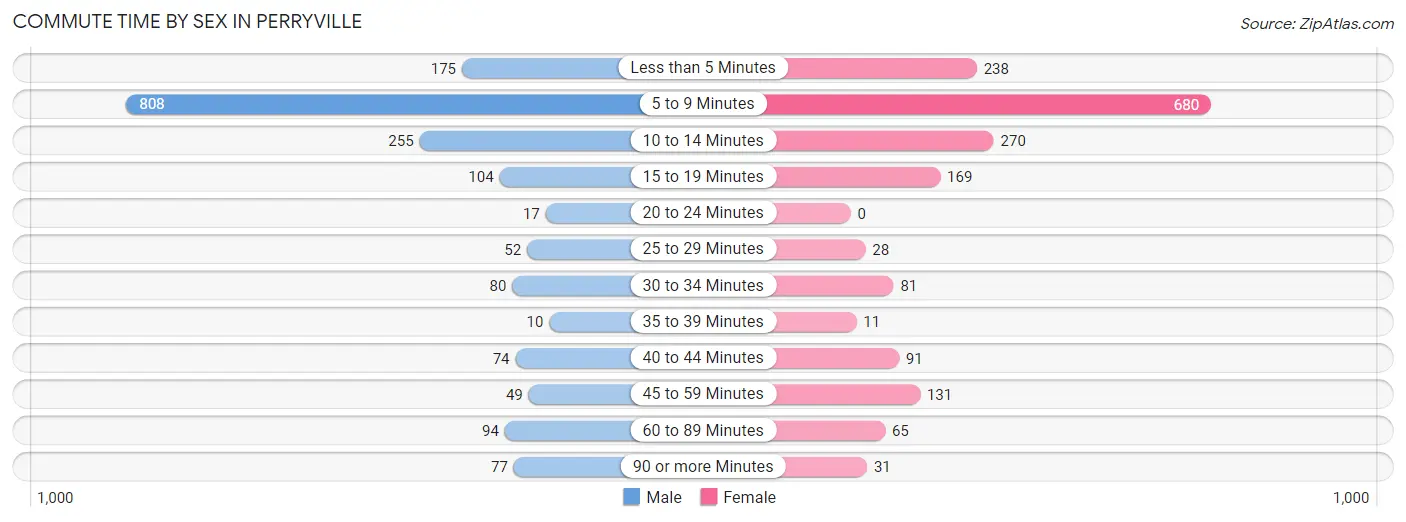
Commute Time by Sex in Perryville
The most common commute times in Perryville are 5 to 9 minutes (808 commuters, 45.0%) for males and 5 to 9 minutes (680 commuters, 37.9%) for females.
| Commute Time | Male | Female |
| Less than 5 Minutes | 175 (9.8%) | 238 (13.3%) |
| 5 to 9 Minutes | 808 (45.0%) | 680 (37.9%) |
| 10 to 14 Minutes | 255 (14.2%) | 270 (15.0%) |
| 15 to 19 Minutes | 104 (5.8%) | 169 (9.4%) |
| 20 to 24 Minutes | 17 (0.9%) | 0 (0.0%) |
| 25 to 29 Minutes | 52 (2.9%) | 28 (1.6%) |
| 30 to 34 Minutes | 80 (4.5%) | 81 (4.5%) |
| 35 to 39 Minutes | 10 (0.6%) | 11 (0.6%) |
| 40 to 44 Minutes | 74 (4.1%) | 91 (5.1%) |
| 45 to 59 Minutes | 49 (2.7%) | 131 (7.3%) |
| 60 to 89 Minutes | 94 (5.2%) | 65 (3.6%) |
| 90 or more Minutes | 77 (4.3%) | 31 (1.7%) |
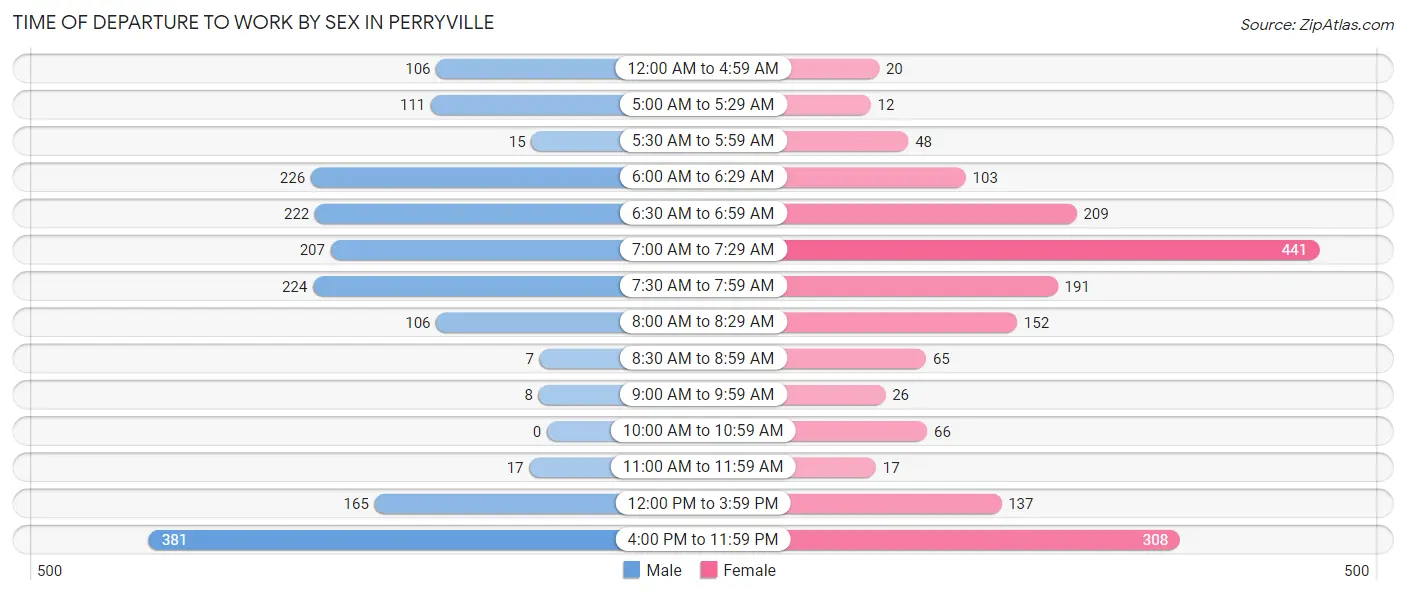
Time of Departure to Work by Sex in Perryville
The most frequent times of departure to work in Perryville are 4:00 PM to 11:59 PM (381, 21.2%) for males and 7:00 AM to 7:29 AM (441, 24.6%) for females.
| Time of Departure | Male | Female |
| 12:00 AM to 4:59 AM | 106 (5.9%) | 20 (1.1%) |
| 5:00 AM to 5:29 AM | 111 (6.2%) | 12 (0.7%) |
| 5:30 AM to 5:59 AM | 15 (0.8%) | 48 (2.7%) |
| 6:00 AM to 6:29 AM | 226 (12.6%) | 103 (5.7%) |
| 6:30 AM to 6:59 AM | 222 (12.4%) | 209 (11.6%) |
| 7:00 AM to 7:29 AM | 207 (11.5%) | 441 (24.6%) |
| 7:30 AM to 7:59 AM | 224 (12.5%) | 191 (10.6%) |
| 8:00 AM to 8:29 AM | 106 (5.9%) | 152 (8.5%) |
| 8:30 AM to 8:59 AM | 7 (0.4%) | 65 (3.6%) |
| 9:00 AM to 9:59 AM | 8 (0.4%) | 26 (1.5%) |
| 10:00 AM to 10:59 AM | 0 (0.0%) | 66 (3.7%) |
| 11:00 AM to 11:59 AM | 17 (0.9%) | 17 (0.9%) |
| 12:00 PM to 3:59 PM | 165 (9.2%) | 137 (7.6%) |
| 4:00 PM to 11:59 PM | 381 (21.2%) | 308 (17.2%) |
| Total | 1,795 (100.0%) | 1,795 (100.0%) |
Housing Occupancy in Perryville
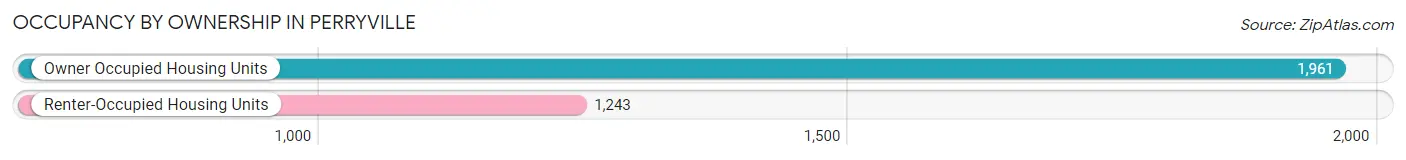
Occupancy by Ownership in Perryville
Of the total 3,204 dwellings in Perryville, owner-occupied units account for 1,961 (61.2%), while renter-occupied units make up 1,243 (38.8%).
| Occupancy | # Housing Units | % Housing Units |
| Owner Occupied Housing Units | 1,961 | 61.2% |
| Renter-Occupied Housing Units | 1,243 | 38.8% |
| Total Occupied Housing Units | 3,204 | 100.0% |
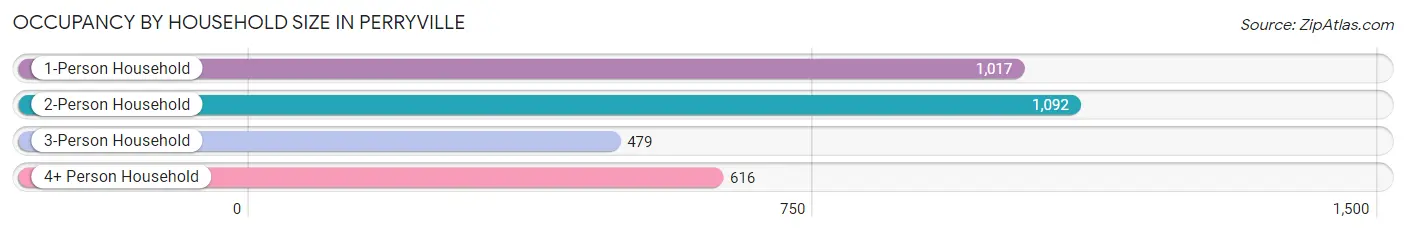
Occupancy by Household Size in Perryville
| Household Size | # Housing Units | % Housing Units |
| 1-Person Household | 1,017 | 31.7% |
| 2-Person Household | 1,092 | 34.1% |
| 3-Person Household | 479 | 14.9% |
| 4+ Person Household | 616 | 19.2% |
| Total Housing Units | 3,204 | 100.0% |
Occupancy by Ownership by Household Size in Perryville
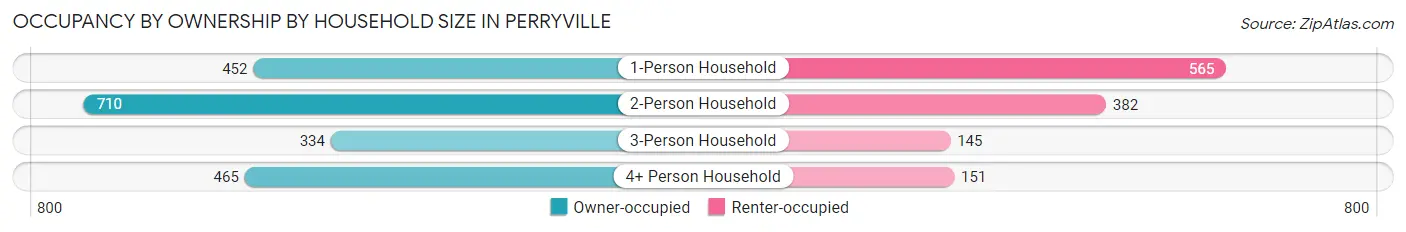
| Household Size | Owner-occupied | Renter-occupied |
| 1-Person Household | 452 (44.4%) | 565 (55.6%) |
| 2-Person Household | 710 (65.0%) | 382 (35.0%) |
| 3-Person Household | 334 (69.7%) | 145 (30.3%) |
| 4+ Person Household | 465 (75.5%) | 151 (24.5%) |
| Total Housing Units | 1,961 (61.2%) | 1,243 (38.8%) |
Occupancy by Educational Attainment in Perryville
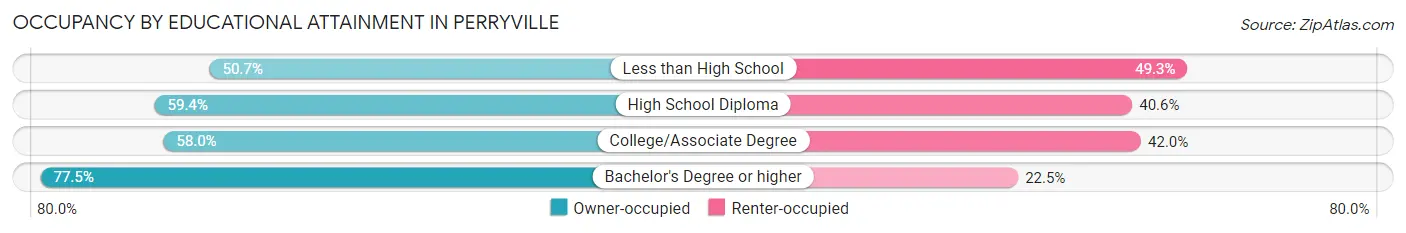
| Household Size | Owner-occupied | Renter-occupied |
| Less than High School | 192 (50.7%) | 187 (49.3%) |
| High School Diploma | 795 (59.4%) | 544 (40.6%) |
| College/Associate Degree | 527 (58.0%) | 382 (42.0%) |
| Bachelor's Degree or higher | 447 (77.5%) | 130 (22.5%) |
Occupancy by Age of Householder in Perryville
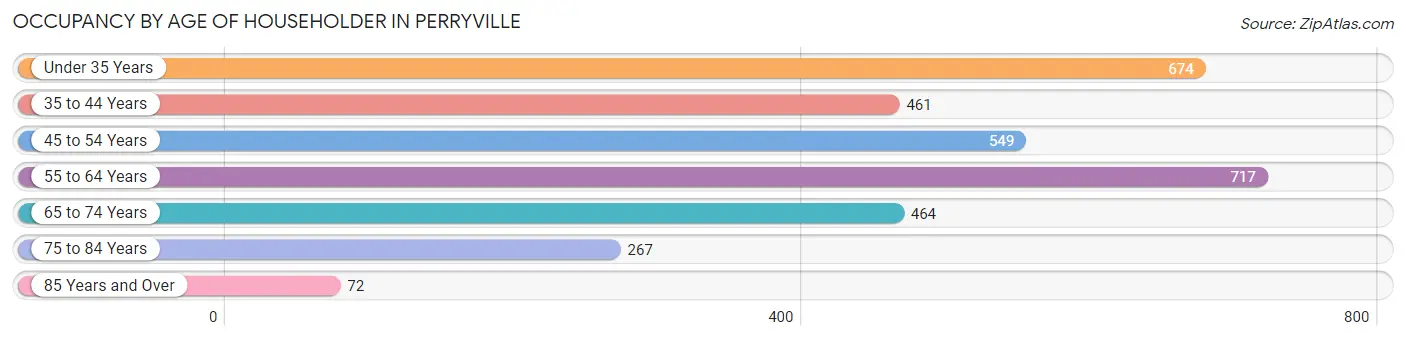
| Age Bracket | # Households | % Households |
| Under 35 Years | 674 | 21.0% |
| 35 to 44 Years | 461 | 14.4% |
| 45 to 54 Years | 549 | 17.1% |
| 55 to 64 Years | 717 | 22.4% |
| 65 to 74 Years | 464 | 14.5% |
| 75 to 84 Years | 267 | 8.3% |
| 85 Years and Over | 72 | 2.2% |
| Total | 3,204 | 100.0% |
Housing Finances in Perryville
Median Income by Occupancy in Perryville
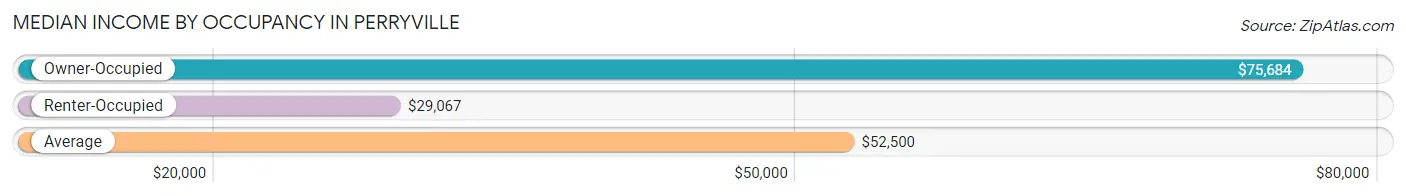
| Occupancy Type | # Households | Median Income |
| Owner-Occupied | 1,961 (61.2%) | $75,684 |
| Renter-Occupied | 1,243 (38.8%) | $29,067 |
| Average | 3,204 (100.0%) | $52,500 |
Occupancy by Householder Income Bracket in Perryville
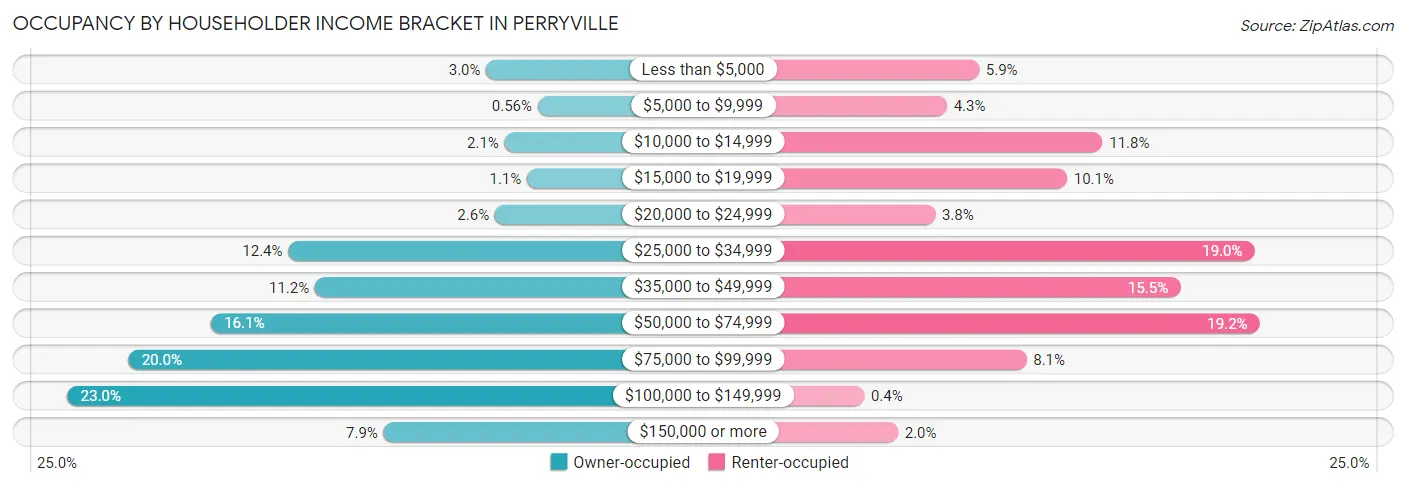
| Income Bracket | Owner-occupied | Renter-occupied |
| Less than $5,000 | 59 (3.0%) | 73 (5.9%) |
| $5,000 to $9,999 | 11 (0.6%) | 54 (4.3%) |
| $10,000 to $14,999 | 42 (2.1%) | 146 (11.7%) |
| $15,000 to $19,999 | 21 (1.1%) | 125 (10.1%) |
| $20,000 to $24,999 | 51 (2.6%) | 47 (3.8%) |
| $25,000 to $34,999 | 244 (12.4%) | 236 (19.0%) |
| $35,000 to $49,999 | 219 (11.2%) | 192 (15.4%) |
| $50,000 to $74,999 | 316 (16.1%) | 239 (19.2%) |
| $75,000 to $99,999 | 393 (20.0%) | 101 (8.1%) |
| $100,000 to $149,999 | 450 (23.0%) | 5 (0.4%) |
| $150,000 or more | 155 (7.9%) | 25 (2.0%) |
| Total | 1,961 (100.0%) | 1,243 (100.0%) |
Monthly Housing Cost Tiers in Perryville
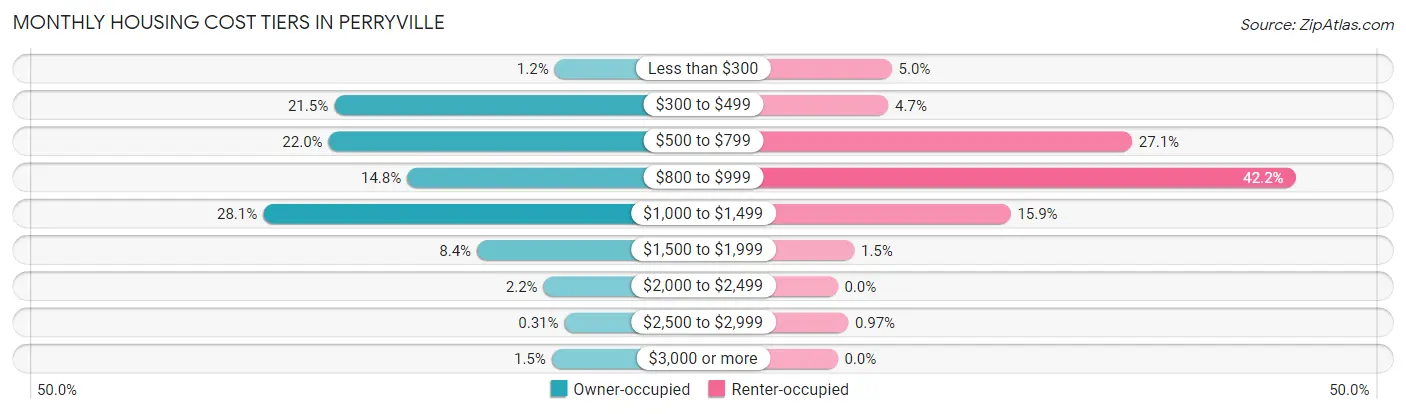
| Monthly Cost | Owner-occupied | Renter-occupied |
| Less than $300 | 24 (1.2%) | 62 (5.0%) |
| $300 to $499 | 422 (21.5%) | 58 (4.7%) |
| $500 to $799 | 432 (22.0%) | 337 (27.1%) |
| $800 to $999 | 290 (14.8%) | 524 (42.2%) |
| $1,000 to $1,499 | 550 (28.1%) | 198 (15.9%) |
| $1,500 to $1,999 | 164 (8.4%) | 19 (1.5%) |
| $2,000 to $2,499 | 44 (2.2%) | 0 (0.0%) |
| $2,500 to $2,999 | 6 (0.3%) | 12 (1.0%) |
| $3,000 or more | 29 (1.5%) | 0 (0.0%) |
| Total | 1,961 (100.0%) | 1,243 (100.0%) |
Physical Housing Characteristics in Perryville
Housing Structures in Perryville
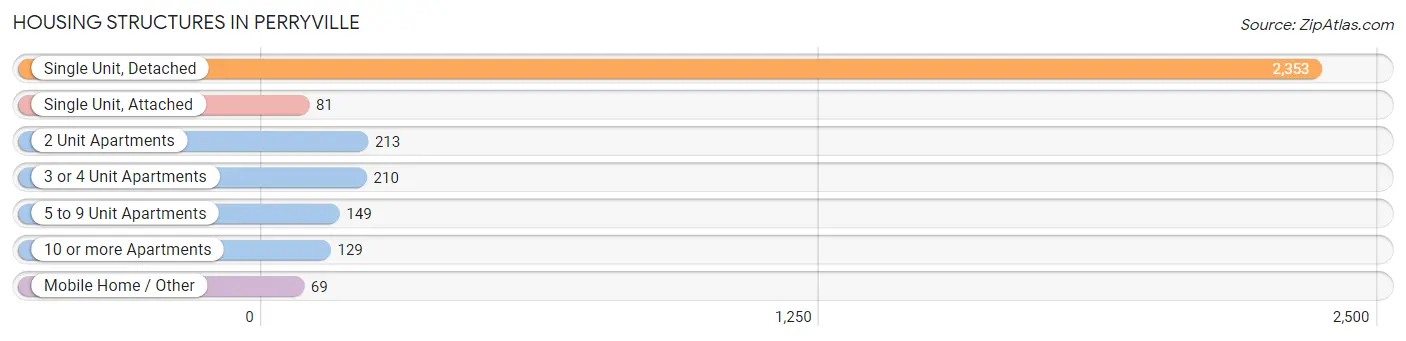
| Structure Type | # Housing Units | % Housing Units |
| Single Unit, Detached | 2,353 | 73.4% |
| Single Unit, Attached | 81 | 2.5% |
| 2 Unit Apartments | 213 | 6.7% |
| 3 or 4 Unit Apartments | 210 | 6.6% |
| 5 to 9 Unit Apartments | 149 | 4.6% |
| 10 or more Apartments | 129 | 4.0% |
| Mobile Home / Other | 69 | 2.1% |
| Total | 3,204 | 100.0% |
Housing Structures by Occupancy in Perryville
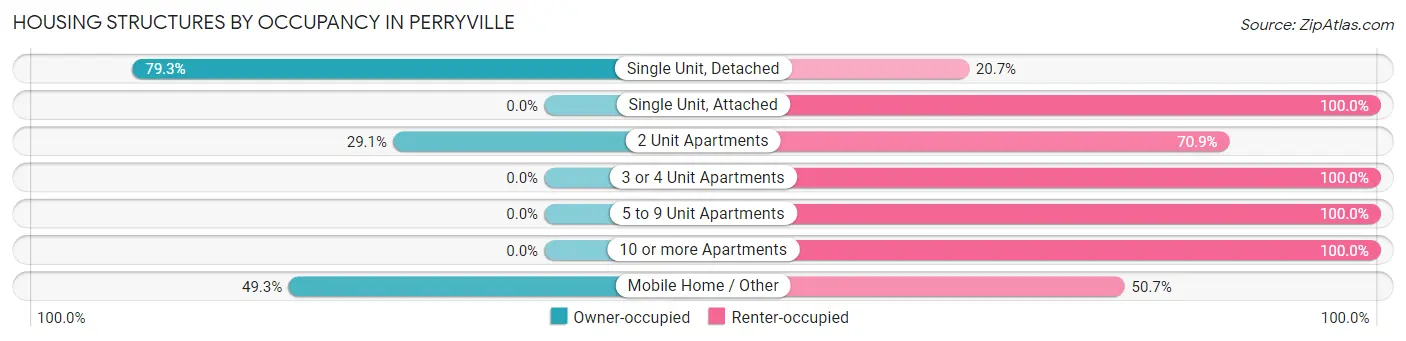
| Structure Type | Owner-occupied | Renter-occupied |
| Single Unit, Detached | 1,865 (79.3%) | 488 (20.7%) |
| Single Unit, Attached | 0 (0.0%) | 81 (100.0%) |
| 2 Unit Apartments | 62 (29.1%) | 151 (70.9%) |
| 3 or 4 Unit Apartments | 0 (0.0%) | 210 (100.0%) |
| 5 to 9 Unit Apartments | 0 (0.0%) | 149 (100.0%) |
| 10 or more Apartments | 0 (0.0%) | 129 (100.0%) |
| Mobile Home / Other | 34 (49.3%) | 35 (50.7%) |
| Total | 1,961 (61.2%) | 1,243 (38.8%) |
Housing Structures by Number of Rooms in Perryville
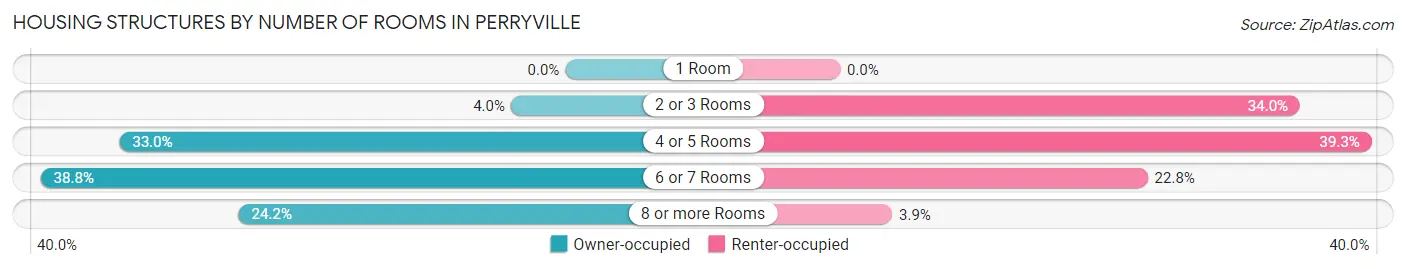
| Number of Rooms | Owner-occupied | Renter-occupied |
| 1 Room | 0 (0.0%) | 0 (0.0%) |
| 2 or 3 Rooms | 79 (4.0%) | 423 (34.0%) |
| 4 or 5 Rooms | 647 (33.0%) | 489 (39.3%) |
| 6 or 7 Rooms | 761 (38.8%) | 283 (22.8%) |
| 8 or more Rooms | 474 (24.2%) | 48 (3.9%) |
| Total | 1,961 (100.0%) | 1,243 (100.0%) |
Housing Structure by Heating Type in Perryville
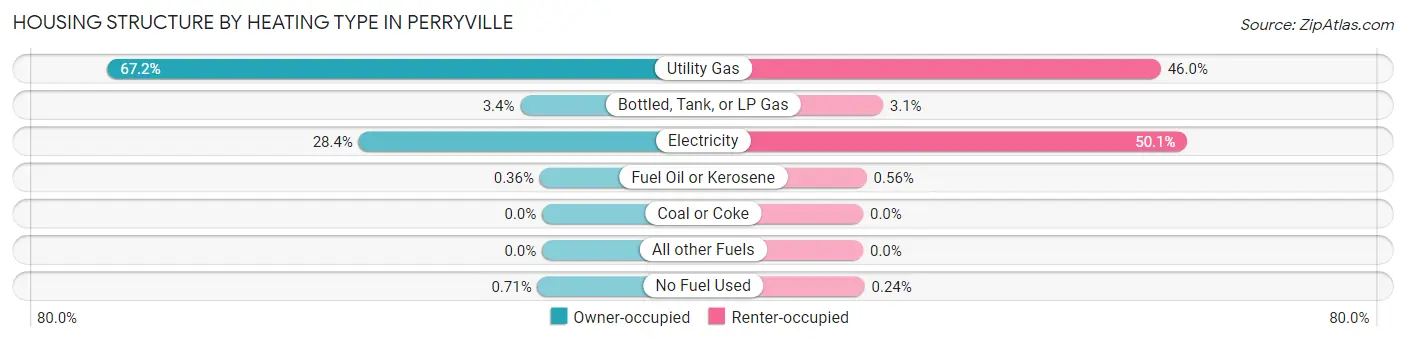
| Heating Type | Owner-occupied | Renter-occupied |
| Utility Gas | 1,318 (67.2%) | 572 (46.0%) |
| Bottled, Tank, or LP Gas | 66 (3.4%) | 38 (3.1%) |
| Electricity | 556 (28.3%) | 623 (50.1%) |
| Fuel Oil or Kerosene | 7 (0.4%) | 7 (0.6%) |
| Coal or Coke | 0 (0.0%) | 0 (0.0%) |
| All other Fuels | 0 (0.0%) | 0 (0.0%) |
| No Fuel Used | 14 (0.7%) | 3 (0.2%) |
| Total | 1,961 (100.0%) | 1,243 (100.0%) |
Household Vehicle Usage in Perryville
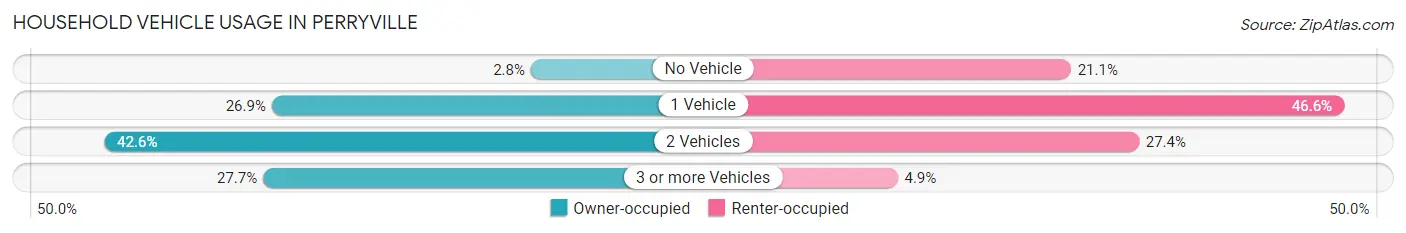
| Vehicles per Household | Owner-occupied | Renter-occupied |
| No Vehicle | 54 (2.8%) | 262 (21.1%) |
| 1 Vehicle | 528 (26.9%) | 579 (46.6%) |
| 2 Vehicles | 835 (42.6%) | 341 (27.4%) |
| 3 or more Vehicles | 544 (27.7%) | 61 (4.9%) |
| Total | 1,961 (100.0%) | 1,243 (100.0%) |
Real Estate & Mortgages in Perryville
Real Estate and Mortgage Overview in Perryville
| Characteristic | Without Mortgage | With Mortgage |
| Housing Units | 812 | 1,149 |
| Median Property Value | $209,900 | $161,700 |
| Median Household Income | $58,875 | $41 |
| Monthly Housing Costs | $496 | $21 |
| Real Estate Taxes | $1,585 | $17 |
Property Value by Mortgage Status in Perryville
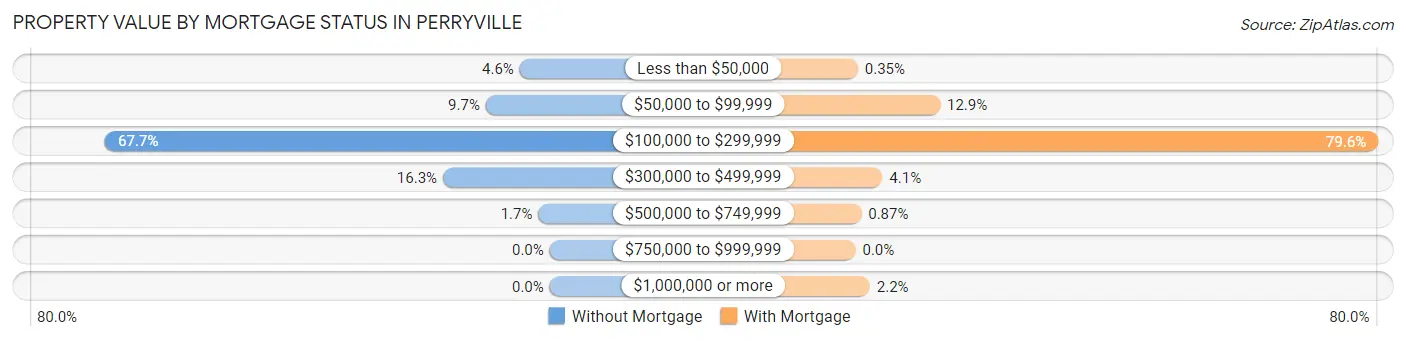
| Property Value | Without Mortgage | With Mortgage |
| Less than $50,000 | 37 (4.6%) | 4 (0.4%) |
| $50,000 to $99,999 | 79 (9.7%) | 148 (12.9%) |
| $100,000 to $299,999 | 550 (67.7%) | 915 (79.6%) |
| $300,000 to $499,999 | 132 (16.3%) | 47 (4.1%) |
| $500,000 to $749,999 | 14 (1.7%) | 10 (0.9%) |
| $750,000 to $999,999 | 0 (0.0%) | 0 (0.0%) |
| $1,000,000 or more | 0 (0.0%) | 25 (2.2%) |
| Total | 812 (100.0%) | 1,149 (100.0%) |
Household Income by Mortgage Status in Perryville
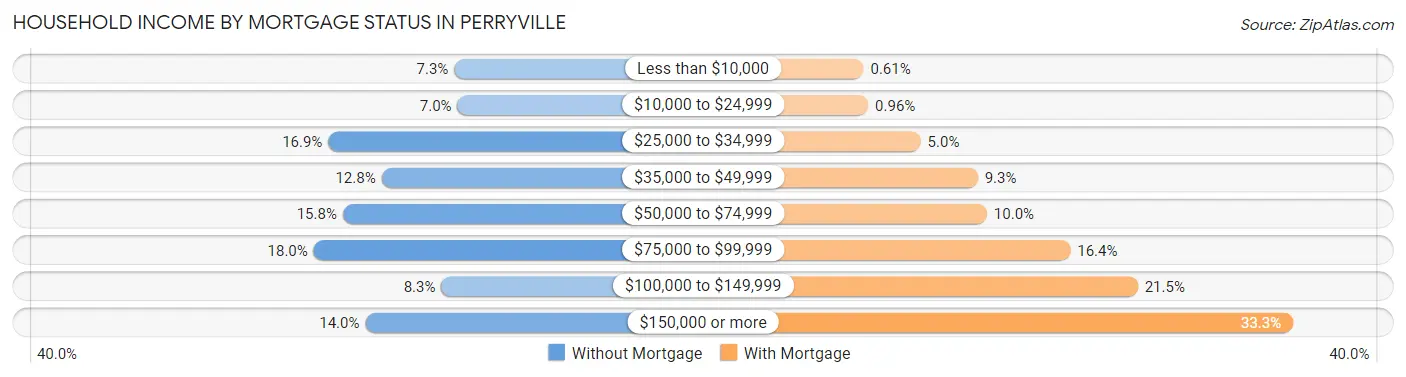
| Household Income | Without Mortgage | With Mortgage |
| Less than $10,000 | 59 (7.3%) | 7 (0.6%) |
| $10,000 to $24,999 | 57 (7.0%) | 11 (1.0%) |
| $25,000 to $34,999 | 137 (16.9%) | 57 (5.0%) |
| $35,000 to $49,999 | 104 (12.8%) | 107 (9.3%) |
| $50,000 to $74,999 | 128 (15.8%) | 115 (10.0%) |
| $75,000 to $99,999 | 146 (18.0%) | 188 (16.4%) |
| $100,000 to $149,999 | 67 (8.3%) | 247 (21.5%) |
| $150,000 or more | 114 (14.0%) | 383 (33.3%) |
| Total | 812 (100.0%) | 1,149 (100.0%) |
Property Value to Household Income Ratio in Perryville
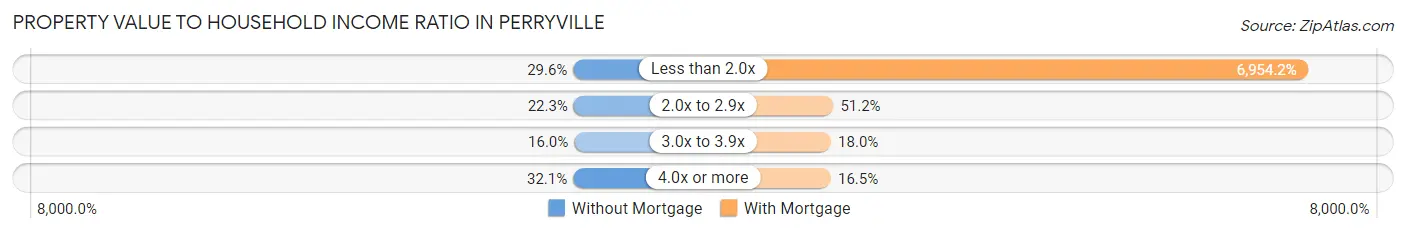
| Value-to-Income Ratio | Without Mortgage | With Mortgage |
| Less than 2.0x | 240 (29.6%) | 79,904 (6,954.2%) |
| 2.0x to 2.9x | 181 (22.3%) | 588 (51.2%) |
| 3.0x to 3.9x | 130 (16.0%) | 207 (18.0%) |
| 4.0x or more | 261 (32.1%) | 190 (16.5%) |
| Total | 812 (100.0%) | 1,149 (100.0%) |
Real Estate Taxes by Mortgage Status in Perryville
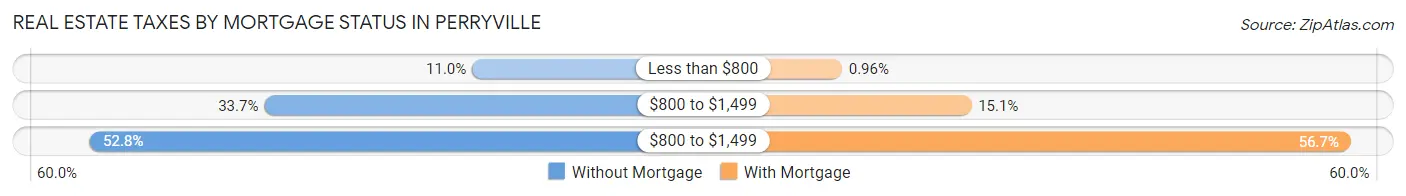
| Property Taxes | Without Mortgage | With Mortgage |
| Less than $800 | 89 (11.0%) | 11 (1.0%) |
| $800 to $1,499 | 274 (33.7%) | 174 (15.1%) |
| $800 to $1,499 | 429 (52.8%) | 652 (56.7%) |
| Total | 812 (100.0%) | 1,149 (100.0%) |
Health & Disability in Perryville
Health Insurance Coverage by Age in Perryville
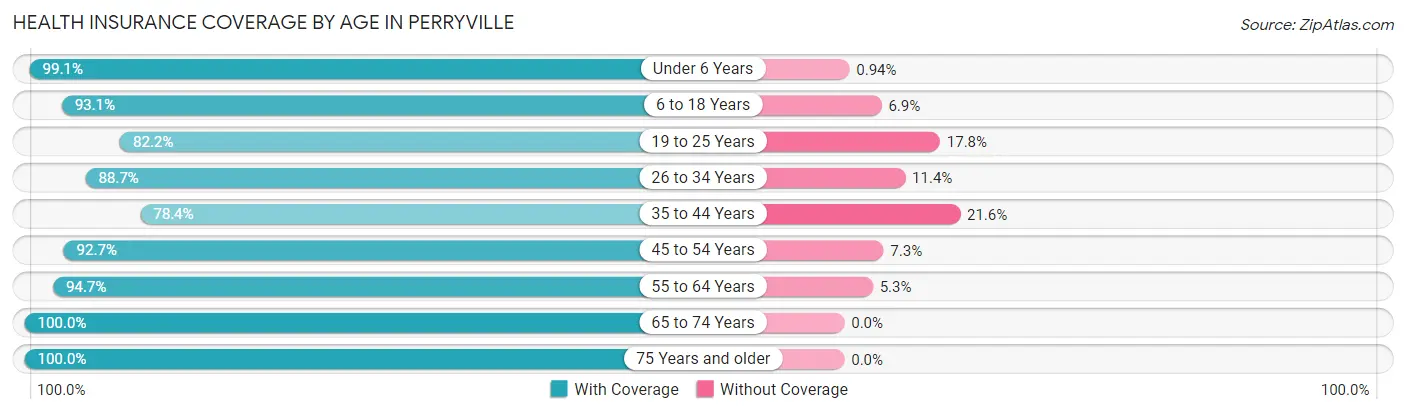
| Age Bracket | With Coverage | Without Coverage |
| Under 6 Years | 738 (99.1%) | 7 (0.9%) |
| 6 to 18 Years | 1,410 (93.1%) | 105 (6.9%) |
| 19 to 25 Years | 581 (82.2%) | 126 (17.8%) |
| 26 to 34 Years | 883 (88.6%) | 113 (11.4%) |
| 35 to 44 Years | 788 (78.4%) | 217 (21.6%) |
| 45 to 54 Years | 865 (92.7%) | 68 (7.3%) |
| 55 to 64 Years | 1,089 (94.7%) | 61 (5.3%) |
| 65 to 74 Years | 672 (100.0%) | 0 (0.0%) |
| 75 Years and older | 517 (100.0%) | 0 (0.0%) |
| Total | 7,543 (91.5%) | 697 (8.5%) |
Health Insurance Coverage by Citizenship Status in Perryville
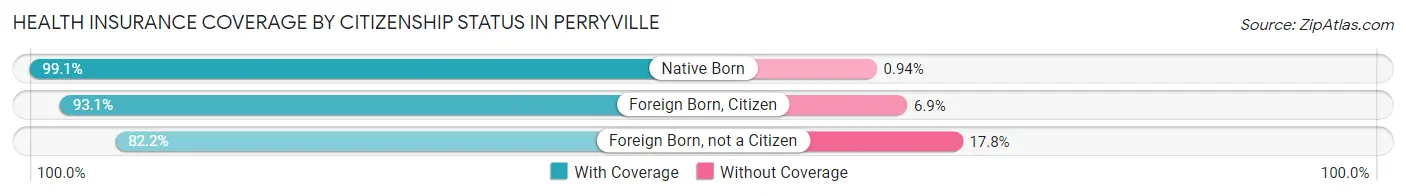
| Citizenship Status | With Coverage | Without Coverage |
| Native Born | 738 (99.1%) | 7 (0.9%) |
| Foreign Born, Citizen | 1,410 (93.1%) | 105 (6.9%) |
| Foreign Born, not a Citizen | 581 (82.2%) | 126 (17.8%) |
Health Insurance Coverage by Household Income in Perryville
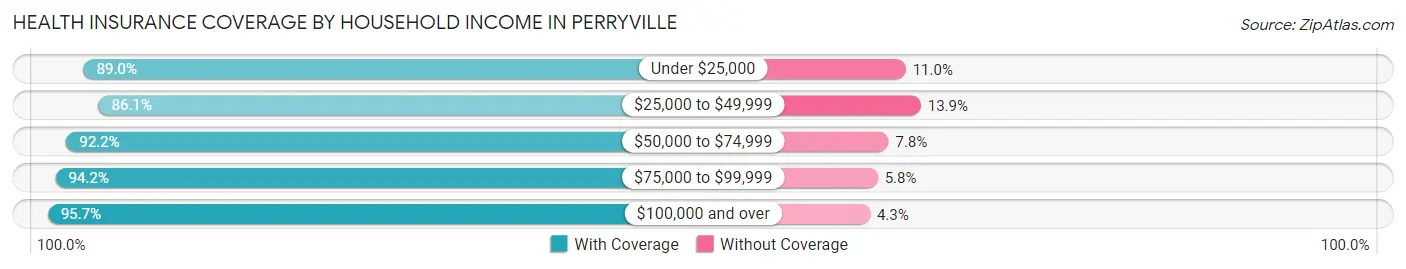
| Household Income | With Coverage | Without Coverage |
| Under $25,000 | 983 (89.0%) | 122 (11.0%) |
| $25,000 to $49,999 | 1,677 (86.1%) | 270 (13.9%) |
| $50,000 to $74,999 | 1,037 (92.2%) | 88 (7.8%) |
| $75,000 to $99,999 | 1,399 (94.2%) | 86 (5.8%) |
| $100,000 and over | 2,401 (95.7%) | 109 (4.3%) |
Public vs Private Health Insurance Coverage by Age in Perryville
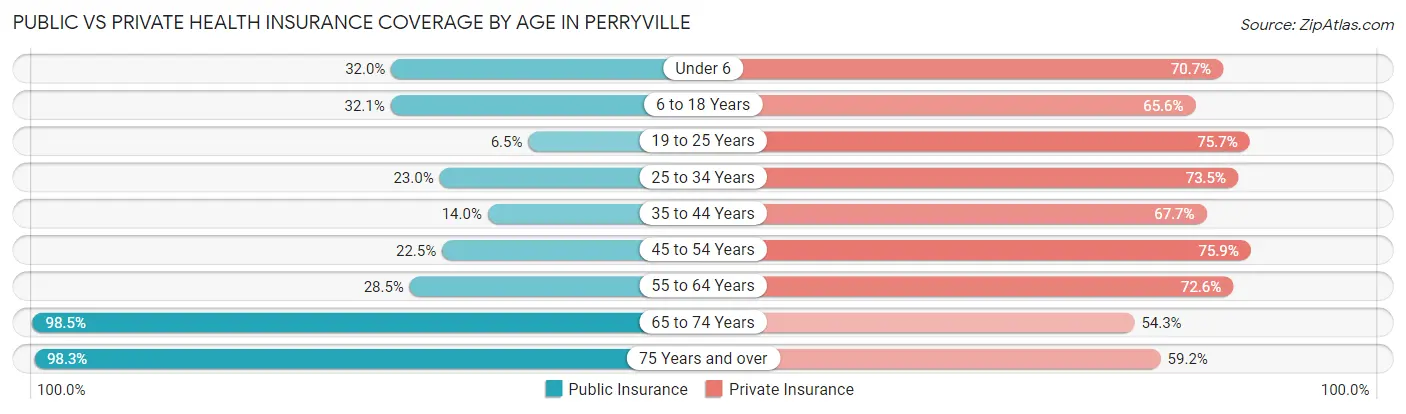
| Age Bracket | Public Insurance | Private Insurance |
| Under 6 | 238 (32.0%) | 527 (70.7%) |
| 6 to 18 Years | 486 (32.1%) | 994 (65.6%) |
| 19 to 25 Years | 46 (6.5%) | 535 (75.7%) |
| 25 to 34 Years | 229 (23.0%) | 732 (73.5%) |
| 35 to 44 Years | 141 (14.0%) | 680 (67.7%) |
| 45 to 54 Years | 210 (22.5%) | 708 (75.9%) |
| 55 to 64 Years | 328 (28.5%) | 835 (72.6%) |
| 65 to 74 Years | 662 (98.5%) | 365 (54.3%) |
| 75 Years and over | 508 (98.3%) | 306 (59.2%) |
| Total | 2,848 (34.6%) | 5,682 (69.0%) |
Disability Status by Sex by Age in Perryville
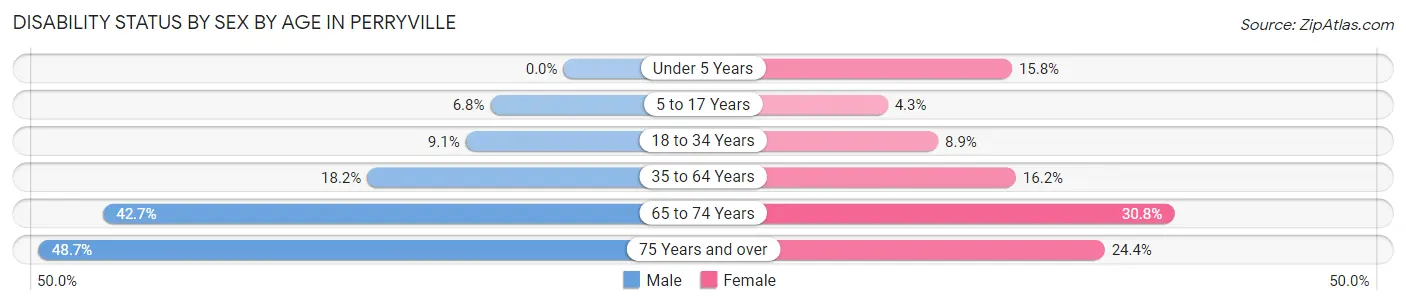
| Age Bracket | Male | Female |
| Under 5 Years | 0 (0.0%) | 39 (15.8%) |
| 5 to 17 Years | 49 (6.8%) | 38 (4.3%) |
| 18 to 34 Years | 77 (9.1%) | 87 (8.9%) |
| 35 to 64 Years | 258 (18.2%) | 270 (16.2%) |
| 65 to 74 Years | 111 (42.7%) | 127 (30.8%) |
| 75 Years and over | 110 (48.7%) | 71 (24.4%) |
Disability Class by Sex by Age in Perryville
Disability Class: Hearing Difficulty
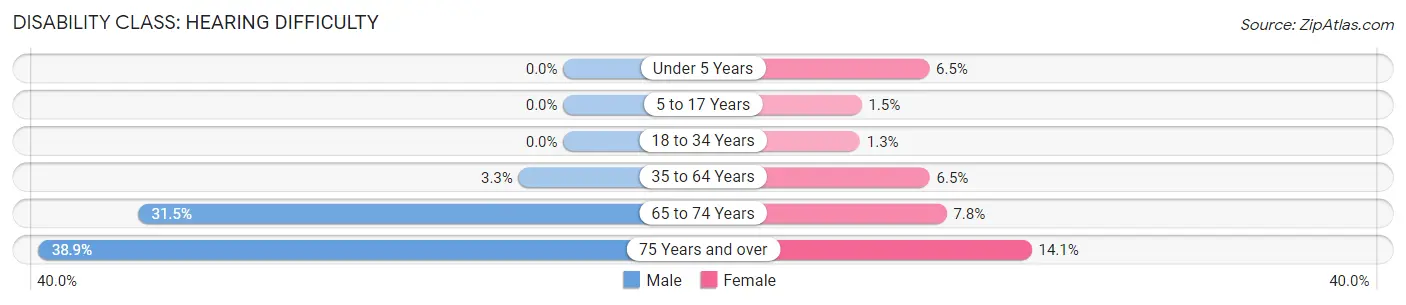
| Age Bracket | Male | Female |
| Under 5 Years | 0 (0.0%) | 16 (6.5%) |
| 5 to 17 Years | 0 (0.0%) | 13 (1.5%) |
| 18 to 34 Years | 0 (0.0%) | 13 (1.3%) |
| 35 to 64 Years | 47 (3.3%) | 109 (6.5%) |
| 65 to 74 Years | 82 (31.5%) | 32 (7.8%) |
| 75 Years and over | 88 (38.9%) | 41 (14.1%) |
Disability Class: Vision Difficulty
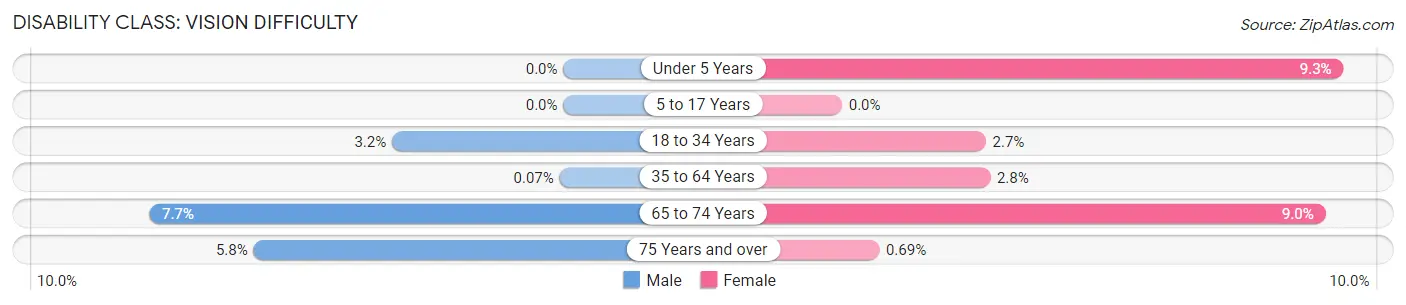
| Age Bracket | Male | Female |
| Under 5 Years | 0 (0.0%) | 23 (9.3%) |
| 5 to 17 Years | 0 (0.0%) | 0 (0.0%) |
| 18 to 34 Years | 27 (3.2%) | 26 (2.7%) |
| 35 to 64 Years | 1 (0.1%) | 46 (2.8%) |
| 65 to 74 Years | 20 (7.7%) | 37 (9.0%) |
| 75 Years and over | 13 (5.8%) | 2 (0.7%) |
Disability Class: Cognitive Difficulty
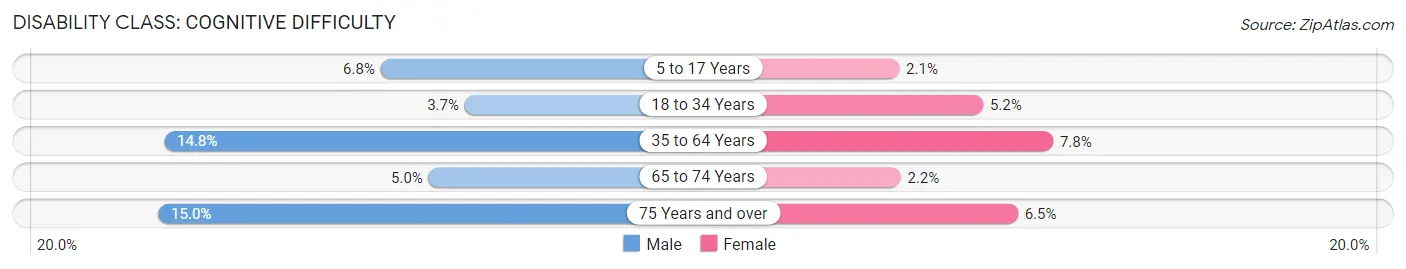
| Age Bracket | Male | Female |
| 5 to 17 Years | 49 (6.8%) | 19 (2.1%) |
| 18 to 34 Years | 31 (3.7%) | 51 (5.2%) |
| 35 to 64 Years | 210 (14.8%) | 131 (7.8%) |
| 65 to 74 Years | 13 (5.0%) | 9 (2.2%) |
| 75 Years and over | 34 (15.0%) | 19 (6.5%) |
Disability Class: Ambulatory Difficulty
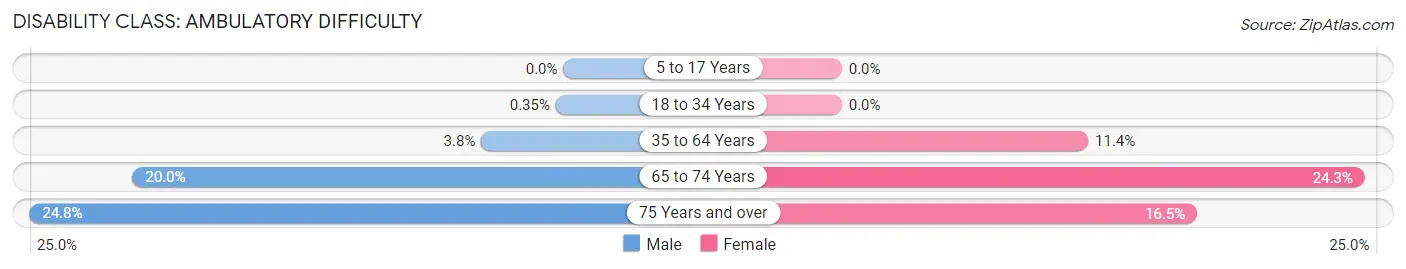
| Age Bracket | Male | Female |
| 5 to 17 Years | 0 (0.0%) | 0 (0.0%) |
| 18 to 34 Years | 3 (0.4%) | 0 (0.0%) |
| 35 to 64 Years | 54 (3.8%) | 191 (11.4%) |
| 65 to 74 Years | 52 (20.0%) | 100 (24.3%) |
| 75 Years and over | 56 (24.8%) | 48 (16.5%) |
Disability Class: Self-Care Difficulty
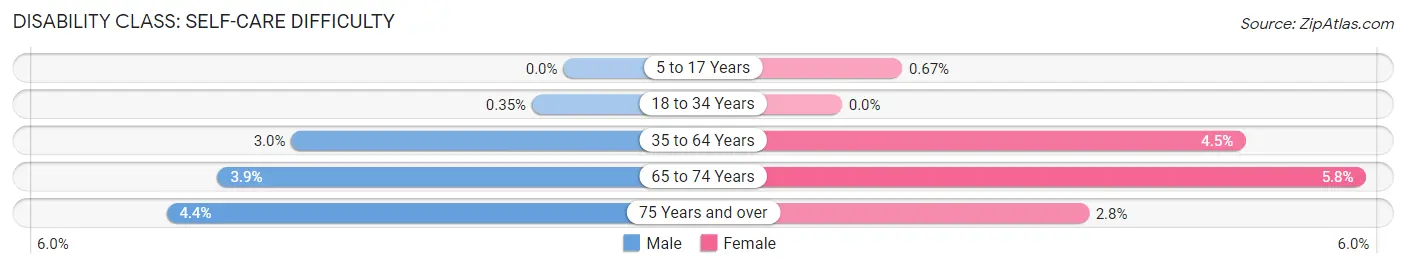
| Age Bracket | Male | Female |
| 5 to 17 Years | 0 (0.0%) | 6 (0.7%) |
| 18 to 34 Years | 3 (0.4%) | 0 (0.0%) |
| 35 to 64 Years | 43 (3.0%) | 75 (4.5%) |
| 65 to 74 Years | 10 (3.8%) | 24 (5.8%) |
| 75 Years and over | 10 (4.4%) | 8 (2.8%) |
Technology Access in Perryville
Computing Device Access in Perryville
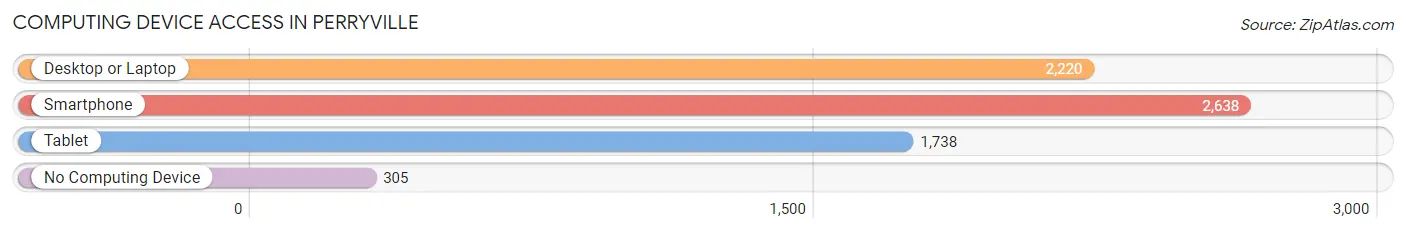
| Device Type | # Households | % Households |
| Desktop or Laptop | 2,220 | 69.3% |
| Smartphone | 2,638 | 82.3% |
| Tablet | 1,738 | 54.2% |
| No Computing Device | 305 | 9.5% |
| Total | 3,204 | 100.0% |
Internet Access in Perryville
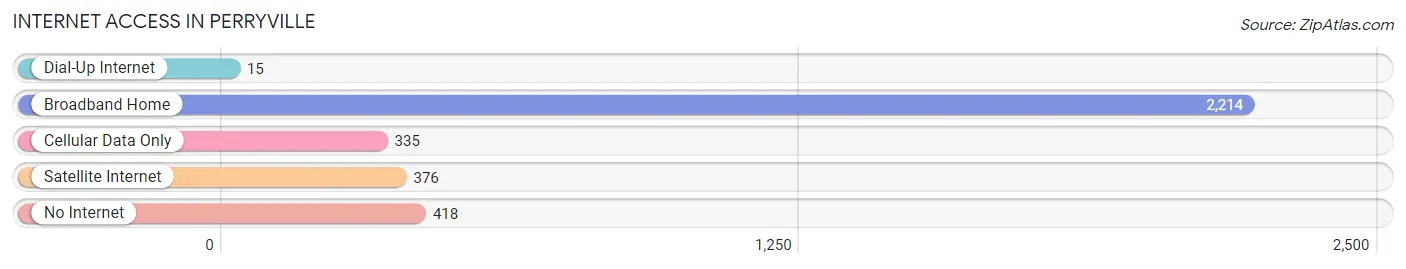
| Internet Type | # Households | % Households |
| Dial-Up Internet | 15 | 0.5% |
| Broadband Home | 2,214 | 69.1% |
| Cellular Data Only | 335 | 10.5% |
| Satellite Internet | 376 | 11.7% |
| No Internet | 418 | 13.1% |
| Total | 3,204 | 100.0% |
Perryville Summary
Perryville, Missouri is a small city located in Perry County, Missouri. It is the county seat of Perry County and is located in the southeastern part of the state. The city has a population of 8,225 as of the 2010 census.
History
Perryville was founded in 1820 by a group of settlers from Kentucky and Tennessee. The city was named after Commodore Oliver Hazard Perry, a hero of the War of 1812. The city was incorporated in 1851 and was the first city in Perry County.
In the late 19th century, Perryville was a major center for the production of tobacco. The city was also home to a large number of German immigrants, who established a number of businesses in the city.
Geography
Perryville is located in southeastern Missouri, in Perry County. It is situated at the intersection of U.S. Route 61 and Missouri Route 51. The city is located about 50 miles south of St. Louis and about 30 miles north of Cape Girardeau.
The city is situated on the banks of the Mississippi River and is surrounded by rolling hills and forests. The city is located in a humid subtropical climate zone, with hot, humid summers and mild winters.
Economy
Perryville’s economy is largely based on agriculture and manufacturing. The city is home to a number of manufacturing companies, including a large paper mill and a number of food processing plants.
The city is also home to a number of retail stores, restaurants, and other businesses. The city is also home to a number of medical facilities, including a hospital and a number of clinics.
Demographics
As of the 2010 census, Perryville had a population of 8,225. The racial makeup of the city was 95.2% White, 1.2% African American, 0.3% Native American, 0.5% Asian, 0.1% Pacific Islander, 1.2% from other races, and 1.5% from two or more races. Hispanic or Latino of any race were 3.2% of the population.
The median income for a household in the city was $37,917, and the median income for a family was $45,917. The per capita income for the city was $19,845. About 11.2% of families and 14.2% of the population were below the poverty line, including 19.2% of those under age 18 and 8.2% of those age 65 or over.
Perryville is a small city with a rich history and a diverse economy. The city is home to a number of manufacturing companies, retail stores, restaurants, and medical facilities. The city is also home to a diverse population, with a mix of races and ethnicities.
Common Questions
What is Per Capita Income in Perryville?
Per Capita income in Perryville is $26,684.
What is the Median Family Income in Perryville?
Median Family Income in Perryville is $69,180.
What is the Median Household income in Perryville?
Median Household Income in Perryville is $52,500.
What is Income or Wage Gap in Perryville?
Income or Wage Gap in Perryville is 37.5%.
Women in Perryville earn 62.5 cents for every dollar earned by a man.
What is Inequality or Gini Index in Perryville?
Inequality or Gini Index in Perryville is 0.43.
What is the Total Population of Perryville?
Total Population of Perryville is 8,536.
What is the Total Male Population of Perryville?
Total Male Population of Perryville is 3,885.
What is the Total Female Population of Perryville?
Total Female Population of Perryville is 4,651.
What is the Ratio of Males per 100 Females in Perryville?
There are 83.53 Males per 100 Females in Perryville.
What is the Ratio of Females per 100 Males in Perryville?
There are 119.72 Females per 100 Males in Perryville.
What is the Median Population Age in Perryville?
Median Population Age in Perryville is 38.2 Years.
What is the Average Family Size in Perryville
Average Family Size in Perryville is 3.2 People.
What is the Average Household Size in Perryville
Average Household Size in Perryville is 2.6 People.
How Large is the Labor Force in Perryville?
There are 4,039 People in the Labor Forcein in Perryville.
What is the Percentage of People in the Labor Force in Perryville?
61.1% of People are in the Labor Force in Perryville.
What is the Unemployment Rate in Perryville?
Unemployment Rate in Perryville is 6.4%.