Park Hills, MO Map & Demographics
Park Hills Map
Park Hills Overview
$24,734
PER CAPITA INCOME
$55,532
AVG FAMILY INCOME
$50,628
AVG HOUSEHOLD INCOME
40.9%
WAGE / INCOME GAP [ % ]
59.1¢/ $1
WAGE / INCOME GAP [ $ ]
0.44
INEQUALITY / GINI INDEX
8,653
TOTAL POPULATION
4,068
MALE POPULATION
4,585
FEMALE POPULATION
88.72
MALES / 100 FEMALES
112.71
FEMALES / 100 MALES
35.7
MEDIAN AGE
3.1
AVG FAMILY SIZE
2.5
AVG HOUSEHOLD SIZE
4,290
LABOR FORCE [ PEOPLE ]
64.0%
PERCENT IN LABOR FORCE
5.7%
UNEMPLOYMENT RATE
Park Hills Zip Codes
Park Hills Area Codes
Income in Park Hills
Income Overview in Park Hills
Per Capita Income in Park Hills is $24,734, while median incomes of families and households are $55,532 and $50,628 respectively.
| Characteristic | Number | Measure |
| Per Capita Income | 8,653 | $24,734 |
| Median Family Income | 2,131 | $55,532 |
| Mean Family Income | 2,131 | $66,200 |
| Median Household Income | 3,440 | $50,628 |
| Mean Household Income | 3,440 | $63,101 |
| Income Deficit | 2,131 | $0 |
| Wage / Income Gap (%) | 8,653 | 40.88% |
| Wage / Income Gap ($) | 8,653 | 59.12¢ per $1 |
| Gini / Inequality Index | 8,653 | 0.44 |
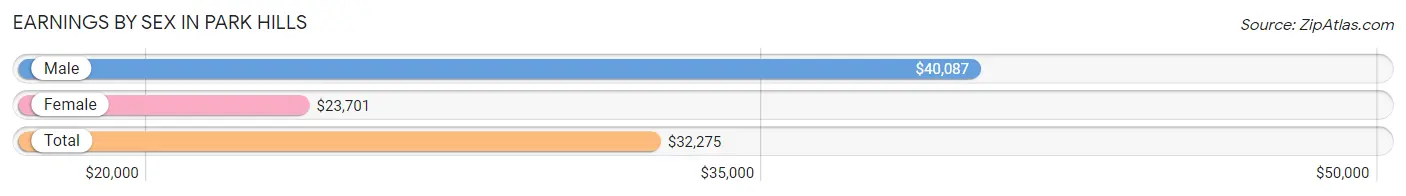
Earnings by Sex in Park Hills
Average Earnings in Park Hills are $32,275, $40,087 for men and $23,701 for women, a difference of 40.9%.
| Sex | Number | Average Earnings |
| Male | 2,048 (47.0%) | $40,087 |
| Female | 2,310 (53.0%) | $23,701 |
| Total | 4,358 (100.0%) | $32,275 |
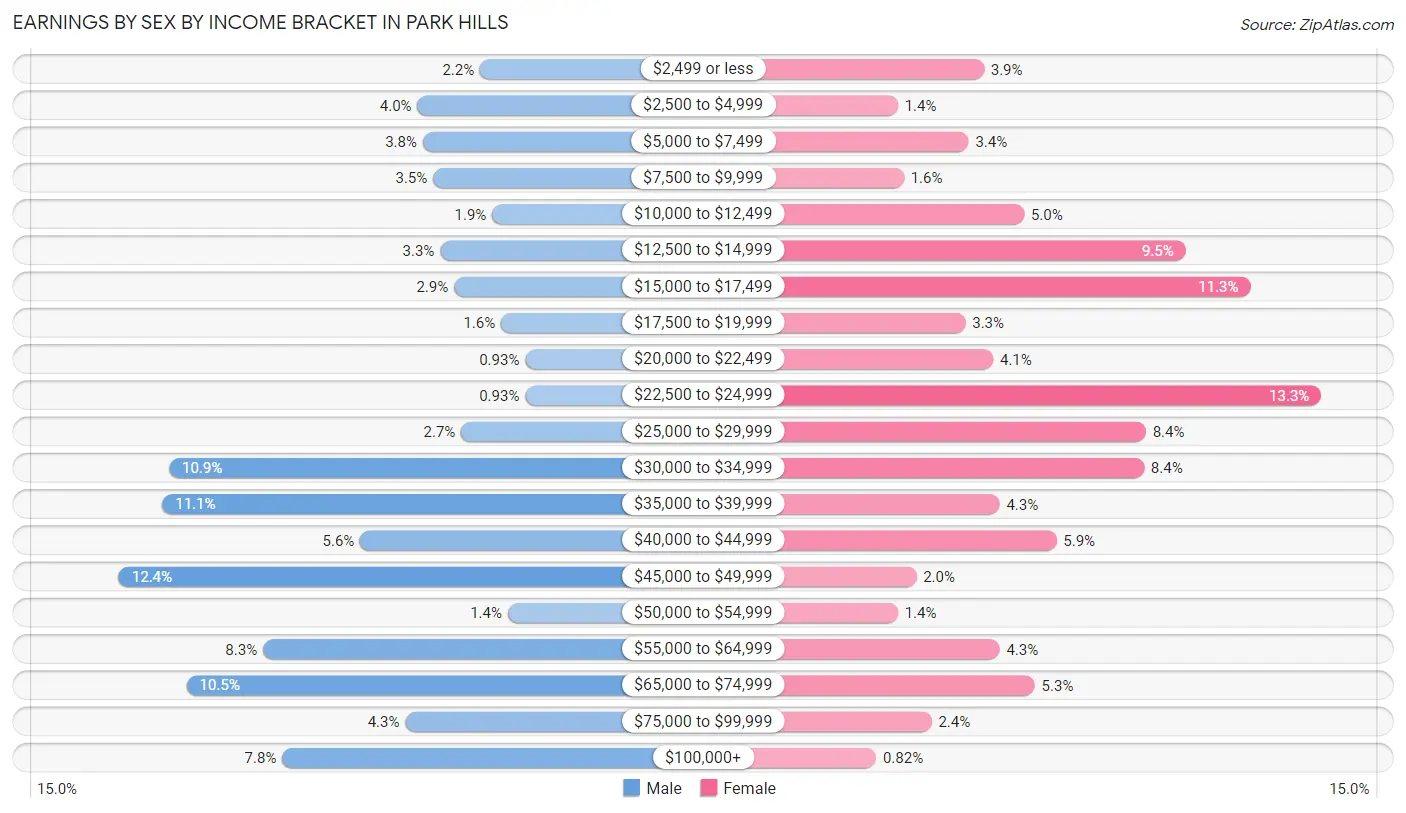
Earnings by Sex by Income Bracket in Park Hills
The most common earnings brackets in Park Hills are $45,000 to $49,999 for men (253 | 12.3%) and $22,500 to $24,999 for women (308 | 13.3%).
| Income | Male | Female |
| $2,499 or less | 45 (2.2%) | 89 (3.8%) |
| $2,500 to $4,999 | 81 (4.0%) | 33 (1.4%) |
| $5,000 to $7,499 | 78 (3.8%) | 79 (3.4%) |
| $7,500 to $9,999 | 72 (3.5%) | 37 (1.6%) |
| $10,000 to $12,499 | 38 (1.9%) | 115 (5.0%) |
| $12,500 to $14,999 | 68 (3.3%) | 220 (9.5%) |
| $15,000 to $17,499 | 60 (2.9%) | 262 (11.3%) |
| $17,500 to $19,999 | 33 (1.6%) | 77 (3.3%) |
| $20,000 to $22,499 | 19 (0.9%) | 95 (4.1%) |
| $22,500 to $24,999 | 19 (0.9%) | 308 (13.3%) |
| $25,000 to $29,999 | 56 (2.7%) | 194 (8.4%) |
| $30,000 to $34,999 | 224 (10.9%) | 193 (8.4%) |
| $35,000 to $39,999 | 228 (11.1%) | 99 (4.3%) |
| $40,000 to $44,999 | 114 (5.6%) | 136 (5.9%) |
| $45,000 to $49,999 | 253 (12.3%) | 45 (1.9%) |
| $50,000 to $54,999 | 29 (1.4%) | 33 (1.4%) |
| $55,000 to $64,999 | 170 (8.3%) | 99 (4.3%) |
| $65,000 to $74,999 | 214 (10.4%) | 122 (5.3%) |
| $75,000 to $99,999 | 88 (4.3%) | 55 (2.4%) |
| $100,000+ | 159 (7.8%) | 19 (0.8%) |
| Total | 2,048 (100.0%) | 2,310 (100.0%) |
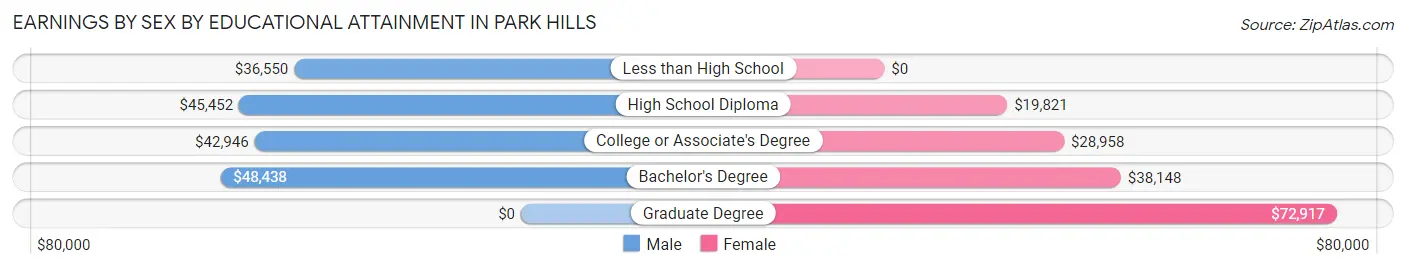
Earnings by Sex by Educational Attainment in Park Hills
Average earnings in Park Hills are $45,119 for men and $24,394 for women, a difference of 45.9%. Men with an educational attainment of bachelor's degree enjoy the highest average annual earnings of $48,438, while those with less than high school education earn the least with $36,550. Women with an educational attainment of graduate degree earn the most with the average annual earnings of $72,917, while those with high school diploma education have the smallest earnings of $19,821.
| Educational Attainment | Male Income | Female Income |
| Less than High School | $36,550 | $0 |
| High School Diploma | $45,452 | $19,821 |
| College or Associate's Degree | $42,946 | $28,958 |
| Bachelor's Degree | $48,438 | $38,148 |
| Graduate Degree | - | - |
| Total | $45,119 | $24,394 |
Family Income in Park Hills
Family Income Brackets in Park Hills
According to the Park Hills family income data, there are 460 families falling into the $50,000 to $74,999 income range, which is the most common income bracket and makes up 21.6% of all families. Conversely, the $10,000 to $14,999 income bracket is the least frequent group with only 9 families (0.4%) belonging to this category.
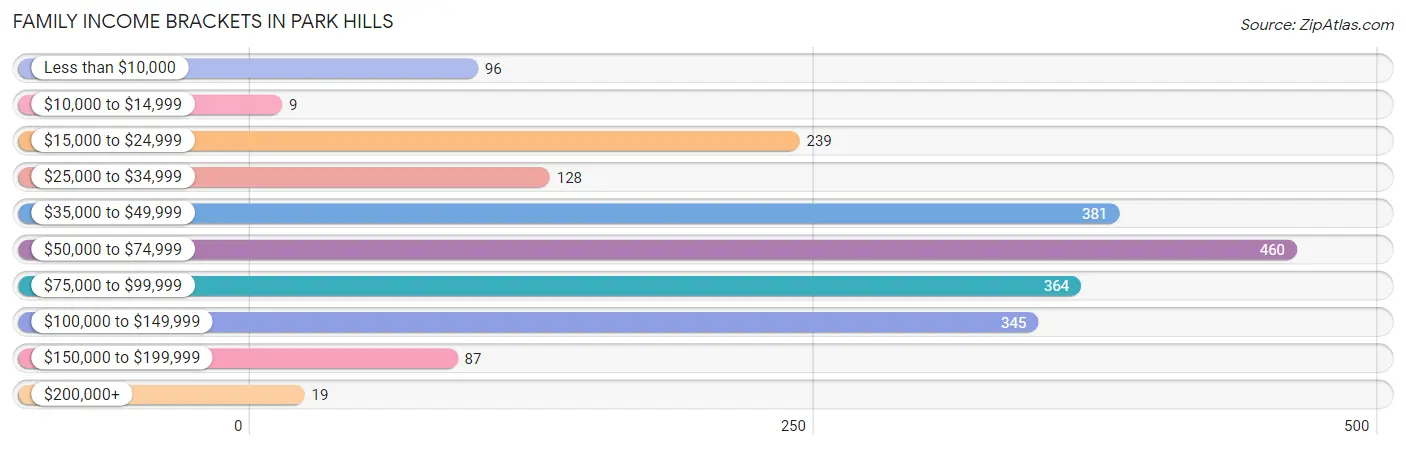
| Income Bracket | # Families | % Families |
| Less than $10,000 | 96 | 4.5% |
| $10,000 to $14,999 | 9 | 0.4% |
| $15,000 to $24,999 | 239 | 11.2% |
| $25,000 to $34,999 | 128 | 6.0% |
| $35,000 to $49,999 | 381 | 17.9% |
| $50,000 to $74,999 | 460 | 21.6% |
| $75,000 to $99,999 | 364 | 17.1% |
| $100,000 to $149,999 | 345 | 16.2% |
| $150,000 to $199,999 | 87 | 4.1% |
| $200,000+ | 19 | 0.9% |
Family Income by Famaliy Size in Park Hills
4-person families (618 | 29.0%) account for the highest median family income in Park Hills with $81,398 per family, while 2-person families (876 | 41.1%) have the highest median income of $25,502 per family member.
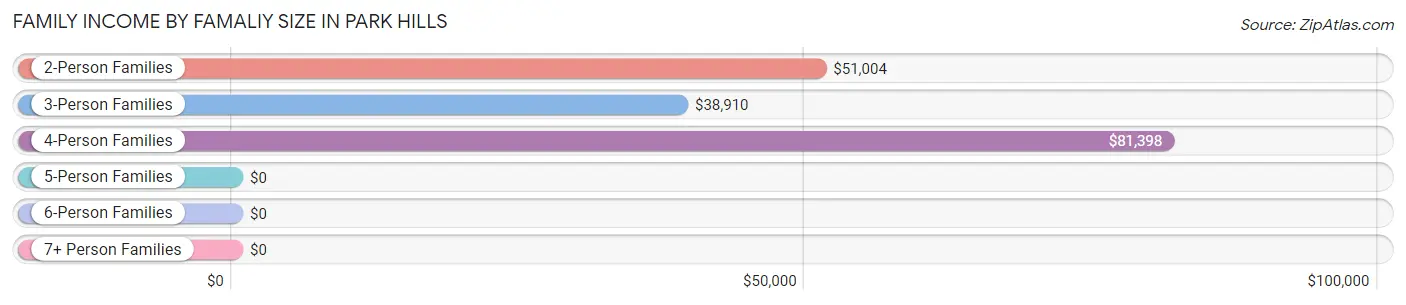
| Income Bracket | # Families | Median Income |
| 2-Person Families | 876 (41.1%) | $51,004 |
| 3-Person Families | 498 (23.4%) | $38,910 |
| 4-Person Families | 618 (29.0%) | $81,398 |
| 5-Person Families | 91 (4.3%) | $0 |
| 6-Person Families | 48 (2.2%) | $0 |
| 7+ Person Families | 0 (0.0%) | $0 |
| Total | 2,131 (100.0%) | $55,532 |
Family Income by Number of Earners in Park Hills
The median family income in Park Hills is $55,532, with families comprising 3+ earners (207) having the highest median family income of $110,625, while families with no earners (324) have the lowest median family income of $35,379, accounting for 9.7% and 15.2% of families, respectively.
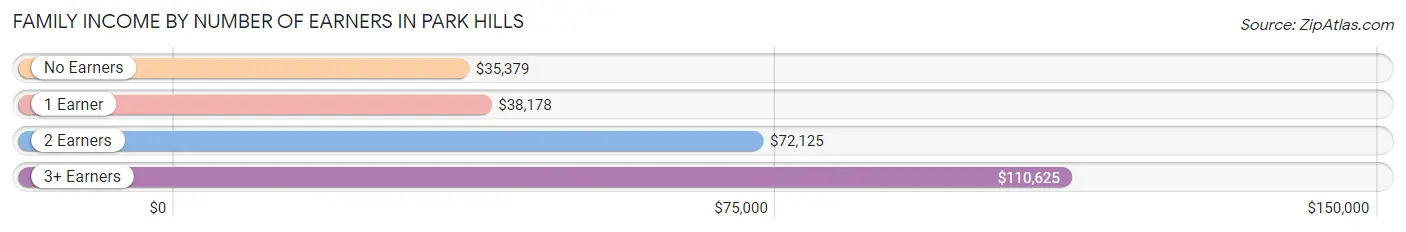
| Number of Earners | # Families | Median Income |
| No Earners | 324 (15.2%) | $35,379 |
| 1 Earner | 722 (33.9%) | $38,178 |
| 2 Earners | 878 (41.2%) | $72,125 |
| 3+ Earners | 207 (9.7%) | $110,625 |
| Total | 2,131 (100.0%) | $55,532 |
Household Income in Park Hills
Household Income Brackets in Park Hills
With 681 households falling in the category, the $15,000 to $24,999 income range is the most frequent in Park Hills, accounting for 19.8% of all households. In contrast, only 62 households (1.8%) fall into the $200,000+ income bracket, making it the least populous group.
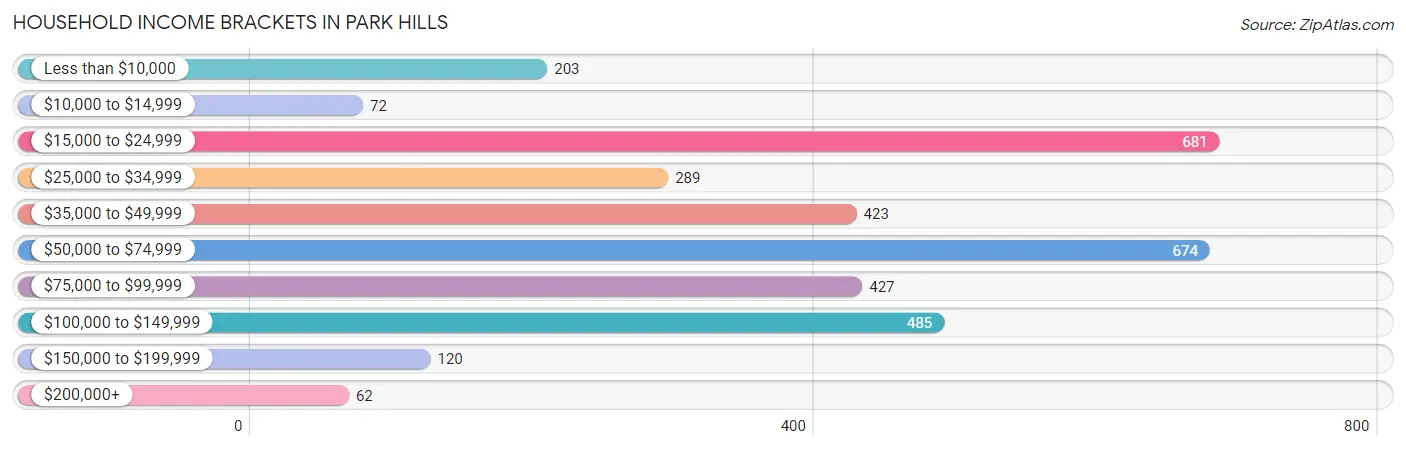
| Income Bracket | # Households | % Households |
| Less than $10,000 | 203 | 5.9% |
| $10,000 to $14,999 | 72 | 2.1% |
| $15,000 to $24,999 | 681 | 19.8% |
| $25,000 to $34,999 | 289 | 8.4% |
| $35,000 to $49,999 | 423 | 12.3% |
| $50,000 to $74,999 | 674 | 19.6% |
| $75,000 to $99,999 | 427 | 12.4% |
| $100,000 to $149,999 | 485 | 14.1% |
| $150,000 to $199,999 | 120 | 3.5% |
| $200,000+ | 62 | 1.8% |
Household Income by Householder Age in Park Hills
The median household income in Park Hills is $50,628, with the highest median household income of $62,129 found in the 25 to 44 years age bracket for the primary householder. A total of 1,207 households (35.1%) fall into this category. Meanwhile, the 65+ years age bracket for the primary householder has the lowest median household income of $30,313, with 846 households (24.6%) in this group.
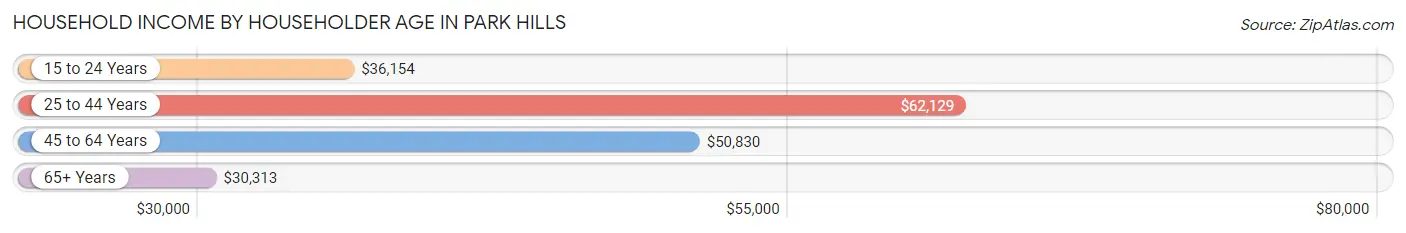
| Income Bracket | # Households | Median Income |
| 15 to 24 Years | 308 (8.9%) | $36,154 |
| 25 to 44 Years | 1,207 (35.1%) | $62,129 |
| 45 to 64 Years | 1,079 (31.4%) | $50,830 |
| 65+ Years | 846 (24.6%) | $30,313 |
| Total | 3,440 (100.0%) | $50,628 |
Poverty in Park Hills
Income Below Poverty by Sex and Age in Park Hills
With 15.1% poverty level for males and 16.6% for females among the residents of Park Hills, 12 to 14 year old males and 16 and 17 year old females are the most vulnerable to poverty, with 71 males (33.8%) and 48 females (36.6%) in their respective age groups living below the poverty level.
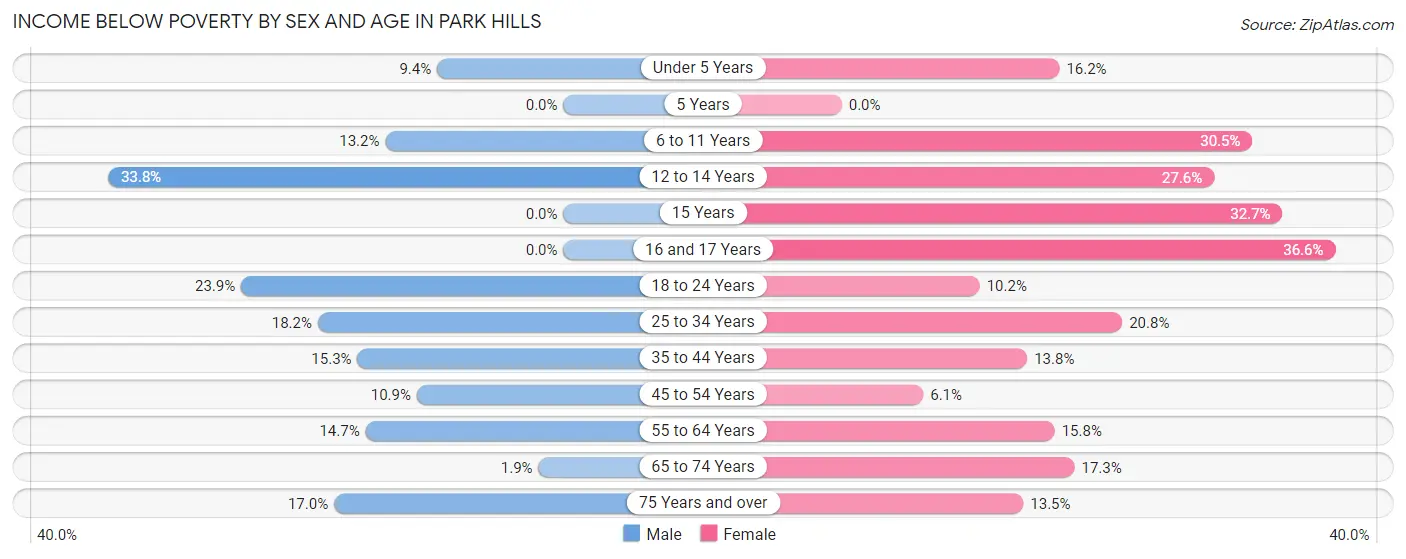
| Age Bracket | Male | Female |
| Under 5 Years | 35 (9.4%) | 64 (16.2%) |
| 5 Years | 0 (0.0%) | 0 (0.0%) |
| 6 to 11 Years | 46 (13.2%) | 82 (30.5%) |
| 12 to 14 Years | 71 (33.8%) | 34 (27.6%) |
| 15 Years | 0 (0.0%) | 35 (32.7%) |
| 16 and 17 Years | 0 (0.0%) | 48 (36.6%) |
| 18 to 24 Years | 112 (23.9%) | 56 (10.2%) |
| 25 to 34 Years | 76 (18.2%) | 122 (20.8%) |
| 35 to 44 Years | 98 (15.3%) | 99 (13.8%) |
| 45 to 54 Years | 31 (10.9%) | 28 (6.0%) |
| 55 to 64 Years | 73 (14.7%) | 95 (15.8%) |
| 65 to 74 Years | 6 (1.8%) | 47 (17.3%) |
| 75 Years and over | 55 (17.0%) | 38 (13.5%) |
| Total | 603 (15.1%) | 748 (16.6%) |
Income Above Poverty by Sex and Age in Park Hills
According to the poverty statistics in Park Hills, males aged 5 years and females aged 45 to 54 years are the age groups that are most secure financially, with 100.0% of males and 94.0% of females in these age groups living above the poverty line.
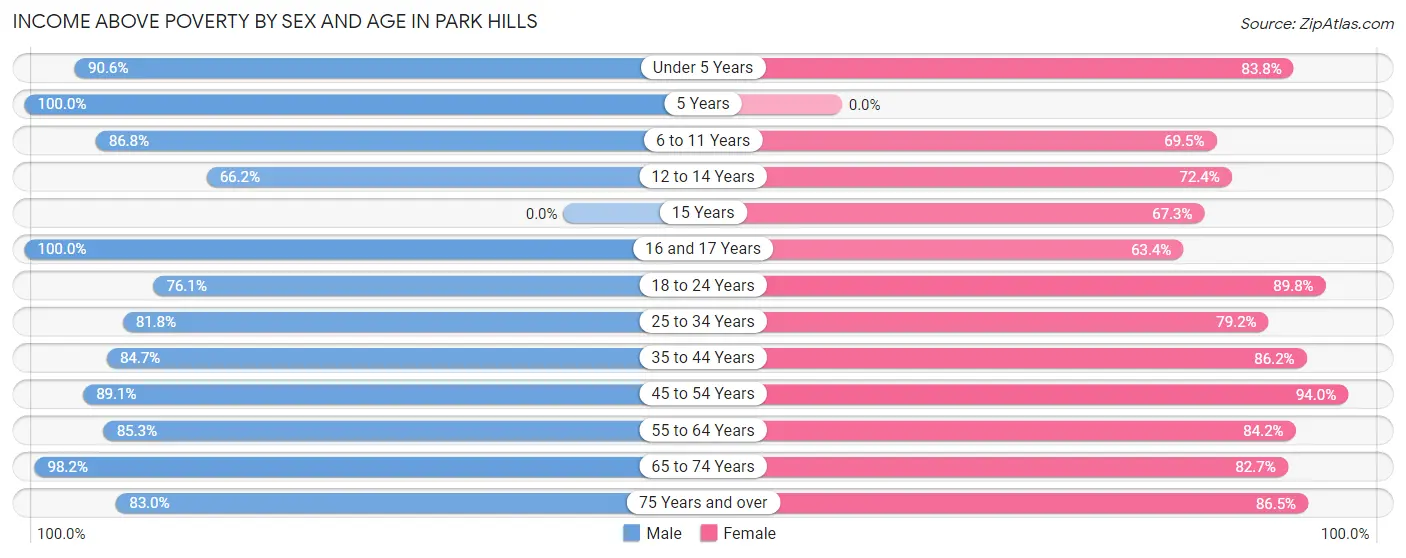
| Age Bracket | Male | Female |
| Under 5 Years | 338 (90.6%) | 332 (83.8%) |
| 5 Years | 60 (100.0%) | 0 (0.0%) |
| 6 to 11 Years | 302 (86.8%) | 187 (69.5%) |
| 12 to 14 Years | 139 (66.2%) | 89 (72.4%) |
| 15 Years | 0 (0.0%) | 72 (67.3%) |
| 16 and 17 Years | 57 (100.0%) | 83 (63.4%) |
| 18 to 24 Years | 356 (76.1%) | 491 (89.8%) |
| 25 to 34 Years | 341 (81.8%) | 464 (79.2%) |
| 35 to 44 Years | 543 (84.7%) | 620 (86.2%) |
| 45 to 54 Years | 254 (89.1%) | 435 (94.0%) |
| 55 to 64 Years | 424 (85.3%) | 506 (84.2%) |
| 65 to 74 Years | 319 (98.2%) | 225 (82.7%) |
| 75 Years and over | 268 (83.0%) | 244 (86.5%) |
| Total | 3,401 (84.9%) | 3,748 (83.4%) |
Income Below Poverty Among Married-Couple Families in Park Hills
The poverty statistics for married-couple families in Park Hills show that 5.3% or 73 of the total 1,389 families live below the poverty line. Families with 3 or 4 children have the highest poverty rate of 15.8%, comprising of 12 families. On the other hand, families with 1 or 2 children have the lowest poverty rate of 0.0%, which includes 0 families.
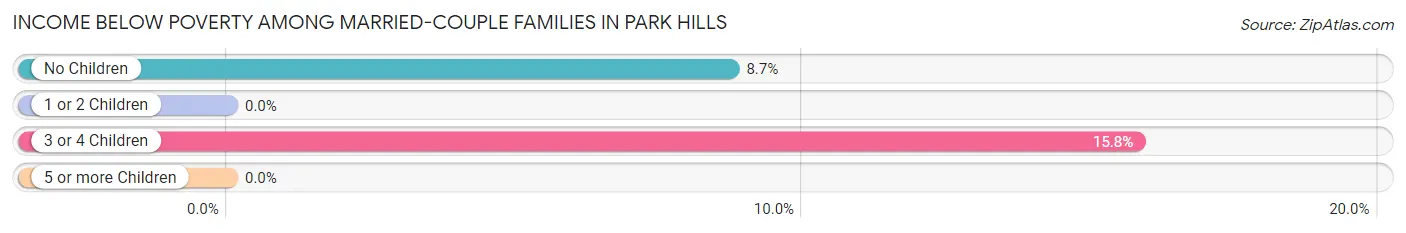
| Children | Above Poverty | Below Poverty |
| No Children | 638 (91.3%) | 61 (8.7%) |
| 1 or 2 Children | 614 (100.0%) | 0 (0.0%) |
| 3 or 4 Children | 64 (84.2%) | 12 (15.8%) |
| 5 or more Children | 0 (0.0%) | 0 (0.0%) |
| Total | 1,316 (94.7%) | 73 (5.3%) |
Income Below Poverty Among Single-Parent Households in Park Hills
According to the poverty data in Park Hills, 8.8% or 27 single-father households and 52.7% or 230 single-mother households are living below the poverty line. Among single-father households, those with 3 or 4 children have the highest poverty rate, with 27 households (100.0%) experiencing poverty. Likewise, among single-mother households, those with 3 or 4 children have the highest poverty rate, with 34 households (89.5%) falling below the poverty line.
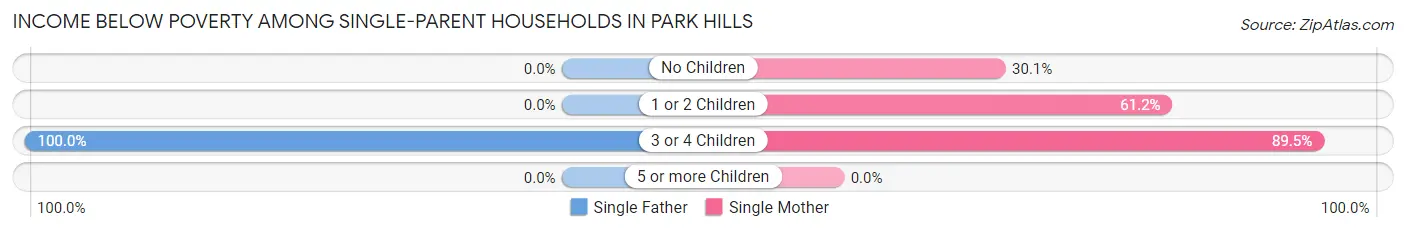
| Children | Single Father | Single Mother |
| No Children | 0 (0.0%) | 46 (30.1%) |
| 1 or 2 Children | 0 (0.0%) | 150 (61.2%) |
| 3 or 4 Children | 27 (100.0%) | 34 (89.5%) |
| 5 or more Children | 0 (0.0%) | 0 (0.0%) |
| Total | 27 (8.8%) | 230 (52.7%) |
Income Below Poverty Among Married-Couple vs Single-Parent Households in Park Hills
The poverty data for Park Hills shows that 73 of the married-couple family households (5.3%) and 257 of the single-parent households (34.6%) are living below the poverty level. Within the married-couple family households, those with 3 or 4 children have the highest poverty rate, with 12 households (15.8%) falling below the poverty line. Among the single-parent households, those with 3 or 4 children have the highest poverty rate, with 61 household (93.9%) living below poverty.
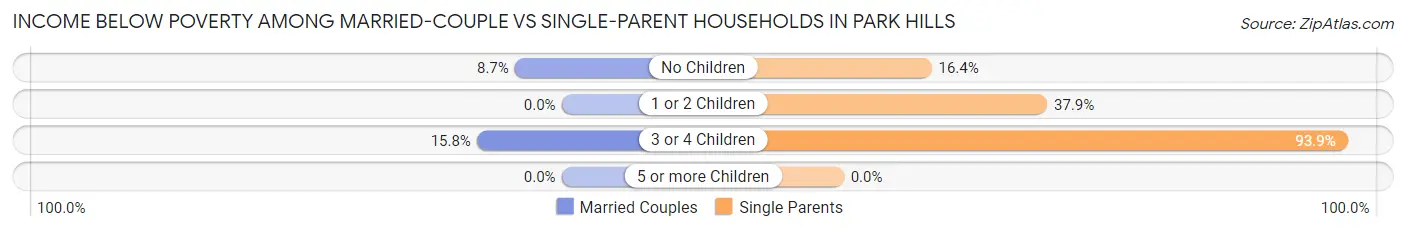
| Children | Married-Couple Families | Single-Parent Households |
| No Children | 61 (8.7%) | 46 (16.4%) |
| 1 or 2 Children | 0 (0.0%) | 150 (37.9%) |
| 3 or 4 Children | 12 (15.8%) | 61 (93.9%) |
| 5 or more Children | 0 (0.0%) | 0 (0.0%) |
| Total | 73 (5.3%) | 257 (34.6%) |
Race in Park Hills
The most populous races in Park Hills are White / Caucasian (8,148 | 94.2%), Two or more Races (501 | 5.8%), and Hispanic or Latino (73 | 0.8%).
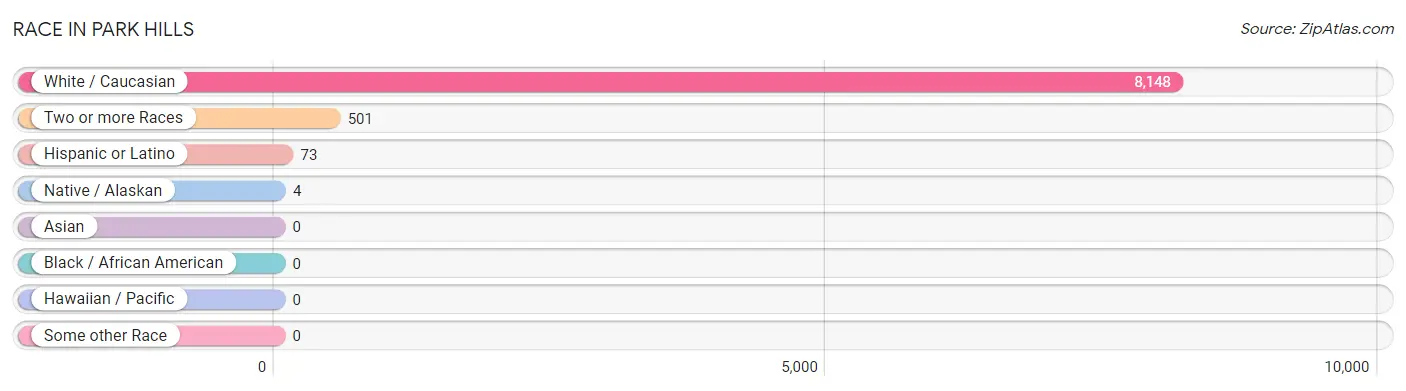
| Race | # Population | % Population |
| Asian | 0 | 0.0% |
| Black / African American | 0 | 0.0% |
| Hawaiian / Pacific | 0 | 0.0% |
| Hispanic or Latino | 73 | 0.8% |
| Native / Alaskan | 4 | 0.1% |
| White / Caucasian | 8,148 | 94.2% |
| Two or more Races | 501 | 5.8% |
| Some other Race | 0 | 0.0% |
| Total | 8,653 | 100.0% |
Ancestry in Park Hills
The most populous ancestries reported in Park Hills are American (1,730 | 20.0%), German (1,686 | 19.5%), English (908 | 10.5%), Irish (786 | 9.1%), and French (342 | 4.0%), together accounting for 63.0% of all Park Hills residents.
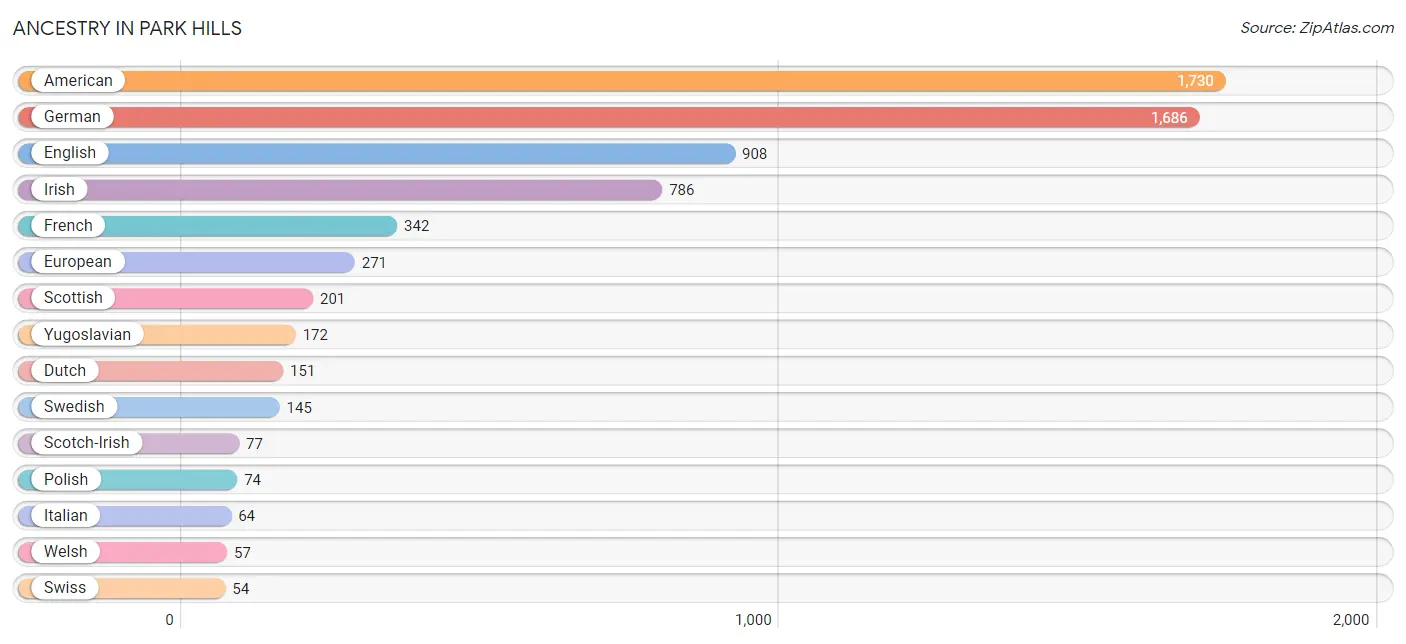
| Ancestry | # Population | % Population |
| American | 1,730 | 20.0% |
| Apache | 12 | 0.1% |
| Arab | 17 | 0.2% |
| Belgian | 43 | 0.5% |
| British | 10 | 0.1% |
| Central American | 49 | 0.6% |
| Cherokee | 20 | 0.2% |
| Choctaw | 7 | 0.1% |
| Dutch | 151 | 1.8% |
| English | 908 | 10.5% |
| European | 271 | 3.1% |
| French | 342 | 4.0% |
| German | 1,686 | 19.5% |
| Honduran | 49 | 0.6% |
| Hungarian | 19 | 0.2% |
| Irish | 786 | 9.1% |
| Italian | 64 | 0.7% |
| Lebanese | 17 | 0.2% |
| Mexican | 24 | 0.3% |
| Mexican American Indian | 19 | 0.2% |
| Native Hawaiian | 53 | 0.6% |
| Norwegian | 25 | 0.3% |
| Polish | 74 | 0.9% |
| Scotch-Irish | 77 | 0.9% |
| Scottish | 201 | 2.3% |
| Swedish | 145 | 1.7% |
| Swiss | 54 | 0.6% |
| Welsh | 57 | 0.7% |
| Yugoslavian | 172 | 2.0% | View All 29 Rows |
Immigrants in Park Hills

| Immigration Origin | # Population | % Population | View All 0 Rows |
Sex and Age in Park Hills
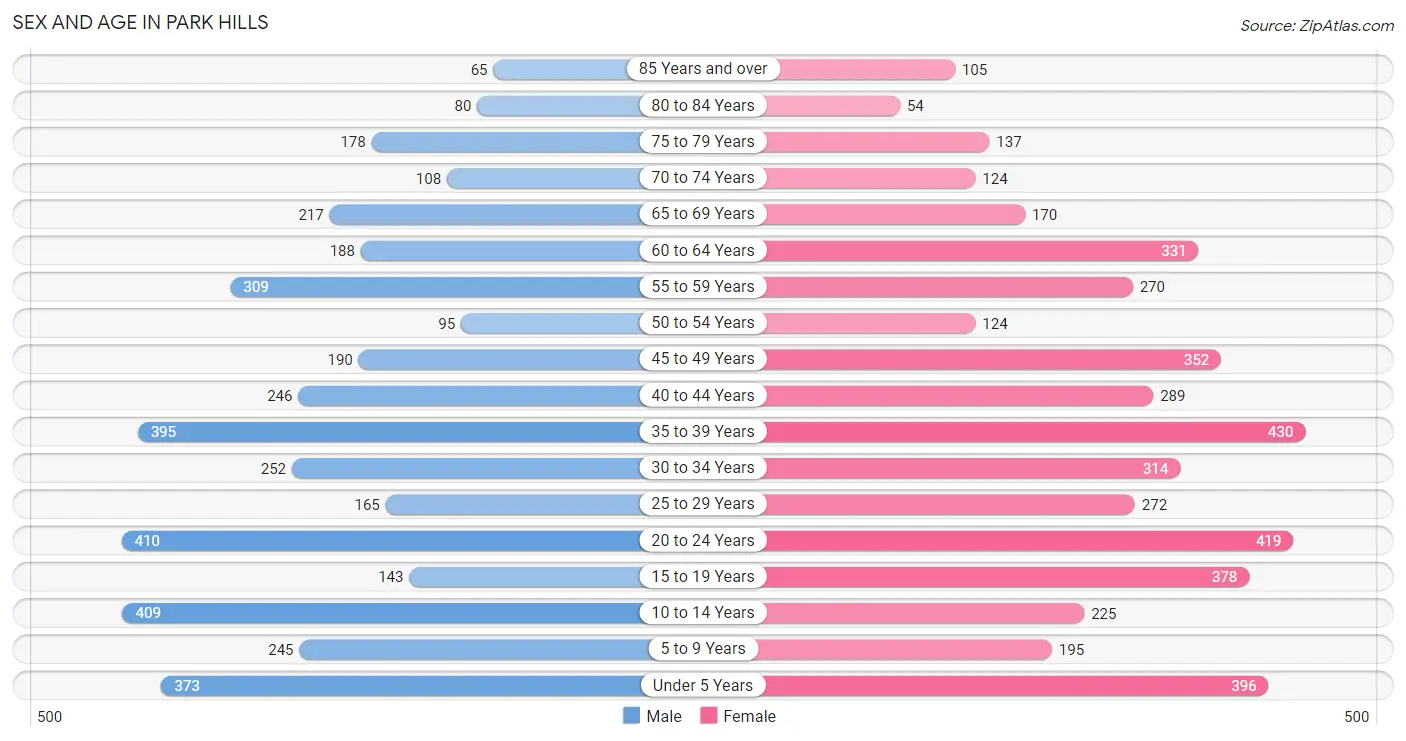
Sex and Age in Park Hills
The most populous age groups in Park Hills are 20 to 24 Years (410 | 10.1%) for men and 35 to 39 Years (430 | 9.4%) for women.
| Age Bracket | Male | Female |
| Under 5 Years | 373 (9.2%) | 396 (8.6%) |
| 5 to 9 Years | 245 (6.0%) | 195 (4.3%) |
| 10 to 14 Years | 409 (10.1%) | 225 (4.9%) |
| 15 to 19 Years | 143 (3.5%) | 378 (8.2%) |
| 20 to 24 Years | 410 (10.1%) | 419 (9.1%) |
| 25 to 29 Years | 165 (4.1%) | 272 (5.9%) |
| 30 to 34 Years | 252 (6.2%) | 314 (6.9%) |
| 35 to 39 Years | 395 (9.7%) | 430 (9.4%) |
| 40 to 44 Years | 246 (6.0%) | 289 (6.3%) |
| 45 to 49 Years | 190 (4.7%) | 352 (7.7%) |
| 50 to 54 Years | 95 (2.3%) | 124 (2.7%) |
| 55 to 59 Years | 309 (7.6%) | 270 (5.9%) |
| 60 to 64 Years | 188 (4.6%) | 331 (7.2%) |
| 65 to 69 Years | 217 (5.3%) | 170 (3.7%) |
| 70 to 74 Years | 108 (2.6%) | 124 (2.7%) |
| 75 to 79 Years | 178 (4.4%) | 137 (3.0%) |
| 80 to 84 Years | 80 (2.0%) | 54 (1.2%) |
| 85 Years and over | 65 (1.6%) | 105 (2.3%) |
| Total | 4,068 (100.0%) | 4,585 (100.0%) |
Families and Households in Park Hills
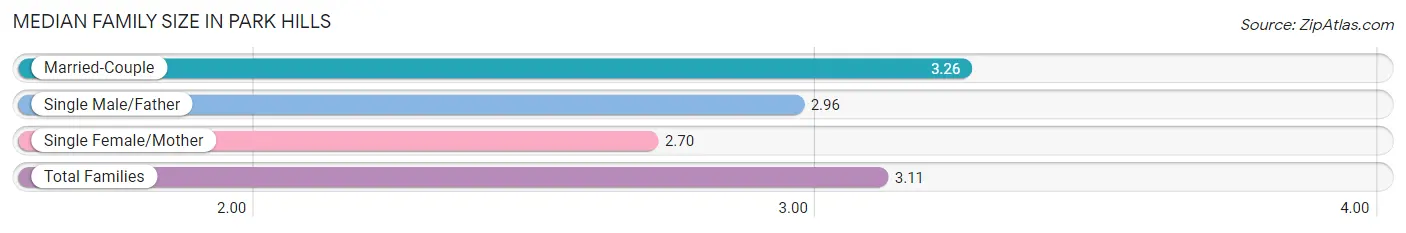
Median Family Size in Park Hills
The median family size in Park Hills is 3.11 persons per family, with married-couple families (1,389 | 65.2%) accounting for the largest median family size of 3.26 persons per family. On the other hand, single female/mother families (436 | 20.5%) represent the smallest median family size with 2.70 persons per family.
| Family Type | # Families | Family Size |
| Married-Couple | 1,389 (65.2%) | 3.26 |
| Single Male/Father | 306 (14.4%) | 2.96 |
| Single Female/Mother | 436 (20.5%) | 2.70 |
| Total Families | 2,131 (100.0%) | 3.11 |
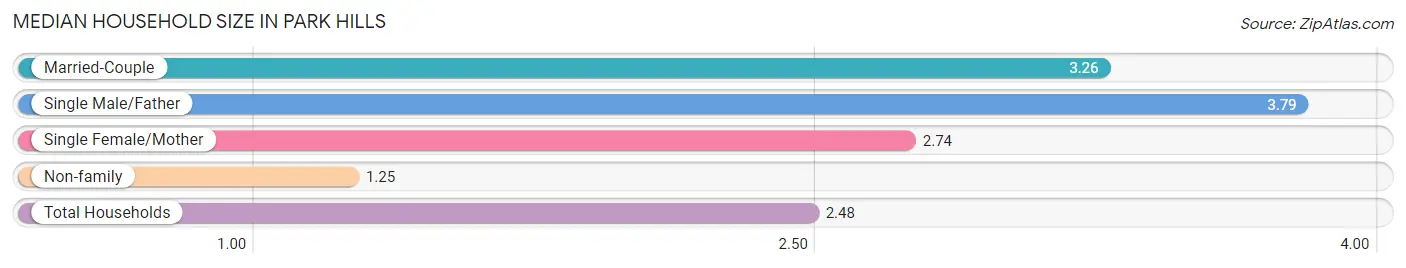
Median Household Size in Park Hills
The median household size in Park Hills is 2.48 persons per household, with single male/father households (306 | 8.9%) accounting for the largest median household size of 3.79 persons per household. non-family households (1,309 | 38.1%) represent the smallest median household size with 1.25 persons per household.
| Household Type | # Households | Household Size |
| Married-Couple | 1,389 (40.4%) | 3.26 |
| Single Male/Father | 306 (8.9%) | 3.79 |
| Single Female/Mother | 436 (12.7%) | 2.74 |
| Non-family | 1,309 (38.1%) | 1.25 |
| Total Households | 3,440 (100.0%) | 2.48 |
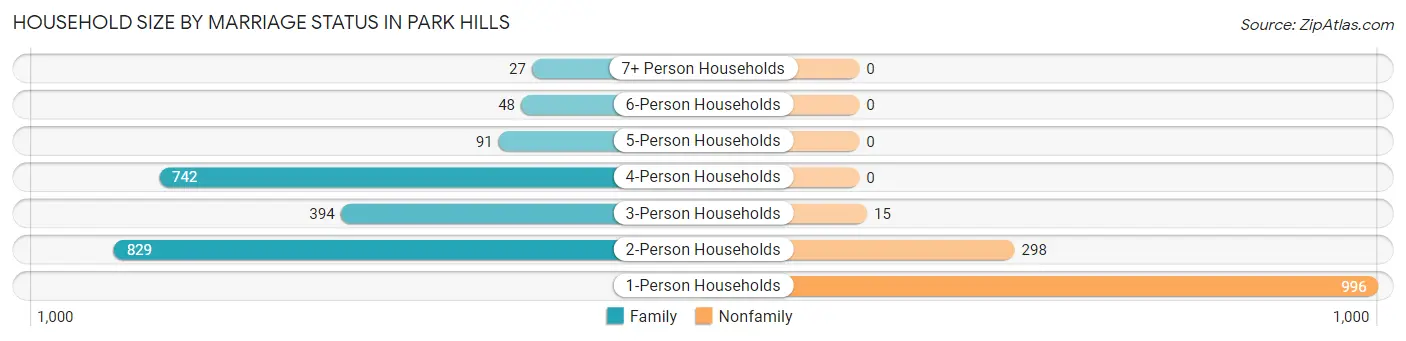
Household Size by Marriage Status in Park Hills
Out of a total of 3,440 households in Park Hills, 2,131 (62.0%) are family households, while 1,309 (38.1%) are nonfamily households. The most numerous type of family households are 2-person households, comprising 829, and the most common type of nonfamily households are 1-person households, comprising 996.
| Household Size | Family Households | Nonfamily Households |
| 1-Person Households | - | 996 (28.9%) |
| 2-Person Households | 829 (24.1%) | 298 (8.7%) |
| 3-Person Households | 394 (11.5%) | 15 (0.4%) |
| 4-Person Households | 742 (21.6%) | 0 (0.0%) |
| 5-Person Households | 91 (2.6%) | 0 (0.0%) |
| 6-Person Households | 48 (1.4%) | 0 (0.0%) |
| 7+ Person Households | 27 (0.8%) | 0 (0.0%) |
| Total | 2,131 (62.0%) | 1,309 (38.1%) |
Female Fertility in Park Hills
Fertility by Age in Park Hills
Average fertility rate in Park Hills is 58.0 births per 1,000 women. Women in the age bracket of 20 to 34 years have the highest fertility rate with 134.0 births per 1,000 women. Women in the age bracket of 20 to 34 years acount for 93.8% of all women with births.
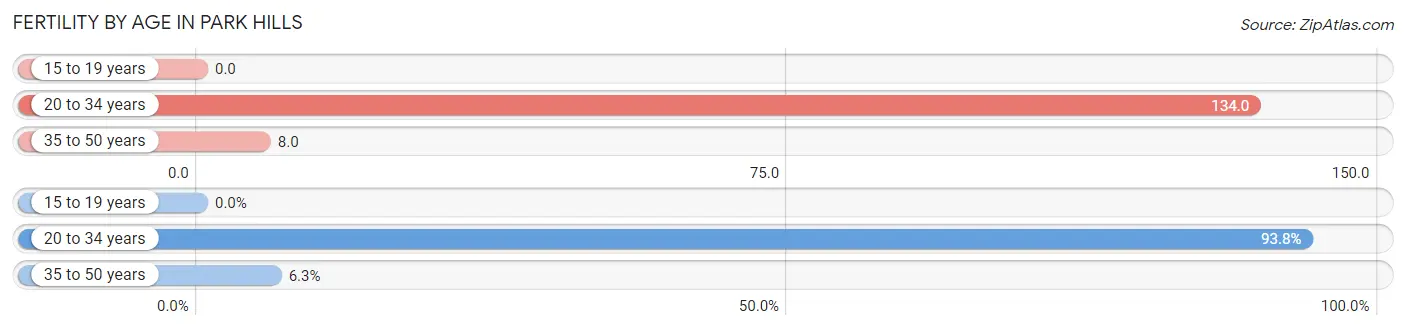
| Age Bracket | Women with Births | Births / 1,000 Women |
| 15 to 19 years | 0 (0.0%) | 0.0 |
| 20 to 34 years | 135 (93.8%) | 134.0 |
| 35 to 50 years | 9 (6.2%) | 8.0 |
| Total | 144 (100.0%) | 58.0 |
Fertility by Age by Marriage Status in Park Hills
56.9% of women with births (144) in Park Hills are married. The highest percentage of unmarried women with births falls into 20 to 34 years age bracket with 45.9% of them unmarried at the time of birth, while the lowest percentage of unmarried women with births belong to 35 to 50 years age bracket with 0.0% of them unmarried.
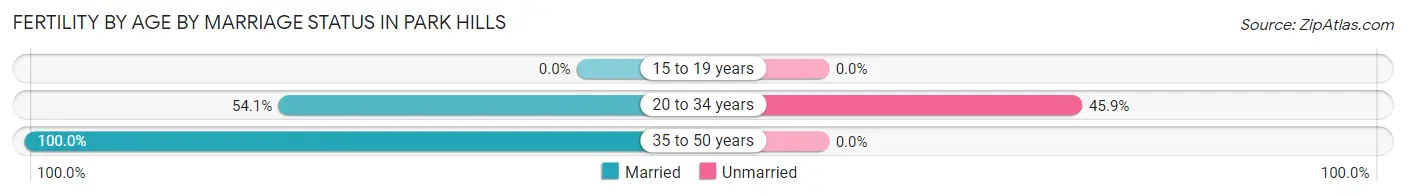
| Age Bracket | Married | Unmarried |
| 15 to 19 years | 0 (0.0%) | 0 (0.0%) |
| 20 to 34 years | 73 (54.1%) | 62 (45.9%) |
| 35 to 50 years | 9 (100.0%) | 0 (0.0%) |
| Total | 82 (56.9%) | 62 (43.1%) |
Fertility by Education in Park Hills
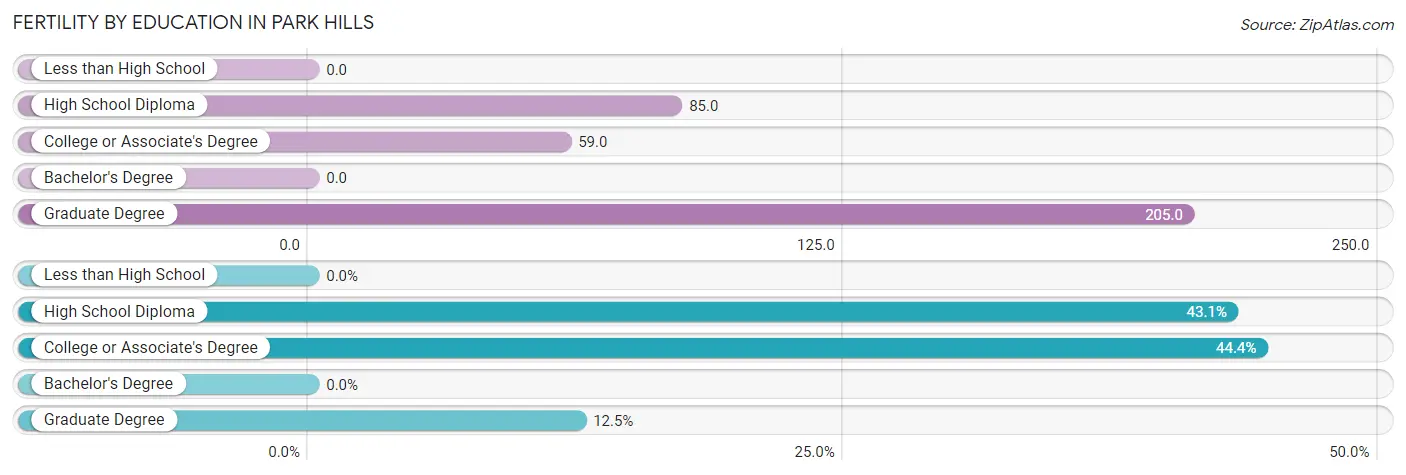
| Educational Attainment | Women with Births | Births / 1,000 Women |
| Less than High School | 0 (0.0%) | 0.0 |
| High School Diploma | 62 (43.1%) | 85.0 |
| College or Associate's Degree | 64 (44.4%) | 59.0 |
| Bachelor's Degree | 0 (0.0%) | 0.0 |
| Graduate Degree | 18 (12.5%) | 205.0 |
| Total | 144 (100.0%) | 58.0 |
Fertility by Education by Marriage Status in Park Hills
43.1% of women with births in Park Hills are unmarried. Women with the educational attainment of college or associate's degree are most likely to be married with 100.0% of them married at childbirth, while women with the educational attainment of high school diploma are least likely to be married with 100.0% of them unmarried at childbirth.
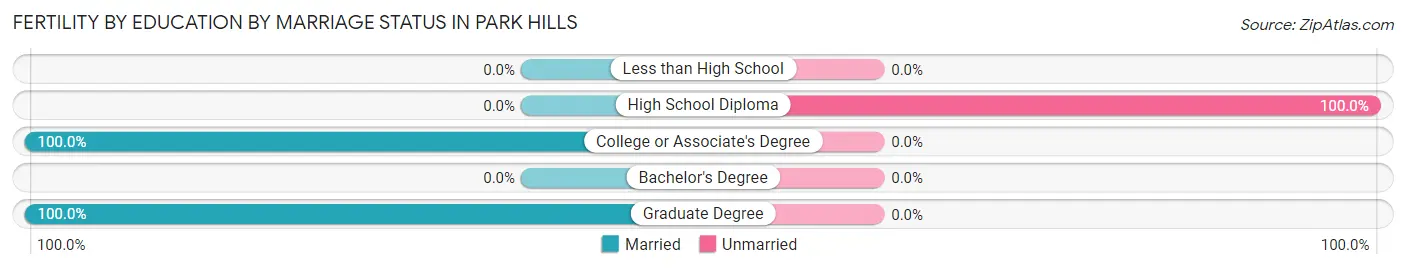
| Educational Attainment | Married | Unmarried |
| Less than High School | 0 (0.0%) | 0 (0.0%) |
| High School Diploma | 0 (0.0%) | 62 (100.0%) |
| College or Associate's Degree | 64 (100.0%) | 0 (0.0%) |
| Bachelor's Degree | 0 (0.0%) | 0 (0.0%) |
| Graduate Degree | 18 (100.0%) | 0 (0.0%) |
| Total | 82 (56.9%) | 62 (43.1%) |
Employment Characteristics in Park Hills
Employment by Class of Employer in Park Hills
Among the 4,001 employed individuals in Park Hills, private company employees (2,703 | 67.6%), state government employees (503 | 12.6%), and local government employees (297 | 7.4%) make up the most common classes of employment.
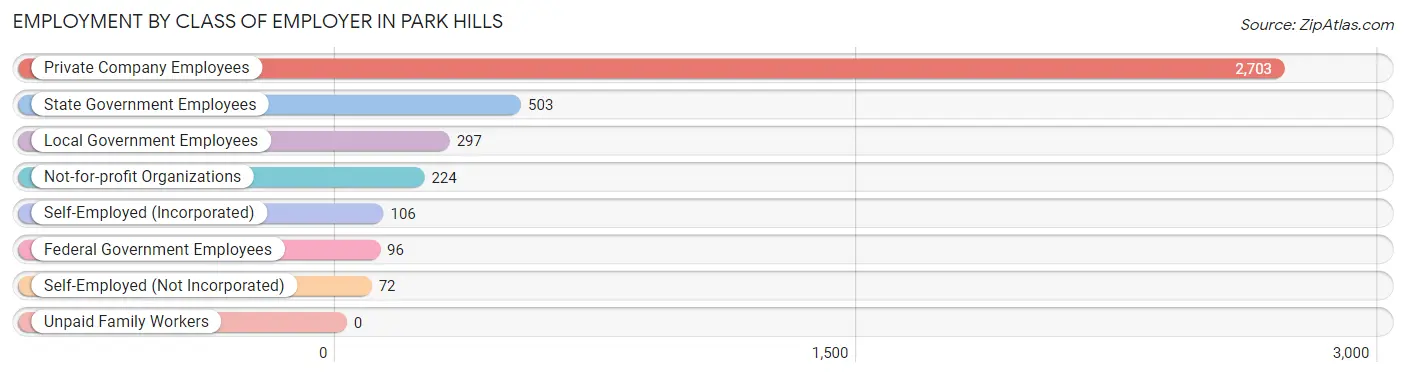
| Employer Class | # Employees | % Employees |
| Private Company Employees | 2,703 | 67.6% |
| Self-Employed (Incorporated) | 106 | 2.6% |
| Self-Employed (Not Incorporated) | 72 | 1.8% |
| Not-for-profit Organizations | 224 | 5.6% |
| Local Government Employees | 297 | 7.4% |
| State Government Employees | 503 | 12.6% |
| Federal Government Employees | 96 | 2.4% |
| Unpaid Family Workers | 0 | 0.0% |
| Total | 4,001 | 100.0% |
Employment Status by Age in Park Hills
According to the labor force statistics for Park Hills, out of the total population over 16 years of age (6,703), 64.0% or 4,290 individuals are in the labor force, with 5.7% or 245 of them unemployed. The age group with the highest labor force participation rate is 25 to 29 years, with 100.0% or 437 individuals in the labor force. Within the labor force, the 45 to 54 years age range has the highest percentage of unemployed individuals, with 21.2% or 116 of them being unemployed.
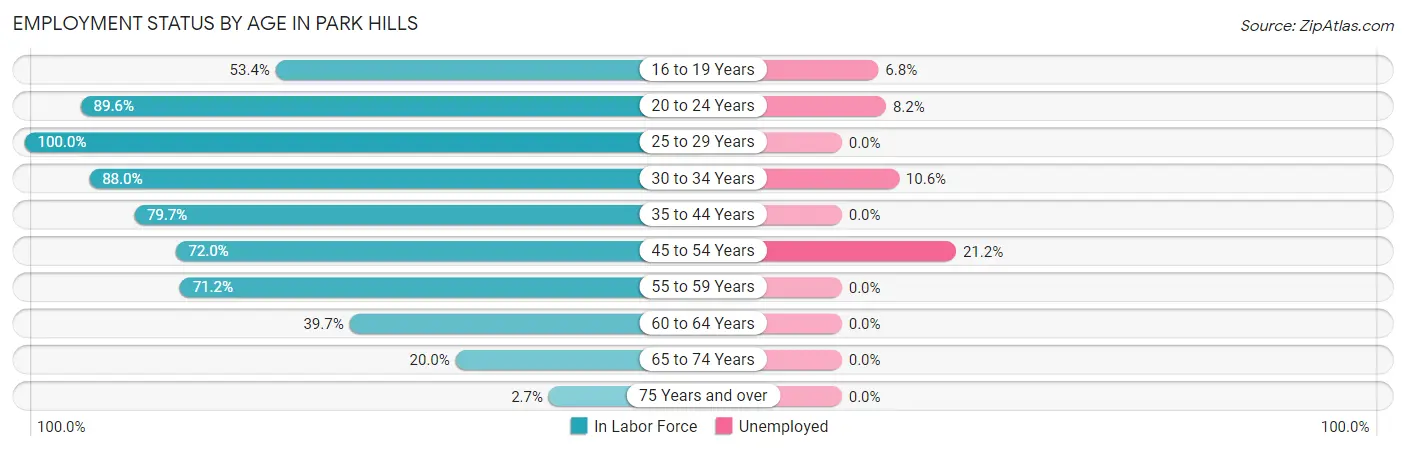
| Age Bracket | In Labor Force | Unemployed |
| 16 to 19 Years | 221 (53.4%) | 15 (6.8%) |
| 20 to 24 Years | 743 (89.6%) | 61 (8.2%) |
| 25 to 29 Years | 437 (100.0%) | 0 (0.0%) |
| 30 to 34 Years | 498 (88.0%) | 53 (10.6%) |
| 35 to 44 Years | 1,084 (79.7%) | 0 (0.0%) |
| 45 to 54 Years | 548 (72.0%) | 116 (21.2%) |
| 55 to 59 Years | 412 (71.2%) | 0 (0.0%) |
| 60 to 64 Years | 206 (39.7%) | 0 (0.0%) |
| 65 to 74 Years | 124 (20.0%) | 0 (0.0%) |
| 75 Years and over | 17 (2.7%) | 0 (0.0%) |
| Total | 4,290 (64.0%) | 245 (5.7%) |
Employment Status by Educational Attainment in Park Hills
According to labor force statistics for Park Hills, 75.4% of individuals (3,183) out of the total population between 25 and 64 years of age (4,222) are in the labor force, with 5.3% or 169 of them being unemployed. The group with the highest labor force participation rate are those with the educational attainment of college / associate degree, with 81.1% or 1,506 individuals in the labor force. Within the labor force, individuals with college / associate degree education have the highest percentage of unemployment, with 7.7% or 116 of them being unemployed.
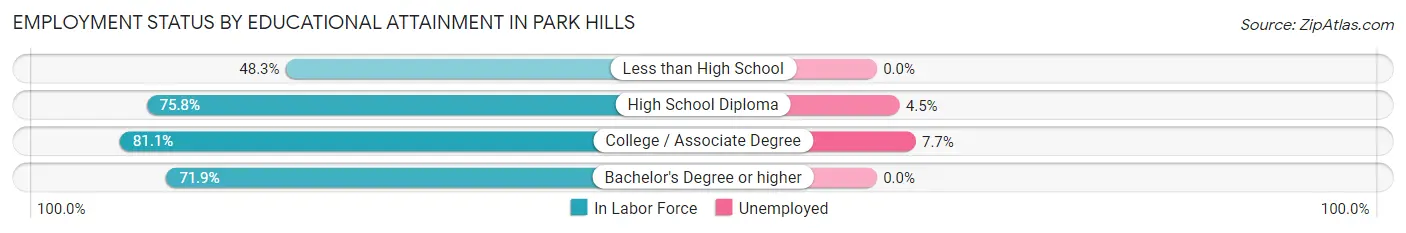
| Educational Attainment | In Labor Force | Unemployed |
| Less than High School | 169 (48.3%) | 0 (0.0%) |
| High School Diploma | 1,176 (75.8%) | 70 (4.5%) |
| College / Associate Degree | 1,506 (81.1%) | 143 (7.7%) |
| Bachelor's Degree or higher | 333 (71.9%) | 0 (0.0%) |
| Total | 3,183 (75.4%) | 224 (5.3%) |
Employment Occupations by Sex in Park Hills
Management, Business, Science and Arts Occupations
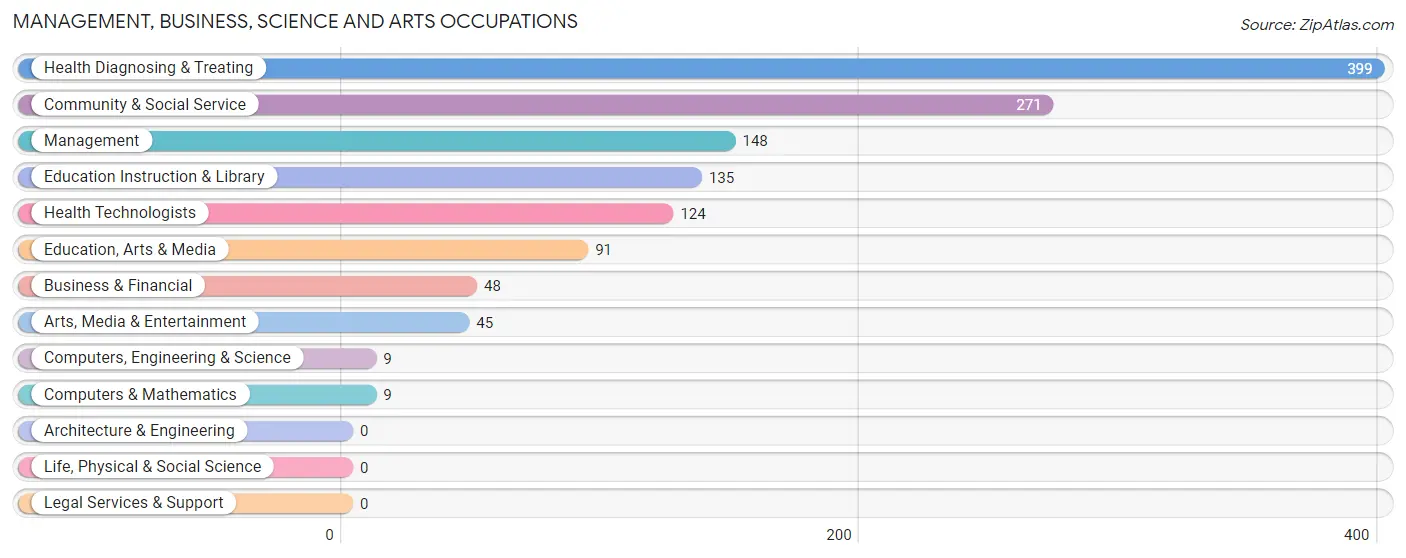
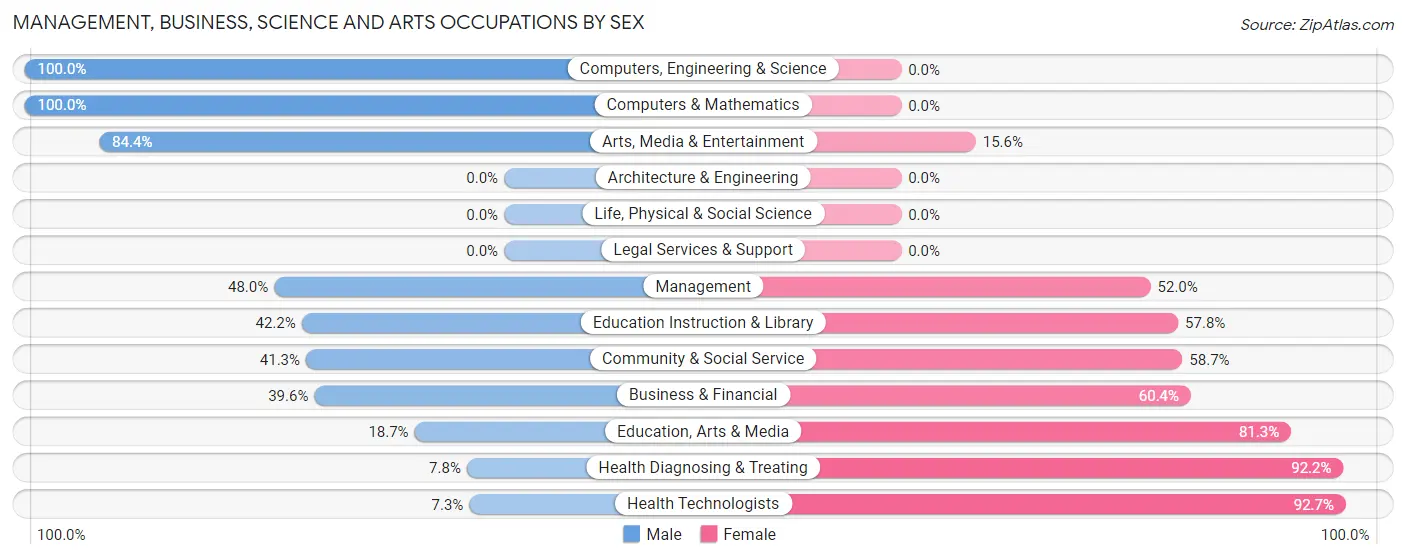
The most common Management, Business, Science and Arts occupations in Park Hills are Health Diagnosing & Treating (399 | 9.9%), Community & Social Service (271 | 6.7%), Management (148 | 3.7%), Education Instruction & Library (135 | 3.3%), and Health Technologists (124 | 3.1%).
Management, Business, Science and Arts Occupations by Sex
Within the Management, Business, Science and Arts occupations in Park Hills, the most male-oriented occupations are Computers, Engineering & Science (100.0%), Computers & Mathematics (100.0%), and Arts, Media & Entertainment (84.4%), while the most female-oriented occupations are Health Technologists (92.7%), Health Diagnosing & Treating (92.2%), and Education, Arts & Media (81.3%).
| Occupation | Male | Female |
| Management | 71 (48.0%) | 77 (52.0%) |
| Business & Financial | 19 (39.6%) | 29 (60.4%) |
| Computers, Engineering & Science | 9 (100.0%) | 0 (0.0%) |
| Computers & Mathematics | 9 (100.0%) | 0 (0.0%) |
| Architecture & Engineering | 0 (0.0%) | 0 (0.0%) |
| Life, Physical & Social Science | 0 (0.0%) | 0 (0.0%) |
| Community & Social Service | 112 (41.3%) | 159 (58.7%) |
| Education, Arts & Media | 17 (18.7%) | 74 (81.3%) |
| Legal Services & Support | 0 (0.0%) | 0 (0.0%) |
| Education Instruction & Library | 57 (42.2%) | 78 (57.8%) |
| Arts, Media & Entertainment | 38 (84.4%) | 7 (15.6%) |
| Health Diagnosing & Treating | 31 (7.8%) | 368 (92.2%) |
| Health Technologists | 9 (7.3%) | 115 (92.7%) |
| Total (Category) | 242 (27.7%) | 633 (72.3%) |
| Total (Overall) | 1,783 (44.1%) | 2,262 (55.9%) |
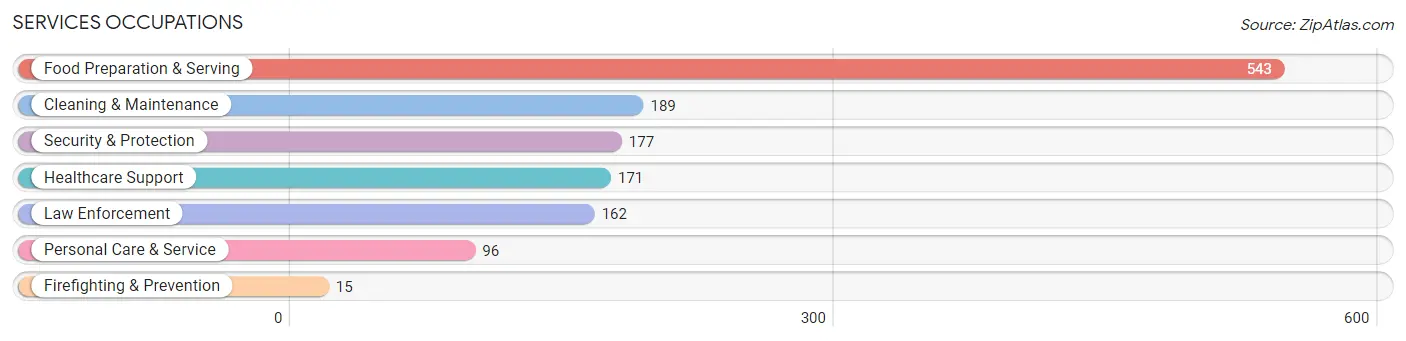
Services Occupations
The most common Services occupations in Park Hills are Food Preparation & Serving (543 | 13.4%), Cleaning & Maintenance (189 | 4.7%), Security & Protection (177 | 4.4%), Healthcare Support (171 | 4.2%), and Law Enforcement (162 | 4.0%).
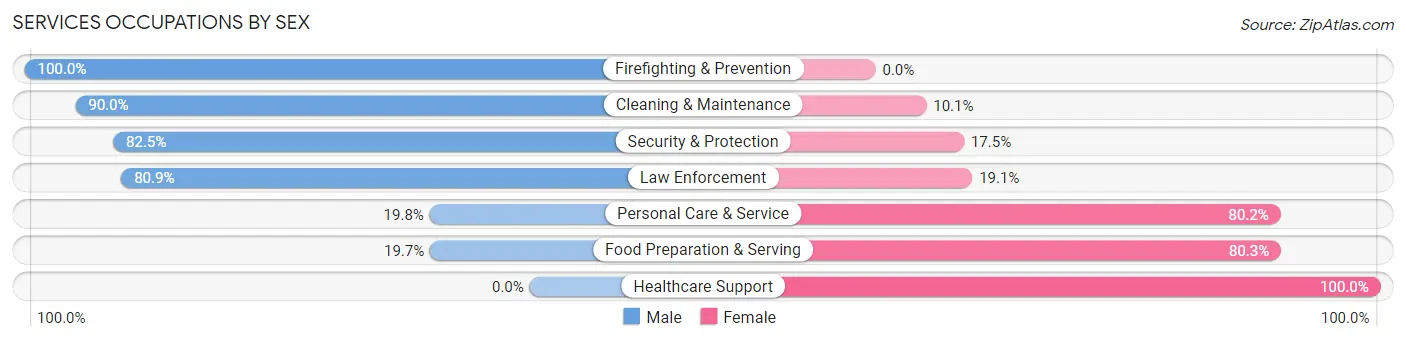
Services Occupations by Sex
Within the Services occupations in Park Hills, the most male-oriented occupations are Firefighting & Prevention (100.0%), Cleaning & Maintenance (89.9%), and Security & Protection (82.5%), while the most female-oriented occupations are Healthcare Support (100.0%), Food Preparation & Serving (80.3%), and Personal Care & Service (80.2%).
| Occupation | Male | Female |
| Healthcare Support | 0 (0.0%) | 171 (100.0%) |
| Security & Protection | 146 (82.5%) | 31 (17.5%) |
| Firefighting & Prevention | 15 (100.0%) | 0 (0.0%) |
| Law Enforcement | 131 (80.9%) | 31 (19.1%) |
| Food Preparation & Serving | 107 (19.7%) | 436 (80.3%) |
| Cleaning & Maintenance | 170 (89.9%) | 19 (10.1%) |
| Personal Care & Service | 19 (19.8%) | 77 (80.2%) |
| Total (Category) | 442 (37.6%) | 734 (62.4%) |
| Total (Overall) | 1,783 (44.1%) | 2,262 (55.9%) |
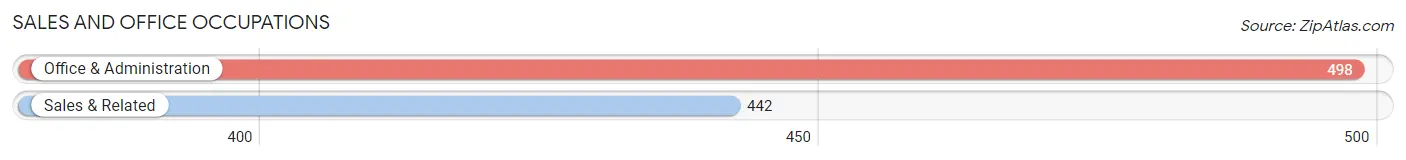
Sales and Office Occupations
The most common Sales and Office occupations in Park Hills are Office & Administration (498 | 12.3%), and Sales & Related (442 | 10.9%).
Sales and Office Occupations by Sex
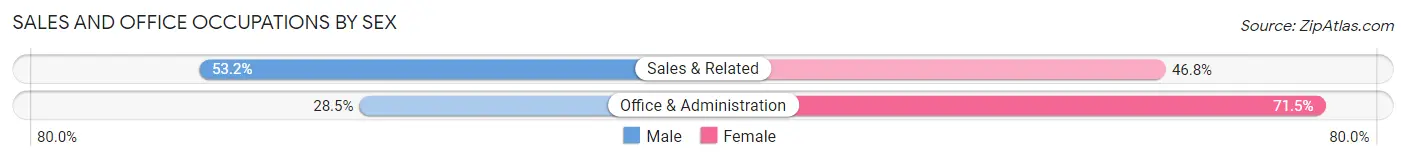
| Occupation | Male | Female |
| Sales & Related | 235 (53.2%) | 207 (46.8%) |
| Office & Administration | 142 (28.5%) | 356 (71.5%) |
| Total (Category) | 377 (40.1%) | 563 (59.9%) |
| Total (Overall) | 1,783 (44.1%) | 2,262 (55.9%) |
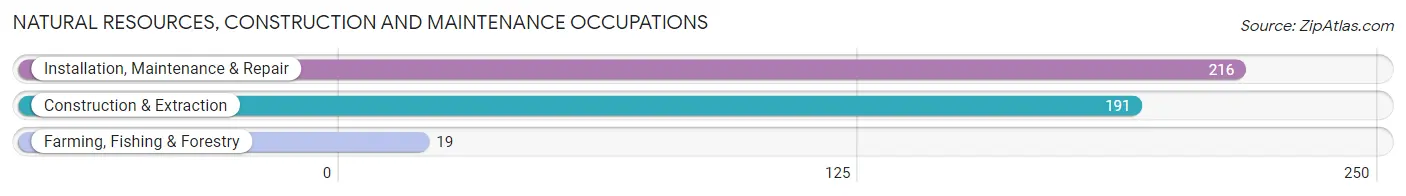
Natural Resources, Construction and Maintenance Occupations
The most common Natural Resources, Construction and Maintenance occupations in Park Hills are Installation, Maintenance & Repair (216 | 5.3%), Construction & Extraction (191 | 4.7%), and Farming, Fishing & Forestry (19 | 0.5%).
Natural Resources, Construction and Maintenance Occupations by Sex
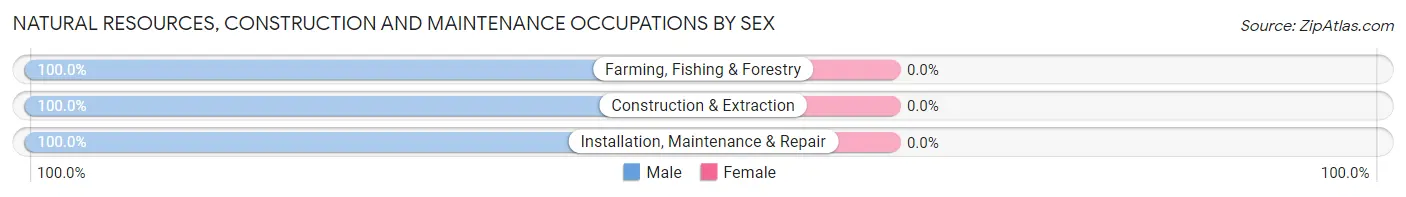
| Occupation | Male | Female |
| Farming, Fishing & Forestry | 19 (100.0%) | 0 (0.0%) |
| Construction & Extraction | 191 (100.0%) | 0 (0.0%) |
| Installation, Maintenance & Repair | 216 (100.0%) | 0 (0.0%) |
| Total (Category) | 426 (100.0%) | 0 (0.0%) |
| Total (Overall) | 1,783 (44.1%) | 2,262 (55.9%) |
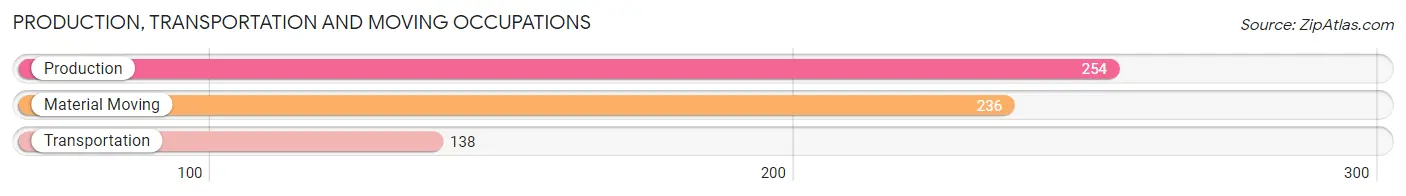
Production, Transportation and Moving Occupations
The most common Production, Transportation and Moving occupations in Park Hills are Production (254 | 6.3%), Material Moving (236 | 5.8%), and Transportation (138 | 3.4%).
Production, Transportation and Moving Occupations by Sex
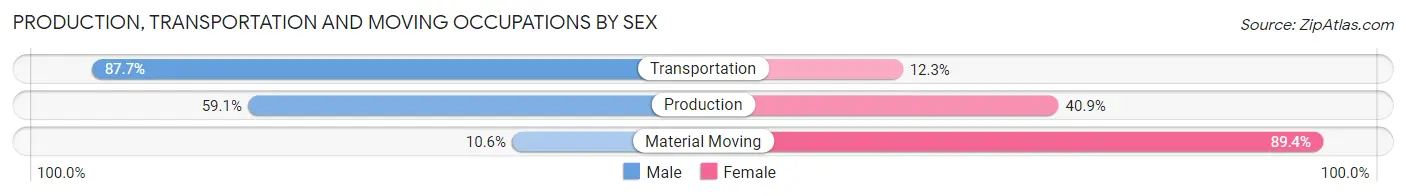
| Occupation | Male | Female |
| Production | 150 (59.1%) | 104 (40.9%) |
| Transportation | 121 (87.7%) | 17 (12.3%) |
| Material Moving | 25 (10.6%) | 211 (89.4%) |
| Total (Category) | 296 (47.1%) | 332 (52.9%) |
| Total (Overall) | 1,783 (44.1%) | 2,262 (55.9%) |
Employment Industries by Sex in Park Hills
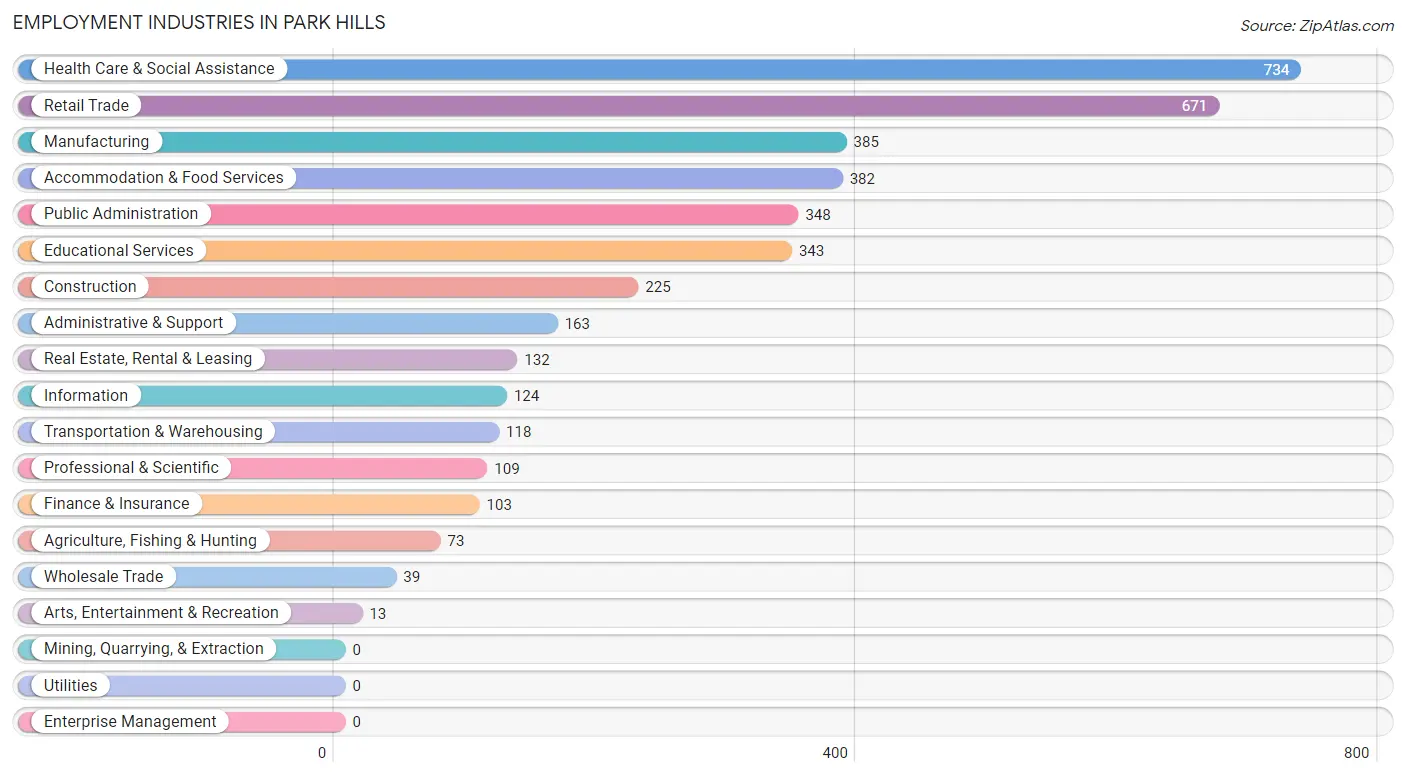
Employment Industries in Park Hills
The major employment industries in Park Hills include Health Care & Social Assistance (734 | 18.1%), Retail Trade (671 | 16.6%), Manufacturing (385 | 9.5%), Accommodation & Food Services (382 | 9.4%), and Public Administration (348 | 8.6%).
Employment Industries by Sex in Park Hills
The Park Hills industries that see more men than women are Agriculture, Fishing & Hunting (100.0%), Information (100.0%), and Arts, Entertainment & Recreation (100.0%), whereas the industries that tend to have a higher number of women are Finance & Insurance (100.0%), Professional & Scientific (100.0%), and Health Care & Social Assistance (95.0%).
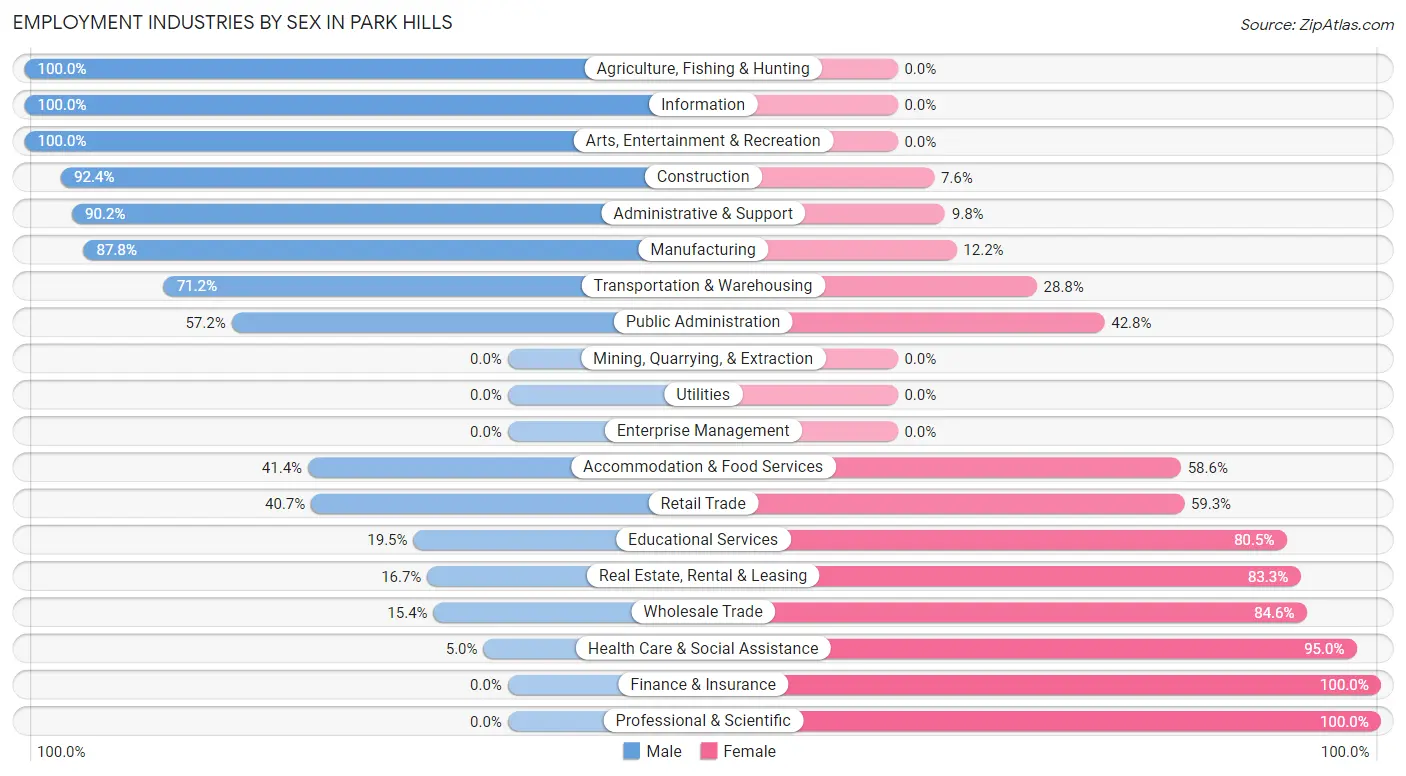
| Industry | Male | Female |
| Agriculture, Fishing & Hunting | 73 (100.0%) | 0 (0.0%) |
| Mining, Quarrying, & Extraction | 0 (0.0%) | 0 (0.0%) |
| Construction | 208 (92.4%) | 17 (7.6%) |
| Manufacturing | 338 (87.8%) | 47 (12.2%) |
| Wholesale Trade | 6 (15.4%) | 33 (84.6%) |
| Retail Trade | 273 (40.7%) | 398 (59.3%) |
| Transportation & Warehousing | 84 (71.2%) | 34 (28.8%) |
| Utilities | 0 (0.0%) | 0 (0.0%) |
| Information | 124 (100.0%) | 0 (0.0%) |
| Finance & Insurance | 0 (0.0%) | 103 (100.0%) |
| Real Estate, Rental & Leasing | 22 (16.7%) | 110 (83.3%) |
| Professional & Scientific | 0 (0.0%) | 109 (100.0%) |
| Enterprise Management | 0 (0.0%) | 0 (0.0%) |
| Administrative & Support | 147 (90.2%) | 16 (9.8%) |
| Educational Services | 67 (19.5%) | 276 (80.5%) |
| Health Care & Social Assistance | 37 (5.0%) | 697 (95.0%) |
| Arts, Entertainment & Recreation | 13 (100.0%) | 0 (0.0%) |
| Accommodation & Food Services | 158 (41.4%) | 224 (58.6%) |
| Public Administration | 199 (57.2%) | 149 (42.8%) |
| Total | 1,783 (44.1%) | 2,262 (55.9%) |
Education in Park Hills
School Enrollment in Park Hills
The most common levels of schooling among the 1,880 students in Park Hills are middle school (648 | 34.5%), elementary school (360 | 19.2%), and high school (338 | 18.0%).
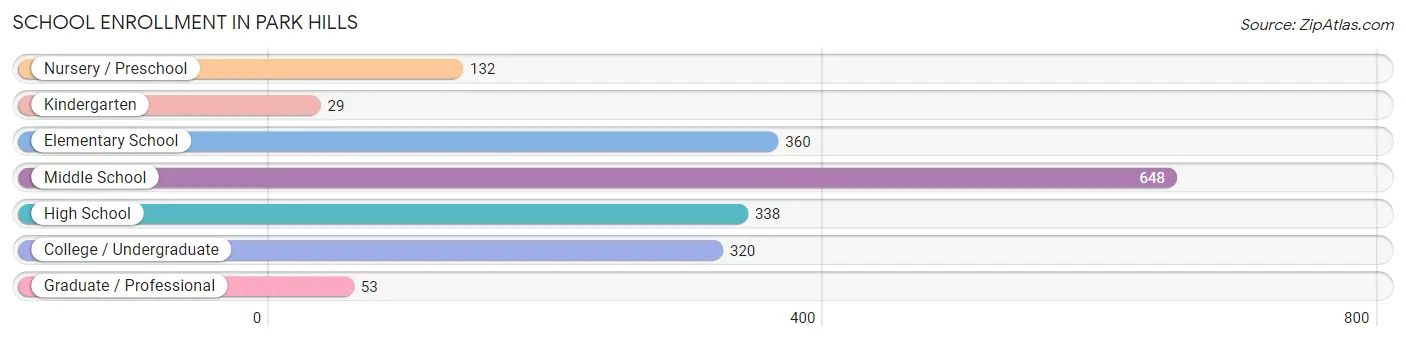
| School Level | # Students | % Students |
| Nursery / Preschool | 132 | 7.0% |
| Kindergarten | 29 | 1.5% |
| Elementary School | 360 | 19.2% |
| Middle School | 648 | 34.5% |
| High School | 338 | 18.0% |
| College / Undergraduate | 320 | 17.0% |
| Graduate / Professional | 53 | 2.8% |
| Total | 1,880 | 100.0% |
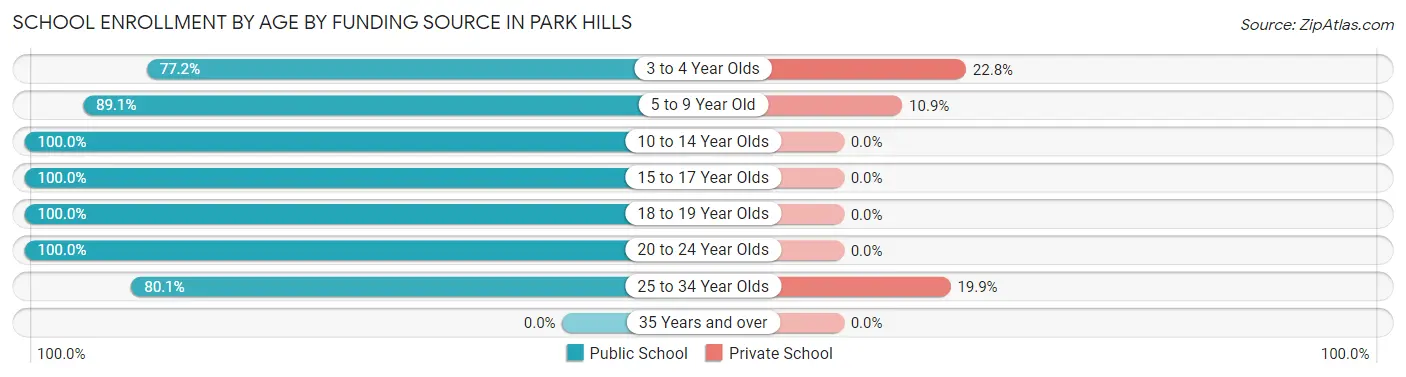
School Enrollment by Age by Funding Source in Park Hills
Out of a total of 1,880 students who are enrolled in schools in Park Hills, 103 (5.5%) attend a private institution, while the remaining 1,777 (94.5%) are enrolled in public schools. The age group of 3 to 4 year olds has the highest likelihood of being enrolled in private schools, with 23 (22.8% in the age bracket) enrolled. Conversely, the age group of 10 to 14 year olds has the lowest likelihood of being enrolled in a private school, with 634 (100.0% in the age bracket) attending a public institution.
| Age Bracket | Public School | Private School |
| 3 to 4 Year Olds | 78 (77.2%) | 23 (22.8%) |
| 5 to 9 Year Old | 360 (89.1%) | 44 (10.9%) |
| 10 to 14 Year Olds | 634 (100.0%) | 0 (0.0%) |
| 15 to 17 Year Olds | 295 (100.0%) | 0 (0.0%) |
| 18 to 19 Year Olds | 181 (100.0%) | 0 (0.0%) |
| 20 to 24 Year Olds | 79 (100.0%) | 0 (0.0%) |
| 25 to 34 Year Olds | 149 (80.1%) | 37 (19.9%) |
| 35 Years and over | 0 (0.0%) | 0 (0.0%) |
| Total | 1,777 (94.5%) | 103 (5.5%) |
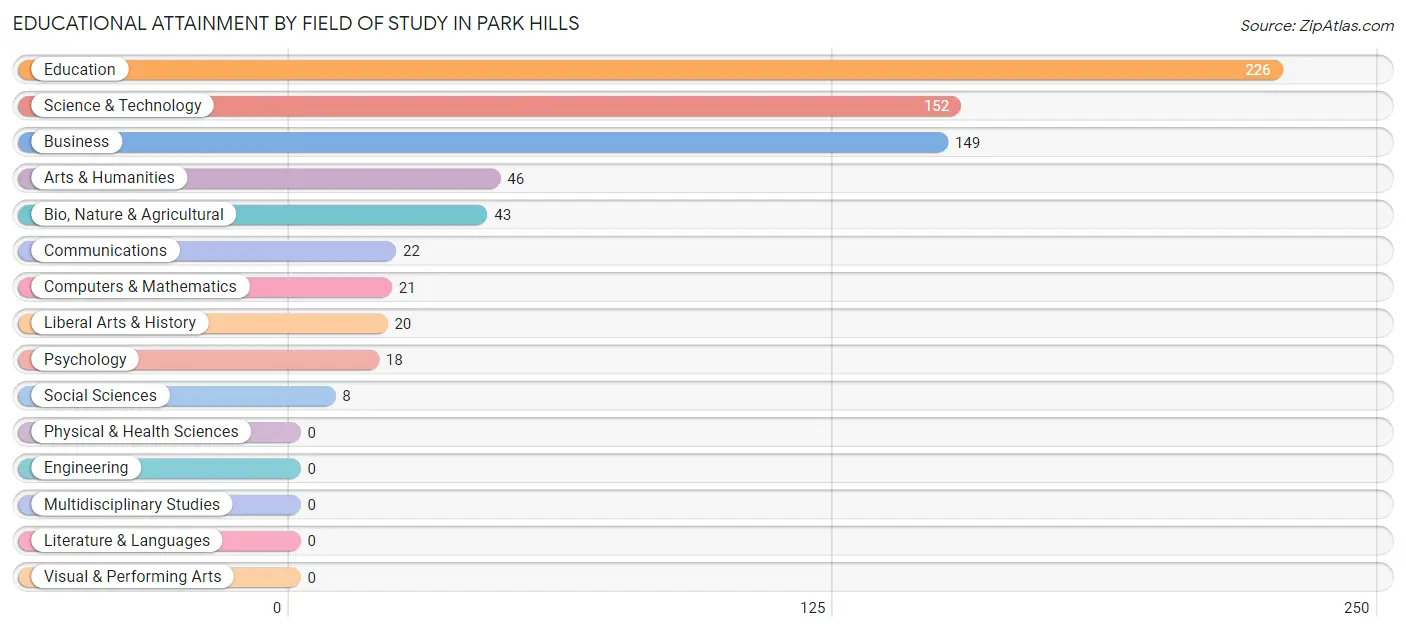
Educational Attainment by Field of Study in Park Hills
Education (226 | 32.1%), science & technology (152 | 21.6%), business (149 | 21.1%), arts & humanities (46 | 6.5%), and bio, nature & agricultural (43 | 6.1%) are the most common fields of study among 705 individuals in Park Hills who have obtained a bachelor's degree or higher.
| Field of Study | # Graduates | % Graduates |
| Computers & Mathematics | 21 | 3.0% |
| Bio, Nature & Agricultural | 43 | 6.1% |
| Physical & Health Sciences | 0 | 0.0% |
| Psychology | 18 | 2.5% |
| Social Sciences | 8 | 1.1% |
| Engineering | 0 | 0.0% |
| Multidisciplinary Studies | 0 | 0.0% |
| Science & Technology | 152 | 21.6% |
| Business | 149 | 21.1% |
| Education | 226 | 32.1% |
| Literature & Languages | 0 | 0.0% |
| Liberal Arts & History | 20 | 2.8% |
| Visual & Performing Arts | 0 | 0.0% |
| Communications | 22 | 3.1% |
| Arts & Humanities | 46 | 6.5% |
| Total | 705 | 100.0% |
Transportation & Commute in Park Hills
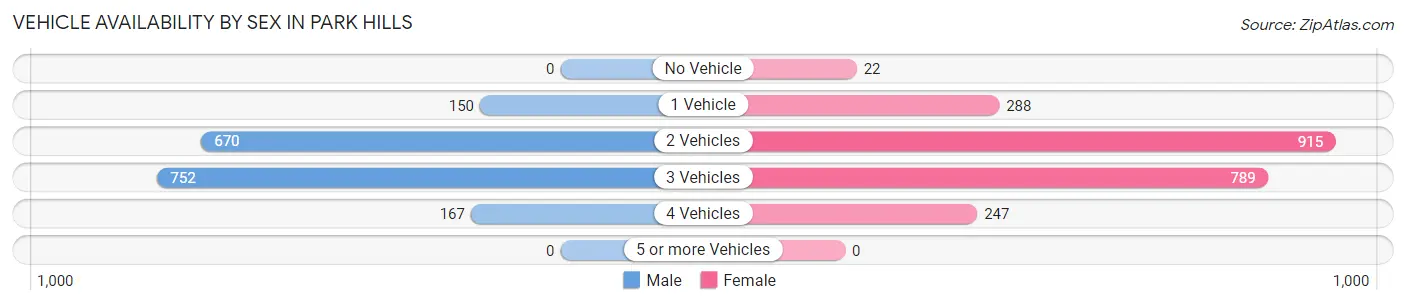
Vehicle Availability by Sex in Park Hills
The most prevalent vehicle ownership categories in Park Hills are males with 3 vehicles (752, accounting for 43.2%) and females with 3 vehicles (789, making up 33.3%).
| Vehicles Available | Male | Female |
| No Vehicle | 0 (0.0%) | 22 (1.0%) |
| 1 Vehicle | 150 (8.6%) | 288 (12.7%) |
| 2 Vehicles | 670 (38.5%) | 915 (40.5%) |
| 3 Vehicles | 752 (43.2%) | 789 (34.9%) |
| 4 Vehicles | 167 (9.6%) | 247 (10.9%) |
| 5 or more Vehicles | 0 (0.0%) | 0 (0.0%) |
| Total | 1,739 (100.0%) | 2,261 (100.0%) |
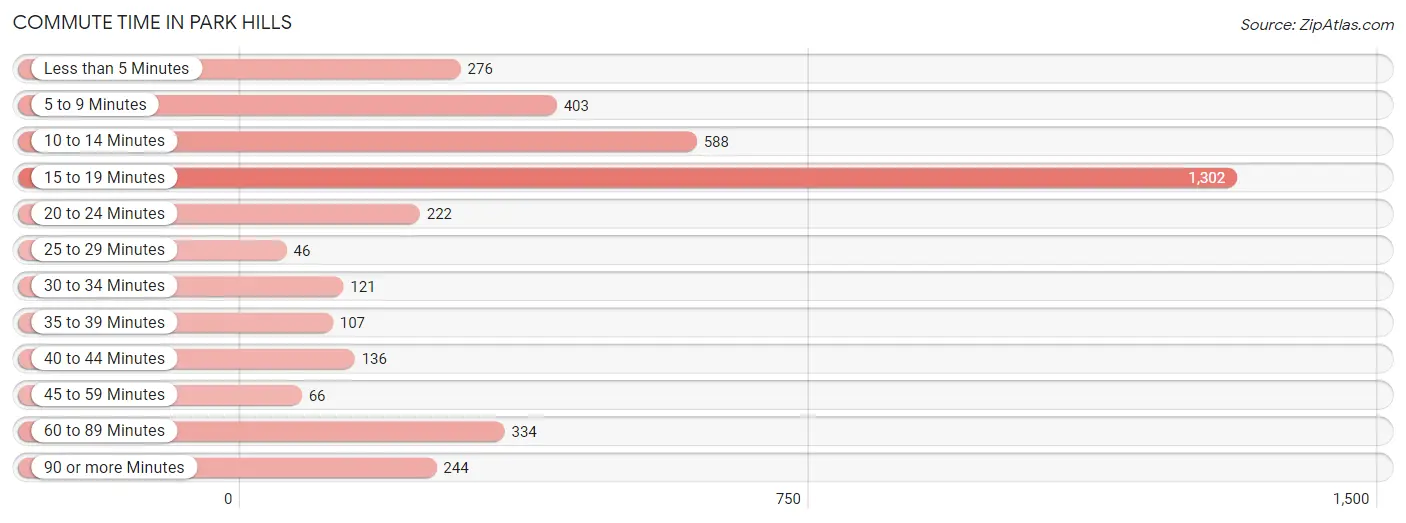
Commute Time in Park Hills
The most frequently occuring commute durations in Park Hills are 15 to 19 minutes (1,302 commuters, 33.9%), 10 to 14 minutes (588 commuters, 15.3%), and 5 to 9 minutes (403 commuters, 10.5%).
| Commute Time | # Commuters | % Commuters |
| Less than 5 Minutes | 276 | 7.2% |
| 5 to 9 Minutes | 403 | 10.5% |
| 10 to 14 Minutes | 588 | 15.3% |
| 15 to 19 Minutes | 1,302 | 33.9% |
| 20 to 24 Minutes | 222 | 5.8% |
| 25 to 29 Minutes | 46 | 1.2% |
| 30 to 34 Minutes | 121 | 3.2% |
| 35 to 39 Minutes | 107 | 2.8% |
| 40 to 44 Minutes | 136 | 3.5% |
| 45 to 59 Minutes | 66 | 1.7% |
| 60 to 89 Minutes | 334 | 8.7% |
| 90 or more Minutes | 244 | 6.4% |
Commute Time by Sex in Park Hills
The most common commute times in Park Hills are 15 to 19 minutes (450 commuters, 26.7%) for males and 15 to 19 minutes (852 commuters, 39.5%) for females.
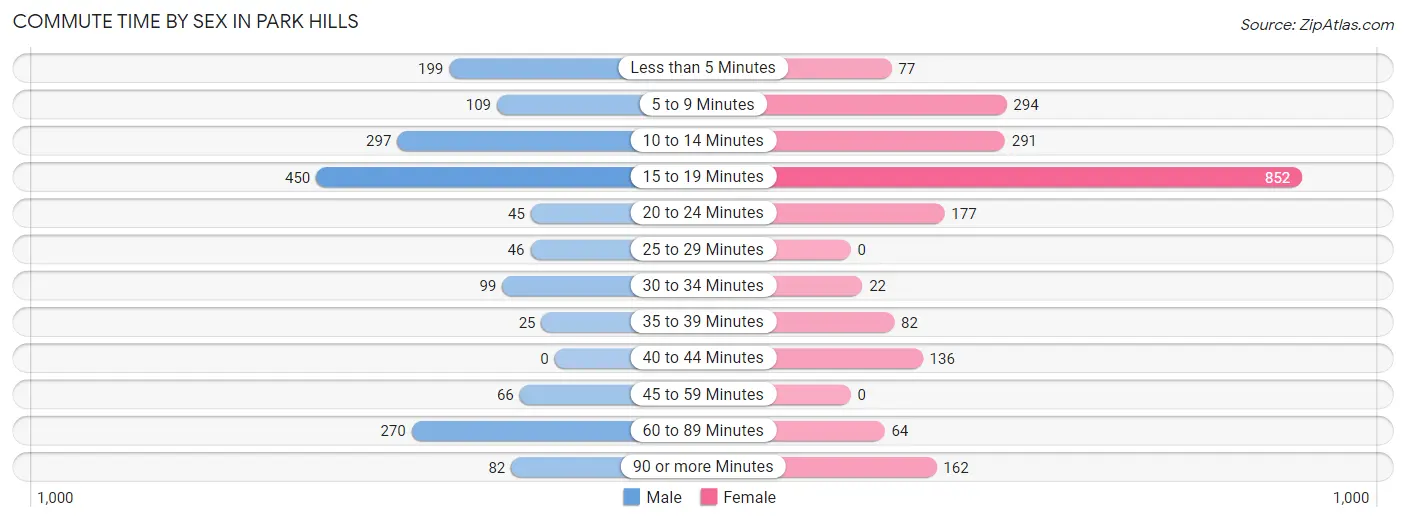
| Commute Time | Male | Female |
| Less than 5 Minutes | 199 (11.8%) | 77 (3.6%) |
| 5 to 9 Minutes | 109 (6.5%) | 294 (13.6%) |
| 10 to 14 Minutes | 297 (17.6%) | 291 (13.5%) |
| 15 to 19 Minutes | 450 (26.7%) | 852 (39.5%) |
| 20 to 24 Minutes | 45 (2.7%) | 177 (8.2%) |
| 25 to 29 Minutes | 46 (2.7%) | 0 (0.0%) |
| 30 to 34 Minutes | 99 (5.9%) | 22 (1.0%) |
| 35 to 39 Minutes | 25 (1.5%) | 82 (3.8%) |
| 40 to 44 Minutes | 0 (0.0%) | 136 (6.3%) |
| 45 to 59 Minutes | 66 (3.9%) | 0 (0.0%) |
| 60 to 89 Minutes | 270 (16.0%) | 64 (3.0%) |
| 90 or more Minutes | 82 (4.9%) | 162 (7.5%) |
Time of Departure to Work by Sex in Park Hills
The most frequent times of departure to work in Park Hills are 5:30 AM to 5:59 AM (296, 17.5%) for males and 7:00 AM to 7:29 AM (556, 25.8%) for females.
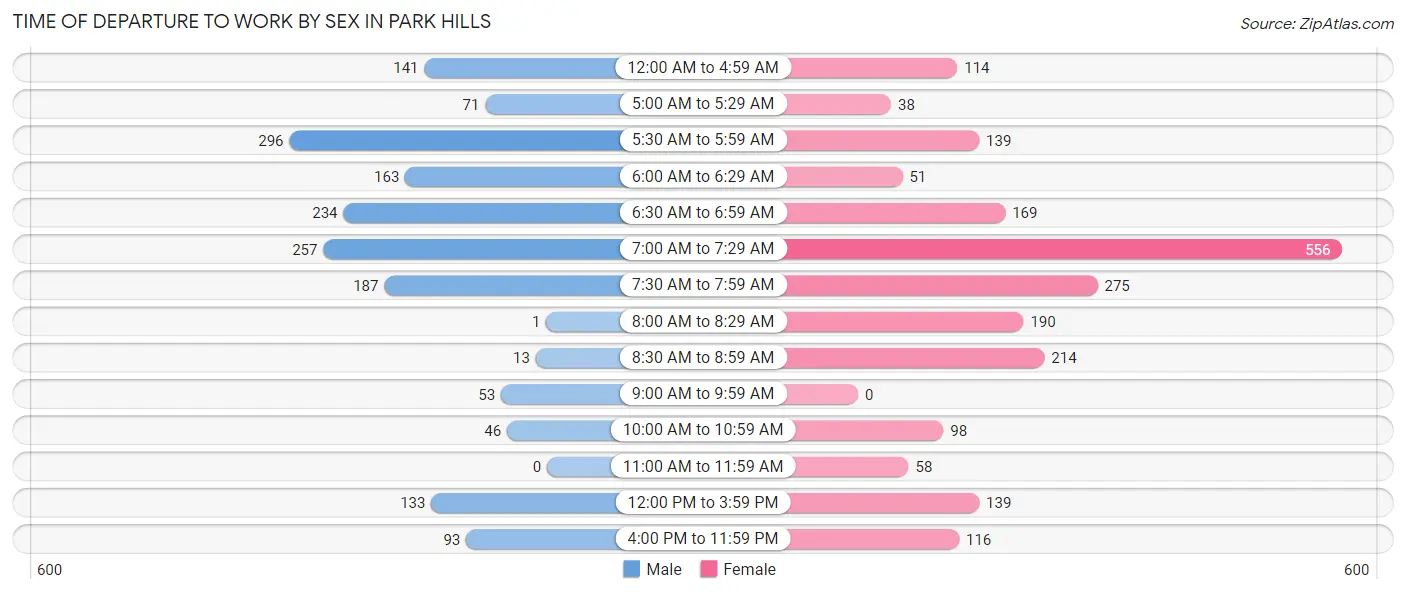
| Time of Departure | Male | Female |
| 12:00 AM to 4:59 AM | 141 (8.4%) | 114 (5.3%) |
| 5:00 AM to 5:29 AM | 71 (4.2%) | 38 (1.8%) |
| 5:30 AM to 5:59 AM | 296 (17.5%) | 139 (6.4%) |
| 6:00 AM to 6:29 AM | 163 (9.7%) | 51 (2.4%) |
| 6:30 AM to 6:59 AM | 234 (13.9%) | 169 (7.8%) |
| 7:00 AM to 7:29 AM | 257 (15.2%) | 556 (25.8%) |
| 7:30 AM to 7:59 AM | 187 (11.1%) | 275 (12.8%) |
| 8:00 AM to 8:29 AM | 1 (0.1%) | 190 (8.8%) |
| 8:30 AM to 8:59 AM | 13 (0.8%) | 214 (9.9%) |
| 9:00 AM to 9:59 AM | 53 (3.1%) | 0 (0.0%) |
| 10:00 AM to 10:59 AM | 46 (2.7%) | 98 (4.5%) |
| 11:00 AM to 11:59 AM | 0 (0.0%) | 58 (2.7%) |
| 12:00 PM to 3:59 PM | 133 (7.9%) | 139 (6.4%) |
| 4:00 PM to 11:59 PM | 93 (5.5%) | 116 (5.4%) |
| Total | 1,688 (100.0%) | 2,157 (100.0%) |
Housing Occupancy in Park Hills
Occupancy by Ownership in Park Hills
Of the total 3,440 dwellings in Park Hills, owner-occupied units account for 2,123 (61.7%), while renter-occupied units make up 1,317 (38.3%).
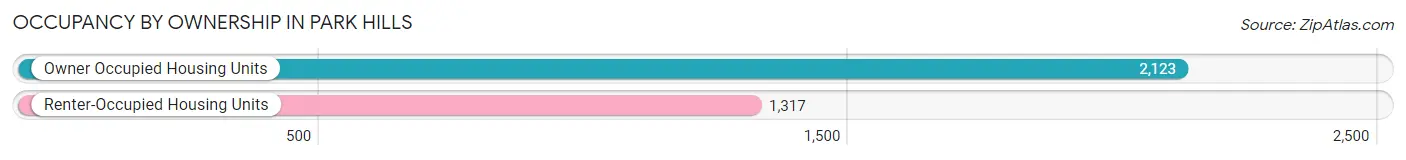
| Occupancy | # Housing Units | % Housing Units |
| Owner Occupied Housing Units | 2,123 | 61.7% |
| Renter-Occupied Housing Units | 1,317 | 38.3% |
| Total Occupied Housing Units | 3,440 | 100.0% |
Occupancy by Household Size in Park Hills
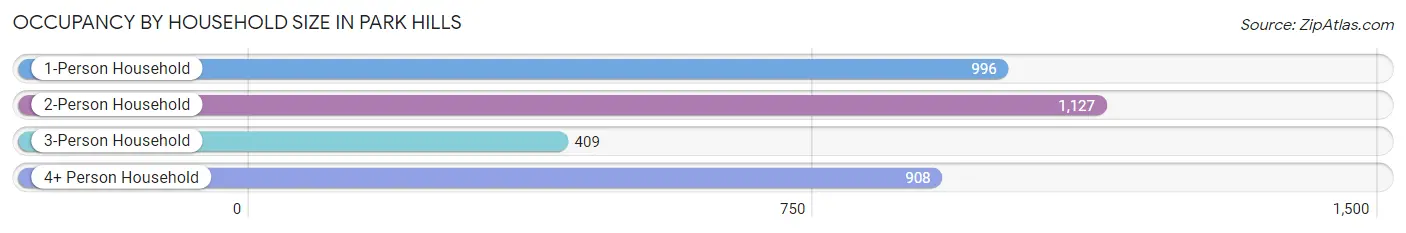
| Household Size | # Housing Units | % Housing Units |
| 1-Person Household | 996 | 28.9% |
| 2-Person Household | 1,127 | 32.8% |
| 3-Person Household | 409 | 11.9% |
| 4+ Person Household | 908 | 26.4% |
| Total Housing Units | 3,440 | 100.0% |
Occupancy by Ownership by Household Size in Park Hills
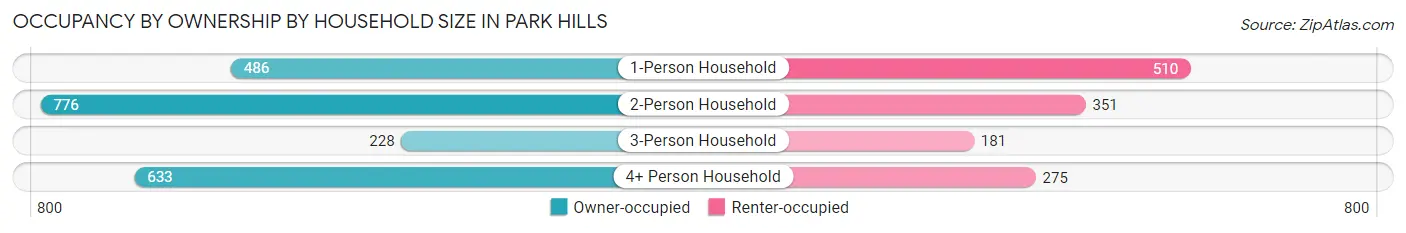
| Household Size | Owner-occupied | Renter-occupied |
| 1-Person Household | 486 (48.8%) | 510 (51.2%) |
| 2-Person Household | 776 (68.9%) | 351 (31.1%) |
| 3-Person Household | 228 (55.7%) | 181 (44.3%) |
| 4+ Person Household | 633 (69.7%) | 275 (30.3%) |
| Total Housing Units | 2,123 (61.7%) | 1,317 (38.3%) |
Occupancy by Educational Attainment in Park Hills
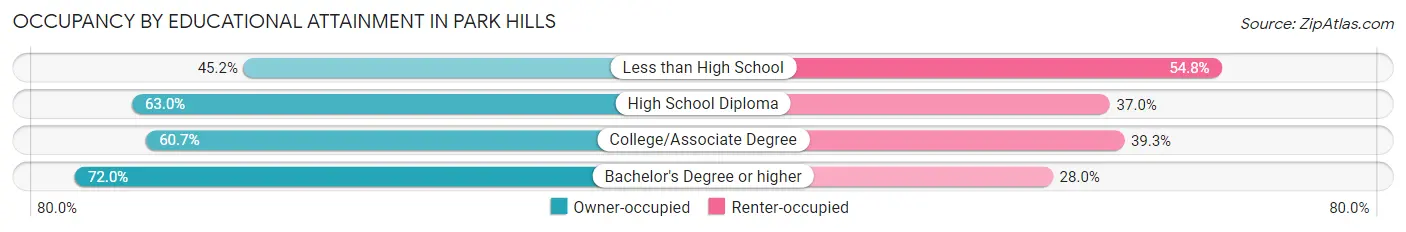
| Household Size | Owner-occupied | Renter-occupied |
| Less than High School | 152 (45.2%) | 184 (54.8%) |
| High School Diploma | 709 (63.0%) | 417 (37.0%) |
| College/Associate Degree | 871 (60.7%) | 564 (39.3%) |
| Bachelor's Degree or higher | 391 (72.0%) | 152 (28.0%) |
Occupancy by Age of Householder in Park Hills
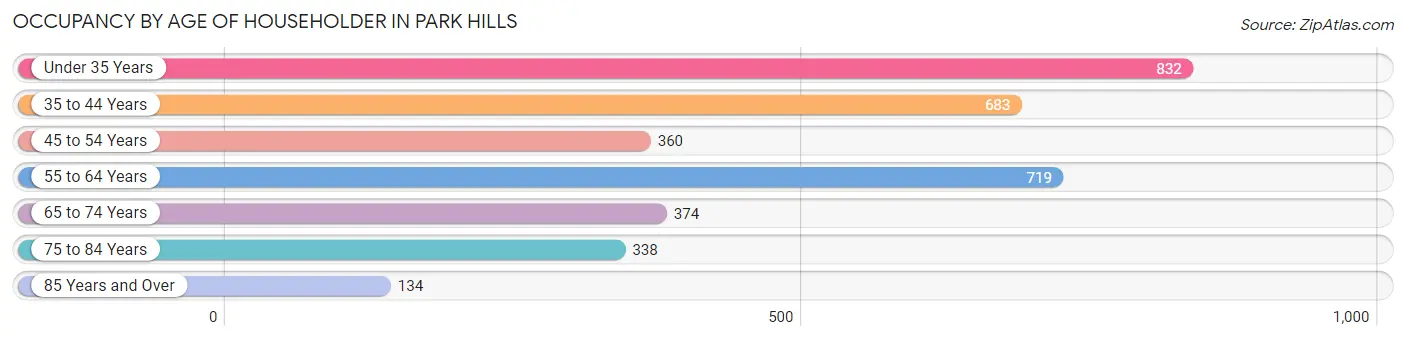
| Age Bracket | # Households | % Households |
| Under 35 Years | 832 | 24.2% |
| 35 to 44 Years | 683 | 19.9% |
| 45 to 54 Years | 360 | 10.5% |
| 55 to 64 Years | 719 | 20.9% |
| 65 to 74 Years | 374 | 10.9% |
| 75 to 84 Years | 338 | 9.8% |
| 85 Years and Over | 134 | 3.9% |
| Total | 3,440 | 100.0% |
Housing Finances in Park Hills
Median Income by Occupancy in Park Hills
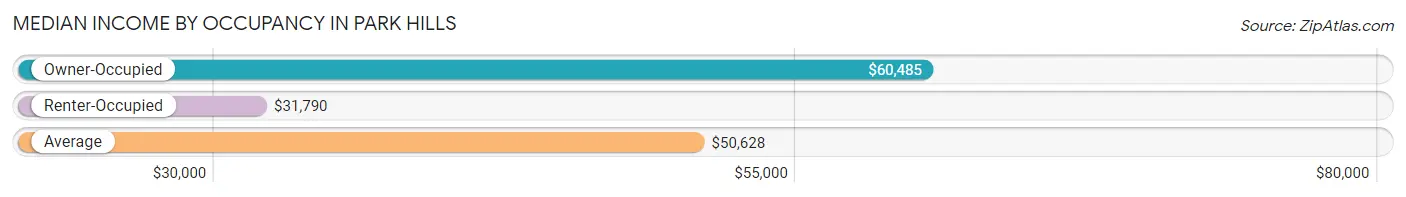
| Occupancy Type | # Households | Median Income |
| Owner-Occupied | 2,123 (61.7%) | $60,485 |
| Renter-Occupied | 1,317 (38.3%) | $31,790 |
| Average | 3,440 (100.0%) | $50,628 |
Occupancy by Householder Income Bracket in Park Hills
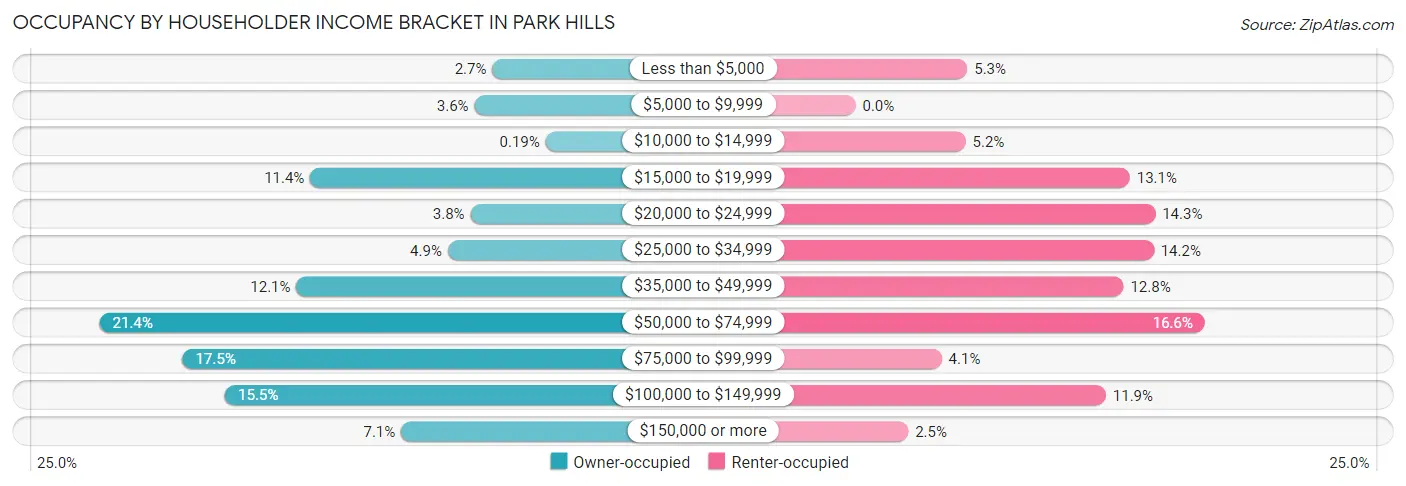
| Income Bracket | Owner-occupied | Renter-occupied |
| Less than $5,000 | 58 (2.7%) | 70 (5.3%) |
| $5,000 to $9,999 | 76 (3.6%) | 0 (0.0%) |
| $10,000 to $14,999 | 4 (0.2%) | 69 (5.2%) |
| $15,000 to $19,999 | 242 (11.4%) | 172 (13.1%) |
| $20,000 to $24,999 | 80 (3.8%) | 188 (14.3%) |
| $25,000 to $34,999 | 103 (4.9%) | 187 (14.2%) |
| $35,000 to $49,999 | 256 (12.1%) | 168 (12.8%) |
| $50,000 to $74,999 | 455 (21.4%) | 219 (16.6%) |
| $75,000 to $99,999 | 371 (17.5%) | 54 (4.1%) |
| $100,000 to $149,999 | 328 (15.4%) | 157 (11.9%) |
| $150,000 or more | 150 (7.1%) | 33 (2.5%) |
| Total | 2,123 (100.0%) | 1,317 (100.0%) |
Monthly Housing Cost Tiers in Park Hills
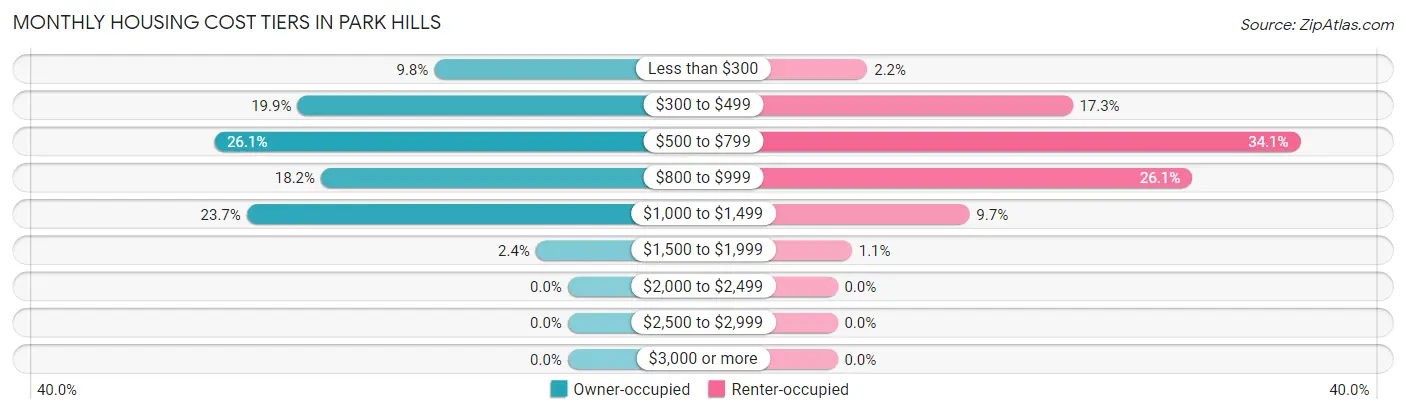
| Monthly Cost | Owner-occupied | Renter-occupied |
| Less than $300 | 209 (9.8%) | 29 (2.2%) |
| $300 to $499 | 423 (19.9%) | 228 (17.3%) |
| $500 to $799 | 553 (26.1%) | 449 (34.1%) |
| $800 to $999 | 386 (18.2%) | 344 (26.1%) |
| $1,000 to $1,499 | 502 (23.6%) | 128 (9.7%) |
| $1,500 to $1,999 | 50 (2.4%) | 14 (1.1%) |
| $2,000 to $2,499 | 0 (0.0%) | 0 (0.0%) |
| $2,500 to $2,999 | 0 (0.0%) | 0 (0.0%) |
| $3,000 or more | 0 (0.0%) | 0 (0.0%) |
| Total | 2,123 (100.0%) | 1,317 (100.0%) |
Physical Housing Characteristics in Park Hills
Housing Structures in Park Hills
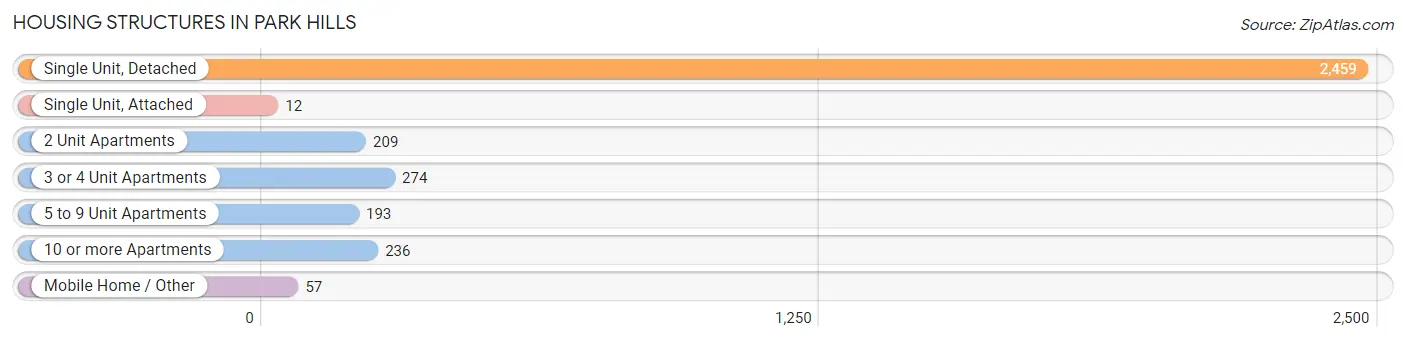
| Structure Type | # Housing Units | % Housing Units |
| Single Unit, Detached | 2,459 | 71.5% |
| Single Unit, Attached | 12 | 0.4% |
| 2 Unit Apartments | 209 | 6.1% |
| 3 or 4 Unit Apartments | 274 | 8.0% |
| 5 to 9 Unit Apartments | 193 | 5.6% |
| 10 or more Apartments | 236 | 6.9% |
| Mobile Home / Other | 57 | 1.7% |
| Total | 3,440 | 100.0% |
Housing Structures by Occupancy in Park Hills
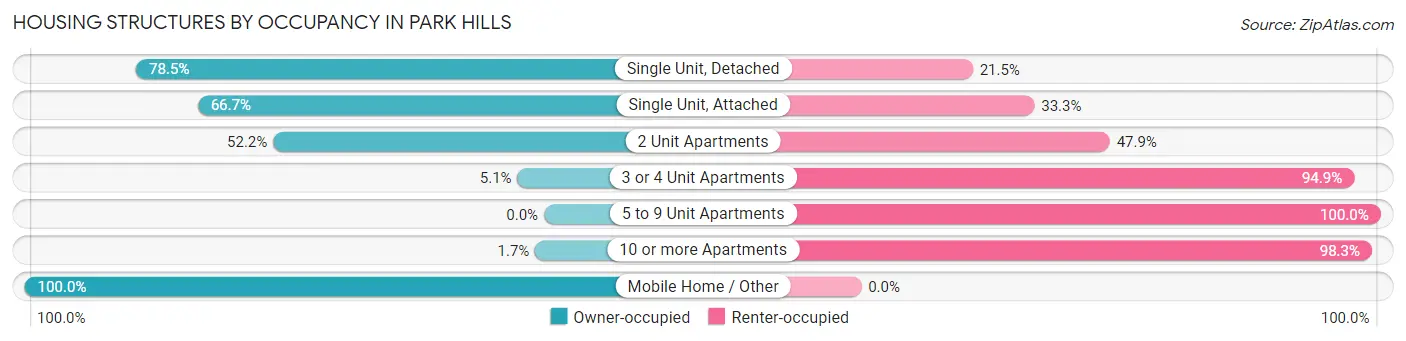
| Structure Type | Owner-occupied | Renter-occupied |
| Single Unit, Detached | 1,931 (78.5%) | 528 (21.5%) |
| Single Unit, Attached | 8 (66.7%) | 4 (33.3%) |
| 2 Unit Apartments | 109 (52.1%) | 100 (47.8%) |
| 3 or 4 Unit Apartments | 14 (5.1%) | 260 (94.9%) |
| 5 to 9 Unit Apartments | 0 (0.0%) | 193 (100.0%) |
| 10 or more Apartments | 4 (1.7%) | 232 (98.3%) |
| Mobile Home / Other | 57 (100.0%) | 0 (0.0%) |
| Total | 2,123 (61.7%) | 1,317 (38.3%) |
Housing Structures by Number of Rooms in Park Hills
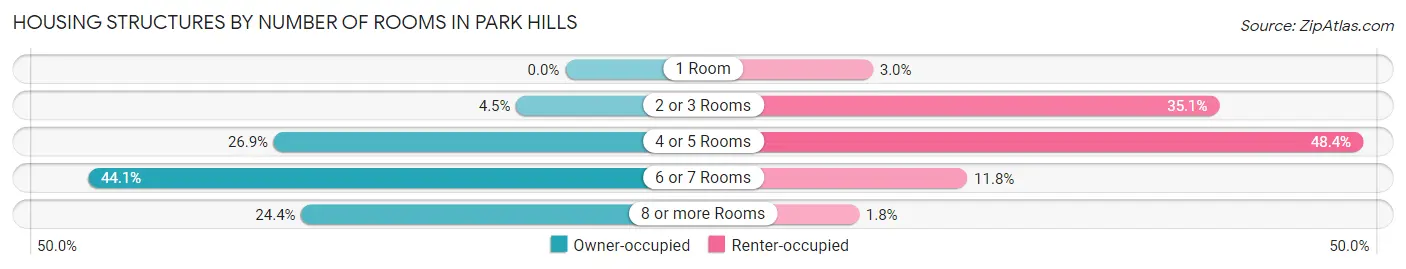
| Number of Rooms | Owner-occupied | Renter-occupied |
| 1 Room | 0 (0.0%) | 40 (3.0%) |
| 2 or 3 Rooms | 96 (4.5%) | 462 (35.1%) |
| 4 or 5 Rooms | 572 (26.9%) | 637 (48.4%) |
| 6 or 7 Rooms | 937 (44.1%) | 155 (11.8%) |
| 8 or more Rooms | 518 (24.4%) | 23 (1.8%) |
| Total | 2,123 (100.0%) | 1,317 (100.0%) |
Housing Structure by Heating Type in Park Hills
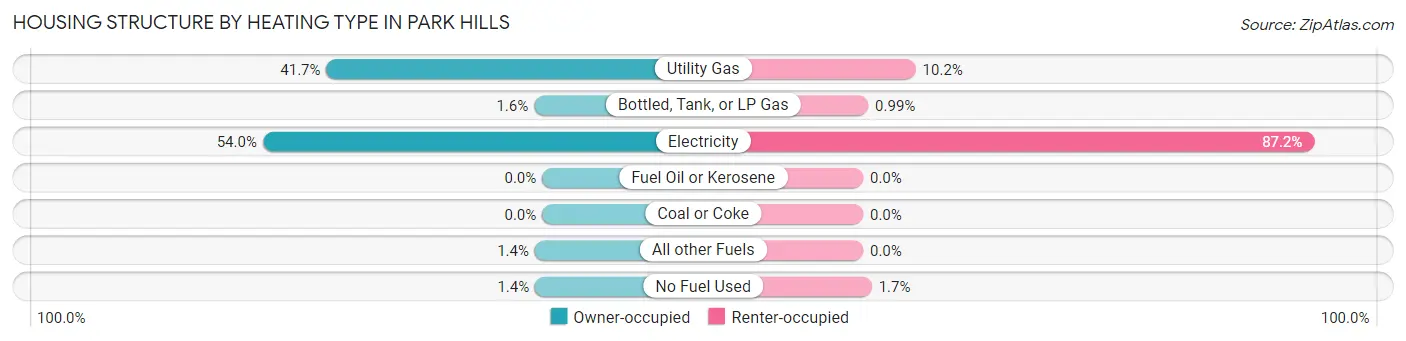
| Heating Type | Owner-occupied | Renter-occupied |
| Utility Gas | 885 (41.7%) | 134 (10.2%) |
| Bottled, Tank, or LP Gas | 33 (1.5%) | 13 (1.0%) |
| Electricity | 1,146 (54.0%) | 1,148 (87.2%) |
| Fuel Oil or Kerosene | 0 (0.0%) | 0 (0.0%) |
| Coal or Coke | 0 (0.0%) | 0 (0.0%) |
| All other Fuels | 30 (1.4%) | 0 (0.0%) |
| No Fuel Used | 29 (1.4%) | 22 (1.7%) |
| Total | 2,123 (100.0%) | 1,317 (100.0%) |
Household Vehicle Usage in Park Hills
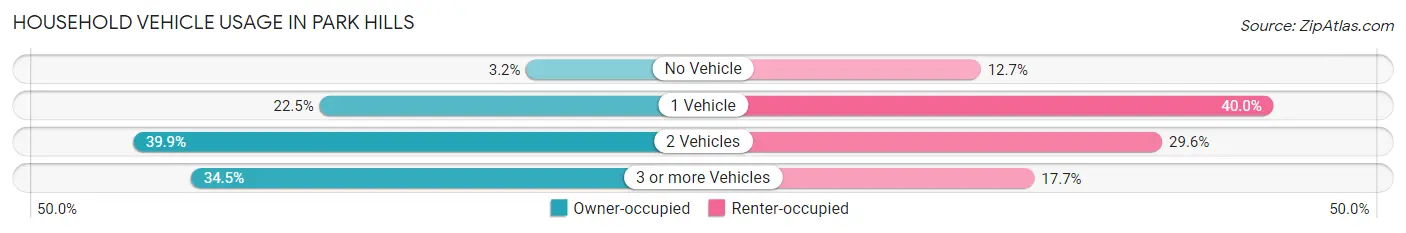
| Vehicles per Household | Owner-occupied | Renter-occupied |
| No Vehicle | 67 (3.2%) | 167 (12.7%) |
| 1 Vehicle | 477 (22.5%) | 527 (40.0%) |
| 2 Vehicles | 847 (39.9%) | 390 (29.6%) |
| 3 or more Vehicles | 732 (34.5%) | 233 (17.7%) |
| Total | 2,123 (100.0%) | 1,317 (100.0%) |
Real Estate & Mortgages in Park Hills
Real Estate and Mortgage Overview in Park Hills
| Characteristic | Without Mortgage | With Mortgage |
| Housing Units | 782 | 1,341 |
| Median Property Value | $79,300 | $109,600 |
| Median Household Income | $68,036 | $50 |
| Monthly Housing Costs | $385 | $0 |
| Real Estate Taxes | $762 | $62 |
Property Value by Mortgage Status in Park Hills
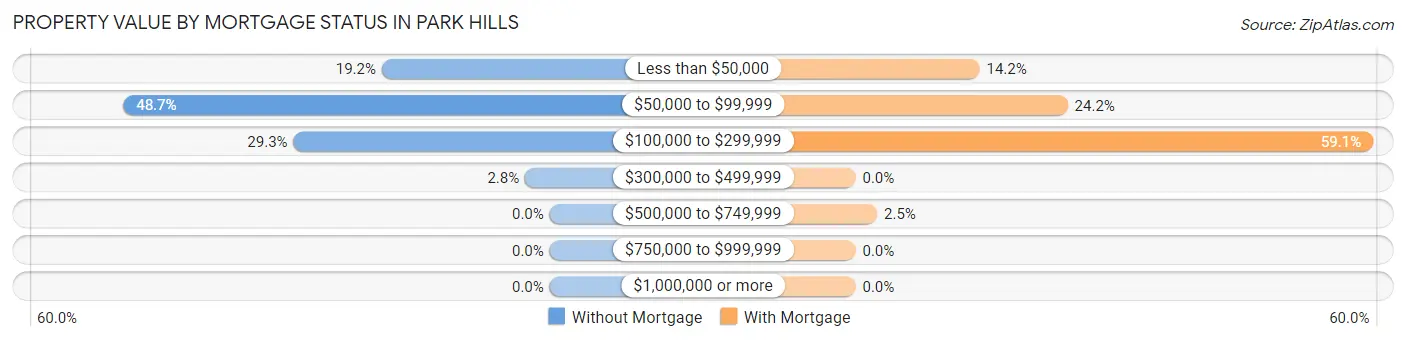
| Property Value | Without Mortgage | With Mortgage |
| Less than $50,000 | 150 (19.2%) | 190 (14.2%) |
| $50,000 to $99,999 | 381 (48.7%) | 325 (24.2%) |
| $100,000 to $299,999 | 229 (29.3%) | 793 (59.1%) |
| $300,000 to $499,999 | 22 (2.8%) | 0 (0.0%) |
| $500,000 to $749,999 | 0 (0.0%) | 33 (2.5%) |
| $750,000 to $999,999 | 0 (0.0%) | 0 (0.0%) |
| $1,000,000 or more | 0 (0.0%) | 0 (0.0%) |
| Total | 782 (100.0%) | 1,341 (100.0%) |
Household Income by Mortgage Status in Park Hills
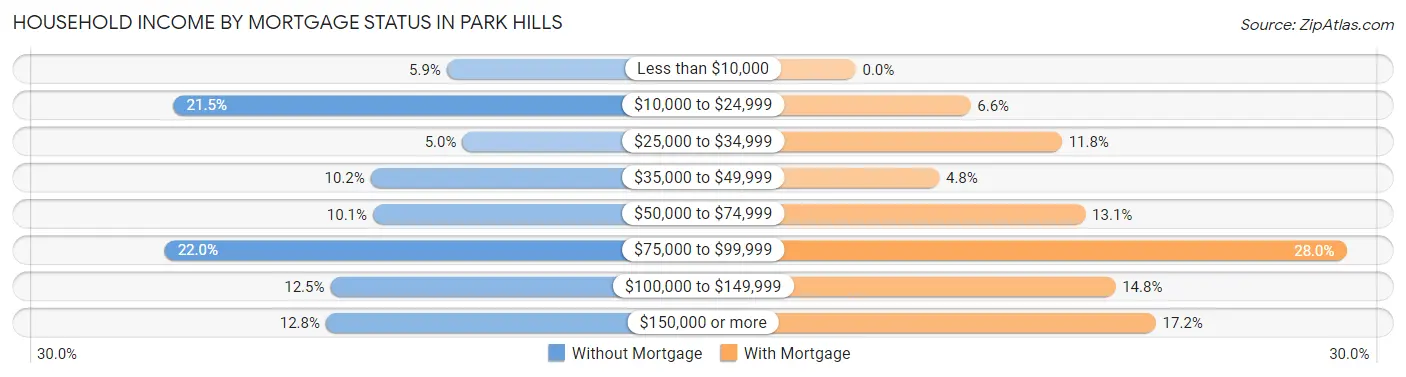
| Household Income | Without Mortgage | With Mortgage |
| Less than $10,000 | 46 (5.9%) | 0 (0.0%) |
| $10,000 to $24,999 | 168 (21.5%) | 88 (6.6%) |
| $25,000 to $34,999 | 39 (5.0%) | 158 (11.8%) |
| $35,000 to $49,999 | 80 (10.2%) | 64 (4.8%) |
| $50,000 to $74,999 | 79 (10.1%) | 176 (13.1%) |
| $75,000 to $99,999 | 172 (22.0%) | 376 (28.0%) |
| $100,000 to $149,999 | 98 (12.5%) | 199 (14.8%) |
| $150,000 or more | 100 (12.8%) | 230 (17.2%) |
| Total | 782 (100.0%) | 1,341 (100.0%) |
Property Value to Household Income Ratio in Park Hills
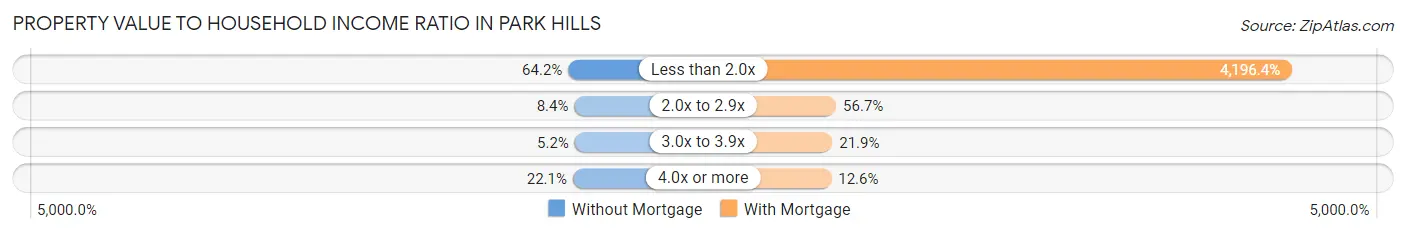
| Value-to-Income Ratio | Without Mortgage | With Mortgage |
| Less than 2.0x | 502 (64.2%) | 56,273 (4,196.4%) |
| 2.0x to 2.9x | 66 (8.4%) | 760 (56.7%) |
| 3.0x to 3.9x | 41 (5.2%) | 294 (21.9%) |
| 4.0x or more | 173 (22.1%) | 169 (12.6%) |
| Total | 782 (100.0%) | 1,341 (100.0%) |
Real Estate Taxes by Mortgage Status in Park Hills
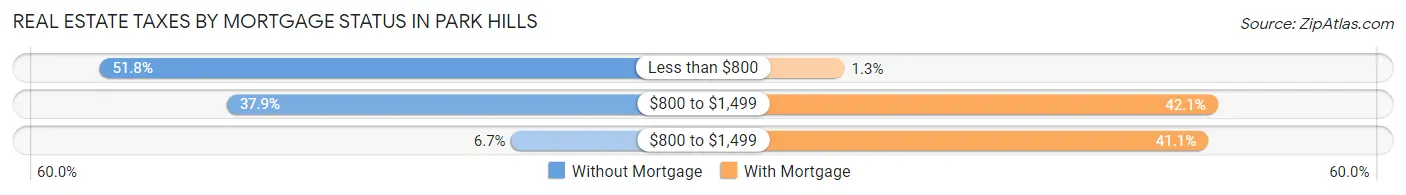
| Property Taxes | Without Mortgage | With Mortgage |
| Less than $800 | 405 (51.8%) | 17 (1.3%) |
| $800 to $1,499 | 296 (37.9%) | 565 (42.1%) |
| $800 to $1,499 | 52 (6.7%) | 551 (41.1%) |
| Total | 782 (100.0%) | 1,341 (100.0%) |
Health & Disability in Park Hills
Health Insurance Coverage by Age in Park Hills
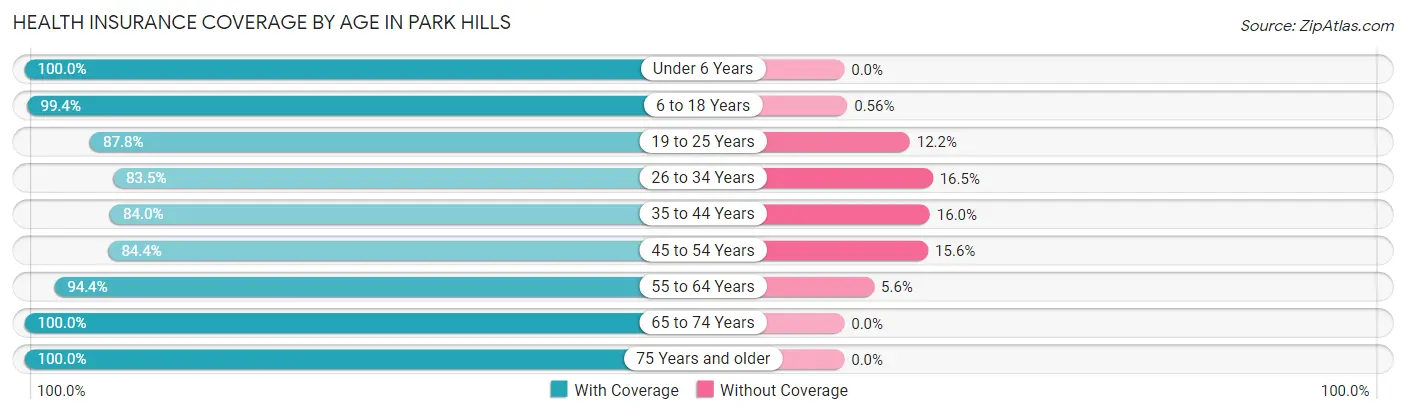
| Age Bracket | With Coverage | Without Coverage |
| Under 6 Years | 829 (100.0%) | 0 (0.0%) |
| 6 to 18 Years | 1,421 (99.4%) | 8 (0.6%) |
| 19 to 25 Years | 855 (87.8%) | 119 (12.2%) |
| 26 to 34 Years | 805 (83.5%) | 159 (16.5%) |
| 35 to 44 Years | 1,143 (84.0%) | 217 (16.0%) |
| 45 to 54 Years | 631 (84.4%) | 117 (15.6%) |
| 55 to 64 Years | 1,037 (94.4%) | 61 (5.6%) |
| 65 to 74 Years | 597 (100.0%) | 0 (0.0%) |
| 75 Years and older | 605 (100.0%) | 0 (0.0%) |
| Total | 7,923 (92.1%) | 681 (7.9%) |
Health Insurance Coverage by Citizenship Status in Park Hills
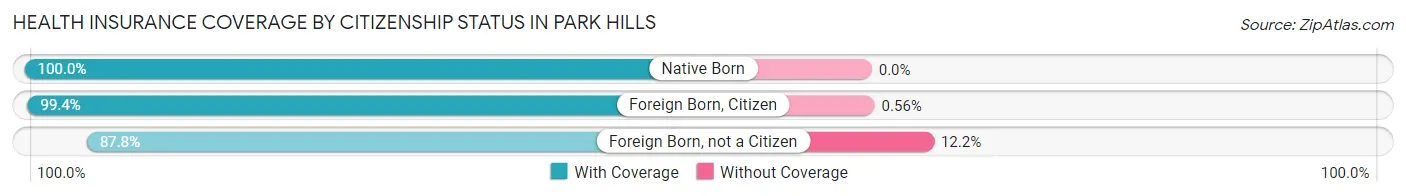
| Citizenship Status | With Coverage | Without Coverage |
| Native Born | 829 (100.0%) | 0 (0.0%) |
| Foreign Born, Citizen | 1,421 (99.4%) | 8 (0.6%) |
| Foreign Born, not a Citizen | 855 (87.8%) | 119 (12.2%) |
Health Insurance Coverage by Household Income in Park Hills
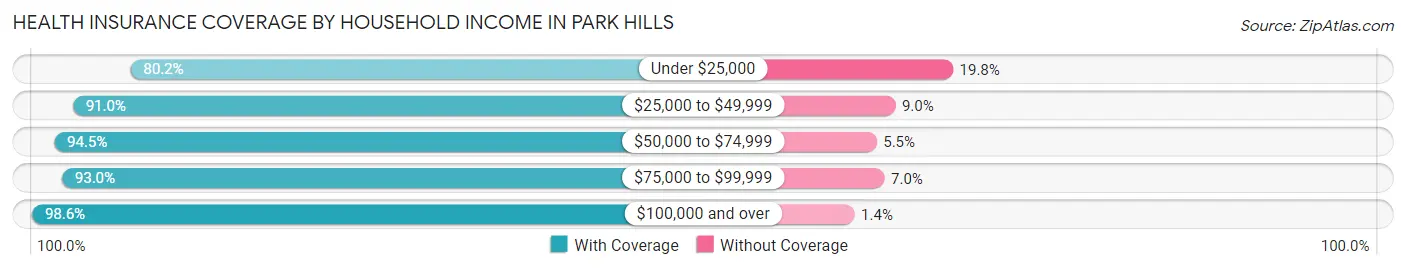
| Household Income | With Coverage | Without Coverage |
| Under $25,000 | 1,327 (80.2%) | 328 (19.8%) |
| $25,000 to $49,999 | 1,432 (91.0%) | 142 (9.0%) |
| $50,000 to $74,999 | 1,610 (94.5%) | 94 (5.5%) |
| $75,000 to $99,999 | 1,118 (93.0%) | 84 (7.0%) |
| $100,000 and over | 2,357 (98.6%) | 33 (1.4%) |
Public vs Private Health Insurance Coverage by Age in Park Hills
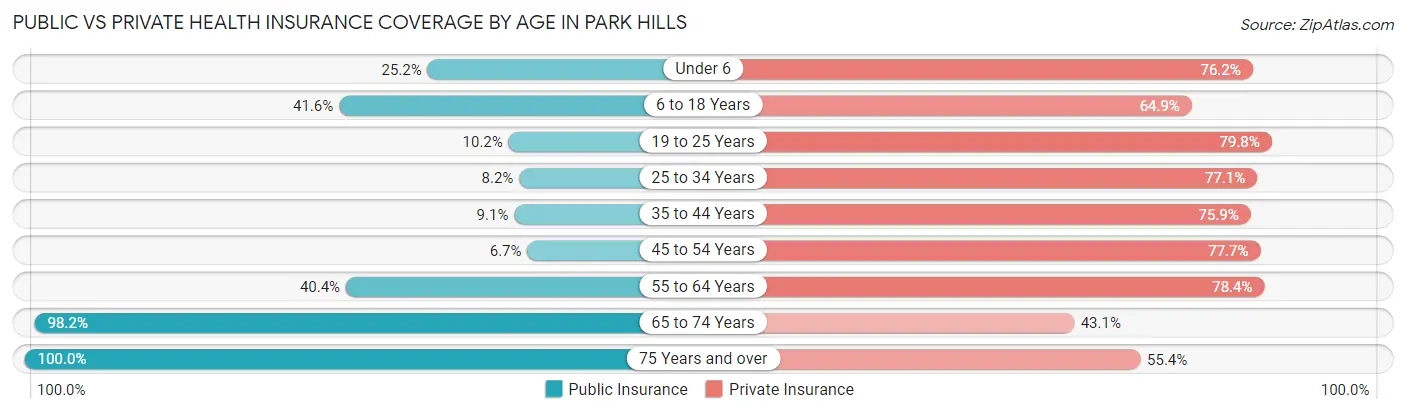
| Age Bracket | Public Insurance | Private Insurance |
| Under 6 | 209 (25.2%) | 632 (76.2%) |
| 6 to 18 Years | 595 (41.6%) | 928 (64.9%) |
| 19 to 25 Years | 99 (10.2%) | 777 (79.8%) |
| 25 to 34 Years | 79 (8.2%) | 743 (77.1%) |
| 35 to 44 Years | 124 (9.1%) | 1,032 (75.9%) |
| 45 to 54 Years | 50 (6.7%) | 581 (77.7%) |
| 55 to 64 Years | 443 (40.4%) | 861 (78.4%) |
| 65 to 74 Years | 586 (98.2%) | 257 (43.0%) |
| 75 Years and over | 605 (100.0%) | 335 (55.4%) |
| Total | 2,790 (32.4%) | 6,146 (71.4%) |
Disability Status by Sex by Age in Park Hills
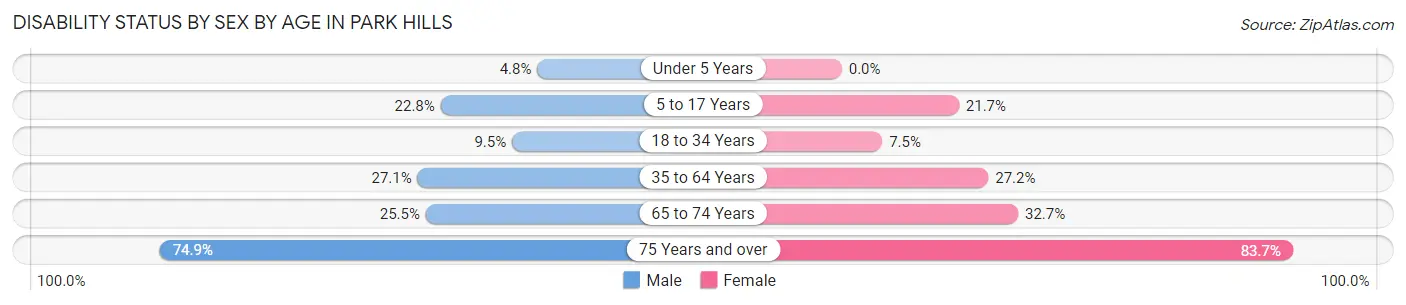
| Age Bracket | Male | Female |
| Under 5 Years | 18 (4.8%) | 0 (0.0%) |
| 5 to 17 Years | 162 (22.8%) | 143 (21.7%) |
| 18 to 34 Years | 87 (9.5%) | 86 (7.5%) |
| 35 to 64 Years | 385 (27.1%) | 485 (27.2%) |
| 65 to 74 Years | 83 (25.5%) | 89 (32.7%) |
| 75 Years and over | 242 (74.9%) | 236 (83.7%) |
Disability Class by Sex by Age in Park Hills
Disability Class: Hearing Difficulty
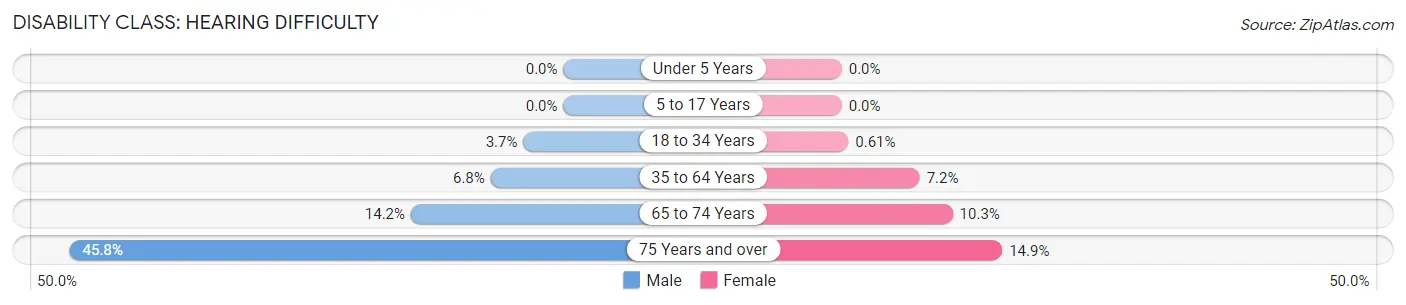
| Age Bracket | Male | Female |
| Under 5 Years | 0 (0.0%) | 0 (0.0%) |
| 5 to 17 Years | 0 (0.0%) | 0 (0.0%) |
| 18 to 34 Years | 34 (3.7%) | 7 (0.6%) |
| 35 to 64 Years | 96 (6.8%) | 129 (7.2%) |
| 65 to 74 Years | 46 (14.1%) | 28 (10.3%) |
| 75 Years and over | 148 (45.8%) | 42 (14.9%) |
Disability Class: Vision Difficulty
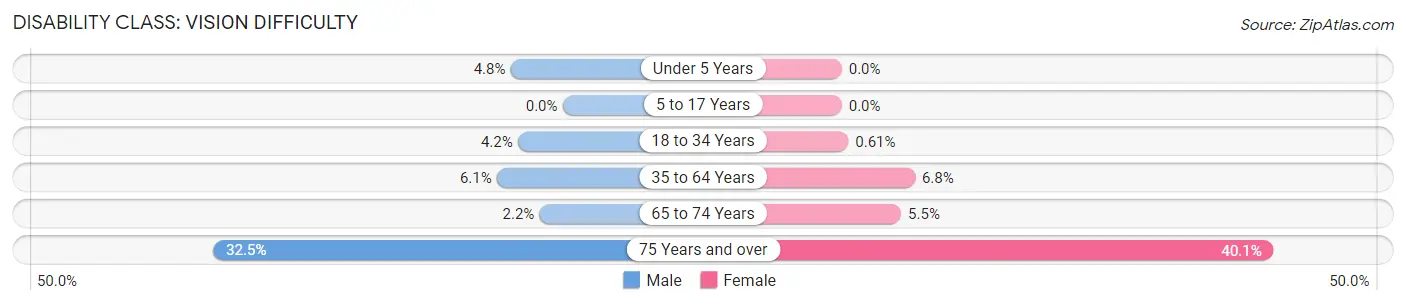
| Age Bracket | Male | Female |
| Under 5 Years | 18 (4.8%) | 0 (0.0%) |
| 5 to 17 Years | 0 (0.0%) | 0 (0.0%) |
| 18 to 34 Years | 38 (4.2%) | 7 (0.6%) |
| 35 to 64 Years | 87 (6.1%) | 121 (6.8%) |
| 65 to 74 Years | 7 (2.1%) | 15 (5.5%) |
| 75 Years and over | 105 (32.5%) | 113 (40.1%) |
Disability Class: Cognitive Difficulty
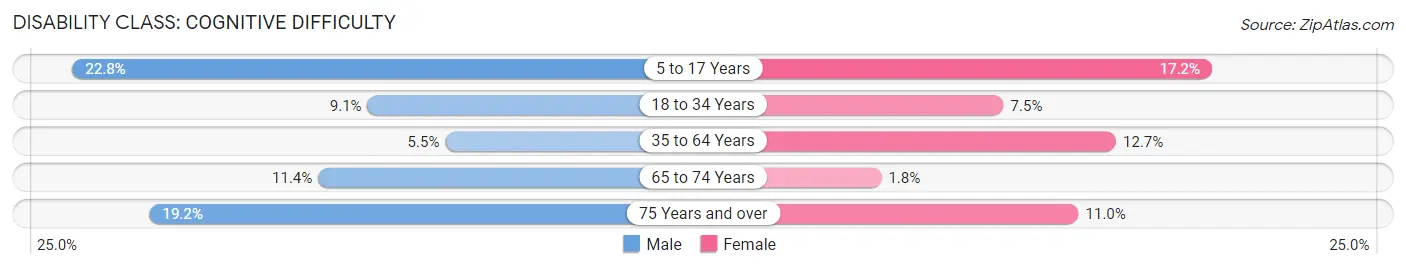
| Age Bracket | Male | Female |
| 5 to 17 Years | 162 (22.8%) | 113 (17.2%) |
| 18 to 34 Years | 83 (9.1%) | 86 (7.5%) |
| 35 to 64 Years | 78 (5.5%) | 227 (12.7%) |
| 65 to 74 Years | 37 (11.4%) | 5 (1.8%) |
| 75 Years and over | 62 (19.2%) | 31 (11.0%) |
Disability Class: Ambulatory Difficulty
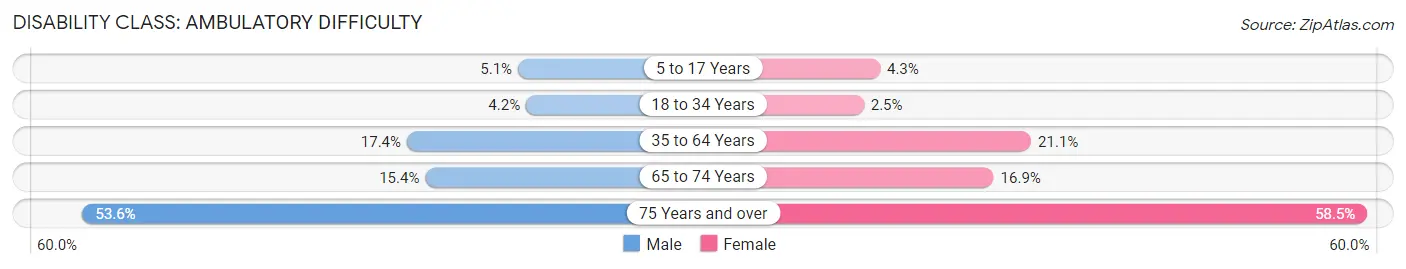
| Age Bracket | Male | Female |
| 5 to 17 Years | 36 (5.1%) | 28 (4.3%) |
| 18 to 34 Years | 38 (4.2%) | 28 (2.5%) |
| 35 to 64 Years | 248 (17.4%) | 376 (21.1%) |
| 65 to 74 Years | 50 (15.4%) | 46 (16.9%) |
| 75 Years and over | 173 (53.6%) | 165 (58.5%) |
Disability Class: Self-Care Difficulty
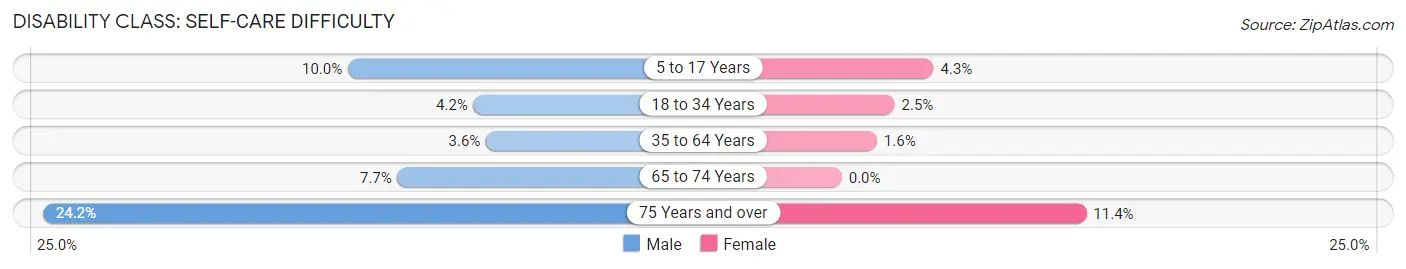
| Age Bracket | Male | Female |
| 5 to 17 Years | 71 (10.0%) | 28 (4.3%) |
| 18 to 34 Years | 38 (4.2%) | 28 (2.5%) |
| 35 to 64 Years | 51 (3.6%) | 29 (1.6%) |
| 65 to 74 Years | 25 (7.7%) | 0 (0.0%) |
| 75 Years and over | 78 (24.1%) | 32 (11.4%) |
Technology Access in Park Hills
Computing Device Access in Park Hills
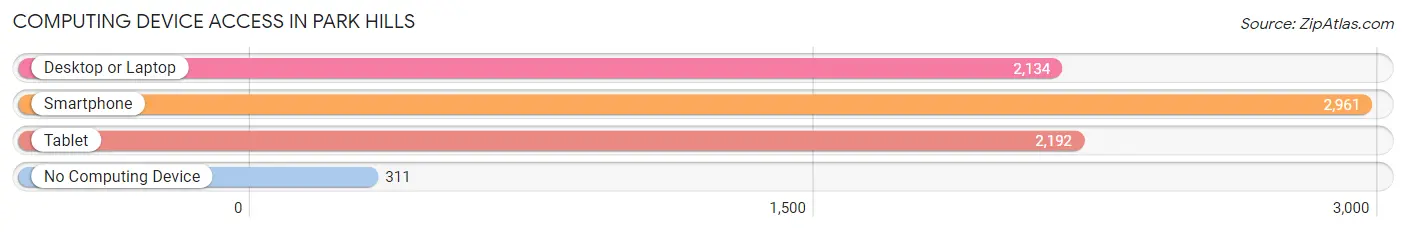
| Device Type | # Households | % Households |
| Desktop or Laptop | 2,134 | 62.0% |
| Smartphone | 2,961 | 86.1% |
| Tablet | 2,192 | 63.7% |
| No Computing Device | 311 | 9.0% |
| Total | 3,440 | 100.0% |
Internet Access in Park Hills
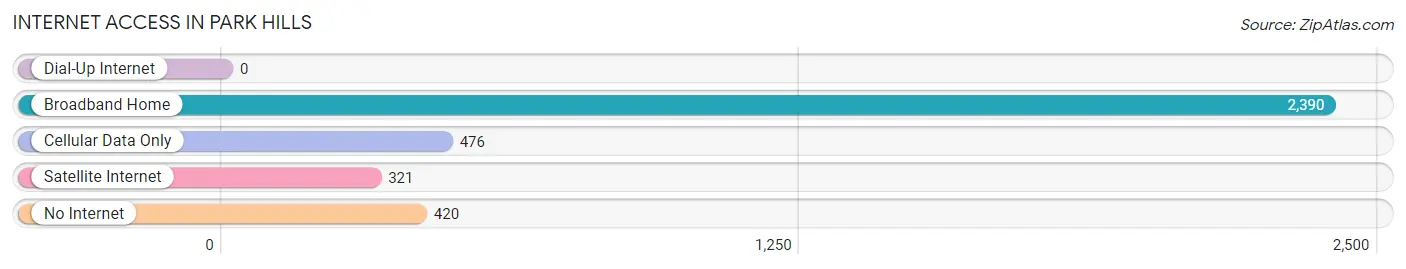
| Internet Type | # Households | % Households |
| Dial-Up Internet | 0 | 0.0% |
| Broadband Home | 2,390 | 69.5% |
| Cellular Data Only | 476 | 13.8% |
| Satellite Internet | 321 | 9.3% |
| No Internet | 420 | 12.2% |
| Total | 3,440 | 100.0% |
Park Hills Summary
History
Park Hills, Missouri is a small city located in St. Francois County in the southeastern part of the state. It is situated on the banks of the Big River, and is part of the St. Louis metropolitan area. The city was founded in 1876 by a group of coal miners who were looking for a place to settle and work. The city was named after the nearby hills, which were used for coal mining.
The city was originally a small mining town, but it quickly grew in size and population. By the early 1900s, Park Hills had become a bustling city with a population of over 2,000 people. The city was home to several coal mines, as well as a number of other businesses, including a hotel, a bank, and a post office.
In the early 1900s, Park Hills was a major center for the coal mining industry. The city was home to several large coal companies, including the Park Hills Coal Company, the St. Francois County Coal Company, and the Park Hills Mining Company. The coal industry provided jobs for many of the city’s residents, and the city’s economy was largely dependent on the coal industry.
In the 1950s, the coal industry began to decline, and the city’s economy shifted to other industries. The city’s population began to decline as well, and by the 1970s, the city’s population had dropped to just over 1,000 people.
Today, Park Hills is a small city with a population of just over 2,000 people. The city is still home to several coal mines, but the coal industry is no longer the main source of employment for the city’s residents. The city’s economy is now largely based on tourism, with many visitors coming to the city to enjoy its natural beauty and outdoor activities.
Geography
Park Hills is located in St. Francois County in the southeastern part of Missouri. The city is situated on the banks of the Big River, and is part of the St. Louis metropolitan area. The city is located in a hilly area, and is surrounded by forests and rolling hills. The city is located about 50 miles south of St. Louis, and is about an hour’s drive from the city.
The city has a total area of 2.2 square miles, and has a population of just over 2,000 people. The city is home to several parks, including the Park Hills City Park, which is located on the banks of the Big River. The city is also home to several historic sites, including the Park Hills Historic District, which is listed on the National Register of Historic Places.
Economy
The economy of Park Hills is largely based on tourism. The city is home to several parks and historic sites, and many visitors come to the city to enjoy its natural beauty and outdoor activities. The city is also home to several businesses, including restaurants, hotels, and retail stores.
The city is also home to several coal mines, and the coal industry is still an important part of the city’s economy. The city is home to several large coal companies, including the Park Hills Coal Company, the St. Francois County Coal Company, and the Park Hills Mining Company.
Demographics
As of the 2010 census, the population of Park Hills was 2,072. The city has a population density of 930 people per square mile. The median age of the city’s population is 41.7 years, and the median household income is $37,941.
The city is predominantly white, with 87.3% of the population identifying as white. The city is also home to a small African American population, with 8.2% of the population identifying as African American. The city is also home to a small Hispanic population, with 2.2% of the population identifying as Hispanic or Latino.
The city is home to several churches, including the Park Hills United Methodist Church, the Park Hills Baptist Church, and the Park Hills Presbyterian Church. The city is also home to several schools, including the Park Hills Elementary School, the Park Hills Middle School, and the Park Hills High School.
Common Questions
What is Per Capita Income in Park Hills?
Per Capita income in Park Hills is $24,734.
What is the Median Family Income in Park Hills?
Median Family Income in Park Hills is $55,532.
What is the Median Household income in Park Hills?
Median Household Income in Park Hills is $50,628.
What is Income or Wage Gap in Park Hills?
Income or Wage Gap in Park Hills is 40.9%.
Women in Park Hills earn 59.1 cents for every dollar earned by a man.
What is Inequality or Gini Index in Park Hills?
Inequality or Gini Index in Park Hills is 0.44.
What is the Total Population of Park Hills?
Total Population of Park Hills is 8,653.
What is the Total Male Population of Park Hills?
Total Male Population of Park Hills is 4,068.
What is the Total Female Population of Park Hills?
Total Female Population of Park Hills is 4,585.
What is the Ratio of Males per 100 Females in Park Hills?
There are 88.72 Males per 100 Females in Park Hills.
What is the Ratio of Females per 100 Males in Park Hills?
There are 112.71 Females per 100 Males in Park Hills.
What is the Median Population Age in Park Hills?
Median Population Age in Park Hills is 35.7 Years.
What is the Average Family Size in Park Hills
Average Family Size in Park Hills is 3.1 People.
What is the Average Household Size in Park Hills
Average Household Size in Park Hills is 2.5 People.
How Large is the Labor Force in Park Hills?
There are 4,290 People in the Labor Forcein in Park Hills.
What is the Percentage of People in the Labor Force in Park Hills?
64.0% of People are in the Labor Force in Park Hills.
What is the Unemployment Rate in Park Hills?
Unemployment Rate in Park Hills is 5.7%.