Osage Beach, MO Map & Demographics
Osage Beach Map
Osage Beach Overview
$28,511
PER CAPITA INCOME
$61,478
AVG FAMILY INCOME
$51,600
AVG HOUSEHOLD INCOME
10.7%
WAGE / INCOME GAP [ % ]
89.3¢/ $1
WAGE / INCOME GAP [ $ ]
0.46
INEQUALITY / GINI INDEX
4,736
TOTAL POPULATION
2,490
MALE POPULATION
2,246
FEMALE POPULATION
110.86
MALES / 100 FEMALES
90.20
FEMALES / 100 MALES
48.0
MEDIAN AGE
3.2
AVG FAMILY SIZE
2.7
AVG HOUSEHOLD SIZE
2,318
LABOR FORCE [ PEOPLE ]
57.8%
PERCENT IN LABOR FORCE
10.6%
UNEMPLOYMENT RATE
Osage Beach Zip Codes
Osage Beach Area Codes
Income in Osage Beach
Income Overview in Osage Beach
Per Capita Income in Osage Beach is $28,511, while median incomes of families and households are $61,478 and $51,600 respectively.
| Characteristic | Number | Measure |
| Per Capita Income | 4,736 | $28,511 |
| Median Family Income | 1,024 | $61,478 |
| Mean Family Income | 1,024 | $87,615 |
| Median Household Income | 1,658 | $51,600 |
| Mean Household Income | 1,658 | $71,535 |
| Income Deficit | 1,024 | $0 |
| Wage / Income Gap (%) | 4,736 | 10.73% |
| Wage / Income Gap ($) | 4,736 | 89.27¢ per $1 |
| Gini / Inequality Index | 4,736 | 0.46 |
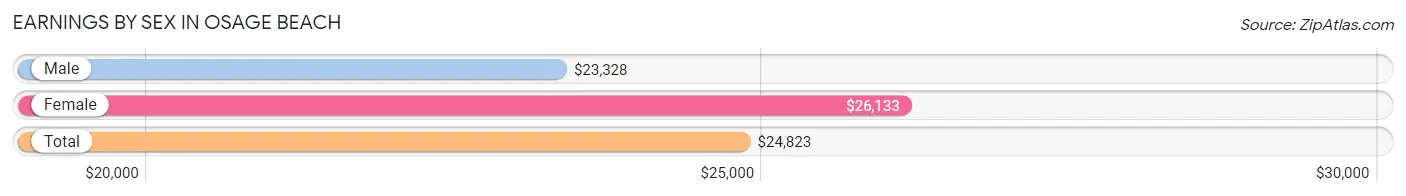
Earnings by Sex in Osage Beach
Average Earnings in Osage Beach are $24,823, $23,328 for men and $26,133 for women, a difference of 10.7%.
| Sex | Number | Average Earnings |
| Male | 1,487 (59.4%) | $23,328 |
| Female | 1,017 (40.6%) | $26,133 |
| Total | 2,504 (100.0%) | $24,823 |
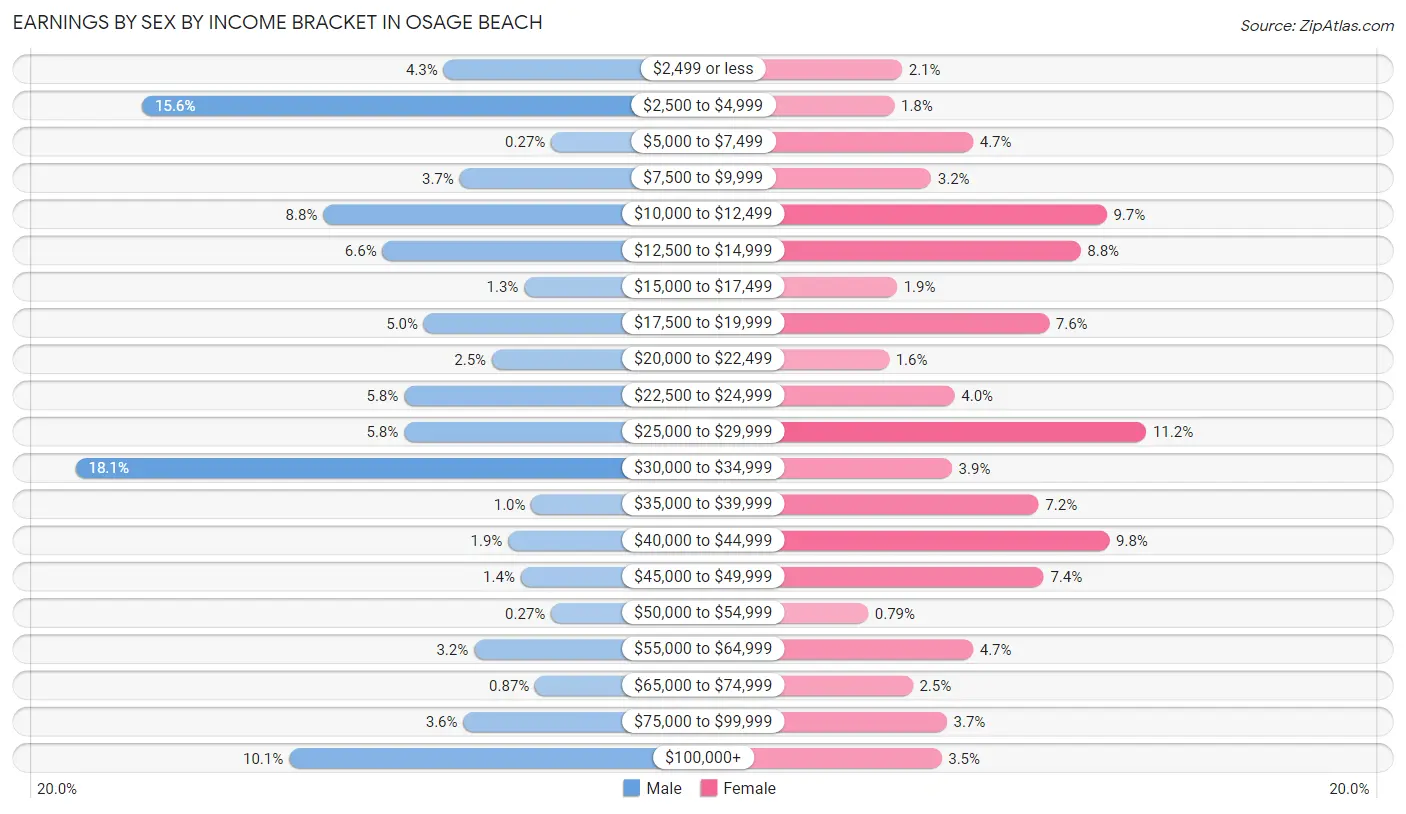
Earnings by Sex by Income Bracket in Osage Beach
The most common earnings brackets in Osage Beach are $30,000 to $34,999 for men (269 | 18.1%) and $25,000 to $29,999 for women (114 | 11.2%).
| Income | Male | Female |
| $2,499 or less | 64 (4.3%) | 21 (2.1%) |
| $2,500 to $4,999 | 232 (15.6%) | 18 (1.8%) |
| $5,000 to $7,499 | 4 (0.3%) | 48 (4.7%) |
| $7,500 to $9,999 | 55 (3.7%) | 32 (3.2%) |
| $10,000 to $12,499 | 131 (8.8%) | 99 (9.7%) |
| $12,500 to $14,999 | 98 (6.6%) | 89 (8.7%) |
| $15,000 to $17,499 | 19 (1.3%) | 19 (1.9%) |
| $17,500 to $19,999 | 75 (5.0%) | 77 (7.6%) |
| $20,000 to $22,499 | 37 (2.5%) | 16 (1.6%) |
| $22,500 to $24,999 | 86 (5.8%) | 41 (4.0%) |
| $25,000 to $29,999 | 86 (5.8%) | 114 (11.2%) |
| $30,000 to $34,999 | 269 (18.1%) | 40 (3.9%) |
| $35,000 to $39,999 | 15 (1.0%) | 73 (7.2%) |
| $40,000 to $44,999 | 28 (1.9%) | 100 (9.8%) |
| $45,000 to $49,999 | 21 (1.4%) | 75 (7.4%) |
| $50,000 to $54,999 | 4 (0.3%) | 8 (0.8%) |
| $55,000 to $64,999 | 47 (3.2%) | 48 (4.7%) |
| $65,000 to $74,999 | 13 (0.9%) | 25 (2.5%) |
| $75,000 to $99,999 | 53 (3.6%) | 38 (3.7%) |
| $100,000+ | 150 (10.1%) | 36 (3.5%) |
| Total | 1,487 (100.0%) | 1,017 (100.0%) |
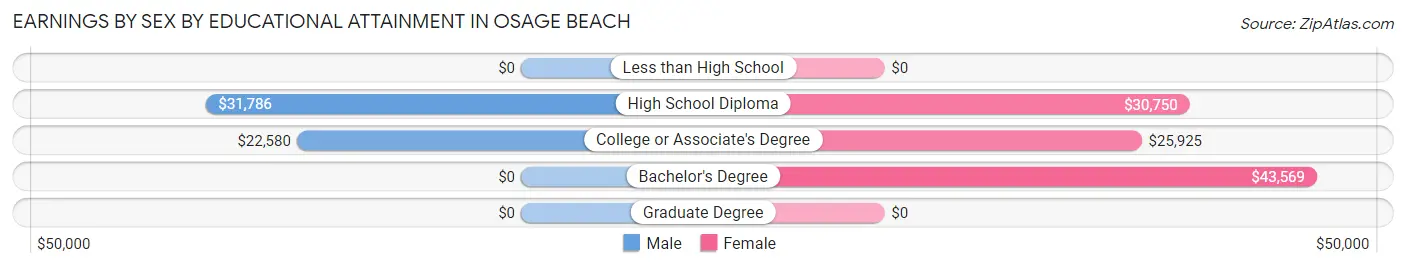
Earnings by Sex by Educational Attainment in Osage Beach
Average earnings in Osage Beach are $27,337 for men and $26,605 for women, a difference of 2.7%. Men with an educational attainment of high school diploma enjoy the highest average annual earnings of $31,786, while those with college or associate's degree education earn the least with $22,580. Women with an educational attainment of bachelor's degree earn the most with the average annual earnings of $43,569, while those with college or associate's degree education have the smallest earnings of $25,925.
| Educational Attainment | Male Income | Female Income |
| Less than High School | - | - |
| High School Diploma | $31,786 | $30,750 |
| College or Associate's Degree | $22,580 | $25,925 |
| Bachelor's Degree | - | - |
| Graduate Degree | - | - |
| Total | $27,337 | $26,605 |
Family Income in Osage Beach
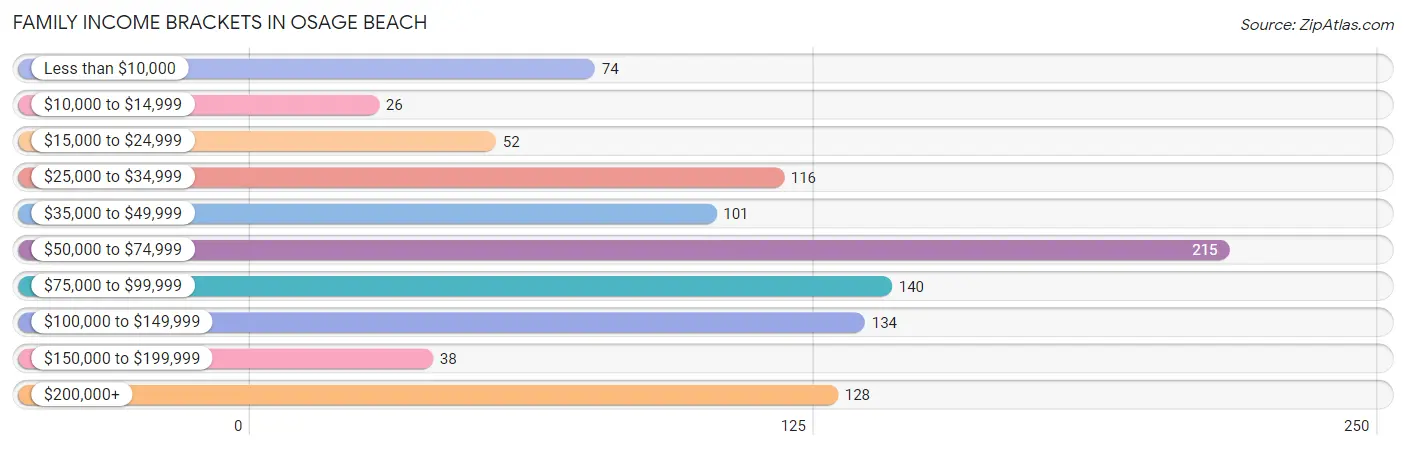
Family Income Brackets in Osage Beach
According to the Osage Beach family income data, there are 215 families falling into the $50,000 to $74,999 income range, which is the most common income bracket and makes up 21.0% of all families. Conversely, the $10,000 to $14,999 income bracket is the least frequent group with only 26 families (2.5%) belonging to this category.
| Income Bracket | # Families | % Families |
| Less than $10,000 | 74 | 7.2% |
| $10,000 to $14,999 | 26 | 2.5% |
| $15,000 to $24,999 | 52 | 5.1% |
| $25,000 to $34,999 | 116 | 11.3% |
| $35,000 to $49,999 | 101 | 9.9% |
| $50,000 to $74,999 | 215 | 21.0% |
| $75,000 to $99,999 | 140 | 13.7% |
| $100,000 to $149,999 | 134 | 13.1% |
| $150,000 to $199,999 | 38 | 3.7% |
| $200,000+ | 128 | 12.5% |
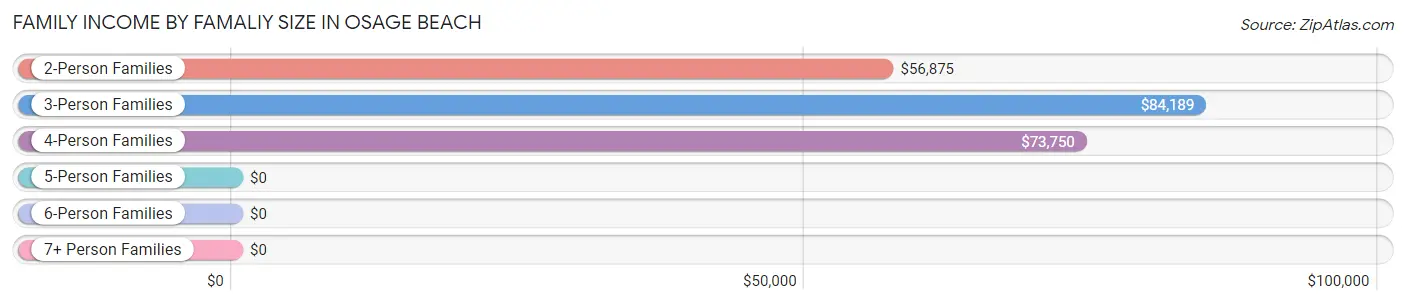
Family Income by Famaliy Size in Osage Beach
3-person families (154 | 15.0%) account for the highest median family income in Osage Beach with $84,189 per family, while 2-person families (701 | 68.5%) have the highest median income of $28,438 per family member.
| Income Bracket | # Families | Median Income |
| 2-Person Families | 701 (68.5%) | $56,875 |
| 3-Person Families | 154 (15.0%) | $84,189 |
| 4-Person Families | 62 (6.0%) | $73,750 |
| 5-Person Families | 87 (8.5%) | $0 |
| 6-Person Families | 7 (0.7%) | $0 |
| 7+ Person Families | 13 (1.3%) | $0 |
| Total | 1,024 (100.0%) | $61,478 |
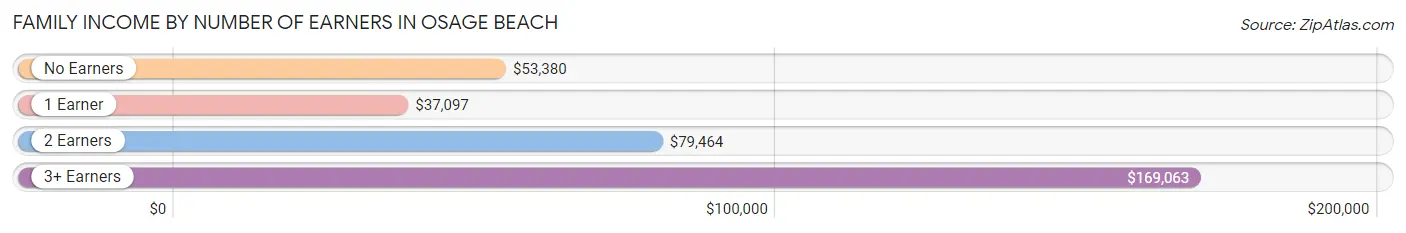
Family Income by Number of Earners in Osage Beach
The median family income in Osage Beach is $61,478, with families comprising 3+ earners (73) having the highest median family income of $169,063, while families with 1 earner (240) have the lowest median family income of $37,097, accounting for 7.1% and 23.4% of families, respectively.
| Number of Earners | # Families | Median Income |
| No Earners | 288 (28.1%) | $53,380 |
| 1 Earner | 240 (23.4%) | $37,097 |
| 2 Earners | 423 (41.3%) | $79,464 |
| 3+ Earners | 73 (7.1%) | $169,063 |
| Total | 1,024 (100.0%) | $61,478 |
Household Income in Osage Beach
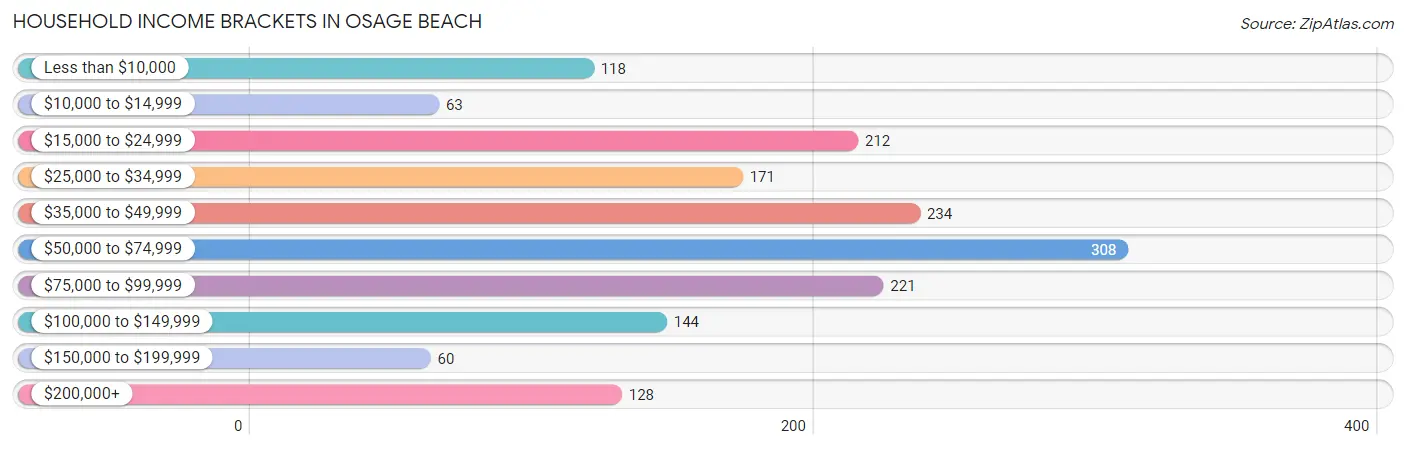
Household Income Brackets in Osage Beach
With 308 households falling in the category, the $50,000 to $74,999 income range is the most frequent in Osage Beach, accounting for 18.6% of all households. In contrast, only 60 households (3.6%) fall into the $150,000 to $199,999 income bracket, making it the least populous group.
| Income Bracket | # Households | % Households |
| Less than $10,000 | 118 | 7.1% |
| $10,000 to $14,999 | 63 | 3.8% |
| $15,000 to $24,999 | 212 | 12.8% |
| $25,000 to $34,999 | 171 | 10.3% |
| $35,000 to $49,999 | 234 | 14.1% |
| $50,000 to $74,999 | 308 | 18.6% |
| $75,000 to $99,999 | 221 | 13.3% |
| $100,000 to $149,999 | 144 | 8.7% |
| $150,000 to $199,999 | 60 | 3.6% |
| $200,000+ | 128 | 7.7% |
Household Income by Householder Age in Osage Beach
The median household income in Osage Beach is $51,600, with the highest median household income of $83,750 found in the 45 to 64 years age bracket for the primary householder. A total of 516 households (31.1%) fall into this category. Meanwhile, the 65+ years age bracket for the primary householder has the lowest median household income of $36,316, with 756 households (45.6%) in this group.
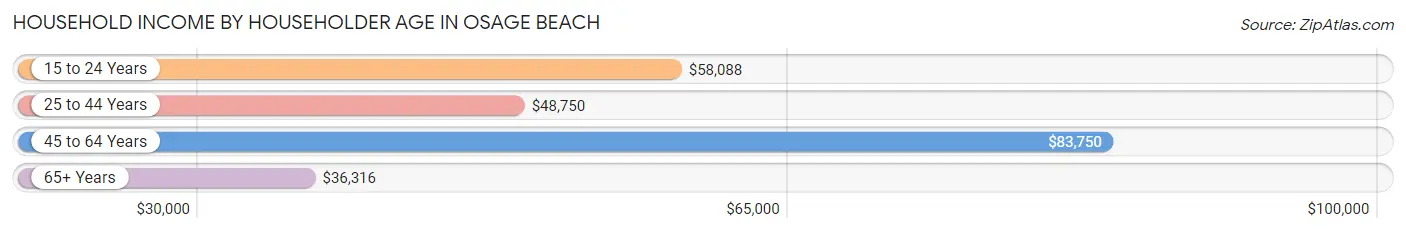
| Income Bracket | # Households | Median Income |
| 15 to 24 Years | 40 (2.4%) | $58,088 |
| 25 to 44 Years | 346 (20.9%) | $48,750 |
| 45 to 64 Years | 516 (31.1%) | $83,750 |
| 65+ Years | 756 (45.6%) | $36,316 |
| Total | 1,658 (100.0%) | $51,600 |
Poverty in Osage Beach
Income Below Poverty by Sex and Age in Osage Beach
With 22.8% poverty level for males and 14.4% for females among the residents of Osage Beach, 35 to 44 year old males and 12 to 14 year old females are the most vulnerable to poverty, with 194 males (55.4%) and 60 females (75.9%) in their respective age groups living below the poverty level.
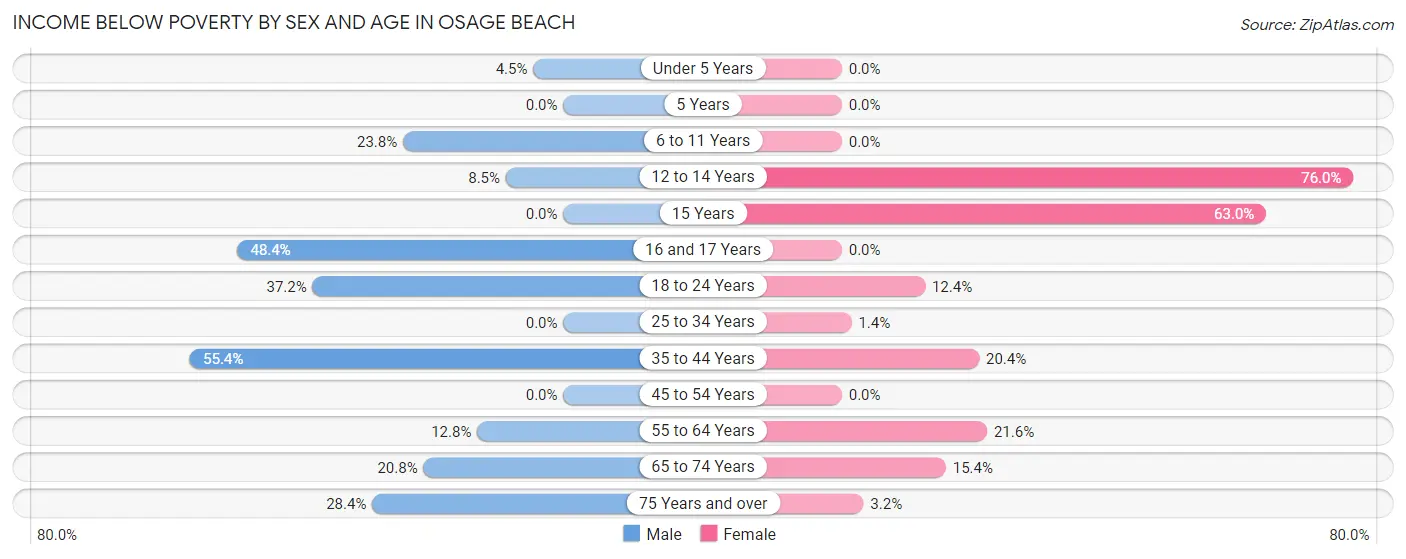
| Age Bracket | Male | Female |
| Under 5 Years | 7 (4.5%) | 0 (0.0%) |
| 5 Years | 0 (0.0%) | 0 (0.0%) |
| 6 to 11 Years | 15 (23.8%) | 0 (0.0%) |
| 12 to 14 Years | 7 (8.5%) | 60 (75.9%) |
| 15 Years | 0 (0.0%) | 46 (63.0%) |
| 16 and 17 Years | 60 (48.4%) | 0 (0.0%) |
| 18 to 24 Years | 73 (37.2%) | 10 (12.3%) |
| 25 to 34 Years | 0 (0.0%) | 4 (1.4%) |
| 35 to 44 Years | 194 (55.4%) | 43 (20.4%) |
| 45 to 54 Years | 0 (0.0%) | 0 (0.0%) |
| 55 to 64 Years | 49 (12.8%) | 83 (21.6%) |
| 65 to 74 Years | 70 (20.8%) | 44 (15.4%) |
| 75 Years and over | 65 (28.4%) | 9 (3.2%) |
| Total | 540 (22.8%) | 299 (14.4%) |
Income Above Poverty by Sex and Age in Osage Beach
According to the poverty statistics in Osage Beach, males aged 5 years and females aged under 5 years are the age groups that are most secure financially, with 100.0% of males and 100.0% of females in these age groups living above the poverty line.
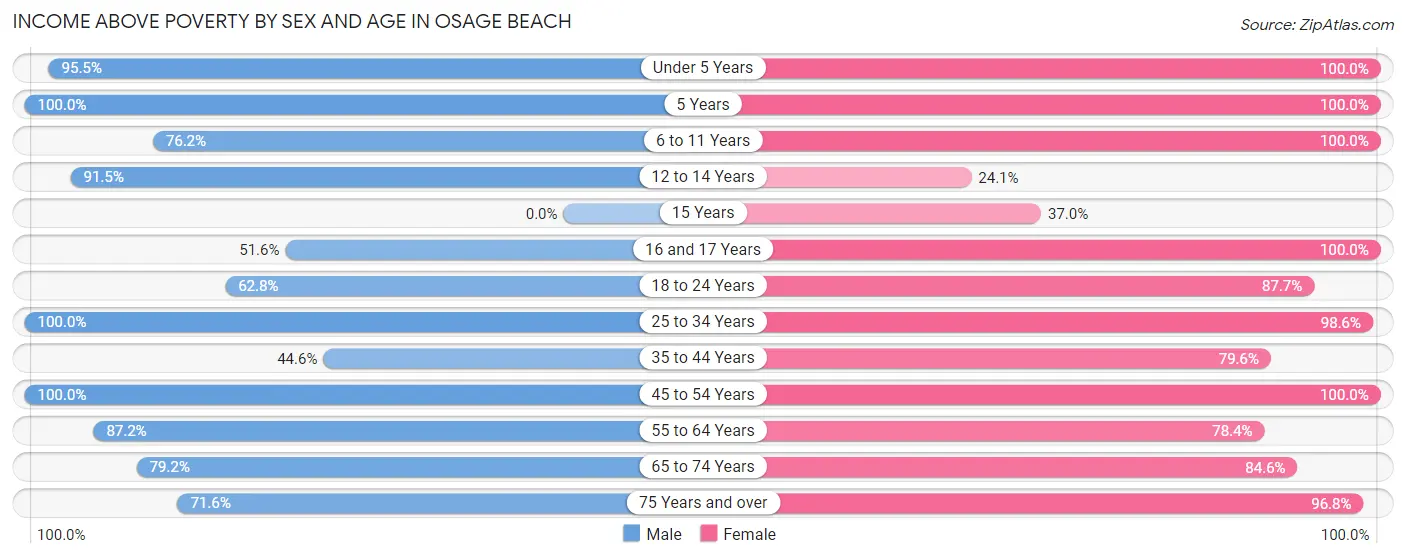
| Age Bracket | Male | Female |
| Under 5 Years | 150 (95.5%) | 93 (100.0%) |
| 5 Years | 25 (100.0%) | 7 (100.0%) |
| 6 to 11 Years | 48 (76.2%) | 67 (100.0%) |
| 12 to 14 Years | 75 (91.5%) | 19 (24.0%) |
| 15 Years | 0 (0.0%) | 27 (37.0%) |
| 16 and 17 Years | 64 (51.6%) | 16 (100.0%) |
| 18 to 24 Years | 123 (62.8%) | 71 (87.6%) |
| 25 to 34 Years | 255 (100.0%) | 275 (98.6%) |
| 35 to 44 Years | 156 (44.6%) | 168 (79.6%) |
| 45 to 54 Years | 171 (100.0%) | 221 (100.0%) |
| 55 to 64 Years | 334 (87.2%) | 302 (78.4%) |
| 65 to 74 Years | 267 (79.2%) | 241 (84.6%) |
| 75 Years and over | 164 (71.6%) | 271 (96.8%) |
| Total | 1,832 (77.2%) | 1,778 (85.6%) |
Income Below Poverty Among Married-Couple Families in Osage Beach
The poverty statistics for married-couple families in Osage Beach show that 17.9% or 150 of the total 837 families live below the poverty line. Families with 3 or 4 children have the highest poverty rate of 43.2%, comprising of 41 families. On the other hand, families with 1 or 2 children have the lowest poverty rate of 0.0%, which includes 0 families.
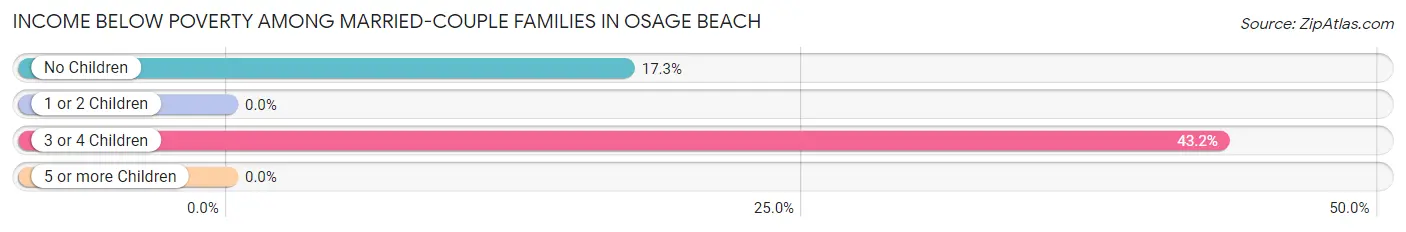
| Children | Above Poverty | Below Poverty |
| No Children | 522 (82.7%) | 109 (17.3%) |
| 1 or 2 Children | 111 (100.0%) | 0 (0.0%) |
| 3 or 4 Children | 54 (56.8%) | 41 (43.2%) |
| 5 or more Children | 0 (0.0%) | 0 (0.0%) |
| Total | 687 (82.1%) | 150 (17.9%) |
Income Below Poverty Among Single-Parent Households in Osage Beach
According to the poverty data in Osage Beach, 12.1% or 4 single-father households and 2.6% or 4 single-mother households are living below the poverty line. Among single-father households, those with no children have the highest poverty rate, with 4 households (22.2%) experiencing poverty. Likewise, among single-mother households, those with 3 or 4 children have the highest poverty rate, with 4 households (100.0%) falling below the poverty line.
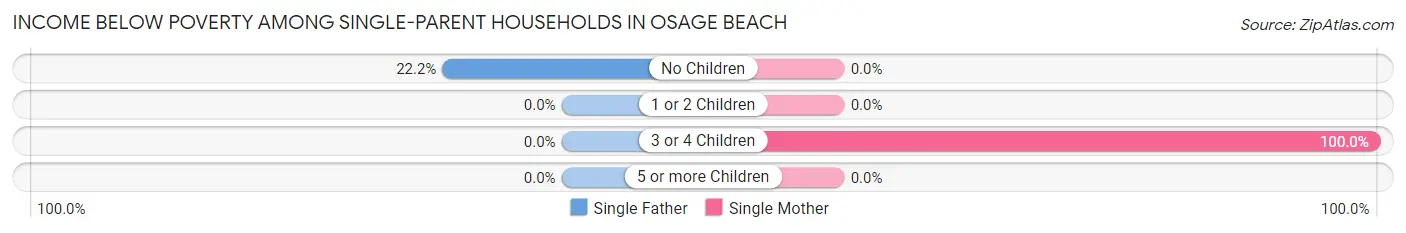
| Children | Single Father | Single Mother |
| No Children | 4 (22.2%) | 0 (0.0%) |
| 1 or 2 Children | 0 (0.0%) | 0 (0.0%) |
| 3 or 4 Children | 0 (0.0%) | 4 (100.0%) |
| 5 or more Children | 0 (0.0%) | 0 (0.0%) |
| Total | 4 (12.1%) | 4 (2.6%) |
Income Below Poverty Among Married-Couple vs Single-Parent Households in Osage Beach
The poverty data for Osage Beach shows that 150 of the married-couple family households (17.9%) and 8 of the single-parent households (4.3%) are living below the poverty level. Within the married-couple family households, those with 3 or 4 children have the highest poverty rate, with 41 households (43.2%) falling below the poverty line. Among the single-parent households, those with 3 or 4 children have the highest poverty rate, with 4 household (100.0%) living below poverty.
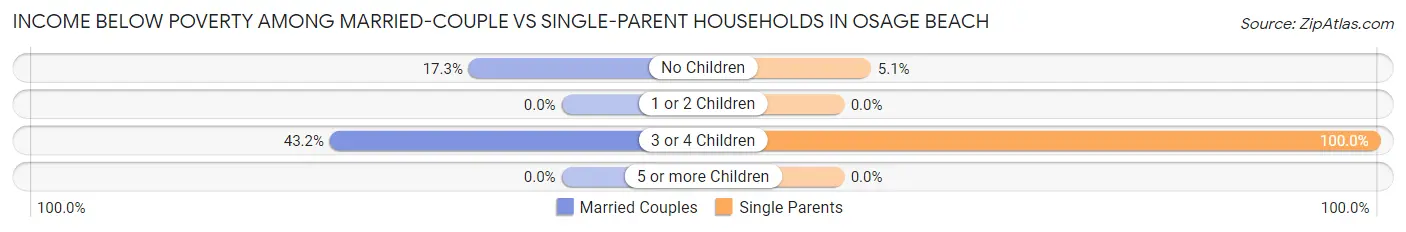
| Children | Married-Couple Families | Single-Parent Households |
| No Children | 109 (17.3%) | 4 (5.1%) |
| 1 or 2 Children | 0 (0.0%) | 0 (0.0%) |
| 3 or 4 Children | 41 (43.2%) | 4 (100.0%) |
| 5 or more Children | 0 (0.0%) | 0 (0.0%) |
| Total | 150 (17.9%) | 8 (4.3%) |
Race in Osage Beach
The most populous races in Osage Beach are White / Caucasian (4,290 | 90.6%), Hispanic or Latino (381 | 8.0%), and Two or more Races (161 | 3.4%).
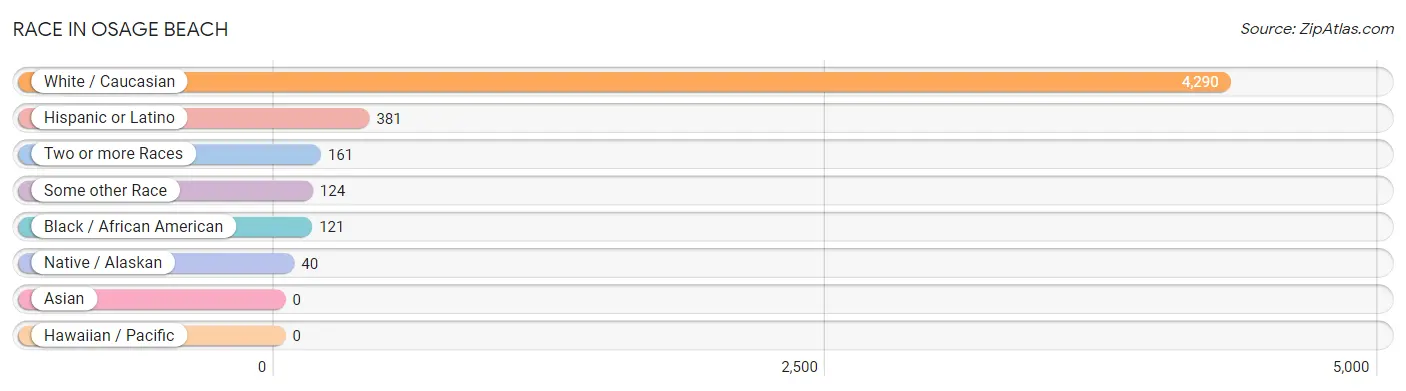
| Race | # Population | % Population |
| Asian | 0 | 0.0% |
| Black / African American | 121 | 2.5% |
| Hawaiian / Pacific | 0 | 0.0% |
| Hispanic or Latino | 381 | 8.0% |
| Native / Alaskan | 40 | 0.8% |
| White / Caucasian | 4,290 | 90.6% |
| Two or more Races | 161 | 3.4% |
| Some other Race | 124 | 2.6% |
| Total | 4,736 | 100.0% |
Ancestry in Osage Beach
The most populous ancestries reported in Osage Beach are American (977 | 20.6%), German (934 | 19.7%), English (524 | 11.1%), Irish (485 | 10.2%), and Italian (412 | 8.7%), together accounting for 70.4% of all Osage Beach residents.
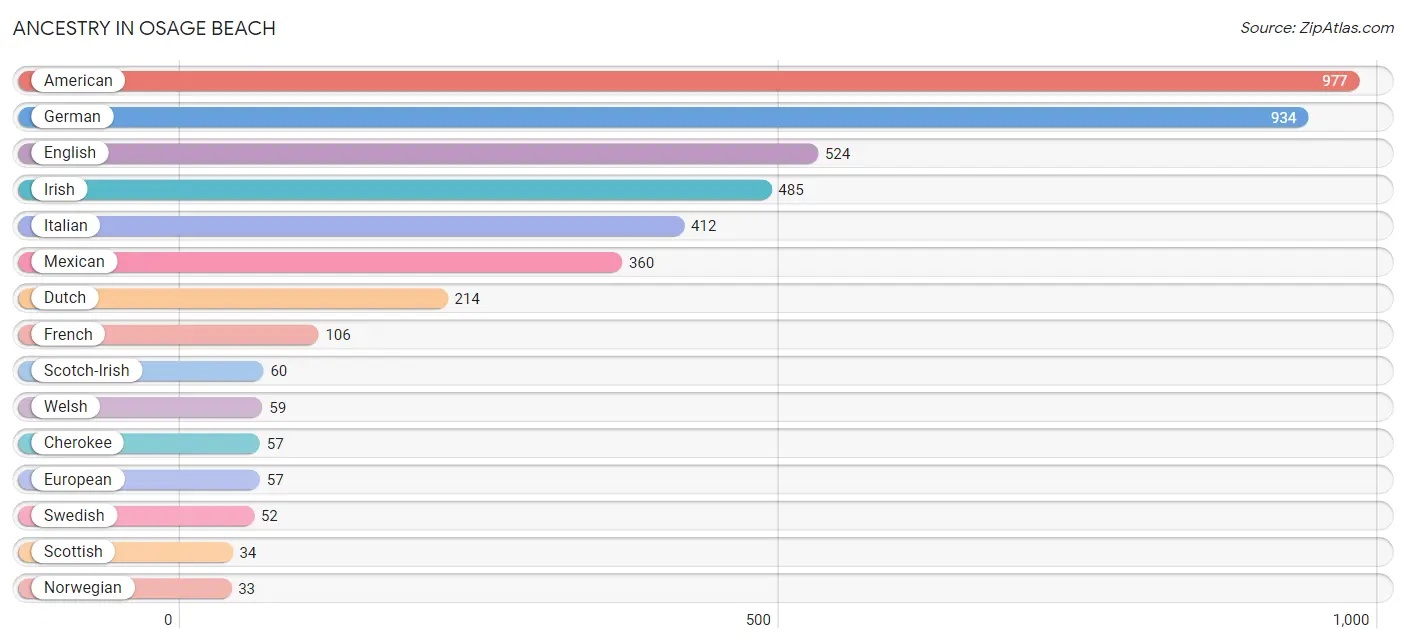
| Ancestry | # Population | % Population |
| American | 977 | 20.6% |
| Apache | 9 | 0.2% |
| Belgian | 7 | 0.2% |
| Canadian | 12 | 0.3% |
| Cherokee | 57 | 1.2% |
| Cheyenne | 20 | 0.4% |
| Danish | 20 | 0.4% |
| Dutch | 214 | 4.5% |
| English | 524 | 11.1% |
| European | 57 | 1.2% |
| French | 106 | 2.2% |
| German | 934 | 19.7% |
| Irish | 485 | 10.2% |
| Italian | 412 | 8.7% |
| Jamaican | 10 | 0.2% |
| Mexican | 360 | 7.6% |
| Norwegian | 33 | 0.7% |
| Polish | 14 | 0.3% |
| Scandinavian | 5 | 0.1% |
| Scotch-Irish | 60 | 1.3% |
| Scottish | 34 | 0.7% |
| Spanish | 21 | 0.4% |
| Swedish | 52 | 1.1% |
| Swiss | 8 | 0.2% |
| Welsh | 59 | 1.3% | View All 25 Rows |
Immigrants in Osage Beach
The most numerous immigrant groups reported in Osage Beach came from Latin America (92 | 1.9%), Central America (84 | 1.8%), Mexico (84 | 1.8%), Canada (12 | 0.3%), and Caribbean (8 | 0.2%), together accounting for 5.9% of all Osage Beach residents.
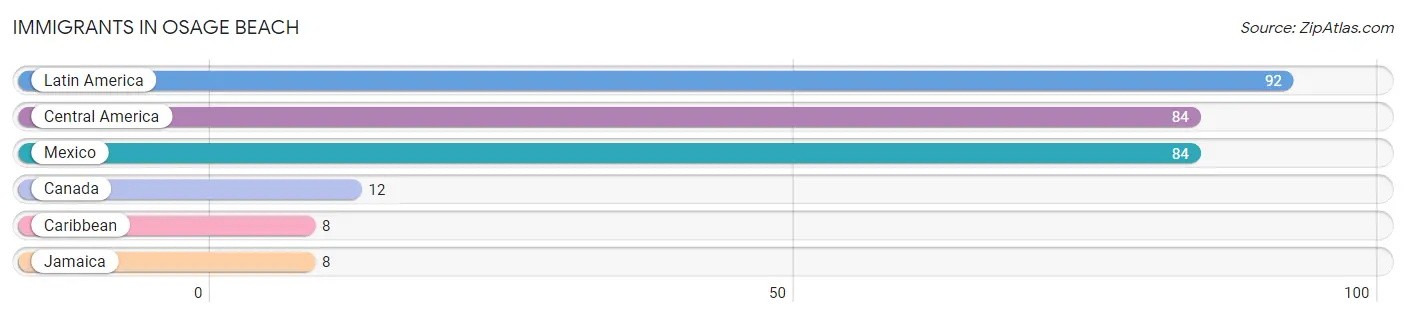
| Immigration Origin | # Population | % Population |
| Canada | 12 | 0.3% |
| Caribbean | 8 | 0.2% |
| Central America | 84 | 1.8% |
| Jamaica | 8 | 0.2% |
| Latin America | 92 | 1.9% |
| Mexico | 84 | 1.8% | View All 6 Rows |
Sex and Age in Osage Beach
Sex and Age in Osage Beach
The most populous age groups in Osage Beach are 55 to 59 Years (264 | 10.6%) for men and 60 to 64 Years (317 | 14.1%) for women.
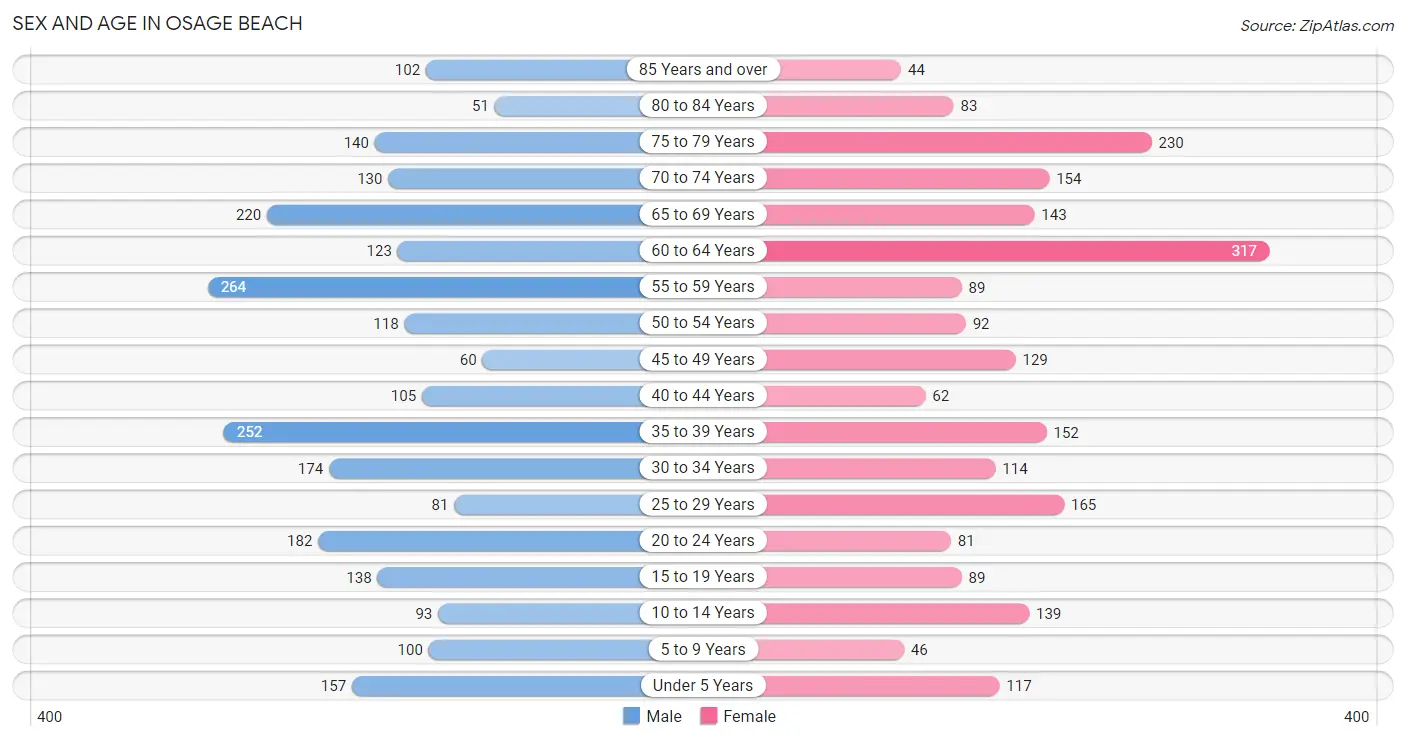
| Age Bracket | Male | Female |
| Under 5 Years | 157 (6.3%) | 117 (5.2%) |
| 5 to 9 Years | 100 (4.0%) | 46 (2.1%) |
| 10 to 14 Years | 93 (3.7%) | 139 (6.2%) |
| 15 to 19 Years | 138 (5.5%) | 89 (4.0%) |
| 20 to 24 Years | 182 (7.3%) | 81 (3.6%) |
| 25 to 29 Years | 81 (3.3%) | 165 (7.3%) |
| 30 to 34 Years | 174 (7.0%) | 114 (5.1%) |
| 35 to 39 Years | 252 (10.1%) | 152 (6.8%) |
| 40 to 44 Years | 105 (4.2%) | 62 (2.8%) |
| 45 to 49 Years | 60 (2.4%) | 129 (5.7%) |
| 50 to 54 Years | 118 (4.7%) | 92 (4.1%) |
| 55 to 59 Years | 264 (10.6%) | 89 (4.0%) |
| 60 to 64 Years | 123 (4.9%) | 317 (14.1%) |
| 65 to 69 Years | 220 (8.8%) | 143 (6.4%) |
| 70 to 74 Years | 130 (5.2%) | 154 (6.9%) |
| 75 to 79 Years | 140 (5.6%) | 230 (10.2%) |
| 80 to 84 Years | 51 (2.1%) | 83 (3.7%) |
| 85 Years and over | 102 (4.1%) | 44 (2.0%) |
| Total | 2,490 (100.0%) | 2,246 (100.0%) |
Families and Households in Osage Beach
Median Family Size in Osage Beach
The median family size in Osage Beach is 3.16 persons per family, with single female/mother families (154 | 15.0%) accounting for the largest median family size of 4.55 persons per family. On the other hand, married-couple families (837 | 81.7%) represent the smallest median family size with 2.85 persons per family.
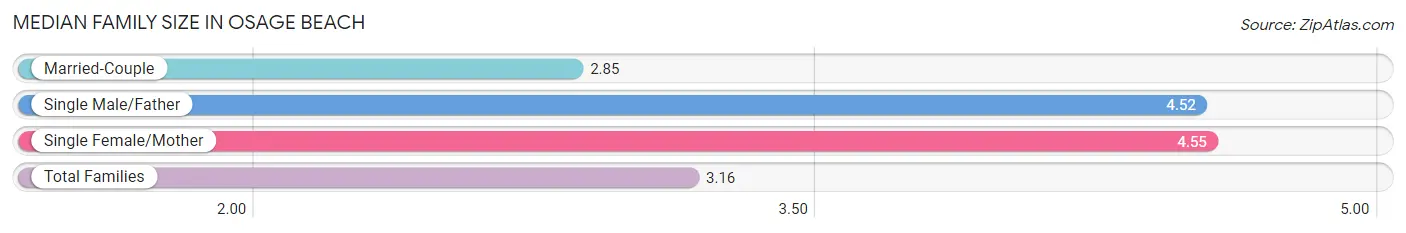
| Family Type | # Families | Family Size |
| Married-Couple | 837 (81.7%) | 2.85 |
| Single Male/Father | 33 (3.2%) | 4.52 |
| Single Female/Mother | 154 (15.0%) | 4.55 |
| Total Families | 1,024 (100.0%) | 3.16 |
Median Household Size in Osage Beach
The median household size in Osage Beach is 2.73 persons per household, with single male/father households (33 | 2.0%) accounting for the largest median household size of 6.82 persons per household. non-family households (634 | 38.2%) represent the smallest median household size with 1.76 persons per household.
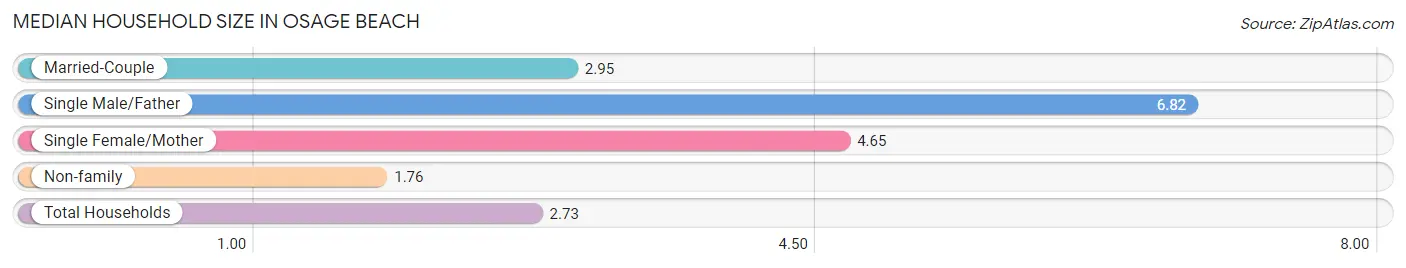
| Household Type | # Households | Household Size |
| Married-Couple | 837 (50.5%) | 2.95 |
| Single Male/Father | 33 (2.0%) | 6.82 |
| Single Female/Mother | 154 (9.3%) | 4.65 |
| Non-family | 634 (38.2%) | 1.76 |
| Total Households | 1,658 (100.0%) | 2.73 |
Household Size by Marriage Status in Osage Beach
Out of a total of 1,658 households in Osage Beach, 1,024 (61.8%) are family households, while 634 (38.2%) are nonfamily households. The most numerous type of family households are 2-person households, comprising 681, and the most common type of nonfamily households are 1-person households, comprising 503.
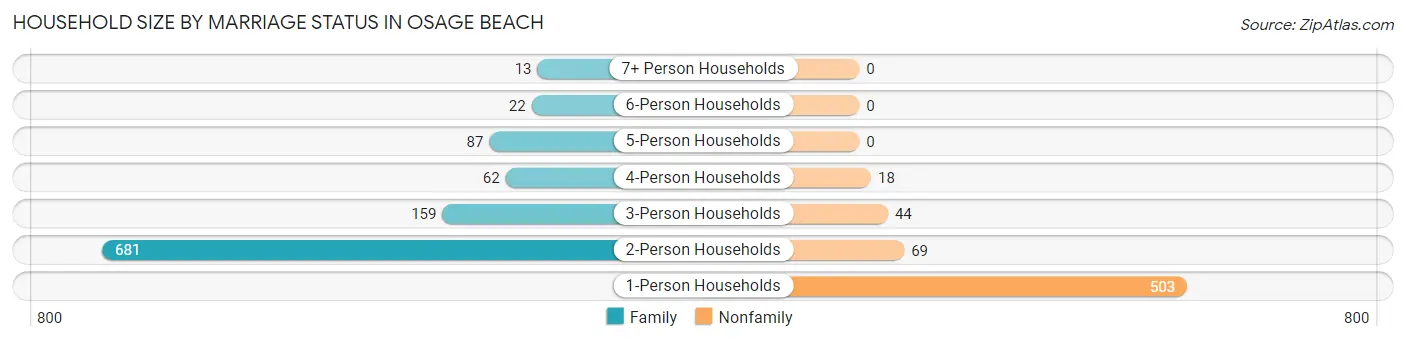
| Household Size | Family Households | Nonfamily Households |
| 1-Person Households | - | 503 (30.3%) |
| 2-Person Households | 681 (41.1%) | 69 (4.2%) |
| 3-Person Households | 159 (9.6%) | 44 (2.6%) |
| 4-Person Households | 62 (3.7%) | 18 (1.1%) |
| 5-Person Households | 87 (5.2%) | 0 (0.0%) |
| 6-Person Households | 22 (1.3%) | 0 (0.0%) |
| 7+ Person Households | 13 (0.8%) | 0 (0.0%) |
| Total | 1,024 (61.8%) | 634 (38.2%) |
Female Fertility in Osage Beach
Fertility by Age in Osage Beach
Average fertility rate in Osage Beach is 125.0 births per 1,000 women. Women in the age bracket of 20 to 34 years have the highest fertility rate with 281.0 births per 1,000 women. Women in the age bracket of 20 to 34 years acount for 100.0% of all women with births.
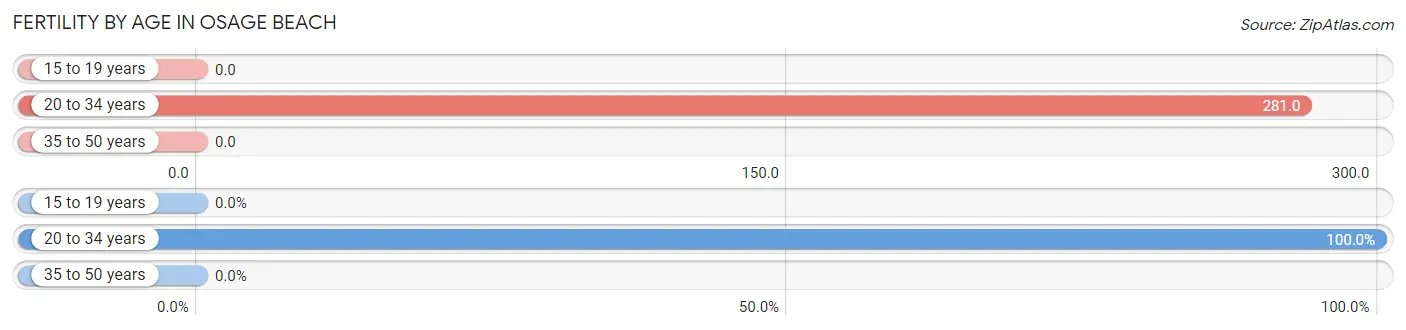
| Age Bracket | Women with Births | Births / 1,000 Women |
| 15 to 19 years | 0 (0.0%) | 0.0 |
| 20 to 34 years | 101 (100.0%) | 281.0 |
| 35 to 50 years | 0 (0.0%) | 0.0 |
| Total | 101 (100.0%) | 125.0 |
Fertility by Age by Marriage Status in Osage Beach
35.6% of women with births (101) in Osage Beach are married. The highest percentage of unmarried women with births falls into 20 to 34 years age bracket with 64.4% of them unmarried at the time of birth, while the lowest percentage of unmarried women with births belong to 20 to 34 years age bracket with 64.4% of them unmarried.
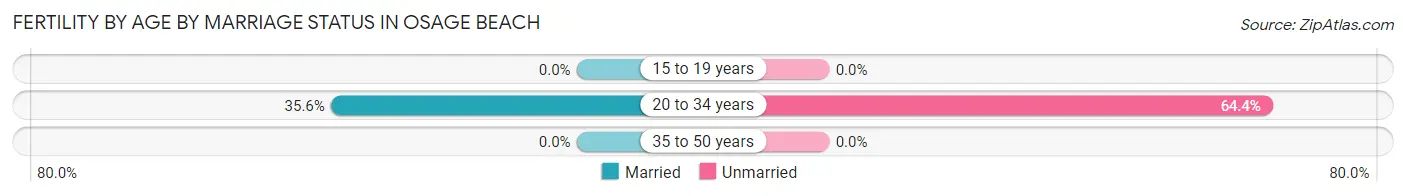
| Age Bracket | Married | Unmarried |
| 15 to 19 years | 0 (0.0%) | 0 (0.0%) |
| 20 to 34 years | 36 (35.6%) | 65 (64.4%) |
| 35 to 50 years | 0 (0.0%) | 0 (0.0%) |
| Total | 36 (35.6%) | 65 (64.4%) |
Fertility by Education in Osage Beach
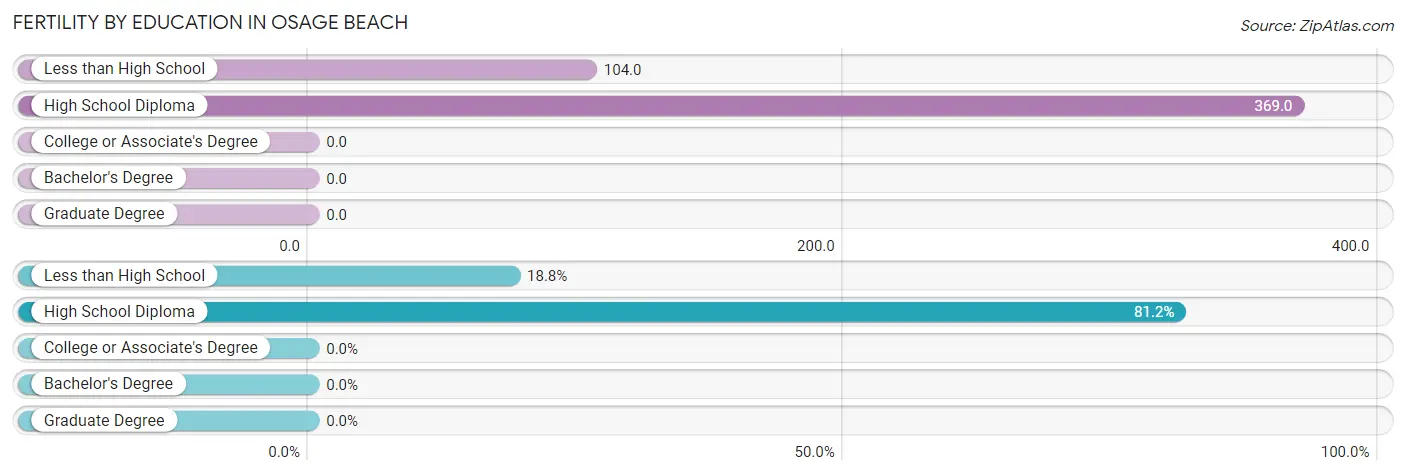
| Educational Attainment | Women with Births | Births / 1,000 Women |
| Less than High School | 19 (18.8%) | 104.0 |
| High School Diploma | 82 (81.2%) | 369.0 |
| College or Associate's Degree | 0 (0.0%) | 0.0 |
| Bachelor's Degree | 0 (0.0%) | 0.0 |
| Graduate Degree | 0 (0.0%) | 0.0 |
| Total | 101 (100.0%) | 125.0 |
Fertility by Education by Marriage Status in Osage Beach
64.4% of women with births in Osage Beach are unmarried. Women with the educational attainment of high school diploma are most likely to be married with 43.9% of them married at childbirth, while women with the educational attainment of less than high school are least likely to be married with 100.0% of them unmarried at childbirth.
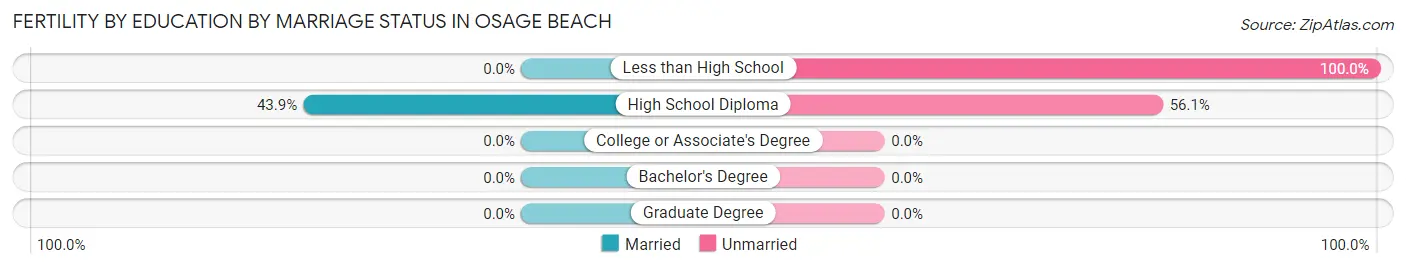
| Educational Attainment | Married | Unmarried |
| Less than High School | 0 (0.0%) | 19 (100.0%) |
| High School Diploma | 36 (43.9%) | 46 (56.1%) |
| College or Associate's Degree | 0 (0.0%) | 0 (0.0%) |
| Bachelor's Degree | 0 (0.0%) | 0 (0.0%) |
| Graduate Degree | 0 (0.0%) | 0 (0.0%) |
| Total | 36 (35.6%) | 65 (64.4%) |
Employment Characteristics in Osage Beach
Employment by Class of Employer in Osage Beach
Among the 2,005 employed individuals in Osage Beach, private company employees (1,346 | 67.1%), not-for-profit organizations (178 | 8.9%), and self-employed (incorporated) (167 | 8.3%) make up the most common classes of employment.
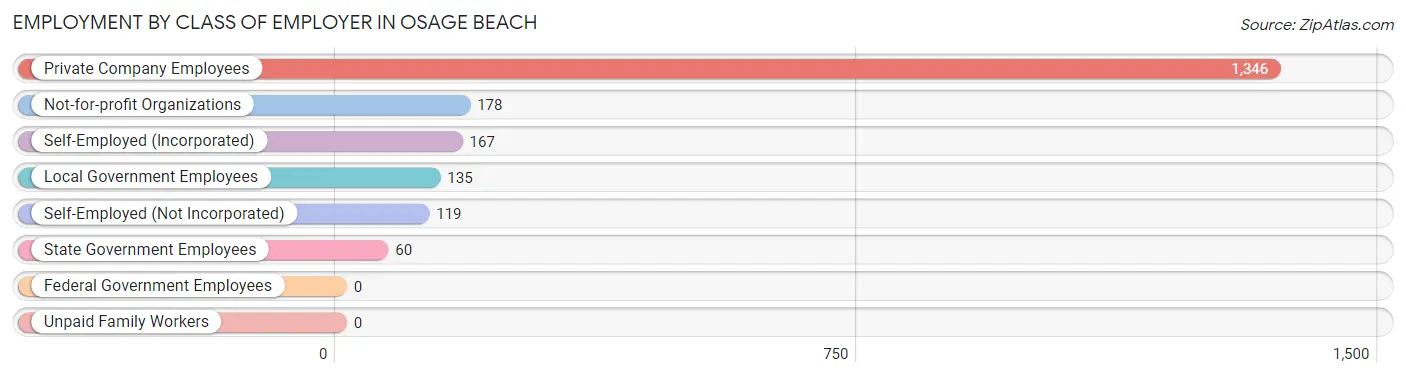
| Employer Class | # Employees | % Employees |
| Private Company Employees | 1,346 | 67.1% |
| Self-Employed (Incorporated) | 167 | 8.3% |
| Self-Employed (Not Incorporated) | 119 | 5.9% |
| Not-for-profit Organizations | 178 | 8.9% |
| Local Government Employees | 135 | 6.7% |
| State Government Employees | 60 | 3.0% |
| Federal Government Employees | 0 | 0.0% |
| Unpaid Family Workers | 0 | 0.0% |
| Total | 2,005 | 100.0% |
Employment Status by Age in Osage Beach
According to the labor force statistics for Osage Beach, out of the total population over 16 years of age (4,011), 57.8% or 2,318 individuals are in the labor force, with 10.6% or 246 of them unemployed. The age group with the highest labor force participation rate is 20 to 24 years, with 100.0% or 263 individuals in the labor force. Within the labor force, the 35 to 44 years age range has the highest percentage of unemployed individuals, with 28.4% or 157 of them being unemployed.
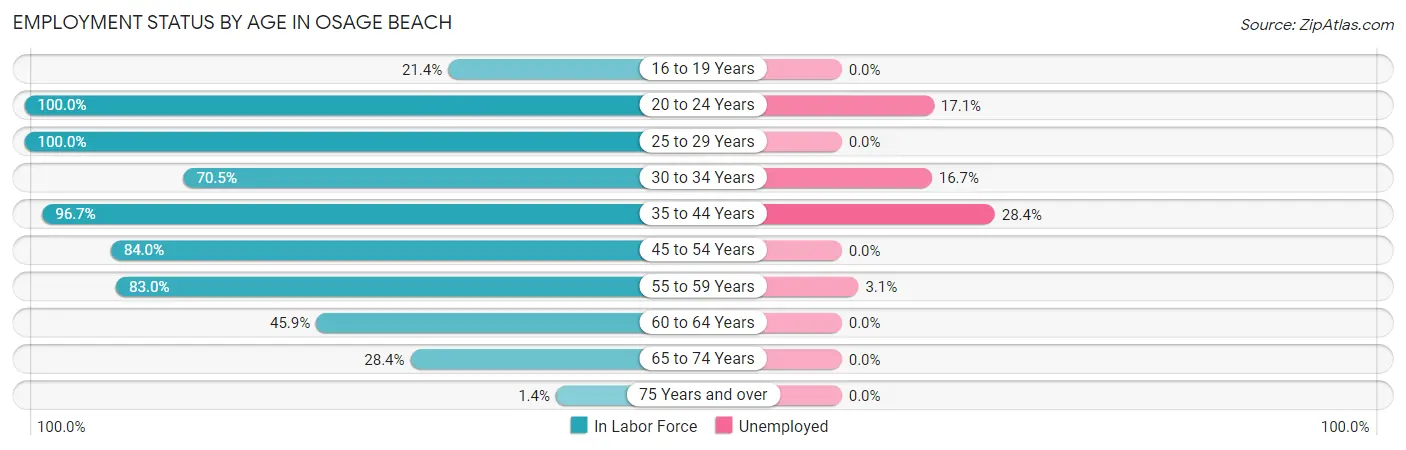
| Age Bracket | In Labor Force | Unemployed |
| 16 to 19 Years | 33 (21.4%) | 0 (0.0%) |
| 20 to 24 Years | 263 (100.0%) | 45 (17.1%) |
| 25 to 29 Years | 246 (100.0%) | 0 (0.0%) |
| 30 to 34 Years | 203 (70.5%) | 34 (16.7%) |
| 35 to 44 Years | 552 (96.7%) | 157 (28.4%) |
| 45 to 54 Years | 335 (84.0%) | 0 (0.0%) |
| 55 to 59 Years | 293 (83.0%) | 9 (3.1%) |
| 60 to 64 Years | 202 (45.9%) | 0 (0.0%) |
| 65 to 74 Years | 184 (28.4%) | 0 (0.0%) |
| 75 Years and over | 9 (1.4%) | 0 (0.0%) |
| Total | 2,318 (57.8%) | 246 (10.6%) |
Employment Status by Educational Attainment in Osage Beach
According to labor force statistics for Osage Beach, 79.7% of individuals (1,831) out of the total population between 25 and 64 years of age (2,297) are in the labor force, with 10.9% or 200 of them being unemployed. The group with the highest labor force participation rate are those with the educational attainment of less than high school, with 91.1% or 439 individuals in the labor force. Within the labor force, individuals with less than high school education have the highest percentage of unemployment, with 34.4% or 151 of them being unemployed.
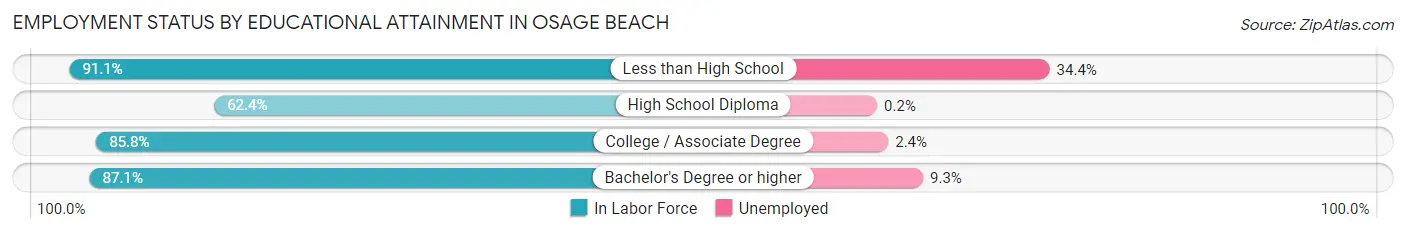
| Educational Attainment | In Labor Force | Unemployed |
| Less than High School | 439 (91.1%) | 166 (34.4%) |
| High School Diploma | 455 (62.4%) | 1 (0.2%) |
| College / Associate Degree | 572 (85.8%) | 16 (2.4%) |
| Bachelor's Degree or higher | 365 (87.1%) | 39 (9.3%) |
| Total | 1,831 (79.7%) | 250 (10.9%) |
Employment Occupations by Sex in Osage Beach
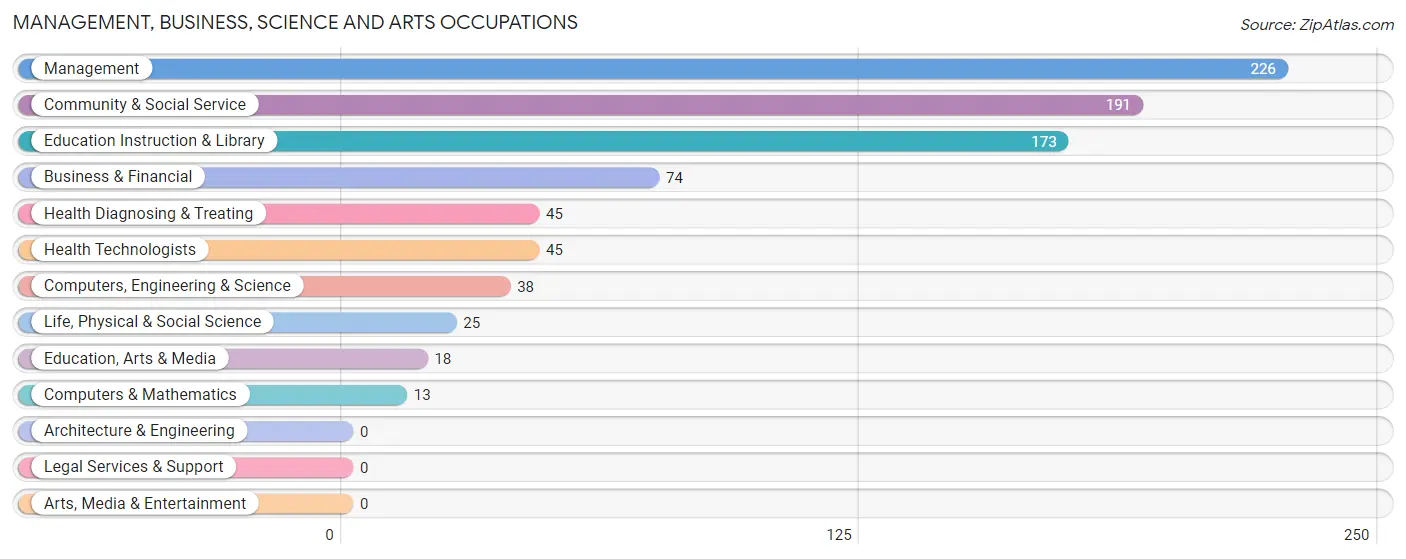
Management, Business, Science and Arts Occupations
The most common Management, Business, Science and Arts occupations in Osage Beach are Management (226 | 10.9%), Community & Social Service (191 | 9.2%), Education Instruction & Library (173 | 8.3%), Business & Financial (74 | 3.6%), and Health Diagnosing & Treating (45 | 2.2%).
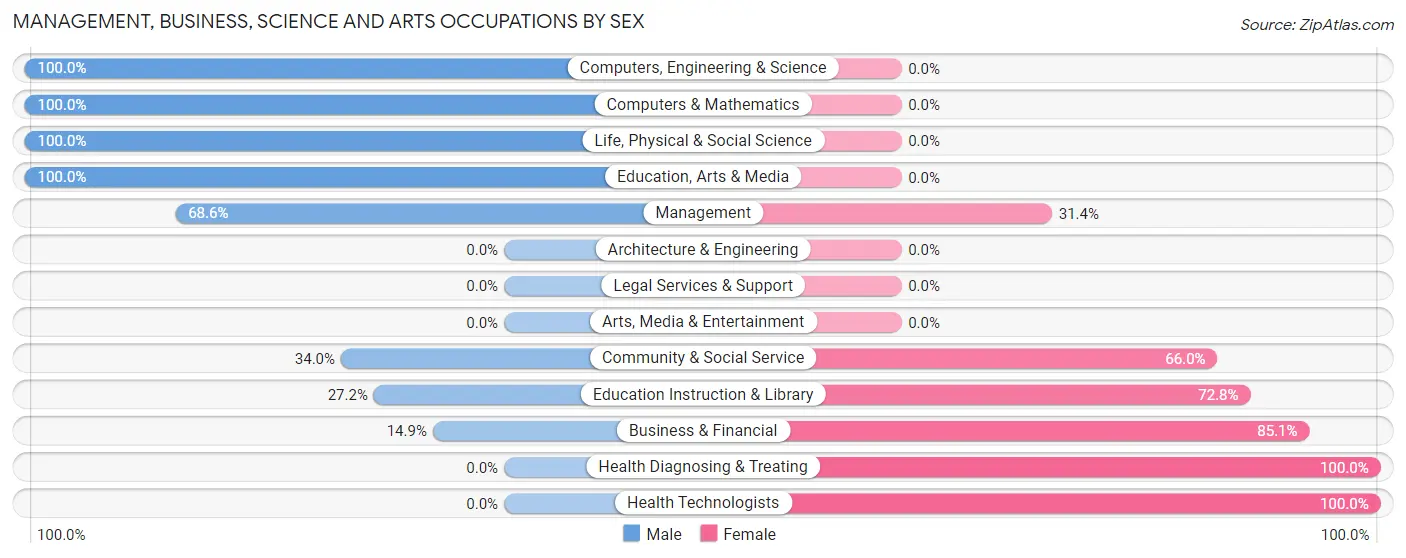
Management, Business, Science and Arts Occupations by Sex
Within the Management, Business, Science and Arts occupations in Osage Beach, the most male-oriented occupations are Computers, Engineering & Science (100.0%), Computers & Mathematics (100.0%), and Life, Physical & Social Science (100.0%), while the most female-oriented occupations are Health Diagnosing & Treating (100.0%), Health Technologists (100.0%), and Business & Financial (85.1%).
| Occupation | Male | Female |
| Management | 155 (68.6%) | 71 (31.4%) |
| Business & Financial | 11 (14.9%) | 63 (85.1%) |
| Computers, Engineering & Science | 38 (100.0%) | 0 (0.0%) |
| Computers & Mathematics | 13 (100.0%) | 0 (0.0%) |
| Architecture & Engineering | 0 (0.0%) | 0 (0.0%) |
| Life, Physical & Social Science | 25 (100.0%) | 0 (0.0%) |
| Community & Social Service | 65 (34.0%) | 126 (66.0%) |
| Education, Arts & Media | 18 (100.0%) | 0 (0.0%) |
| Legal Services & Support | 0 (0.0%) | 0 (0.0%) |
| Education Instruction & Library | 47 (27.2%) | 126 (72.8%) |
| Arts, Media & Entertainment | 0 (0.0%) | 0 (0.0%) |
| Health Diagnosing & Treating | 0 (0.0%) | 45 (100.0%) |
| Health Technologists | 0 (0.0%) | 45 (100.0%) |
| Total (Category) | 269 (46.9%) | 305 (53.1%) |
| Total (Overall) | 1,104 (53.2%) | 971 (46.8%) |
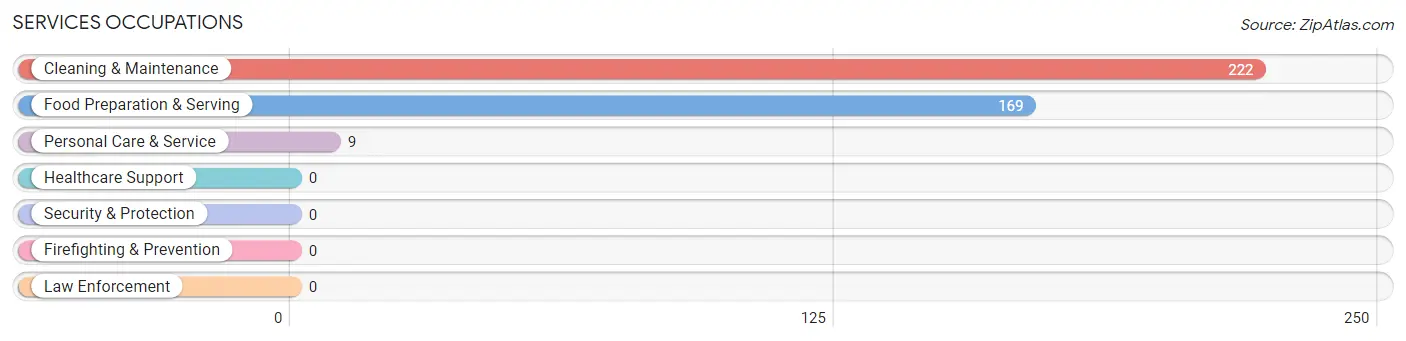
Services Occupations
The most common Services occupations in Osage Beach are Cleaning & Maintenance (222 | 10.7%), Food Preparation & Serving (169 | 8.1%), and Personal Care & Service (9 | 0.4%).
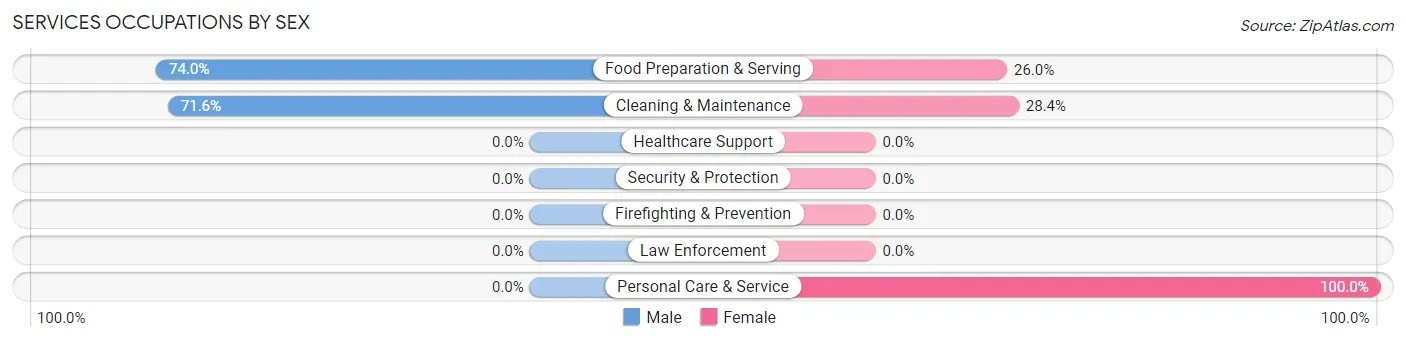
Services Occupations by Sex
Within the Services occupations in Osage Beach, the most male-oriented occupations are Food Preparation & Serving (74.0%), and Cleaning & Maintenance (71.6%), while the most female-oriented occupations are Personal Care & Service (100.0%), Cleaning & Maintenance (28.4%), and Food Preparation & Serving (26.0%).
| Occupation | Male | Female |
| Healthcare Support | 0 (0.0%) | 0 (0.0%) |
| Security & Protection | 0 (0.0%) | 0 (0.0%) |
| Firefighting & Prevention | 0 (0.0%) | 0 (0.0%) |
| Law Enforcement | 0 (0.0%) | 0 (0.0%) |
| Food Preparation & Serving | 125 (74.0%) | 44 (26.0%) |
| Cleaning & Maintenance | 159 (71.6%) | 63 (28.4%) |
| Personal Care & Service | 0 (0.0%) | 9 (100.0%) |
| Total (Category) | 284 (71.0%) | 116 (29.0%) |
| Total (Overall) | 1,104 (53.2%) | 971 (46.8%) |
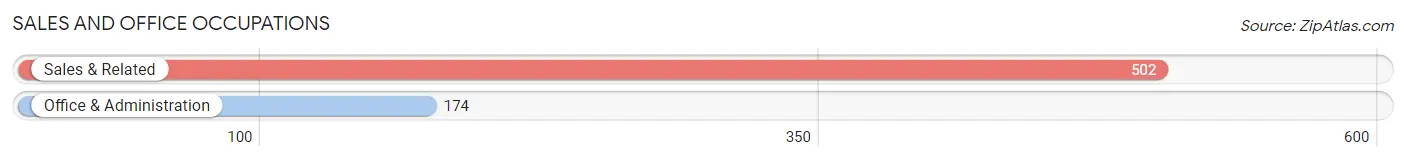
Sales and Office Occupations
The most common Sales and Office occupations in Osage Beach are Sales & Related (502 | 24.2%), and Office & Administration (174 | 8.4%).
Sales and Office Occupations by Sex
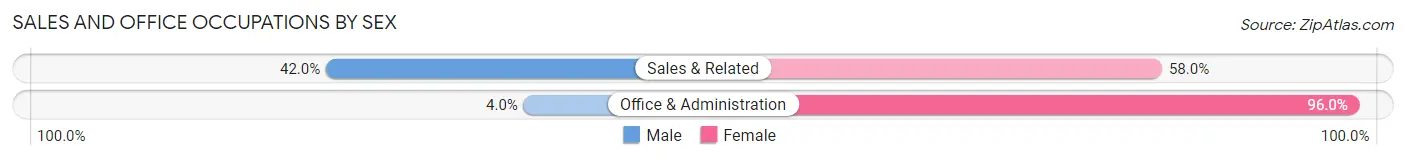
| Occupation | Male | Female |
| Sales & Related | 211 (42.0%) | 291 (58.0%) |
| Office & Administration | 7 (4.0%) | 167 (96.0%) |
| Total (Category) | 218 (32.3%) | 458 (67.7%) |
| Total (Overall) | 1,104 (53.2%) | 971 (46.8%) |
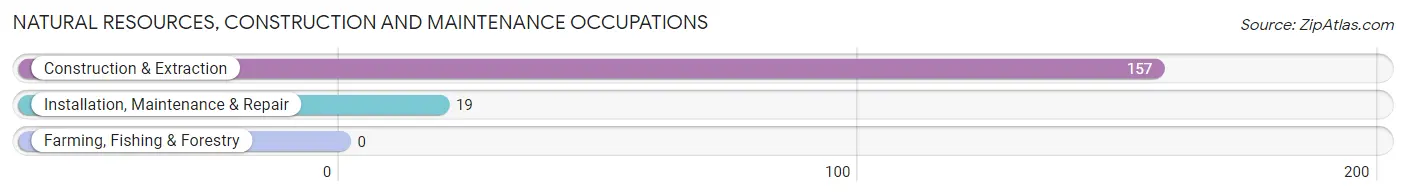
Natural Resources, Construction and Maintenance Occupations
The most common Natural Resources, Construction and Maintenance occupations in Osage Beach are Construction & Extraction (157 | 7.6%), and Installation, Maintenance & Repair (19 | 0.9%).
Natural Resources, Construction and Maintenance Occupations by Sex
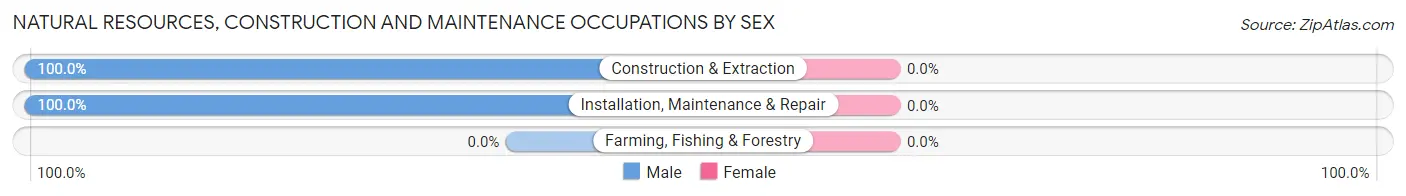
| Occupation | Male | Female |
| Farming, Fishing & Forestry | 0 (0.0%) | 0 (0.0%) |
| Construction & Extraction | 157 (100.0%) | 0 (0.0%) |
| Installation, Maintenance & Repair | 19 (100.0%) | 0 (0.0%) |
| Total (Category) | 176 (100.0%) | 0 (0.0%) |
| Total (Overall) | 1,104 (53.2%) | 971 (46.8%) |
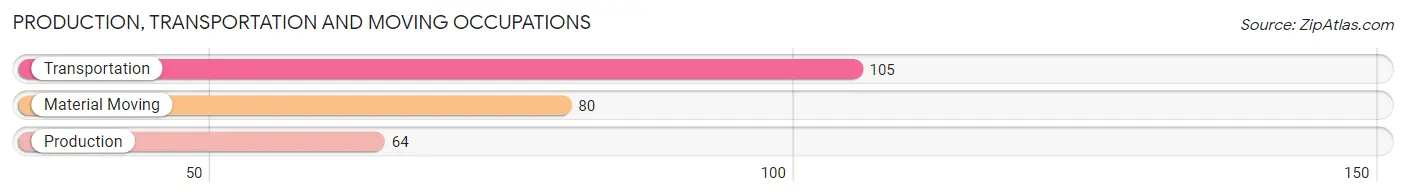
Production, Transportation and Moving Occupations
The most common Production, Transportation and Moving occupations in Osage Beach are Transportation (105 | 5.1%), Material Moving (80 | 3.9%), and Production (64 | 3.1%).
Production, Transportation and Moving Occupations by Sex
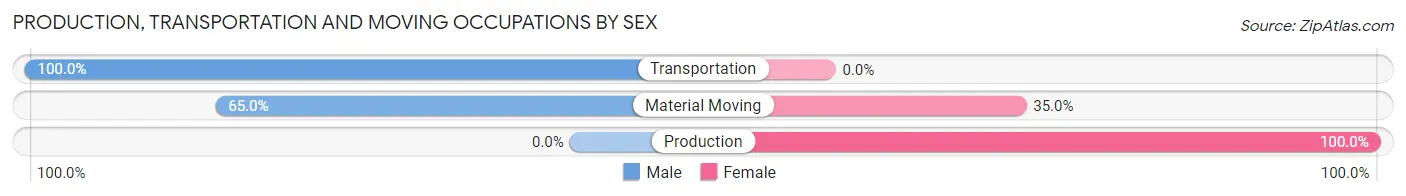
| Occupation | Male | Female |
| Production | 0 (0.0%) | 64 (100.0%) |
| Transportation | 105 (100.0%) | 0 (0.0%) |
| Material Moving | 52 (65.0%) | 28 (35.0%) |
| Total (Category) | 157 (63.0%) | 92 (36.9%) |
| Total (Overall) | 1,104 (53.2%) | 971 (46.8%) |
Employment Industries by Sex in Osage Beach
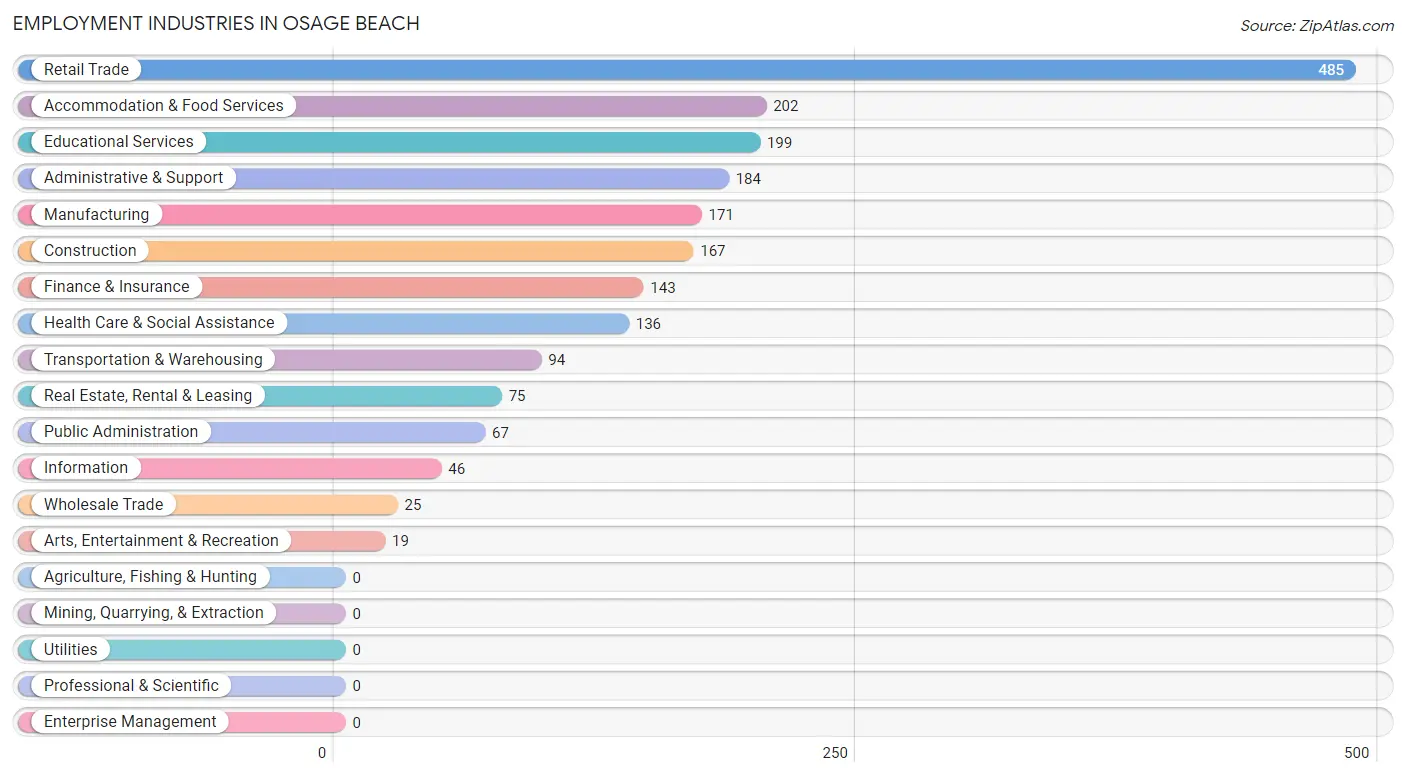
Employment Industries in Osage Beach
The major employment industries in Osage Beach include Retail Trade (485 | 23.4%), Accommodation & Food Services (202 | 9.7%), Educational Services (199 | 9.6%), Administrative & Support (184 | 8.9%), and Manufacturing (171 | 8.2%).
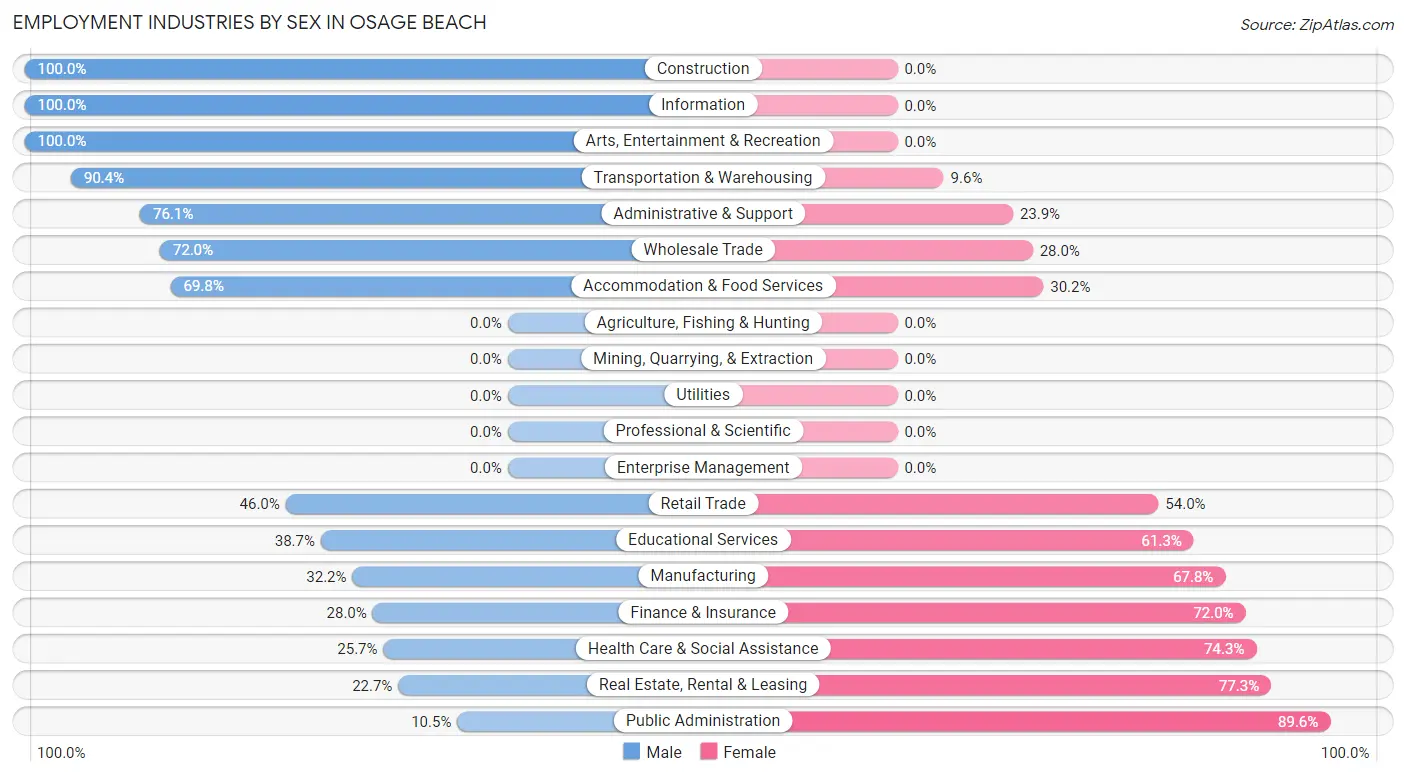
Employment Industries by Sex in Osage Beach
The Osage Beach industries that see more men than women are Construction (100.0%), Information (100.0%), and Arts, Entertainment & Recreation (100.0%), whereas the industries that tend to have a higher number of women are Public Administration (89.5%), Real Estate, Rental & Leasing (77.3%), and Health Care & Social Assistance (74.3%).
| Industry | Male | Female |
| Agriculture, Fishing & Hunting | 0 (0.0%) | 0 (0.0%) |
| Mining, Quarrying, & Extraction | 0 (0.0%) | 0 (0.0%) |
| Construction | 167 (100.0%) | 0 (0.0%) |
| Manufacturing | 55 (32.2%) | 116 (67.8%) |
| Wholesale Trade | 18 (72.0%) | 7 (28.0%) |
| Retail Trade | 223 (46.0%) | 262 (54.0%) |
| Transportation & Warehousing | 85 (90.4%) | 9 (9.6%) |
| Utilities | 0 (0.0%) | 0 (0.0%) |
| Information | 46 (100.0%) | 0 (0.0%) |
| Finance & Insurance | 40 (28.0%) | 103 (72.0%) |
| Real Estate, Rental & Leasing | 17 (22.7%) | 58 (77.3%) |
| Professional & Scientific | 0 (0.0%) | 0 (0.0%) |
| Enterprise Management | 0 (0.0%) | 0 (0.0%) |
| Administrative & Support | 140 (76.1%) | 44 (23.9%) |
| Educational Services | 77 (38.7%) | 122 (61.3%) |
| Health Care & Social Assistance | 35 (25.7%) | 101 (74.3%) |
| Arts, Entertainment & Recreation | 19 (100.0%) | 0 (0.0%) |
| Accommodation & Food Services | 141 (69.8%) | 61 (30.2%) |
| Public Administration | 7 (10.4%) | 60 (89.5%) |
| Total | 1,104 (53.2%) | 971 (46.8%) |
Education in Osage Beach
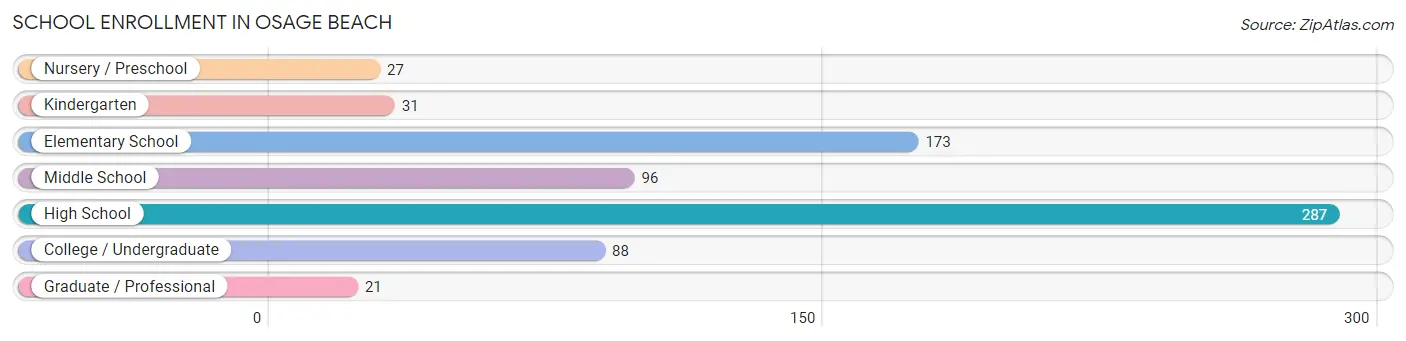
School Enrollment in Osage Beach
The most common levels of schooling among the 723 students in Osage Beach are high school (287 | 39.7%), elementary school (173 | 23.9%), and middle school (96 | 13.3%).
| School Level | # Students | % Students |
| Nursery / Preschool | 27 | 3.7% |
| Kindergarten | 31 | 4.3% |
| Elementary School | 173 | 23.9% |
| Middle School | 96 | 13.3% |
| High School | 287 | 39.7% |
| College / Undergraduate | 88 | 12.2% |
| Graduate / Professional | 21 | 2.9% |
| Total | 723 | 100.0% |
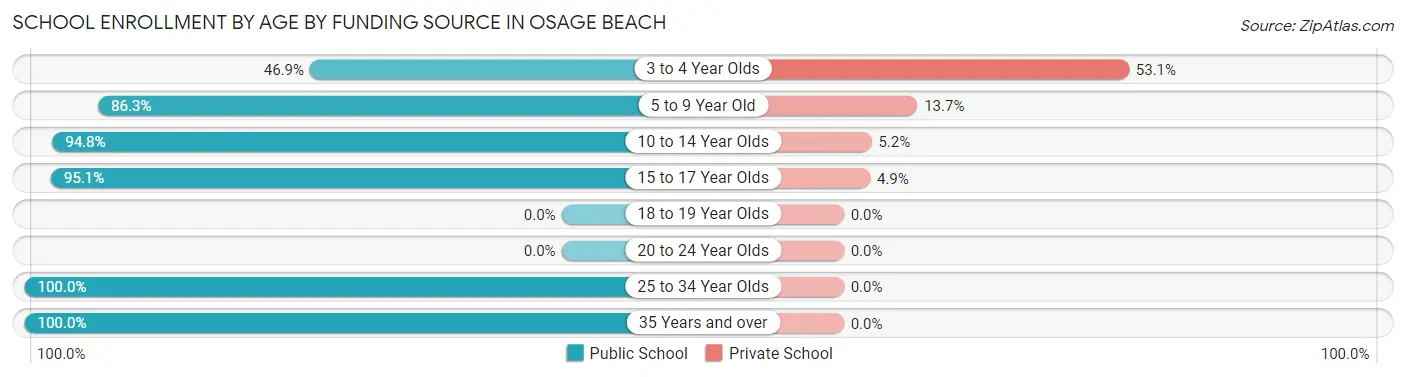
School Enrollment by Age by Funding Source in Osage Beach
Out of a total of 723 students who are enrolled in schools in Osage Beach, 59 (8.2%) attend a private institution, while the remaining 664 (91.8%) are enrolled in public schools. The age group of 3 to 4 year olds has the highest likelihood of being enrolled in private schools, with 17 (53.1% in the age bracket) enrolled. Conversely, the age group of 25 to 34 year olds has the lowest likelihood of being enrolled in a private school, with 69 (100.0% in the age bracket) attending a public institution.
| Age Bracket | Public School | Private School |
| 3 to 4 Year Olds | 15 (46.9%) | 17 (53.1%) |
| 5 to 9 Year Old | 126 (86.3%) | 20 (13.7%) |
| 10 to 14 Year Olds | 220 (94.8%) | 12 (5.2%) |
| 15 to 17 Year Olds | 194 (95.1%) | 10 (4.9%) |
| 18 to 19 Year Olds | 0 (0.0%) | 0 (0.0%) |
| 20 to 24 Year Olds | 0 (0.0%) | 0 (0.0%) |
| 25 to 34 Year Olds | 69 (100.0%) | 0 (0.0%) |
| 35 Years and over | 40 (100.0%) | 0 (0.0%) |
| Total | 664 (91.8%) | 59 (8.2%) |
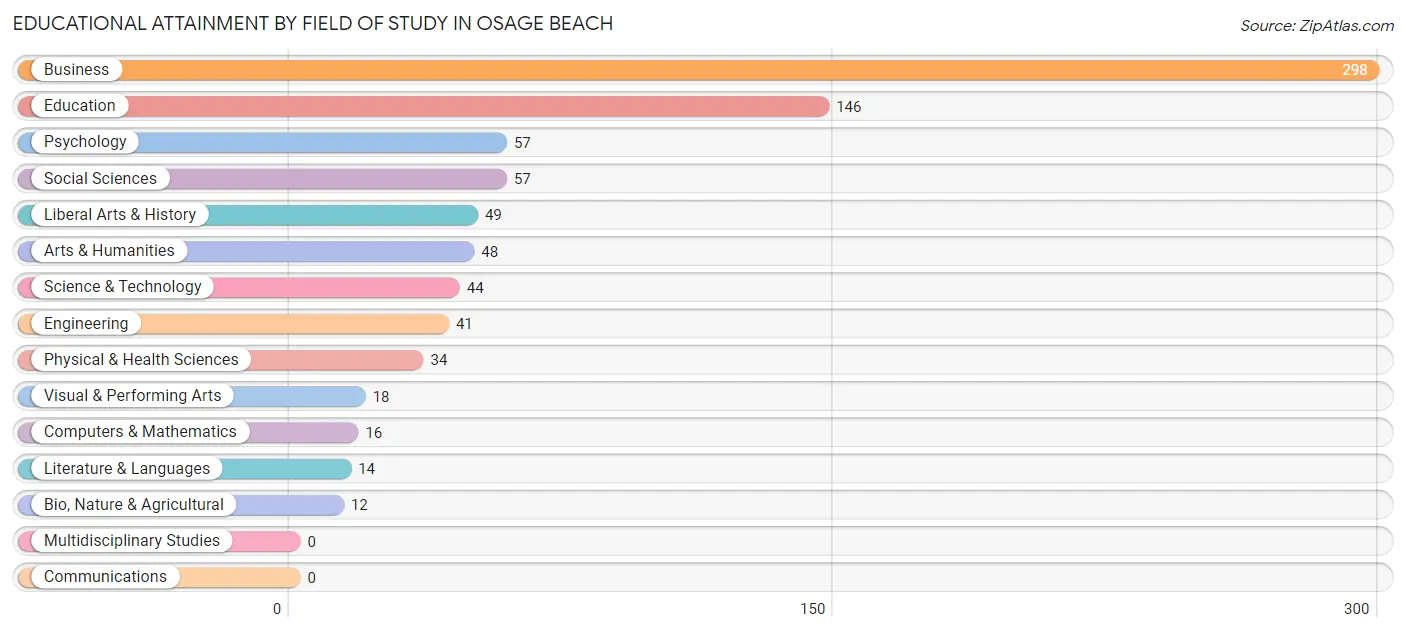
Educational Attainment by Field of Study in Osage Beach
Business (298 | 35.7%), education (146 | 17.5%), psychology (57 | 6.8%), social sciences (57 | 6.8%), and liberal arts & history (49 | 5.9%) are the most common fields of study among 834 individuals in Osage Beach who have obtained a bachelor's degree or higher.
| Field of Study | # Graduates | % Graduates |
| Computers & Mathematics | 16 | 1.9% |
| Bio, Nature & Agricultural | 12 | 1.4% |
| Physical & Health Sciences | 34 | 4.1% |
| Psychology | 57 | 6.8% |
| Social Sciences | 57 | 6.8% |
| Engineering | 41 | 4.9% |
| Multidisciplinary Studies | 0 | 0.0% |
| Science & Technology | 44 | 5.3% |
| Business | 298 | 35.7% |
| Education | 146 | 17.5% |
| Literature & Languages | 14 | 1.7% |
| Liberal Arts & History | 49 | 5.9% |
| Visual & Performing Arts | 18 | 2.2% |
| Communications | 0 | 0.0% |
| Arts & Humanities | 48 | 5.8% |
| Total | 834 | 100.0% |
Transportation & Commute in Osage Beach
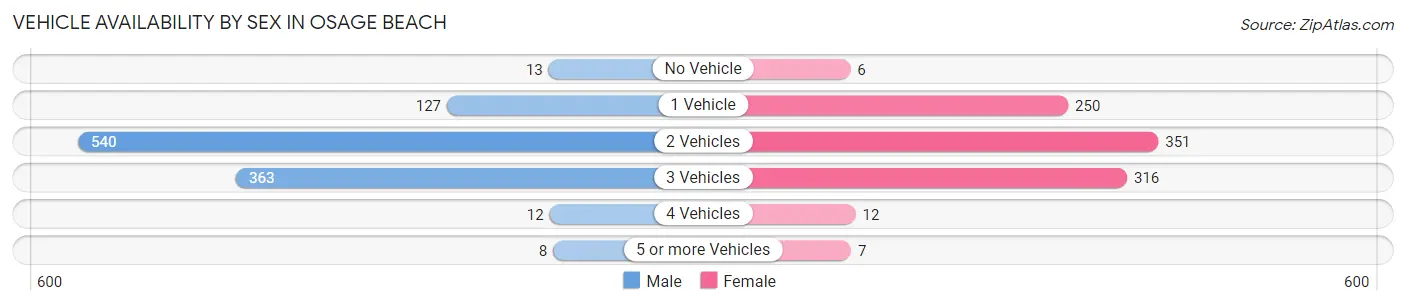
Vehicle Availability by Sex in Osage Beach
The most prevalent vehicle ownership categories in Osage Beach are males with 2 vehicles (540, accounting for 50.8%) and females with 2 vehicles (351, making up 57.3%).
| Vehicles Available | Male | Female |
| No Vehicle | 13 (1.2%) | 6 (0.6%) |
| 1 Vehicle | 127 (11.9%) | 250 (26.5%) |
| 2 Vehicles | 540 (50.8%) | 351 (37.3%) |
| 3 Vehicles | 363 (34.2%) | 316 (33.6%) |
| 4 Vehicles | 12 (1.1%) | 12 (1.3%) |
| 5 or more Vehicles | 8 (0.7%) | 7 (0.7%) |
| Total | 1,063 (100.0%) | 942 (100.0%) |
Commute Time in Osage Beach
The most frequently occuring commute durations in Osage Beach are 5 to 9 minutes (456 commuters, 25.0%), 15 to 19 minutes (455 commuters, 25.0%), and 10 to 14 minutes (343 commuters, 18.8%).
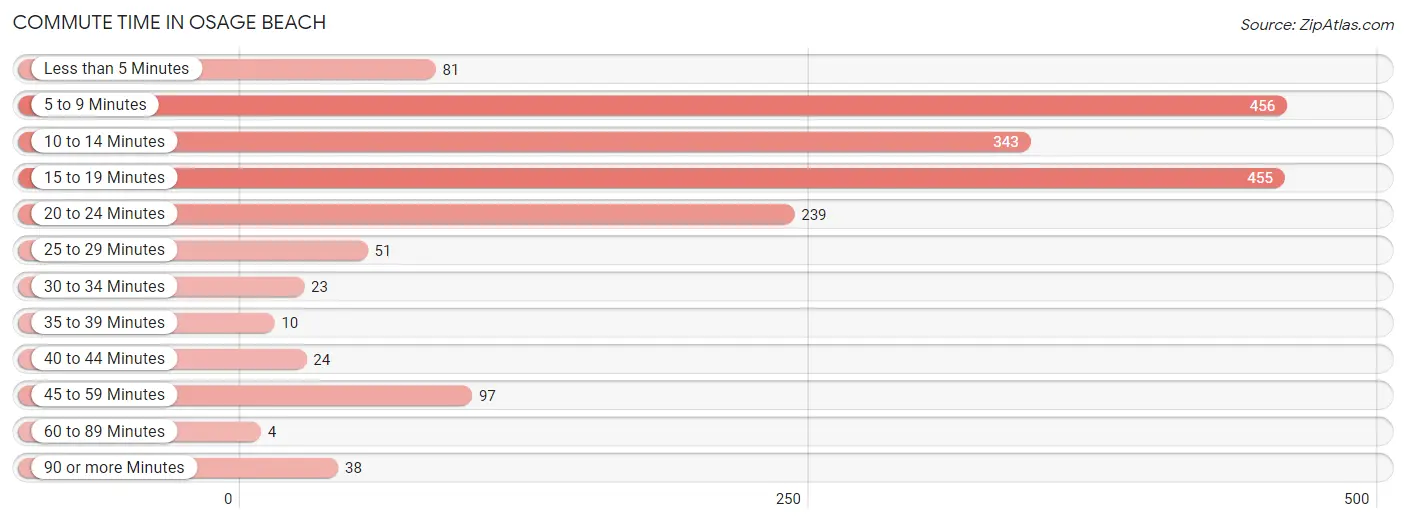
| Commute Time | # Commuters | % Commuters |
| Less than 5 Minutes | 81 | 4.4% |
| 5 to 9 Minutes | 456 | 25.0% |
| 10 to 14 Minutes | 343 | 18.8% |
| 15 to 19 Minutes | 455 | 25.0% |
| 20 to 24 Minutes | 239 | 13.1% |
| 25 to 29 Minutes | 51 | 2.8% |
| 30 to 34 Minutes | 23 | 1.3% |
| 35 to 39 Minutes | 10 | 0.5% |
| 40 to 44 Minutes | 24 | 1.3% |
| 45 to 59 Minutes | 97 | 5.3% |
| 60 to 89 Minutes | 4 | 0.2% |
| 90 or more Minutes | 38 | 2.1% |
Commute Time by Sex in Osage Beach
The most common commute times in Osage Beach are 15 to 19 minutes (239 commuters, 25.1%) for males and 5 to 9 minutes (301 commuters, 34.6%) for females.
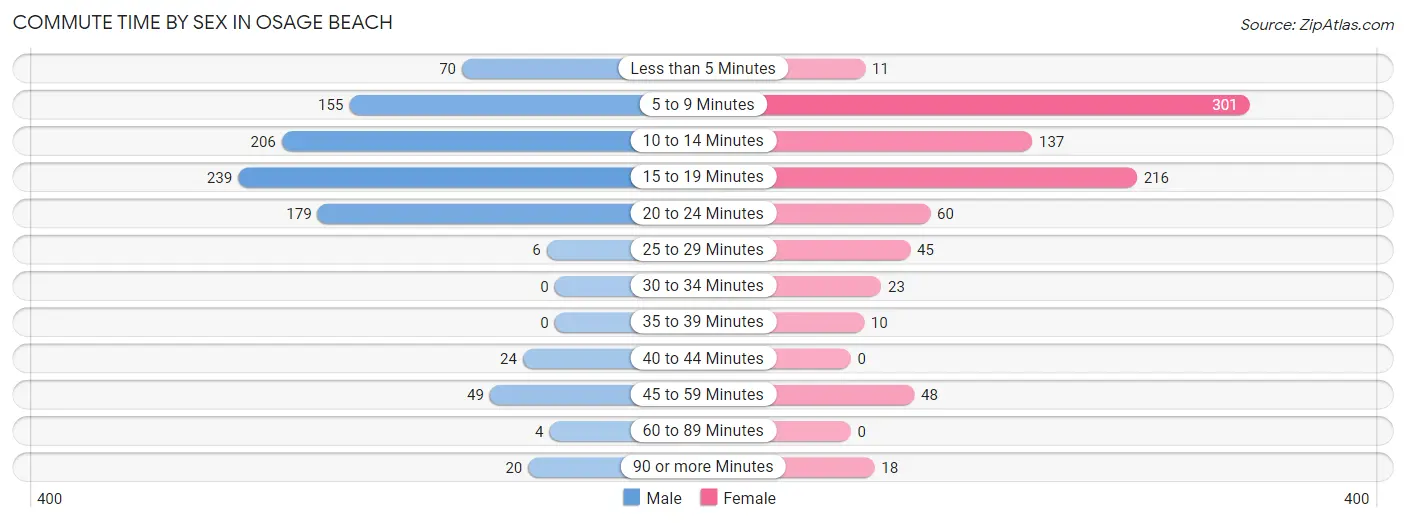
| Commute Time | Male | Female |
| Less than 5 Minutes | 70 (7.3%) | 11 (1.3%) |
| 5 to 9 Minutes | 155 (16.3%) | 301 (34.6%) |
| 10 to 14 Minutes | 206 (21.6%) | 137 (15.8%) |
| 15 to 19 Minutes | 239 (25.1%) | 216 (24.9%) |
| 20 to 24 Minutes | 179 (18.8%) | 60 (6.9%) |
| 25 to 29 Minutes | 6 (0.6%) | 45 (5.2%) |
| 30 to 34 Minutes | 0 (0.0%) | 23 (2.6%) |
| 35 to 39 Minutes | 0 (0.0%) | 10 (1.1%) |
| 40 to 44 Minutes | 24 (2.5%) | 0 (0.0%) |
| 45 to 59 Minutes | 49 (5.1%) | 48 (5.5%) |
| 60 to 89 Minutes | 4 (0.4%) | 0 (0.0%) |
| 90 or more Minutes | 20 (2.1%) | 18 (2.1%) |
Time of Departure to Work by Sex in Osage Beach
The most frequent times of departure to work in Osage Beach are 7:00 AM to 7:29 AM (211, 22.2%) for males and 7:30 AM to 7:59 AM (120, 13.8%) for females.
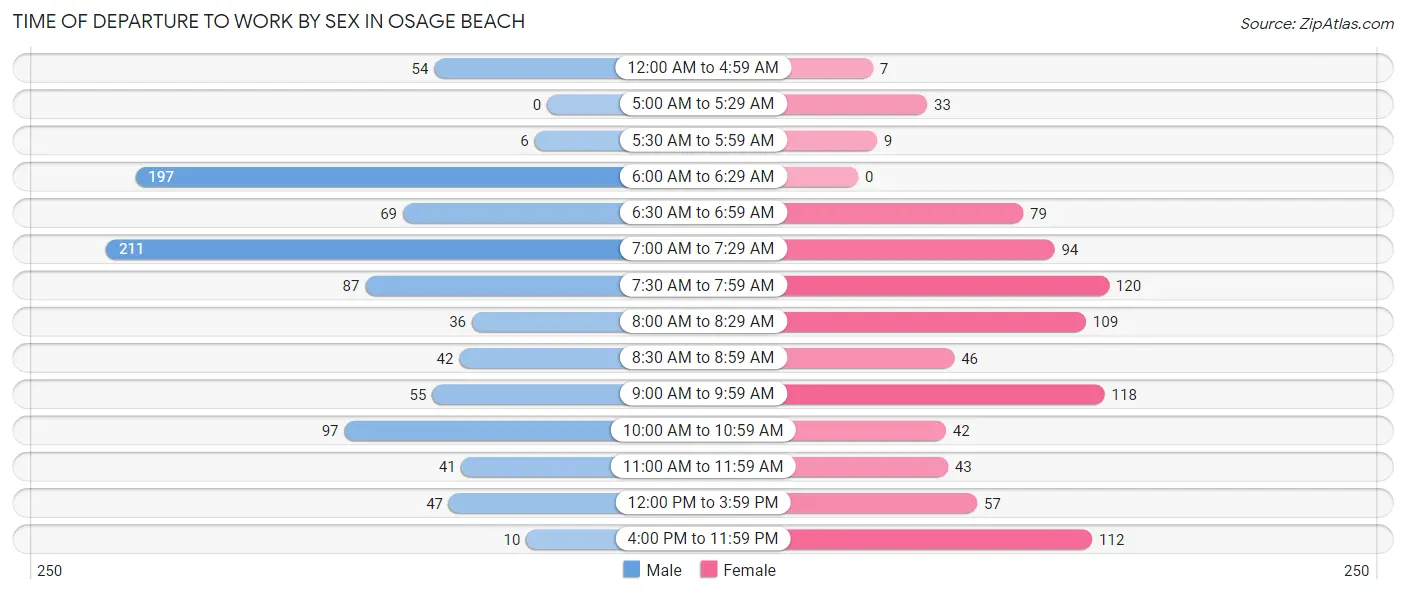
| Time of Departure | Male | Female |
| 12:00 AM to 4:59 AM | 54 (5.7%) | 7 (0.8%) |
| 5:00 AM to 5:29 AM | 0 (0.0%) | 33 (3.8%) |
| 5:30 AM to 5:59 AM | 6 (0.6%) | 9 (1.0%) |
| 6:00 AM to 6:29 AM | 197 (20.7%) | 0 (0.0%) |
| 6:30 AM to 6:59 AM | 69 (7.2%) | 79 (9.1%) |
| 7:00 AM to 7:29 AM | 211 (22.2%) | 94 (10.8%) |
| 7:30 AM to 7:59 AM | 87 (9.1%) | 120 (13.8%) |
| 8:00 AM to 8:29 AM | 36 (3.8%) | 109 (12.5%) |
| 8:30 AM to 8:59 AM | 42 (4.4%) | 46 (5.3%) |
| 9:00 AM to 9:59 AM | 55 (5.8%) | 118 (13.6%) |
| 10:00 AM to 10:59 AM | 97 (10.2%) | 42 (4.8%) |
| 11:00 AM to 11:59 AM | 41 (4.3%) | 43 (5.0%) |
| 12:00 PM to 3:59 PM | 47 (4.9%) | 57 (6.6%) |
| 4:00 PM to 11:59 PM | 10 (1.1%) | 112 (12.9%) |
| Total | 952 (100.0%) | 869 (100.0%) |
Housing Occupancy in Osage Beach
Occupancy by Ownership in Osage Beach
Of the total 1,658 dwellings in Osage Beach, owner-occupied units account for 1,062 (64.0%), while renter-occupied units make up 596 (35.9%).
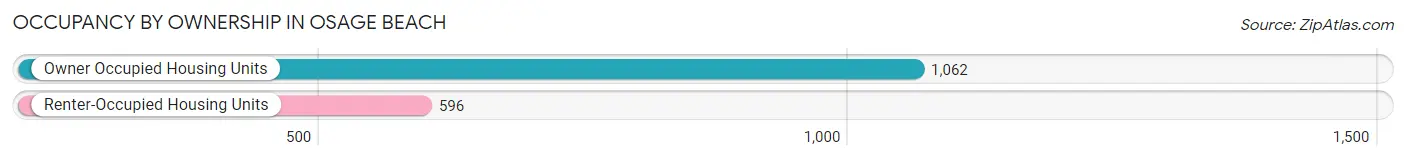
| Occupancy | # Housing Units | % Housing Units |
| Owner Occupied Housing Units | 1,062 | 64.0% |
| Renter-Occupied Housing Units | 596 | 35.9% |
| Total Occupied Housing Units | 1,658 | 100.0% |
Occupancy by Household Size in Osage Beach
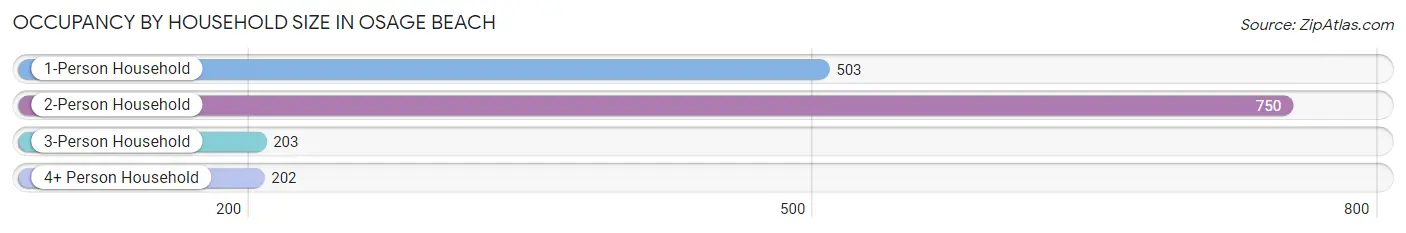
| Household Size | # Housing Units | % Housing Units |
| 1-Person Household | 503 | 30.3% |
| 2-Person Household | 750 | 45.2% |
| 3-Person Household | 203 | 12.2% |
| 4+ Person Household | 202 | 12.2% |
| Total Housing Units | 1,658 | 100.0% |
Occupancy by Ownership by Household Size in Osage Beach
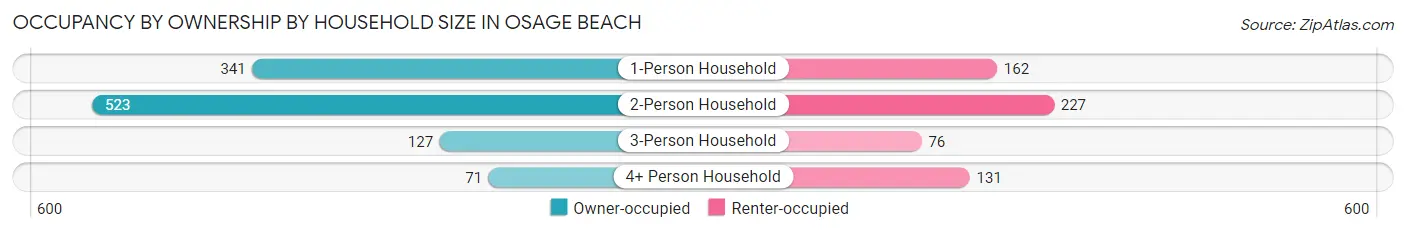
| Household Size | Owner-occupied | Renter-occupied |
| 1-Person Household | 341 (67.8%) | 162 (32.2%) |
| 2-Person Household | 523 (69.7%) | 227 (30.3%) |
| 3-Person Household | 127 (62.6%) | 76 (37.4%) |
| 4+ Person Household | 71 (35.1%) | 131 (64.8%) |
| Total Housing Units | 1,062 (64.0%) | 596 (35.9%) |
Occupancy by Educational Attainment in Osage Beach
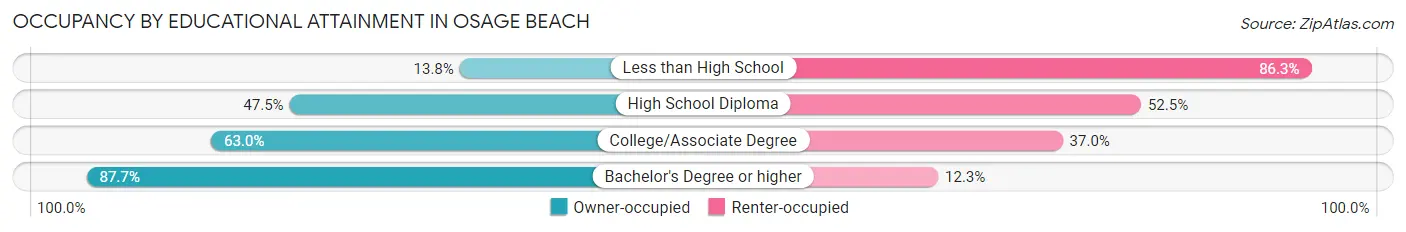
| Household Size | Owner-occupied | Renter-occupied |
| Less than High School | 11 (13.8%) | 69 (86.3%) |
| High School Diploma | 209 (47.5%) | 231 (52.5%) |
| College/Associate Degree | 399 (63.0%) | 234 (37.0%) |
| Bachelor's Degree or higher | 443 (87.7%) | 62 (12.3%) |
Occupancy by Age of Householder in Osage Beach
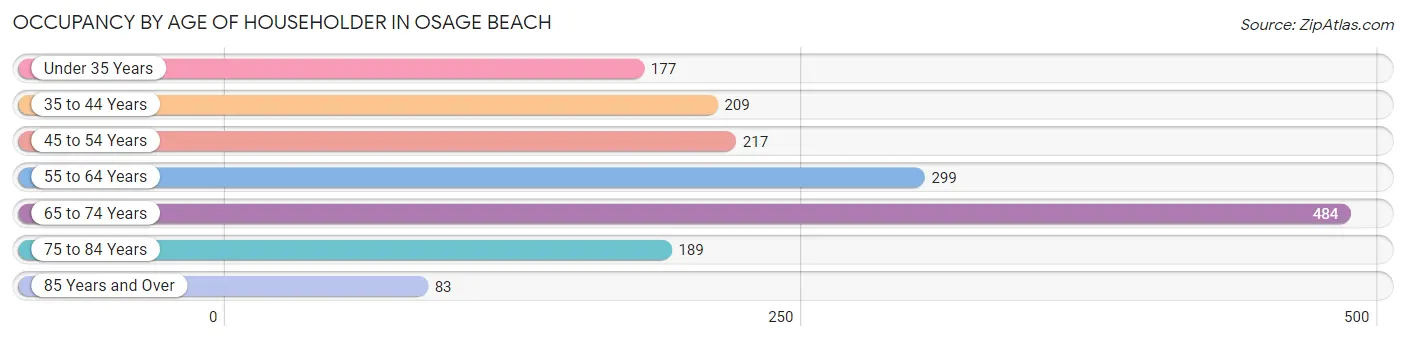
| Age Bracket | # Households | % Households |
| Under 35 Years | 177 | 10.7% |
| 35 to 44 Years | 209 | 12.6% |
| 45 to 54 Years | 217 | 13.1% |
| 55 to 64 Years | 299 | 18.0% |
| 65 to 74 Years | 484 | 29.2% |
| 75 to 84 Years | 189 | 11.4% |
| 85 Years and Over | 83 | 5.0% |
| Total | 1,658 | 100.0% |
Housing Finances in Osage Beach
Median Income by Occupancy in Osage Beach
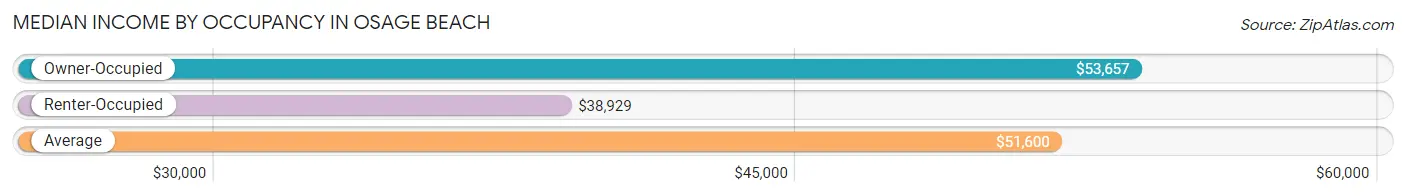
| Occupancy Type | # Households | Median Income |
| Owner-Occupied | 1,062 (64.0%) | $53,657 |
| Renter-Occupied | 596 (35.9%) | $38,929 |
| Average | 1,658 (100.0%) | $51,600 |
Occupancy by Householder Income Bracket in Osage Beach
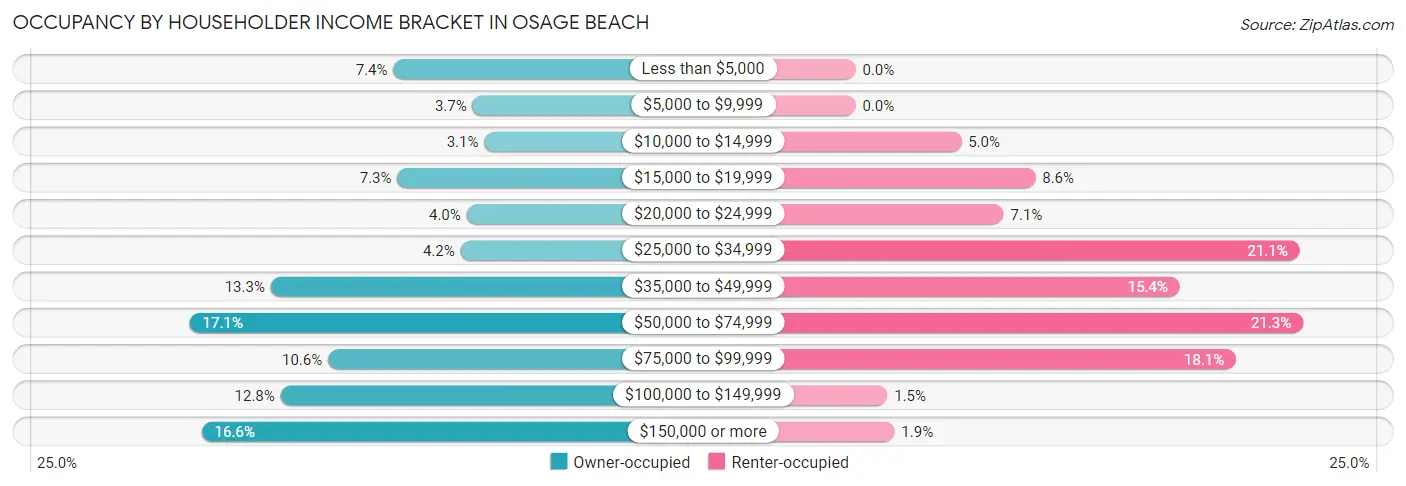
| Income Bracket | Owner-occupied | Renter-occupied |
| Less than $5,000 | 79 (7.4%) | 0 (0.0%) |
| $5,000 to $9,999 | 39 (3.7%) | 0 (0.0%) |
| $10,000 to $14,999 | 33 (3.1%) | 30 (5.0%) |
| $15,000 to $19,999 | 77 (7.2%) | 51 (8.6%) |
| $20,000 to $24,999 | 42 (4.0%) | 42 (7.0%) |
| $25,000 to $34,999 | 45 (4.2%) | 126 (21.1%) |
| $35,000 to $49,999 | 141 (13.3%) | 92 (15.4%) |
| $50,000 to $74,999 | 182 (17.1%) | 127 (21.3%) |
| $75,000 to $99,999 | 112 (10.5%) | 108 (18.1%) |
| $100,000 to $149,999 | 136 (12.8%) | 9 (1.5%) |
| $150,000 or more | 176 (16.6%) | 11 (1.8%) |
| Total | 1,062 (100.0%) | 596 (100.0%) |
Monthly Housing Cost Tiers in Osage Beach
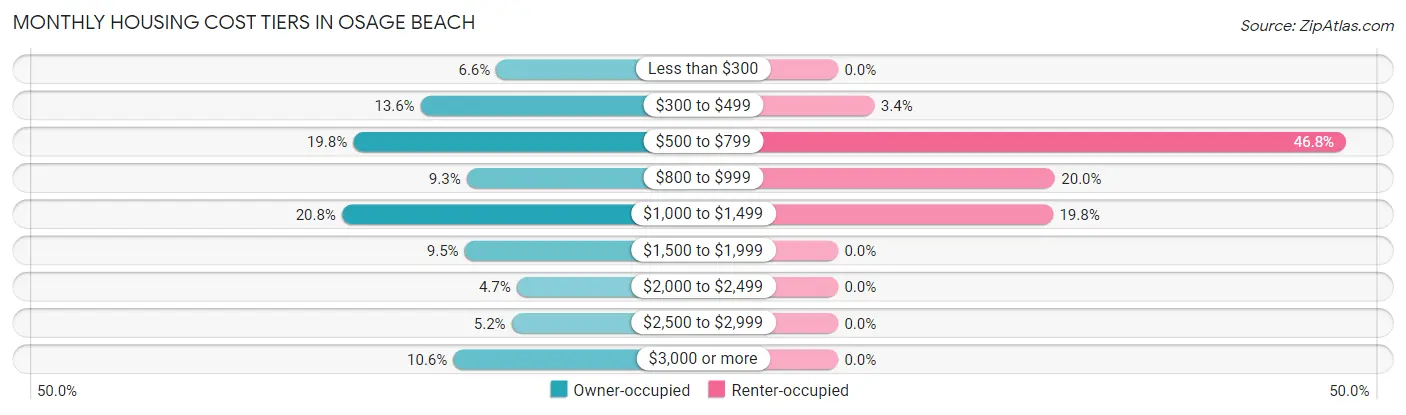
| Monthly Cost | Owner-occupied | Renter-occupied |
| Less than $300 | 70 (6.6%) | 0 (0.0%) |
| $300 to $499 | 144 (13.6%) | 20 (3.4%) |
| $500 to $799 | 210 (19.8%) | 279 (46.8%) |
| $800 to $999 | 99 (9.3%) | 119 (20.0%) |
| $1,000 to $1,499 | 221 (20.8%) | 118 (19.8%) |
| $1,500 to $1,999 | 101 (9.5%) | 0 (0.0%) |
| $2,000 to $2,499 | 50 (4.7%) | 0 (0.0%) |
| $2,500 to $2,999 | 55 (5.2%) | 0 (0.0%) |
| $3,000 or more | 112 (10.5%) | 0 (0.0%) |
| Total | 1,062 (100.0%) | 596 (100.0%) |
Physical Housing Characteristics in Osage Beach
Housing Structures in Osage Beach
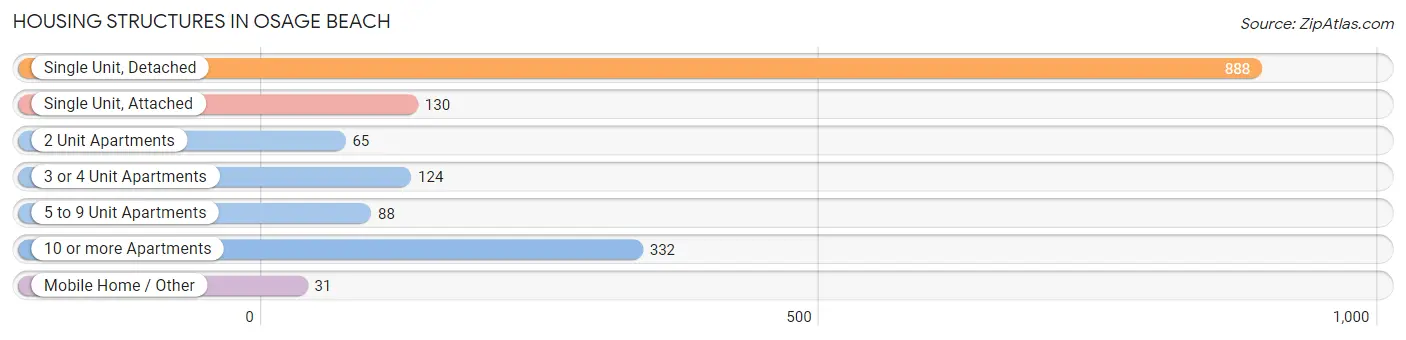
| Structure Type | # Housing Units | % Housing Units |
| Single Unit, Detached | 888 | 53.6% |
| Single Unit, Attached | 130 | 7.8% |
| 2 Unit Apartments | 65 | 3.9% |
| 3 or 4 Unit Apartments | 124 | 7.5% |
| 5 to 9 Unit Apartments | 88 | 5.3% |
| 10 or more Apartments | 332 | 20.0% |
| Mobile Home / Other | 31 | 1.9% |
| Total | 1,658 | 100.0% |
Housing Structures by Occupancy in Osage Beach
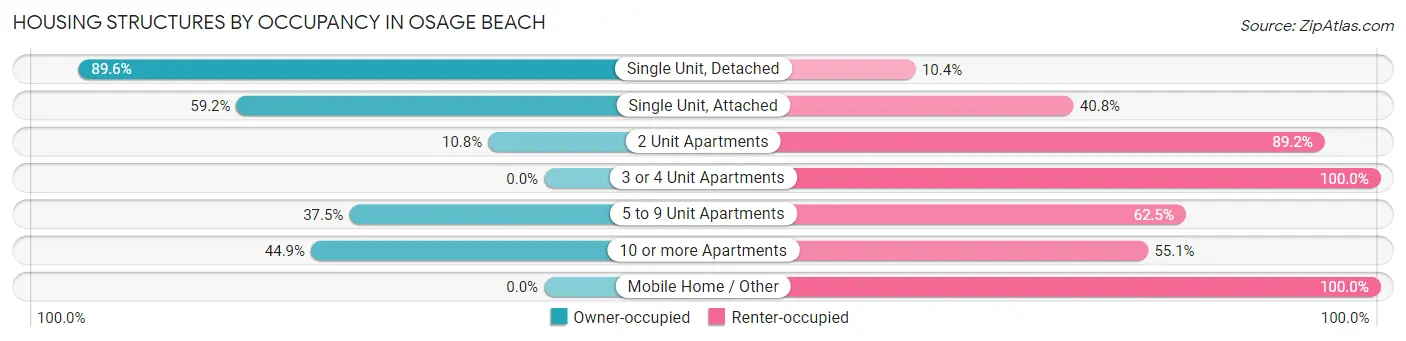
| Structure Type | Owner-occupied | Renter-occupied |
| Single Unit, Detached | 796 (89.6%) | 92 (10.4%) |
| Single Unit, Attached | 77 (59.2%) | 53 (40.8%) |
| 2 Unit Apartments | 7 (10.8%) | 58 (89.2%) |
| 3 or 4 Unit Apartments | 0 (0.0%) | 124 (100.0%) |
| 5 to 9 Unit Apartments | 33 (37.5%) | 55 (62.5%) |
| 10 or more Apartments | 149 (44.9%) | 183 (55.1%) |
| Mobile Home / Other | 0 (0.0%) | 31 (100.0%) |
| Total | 1,062 (64.0%) | 596 (35.9%) |
Housing Structures by Number of Rooms in Osage Beach
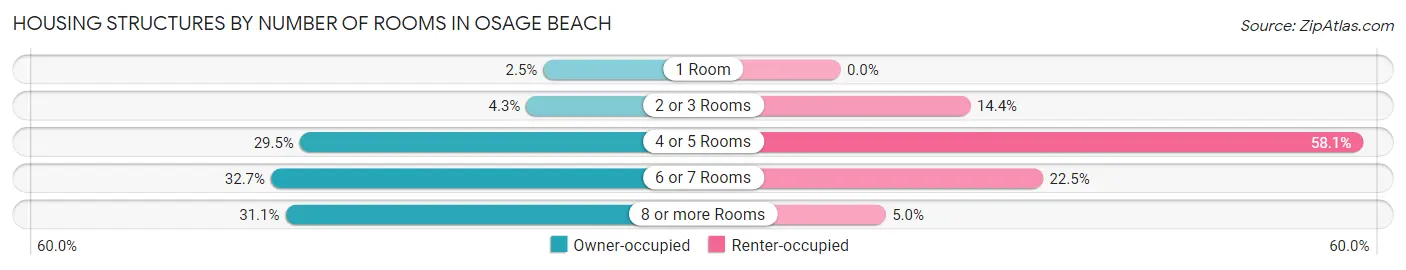
| Number of Rooms | Owner-occupied | Renter-occupied |
| 1 Room | 26 (2.5%) | 0 (0.0%) |
| 2 or 3 Rooms | 46 (4.3%) | 86 (14.4%) |
| 4 or 5 Rooms | 313 (29.5%) | 346 (58.1%) |
| 6 or 7 Rooms | 347 (32.7%) | 134 (22.5%) |
| 8 or more Rooms | 330 (31.1%) | 30 (5.0%) |
| Total | 1,062 (100.0%) | 596 (100.0%) |
Housing Structure by Heating Type in Osage Beach
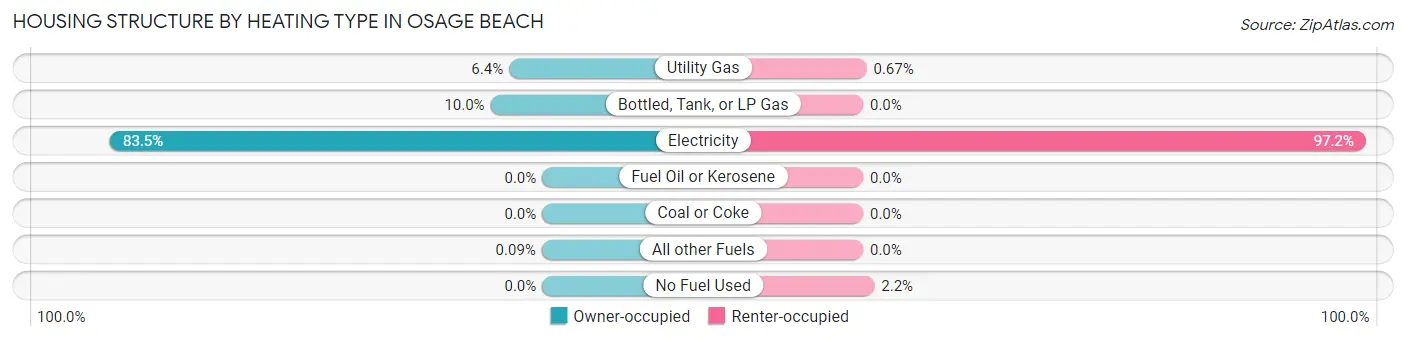
| Heating Type | Owner-occupied | Renter-occupied |
| Utility Gas | 68 (6.4%) | 4 (0.7%) |
| Bottled, Tank, or LP Gas | 106 (10.0%) | 0 (0.0%) |
| Electricity | 887 (83.5%) | 579 (97.2%) |
| Fuel Oil or Kerosene | 0 (0.0%) | 0 (0.0%) |
| Coal or Coke | 0 (0.0%) | 0 (0.0%) |
| All other Fuels | 1 (0.1%) | 0 (0.0%) |
| No Fuel Used | 0 (0.0%) | 13 (2.2%) |
| Total | 1,062 (100.0%) | 596 (100.0%) |
Household Vehicle Usage in Osage Beach
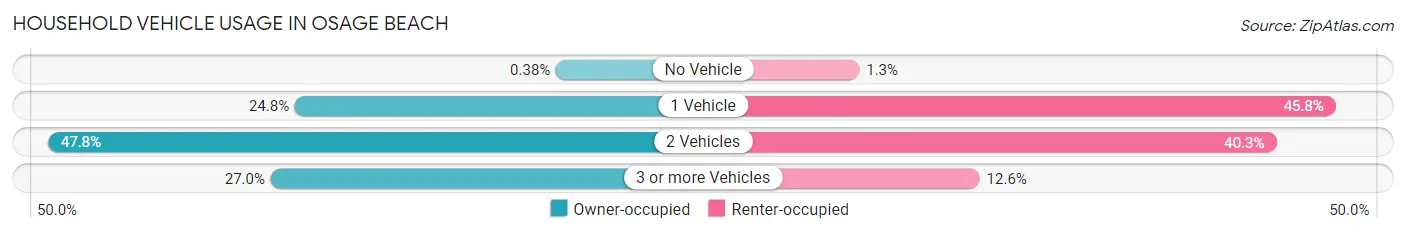
| Vehicles per Household | Owner-occupied | Renter-occupied |
| No Vehicle | 4 (0.4%) | 8 (1.3%) |
| 1 Vehicle | 263 (24.8%) | 273 (45.8%) |
| 2 Vehicles | 508 (47.8%) | 240 (40.3%) |
| 3 or more Vehicles | 287 (27.0%) | 75 (12.6%) |
| Total | 1,062 (100.0%) | 596 (100.0%) |
Real Estate & Mortgages in Osage Beach
Real Estate and Mortgage Overview in Osage Beach
| Characteristic | Without Mortgage | With Mortgage |
| Housing Units | 406 | 656 |
| Median Property Value | $270,600 | $290,000 |
| Median Household Income | $52,870 | $150 |
| Monthly Housing Costs | $487 | $112 |
| Real Estate Taxes | $1,707 | $13 |
Property Value by Mortgage Status in Osage Beach
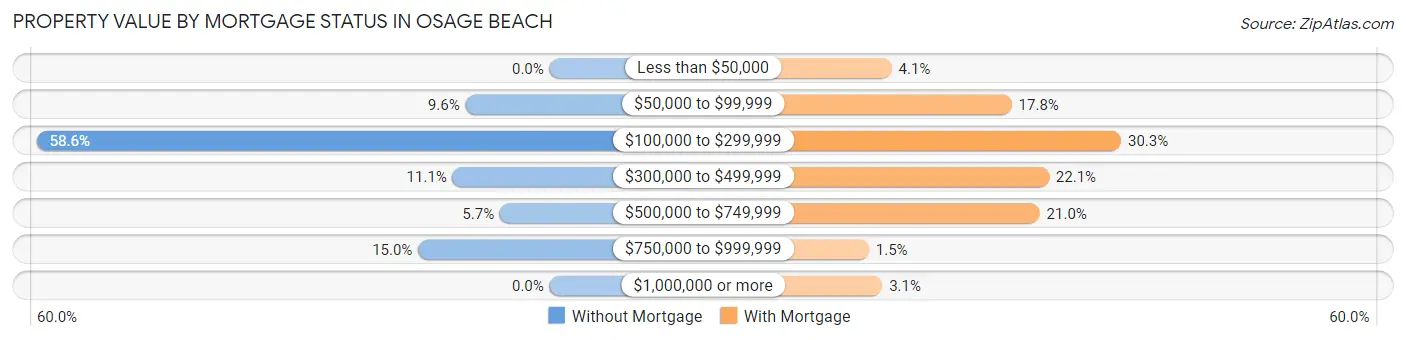
| Property Value | Without Mortgage | With Mortgage |
| Less than $50,000 | 0 (0.0%) | 27 (4.1%) |
| $50,000 to $99,999 | 39 (9.6%) | 117 (17.8%) |
| $100,000 to $299,999 | 238 (58.6%) | 199 (30.3%) |
| $300,000 to $499,999 | 45 (11.1%) | 145 (22.1%) |
| $500,000 to $749,999 | 23 (5.7%) | 138 (21.0%) |
| $750,000 to $999,999 | 61 (15.0%) | 10 (1.5%) |
| $1,000,000 or more | 0 (0.0%) | 20 (3.0%) |
| Total | 406 (100.0%) | 656 (100.0%) |
Household Income by Mortgage Status in Osage Beach
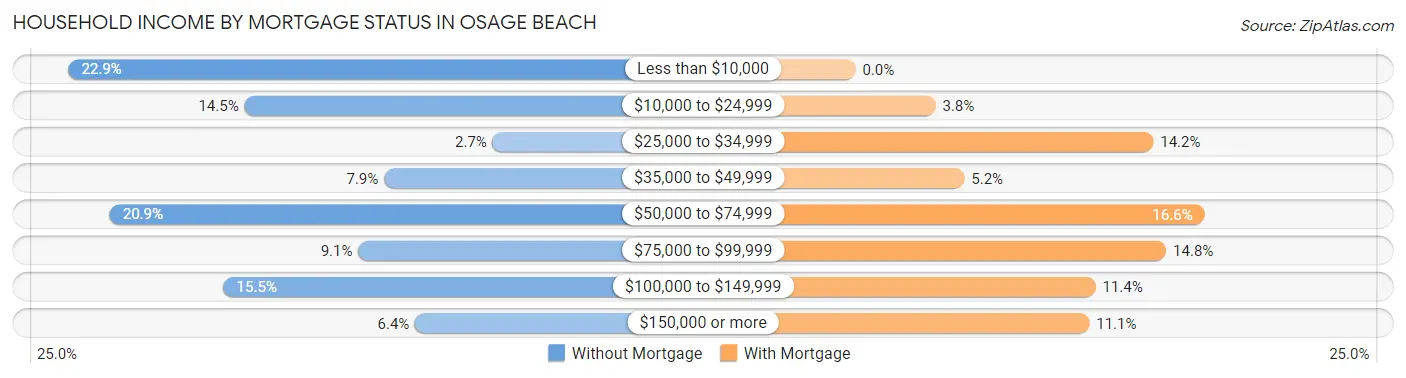
| Household Income | Without Mortgage | With Mortgage |
| Less than $10,000 | 93 (22.9%) | 0 (0.0%) |
| $10,000 to $24,999 | 59 (14.5%) | 25 (3.8%) |
| $25,000 to $34,999 | 11 (2.7%) | 93 (14.2%) |
| $35,000 to $49,999 | 32 (7.9%) | 34 (5.2%) |
| $50,000 to $74,999 | 85 (20.9%) | 109 (16.6%) |
| $75,000 to $99,999 | 37 (9.1%) | 97 (14.8%) |
| $100,000 to $149,999 | 63 (15.5%) | 75 (11.4%) |
| $150,000 or more | 26 (6.4%) | 73 (11.1%) |
| Total | 406 (100.0%) | 656 (100.0%) |
Property Value to Household Income Ratio in Osage Beach
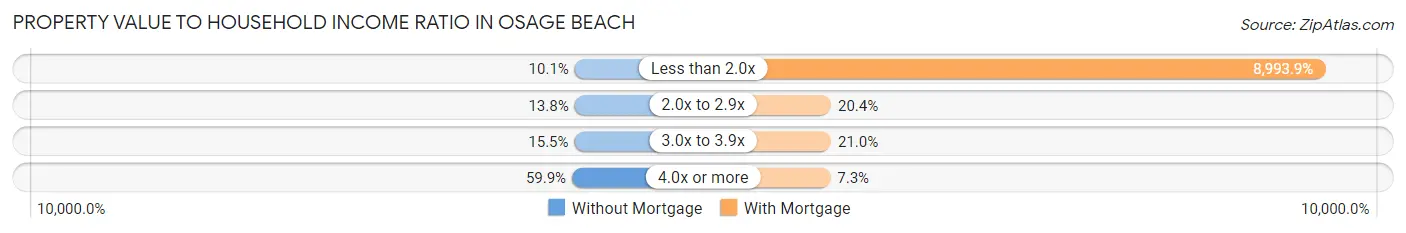
| Value-to-Income Ratio | Without Mortgage | With Mortgage |
| Less than 2.0x | 41 (10.1%) | 59,000 (8,993.9%) |
| 2.0x to 2.9x | 56 (13.8%) | 134 (20.4%) |
| 3.0x to 3.9x | 63 (15.5%) | 138 (21.0%) |
| 4.0x or more | 243 (59.9%) | 48 (7.3%) |
| Total | 406 (100.0%) | 656 (100.0%) |
Real Estate Taxes by Mortgage Status in Osage Beach
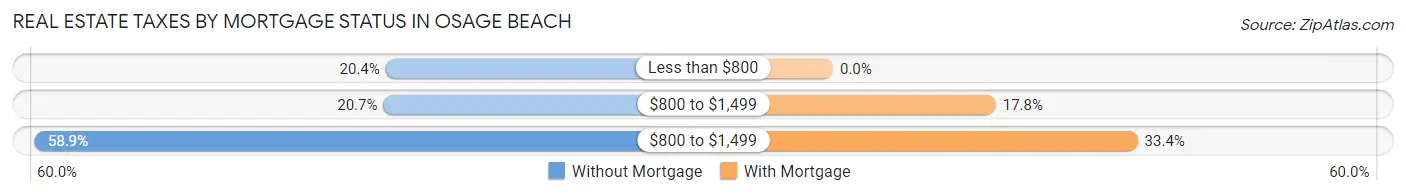
| Property Taxes | Without Mortgage | With Mortgage |
| Less than $800 | 83 (20.4%) | 0 (0.0%) |
| $800 to $1,499 | 84 (20.7%) | 117 (17.8%) |
| $800 to $1,499 | 239 (58.9%) | 219 (33.4%) |
| Total | 406 (100.0%) | 656 (100.0%) |
Health & Disability in Osage Beach
Health Insurance Coverage by Age in Osage Beach
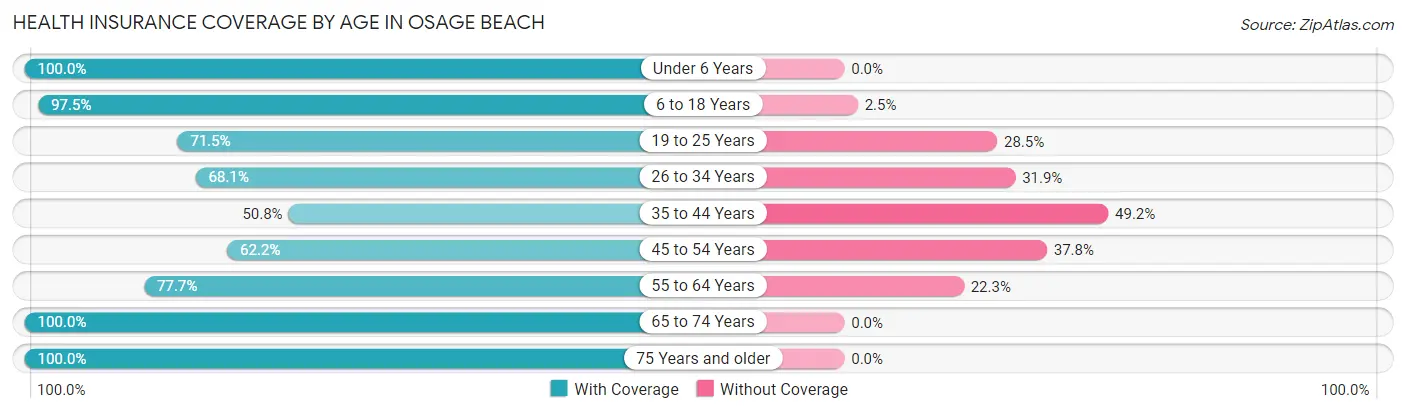
| Age Bracket | With Coverage | Without Coverage |
| Under 6 Years | 306 (100.0%) | 0 (0.0%) |
| 6 to 18 Years | 545 (97.5%) | 14 (2.5%) |
| 19 to 25 Years | 221 (71.5%) | 88 (28.5%) |
| 26 to 34 Years | 342 (68.1%) | 160 (31.9%) |
| 35 to 44 Years | 285 (50.8%) | 276 (49.2%) |
| 45 to 54 Years | 244 (62.2%) | 148 (37.8%) |
| 55 to 64 Years | 597 (77.7%) | 171 (22.3%) |
| 65 to 74 Years | 622 (100.0%) | 0 (0.0%) |
| 75 Years and older | 509 (100.0%) | 0 (0.0%) |
| Total | 3,671 (81.1%) | 857 (18.9%) |
Health Insurance Coverage by Citizenship Status in Osage Beach
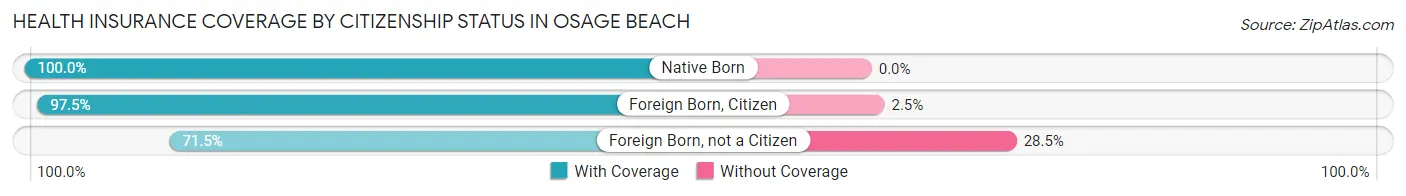
| Citizenship Status | With Coverage | Without Coverage |
| Native Born | 306 (100.0%) | 0 (0.0%) |
| Foreign Born, Citizen | 545 (97.5%) | 14 (2.5%) |
| Foreign Born, not a Citizen | 221 (71.5%) | 88 (28.5%) |
Health Insurance Coverage by Household Income in Osage Beach
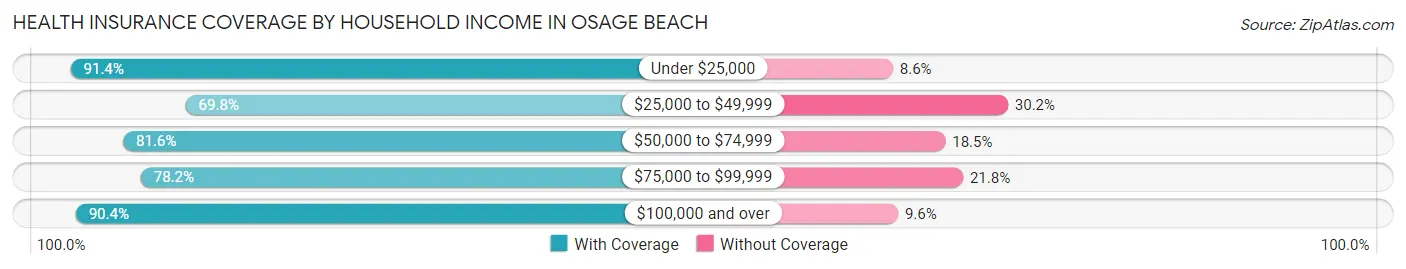
| Household Income | With Coverage | Without Coverage |
| Under $25,000 | 561 (91.4%) | 53 (8.6%) |
| $25,000 to $49,999 | 872 (69.8%) | 377 (30.2%) |
| $50,000 to $74,999 | 442 (81.6%) | 100 (18.4%) |
| $75,000 to $99,999 | 794 (78.2%) | 221 (21.8%) |
| $100,000 and over | 999 (90.4%) | 106 (9.6%) |
Public vs Private Health Insurance Coverage by Age in Osage Beach
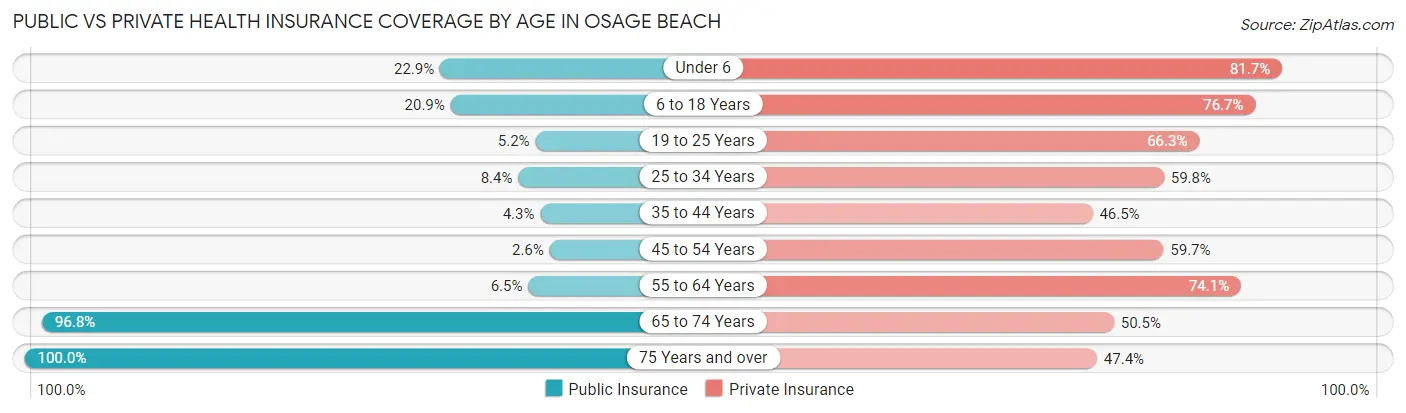
| Age Bracket | Public Insurance | Private Insurance |
| Under 6 | 70 (22.9%) | 250 (81.7%) |
| 6 to 18 Years | 117 (20.9%) | 429 (76.7%) |
| 19 to 25 Years | 16 (5.2%) | 205 (66.3%) |
| 25 to 34 Years | 42 (8.4%) | 300 (59.8%) |
| 35 to 44 Years | 24 (4.3%) | 261 (46.5%) |
| 45 to 54 Years | 10 (2.5%) | 234 (59.7%) |
| 55 to 64 Years | 50 (6.5%) | 569 (74.1%) |
| 65 to 74 Years | 602 (96.8%) | 314 (50.5%) |
| 75 Years and over | 509 (100.0%) | 241 (47.3%) |
| Total | 1,440 (31.8%) | 2,803 (61.9%) |
Disability Status by Sex by Age in Osage Beach
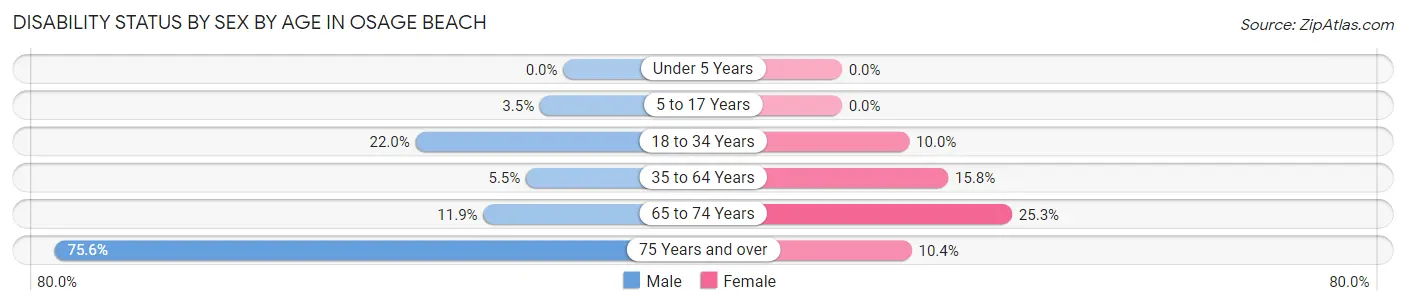
| Age Bracket | Male | Female |
| Under 5 Years | 0 (0.0%) | 0 (0.0%) |
| 5 to 17 Years | 11 (3.5%) | 0 (0.0%) |
| 18 to 34 Years | 99 (22.0%) | 36 (10.0%) |
| 35 to 64 Years | 50 (5.5%) | 129 (15.8%) |
| 65 to 74 Years | 40 (11.9%) | 72 (25.3%) |
| 75 Years and over | 173 (75.5%) | 29 (10.4%) |
Disability Class by Sex by Age in Osage Beach
Disability Class: Hearing Difficulty
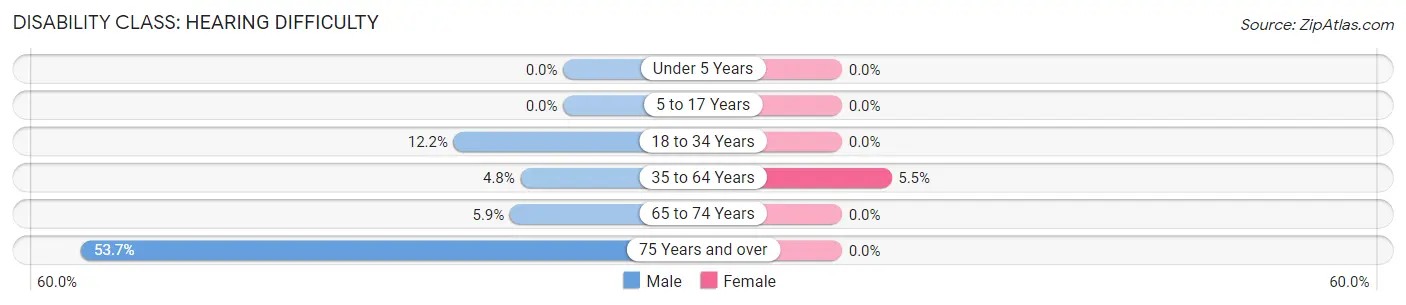
| Age Bracket | Male | Female |
| Under 5 Years | 0 (0.0%) | 0 (0.0%) |
| 5 to 17 Years | 0 (0.0%) | 0 (0.0%) |
| 18 to 34 Years | 55 (12.2%) | 0 (0.0%) |
| 35 to 64 Years | 43 (4.8%) | 45 (5.5%) |
| 65 to 74 Years | 20 (5.9%) | 0 (0.0%) |
| 75 Years and over | 123 (53.7%) | 0 (0.0%) |
Disability Class: Vision Difficulty
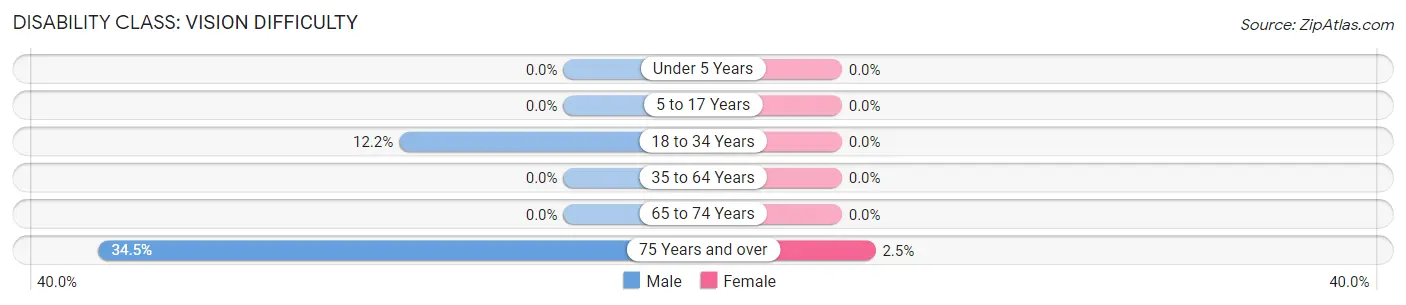
| Age Bracket | Male | Female |
| Under 5 Years | 0 (0.0%) | 0 (0.0%) |
| 5 to 17 Years | 0 (0.0%) | 0 (0.0%) |
| 18 to 34 Years | 55 (12.2%) | 0 (0.0%) |
| 35 to 64 Years | 0 (0.0%) | 0 (0.0%) |
| 65 to 74 Years | 0 (0.0%) | 0 (0.0%) |
| 75 Years and over | 79 (34.5%) | 7 (2.5%) |
Disability Class: Cognitive Difficulty
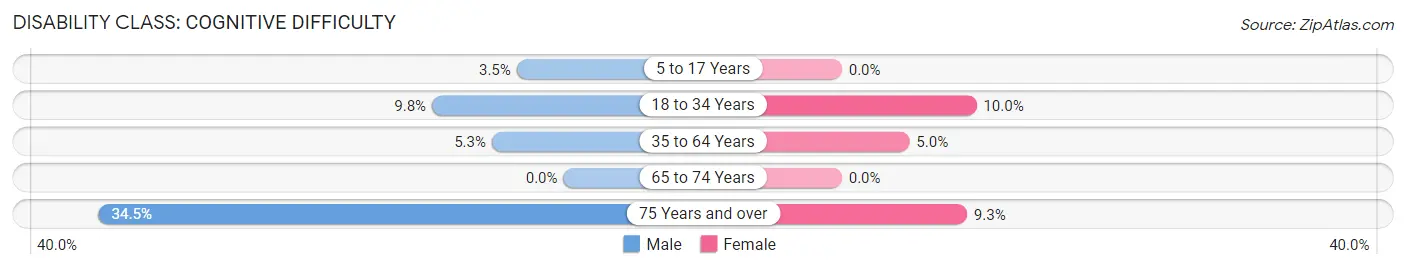
| Age Bracket | Male | Female |
| 5 to 17 Years | 11 (3.5%) | 0 (0.0%) |
| 18 to 34 Years | 44 (9.8%) | 36 (10.0%) |
| 35 to 64 Years | 48 (5.3%) | 41 (5.0%) |
| 65 to 74 Years | 0 (0.0%) | 0 (0.0%) |
| 75 Years and over | 79 (34.5%) | 26 (9.3%) |
Disability Class: Ambulatory Difficulty
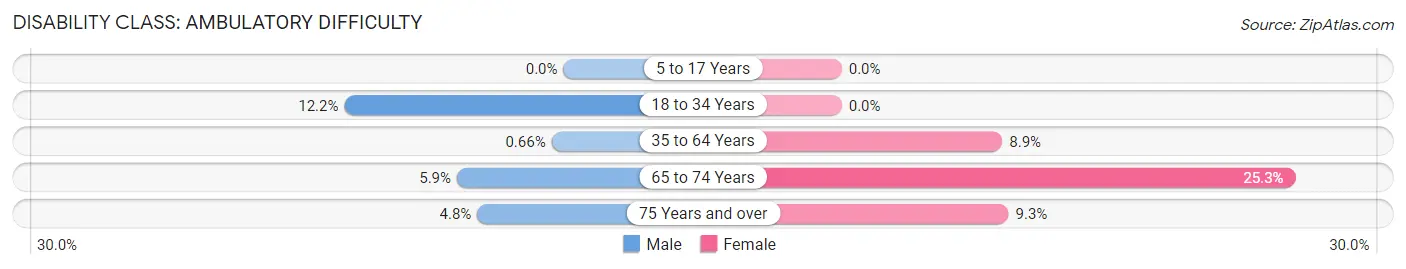
| Age Bracket | Male | Female |
| 5 to 17 Years | 0 (0.0%) | 0 (0.0%) |
| 18 to 34 Years | 55 (12.2%) | 0 (0.0%) |
| 35 to 64 Years | 6 (0.7%) | 73 (8.9%) |
| 65 to 74 Years | 20 (5.9%) | 72 (25.3%) |
| 75 Years and over | 11 (4.8%) | 26 (9.3%) |
Disability Class: Self-Care Difficulty
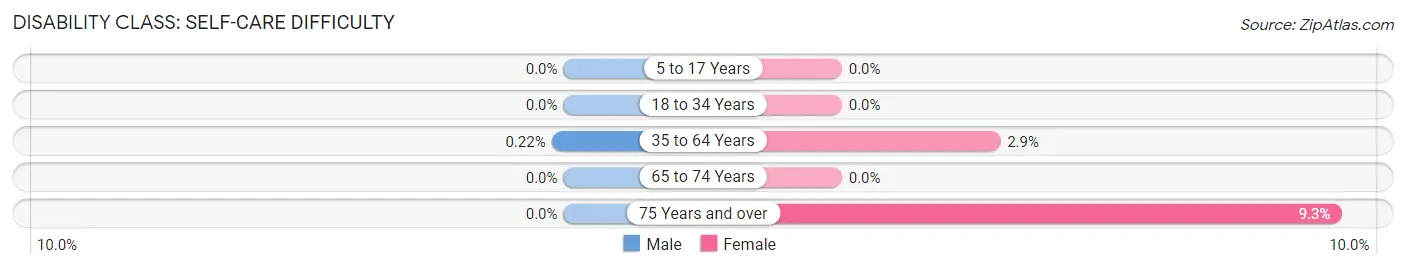
| Age Bracket | Male | Female |
| 5 to 17 Years | 0 (0.0%) | 0 (0.0%) |
| 18 to 34 Years | 0 (0.0%) | 0 (0.0%) |
| 35 to 64 Years | 2 (0.2%) | 24 (2.9%) |
| 65 to 74 Years | 0 (0.0%) | 0 (0.0%) |
| 75 Years and over | 0 (0.0%) | 26 (9.3%) |
Technology Access in Osage Beach
Computing Device Access in Osage Beach
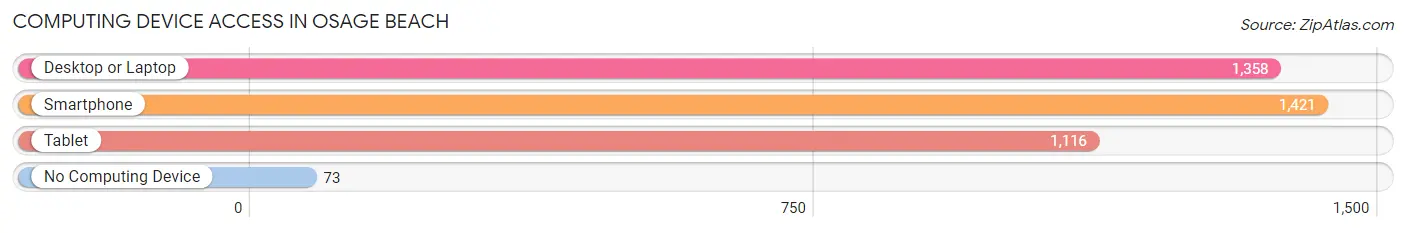
| Device Type | # Households | % Households |
| Desktop or Laptop | 1,358 | 81.9% |
| Smartphone | 1,421 | 85.7% |
| Tablet | 1,116 | 67.3% |
| No Computing Device | 73 | 4.4% |
| Total | 1,658 | 100.0% |
Internet Access in Osage Beach
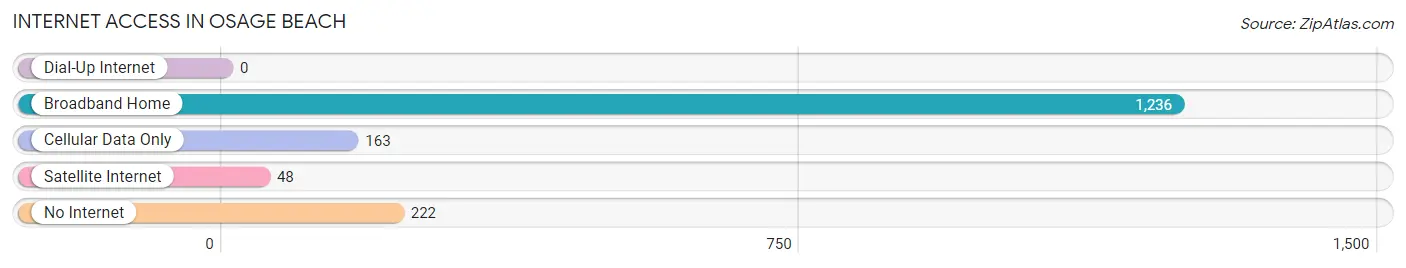
| Internet Type | # Households | % Households |
| Dial-Up Internet | 0 | 0.0% |
| Broadband Home | 1,236 | 74.6% |
| Cellular Data Only | 163 | 9.8% |
| Satellite Internet | 48 | 2.9% |
| No Internet | 222 | 13.4% |
| Total | 1,658 | 100.0% |
Osage Beach Summary
Osage Beach is a city located in the state of Missouri, United States. It is located in Camden County, and is part of the Lake of the Ozarks region. The city is situated on the shore of the Lake of the Ozarks, and is the largest city in the county. As of the 2010 census, the city had a population of 3,570.
History
Osage Beach was founded in the late 19th century, when the area was first settled by European-American settlers. The city was named after the Osage Indians, who had inhabited the area prior to the arrival of the settlers. The city was incorporated in 1952, and has since grown to become the largest city in Camden County.
Geography
Osage Beach is located at 38°7'25" North, 92°40'25" West (38.123611, -92.673611). The city is situated on the shore of the Lake of the Ozarks, and is the largest city in the county. The city has a total area of 8.2 square miles, of which 7.9 square miles is land and 0.3 square miles is water.
Economy
Osage Beach is a popular tourist destination, and the city's economy is largely based on tourism. The city is home to several resorts, hotels, and restaurants, as well as a variety of shops and other businesses. The city is also home to several marinas, which provide access to the lake for recreational activities such as fishing, boating, and swimming.
Demographics
As of the 2010 census, there were 3,570 people, 1,541 households, and 1,039 families residing in the city. The population density was 454.2 people per square mile. The racial makeup of the city was 97.2% White, 0.3% African American, 0.3% Native American, 0.4% Asian, 0.1% Pacific Islander, 0.4% from other races, and 1.3% from two or more races. Hispanic or Latino of any race were 1.7% of the population.
The median income for a household in the city was $41,944, and the median income for a family was $50,000. Males had a median income of $35,000 versus $25,000 for females. The per capita income for the city was $21,945. About 6.2% of families and 8.7% of the population were below the poverty line, including 11.2% of those under age 18 and 5.2% of those age 65 or over.
Conclusion
Osage Beach is a city located in the state of Missouri, United States. It is located in Camden County, and is part of the Lake of the Ozarks region. The city is situated on the shore of the Lake of the Ozarks, and is the largest city in the county. As of the 2010 census, the city had a population of 3,570. The city's economy is largely based on tourism, and it is home to several resorts, hotels, and restaurants, as well as a variety of shops and other businesses. The racial makeup of the city was 97.2% White, 0.3% African American, 0.3% Native American, 0.4% Asian, 0.1% Pacific Islander, 0.4% from other races, and 1.3% from two or more races. The median income for a household in the city was $41,944, and the median income for a family was $50,000.
Common Questions
What is Per Capita Income in Osage Beach?
Per Capita income in Osage Beach is $28,511.
What is the Median Family Income in Osage Beach?
Median Family Income in Osage Beach is $61,478.
What is the Median Household income in Osage Beach?
Median Household Income in Osage Beach is $51,600.
What is Income or Wage Gap in Osage Beach?
Income or Wage Gap in Osage Beach is 10.7%.
Women in Osage Beach earn 89.3 cents for every dollar earned by a man.
What is Inequality or Gini Index in Osage Beach?
Inequality or Gini Index in Osage Beach is 0.46.
What is the Total Population of Osage Beach?
Total Population of Osage Beach is 4,736.
What is the Total Male Population of Osage Beach?
Total Male Population of Osage Beach is 2,490.
What is the Total Female Population of Osage Beach?
Total Female Population of Osage Beach is 2,246.
What is the Ratio of Males per 100 Females in Osage Beach?
There are 110.86 Males per 100 Females in Osage Beach.
What is the Ratio of Females per 100 Males in Osage Beach?
There are 90.20 Females per 100 Males in Osage Beach.
What is the Median Population Age in Osage Beach?
Median Population Age in Osage Beach is 48.0 Years.
What is the Average Family Size in Osage Beach
Average Family Size in Osage Beach is 3.2 People.
What is the Average Household Size in Osage Beach
Average Household Size in Osage Beach is 2.7 People.
How Large is the Labor Force in Osage Beach?
There are 2,318 People in the Labor Forcein in Osage Beach.
What is the Percentage of People in the Labor Force in Osage Beach?
57.8% of People are in the Labor Force in Osage Beach.
What is the Unemployment Rate in Osage Beach?
Unemployment Rate in Osage Beach is 10.6%.