Oran, MO Map & Demographics
Oran Map
Oran Overview
$23,617
PER CAPITA INCOME
$57,500
AVG FAMILY INCOME
$51,250
AVG HOUSEHOLD INCOME
43.3%
WAGE / INCOME GAP [ % ]
56.7¢/ $1
WAGE / INCOME GAP [ $ ]
0.40
INEQUALITY / GINI INDEX
1,150
TOTAL POPULATION
530
MALE POPULATION
620
FEMALE POPULATION
85.48
MALES / 100 FEMALES
116.98
FEMALES / 100 MALES
38.7
MEDIAN AGE
2.9
AVG FAMILY SIZE
2.5
AVG HOUSEHOLD SIZE
634
LABOR FORCE [ PEOPLE ]
67.6%
PERCENT IN LABOR FORCE
7.8%
UNEMPLOYMENT RATE
Oran Zip Codes
Oran Area Codes
Income in Oran
Income Overview in Oran
Per Capita Income in Oran is $23,617, while median incomes of families and households are $57,500 and $51,250 respectively.
| Characteristic | Number | Measure |
| Per Capita Income | 1,150 | $23,617 |
| Median Family Income | 346 | $57,500 |
| Mean Family Income | 346 | $63,738 |
| Median Household Income | 452 | $51,250 |
| Mean Household Income | 452 | $59,027 |
| Income Deficit | 346 | $0 |
| Wage / Income Gap (%) | 1,150 | 43.30% |
| Wage / Income Gap ($) | 1,150 | 56.70¢ per $1 |
| Gini / Inequality Index | 1,150 | 0.40 |
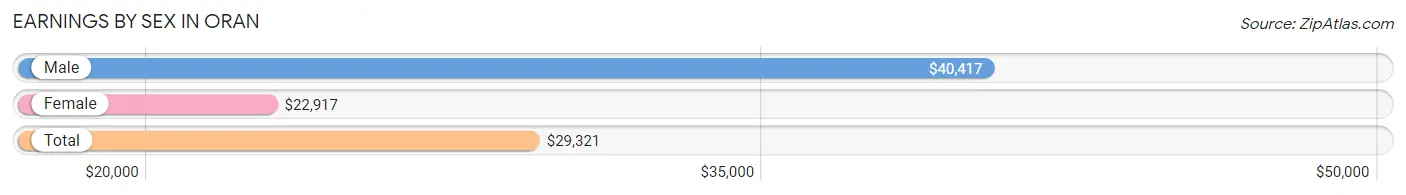
Earnings by Sex in Oran
Average Earnings in Oran are $29,321, $40,417 for men and $22,917 for women, a difference of 43.3%.
| Sex | Number | Average Earnings |
| Male | 289 (46.0%) | $40,417 |
| Female | 340 (54.0%) | $22,917 |
| Total | 629 (100.0%) | $29,321 |
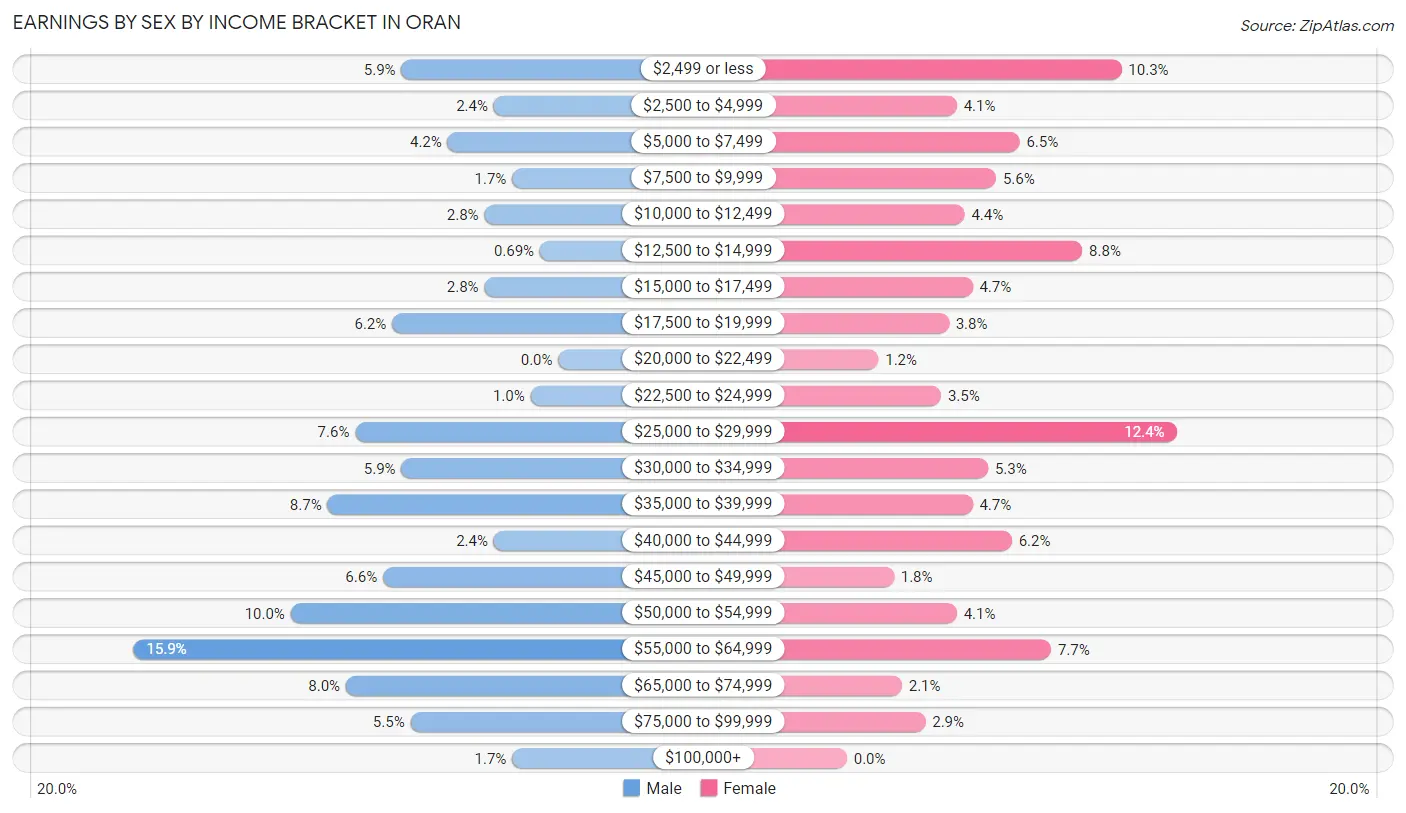
Earnings by Sex by Income Bracket in Oran
The most common earnings brackets in Oran are $55,000 to $64,999 for men (46 | 15.9%) and $25,000 to $29,999 for women (42 | 12.3%).
| Income | Male | Female |
| $2,499 or less | 17 (5.9%) | 35 (10.3%) |
| $2,500 to $4,999 | 7 (2.4%) | 14 (4.1%) |
| $5,000 to $7,499 | 12 (4.2%) | 22 (6.5%) |
| $7,500 to $9,999 | 5 (1.7%) | 19 (5.6%) |
| $10,000 to $12,499 | 8 (2.8%) | 15 (4.4%) |
| $12,500 to $14,999 | 2 (0.7%) | 30 (8.8%) |
| $15,000 to $17,499 | 8 (2.8%) | 16 (4.7%) |
| $17,500 to $19,999 | 18 (6.2%) | 13 (3.8%) |
| $20,000 to $22,499 | 0 (0.0%) | 4 (1.2%) |
| $22,500 to $24,999 | 3 (1.0%) | 12 (3.5%) |
| $25,000 to $29,999 | 22 (7.6%) | 42 (12.3%) |
| $30,000 to $34,999 | 17 (5.9%) | 18 (5.3%) |
| $35,000 to $39,999 | 25 (8.6%) | 16 (4.7%) |
| $40,000 to $44,999 | 7 (2.4%) | 21 (6.2%) |
| $45,000 to $49,999 | 19 (6.6%) | 6 (1.8%) |
| $50,000 to $54,999 | 29 (10.0%) | 14 (4.1%) |
| $55,000 to $64,999 | 46 (15.9%) | 26 (7.6%) |
| $65,000 to $74,999 | 23 (8.0%) | 7 (2.1%) |
| $75,000 to $99,999 | 16 (5.5%) | 10 (2.9%) |
| $100,000+ | 5 (1.7%) | 0 (0.0%) |
| Total | 289 (100.0%) | 340 (100.0%) |
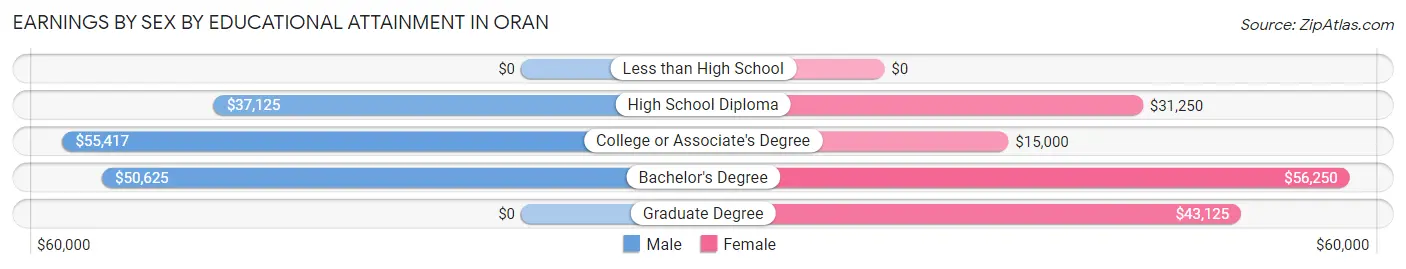
Earnings by Sex by Educational Attainment in Oran
Average earnings in Oran are $43,125 for men and $25,789 for women, a difference of 40.2%. Men with an educational attainment of college or associate's degree enjoy the highest average annual earnings of $55,417, while those with high school diploma education earn the least with $37,125. Women with an educational attainment of bachelor's degree earn the most with the average annual earnings of $56,250, while those with college or associate's degree education have the smallest earnings of $15,000.
| Educational Attainment | Male Income | Female Income |
| Less than High School | - | - |
| High School Diploma | $37,125 | $31,250 |
| College or Associate's Degree | $55,417 | $15,000 |
| Bachelor's Degree | $50,625 | $56,250 |
| Graduate Degree | - | - |
| Total | $43,125 | $25,789 |
Family Income in Oran
Family Income Brackets in Oran
According to the Oran family income data, there are 84 families falling into the $50,000 to $74,999 income range, which is the most common income bracket and makes up 24.3% of all families. Conversely, the $200,000+ income bracket is the least frequent group with only 3 families (0.9%) belonging to this category.
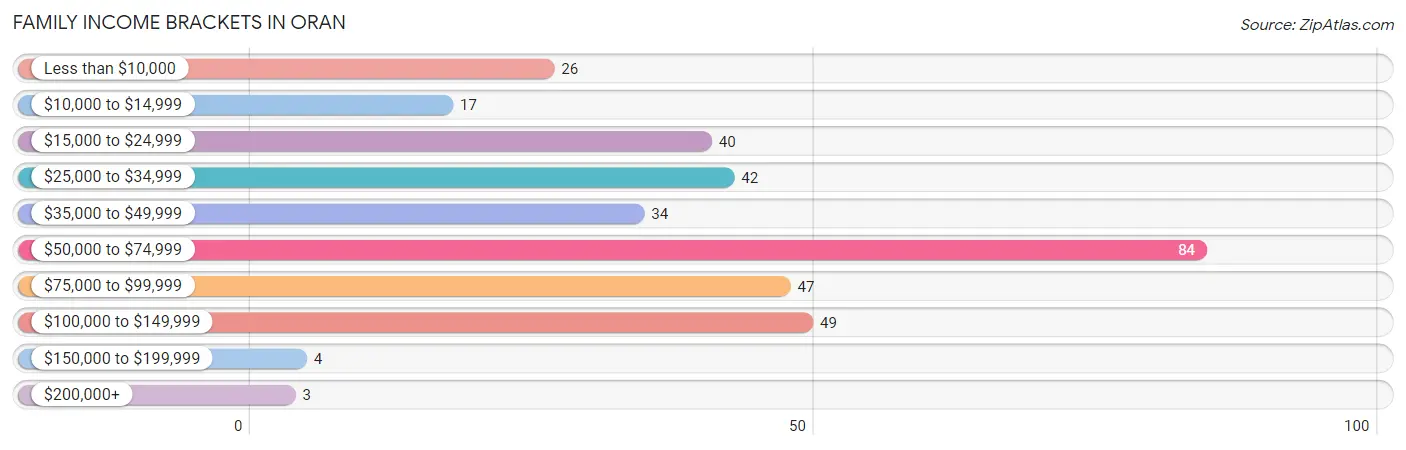
| Income Bracket | # Families | % Families |
| Less than $10,000 | 26 | 7.5% |
| $10,000 to $14,999 | 17 | 4.9% |
| $15,000 to $24,999 | 40 | 11.6% |
| $25,000 to $34,999 | 42 | 12.1% |
| $35,000 to $49,999 | 34 | 9.8% |
| $50,000 to $74,999 | 84 | 24.3% |
| $75,000 to $99,999 | 47 | 13.6% |
| $100,000 to $149,999 | 49 | 14.2% |
| $150,000 to $199,999 | 4 | 1.2% |
| $200,000+ | 3 | 0.9% |
Family Income by Famaliy Size in Oran
4-person families (46 | 13.3%) account for the highest median family income in Oran with $114,038 per family, while 2-person families (203 | 58.7%) have the highest median income of $29,688 per family member.
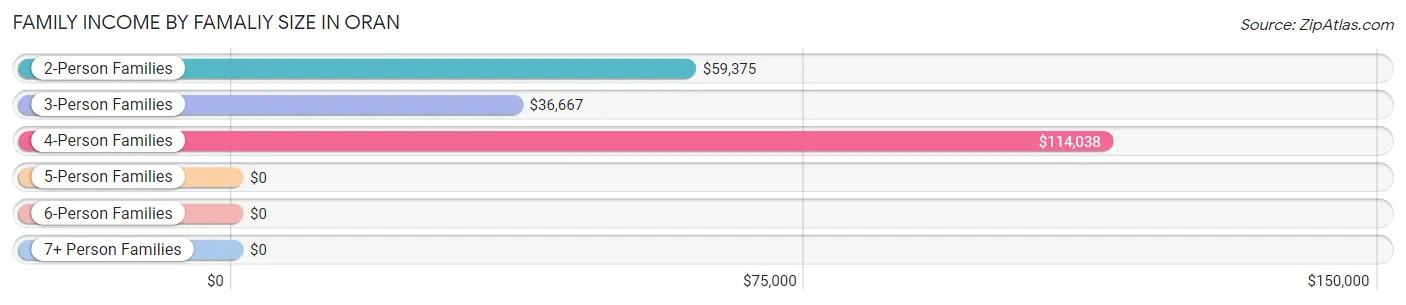
| Income Bracket | # Families | Median Income |
| 2-Person Families | 203 (58.7%) | $59,375 |
| 3-Person Families | 84 (24.3%) | $36,667 |
| 4-Person Families | 46 (13.3%) | $114,038 |
| 5-Person Families | 13 (3.8%) | $0 |
| 6-Person Families | 0 (0.0%) | $0 |
| 7+ Person Families | 0 (0.0%) | $0 |
| Total | 346 (100.0%) | $57,500 |
Family Income by Number of Earners in Oran
The median family income in Oran is $57,500, with families comprising 3+ earners (19) having the highest median family income of $114,750, while families with no earners (38) have the lowest median family income of $23,750, accounting for 5.5% and 11.0% of families, respectively.
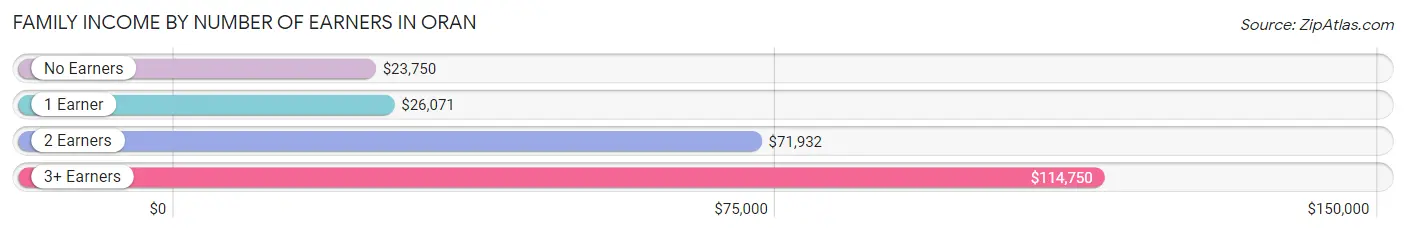
| Number of Earners | # Families | Median Income |
| No Earners | 38 (11.0%) | $23,750 |
| 1 Earner | 126 (36.4%) | $26,071 |
| 2 Earners | 163 (47.1%) | $71,932 |
| 3+ Earners | 19 (5.5%) | $114,750 |
| Total | 346 (100.0%) | $57,500 |
Household Income in Oran
Household Income Brackets in Oran
With 124 households falling in the category, the $50,000 to $74,999 income range is the most frequent in Oran, accounting for 27.4% of all households. In contrast, only 3 households (0.7%) fall into the $200,000+ income bracket, making it the least populous group.
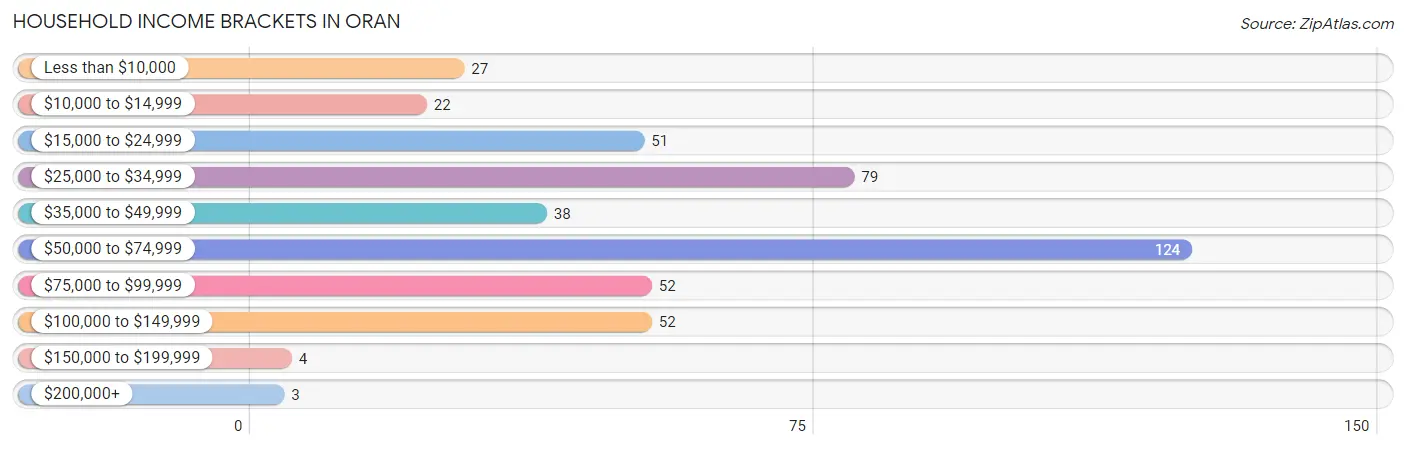
| Income Bracket | # Households | % Households |
| Less than $10,000 | 27 | 6.0% |
| $10,000 to $14,999 | 22 | 4.9% |
| $15,000 to $24,999 | 51 | 11.3% |
| $25,000 to $34,999 | 79 | 17.5% |
| $35,000 to $49,999 | 38 | 8.4% |
| $50,000 to $74,999 | 124 | 27.4% |
| $75,000 to $99,999 | 52 | 11.5% |
| $100,000 to $149,999 | 52 | 11.5% |
| $150,000 to $199,999 | 4 | 0.9% |
| $200,000+ | 3 | 0.7% |
Household Income by Householder Age in Oran
The median household income in Oran is $51,250, with the highest median household income of $69,485 found in the 45 to 64 years age bracket for the primary householder. A total of 137 households (30.3%) fall into this category. Meanwhile, the 65+ years age bracket for the primary householder has the lowest median household income of $30,977, with 121 households (26.8%) in this group.
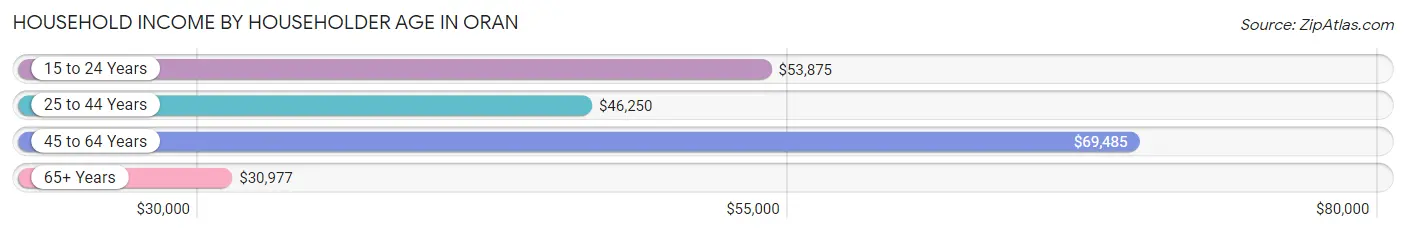
| Income Bracket | # Households | Median Income |
| 15 to 24 Years | 17 (3.8%) | $53,875 |
| 25 to 44 Years | 177 (39.2%) | $46,250 |
| 45 to 64 Years | 137 (30.3%) | $69,485 |
| 65+ Years | 121 (26.8%) | $30,977 |
| Total | 452 (100.0%) | $51,250 |
Poverty in Oran
Income Below Poverty by Sex and Age in Oran
With 19.1% poverty level for males and 24.1% for females among the residents of Oran, 12 to 14 year old males and 6 to 11 year old females are the most vulnerable to poverty, with 25 males (59.5%) and 13 females (56.5%) in their respective age groups living below the poverty level.
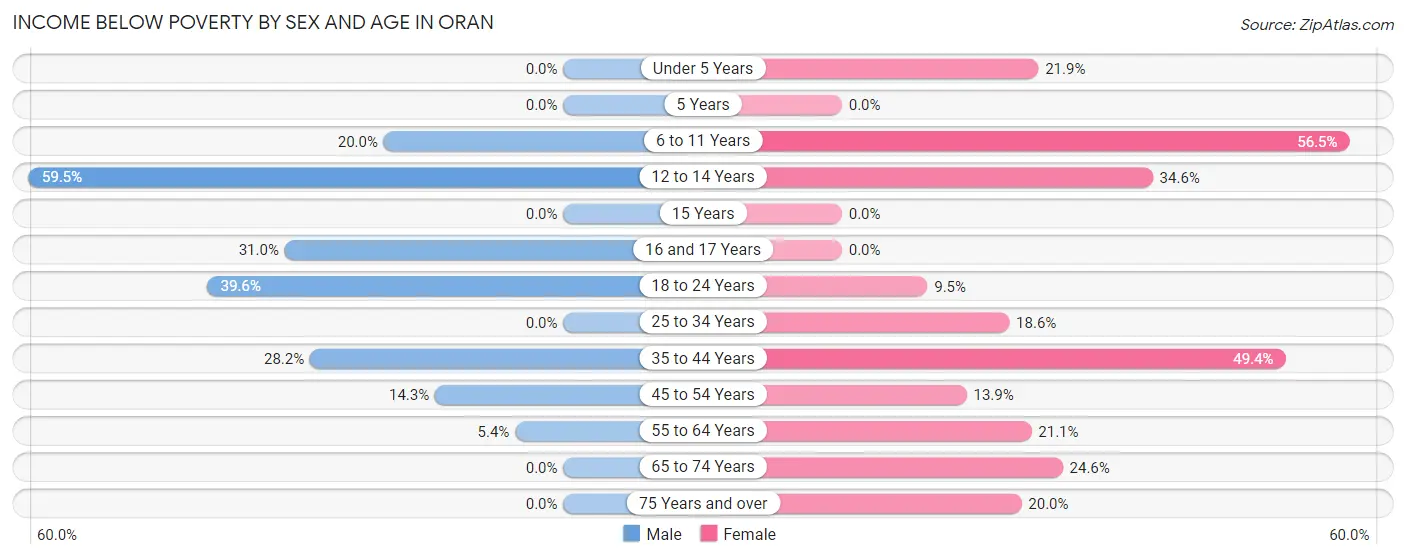
| Age Bracket | Male | Female |
| Under 5 Years | 0 (0.0%) | 7 (21.9%) |
| 5 Years | 0 (0.0%) | 0 (0.0%) |
| 6 to 11 Years | 9 (20.0%) | 13 (56.5%) |
| 12 to 14 Years | 25 (59.5%) | 9 (34.6%) |
| 15 Years | 0 (0.0%) | 0 (0.0%) |
| 16 and 17 Years | 9 (31.0%) | 0 (0.0%) |
| 18 to 24 Years | 21 (39.6%) | 4 (9.5%) |
| 25 to 34 Years | 0 (0.0%) | 22 (18.6%) |
| 35 to 44 Years | 22 (28.2%) | 41 (49.4%) |
| 45 to 54 Years | 11 (14.3%) | 10 (13.9%) |
| 55 to 64 Years | 3 (5.4%) | 19 (21.1%) |
| 65 to 74 Years | 0 (0.0%) | 15 (24.6%) |
| 75 Years and over | 0 (0.0%) | 8 (20.0%) |
| Total | 100 (19.1%) | 148 (24.1%) |
Income Above Poverty by Sex and Age in Oran
According to the poverty statistics in Oran, males aged under 5 years and females aged 5 years are the age groups that are most secure financially, with 100.0% of males and 100.0% of females in these age groups living above the poverty line.
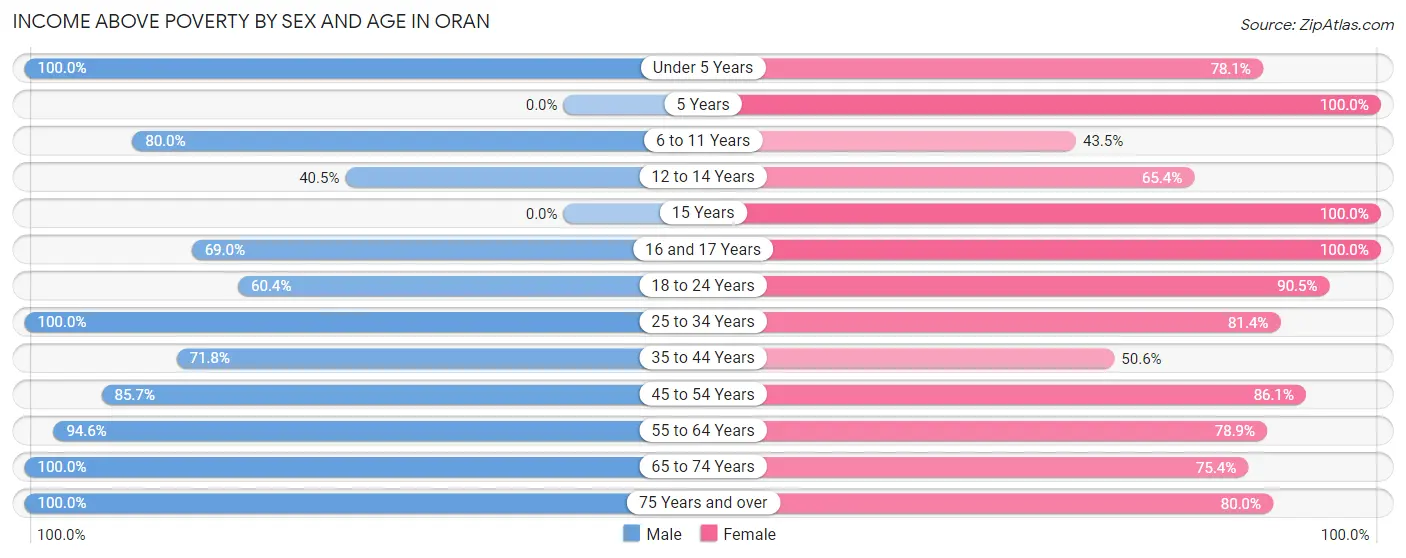
| Age Bracket | Male | Female |
| Under 5 Years | 20 (100.0%) | 25 (78.1%) |
| 5 Years | 0 (0.0%) | 6 (100.0%) |
| 6 to 11 Years | 36 (80.0%) | 10 (43.5%) |
| 12 to 14 Years | 17 (40.5%) | 17 (65.4%) |
| 15 Years | 0 (0.0%) | 6 (100.0%) |
| 16 and 17 Years | 20 (69.0%) | 15 (100.0%) |
| 18 to 24 Years | 32 (60.4%) | 38 (90.5%) |
| 25 to 34 Years | 50 (100.0%) | 96 (81.4%) |
| 35 to 44 Years | 56 (71.8%) | 42 (50.6%) |
| 45 to 54 Years | 66 (85.7%) | 62 (86.1%) |
| 55 to 64 Years | 53 (94.6%) | 71 (78.9%) |
| 65 to 74 Years | 63 (100.0%) | 46 (75.4%) |
| 75 Years and over | 11 (100.0%) | 32 (80.0%) |
| Total | 424 (80.9%) | 466 (75.9%) |
Income Below Poverty Among Married-Couple Families in Oran
The poverty statistics for married-couple families in Oran show that 10.7% or 26 of the total 243 families live below the poverty line. Families with 3 or 4 children have the highest poverty rate of 77.8%, comprising of 7 families. On the other hand, families with 1 or 2 children have the lowest poverty rate of 0.0%, which includes 0 families.
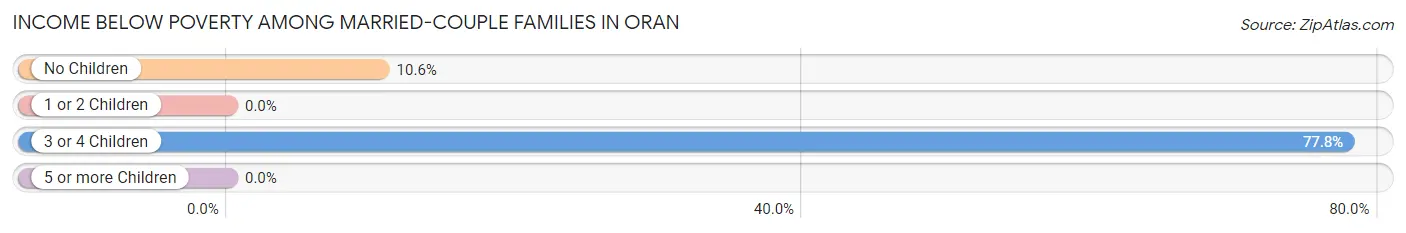
| Children | Above Poverty | Below Poverty |
| No Children | 161 (89.4%) | 19 (10.6%) |
| 1 or 2 Children | 54 (100.0%) | 0 (0.0%) |
| 3 or 4 Children | 2 (22.2%) | 7 (77.8%) |
| 5 or more Children | 0 (0.0%) | 0 (0.0%) |
| Total | 217 (89.3%) | 26 (10.7%) |
Income Below Poverty Among Single-Parent Households in Oran
According to the poverty data in Oran, 11.8% or 2 single-father households and 51.2% or 44 single-mother households are living below the poverty line. Among single-father households, those with 1 or 2 children have the highest poverty rate, with 2 households (33.3%) experiencing poverty. Likewise, among single-mother households, those with no children have the highest poverty rate, with 16 households (61.5%) falling below the poverty line.
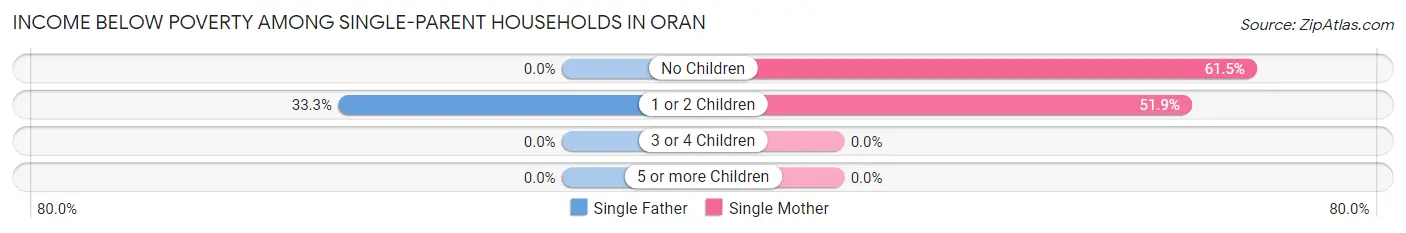
| Children | Single Father | Single Mother |
| No Children | 0 (0.0%) | 16 (61.5%) |
| 1 or 2 Children | 2 (33.3%) | 28 (51.8%) |
| 3 or 4 Children | 0 (0.0%) | 0 (0.0%) |
| 5 or more Children | 0 (0.0%) | 0 (0.0%) |
| Total | 2 (11.8%) | 44 (51.2%) |
Income Below Poverty Among Married-Couple vs Single-Parent Households in Oran
The poverty data for Oran shows that 26 of the married-couple family households (10.7%) and 46 of the single-parent households (44.7%) are living below the poverty level. Within the married-couple family households, those with 3 or 4 children have the highest poverty rate, with 7 households (77.8%) falling below the poverty line. Among the single-parent households, those with 1 or 2 children have the highest poverty rate, with 30 household (50.0%) living below poverty.
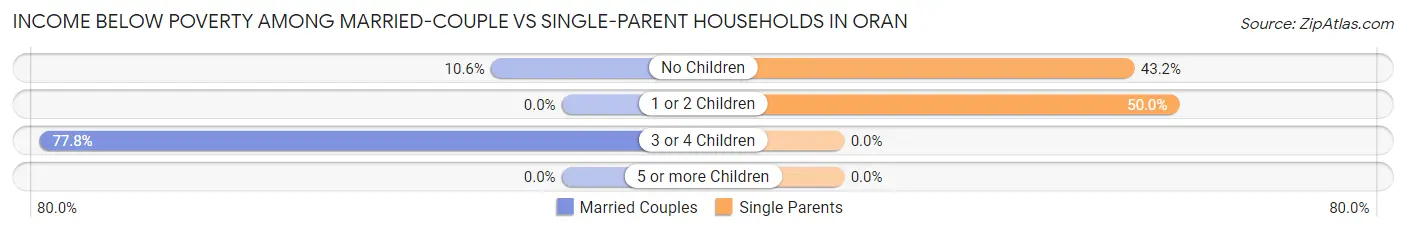
| Children | Married-Couple Families | Single-Parent Households |
| No Children | 19 (10.6%) | 16 (43.2%) |
| 1 or 2 Children | 0 (0.0%) | 30 (50.0%) |
| 3 or 4 Children | 7 (77.8%) | 0 (0.0%) |
| 5 or more Children | 0 (0.0%) | 0 (0.0%) |
| Total | 26 (10.7%) | 46 (44.7%) |
Race in Oran
The most populous races in Oran are White / Caucasian (1,077 | 93.6%), Two or more Races (69 | 6.0%), and Hispanic or Latino (17 | 1.5%).
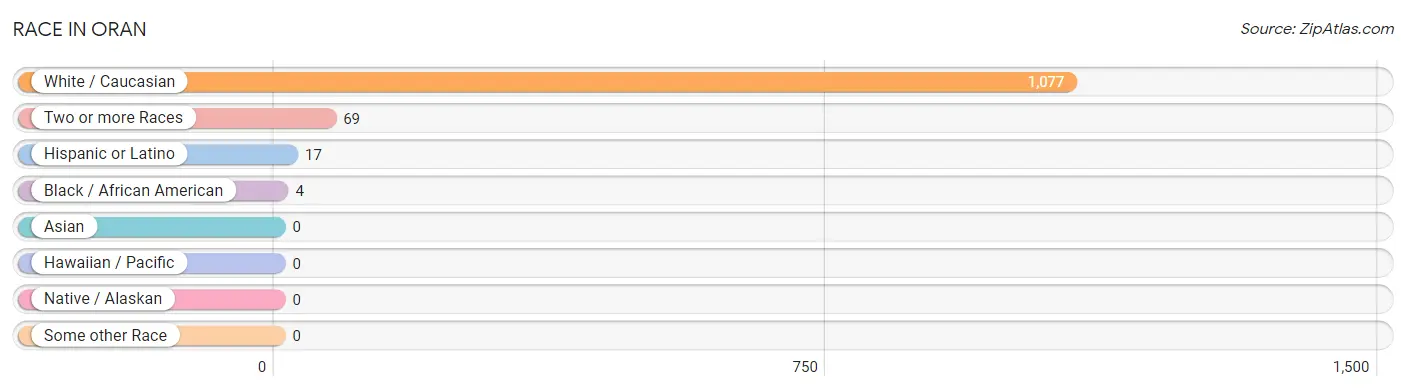
| Race | # Population | % Population |
| Asian | 0 | 0.0% |
| Black / African American | 4 | 0.4% |
| Hawaiian / Pacific | 0 | 0.0% |
| Hispanic or Latino | 17 | 1.5% |
| Native / Alaskan | 0 | 0.0% |
| White / Caucasian | 1,077 | 93.6% |
| Two or more Races | 69 | 6.0% |
| Some other Race | 0 | 0.0% |
| Total | 1,150 | 100.0% |
Ancestry in Oran
The most populous ancestries reported in Oran are German (322 | 28.0%), Irish (157 | 13.7%), American (136 | 11.8%), English (84 | 7.3%), and Dutch (37 | 3.2%), together accounting for 64.0% of all Oran residents.
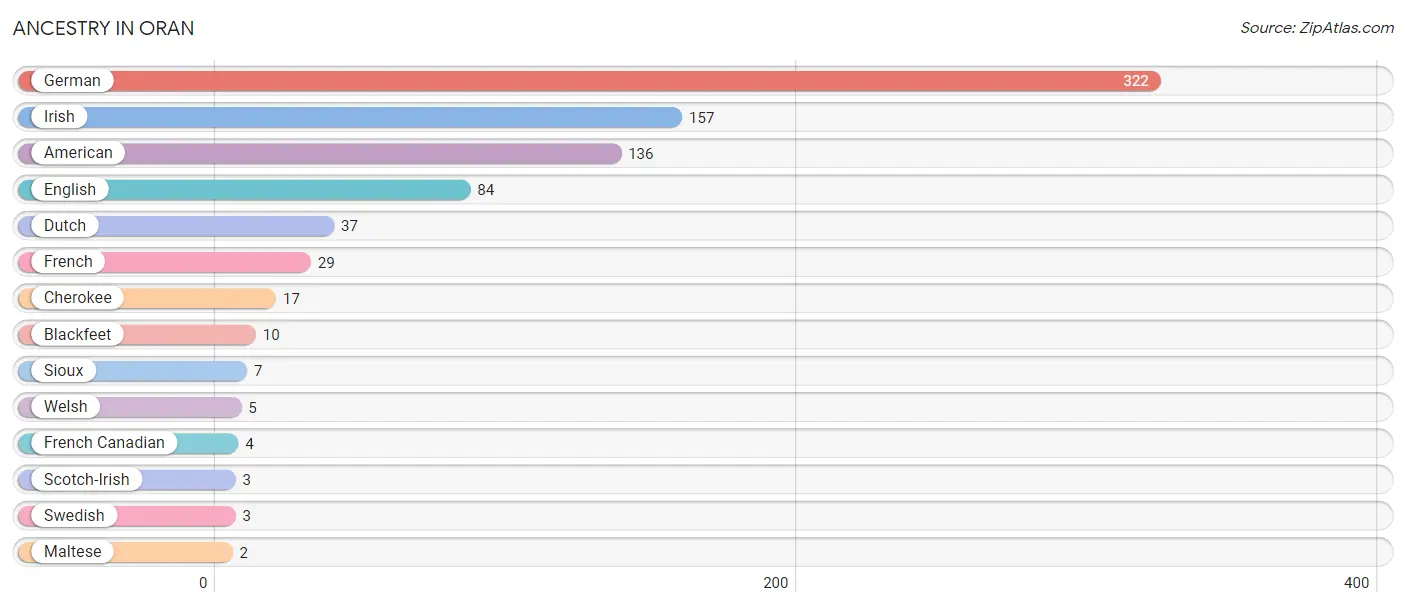
| Ancestry | # Population | % Population |
| American | 136 | 11.8% |
| Blackfeet | 10 | 0.9% |
| Cherokee | 17 | 1.5% |
| Dutch | 37 | 3.2% |
| English | 84 | 7.3% |
| French | 29 | 2.5% |
| French Canadian | 4 | 0.4% |
| German | 322 | 28.0% |
| Irish | 157 | 13.7% |
| Maltese | 2 | 0.2% |
| Scotch-Irish | 3 | 0.3% |
| Sioux | 7 | 0.6% |
| Swedish | 3 | 0.3% |
| Welsh | 5 | 0.4% | View All 14 Rows |
Immigrants in Oran
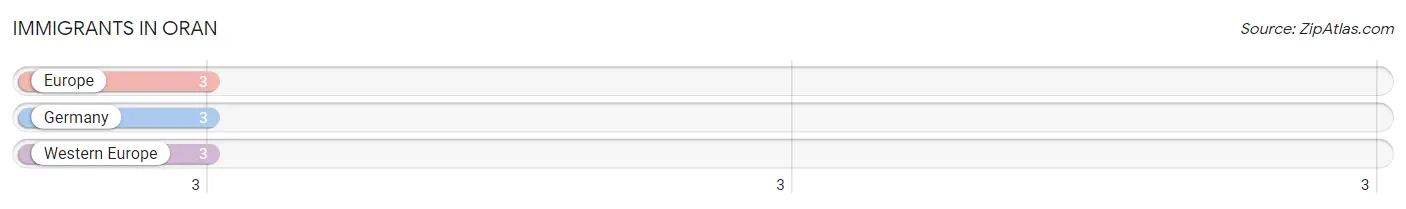
The most numerous immigrant groups reported in Oran came from Europe (3 | 0.3%), Germany (3 | 0.3%), and Western Europe (3 | 0.3%), together accounting for 0.8% of all Oran residents.
| Immigration Origin | # Population | % Population |
| Europe | 3 | 0.3% |
| Germany | 3 | 0.3% |
| Western Europe | 3 | 0.3% | View All 3 Rows |
Sex and Age in Oran
Sex and Age in Oran
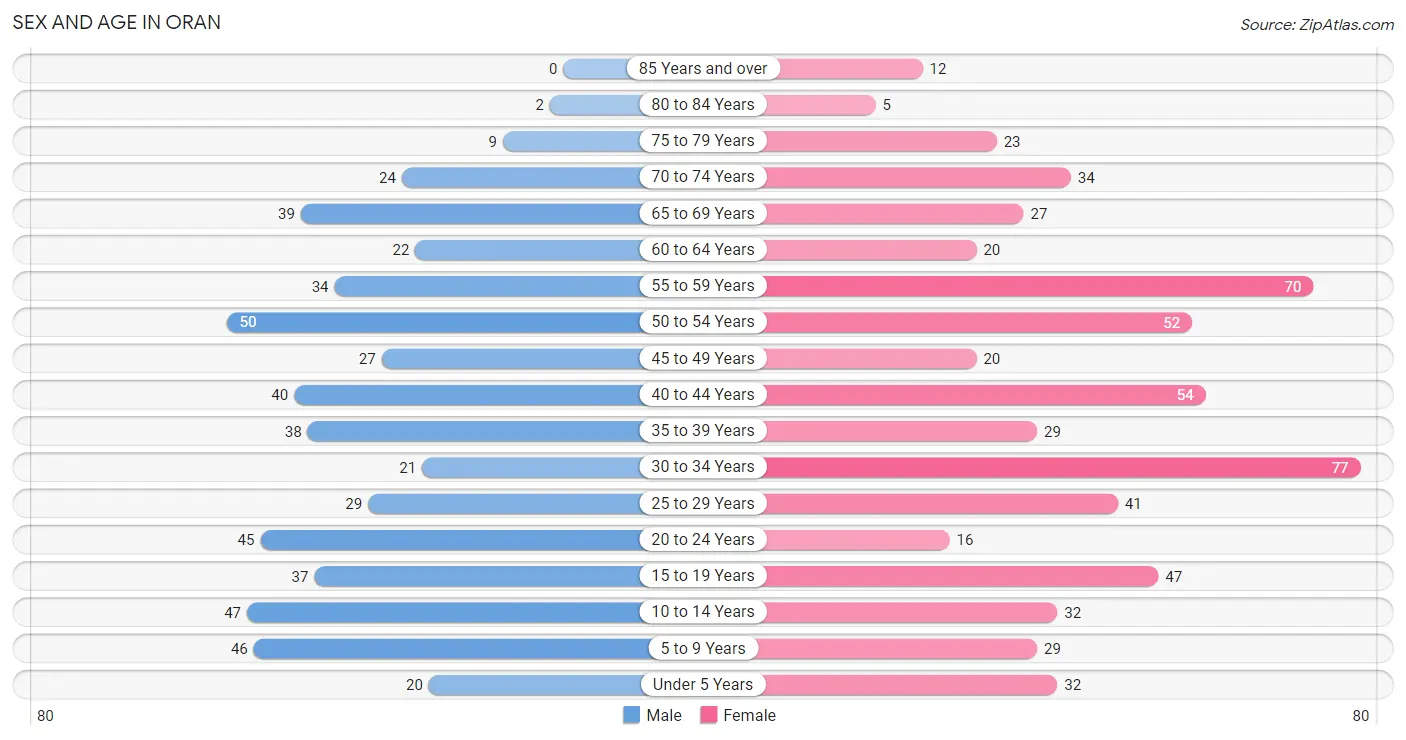
The most populous age groups in Oran are 50 to 54 Years (50 | 9.4%) for men and 30 to 34 Years (77 | 12.4%) for women.
| Age Bracket | Male | Female |
| Under 5 Years | 20 (3.8%) | 32 (5.2%) |
| 5 to 9 Years | 46 (8.7%) | 29 (4.7%) |
| 10 to 14 Years | 47 (8.9%) | 32 (5.2%) |
| 15 to 19 Years | 37 (7.0%) | 47 (7.6%) |
| 20 to 24 Years | 45 (8.5%) | 16 (2.6%) |
| 25 to 29 Years | 29 (5.5%) | 41 (6.6%) |
| 30 to 34 Years | 21 (4.0%) | 77 (12.4%) |
| 35 to 39 Years | 38 (7.2%) | 29 (4.7%) |
| 40 to 44 Years | 40 (7.5%) | 54 (8.7%) |
| 45 to 49 Years | 27 (5.1%) | 20 (3.2%) |
| 50 to 54 Years | 50 (9.4%) | 52 (8.4%) |
| 55 to 59 Years | 34 (6.4%) | 70 (11.3%) |
| 60 to 64 Years | 22 (4.2%) | 20 (3.2%) |
| 65 to 69 Years | 39 (7.4%) | 27 (4.3%) |
| 70 to 74 Years | 24 (4.5%) | 34 (5.5%) |
| 75 to 79 Years | 9 (1.7%) | 23 (3.7%) |
| 80 to 84 Years | 2 (0.4%) | 5 (0.8%) |
| 85 Years and over | 0 (0.0%) | 12 (1.9%) |
| Total | 530 (100.0%) | 620 (100.0%) |
Families and Households in Oran
Median Family Size in Oran
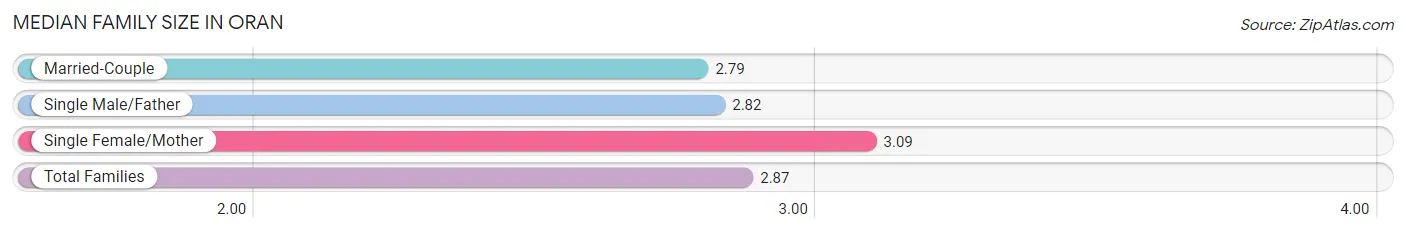
The median family size in Oran is 2.87 persons per family, with single female/mother families (86 | 24.9%) accounting for the largest median family size of 3.09 persons per family. On the other hand, married-couple families (243 | 70.2%) represent the smallest median family size with 2.79 persons per family.
| Family Type | # Families | Family Size |
| Married-Couple | 243 (70.2%) | 2.79 |
| Single Male/Father | 17 (4.9%) | 2.82 |
| Single Female/Mother | 86 (24.9%) | 3.09 |
| Total Families | 346 (100.0%) | 2.87 |
Median Household Size in Oran
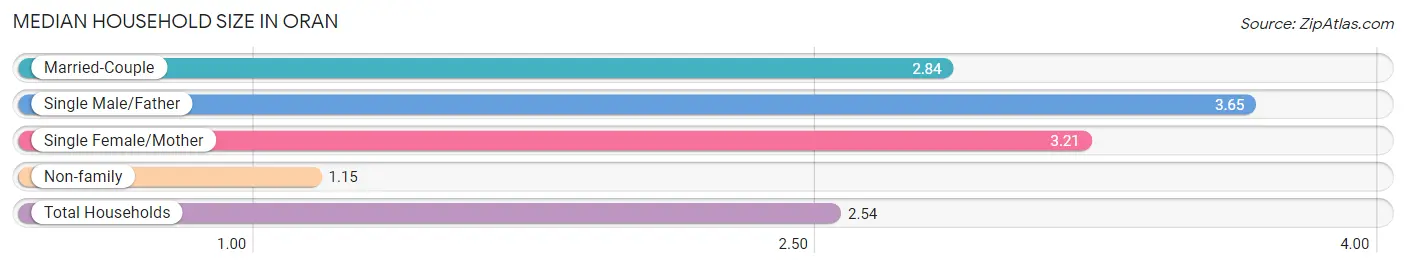
The median household size in Oran is 2.54 persons per household, with single male/father households (17 | 3.8%) accounting for the largest median household size of 3.65 persons per household. non-family households (106 | 23.4%) represent the smallest median household size with 1.15 persons per household.
| Household Type | # Households | Household Size |
| Married-Couple | 243 (53.8%) | 2.84 |
| Single Male/Father | 17 (3.8%) | 3.65 |
| Single Female/Mother | 86 (19.0%) | 3.21 |
| Non-family | 106 (23.4%) | 1.15 |
| Total Households | 452 (100.0%) | 2.54 |
Household Size by Marriage Status in Oran
Out of a total of 452 households in Oran, 346 (76.5%) are family households, while 106 (23.4%) are nonfamily households. The most numerous type of family households are 2-person households, comprising 181, and the most common type of nonfamily households are 1-person households, comprising 91.
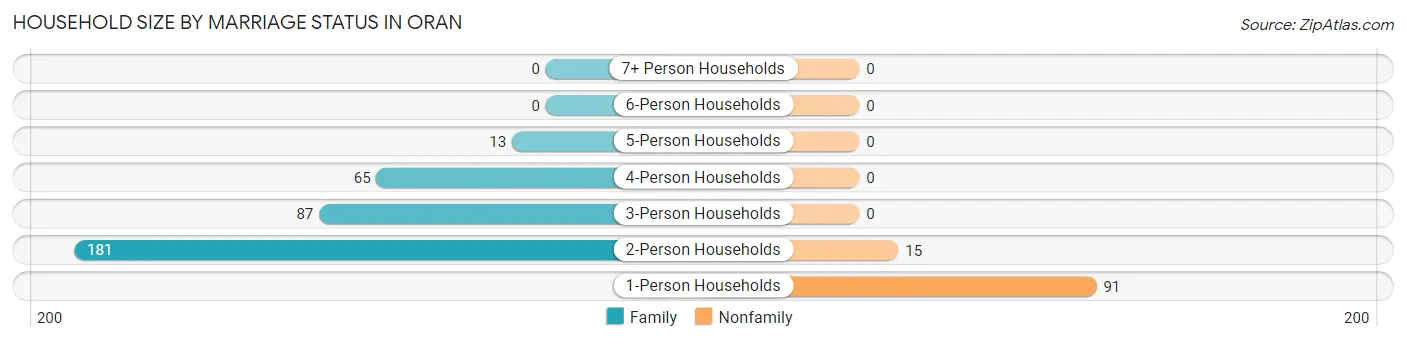
| Household Size | Family Households | Nonfamily Households |
| 1-Person Households | - | 91 (20.1%) |
| 2-Person Households | 181 (40.0%) | 15 (3.3%) |
| 3-Person Households | 87 (19.3%) | 0 (0.0%) |
| 4-Person Households | 65 (14.4%) | 0 (0.0%) |
| 5-Person Households | 13 (2.9%) | 0 (0.0%) |
| 6-Person Households | 0 (0.0%) | 0 (0.0%) |
| 7+ Person Households | 0 (0.0%) | 0 (0.0%) |
| Total | 346 (76.5%) | 106 (23.4%) |
Female Fertility in Oran
Fertility by Age in Oran
Average fertility rate in Oran is 96.0 births per 1,000 women. Women in the age bracket of 20 to 34 years have the highest fertility rate with 149.0 births per 1,000 women. Women in the age bracket of 20 to 34 years acount for 71.4% of all women with births.
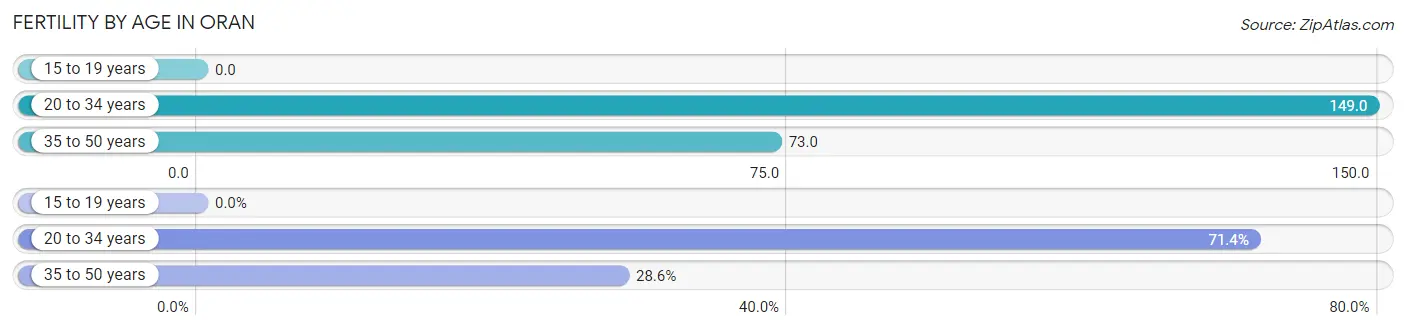
| Age Bracket | Women with Births | Births / 1,000 Women |
| 15 to 19 years | 0 (0.0%) | 0.0 |
| 20 to 34 years | 20 (71.4%) | 149.0 |
| 35 to 50 years | 8 (28.6%) | 73.0 |
| Total | 28 (100.0%) | 96.0 |
Fertility by Age by Marriage Status in Oran
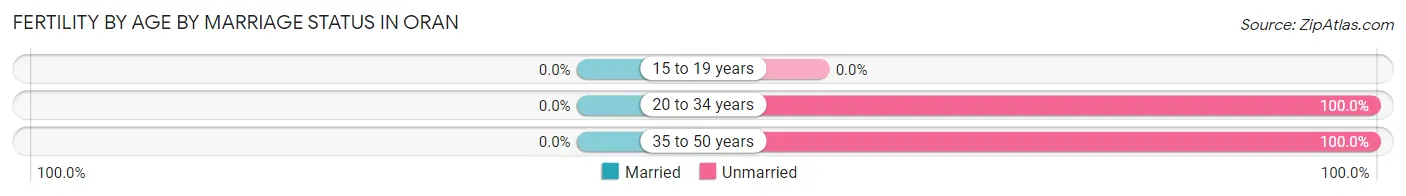
| Age Bracket | Married | Unmarried |
| 15 to 19 years | 0 (0.0%) | 0 (0.0%) |
| 20 to 34 years | 0 (0.0%) | 20 (100.0%) |
| 35 to 50 years | 0 (0.0%) | 8 (100.0%) |
| Total | 0 (0.0%) | 28 (100.0%) |
Fertility by Education in Oran
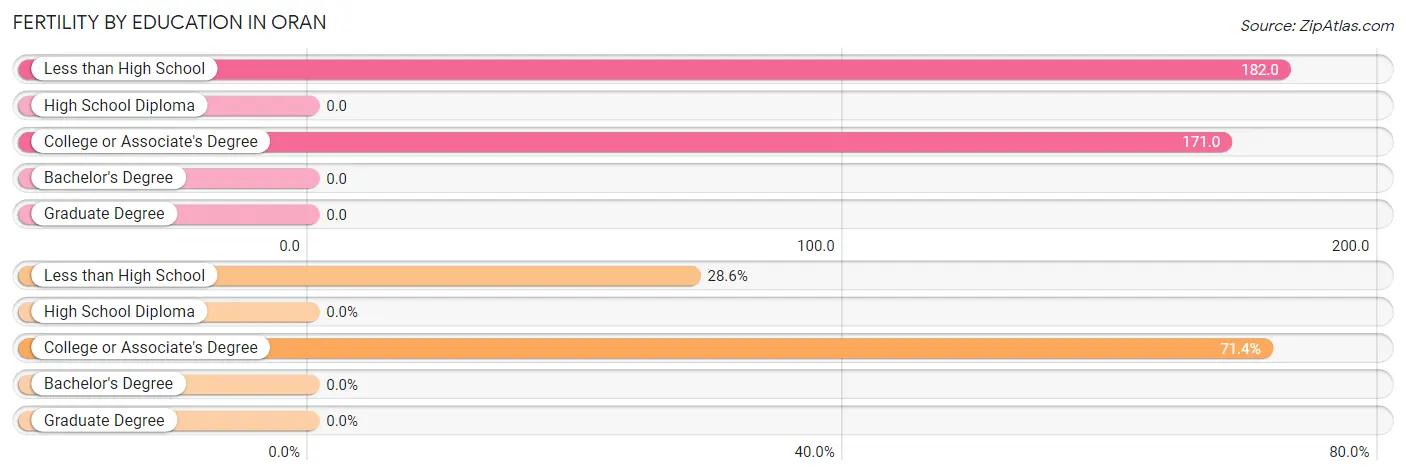
| Educational Attainment | Women with Births | Births / 1,000 Women |
| Less than High School | 8 (28.6%) | 182.0 |
| High School Diploma | 0 (0.0%) | 0.0 |
| College or Associate's Degree | 20 (71.4%) | 171.0 |
| Bachelor's Degree | 0 (0.0%) | 0.0 |
| Graduate Degree | 0 (0.0%) | 0.0 |
| Total | 28 (100.0%) | 96.0 |
Fertility by Education by Marriage Status in Oran
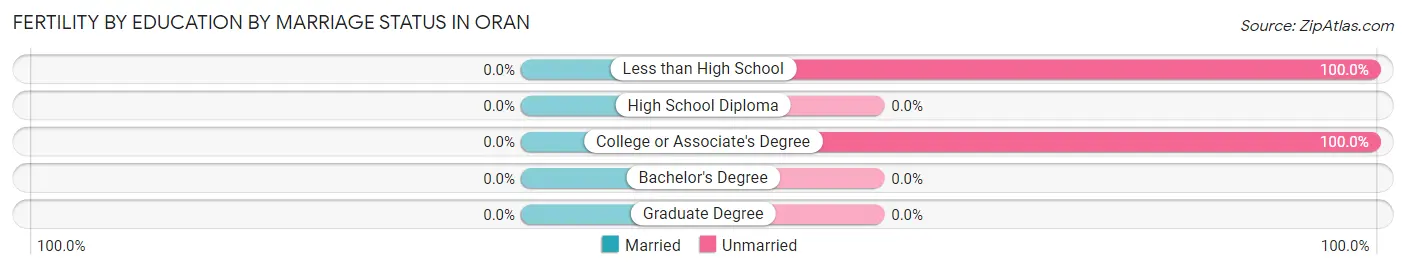
| Educational Attainment | Married | Unmarried |
| Less than High School | 0 (0.0%) | 8 (100.0%) |
| High School Diploma | 0 (0.0%) | 0 (0.0%) |
| College or Associate's Degree | 0 (0.0%) | 20 (100.0%) |
| Bachelor's Degree | 0 (0.0%) | 0 (0.0%) |
| Graduate Degree | 0 (0.0%) | 0 (0.0%) |
| Total | 0 (0.0%) | 28 (100.0%) |
Employment Characteristics in Oran
Employment by Class of Employer in Oran
Among the 572 employed individuals in Oran, private company employees (427 | 74.7%), not-for-profit organizations (49 | 8.6%), and self-employed (not incorporated) (35 | 6.1%) make up the most common classes of employment.
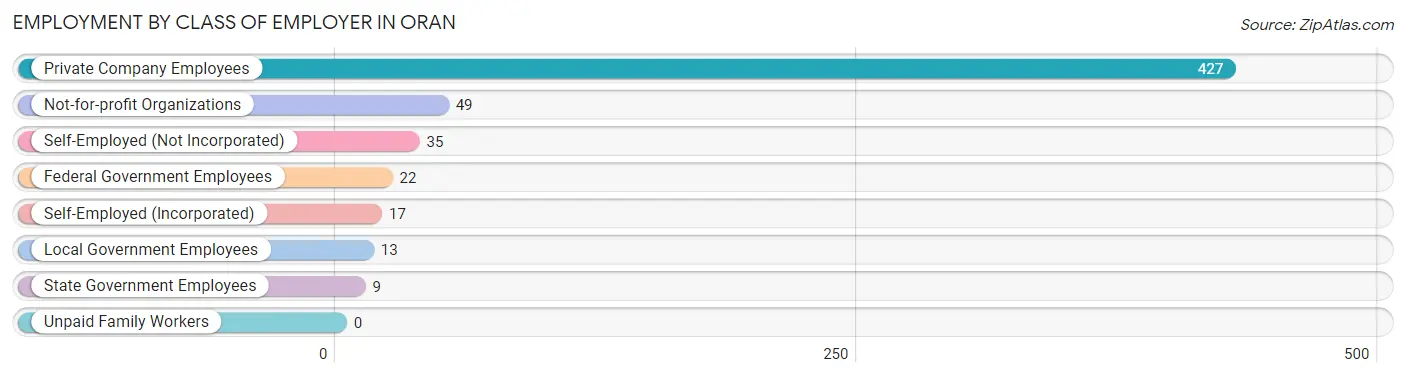
| Employer Class | # Employees | % Employees |
| Private Company Employees | 427 | 74.7% |
| Self-Employed (Incorporated) | 17 | 3.0% |
| Self-Employed (Not Incorporated) | 35 | 6.1% |
| Not-for-profit Organizations | 49 | 8.6% |
| Local Government Employees | 13 | 2.3% |
| State Government Employees | 9 | 1.6% |
| Federal Government Employees | 22 | 3.8% |
| Unpaid Family Workers | 0 | 0.0% |
| Total | 572 | 100.0% |
Employment Status by Age in Oran
According to the labor force statistics for Oran, out of the total population over 16 years of age (938), 67.6% or 634 individuals are in the labor force, with 7.8% or 49 of them unemployed. The age group with the highest labor force participation rate is 25 to 29 years, with 100.0% or 70 individuals in the labor force. Within the labor force, the 20 to 24 years age range has the highest percentage of unemployed individuals, with 62.0% or 31 of them being unemployed.
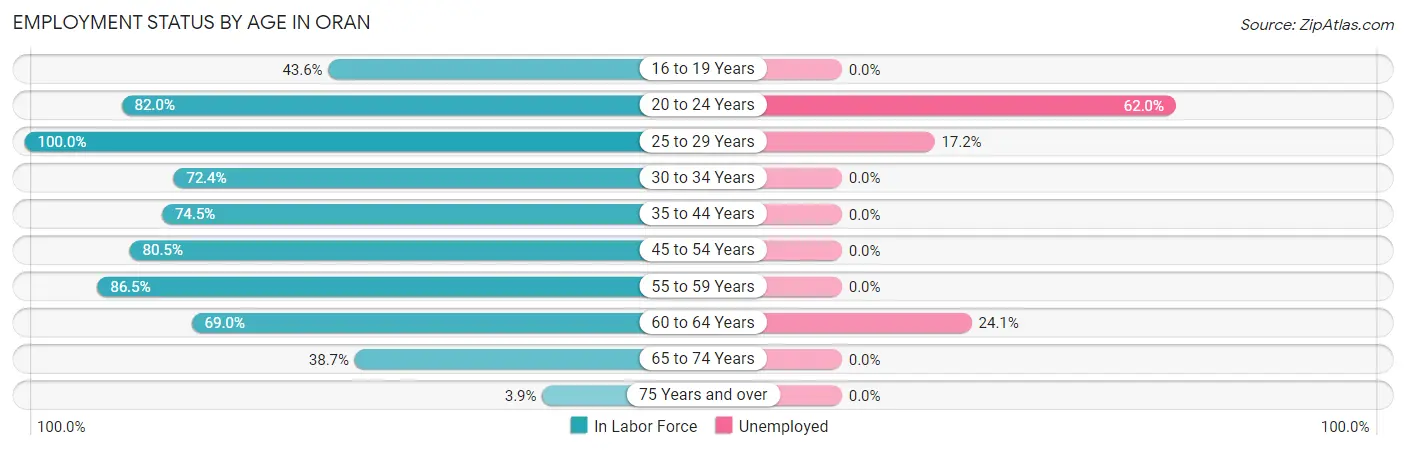
| Age Bracket | In Labor Force | Unemployed |
| 16 to 19 Years | 34 (43.6%) | 0 (0.0%) |
| 20 to 24 Years | 50 (82.0%) | 31 (62.0%) |
| 25 to 29 Years | 70 (100.0%) | 12 (17.2%) |
| 30 to 34 Years | 71 (72.4%) | 0 (0.0%) |
| 35 to 44 Years | 120 (74.5%) | 0 (0.0%) |
| 45 to 54 Years | 120 (80.5%) | 0 (0.0%) |
| 55 to 59 Years | 90 (86.5%) | 0 (0.0%) |
| 60 to 64 Years | 29 (69.0%) | 7 (24.1%) |
| 65 to 74 Years | 48 (38.7%) | 0 (0.0%) |
| 75 Years and over | 2 (3.9%) | 0 (0.0%) |
| Total | 634 (67.6%) | 49 (7.8%) |
Employment Status by Educational Attainment in Oran
According to labor force statistics for Oran, 80.1% of individuals (500) out of the total population between 25 and 64 years of age (624) are in the labor force, with 3.6% or 18 of them being unemployed. The group with the highest labor force participation rate are those with the educational attainment of bachelor's degree or higher, with 90.2% or 83 individuals in the labor force. Within the labor force, individuals with less than high school education have the highest percentage of unemployment, with 10.1% or 7 of them being unemployed.
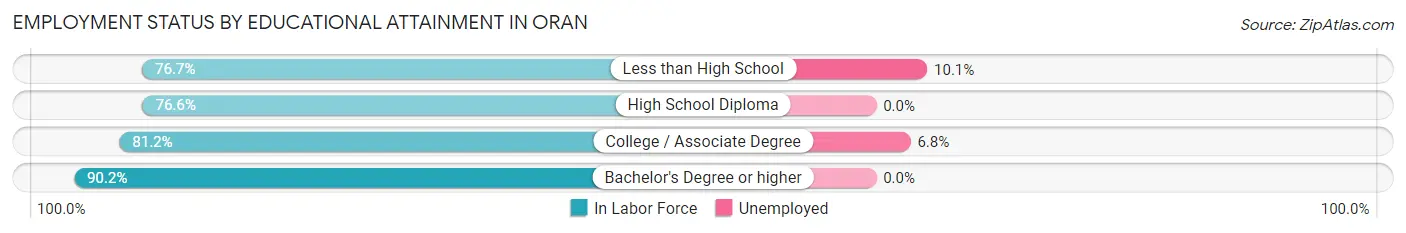
| Educational Attainment | In Labor Force | Unemployed |
| Less than High School | 69 (76.7%) | 9 (10.1%) |
| High School Diploma | 180 (76.6%) | 0 (0.0%) |
| College / Associate Degree | 168 (81.2%) | 14 (6.8%) |
| Bachelor's Degree or higher | 83 (90.2%) | 0 (0.0%) |
| Total | 500 (80.1%) | 22 (3.6%) |
Employment Occupations by Sex in Oran
Management, Business, Science and Arts Occupations
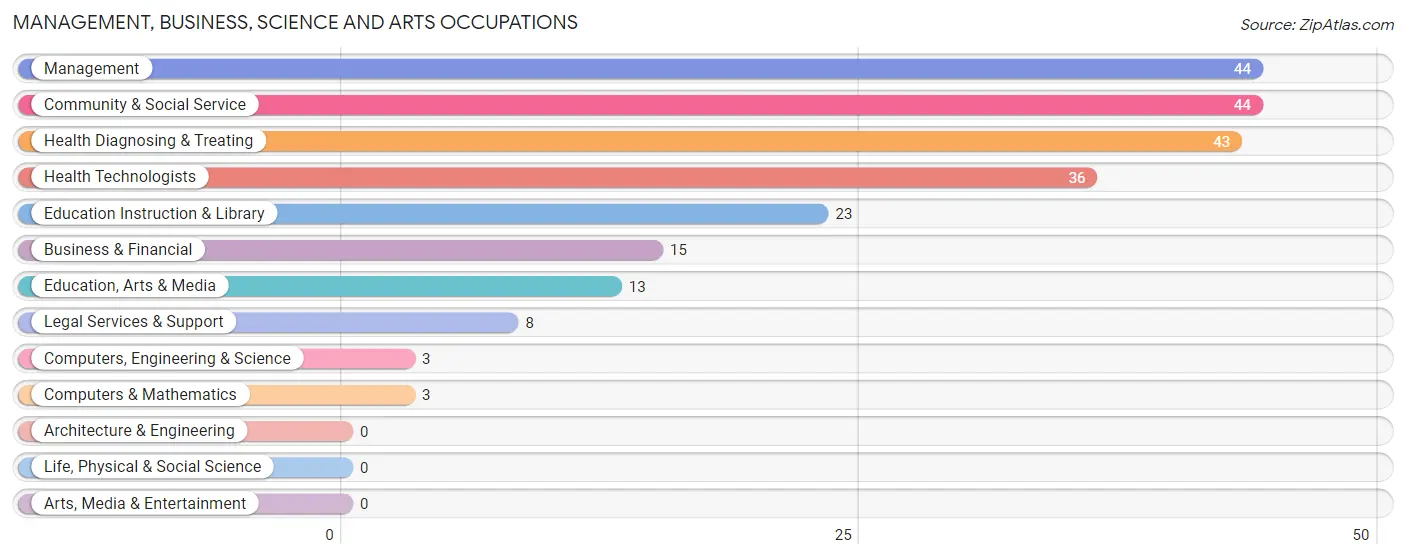
The most common Management, Business, Science and Arts occupations in Oran are Management (44 | 7.6%), Community & Social Service (44 | 7.6%), Health Diagnosing & Treating (43 | 7.4%), Health Technologists (36 | 6.2%), and Education Instruction & Library (23 | 4.0%).
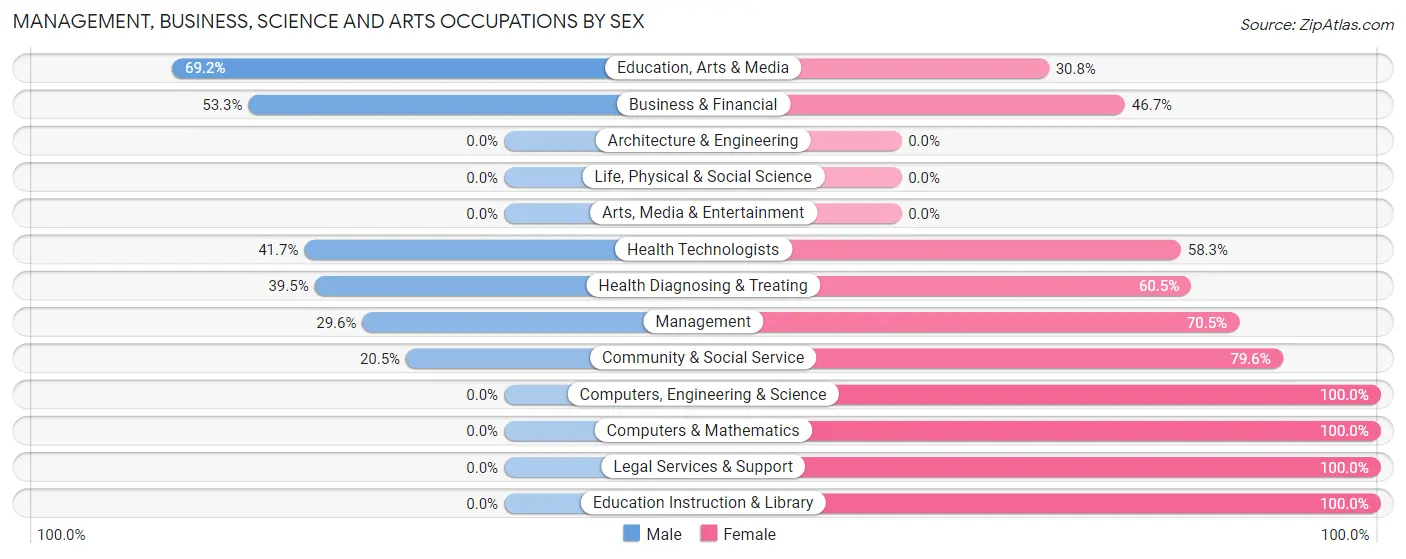
Management, Business, Science and Arts Occupations by Sex
Within the Management, Business, Science and Arts occupations in Oran, the most male-oriented occupations are Education, Arts & Media (69.2%), Business & Financial (53.3%), and Health Technologists (41.7%), while the most female-oriented occupations are Computers, Engineering & Science (100.0%), Computers & Mathematics (100.0%), and Legal Services & Support (100.0%).
| Occupation | Male | Female |
| Management | 13 (29.5%) | 31 (70.5%) |
| Business & Financial | 8 (53.3%) | 7 (46.7%) |
| Computers, Engineering & Science | 0 (0.0%) | 3 (100.0%) |
| Computers & Mathematics | 0 (0.0%) | 3 (100.0%) |
| Architecture & Engineering | 0 (0.0%) | 0 (0.0%) |
| Life, Physical & Social Science | 0 (0.0%) | 0 (0.0%) |
| Community & Social Service | 9 (20.4%) | 35 (79.5%) |
| Education, Arts & Media | 9 (69.2%) | 4 (30.8%) |
| Legal Services & Support | 0 (0.0%) | 8 (100.0%) |
| Education Instruction & Library | 0 (0.0%) | 23 (100.0%) |
| Arts, Media & Entertainment | 0 (0.0%) | 0 (0.0%) |
| Health Diagnosing & Treating | 17 (39.5%) | 26 (60.5%) |
| Health Technologists | 15 (41.7%) | 21 (58.3%) |
| Total (Category) | 47 (31.5%) | 102 (68.5%) |
| Total (Overall) | 273 (47.1%) | 306 (52.8%) |
Services Occupations
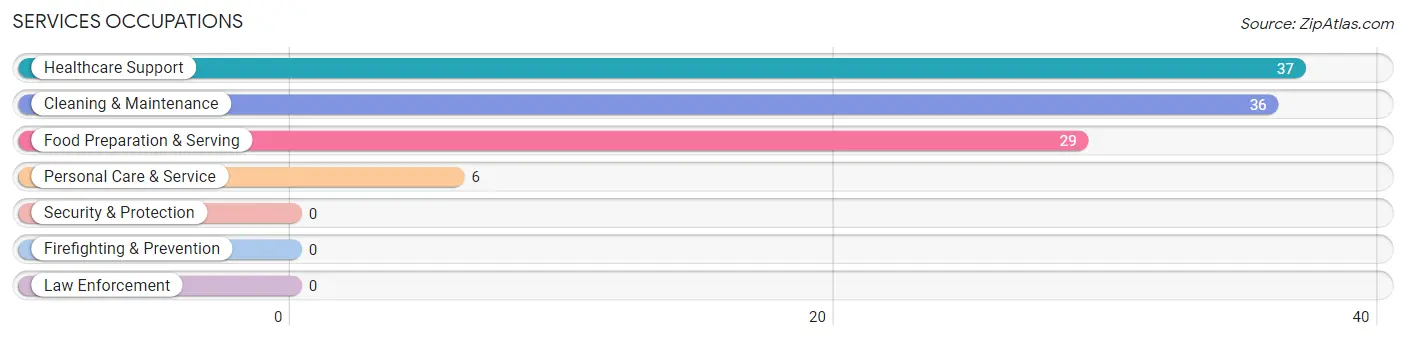
The most common Services occupations in Oran are Healthcare Support (37 | 6.4%), Cleaning & Maintenance (36 | 6.2%), Food Preparation & Serving (29 | 5.0%), and Personal Care & Service (6 | 1.0%).
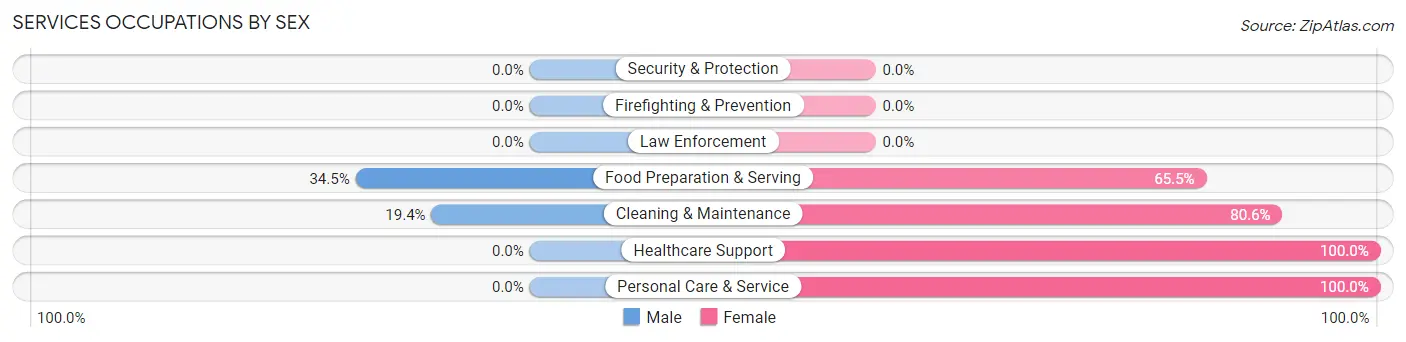
Services Occupations by Sex
Within the Services occupations in Oran, the most male-oriented occupations are Food Preparation & Serving (34.5%), and Cleaning & Maintenance (19.4%), while the most female-oriented occupations are Healthcare Support (100.0%), Personal Care & Service (100.0%), and Cleaning & Maintenance (80.6%).
| Occupation | Male | Female |
| Healthcare Support | 0 (0.0%) | 37 (100.0%) |
| Security & Protection | 0 (0.0%) | 0 (0.0%) |
| Firefighting & Prevention | 0 (0.0%) | 0 (0.0%) |
| Law Enforcement | 0 (0.0%) | 0 (0.0%) |
| Food Preparation & Serving | 10 (34.5%) | 19 (65.5%) |
| Cleaning & Maintenance | 7 (19.4%) | 29 (80.6%) |
| Personal Care & Service | 0 (0.0%) | 6 (100.0%) |
| Total (Category) | 17 (15.7%) | 91 (84.3%) |
| Total (Overall) | 273 (47.1%) | 306 (52.8%) |
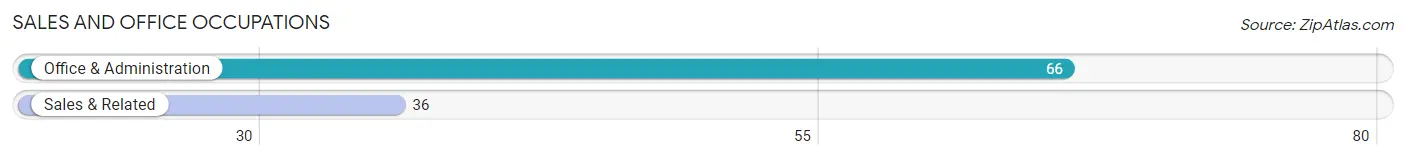
Sales and Office Occupations
The most common Sales and Office occupations in Oran are Office & Administration (66 | 11.4%), and Sales & Related (36 | 6.2%).
Sales and Office Occupations by Sex
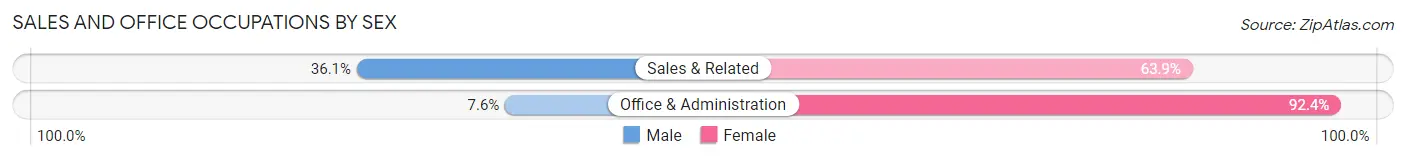
| Occupation | Male | Female |
| Sales & Related | 13 (36.1%) | 23 (63.9%) |
| Office & Administration | 5 (7.6%) | 61 (92.4%) |
| Total (Category) | 18 (17.6%) | 84 (82.4%) |
| Total (Overall) | 273 (47.1%) | 306 (52.8%) |
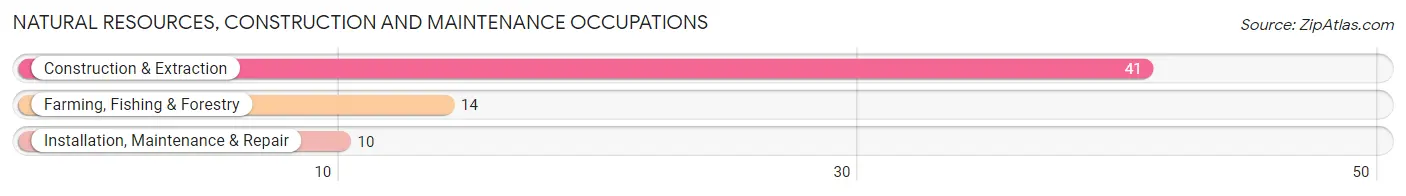
Natural Resources, Construction and Maintenance Occupations
The most common Natural Resources, Construction and Maintenance occupations in Oran are Construction & Extraction (41 | 7.1%), Farming, Fishing & Forestry (14 | 2.4%), and Installation, Maintenance & Repair (10 | 1.7%).
Natural Resources, Construction and Maintenance Occupations by Sex
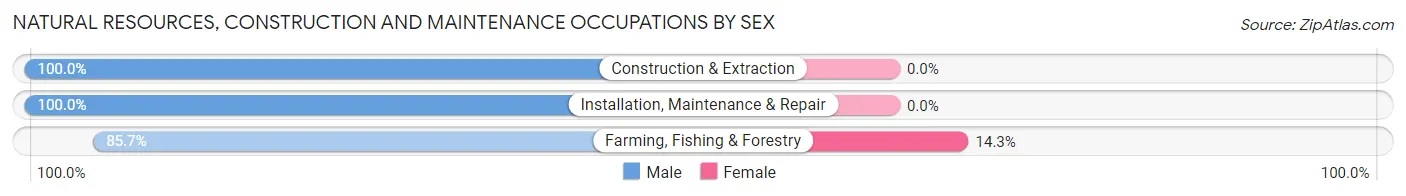
| Occupation | Male | Female |
| Farming, Fishing & Forestry | 12 (85.7%) | 2 (14.3%) |
| Construction & Extraction | 41 (100.0%) | 0 (0.0%) |
| Installation, Maintenance & Repair | 10 (100.0%) | 0 (0.0%) |
| Total (Category) | 63 (96.9%) | 2 (3.1%) |
| Total (Overall) | 273 (47.1%) | 306 (52.8%) |
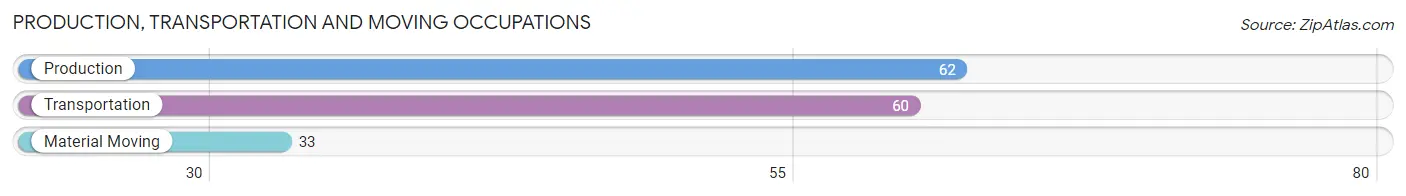
Production, Transportation and Moving Occupations
The most common Production, Transportation and Moving occupations in Oran are Production (62 | 10.7%), Transportation (60 | 10.4%), and Material Moving (33 | 5.7%).
Production, Transportation and Moving Occupations by Sex
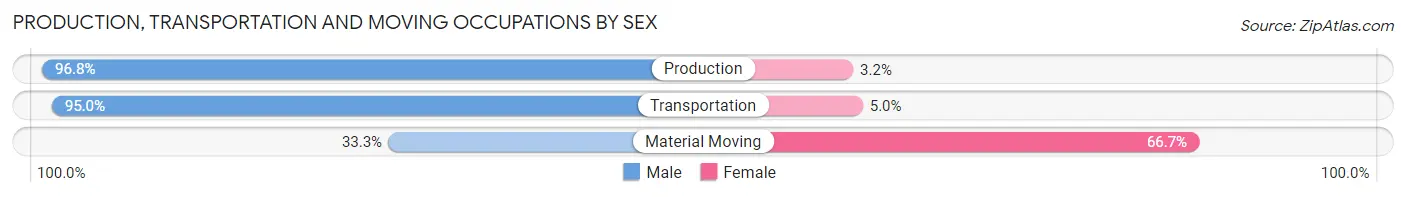
| Occupation | Male | Female |
| Production | 60 (96.8%) | 2 (3.2%) |
| Transportation | 57 (95.0%) | 3 (5.0%) |
| Material Moving | 11 (33.3%) | 22 (66.7%) |
| Total (Category) | 128 (82.6%) | 27 (17.4%) |
| Total (Overall) | 273 (47.1%) | 306 (52.8%) |
Employment Industries by Sex in Oran
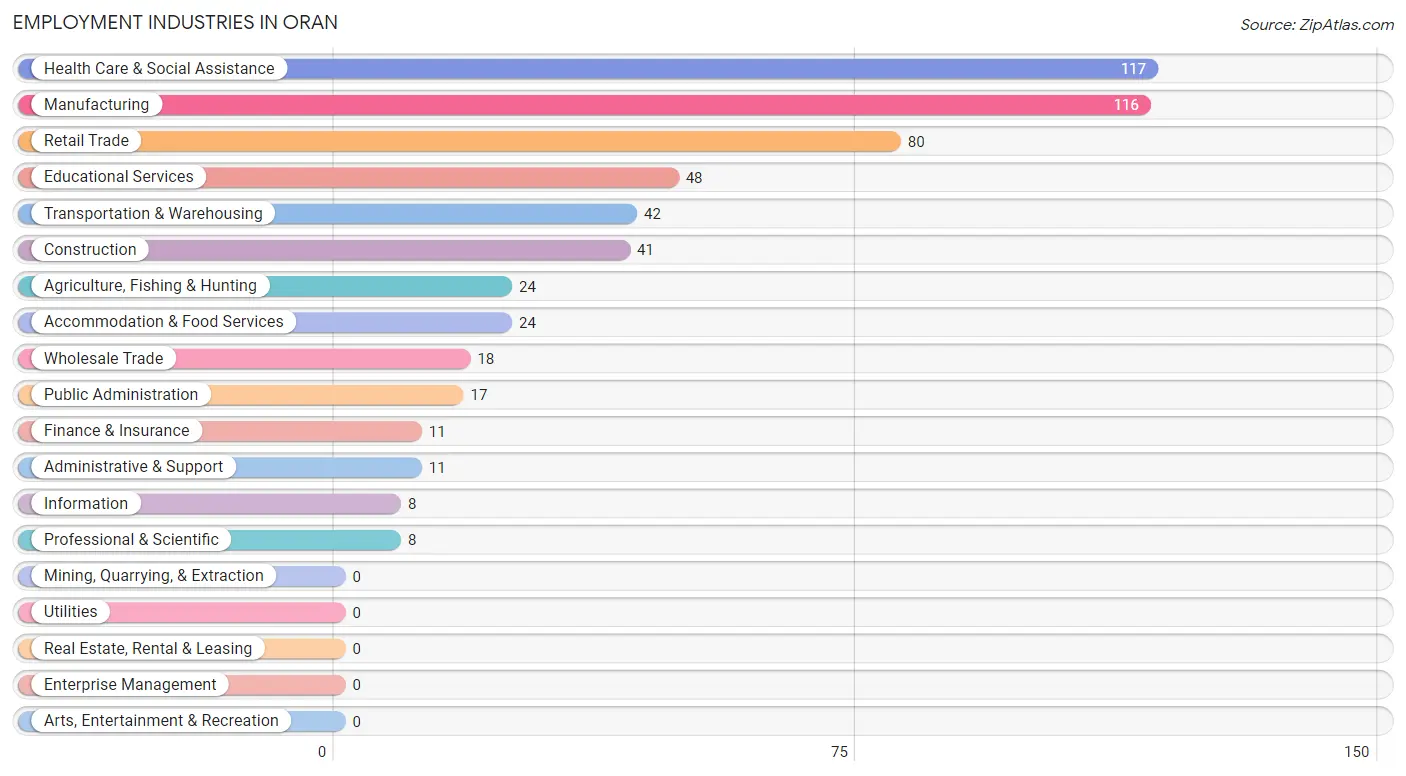
Employment Industries in Oran
The major employment industries in Oran include Health Care & Social Assistance (117 | 20.2%), Manufacturing (116 | 20.0%), Retail Trade (80 | 13.8%), Educational Services (48 | 8.3%), and Transportation & Warehousing (42 | 7.2%).
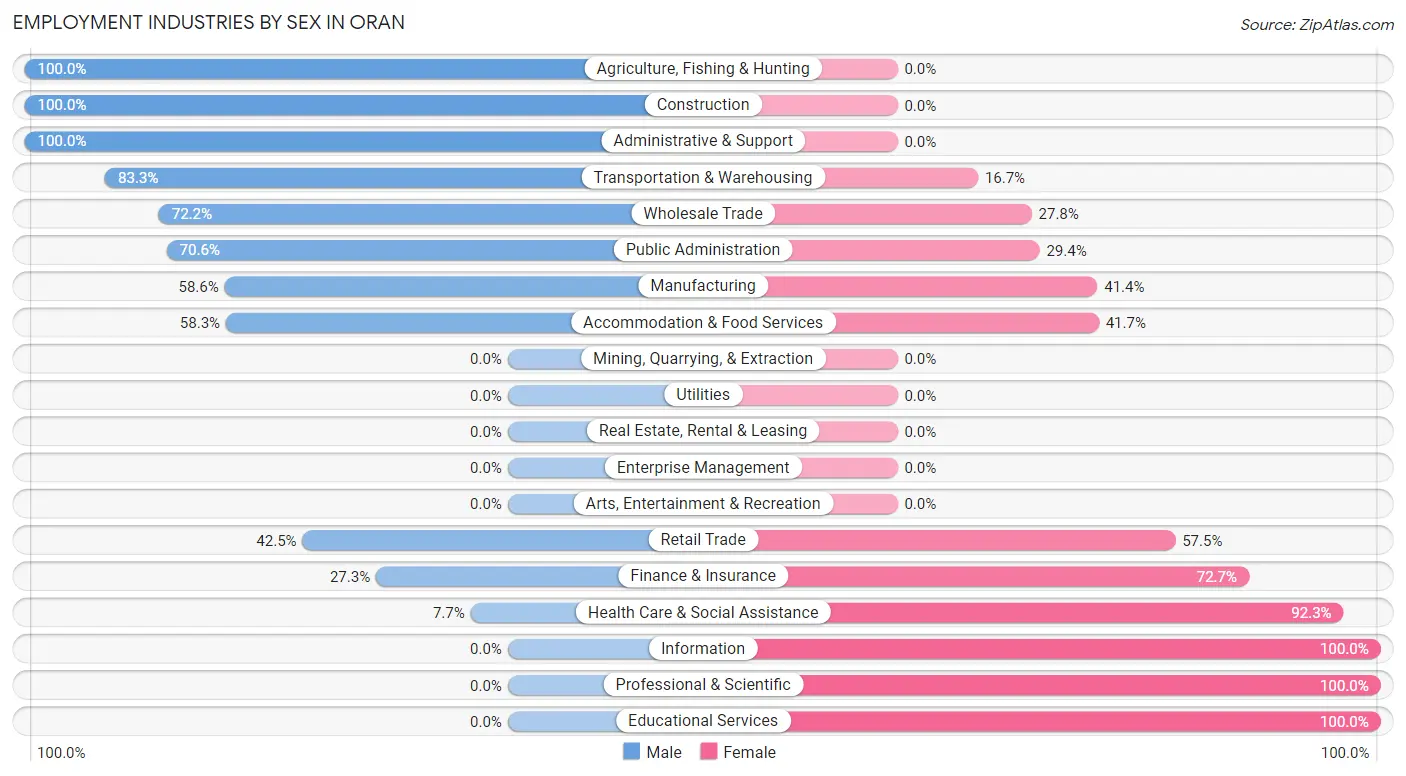
Employment Industries by Sex in Oran
The Oran industries that see more men than women are Agriculture, Fishing & Hunting (100.0%), Construction (100.0%), and Administrative & Support (100.0%), whereas the industries that tend to have a higher number of women are Information (100.0%), Professional & Scientific (100.0%), and Educational Services (100.0%).
| Industry | Male | Female |
| Agriculture, Fishing & Hunting | 24 (100.0%) | 0 (0.0%) |
| Mining, Quarrying, & Extraction | 0 (0.0%) | 0 (0.0%) |
| Construction | 41 (100.0%) | 0 (0.0%) |
| Manufacturing | 68 (58.6%) | 48 (41.4%) |
| Wholesale Trade | 13 (72.2%) | 5 (27.8%) |
| Retail Trade | 34 (42.5%) | 46 (57.5%) |
| Transportation & Warehousing | 35 (83.3%) | 7 (16.7%) |
| Utilities | 0 (0.0%) | 0 (0.0%) |
| Information | 0 (0.0%) | 8 (100.0%) |
| Finance & Insurance | 3 (27.3%) | 8 (72.7%) |
| Real Estate, Rental & Leasing | 0 (0.0%) | 0 (0.0%) |
| Professional & Scientific | 0 (0.0%) | 8 (100.0%) |
| Enterprise Management | 0 (0.0%) | 0 (0.0%) |
| Administrative & Support | 11 (100.0%) | 0 (0.0%) |
| Educational Services | 0 (0.0%) | 48 (100.0%) |
| Health Care & Social Assistance | 9 (7.7%) | 108 (92.3%) |
| Arts, Entertainment & Recreation | 0 (0.0%) | 0 (0.0%) |
| Accommodation & Food Services | 14 (58.3%) | 10 (41.7%) |
| Public Administration | 12 (70.6%) | 5 (29.4%) |
| Total | 273 (47.1%) | 306 (52.8%) |
Education in Oran
School Enrollment in Oran
The most common levels of schooling among the 243 students in Oran are high school (87 | 35.8%), middle school (63 | 25.9%), and elementary school (62 | 25.5%).
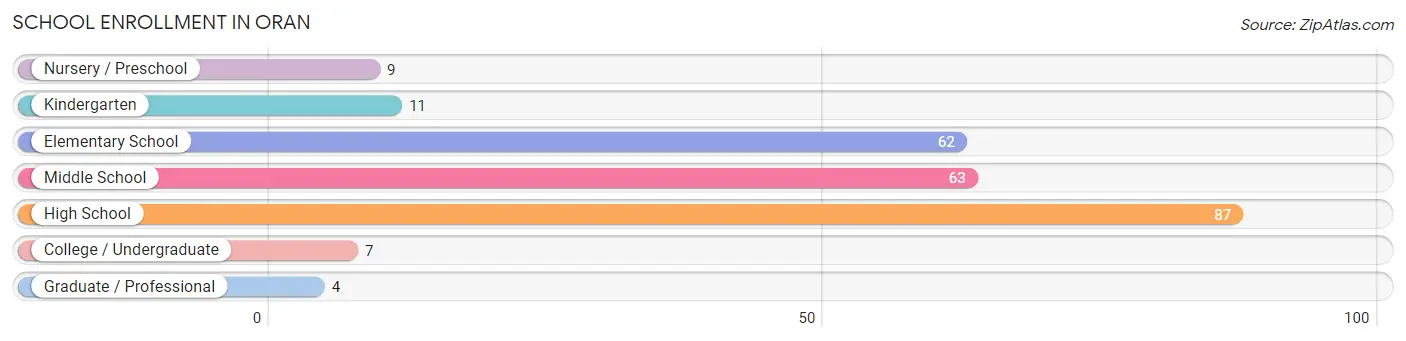
| School Level | # Students | % Students |
| Nursery / Preschool | 9 | 3.7% |
| Kindergarten | 11 | 4.5% |
| Elementary School | 62 | 25.5% |
| Middle School | 63 | 25.9% |
| High School | 87 | 35.8% |
| College / Undergraduate | 7 | 2.9% |
| Graduate / Professional | 4 | 1.7% |
| Total | 243 | 100.0% |
School Enrollment by Age by Funding Source in Oran
Out of a total of 243 students who are enrolled in schools in Oran, 8 (3.3%) attend a private institution, while the remaining 235 (96.7%) are enrolled in public schools. The age group of 10 to 14 year olds has the highest likelihood of being enrolled in private schools, with 8 (10.1% in the age bracket) enrolled. Conversely, the age group of 3 to 4 year olds has the lowest likelihood of being enrolled in a private school, with 9 (100.0% in the age bracket) attending a public institution.
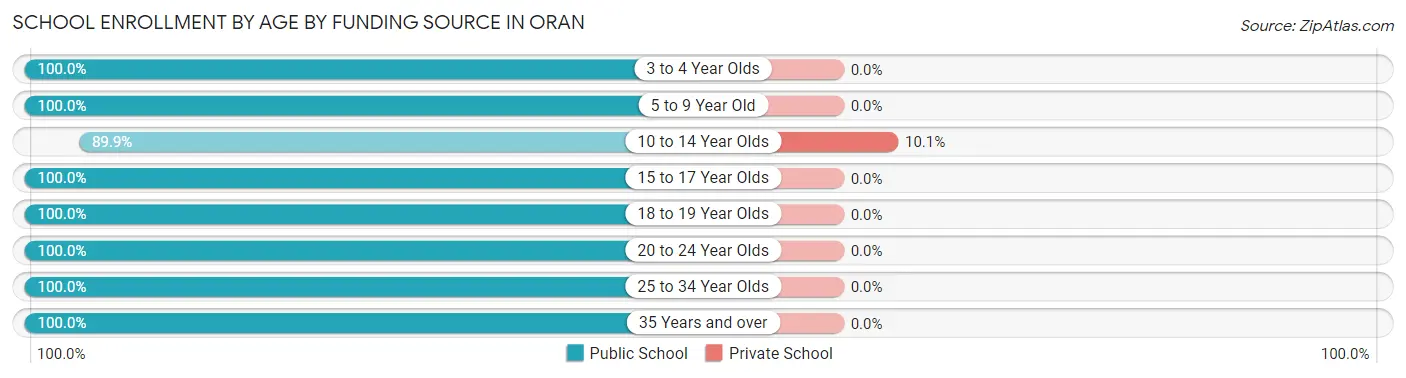
| Age Bracket | Public School | Private School |
| 3 to 4 Year Olds | 9 (100.0%) | 0 (0.0%) |
| 5 to 9 Year Old | 71 (100.0%) | 0 (0.0%) |
| 10 to 14 Year Olds | 71 (89.9%) | 8 (10.1%) |
| 15 to 17 Year Olds | 50 (100.0%) | 0 (0.0%) |
| 18 to 19 Year Olds | 23 (100.0%) | 0 (0.0%) |
| 20 to 24 Year Olds | 4 (100.0%) | 0 (0.0%) |
| 25 to 34 Year Olds | 3 (100.0%) | 0 (0.0%) |
| 35 Years and over | 4 (100.0%) | 0 (0.0%) |
| Total | 235 (96.7%) | 8 (3.3%) |
Educational Attainment by Field of Study in Oran
Education (30 | 25.4%), business (28 | 23.7%), science & technology (26 | 22.0%), psychology (11 | 9.3%), and bio, nature & agricultural (7 | 5.9%) are the most common fields of study among 118 individuals in Oran who have obtained a bachelor's degree or higher.
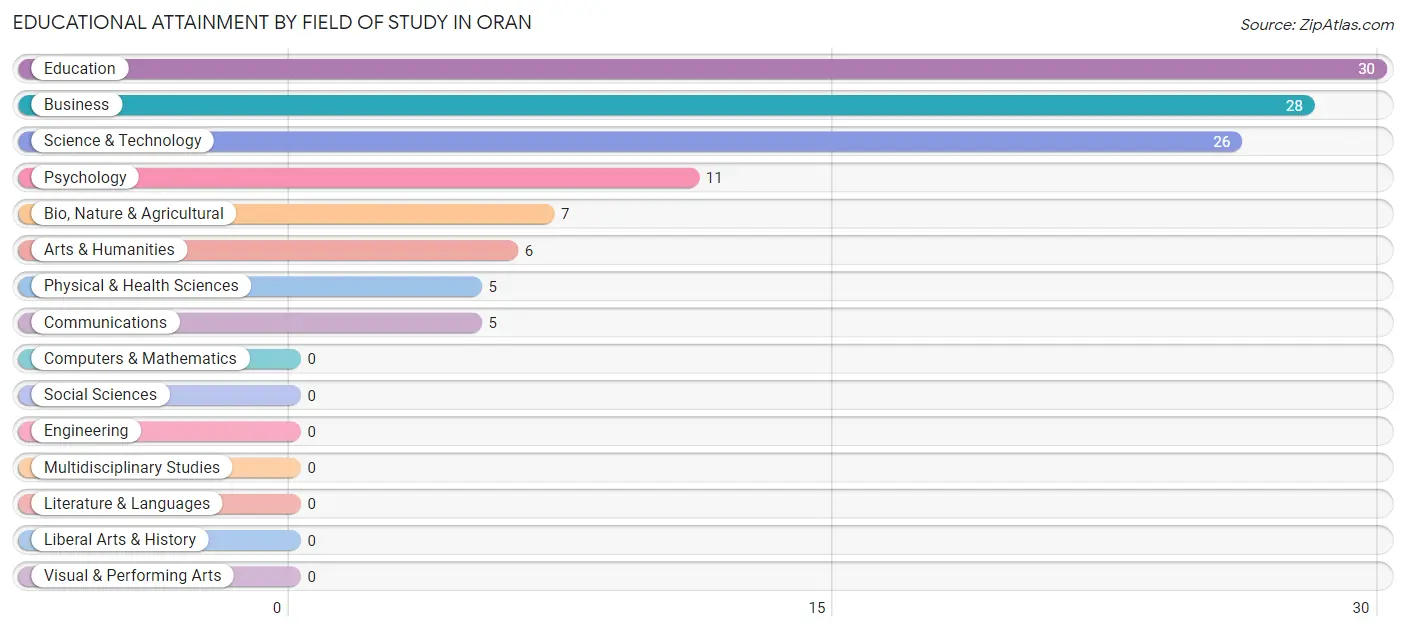
| Field of Study | # Graduates | % Graduates |
| Computers & Mathematics | 0 | 0.0% |
| Bio, Nature & Agricultural | 7 | 5.9% |
| Physical & Health Sciences | 5 | 4.2% |
| Psychology | 11 | 9.3% |
| Social Sciences | 0 | 0.0% |
| Engineering | 0 | 0.0% |
| Multidisciplinary Studies | 0 | 0.0% |
| Science & Technology | 26 | 22.0% |
| Business | 28 | 23.7% |
| Education | 30 | 25.4% |
| Literature & Languages | 0 | 0.0% |
| Liberal Arts & History | 0 | 0.0% |
| Visual & Performing Arts | 0 | 0.0% |
| Communications | 5 | 4.2% |
| Arts & Humanities | 6 | 5.1% |
| Total | 118 | 100.0% |
Transportation & Commute in Oran
Vehicle Availability by Sex in Oran
The most prevalent vehicle ownership categories in Oran are males with 2 vehicles (132, accounting for 47.3%) and females with 2 vehicles (133, making up 45.1%).
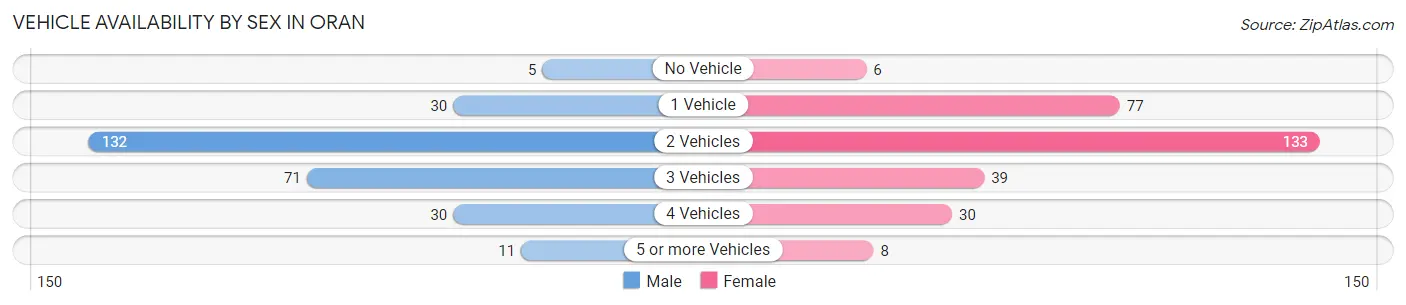
| Vehicles Available | Male | Female |
| No Vehicle | 5 (1.8%) | 6 (2.1%) |
| 1 Vehicle | 30 (10.7%) | 77 (26.3%) |
| 2 Vehicles | 132 (47.3%) | 133 (45.4%) |
| 3 Vehicles | 71 (25.5%) | 39 (13.3%) |
| 4 Vehicles | 30 (10.7%) | 30 (10.2%) |
| 5 or more Vehicles | 11 (3.9%) | 8 (2.7%) |
| Total | 279 (100.0%) | 293 (100.0%) |
Commute Time in Oran
The most frequently occuring commute durations in Oran are 30 to 34 minutes (144 commuters, 26.8%), 25 to 29 minutes (113 commuters, 21.0%), and less than 5 minutes (74 commuters, 13.8%).
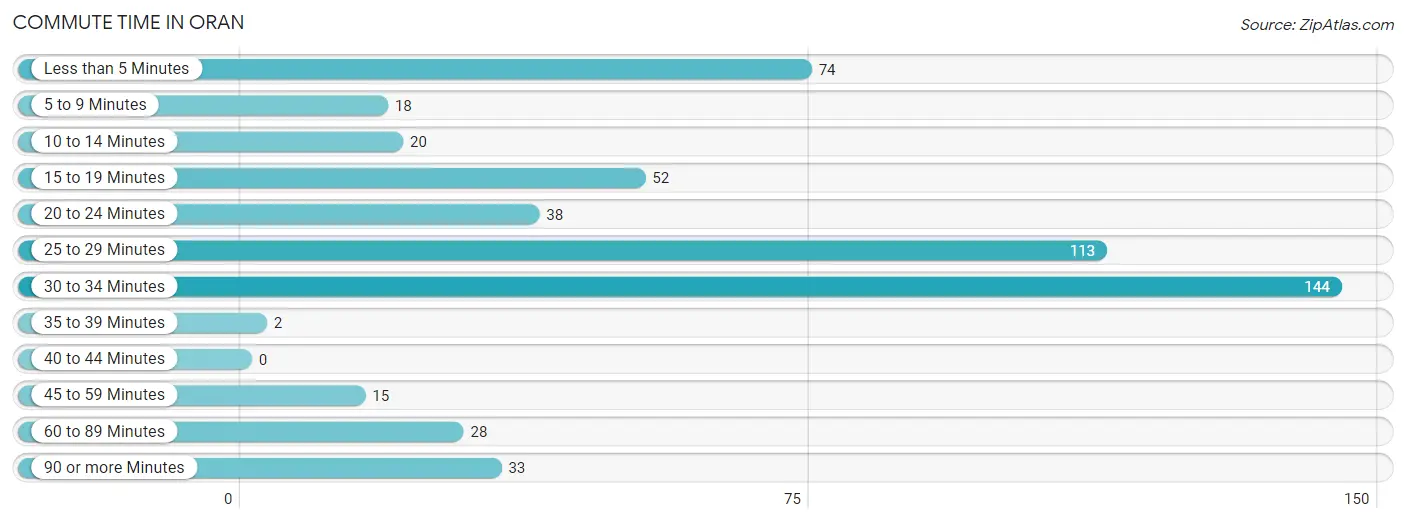
| Commute Time | # Commuters | % Commuters |
| Less than 5 Minutes | 74 | 13.8% |
| 5 to 9 Minutes | 18 | 3.4% |
| 10 to 14 Minutes | 20 | 3.7% |
| 15 to 19 Minutes | 52 | 9.7% |
| 20 to 24 Minutes | 38 | 7.1% |
| 25 to 29 Minutes | 113 | 21.0% |
| 30 to 34 Minutes | 144 | 26.8% |
| 35 to 39 Minutes | 2 | 0.4% |
| 40 to 44 Minutes | 0 | 0.0% |
| 45 to 59 Minutes | 15 | 2.8% |
| 60 to 89 Minutes | 28 | 5.2% |
| 90 or more Minutes | 33 | 6.1% |
Commute Time by Sex in Oran
The most common commute times in Oran are 30 to 34 minutes (77 commuters, 29.4%) for males and 30 to 34 minutes (67 commuters, 24.4%) for females.
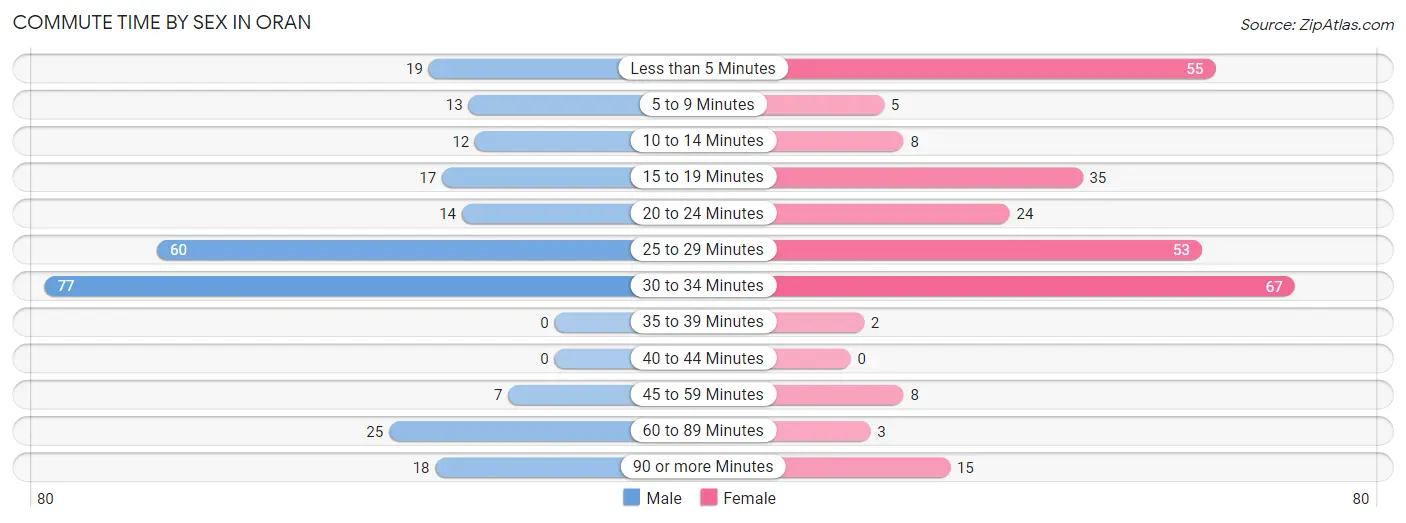
| Commute Time | Male | Female |
| Less than 5 Minutes | 19 (7.2%) | 55 (20.0%) |
| 5 to 9 Minutes | 13 (5.0%) | 5 (1.8%) |
| 10 to 14 Minutes | 12 (4.6%) | 8 (2.9%) |
| 15 to 19 Minutes | 17 (6.5%) | 35 (12.7%) |
| 20 to 24 Minutes | 14 (5.3%) | 24 (8.7%) |
| 25 to 29 Minutes | 60 (22.9%) | 53 (19.3%) |
| 30 to 34 Minutes | 77 (29.4%) | 67 (24.4%) |
| 35 to 39 Minutes | 0 (0.0%) | 2 (0.7%) |
| 40 to 44 Minutes | 0 (0.0%) | 0 (0.0%) |
| 45 to 59 Minutes | 7 (2.7%) | 8 (2.9%) |
| 60 to 89 Minutes | 25 (9.5%) | 3 (1.1%) |
| 90 or more Minutes | 18 (6.9%) | 15 (5.4%) |
Time of Departure to Work by Sex in Oran
The most frequent times of departure to work in Oran are 5:30 AM to 5:59 AM (47, 17.9%) for males and 7:30 AM to 7:59 AM (92, 33.5%) for females.
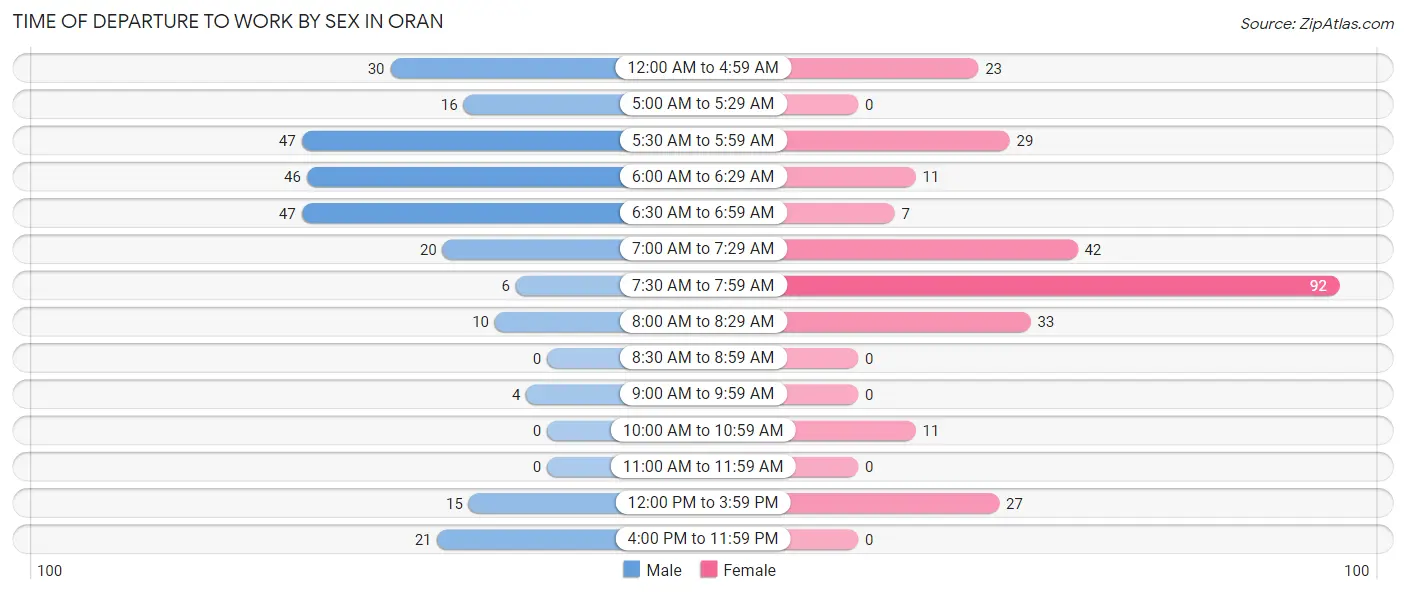
| Time of Departure | Male | Female |
| 12:00 AM to 4:59 AM | 30 (11.5%) | 23 (8.4%) |
| 5:00 AM to 5:29 AM | 16 (6.1%) | 0 (0.0%) |
| 5:30 AM to 5:59 AM | 47 (17.9%) | 29 (10.5%) |
| 6:00 AM to 6:29 AM | 46 (17.6%) | 11 (4.0%) |
| 6:30 AM to 6:59 AM | 47 (17.9%) | 7 (2.5%) |
| 7:00 AM to 7:29 AM | 20 (7.6%) | 42 (15.3%) |
| 7:30 AM to 7:59 AM | 6 (2.3%) | 92 (33.5%) |
| 8:00 AM to 8:29 AM | 10 (3.8%) | 33 (12.0%) |
| 8:30 AM to 8:59 AM | 0 (0.0%) | 0 (0.0%) |
| 9:00 AM to 9:59 AM | 4 (1.5%) | 0 (0.0%) |
| 10:00 AM to 10:59 AM | 0 (0.0%) | 11 (4.0%) |
| 11:00 AM to 11:59 AM | 0 (0.0%) | 0 (0.0%) |
| 12:00 PM to 3:59 PM | 15 (5.7%) | 27 (9.8%) |
| 4:00 PM to 11:59 PM | 21 (8.0%) | 0 (0.0%) |
| Total | 262 (100.0%) | 275 (100.0%) |
Housing Occupancy in Oran
Occupancy by Ownership in Oran
Of the total 452 dwellings in Oran, owner-occupied units account for 269 (59.5%), while renter-occupied units make up 183 (40.5%).
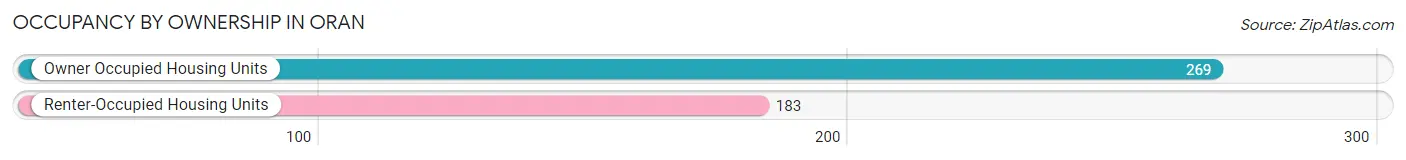
| Occupancy | # Housing Units | % Housing Units |
| Owner Occupied Housing Units | 269 | 59.5% |
| Renter-Occupied Housing Units | 183 | 40.5% |
| Total Occupied Housing Units | 452 | 100.0% |
Occupancy by Household Size in Oran
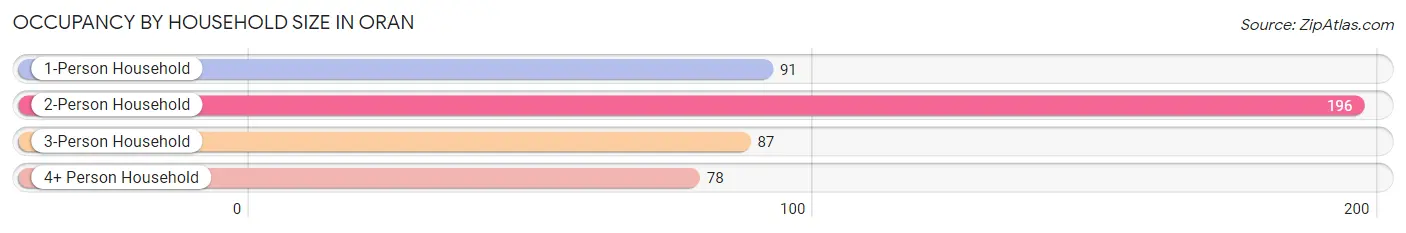
| Household Size | # Housing Units | % Housing Units |
| 1-Person Household | 91 | 20.1% |
| 2-Person Household | 196 | 43.4% |
| 3-Person Household | 87 | 19.3% |
| 4+ Person Household | 78 | 17.3% |
| Total Housing Units | 452 | 100.0% |
Occupancy by Ownership by Household Size in Oran
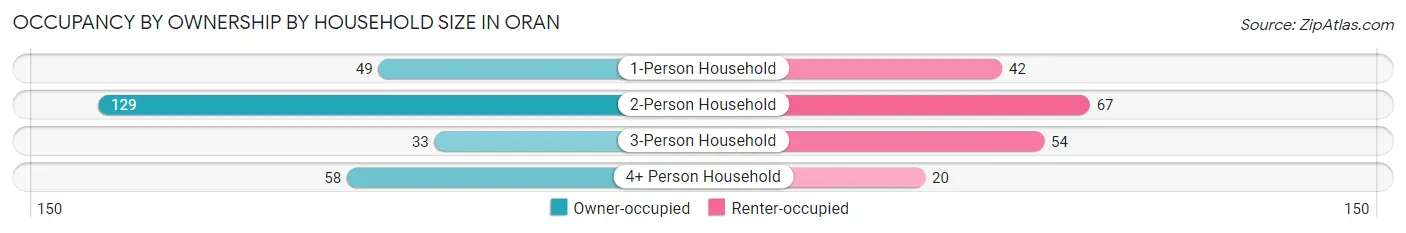
| Household Size | Owner-occupied | Renter-occupied |
| 1-Person Household | 49 (53.8%) | 42 (46.2%) |
| 2-Person Household | 129 (65.8%) | 67 (34.2%) |
| 3-Person Household | 33 (37.9%) | 54 (62.1%) |
| 4+ Person Household | 58 (74.4%) | 20 (25.6%) |
| Total Housing Units | 269 (59.5%) | 183 (40.5%) |
Occupancy by Educational Attainment in Oran
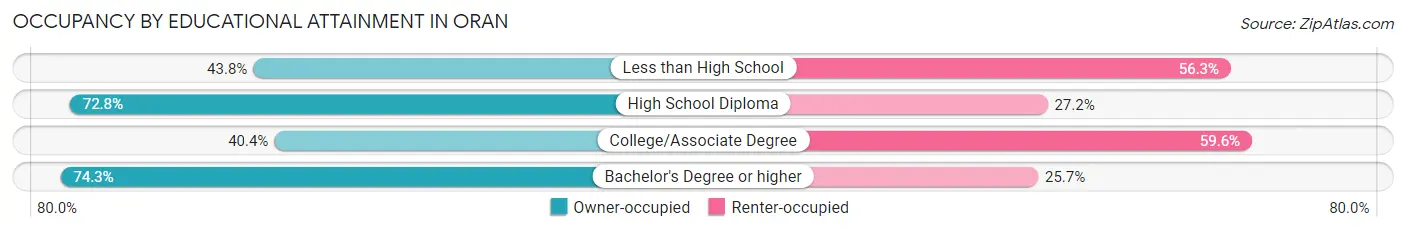
| Household Size | Owner-occupied | Renter-occupied |
| Less than High School | 21 (43.8%) | 27 (56.2%) |
| High School Diploma | 134 (72.8%) | 50 (27.2%) |
| College/Associate Degree | 59 (40.4%) | 87 (59.6%) |
| Bachelor's Degree or higher | 55 (74.3%) | 19 (25.7%) |
Occupancy by Age of Householder in Oran
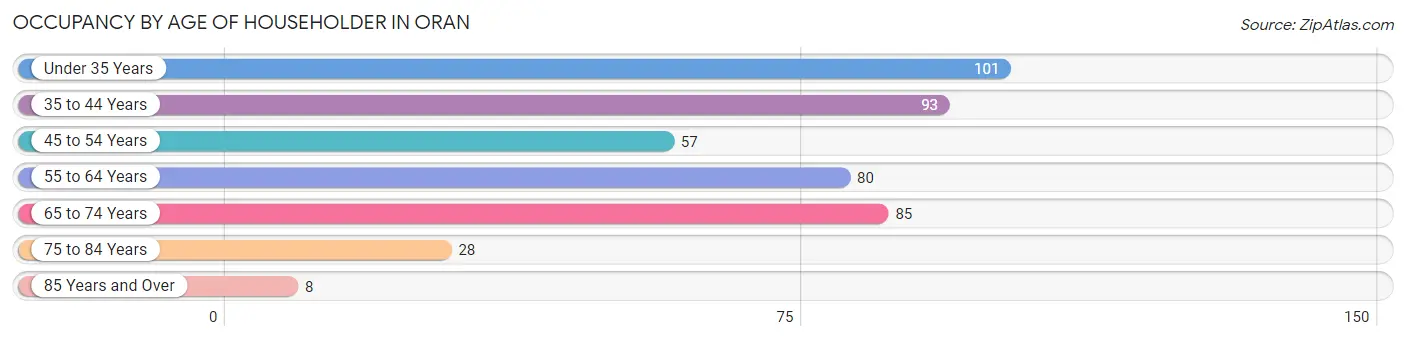
| Age Bracket | # Households | % Households |
| Under 35 Years | 101 | 22.4% |
| 35 to 44 Years | 93 | 20.6% |
| 45 to 54 Years | 57 | 12.6% |
| 55 to 64 Years | 80 | 17.7% |
| 65 to 74 Years | 85 | 18.8% |
| 75 to 84 Years | 28 | 6.2% |
| 85 Years and Over | 8 | 1.8% |
| Total | 452 | 100.0% |
Housing Finances in Oran
Median Income by Occupancy in Oran
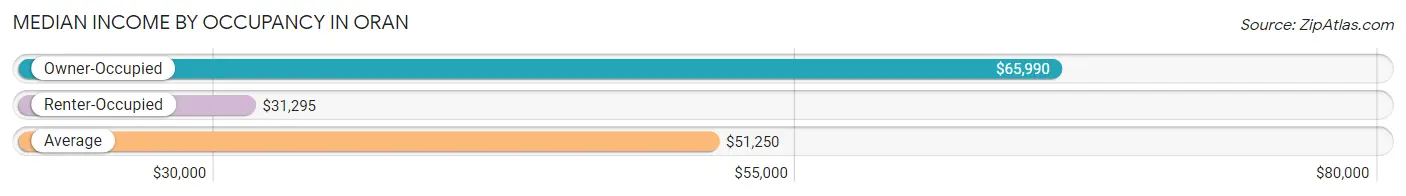
| Occupancy Type | # Households | Median Income |
| Owner-Occupied | 269 (59.5%) | $65,990 |
| Renter-Occupied | 183 (40.5%) | $31,295 |
| Average | 452 (100.0%) | $51,250 |
Occupancy by Householder Income Bracket in Oran
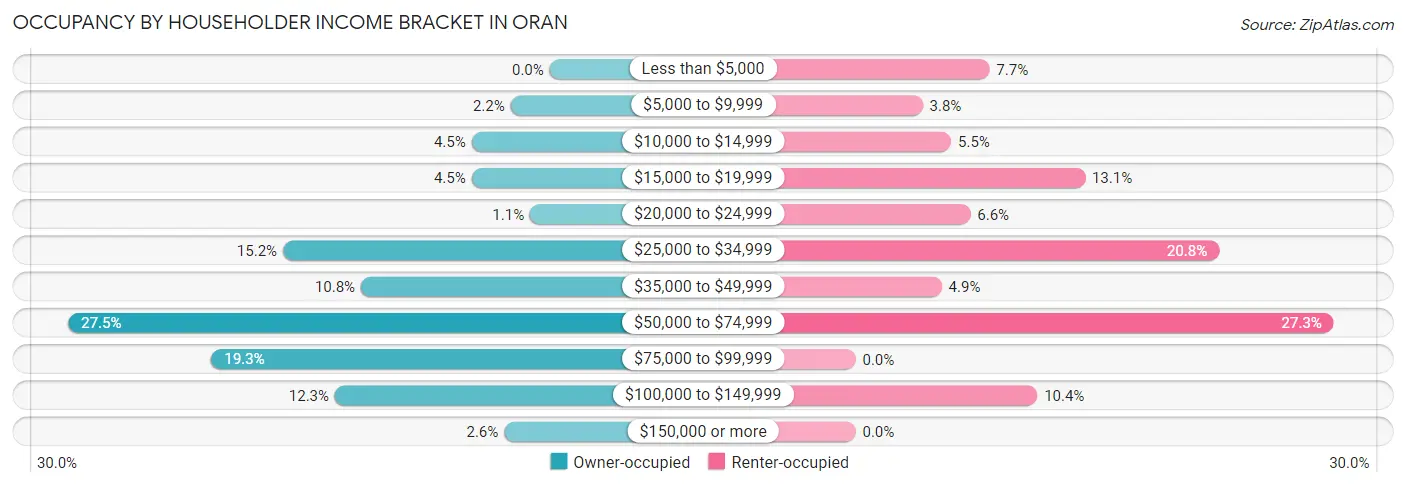
| Income Bracket | Owner-occupied | Renter-occupied |
| Less than $5,000 | 0 (0.0%) | 14 (7.6%) |
| $5,000 to $9,999 | 6 (2.2%) | 7 (3.8%) |
| $10,000 to $14,999 | 12 (4.5%) | 10 (5.5%) |
| $15,000 to $19,999 | 12 (4.5%) | 24 (13.1%) |
| $20,000 to $24,999 | 3 (1.1%) | 12 (6.6%) |
| $25,000 to $34,999 | 41 (15.2%) | 38 (20.8%) |
| $35,000 to $49,999 | 29 (10.8%) | 9 (4.9%) |
| $50,000 to $74,999 | 74 (27.5%) | 50 (27.3%) |
| $75,000 to $99,999 | 52 (19.3%) | 0 (0.0%) |
| $100,000 to $149,999 | 33 (12.3%) | 19 (10.4%) |
| $150,000 or more | 7 (2.6%) | 0 (0.0%) |
| Total | 269 (100.0%) | 183 (100.0%) |
Monthly Housing Cost Tiers in Oran
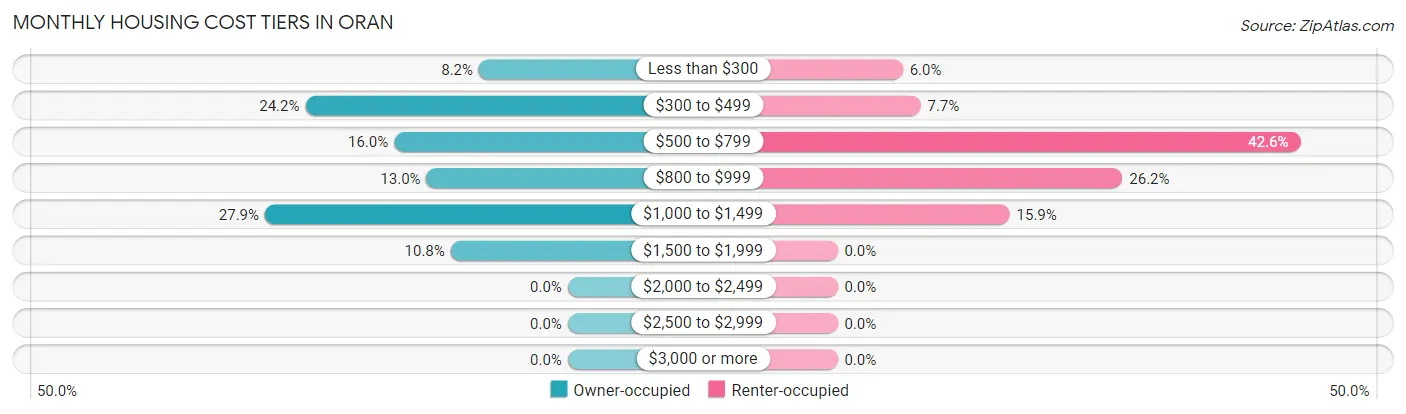
| Monthly Cost | Owner-occupied | Renter-occupied |
| Less than $300 | 22 (8.2%) | 11 (6.0%) |
| $300 to $499 | 65 (24.2%) | 14 (7.6%) |
| $500 to $799 | 43 (16.0%) | 78 (42.6%) |
| $800 to $999 | 35 (13.0%) | 48 (26.2%) |
| $1,000 to $1,499 | 75 (27.9%) | 29 (15.9%) |
| $1,500 to $1,999 | 29 (10.8%) | 0 (0.0%) |
| $2,000 to $2,499 | 0 (0.0%) | 0 (0.0%) |
| $2,500 to $2,999 | 0 (0.0%) | 0 (0.0%) |
| $3,000 or more | 0 (0.0%) | 0 (0.0%) |
| Total | 269 (100.0%) | 183 (100.0%) |
Physical Housing Characteristics in Oran
Housing Structures in Oran
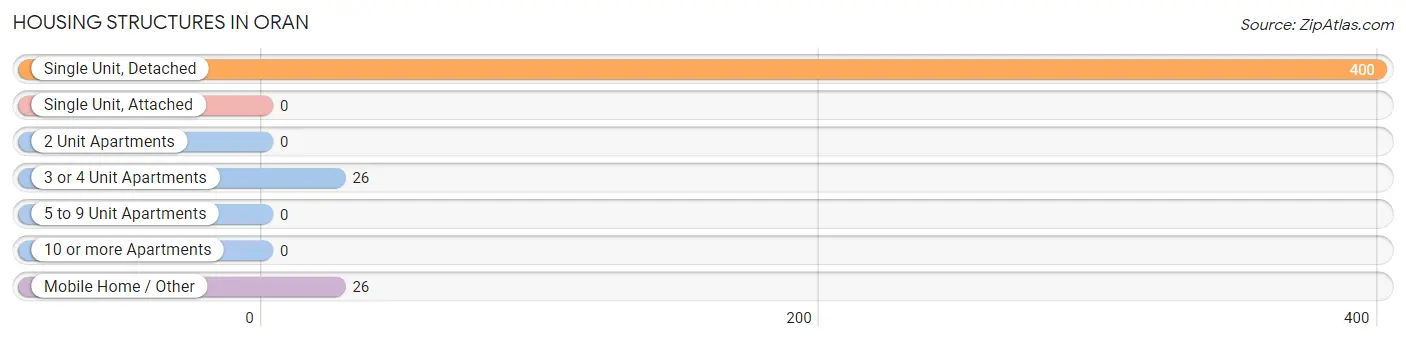
| Structure Type | # Housing Units | % Housing Units |
| Single Unit, Detached | 400 | 88.5% |
| Single Unit, Attached | 0 | 0.0% |
| 2 Unit Apartments | 0 | 0.0% |
| 3 or 4 Unit Apartments | 26 | 5.8% |
| 5 to 9 Unit Apartments | 0 | 0.0% |
| 10 or more Apartments | 0 | 0.0% |
| Mobile Home / Other | 26 | 5.8% |
| Total | 452 | 100.0% |
Housing Structures by Occupancy in Oran
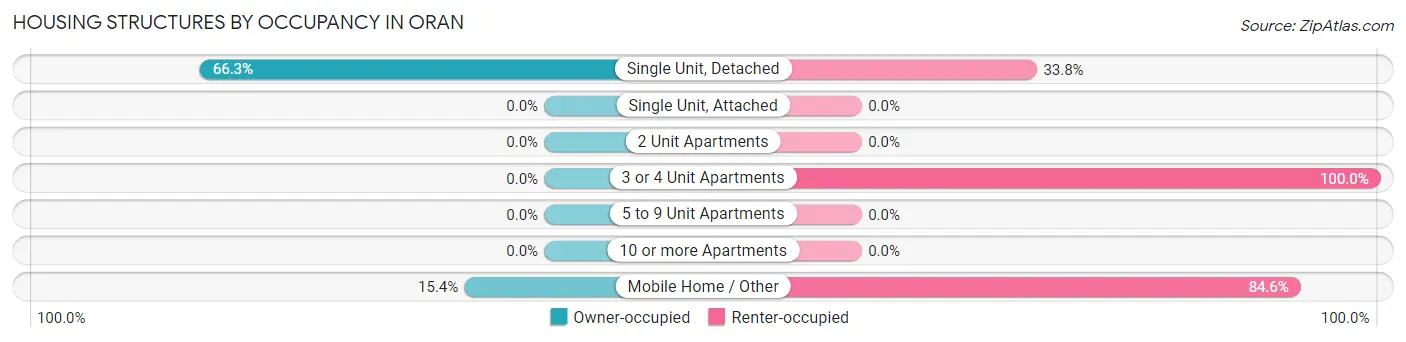
| Structure Type | Owner-occupied | Renter-occupied |
| Single Unit, Detached | 265 (66.2%) | 135 (33.8%) |
| Single Unit, Attached | 0 (0.0%) | 0 (0.0%) |
| 2 Unit Apartments | 0 (0.0%) | 0 (0.0%) |
| 3 or 4 Unit Apartments | 0 (0.0%) | 26 (100.0%) |
| 5 to 9 Unit Apartments | 0 (0.0%) | 0 (0.0%) |
| 10 or more Apartments | 0 (0.0%) | 0 (0.0%) |
| Mobile Home / Other | 4 (15.4%) | 22 (84.6%) |
| Total | 269 (59.5%) | 183 (40.5%) |
Housing Structures by Number of Rooms in Oran
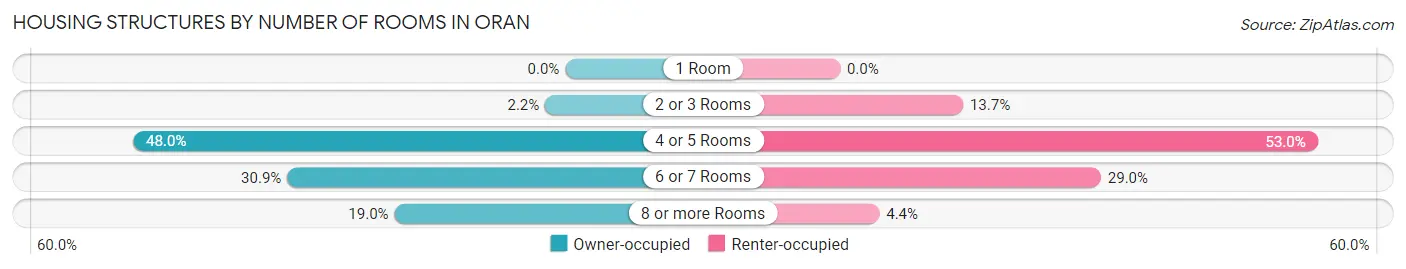
| Number of Rooms | Owner-occupied | Renter-occupied |
| 1 Room | 0 (0.0%) | 0 (0.0%) |
| 2 or 3 Rooms | 6 (2.2%) | 25 (13.7%) |
| 4 or 5 Rooms | 129 (48.0%) | 97 (53.0%) |
| 6 or 7 Rooms | 83 (30.9%) | 53 (29.0%) |
| 8 or more Rooms | 51 (19.0%) | 8 (4.4%) |
| Total | 269 (100.0%) | 183 (100.0%) |
Housing Structure by Heating Type in Oran
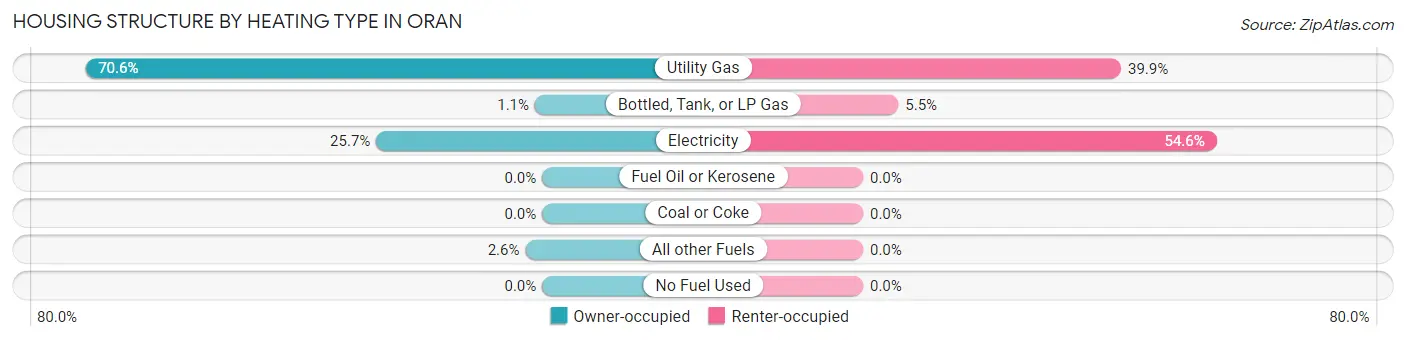
| Heating Type | Owner-occupied | Renter-occupied |
| Utility Gas | 190 (70.6%) | 73 (39.9%) |
| Bottled, Tank, or LP Gas | 3 (1.1%) | 10 (5.5%) |
| Electricity | 69 (25.7%) | 100 (54.6%) |
| Fuel Oil or Kerosene | 0 (0.0%) | 0 (0.0%) |
| Coal or Coke | 0 (0.0%) | 0 (0.0%) |
| All other Fuels | 7 (2.6%) | 0 (0.0%) |
| No Fuel Used | 0 (0.0%) | 0 (0.0%) |
| Total | 269 (100.0%) | 183 (100.0%) |
Household Vehicle Usage in Oran
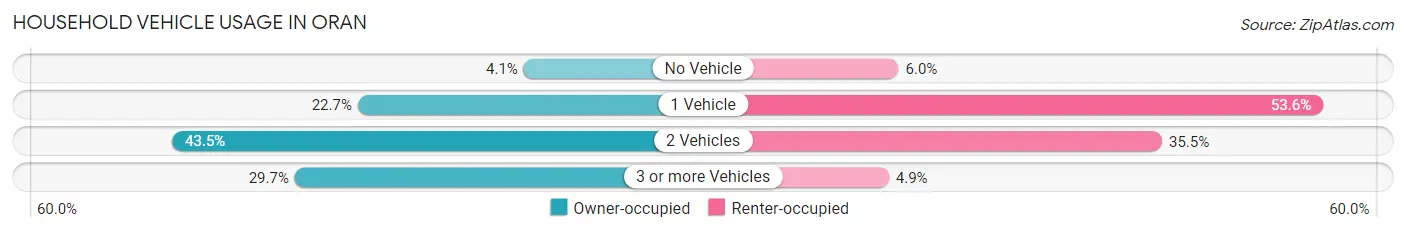
| Vehicles per Household | Owner-occupied | Renter-occupied |
| No Vehicle | 11 (4.1%) | 11 (6.0%) |
| 1 Vehicle | 61 (22.7%) | 98 (53.5%) |
| 2 Vehicles | 117 (43.5%) | 65 (35.5%) |
| 3 or more Vehicles | 80 (29.7%) | 9 (4.9%) |
| Total | 269 (100.0%) | 183 (100.0%) |
Real Estate & Mortgages in Oran
Real Estate and Mortgage Overview in Oran
| Characteristic | Without Mortgage | With Mortgage |
| Housing Units | 105 | 164 |
| Median Property Value | $85,900 | $131,300 |
| Median Household Income | $41,250 | $2 |
| Monthly Housing Costs | $379 | $0 |
| Real Estate Taxes | $521 | $0 |
Property Value by Mortgage Status in Oran
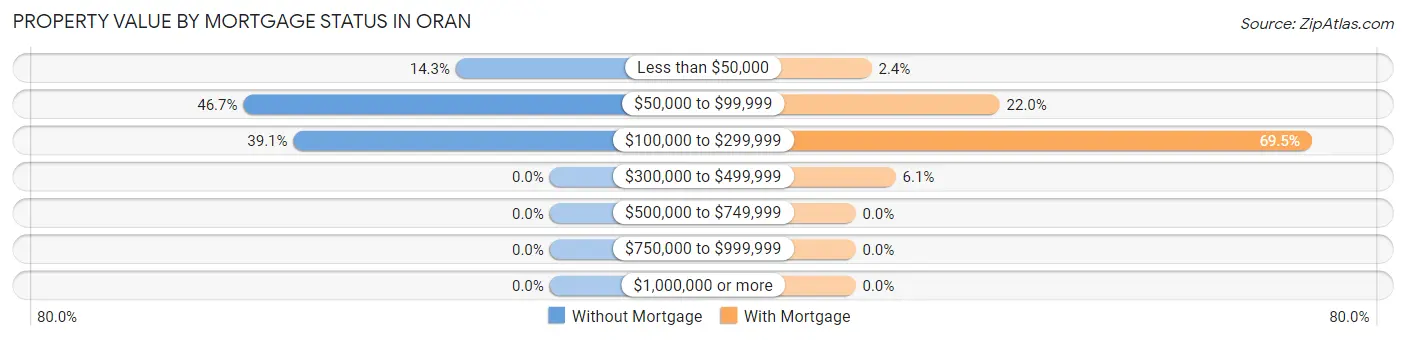
| Property Value | Without Mortgage | With Mortgage |
| Less than $50,000 | 15 (14.3%) | 4 (2.4%) |
| $50,000 to $99,999 | 49 (46.7%) | 36 (22.0%) |
| $100,000 to $299,999 | 41 (39.1%) | 114 (69.5%) |
| $300,000 to $499,999 | 0 (0.0%) | 10 (6.1%) |
| $500,000 to $749,999 | 0 (0.0%) | 0 (0.0%) |
| $750,000 to $999,999 | 0 (0.0%) | 0 (0.0%) |
| $1,000,000 or more | 0 (0.0%) | 0 (0.0%) |
| Total | 105 (100.0%) | 164 (100.0%) |
Household Income by Mortgage Status in Oran
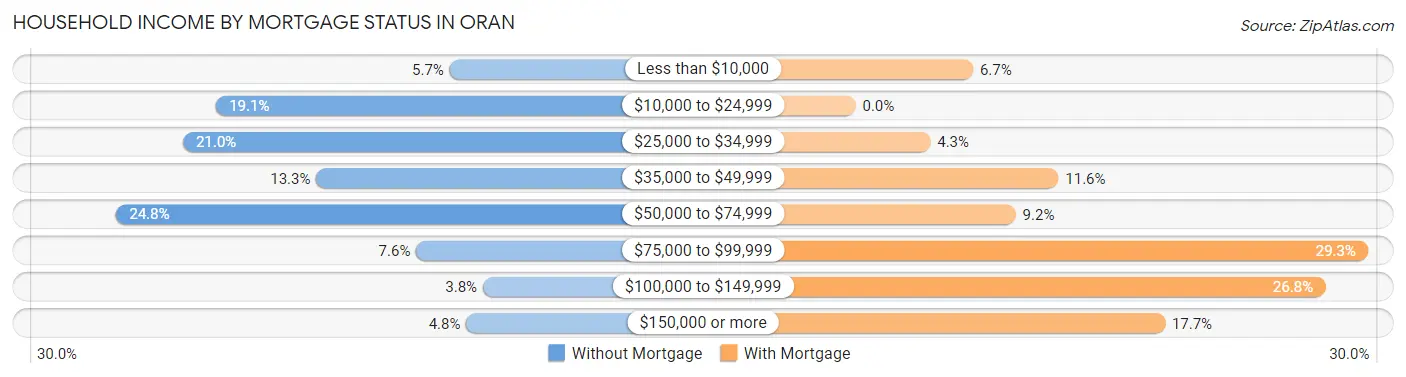
| Household Income | Without Mortgage | With Mortgage |
| Less than $10,000 | 6 (5.7%) | 11 (6.7%) |
| $10,000 to $24,999 | 20 (19.1%) | 0 (0.0%) |
| $25,000 to $34,999 | 22 (20.9%) | 7 (4.3%) |
| $35,000 to $49,999 | 14 (13.3%) | 19 (11.6%) |
| $50,000 to $74,999 | 26 (24.8%) | 15 (9.1%) |
| $75,000 to $99,999 | 8 (7.6%) | 48 (29.3%) |
| $100,000 to $149,999 | 4 (3.8%) | 44 (26.8%) |
| $150,000 or more | 5 (4.8%) | 29 (17.7%) |
| Total | 105 (100.0%) | 164 (100.0%) |
Property Value to Household Income Ratio in Oran
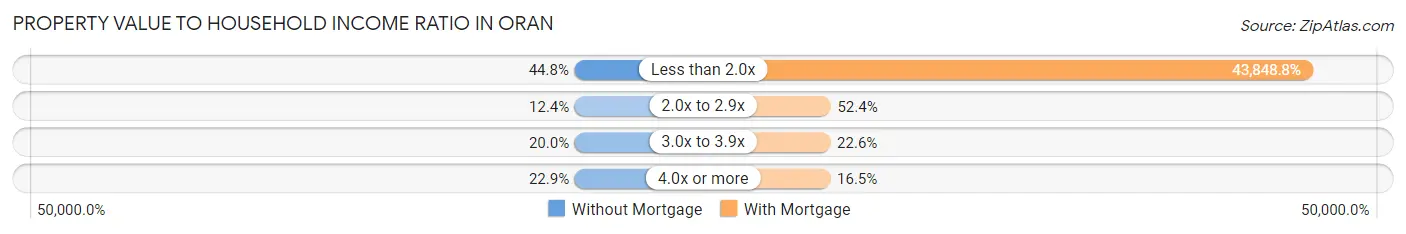
| Value-to-Income Ratio | Without Mortgage | With Mortgage |
| Less than 2.0x | 47 (44.8%) | 71,912 (43,848.8%) |
| 2.0x to 2.9x | 13 (12.4%) | 86 (52.4%) |
| 3.0x to 3.9x | 21 (20.0%) | 37 (22.6%) |
| 4.0x or more | 24 (22.9%) | 27 (16.5%) |
| Total | 105 (100.0%) | 164 (100.0%) |
Real Estate Taxes by Mortgage Status in Oran
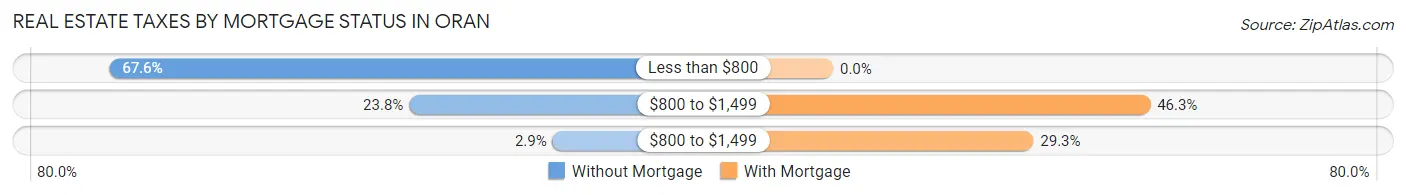
| Property Taxes | Without Mortgage | With Mortgage |
| Less than $800 | 71 (67.6%) | 0 (0.0%) |
| $800 to $1,499 | 25 (23.8%) | 76 (46.3%) |
| $800 to $1,499 | 3 (2.9%) | 48 (29.3%) |
| Total | 105 (100.0%) | 164 (100.0%) |
Health & Disability in Oran
Health Insurance Coverage by Age in Oran
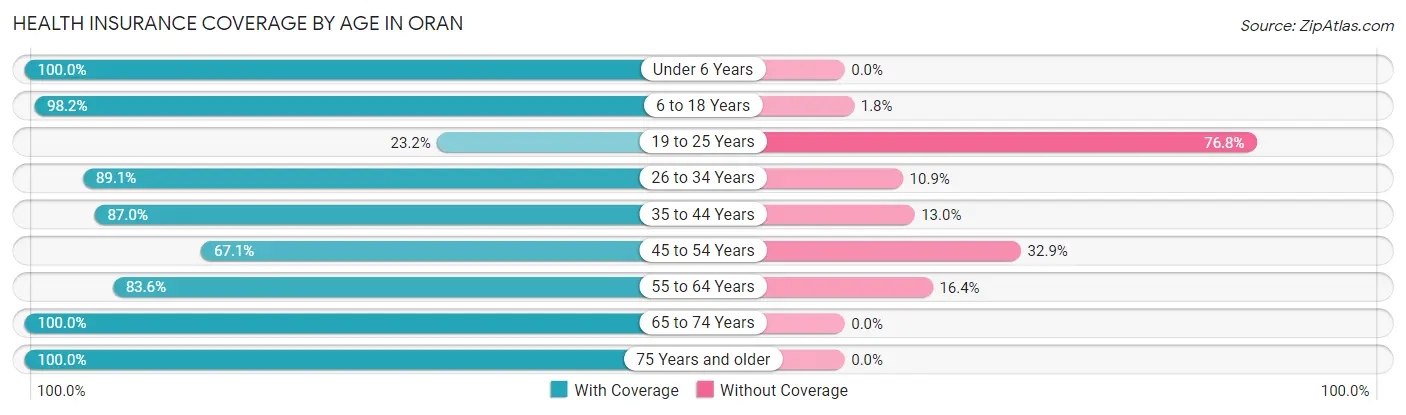
| Age Bracket | With Coverage | Without Coverage |
| Under 6 Years | 58 (100.0%) | 0 (0.0%) |
| 6 to 18 Years | 222 (98.2%) | 4 (1.8%) |
| 19 to 25 Years | 19 (23.2%) | 63 (76.8%) |
| 26 to 34 Years | 131 (89.1%) | 16 (10.9%) |
| 35 to 44 Years | 140 (87.0%) | 21 (13.0%) |
| 45 to 54 Years | 100 (67.1%) | 49 (32.9%) |
| 55 to 64 Years | 122 (83.6%) | 24 (16.4%) |
| 65 to 74 Years | 124 (100.0%) | 0 (0.0%) |
| 75 Years and older | 51 (100.0%) | 0 (0.0%) |
| Total | 967 (84.5%) | 177 (15.5%) |
Health Insurance Coverage by Citizenship Status in Oran
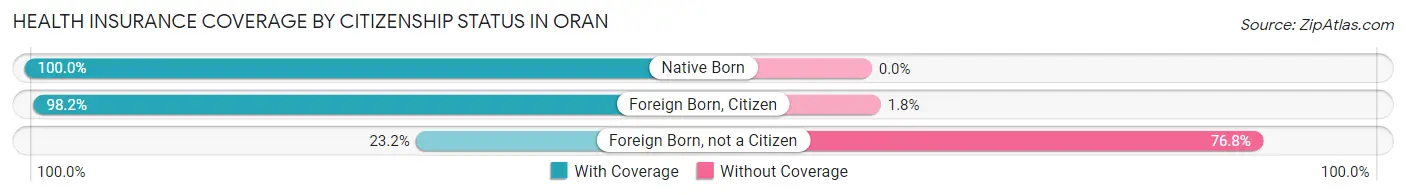
| Citizenship Status | With Coverage | Without Coverage |
| Native Born | 58 (100.0%) | 0 (0.0%) |
| Foreign Born, Citizen | 222 (98.2%) | 4 (1.8%) |
| Foreign Born, not a Citizen | 19 (23.2%) | 63 (76.8%) |
Health Insurance Coverage by Household Income in Oran
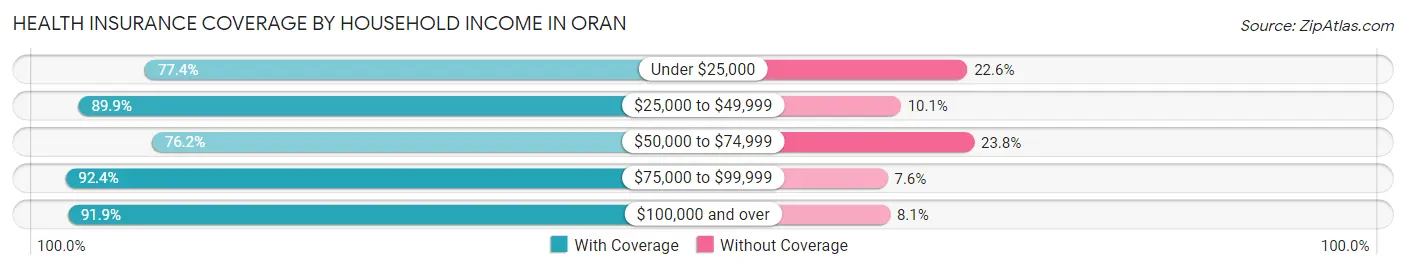
| Household Income | With Coverage | Without Coverage |
| Under $25,000 | 151 (77.4%) | 44 (22.6%) |
| $25,000 to $49,999 | 267 (89.9%) | 30 (10.1%) |
| $50,000 to $74,999 | 246 (76.2%) | 77 (23.8%) |
| $75,000 to $99,999 | 121 (92.4%) | 10 (7.6%) |
| $100,000 and over | 182 (91.9%) | 16 (8.1%) |
Public vs Private Health Insurance Coverage by Age in Oran
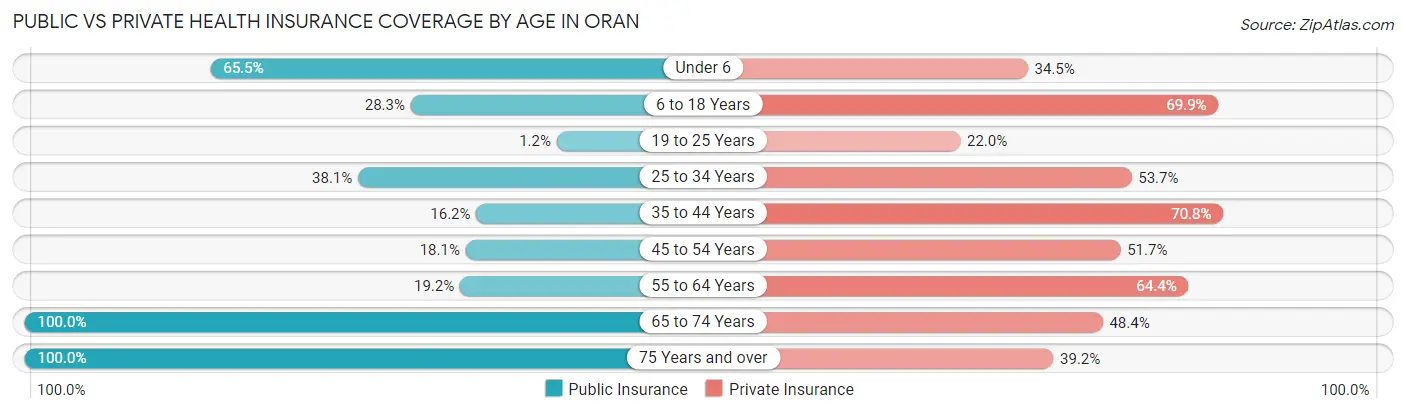
| Age Bracket | Public Insurance | Private Insurance |
| Under 6 | 38 (65.5%) | 20 (34.5%) |
| 6 to 18 Years | 64 (28.3%) | 158 (69.9%) |
| 19 to 25 Years | 1 (1.2%) | 18 (22.0%) |
| 25 to 34 Years | 56 (38.1%) | 79 (53.7%) |
| 35 to 44 Years | 26 (16.2%) | 114 (70.8%) |
| 45 to 54 Years | 27 (18.1%) | 77 (51.7%) |
| 55 to 64 Years | 28 (19.2%) | 94 (64.4%) |
| 65 to 74 Years | 124 (100.0%) | 60 (48.4%) |
| 75 Years and over | 51 (100.0%) | 20 (39.2%) |
| Total | 415 (36.3%) | 640 (55.9%) |
Disability Status by Sex by Age in Oran
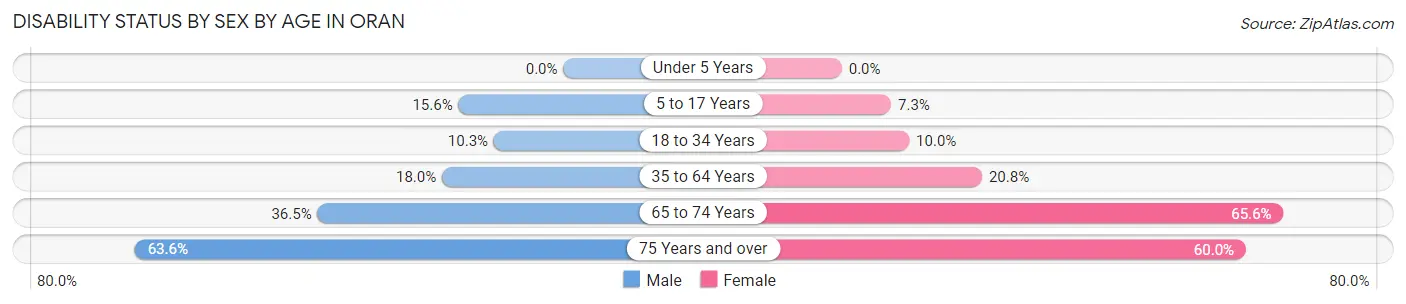
| Age Bracket | Male | Female |
| Under 5 Years | 0 (0.0%) | 0 (0.0%) |
| 5 to 17 Years | 19 (15.6%) | 6 (7.3%) |
| 18 to 34 Years | 10 (10.3%) | 16 (10.0%) |
| 35 to 64 Years | 38 (18.0%) | 51 (20.8%) |
| 65 to 74 Years | 23 (36.5%) | 40 (65.6%) |
| 75 Years and over | 7 (63.6%) | 24 (60.0%) |
Disability Class by Sex by Age in Oran
Disability Class: Hearing Difficulty
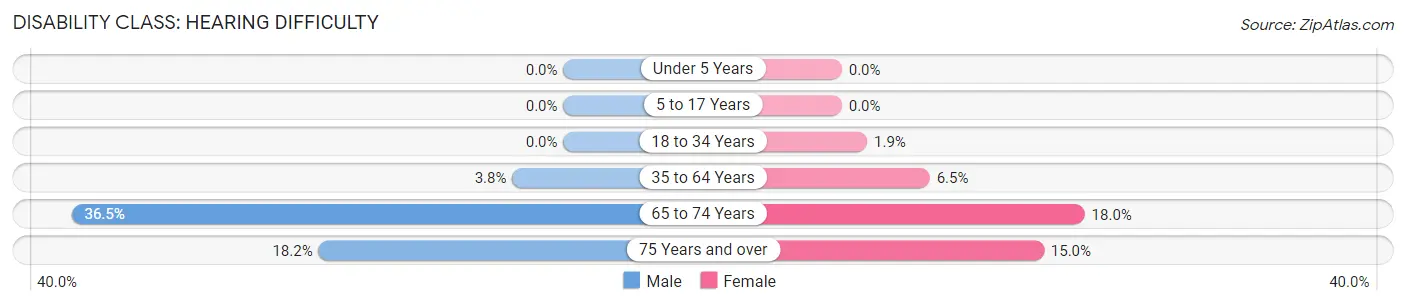
| Age Bracket | Male | Female |
| Under 5 Years | 0 (0.0%) | 0 (0.0%) |
| 5 to 17 Years | 0 (0.0%) | 0 (0.0%) |
| 18 to 34 Years | 0 (0.0%) | 3 (1.9%) |
| 35 to 64 Years | 8 (3.8%) | 16 (6.5%) |
| 65 to 74 Years | 23 (36.5%) | 11 (18.0%) |
| 75 Years and over | 2 (18.2%) | 6 (15.0%) |
Disability Class: Vision Difficulty
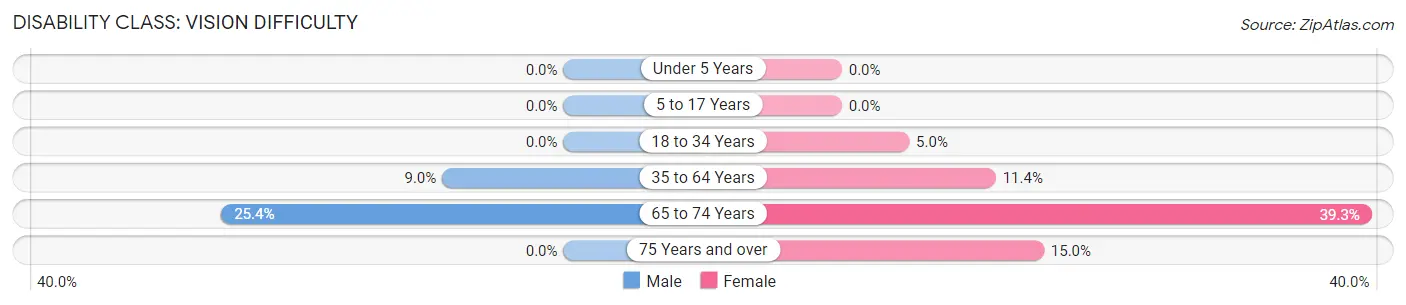
| Age Bracket | Male | Female |
| Under 5 Years | 0 (0.0%) | 0 (0.0%) |
| 5 to 17 Years | 0 (0.0%) | 0 (0.0%) |
| 18 to 34 Years | 0 (0.0%) | 8 (5.0%) |
| 35 to 64 Years | 19 (9.0%) | 28 (11.4%) |
| 65 to 74 Years | 16 (25.4%) | 24 (39.3%) |
| 75 Years and over | 0 (0.0%) | 6 (15.0%) |
Disability Class: Cognitive Difficulty
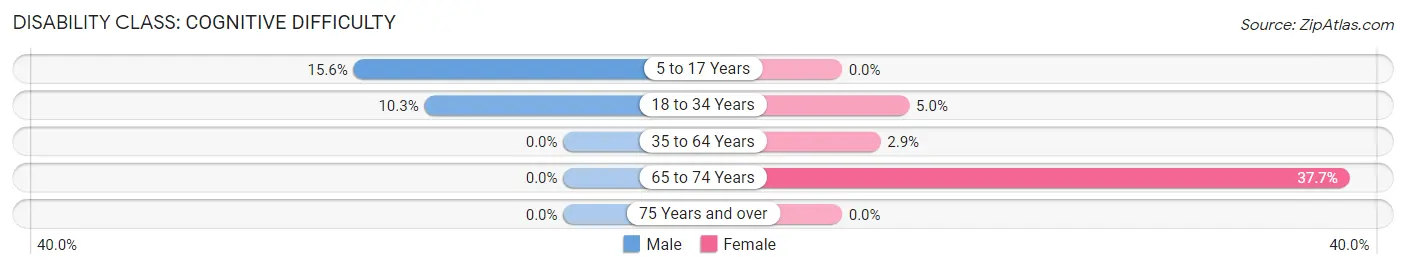
| Age Bracket | Male | Female |
| 5 to 17 Years | 19 (15.6%) | 0 (0.0%) |
| 18 to 34 Years | 10 (10.3%) | 8 (5.0%) |
| 35 to 64 Years | 0 (0.0%) | 7 (2.9%) |
| 65 to 74 Years | 0 (0.0%) | 23 (37.7%) |
| 75 Years and over | 0 (0.0%) | 0 (0.0%) |
Disability Class: Ambulatory Difficulty
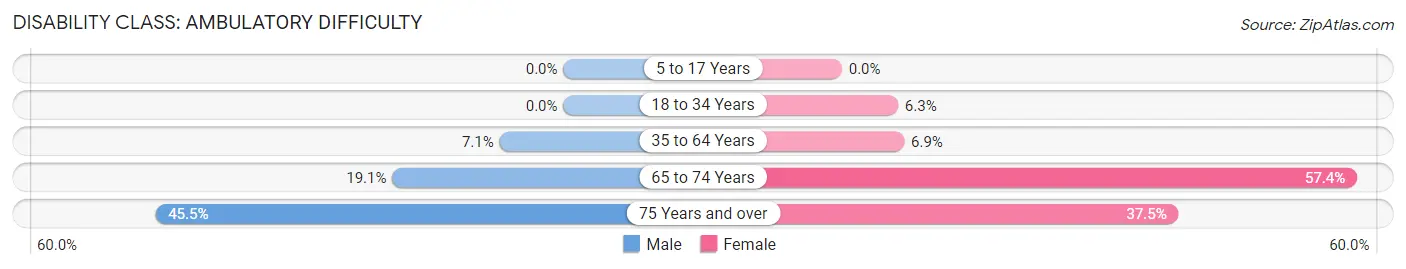
| Age Bracket | Male | Female |
| 5 to 17 Years | 0 (0.0%) | 0 (0.0%) |
| 18 to 34 Years | 0 (0.0%) | 10 (6.2%) |
| 35 to 64 Years | 15 (7.1%) | 17 (6.9%) |
| 65 to 74 Years | 12 (19.1%) | 35 (57.4%) |
| 75 Years and over | 5 (45.5%) | 15 (37.5%) |
Disability Class: Self-Care Difficulty
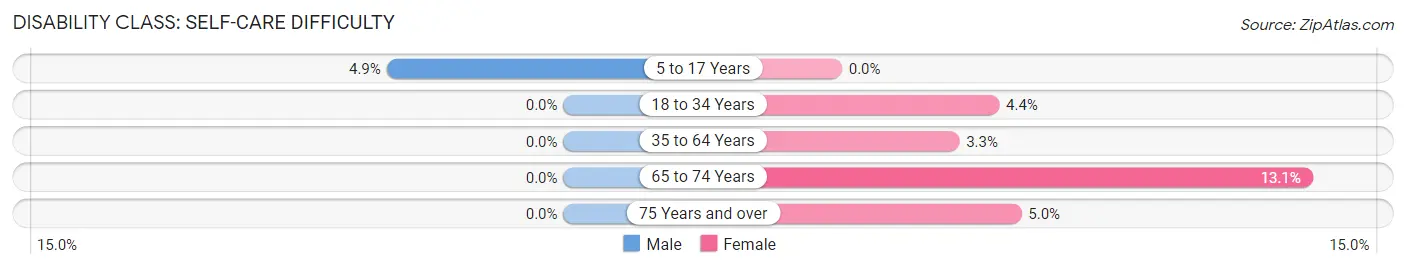
| Age Bracket | Male | Female |
| 5 to 17 Years | 6 (4.9%) | 0 (0.0%) |
| 18 to 34 Years | 0 (0.0%) | 7 (4.4%) |
| 35 to 64 Years | 0 (0.0%) | 8 (3.3%) |
| 65 to 74 Years | 0 (0.0%) | 8 (13.1%) |
| 75 Years and over | 0 (0.0%) | 2 (5.0%) |
Technology Access in Oran
Computing Device Access in Oran
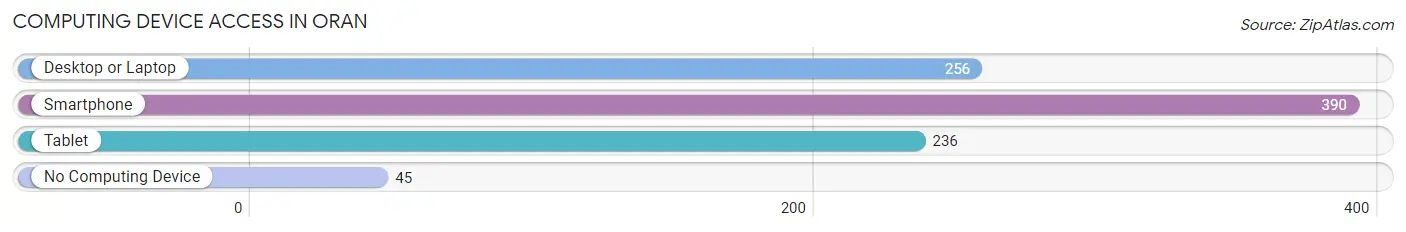
| Device Type | # Households | % Households |
| Desktop or Laptop | 256 | 56.6% |
| Smartphone | 390 | 86.3% |
| Tablet | 236 | 52.2% |
| No Computing Device | 45 | 10.0% |
| Total | 452 | 100.0% |
Internet Access in Oran
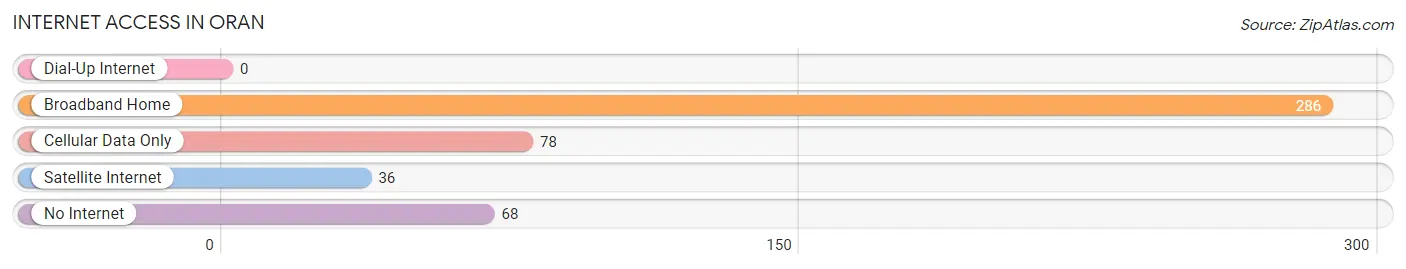
| Internet Type | # Households | % Households |
| Dial-Up Internet | 0 | 0.0% |
| Broadband Home | 286 | 63.3% |
| Cellular Data Only | 78 | 17.3% |
| Satellite Internet | 36 | 8.0% |
| No Internet | 68 | 15.0% |
| Total | 452 | 100.0% |
Oran Summary
Oran, Missouri is a small city located in Scott County, in the southeastern corner of the state. It is situated on the banks of the Mississippi River, and is part of the Cape Girardeau-Jackson metropolitan area. The city has a population of 1,845, according to the 2010 census.
History
Oran was founded in 1858 by German immigrants who had settled in the area. The city was named after the German city of Oranienburg, which was the birthplace of the city's first mayor, John F. Schuessler. The city was incorporated in 1872, and the first post office was established in 1873.
In the late 19th century, Oran was a thriving river port, with a large number of steamboats and barges coming and going. The city was also home to a number of businesses, including a flour mill, a sawmill, a brickyard, and a brewery.
Geography
Oran is located in southeastern Missouri, in Scott County. It is situated on the banks of the Mississippi River, and is part of the Cape Girardeau-Jackson metropolitan area. The city has a total area of 1.2 square miles, all of which is land.
Economy
Oran's economy is largely based on agriculture and manufacturing. The city is home to a number of agricultural businesses, including a grain elevator, a feed mill, and a fertilizer plant. The city also has a number of manufacturing businesses, including a furniture factory, a plastics factory, and a metal fabrication plant.
Demographics
According to the 2010 census, Oran has a population of 1,845. The racial makeup of the city is 97.3% White, 0.7% African American, 0.3% Native American, 0.2% Asian, 0.1% Pacific Islander, 0.2% from other races, and 1.2% from two or more races. The median household income is $37,917, and the median family income is $45,938. The per capita income is $19,945.
Conclusion
Oran, Missouri is a small city located in Scott County, in the southeastern corner of the state. It was founded in 1858 by German immigrants, and has a population of 1,845, according to the 2010 census. The city's economy is largely based on agriculture and manufacturing, and the median household income is $37,917. Oran is a vibrant and diverse community, and is a great place to live and work.
Common Questions
What is Per Capita Income in Oran?
Per Capita income in Oran is $23,617.
What is the Median Family Income in Oran?
Median Family Income in Oran is $57,500.
What is the Median Household income in Oran?
Median Household Income in Oran is $51,250.
What is Income or Wage Gap in Oran?
Income or Wage Gap in Oran is 43.3%.
Women in Oran earn 56.7 cents for every dollar earned by a man.
What is Inequality or Gini Index in Oran?
Inequality or Gini Index in Oran is 0.40.
What is the Total Population of Oran?
Total Population of Oran is 1,150.
What is the Total Male Population of Oran?
Total Male Population of Oran is 530.
What is the Total Female Population of Oran?
Total Female Population of Oran is 620.
What is the Ratio of Males per 100 Females in Oran?
There are 85.48 Males per 100 Females in Oran.
What is the Ratio of Females per 100 Males in Oran?
There are 116.98 Females per 100 Males in Oran.
What is the Median Population Age in Oran?
Median Population Age in Oran is 38.7 Years.
What is the Average Family Size in Oran
Average Family Size in Oran is 2.9 People.
What is the Average Household Size in Oran
Average Household Size in Oran is 2.5 People.
How Large is the Labor Force in Oran?
There are 634 People in the Labor Forcein in Oran.
What is the Percentage of People in the Labor Force in Oran?
67.6% of People are in the Labor Force in Oran.
What is the Unemployment Rate in Oran?
Unemployment Rate in Oran is 7.8%.