Olean, MO Map & Demographics
Olean Map
Olean Overview
$29,591
PER CAPITA INCOME
$103,333
AVG FAMILY INCOME
$67,708
AVG HOUSEHOLD INCOME
45.0%
WAGE / INCOME GAP [ % ]
55.0¢/ $1
WAGE / INCOME GAP [ $ ]
0.40
INEQUALITY / GINI INDEX
112
TOTAL POPULATION
48
MALE POPULATION
64
FEMALE POPULATION
75.00
MALES / 100 FEMALES
133.33
FEMALES / 100 MALES
39.5
MEDIAN AGE
3.6
AVG FAMILY SIZE
2.5
AVG HOUSEHOLD SIZE
63
LABOR FORCE [ PEOPLE ]
68.5%
PERCENT IN LABOR FORCE
Olean Zip Codes
Olean Area Codes
Income in Olean
Income Overview in Olean
Per Capita Income in Olean is $29,591, while median incomes of families and households are $103,333 and $67,708 respectively.
| Characteristic | Number | Measure |
| Per Capita Income | 112 | $29,591 |
| Median Family Income | 24 | $103,333 |
| Mean Family Income | 24 | $89,050 |
| Median Household Income | 45 | $67,708 |
| Mean Household Income | 45 | $74,280 |
| Income Deficit | 24 | $0 |
| Wage / Income Gap (%) | 112 | 44.96% |
| Wage / Income Gap ($) | 112 | 55.04¢ per $1 |
| Gini / Inequality Index | 112 | 0.40 |
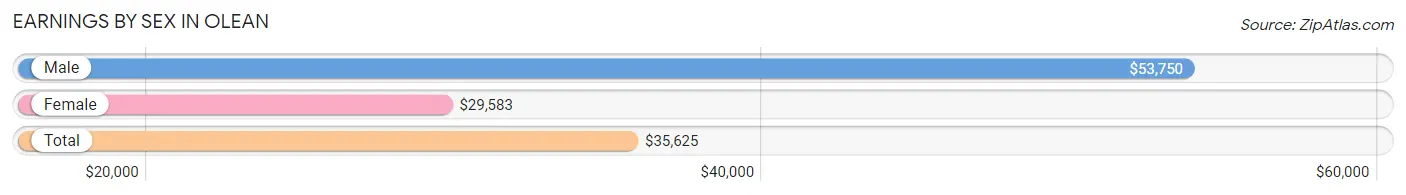
Earnings by Sex in Olean
Average Earnings in Olean are $35,625, $53,750 for men and $29,583 for women, a difference of 45.0%.
| Sex | Number | Average Earnings |
| Male | 33 (52.4%) | $53,750 |
| Female | 30 (47.6%) | $29,583 |
| Total | 63 (100.0%) | $35,625 |
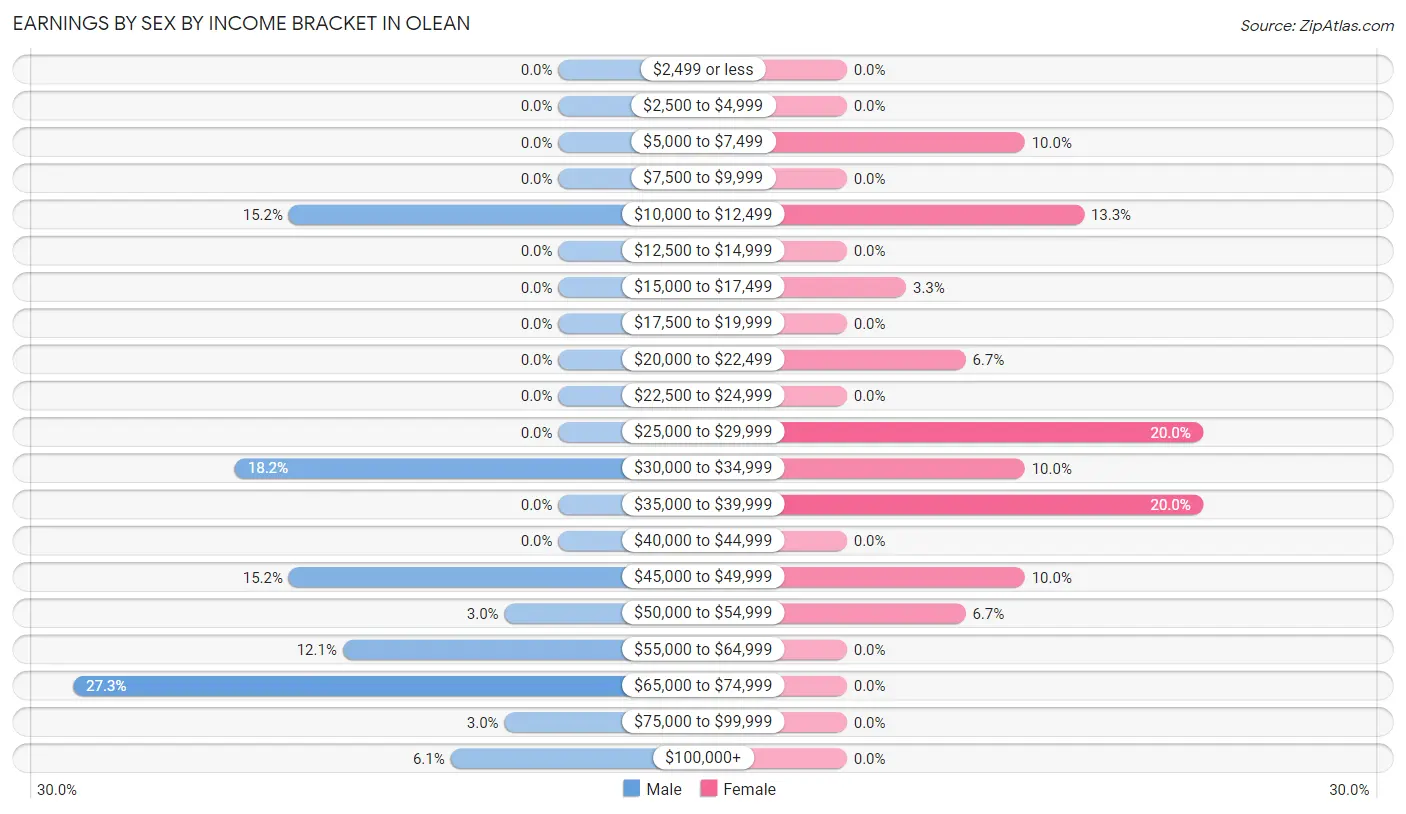
Earnings by Sex by Income Bracket in Olean
The most common earnings brackets in Olean are $65,000 to $74,999 for men (9 | 27.3%) and $25,000 to $29,999 for women (6 | 20.0%).
| Income | Male | Female |
| $2,499 or less | 0 (0.0%) | 0 (0.0%) |
| $2,500 to $4,999 | 0 (0.0%) | 0 (0.0%) |
| $5,000 to $7,499 | 0 (0.0%) | 3 (10.0%) |
| $7,500 to $9,999 | 0 (0.0%) | 0 (0.0%) |
| $10,000 to $12,499 | 5 (15.1%) | 4 (13.3%) |
| $12,500 to $14,999 | 0 (0.0%) | 0 (0.0%) |
| $15,000 to $17,499 | 0 (0.0%) | 1 (3.3%) |
| $17,500 to $19,999 | 0 (0.0%) | 0 (0.0%) |
| $20,000 to $22,499 | 0 (0.0%) | 2 (6.7%) |
| $22,500 to $24,999 | 0 (0.0%) | 0 (0.0%) |
| $25,000 to $29,999 | 0 (0.0%) | 6 (20.0%) |
| $30,000 to $34,999 | 6 (18.2%) | 3 (10.0%) |
| $35,000 to $39,999 | 0 (0.0%) | 6 (20.0%) |
| $40,000 to $44,999 | 0 (0.0%) | 0 (0.0%) |
| $45,000 to $49,999 | 5 (15.1%) | 3 (10.0%) |
| $50,000 to $54,999 | 1 (3.0%) | 2 (6.7%) |
| $55,000 to $64,999 | 4 (12.1%) | 0 (0.0%) |
| $65,000 to $74,999 | 9 (27.3%) | 0 (0.0%) |
| $75,000 to $99,999 | 1 (3.0%) | 0 (0.0%) |
| $100,000+ | 2 (6.1%) | 0 (0.0%) |
| Total | 33 (100.0%) | 30 (100.0%) |
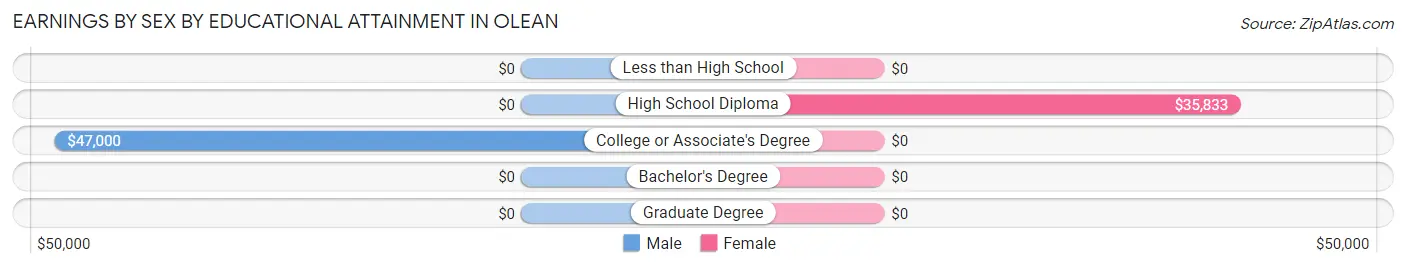
Earnings by Sex by Educational Attainment in Olean
Average earnings in Olean are $53,750 for men and $29,583 for women, a difference of 45.0%. Men with an educational attainment of college or associate's degree enjoy the highest average annual earnings of $47,000, while those with college or associate's degree education earn the least with $47,000. Women with an educational attainment of high school diploma earn the most with the average annual earnings of $35,833, while those with high school diploma education have the smallest earnings of $35,833.
| Educational Attainment | Male Income | Female Income |
| Less than High School | - | - |
| High School Diploma | - | - |
| College or Associate's Degree | $47,000 | $0 |
| Bachelor's Degree | - | - |
| Graduate Degree | - | - |
| Total | $53,750 | $29,583 |
Family Income in Olean
Family Income Brackets in Olean
According to the Olean family income data, there are 14 families falling into the $100,000 to $149,999 income range, which is the most common income bracket and makes up 58.3% of all families.
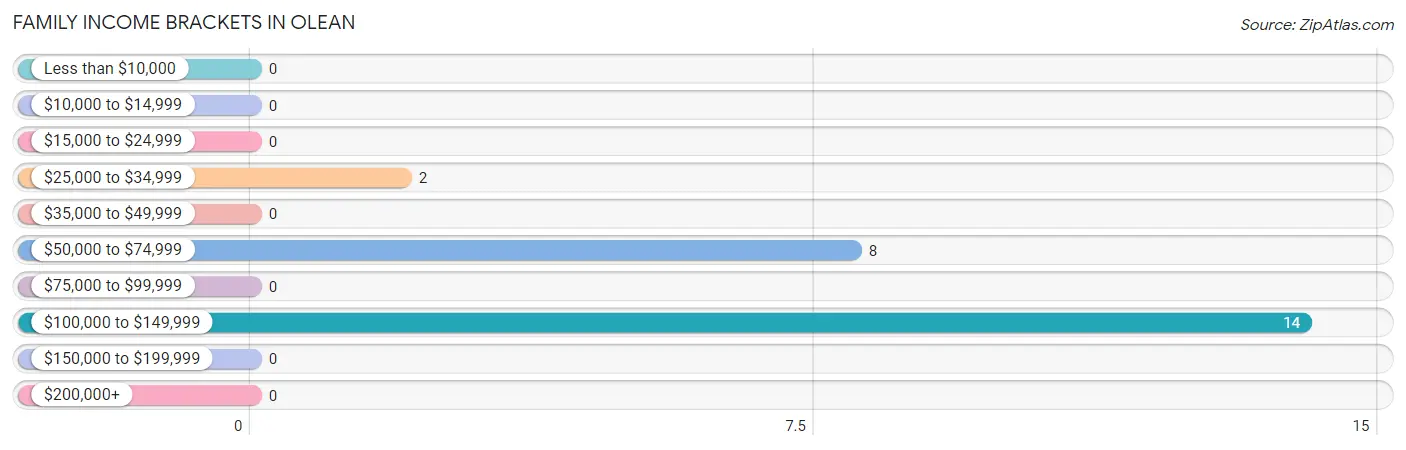
| Income Bracket | # Families | % Families |
| Less than $10,000 | 0 | 0.0% |
| $10,000 to $14,999 | 0 | 0.0% |
| $15,000 to $24,999 | 0 | 0.0% |
| $25,000 to $34,999 | 2 | 8.3% |
| $35,000 to $49,999 | 0 | 0.0% |
| $50,000 to $74,999 | 8 | 33.3% |
| $75,000 to $99,999 | 0 | 0.0% |
| $100,000 to $149,999 | 14 | 58.3% |
| $150,000 to $199,999 | 0 | 0.0% |
| $200,000+ | 0 | 0.0% |
Family Income by Famaliy Size in Olean
2-person families (8 | 33.3%) account for the highest median family income in Olean with $83,750 per family, while 2-person families (8 | 33.3%) have the highest median income of $41,875 per family member.
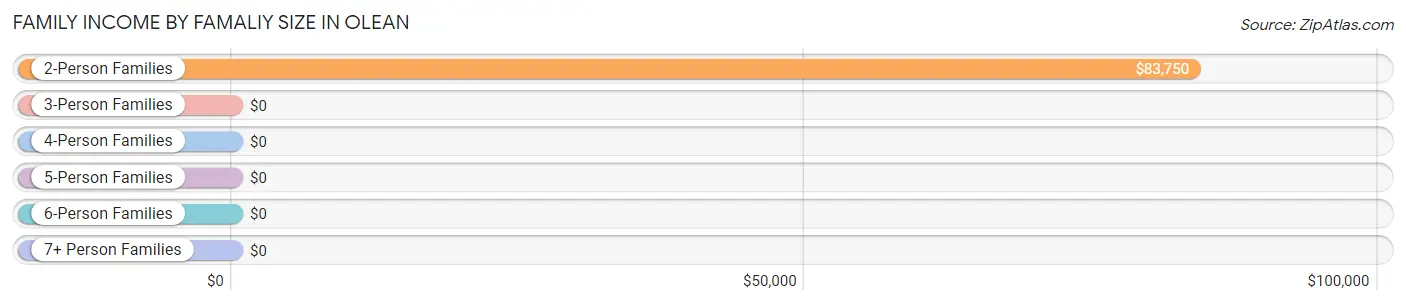
| Income Bracket | # Families | Median Income |
| 2-Person Families | 8 (33.3%) | $83,750 |
| 3-Person Families | 0 (0.0%) | $0 |
| 4-Person Families | 10 (41.7%) | $0 |
| 5-Person Families | 0 (0.0%) | $0 |
| 6-Person Families | 6 (25.0%) | $0 |
| 7+ Person Families | 0 (0.0%) | $0 |
| Total | 24 (100.0%) | $103,333 |
Family Income by Number of Earners in Olean
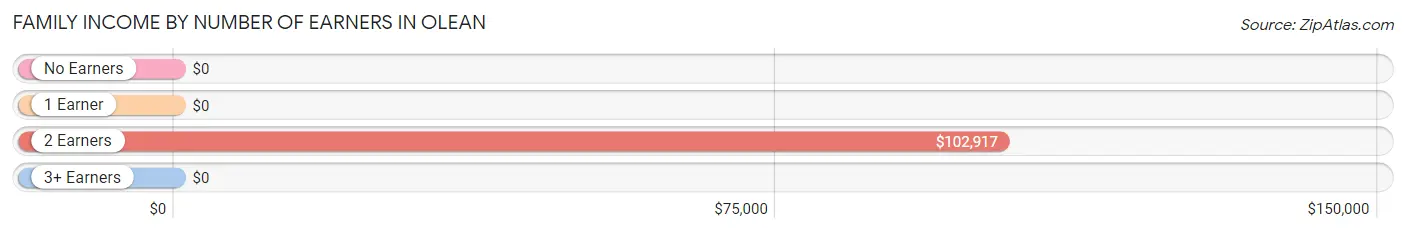
| Number of Earners | # Families | Median Income |
| No Earners | 2 (8.3%) | $0 |
| 1 Earner | 0 (0.0%) | $0 |
| 2 Earners | 18 (75.0%) | $102,917 |
| 3+ Earners | 4 (16.7%) | $0 |
| Total | 24 (100.0%) | $103,333 |
Household Income in Olean
Household Income Brackets in Olean
With 14 households falling in the category, the $100,000 to $149,999 income range is the most frequent in Olean, accounting for 31.1% of all households.
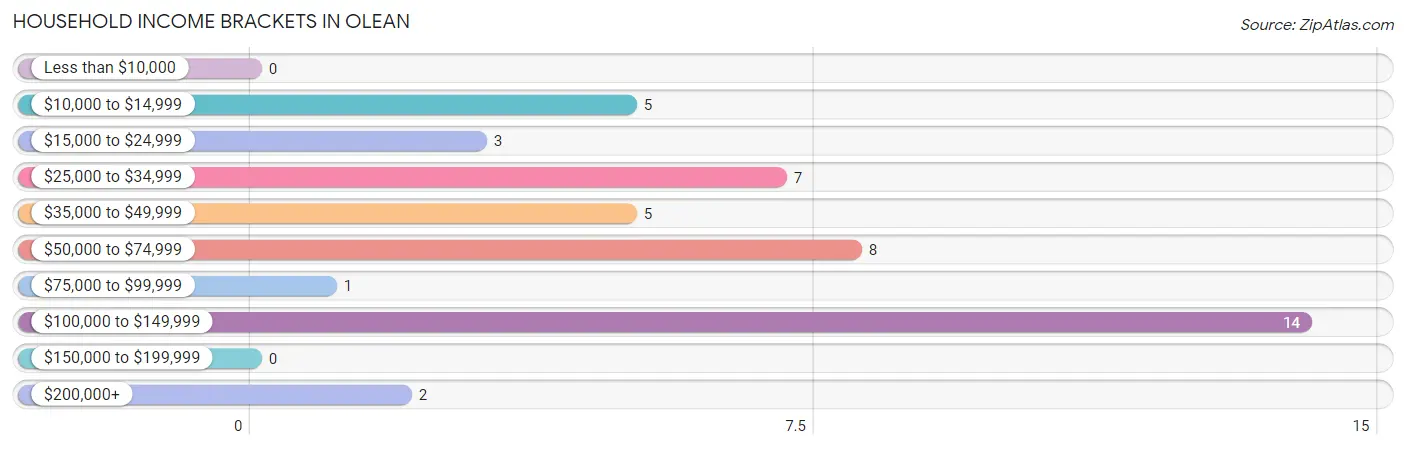
| Income Bracket | # Households | % Households |
| Less than $10,000 | 0 | 0.0% |
| $10,000 to $14,999 | 5 | 11.1% |
| $15,000 to $24,999 | 3 | 6.7% |
| $25,000 to $34,999 | 7 | 15.6% |
| $35,000 to $49,999 | 5 | 11.1% |
| $50,000 to $74,999 | 8 | 17.8% |
| $75,000 to $99,999 | 1 | 2.2% |
| $100,000 to $149,999 | 14 | 31.1% |
| $150,000 to $199,999 | 0 | 0.0% |
| $200,000+ | 2 | 4.4% |
Household Income by Householder Age in Olean
The median household income in Olean is $67,708, with the highest median household income of $68,958 found in the 25 to 44 years age bracket for the primary householder. A total of 21 households (46.7%) fall into this category.
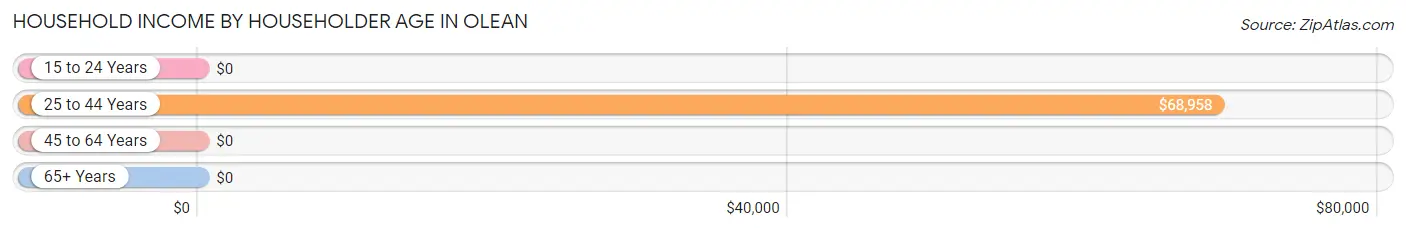
| Income Bracket | # Households | Median Income |
| 15 to 24 Years | 0 (0.0%) | $0 |
| 25 to 44 Years | 21 (46.7%) | $68,958 |
| 45 to 64 Years | 21 (46.7%) | $0 |
| 65+ Years | 3 (6.7%) | $0 |
| Total | 45 (100.0%) | $67,708 |
Poverty in Olean
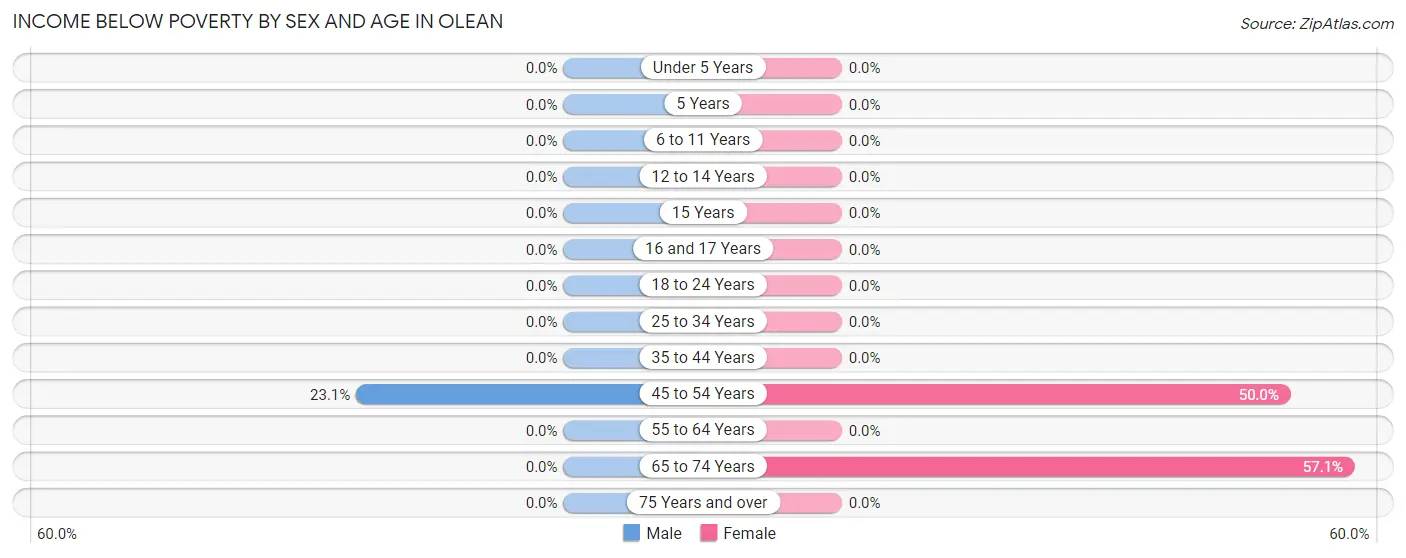
Income Below Poverty by Sex and Age in Olean
With 6.2% poverty level for males and 14.1% for females among the residents of Olean, 45 to 54 year old males and 65 to 74 year old females are the most vulnerable to poverty, with 3 males (23.1%) and 4 females (57.1%) in their respective age groups living below the poverty level.
| Age Bracket | Male | Female |
| Under 5 Years | 0 (0.0%) | 0 (0.0%) |
| 5 Years | 0 (0.0%) | 0 (0.0%) |
| 6 to 11 Years | 0 (0.0%) | 0 (0.0%) |
| 12 to 14 Years | 0 (0.0%) | 0 (0.0%) |
| 15 Years | 0 (0.0%) | 0 (0.0%) |
| 16 and 17 Years | 0 (0.0%) | 0 (0.0%) |
| 18 to 24 Years | 0 (0.0%) | 0 (0.0%) |
| 25 to 34 Years | 0 (0.0%) | 0 (0.0%) |
| 35 to 44 Years | 0 (0.0%) | 0 (0.0%) |
| 45 to 54 Years | 3 (23.1%) | 5 (50.0%) |
| 55 to 64 Years | 0 (0.0%) | 0 (0.0%) |
| 65 to 74 Years | 0 (0.0%) | 4 (57.1%) |
| 75 Years and over | 0 (0.0%) | 0 (0.0%) |
| Total | 3 (6.2%) | 9 (14.1%) |
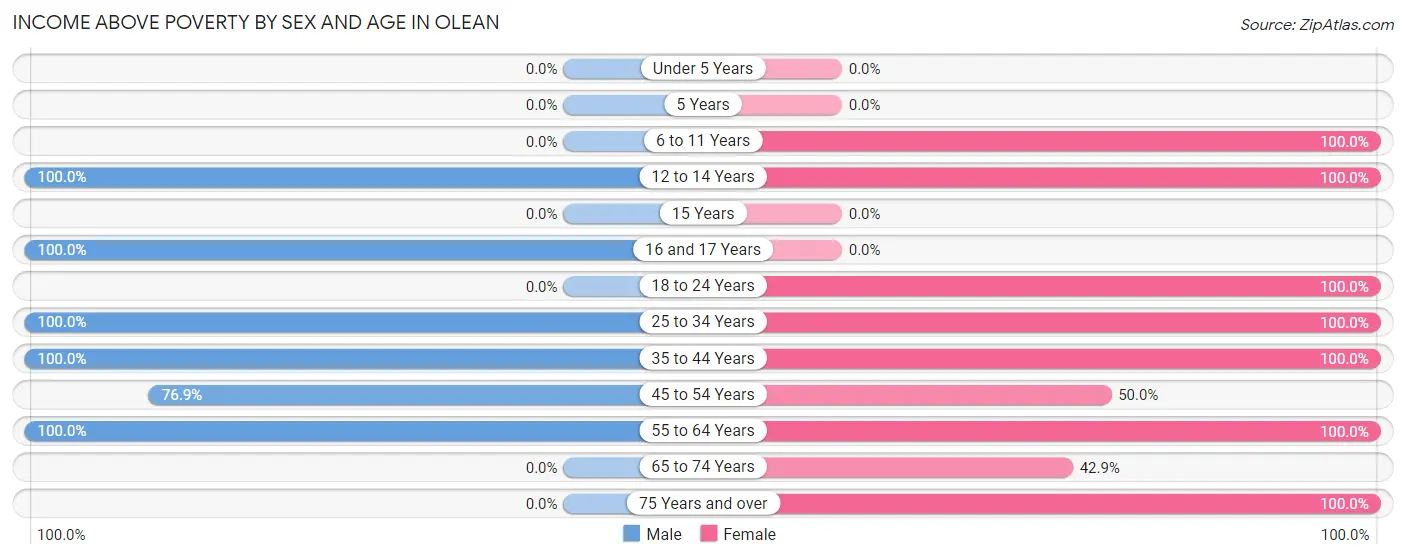
Income Above Poverty by Sex and Age in Olean
According to the poverty statistics in Olean, males aged 12 to 14 years and females aged 6 to 11 years are the age groups that are most secure financially, with 100.0% of males and 100.0% of females in these age groups living above the poverty line.
| Age Bracket | Male | Female |
| Under 5 Years | 0 (0.0%) | 0 (0.0%) |
| 5 Years | 0 (0.0%) | 0 (0.0%) |
| 6 to 11 Years | 0 (0.0%) | 7 (100.0%) |
| 12 to 14 Years | 7 (100.0%) | 6 (100.0%) |
| 15 Years | 0 (0.0%) | 0 (0.0%) |
| 16 and 17 Years | 6 (100.0%) | 0 (0.0%) |
| 18 to 24 Years | 0 (0.0%) | 5 (100.0%) |
| 25 to 34 Years | 9 (100.0%) | 7 (100.0%) |
| 35 to 44 Years | 6 (100.0%) | 14 (100.0%) |
| 45 to 54 Years | 10 (76.9%) | 5 (50.0%) |
| 55 to 64 Years | 7 (100.0%) | 5 (100.0%) |
| 65 to 74 Years | 0 (0.0%) | 3 (42.9%) |
| 75 Years and over | 0 (0.0%) | 3 (100.0%) |
| Total | 45 (93.8%) | 55 (85.9%) |
Income Below Poverty Among Married-Couple Families in Olean
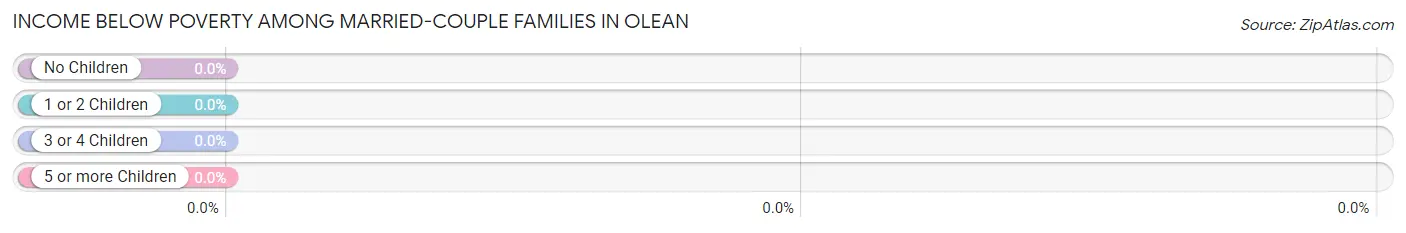
| Children | Above Poverty | Below Poverty |
| No Children | 9 (100.0%) | 0 (0.0%) |
| 1 or 2 Children | 6 (100.0%) | 0 (0.0%) |
| 3 or 4 Children | 6 (100.0%) | 0 (0.0%) |
| 5 or more Children | 0 (0.0%) | 0 (0.0%) |
| Total | 21 (100.0%) | 0 (0.0%) |
Income Below Poverty Among Single-Parent Households in Olean
| Children | Single Father | Single Mother |
| No Children | 0 (0.0%) | 0 (0.0%) |
| 1 or 2 Children | 0 (0.0%) | 0 (0.0%) |
| 3 or 4 Children | 0 (0.0%) | 0 (0.0%) |
| 5 or more Children | 0 (0.0%) | 0 (0.0%) |
| Total | 0 (0.0%) | 0 (0.0%) |
Income Below Poverty Among Married-Couple vs Single-Parent Households in Olean
| Children | Married-Couple Families | Single-Parent Households |
| No Children | 0 (0.0%) | 0 (0.0%) |
| 1 or 2 Children | 0 (0.0%) | 0 (0.0%) |
| 3 or 4 Children | 0 (0.0%) | 0 (0.0%) |
| 5 or more Children | 0 (0.0%) | 0 (0.0%) |
| Total | 0 (0.0%) | 0 (0.0%) |
Race in Olean
The most populous races in Olean are White / Caucasian (110 | 98.2%), and Two or more Races (2 | 1.8%).
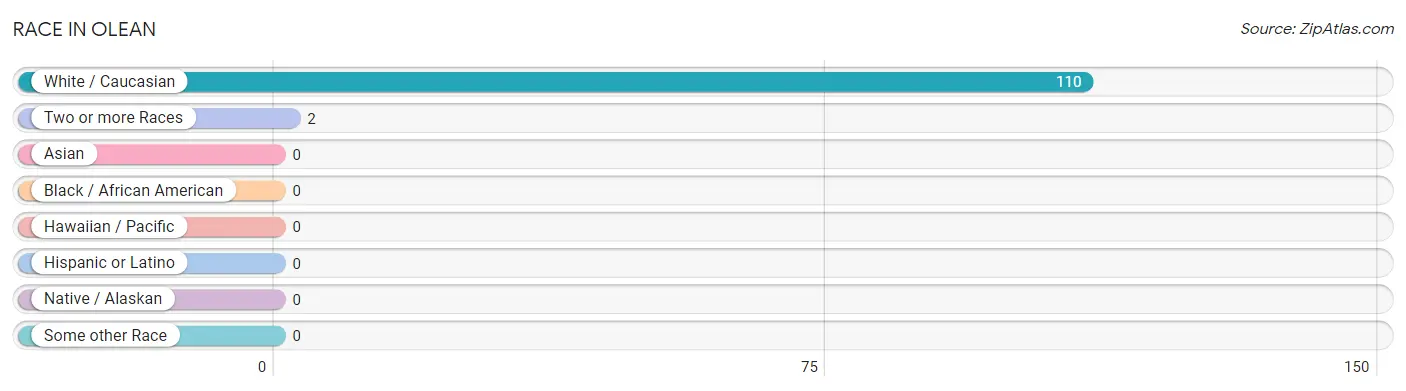
| Race | # Population | % Population |
| Asian | 0 | 0.0% |
| Black / African American | 0 | 0.0% |
| Hawaiian / Pacific | 0 | 0.0% |
| Hispanic or Latino | 0 | 0.0% |
| Native / Alaskan | 0 | 0.0% |
| White / Caucasian | 110 | 98.2% |
| Two or more Races | 2 | 1.8% |
| Some other Race | 0 | 0.0% |
| Total | 112 | 100.0% |
Ancestry in Olean
The most populous ancestries reported in Olean are American (28 | 25.0%), Irish (7 | 6.2%), German (4 | 3.6%), Polish (4 | 3.6%), and English (3 | 2.7%), together accounting for 41.1% of all Olean residents.
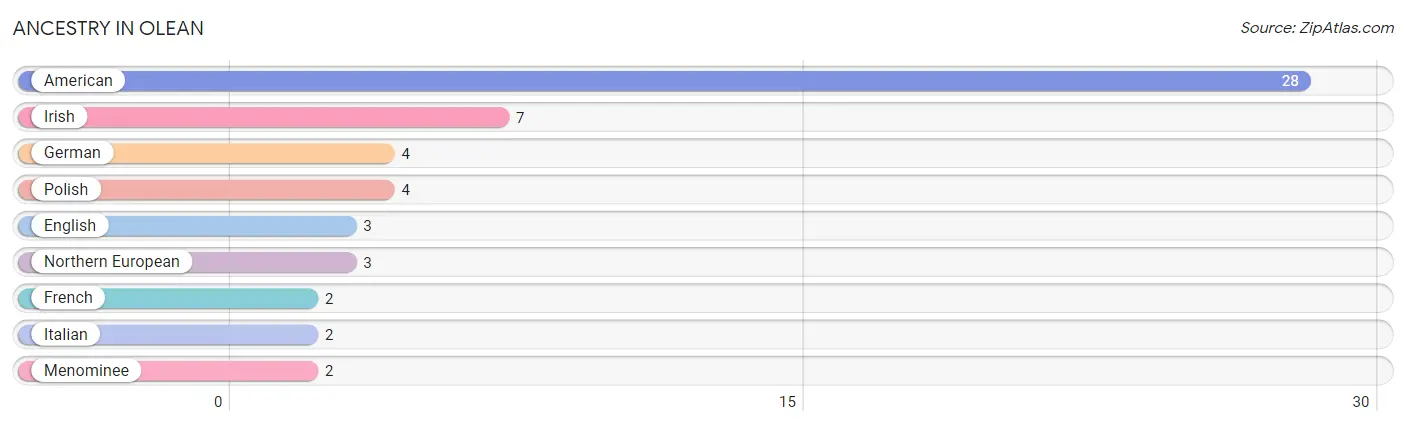
| Ancestry | # Population | % Population |
| American | 28 | 25.0% |
| English | 3 | 2.7% |
| French | 2 | 1.8% |
| German | 4 | 3.6% |
| Irish | 7 | 6.2% |
| Italian | 2 | 1.8% |
| Menominee | 2 | 1.8% |
| Northern European | 3 | 2.7% |
| Polish | 4 | 3.6% | View All 9 Rows |
Immigrants in Olean

| Immigration Origin | # Population | % Population | View All 0 Rows |
Sex and Age in Olean
Sex and Age in Olean
The most populous age groups in Olean are 45 to 49 Years (10 | 20.8%) for men and 40 to 44 Years (8 | 12.5%) for women.
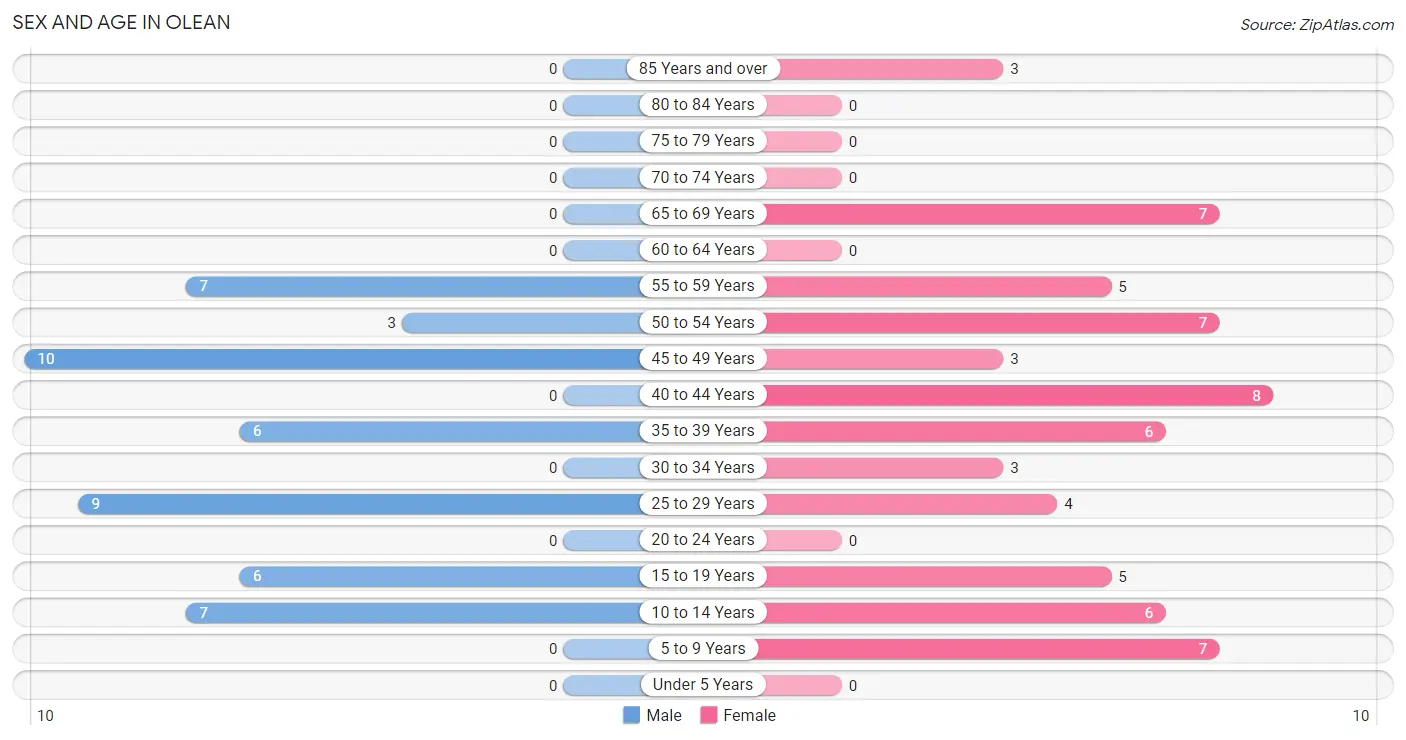
| Age Bracket | Male | Female |
| Under 5 Years | 0 (0.0%) | 0 (0.0%) |
| 5 to 9 Years | 0 (0.0%) | 7 (10.9%) |
| 10 to 14 Years | 7 (14.6%) | 6 (9.4%) |
| 15 to 19 Years | 6 (12.5%) | 5 (7.8%) |
| 20 to 24 Years | 0 (0.0%) | 0 (0.0%) |
| 25 to 29 Years | 9 (18.8%) | 4 (6.2%) |
| 30 to 34 Years | 0 (0.0%) | 3 (4.7%) |
| 35 to 39 Years | 6 (12.5%) | 6 (9.4%) |
| 40 to 44 Years | 0 (0.0%) | 8 (12.5%) |
| 45 to 49 Years | 10 (20.8%) | 3 (4.7%) |
| 50 to 54 Years | 3 (6.2%) | 7 (10.9%) |
| 55 to 59 Years | 7 (14.6%) | 5 (7.8%) |
| 60 to 64 Years | 0 (0.0%) | 0 (0.0%) |
| 65 to 69 Years | 0 (0.0%) | 7 (10.9%) |
| 70 to 74 Years | 0 (0.0%) | 0 (0.0%) |
| 75 to 79 Years | 0 (0.0%) | 0 (0.0%) |
| 80 to 84 Years | 0 (0.0%) | 0 (0.0%) |
| 85 Years and over | 0 (0.0%) | 3 (4.7%) |
| Total | 48 (100.0%) | 64 (100.0%) |
Families and Households in Olean
Median Family Size in Olean
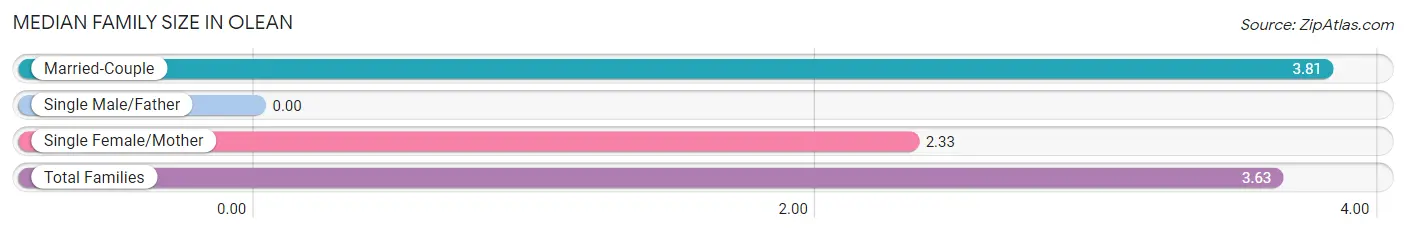
| Family Type | # Families | Family Size |
| Married-Couple | 21 (87.5%) | 3.81 |
| Single Male/Father | 0 (0.0%) | - |
| Single Female/Mother | 3 (12.5%) | 2.33 |
| Total Families | 24 (100.0%) | 3.63 |
Median Household Size in Olean
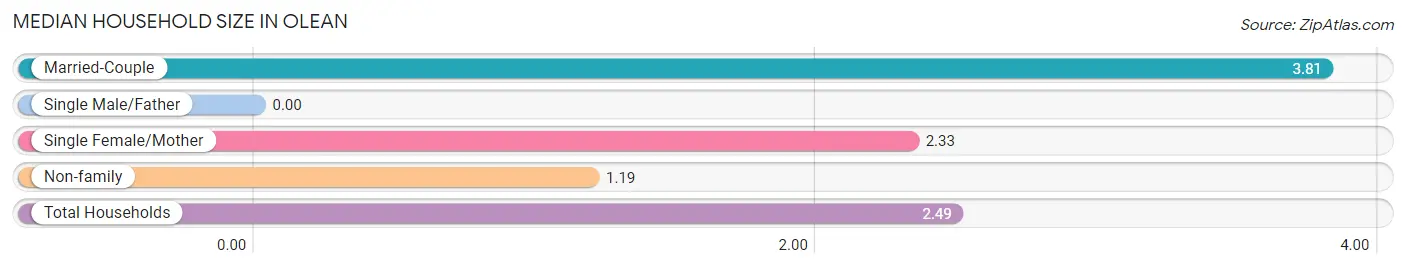
| Household Type | # Households | Household Size |
| Married-Couple | 21 (46.7%) | 3.81 |
| Single Male/Father | 0 (0.0%) | - |
| Single Female/Mother | 3 (6.7%) | 2.33 |
| Non-family | 21 (46.7%) | 1.19 |
| Total Households | 45 (100.0%) | 2.49 |
Household Size by Marriage Status in Olean
Out of a total of 45 households in Olean, 24 (53.3%) are family households, while 21 (46.7%) are nonfamily households. The most numerous type of family households are 4-person households, comprising 10, and the most common type of nonfamily households are 1-person households, comprising 18.
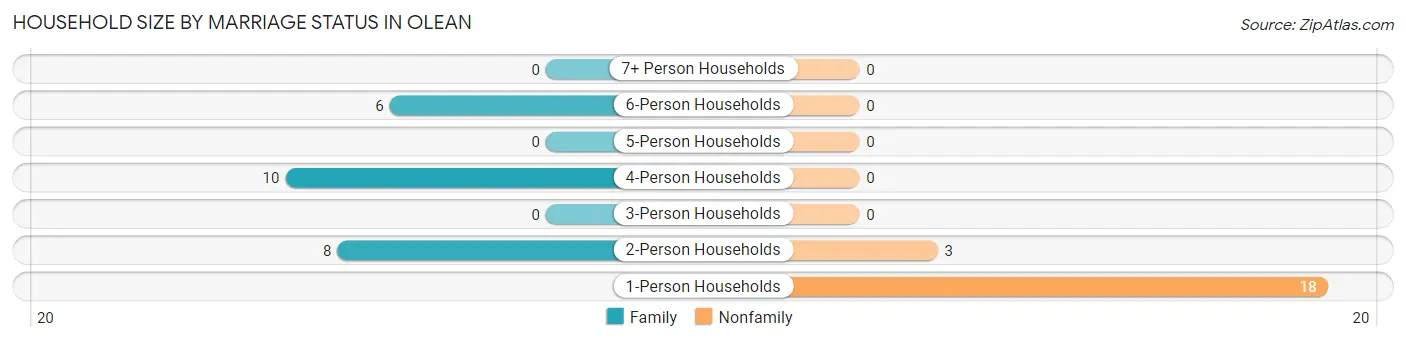
| Household Size | Family Households | Nonfamily Households |
| 1-Person Households | - | 18 (40.0%) |
| 2-Person Households | 8 (17.8%) | 3 (6.7%) |
| 3-Person Households | 0 (0.0%) | 0 (0.0%) |
| 4-Person Households | 10 (22.2%) | 0 (0.0%) |
| 5-Person Households | 0 (0.0%) | 0 (0.0%) |
| 6-Person Households | 6 (13.3%) | 0 (0.0%) |
| 7+ Person Households | 0 (0.0%) | 0 (0.0%) |
| Total | 24 (53.3%) | 21 (46.7%) |
Female Fertility in Olean
Fertility by Age in Olean
| Age Bracket | Women with Births | Births / 1,000 Women |
| 15 to 19 years | 0 (0.0%) | 0.0 |
| 20 to 34 years | 0 (0.0%) | 0.0 |
| 35 to 50 years | 0 (0.0%) | 0.0 |
| Total | 0 (0.0%) | 0.0 |
Fertility by Age by Marriage Status in Olean
| Age Bracket | Married | Unmarried |
| 15 to 19 years | 0 (0.0%) | 0 (0.0%) |
| 20 to 34 years | 0 (0.0%) | 0 (0.0%) |
| 35 to 50 years | 0 (0.0%) | 0 (0.0%) |
| Total | 0 (0.0%) | 0 (0.0%) |
Fertility by Education in Olean
| Educational Attainment | Women with Births | Births / 1,000 Women |
| Less than High School | 0 (0.0%) | 0.0 |
| High School Diploma | 0 (0.0%) | 0.0 |
| College or Associate's Degree | 0 (0.0%) | 0.0 |
| Bachelor's Degree | 0 (0.0%) | 0.0 |
| Graduate Degree | 0 (0.0%) | 0.0 |
| Total | 0 (0.0%) | 0.0 |
Fertility by Education by Marriage Status in Olean
| Educational Attainment | Married | Unmarried |
| Less than High School | 0 (0.0%) | 0 (0.0%) |
| High School Diploma | 0 (0.0%) | 0 (0.0%) |
| College or Associate's Degree | 0 (0.0%) | 0 (0.0%) |
| Bachelor's Degree | 0 (0.0%) | 0 (0.0%) |
| Graduate Degree | 0 (0.0%) | 0 (0.0%) |
| Total | 0 (0.0%) | 0 (0.0%) |
Employment Characteristics in Olean
Employment by Class of Employer in Olean
Among the 63 employed individuals in Olean, private company employees (44 | 69.8%), local government employees (9 | 14.3%), and self-employed (not incorporated) (5 | 7.9%) make up the most common classes of employment.
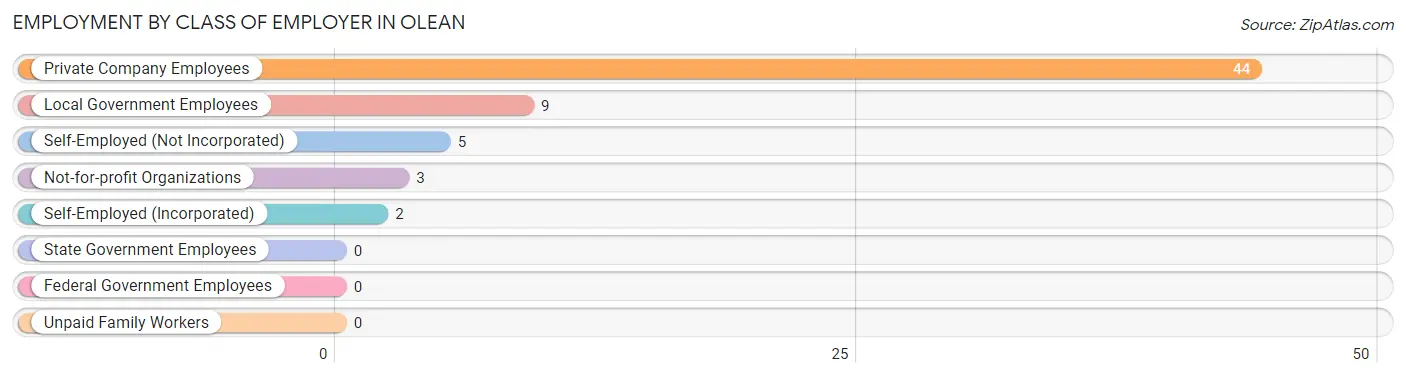
| Employer Class | # Employees | % Employees |
| Private Company Employees | 44 | 69.8% |
| Self-Employed (Incorporated) | 2 | 3.2% |
| Self-Employed (Not Incorporated) | 5 | 7.9% |
| Not-for-profit Organizations | 3 | 4.8% |
| Local Government Employees | 9 | 14.3% |
| State Government Employees | 0 | 0.0% |
| Federal Government Employees | 0 | 0.0% |
| Unpaid Family Workers | 0 | 0.0% |
| Total | 63 | 100.0% |
Employment Status by Age in Olean
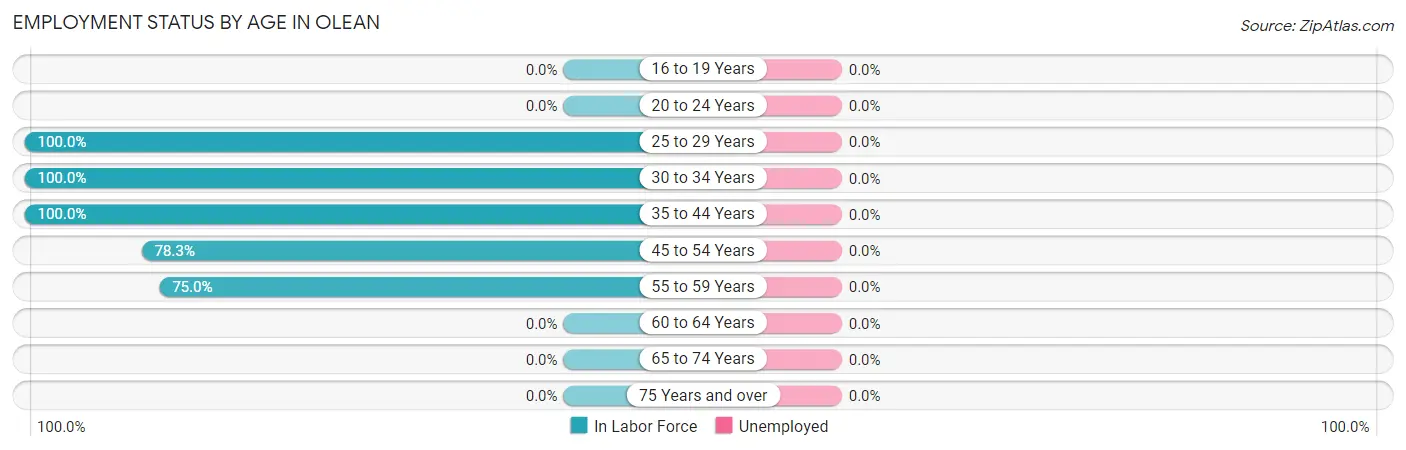
| Age Bracket | In Labor Force | Unemployed |
| 16 to 19 Years | 0 (0.0%) | 0 (0.0%) |
| 20 to 24 Years | 0 (0.0%) | 0 (0.0%) |
| 25 to 29 Years | 13 (100.0%) | 0 (0.0%) |
| 30 to 34 Years | 3 (100.0%) | 0 (0.0%) |
| 35 to 44 Years | 20 (100.0%) | 0 (0.0%) |
| 45 to 54 Years | 18 (78.3%) | 0 (0.0%) |
| 55 to 59 Years | 9 (75.0%) | 0 (0.0%) |
| 60 to 64 Years | 0 (0.0%) | 0 (0.0%) |
| 65 to 74 Years | 0 (0.0%) | 0 (0.0%) |
| 75 Years and over | 0 (0.0%) | 0 (0.0%) |
| Total | 63 (68.5%) | 0 (0.0%) |
Employment Status by Educational Attainment in Olean
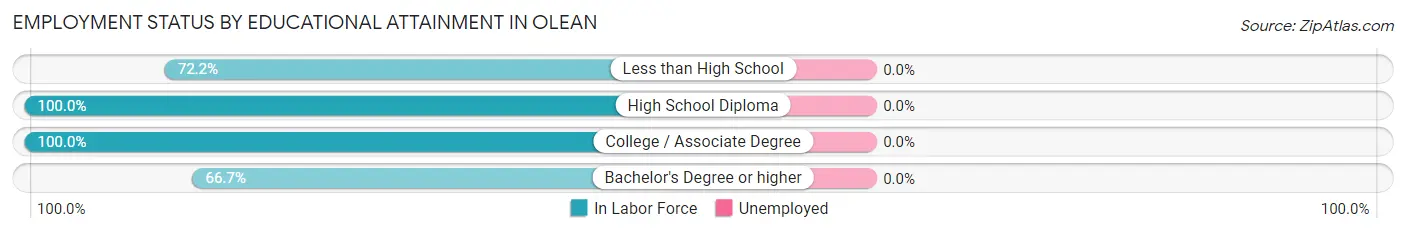
| Educational Attainment | In Labor Force | Unemployed |
| Less than High School | 13 (72.2%) | 0 (0.0%) |
| High School Diploma | 26 (100.0%) | 0 (0.0%) |
| College / Associate Degree | 18 (100.0%) | 0 (0.0%) |
| Bachelor's Degree or higher | 6 (66.7%) | 0 (0.0%) |
| Total | 63 (88.7%) | 0 (0.0%) |
Employment Occupations by Sex in Olean
Management, Business, Science and Arts Occupations
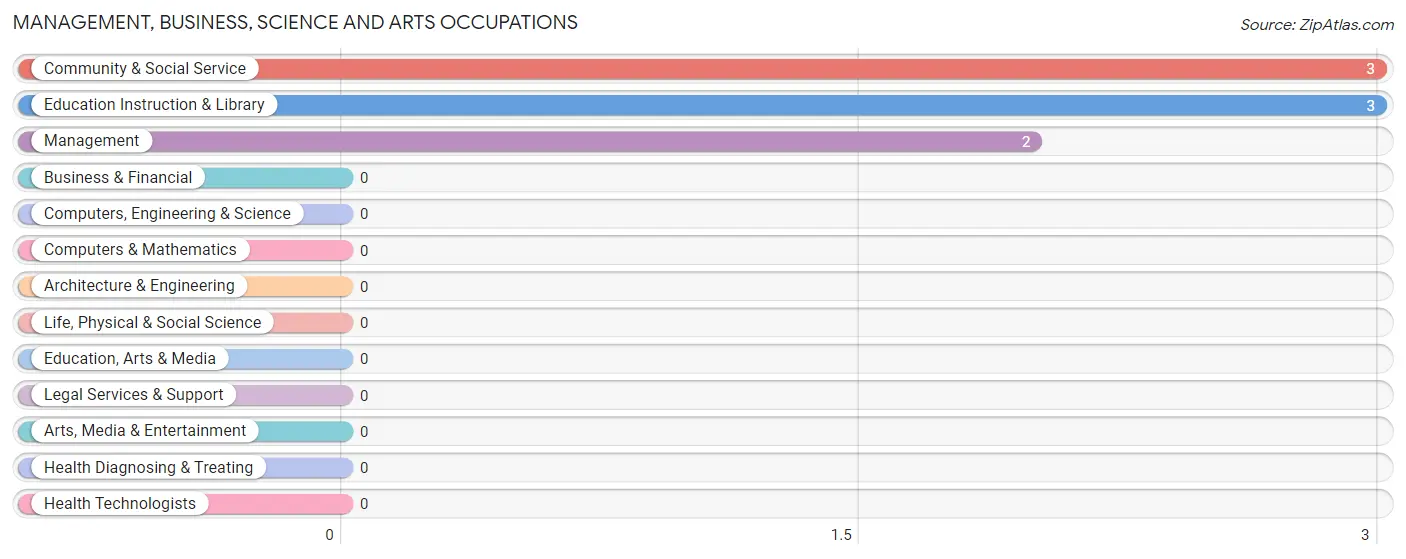
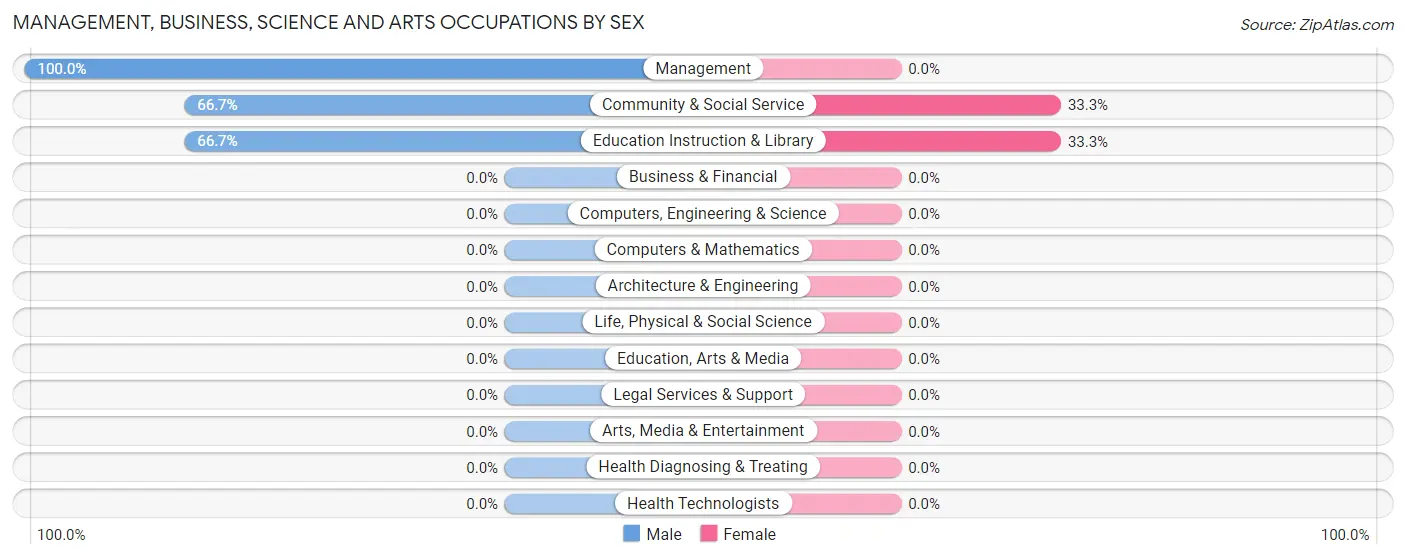
The most common Management, Business, Science and Arts occupations in Olean are Community & Social Service (3 | 4.8%), Education Instruction & Library (3 | 4.8%), and Management (2 | 3.2%).
Management, Business, Science and Arts Occupations by Sex
Within the Management, Business, Science and Arts occupations in Olean, the most male-oriented occupations are Management (100.0%), Community & Social Service (66.7%), and Education Instruction & Library (66.7%), while the most female-oriented occupations are Community & Social Service (33.3%), and Education Instruction & Library (33.3%).
| Occupation | Male | Female |
| Management | 2 (100.0%) | 0 (0.0%) |
| Business & Financial | 0 (0.0%) | 0 (0.0%) |
| Computers, Engineering & Science | 0 (0.0%) | 0 (0.0%) |
| Computers & Mathematics | 0 (0.0%) | 0 (0.0%) |
| Architecture & Engineering | 0 (0.0%) | 0 (0.0%) |
| Life, Physical & Social Science | 0 (0.0%) | 0 (0.0%) |
| Community & Social Service | 2 (66.7%) | 1 (33.3%) |
| Education, Arts & Media | 0 (0.0%) | 0 (0.0%) |
| Legal Services & Support | 0 (0.0%) | 0 (0.0%) |
| Education Instruction & Library | 2 (66.7%) | 1 (33.3%) |
| Arts, Media & Entertainment | 0 (0.0%) | 0 (0.0%) |
| Health Diagnosing & Treating | 0 (0.0%) | 0 (0.0%) |
| Health Technologists | 0 (0.0%) | 0 (0.0%) |
| Total (Category) | 4 (80.0%) | 1 (20.0%) |
| Total (Overall) | 33 (52.4%) | 30 (47.6%) |
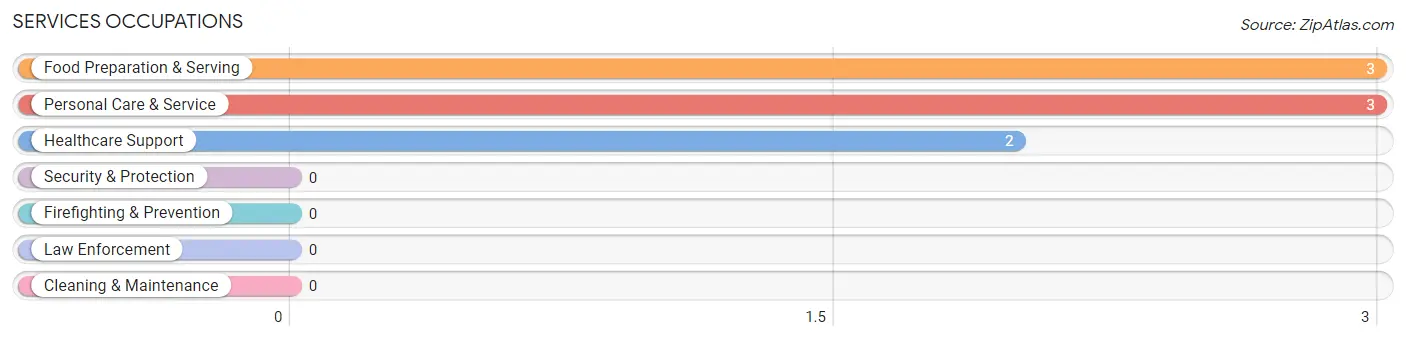
Services Occupations
The most common Services occupations in Olean are Food Preparation & Serving (3 | 4.8%), Personal Care & Service (3 | 4.8%), and Healthcare Support (2 | 3.2%).
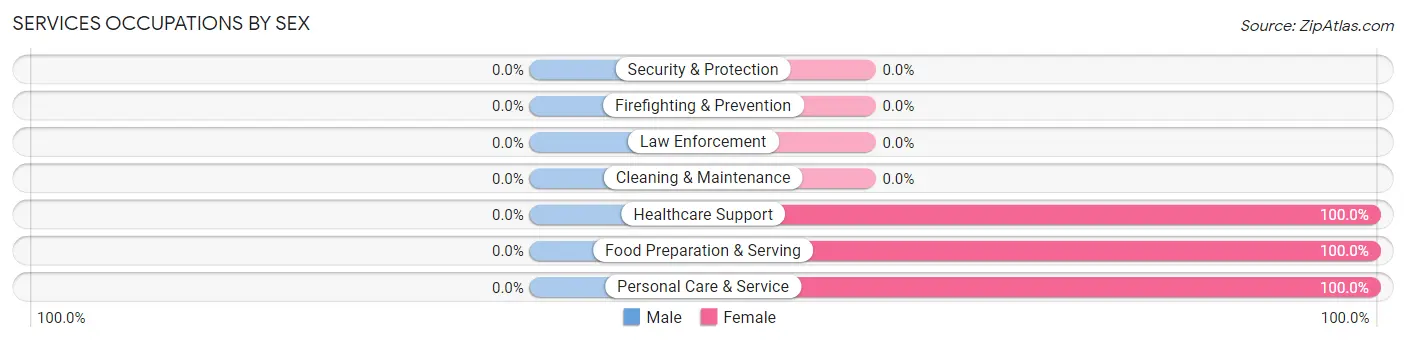
Services Occupations by Sex
| Occupation | Male | Female |
| Healthcare Support | 0 (0.0%) | 2 (100.0%) |
| Security & Protection | 0 (0.0%) | 0 (0.0%) |
| Firefighting & Prevention | 0 (0.0%) | 0 (0.0%) |
| Law Enforcement | 0 (0.0%) | 0 (0.0%) |
| Food Preparation & Serving | 0 (0.0%) | 3 (100.0%) |
| Cleaning & Maintenance | 0 (0.0%) | 0 (0.0%) |
| Personal Care & Service | 0 (0.0%) | 3 (100.0%) |
| Total (Category) | 0 (0.0%) | 8 (100.0%) |
| Total (Overall) | 33 (52.4%) | 30 (47.6%) |
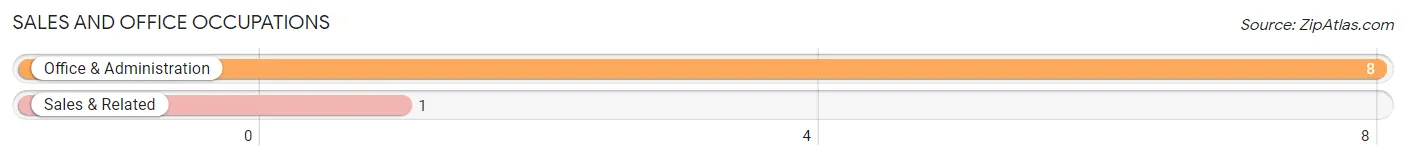
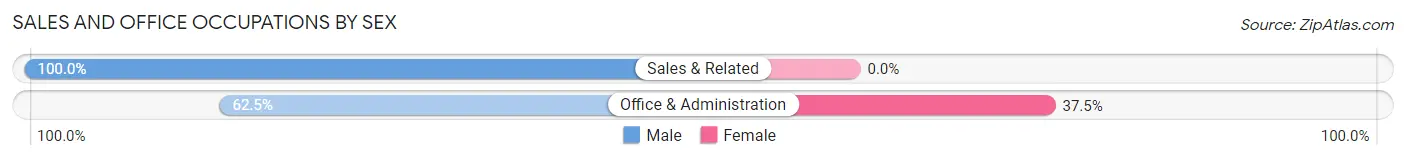
Sales and Office Occupations
The most common Sales and Office occupations in Olean are Office & Administration (8 | 12.7%), and Sales & Related (1 | 1.6%).
Sales and Office Occupations by Sex
| Occupation | Male | Female |
| Sales & Related | 1 (100.0%) | 0 (0.0%) |
| Office & Administration | 5 (62.5%) | 3 (37.5%) |
| Total (Category) | 6 (66.7%) | 3 (33.3%) |
| Total (Overall) | 33 (52.4%) | 30 (47.6%) |
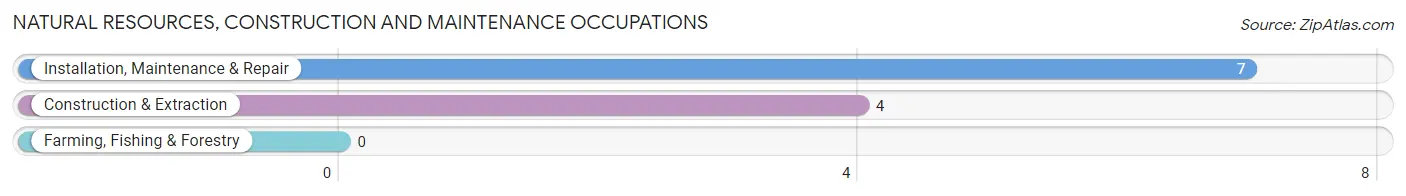
Natural Resources, Construction and Maintenance Occupations
The most common Natural Resources, Construction and Maintenance occupations in Olean are Installation, Maintenance & Repair (7 | 11.1%), and Construction & Extraction (4 | 6.4%).
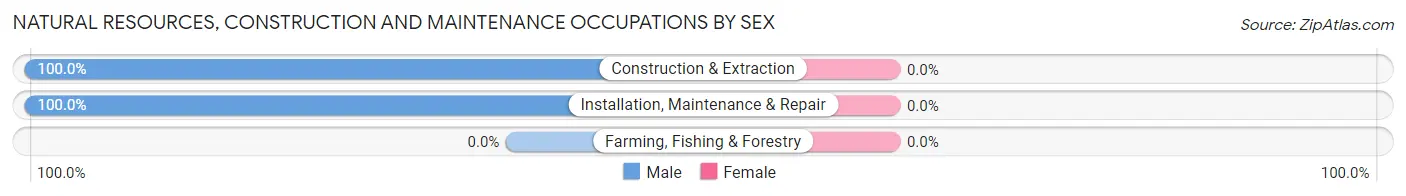
Natural Resources, Construction and Maintenance Occupations by Sex
| Occupation | Male | Female |
| Farming, Fishing & Forestry | 0 (0.0%) | 0 (0.0%) |
| Construction & Extraction | 4 (100.0%) | 0 (0.0%) |
| Installation, Maintenance & Repair | 7 (100.0%) | 0 (0.0%) |
| Total (Category) | 11 (100.0%) | 0 (0.0%) |
| Total (Overall) | 33 (52.4%) | 30 (47.6%) |
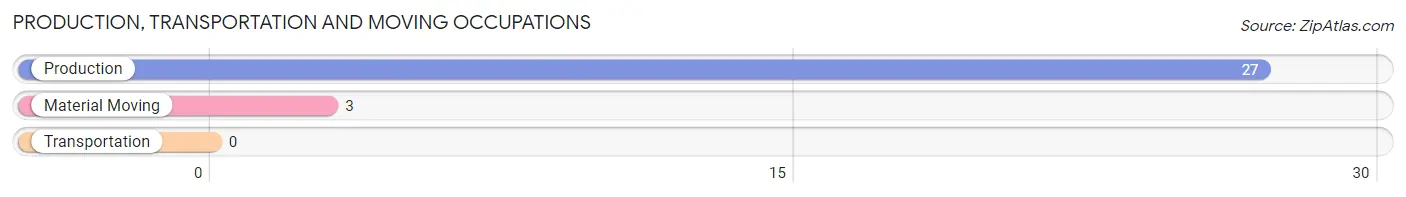
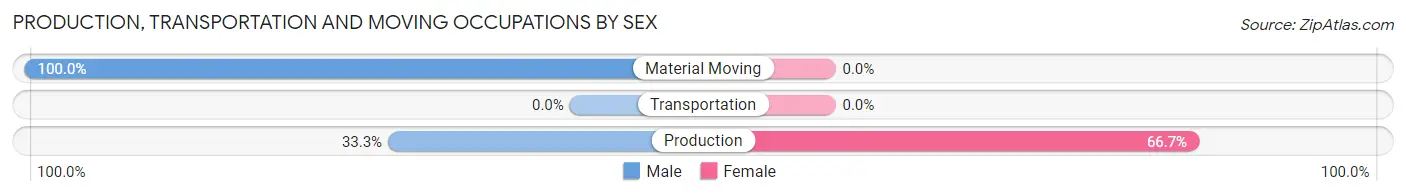
Production, Transportation and Moving Occupations
The most common Production, Transportation and Moving occupations in Olean are Production (27 | 42.9%), and Material Moving (3 | 4.8%).
Production, Transportation and Moving Occupations by Sex
| Occupation | Male | Female |
| Production | 9 (33.3%) | 18 (66.7%) |
| Transportation | 0 (0.0%) | 0 (0.0%) |
| Material Moving | 3 (100.0%) | 0 (0.0%) |
| Total (Category) | 12 (40.0%) | 18 (60.0%) |
| Total (Overall) | 33 (52.4%) | 30 (47.6%) |
Employment Industries by Sex in Olean
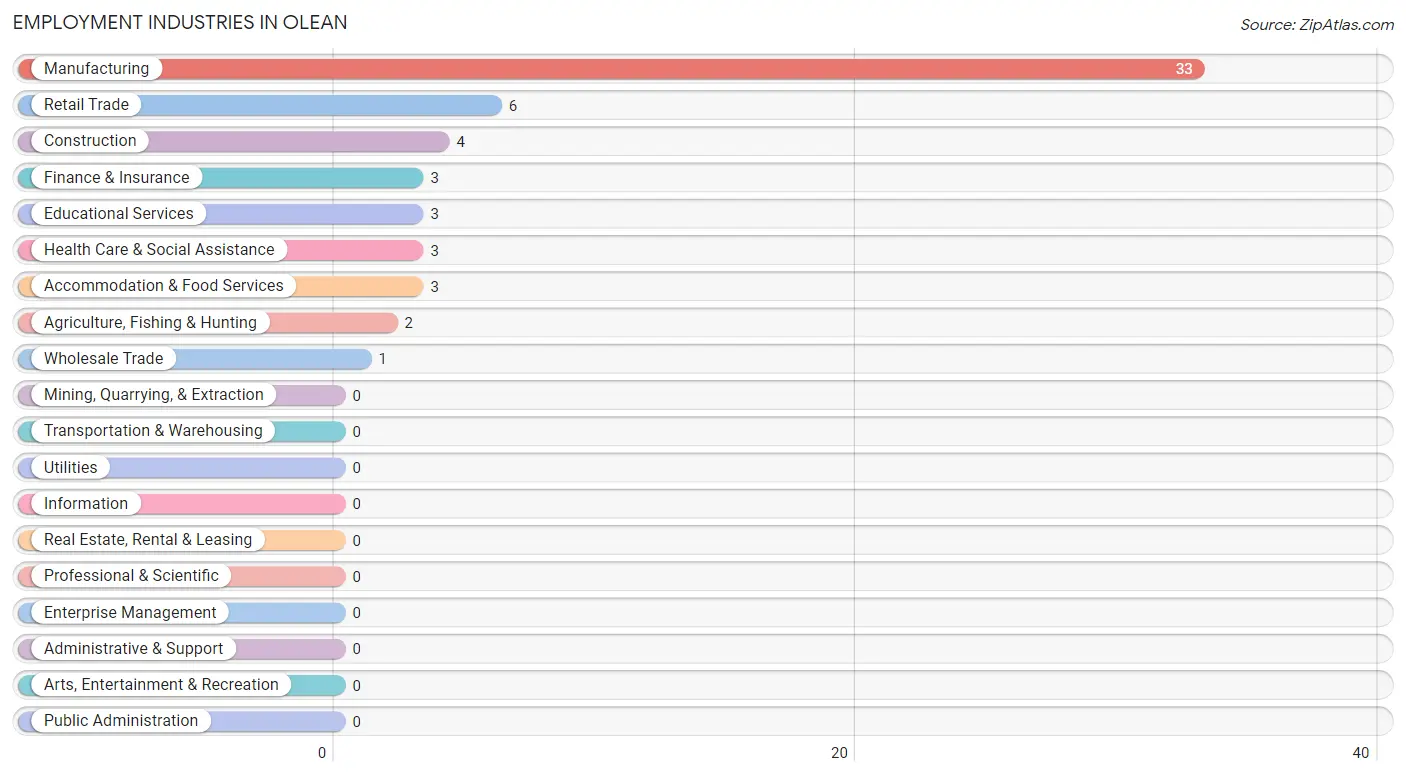
Employment Industries in Olean
The major employment industries in Olean include Manufacturing (33 | 52.4%), Retail Trade (6 | 9.5%), Construction (4 | 6.4%), Finance & Insurance (3 | 4.8%), and Educational Services (3 | 4.8%).
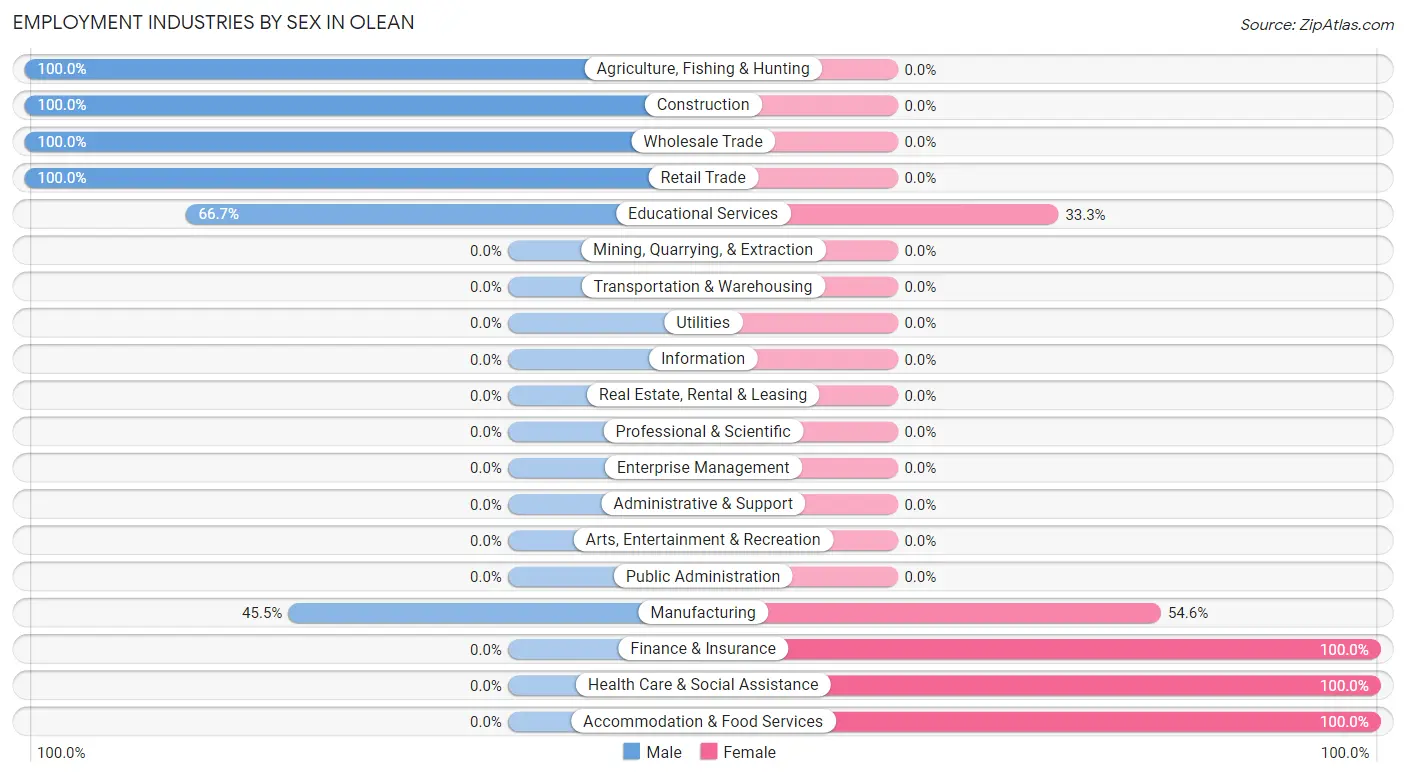
Employment Industries by Sex in Olean
The Olean industries that see more men than women are Agriculture, Fishing & Hunting (100.0%), Construction (100.0%), and Wholesale Trade (100.0%), whereas the industries that tend to have a higher number of women are Finance & Insurance (100.0%), Health Care & Social Assistance (100.0%), and Accommodation & Food Services (100.0%).
| Industry | Male | Female |
| Agriculture, Fishing & Hunting | 2 (100.0%) | 0 (0.0%) |
| Mining, Quarrying, & Extraction | 0 (0.0%) | 0 (0.0%) |
| Construction | 4 (100.0%) | 0 (0.0%) |
| Manufacturing | 15 (45.5%) | 18 (54.5%) |
| Wholesale Trade | 1 (100.0%) | 0 (0.0%) |
| Retail Trade | 6 (100.0%) | 0 (0.0%) |
| Transportation & Warehousing | 0 (0.0%) | 0 (0.0%) |
| Utilities | 0 (0.0%) | 0 (0.0%) |
| Information | 0 (0.0%) | 0 (0.0%) |
| Finance & Insurance | 0 (0.0%) | 3 (100.0%) |
| Real Estate, Rental & Leasing | 0 (0.0%) | 0 (0.0%) |
| Professional & Scientific | 0 (0.0%) | 0 (0.0%) |
| Enterprise Management | 0 (0.0%) | 0 (0.0%) |
| Administrative & Support | 0 (0.0%) | 0 (0.0%) |
| Educational Services | 2 (66.7%) | 1 (33.3%) |
| Health Care & Social Assistance | 0 (0.0%) | 3 (100.0%) |
| Arts, Entertainment & Recreation | 0 (0.0%) | 0 (0.0%) |
| Accommodation & Food Services | 0 (0.0%) | 3 (100.0%) |
| Public Administration | 0 (0.0%) | 0 (0.0%) |
| Total | 33 (52.4%) | 30 (47.6%) |
Education in Olean
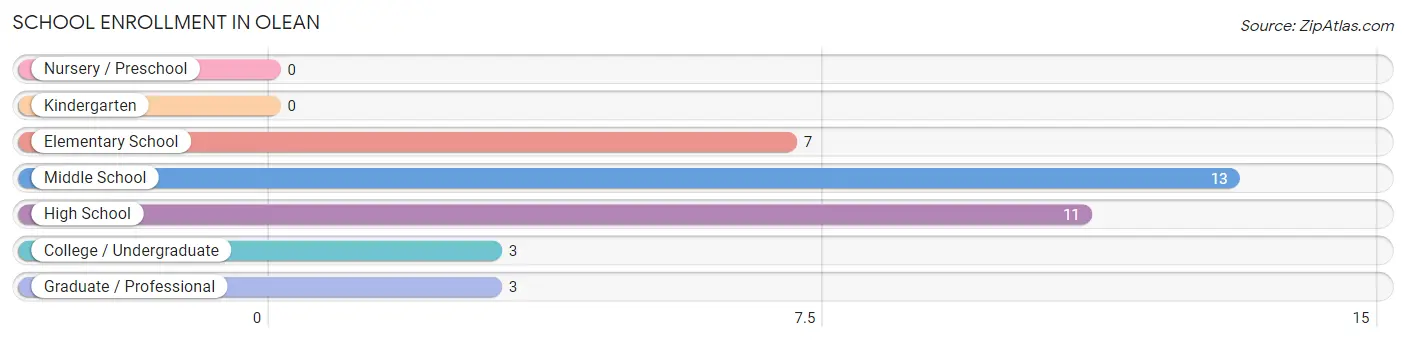
School Enrollment in Olean
The most common levels of schooling among the 37 students in Olean are middle school (13 | 35.1%), high school (11 | 29.7%), and elementary school (7 | 18.9%).
| School Level | # Students | % Students |
| Nursery / Preschool | 0 | 0.0% |
| Kindergarten | 0 | 0.0% |
| Elementary School | 7 | 18.9% |
| Middle School | 13 | 35.1% |
| High School | 11 | 29.7% |
| College / Undergraduate | 3 | 8.1% |
| Graduate / Professional | 3 | 8.1% |
| Total | 37 | 100.0% |
School Enrollment by Age by Funding Source in Olean
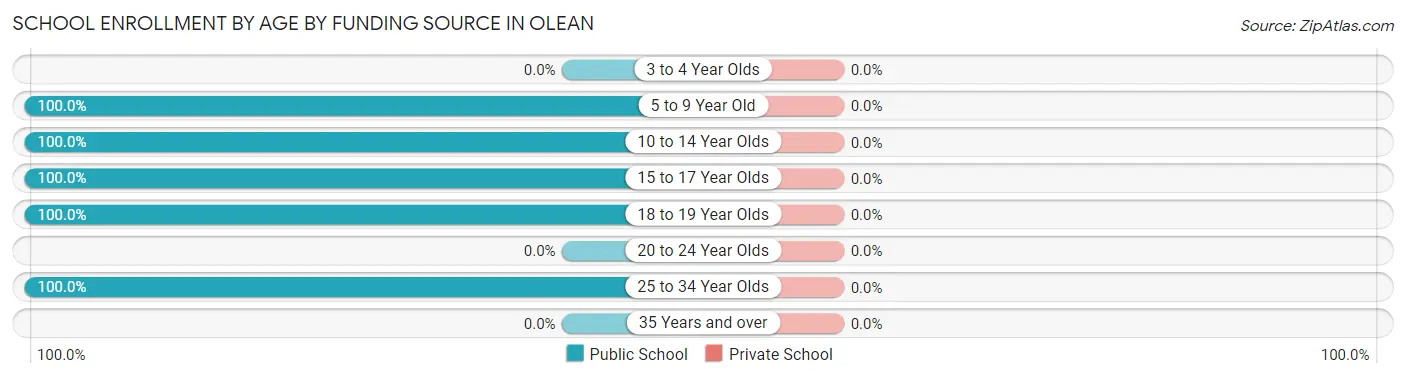
| Age Bracket | Public School | Private School |
| 3 to 4 Year Olds | 0 (0.0%) | 0 (0.0%) |
| 5 to 9 Year Old | 7 (100.0%) | 0 (0.0%) |
| 10 to 14 Year Olds | 13 (100.0%) | 0 (0.0%) |
| 15 to 17 Year Olds | 6 (100.0%) | 0 (0.0%) |
| 18 to 19 Year Olds | 5 (100.0%) | 0 (0.0%) |
| 20 to 24 Year Olds | 0 (0.0%) | 0 (0.0%) |
| 25 to 34 Year Olds | 6 (100.0%) | 0 (0.0%) |
| 35 Years and over | 0 (0.0%) | 0 (0.0%) |
| Total | 37 (100.0%) | 0 (0.0%) |
Educational Attainment by Field of Study in Olean
Education (6 | 66.7%), and bio, nature & agricultural (3 | 33.3%) are the most common fields of study among 9 individuals in Olean who have obtained a bachelor's degree or higher.
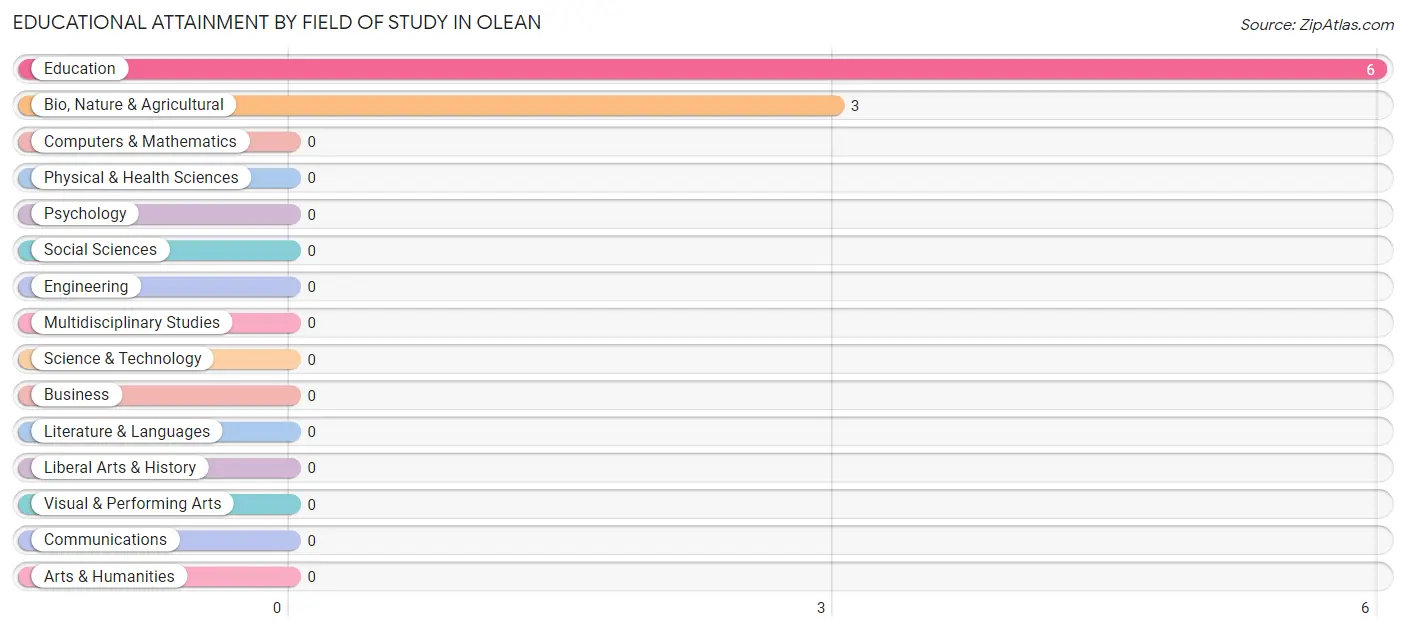
| Field of Study | # Graduates | % Graduates |
| Computers & Mathematics | 0 | 0.0% |
| Bio, Nature & Agricultural | 3 | 33.3% |
| Physical & Health Sciences | 0 | 0.0% |
| Psychology | 0 | 0.0% |
| Social Sciences | 0 | 0.0% |
| Engineering | 0 | 0.0% |
| Multidisciplinary Studies | 0 | 0.0% |
| Science & Technology | 0 | 0.0% |
| Business | 0 | 0.0% |
| Education | 6 | 66.7% |
| Literature & Languages | 0 | 0.0% |
| Liberal Arts & History | 0 | 0.0% |
| Visual & Performing Arts | 0 | 0.0% |
| Communications | 0 | 0.0% |
| Arts & Humanities | 0 | 0.0% |
| Total | 9 | 100.0% |
Transportation & Commute in Olean
Vehicle Availability by Sex in Olean
The most prevalent vehicle ownership categories in Olean are males with 2 vehicles (15, accounting for 45.5%) and females with 2 vehicles (12, making up 50.0%).
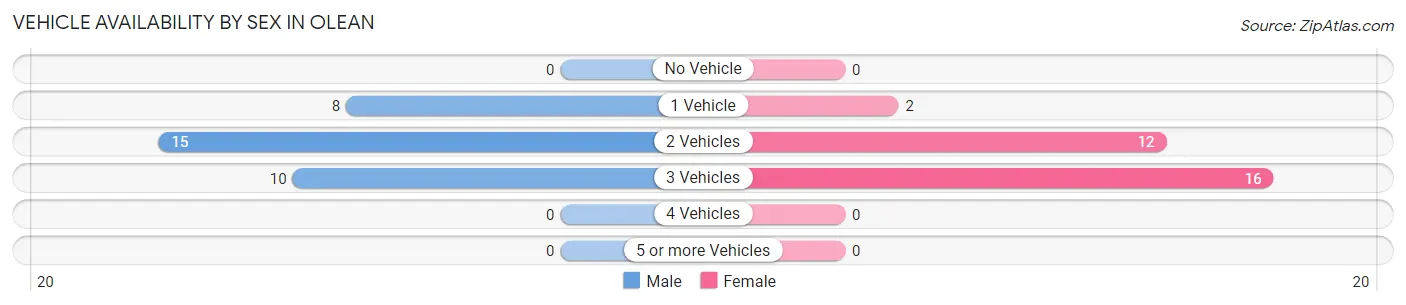
| Vehicles Available | Male | Female |
| No Vehicle | 0 (0.0%) | 0 (0.0%) |
| 1 Vehicle | 8 (24.2%) | 2 (6.7%) |
| 2 Vehicles | 15 (45.5%) | 12 (40.0%) |
| 3 Vehicles | 10 (30.3%) | 16 (53.3%) |
| 4 Vehicles | 0 (0.0%) | 0 (0.0%) |
| 5 or more Vehicles | 0 (0.0%) | 0 (0.0%) |
| Total | 33 (100.0%) | 30 (100.0%) |
Commute Time in Olean
The most frequently occuring commute durations in Olean are 10 to 14 minutes (18 commuters, 28.6%), 15 to 19 minutes (15 commuters, 23.8%), and 25 to 29 minutes (9 commuters, 14.3%).
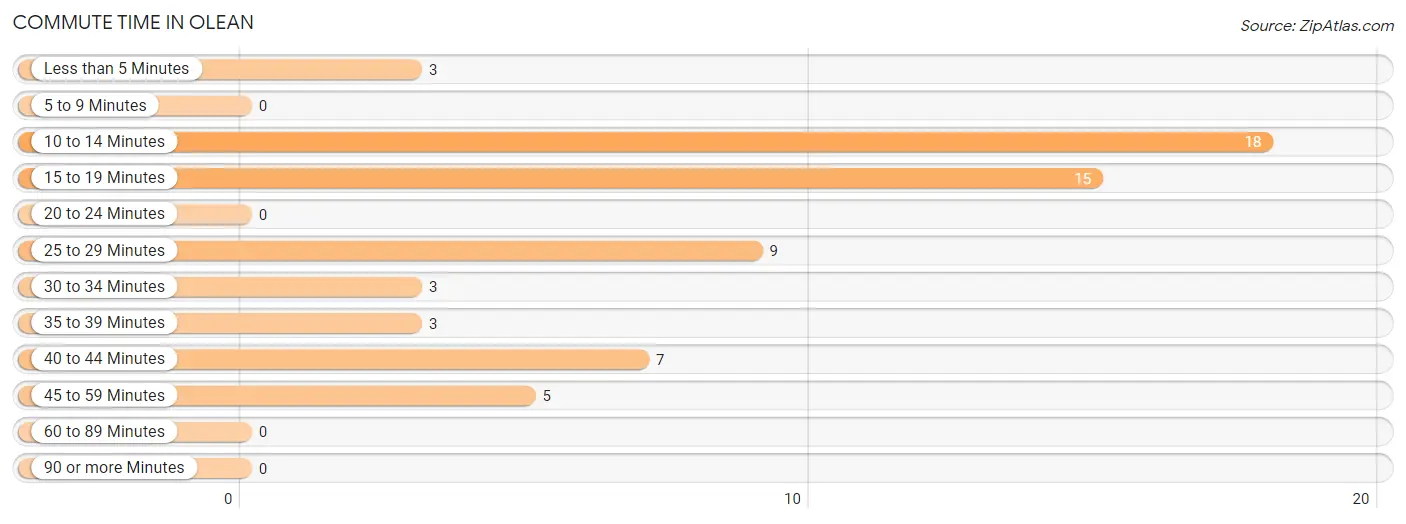
| Commute Time | # Commuters | % Commuters |
| Less than 5 Minutes | 3 | 4.8% |
| 5 to 9 Minutes | 0 | 0.0% |
| 10 to 14 Minutes | 18 | 28.6% |
| 15 to 19 Minutes | 15 | 23.8% |
| 20 to 24 Minutes | 0 | 0.0% |
| 25 to 29 Minutes | 9 | 14.3% |
| 30 to 34 Minutes | 3 | 4.8% |
| 35 to 39 Minutes | 3 | 4.8% |
| 40 to 44 Minutes | 7 | 11.1% |
| 45 to 59 Minutes | 5 | 7.9% |
| 60 to 89 Minutes | 0 | 0.0% |
| 90 or more Minutes | 0 | 0.0% |
Commute Time by Sex in Olean
The most common commute times in Olean are 10 to 14 minutes (10 commuters, 30.3%) for males and 10 to 14 minutes (8 commuters, 26.7%) for females.
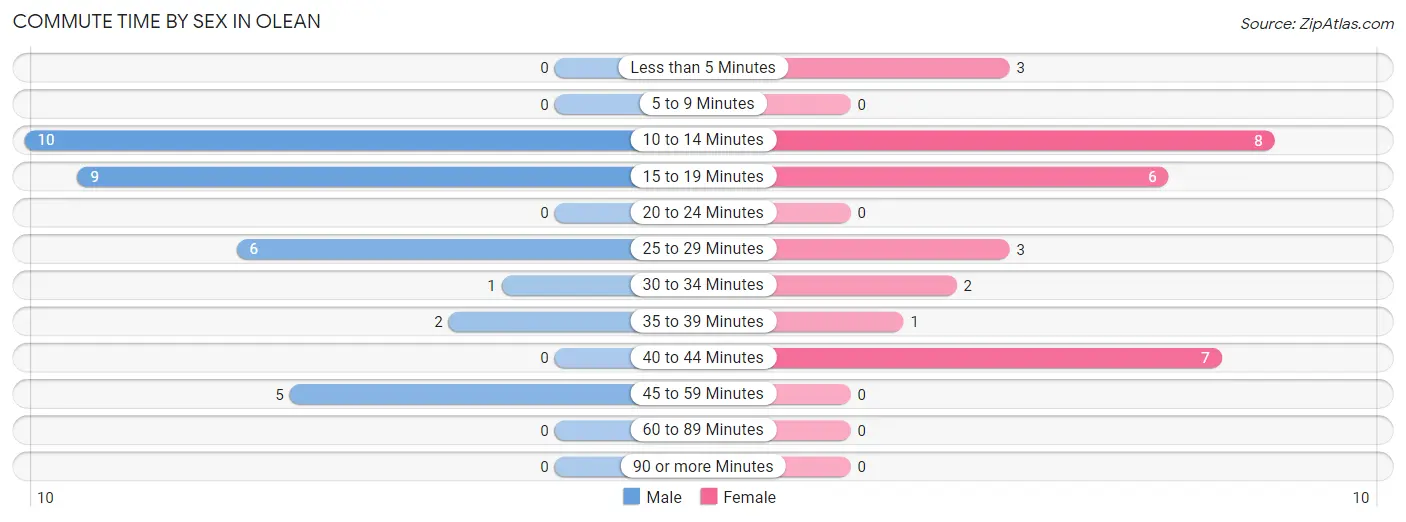
| Commute Time | Male | Female |
| Less than 5 Minutes | 0 (0.0%) | 3 (10.0%) |
| 5 to 9 Minutes | 0 (0.0%) | 0 (0.0%) |
| 10 to 14 Minutes | 10 (30.3%) | 8 (26.7%) |
| 15 to 19 Minutes | 9 (27.3%) | 6 (20.0%) |
| 20 to 24 Minutes | 0 (0.0%) | 0 (0.0%) |
| 25 to 29 Minutes | 6 (18.2%) | 3 (10.0%) |
| 30 to 34 Minutes | 1 (3.0%) | 2 (6.7%) |
| 35 to 39 Minutes | 2 (6.1%) | 1 (3.3%) |
| 40 to 44 Minutes | 0 (0.0%) | 7 (23.3%) |
| 45 to 59 Minutes | 5 (15.1%) | 0 (0.0%) |
| 60 to 89 Minutes | 0 (0.0%) | 0 (0.0%) |
| 90 or more Minutes | 0 (0.0%) | 0 (0.0%) |
Time of Departure to Work by Sex in Olean
The most frequent times of departure to work in Olean are 7:00 AM to 7:29 AM (11, 33.3%) for males and 6:00 AM to 6:29 AM (13, 43.3%) for females.
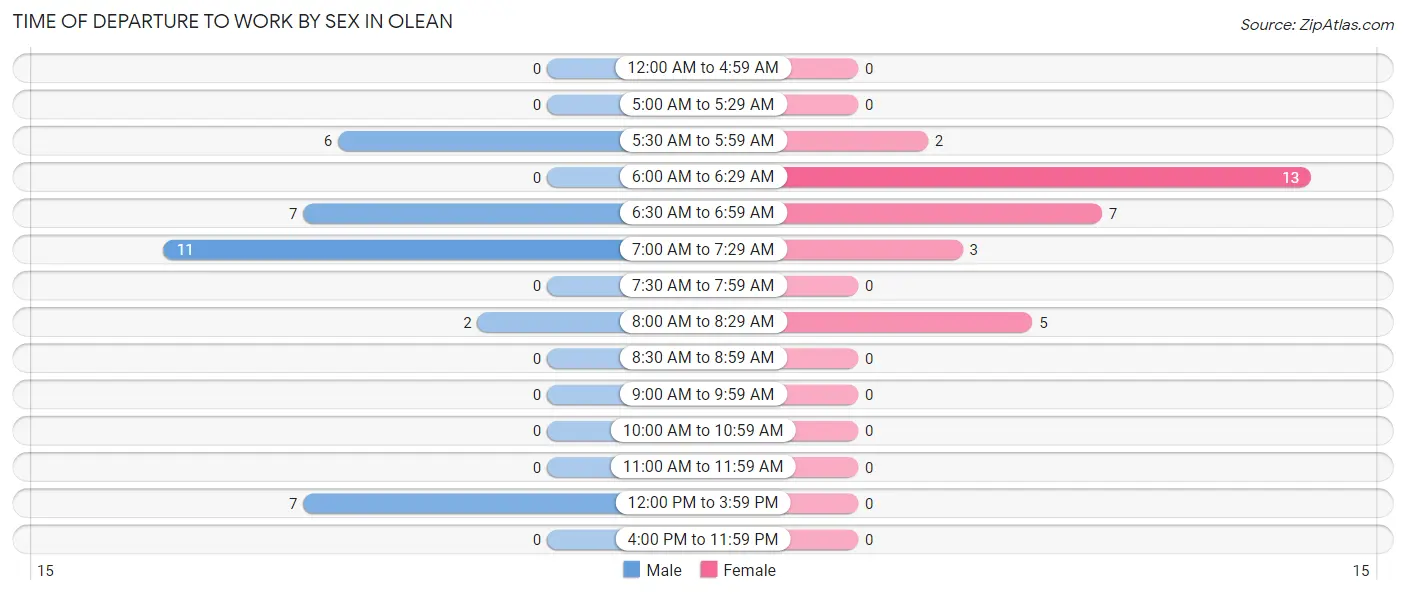
| Time of Departure | Male | Female |
| 12:00 AM to 4:59 AM | 0 (0.0%) | 0 (0.0%) |
| 5:00 AM to 5:29 AM | 0 (0.0%) | 0 (0.0%) |
| 5:30 AM to 5:59 AM | 6 (18.2%) | 2 (6.7%) |
| 6:00 AM to 6:29 AM | 0 (0.0%) | 13 (43.3%) |
| 6:30 AM to 6:59 AM | 7 (21.2%) | 7 (23.3%) |
| 7:00 AM to 7:29 AM | 11 (33.3%) | 3 (10.0%) |
| 7:30 AM to 7:59 AM | 0 (0.0%) | 0 (0.0%) |
| 8:00 AM to 8:29 AM | 2 (6.1%) | 5 (16.7%) |
| 8:30 AM to 8:59 AM | 0 (0.0%) | 0 (0.0%) |
| 9:00 AM to 9:59 AM | 0 (0.0%) | 0 (0.0%) |
| 10:00 AM to 10:59 AM | 0 (0.0%) | 0 (0.0%) |
| 11:00 AM to 11:59 AM | 0 (0.0%) | 0 (0.0%) |
| 12:00 PM to 3:59 PM | 7 (21.2%) | 0 (0.0%) |
| 4:00 PM to 11:59 PM | 0 (0.0%) | 0 (0.0%) |
| Total | 33 (100.0%) | 30 (100.0%) |
Housing Occupancy in Olean
Occupancy by Ownership in Olean
Of the total 45 dwellings in Olean, owner-occupied units account for 41 (91.1%), while renter-occupied units make up 4 (8.9%).
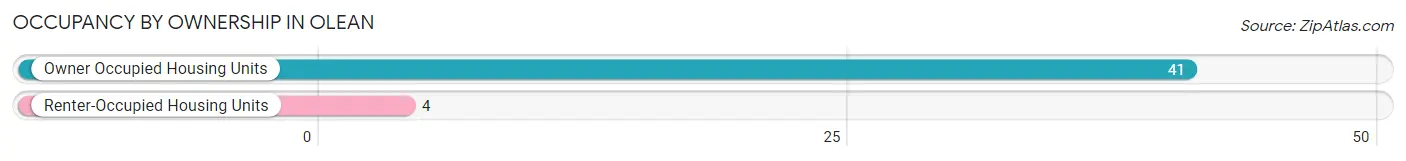
| Occupancy | # Housing Units | % Housing Units |
| Owner Occupied Housing Units | 41 | 91.1% |
| Renter-Occupied Housing Units | 4 | 8.9% |
| Total Occupied Housing Units | 45 | 100.0% |
Occupancy by Household Size in Olean
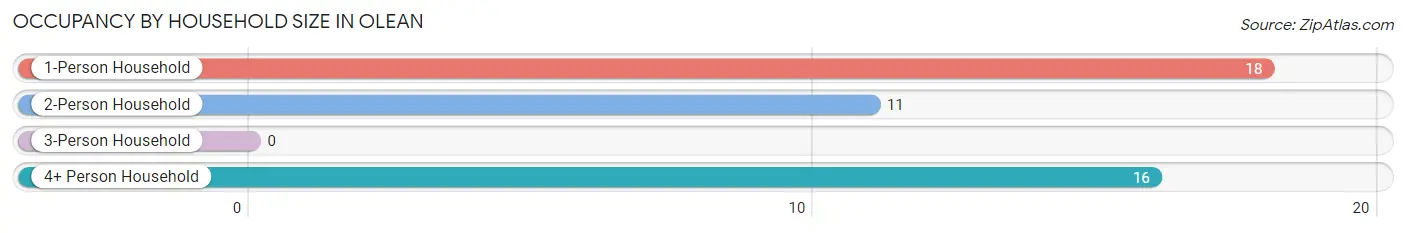
| Household Size | # Housing Units | % Housing Units |
| 1-Person Household | 18 | 40.0% |
| 2-Person Household | 11 | 24.4% |
| 3-Person Household | 0 | 0.0% |
| 4+ Person Household | 16 | 35.6% |
| Total Housing Units | 45 | 100.0% |
Occupancy by Ownership by Household Size in Olean
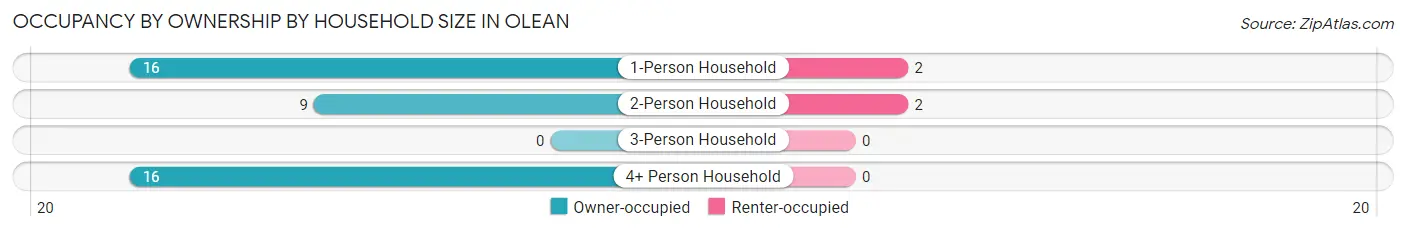
| Household Size | Owner-occupied | Renter-occupied |
| 1-Person Household | 16 (88.9%) | 2 (11.1%) |
| 2-Person Household | 9 (81.8%) | 2 (18.2%) |
| 3-Person Household | 0 (0.0%) | 0 (0.0%) |
| 4+ Person Household | 16 (100.0%) | 0 (0.0%) |
| Total Housing Units | 41 (91.1%) | 4 (8.9%) |
Occupancy by Educational Attainment in Olean
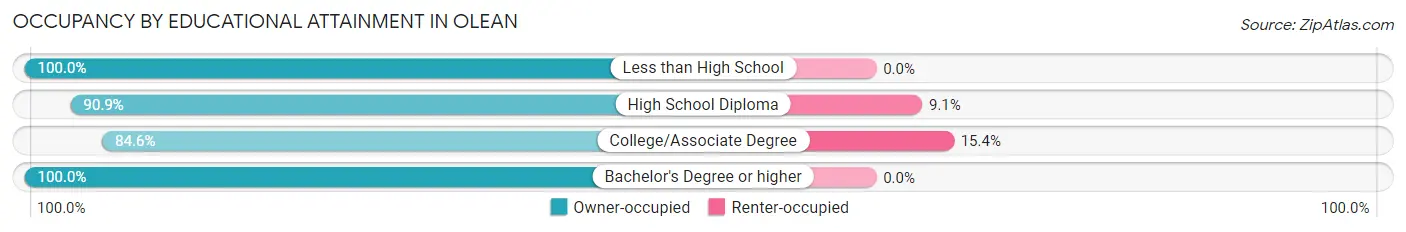
| Household Size | Owner-occupied | Renter-occupied |
| Less than High School | 8 (100.0%) | 0 (0.0%) |
| High School Diploma | 20 (90.9%) | 2 (9.1%) |
| College/Associate Degree | 11 (84.6%) | 2 (15.4%) |
| Bachelor's Degree or higher | 2 (100.0%) | 0 (0.0%) |
Occupancy by Age of Householder in Olean
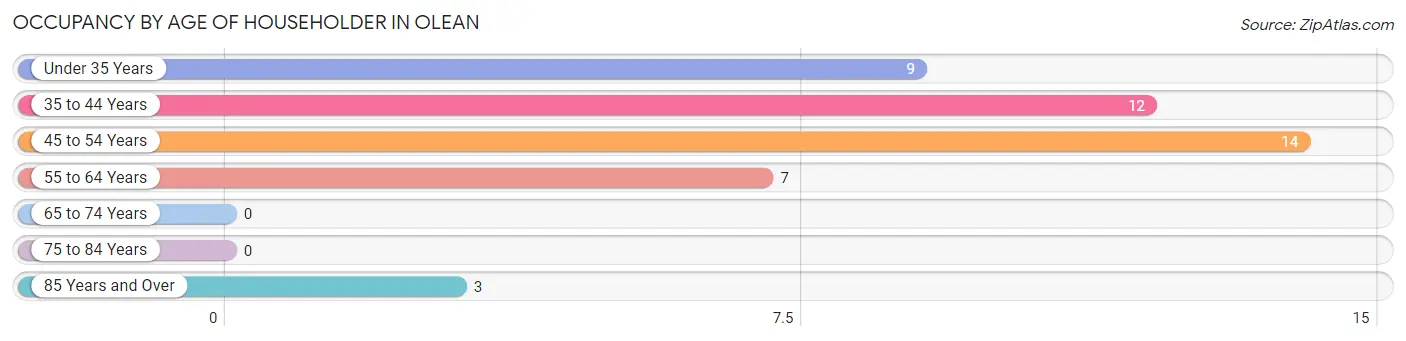
| Age Bracket | # Households | % Households |
| Under 35 Years | 9 | 20.0% |
| 35 to 44 Years | 12 | 26.7% |
| 45 to 54 Years | 14 | 31.1% |
| 55 to 64 Years | 7 | 15.6% |
| 65 to 74 Years | 0 | 0.0% |
| 75 to 84 Years | 0 | 0.0% |
| 85 Years and Over | 3 | 6.7% |
| Total | 45 | 100.0% |
Housing Finances in Olean
Median Income by Occupancy in Olean
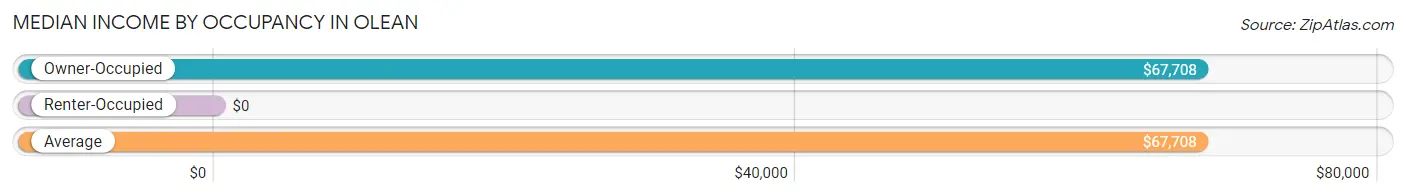
| Occupancy Type | # Households | Median Income |
| Owner-Occupied | 41 (91.1%) | $67,708 |
| Renter-Occupied | 4 (8.9%) | $0 |
| Average | 45 (100.0%) | $67,708 |
Occupancy by Householder Income Bracket in Olean
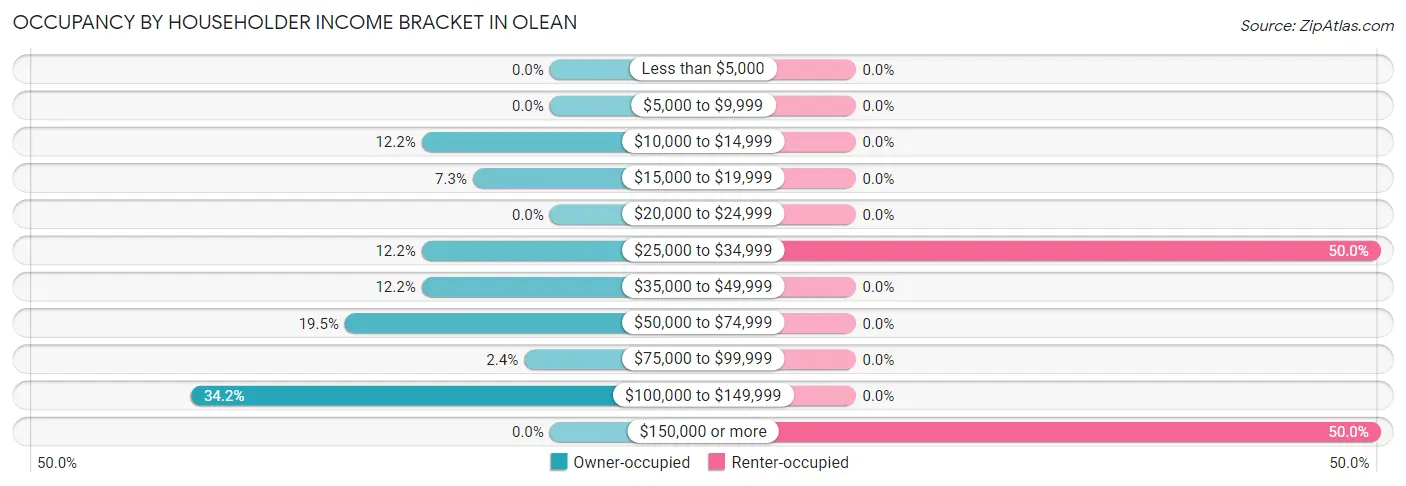
| Income Bracket | Owner-occupied | Renter-occupied |
| Less than $5,000 | 0 (0.0%) | 0 (0.0%) |
| $5,000 to $9,999 | 0 (0.0%) | 0 (0.0%) |
| $10,000 to $14,999 | 5 (12.2%) | 0 (0.0%) |
| $15,000 to $19,999 | 3 (7.3%) | 0 (0.0%) |
| $20,000 to $24,999 | 0 (0.0%) | 0 (0.0%) |
| $25,000 to $34,999 | 5 (12.2%) | 2 (50.0%) |
| $35,000 to $49,999 | 5 (12.2%) | 0 (0.0%) |
| $50,000 to $74,999 | 8 (19.5%) | 0 (0.0%) |
| $75,000 to $99,999 | 1 (2.4%) | 0 (0.0%) |
| $100,000 to $149,999 | 14 (34.2%) | 0 (0.0%) |
| $150,000 or more | 0 (0.0%) | 2 (50.0%) |
| Total | 41 (100.0%) | 4 (100.0%) |
Monthly Housing Cost Tiers in Olean
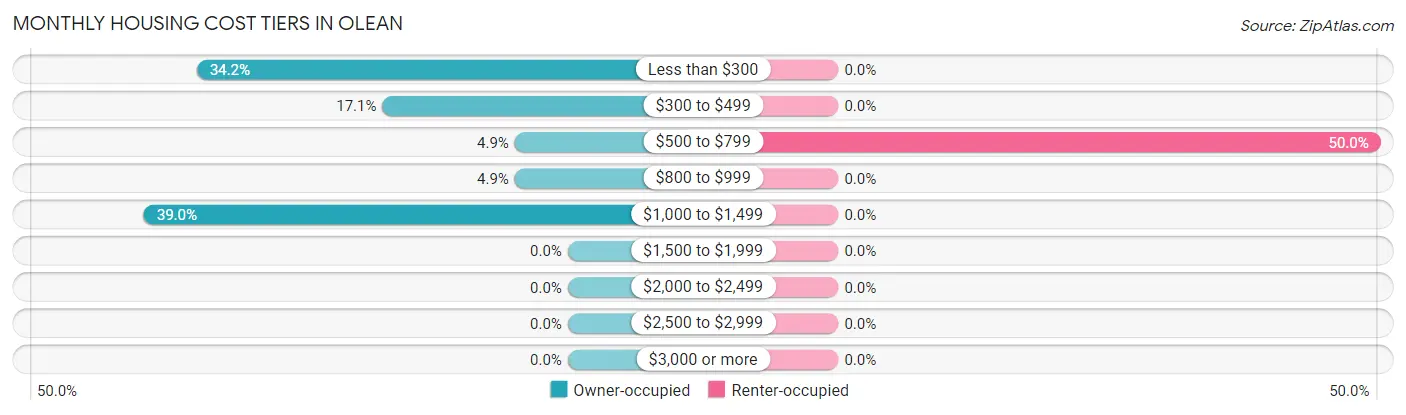
| Monthly Cost | Owner-occupied | Renter-occupied |
| Less than $300 | 14 (34.2%) | 0 (0.0%) |
| $300 to $499 | 7 (17.1%) | 0 (0.0%) |
| $500 to $799 | 2 (4.9%) | 2 (50.0%) |
| $800 to $999 | 2 (4.9%) | 0 (0.0%) |
| $1,000 to $1,499 | 16 (39.0%) | 0 (0.0%) |
| $1,500 to $1,999 | 0 (0.0%) | 0 (0.0%) |
| $2,000 to $2,499 | 0 (0.0%) | 0 (0.0%) |
| $2,500 to $2,999 | 0 (0.0%) | 0 (0.0%) |
| $3,000 or more | 0 (0.0%) | 0 (0.0%) |
| Total | 41 (100.0%) | 4 (100.0%) |
Physical Housing Characteristics in Olean
Housing Structures in Olean
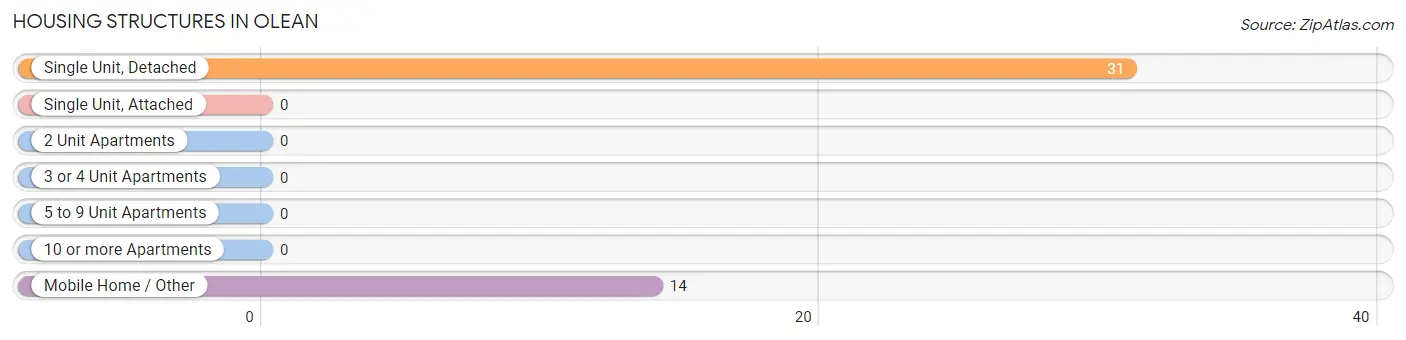
| Structure Type | # Housing Units | % Housing Units |
| Single Unit, Detached | 31 | 68.9% |
| Single Unit, Attached | 0 | 0.0% |
| 2 Unit Apartments | 0 | 0.0% |
| 3 or 4 Unit Apartments | 0 | 0.0% |
| 5 to 9 Unit Apartments | 0 | 0.0% |
| 10 or more Apartments | 0 | 0.0% |
| Mobile Home / Other | 14 | 31.1% |
| Total | 45 | 100.0% |
Housing Structures by Occupancy in Olean
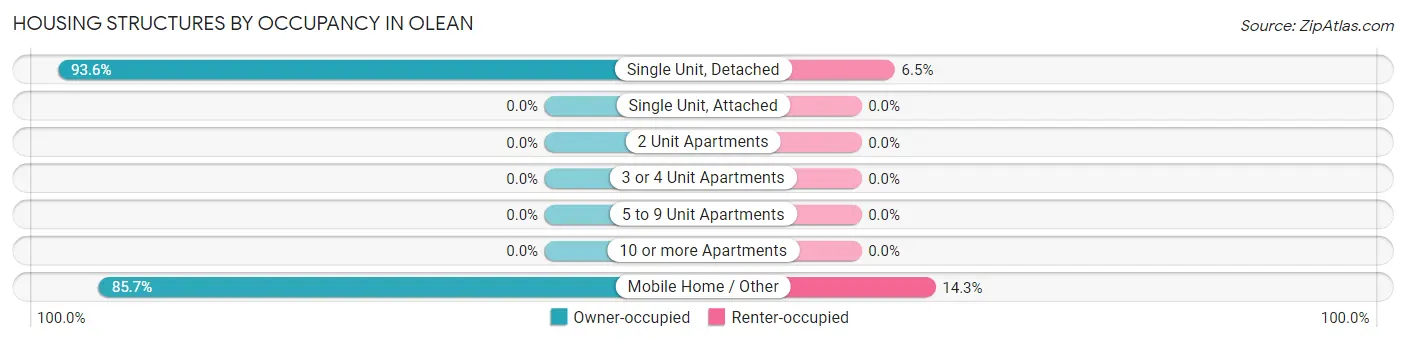
| Structure Type | Owner-occupied | Renter-occupied |
| Single Unit, Detached | 29 (93.5%) | 2 (6.5%) |
| Single Unit, Attached | 0 (0.0%) | 0 (0.0%) |
| 2 Unit Apartments | 0 (0.0%) | 0 (0.0%) |
| 3 or 4 Unit Apartments | 0 (0.0%) | 0 (0.0%) |
| 5 to 9 Unit Apartments | 0 (0.0%) | 0 (0.0%) |
| 10 or more Apartments | 0 (0.0%) | 0 (0.0%) |
| Mobile Home / Other | 12 (85.7%) | 2 (14.3%) |
| Total | 41 (91.1%) | 4 (8.9%) |
Housing Structures by Number of Rooms in Olean
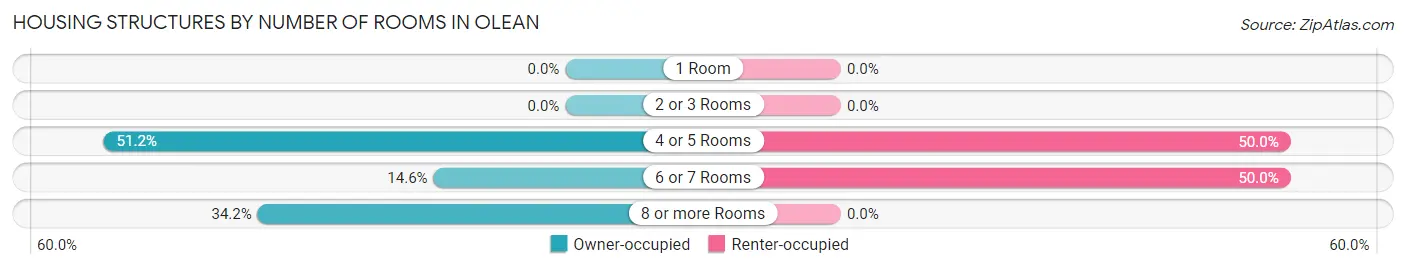
| Number of Rooms | Owner-occupied | Renter-occupied |
| 1 Room | 0 (0.0%) | 0 (0.0%) |
| 2 or 3 Rooms | 0 (0.0%) | 0 (0.0%) |
| 4 or 5 Rooms | 21 (51.2%) | 2 (50.0%) |
| 6 or 7 Rooms | 6 (14.6%) | 2 (50.0%) |
| 8 or more Rooms | 14 (34.2%) | 0 (0.0%) |
| Total | 41 (100.0%) | 4 (100.0%) |
Housing Structure by Heating Type in Olean
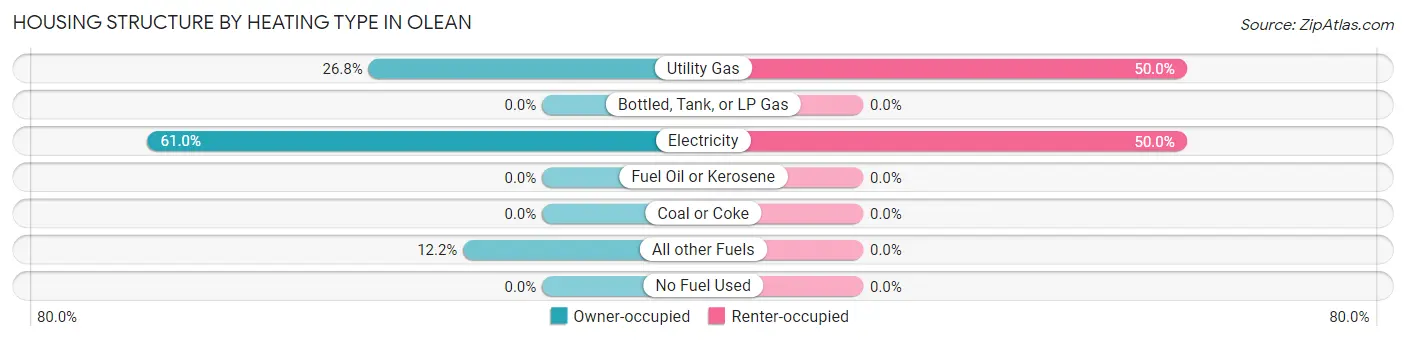
| Heating Type | Owner-occupied | Renter-occupied |
| Utility Gas | 11 (26.8%) | 2 (50.0%) |
| Bottled, Tank, or LP Gas | 0 (0.0%) | 0 (0.0%) |
| Electricity | 25 (61.0%) | 2 (50.0%) |
| Fuel Oil or Kerosene | 0 (0.0%) | 0 (0.0%) |
| Coal or Coke | 0 (0.0%) | 0 (0.0%) |
| All other Fuels | 5 (12.2%) | 0 (0.0%) |
| No Fuel Used | 0 (0.0%) | 0 (0.0%) |
| Total | 41 (100.0%) | 4 (100.0%) |
Household Vehicle Usage in Olean
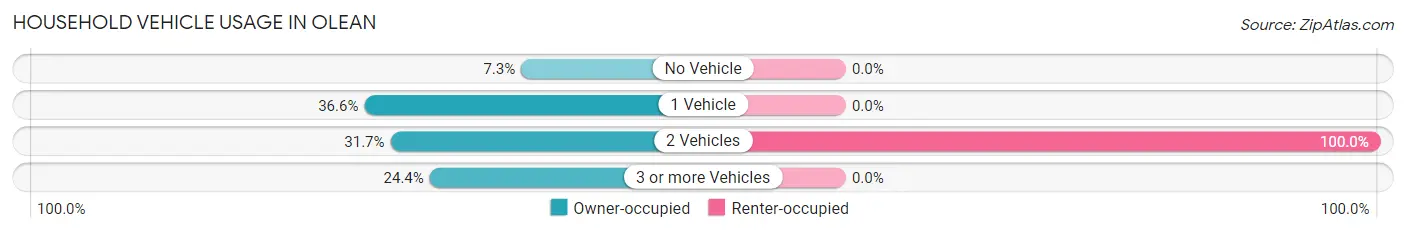
| Vehicles per Household | Owner-occupied | Renter-occupied |
| No Vehicle | 3 (7.3%) | 0 (0.0%) |
| 1 Vehicle | 15 (36.6%) | 0 (0.0%) |
| 2 Vehicles | 13 (31.7%) | 4 (100.0%) |
| 3 or more Vehicles | 10 (24.4%) | 0 (0.0%) |
| Total | 41 (100.0%) | 4 (100.0%) |
Real Estate & Mortgages in Olean
Real Estate and Mortgage Overview in Olean
| Characteristic | Without Mortgage | With Mortgage |
| Housing Units | 18 | 23 |
| Median Property Value | $19,100 | $97,500 |
| Median Household Income | $30,500 | $0 |
| Monthly Housing Costs | $208 | $0 |
| Real Estate Taxes | $220 | $6 |
Property Value by Mortgage Status in Olean
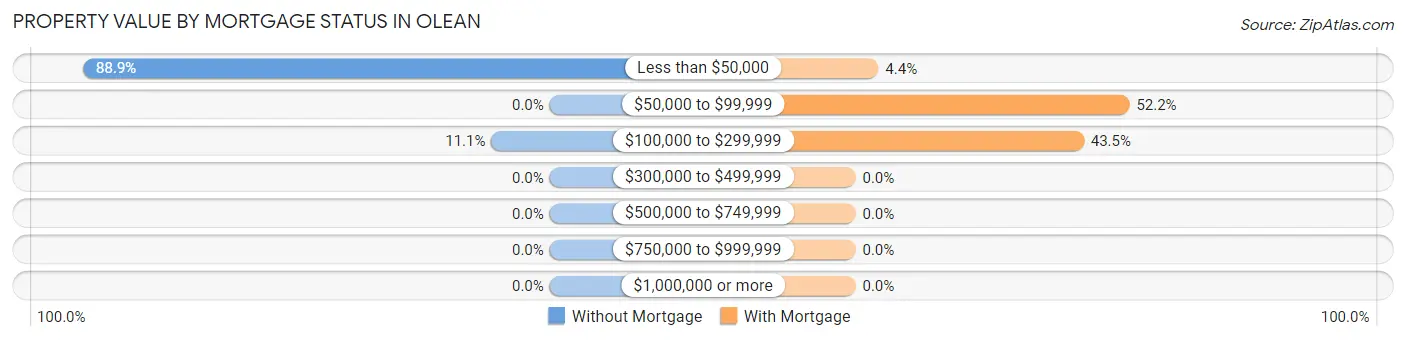
| Property Value | Without Mortgage | With Mortgage |
| Less than $50,000 | 16 (88.9%) | 1 (4.3%) |
| $50,000 to $99,999 | 0 (0.0%) | 12 (52.2%) |
| $100,000 to $299,999 | 2 (11.1%) | 10 (43.5%) |
| $300,000 to $499,999 | 0 (0.0%) | 0 (0.0%) |
| $500,000 to $749,999 | 0 (0.0%) | 0 (0.0%) |
| $750,000 to $999,999 | 0 (0.0%) | 0 (0.0%) |
| $1,000,000 or more | 0 (0.0%) | 0 (0.0%) |
| Total | 18 (100.0%) | 23 (100.0%) |
Household Income by Mortgage Status in Olean
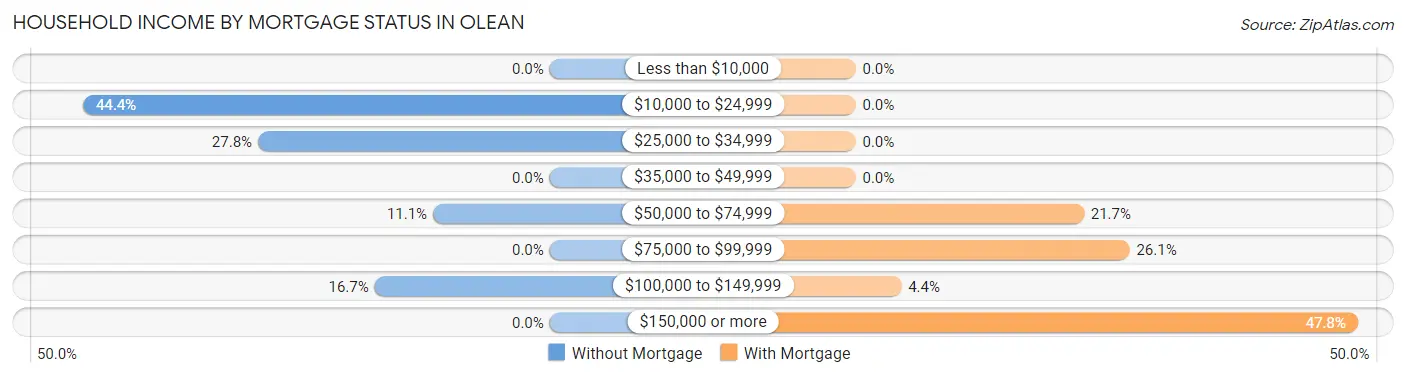
| Household Income | Without Mortgage | With Mortgage |
| Less than $10,000 | 0 (0.0%) | 0 (0.0%) |
| $10,000 to $24,999 | 8 (44.4%) | 0 (0.0%) |
| $25,000 to $34,999 | 5 (27.8%) | 0 (0.0%) |
| $35,000 to $49,999 | 0 (0.0%) | 0 (0.0%) |
| $50,000 to $74,999 | 2 (11.1%) | 5 (21.7%) |
| $75,000 to $99,999 | 0 (0.0%) | 6 (26.1%) |
| $100,000 to $149,999 | 3 (16.7%) | 1 (4.3%) |
| $150,000 or more | 0 (0.0%) | 11 (47.8%) |
| Total | 18 (100.0%) | 23 (100.0%) |
Property Value to Household Income Ratio in Olean
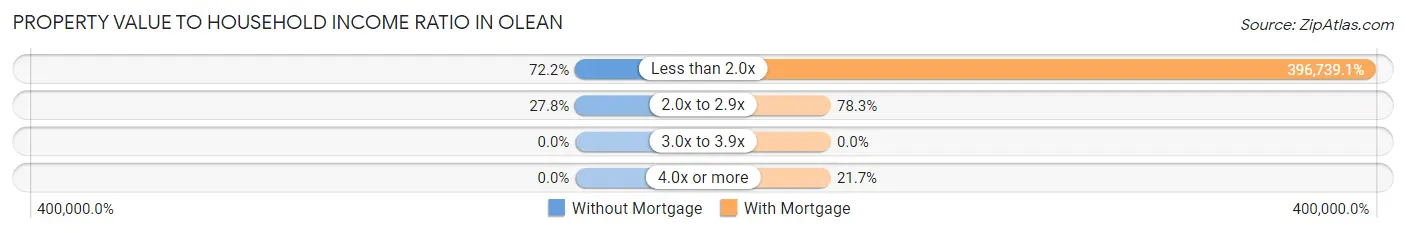
| Value-to-Income Ratio | Without Mortgage | With Mortgage |
| Less than 2.0x | 13 (72.2%) | 91,250 (396,739.1%) |
| 2.0x to 2.9x | 5 (27.8%) | 18 (78.3%) |
| 3.0x to 3.9x | 0 (0.0%) | 0 (0.0%) |
| 4.0x or more | 0 (0.0%) | 5 (21.7%) |
| Total | 18 (100.0%) | 23 (100.0%) |
Real Estate Taxes by Mortgage Status in Olean
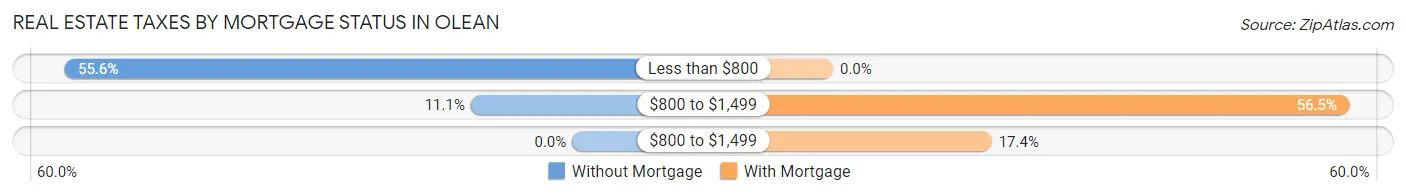
| Property Taxes | Without Mortgage | With Mortgage |
| Less than $800 | 10 (55.6%) | 0 (0.0%) |
| $800 to $1,499 | 2 (11.1%) | 13 (56.5%) |
| $800 to $1,499 | 0 (0.0%) | 4 (17.4%) |
| Total | 18 (100.0%) | 23 (100.0%) |
Health & Disability in Olean
Health Insurance Coverage by Age in Olean
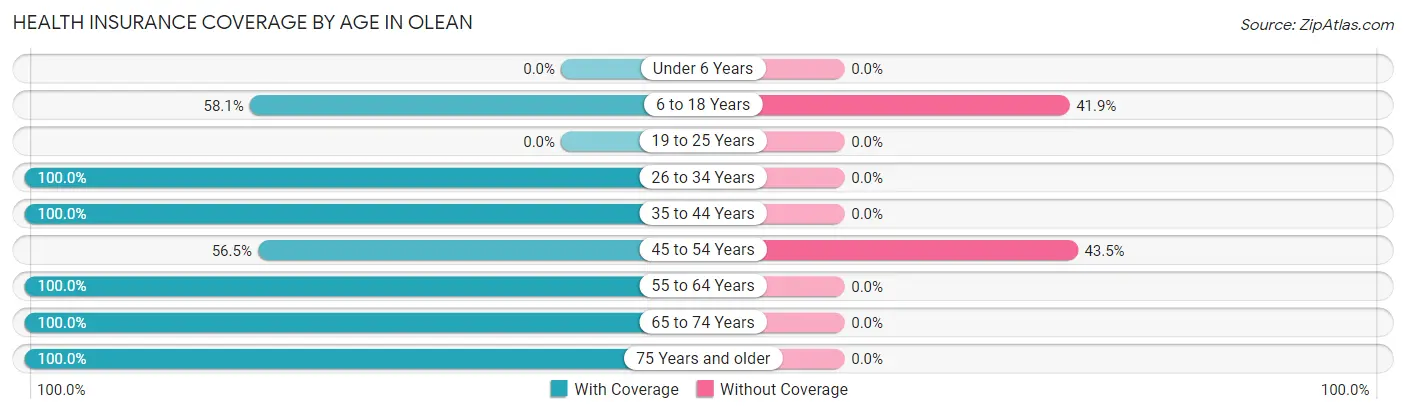
| Age Bracket | With Coverage | Without Coverage |
| Under 6 Years | 0 (0.0%) | 0 (0.0%) |
| 6 to 18 Years | 18 (58.1%) | 13 (41.9%) |
| 19 to 25 Years | 0 (0.0%) | 0 (0.0%) |
| 26 to 34 Years | 16 (100.0%) | 0 (0.0%) |
| 35 to 44 Years | 20 (100.0%) | 0 (0.0%) |
| 45 to 54 Years | 13 (56.5%) | 10 (43.5%) |
| 55 to 64 Years | 12 (100.0%) | 0 (0.0%) |
| 65 to 74 Years | 7 (100.0%) | 0 (0.0%) |
| 75 Years and older | 3 (100.0%) | 0 (0.0%) |
| Total | 89 (79.5%) | 23 (20.5%) |
Health Insurance Coverage by Citizenship Status in Olean
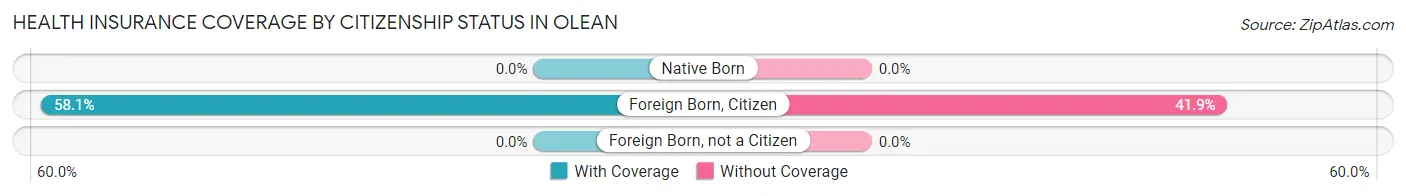
| Citizenship Status | With Coverage | Without Coverage |
| Native Born | 0 (0.0%) | 0 (0.0%) |
| Foreign Born, Citizen | 18 (58.1%) | 13 (41.9%) |
| Foreign Born, not a Citizen | 0 (0.0%) | 0 (0.0%) |
Health Insurance Coverage by Household Income in Olean
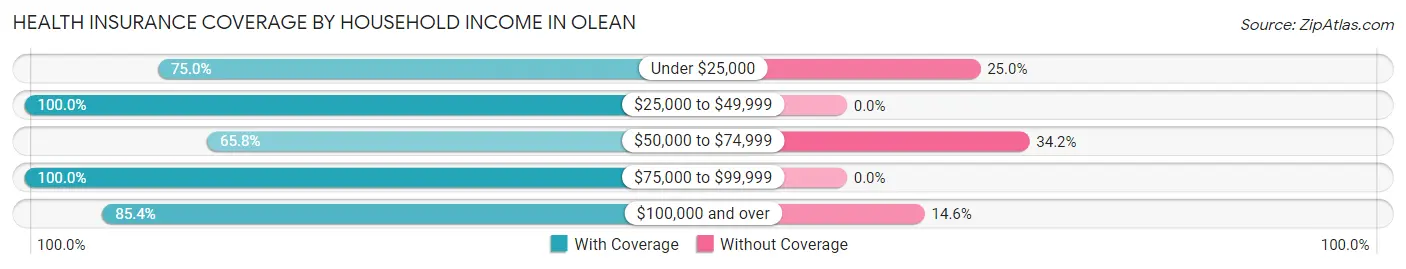
| Household Income | With Coverage | Without Coverage |
| Under $25,000 | 9 (75.0%) | 3 (25.0%) |
| $25,000 to $49,999 | 13 (100.0%) | 0 (0.0%) |
| $50,000 to $74,999 | 25 (65.8%) | 13 (34.2%) |
| $75,000 to $99,999 | 1 (100.0%) | 0 (0.0%) |
| $100,000 and over | 41 (85.4%) | 7 (14.6%) |
Public vs Private Health Insurance Coverage by Age in Olean
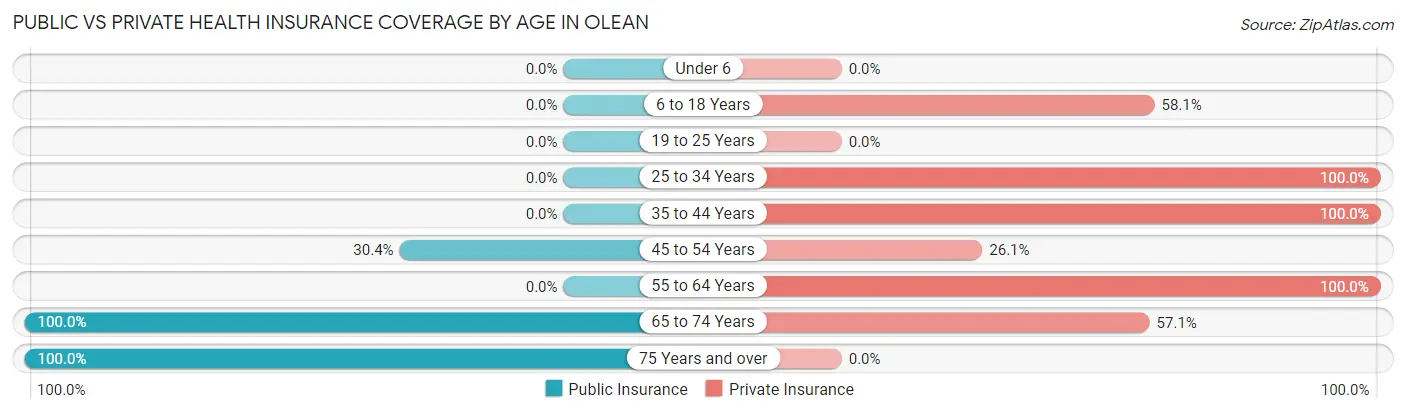
| Age Bracket | Public Insurance | Private Insurance |
| Under 6 | 0 (0.0%) | 0 (0.0%) |
| 6 to 18 Years | 0 (0.0%) | 18 (58.1%) |
| 19 to 25 Years | 0 (0.0%) | 0 (0.0%) |
| 25 to 34 Years | 0 (0.0%) | 16 (100.0%) |
| 35 to 44 Years | 0 (0.0%) | 20 (100.0%) |
| 45 to 54 Years | 7 (30.4%) | 6 (26.1%) |
| 55 to 64 Years | 0 (0.0%) | 12 (100.0%) |
| 65 to 74 Years | 7 (100.0%) | 4 (57.1%) |
| 75 Years and over | 3 (100.0%) | 0 (0.0%) |
| Total | 17 (15.2%) | 76 (67.9%) |
Disability Status by Sex by Age in Olean
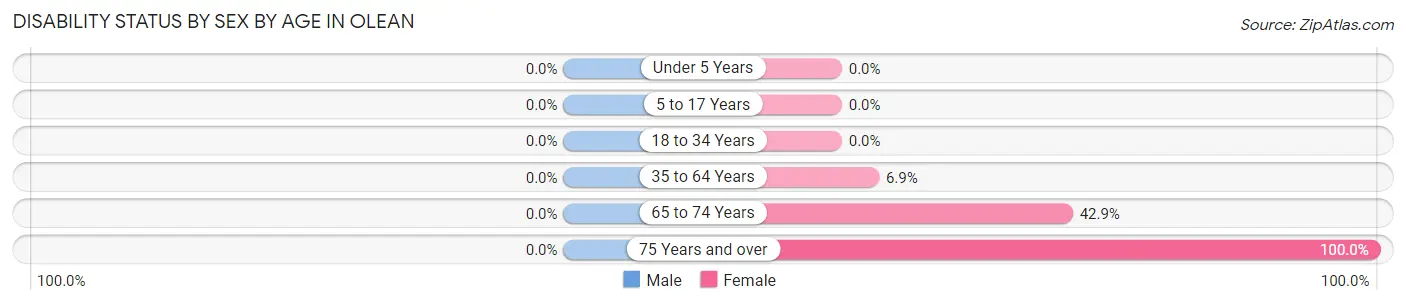
| Age Bracket | Male | Female |
| Under 5 Years | 0 (0.0%) | 0 (0.0%) |
| 5 to 17 Years | 0 (0.0%) | 0 (0.0%) |
| 18 to 34 Years | 0 (0.0%) | 0 (0.0%) |
| 35 to 64 Years | 0 (0.0%) | 2 (6.9%) |
| 65 to 74 Years | 0 (0.0%) | 3 (42.9%) |
| 75 Years and over | 0 (0.0%) | 3 (100.0%) |
Disability Class by Sex by Age in Olean
Disability Class: Hearing Difficulty
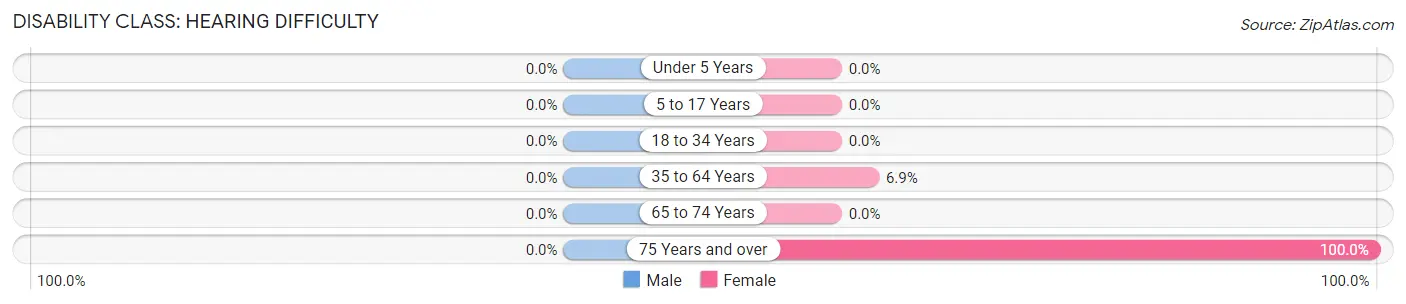
| Age Bracket | Male | Female |
| Under 5 Years | 0 (0.0%) | 0 (0.0%) |
| 5 to 17 Years | 0 (0.0%) | 0 (0.0%) |
| 18 to 34 Years | 0 (0.0%) | 0 (0.0%) |
| 35 to 64 Years | 0 (0.0%) | 2 (6.9%) |
| 65 to 74 Years | 0 (0.0%) | 0 (0.0%) |
| 75 Years and over | 0 (0.0%) | 3 (100.0%) |
Disability Class: Vision Difficulty
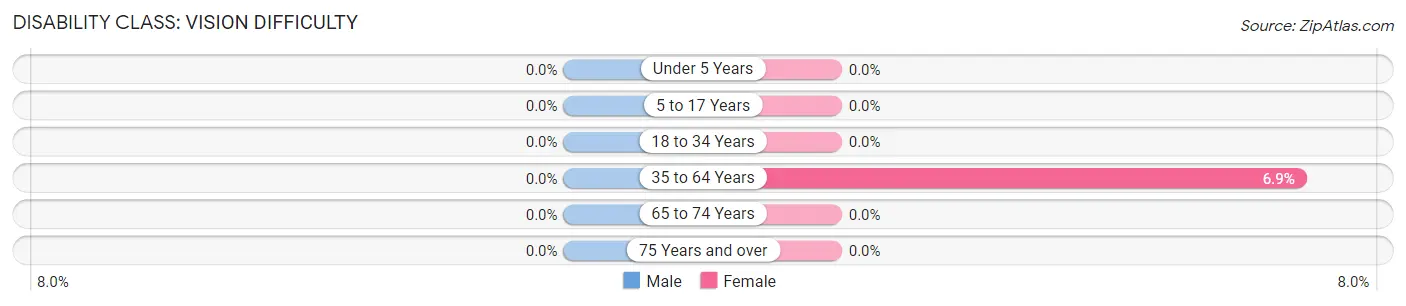
| Age Bracket | Male | Female |
| Under 5 Years | 0 (0.0%) | 0 (0.0%) |
| 5 to 17 Years | 0 (0.0%) | 0 (0.0%) |
| 18 to 34 Years | 0 (0.0%) | 0 (0.0%) |
| 35 to 64 Years | 0 (0.0%) | 2 (6.9%) |
| 65 to 74 Years | 0 (0.0%) | 0 (0.0%) |
| 75 Years and over | 0 (0.0%) | 0 (0.0%) |
Disability Class: Cognitive Difficulty
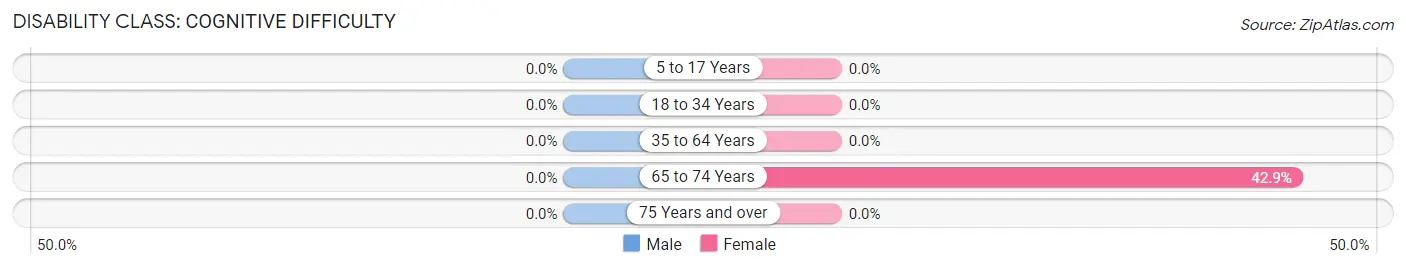
| Age Bracket | Male | Female |
| 5 to 17 Years | 0 (0.0%) | 0 (0.0%) |
| 18 to 34 Years | 0 (0.0%) | 0 (0.0%) |
| 35 to 64 Years | 0 (0.0%) | 0 (0.0%) |
| 65 to 74 Years | 0 (0.0%) | 3 (42.9%) |
| 75 Years and over | 0 (0.0%) | 0 (0.0%) |
Disability Class: Ambulatory Difficulty
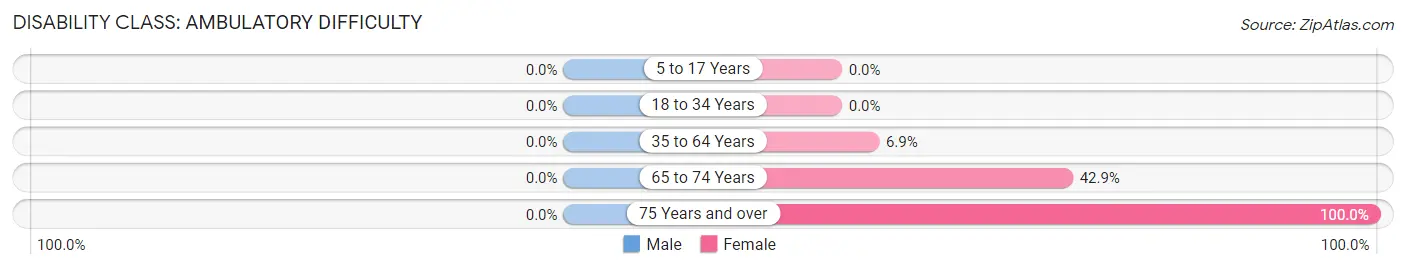
| Age Bracket | Male | Female |
| 5 to 17 Years | 0 (0.0%) | 0 (0.0%) |
| 18 to 34 Years | 0 (0.0%) | 0 (0.0%) |
| 35 to 64 Years | 0 (0.0%) | 2 (6.9%) |
| 65 to 74 Years | 0 (0.0%) | 3 (42.9%) |
| 75 Years and over | 0 (0.0%) | 3 (100.0%) |
Disability Class: Self-Care Difficulty
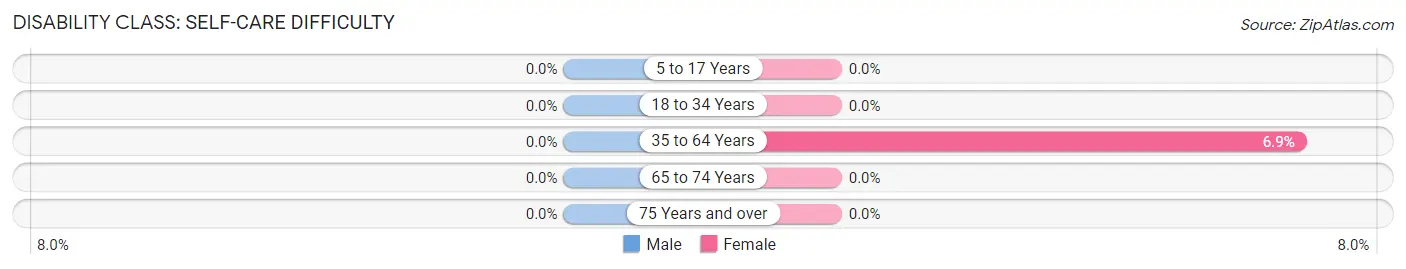
| Age Bracket | Male | Female |
| 5 to 17 Years | 0 (0.0%) | 0 (0.0%) |
| 18 to 34 Years | 0 (0.0%) | 0 (0.0%) |
| 35 to 64 Years | 0 (0.0%) | 2 (6.9%) |
| 65 to 74 Years | 0 (0.0%) | 0 (0.0%) |
| 75 Years and over | 0 (0.0%) | 0 (0.0%) |
Technology Access in Olean
Computing Device Access in Olean
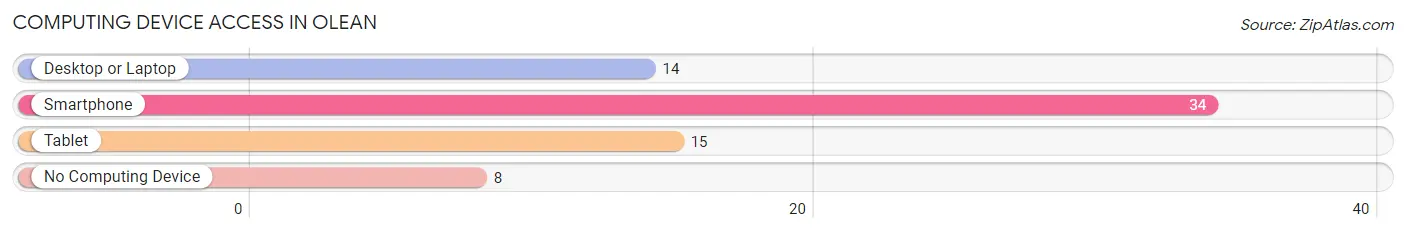
| Device Type | # Households | % Households |
| Desktop or Laptop | 14 | 31.1% |
| Smartphone | 34 | 75.6% |
| Tablet | 15 | 33.3% |
| No Computing Device | 8 | 17.8% |
| Total | 45 | 100.0% |
Internet Access in Olean
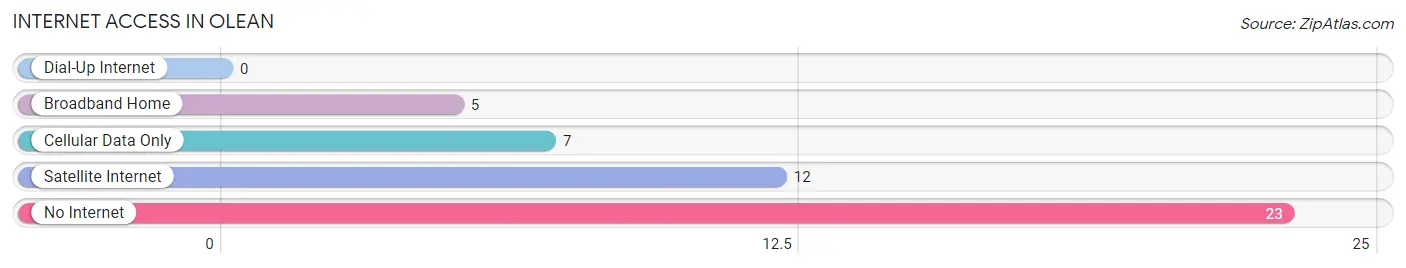
| Internet Type | # Households | % Households |
| Dial-Up Internet | 0 | 0.0% |
| Broadband Home | 5 | 11.1% |
| Cellular Data Only | 7 | 15.6% |
| Satellite Internet | 12 | 26.7% |
| No Internet | 23 | 51.1% |
| Total | 45 | 100.0% |
Olean Summary
Olean is a small town located in the southeastern corner of Missouri, in the Ozark Mountains. It is situated in the foothills of the Ozarks, and is surrounded by rolling hills and lush forests. The town is located in the heart of the Ozark National Scenic Riverways, and is home to a variety of outdoor activities, including fishing, camping, hiking, and canoeing.
Olean was founded in 1845 by a group of settlers from Kentucky and Tennessee. The town was named after the nearby Olean Creek, which was named after the Olean Indians, who were the original inhabitants of the area. The town was originally a farming community, and the main crops grown were corn, wheat, and oats. In the late 1800s, the town began to grow and develop, and by the early 1900s, it had become a thriving community.
The economy of Olean is largely based on agriculture and tourism. The town is home to several farms, which produce a variety of crops, including corn, wheat, oats, soybeans, and hay. The town also has a number of small businesses, including restaurants, shops, and other services. Tourism is also an important part of the local economy, as the town is home to several popular attractions, including the Ozark National Scenic Riverways, the Ozark Trail, and the Mark Twain National Forest.
The population of Olean was 1,845 in the year 2000. The town is predominantly white, with a small African American population. The median household income in Olean is $35,000, and the median home value is $90,000. The town has a low unemployment rate, and the majority of the population is employed in the agricultural and tourism industries.
Olean is served by the Olean Public School District, which consists of two elementary schools, one middle school, and one high school. The town also has a number of private schools, including a Catholic school and a Christian school. The town is home to a number of churches, including Baptist, Methodist, and Presbyterian.
Olean is a small town with a rich history and a vibrant economy. The town is home to a variety of outdoor activities, and is a popular destination for tourists. The town is also home to a number of small businesses, and the majority of the population is employed in the agricultural and tourism industries. The town has a low unemployment rate, and the median household income is $35,000. Olean is a great place to live, work, and play.
Common Questions
What is Per Capita Income in Olean?
Per Capita income in Olean is $29,591.
What is the Median Family Income in Olean?
Median Family Income in Olean is $103,333.
What is the Median Household income in Olean?
Median Household Income in Olean is $67,708.
What is Income or Wage Gap in Olean?
Income or Wage Gap in Olean is 45.0%.
Women in Olean earn 55.0 cents for every dollar earned by a man.
What is Inequality or Gini Index in Olean?
Inequality or Gini Index in Olean is 0.40.
What is the Total Population of Olean?
Total Population of Olean is 112.
What is the Total Male Population of Olean?
Total Male Population of Olean is 48.
What is the Total Female Population of Olean?
Total Female Population of Olean is 64.
What is the Ratio of Males per 100 Females in Olean?
There are 75.00 Males per 100 Females in Olean.
What is the Ratio of Females per 100 Males in Olean?
There are 133.33 Females per 100 Males in Olean.
What is the Median Population Age in Olean?
Median Population Age in Olean is 39.5 Years.
What is the Average Family Size in Olean
Average Family Size in Olean is 3.6 People.
What is the Average Household Size in Olean
Average Household Size in Olean is 2.5 People.
How Large is the Labor Force in Olean?
There are 63 People in the Labor Forcein in Olean.
What is the Percentage of People in the Labor Force in Olean?
68.5% of People are in the Labor Force in Olean.