Oak Ridge, MO Map & Demographics
Oak Ridge Map
Oak Ridge Overview
$25,710
PER CAPITA INCOME
$66,786
AVG FAMILY INCOME
$67,500
AVG HOUSEHOLD INCOME
25.5%
WAGE / INCOME GAP [ % ]
74.5¢/ $1
WAGE / INCOME GAP [ $ ]
0.32
INEQUALITY / GINI INDEX
279
TOTAL POPULATION
143
MALE POPULATION
136
FEMALE POPULATION
105.15
MALES / 100 FEMALES
95.10
FEMALES / 100 MALES
41.6
MEDIAN AGE
3.1
AVG FAMILY SIZE
3.0
AVG HOUSEHOLD SIZE
127
LABOR FORCE [ PEOPLE ]
59.3%
PERCENT IN LABOR FORCE
1.6%
UNEMPLOYMENT RATE
Oak Ridge Zip Codes
Oak Ridge Area Codes
Income in Oak Ridge
Income Overview in Oak Ridge
Per Capita Income in Oak Ridge is $25,710, while median incomes of families and households are $66,786 and $67,500 respectively.
| Characteristic | Number | Measure |
| Per Capita Income | 279 | $25,710 |
| Median Family Income | 76 | $66,786 |
| Mean Family Income | 76 | $74,314 |
| Median Household Income | 94 | $67,500 |
| Mean Household Income | 94 | $73,635 |
| Income Deficit | 76 | $0 |
| Wage / Income Gap (%) | 279 | 25.53% |
| Wage / Income Gap ($) | 279 | 74.47¢ per $1 |
| Gini / Inequality Index | 279 | 0.32 |
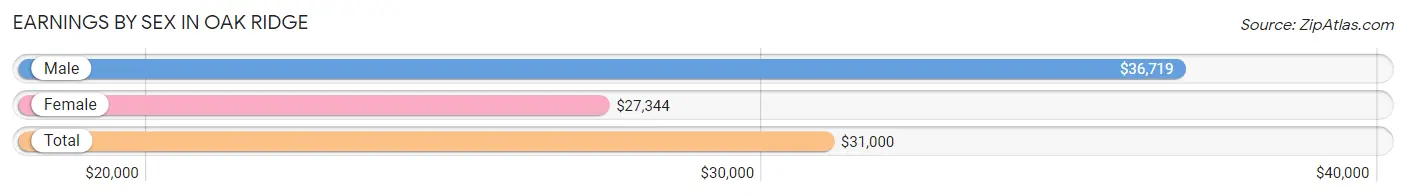
Earnings by Sex in Oak Ridge
Average Earnings in Oak Ridge are $31,000, $36,719 for men and $27,344 for women, a difference of 25.5%.
| Sex | Number | Average Earnings |
| Male | 67 (51.5%) | $36,719 |
| Female | 63 (48.5%) | $27,344 |
| Total | 130 (100.0%) | $31,000 |
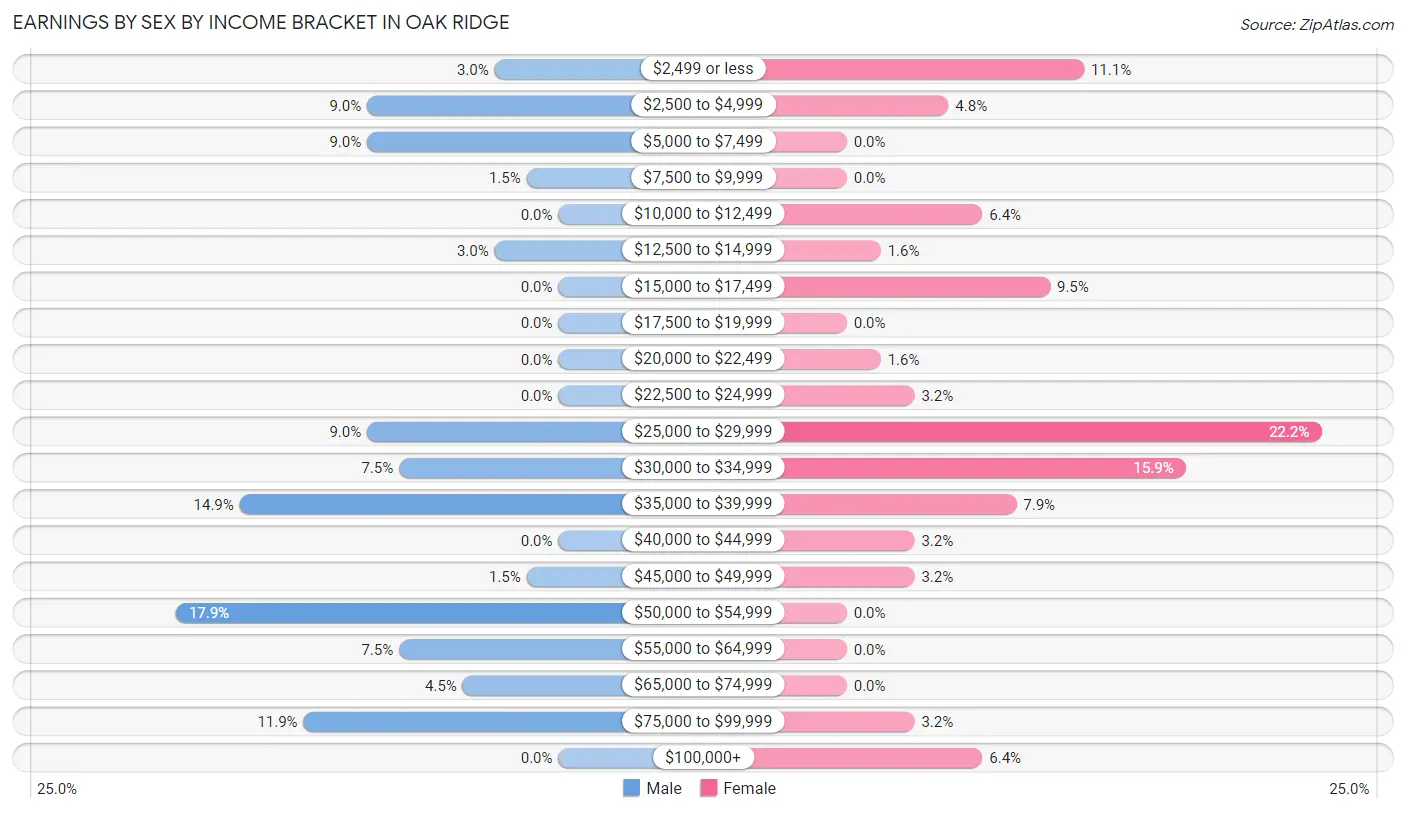
Earnings by Sex by Income Bracket in Oak Ridge
The most common earnings brackets in Oak Ridge are $50,000 to $54,999 for men (12 | 17.9%) and $25,000 to $29,999 for women (14 | 22.2%).
| Income | Male | Female |
| $2,499 or less | 2 (3.0%) | 7 (11.1%) |
| $2,500 to $4,999 | 6 (9.0%) | 3 (4.8%) |
| $5,000 to $7,499 | 6 (9.0%) | 0 (0.0%) |
| $7,500 to $9,999 | 1 (1.5%) | 0 (0.0%) |
| $10,000 to $12,499 | 0 (0.0%) | 4 (6.4%) |
| $12,500 to $14,999 | 2 (3.0%) | 1 (1.6%) |
| $15,000 to $17,499 | 0 (0.0%) | 6 (9.5%) |
| $17,500 to $19,999 | 0 (0.0%) | 0 (0.0%) |
| $20,000 to $22,499 | 0 (0.0%) | 1 (1.6%) |
| $22,500 to $24,999 | 0 (0.0%) | 2 (3.2%) |
| $25,000 to $29,999 | 6 (9.0%) | 14 (22.2%) |
| $30,000 to $34,999 | 5 (7.5%) | 10 (15.9%) |
| $35,000 to $39,999 | 10 (14.9%) | 5 (7.9%) |
| $40,000 to $44,999 | 0 (0.0%) | 2 (3.2%) |
| $45,000 to $49,999 | 1 (1.5%) | 2 (3.2%) |
| $50,000 to $54,999 | 12 (17.9%) | 0 (0.0%) |
| $55,000 to $64,999 | 5 (7.5%) | 0 (0.0%) |
| $65,000 to $74,999 | 3 (4.5%) | 0 (0.0%) |
| $75,000 to $99,999 | 8 (11.9%) | 2 (3.2%) |
| $100,000+ | 0 (0.0%) | 4 (6.4%) |
| Total | 67 (100.0%) | 63 (100.0%) |
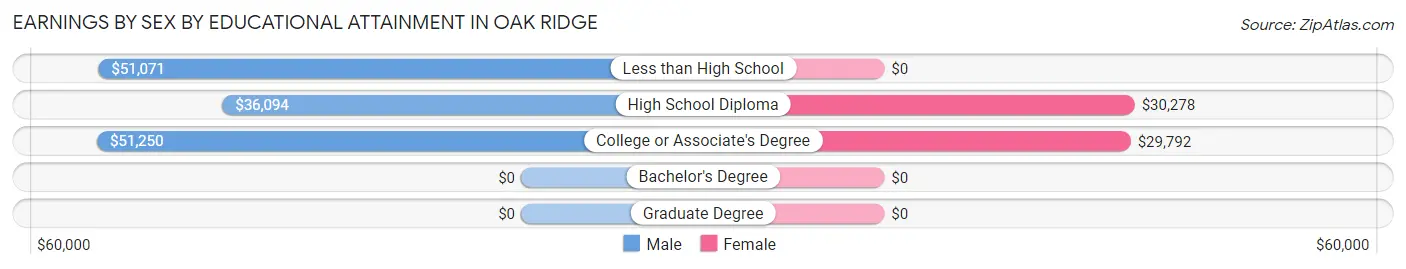
Earnings by Sex by Educational Attainment in Oak Ridge
Average earnings in Oak Ridge are $42,500 for men and $29,792 for women, a difference of 29.9%. Men with an educational attainment of college or associate's degree enjoy the highest average annual earnings of $51,250, while those with high school diploma education earn the least with $36,094. Women with an educational attainment of high school diploma earn the most with the average annual earnings of $30,278, while those with college or associate's degree education have the smallest earnings of $29,792.
| Educational Attainment | Male Income | Female Income |
| Less than High School | $51,071 | $0 |
| High School Diploma | $36,094 | $30,278 |
| College or Associate's Degree | $51,250 | $29,792 |
| Bachelor's Degree | - | - |
| Graduate Degree | - | - |
| Total | $42,500 | $29,792 |
Family Income in Oak Ridge
Family Income Brackets in Oak Ridge
According to the Oak Ridge family income data, there are 19 families falling into the $75,000 to $99,999 income range, which is the most common income bracket and makes up 25.0% of all families.
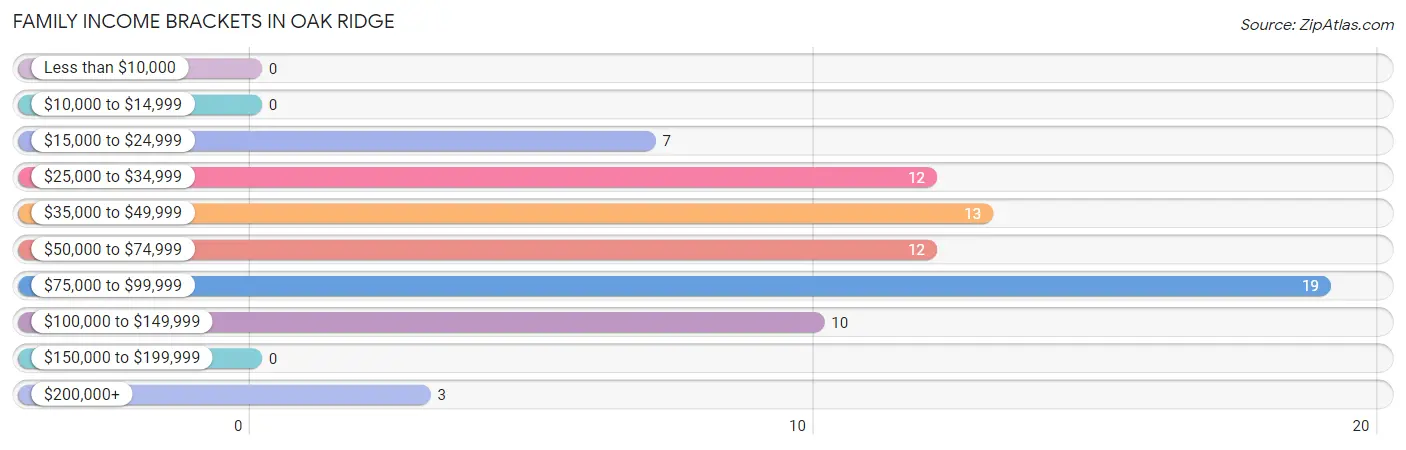
| Income Bracket | # Families | % Families |
| Less than $10,000 | 0 | 0.0% |
| $10,000 to $14,999 | 0 | 0.0% |
| $15,000 to $24,999 | 7 | 9.2% |
| $25,000 to $34,999 | 12 | 15.8% |
| $35,000 to $49,999 | 13 | 17.1% |
| $50,000 to $74,999 | 12 | 15.8% |
| $75,000 to $99,999 | 19 | 25.0% |
| $100,000 to $149,999 | 10 | 13.2% |
| $150,000 to $199,999 | 0 | 0.0% |
| $200,000+ | 3 | 3.9% |
Family Income by Famaliy Size in Oak Ridge
5-person families (8 | 10.5%) account for the highest median family income in Oak Ridge with $143,500 per family, while 5-person families (8 | 10.5%) have the highest median income of $28,700 per family member.
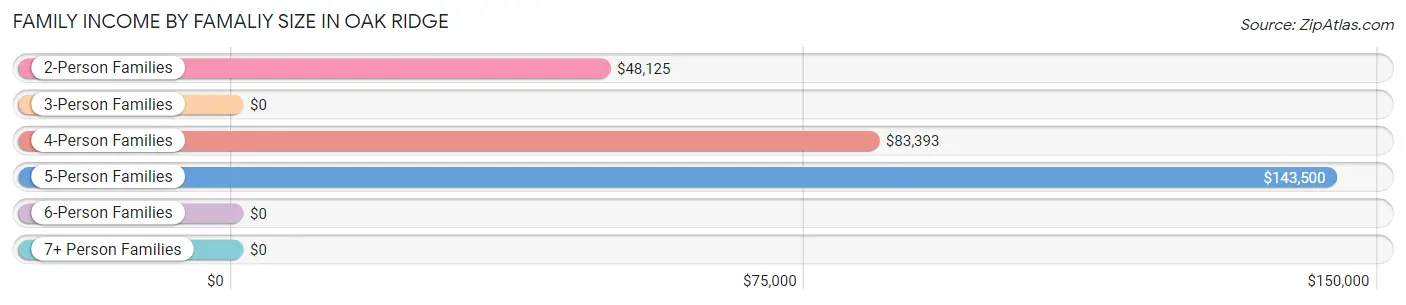
| Income Bracket | # Families | Median Income |
| 2-Person Families | 35 (46.1%) | $48,125 |
| 3-Person Families | 17 (22.4%) | $0 |
| 4-Person Families | 13 (17.1%) | $83,393 |
| 5-Person Families | 8 (10.5%) | $143,500 |
| 6-Person Families | 3 (4.0%) | $0 |
| 7+ Person Families | 0 (0.0%) | $0 |
| Total | 76 (100.0%) | $66,786 |
Family Income by Number of Earners in Oak Ridge
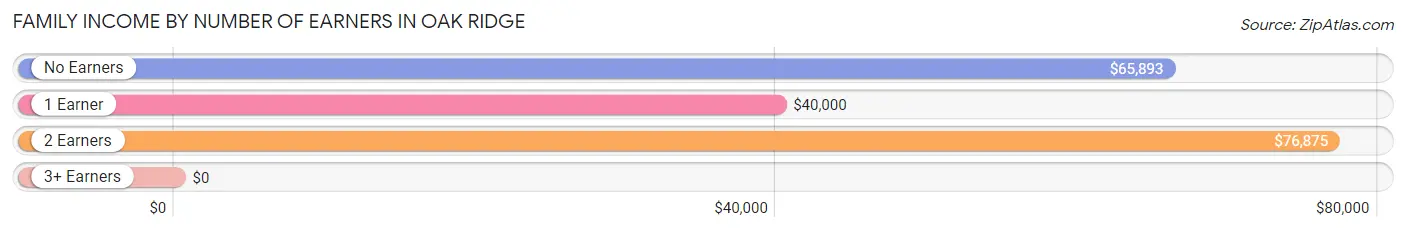
| Number of Earners | # Families | Median Income |
| No Earners | 21 (27.6%) | $65,893 |
| 1 Earner | 16 (21.0%) | $40,000 |
| 2 Earners | 31 (40.8%) | $76,875 |
| 3+ Earners | 8 (10.5%) | $0 |
| Total | 76 (100.0%) | $66,786 |
Household Income in Oak Ridge
Household Income Brackets in Oak Ridge
With 27 households falling in the category, the $75,000 to $99,999 income range is the most frequent in Oak Ridge, accounting for 28.7% of all households.
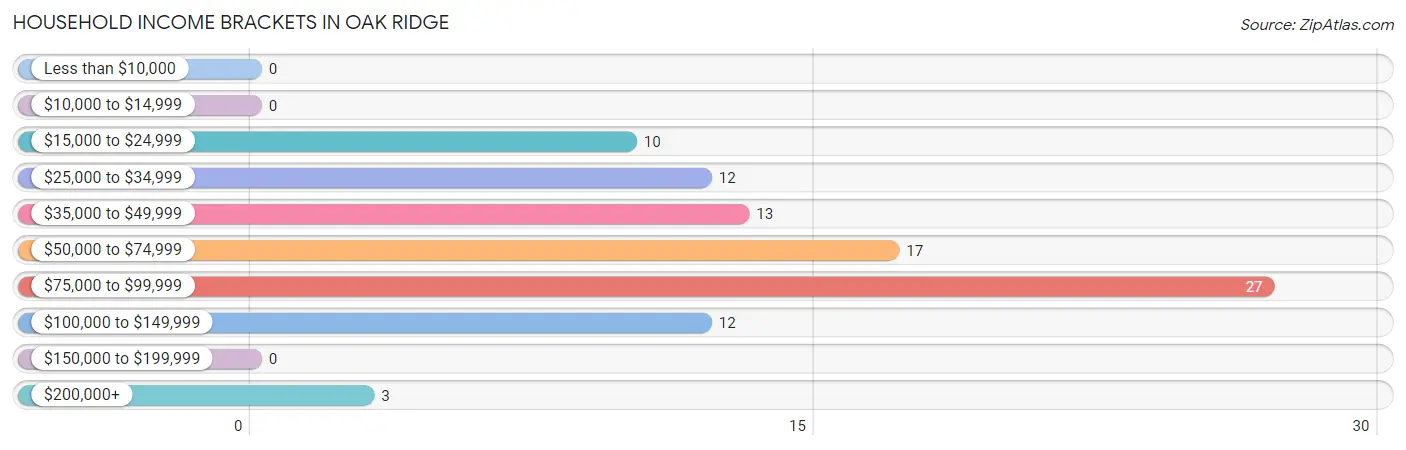
| Income Bracket | # Households | % Households |
| Less than $10,000 | 0 | 0.0% |
| $10,000 to $14,999 | 0 | 0.0% |
| $15,000 to $24,999 | 10 | 10.6% |
| $25,000 to $34,999 | 12 | 12.8% |
| $35,000 to $49,999 | 13 | 13.8% |
| $50,000 to $74,999 | 17 | 18.1% |
| $75,000 to $99,999 | 27 | 28.7% |
| $100,000 to $149,999 | 12 | 12.8% |
| $150,000 to $199,999 | 0 | 0.0% |
| $200,000+ | 3 | 3.2% |
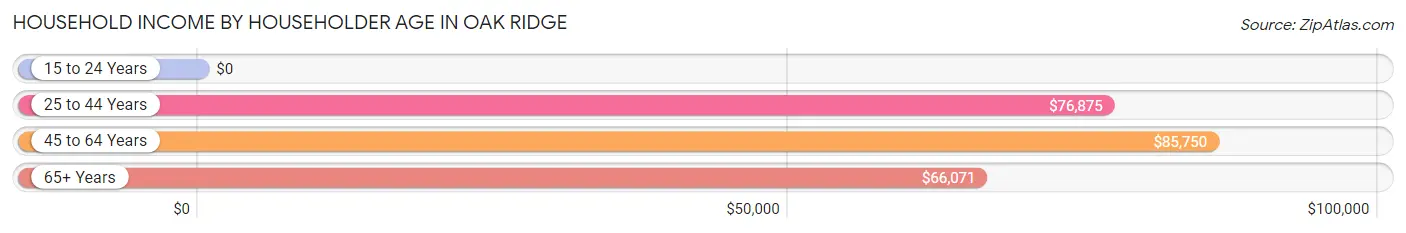
Household Income by Householder Age in Oak Ridge
The median household income in Oak Ridge is $67,500, with the highest median household income of $85,750 found in the 45 to 64 years age bracket for the primary householder. A total of 29 households (30.8%) fall into this category. Meanwhile, the 15 to 24 years age bracket for the primary householder has the lowest median household income of $0, with 2 households (2.1%) in this group.
| Income Bracket | # Households | Median Income |
| 15 to 24 Years | 2 (2.1%) | $0 |
| 25 to 44 Years | 29 (30.8%) | $76,875 |
| 45 to 64 Years | 29 (30.8%) | $85,750 |
| 65+ Years | 34 (36.2%) | $66,071 |
| Total | 94 (100.0%) | $67,500 |
Poverty in Oak Ridge
Income Below Poverty by Sex and Age in Oak Ridge
With 12.0% poverty level for males and 13.2% for females among the residents of Oak Ridge, 18 to 24 year old males and 25 to 34 year old females are the most vulnerable to poverty, with 5 males (71.4%) and 5 females (41.7%) in their respective age groups living below the poverty level.
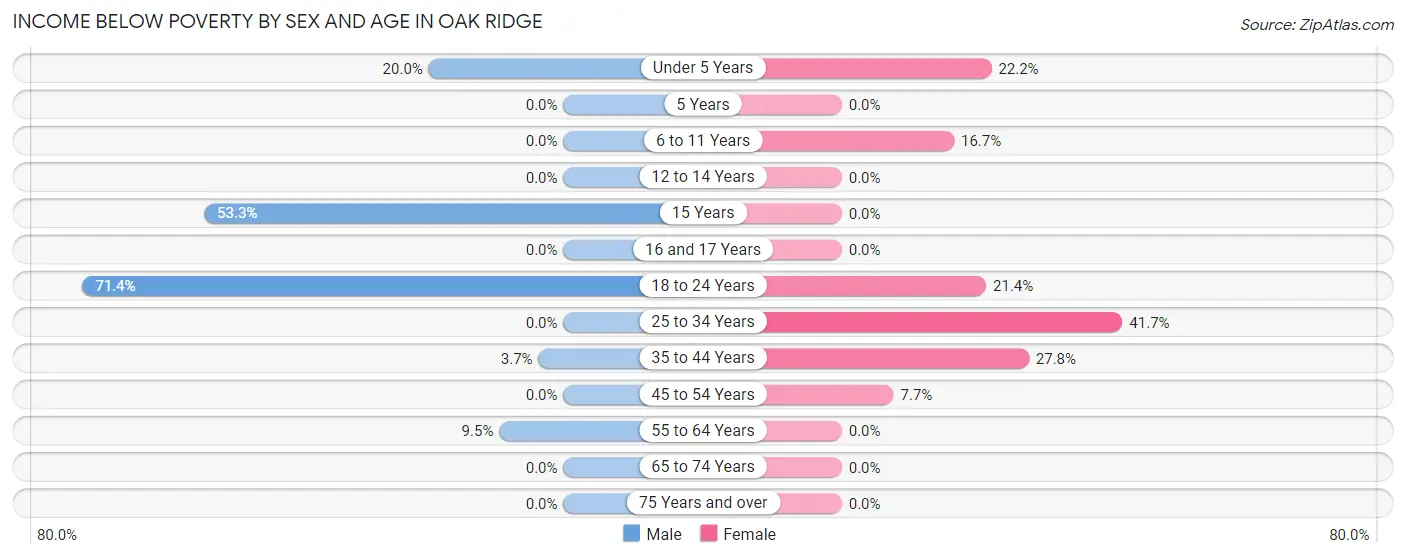
| Age Bracket | Male | Female |
| Under 5 Years | 1 (20.0%) | 2 (22.2%) |
| 5 Years | 0 (0.0%) | 0 (0.0%) |
| 6 to 11 Years | 0 (0.0%) | 2 (16.7%) |
| 12 to 14 Years | 0 (0.0%) | 0 (0.0%) |
| 15 Years | 8 (53.3%) | 0 (0.0%) |
| 16 and 17 Years | 0 (0.0%) | 0 (0.0%) |
| 18 to 24 Years | 5 (71.4%) | 3 (21.4%) |
| 25 to 34 Years | 0 (0.0%) | 5 (41.7%) |
| 35 to 44 Years | 1 (3.7%) | 5 (27.8%) |
| 45 to 54 Years | 0 (0.0%) | 1 (7.7%) |
| 55 to 64 Years | 2 (9.5%) | 0 (0.0%) |
| 65 to 74 Years | 0 (0.0%) | 0 (0.0%) |
| 75 Years and over | 0 (0.0%) | 0 (0.0%) |
| Total | 17 (12.0%) | 18 (13.2%) |
Income Above Poverty by Sex and Age in Oak Ridge
According to the poverty statistics in Oak Ridge, males aged 6 to 11 years and females aged 5 years are the age groups that are most secure financially, with 100.0% of males and 100.0% of females in these age groups living above the poverty line.
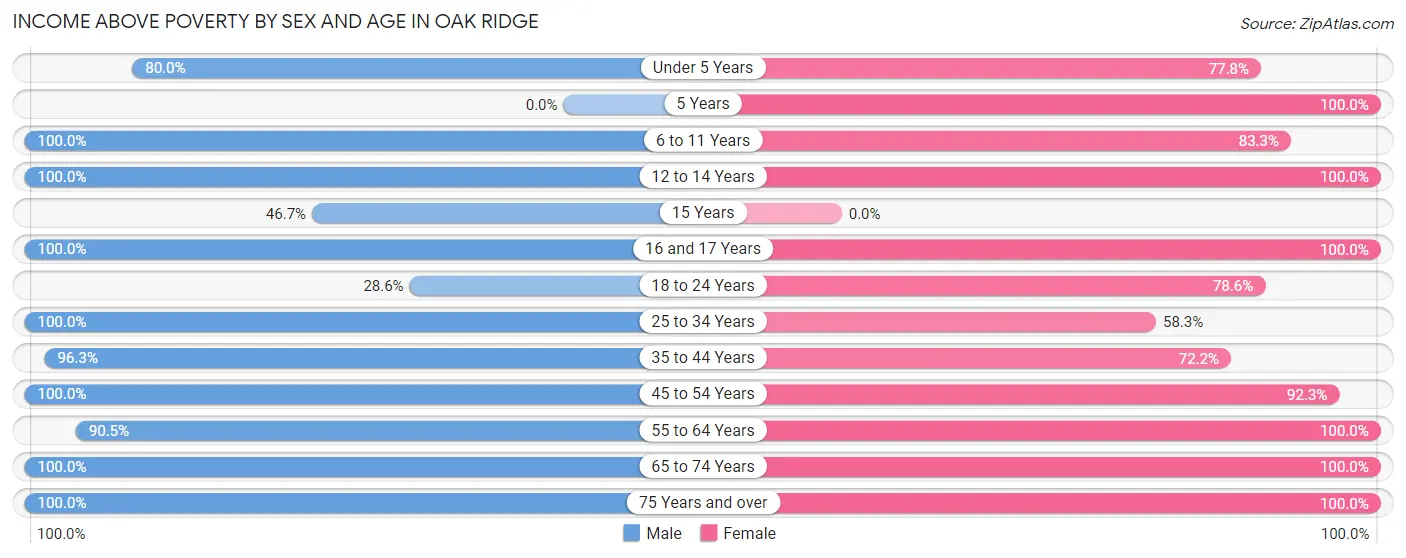
| Age Bracket | Male | Female |
| Under 5 Years | 4 (80.0%) | 7 (77.8%) |
| 5 Years | 0 (0.0%) | 4 (100.0%) |
| 6 to 11 Years | 14 (100.0%) | 10 (83.3%) |
| 12 to 14 Years | 4 (100.0%) | 1 (100.0%) |
| 15 Years | 7 (46.7%) | 0 (0.0%) |
| 16 and 17 Years | 2 (100.0%) | 3 (100.0%) |
| 18 to 24 Years | 2 (28.6%) | 11 (78.6%) |
| 25 to 34 Years | 7 (100.0%) | 7 (58.3%) |
| 35 to 44 Years | 26 (96.3%) | 13 (72.2%) |
| 45 to 54 Years | 15 (100.0%) | 12 (92.3%) |
| 55 to 64 Years | 19 (90.5%) | 15 (100.0%) |
| 65 to 74 Years | 13 (100.0%) | 19 (100.0%) |
| 75 Years and over | 12 (100.0%) | 16 (100.0%) |
| Total | 125 (88.0%) | 118 (86.8%) |
Income Below Poverty Among Married-Couple Families in Oak Ridge
The poverty statistics for married-couple families in Oak Ridge show that 1.9% or 1 of the total 52 families live below the poverty line. Families with 3 or 4 children have the highest poverty rate of 33.3%, comprising of 1 families. On the other hand, families with no children have the lowest poverty rate of 0.0%, which includes 0 families.
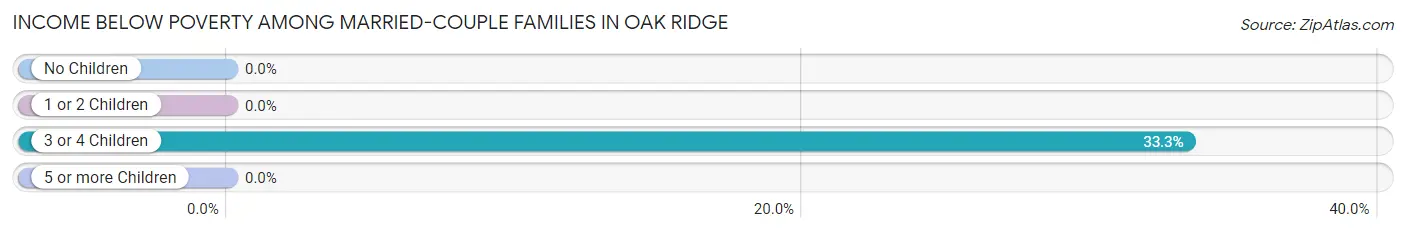
| Children | Above Poverty | Below Poverty |
| No Children | 32 (100.0%) | 0 (0.0%) |
| 1 or 2 Children | 17 (100.0%) | 0 (0.0%) |
| 3 or 4 Children | 2 (66.7%) | 1 (33.3%) |
| 5 or more Children | 0 (0.0%) | 0 (0.0%) |
| Total | 51 (98.1%) | 1 (1.9%) |
Income Below Poverty Among Single-Parent Households in Oak Ridge
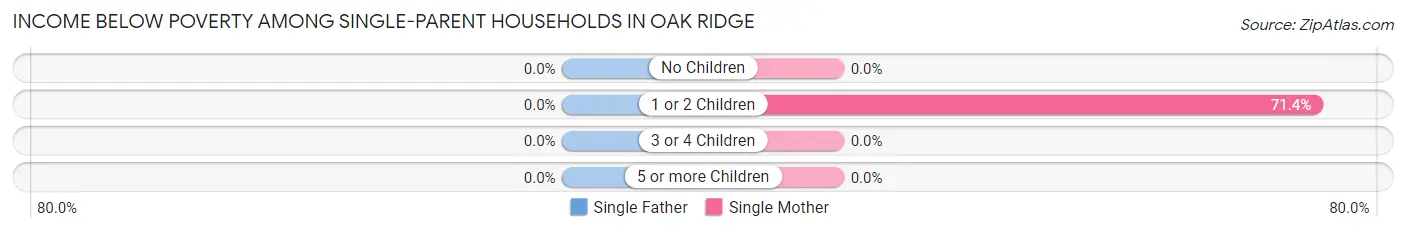
| Children | Single Father | Single Mother |
| No Children | 0 (0.0%) | 0 (0.0%) |
| 1 or 2 Children | 0 (0.0%) | 5 (71.4%) |
| 3 or 4 Children | 0 (0.0%) | 0 (0.0%) |
| 5 or more Children | 0 (0.0%) | 0 (0.0%) |
| Total | 0 (0.0%) | 5 (62.5%) |
Income Below Poverty Among Married-Couple vs Single-Parent Households in Oak Ridge
The poverty data for Oak Ridge shows that 1 of the married-couple family households (1.9%) and 5 of the single-parent households (20.8%) are living below the poverty level. Within the married-couple family households, those with 3 or 4 children have the highest poverty rate, with 1 households (33.3%) falling below the poverty line. Among the single-parent households, those with 1 or 2 children have the highest poverty rate, with 5 household (33.3%) living below poverty.
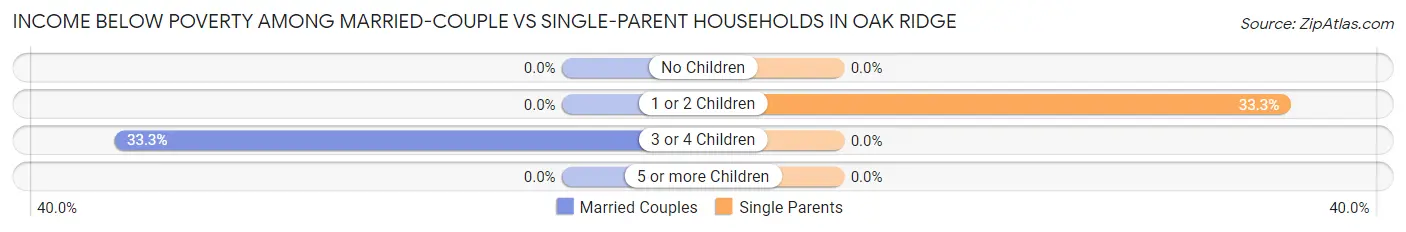
| Children | Married-Couple Families | Single-Parent Households |
| No Children | 0 (0.0%) | 0 (0.0%) |
| 1 or 2 Children | 0 (0.0%) | 5 (33.3%) |
| 3 or 4 Children | 1 (33.3%) | 0 (0.0%) |
| 5 or more Children | 0 (0.0%) | 0 (0.0%) |
| Total | 1 (1.9%) | 5 (20.8%) |
Race in Oak Ridge
The most populous races in Oak Ridge are White / Caucasian (278 | 99.6%), and Two or more Races (1 | 0.4%).
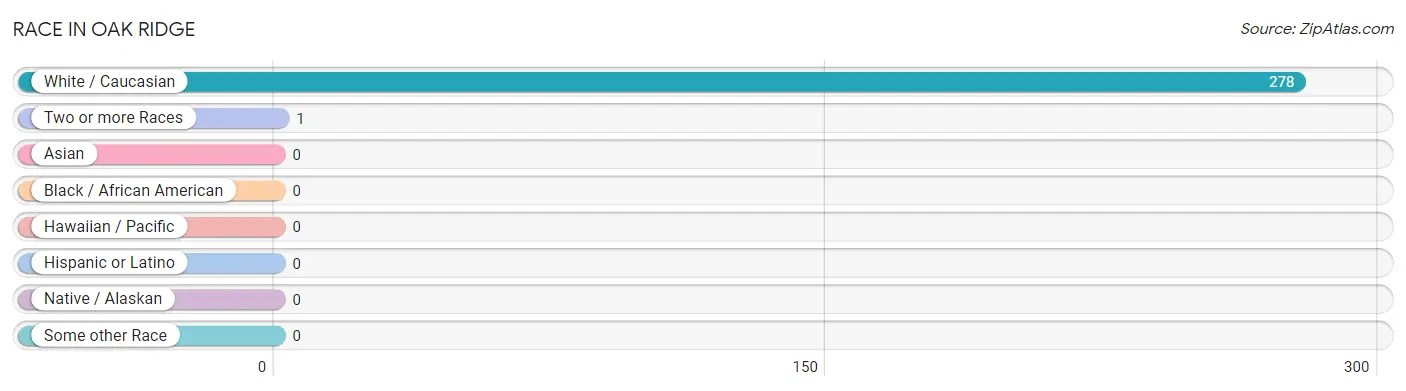
| Race | # Population | % Population |
| Asian | 0 | 0.0% |
| Black / African American | 0 | 0.0% |
| Hawaiian / Pacific | 0 | 0.0% |
| Hispanic or Latino | 0 | 0.0% |
| Native / Alaskan | 0 | 0.0% |
| White / Caucasian | 278 | 99.6% |
| Two or more Races | 1 | 0.4% |
| Some other Race | 0 | 0.0% |
| Total | 279 | 100.0% |
Ancestry in Oak Ridge
The most populous ancestries reported in Oak Ridge are German (98 | 35.1%), American (54 | 19.4%), English (17 | 6.1%), European (10 | 3.6%), and Irish (10 | 3.6%), together accounting for 67.7% of all Oak Ridge residents.
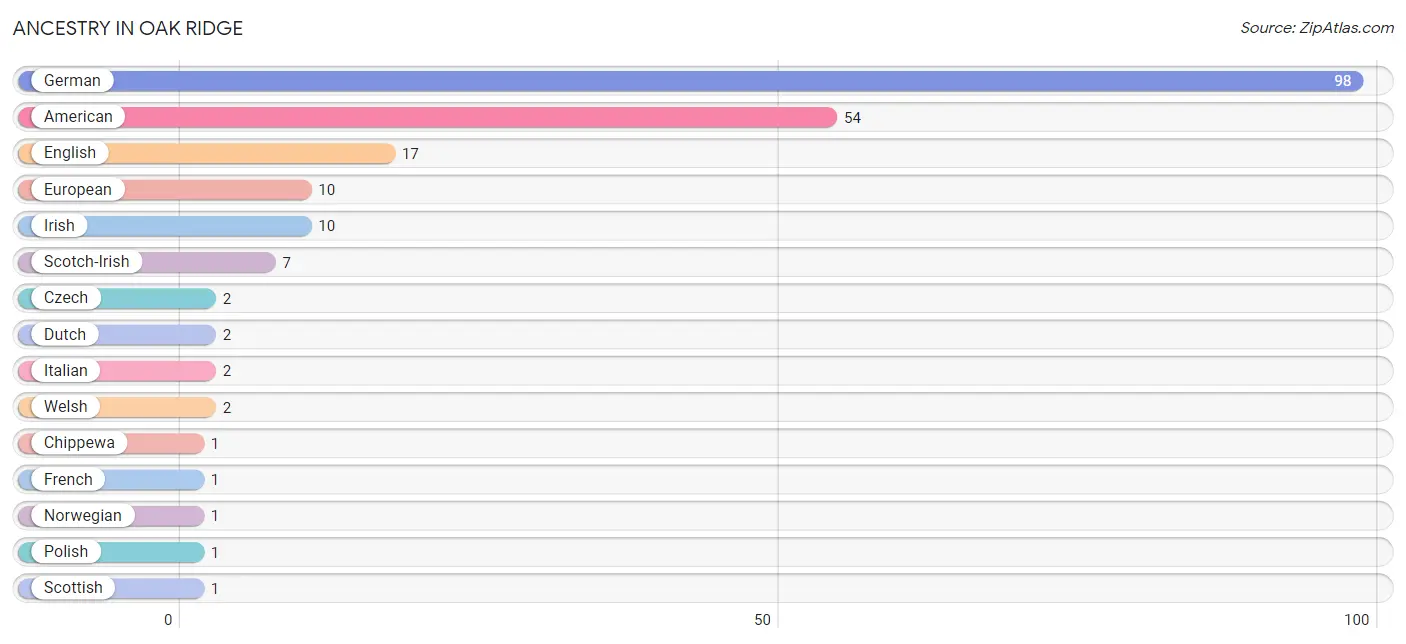
| Ancestry | # Population | % Population |
| American | 54 | 19.4% |
| Chippewa | 1 | 0.4% |
| Czech | 2 | 0.7% |
| Dutch | 2 | 0.7% |
| English | 17 | 6.1% |
| European | 10 | 3.6% |
| French | 1 | 0.4% |
| German | 98 | 35.1% |
| Irish | 10 | 3.6% |
| Italian | 2 | 0.7% |
| Norwegian | 1 | 0.4% |
| Polish | 1 | 0.4% |
| Scotch-Irish | 7 | 2.5% |
| Scottish | 1 | 0.4% |
| Welsh | 2 | 0.7% | View All 15 Rows |
Immigrants in Oak Ridge

| Immigration Origin | # Population | % Population | View All 0 Rows |
Sex and Age in Oak Ridge
Sex and Age in Oak Ridge
The most populous age groups in Oak Ridge are 15 to 19 Years (22 | 15.4%) for men and 5 to 9 Years (16 | 11.8%) for women.
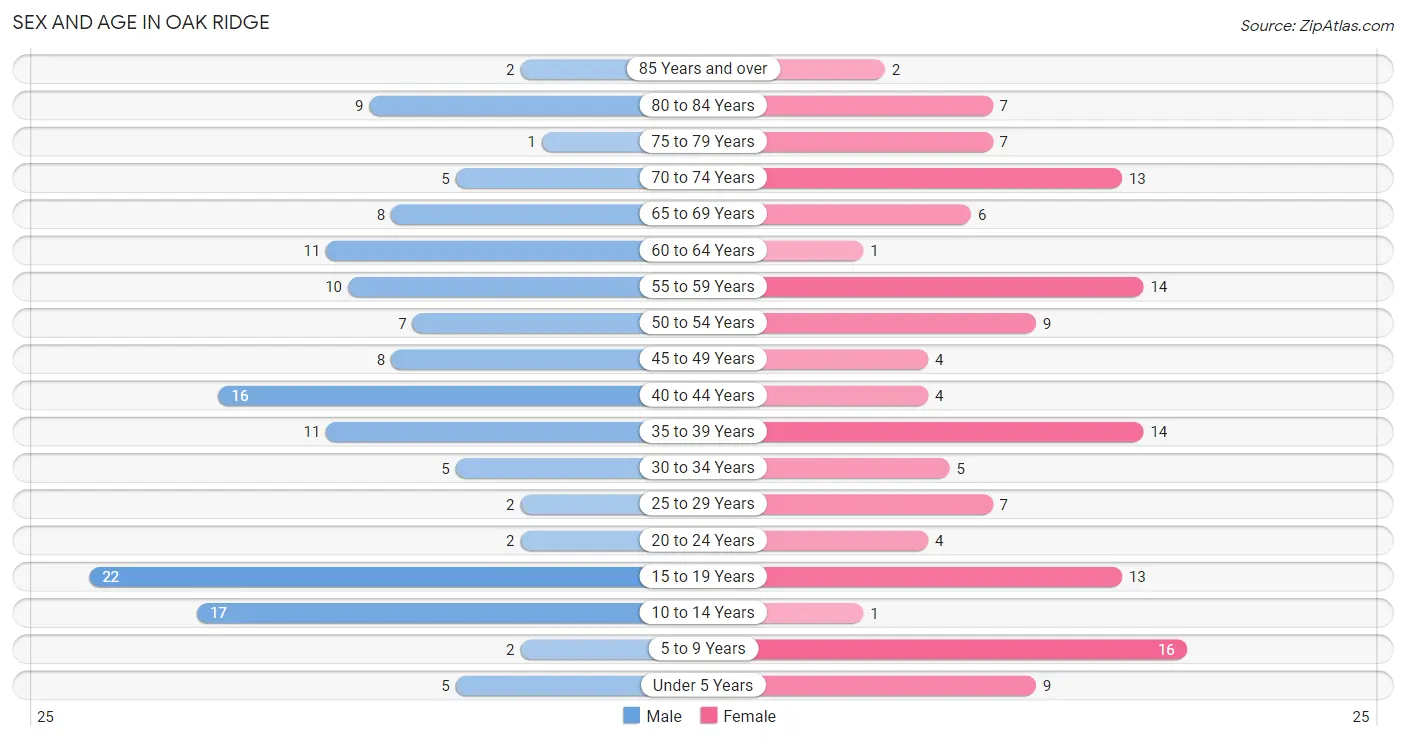
| Age Bracket | Male | Female |
| Under 5 Years | 5 (3.5%) | 9 (6.6%) |
| 5 to 9 Years | 2 (1.4%) | 16 (11.8%) |
| 10 to 14 Years | 17 (11.9%) | 1 (0.7%) |
| 15 to 19 Years | 22 (15.4%) | 13 (9.6%) |
| 20 to 24 Years | 2 (1.4%) | 4 (2.9%) |
| 25 to 29 Years | 2 (1.4%) | 7 (5.1%) |
| 30 to 34 Years | 5 (3.5%) | 5 (3.7%) |
| 35 to 39 Years | 11 (7.7%) | 14 (10.3%) |
| 40 to 44 Years | 16 (11.2%) | 4 (2.9%) |
| 45 to 49 Years | 8 (5.6%) | 4 (2.9%) |
| 50 to 54 Years | 7 (4.9%) | 9 (6.6%) |
| 55 to 59 Years | 10 (7.0%) | 14 (10.3%) |
| 60 to 64 Years | 11 (7.7%) | 1 (0.7%) |
| 65 to 69 Years | 8 (5.6%) | 6 (4.4%) |
| 70 to 74 Years | 5 (3.5%) | 13 (9.6%) |
| 75 to 79 Years | 1 (0.7%) | 7 (5.1%) |
| 80 to 84 Years | 9 (6.3%) | 7 (5.1%) |
| 85 Years and over | 2 (1.4%) | 2 (1.5%) |
| Total | 143 (100.0%) | 136 (100.0%) |
Families and Households in Oak Ridge
Median Family Size in Oak Ridge
The median family size in Oak Ridge is 3.13 persons per family, with single female/mother families (8 | 10.5%) accounting for the largest median family size of 3.5 persons per family. On the other hand, married-couple families (52 | 68.4%) represent the smallest median family size with 3.02 persons per family.
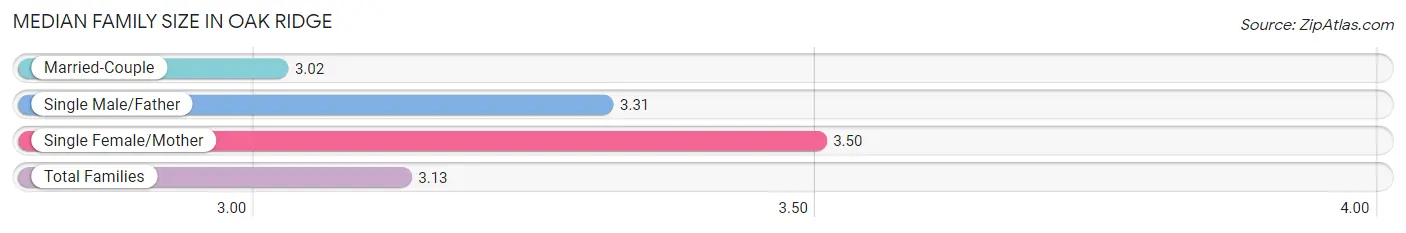
| Family Type | # Families | Family Size |
| Married-Couple | 52 (68.4%) | 3.02 |
| Single Male/Father | 16 (21.0%) | 3.31 |
| Single Female/Mother | 8 (10.5%) | 3.50 |
| Total Families | 76 (100.0%) | 3.13 |
Median Household Size in Oak Ridge
The median household size in Oak Ridge is 2.97 persons per household, with single female/mother households (8 | 8.5%) accounting for the largest median household size of 3.88 persons per household. non-family households (18 | 19.2%) represent the smallest median household size with 1.72 persons per household.
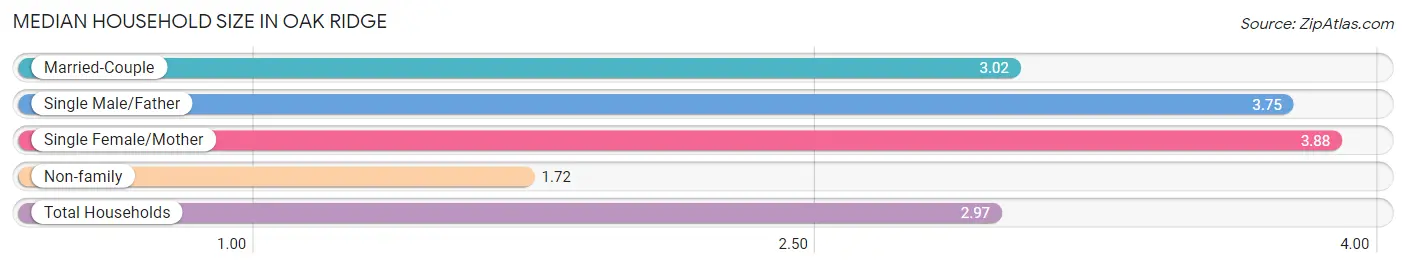
| Household Type | # Households | Household Size |
| Married-Couple | 52 (55.3%) | 3.02 |
| Single Male/Father | 16 (17.0%) | 3.75 |
| Single Female/Mother | 8 (8.5%) | 3.88 |
| Non-family | 18 (19.2%) | 1.72 |
| Total Households | 94 (100.0%) | 2.97 |
Household Size by Marriage Status in Oak Ridge
Out of a total of 94 households in Oak Ridge, 76 (80.8%) are family households, while 18 (19.2%) are nonfamily households. The most numerous type of family households are 2-person households, comprising 33, and the most common type of nonfamily households are 2-person households, comprising 9.
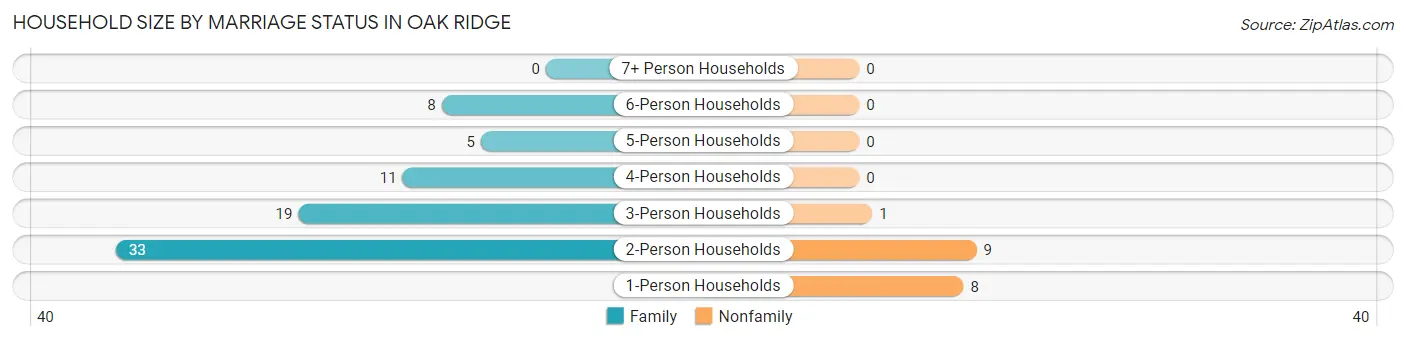
| Household Size | Family Households | Nonfamily Households |
| 1-Person Households | - | 8 (8.5%) |
| 2-Person Households | 33 (35.1%) | 9 (9.6%) |
| 3-Person Households | 19 (20.2%) | 1 (1.1%) |
| 4-Person Households | 11 (11.7%) | 0 (0.0%) |
| 5-Person Households | 5 (5.3%) | 0 (0.0%) |
| 6-Person Households | 8 (8.5%) | 0 (0.0%) |
| 7+ Person Households | 0 (0.0%) | 0 (0.0%) |
| Total | 76 (80.8%) | 18 (19.2%) |
Female Fertility in Oak Ridge
Fertility by Age in Oak Ridge
Average fertility rate in Oak Ridge is 167.0 births per 1,000 women. Women in the age bracket of 20 to 34 years have the highest fertility rate with 375.0 births per 1,000 women. Women in the age bracket of 20 to 34 years acount for 66.7% of all women with births.
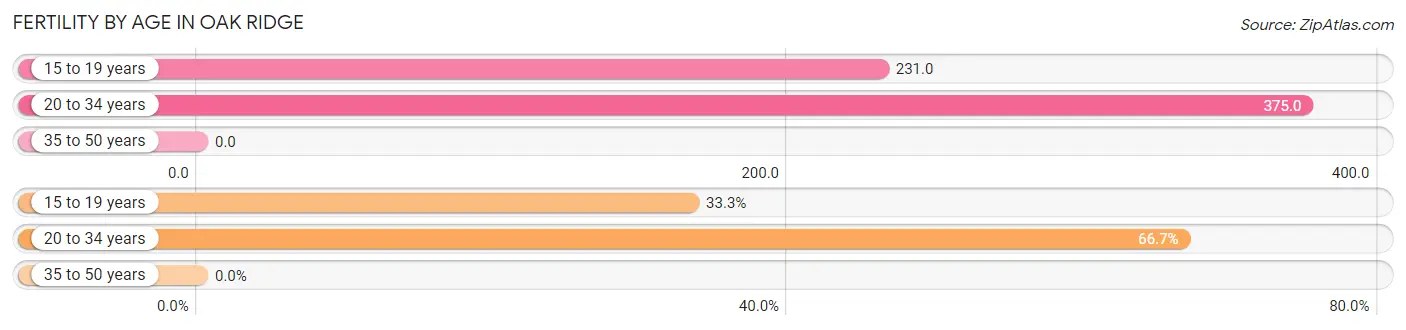
| Age Bracket | Women with Births | Births / 1,000 Women |
| 15 to 19 years | 3 (33.3%) | 231.0 |
| 20 to 34 years | 6 (66.7%) | 375.0 |
| 35 to 50 years | 0 (0.0%) | 0.0 |
| Total | 9 (100.0%) | 167.0 |
Fertility by Age by Marriage Status in Oak Ridge
22.2% of women with births (9) in Oak Ridge are married. The highest percentage of unmarried women with births falls into 15 to 19 years age bracket with 100.0% of them unmarried at the time of birth, while the lowest percentage of unmarried women with births belong to 20 to 34 years age bracket with 66.7% of them unmarried.
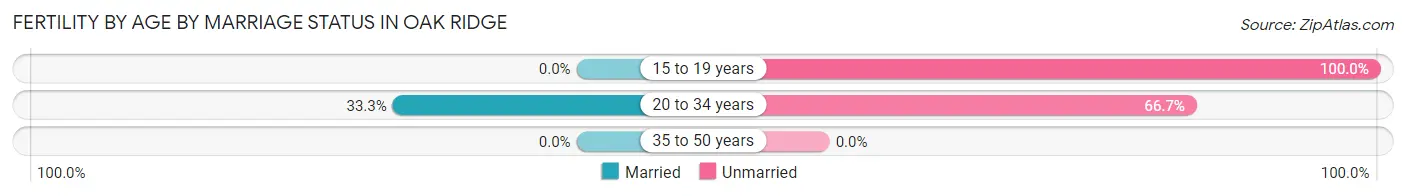
| Age Bracket | Married | Unmarried |
| 15 to 19 years | 0 (0.0%) | 3 (100.0%) |
| 20 to 34 years | 2 (33.3%) | 4 (66.7%) |
| 35 to 50 years | 0 (0.0%) | 0 (0.0%) |
| Total | 2 (22.2%) | 7 (77.8%) |
Fertility by Education in Oak Ridge
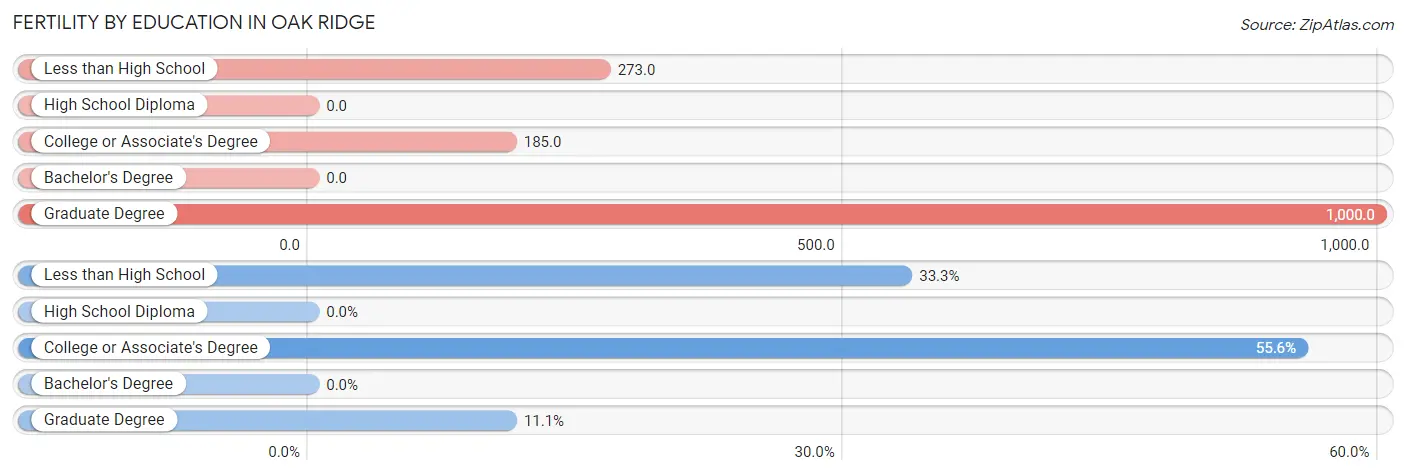
| Educational Attainment | Women with Births | Births / 1,000 Women |
| Less than High School | 3 (33.3%) | 273.0 |
| High School Diploma | 0 (0.0%) | 0.0 |
| College or Associate's Degree | 5 (55.6%) | 185.0 |
| Bachelor's Degree | 0 (0.0%) | 0.0 |
| Graduate Degree | 1 (11.1%) | 1,000.0 |
| Total | 9 (100.0%) | 167.0 |
Fertility by Education by Marriage Status in Oak Ridge
77.8% of women with births in Oak Ridge are unmarried. Women with the educational attainment of graduate degree are most likely to be married with 100.0% of them married at childbirth, while women with the educational attainment of less than high school are least likely to be married with 100.0% of them unmarried at childbirth.
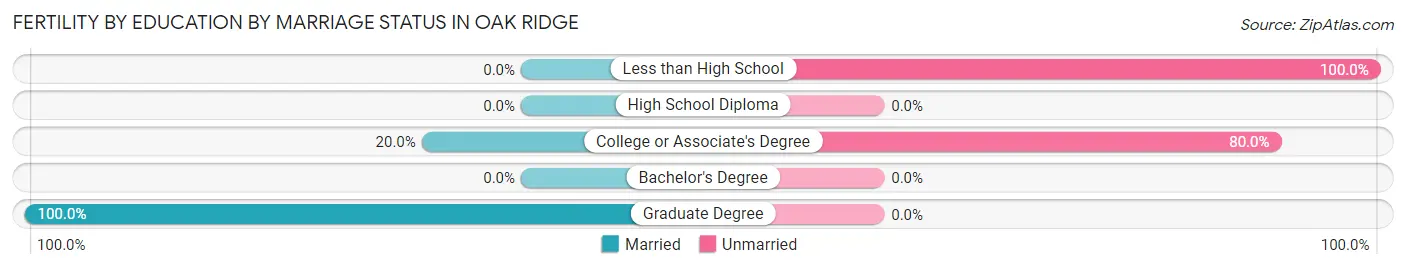
| Educational Attainment | Married | Unmarried |
| Less than High School | 0 (0.0%) | 3 (100.0%) |
| High School Diploma | 0 (0.0%) | 0 (0.0%) |
| College or Associate's Degree | 1 (20.0%) | 4 (80.0%) |
| Bachelor's Degree | 0 (0.0%) | 0 (0.0%) |
| Graduate Degree | 1 (100.0%) | 0 (0.0%) |
| Total | 2 (22.2%) | 7 (77.8%) |
Employment Characteristics in Oak Ridge
Employment by Class of Employer in Oak Ridge
Among the 125 employed individuals in Oak Ridge, private company employees (94 | 75.2%), not-for-profit organizations (13 | 10.4%), and local government employees (8 | 6.4%) make up the most common classes of employment.
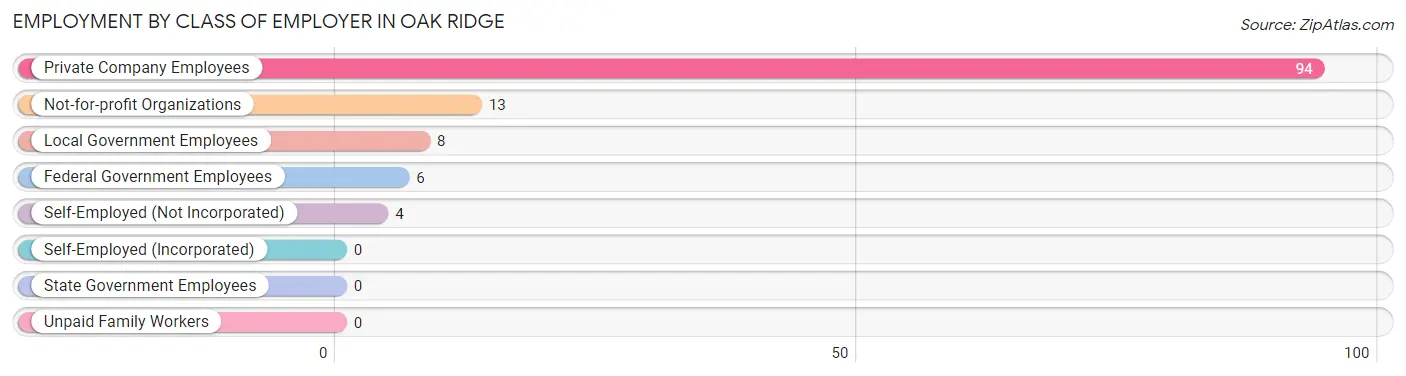
| Employer Class | # Employees | % Employees |
| Private Company Employees | 94 | 75.2% |
| Self-Employed (Incorporated) | 0 | 0.0% |
| Self-Employed (Not Incorporated) | 4 | 3.2% |
| Not-for-profit Organizations | 13 | 10.4% |
| Local Government Employees | 8 | 6.4% |
| State Government Employees | 0 | 0.0% |
| Federal Government Employees | 6 | 4.8% |
| Unpaid Family Workers | 0 | 0.0% |
| Total | 125 | 100.0% |
Employment Status by Age in Oak Ridge
According to the labor force statistics for Oak Ridge, out of the total population over 16 years of age (214), 59.3% or 127 individuals are in the labor force, with 1.6% or 2 of them unemployed. The age group with the highest labor force participation rate is 20 to 24 years, with 100.0% or 6 individuals in the labor force. Within the labor force, the 65 to 74 years age range has the highest percentage of unemployed individuals, with 50.0% or 2 of them being unemployed.
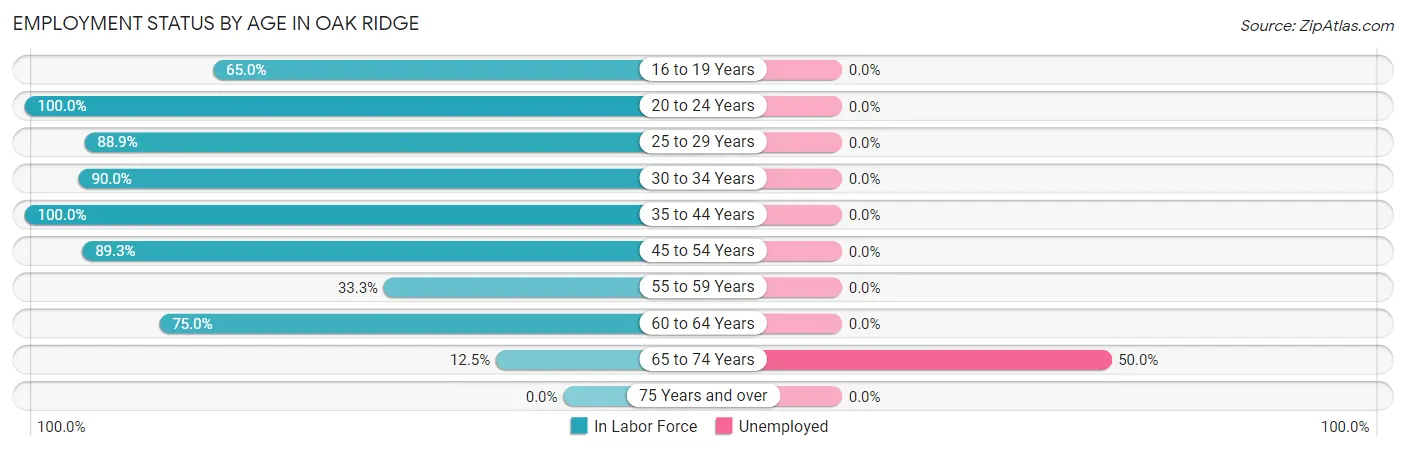
| Age Bracket | In Labor Force | Unemployed |
| 16 to 19 Years | 13 (65.0%) | 0 (0.0%) |
| 20 to 24 Years | 6 (100.0%) | 0 (0.0%) |
| 25 to 29 Years | 8 (88.9%) | 0 (0.0%) |
| 30 to 34 Years | 9 (90.0%) | 0 (0.0%) |
| 35 to 44 Years | 45 (100.0%) | 0 (0.0%) |
| 45 to 54 Years | 25 (89.3%) | 0 (0.0%) |
| 55 to 59 Years | 8 (33.3%) | 0 (0.0%) |
| 60 to 64 Years | 9 (75.0%) | 0 (0.0%) |
| 65 to 74 Years | 4 (12.5%) | 2 (50.0%) |
| 75 Years and over | 0 (0.0%) | 0 (0.0%) |
| Total | 127 (59.3%) | 2 (1.6%) |
Employment Status by Educational Attainment in Oak Ridge
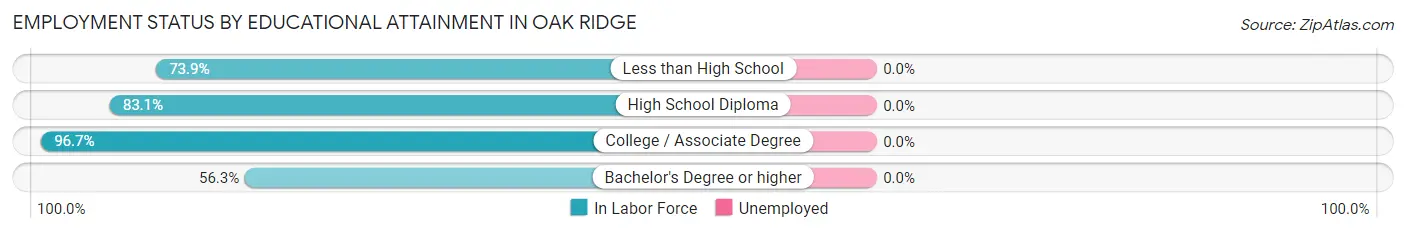
| Educational Attainment | In Labor Force | Unemployed |
| Less than High School | 17 (73.9%) | 0 (0.0%) |
| High School Diploma | 49 (83.1%) | 0 (0.0%) |
| College / Associate Degree | 29 (96.7%) | 0 (0.0%) |
| Bachelor's Degree or higher | 9 (56.3%) | 0 (0.0%) |
| Total | 104 (81.3%) | 0 (0.0%) |
Employment Occupations by Sex in Oak Ridge
Management, Business, Science and Arts Occupations
The most common Management, Business, Science and Arts occupations in Oak Ridge are Health Diagnosing & Treating (8 | 6.4%), Management (4 | 3.2%), Community & Social Service (4 | 3.2%), Education, Arts & Media (4 | 3.2%), and Computers, Engineering & Science (2 | 1.6%).
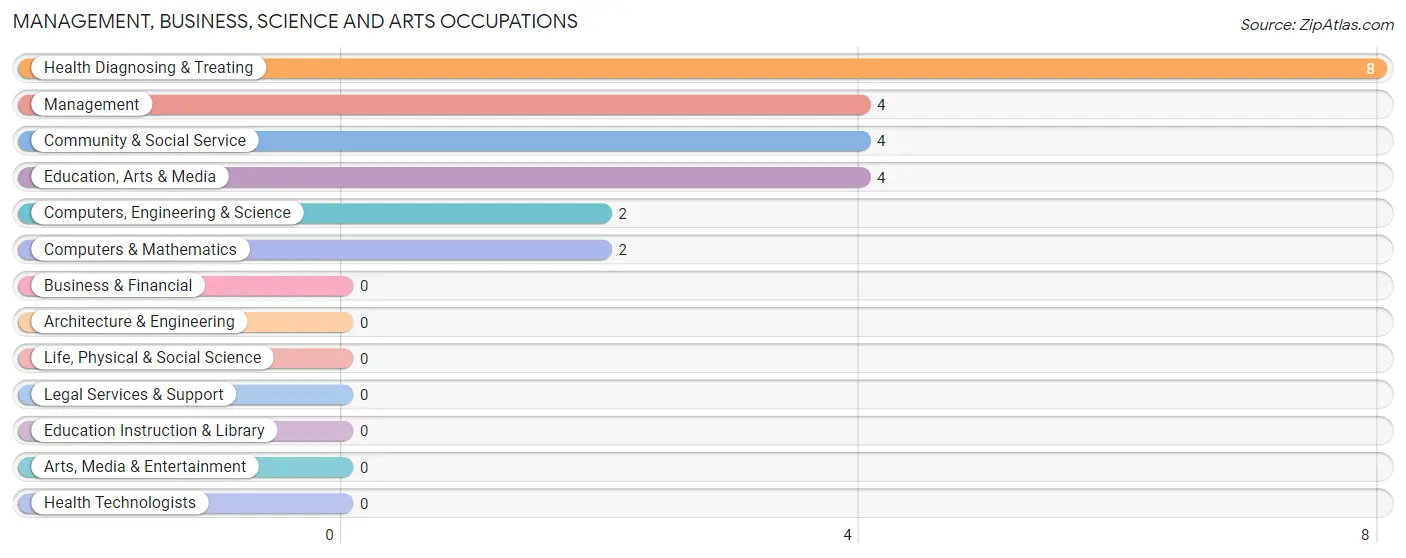
Management, Business, Science and Arts Occupations by Sex
Within the Management, Business, Science and Arts occupations in Oak Ridge, the most male-oriented occupations are Management (75.0%), Community & Social Service (50.0%), and Education, Arts & Media (50.0%), while the most female-oriented occupations are Computers, Engineering & Science (100.0%), Computers & Mathematics (100.0%), and Health Diagnosing & Treating (100.0%).
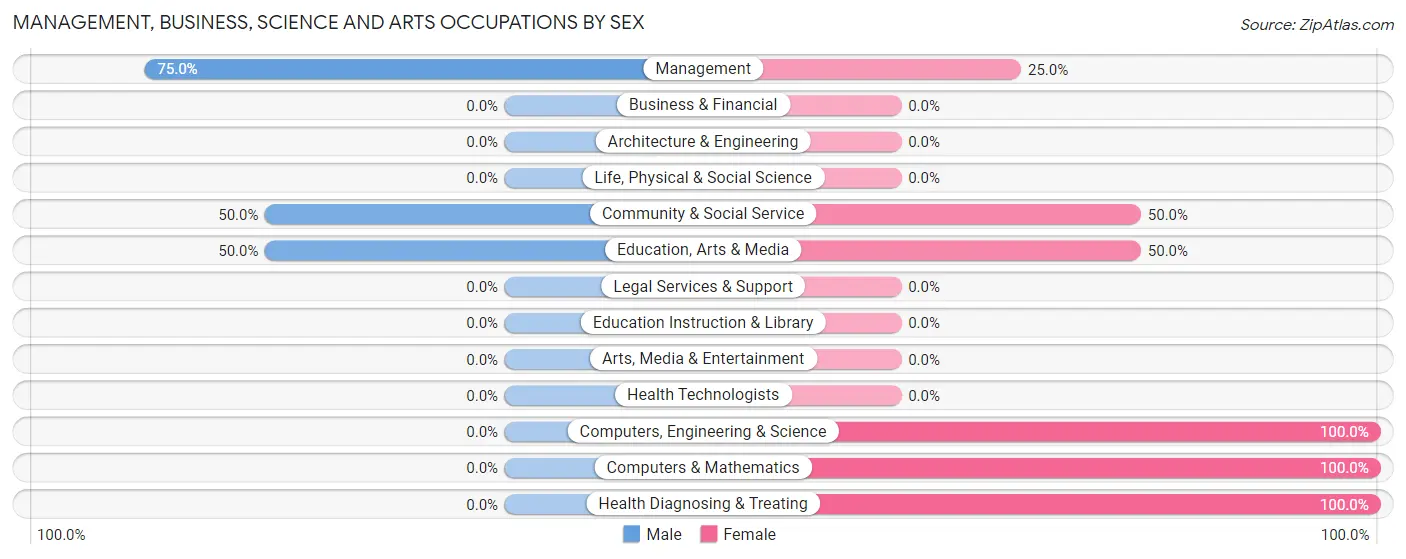
| Occupation | Male | Female |
| Management | 3 (75.0%) | 1 (25.0%) |
| Business & Financial | 0 (0.0%) | 0 (0.0%) |
| Computers, Engineering & Science | 0 (0.0%) | 2 (100.0%) |
| Computers & Mathematics | 0 (0.0%) | 2 (100.0%) |
| Architecture & Engineering | 0 (0.0%) | 0 (0.0%) |
| Life, Physical & Social Science | 0 (0.0%) | 0 (0.0%) |
| Community & Social Service | 2 (50.0%) | 2 (50.0%) |
| Education, Arts & Media | 2 (50.0%) | 2 (50.0%) |
| Legal Services & Support | 0 (0.0%) | 0 (0.0%) |
| Education Instruction & Library | 0 (0.0%) | 0 (0.0%) |
| Arts, Media & Entertainment | 0 (0.0%) | 0 (0.0%) |
| Health Diagnosing & Treating | 0 (0.0%) | 8 (100.0%) |
| Health Technologists | 0 (0.0%) | 0 (0.0%) |
| Total (Category) | 5 (27.8%) | 13 (72.2%) |
| Total (Overall) | 63 (50.4%) | 62 (49.6%) |
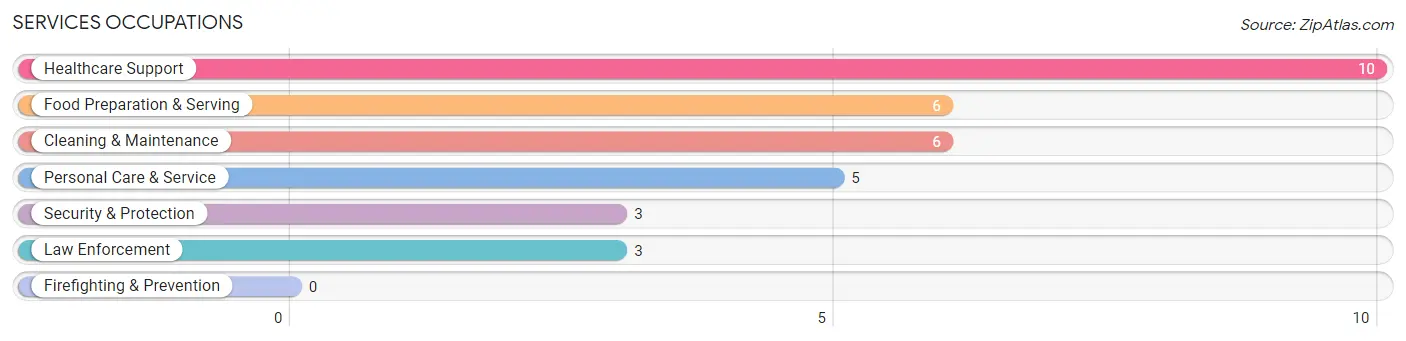
Services Occupations
The most common Services occupations in Oak Ridge are Healthcare Support (10 | 8.0%), Food Preparation & Serving (6 | 4.8%), Cleaning & Maintenance (6 | 4.8%), Personal Care & Service (5 | 4.0%), and Security & Protection (3 | 2.4%).
Services Occupations by Sex
Within the Services occupations in Oak Ridge, the most male-oriented occupations are Cleaning & Maintenance (83.3%), and Healthcare Support (10.0%), while the most female-oriented occupations are Security & Protection (100.0%), Law Enforcement (100.0%), and Food Preparation & Serving (100.0%).
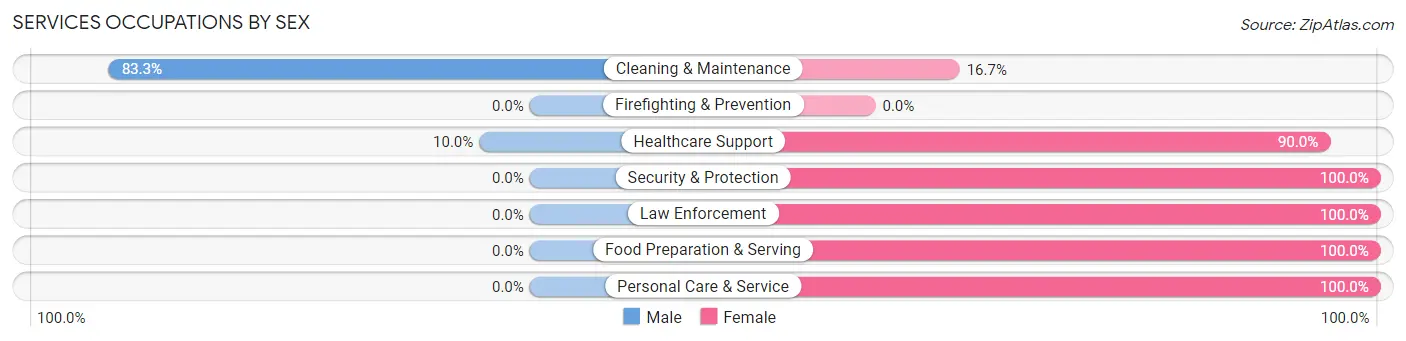
| Occupation | Male | Female |
| Healthcare Support | 1 (10.0%) | 9 (90.0%) |
| Security & Protection | 0 (0.0%) | 3 (100.0%) |
| Firefighting & Prevention | 0 (0.0%) | 0 (0.0%) |
| Law Enforcement | 0 (0.0%) | 3 (100.0%) |
| Food Preparation & Serving | 0 (0.0%) | 6 (100.0%) |
| Cleaning & Maintenance | 5 (83.3%) | 1 (16.7%) |
| Personal Care & Service | 0 (0.0%) | 5 (100.0%) |
| Total (Category) | 6 (20.0%) | 24 (80.0%) |
| Total (Overall) | 63 (50.4%) | 62 (49.6%) |
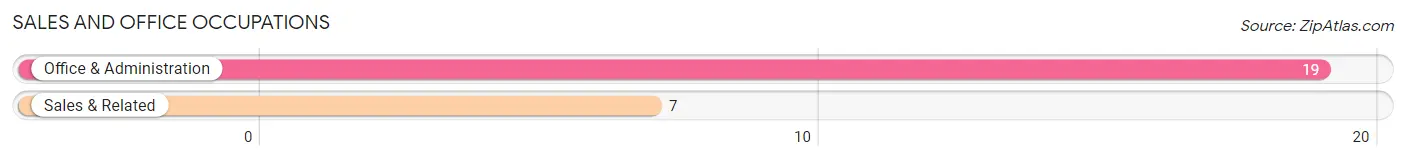
Sales and Office Occupations
The most common Sales and Office occupations in Oak Ridge are Office & Administration (19 | 15.2%), and Sales & Related (7 | 5.6%).
Sales and Office Occupations by Sex

| Occupation | Male | Female |
| Sales & Related | 2 (28.6%) | 5 (71.4%) |
| Office & Administration | 0 (0.0%) | 19 (100.0%) |
| Total (Category) | 2 (7.7%) | 24 (92.3%) |
| Total (Overall) | 63 (50.4%) | 62 (49.6%) |
Natural Resources, Construction and Maintenance Occupations
The most common Natural Resources, Construction and Maintenance occupations in Oak Ridge are Construction & Extraction (18 | 14.4%), and Installation, Maintenance & Repair (4 | 3.2%).
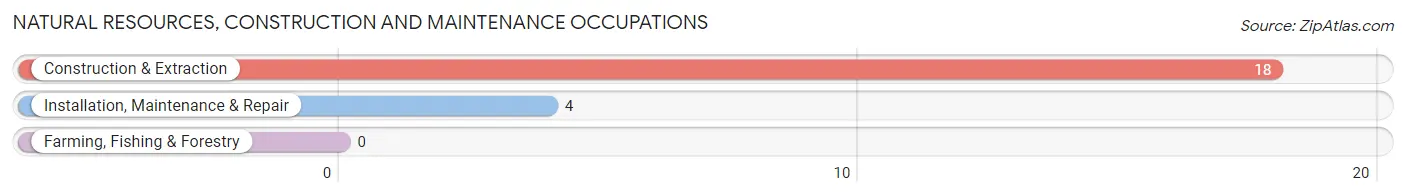
Natural Resources, Construction and Maintenance Occupations by Sex

| Occupation | Male | Female |
| Farming, Fishing & Forestry | 0 (0.0%) | 0 (0.0%) |
| Construction & Extraction | 18 (100.0%) | 0 (0.0%) |
| Installation, Maintenance & Repair | 4 (100.0%) | 0 (0.0%) |
| Total (Category) | 22 (100.0%) | 0 (0.0%) |
| Total (Overall) | 63 (50.4%) | 62 (49.6%) |
Production, Transportation and Moving Occupations
The most common Production, Transportation and Moving occupations in Oak Ridge are Production (16 | 12.8%), Material Moving (12 | 9.6%), and Transportation (1 | 0.8%).
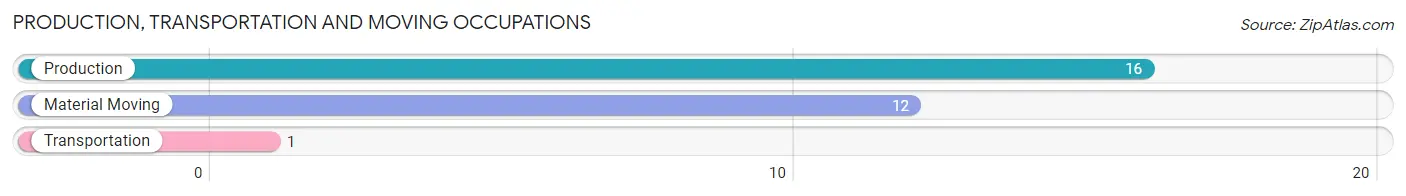
Production, Transportation and Moving Occupations by Sex
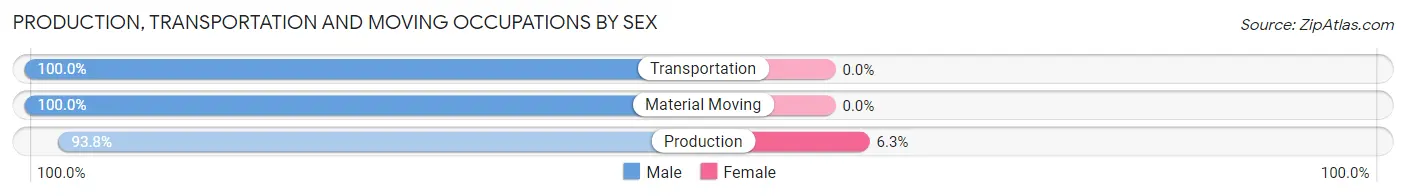
| Occupation | Male | Female |
| Production | 15 (93.8%) | 1 (6.2%) |
| Transportation | 1 (100.0%) | 0 (0.0%) |
| Material Moving | 12 (100.0%) | 0 (0.0%) |
| Total (Category) | 28 (96.6%) | 1 (3.5%) |
| Total (Overall) | 63 (50.4%) | 62 (49.6%) |
Employment Industries by Sex in Oak Ridge
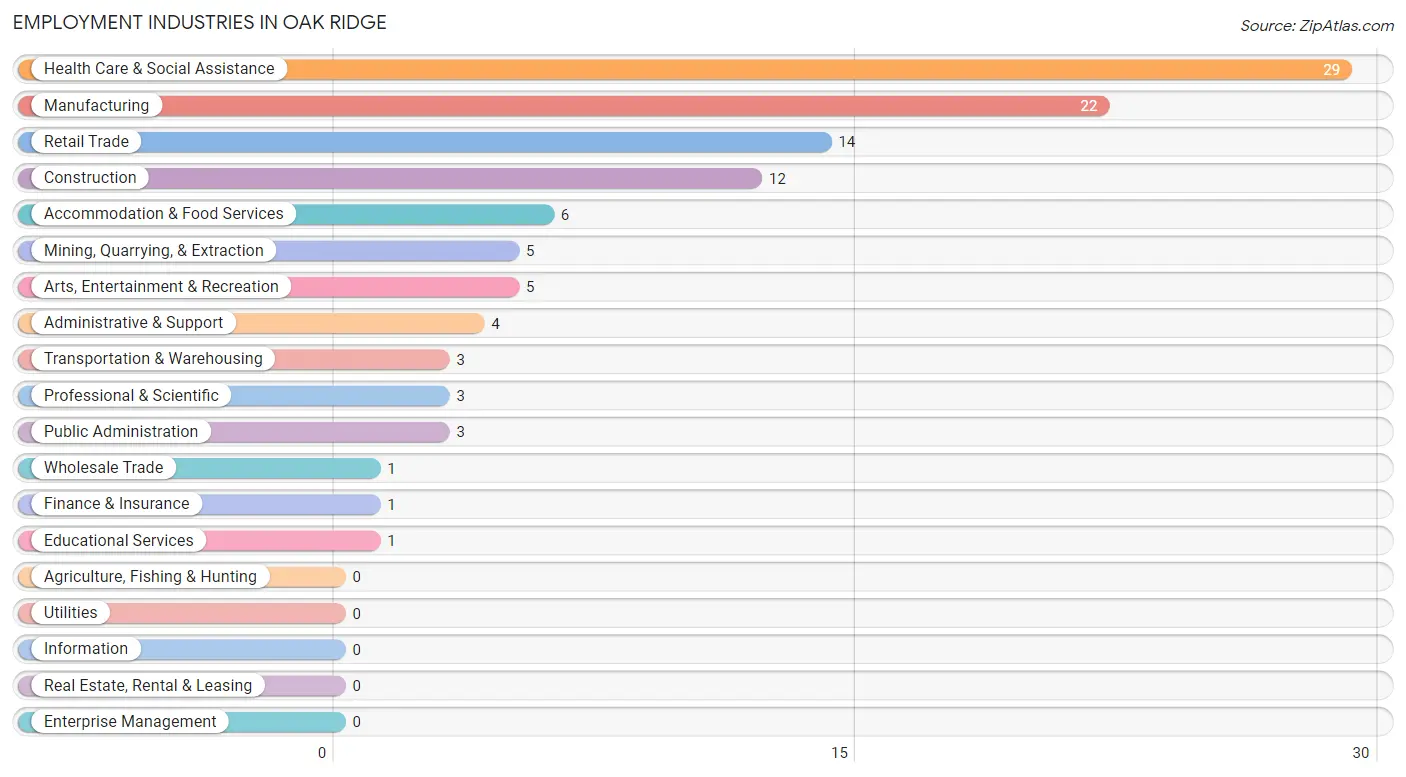
Employment Industries in Oak Ridge
The major employment industries in Oak Ridge include Health Care & Social Assistance (29 | 23.2%), Manufacturing (22 | 17.6%), Retail Trade (14 | 11.2%), Construction (12 | 9.6%), and Accommodation & Food Services (6 | 4.8%).
Employment Industries by Sex in Oak Ridge
The Oak Ridge industries that see more men than women are Mining, Quarrying, & Extraction (100.0%), Construction (100.0%), and Wholesale Trade (100.0%), whereas the industries that tend to have a higher number of women are Finance & Insurance (100.0%), Professional & Scientific (100.0%), and Educational Services (100.0%).
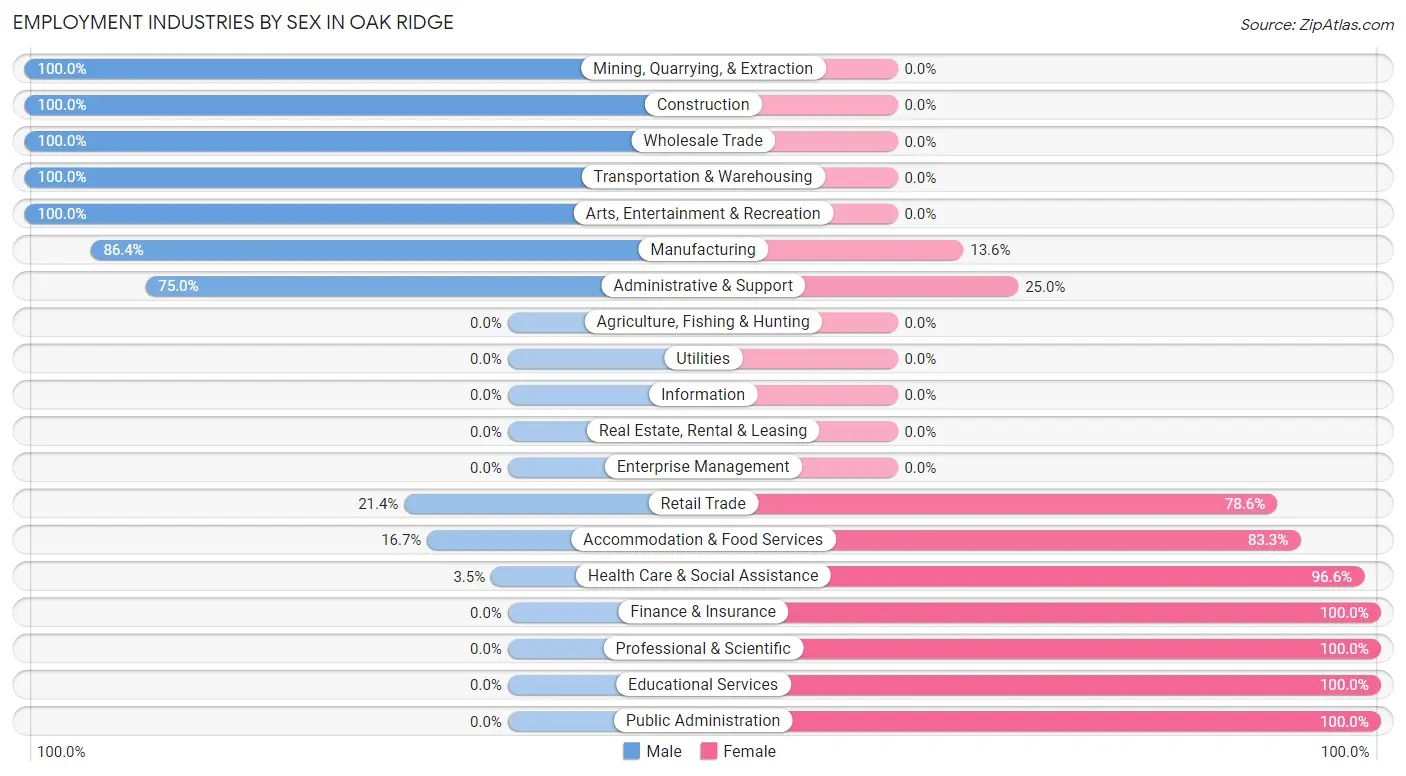
| Industry | Male | Female |
| Agriculture, Fishing & Hunting | 0 (0.0%) | 0 (0.0%) |
| Mining, Quarrying, & Extraction | 5 (100.0%) | 0 (0.0%) |
| Construction | 12 (100.0%) | 0 (0.0%) |
| Manufacturing | 19 (86.4%) | 3 (13.6%) |
| Wholesale Trade | 1 (100.0%) | 0 (0.0%) |
| Retail Trade | 3 (21.4%) | 11 (78.6%) |
| Transportation & Warehousing | 3 (100.0%) | 0 (0.0%) |
| Utilities | 0 (0.0%) | 0 (0.0%) |
| Information | 0 (0.0%) | 0 (0.0%) |
| Finance & Insurance | 0 (0.0%) | 1 (100.0%) |
| Real Estate, Rental & Leasing | 0 (0.0%) | 0 (0.0%) |
| Professional & Scientific | 0 (0.0%) | 3 (100.0%) |
| Enterprise Management | 0 (0.0%) | 0 (0.0%) |
| Administrative & Support | 3 (75.0%) | 1 (25.0%) |
| Educational Services | 0 (0.0%) | 1 (100.0%) |
| Health Care & Social Assistance | 1 (3.5%) | 28 (96.6%) |
| Arts, Entertainment & Recreation | 5 (100.0%) | 0 (0.0%) |
| Accommodation & Food Services | 1 (16.7%) | 5 (83.3%) |
| Public Administration | 0 (0.0%) | 3 (100.0%) |
| Total | 63 (50.4%) | 62 (49.6%) |
Education in Oak Ridge
School Enrollment in Oak Ridge
The most common levels of schooling among the 61 students in Oak Ridge are high school (24 | 39.3%), middle school (17 | 27.9%), and elementary school (15 | 24.6%).
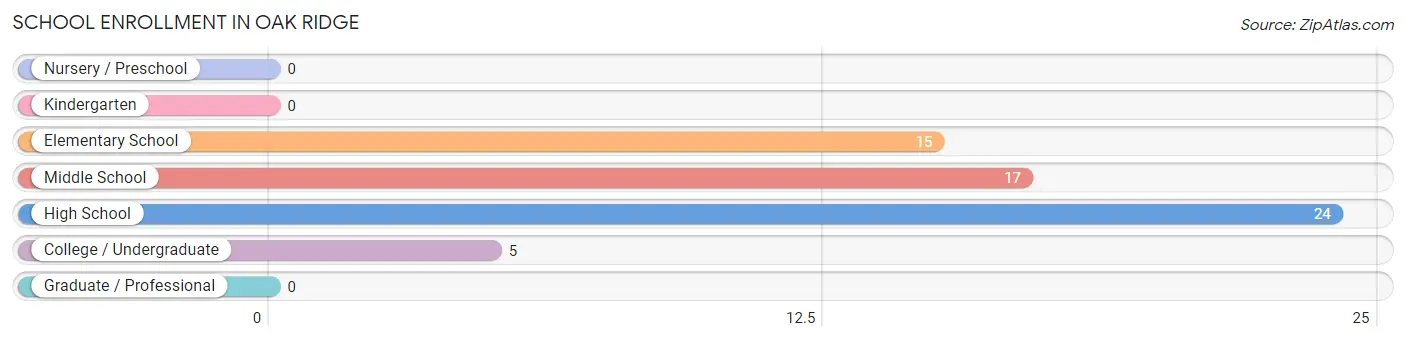
| School Level | # Students | % Students |
| Nursery / Preschool | 0 | 0.0% |
| Kindergarten | 0 | 0.0% |
| Elementary School | 15 | 24.6% |
| Middle School | 17 | 27.9% |
| High School | 24 | 39.3% |
| College / Undergraduate | 5 | 8.2% |
| Graduate / Professional | 0 | 0.0% |
| Total | 61 | 100.0% |
School Enrollment by Age by Funding Source in Oak Ridge
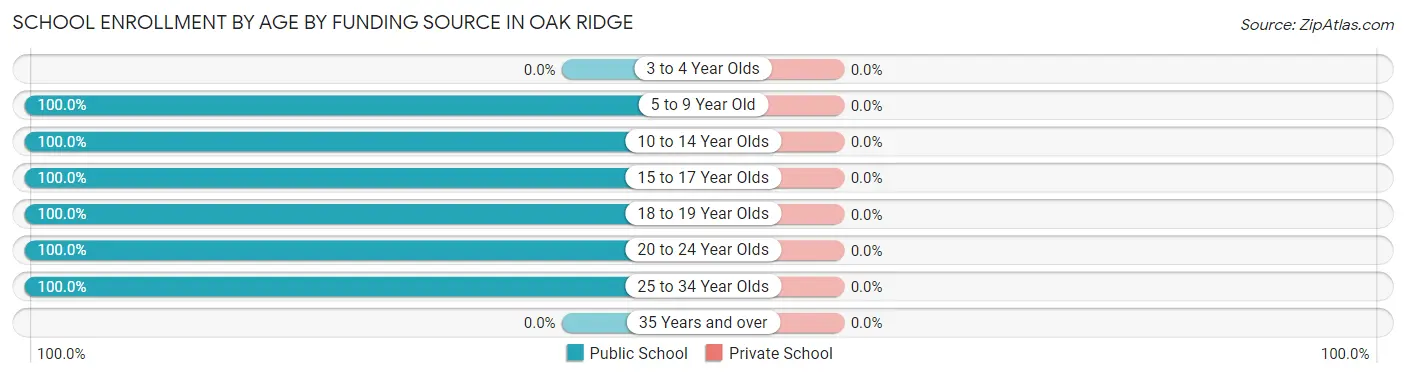
| Age Bracket | Public School | Private School |
| 3 to 4 Year Olds | 0 (0.0%) | 0 (0.0%) |
| 5 to 9 Year Old | 14 (100.0%) | 0 (0.0%) |
| 10 to 14 Year Olds | 18 (100.0%) | 0 (0.0%) |
| 15 to 17 Year Olds | 20 (100.0%) | 0 (0.0%) |
| 18 to 19 Year Olds | 4 (100.0%) | 0 (0.0%) |
| 20 to 24 Year Olds | 3 (100.0%) | 0 (0.0%) |
| 25 to 34 Year Olds | 2 (100.0%) | 0 (0.0%) |
| 35 Years and over | 0 (0.0%) | 0 (0.0%) |
| Total | 61 (100.0%) | 0 (0.0%) |
Educational Attainment by Field of Study in Oak Ridge
Business (9 | 32.1%), psychology (8 | 28.6%), education (3 | 10.7%), physical & health sciences (2 | 7.1%), and social sciences (2 | 7.1%) are the most common fields of study among 28 individuals in Oak Ridge who have obtained a bachelor's degree or higher.
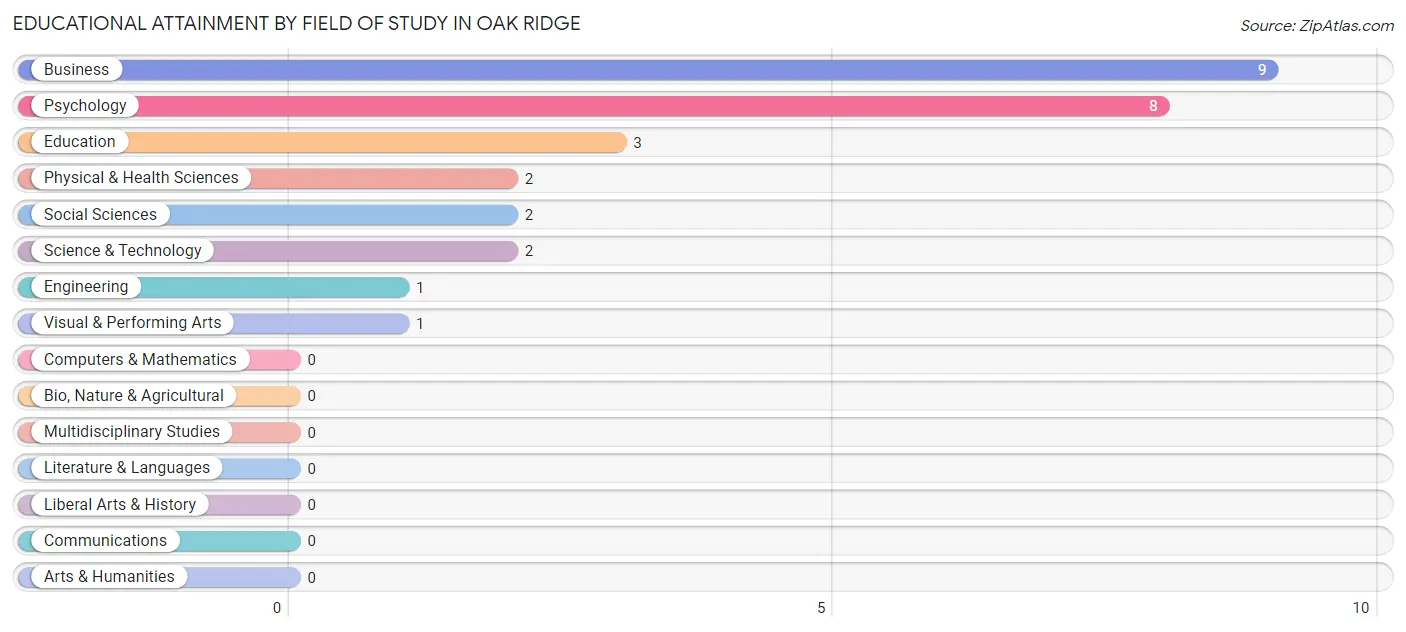
| Field of Study | # Graduates | % Graduates |
| Computers & Mathematics | 0 | 0.0% |
| Bio, Nature & Agricultural | 0 | 0.0% |
| Physical & Health Sciences | 2 | 7.1% |
| Psychology | 8 | 28.6% |
| Social Sciences | 2 | 7.1% |
| Engineering | 1 | 3.6% |
| Multidisciplinary Studies | 0 | 0.0% |
| Science & Technology | 2 | 7.1% |
| Business | 9 | 32.1% |
| Education | 3 | 10.7% |
| Literature & Languages | 0 | 0.0% |
| Liberal Arts & History | 0 | 0.0% |
| Visual & Performing Arts | 1 | 3.6% |
| Communications | 0 | 0.0% |
| Arts & Humanities | 0 | 0.0% |
| Total | 28 | 100.0% |
Transportation & Commute in Oak Ridge
Vehicle Availability by Sex in Oak Ridge
The most prevalent vehicle ownership categories in Oak Ridge are males with 2 vehicles (31, accounting for 49.2%) and females with 2 vehicles (26, making up 50.0%).
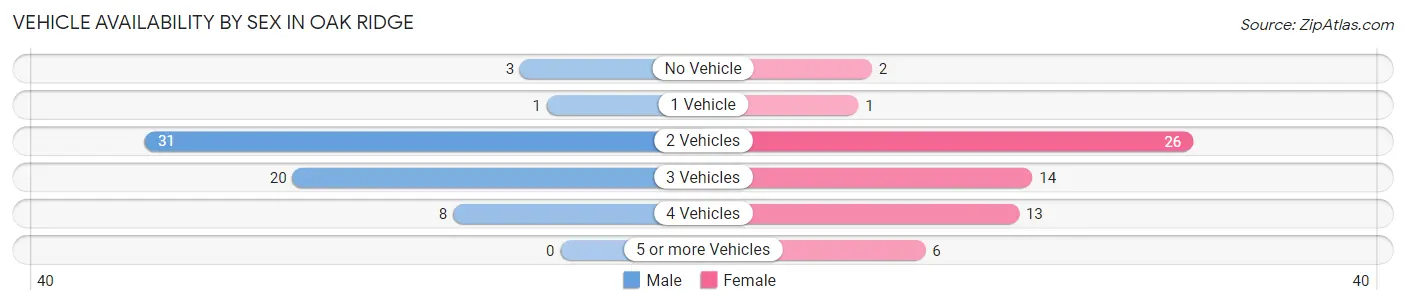
| Vehicles Available | Male | Female |
| No Vehicle | 3 (4.8%) | 2 (3.2%) |
| 1 Vehicle | 1 (1.6%) | 1 (1.6%) |
| 2 Vehicles | 31 (49.2%) | 26 (41.9%) |
| 3 Vehicles | 20 (31.8%) | 14 (22.6%) |
| 4 Vehicles | 8 (12.7%) | 13 (21.0%) |
| 5 or more Vehicles | 0 (0.0%) | 6 (9.7%) |
| Total | 63 (100.0%) | 62 (100.0%) |
Commute Time in Oak Ridge
The most frequently occuring commute durations in Oak Ridge are 25 to 29 minutes (30 commuters, 24.2%), 20 to 24 minutes (29 commuters, 23.4%), and 15 to 19 minutes (21 commuters, 16.9%).
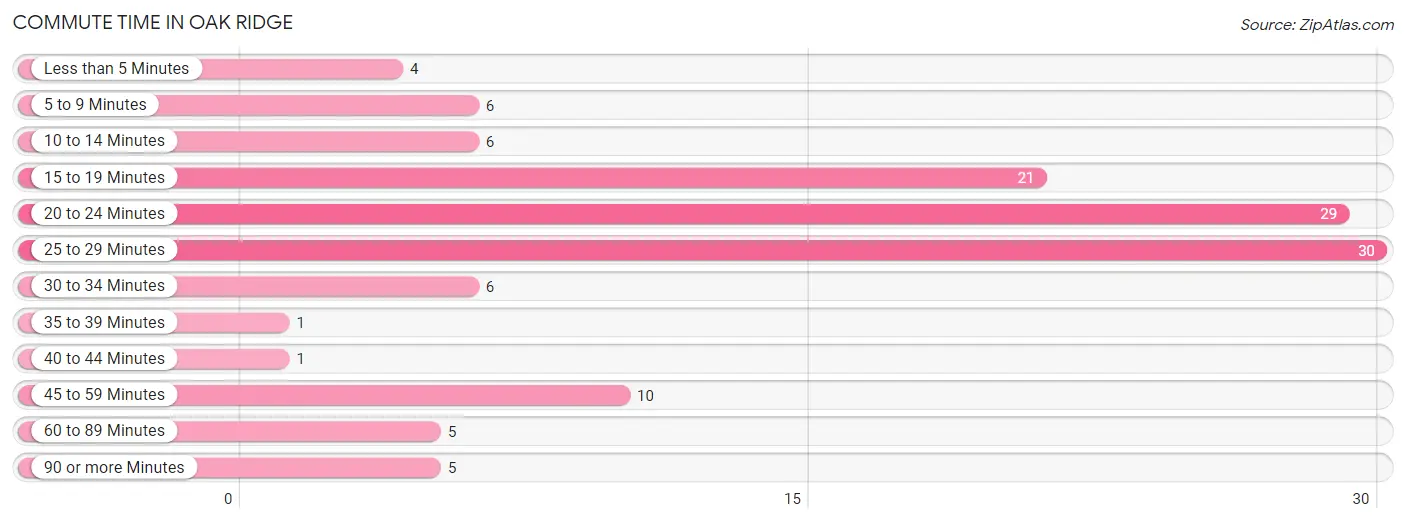
| Commute Time | # Commuters | % Commuters |
| Less than 5 Minutes | 4 | 3.2% |
| 5 to 9 Minutes | 6 | 4.8% |
| 10 to 14 Minutes | 6 | 4.8% |
| 15 to 19 Minutes | 21 | 16.9% |
| 20 to 24 Minutes | 29 | 23.4% |
| 25 to 29 Minutes | 30 | 24.2% |
| 30 to 34 Minutes | 6 | 4.8% |
| 35 to 39 Minutes | 1 | 0.8% |
| 40 to 44 Minutes | 1 | 0.8% |
| 45 to 59 Minutes | 10 | 8.1% |
| 60 to 89 Minutes | 5 | 4.0% |
| 90 or more Minutes | 5 | 4.0% |
Commute Time by Sex in Oak Ridge
The most common commute times in Oak Ridge are 20 to 24 minutes (16 commuters, 25.8%) for males and 25 to 29 minutes (28 commuters, 45.2%) for females.
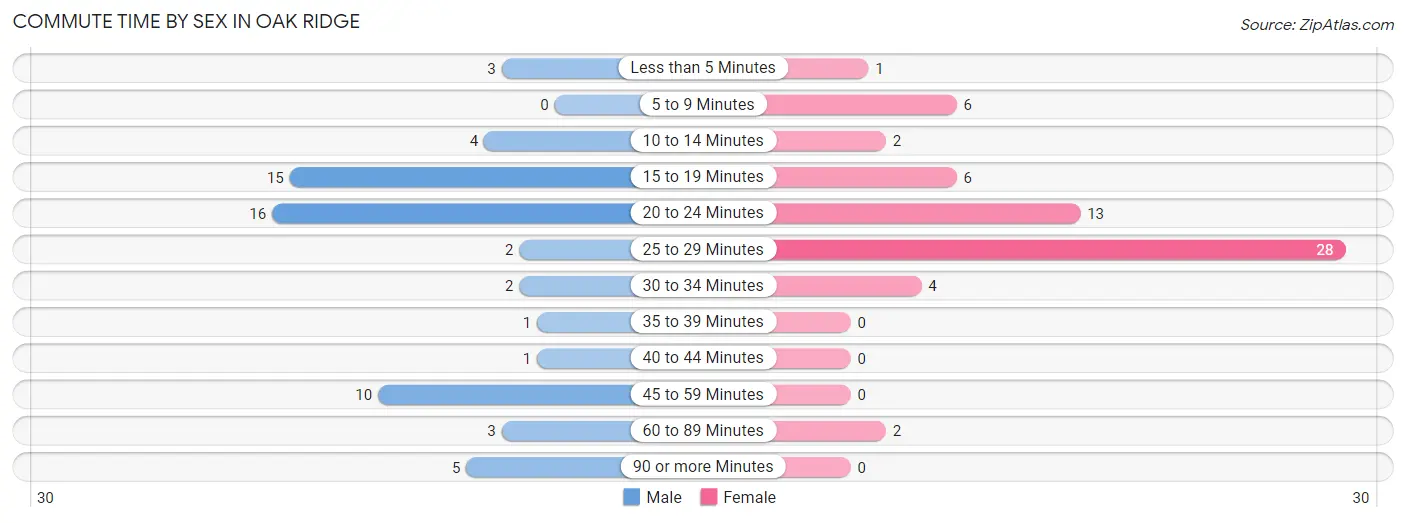
| Commute Time | Male | Female |
| Less than 5 Minutes | 3 (4.8%) | 1 (1.6%) |
| 5 to 9 Minutes | 0 (0.0%) | 6 (9.7%) |
| 10 to 14 Minutes | 4 (6.5%) | 2 (3.2%) |
| 15 to 19 Minutes | 15 (24.2%) | 6 (9.7%) |
| 20 to 24 Minutes | 16 (25.8%) | 13 (21.0%) |
| 25 to 29 Minutes | 2 (3.2%) | 28 (45.2%) |
| 30 to 34 Minutes | 2 (3.2%) | 4 (6.5%) |
| 35 to 39 Minutes | 1 (1.6%) | 0 (0.0%) |
| 40 to 44 Minutes | 1 (1.6%) | 0 (0.0%) |
| 45 to 59 Minutes | 10 (16.1%) | 0 (0.0%) |
| 60 to 89 Minutes | 3 (4.8%) | 2 (3.2%) |
| 90 or more Minutes | 5 (8.1%) | 0 (0.0%) |
Time of Departure to Work by Sex in Oak Ridge
The most frequent times of departure to work in Oak Ridge are 6:00 AM to 6:29 AM (18, 29.0%) for males and 6:30 AM to 6:59 AM (12, 19.4%) for females.
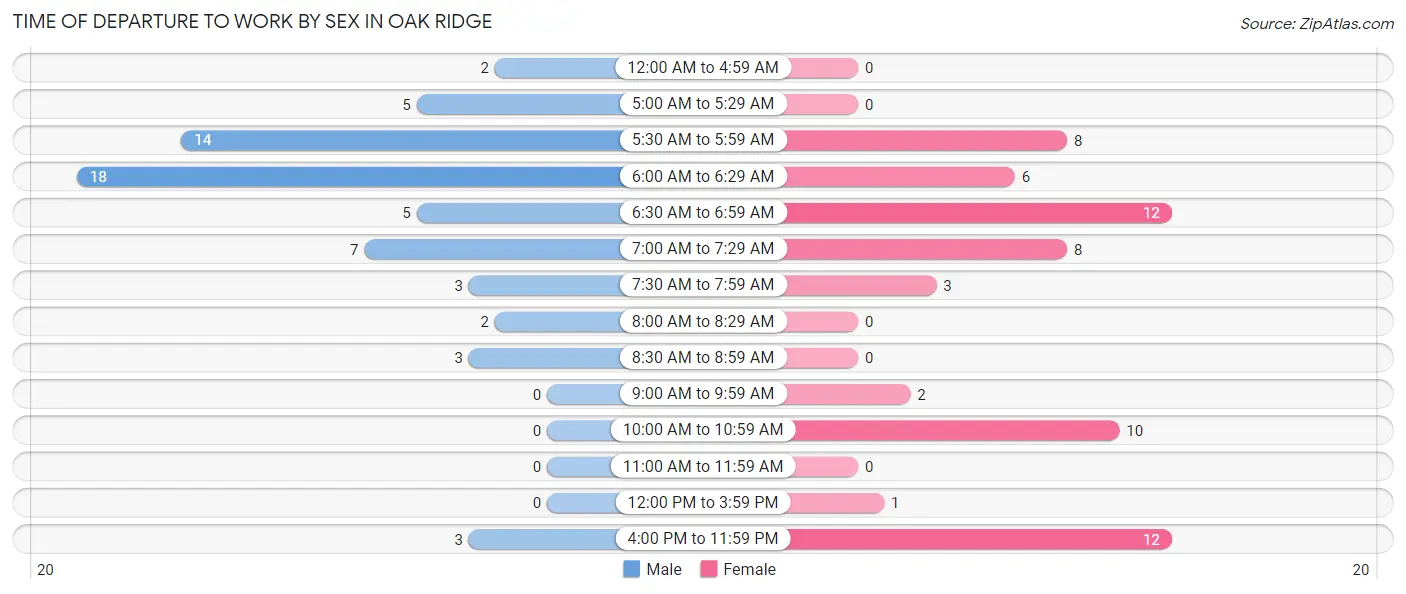
| Time of Departure | Male | Female |
| 12:00 AM to 4:59 AM | 2 (3.2%) | 0 (0.0%) |
| 5:00 AM to 5:29 AM | 5 (8.1%) | 0 (0.0%) |
| 5:30 AM to 5:59 AM | 14 (22.6%) | 8 (12.9%) |
| 6:00 AM to 6:29 AM | 18 (29.0%) | 6 (9.7%) |
| 6:30 AM to 6:59 AM | 5 (8.1%) | 12 (19.4%) |
| 7:00 AM to 7:29 AM | 7 (11.3%) | 8 (12.9%) |
| 7:30 AM to 7:59 AM | 3 (4.8%) | 3 (4.8%) |
| 8:00 AM to 8:29 AM | 2 (3.2%) | 0 (0.0%) |
| 8:30 AM to 8:59 AM | 3 (4.8%) | 0 (0.0%) |
| 9:00 AM to 9:59 AM | 0 (0.0%) | 2 (3.2%) |
| 10:00 AM to 10:59 AM | 0 (0.0%) | 10 (16.1%) |
| 11:00 AM to 11:59 AM | 0 (0.0%) | 0 (0.0%) |
| 12:00 PM to 3:59 PM | 0 (0.0%) | 1 (1.6%) |
| 4:00 PM to 11:59 PM | 3 (4.8%) | 12 (19.4%) |
| Total | 62 (100.0%) | 62 (100.0%) |
Housing Occupancy in Oak Ridge
Occupancy by Ownership in Oak Ridge
Of the total 94 dwellings in Oak Ridge, owner-occupied units account for 82 (87.2%), while renter-occupied units make up 12 (12.8%).
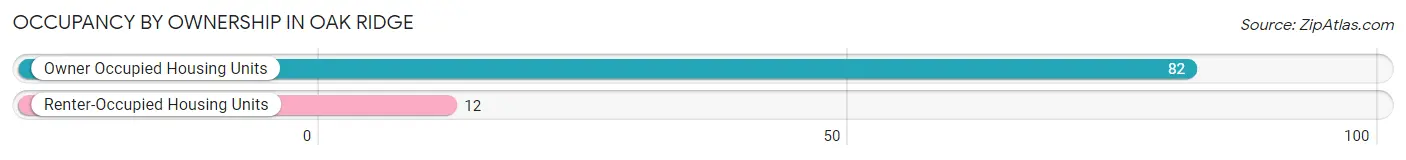
| Occupancy | # Housing Units | % Housing Units |
| Owner Occupied Housing Units | 82 | 87.2% |
| Renter-Occupied Housing Units | 12 | 12.8% |
| Total Occupied Housing Units | 94 | 100.0% |
Occupancy by Household Size in Oak Ridge
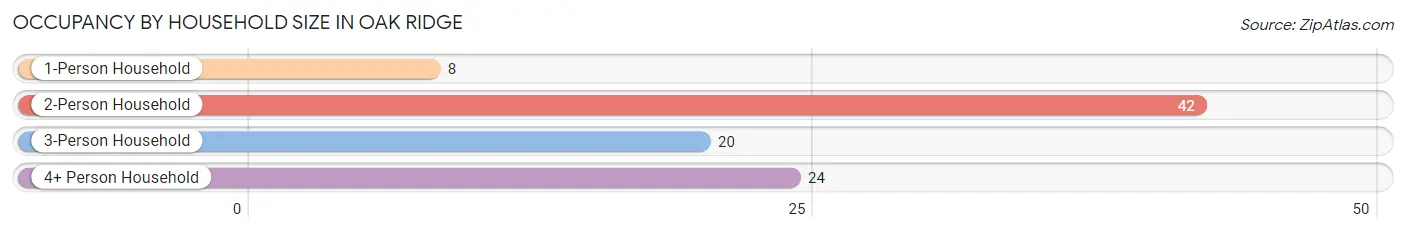
| Household Size | # Housing Units | % Housing Units |
| 1-Person Household | 8 | 8.5% |
| 2-Person Household | 42 | 44.7% |
| 3-Person Household | 20 | 21.3% |
| 4+ Person Household | 24 | 25.5% |
| Total Housing Units | 94 | 100.0% |
Occupancy by Ownership by Household Size in Oak Ridge
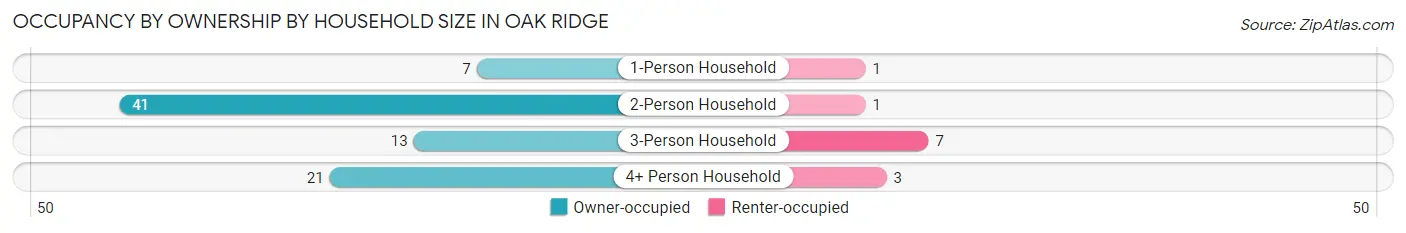
| Household Size | Owner-occupied | Renter-occupied |
| 1-Person Household | 7 (87.5%) | 1 (12.5%) |
| 2-Person Household | 41 (97.6%) | 1 (2.4%) |
| 3-Person Household | 13 (65.0%) | 7 (35.0%) |
| 4+ Person Household | 21 (87.5%) | 3 (12.5%) |
| Total Housing Units | 82 (87.2%) | 12 (12.8%) |
Occupancy by Educational Attainment in Oak Ridge
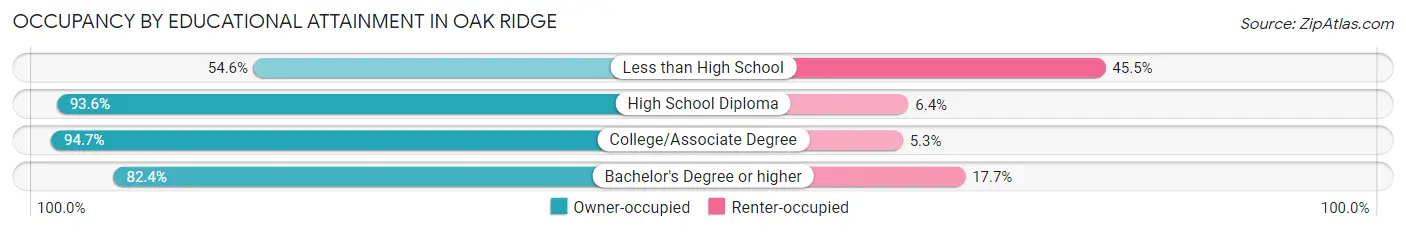
| Household Size | Owner-occupied | Renter-occupied |
| Less than High School | 6 (54.5%) | 5 (45.5%) |
| High School Diploma | 44 (93.6%) | 3 (6.4%) |
| College/Associate Degree | 18 (94.7%) | 1 (5.3%) |
| Bachelor's Degree or higher | 14 (82.4%) | 3 (17.6%) |
Occupancy by Age of Householder in Oak Ridge
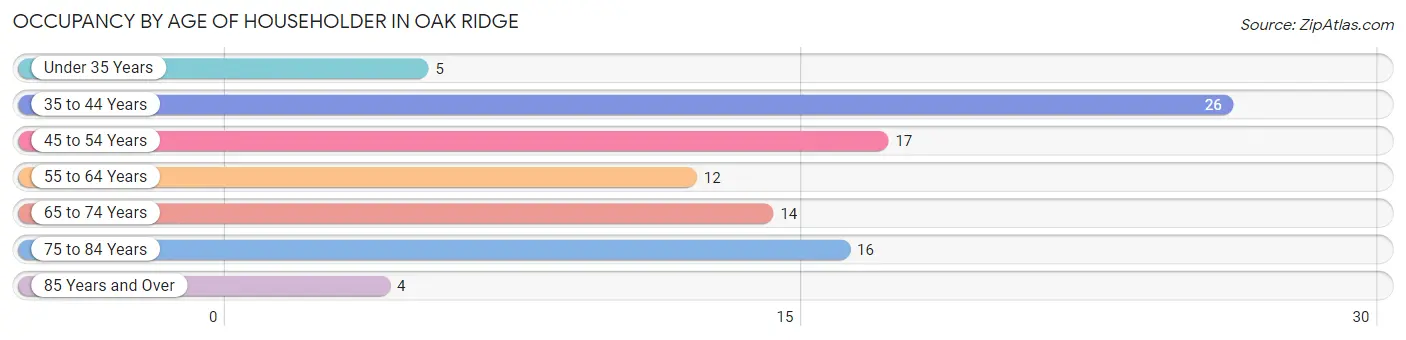
| Age Bracket | # Households | % Households |
| Under 35 Years | 5 | 5.3% |
| 35 to 44 Years | 26 | 27.7% |
| 45 to 54 Years | 17 | 18.1% |
| 55 to 64 Years | 12 | 12.8% |
| 65 to 74 Years | 14 | 14.9% |
| 75 to 84 Years | 16 | 17.0% |
| 85 Years and Over | 4 | 4.3% |
| Total | 94 | 100.0% |
Housing Finances in Oak Ridge
Median Income by Occupancy in Oak Ridge
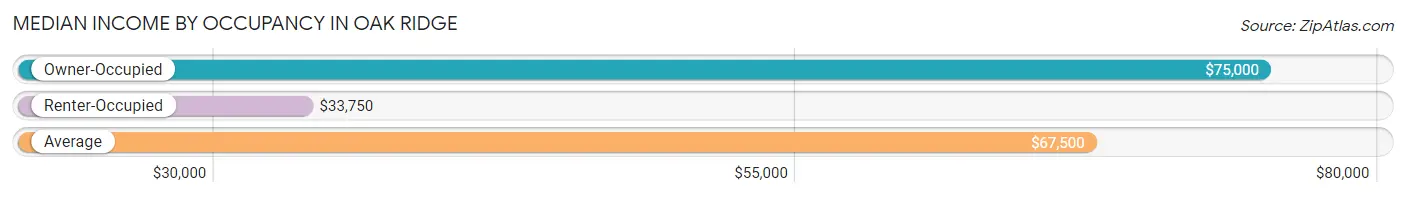
| Occupancy Type | # Households | Median Income |
| Owner-Occupied | 82 (87.2%) | $75,000 |
| Renter-Occupied | 12 (12.8%) | $33,750 |
| Average | 94 (100.0%) | $67,500 |
Occupancy by Householder Income Bracket in Oak Ridge
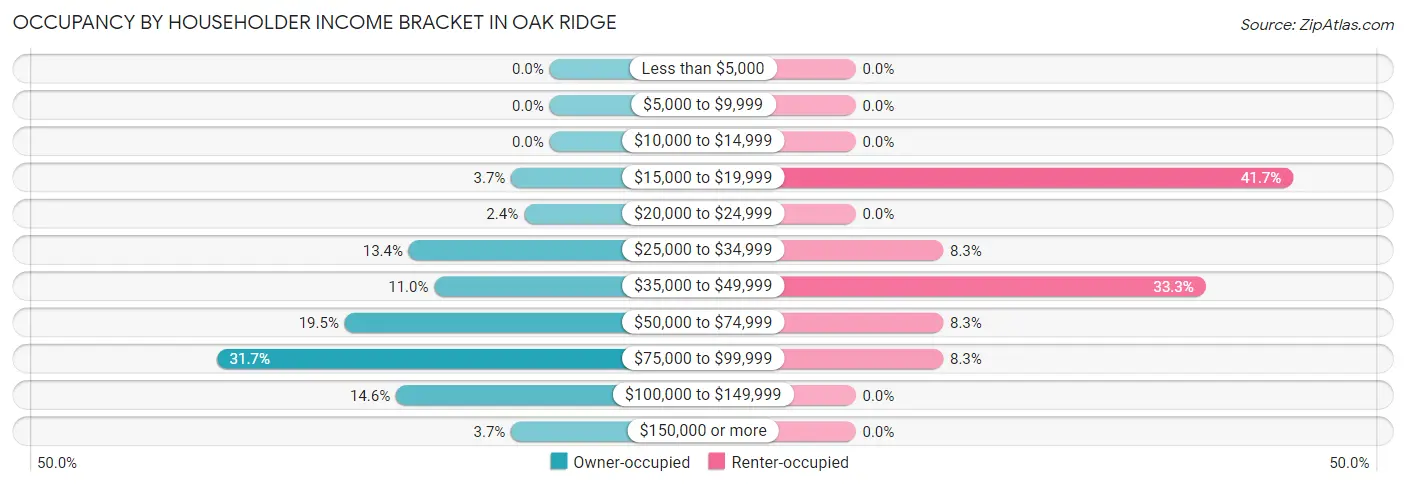
| Income Bracket | Owner-occupied | Renter-occupied |
| Less than $5,000 | 0 (0.0%) | 0 (0.0%) |
| $5,000 to $9,999 | 0 (0.0%) | 0 (0.0%) |
| $10,000 to $14,999 | 0 (0.0%) | 0 (0.0%) |
| $15,000 to $19,999 | 3 (3.7%) | 5 (41.7%) |
| $20,000 to $24,999 | 2 (2.4%) | 0 (0.0%) |
| $25,000 to $34,999 | 11 (13.4%) | 1 (8.3%) |
| $35,000 to $49,999 | 9 (11.0%) | 4 (33.3%) |
| $50,000 to $74,999 | 16 (19.5%) | 1 (8.3%) |
| $75,000 to $99,999 | 26 (31.7%) | 1 (8.3%) |
| $100,000 to $149,999 | 12 (14.6%) | 0 (0.0%) |
| $150,000 or more | 3 (3.7%) | 0 (0.0%) |
| Total | 82 (100.0%) | 12 (100.0%) |
Monthly Housing Cost Tiers in Oak Ridge
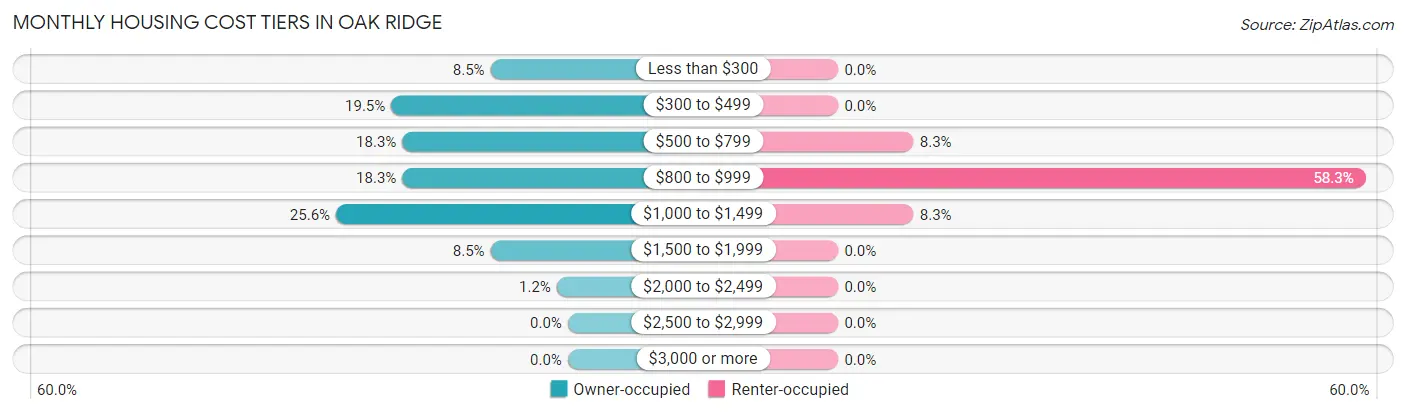
| Monthly Cost | Owner-occupied | Renter-occupied |
| Less than $300 | 7 (8.5%) | 0 (0.0%) |
| $300 to $499 | 16 (19.5%) | 0 (0.0%) |
| $500 to $799 | 15 (18.3%) | 1 (8.3%) |
| $800 to $999 | 15 (18.3%) | 7 (58.3%) |
| $1,000 to $1,499 | 21 (25.6%) | 1 (8.3%) |
| $1,500 to $1,999 | 7 (8.5%) | 0 (0.0%) |
| $2,000 to $2,499 | 1 (1.2%) | 0 (0.0%) |
| $2,500 to $2,999 | 0 (0.0%) | 0 (0.0%) |
| $3,000 or more | 0 (0.0%) | 0 (0.0%) |
| Total | 82 (100.0%) | 12 (100.0%) |
Physical Housing Characteristics in Oak Ridge
Housing Structures in Oak Ridge
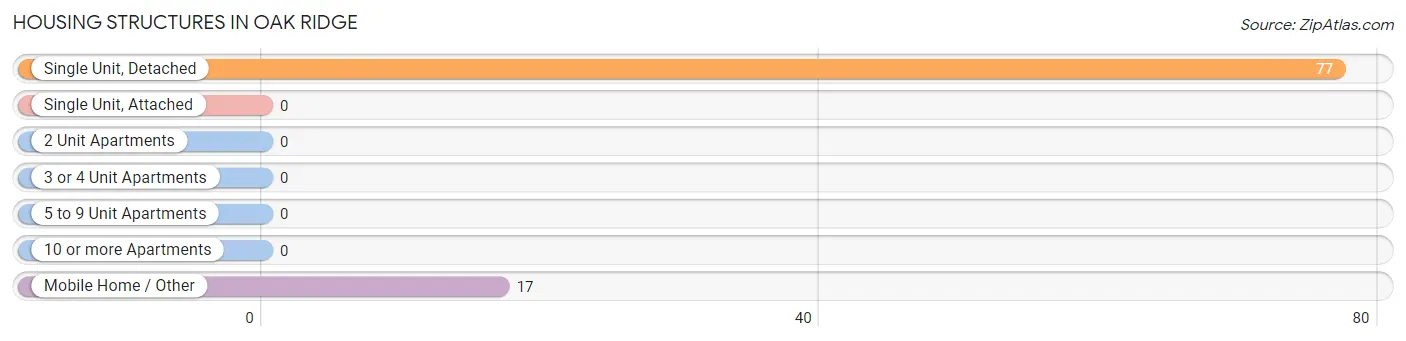
| Structure Type | # Housing Units | % Housing Units |
| Single Unit, Detached | 77 | 81.9% |
| Single Unit, Attached | 0 | 0.0% |
| 2 Unit Apartments | 0 | 0.0% |
| 3 or 4 Unit Apartments | 0 | 0.0% |
| 5 to 9 Unit Apartments | 0 | 0.0% |
| 10 or more Apartments | 0 | 0.0% |
| Mobile Home / Other | 17 | 18.1% |
| Total | 94 | 100.0% |
Housing Structures by Occupancy in Oak Ridge
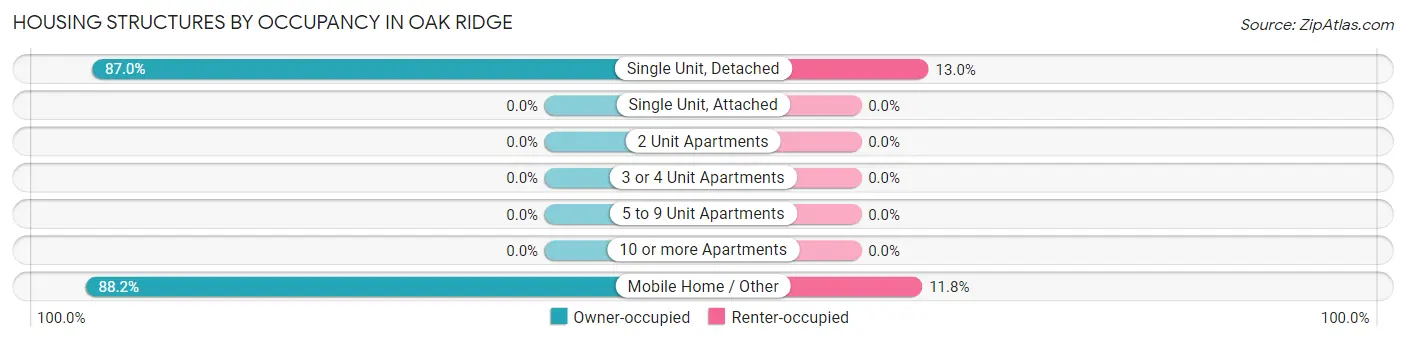
| Structure Type | Owner-occupied | Renter-occupied |
| Single Unit, Detached | 67 (87.0%) | 10 (13.0%) |
| Single Unit, Attached | 0 (0.0%) | 0 (0.0%) |
| 2 Unit Apartments | 0 (0.0%) | 0 (0.0%) |
| 3 or 4 Unit Apartments | 0 (0.0%) | 0 (0.0%) |
| 5 to 9 Unit Apartments | 0 (0.0%) | 0 (0.0%) |
| 10 or more Apartments | 0 (0.0%) | 0 (0.0%) |
| Mobile Home / Other | 15 (88.2%) | 2 (11.8%) |
| Total | 82 (87.2%) | 12 (12.8%) |
Housing Structures by Number of Rooms in Oak Ridge
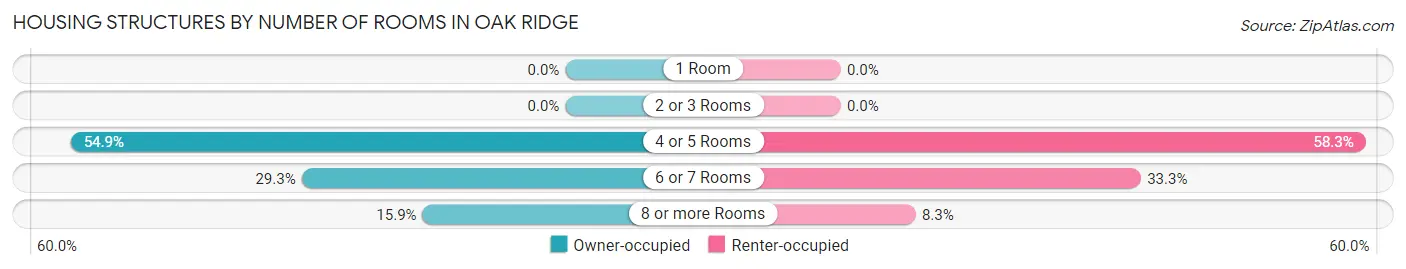
| Number of Rooms | Owner-occupied | Renter-occupied |
| 1 Room | 0 (0.0%) | 0 (0.0%) |
| 2 or 3 Rooms | 0 (0.0%) | 0 (0.0%) |
| 4 or 5 Rooms | 45 (54.9%) | 7 (58.3%) |
| 6 or 7 Rooms | 24 (29.3%) | 4 (33.3%) |
| 8 or more Rooms | 13 (15.9%) | 1 (8.3%) |
| Total | 82 (100.0%) | 12 (100.0%) |
Housing Structure by Heating Type in Oak Ridge
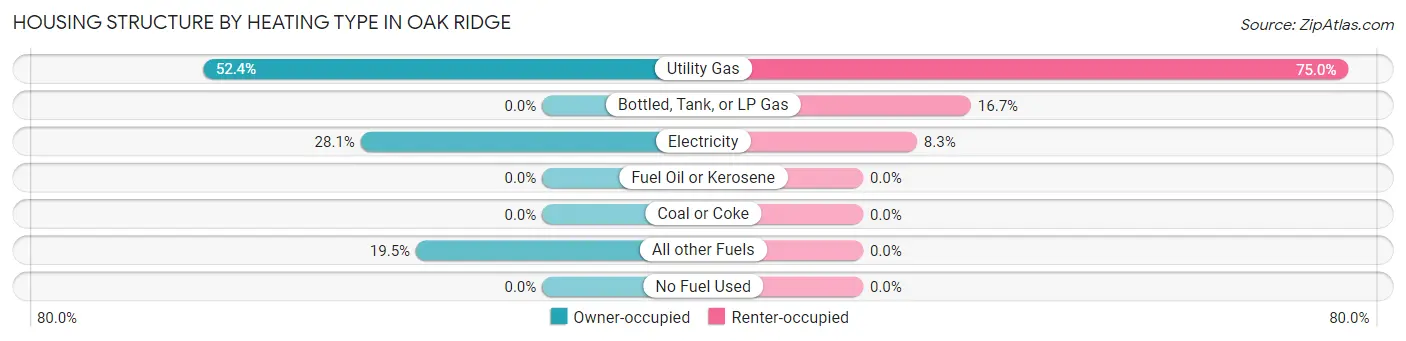
| Heating Type | Owner-occupied | Renter-occupied |
| Utility Gas | 43 (52.4%) | 9 (75.0%) |
| Bottled, Tank, or LP Gas | 0 (0.0%) | 2 (16.7%) |
| Electricity | 23 (28.1%) | 1 (8.3%) |
| Fuel Oil or Kerosene | 0 (0.0%) | 0 (0.0%) |
| Coal or Coke | 0 (0.0%) | 0 (0.0%) |
| All other Fuels | 16 (19.5%) | 0 (0.0%) |
| No Fuel Used | 0 (0.0%) | 0 (0.0%) |
| Total | 82 (100.0%) | 12 (100.0%) |
Household Vehicle Usage in Oak Ridge
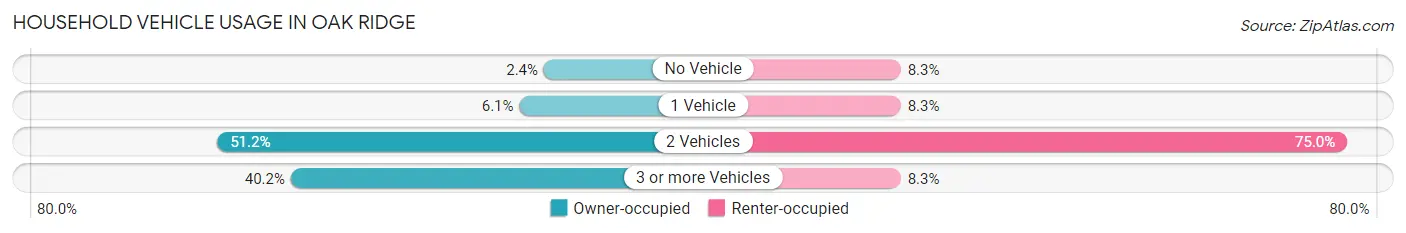
| Vehicles per Household | Owner-occupied | Renter-occupied |
| No Vehicle | 2 (2.4%) | 1 (8.3%) |
| 1 Vehicle | 5 (6.1%) | 1 (8.3%) |
| 2 Vehicles | 42 (51.2%) | 9 (75.0%) |
| 3 or more Vehicles | 33 (40.2%) | 1 (8.3%) |
| Total | 82 (100.0%) | 12 (100.0%) |
Real Estate & Mortgages in Oak Ridge
Real Estate and Mortgage Overview in Oak Ridge
| Characteristic | Without Mortgage | With Mortgage |
| Housing Units | 29 | 53 |
| Median Property Value | $97,000 | $156,300 |
| Median Household Income | $50,625 | $1 |
| Monthly Housing Costs | $382 | $0 |
| Real Estate Taxes | $640 | $1 |
Property Value by Mortgage Status in Oak Ridge
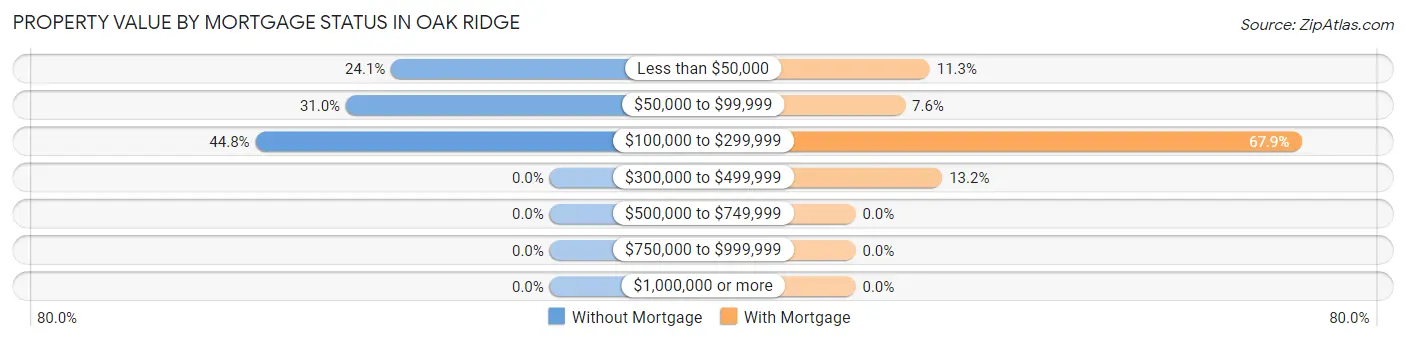
| Property Value | Without Mortgage | With Mortgage |
| Less than $50,000 | 7 (24.1%) | 6 (11.3%) |
| $50,000 to $99,999 | 9 (31.0%) | 4 (7.5%) |
| $100,000 to $299,999 | 13 (44.8%) | 36 (67.9%) |
| $300,000 to $499,999 | 0 (0.0%) | 7 (13.2%) |
| $500,000 to $749,999 | 0 (0.0%) | 0 (0.0%) |
| $750,000 to $999,999 | 0 (0.0%) | 0 (0.0%) |
| $1,000,000 or more | 0 (0.0%) | 0 (0.0%) |
| Total | 29 (100.0%) | 53 (100.0%) |
Household Income by Mortgage Status in Oak Ridge
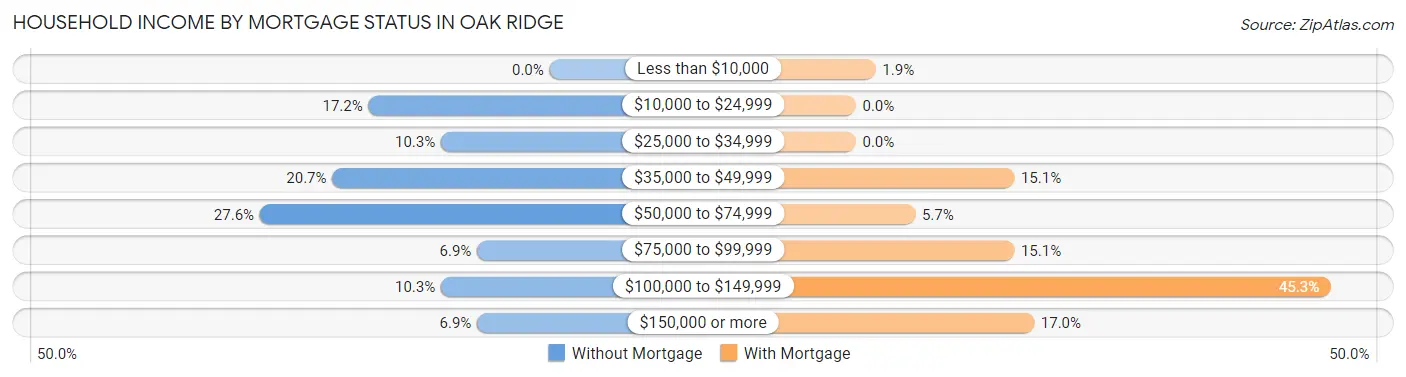
| Household Income | Without Mortgage | With Mortgage |
| Less than $10,000 | 0 (0.0%) | 1 (1.9%) |
| $10,000 to $24,999 | 5 (17.2%) | 0 (0.0%) |
| $25,000 to $34,999 | 3 (10.3%) | 0 (0.0%) |
| $35,000 to $49,999 | 6 (20.7%) | 8 (15.1%) |
| $50,000 to $74,999 | 8 (27.6%) | 3 (5.7%) |
| $75,000 to $99,999 | 2 (6.9%) | 8 (15.1%) |
| $100,000 to $149,999 | 3 (10.3%) | 24 (45.3%) |
| $150,000 or more | 2 (6.9%) | 9 (17.0%) |
| Total | 29 (100.0%) | 53 (100.0%) |
Property Value to Household Income Ratio in Oak Ridge
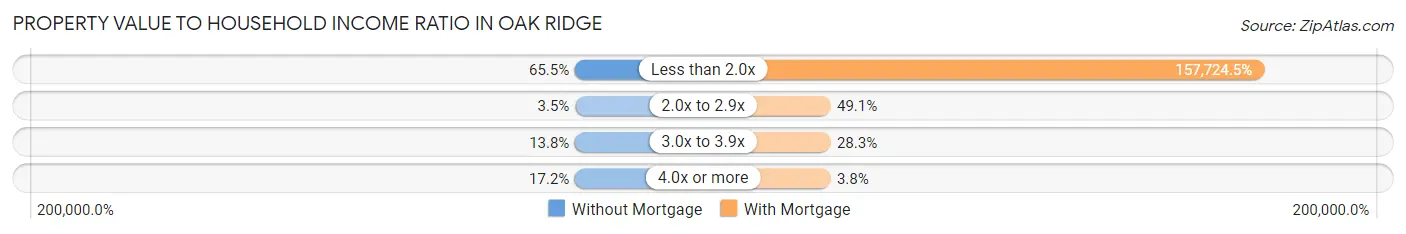
| Value-to-Income Ratio | Without Mortgage | With Mortgage |
| Less than 2.0x | 19 (65.5%) | 83,594 (157,724.5%) |
| 2.0x to 2.9x | 1 (3.5%) | 26 (49.1%) |
| 3.0x to 3.9x | 4 (13.8%) | 15 (28.3%) |
| 4.0x or more | 5 (17.2%) | 2 (3.8%) |
| Total | 29 (100.0%) | 53 (100.0%) |
Real Estate Taxes by Mortgage Status in Oak Ridge
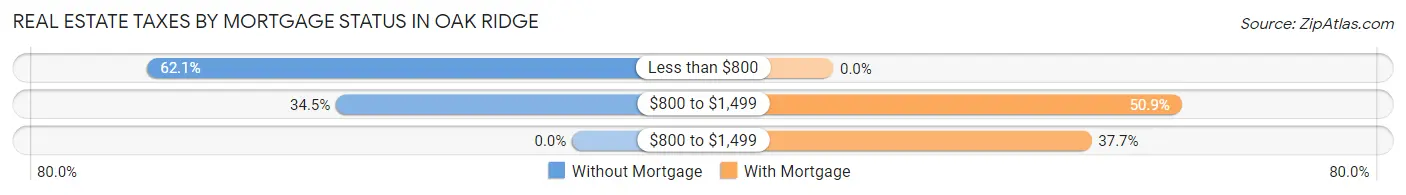
| Property Taxes | Without Mortgage | With Mortgage |
| Less than $800 | 18 (62.1%) | 0 (0.0%) |
| $800 to $1,499 | 10 (34.5%) | 27 (50.9%) |
| $800 to $1,499 | 0 (0.0%) | 20 (37.7%) |
| Total | 29 (100.0%) | 53 (100.0%) |
Health & Disability in Oak Ridge
Health Insurance Coverage by Age in Oak Ridge
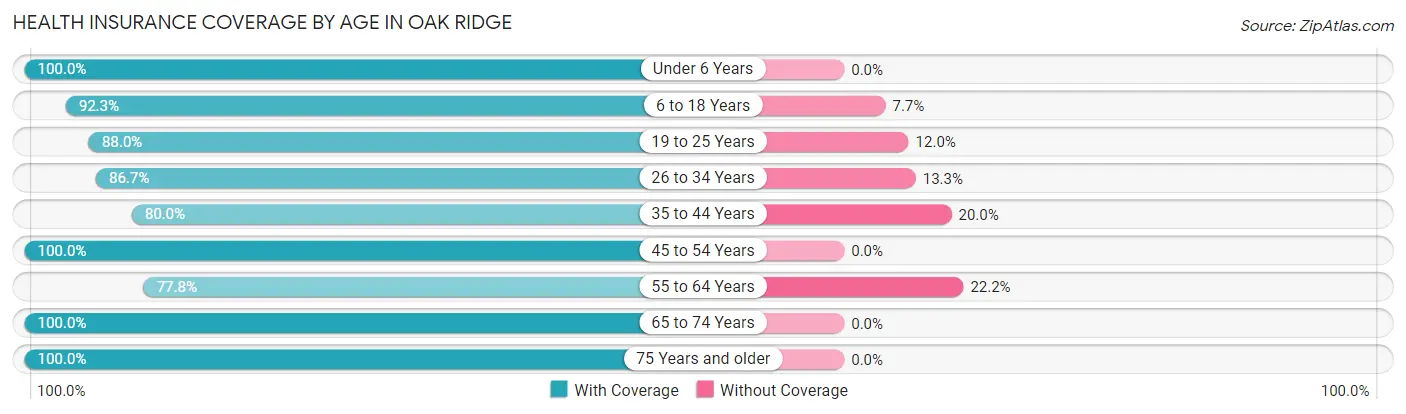
| Age Bracket | With Coverage | Without Coverage |
| Under 6 Years | 18 (100.0%) | 0 (0.0%) |
| 6 to 18 Years | 48 (92.3%) | 4 (7.7%) |
| 19 to 25 Years | 22 (88.0%) | 3 (12.0%) |
| 26 to 34 Years | 13 (86.7%) | 2 (13.3%) |
| 35 to 44 Years | 36 (80.0%) | 9 (20.0%) |
| 45 to 54 Years | 28 (100.0%) | 0 (0.0%) |
| 55 to 64 Years | 28 (77.8%) | 8 (22.2%) |
| 65 to 74 Years | 32 (100.0%) | 0 (0.0%) |
| 75 Years and older | 28 (100.0%) | 0 (0.0%) |
| Total | 253 (90.7%) | 26 (9.3%) |
Health Insurance Coverage by Citizenship Status in Oak Ridge
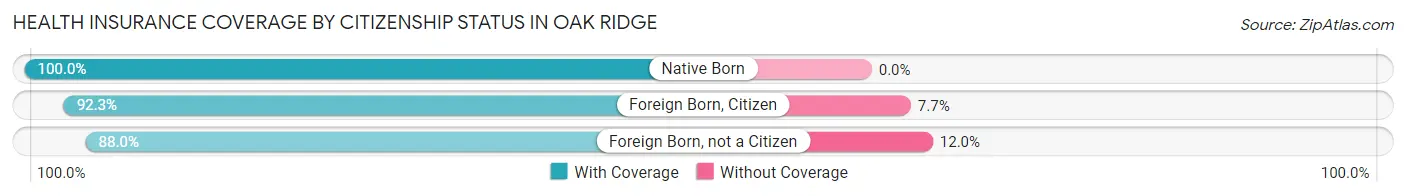
| Citizenship Status | With Coverage | Without Coverage |
| Native Born | 18 (100.0%) | 0 (0.0%) |
| Foreign Born, Citizen | 48 (92.3%) | 4 (7.7%) |
| Foreign Born, not a Citizen | 22 (88.0%) | 3 (12.0%) |
Health Insurance Coverage by Household Income in Oak Ridge
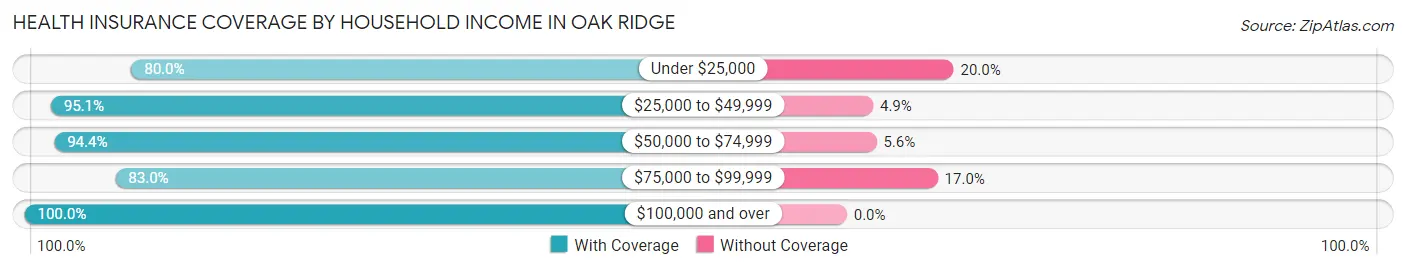
| Household Income | With Coverage | Without Coverage |
| Under $25,000 | 20 (80.0%) | 5 (20.0%) |
| $25,000 to $49,999 | 58 (95.1%) | 3 (4.9%) |
| $50,000 to $74,999 | 34 (94.4%) | 2 (5.6%) |
| $75,000 to $99,999 | 78 (83.0%) | 16 (17.0%) |
| $100,000 and over | 63 (100.0%) | 0 (0.0%) |
Public vs Private Health Insurance Coverage by Age in Oak Ridge
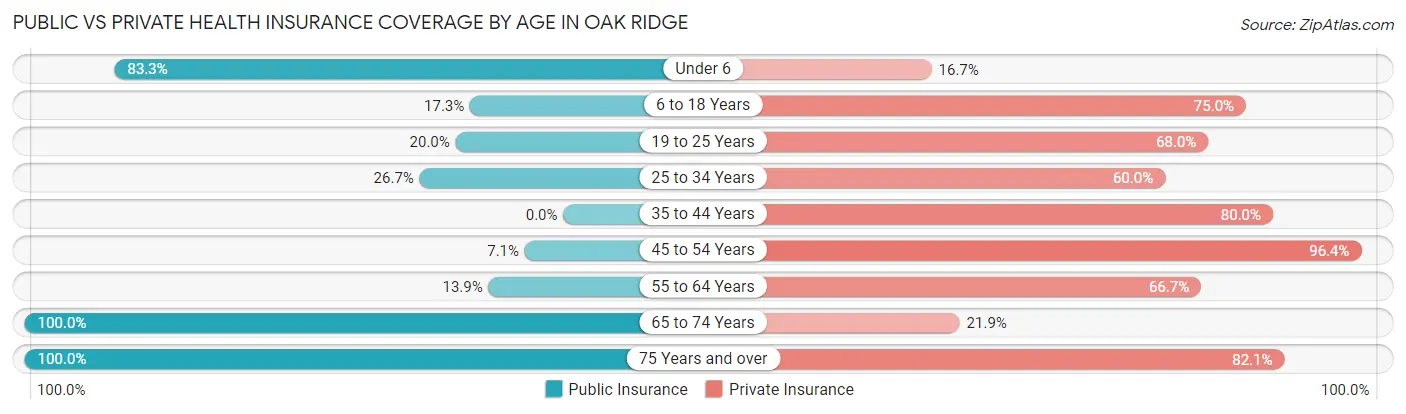
| Age Bracket | Public Insurance | Private Insurance |
| Under 6 | 15 (83.3%) | 3 (16.7%) |
| 6 to 18 Years | 9 (17.3%) | 39 (75.0%) |
| 19 to 25 Years | 5 (20.0%) | 17 (68.0%) |
| 25 to 34 Years | 4 (26.7%) | 9 (60.0%) |
| 35 to 44 Years | 0 (0.0%) | 36 (80.0%) |
| 45 to 54 Years | 2 (7.1%) | 27 (96.4%) |
| 55 to 64 Years | 5 (13.9%) | 24 (66.7%) |
| 65 to 74 Years | 32 (100.0%) | 7 (21.9%) |
| 75 Years and over | 28 (100.0%) | 23 (82.1%) |
| Total | 100 (35.8%) | 185 (66.3%) |
Disability Status by Sex by Age in Oak Ridge
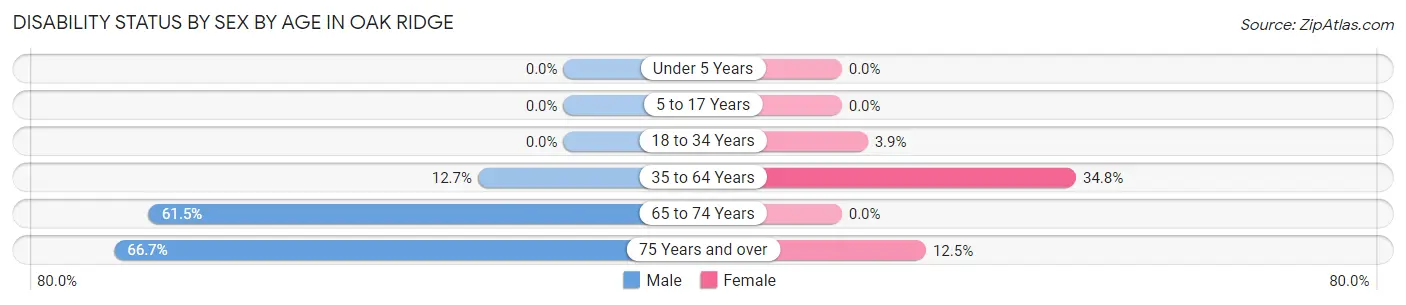
| Age Bracket | Male | Female |
| Under 5 Years | 0 (0.0%) | 0 (0.0%) |
| 5 to 17 Years | 0 (0.0%) | 0 (0.0%) |
| 18 to 34 Years | 0 (0.0%) | 1 (3.8%) |
| 35 to 64 Years | 8 (12.7%) | 16 (34.8%) |
| 65 to 74 Years | 8 (61.5%) | 0 (0.0%) |
| 75 Years and over | 8 (66.7%) | 2 (12.5%) |
Disability Class by Sex by Age in Oak Ridge
Disability Class: Hearing Difficulty
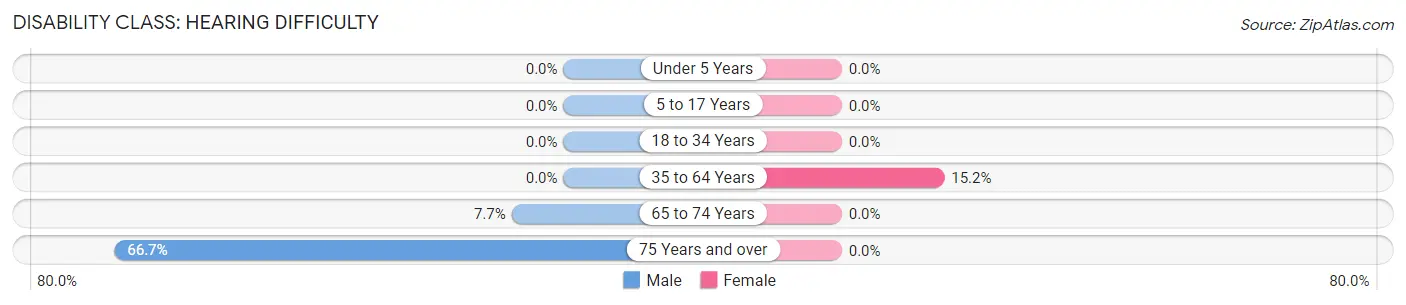
| Age Bracket | Male | Female |
| Under 5 Years | 0 (0.0%) | 0 (0.0%) |
| 5 to 17 Years | 0 (0.0%) | 0 (0.0%) |
| 18 to 34 Years | 0 (0.0%) | 0 (0.0%) |
| 35 to 64 Years | 0 (0.0%) | 7 (15.2%) |
| 65 to 74 Years | 1 (7.7%) | 0 (0.0%) |
| 75 Years and over | 8 (66.7%) | 0 (0.0%) |
Disability Class: Vision Difficulty
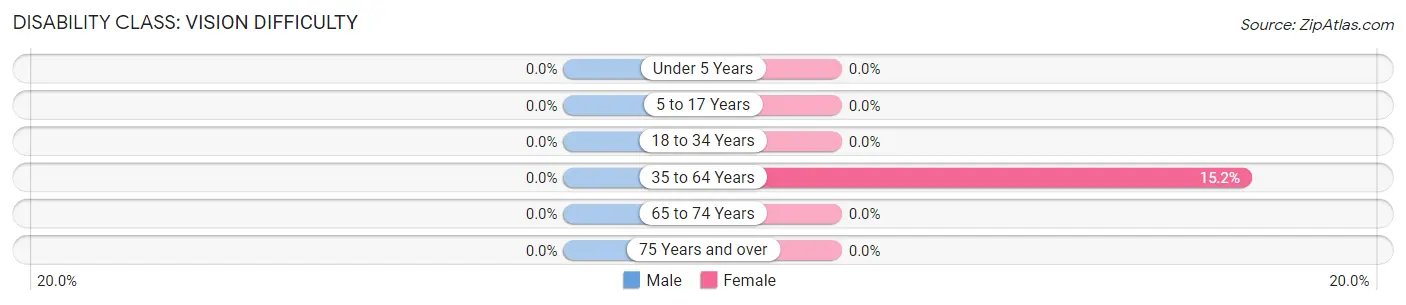
| Age Bracket | Male | Female |
| Under 5 Years | 0 (0.0%) | 0 (0.0%) |
| 5 to 17 Years | 0 (0.0%) | 0 (0.0%) |
| 18 to 34 Years | 0 (0.0%) | 0 (0.0%) |
| 35 to 64 Years | 0 (0.0%) | 7 (15.2%) |
| 65 to 74 Years | 0 (0.0%) | 0 (0.0%) |
| 75 Years and over | 0 (0.0%) | 0 (0.0%) |
Disability Class: Cognitive Difficulty
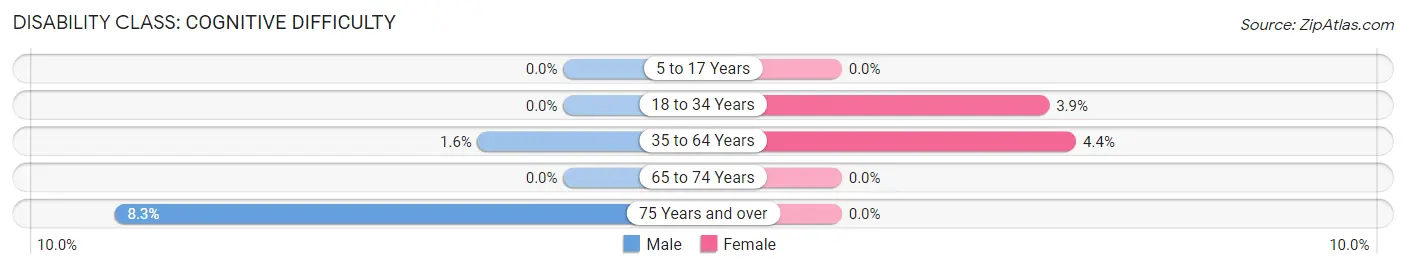
| Age Bracket | Male | Female |
| 5 to 17 Years | 0 (0.0%) | 0 (0.0%) |
| 18 to 34 Years | 0 (0.0%) | 1 (3.8%) |
| 35 to 64 Years | 1 (1.6%) | 2 (4.3%) |
| 65 to 74 Years | 0 (0.0%) | 0 (0.0%) |
| 75 Years and over | 1 (8.3%) | 0 (0.0%) |
Disability Class: Ambulatory Difficulty
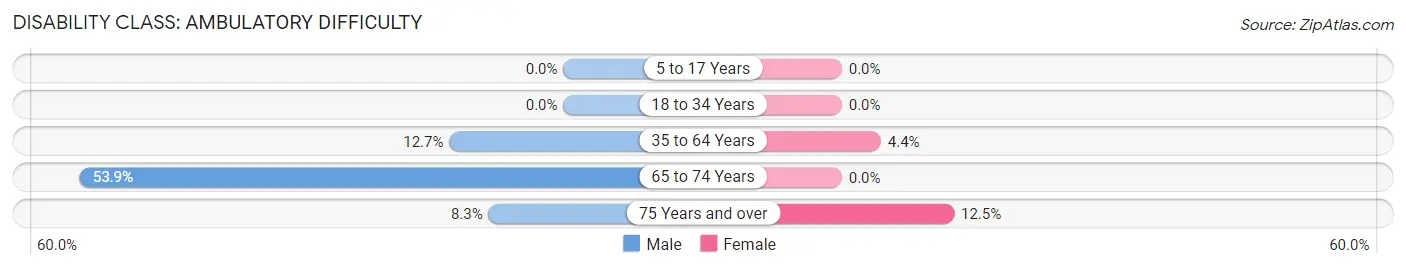
| Age Bracket | Male | Female |
| 5 to 17 Years | 0 (0.0%) | 0 (0.0%) |
| 18 to 34 Years | 0 (0.0%) | 0 (0.0%) |
| 35 to 64 Years | 8 (12.7%) | 2 (4.3%) |
| 65 to 74 Years | 7 (53.8%) | 0 (0.0%) |
| 75 Years and over | 1 (8.3%) | 2 (12.5%) |
Disability Class: Self-Care Difficulty
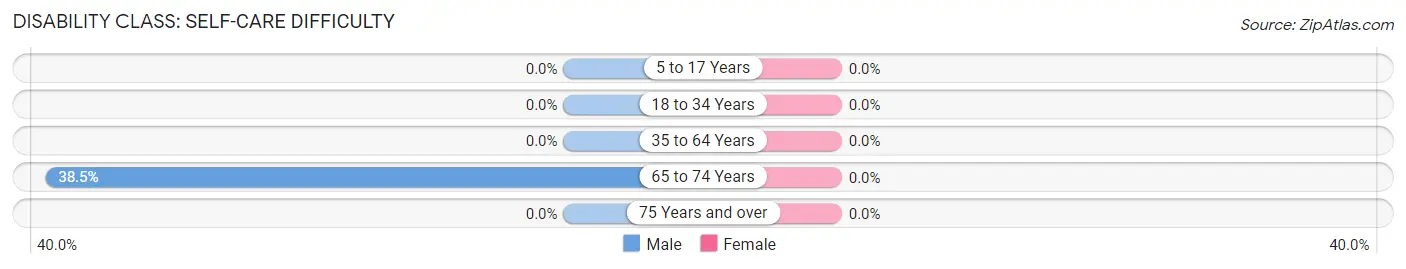
| Age Bracket | Male | Female |
| 5 to 17 Years | 0 (0.0%) | 0 (0.0%) |
| 18 to 34 Years | 0 (0.0%) | 0 (0.0%) |
| 35 to 64 Years | 0 (0.0%) | 0 (0.0%) |
| 65 to 74 Years | 5 (38.5%) | 0 (0.0%) |
| 75 Years and over | 0 (0.0%) | 0 (0.0%) |
Technology Access in Oak Ridge
Computing Device Access in Oak Ridge
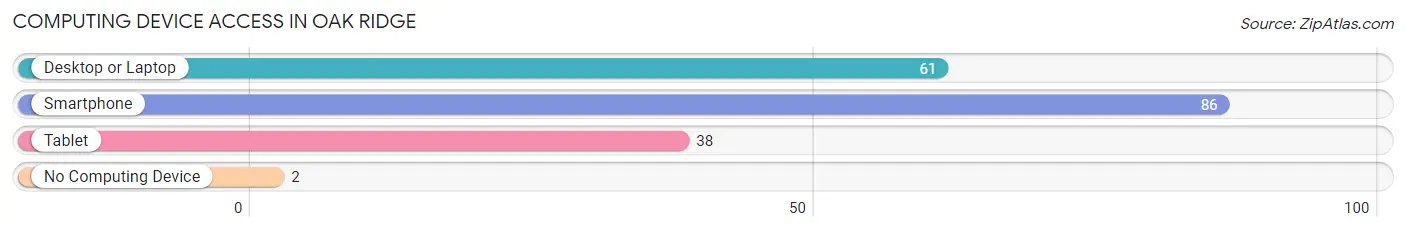
| Device Type | # Households | % Households |
| Desktop or Laptop | 61 | 64.9% |
| Smartphone | 86 | 91.5% |
| Tablet | 38 | 40.4% |
| No Computing Device | 2 | 2.1% |
| Total | 94 | 100.0% |
Internet Access in Oak Ridge
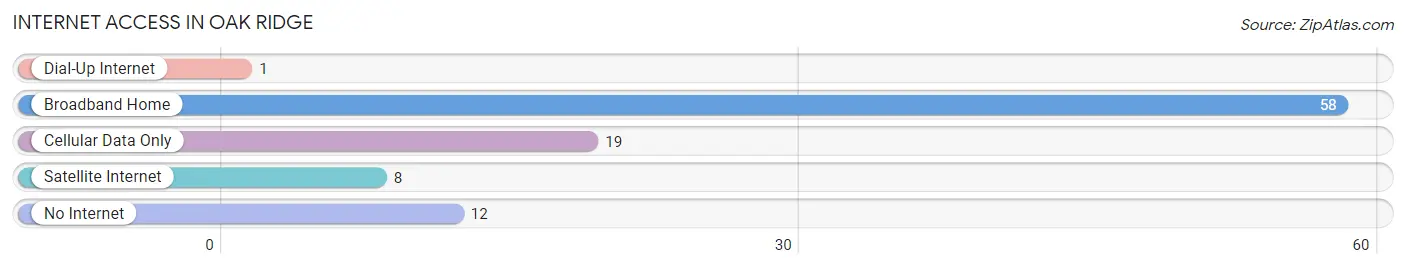
| Internet Type | # Households | % Households |
| Dial-Up Internet | 1 | 1.1% |
| Broadband Home | 58 | 61.7% |
| Cellular Data Only | 19 | 20.2% |
| Satellite Internet | 8 | 8.5% |
| No Internet | 12 | 12.8% |
| Total | 94 | 100.0% |
Oak Ridge Summary
History
The small town of Oak Ridge, Missouri is located in the southeastern corner of the state, just north of the Arkansas border. It is part of the Ozark Mountains region and is situated in the foothills of the St. Francois Mountains. The town was founded in 1845 by a group of settlers from Tennessee and Kentucky who were looking for a new home. The town was originally called “Oak Ridge” because of the abundance of oak trees in the area.
The town was originally a farming community, but in the late 19th century, it began to develop into a small industrial center. The first industry to come to Oak Ridge was a sawmill, which was built in 1887. This was followed by a grist mill, a brickyard, and a furniture factory. The town also had a number of stores, including a general store, a drug store, and a hardware store.
In the early 20th century, Oak Ridge began to experience a period of growth and prosperity. The town was incorporated in 1911 and the population grew to over 1,000 by 1920. During this time, the town was home to a number of businesses, including a bank, a hotel, a movie theater, and a number of other stores.
The Great Depression hit Oak Ridge hard, and the population declined to just over 500 by 1940. However, the town was able to recover and the population grew to over 1,000 again by 1950.
Geography
Oak Ridge is located in the southeastern corner of Missouri, just north of the Arkansas border. It is part of the Ozark Mountains region and is situated in the foothills of the St. Francois Mountains. The town is located on the banks of the Black River, which flows through the area.
The town is located in a rural area, and the surrounding landscape is mostly wooded. The town is surrounded by rolling hills and valleys, and there are several small lakes and streams in the area. The climate in Oak Ridge is mild, with hot summers and cold winters.
Economy
Oak Ridge is a small town with a population of just over 1,000 people. The town’s economy is largely based on agriculture and tourism. The town is home to a number of small businesses, including a general store, a drug store, and a hardware store.
The town is also home to a number of small manufacturing companies, including a furniture factory and a brickyard. The town is also home to a number of small farms, which produce a variety of crops, including corn, soybeans, and wheat.
Demographics
As of the 2010 census, the population of Oak Ridge was 1,072. The racial makeup of the town was 97.2% White, 0.7% African American, 0.2% Native American, 0.2% Asian, 0.1% Pacific Islander, 0.7% from other races, and 0.9% from two or more races. Hispanic or Latino of any race were 1.3% of the population.
The median income for a household in Oak Ridge was $37,500, and the median income for a family was $41,250. The per capita income for the town was $17,845. About 11.2% of families and 13.2% of the population were below the poverty line, including 17.2% of those under age 18 and 8.3% of those age 65 or over.
Common Questions
What is Per Capita Income in Oak Ridge?
Per Capita income in Oak Ridge is $25,710.
What is the Median Family Income in Oak Ridge?
Median Family Income in Oak Ridge is $66,786.
What is the Median Household income in Oak Ridge?
Median Household Income in Oak Ridge is $67,500.
What is Income or Wage Gap in Oak Ridge?
Income or Wage Gap in Oak Ridge is 25.5%.
Women in Oak Ridge earn 74.5 cents for every dollar earned by a man.
What is Inequality or Gini Index in Oak Ridge?
Inequality or Gini Index in Oak Ridge is 0.32.
What is the Total Population of Oak Ridge?
Total Population of Oak Ridge is 279.
What is the Total Male Population of Oak Ridge?
Total Male Population of Oak Ridge is 143.
What is the Total Female Population of Oak Ridge?
Total Female Population of Oak Ridge is 136.
What is the Ratio of Males per 100 Females in Oak Ridge?
There are 105.15 Males per 100 Females in Oak Ridge.
What is the Ratio of Females per 100 Males in Oak Ridge?
There are 95.10 Females per 100 Males in Oak Ridge.
What is the Median Population Age in Oak Ridge?
Median Population Age in Oak Ridge is 41.6 Years.
What is the Average Family Size in Oak Ridge
Average Family Size in Oak Ridge is 3.1 People.
What is the Average Household Size in Oak Ridge
Average Household Size in Oak Ridge is 3.0 People.
How Large is the Labor Force in Oak Ridge?
There are 127 People in the Labor Forcein in Oak Ridge.
What is the Percentage of People in the Labor Force in Oak Ridge?
59.3% of People are in the Labor Force in Oak Ridge.
What is the Unemployment Rate in Oak Ridge?
Unemployment Rate in Oak Ridge is 1.6%.