Norborne, MO Map & Demographics
Norborne Map
Norborne Overview
$31,841
PER CAPITA INCOME
$68,438
AVG FAMILY INCOME
$64,917
AVG HOUSEHOLD INCOME
35.2%
WAGE / INCOME GAP [ % ]
64.8¢/ $1
WAGE / INCOME GAP [ $ ]
0.35
INEQUALITY / GINI INDEX
656
TOTAL POPULATION
274
MALE POPULATION
382
FEMALE POPULATION
71.73
MALES / 100 FEMALES
139.42
FEMALES / 100 MALES
40.2
MEDIAN AGE
2.7
AVG FAMILY SIZE
2.4
AVG HOUSEHOLD SIZE
316
LABOR FORCE [ PEOPLE ]
58.3%
PERCENT IN LABOR FORCE
4.1%
UNEMPLOYMENT RATE
Norborne Zip Codes
Norborne Area Codes
Income in Norborne
Income Overview in Norborne
Per Capita Income in Norborne is $31,841, while median incomes of families and households are $68,438 and $64,917 respectively.
| Characteristic | Number | Measure |
| Per Capita Income | 656 | $31,841 |
| Median Family Income | 199 | $68,438 |
| Mean Family Income | 199 | $84,722 |
| Median Household Income | 269 | $64,917 |
| Mean Household Income | 269 | $77,025 |
| Income Deficit | 199 | $0 |
| Wage / Income Gap (%) | 656 | 35.24% |
| Wage / Income Gap ($) | 656 | 64.76¢ per $1 |
| Gini / Inequality Index | 656 | 0.35 |
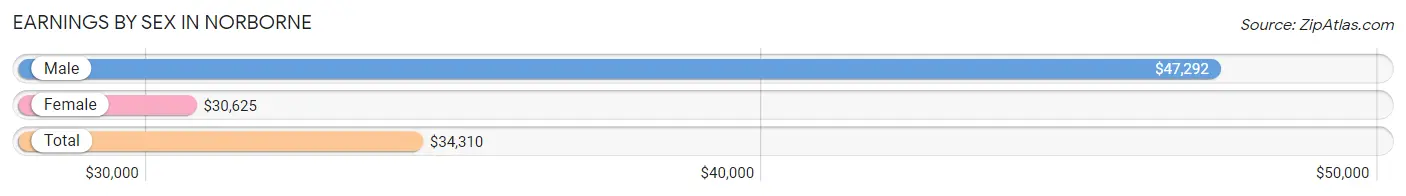
Earnings by Sex in Norborne
Average Earnings in Norborne are $34,310, $47,292 for men and $30,625 for women, a difference of 35.2%.
| Sex | Number | Average Earnings |
| Male | 159 (46.2%) | $47,292 |
| Female | 185 (53.8%) | $30,625 |
| Total | 344 (100.0%) | $34,310 |
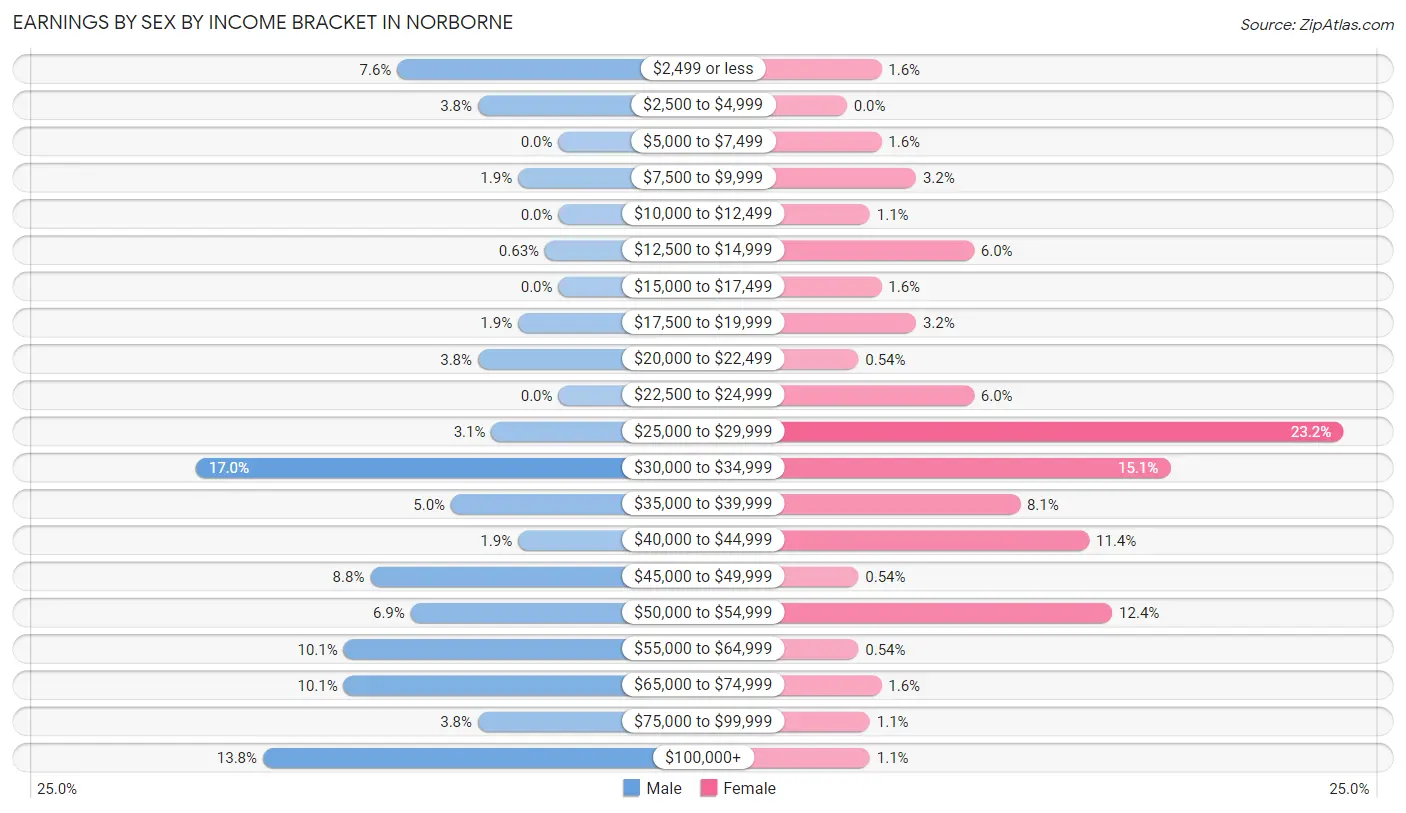
Earnings by Sex by Income Bracket in Norborne
The most common earnings brackets in Norborne are $30,000 to $34,999 for men (27 | 17.0%) and $25,000 to $29,999 for women (43 | 23.2%).
| Income | Male | Female |
| $2,499 or less | 12 (7.5%) | 3 (1.6%) |
| $2,500 to $4,999 | 6 (3.8%) | 0 (0.0%) |
| $5,000 to $7,499 | 0 (0.0%) | 3 (1.6%) |
| $7,500 to $9,999 | 3 (1.9%) | 6 (3.2%) |
| $10,000 to $12,499 | 0 (0.0%) | 2 (1.1%) |
| $12,500 to $14,999 | 1 (0.6%) | 11 (5.9%) |
| $15,000 to $17,499 | 0 (0.0%) | 3 (1.6%) |
| $17,500 to $19,999 | 3 (1.9%) | 6 (3.2%) |
| $20,000 to $22,499 | 6 (3.8%) | 1 (0.5%) |
| $22,500 to $24,999 | 0 (0.0%) | 11 (5.9%) |
| $25,000 to $29,999 | 5 (3.1%) | 43 (23.2%) |
| $30,000 to $34,999 | 27 (17.0%) | 28 (15.1%) |
| $35,000 to $39,999 | 8 (5.0%) | 15 (8.1%) |
| $40,000 to $44,999 | 3 (1.9%) | 21 (11.4%) |
| $45,000 to $49,999 | 14 (8.8%) | 1 (0.5%) |
| $50,000 to $54,999 | 11 (6.9%) | 23 (12.4%) |
| $55,000 to $64,999 | 16 (10.1%) | 1 (0.5%) |
| $65,000 to $74,999 | 16 (10.1%) | 3 (1.6%) |
| $75,000 to $99,999 | 6 (3.8%) | 2 (1.1%) |
| $100,000+ | 22 (13.8%) | 2 (1.1%) |
| Total | 159 (100.0%) | 185 (100.0%) |
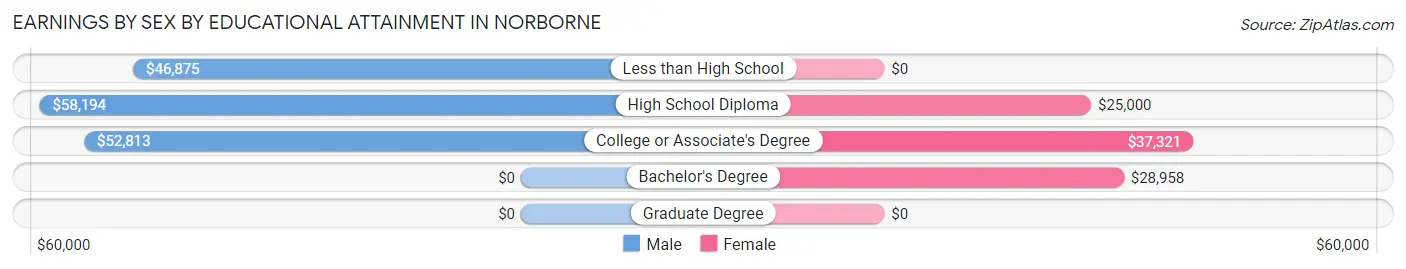
Earnings by Sex by Educational Attainment in Norborne
Average earnings in Norborne are $53,611 for men and $32,708 for women, a difference of 39.0%. Men with an educational attainment of high school diploma enjoy the highest average annual earnings of $58,194, while those with less than high school education earn the least with $46,875. Women with an educational attainment of college or associate's degree earn the most with the average annual earnings of $37,321, while those with high school diploma education have the smallest earnings of $25,000.
| Educational Attainment | Male Income | Female Income |
| Less than High School | $46,875 | $0 |
| High School Diploma | $58,194 | $25,000 |
| College or Associate's Degree | $52,813 | $37,321 |
| Bachelor's Degree | - | - |
| Graduate Degree | - | - |
| Total | $53,611 | $32,708 |
Family Income in Norborne
Family Income Brackets in Norborne
According to the Norborne family income data, there are 50 families falling into the $50,000 to $74,999 income range, which is the most common income bracket and makes up 25.1% of all families.
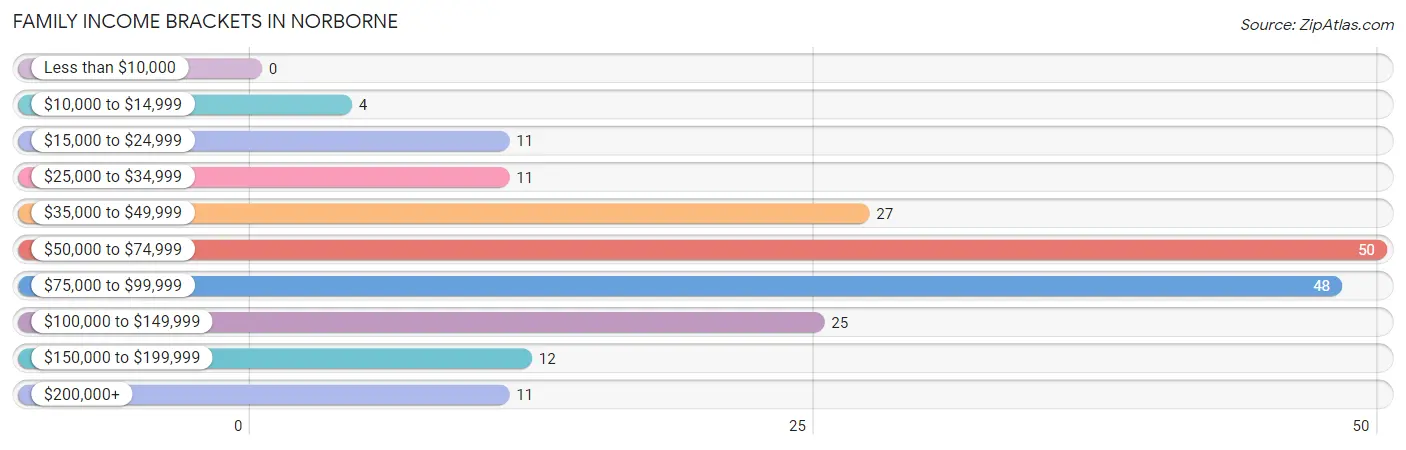
| Income Bracket | # Families | % Families |
| Less than $10,000 | 0 | 0.0% |
| $10,000 to $14,999 | 4 | 2.0% |
| $15,000 to $24,999 | 11 | 5.5% |
| $25,000 to $34,999 | 11 | 5.5% |
| $35,000 to $49,999 | 27 | 13.6% |
| $50,000 to $74,999 | 50 | 25.1% |
| $75,000 to $99,999 | 48 | 24.1% |
| $100,000 to $149,999 | 25 | 12.6% |
| $150,000 to $199,999 | 12 | 6.0% |
| $200,000+ | 11 | 5.5% |
Family Income by Famaliy Size in Norborne
4-person families (37 | 18.6%) account for the highest median family income in Norborne with $86,193 per family, while 2-person families (133 | 66.8%) have the highest median income of $32,266 per family member.
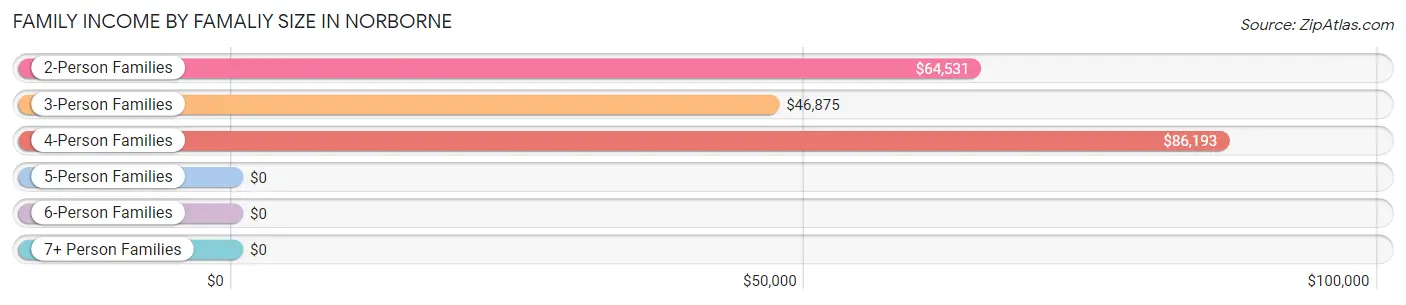
| Income Bracket | # Families | Median Income |
| 2-Person Families | 133 (66.8%) | $64,531 |
| 3-Person Families | 26 (13.1%) | $46,875 |
| 4-Person Families | 37 (18.6%) | $86,193 |
| 5-Person Families | 3 (1.5%) | $0 |
| 6-Person Families | 0 (0.0%) | $0 |
| 7+ Person Families | 0 (0.0%) | $0 |
| Total | 199 (100.0%) | $68,438 |
Family Income by Number of Earners in Norborne
The median family income in Norborne is $68,438, with families comprising 3+ earners (7) having the highest median family income of $88,438, while families with 1 earner (75) have the lowest median family income of $57,656, accounting for 3.5% and 37.7% of families, respectively.
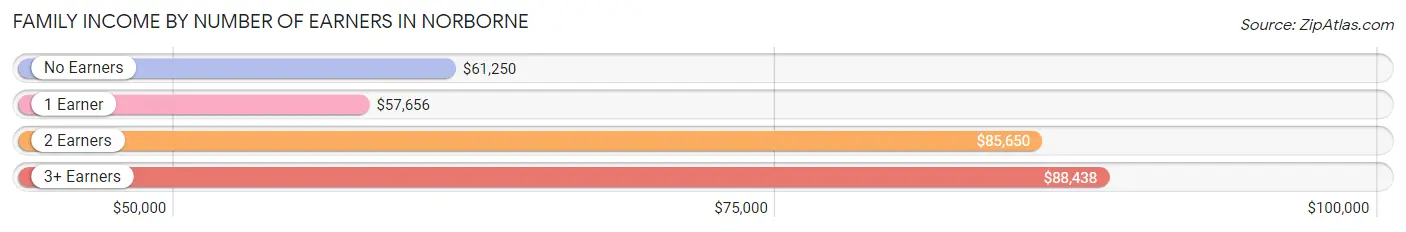
| Number of Earners | # Families | Median Income |
| No Earners | 26 (13.1%) | $61,250 |
| 1 Earner | 75 (37.7%) | $57,656 |
| 2 Earners | 91 (45.7%) | $85,650 |
| 3+ Earners | 7 (3.5%) | $88,438 |
| Total | 199 (100.0%) | $68,438 |
Household Income in Norborne
Household Income Brackets in Norborne
With 60 households falling in the category, the $50,000 to $74,999 income range is the most frequent in Norborne, accounting for 22.3% of all households. In contrast, only 6 households (2.2%) fall into the less than $10,000 income bracket, making it the least populous group.
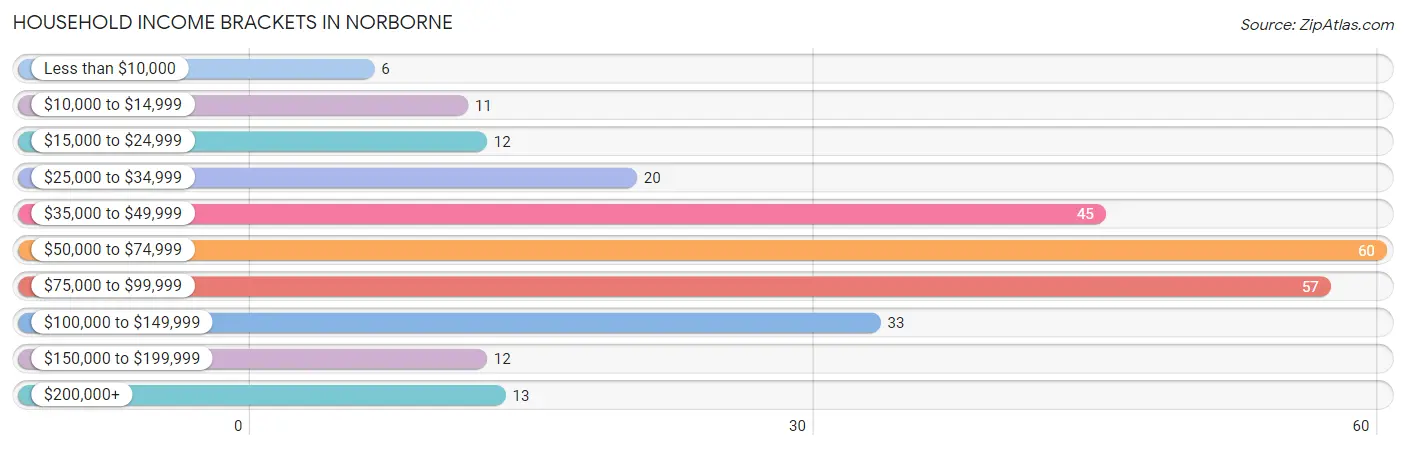
| Income Bracket | # Households | % Households |
| Less than $10,000 | 6 | 2.2% |
| $10,000 to $14,999 | 11 | 4.1% |
| $15,000 to $24,999 | 12 | 4.5% |
| $25,000 to $34,999 | 20 | 7.4% |
| $35,000 to $49,999 | 45 | 16.7% |
| $50,000 to $74,999 | 60 | 22.3% |
| $75,000 to $99,999 | 57 | 21.2% |
| $100,000 to $149,999 | 33 | 12.3% |
| $150,000 to $199,999 | 12 | 4.5% |
| $200,000+ | 13 | 4.8% |
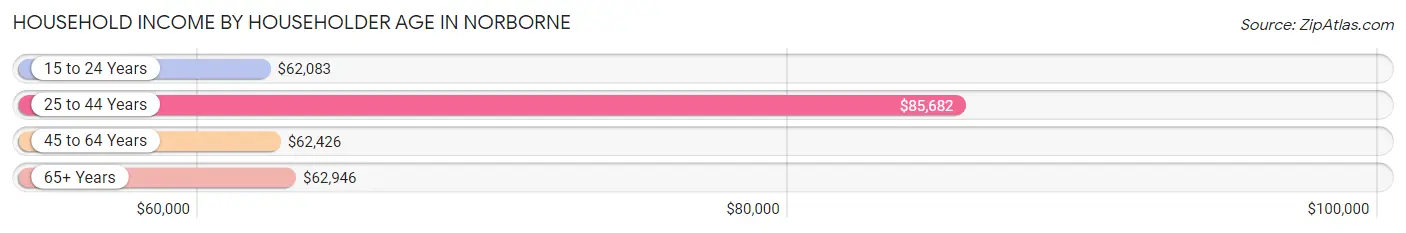
Household Income by Householder Age in Norborne
The median household income in Norborne is $64,917, with the highest median household income of $85,682 found in the 25 to 44 years age bracket for the primary householder. A total of 88 households (32.7%) fall into this category. Meanwhile, the 15 to 24 years age bracket for the primary householder has the lowest median household income of $62,083, with 9 households (3.4%) in this group.
| Income Bracket | # Households | Median Income |
| 15 to 24 Years | 9 (3.4%) | $62,083 |
| 25 to 44 Years | 88 (32.7%) | $85,682 |
| 45 to 64 Years | 91 (33.8%) | $62,426 |
| 65+ Years | 81 (30.1%) | $62,946 |
| Total | 269 (100.0%) | $64,917 |
Poverty in Norborne
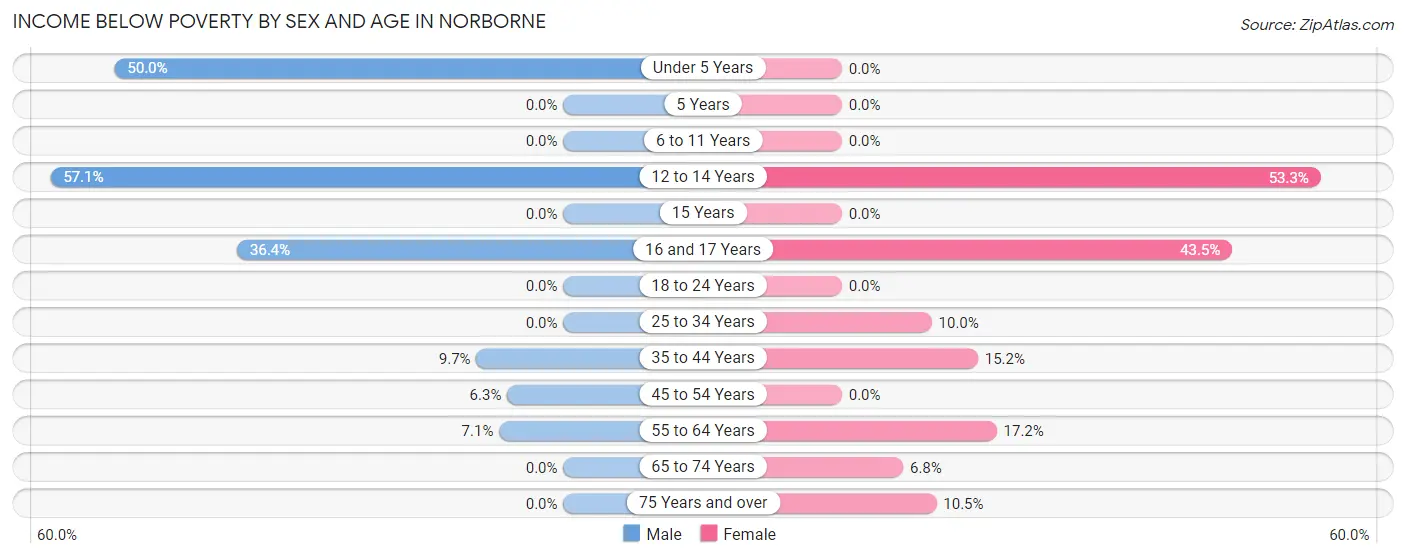
Income Below Poverty by Sex and Age in Norborne
With 7.5% poverty level for males and 11.3% for females among the residents of Norborne, 12 to 14 year old males and 12 to 14 year old females are the most vulnerable to poverty, with 4 males (57.1%) and 8 females (53.3%) in their respective age groups living below the poverty level.
| Age Bracket | Male | Female |
| Under 5 Years | 3 (50.0%) | 0 (0.0%) |
| 5 Years | 0 (0.0%) | 0 (0.0%) |
| 6 to 11 Years | 0 (0.0%) | 0 (0.0%) |
| 12 to 14 Years | 4 (57.1%) | 8 (53.3%) |
| 15 Years | 0 (0.0%) | 0 (0.0%) |
| 16 and 17 Years | 4 (36.4%) | 10 (43.5%) |
| 18 to 24 Years | 0 (0.0%) | 0 (0.0%) |
| 25 to 34 Years | 0 (0.0%) | 5 (10.0%) |
| 35 to 44 Years | 3 (9.7%) | 10 (15.1%) |
| 45 to 54 Years | 3 (6.2%) | 0 (0.0%) |
| 55 to 64 Years | 3 (7.1%) | 5 (17.2%) |
| 65 to 74 Years | 0 (0.0%) | 3 (6.8%) |
| 75 Years and over | 0 (0.0%) | 2 (10.5%) |
| Total | 20 (7.5%) | 43 (11.3%) |
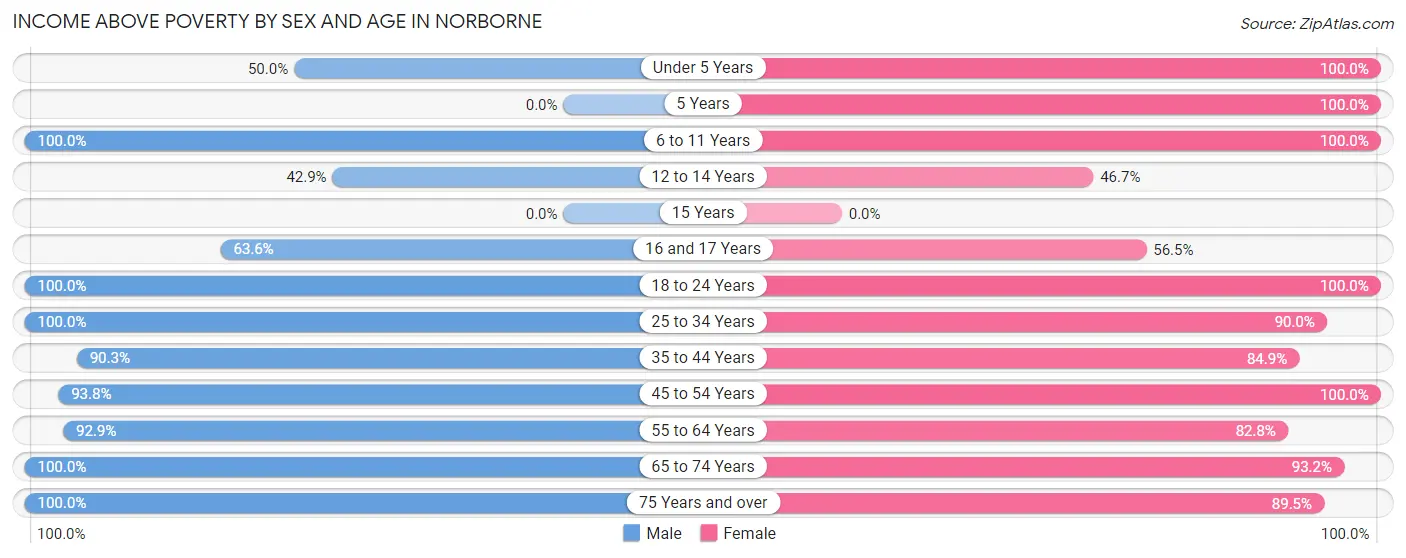
Income Above Poverty by Sex and Age in Norborne
According to the poverty statistics in Norborne, males aged 6 to 11 years and females aged under 5 years are the age groups that are most secure financially, with 100.0% of males and 100.0% of females in these age groups living above the poverty line.
| Age Bracket | Male | Female |
| Under 5 Years | 3 (50.0%) | 21 (100.0%) |
| 5 Years | 0 (0.0%) | 5 (100.0%) |
| 6 to 11 Years | 7 (100.0%) | 44 (100.0%) |
| 12 to 14 Years | 3 (42.9%) | 7 (46.7%) |
| 15 Years | 0 (0.0%) | 0 (0.0%) |
| 16 and 17 Years | 7 (63.6%) | 13 (56.5%) |
| 18 to 24 Years | 43 (100.0%) | 27 (100.0%) |
| 25 to 34 Years | 17 (100.0%) | 45 (90.0%) |
| 35 to 44 Years | 28 (90.3%) | 56 (84.9%) |
| 45 to 54 Years | 45 (93.8%) | 39 (100.0%) |
| 55 to 64 Years | 39 (92.9%) | 24 (82.8%) |
| 65 to 74 Years | 35 (100.0%) | 41 (93.2%) |
| 75 Years and over | 18 (100.0%) | 17 (89.5%) |
| Total | 245 (92.4%) | 339 (88.7%) |
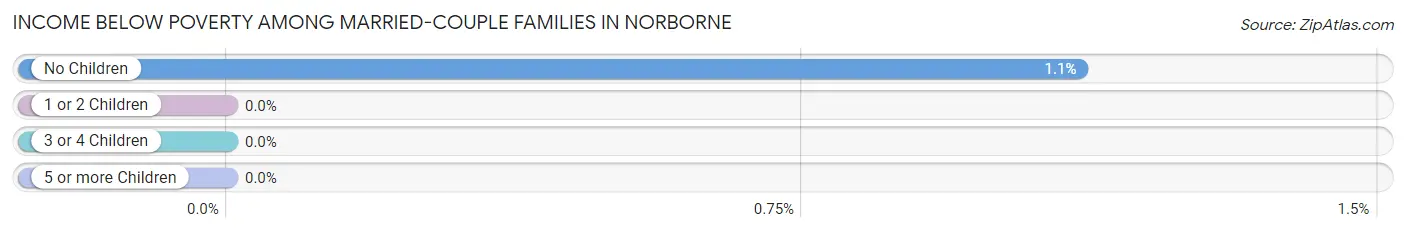
Income Below Poverty Among Married-Couple Families in Norborne
The poverty statistics for married-couple families in Norborne show that 0.7% or 1 of the total 138 families live below the poverty line. Families with no children have the highest poverty rate of 1.1%, comprising of 1 families. On the other hand, families with 1 or 2 children have the lowest poverty rate of 0.0%, which includes 0 families.
| Children | Above Poverty | Below Poverty |
| No Children | 89 (98.9%) | 1 (1.1%) |
| 1 or 2 Children | 45 (100.0%) | 0 (0.0%) |
| 3 or 4 Children | 3 (100.0%) | 0 (0.0%) |
| 5 or more Children | 0 (0.0%) | 0 (0.0%) |
| Total | 137 (99.3%) | 1 (0.7%) |
Income Below Poverty Among Single-Parent Households in Norborne
According to the poverty data in Norborne, 11.1% or 3 single-father households and 17.6% or 6 single-mother households are living below the poverty line. Among single-father households, those with 1 or 2 children have the highest poverty rate, with 3 households (15.0%) experiencing poverty. Likewise, among single-mother households, those with 1 or 2 children have the highest poverty rate, with 6 households (40.0%) falling below the poverty line.
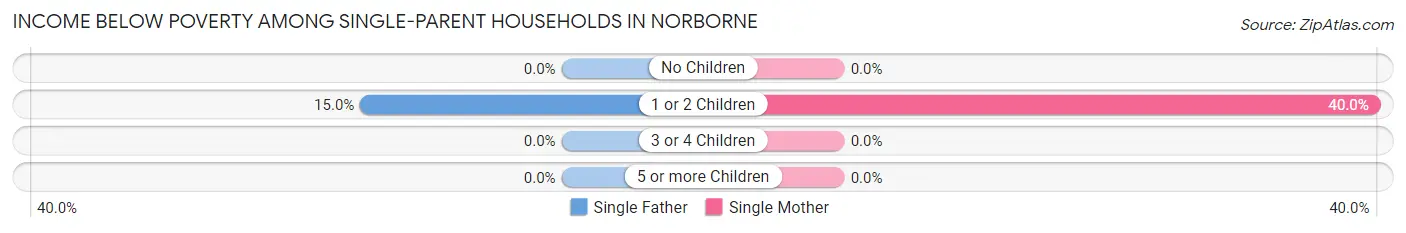
| Children | Single Father | Single Mother |
| No Children | 0 (0.0%) | 0 (0.0%) |
| 1 or 2 Children | 3 (15.0%) | 6 (40.0%) |
| 3 or 4 Children | 0 (0.0%) | 0 (0.0%) |
| 5 or more Children | 0 (0.0%) | 0 (0.0%) |
| Total | 3 (11.1%) | 6 (17.6%) |
Income Below Poverty Among Married-Couple vs Single-Parent Households in Norborne
The poverty data for Norborne shows that 1 of the married-couple family households (0.7%) and 9 of the single-parent households (14.7%) are living below the poverty level. Within the married-couple family households, those with no children have the highest poverty rate, with 1 households (1.1%) falling below the poverty line. Among the single-parent households, those with 1 or 2 children have the highest poverty rate, with 9 household (25.7%) living below poverty.
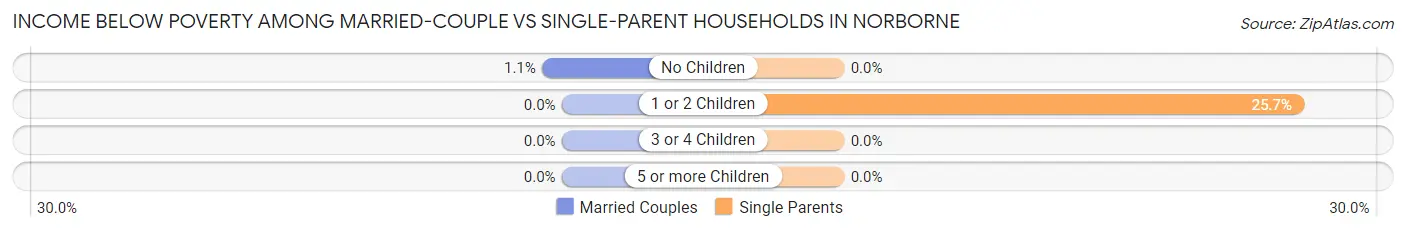
| Children | Married-Couple Families | Single-Parent Households |
| No Children | 1 (1.1%) | 0 (0.0%) |
| 1 or 2 Children | 0 (0.0%) | 9 (25.7%) |
| 3 or 4 Children | 0 (0.0%) | 0 (0.0%) |
| 5 or more Children | 0 (0.0%) | 0 (0.0%) |
| Total | 1 (0.7%) | 9 (14.7%) |
Race in Norborne
The most populous races in Norborne are White / Caucasian (590 | 89.9%), Black / African American (46 | 7.0%), and Two or more Races (20 | 3.0%).
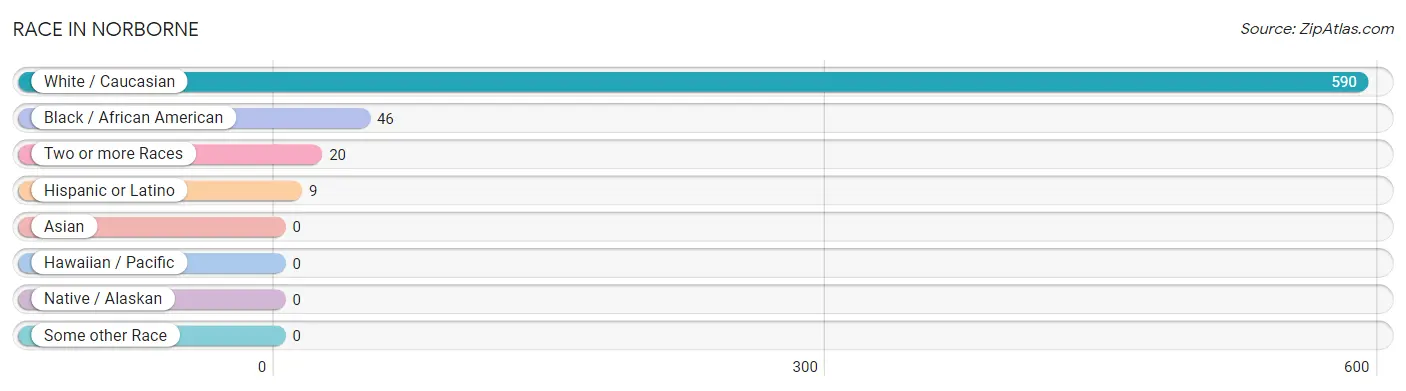
| Race | # Population | % Population |
| Asian | 0 | 0.0% |
| Black / African American | 46 | 7.0% |
| Hawaiian / Pacific | 0 | 0.0% |
| Hispanic or Latino | 9 | 1.4% |
| Native / Alaskan | 0 | 0.0% |
| White / Caucasian | 590 | 89.9% |
| Two or more Races | 20 | 3.0% |
| Some other Race | 0 | 0.0% |
| Total | 656 | 100.0% |
Ancestry in Norborne
The most populous ancestries reported in Norborne are German (148 | 22.6%), American (104 | 15.9%), Irish (41 | 6.2%), English (40 | 6.1%), and Italian (22 | 3.4%), together accounting for 54.1% of all Norborne residents.
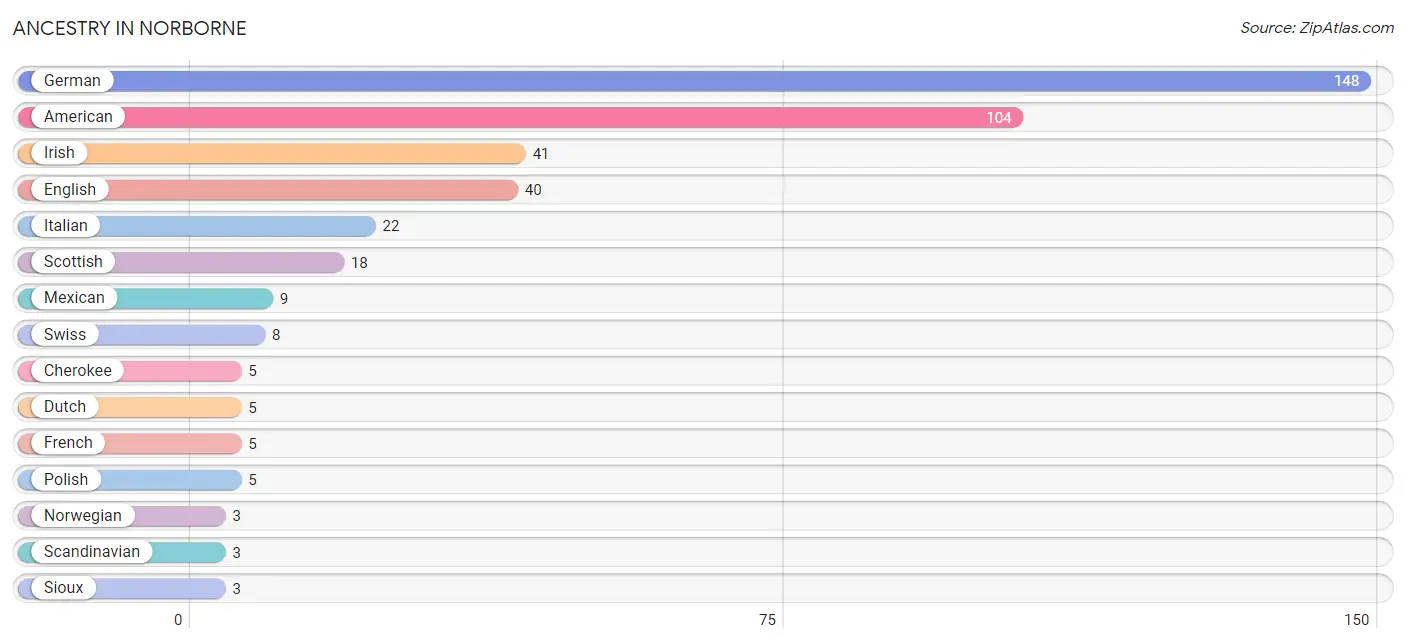
| Ancestry | # Population | % Population |
| American | 104 | 15.9% |
| Blackfeet | 1 | 0.2% |
| Cherokee | 5 | 0.8% |
| Dutch | 5 | 0.8% |
| English | 40 | 6.1% |
| French | 5 | 0.8% |
| German | 148 | 22.6% |
| Irish | 41 | 6.2% |
| Italian | 22 | 3.4% |
| Mexican | 9 | 1.4% |
| Navajo | 2 | 0.3% |
| Norwegian | 3 | 0.5% |
| Polish | 5 | 0.8% |
| Scandinavian | 3 | 0.5% |
| Scottish | 18 | 2.7% |
| Sioux | 3 | 0.5% |
| Swiss | 8 | 1.2% |
| Welsh | 2 | 0.3% | View All 18 Rows |
Immigrants in Norborne

| Immigration Origin | # Population | % Population | View All 0 Rows |
Sex and Age in Norborne
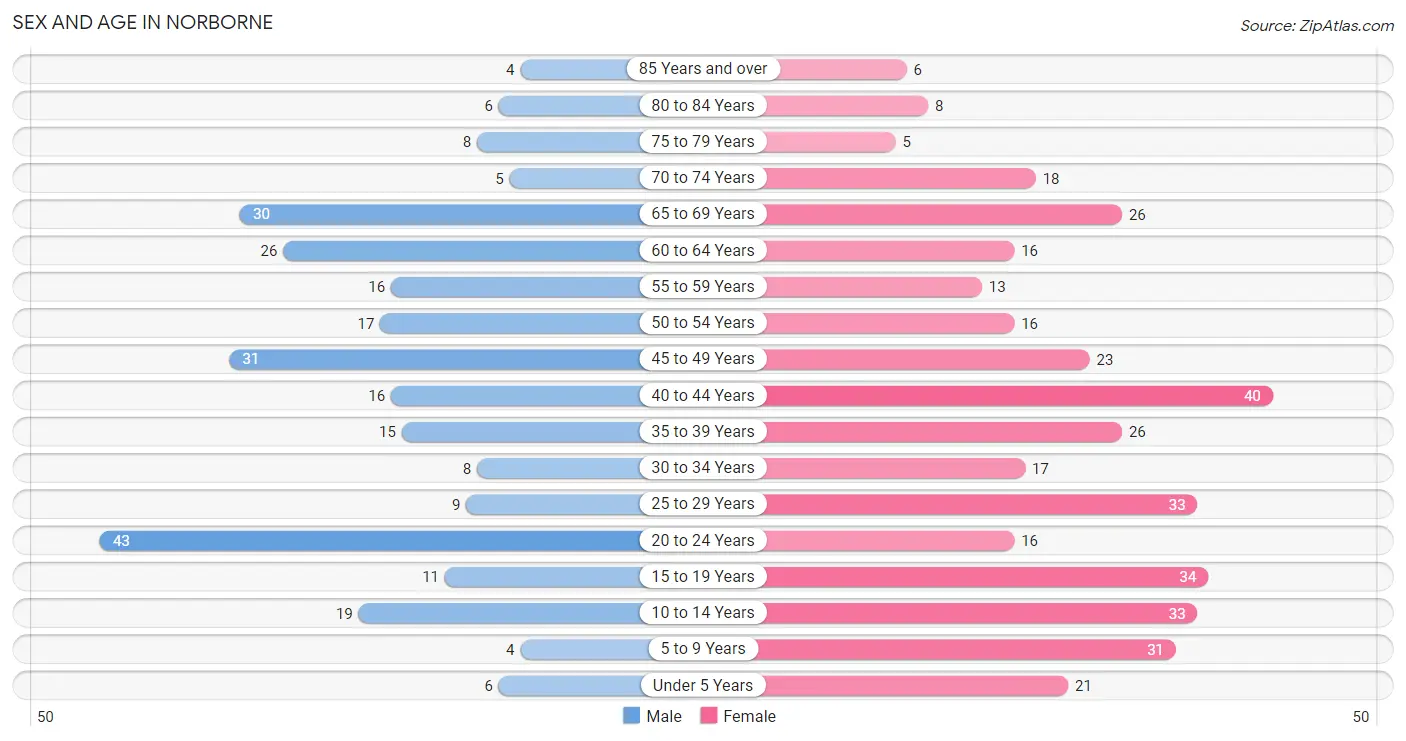
Sex and Age in Norborne
The most populous age groups in Norborne are 20 to 24 Years (43 | 15.7%) for men and 40 to 44 Years (40 | 10.5%) for women.
| Age Bracket | Male | Female |
| Under 5 Years | 6 (2.2%) | 21 (5.5%) |
| 5 to 9 Years | 4 (1.5%) | 31 (8.1%) |
| 10 to 14 Years | 19 (6.9%) | 33 (8.6%) |
| 15 to 19 Years | 11 (4.0%) | 34 (8.9%) |
| 20 to 24 Years | 43 (15.7%) | 16 (4.2%) |
| 25 to 29 Years | 9 (3.3%) | 33 (8.6%) |
| 30 to 34 Years | 8 (2.9%) | 17 (4.4%) |
| 35 to 39 Years | 15 (5.5%) | 26 (6.8%) |
| 40 to 44 Years | 16 (5.8%) | 40 (10.5%) |
| 45 to 49 Years | 31 (11.3%) | 23 (6.0%) |
| 50 to 54 Years | 17 (6.2%) | 16 (4.2%) |
| 55 to 59 Years | 16 (5.8%) | 13 (3.4%) |
| 60 to 64 Years | 26 (9.5%) | 16 (4.2%) |
| 65 to 69 Years | 30 (11.0%) | 26 (6.8%) |
| 70 to 74 Years | 5 (1.8%) | 18 (4.7%) |
| 75 to 79 Years | 8 (2.9%) | 5 (1.3%) |
| 80 to 84 Years | 6 (2.2%) | 8 (2.1%) |
| 85 Years and over | 4 (1.5%) | 6 (1.6%) |
| Total | 274 (100.0%) | 382 (100.0%) |
Families and Households in Norborne
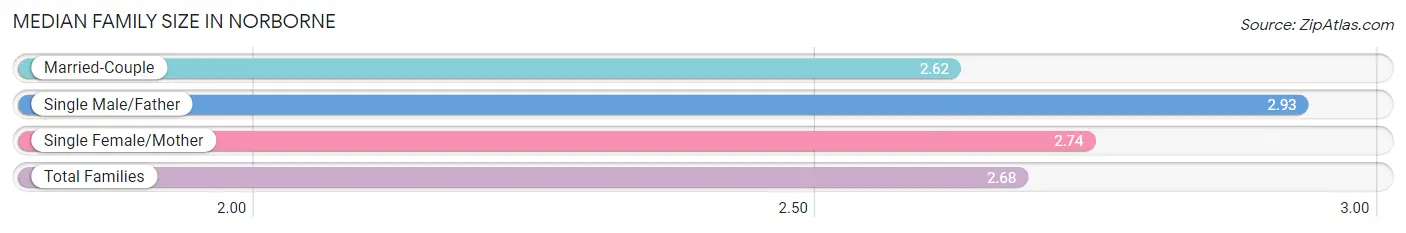
Median Family Size in Norborne
The median family size in Norborne is 2.68 persons per family, with single male/father families (27 | 13.6%) accounting for the largest median family size of 2.93 persons per family. On the other hand, married-couple families (138 | 69.4%) represent the smallest median family size with 2.62 persons per family.
| Family Type | # Families | Family Size |
| Married-Couple | 138 (69.4%) | 2.62 |
| Single Male/Father | 27 (13.6%) | 2.93 |
| Single Female/Mother | 34 (17.1%) | 2.74 |
| Total Families | 199 (100.0%) | 2.68 |
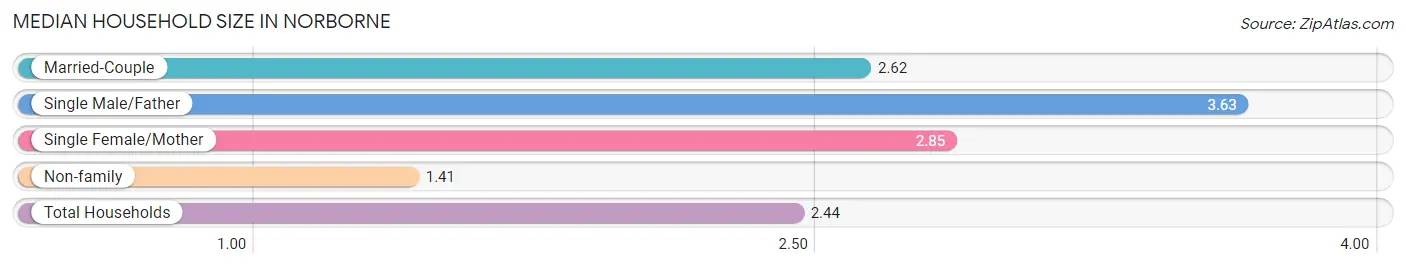
Median Household Size in Norborne
The median household size in Norborne is 2.44 persons per household, with single male/father households (27 | 10.0%) accounting for the largest median household size of 3.63 persons per household. non-family households (70 | 26.0%) represent the smallest median household size with 1.41 persons per household.
| Household Type | # Households | Household Size |
| Married-Couple | 138 (51.3%) | 2.62 |
| Single Male/Father | 27 (10.0%) | 3.63 |
| Single Female/Mother | 34 (12.6%) | 2.85 |
| Non-family | 70 (26.0%) | 1.41 |
| Total Households | 269 (100.0%) | 2.44 |
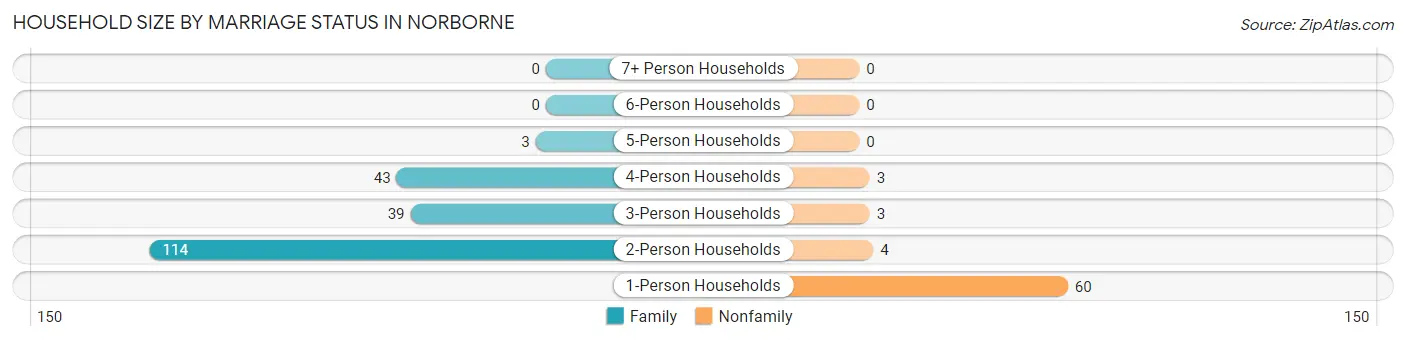
Household Size by Marriage Status in Norborne
Out of a total of 269 households in Norborne, 199 (74.0%) are family households, while 70 (26.0%) are nonfamily households. The most numerous type of family households are 2-person households, comprising 114, and the most common type of nonfamily households are 1-person households, comprising 60.
| Household Size | Family Households | Nonfamily Households |
| 1-Person Households | - | 60 (22.3%) |
| 2-Person Households | 114 (42.4%) | 4 (1.5%) |
| 3-Person Households | 39 (14.5%) | 3 (1.1%) |
| 4-Person Households | 43 (16.0%) | 3 (1.1%) |
| 5-Person Households | 3 (1.1%) | 0 (0.0%) |
| 6-Person Households | 0 (0.0%) | 0 (0.0%) |
| 7+ Person Households | 0 (0.0%) | 0 (0.0%) |
| Total | 199 (74.0%) | 70 (26.0%) |
Female Fertility in Norborne
Fertility by Age in Norborne
Average fertility rate in Norborne is 90.0 births per 1,000 women. Women in the age bracket of 20 to 34 years have the highest fertility rate with 227.0 births per 1,000 women. Women in the age bracket of 20 to 34 years acount for 88.2% of all women with births.
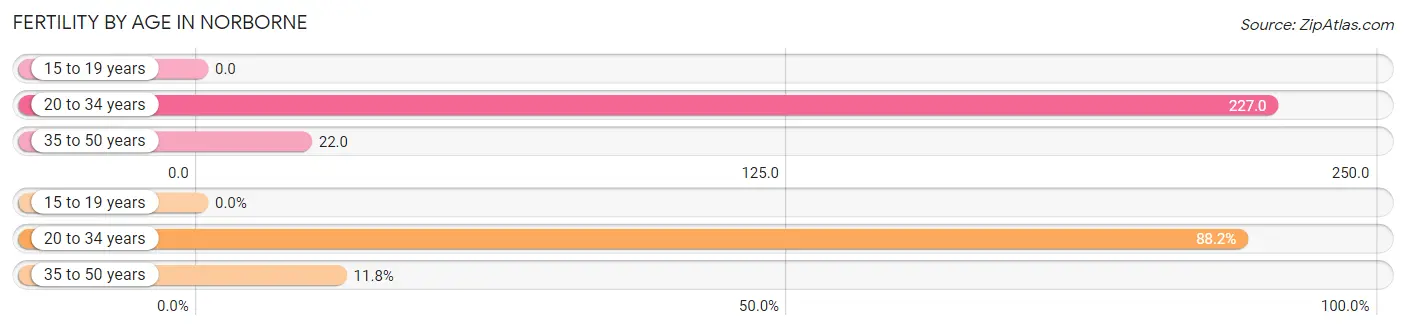
| Age Bracket | Women with Births | Births / 1,000 Women |
| 15 to 19 years | 0 (0.0%) | 0.0 |
| 20 to 34 years | 15 (88.2%) | 227.0 |
| 35 to 50 years | 2 (11.8%) | 22.0 |
| Total | 17 (100.0%) | 90.0 |
Fertility by Age by Marriage Status in Norborne
35.3% of women with births (17) in Norborne are married. The highest percentage of unmarried women with births falls into 35 to 50 years age bracket with 100.0% of them unmarried at the time of birth, while the lowest percentage of unmarried women with births belong to 20 to 34 years age bracket with 60.0% of them unmarried.
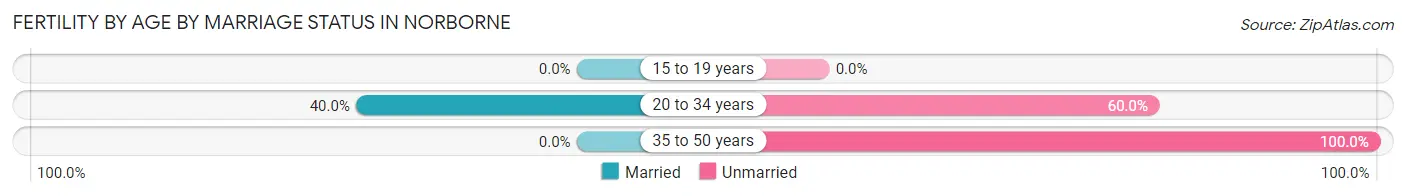
| Age Bracket | Married | Unmarried |
| 15 to 19 years | 0 (0.0%) | 0 (0.0%) |
| 20 to 34 years | 6 (40.0%) | 9 (60.0%) |
| 35 to 50 years | 0 (0.0%) | 2 (100.0%) |
| Total | 6 (35.3%) | 11 (64.7%) |
Fertility by Education in Norborne
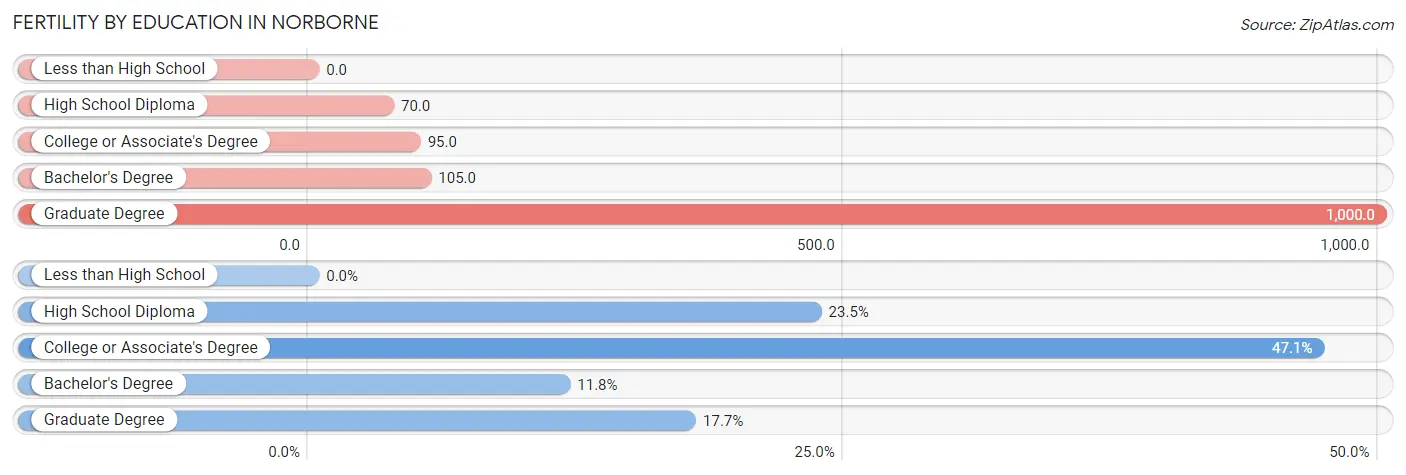
| Educational Attainment | Women with Births | Births / 1,000 Women |
| Less than High School | 0 (0.0%) | 0.0 |
| High School Diploma | 4 (23.5%) | 70.0 |
| College or Associate's Degree | 8 (47.1%) | 95.0 |
| Bachelor's Degree | 2 (11.8%) | 105.0 |
| Graduate Degree | 3 (17.6%) | 1,000.0 |
| Total | 17 (100.0%) | 90.0 |
Fertility by Education by Marriage Status in Norborne
64.7% of women with births in Norborne are unmarried. Women with the educational attainment of graduate degree are most likely to be married with 100.0% of them married at childbirth, while women with the educational attainment of high school diploma are least likely to be married with 100.0% of them unmarried at childbirth.
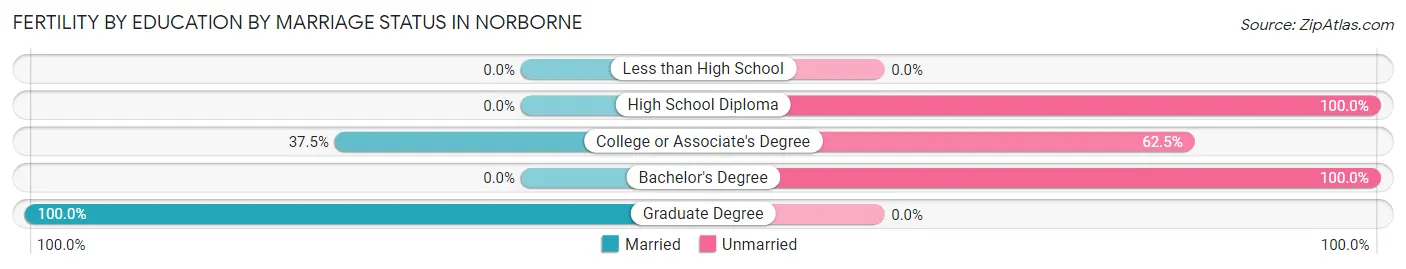
| Educational Attainment | Married | Unmarried |
| Less than High School | 0 (0.0%) | 0 (0.0%) |
| High School Diploma | 0 (0.0%) | 4 (100.0%) |
| College or Associate's Degree | 3 (37.5%) | 5 (62.5%) |
| Bachelor's Degree | 0 (0.0%) | 2 (100.0%) |
| Graduate Degree | 3 (100.0%) | 0 (0.0%) |
| Total | 6 (35.3%) | 11 (64.7%) |
Employment Characteristics in Norborne
Employment by Class of Employer in Norborne
Among the 299 employed individuals in Norborne, private company employees (190 | 63.5%), not-for-profit organizations (34 | 11.4%), and local government employees (32 | 10.7%) make up the most common classes of employment.
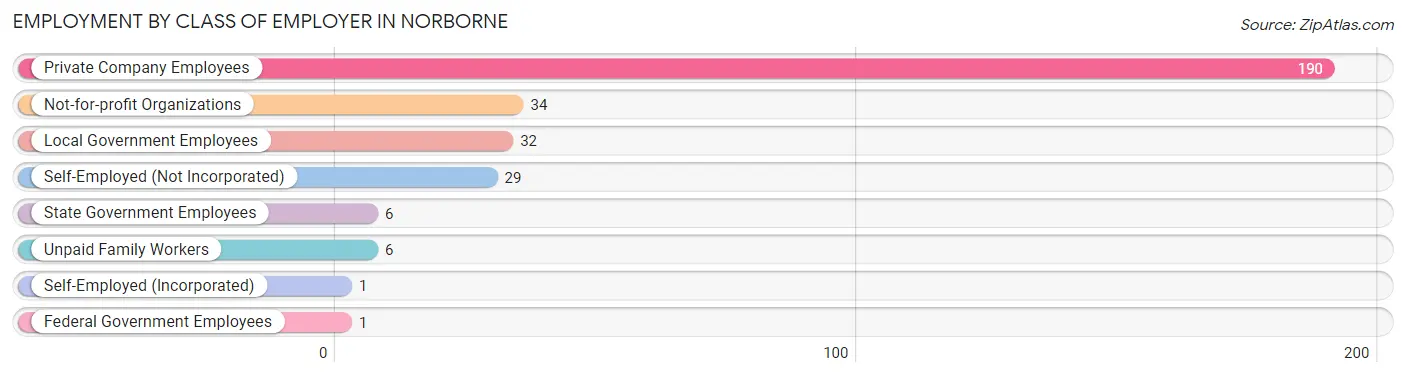
| Employer Class | # Employees | % Employees |
| Private Company Employees | 190 | 63.5% |
| Self-Employed (Incorporated) | 1 | 0.3% |
| Self-Employed (Not Incorporated) | 29 | 9.7% |
| Not-for-profit Organizations | 34 | 11.4% |
| Local Government Employees | 32 | 10.7% |
| State Government Employees | 6 | 2.0% |
| Federal Government Employees | 1 | 0.3% |
| Unpaid Family Workers | 6 | 2.0% |
| Total | 299 | 100.0% |
Employment Status by Age in Norborne
According to the labor force statistics for Norborne, out of the total population over 16 years of age (542), 58.3% or 316 individuals are in the labor force, with 4.1% or 13 of them unemployed. The age group with the highest labor force participation rate is 30 to 34 years, with 92.0% or 23 individuals in the labor force. Within the labor force, the 20 to 24 years age range has the highest percentage of unemployed individuals, with 13.8% or 4 of them being unemployed.
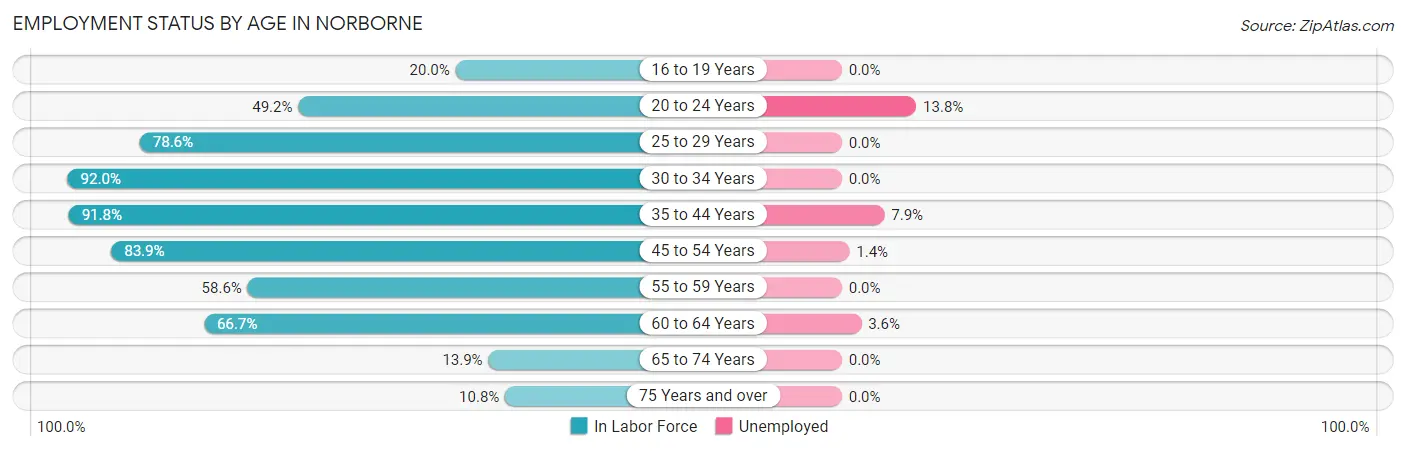
| Age Bracket | In Labor Force | Unemployed |
| 16 to 19 Years | 9 (20.0%) | 0 (0.0%) |
| 20 to 24 Years | 29 (49.2%) | 4 (13.8%) |
| 25 to 29 Years | 33 (78.6%) | 0 (0.0%) |
| 30 to 34 Years | 23 (92.0%) | 0 (0.0%) |
| 35 to 44 Years | 89 (91.8%) | 7 (7.9%) |
| 45 to 54 Years | 73 (83.9%) | 1 (1.4%) |
| 55 to 59 Years | 17 (58.6%) | 0 (0.0%) |
| 60 to 64 Years | 28 (66.7%) | 1 (3.6%) |
| 65 to 74 Years | 11 (13.9%) | 0 (0.0%) |
| 75 Years and over | 4 (10.8%) | 0 (0.0%) |
| Total | 316 (58.3%) | 13 (4.1%) |
Employment Status by Educational Attainment in Norborne
According to labor force statistics for Norborne, 81.7% of individuals (263) out of the total population between 25 and 64 years of age (322) are in the labor force, with 3.4% or 9 of them being unemployed. The group with the highest labor force participation rate are those with the educational attainment of college / associate degree, with 95.8% or 115 individuals in the labor force. Within the labor force, individuals with high school diploma education have the highest percentage of unemployment, with 8.9% or 8 of them being unemployed.
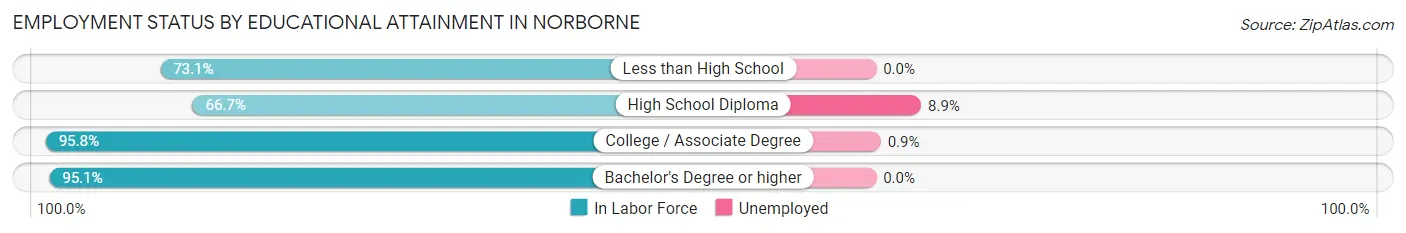
| Educational Attainment | In Labor Force | Unemployed |
| Less than High School | 19 (73.1%) | 0 (0.0%) |
| High School Diploma | 90 (66.7%) | 12 (8.9%) |
| College / Associate Degree | 115 (95.8%) | 1 (0.9%) |
| Bachelor's Degree or higher | 39 (95.1%) | 0 (0.0%) |
| Total | 263 (81.7%) | 11 (3.4%) |
Employment Occupations by Sex in Norborne
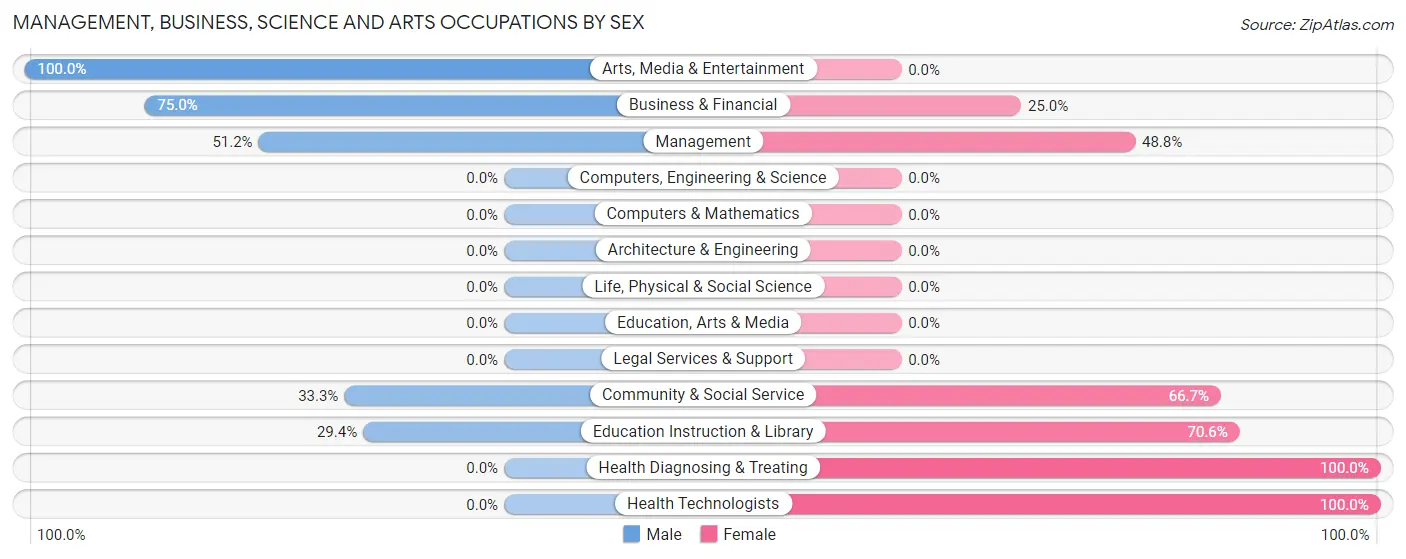
Management, Business, Science and Arts Occupations
The most common Management, Business, Science and Arts occupations in Norborne are Health Diagnosing & Treating (52 | 17.2%), Management (41 | 13.5%), Health Technologists (38 | 12.5%), Community & Social Service (18 | 5.9%), and Education Instruction & Library (17 | 5.6%).
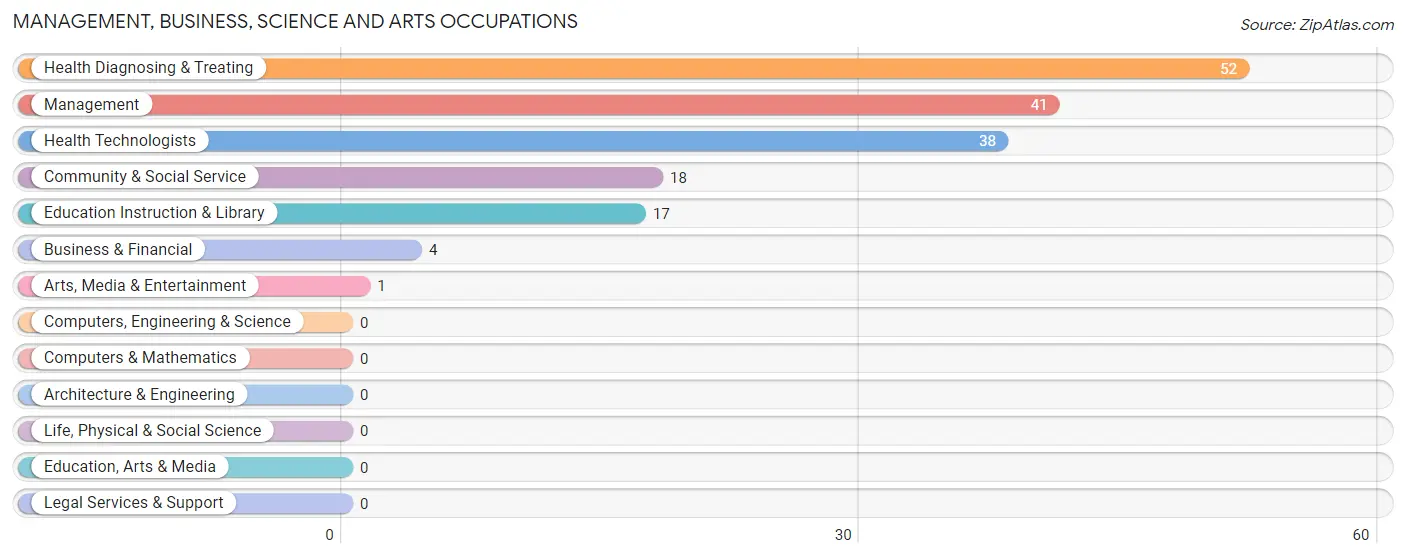
Management, Business, Science and Arts Occupations by Sex
Within the Management, Business, Science and Arts occupations in Norborne, the most male-oriented occupations are Arts, Media & Entertainment (100.0%), Business & Financial (75.0%), and Management (51.2%), while the most female-oriented occupations are Health Diagnosing & Treating (100.0%), Health Technologists (100.0%), and Education Instruction & Library (70.6%).
| Occupation | Male | Female |
| Management | 21 (51.2%) | 20 (48.8%) |
| Business & Financial | 3 (75.0%) | 1 (25.0%) |
| Computers, Engineering & Science | 0 (0.0%) | 0 (0.0%) |
| Computers & Mathematics | 0 (0.0%) | 0 (0.0%) |
| Architecture & Engineering | 0 (0.0%) | 0 (0.0%) |
| Life, Physical & Social Science | 0 (0.0%) | 0 (0.0%) |
| Community & Social Service | 6 (33.3%) | 12 (66.7%) |
| Education, Arts & Media | 0 (0.0%) | 0 (0.0%) |
| Legal Services & Support | 0 (0.0%) | 0 (0.0%) |
| Education Instruction & Library | 5 (29.4%) | 12 (70.6%) |
| Arts, Media & Entertainment | 1 (100.0%) | 0 (0.0%) |
| Health Diagnosing & Treating | 0 (0.0%) | 52 (100.0%) |
| Health Technologists | 0 (0.0%) | 38 (100.0%) |
| Total (Category) | 30 (26.1%) | 85 (73.9%) |
| Total (Overall) | 138 (45.5%) | 165 (54.5%) |
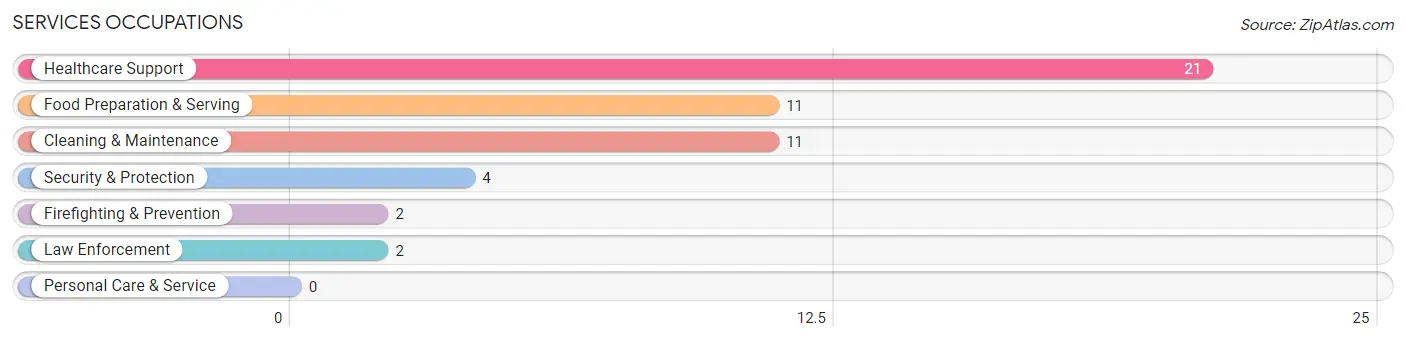
Services Occupations
The most common Services occupations in Norborne are Healthcare Support (21 | 6.9%), Food Preparation & Serving (11 | 3.6%), Cleaning & Maintenance (11 | 3.6%), Security & Protection (4 | 1.3%), and Firefighting & Prevention (2 | 0.7%).
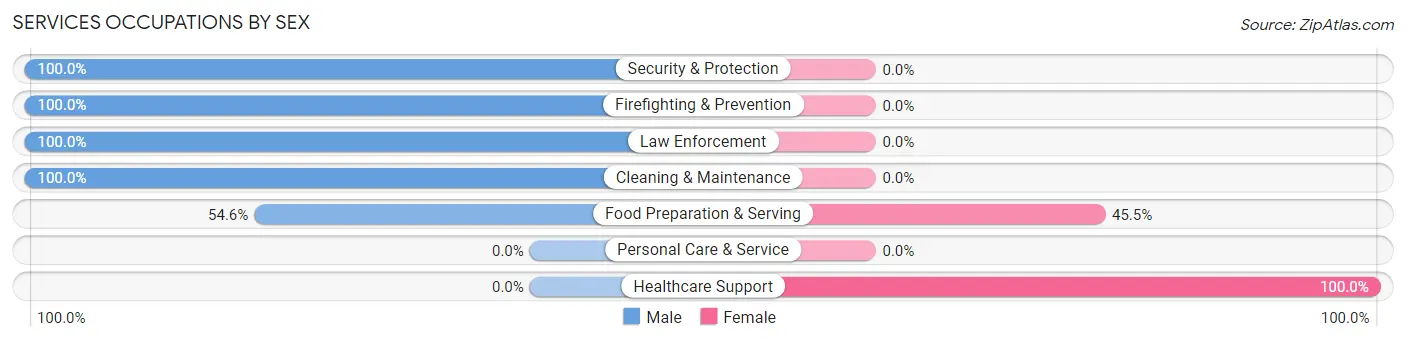
Services Occupations by Sex
Within the Services occupations in Norborne, the most male-oriented occupations are Security & Protection (100.0%), Firefighting & Prevention (100.0%), and Law Enforcement (100.0%), while the most female-oriented occupations are Healthcare Support (100.0%), and Food Preparation & Serving (45.5%).
| Occupation | Male | Female |
| Healthcare Support | 0 (0.0%) | 21 (100.0%) |
| Security & Protection | 4 (100.0%) | 0 (0.0%) |
| Firefighting & Prevention | 2 (100.0%) | 0 (0.0%) |
| Law Enforcement | 2 (100.0%) | 0 (0.0%) |
| Food Preparation & Serving | 6 (54.5%) | 5 (45.5%) |
| Cleaning & Maintenance | 11 (100.0%) | 0 (0.0%) |
| Personal Care & Service | 0 (0.0%) | 0 (0.0%) |
| Total (Category) | 21 (44.7%) | 26 (55.3%) |
| Total (Overall) | 138 (45.5%) | 165 (54.5%) |
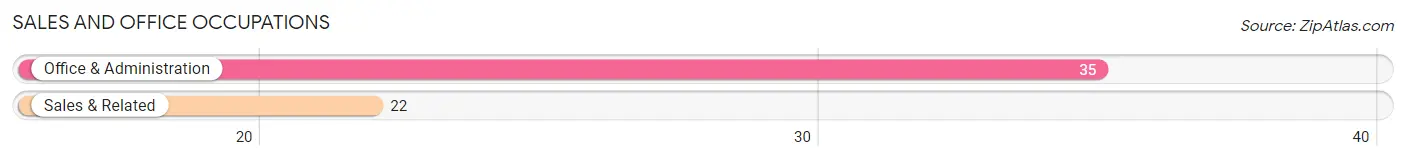
Sales and Office Occupations
The most common Sales and Office occupations in Norborne are Office & Administration (35 | 11.6%), and Sales & Related (22 | 7.3%).
Sales and Office Occupations by Sex
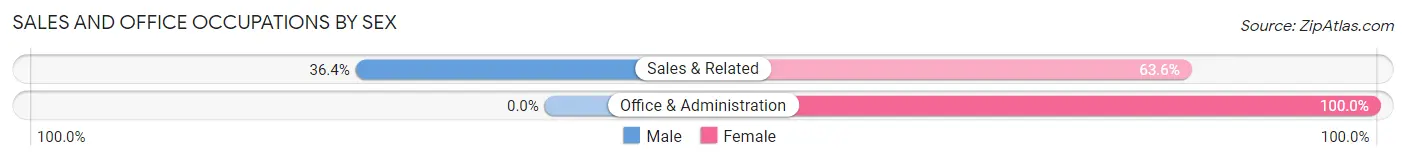
| Occupation | Male | Female |
| Sales & Related | 8 (36.4%) | 14 (63.6%) |
| Office & Administration | 0 (0.0%) | 35 (100.0%) |
| Total (Category) | 8 (14.0%) | 49 (86.0%) |
| Total (Overall) | 138 (45.5%) | 165 (54.5%) |
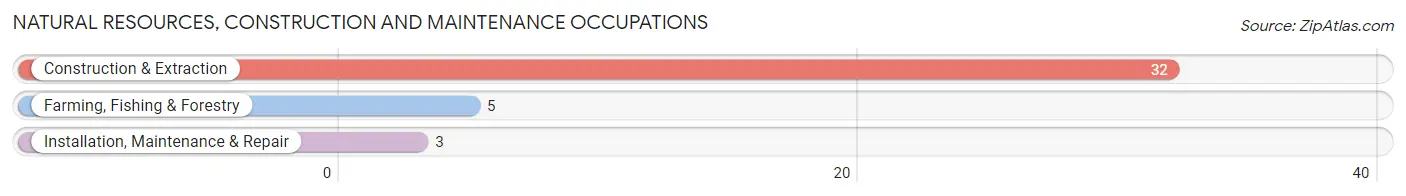
Natural Resources, Construction and Maintenance Occupations
The most common Natural Resources, Construction and Maintenance occupations in Norborne are Construction & Extraction (32 | 10.6%), Farming, Fishing & Forestry (5 | 1.7%), and Installation, Maintenance & Repair (3 | 1.0%).
Natural Resources, Construction and Maintenance Occupations by Sex
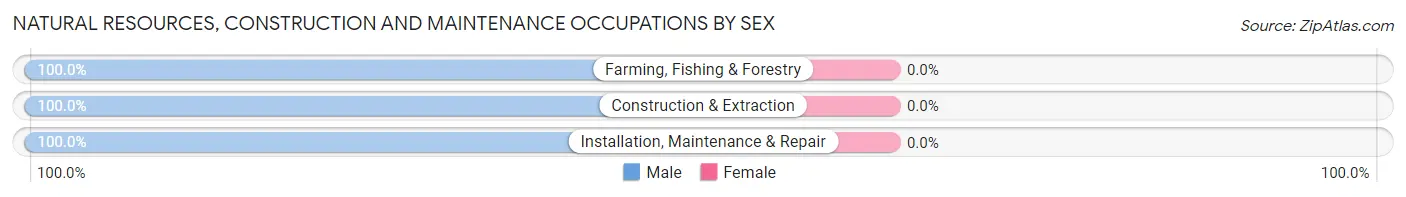
| Occupation | Male | Female |
| Farming, Fishing & Forestry | 5 (100.0%) | 0 (0.0%) |
| Construction & Extraction | 32 (100.0%) | 0 (0.0%) |
| Installation, Maintenance & Repair | 3 (100.0%) | 0 (0.0%) |
| Total (Category) | 40 (100.0%) | 0 (0.0%) |
| Total (Overall) | 138 (45.5%) | 165 (54.5%) |
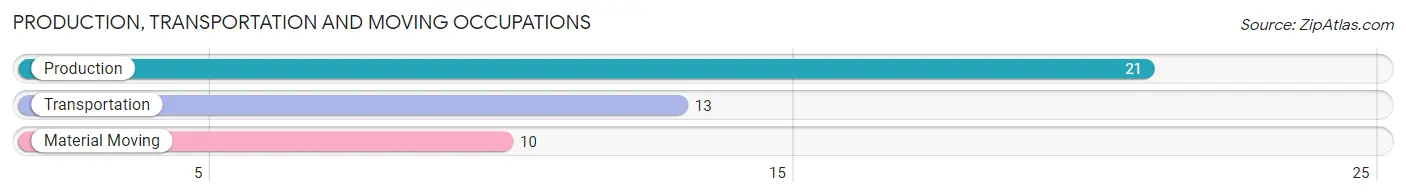
Production, Transportation and Moving Occupations
The most common Production, Transportation and Moving occupations in Norborne are Production (21 | 6.9%), Transportation (13 | 4.3%), and Material Moving (10 | 3.3%).
Production, Transportation and Moving Occupations by Sex
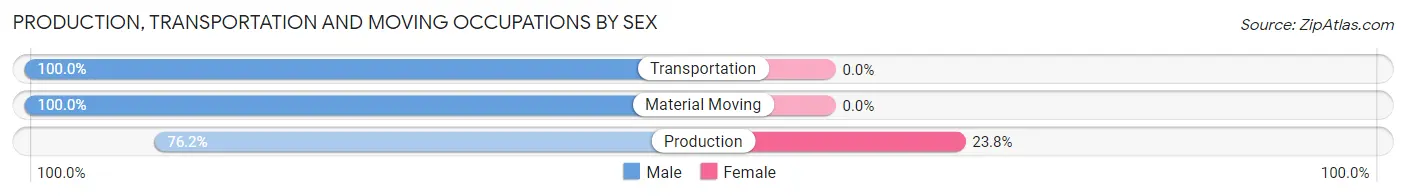
| Occupation | Male | Female |
| Production | 16 (76.2%) | 5 (23.8%) |
| Transportation | 13 (100.0%) | 0 (0.0%) |
| Material Moving | 10 (100.0%) | 0 (0.0%) |
| Total (Category) | 39 (88.6%) | 5 (11.4%) |
| Total (Overall) | 138 (45.5%) | 165 (54.5%) |
Employment Industries by Sex in Norborne
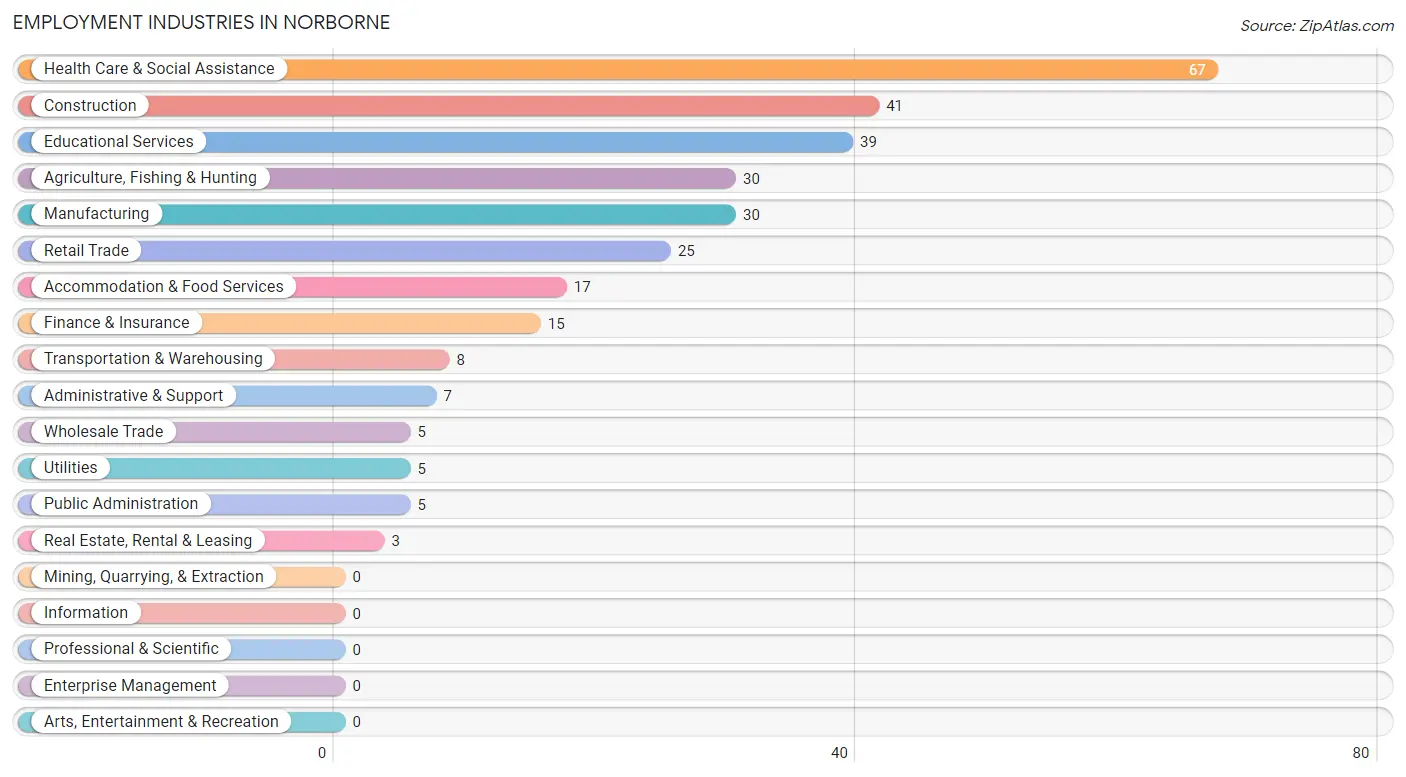
Employment Industries in Norborne
The major employment industries in Norborne include Health Care & Social Assistance (67 | 22.1%), Construction (41 | 13.5%), Educational Services (39 | 12.9%), Agriculture, Fishing & Hunting (30 | 9.9%), and Manufacturing (30 | 9.9%).
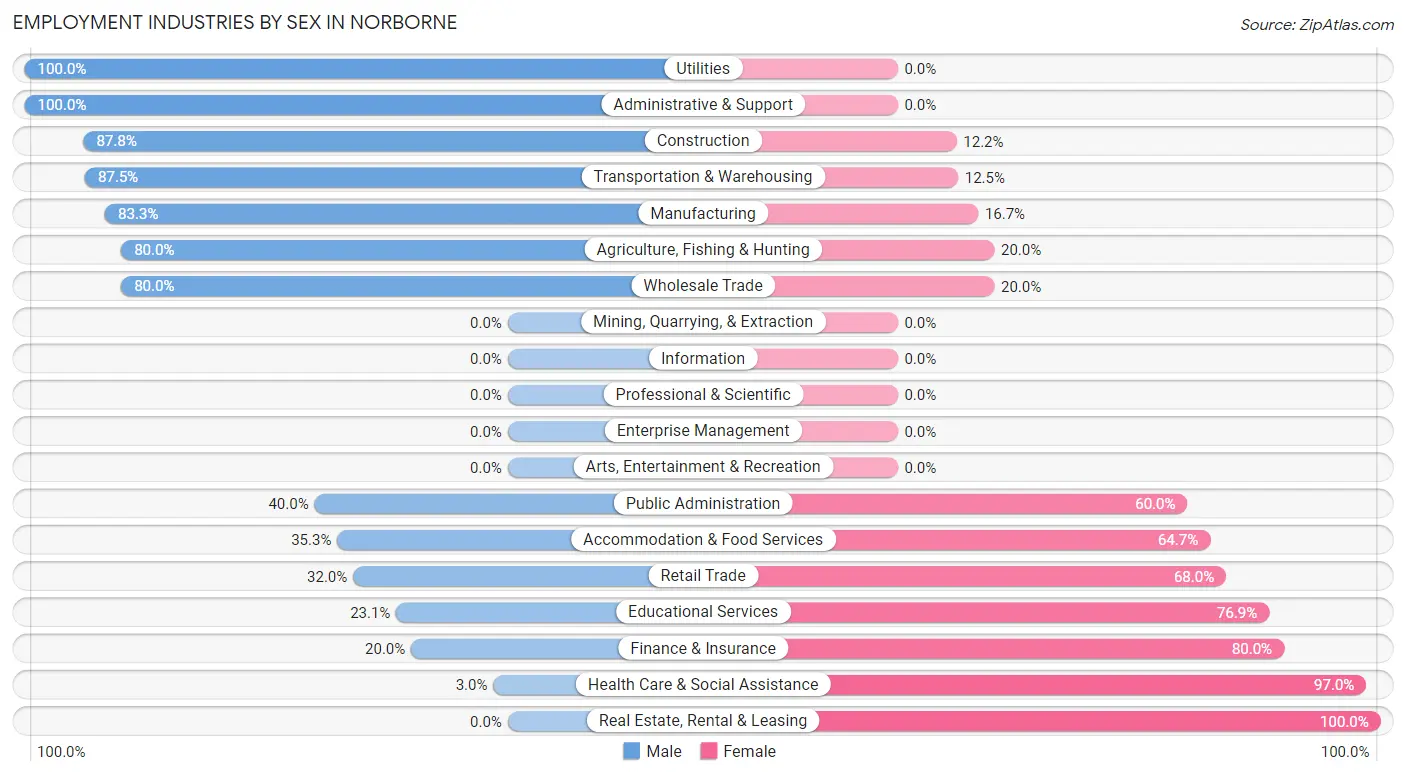
Employment Industries by Sex in Norborne
The Norborne industries that see more men than women are Utilities (100.0%), Administrative & Support (100.0%), and Construction (87.8%), whereas the industries that tend to have a higher number of women are Real Estate, Rental & Leasing (100.0%), Health Care & Social Assistance (97.0%), and Finance & Insurance (80.0%).
| Industry | Male | Female |
| Agriculture, Fishing & Hunting | 24 (80.0%) | 6 (20.0%) |
| Mining, Quarrying, & Extraction | 0 (0.0%) | 0 (0.0%) |
| Construction | 36 (87.8%) | 5 (12.2%) |
| Manufacturing | 25 (83.3%) | 5 (16.7%) |
| Wholesale Trade | 4 (80.0%) | 1 (20.0%) |
| Retail Trade | 8 (32.0%) | 17 (68.0%) |
| Transportation & Warehousing | 7 (87.5%) | 1 (12.5%) |
| Utilities | 5 (100.0%) | 0 (0.0%) |
| Information | 0 (0.0%) | 0 (0.0%) |
| Finance & Insurance | 3 (20.0%) | 12 (80.0%) |
| Real Estate, Rental & Leasing | 0 (0.0%) | 3 (100.0%) |
| Professional & Scientific | 0 (0.0%) | 0 (0.0%) |
| Enterprise Management | 0 (0.0%) | 0 (0.0%) |
| Administrative & Support | 7 (100.0%) | 0 (0.0%) |
| Educational Services | 9 (23.1%) | 30 (76.9%) |
| Health Care & Social Assistance | 2 (3.0%) | 65 (97.0%) |
| Arts, Entertainment & Recreation | 0 (0.0%) | 0 (0.0%) |
| Accommodation & Food Services | 6 (35.3%) | 11 (64.7%) |
| Public Administration | 2 (40.0%) | 3 (60.0%) |
| Total | 138 (45.5%) | 165 (54.5%) |
Education in Norborne
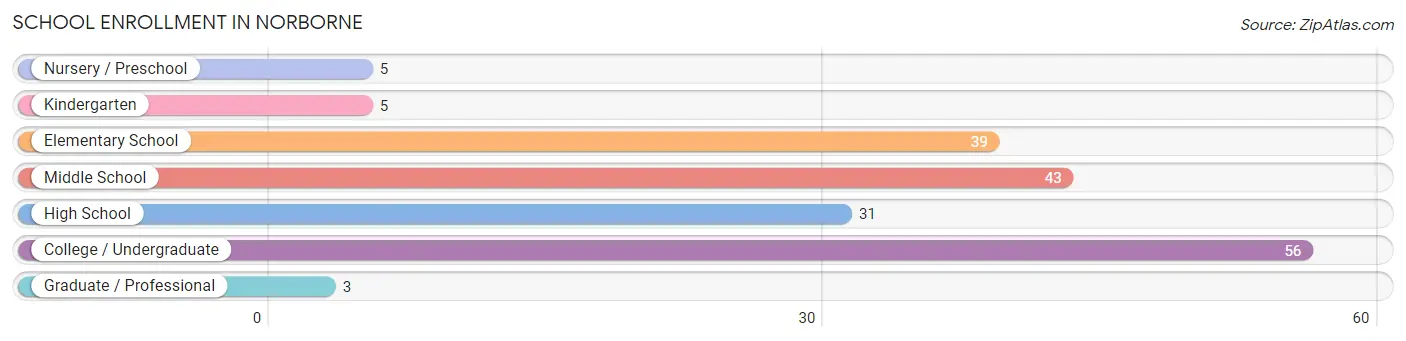
School Enrollment in Norborne
The most common levels of schooling among the 182 students in Norborne are college / undergraduate (56 | 30.8%), middle school (43 | 23.6%), and elementary school (39 | 21.4%).
| School Level | # Students | % Students |
| Nursery / Preschool | 5 | 2.8% |
| Kindergarten | 5 | 2.8% |
| Elementary School | 39 | 21.4% |
| Middle School | 43 | 23.6% |
| High School | 31 | 17.0% |
| College / Undergraduate | 56 | 30.8% |
| Graduate / Professional | 3 | 1.7% |
| Total | 182 | 100.0% |
School Enrollment by Age by Funding Source in Norborne
Out of a total of 182 students who are enrolled in schools in Norborne, 5 (2.7%) attend a private institution, while the remaining 177 (97.3%) are enrolled in public schools. The age group of 25 to 34 year olds has the highest likelihood of being enrolled in private schools, with 3 (50.0% in the age bracket) enrolled. Conversely, the age group of 3 to 4 year olds has the lowest likelihood of being enrolled in a private school, with 5 (100.0% in the age bracket) attending a public institution.
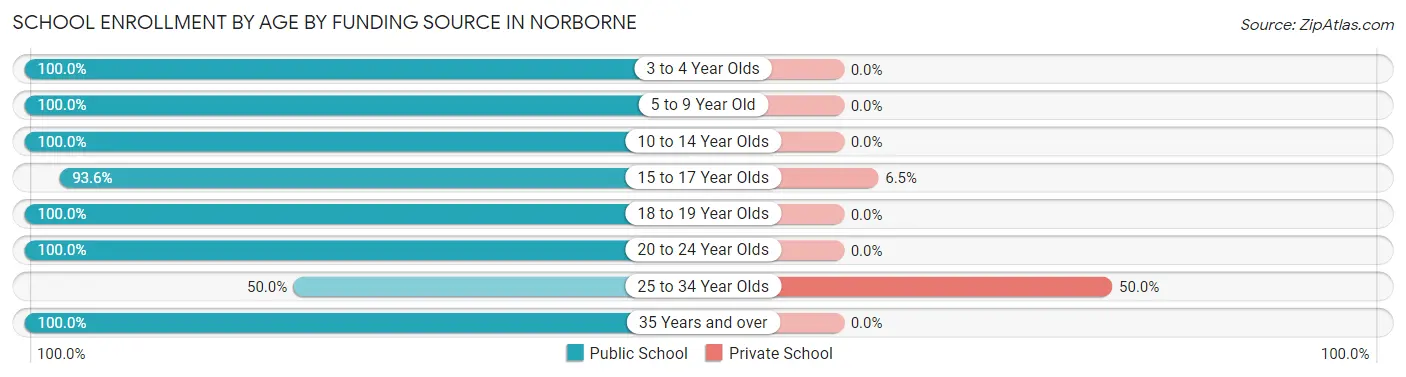
| Age Bracket | Public School | Private School |
| 3 to 4 Year Olds | 5 (100.0%) | 0 (0.0%) |
| 5 to 9 Year Old | 35 (100.0%) | 0 (0.0%) |
| 10 to 14 Year Olds | 52 (100.0%) | 0 (0.0%) |
| 15 to 17 Year Olds | 29 (93.5%) | 2 (6.5%) |
| 18 to 19 Year Olds | 11 (100.0%) | 0 (0.0%) |
| 20 to 24 Year Olds | 20 (100.0%) | 0 (0.0%) |
| 25 to 34 Year Olds | 3 (50.0%) | 3 (50.0%) |
| 35 Years and over | 22 (100.0%) | 0 (0.0%) |
| Total | 177 (97.3%) | 5 (2.7%) |
Educational Attainment by Field of Study in Norborne
Education (28 | 35.4%), bio, nature & agricultural (20 | 25.3%), arts & humanities (14 | 17.7%), science & technology (8 | 10.1%), and business (7 | 8.9%) are the most common fields of study among 79 individuals in Norborne who have obtained a bachelor's degree or higher.
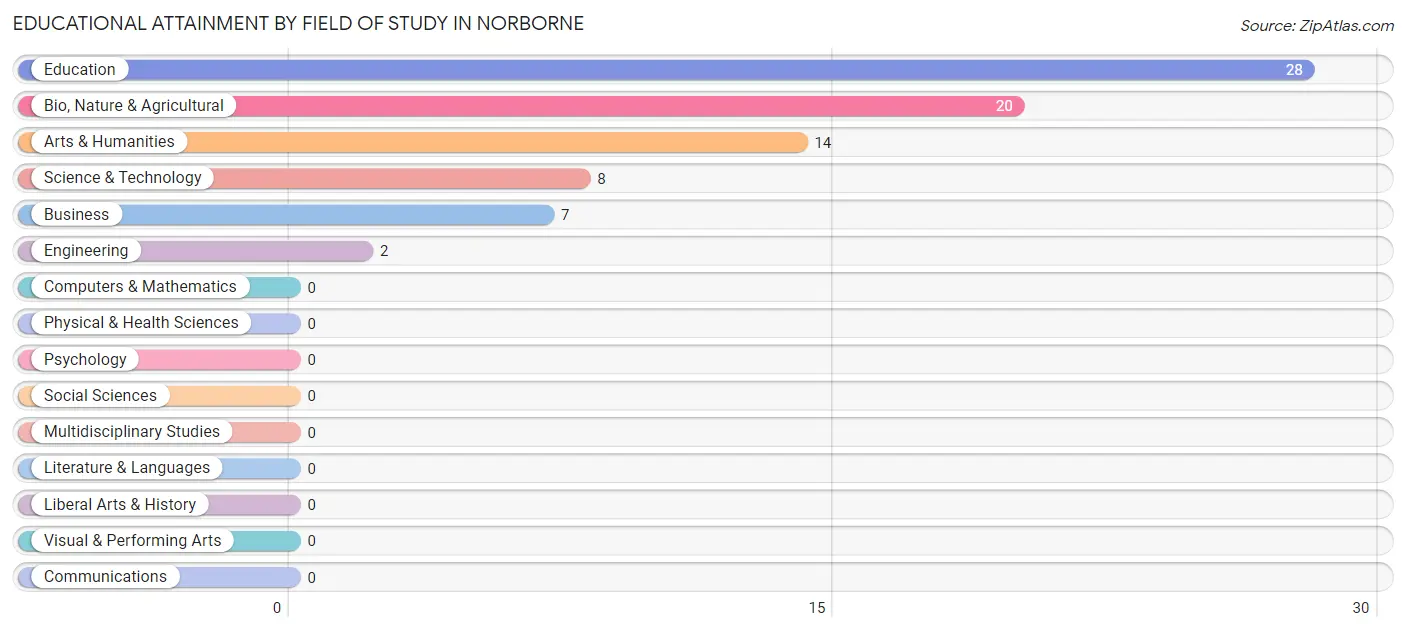
| Field of Study | # Graduates | % Graduates |
| Computers & Mathematics | 0 | 0.0% |
| Bio, Nature & Agricultural | 20 | 25.3% |
| Physical & Health Sciences | 0 | 0.0% |
| Psychology | 0 | 0.0% |
| Social Sciences | 0 | 0.0% |
| Engineering | 2 | 2.5% |
| Multidisciplinary Studies | 0 | 0.0% |
| Science & Technology | 8 | 10.1% |
| Business | 7 | 8.9% |
| Education | 28 | 35.4% |
| Literature & Languages | 0 | 0.0% |
| Liberal Arts & History | 0 | 0.0% |
| Visual & Performing Arts | 0 | 0.0% |
| Communications | 0 | 0.0% |
| Arts & Humanities | 14 | 17.7% |
| Total | 79 | 100.0% |
Transportation & Commute in Norborne
Vehicle Availability by Sex in Norborne
The most prevalent vehicle ownership categories in Norborne are males with 2 vehicles (67, accounting for 49.6%) and females with 2 vehicles (68, making up 40.8%).
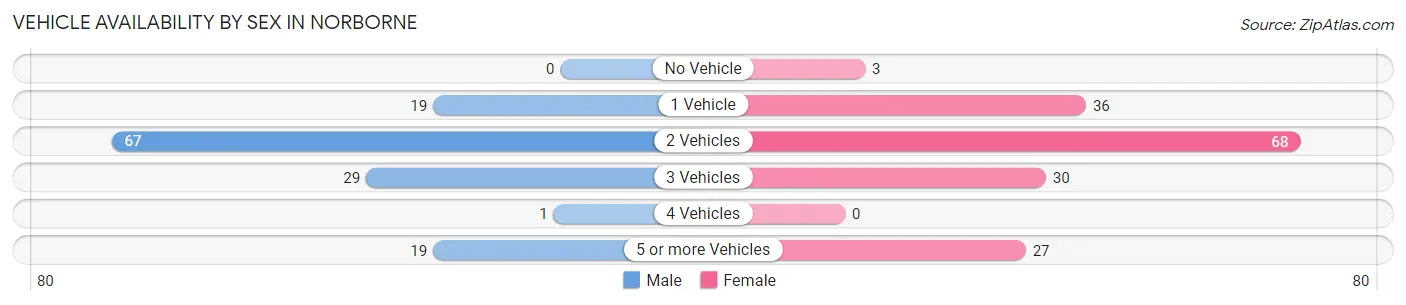
| Vehicles Available | Male | Female |
| No Vehicle | 0 (0.0%) | 3 (1.8%) |
| 1 Vehicle | 19 (14.1%) | 36 (22.0%) |
| 2 Vehicles | 67 (49.6%) | 68 (41.5%) |
| 3 Vehicles | 29 (21.5%) | 30 (18.3%) |
| 4 Vehicles | 1 (0.7%) | 0 (0.0%) |
| 5 or more Vehicles | 19 (14.1%) | 27 (16.5%) |
| Total | 135 (100.0%) | 164 (100.0%) |
Commute Time in Norborne
The most frequently occuring commute durations in Norborne are 60 to 89 minutes (56 commuters, 18.7%), 20 to 24 minutes (48 commuters, 16.1%), and 15 to 19 minutes (46 commuters, 15.4%).
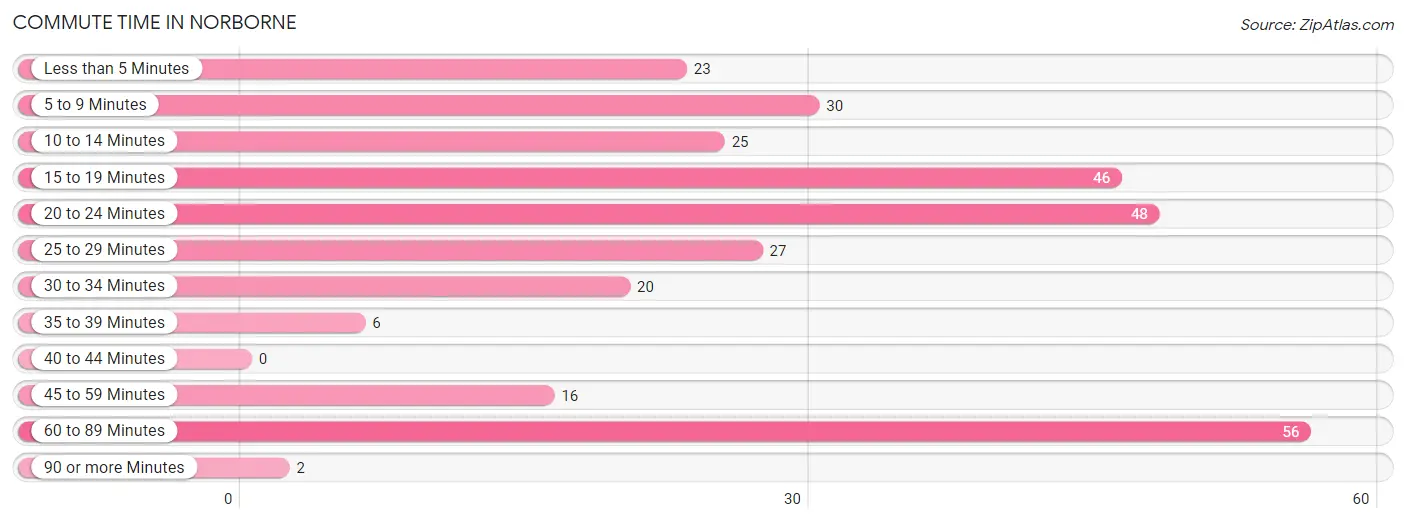
| Commute Time | # Commuters | % Commuters |
| Less than 5 Minutes | 23 | 7.7% |
| 5 to 9 Minutes | 30 | 10.0% |
| 10 to 14 Minutes | 25 | 8.4% |
| 15 to 19 Minutes | 46 | 15.4% |
| 20 to 24 Minutes | 48 | 16.1% |
| 25 to 29 Minutes | 27 | 9.0% |
| 30 to 34 Minutes | 20 | 6.7% |
| 35 to 39 Minutes | 6 | 2.0% |
| 40 to 44 Minutes | 0 | 0.0% |
| 45 to 59 Minutes | 16 | 5.3% |
| 60 to 89 Minutes | 56 | 18.7% |
| 90 or more Minutes | 2 | 0.7% |
Commute Time by Sex in Norborne
The most common commute times in Norborne are 60 to 89 minutes (42 commuters, 31.1%) for males and 15 to 19 minutes (34 commuters, 20.7%) for females.
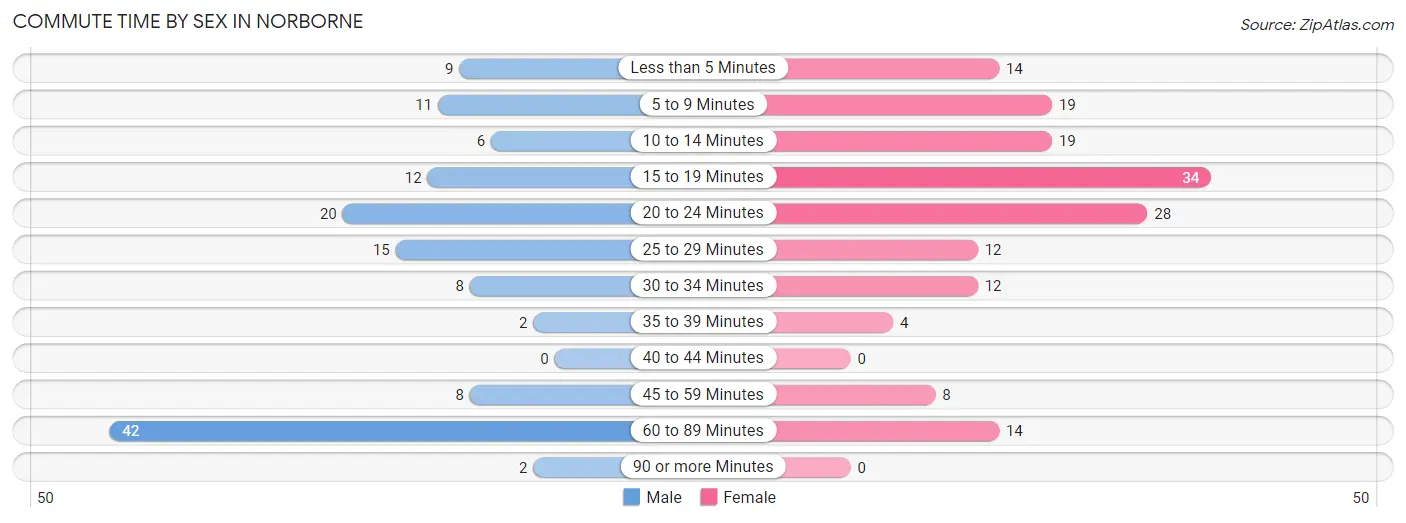
| Commute Time | Male | Female |
| Less than 5 Minutes | 9 (6.7%) | 14 (8.5%) |
| 5 to 9 Minutes | 11 (8.2%) | 19 (11.6%) |
| 10 to 14 Minutes | 6 (4.4%) | 19 (11.6%) |
| 15 to 19 Minutes | 12 (8.9%) | 34 (20.7%) |
| 20 to 24 Minutes | 20 (14.8%) | 28 (17.1%) |
| 25 to 29 Minutes | 15 (11.1%) | 12 (7.3%) |
| 30 to 34 Minutes | 8 (5.9%) | 12 (7.3%) |
| 35 to 39 Minutes | 2 (1.5%) | 4 (2.4%) |
| 40 to 44 Minutes | 0 (0.0%) | 0 (0.0%) |
| 45 to 59 Minutes | 8 (5.9%) | 8 (4.9%) |
| 60 to 89 Minutes | 42 (31.1%) | 14 (8.5%) |
| 90 or more Minutes | 2 (1.5%) | 0 (0.0%) |
Time of Departure to Work by Sex in Norborne
The most frequent times of departure to work in Norborne are 7:30 AM to 7:59 AM (30, 22.2%) for males and 6:30 AM to 6:59 AM (46, 28.1%) for females.
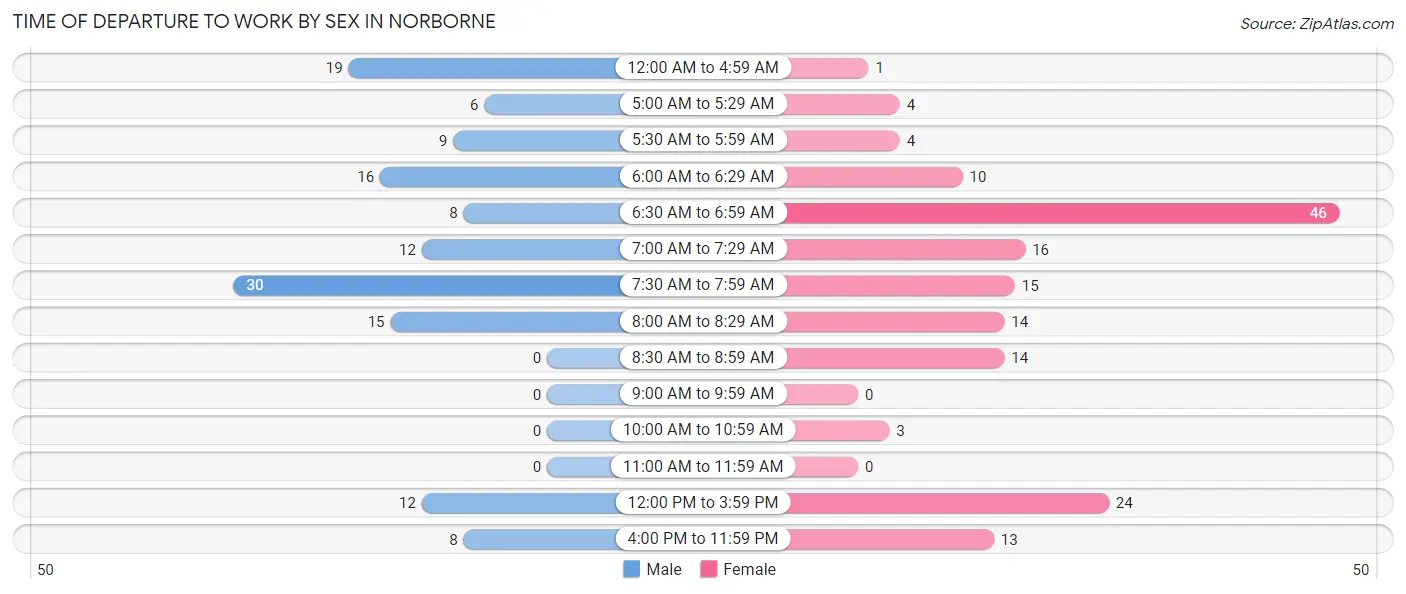
| Time of Departure | Male | Female |
| 12:00 AM to 4:59 AM | 19 (14.1%) | 1 (0.6%) |
| 5:00 AM to 5:29 AM | 6 (4.4%) | 4 (2.4%) |
| 5:30 AM to 5:59 AM | 9 (6.7%) | 4 (2.4%) |
| 6:00 AM to 6:29 AM | 16 (11.8%) | 10 (6.1%) |
| 6:30 AM to 6:59 AM | 8 (5.9%) | 46 (28.1%) |
| 7:00 AM to 7:29 AM | 12 (8.9%) | 16 (9.8%) |
| 7:30 AM to 7:59 AM | 30 (22.2%) | 15 (9.1%) |
| 8:00 AM to 8:29 AM | 15 (11.1%) | 14 (8.5%) |
| 8:30 AM to 8:59 AM | 0 (0.0%) | 14 (8.5%) |
| 9:00 AM to 9:59 AM | 0 (0.0%) | 0 (0.0%) |
| 10:00 AM to 10:59 AM | 0 (0.0%) | 3 (1.8%) |
| 11:00 AM to 11:59 AM | 0 (0.0%) | 0 (0.0%) |
| 12:00 PM to 3:59 PM | 12 (8.9%) | 24 (14.6%) |
| 4:00 PM to 11:59 PM | 8 (5.9%) | 13 (7.9%) |
| Total | 135 (100.0%) | 164 (100.0%) |
Housing Occupancy in Norborne
Occupancy by Ownership in Norborne
Of the total 269 dwellings in Norborne, owner-occupied units account for 232 (86.3%), while renter-occupied units make up 37 (13.8%).
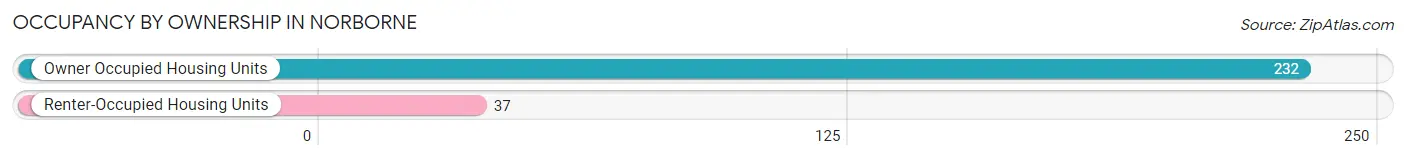
| Occupancy | # Housing Units | % Housing Units |
| Owner Occupied Housing Units | 232 | 86.3% |
| Renter-Occupied Housing Units | 37 | 13.8% |
| Total Occupied Housing Units | 269 | 100.0% |
Occupancy by Household Size in Norborne
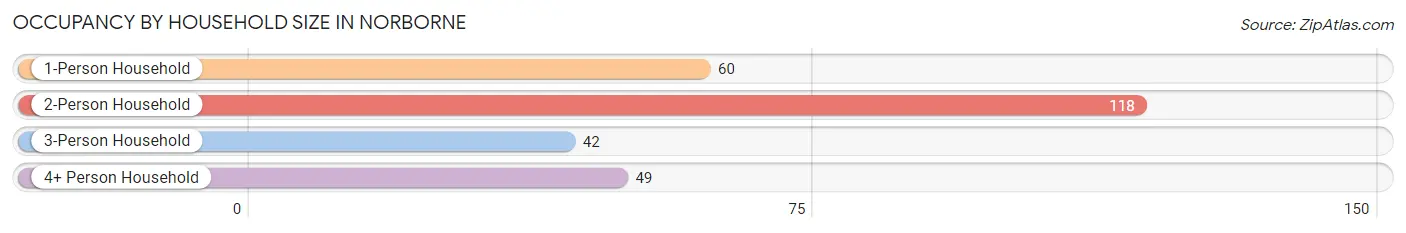
| Household Size | # Housing Units | % Housing Units |
| 1-Person Household | 60 | 22.3% |
| 2-Person Household | 118 | 43.9% |
| 3-Person Household | 42 | 15.6% |
| 4+ Person Household | 49 | 18.2% |
| Total Housing Units | 269 | 100.0% |
Occupancy by Ownership by Household Size in Norborne
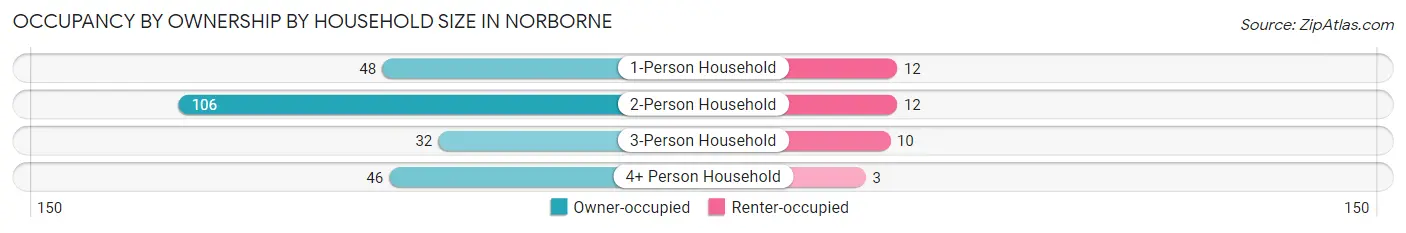
| Household Size | Owner-occupied | Renter-occupied |
| 1-Person Household | 48 (80.0%) | 12 (20.0%) |
| 2-Person Household | 106 (89.8%) | 12 (10.2%) |
| 3-Person Household | 32 (76.2%) | 10 (23.8%) |
| 4+ Person Household | 46 (93.9%) | 3 (6.1%) |
| Total Housing Units | 232 (86.3%) | 37 (13.8%) |
Occupancy by Educational Attainment in Norborne
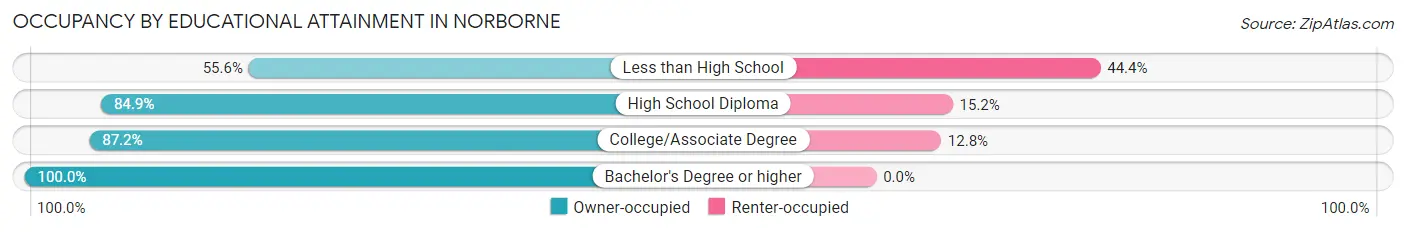
| Household Size | Owner-occupied | Renter-occupied |
| Less than High School | 10 (55.6%) | 8 (44.4%) |
| High School Diploma | 84 (84.9%) | 15 (15.1%) |
| College/Associate Degree | 95 (87.2%) | 14 (12.8%) |
| Bachelor's Degree or higher | 43 (100.0%) | 0 (0.0%) |
Occupancy by Age of Householder in Norborne
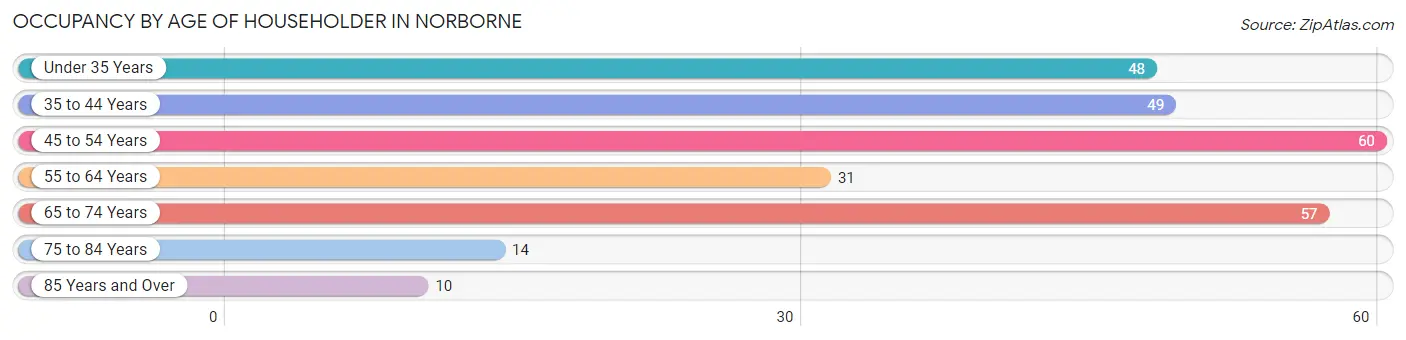
| Age Bracket | # Households | % Households |
| Under 35 Years | 48 | 17.8% |
| 35 to 44 Years | 49 | 18.2% |
| 45 to 54 Years | 60 | 22.3% |
| 55 to 64 Years | 31 | 11.5% |
| 65 to 74 Years | 57 | 21.2% |
| 75 to 84 Years | 14 | 5.2% |
| 85 Years and Over | 10 | 3.7% |
| Total | 269 | 100.0% |
Housing Finances in Norborne
Median Income by Occupancy in Norborne
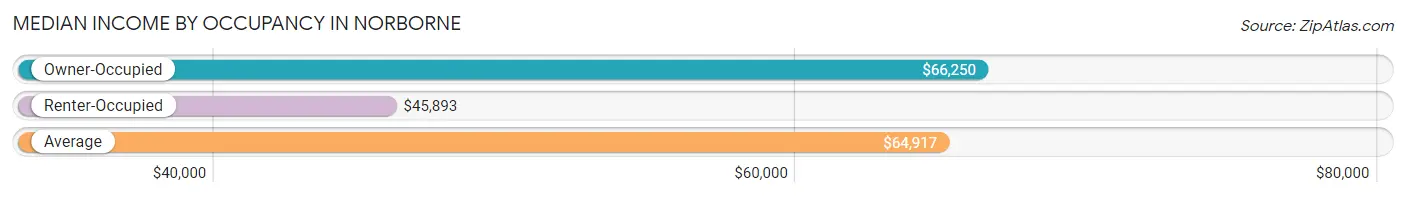
| Occupancy Type | # Households | Median Income |
| Owner-Occupied | 232 (86.3%) | $66,250 |
| Renter-Occupied | 37 (13.8%) | $45,893 |
| Average | 269 (100.0%) | $64,917 |
Occupancy by Householder Income Bracket in Norborne
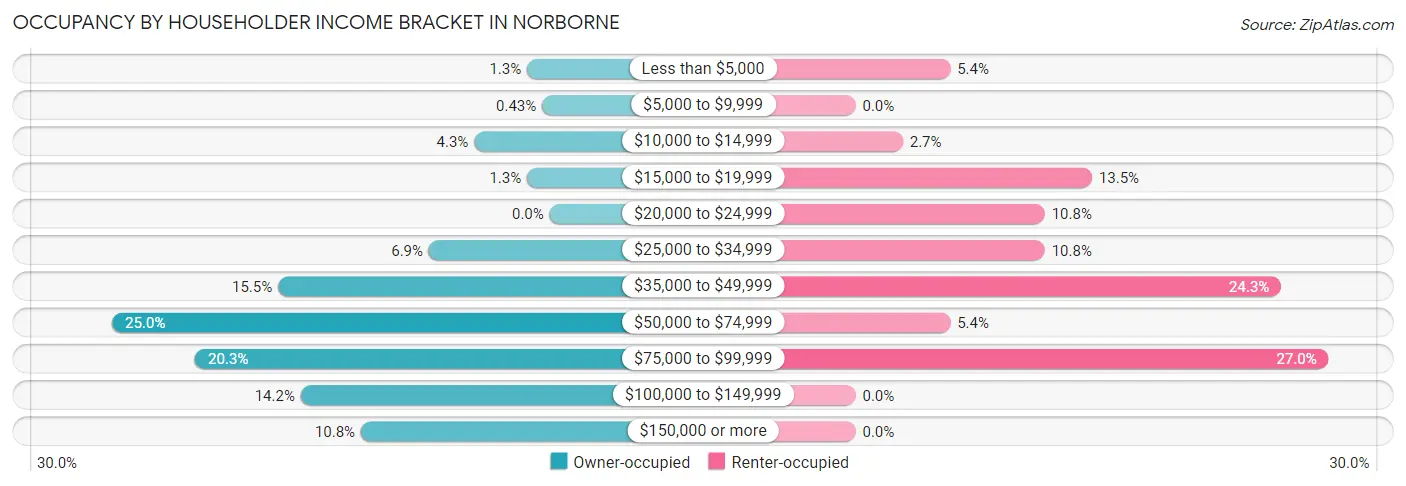
| Income Bracket | Owner-occupied | Renter-occupied |
| Less than $5,000 | 3 (1.3%) | 2 (5.4%) |
| $5,000 to $9,999 | 1 (0.4%) | 0 (0.0%) |
| $10,000 to $14,999 | 10 (4.3%) | 1 (2.7%) |
| $15,000 to $19,999 | 3 (1.3%) | 5 (13.5%) |
| $20,000 to $24,999 | 0 (0.0%) | 4 (10.8%) |
| $25,000 to $34,999 | 16 (6.9%) | 4 (10.8%) |
| $35,000 to $49,999 | 36 (15.5%) | 9 (24.3%) |
| $50,000 to $74,999 | 58 (25.0%) | 2 (5.4%) |
| $75,000 to $99,999 | 47 (20.3%) | 10 (27.0%) |
| $100,000 to $149,999 | 33 (14.2%) | 0 (0.0%) |
| $150,000 or more | 25 (10.8%) | 0 (0.0%) |
| Total | 232 (100.0%) | 37 (100.0%) |
Monthly Housing Cost Tiers in Norborne
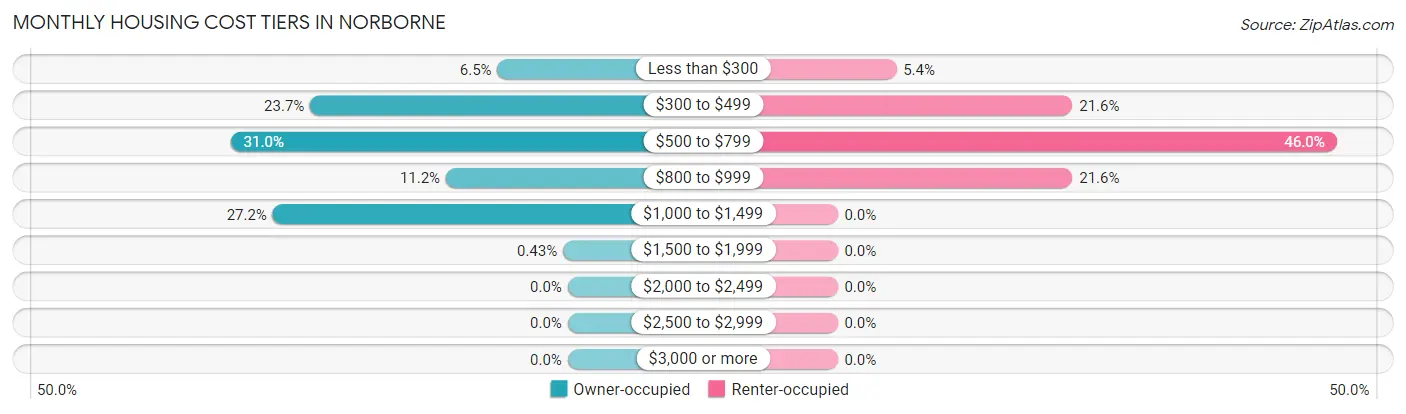
| Monthly Cost | Owner-occupied | Renter-occupied |
| Less than $300 | 15 (6.5%) | 2 (5.4%) |
| $300 to $499 | 55 (23.7%) | 8 (21.6%) |
| $500 to $799 | 72 (31.0%) | 17 (46.0%) |
| $800 to $999 | 26 (11.2%) | 8 (21.6%) |
| $1,000 to $1,499 | 63 (27.2%) | 0 (0.0%) |
| $1,500 to $1,999 | 1 (0.4%) | 0 (0.0%) |
| $2,000 to $2,499 | 0 (0.0%) | 0 (0.0%) |
| $2,500 to $2,999 | 0 (0.0%) | 0 (0.0%) |
| $3,000 or more | 0 (0.0%) | 0 (0.0%) |
| Total | 232 (100.0%) | 37 (100.0%) |
Physical Housing Characteristics in Norborne
Housing Structures in Norborne
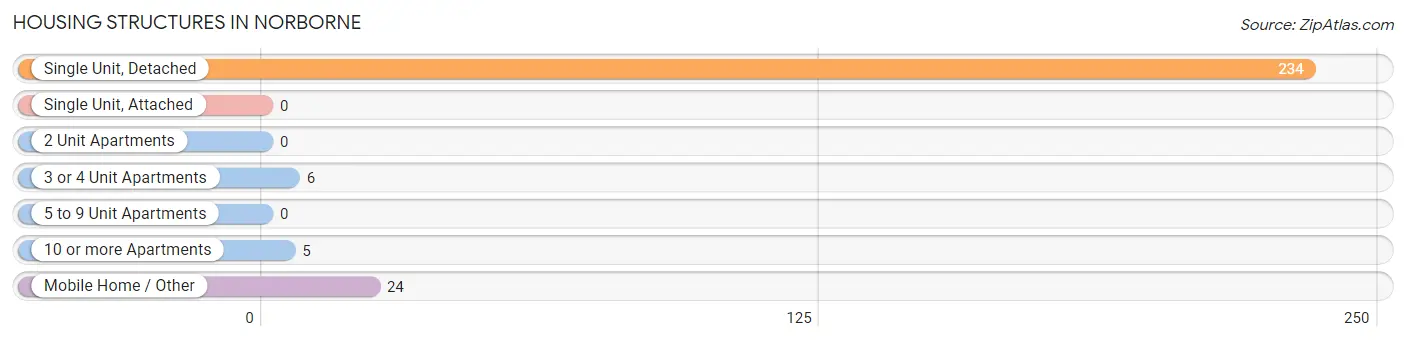
| Structure Type | # Housing Units | % Housing Units |
| Single Unit, Detached | 234 | 87.0% |
| Single Unit, Attached | 0 | 0.0% |
| 2 Unit Apartments | 0 | 0.0% |
| 3 or 4 Unit Apartments | 6 | 2.2% |
| 5 to 9 Unit Apartments | 0 | 0.0% |
| 10 or more Apartments | 5 | 1.9% |
| Mobile Home / Other | 24 | 8.9% |
| Total | 269 | 100.0% |
Housing Structures by Occupancy in Norborne
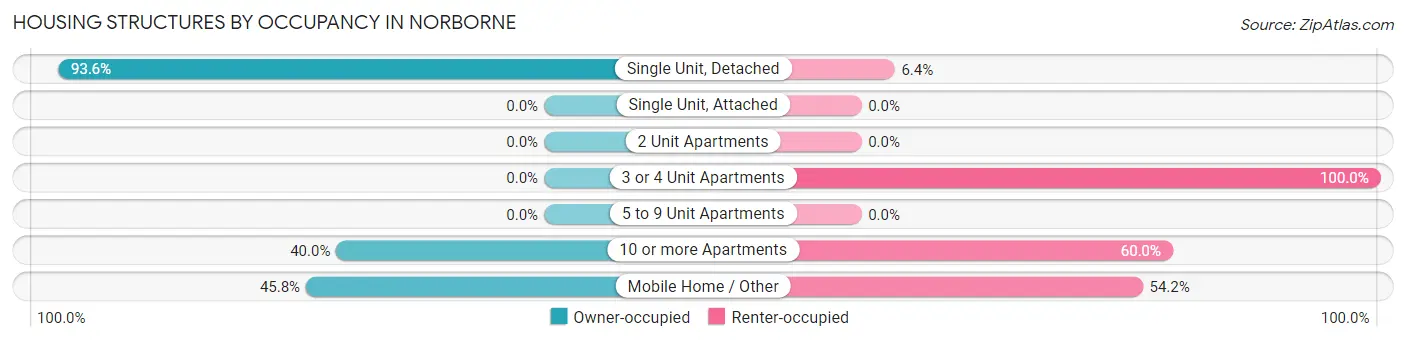
| Structure Type | Owner-occupied | Renter-occupied |
| Single Unit, Detached | 219 (93.6%) | 15 (6.4%) |
| Single Unit, Attached | 0 (0.0%) | 0 (0.0%) |
| 2 Unit Apartments | 0 (0.0%) | 0 (0.0%) |
| 3 or 4 Unit Apartments | 0 (0.0%) | 6 (100.0%) |
| 5 to 9 Unit Apartments | 0 (0.0%) | 0 (0.0%) |
| 10 or more Apartments | 2 (40.0%) | 3 (60.0%) |
| Mobile Home / Other | 11 (45.8%) | 13 (54.2%) |
| Total | 232 (86.3%) | 37 (13.8%) |
Housing Structures by Number of Rooms in Norborne
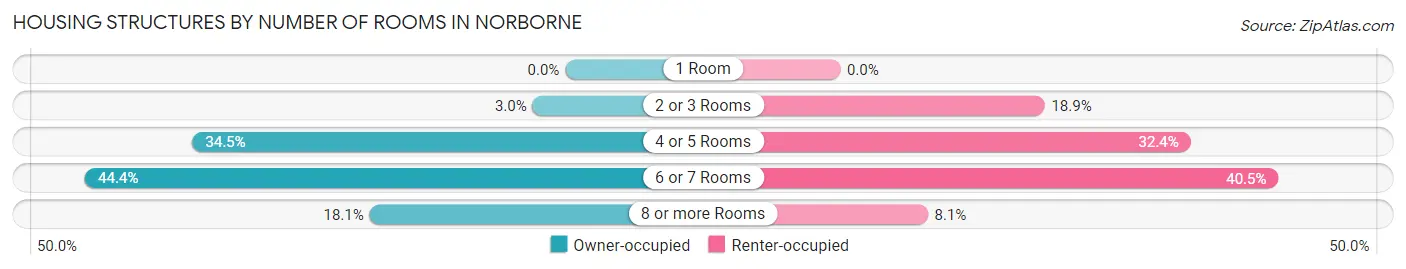
| Number of Rooms | Owner-occupied | Renter-occupied |
| 1 Room | 0 (0.0%) | 0 (0.0%) |
| 2 or 3 Rooms | 7 (3.0%) | 7 (18.9%) |
| 4 or 5 Rooms | 80 (34.5%) | 12 (32.4%) |
| 6 or 7 Rooms | 103 (44.4%) | 15 (40.5%) |
| 8 or more Rooms | 42 (18.1%) | 3 (8.1%) |
| Total | 232 (100.0%) | 37 (100.0%) |
Housing Structure by Heating Type in Norborne
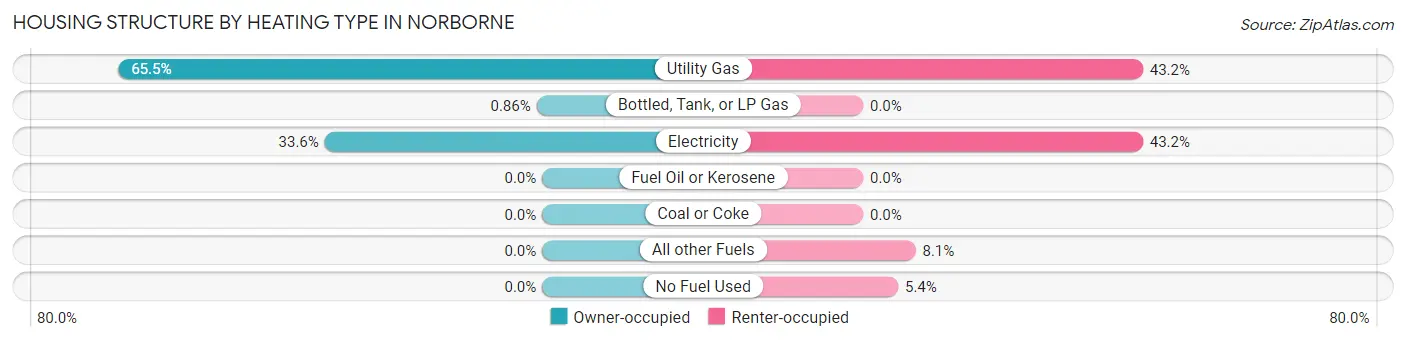
| Heating Type | Owner-occupied | Renter-occupied |
| Utility Gas | 152 (65.5%) | 16 (43.2%) |
| Bottled, Tank, or LP Gas | 2 (0.9%) | 0 (0.0%) |
| Electricity | 78 (33.6%) | 16 (43.2%) |
| Fuel Oil or Kerosene | 0 (0.0%) | 0 (0.0%) |
| Coal or Coke | 0 (0.0%) | 0 (0.0%) |
| All other Fuels | 0 (0.0%) | 3 (8.1%) |
| No Fuel Used | 0 (0.0%) | 2 (5.4%) |
| Total | 232 (100.0%) | 37 (100.0%) |
Household Vehicle Usage in Norborne
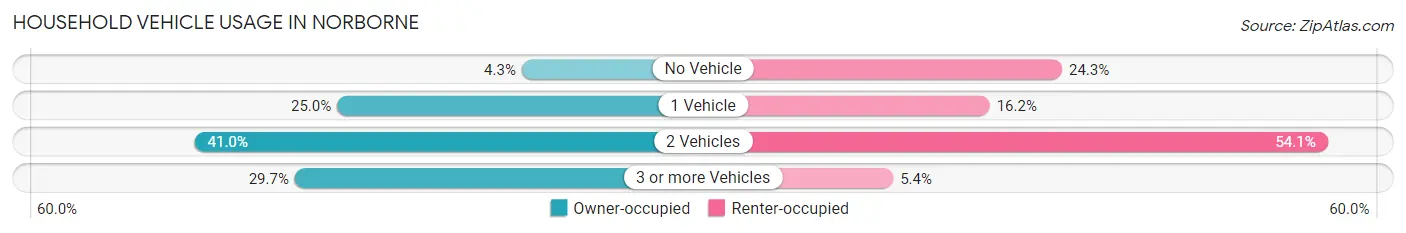
| Vehicles per Household | Owner-occupied | Renter-occupied |
| No Vehicle | 10 (4.3%) | 9 (24.3%) |
| 1 Vehicle | 58 (25.0%) | 6 (16.2%) |
| 2 Vehicles | 95 (40.9%) | 20 (54.0%) |
| 3 or more Vehicles | 69 (29.7%) | 2 (5.4%) |
| Total | 232 (100.0%) | 37 (100.0%) |
Real Estate & Mortgages in Norborne
Real Estate and Mortgage Overview in Norborne
| Characteristic | Without Mortgage | With Mortgage |
| Housing Units | 102 | 130 |
| Median Property Value | $90,000 | $84,700 |
| Median Household Income | $63,750 | $6 |
| Monthly Housing Costs | $439 | $0 |
| Real Estate Taxes | $775 | $1 |
Property Value by Mortgage Status in Norborne
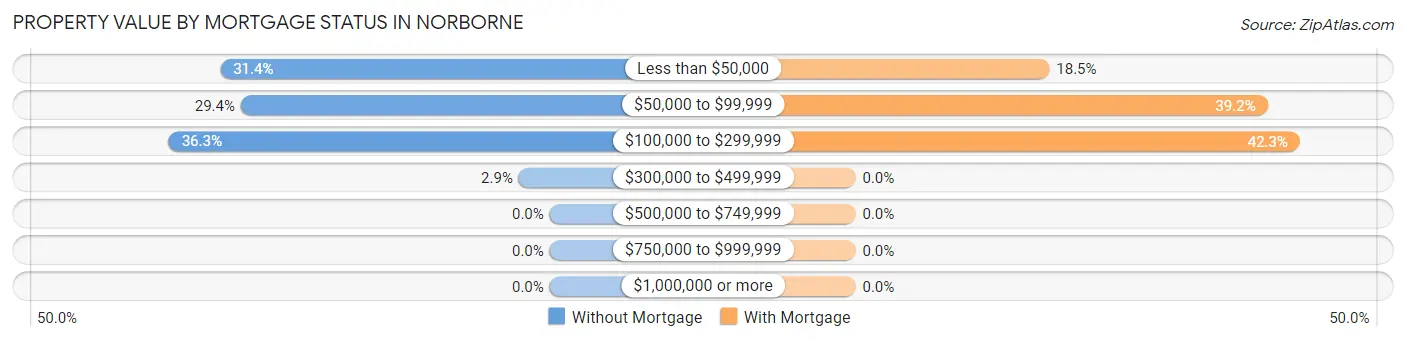
| Property Value | Without Mortgage | With Mortgage |
| Less than $50,000 | 32 (31.4%) | 24 (18.5%) |
| $50,000 to $99,999 | 30 (29.4%) | 51 (39.2%) |
| $100,000 to $299,999 | 37 (36.3%) | 55 (42.3%) |
| $300,000 to $499,999 | 3 (2.9%) | 0 (0.0%) |
| $500,000 to $749,999 | 0 (0.0%) | 0 (0.0%) |
| $750,000 to $999,999 | 0 (0.0%) | 0 (0.0%) |
| $1,000,000 or more | 0 (0.0%) | 0 (0.0%) |
| Total | 102 (100.0%) | 130 (100.0%) |
Household Income by Mortgage Status in Norborne
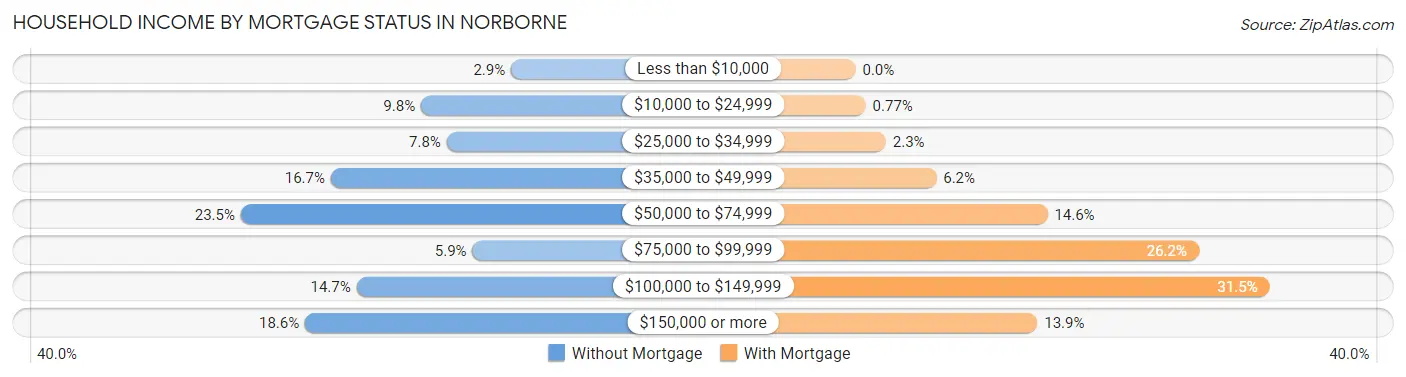
| Household Income | Without Mortgage | With Mortgage |
| Less than $10,000 | 3 (2.9%) | 0 (0.0%) |
| $10,000 to $24,999 | 10 (9.8%) | 1 (0.8%) |
| $25,000 to $34,999 | 8 (7.8%) | 3 (2.3%) |
| $35,000 to $49,999 | 17 (16.7%) | 8 (6.1%) |
| $50,000 to $74,999 | 24 (23.5%) | 19 (14.6%) |
| $75,000 to $99,999 | 6 (5.9%) | 34 (26.2%) |
| $100,000 to $149,999 | 15 (14.7%) | 41 (31.5%) |
| $150,000 or more | 19 (18.6%) | 18 (13.9%) |
| Total | 102 (100.0%) | 130 (100.0%) |
Property Value to Household Income Ratio in Norborne
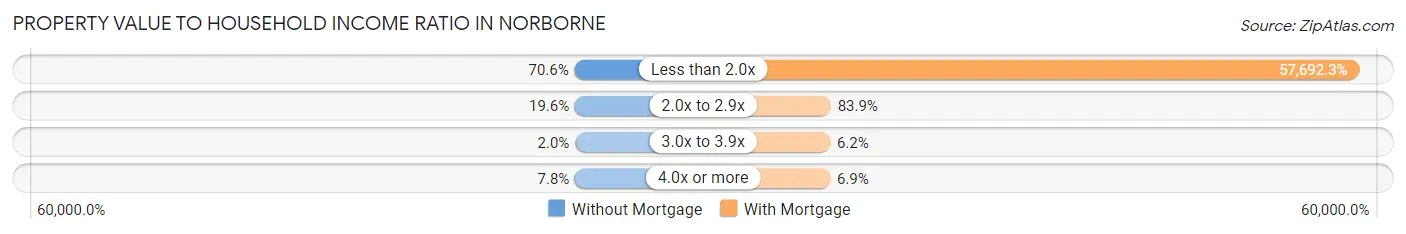
| Value-to-Income Ratio | Without Mortgage | With Mortgage |
| Less than 2.0x | 72 (70.6%) | 75,000 (57,692.3%) |
| 2.0x to 2.9x | 20 (19.6%) | 109 (83.9%) |
| 3.0x to 3.9x | 2 (2.0%) | 8 (6.1%) |
| 4.0x or more | 8 (7.8%) | 9 (6.9%) |
| Total | 102 (100.0%) | 130 (100.0%) |
Real Estate Taxes by Mortgage Status in Norborne
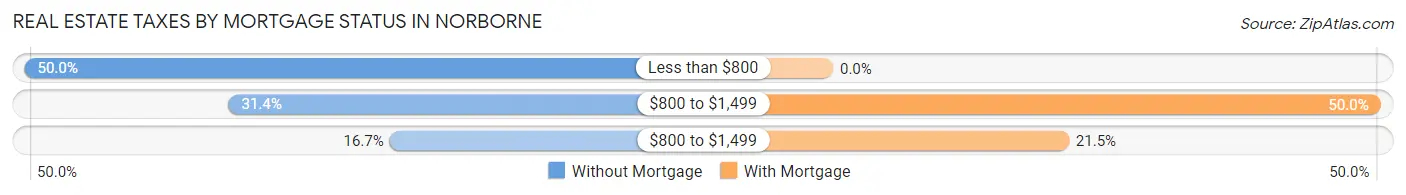
| Property Taxes | Without Mortgage | With Mortgage |
| Less than $800 | 51 (50.0%) | 0 (0.0%) |
| $800 to $1,499 | 32 (31.4%) | 65 (50.0%) |
| $800 to $1,499 | 17 (16.7%) | 28 (21.5%) |
| Total | 102 (100.0%) | 130 (100.0%) |
Health & Disability in Norborne
Health Insurance Coverage by Age in Norborne
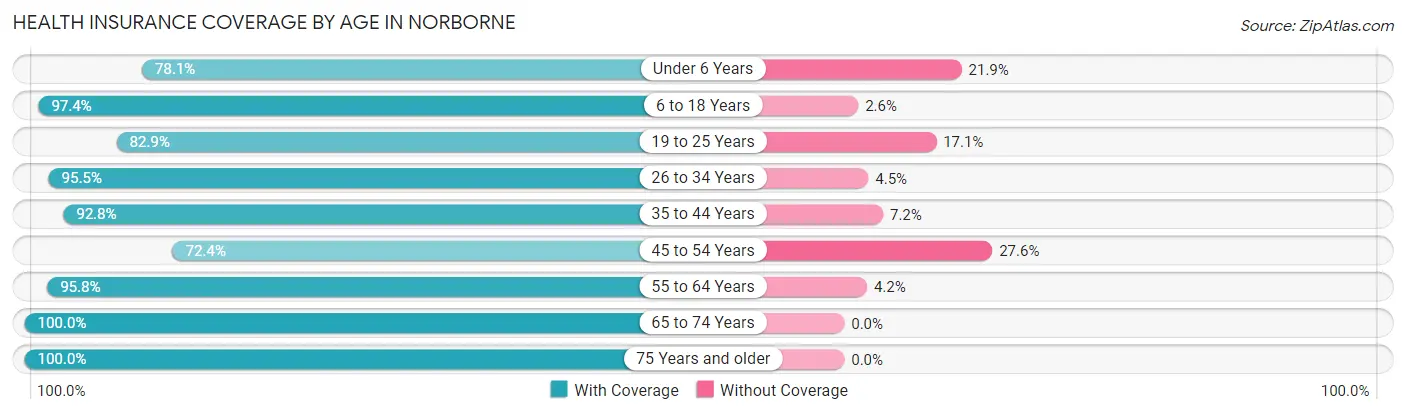
| Age Bracket | With Coverage | Without Coverage |
| Under 6 Years | 25 (78.1%) | 7 (21.9%) |
| 6 to 18 Years | 113 (97.4%) | 3 (2.6%) |
| 19 to 25 Years | 58 (82.9%) | 12 (17.1%) |
| 26 to 34 Years | 64 (95.5%) | 3 (4.5%) |
| 35 to 44 Years | 90 (92.8%) | 7 (7.2%) |
| 45 to 54 Years | 63 (72.4%) | 24 (27.6%) |
| 55 to 64 Years | 68 (95.8%) | 3 (4.2%) |
| 65 to 74 Years | 79 (100.0%) | 0 (0.0%) |
| 75 Years and older | 37 (100.0%) | 0 (0.0%) |
| Total | 597 (91.0%) | 59 (9.0%) |
Health Insurance Coverage by Citizenship Status in Norborne
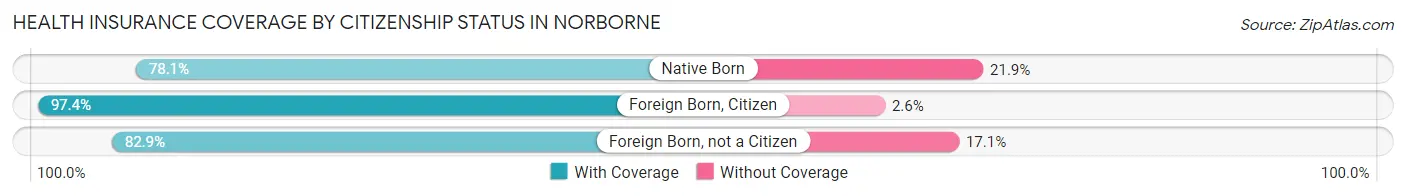
| Citizenship Status | With Coverage | Without Coverage |
| Native Born | 25 (78.1%) | 7 (21.9%) |
| Foreign Born, Citizen | 113 (97.4%) | 3 (2.6%) |
| Foreign Born, not a Citizen | 58 (82.9%) | 12 (17.1%) |
Health Insurance Coverage by Household Income in Norborne
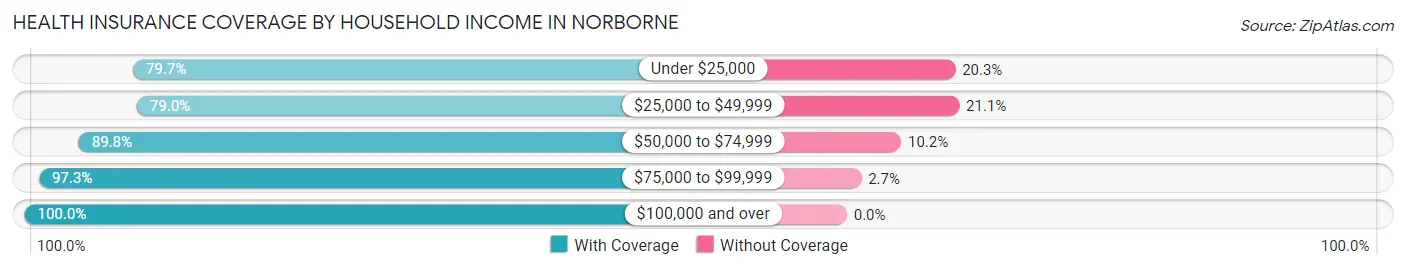
| Household Income | With Coverage | Without Coverage |
| Under $25,000 | 51 (79.7%) | 13 (20.3%) |
| $25,000 to $49,999 | 105 (78.9%) | 28 (21.0%) |
| $50,000 to $74,999 | 115 (89.8%) | 13 (10.2%) |
| $75,000 to $99,999 | 180 (97.3%) | 5 (2.7%) |
| $100,000 and over | 146 (100.0%) | 0 (0.0%) |
Public vs Private Health Insurance Coverage by Age in Norborne
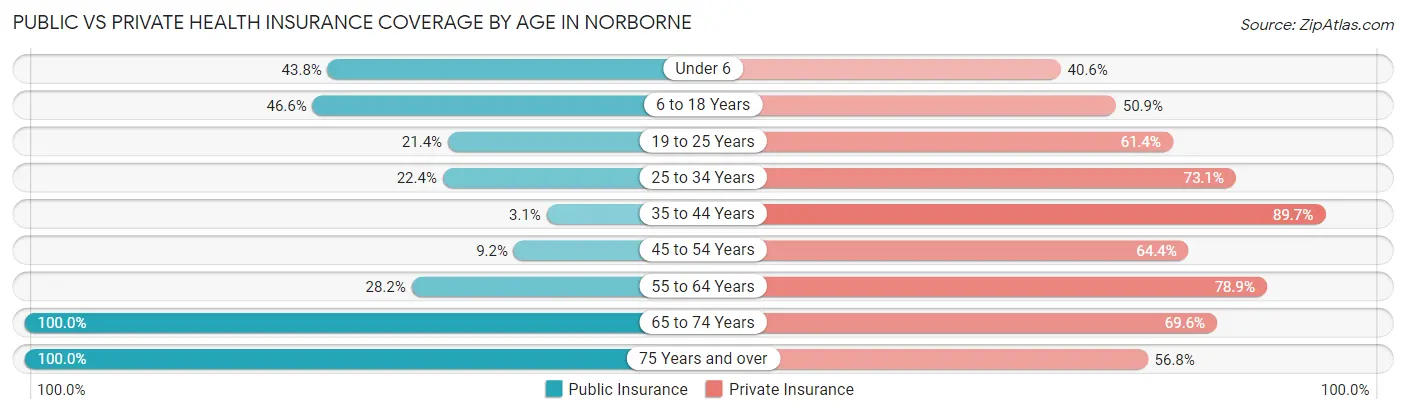
| Age Bracket | Public Insurance | Private Insurance |
| Under 6 | 14 (43.8%) | 13 (40.6%) |
| 6 to 18 Years | 54 (46.6%) | 59 (50.9%) |
| 19 to 25 Years | 15 (21.4%) | 43 (61.4%) |
| 25 to 34 Years | 15 (22.4%) | 49 (73.1%) |
| 35 to 44 Years | 3 (3.1%) | 87 (89.7%) |
| 45 to 54 Years | 8 (9.2%) | 56 (64.4%) |
| 55 to 64 Years | 20 (28.2%) | 56 (78.9%) |
| 65 to 74 Years | 79 (100.0%) | 55 (69.6%) |
| 75 Years and over | 37 (100.0%) | 21 (56.8%) |
| Total | 245 (37.3%) | 439 (66.9%) |
Disability Status by Sex by Age in Norborne
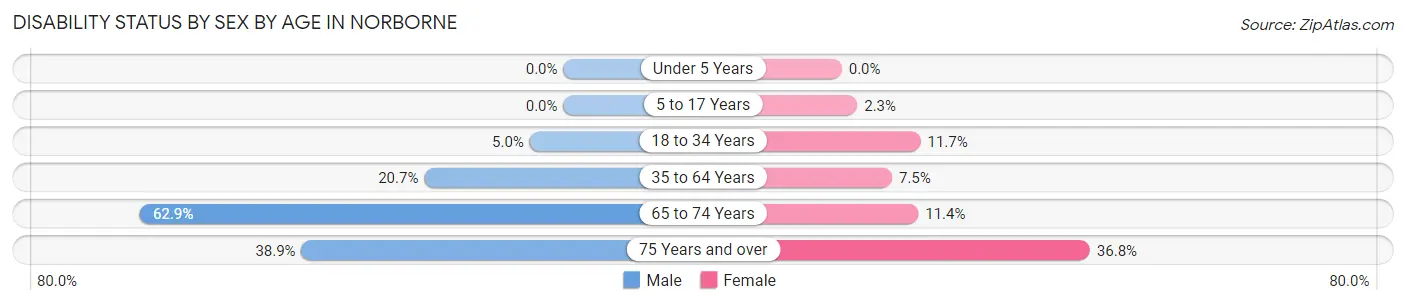
| Age Bracket | Male | Female |
| Under 5 Years | 0 (0.0%) | 0 (0.0%) |
| 5 to 17 Years | 0 (0.0%) | 2 (2.3%) |
| 18 to 34 Years | 3 (5.0%) | 9 (11.7%) |
| 35 to 64 Years | 25 (20.7%) | 10 (7.5%) |
| 65 to 74 Years | 22 (62.9%) | 5 (11.4%) |
| 75 Years and over | 7 (38.9%) | 7 (36.8%) |
Disability Class by Sex by Age in Norborne
Disability Class: Hearing Difficulty
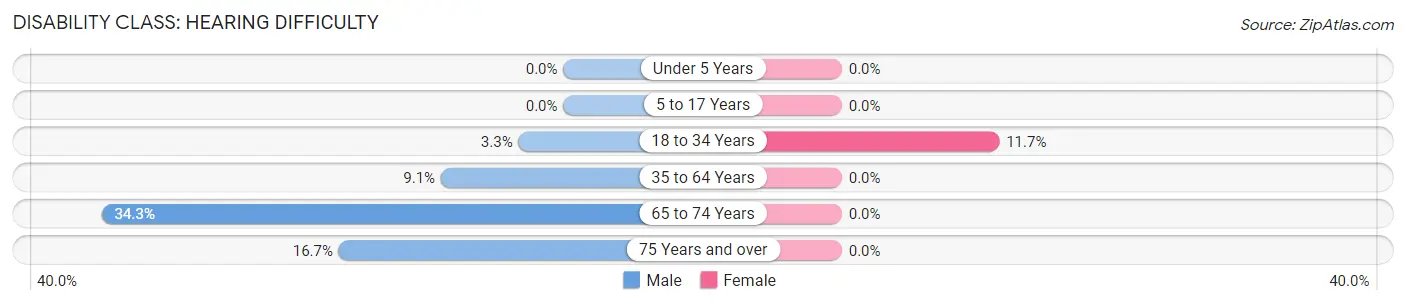
| Age Bracket | Male | Female |
| Under 5 Years | 0 (0.0%) | 0 (0.0%) |
| 5 to 17 Years | 0 (0.0%) | 0 (0.0%) |
| 18 to 34 Years | 2 (3.3%) | 9 (11.7%) |
| 35 to 64 Years | 11 (9.1%) | 0 (0.0%) |
| 65 to 74 Years | 12 (34.3%) | 0 (0.0%) |
| 75 Years and over | 3 (16.7%) | 0 (0.0%) |
Disability Class: Vision Difficulty
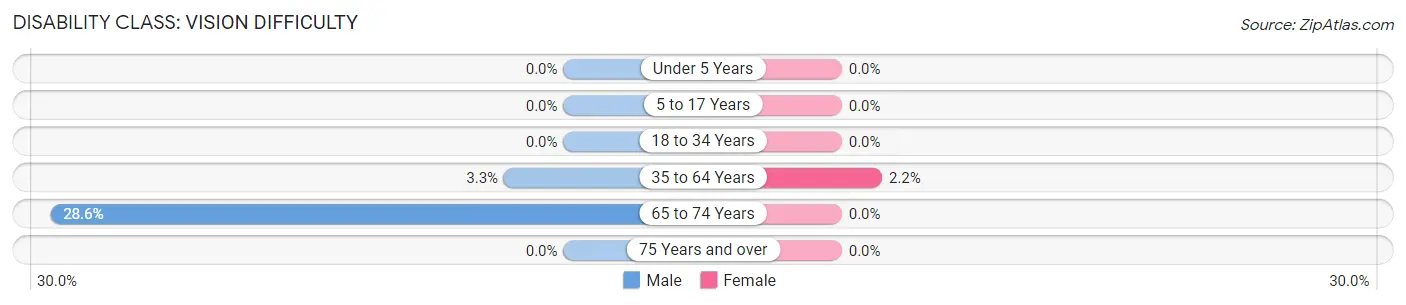
| Age Bracket | Male | Female |
| Under 5 Years | 0 (0.0%) | 0 (0.0%) |
| 5 to 17 Years | 0 (0.0%) | 0 (0.0%) |
| 18 to 34 Years | 0 (0.0%) | 0 (0.0%) |
| 35 to 64 Years | 4 (3.3%) | 3 (2.2%) |
| 65 to 74 Years | 10 (28.6%) | 0 (0.0%) |
| 75 Years and over | 0 (0.0%) | 0 (0.0%) |
Disability Class: Cognitive Difficulty
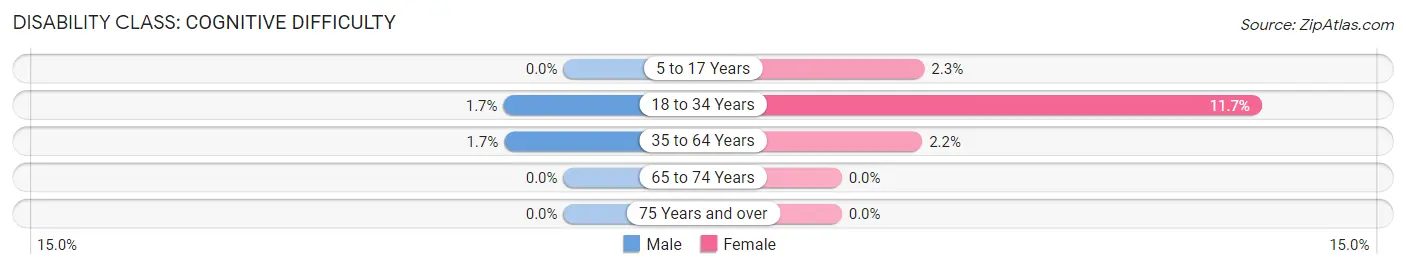
| Age Bracket | Male | Female |
| 5 to 17 Years | 0 (0.0%) | 2 (2.3%) |
| 18 to 34 Years | 1 (1.7%) | 9 (11.7%) |
| 35 to 64 Years | 2 (1.7%) | 3 (2.2%) |
| 65 to 74 Years | 0 (0.0%) | 0 (0.0%) |
| 75 Years and over | 0 (0.0%) | 0 (0.0%) |
Disability Class: Ambulatory Difficulty
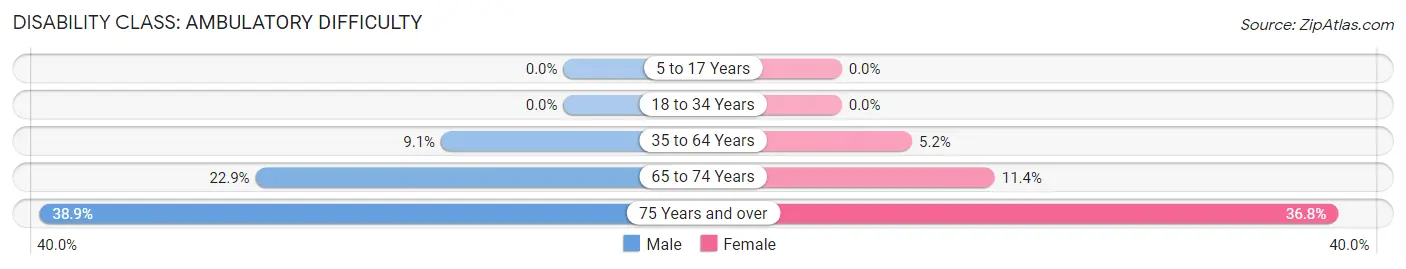
| Age Bracket | Male | Female |
| 5 to 17 Years | 0 (0.0%) | 0 (0.0%) |
| 18 to 34 Years | 0 (0.0%) | 0 (0.0%) |
| 35 to 64 Years | 11 (9.1%) | 7 (5.2%) |
| 65 to 74 Years | 8 (22.9%) | 5 (11.4%) |
| 75 Years and over | 7 (38.9%) | 7 (36.8%) |
Disability Class: Self-Care Difficulty
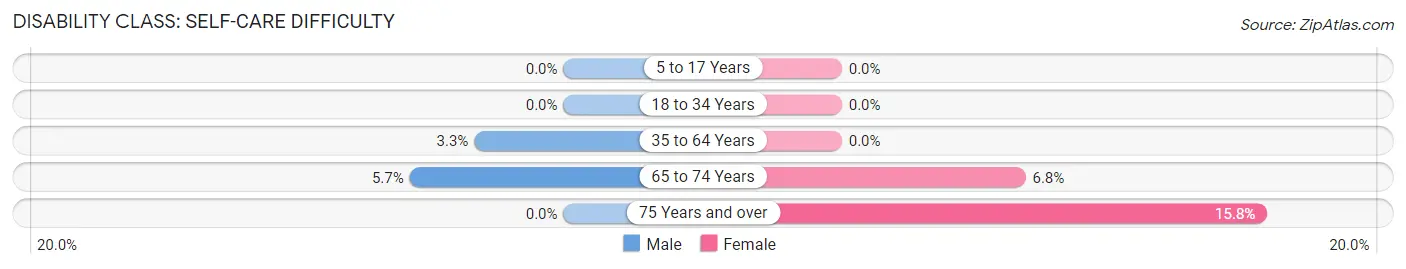
| Age Bracket | Male | Female |
| 5 to 17 Years | 0 (0.0%) | 0 (0.0%) |
| 18 to 34 Years | 0 (0.0%) | 0 (0.0%) |
| 35 to 64 Years | 4 (3.3%) | 0 (0.0%) |
| 65 to 74 Years | 2 (5.7%) | 3 (6.8%) |
| 75 Years and over | 0 (0.0%) | 3 (15.8%) |
Technology Access in Norborne
Computing Device Access in Norborne
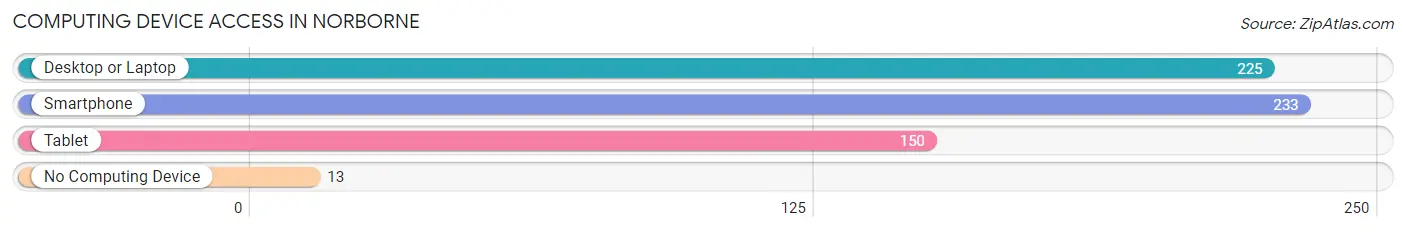
| Device Type | # Households | % Households |
| Desktop or Laptop | 225 | 83.6% |
| Smartphone | 233 | 86.6% |
| Tablet | 150 | 55.8% |
| No Computing Device | 13 | 4.8% |
| Total | 269 | 100.0% |
Internet Access in Norborne
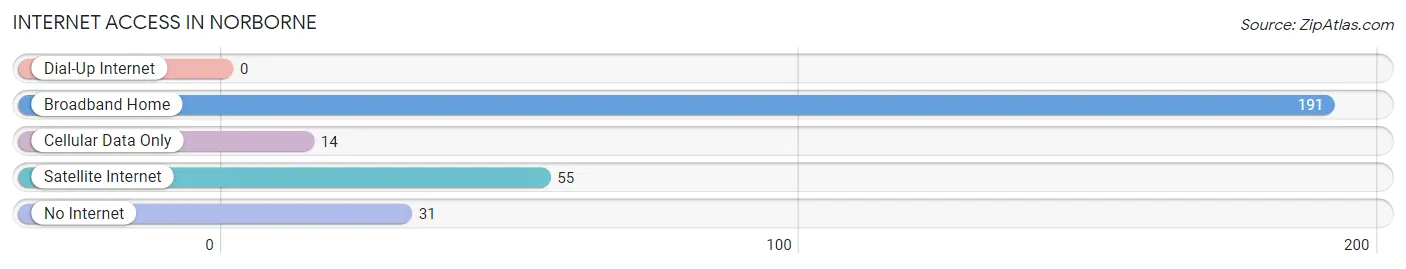
| Internet Type | # Households | % Households |
| Dial-Up Internet | 0 | 0.0% |
| Broadband Home | 191 | 71.0% |
| Cellular Data Only | 14 | 5.2% |
| Satellite Internet | 55 | 20.4% |
| No Internet | 31 | 11.5% |
| Total | 269 | 100.0% |
Norborne Summary
Norborne, Missouri is a small town located in the northwest corner of Carroll County, Missouri. It is situated on the banks of the Missouri River, approximately 30 miles northeast of Kansas City. The town was founded in 1837 and was named after Norborne Berkeley, a prominent local politician. As of the 2010 census, the population of Norborne was 845.
History
Norborne was founded in 1837 by a group of settlers from Kentucky. The town was named after Norborne Berkeley, a prominent local politician. The town was originally a trading post and a stop on the Santa Fe Trail. In 1845, the town was incorporated and the first post office was established.
In the late 19th century, Norborne was a thriving agricultural community. The town was home to several mills, a brickyard, and a canning factory. The town also had a railroad station, which connected it to the larger cities of Kansas City and St. Louis.
In the early 20th century, Norborne experienced a period of decline. The railroad station closed in the 1920s and the canning factory closed in the 1930s. The town’s population decreased from 1,000 in 1910 to just over 500 in 1950.
Geography
Norborne is located in the northwest corner of Carroll County, Missouri. It is situated on the banks of the Missouri River, approximately 30 miles northeast of Kansas City. The town is located in the Missouri River Valley, which is characterized by rolling hills and fertile farmland.
The climate in Norborne is humid continental, with hot summers and cold winters. The average annual temperature is 54°F (12°C). The average annual precipitation is 39 inches (99 cm).
Economy
The economy of Norborne is largely based on agriculture. The town is home to several farms, which produce corn, soybeans, wheat, and hay. The town also has a few small businesses, including a grocery store, a hardware store, and a restaurant.
Demographics
As of the 2010 census, the population of Norborne was 845. The racial makeup of the town was 97.3% White, 0.6% African American, 0.2% Native American, 0.2% Asian, 0.2% from other races, and 1.7% from two or more races. Hispanic or Latino of any race were 0.7% of the population.
The median income for a household in Norborne was $37,500, and the median income for a family was $45,000. The per capita income for the town was $17,000. About 11.3% of families and 14.2% of the population were below the poverty line, including 18.2% of those under age 18 and 8.3% of those age 65 or over.
Common Questions
What is Per Capita Income in Norborne?
Per Capita income in Norborne is $31,841.
What is the Median Family Income in Norborne?
Median Family Income in Norborne is $68,438.
What is the Median Household income in Norborne?
Median Household Income in Norborne is $64,917.
What is Income or Wage Gap in Norborne?
Income or Wage Gap in Norborne is 35.2%.
Women in Norborne earn 64.8 cents for every dollar earned by a man.
What is Inequality or Gini Index in Norborne?
Inequality or Gini Index in Norborne is 0.35.
What is the Total Population of Norborne?
Total Population of Norborne is 656.
What is the Total Male Population of Norborne?
Total Male Population of Norborne is 274.
What is the Total Female Population of Norborne?
Total Female Population of Norborne is 382.
What is the Ratio of Males per 100 Females in Norborne?
There are 71.73 Males per 100 Females in Norborne.
What is the Ratio of Females per 100 Males in Norborne?
There are 139.42 Females per 100 Males in Norborne.
What is the Median Population Age in Norborne?
Median Population Age in Norborne is 40.2 Years.
What is the Average Family Size in Norborne
Average Family Size in Norborne is 2.7 People.
What is the Average Household Size in Norborne
Average Household Size in Norborne is 2.4 People.
How Large is the Labor Force in Norborne?
There are 316 People in the Labor Forcein in Norborne.
What is the Percentage of People in the Labor Force in Norborne?
58.3% of People are in the Labor Force in Norborne.
What is the Unemployment Rate in Norborne?
Unemployment Rate in Norborne is 4.1%.