New Madrid, MO Map & Demographics
New Madrid Map
New Madrid Overview
$25,846
PER CAPITA INCOME
$59,458
AVG FAMILY INCOME
$42,443
AVG HOUSEHOLD INCOME
11.9%
WAGE / INCOME GAP [ % ]
88.1¢/ $1
WAGE / INCOME GAP [ $ ]
0.40
INEQUALITY / GINI INDEX
2,761
TOTAL POPULATION
1,562
MALE POPULATION
1,199
FEMALE POPULATION
130.28
MALES / 100 FEMALES
76.76
FEMALES / 100 MALES
41.9
MEDIAN AGE
3.0
AVG FAMILY SIZE
2.2
AVG HOUSEHOLD SIZE
1,104
LABOR FORCE [ PEOPLE ]
48.2%
PERCENT IN LABOR FORCE
2.3%
UNEMPLOYMENT RATE
New Madrid Zip Codes
New Madrid Area Codes
Income in New Madrid
Income Overview in New Madrid
Per Capita Income in New Madrid is $25,846, while median incomes of families and households are $59,458 and $42,443 respectively.
| Characteristic | Number | Measure |
| Per Capita Income | 2,761 | $25,846 |
| Median Family Income | 628 | $59,458 |
| Mean Family Income | 628 | $69,588 |
| Median Household Income | 1,175 | $42,443 |
| Mean Household Income | 1,175 | $58,676 |
| Income Deficit | 628 | $0 |
| Wage / Income Gap (%) | 2,761 | 11.89% |
| Wage / Income Gap ($) | 2,761 | 88.11¢ per $1 |
| Gini / Inequality Index | 2,761 | 0.40 |
Earnings by Sex in New Madrid
Average Earnings in New Madrid are $32,214, $34,704 for men and $30,579 for women, a difference of 11.9%.
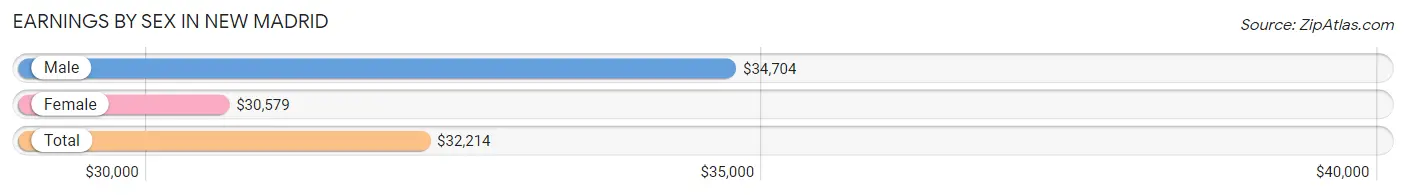
| Sex | Number | Average Earnings |
| Male | 685 (55.6%) | $34,704 |
| Female | 547 (44.4%) | $30,579 |
| Total | 1,232 (100.0%) | $32,214 |
Earnings by Sex by Income Bracket in New Madrid
The most common earnings brackets in New Madrid are $55,000 to $64,999 for men (133 | 19.4%) and $35,000 to $39,999 for women (107 | 19.6%).
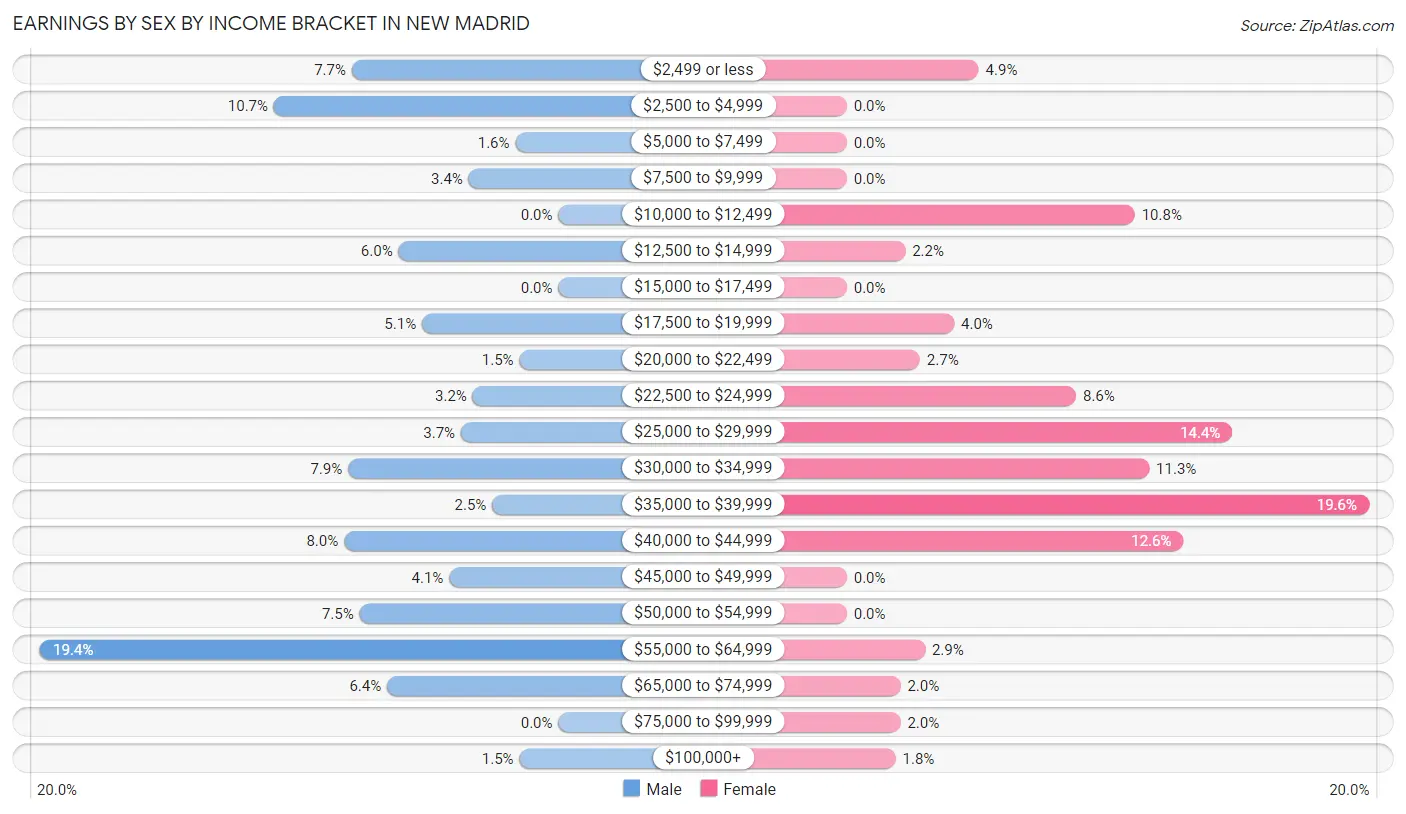
| Income | Male | Female |
| $2,499 or less | 53 (7.7%) | 27 (4.9%) |
| $2,500 to $4,999 | 73 (10.7%) | 0 (0.0%) |
| $5,000 to $7,499 | 11 (1.6%) | 0 (0.0%) |
| $7,500 to $9,999 | 23 (3.4%) | 0 (0.0%) |
| $10,000 to $12,499 | 0 (0.0%) | 59 (10.8%) |
| $12,500 to $14,999 | 41 (6.0%) | 12 (2.2%) |
| $15,000 to $17,499 | 0 (0.0%) | 0 (0.0%) |
| $17,500 to $19,999 | 35 (5.1%) | 22 (4.0%) |
| $20,000 to $22,499 | 10 (1.5%) | 15 (2.7%) |
| $22,500 to $24,999 | 22 (3.2%) | 47 (8.6%) |
| $25,000 to $29,999 | 25 (3.6%) | 79 (14.4%) |
| $30,000 to $34,999 | 54 (7.9%) | 62 (11.3%) |
| $35,000 to $39,999 | 17 (2.5%) | 107 (19.6%) |
| $40,000 to $44,999 | 55 (8.0%) | 69 (12.6%) |
| $45,000 to $49,999 | 28 (4.1%) | 0 (0.0%) |
| $50,000 to $54,999 | 51 (7.4%) | 0 (0.0%) |
| $55,000 to $64,999 | 133 (19.4%) | 16 (2.9%) |
| $65,000 to $74,999 | 44 (6.4%) | 11 (2.0%) |
| $75,000 to $99,999 | 0 (0.0%) | 11 (2.0%) |
| $100,000+ | 10 (1.5%) | 10 (1.8%) |
| Total | 685 (100.0%) | 547 (100.0%) |
Earnings by Sex by Educational Attainment in New Madrid
Average earnings in New Madrid are $40,425 for men and $35,456 for women, a difference of 12.3%. Men with an educational attainment of high school diploma enjoy the highest average annual earnings of $42,159, while those with high school diploma education earn the least with $42,159. Women with an educational attainment of high school diploma earn the most with the average annual earnings of $36,173, while those with college or associate's degree education have the smallest earnings of $25,274.
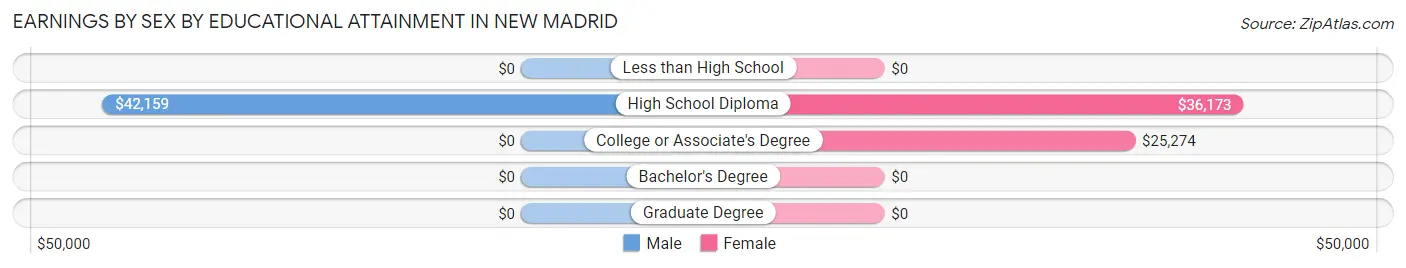
| Educational Attainment | Male Income | Female Income |
| Less than High School | - | - |
| High School Diploma | $42,159 | $36,173 |
| College or Associate's Degree | - | - |
| Bachelor's Degree | - | - |
| Graduate Degree | - | - |
| Total | $40,425 | $35,456 |
Family Income in New Madrid
Family Income Brackets in New Madrid
According to the New Madrid family income data, there are 201 families falling into the $50,000 to $74,999 income range, which is the most common income bracket and makes up 32.0% of all families.
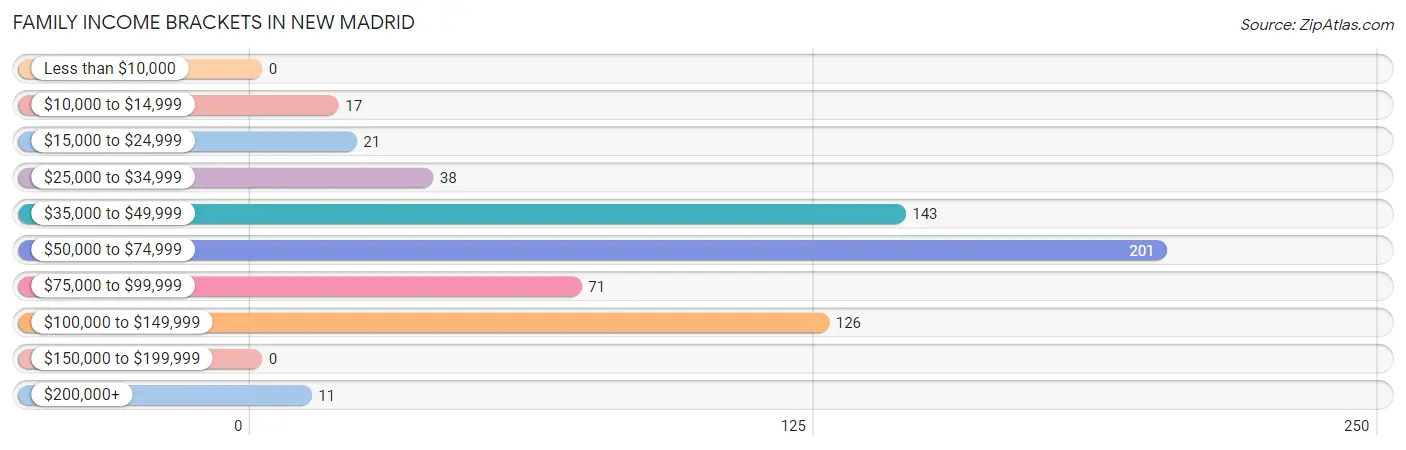
| Income Bracket | # Families | % Families |
| Less than $10,000 | 0 | 0.0% |
| $10,000 to $14,999 | 17 | 2.7% |
| $15,000 to $24,999 | 21 | 3.3% |
| $25,000 to $34,999 | 38 | 6.1% |
| $35,000 to $49,999 | 143 | 22.8% |
| $50,000 to $74,999 | 201 | 32.0% |
| $75,000 to $99,999 | 71 | 11.3% |
| $100,000 to $149,999 | 126 | 20.1% |
| $150,000 to $199,999 | 0 | 0.0% |
| $200,000+ | 11 | 1.8% |
Family Income by Famaliy Size in New Madrid
3-person families (133 | 21.2%) account for the highest median family income in New Madrid with $75,729 per family, while 2-person families (289 | 46.0%) have the highest median income of $30,090 per family member.
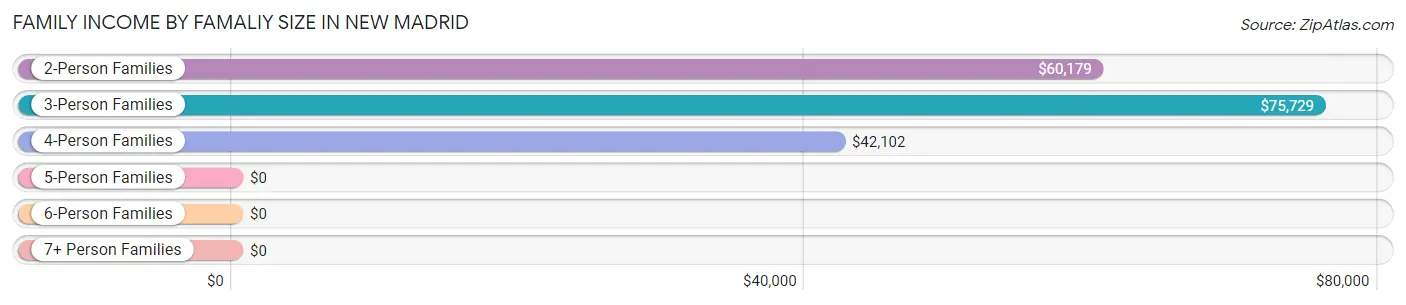
| Income Bracket | # Families | Median Income |
| 2-Person Families | 289 (46.0%) | $60,179 |
| 3-Person Families | 133 (21.2%) | $75,729 |
| 4-Person Families | 145 (23.1%) | $42,102 |
| 5-Person Families | 41 (6.5%) | $0 |
| 6-Person Families | 20 (3.2%) | $0 |
| 7+ Person Families | 0 (0.0%) | $0 |
| Total | 628 (100.0%) | $59,458 |
Family Income by Number of Earners in New Madrid
The median family income in New Madrid is $59,458, with families comprising 3+ earners (71) having the highest median family income of $95,795, while families with 1 earner (225) have the lowest median family income of $40,114, accounting for 11.3% and 35.8% of families, respectively.
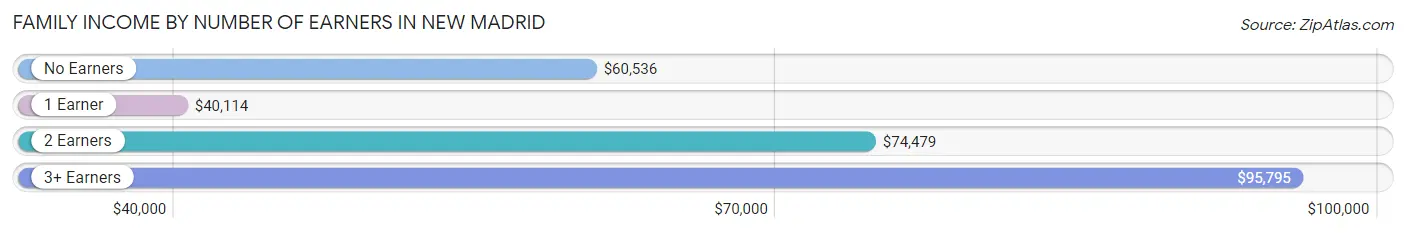
| Number of Earners | # Families | Median Income |
| No Earners | 111 (17.7%) | $60,536 |
| 1 Earner | 225 (35.8%) | $40,114 |
| 2 Earners | 221 (35.2%) | $74,479 |
| 3+ Earners | 71 (11.3%) | $95,795 |
| Total | 628 (100.0%) | $59,458 |
Household Income in New Madrid
Household Income Brackets in New Madrid
With 288 households falling in the category, the $50,000 to $74,999 income range is the most frequent in New Madrid, accounting for 24.5% of all households.
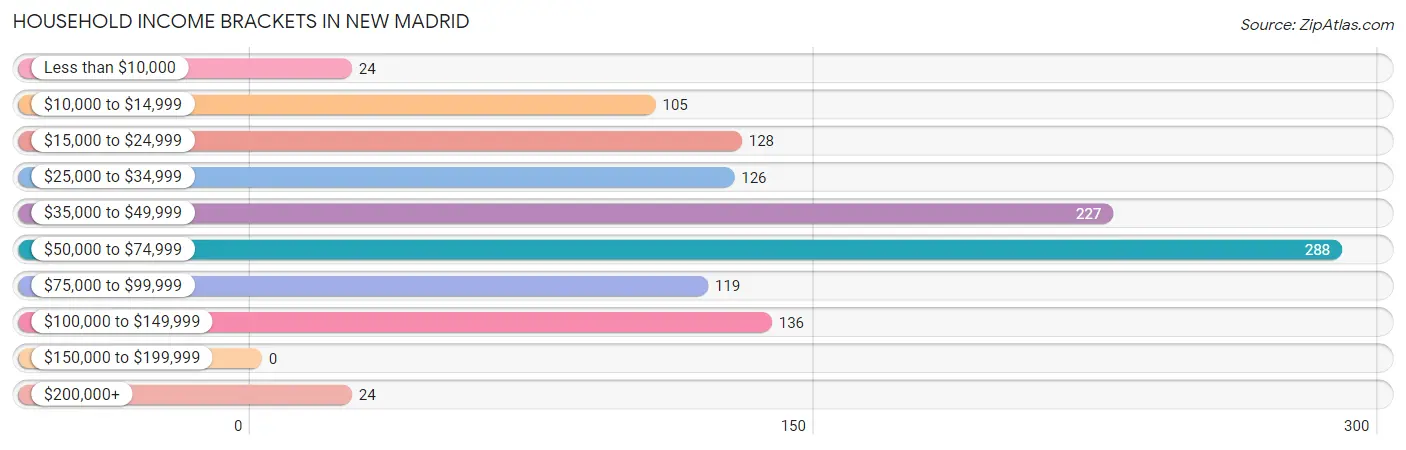
| Income Bracket | # Households | % Households |
| Less than $10,000 | 24 | 2.0% |
| $10,000 to $14,999 | 105 | 8.9% |
| $15,000 to $24,999 | 128 | 10.9% |
| $25,000 to $34,999 | 126 | 10.7% |
| $35,000 to $49,999 | 227 | 19.3% |
| $50,000 to $74,999 | 288 | 24.5% |
| $75,000 to $99,999 | 119 | 10.1% |
| $100,000 to $149,999 | 136 | 11.6% |
| $150,000 to $199,999 | 0 | 0.0% |
| $200,000+ | 24 | 2.0% |
Household Income by Householder Age in New Madrid
The median household income in New Madrid is $42,443, with the highest median household income of $60,000 found in the 45 to 64 years age bracket for the primary householder. A total of 364 households (31.0%) fall into this category. Meanwhile, the 15 to 24 years age bracket for the primary householder has the lowest median household income of $31,815, with 75 households (6.4%) in this group.
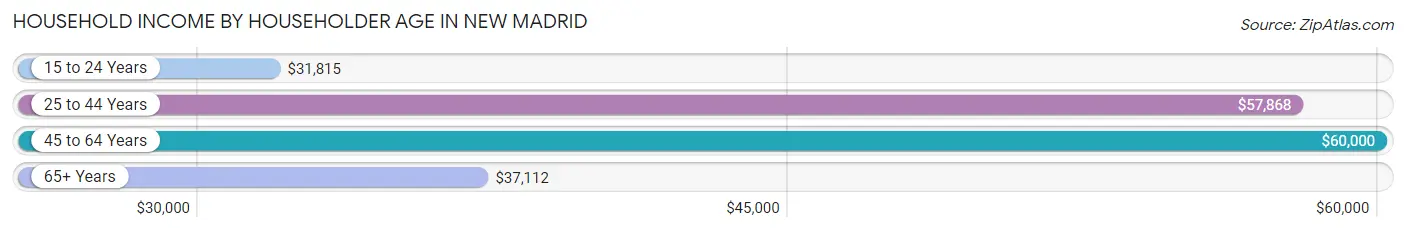
| Income Bracket | # Households | Median Income |
| 15 to 24 Years | 75 (6.4%) | $31,815 |
| 25 to 44 Years | 315 (26.8%) | $57,868 |
| 45 to 64 Years | 364 (31.0%) | $60,000 |
| 65+ Years | 421 (35.8%) | $37,112 |
| Total | 1,175 (100.0%) | $42,443 |
Poverty in New Madrid
Income Below Poverty by Sex and Age in New Madrid
With 8.8% poverty level for males and 10.0% for females among the residents of New Madrid, 65 to 74 year old males and 55 to 64 year old females are the most vulnerable to poverty, with 82 males (39.6%) and 40 females (61.5%) in their respective age groups living below the poverty level.
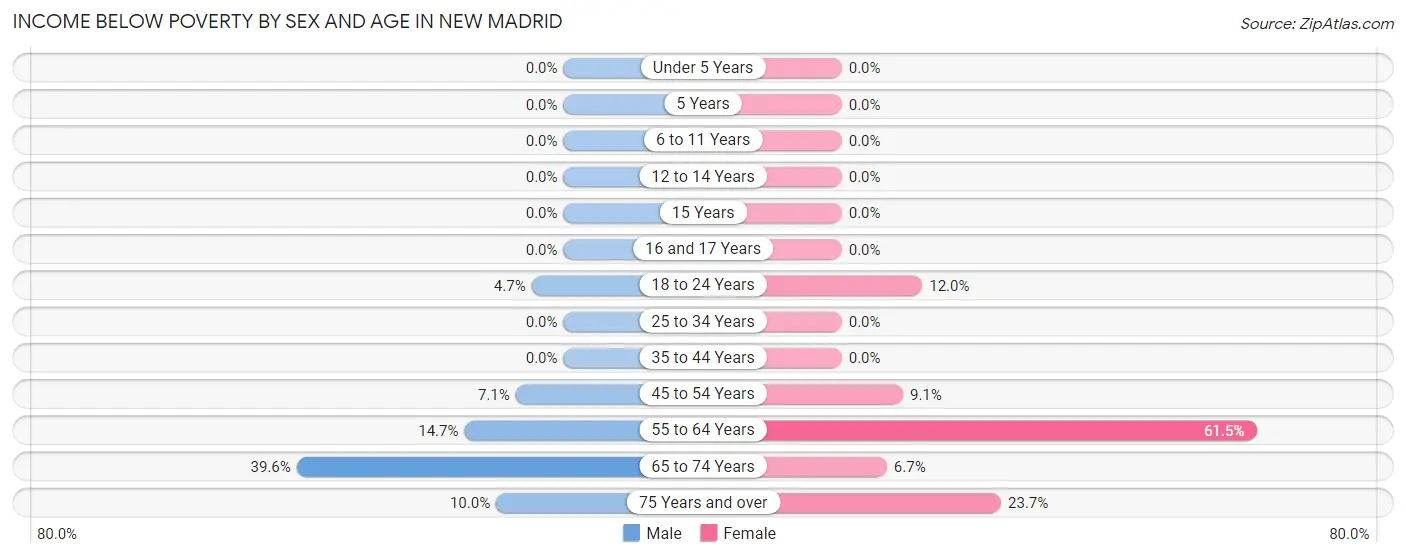
| Age Bracket | Male | Female |
| Under 5 Years | 0 (0.0%) | 0 (0.0%) |
| 5 Years | 0 (0.0%) | 0 (0.0%) |
| 6 to 11 Years | 0 (0.0%) | 0 (0.0%) |
| 12 to 14 Years | 0 (0.0%) | 0 (0.0%) |
| 15 Years | 0 (0.0%) | 0 (0.0%) |
| 16 and 17 Years | 0 (0.0%) | 0 (0.0%) |
| 18 to 24 Years | 7 (4.7%) | 19 (11.9%) |
| 25 to 34 Years | 0 (0.0%) | 0 (0.0%) |
| 35 to 44 Years | 0 (0.0%) | 0 (0.0%) |
| 45 to 54 Years | 12 (7.1%) | 20 (9.1%) |
| 55 to 64 Years | 20 (14.7%) | 40 (61.5%) |
| 65 to 74 Years | 82 (39.6%) | 15 (6.7%) |
| 75 Years and over | 7 (10.0%) | 22 (23.7%) |
| Total | 128 (8.8%) | 116 (10.0%) |
Income Above Poverty by Sex and Age in New Madrid
According to the poverty statistics in New Madrid, males aged under 5 years and females aged under 5 years are the age groups that are most secure financially, with 100.0% of males and 100.0% of females in these age groups living above the poverty line.
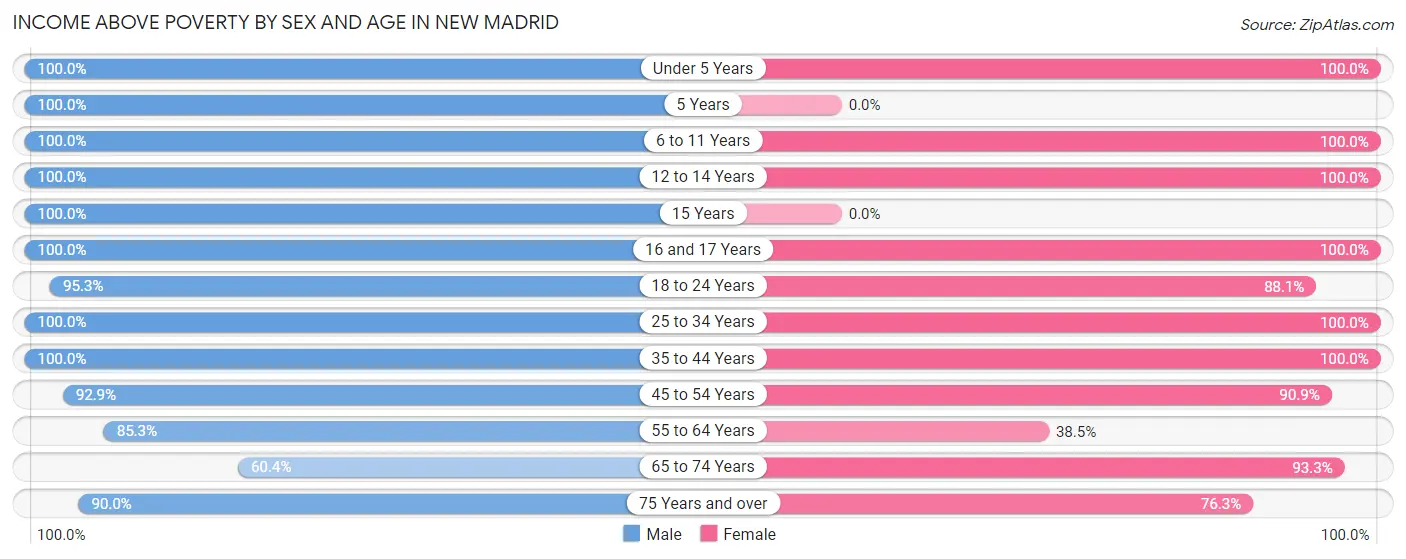
| Age Bracket | Male | Female |
| Under 5 Years | 136 (100.0%) | 38 (100.0%) |
| 5 Years | 6 (100.0%) | 0 (0.0%) |
| 6 to 11 Years | 132 (100.0%) | 75 (100.0%) |
| 12 to 14 Years | 10 (100.0%) | 40 (100.0%) |
| 15 Years | 9 (100.0%) | 0 (0.0%) |
| 16 and 17 Years | 62 (100.0%) | 6 (100.0%) |
| 18 to 24 Years | 141 (95.3%) | 140 (88.0%) |
| 25 to 34 Years | 138 (100.0%) | 152 (100.0%) |
| 35 to 44 Years | 233 (100.0%) | 92 (100.0%) |
| 45 to 54 Years | 157 (92.9%) | 200 (90.9%) |
| 55 to 64 Years | 116 (85.3%) | 25 (38.5%) |
| 65 to 74 Years | 125 (60.4%) | 209 (93.3%) |
| 75 Years and over | 63 (90.0%) | 71 (76.3%) |
| Total | 1,328 (91.2%) | 1,048 (90.0%) |
Income Below Poverty Among Married-Couple Families in New Madrid
The poverty statistics for married-couple families in New Madrid show that 3.3% or 12 of the total 364 families live below the poverty line. Families with no children have the highest poverty rate of 5.9%, comprising of 12 families. On the other hand, families with 1 or 2 children have the lowest poverty rate of 0.0%, which includes 0 families.
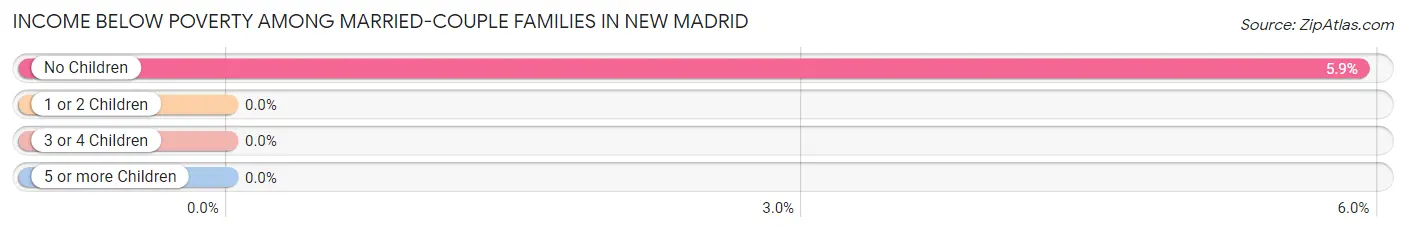
| Children | Above Poverty | Below Poverty |
| No Children | 191 (94.1%) | 12 (5.9%) |
| 1 or 2 Children | 141 (100.0%) | 0 (0.0%) |
| 3 or 4 Children | 20 (100.0%) | 0 (0.0%) |
| 5 or more Children | 0 (0.0%) | 0 (0.0%) |
| Total | 352 (96.7%) | 12 (3.3%) |
Income Below Poverty Among Single-Parent Households in New Madrid
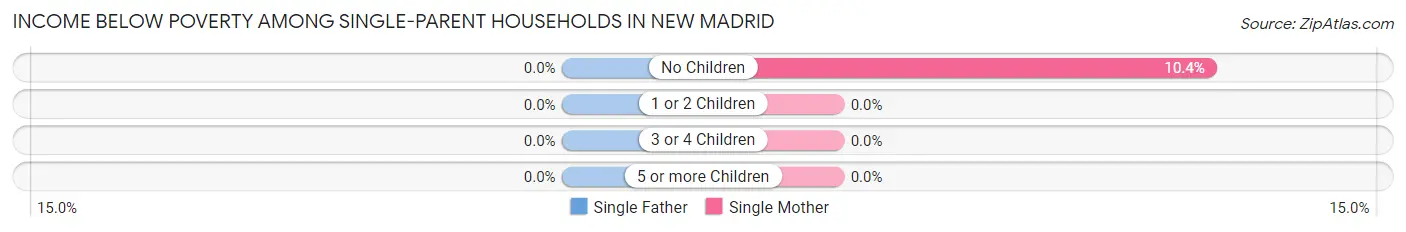
| Children | Single Father | Single Mother |
| No Children | 0 (0.0%) | 5 (10.4%) |
| 1 or 2 Children | 0 (0.0%) | 0 (0.0%) |
| 3 or 4 Children | 0 (0.0%) | 0 (0.0%) |
| 5 or more Children | 0 (0.0%) | 0 (0.0%) |
| Total | 0 (0.0%) | 5 (3.2%) |
Income Below Poverty Among Married-Couple vs Single-Parent Households in New Madrid
The poverty data for New Madrid shows that 12 of the married-couple family households (3.3%) and 5 of the single-parent households (1.9%) are living below the poverty level. Within the married-couple family households, those with no children have the highest poverty rate, with 12 households (5.9%) falling below the poverty line. Among the single-parent households, those with no children have the highest poverty rate, with 5 household (4.1%) living below poverty.
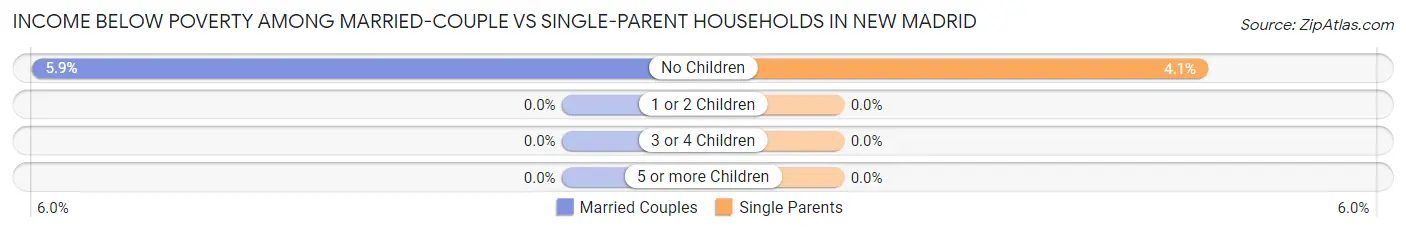
| Children | Married-Couple Families | Single-Parent Households |
| No Children | 12 (5.9%) | 5 (4.1%) |
| 1 or 2 Children | 0 (0.0%) | 0 (0.0%) |
| 3 or 4 Children | 0 (0.0%) | 0 (0.0%) |
| 5 or more Children | 0 (0.0%) | 0 (0.0%) |
| Total | 12 (3.3%) | 5 (1.9%) |
Race in New Madrid
The most populous races in New Madrid are White / Caucasian (2,045 | 74.1%), Black / African American (522 | 18.9%), and Two or more Races (186 | 6.7%).
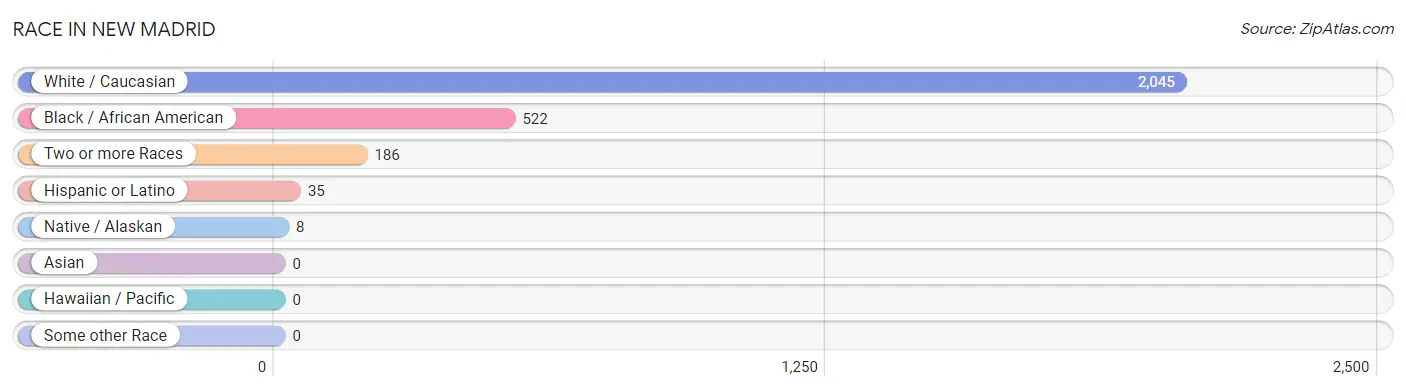
| Race | # Population | % Population |
| Asian | 0 | 0.0% |
| Black / African American | 522 | 18.9% |
| Hawaiian / Pacific | 0 | 0.0% |
| Hispanic or Latino | 35 | 1.3% |
| Native / Alaskan | 8 | 0.3% |
| White / Caucasian | 2,045 | 74.1% |
| Two or more Races | 186 | 6.7% |
| Some other Race | 0 | 0.0% |
| Total | 2,761 | 100.0% |
Ancestry in New Madrid
The most populous ancestries reported in New Madrid are Irish (620 | 22.5%), German (328 | 11.9%), English (296 | 10.7%), American (137 | 5.0%), and Italian (122 | 4.4%), together accounting for 54.4% of all New Madrid residents.
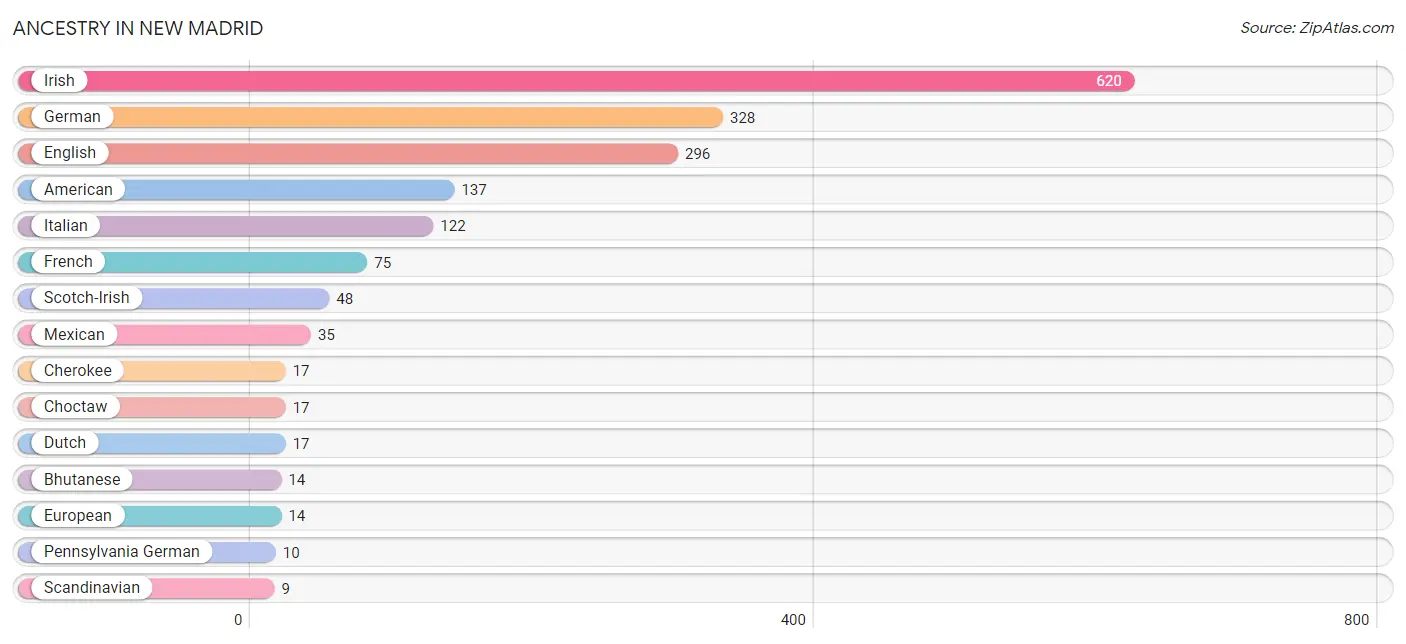
| Ancestry | # Population | % Population |
| American | 137 | 5.0% |
| Austrian | 8 | 0.3% |
| Bhutanese | 14 | 0.5% |
| Cherokee | 17 | 0.6% |
| Choctaw | 17 | 0.6% |
| Czechoslovakian | 8 | 0.3% |
| Dutch | 17 | 0.6% |
| English | 296 | 10.7% |
| European | 14 | 0.5% |
| French | 75 | 2.7% |
| French Canadian | 8 | 0.3% |
| German | 328 | 11.9% |
| Irish | 620 | 22.5% |
| Italian | 122 | 4.4% |
| Kiowa | 8 | 0.3% |
| Mexican | 35 | 1.3% |
| Pennsylvania German | 10 | 0.4% |
| Scandinavian | 9 | 0.3% |
| Scotch-Irish | 48 | 1.7% | View All 19 Rows |
Immigrants in New Madrid
The most numerous immigrant groups reported in New Madrid came from Europe (8 | 0.3%), Germany (8 | 0.3%), and Western Europe (8 | 0.3%), together accounting for 0.9% of all New Madrid residents.
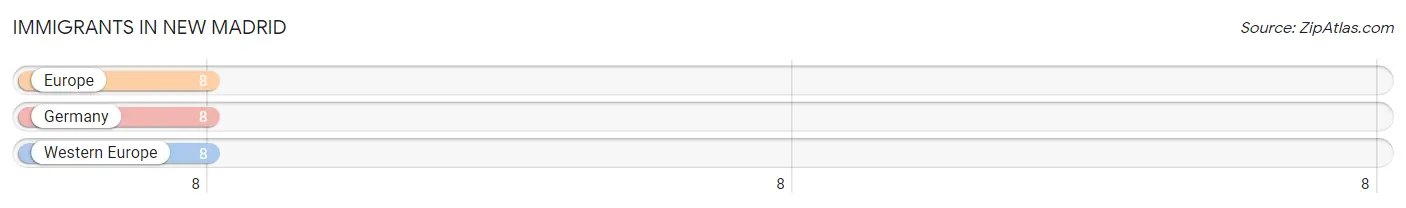
| Immigration Origin | # Population | % Population |
| Europe | 8 | 0.3% |
| Germany | 8 | 0.3% |
| Western Europe | 8 | 0.3% | View All 3 Rows |
Sex and Age in New Madrid
Sex and Age in New Madrid
The most populous age groups in New Madrid are 65 to 69 Years (183 | 11.7%) for men and 70 to 74 Years (178 | 14.8%) for women.
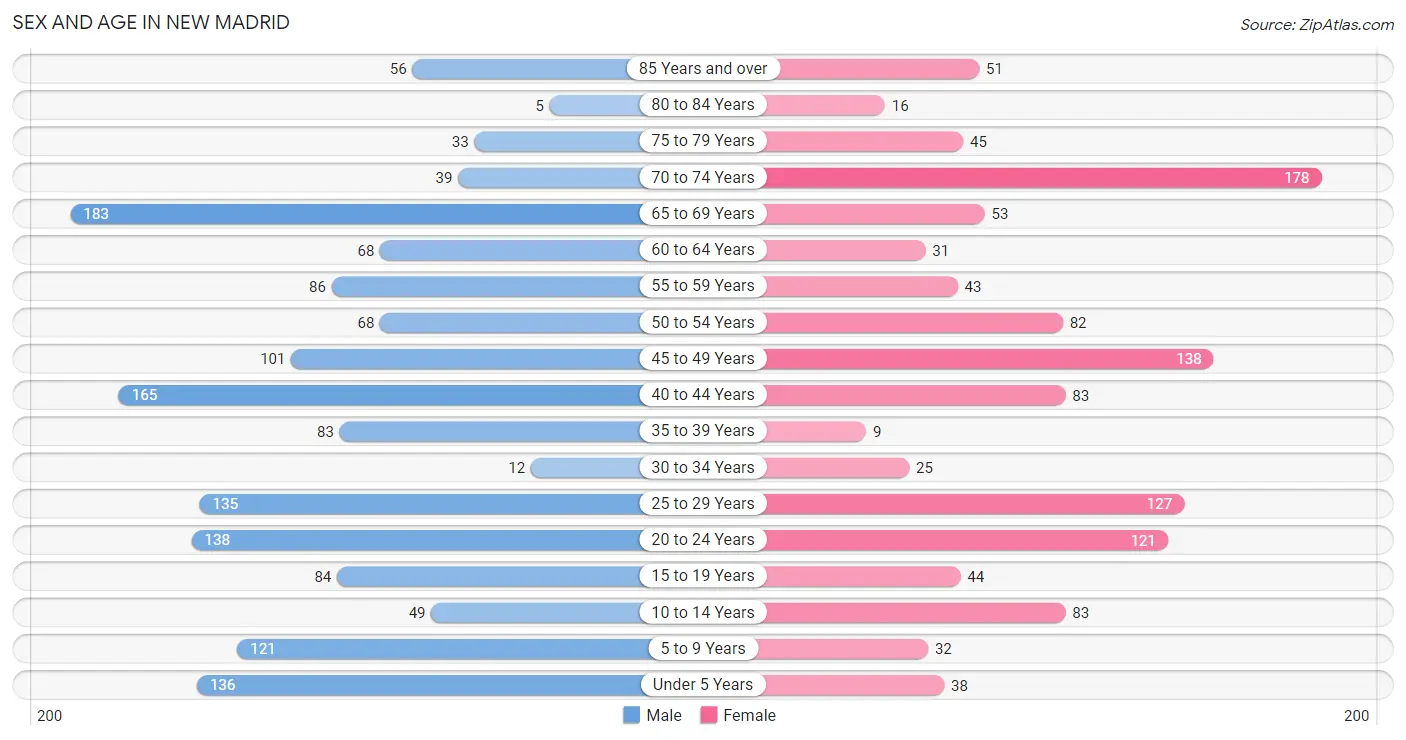
| Age Bracket | Male | Female |
| Under 5 Years | 136 (8.7%) | 38 (3.2%) |
| 5 to 9 Years | 121 (7.7%) | 32 (2.7%) |
| 10 to 14 Years | 49 (3.1%) | 83 (6.9%) |
| 15 to 19 Years | 84 (5.4%) | 44 (3.7%) |
| 20 to 24 Years | 138 (8.8%) | 121 (10.1%) |
| 25 to 29 Years | 135 (8.6%) | 127 (10.6%) |
| 30 to 34 Years | 12 (0.8%) | 25 (2.1%) |
| 35 to 39 Years | 83 (5.3%) | 9 (0.7%) |
| 40 to 44 Years | 165 (10.6%) | 83 (6.9%) |
| 45 to 49 Years | 101 (6.5%) | 138 (11.5%) |
| 50 to 54 Years | 68 (4.3%) | 82 (6.8%) |
| 55 to 59 Years | 86 (5.5%) | 43 (3.6%) |
| 60 to 64 Years | 68 (4.3%) | 31 (2.6%) |
| 65 to 69 Years | 183 (11.7%) | 53 (4.4%) |
| 70 to 74 Years | 39 (2.5%) | 178 (14.8%) |
| 75 to 79 Years | 33 (2.1%) | 45 (3.7%) |
| 80 to 84 Years | 5 (0.3%) | 16 (1.3%) |
| 85 Years and over | 56 (3.6%) | 51 (4.3%) |
| Total | 1,562 (100.0%) | 1,199 (100.0%) |
Families and Households in New Madrid
Median Family Size in New Madrid
The median family size in New Madrid is 2.99 persons per family, with married-couple families (364 | 58.0%) accounting for the largest median family size of 3.11 persons per family. On the other hand, single female/mother families (156 | 24.8%) represent the smallest median family size with 2.67 persons per family.
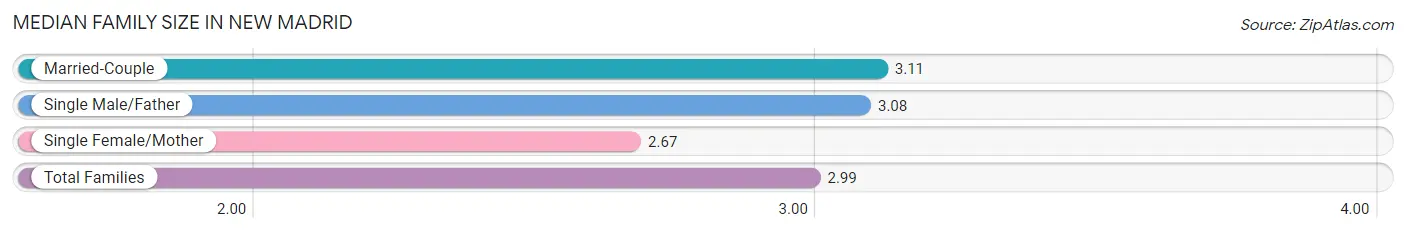
| Family Type | # Families | Family Size |
| Married-Couple | 364 (58.0%) | 3.11 |
| Single Male/Father | 108 (17.2%) | 3.08 |
| Single Female/Mother | 156 (24.8%) | 2.67 |
| Total Families | 628 (100.0%) | 2.99 |
Median Household Size in New Madrid
The median household size in New Madrid is 2.25 persons per household, with single male/father households (108 | 9.2%) accounting for the largest median household size of 3.2 persons per household. non-family households (547 | 46.6%) represent the smallest median household size with 1.31 persons per household.
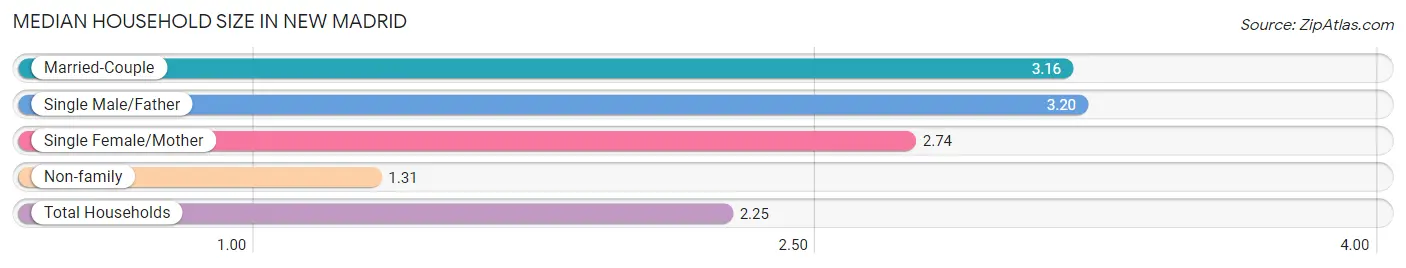
| Household Type | # Households | Household Size |
| Married-Couple | 364 (31.0%) | 3.16 |
| Single Male/Father | 108 (9.2%) | 3.20 |
| Single Female/Mother | 156 (13.3%) | 2.74 |
| Non-family | 547 (46.6%) | 1.31 |
| Total Households | 1,175 (100.0%) | 2.25 |
Household Size by Marriage Status in New Madrid
Out of a total of 1,175 households in New Madrid, 628 (53.4%) are family households, while 547 (46.6%) are nonfamily households. The most numerous type of family households are 2-person households, comprising 278, and the most common type of nonfamily households are 1-person households, comprising 501.
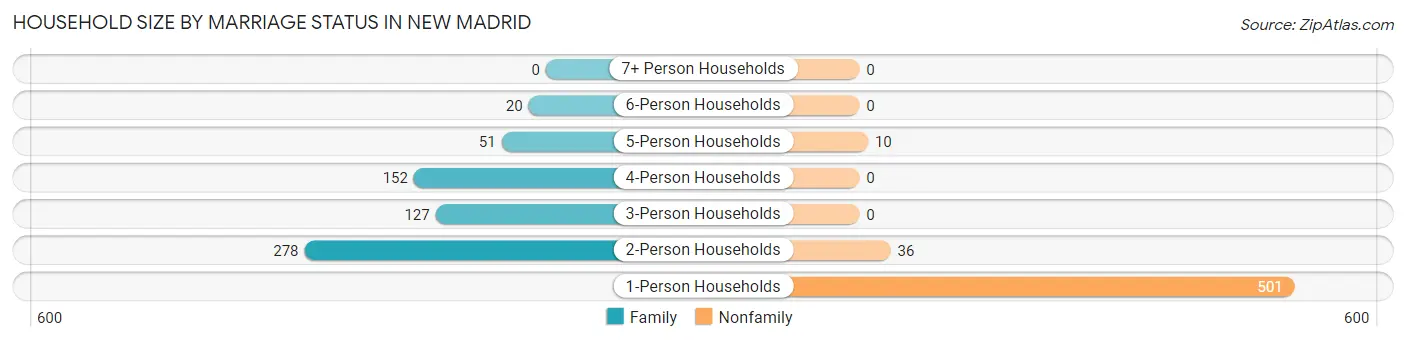
| Household Size | Family Households | Nonfamily Households |
| 1-Person Households | - | 501 (42.6%) |
| 2-Person Households | 278 (23.7%) | 36 (3.1%) |
| 3-Person Households | 127 (10.8%) | 0 (0.0%) |
| 4-Person Households | 152 (12.9%) | 0 (0.0%) |
| 5-Person Households | 51 (4.3%) | 10 (0.9%) |
| 6-Person Households | 20 (1.7%) | 0 (0.0%) |
| 7+ Person Households | 0 (0.0%) | 0 (0.0%) |
| Total | 628 (53.4%) | 547 (46.6%) |
Female Fertility in New Madrid
Fertility by Age in New Madrid
Average fertility rate in New Madrid is 120.0 births per 1,000 women. Women in the age bracket of 20 to 34 years have the highest fertility rate with 249.0 births per 1,000 women. Women in the age bracket of 20 to 34 years acount for 100.0% of all women with births.
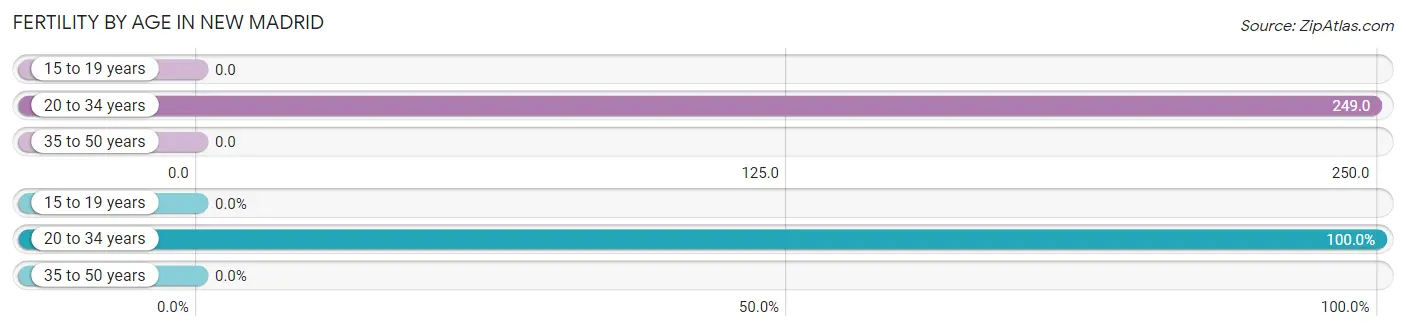
| Age Bracket | Women with Births | Births / 1,000 Women |
| 15 to 19 years | 0 (0.0%) | 0.0 |
| 20 to 34 years | 68 (100.0%) | 249.0 |
| 35 to 50 years | 0 (0.0%) | 0.0 |
| Total | 68 (100.0%) | 120.0 |
Fertility by Age by Marriage Status in New Madrid
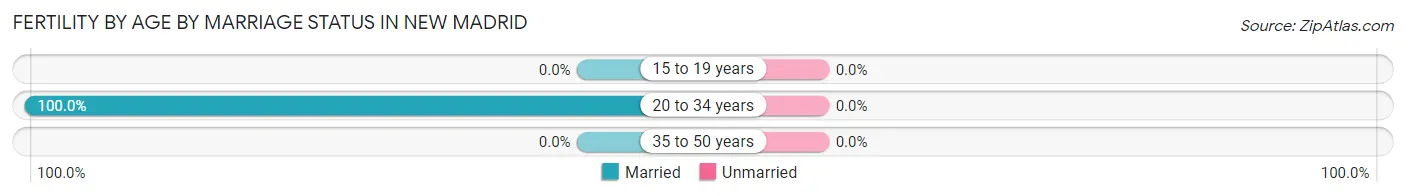
| Age Bracket | Married | Unmarried |
| 15 to 19 years | 0 (0.0%) | 0 (0.0%) |
| 20 to 34 years | 68 (100.0%) | 0 (0.0%) |
| 35 to 50 years | 0 (0.0%) | 0 (0.0%) |
| Total | 68 (100.0%) | 0 (0.0%) |
Fertility by Education in New Madrid
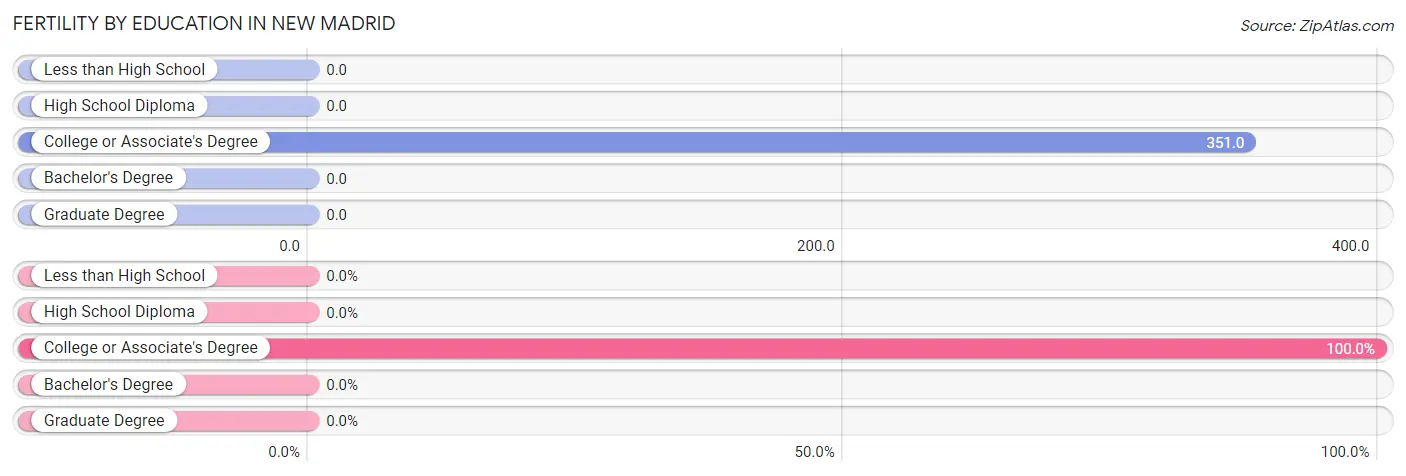
| Educational Attainment | Women with Births | Births / 1,000 Women |
| Less than High School | 0 (0.0%) | 0.0 |
| High School Diploma | 0 (0.0%) | 0.0 |
| College or Associate's Degree | 68 (100.0%) | 351.0 |
| Bachelor's Degree | 0 (0.0%) | 0.0 |
| Graduate Degree | 0 (0.0%) | 0.0 |
| Total | 68 (100.0%) | 120.0 |
Fertility by Education by Marriage Status in New Madrid
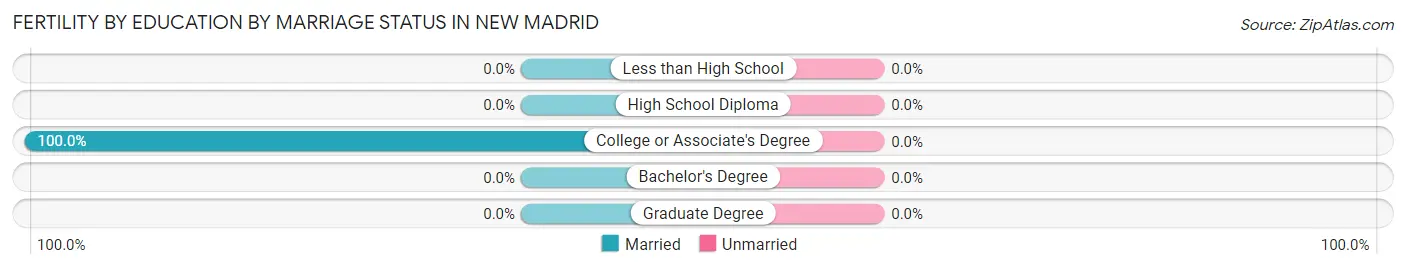
| Educational Attainment | Married | Unmarried |
| Less than High School | 0 (0.0%) | 0 (0.0%) |
| High School Diploma | 0 (0.0%) | 0 (0.0%) |
| College or Associate's Degree | 68 (100.0%) | 0 (0.0%) |
| Bachelor's Degree | 0 (0.0%) | 0 (0.0%) |
| Graduate Degree | 0 (0.0%) | 0 (0.0%) |
| Total | 68 (100.0%) | 0 (0.0%) |
Employment Characteristics in New Madrid
Employment by Class of Employer in New Madrid
Among the 1,037 employed individuals in New Madrid, private company employees (695 | 67.0%), local government employees (187 | 18.0%), and self-employed (not incorporated) (48 | 4.6%) make up the most common classes of employment.
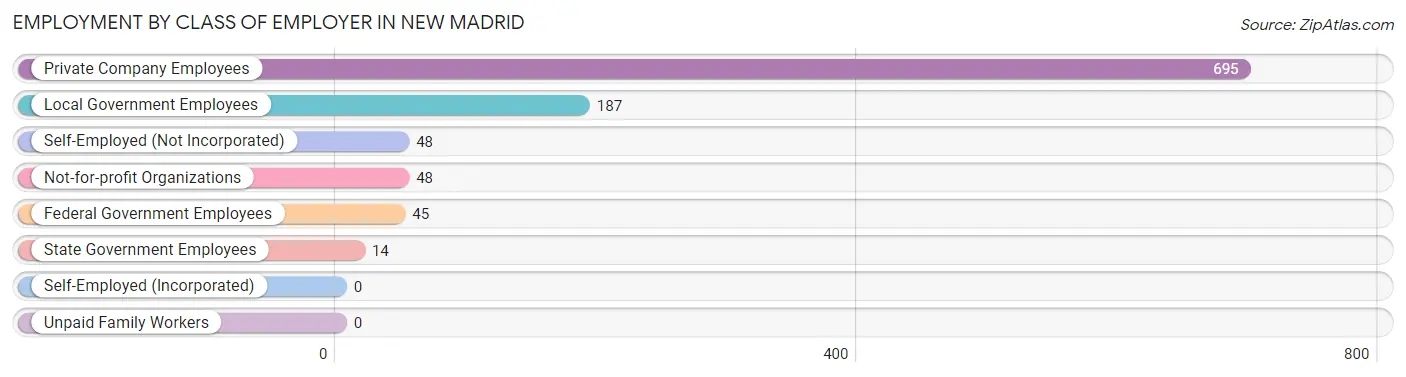
| Employer Class | # Employees | % Employees |
| Private Company Employees | 695 | 67.0% |
| Self-Employed (Incorporated) | 0 | 0.0% |
| Self-Employed (Not Incorporated) | 48 | 4.6% |
| Not-for-profit Organizations | 48 | 4.6% |
| Local Government Employees | 187 | 18.0% |
| State Government Employees | 14 | 1.3% |
| Federal Government Employees | 45 | 4.3% |
| Unpaid Family Workers | 0 | 0.0% |
| Total | 1,037 | 100.0% |
Employment Status by Age in New Madrid
According to the labor force statistics for New Madrid, out of the total population over 16 years of age (2,290), 48.2% or 1,104 individuals are in the labor force, with 2.3% or 25 of them unemployed. The age group with the highest labor force participation rate is 30 to 34 years, with 100.0% or 37 individuals in the labor force. Within the labor force, the 16 to 19 years age range has the highest percentage of unemployed individuals, with 9.0% or 6 of them being unemployed.
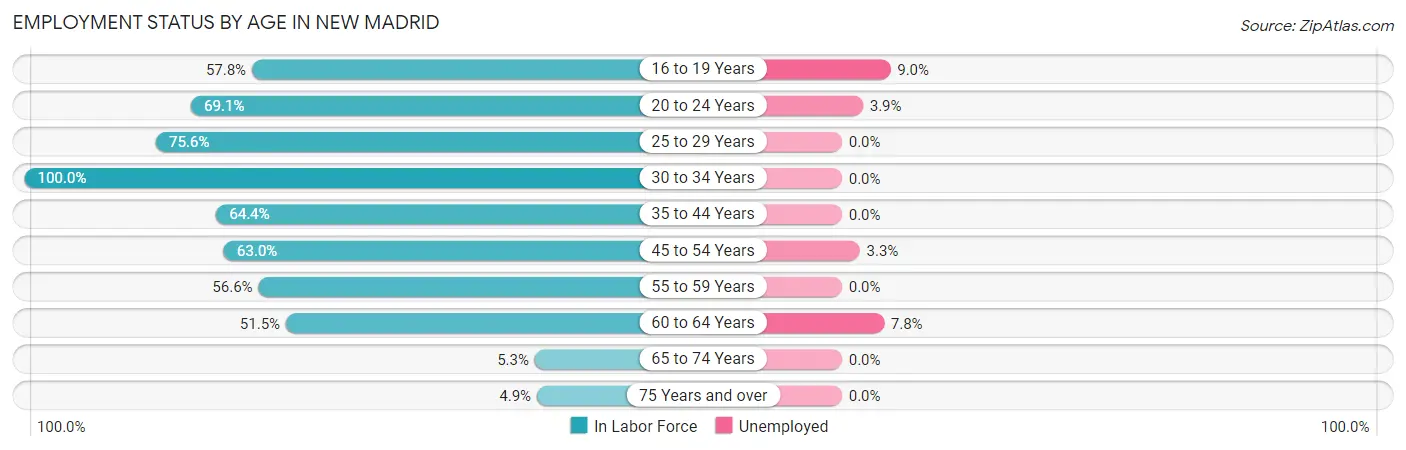
| Age Bracket | In Labor Force | Unemployed |
| 16 to 19 Years | 67 (57.8%) | 6 (9.0%) |
| 20 to 24 Years | 179 (69.1%) | 7 (3.9%) |
| 25 to 29 Years | 198 (75.6%) | 0 (0.0%) |
| 30 to 34 Years | 37 (100.0%) | 0 (0.0%) |
| 35 to 44 Years | 219 (64.4%) | 0 (0.0%) |
| 45 to 54 Years | 245 (63.0%) | 8 (3.3%) |
| 55 to 59 Years | 73 (56.6%) | 0 (0.0%) |
| 60 to 64 Years | 51 (51.5%) | 4 (7.8%) |
| 65 to 74 Years | 24 (5.3%) | 0 (0.0%) |
| 75 Years and over | 10 (4.9%) | 0 (0.0%) |
| Total | 1,104 (48.2%) | 25 (2.3%) |
Employment Status by Educational Attainment in New Madrid
According to labor force statistics for New Madrid, 65.5% of individuals (823) out of the total population between 25 and 64 years of age (1,256) are in the labor force, with 1.5% or 12 of them being unemployed. The group with the highest labor force participation rate are those with the educational attainment of bachelor's degree or higher, with 87.0% or 114 individuals in the labor force. Within the labor force, individuals with college / associate degree education have the highest percentage of unemployment, with 4.9% or 12 of them being unemployed.
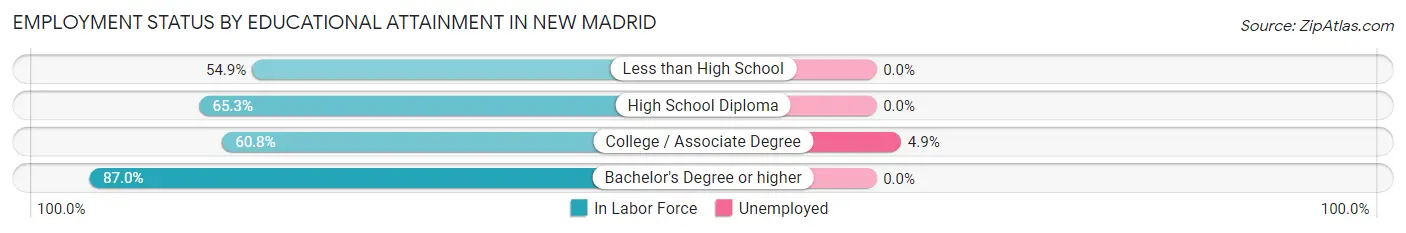
| Educational Attainment | In Labor Force | Unemployed |
| Less than High School | 39 (54.9%) | 0 (0.0%) |
| High School Diploma | 423 (65.3%) | 0 (0.0%) |
| College / Associate Degree | 247 (60.8%) | 20 (4.9%) |
| Bachelor's Degree or higher | 114 (87.0%) | 0 (0.0%) |
| Total | 823 (65.5%) | 19 (1.5%) |
Employment Occupations by Sex in New Madrid
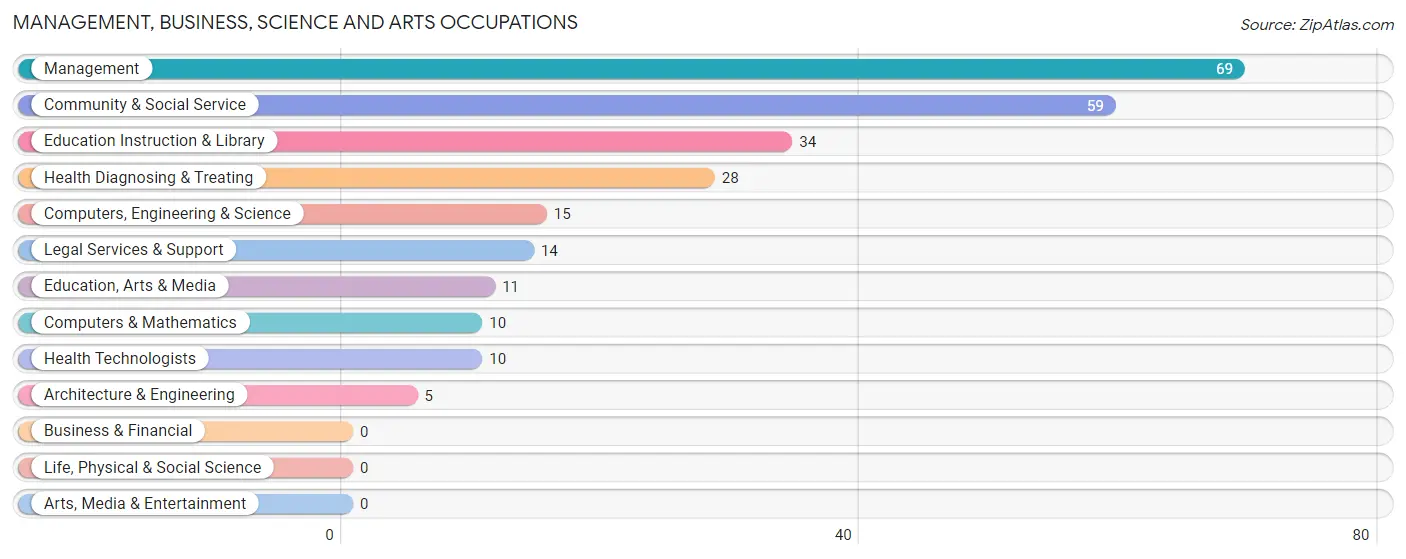
Management, Business, Science and Arts Occupations
The most common Management, Business, Science and Arts occupations in New Madrid are Management (69 | 6.4%), Community & Social Service (59 | 5.5%), Education Instruction & Library (34 | 3.2%), Health Diagnosing & Treating (28 | 2.6%), and Computers, Engineering & Science (15 | 1.4%).
Management, Business, Science and Arts Occupations by Sex
Within the Management, Business, Science and Arts occupations in New Madrid, the most male-oriented occupations are Computers, Engineering & Science (100.0%), Computers & Mathematics (100.0%), and Architecture & Engineering (100.0%), while the most female-oriented occupations are Education, Arts & Media (100.0%), Health Diagnosing & Treating (100.0%), and Health Technologists (100.0%).
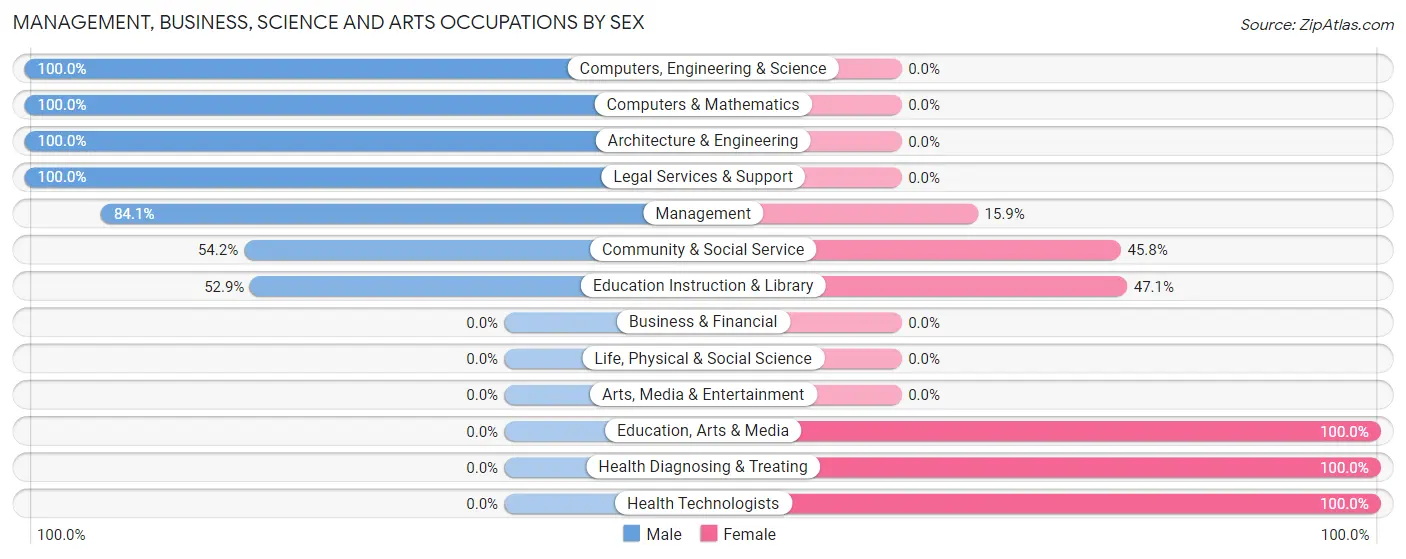
| Occupation | Male | Female |
| Management | 58 (84.1%) | 11 (15.9%) |
| Business & Financial | 0 (0.0%) | 0 (0.0%) |
| Computers, Engineering & Science | 15 (100.0%) | 0 (0.0%) |
| Computers & Mathematics | 10 (100.0%) | 0 (0.0%) |
| Architecture & Engineering | 5 (100.0%) | 0 (0.0%) |
| Life, Physical & Social Science | 0 (0.0%) | 0 (0.0%) |
| Community & Social Service | 32 (54.2%) | 27 (45.8%) |
| Education, Arts & Media | 0 (0.0%) | 11 (100.0%) |
| Legal Services & Support | 14 (100.0%) | 0 (0.0%) |
| Education Instruction & Library | 18 (52.9%) | 16 (47.1%) |
| Arts, Media & Entertainment | 0 (0.0%) | 0 (0.0%) |
| Health Diagnosing & Treating | 0 (0.0%) | 28 (100.0%) |
| Health Technologists | 0 (0.0%) | 10 (100.0%) |
| Total (Category) | 105 (61.4%) | 66 (38.6%) |
| Total (Overall) | 572 (53.1%) | 506 (46.9%) |
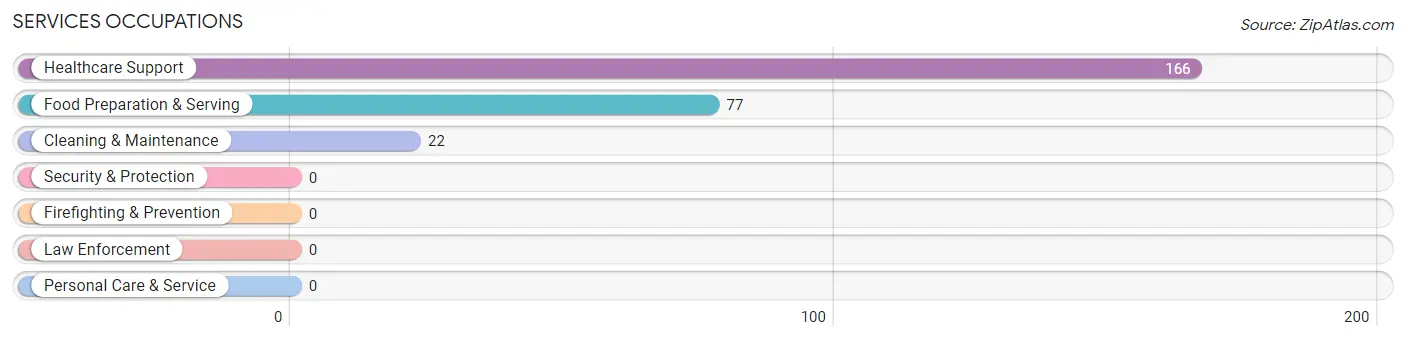
Services Occupations
The most common Services occupations in New Madrid are Healthcare Support (166 | 15.4%), Food Preparation & Serving (77 | 7.1%), and Cleaning & Maintenance (22 | 2.0%).
Services Occupations by Sex
Within the Services occupations in New Madrid, the most male-oriented occupations are Cleaning & Maintenance (100.0%), and Healthcare Support (34.3%), while the most female-oriented occupations are Food Preparation & Serving (100.0%), and Healthcare Support (65.7%).
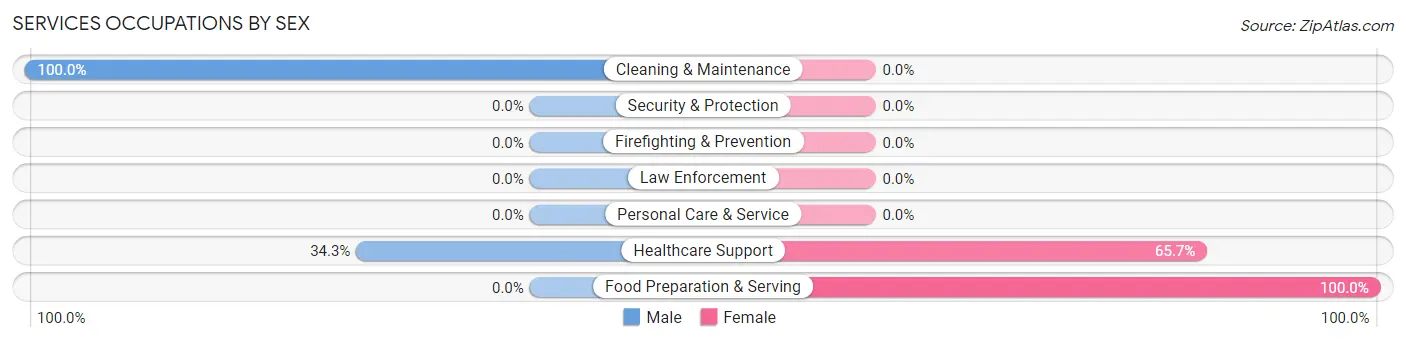
| Occupation | Male | Female |
| Healthcare Support | 57 (34.3%) | 109 (65.7%) |
| Security & Protection | 0 (0.0%) | 0 (0.0%) |
| Firefighting & Prevention | 0 (0.0%) | 0 (0.0%) |
| Law Enforcement | 0 (0.0%) | 0 (0.0%) |
| Food Preparation & Serving | 0 (0.0%) | 77 (100.0%) |
| Cleaning & Maintenance | 22 (100.0%) | 0 (0.0%) |
| Personal Care & Service | 0 (0.0%) | 0 (0.0%) |
| Total (Category) | 79 (29.8%) | 186 (70.2%) |
| Total (Overall) | 572 (53.1%) | 506 (46.9%) |
Sales and Office Occupations
The most common Sales and Office occupations in New Madrid are Office & Administration (171 | 15.9%), and Sales & Related (125 | 11.6%).

Sales and Office Occupations by Sex

| Occupation | Male | Female |
| Sales & Related | 74 (59.2%) | 51 (40.8%) |
| Office & Administration | 19 (11.1%) | 152 (88.9%) |
| Total (Category) | 93 (31.4%) | 203 (68.6%) |
| Total (Overall) | 572 (53.1%) | 506 (46.9%) |
Natural Resources, Construction and Maintenance Occupations
The most common Natural Resources, Construction and Maintenance occupations in New Madrid are Installation, Maintenance & Repair (71 | 6.6%), Construction & Extraction (38 | 3.5%), and Farming, Fishing & Forestry (34 | 3.2%).
Natural Resources, Construction and Maintenance Occupations by Sex
| Occupation | Male | Female |
| Farming, Fishing & Forestry | 34 (100.0%) | 0 (0.0%) |
| Construction & Extraction | 38 (100.0%) | 0 (0.0%) |
| Installation, Maintenance & Repair | 45 (63.4%) | 26 (36.6%) |
| Total (Category) | 117 (81.8%) | 26 (18.2%) |
| Total (Overall) | 572 (53.1%) | 506 (46.9%) |
Production, Transportation and Moving Occupations
The most common Production, Transportation and Moving occupations in New Madrid are Production (106 | 9.8%), Material Moving (66 | 6.1%), and Transportation (31 | 2.9%).
Production, Transportation and Moving Occupations by Sex
| Occupation | Male | Female |
| Production | 95 (89.6%) | 11 (10.4%) |
| Transportation | 31 (100.0%) | 0 (0.0%) |
| Material Moving | 52 (78.8%) | 14 (21.2%) |
| Total (Category) | 178 (87.7%) | 25 (12.3%) |
| Total (Overall) | 572 (53.1%) | 506 (46.9%) |
Employment Industries by Sex in New Madrid
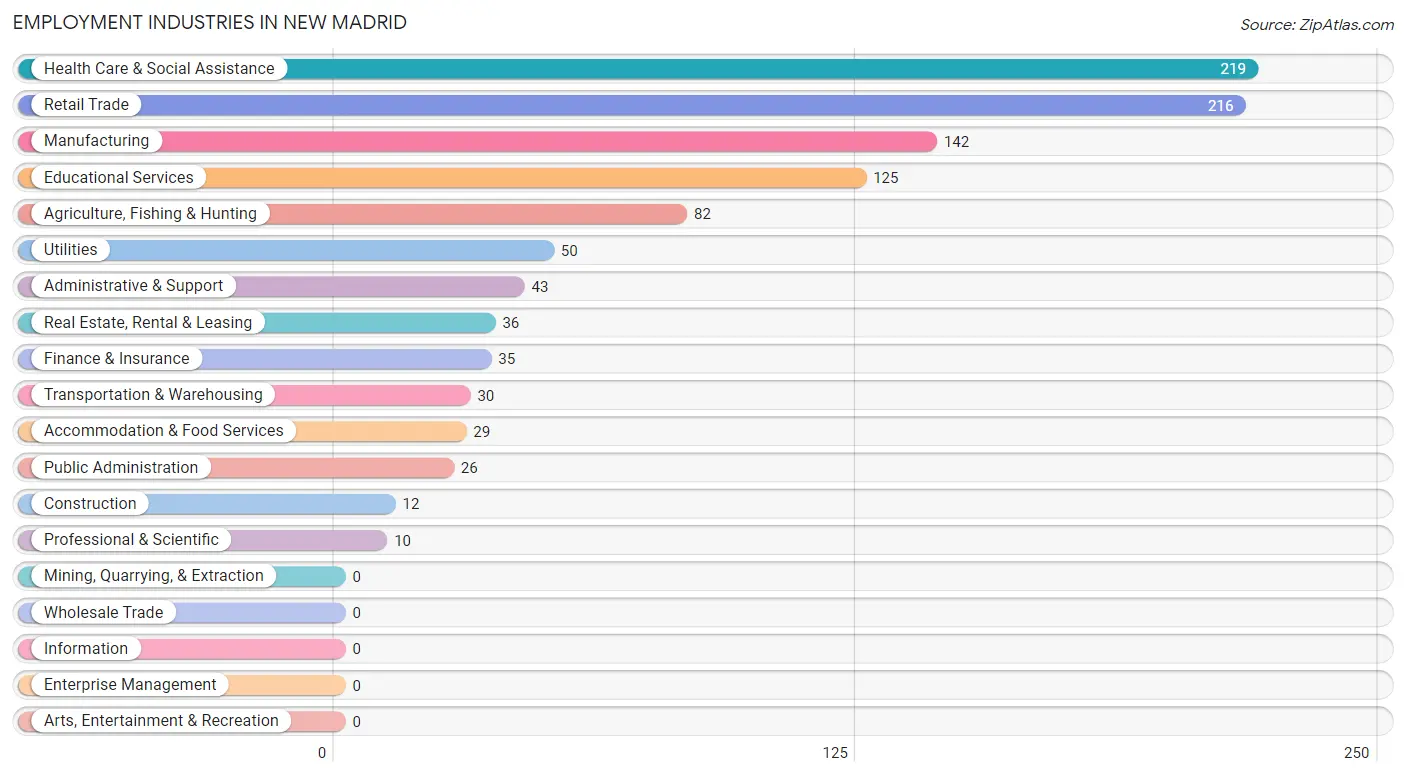
Employment Industries in New Madrid
The major employment industries in New Madrid include Health Care & Social Assistance (219 | 20.3%), Retail Trade (216 | 20.0%), Manufacturing (142 | 13.2%), Educational Services (125 | 11.6%), and Agriculture, Fishing & Hunting (82 | 7.6%).
Employment Industries by Sex in New Madrid
The New Madrid industries that see more men than women are Construction (100.0%), Transportation & Warehousing (100.0%), and Utilities (100.0%), whereas the industries that tend to have a higher number of women are Finance & Insurance (100.0%), Real Estate, Rental & Leasing (100.0%), and Accommodation & Food Services (100.0%).
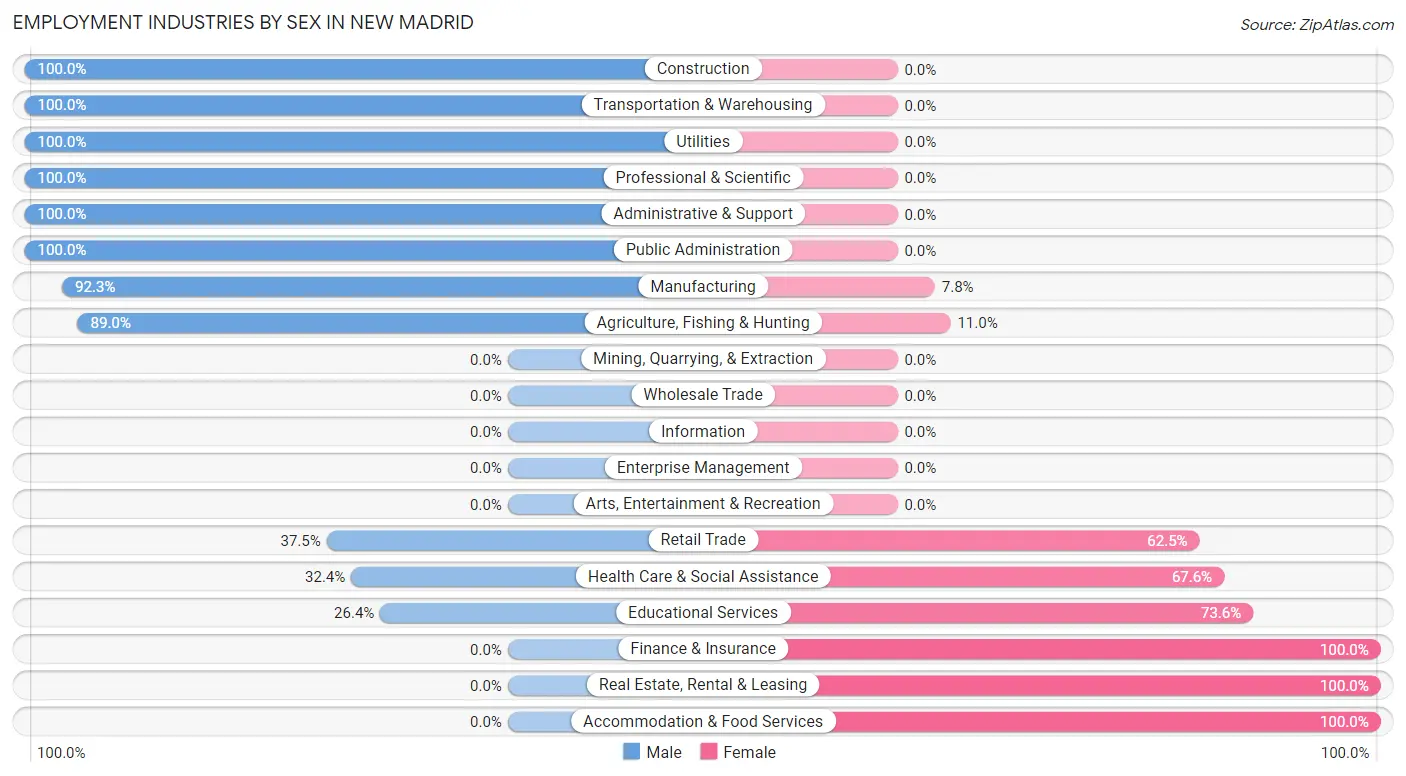
| Industry | Male | Female |
| Agriculture, Fishing & Hunting | 73 (89.0%) | 9 (11.0%) |
| Mining, Quarrying, & Extraction | 0 (0.0%) | 0 (0.0%) |
| Construction | 12 (100.0%) | 0 (0.0%) |
| Manufacturing | 131 (92.2%) | 11 (7.7%) |
| Wholesale Trade | 0 (0.0%) | 0 (0.0%) |
| Retail Trade | 81 (37.5%) | 135 (62.5%) |
| Transportation & Warehousing | 30 (100.0%) | 0 (0.0%) |
| Utilities | 50 (100.0%) | 0 (0.0%) |
| Information | 0 (0.0%) | 0 (0.0%) |
| Finance & Insurance | 0 (0.0%) | 35 (100.0%) |
| Real Estate, Rental & Leasing | 0 (0.0%) | 36 (100.0%) |
| Professional & Scientific | 10 (100.0%) | 0 (0.0%) |
| Enterprise Management | 0 (0.0%) | 0 (0.0%) |
| Administrative & Support | 43 (100.0%) | 0 (0.0%) |
| Educational Services | 33 (26.4%) | 92 (73.6%) |
| Health Care & Social Assistance | 71 (32.4%) | 148 (67.6%) |
| Arts, Entertainment & Recreation | 0 (0.0%) | 0 (0.0%) |
| Accommodation & Food Services | 0 (0.0%) | 29 (100.0%) |
| Public Administration | 26 (100.0%) | 0 (0.0%) |
| Total | 572 (53.1%) | 506 (46.9%) |
Education in New Madrid
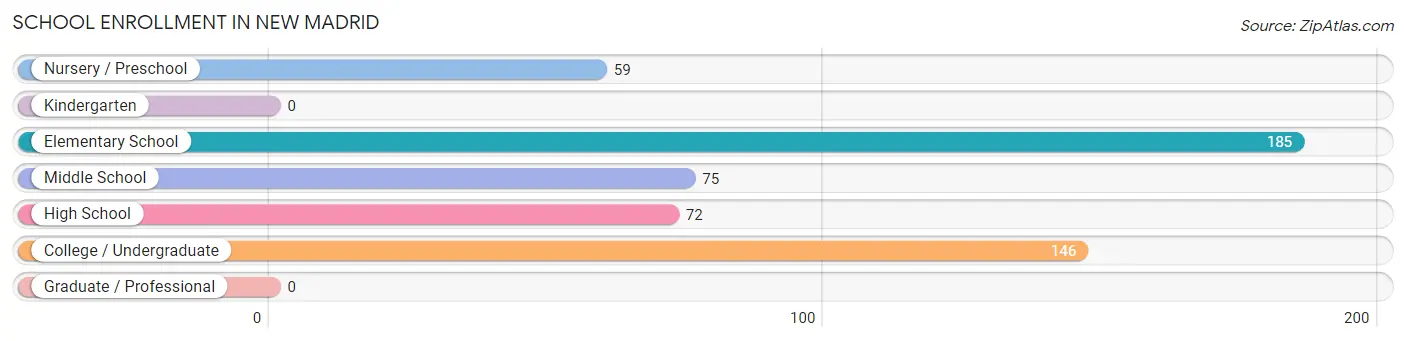
School Enrollment in New Madrid
The most common levels of schooling among the 537 students in New Madrid are elementary school (185 | 34.4%), college / undergraduate (146 | 27.2%), and middle school (75 | 14.0%).
| School Level | # Students | % Students |
| Nursery / Preschool | 59 | 11.0% |
| Kindergarten | 0 | 0.0% |
| Elementary School | 185 | 34.4% |
| Middle School | 75 | 14.0% |
| High School | 72 | 13.4% |
| College / Undergraduate | 146 | 27.2% |
| Graduate / Professional | 0 | 0.0% |
| Total | 537 | 100.0% |
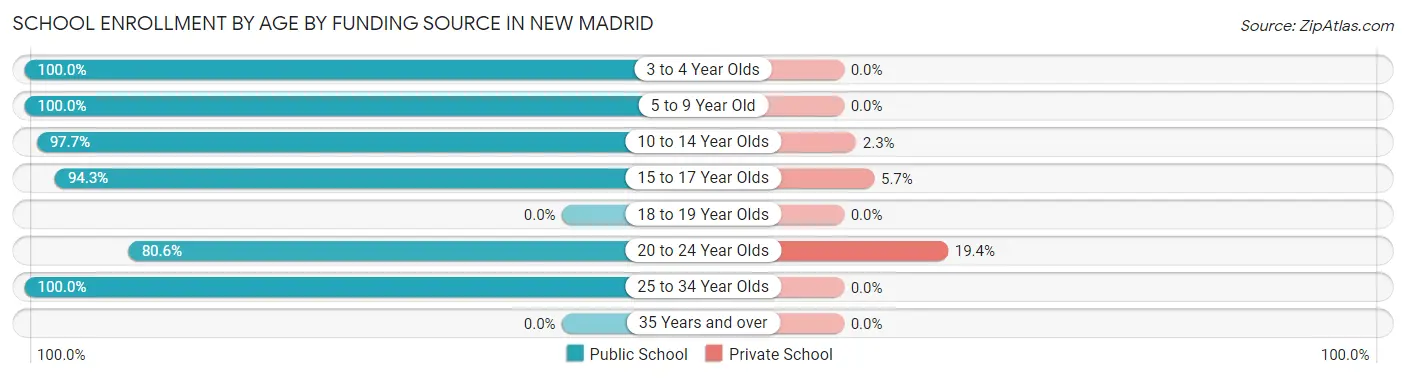
School Enrollment by Age by Funding Source in New Madrid
Out of a total of 537 students who are enrolled in schools in New Madrid, 32 (6.0%) attend a private institution, while the remaining 505 (94.0%) are enrolled in public schools. The age group of 20 to 24 year olds has the highest likelihood of being enrolled in private schools, with 26 (19.4% in the age bracket) enrolled. Conversely, the age group of 3 to 4 year olds has the lowest likelihood of being enrolled in a private school, with 53 (100.0% in the age bracket) attending a public institution.
| Age Bracket | Public School | Private School |
| 3 to 4 Year Olds | 53 (100.0%) | 0 (0.0%) |
| 5 to 9 Year Old | 153 (100.0%) | 0 (0.0%) |
| 10 to 14 Year Olds | 129 (97.7%) | 3 (2.3%) |
| 15 to 17 Year Olds | 50 (94.3%) | 3 (5.7%) |
| 18 to 19 Year Olds | 0 (0.0%) | 0 (0.0%) |
| 20 to 24 Year Olds | 108 (80.6%) | 26 (19.4%) |
| 25 to 34 Year Olds | 12 (100.0%) | 0 (0.0%) |
| 35 Years and over | 0 (0.0%) | 0 (0.0%) |
| Total | 505 (94.0%) | 32 (6.0%) |
Educational Attainment by Field of Study in New Madrid
Education (92 | 35.2%), business (32 | 12.3%), arts & humanities (26 | 10.0%), liberal arts & history (23 | 8.8%), and social sciences (22 | 8.4%) are the most common fields of study among 261 individuals in New Madrid who have obtained a bachelor's degree or higher.
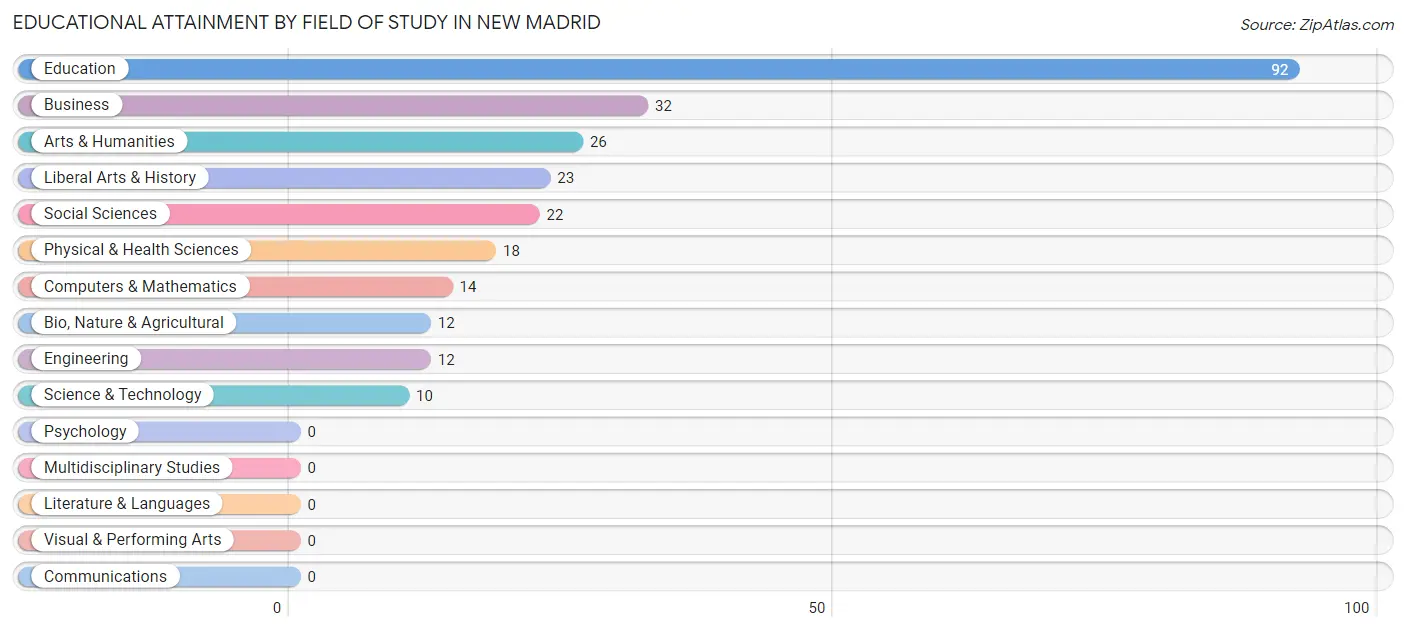
| Field of Study | # Graduates | % Graduates |
| Computers & Mathematics | 14 | 5.4% |
| Bio, Nature & Agricultural | 12 | 4.6% |
| Physical & Health Sciences | 18 | 6.9% |
| Psychology | 0 | 0.0% |
| Social Sciences | 22 | 8.4% |
| Engineering | 12 | 4.6% |
| Multidisciplinary Studies | 0 | 0.0% |
| Science & Technology | 10 | 3.8% |
| Business | 32 | 12.3% |
| Education | 92 | 35.2% |
| Literature & Languages | 0 | 0.0% |
| Liberal Arts & History | 23 | 8.8% |
| Visual & Performing Arts | 0 | 0.0% |
| Communications | 0 | 0.0% |
| Arts & Humanities | 26 | 10.0% |
| Total | 261 | 100.0% |
Transportation & Commute in New Madrid
Vehicle Availability by Sex in New Madrid
The most prevalent vehicle ownership categories in New Madrid are males with 2 vehicles (230, accounting for 40.2%) and females with 2 vehicles (121, making up 49.5%).
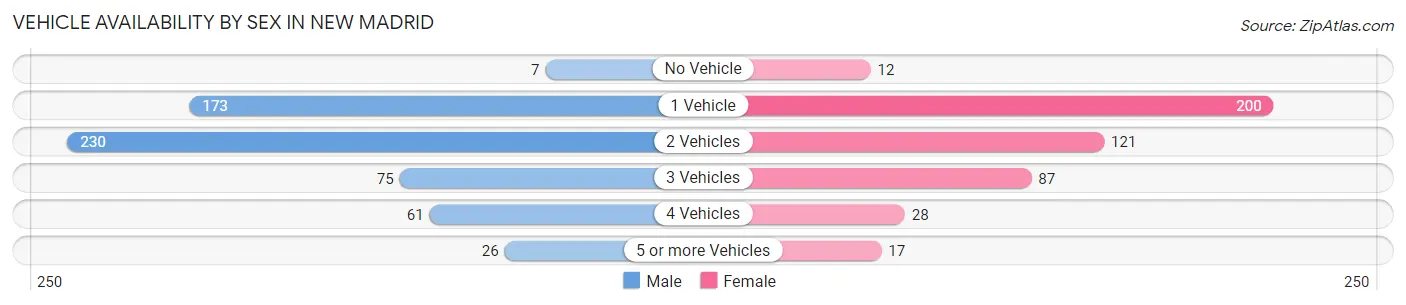
| Vehicles Available | Male | Female |
| No Vehicle | 7 (1.2%) | 12 (2.6%) |
| 1 Vehicle | 173 (30.2%) | 200 (43.0%) |
| 2 Vehicles | 230 (40.2%) | 121 (26.0%) |
| 3 Vehicles | 75 (13.1%) | 87 (18.7%) |
| 4 Vehicles | 61 (10.7%) | 28 (6.0%) |
| 5 or more Vehicles | 26 (4.5%) | 17 (3.7%) |
| Total | 572 (100.0%) | 465 (100.0%) |
Commute Time in New Madrid
The most frequently occuring commute durations in New Madrid are 5 to 9 minutes (320 commuters, 31.2%), 15 to 19 minutes (147 commuters, 14.3%), and 10 to 14 minutes (133 commuters, 13.0%).
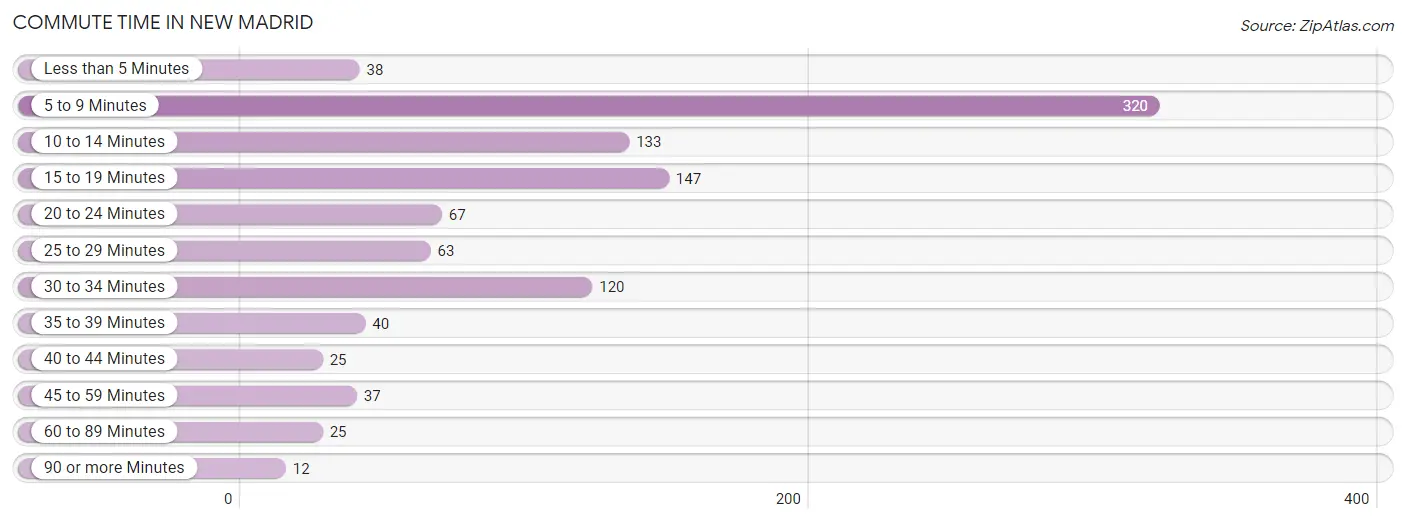
| Commute Time | # Commuters | % Commuters |
| Less than 5 Minutes | 38 | 3.7% |
| 5 to 9 Minutes | 320 | 31.2% |
| 10 to 14 Minutes | 133 | 13.0% |
| 15 to 19 Minutes | 147 | 14.3% |
| 20 to 24 Minutes | 67 | 6.5% |
| 25 to 29 Minutes | 63 | 6.1% |
| 30 to 34 Minutes | 120 | 11.7% |
| 35 to 39 Minutes | 40 | 3.9% |
| 40 to 44 Minutes | 25 | 2.4% |
| 45 to 59 Minutes | 37 | 3.6% |
| 60 to 89 Minutes | 25 | 2.4% |
| 90 or more Minutes | 12 | 1.2% |
Commute Time by Sex in New Madrid
The most common commute times in New Madrid are 5 to 9 minutes (127 commuters, 22.6%) for males and 5 to 9 minutes (193 commuters, 41.5%) for females.
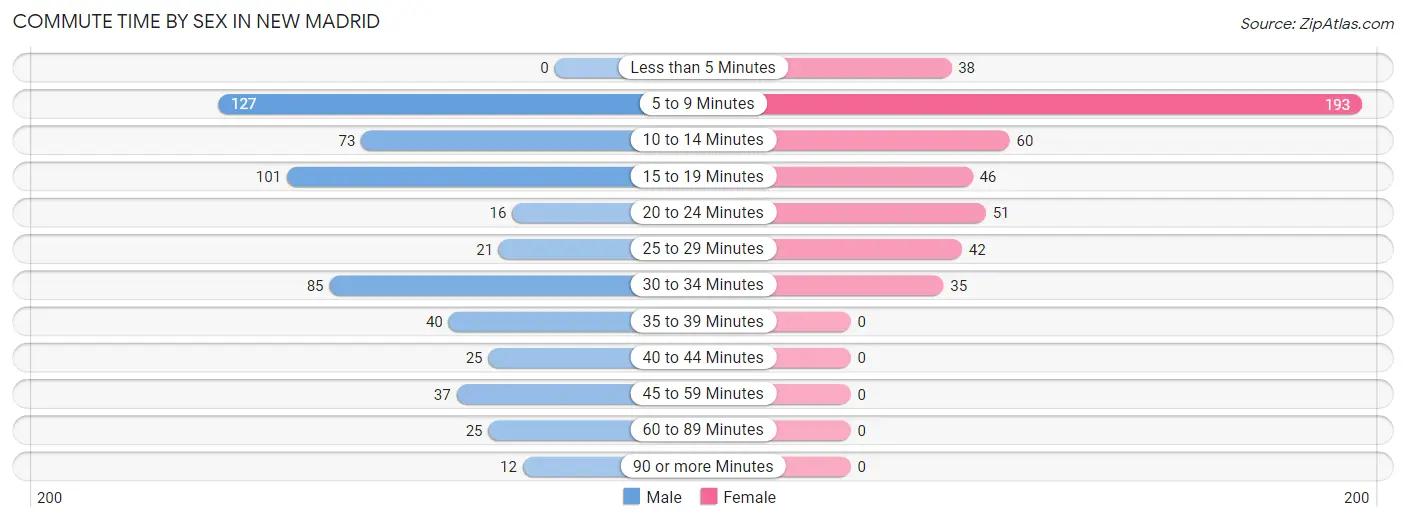
| Commute Time | Male | Female |
| Less than 5 Minutes | 0 (0.0%) | 38 (8.2%) |
| 5 to 9 Minutes | 127 (22.6%) | 193 (41.5%) |
| 10 to 14 Minutes | 73 (13.0%) | 60 (12.9%) |
| 15 to 19 Minutes | 101 (18.0%) | 46 (9.9%) |
| 20 to 24 Minutes | 16 (2.9%) | 51 (11.0%) |
| 25 to 29 Minutes | 21 (3.7%) | 42 (9.0%) |
| 30 to 34 Minutes | 85 (15.1%) | 35 (7.5%) |
| 35 to 39 Minutes | 40 (7.1%) | 0 (0.0%) |
| 40 to 44 Minutes | 25 (4.4%) | 0 (0.0%) |
| 45 to 59 Minutes | 37 (6.6%) | 0 (0.0%) |
| 60 to 89 Minutes | 25 (4.4%) | 0 (0.0%) |
| 90 or more Minutes | 12 (2.1%) | 0 (0.0%) |
Time of Departure to Work by Sex in New Madrid
The most frequent times of departure to work in New Madrid are 7:00 AM to 7:29 AM (91, 16.2%) for males and 7:30 AM to 7:59 AM (196, 42.1%) for females.
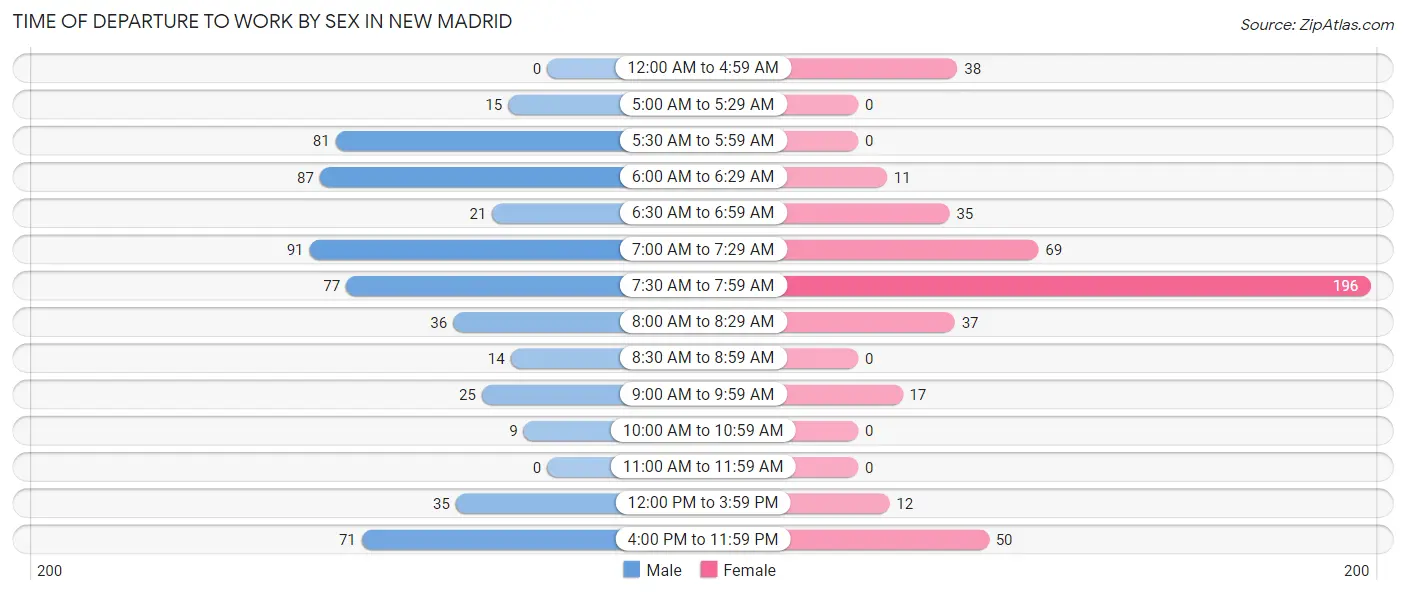
| Time of Departure | Male | Female |
| 12:00 AM to 4:59 AM | 0 (0.0%) | 38 (8.2%) |
| 5:00 AM to 5:29 AM | 15 (2.7%) | 0 (0.0%) |
| 5:30 AM to 5:59 AM | 81 (14.4%) | 0 (0.0%) |
| 6:00 AM to 6:29 AM | 87 (15.5%) | 11 (2.4%) |
| 6:30 AM to 6:59 AM | 21 (3.7%) | 35 (7.5%) |
| 7:00 AM to 7:29 AM | 91 (16.2%) | 69 (14.8%) |
| 7:30 AM to 7:59 AM | 77 (13.7%) | 196 (42.1%) |
| 8:00 AM to 8:29 AM | 36 (6.4%) | 37 (8.0%) |
| 8:30 AM to 8:59 AM | 14 (2.5%) | 0 (0.0%) |
| 9:00 AM to 9:59 AM | 25 (4.4%) | 17 (3.7%) |
| 10:00 AM to 10:59 AM | 9 (1.6%) | 0 (0.0%) |
| 11:00 AM to 11:59 AM | 0 (0.0%) | 0 (0.0%) |
| 12:00 PM to 3:59 PM | 35 (6.2%) | 12 (2.6%) |
| 4:00 PM to 11:59 PM | 71 (12.6%) | 50 (10.7%) |
| Total | 562 (100.0%) | 465 (100.0%) |
Housing Occupancy in New Madrid
Occupancy by Ownership in New Madrid
Of the total 1,175 dwellings in New Madrid, owner-occupied units account for 678 (57.7%), while renter-occupied units make up 497 (42.3%).
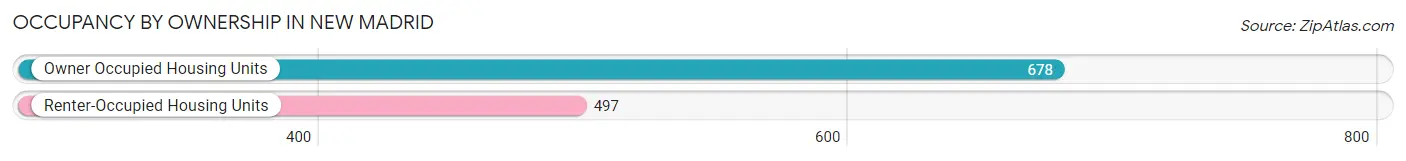
| Occupancy | # Housing Units | % Housing Units |
| Owner Occupied Housing Units | 678 | 57.7% |
| Renter-Occupied Housing Units | 497 | 42.3% |
| Total Occupied Housing Units | 1,175 | 100.0% |
Occupancy by Household Size in New Madrid
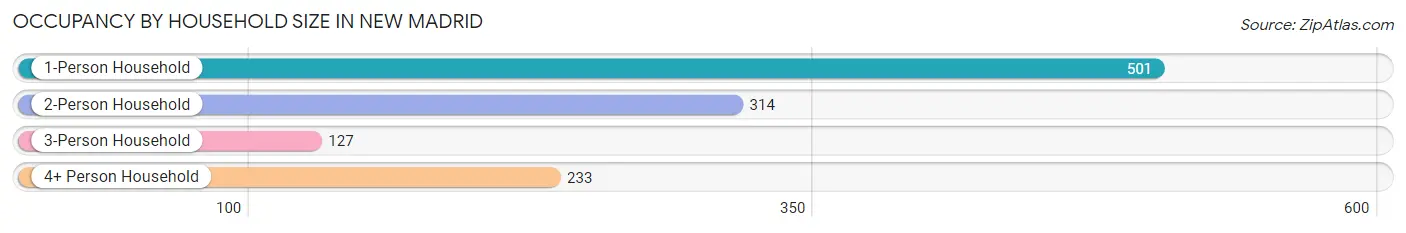
| Household Size | # Housing Units | % Housing Units |
| 1-Person Household | 501 | 42.6% |
| 2-Person Household | 314 | 26.7% |
| 3-Person Household | 127 | 10.8% |
| 4+ Person Household | 233 | 19.8% |
| Total Housing Units | 1,175 | 100.0% |
Occupancy by Ownership by Household Size in New Madrid
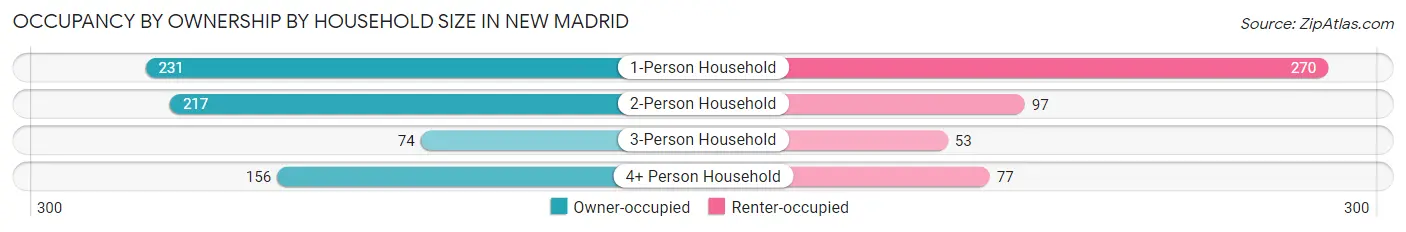
| Household Size | Owner-occupied | Renter-occupied |
| 1-Person Household | 231 (46.1%) | 270 (53.9%) |
| 2-Person Household | 217 (69.1%) | 97 (30.9%) |
| 3-Person Household | 74 (58.3%) | 53 (41.7%) |
| 4+ Person Household | 156 (66.9%) | 77 (33.1%) |
| Total Housing Units | 678 (57.7%) | 497 (42.3%) |
Occupancy by Educational Attainment in New Madrid
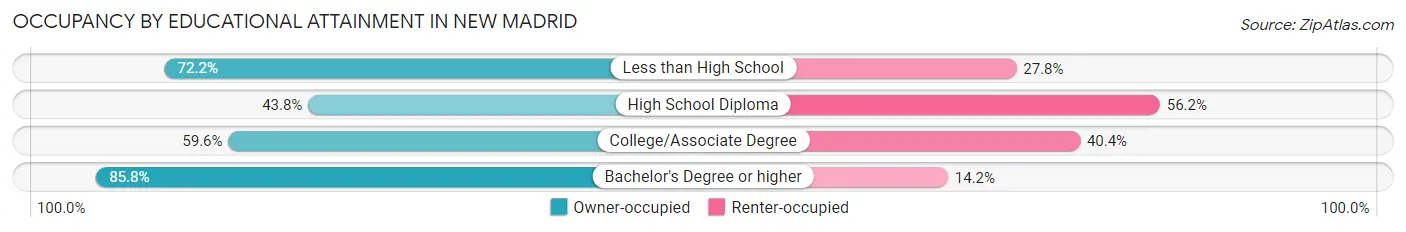
| Household Size | Owner-occupied | Renter-occupied |
| Less than High School | 78 (72.2%) | 30 (27.8%) |
| High School Diploma | 232 (43.8%) | 298 (56.2%) |
| College/Associate Degree | 211 (59.6%) | 143 (40.4%) |
| Bachelor's Degree or higher | 157 (85.8%) | 26 (14.2%) |
Occupancy by Age of Householder in New Madrid
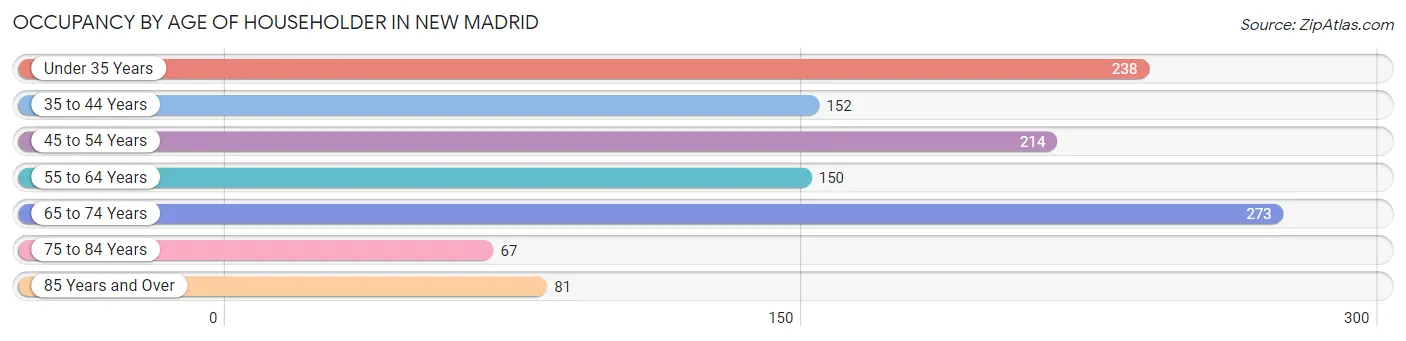
| Age Bracket | # Households | % Households |
| Under 35 Years | 238 | 20.3% |
| 35 to 44 Years | 152 | 12.9% |
| 45 to 54 Years | 214 | 18.2% |
| 55 to 64 Years | 150 | 12.8% |
| 65 to 74 Years | 273 | 23.2% |
| 75 to 84 Years | 67 | 5.7% |
| 85 Years and Over | 81 | 6.9% |
| Total | 1,175 | 100.0% |
Housing Finances in New Madrid
Median Income by Occupancy in New Madrid
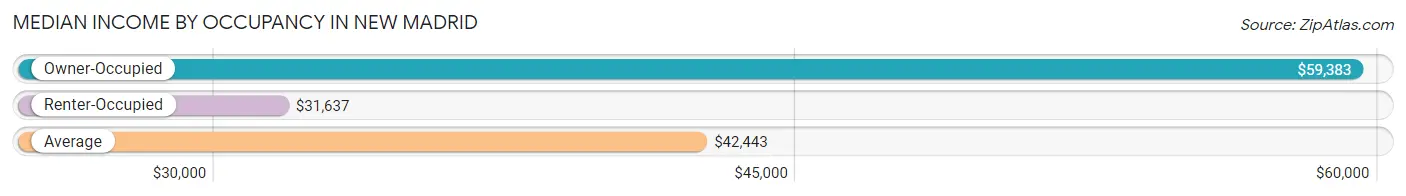
| Occupancy Type | # Households | Median Income |
| Owner-Occupied | 678 (57.7%) | $59,383 |
| Renter-Occupied | 497 (42.3%) | $31,637 |
| Average | 1,175 (100.0%) | $42,443 |
Occupancy by Householder Income Bracket in New Madrid
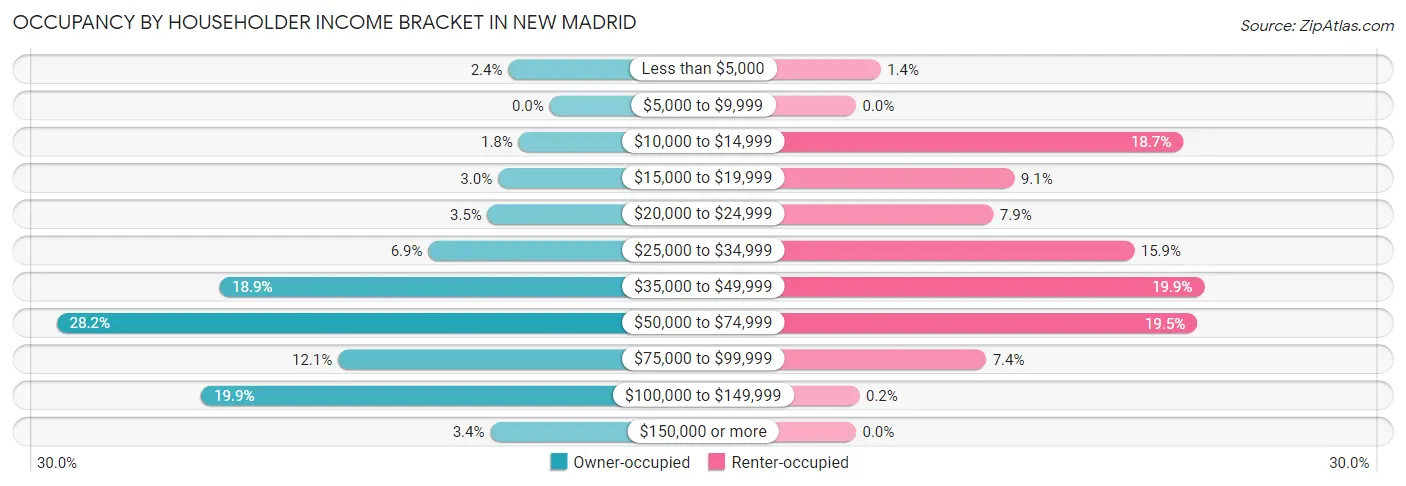
| Income Bracket | Owner-occupied | Renter-occupied |
| Less than $5,000 | 16 (2.4%) | 7 (1.4%) |
| $5,000 to $9,999 | 0 (0.0%) | 0 (0.0%) |
| $10,000 to $14,999 | 12 (1.8%) | 93 (18.7%) |
| $15,000 to $19,999 | 20 (2.9%) | 45 (9.0%) |
| $20,000 to $24,999 | 24 (3.5%) | 39 (7.9%) |
| $25,000 to $34,999 | 47 (6.9%) | 79 (15.9%) |
| $35,000 to $49,999 | 128 (18.9%) | 99 (19.9%) |
| $50,000 to $74,999 | 191 (28.2%) | 97 (19.5%) |
| $75,000 to $99,999 | 82 (12.1%) | 37 (7.4%) |
| $100,000 to $149,999 | 135 (19.9%) | 1 (0.2%) |
| $150,000 or more | 23 (3.4%) | 0 (0.0%) |
| Total | 678 (100.0%) | 497 (100.0%) |
Monthly Housing Cost Tiers in New Madrid
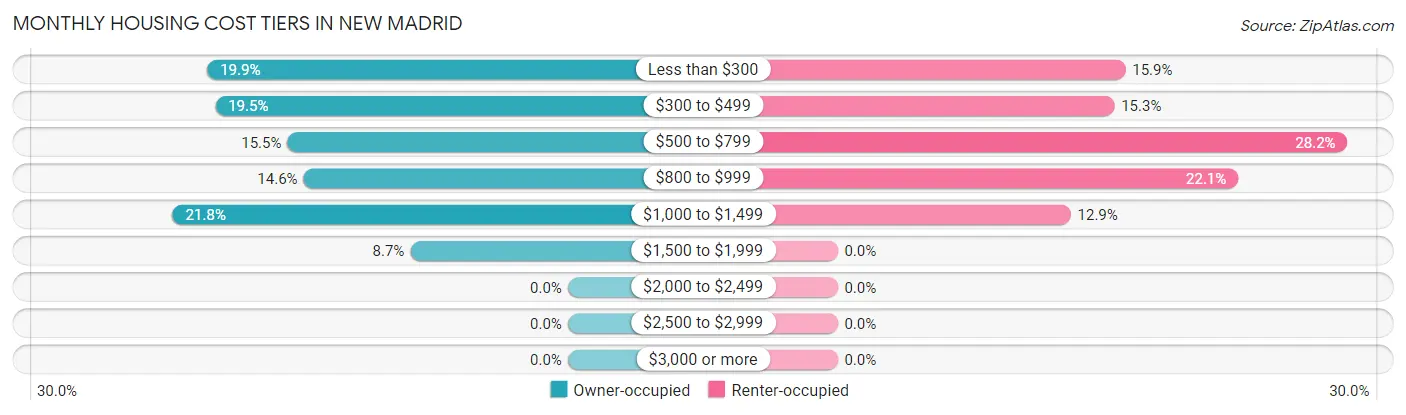
| Monthly Cost | Owner-occupied | Renter-occupied |
| Less than $300 | 135 (19.9%) | 79 (15.9%) |
| $300 to $499 | 132 (19.5%) | 76 (15.3%) |
| $500 to $799 | 105 (15.5%) | 140 (28.2%) |
| $800 to $999 | 99 (14.6%) | 110 (22.1%) |
| $1,000 to $1,499 | 148 (21.8%) | 64 (12.9%) |
| $1,500 to $1,999 | 59 (8.7%) | 0 (0.0%) |
| $2,000 to $2,499 | 0 (0.0%) | 0 (0.0%) |
| $2,500 to $2,999 | 0 (0.0%) | 0 (0.0%) |
| $3,000 or more | 0 (0.0%) | 0 (0.0%) |
| Total | 678 (100.0%) | 497 (100.0%) |
Physical Housing Characteristics in New Madrid
Housing Structures in New Madrid
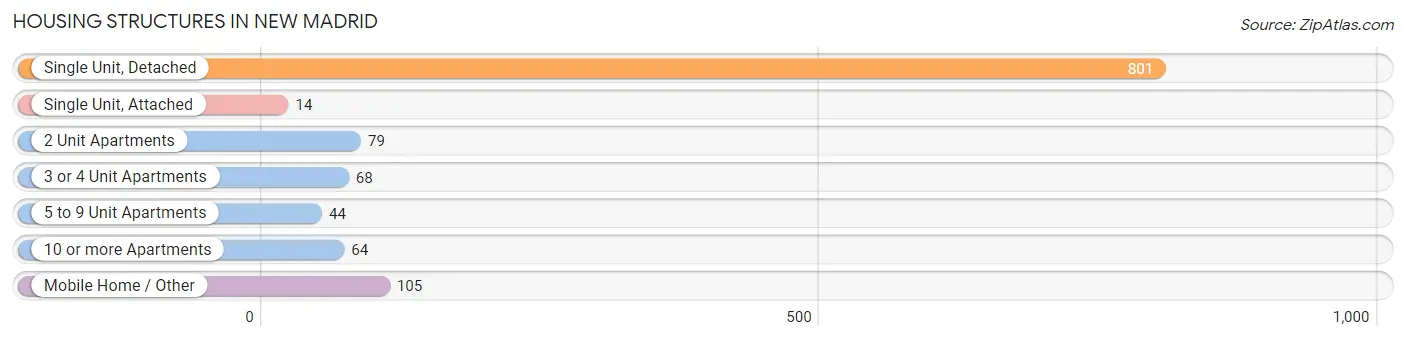
| Structure Type | # Housing Units | % Housing Units |
| Single Unit, Detached | 801 | 68.2% |
| Single Unit, Attached | 14 | 1.2% |
| 2 Unit Apartments | 79 | 6.7% |
| 3 or 4 Unit Apartments | 68 | 5.8% |
| 5 to 9 Unit Apartments | 44 | 3.7% |
| 10 or more Apartments | 64 | 5.4% |
| Mobile Home / Other | 105 | 8.9% |
| Total | 1,175 | 100.0% |
Housing Structures by Occupancy in New Madrid
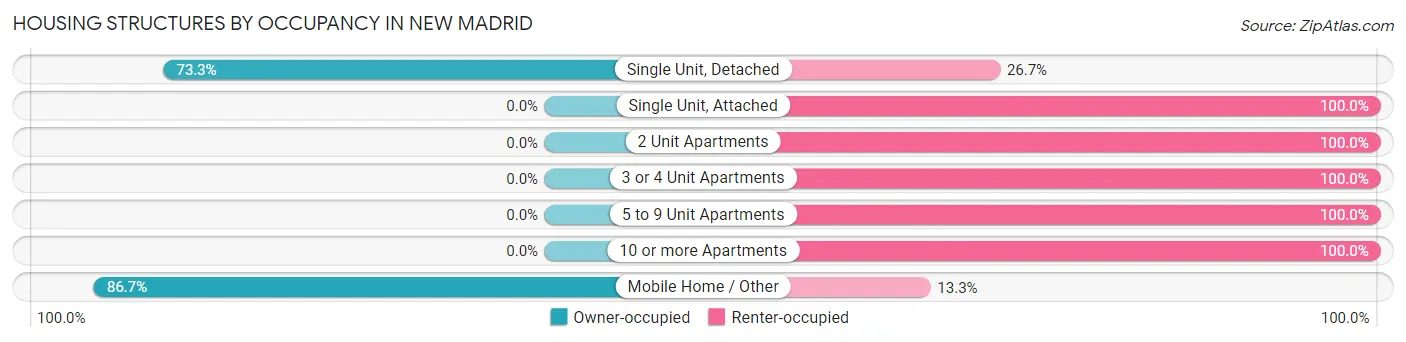
| Structure Type | Owner-occupied | Renter-occupied |
| Single Unit, Detached | 587 (73.3%) | 214 (26.7%) |
| Single Unit, Attached | 0 (0.0%) | 14 (100.0%) |
| 2 Unit Apartments | 0 (0.0%) | 79 (100.0%) |
| 3 or 4 Unit Apartments | 0 (0.0%) | 68 (100.0%) |
| 5 to 9 Unit Apartments | 0 (0.0%) | 44 (100.0%) |
| 10 or more Apartments | 0 (0.0%) | 64 (100.0%) |
| Mobile Home / Other | 91 (86.7%) | 14 (13.3%) |
| Total | 678 (57.7%) | 497 (42.3%) |
Housing Structures by Number of Rooms in New Madrid
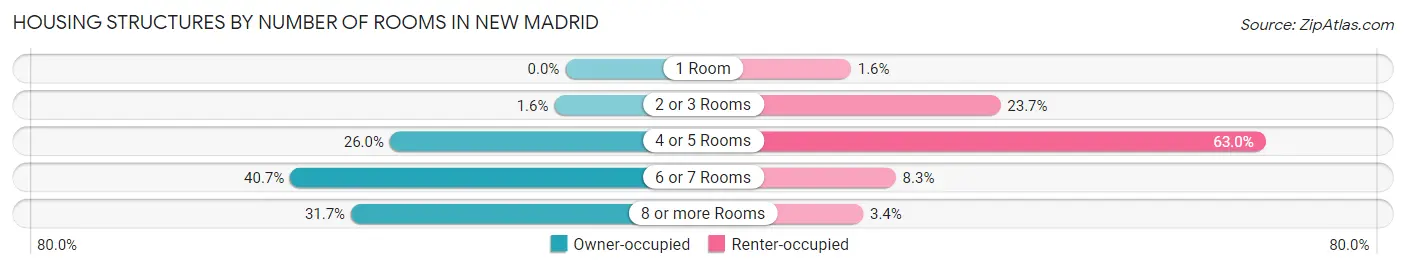
| Number of Rooms | Owner-occupied | Renter-occupied |
| 1 Room | 0 (0.0%) | 8 (1.6%) |
| 2 or 3 Rooms | 11 (1.6%) | 118 (23.7%) |
| 4 or 5 Rooms | 176 (26.0%) | 313 (63.0%) |
| 6 or 7 Rooms | 276 (40.7%) | 41 (8.3%) |
| 8 or more Rooms | 215 (31.7%) | 17 (3.4%) |
| Total | 678 (100.0%) | 497 (100.0%) |
Housing Structure by Heating Type in New Madrid
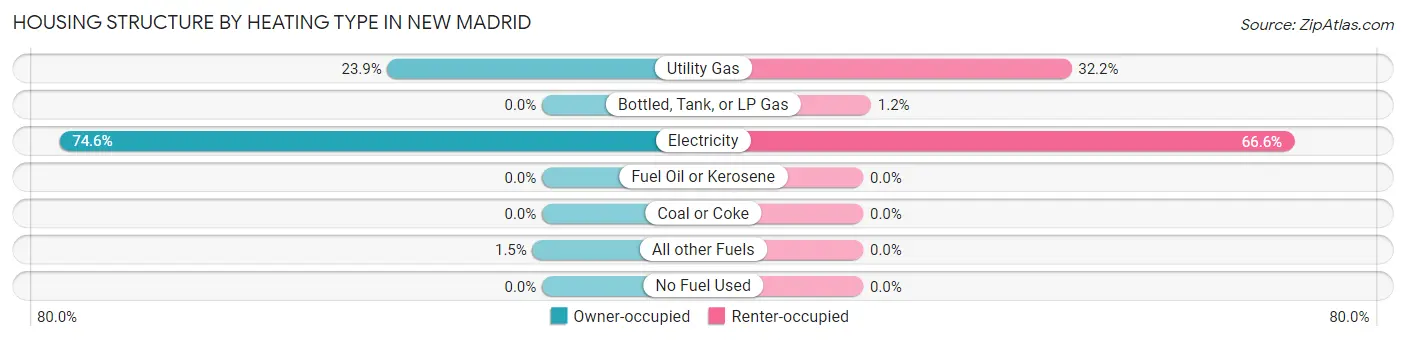
| Heating Type | Owner-occupied | Renter-occupied |
| Utility Gas | 162 (23.9%) | 160 (32.2%) |
| Bottled, Tank, or LP Gas | 0 (0.0%) | 6 (1.2%) |
| Electricity | 506 (74.6%) | 331 (66.6%) |
| Fuel Oil or Kerosene | 0 (0.0%) | 0 (0.0%) |
| Coal or Coke | 0 (0.0%) | 0 (0.0%) |
| All other Fuels | 10 (1.5%) | 0 (0.0%) |
| No Fuel Used | 0 (0.0%) | 0 (0.0%) |
| Total | 678 (100.0%) | 497 (100.0%) |
Household Vehicle Usage in New Madrid
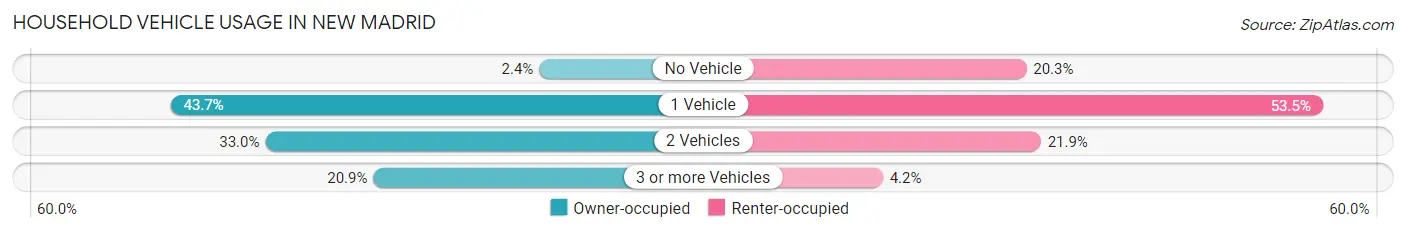
| Vehicles per Household | Owner-occupied | Renter-occupied |
| No Vehicle | 16 (2.4%) | 101 (20.3%) |
| 1 Vehicle | 296 (43.7%) | 266 (53.5%) |
| 2 Vehicles | 224 (33.0%) | 109 (21.9%) |
| 3 or more Vehicles | 142 (20.9%) | 21 (4.2%) |
| Total | 678 (100.0%) | 497 (100.0%) |
Real Estate & Mortgages in New Madrid
Real Estate and Mortgage Overview in New Madrid
| Characteristic | Without Mortgage | With Mortgage |
| Housing Units | 357 | 321 |
| Median Property Value | $80,500 | $143,300 |
| Median Household Income | $58,719 | $12 |
| Monthly Housing Costs | $369 | $0 |
| Real Estate Taxes | $468 | $0 |
Property Value by Mortgage Status in New Madrid
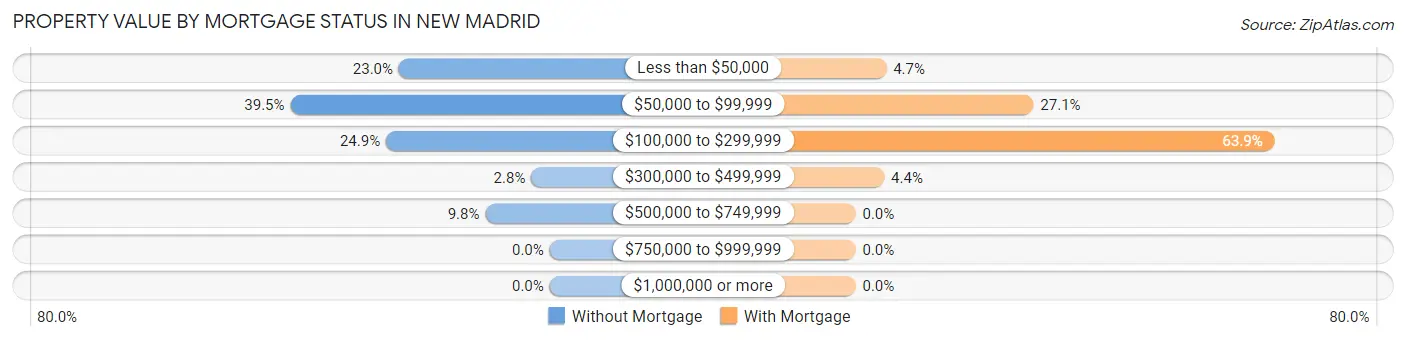
| Property Value | Without Mortgage | With Mortgage |
| Less than $50,000 | 82 (23.0%) | 15 (4.7%) |
| $50,000 to $99,999 | 141 (39.5%) | 87 (27.1%) |
| $100,000 to $299,999 | 89 (24.9%) | 205 (63.9%) |
| $300,000 to $499,999 | 10 (2.8%) | 14 (4.4%) |
| $500,000 to $749,999 | 35 (9.8%) | 0 (0.0%) |
| $750,000 to $999,999 | 0 (0.0%) | 0 (0.0%) |
| $1,000,000 or more | 0 (0.0%) | 0 (0.0%) |
| Total | 357 (100.0%) | 321 (100.0%) |
Household Income by Mortgage Status in New Madrid
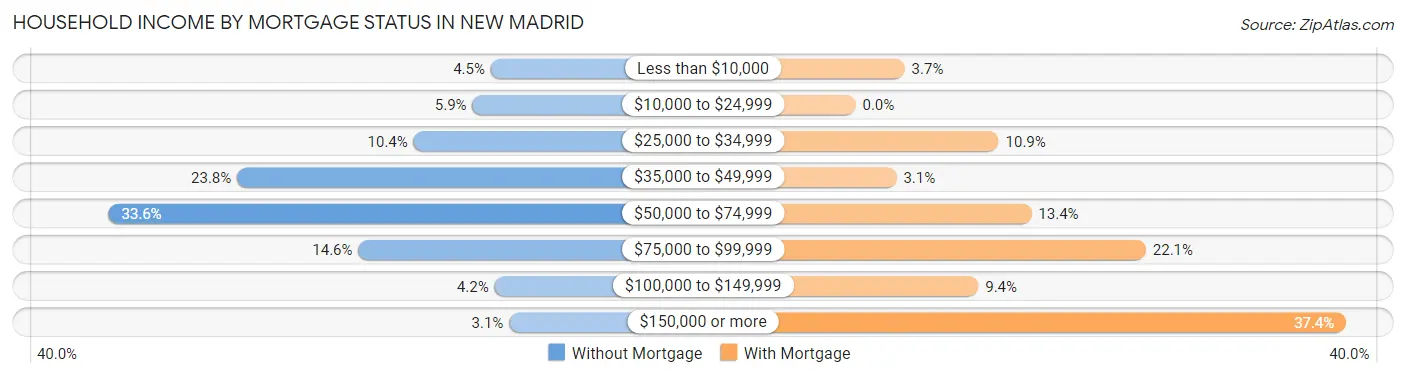
| Household Income | Without Mortgage | With Mortgage |
| Less than $10,000 | 16 (4.5%) | 12 (3.7%) |
| $10,000 to $24,999 | 21 (5.9%) | 0 (0.0%) |
| $25,000 to $34,999 | 37 (10.4%) | 35 (10.9%) |
| $35,000 to $49,999 | 85 (23.8%) | 10 (3.1%) |
| $50,000 to $74,999 | 120 (33.6%) | 43 (13.4%) |
| $75,000 to $99,999 | 52 (14.6%) | 71 (22.1%) |
| $100,000 to $149,999 | 15 (4.2%) | 30 (9.3%) |
| $150,000 or more | 11 (3.1%) | 120 (37.4%) |
| Total | 357 (100.0%) | 321 (100.0%) |
Property Value to Household Income Ratio in New Madrid
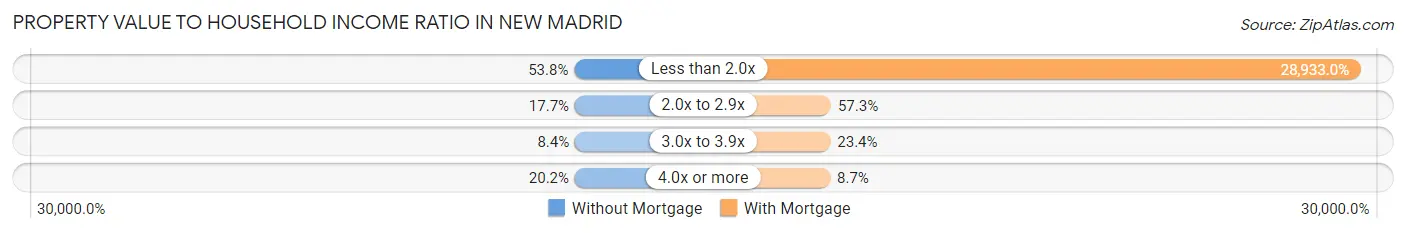
| Value-to-Income Ratio | Without Mortgage | With Mortgage |
| Less than 2.0x | 192 (53.8%) | 92,875 (28,933.0%) |
| 2.0x to 2.9x | 63 (17.6%) | 184 (57.3%) |
| 3.0x to 3.9x | 30 (8.4%) | 75 (23.4%) |
| 4.0x or more | 72 (20.2%) | 28 (8.7%) |
| Total | 357 (100.0%) | 321 (100.0%) |
Real Estate Taxes by Mortgage Status in New Madrid
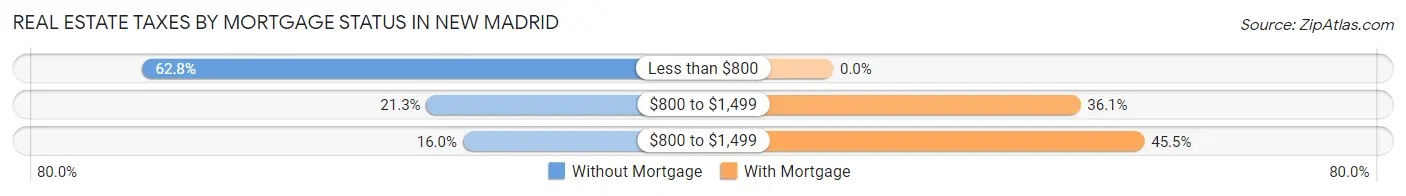
| Property Taxes | Without Mortgage | With Mortgage |
| Less than $800 | 224 (62.7%) | 0 (0.0%) |
| $800 to $1,499 | 76 (21.3%) | 116 (36.1%) |
| $800 to $1,499 | 57 (16.0%) | 146 (45.5%) |
| Total | 357 (100.0%) | 321 (100.0%) |
Health & Disability in New Madrid
Health Insurance Coverage by Age in New Madrid
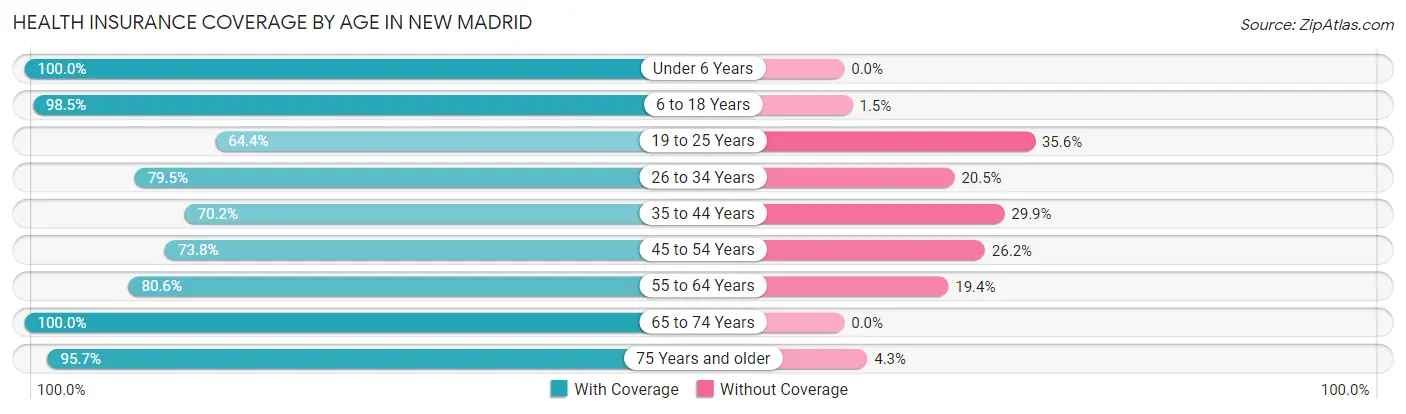
| Age Bracket | With Coverage | Without Coverage |
| Under 6 Years | 180 (100.0%) | 0 (0.0%) |
| 6 to 18 Years | 385 (98.5%) | 6 (1.5%) |
| 19 to 25 Years | 241 (64.4%) | 133 (35.6%) |
| 26 to 34 Years | 147 (79.5%) | 38 (20.5%) |
| 35 to 44 Years | 228 (70.2%) | 97 (29.8%) |
| 45 to 54 Years | 287 (73.8%) | 102 (26.2%) |
| 55 to 64 Years | 162 (80.6%) | 39 (19.4%) |
| 65 to 74 Years | 431 (100.0%) | 0 (0.0%) |
| 75 Years and older | 156 (95.7%) | 7 (4.3%) |
| Total | 2,217 (84.0%) | 422 (16.0%) |
Health Insurance Coverage by Citizenship Status in New Madrid
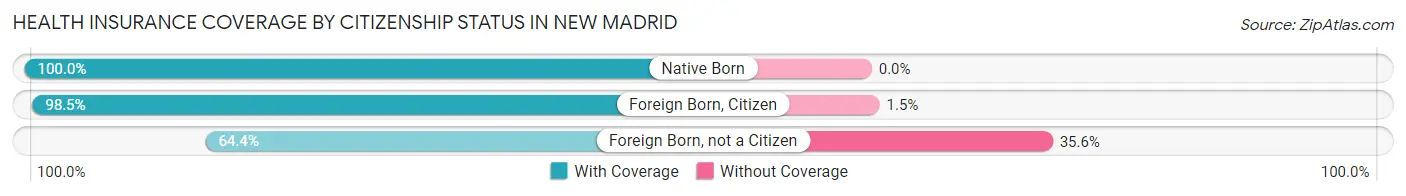
| Citizenship Status | With Coverage | Without Coverage |
| Native Born | 180 (100.0%) | 0 (0.0%) |
| Foreign Born, Citizen | 385 (98.5%) | 6 (1.5%) |
| Foreign Born, not a Citizen | 241 (64.4%) | 133 (35.6%) |
Health Insurance Coverage by Household Income in New Madrid
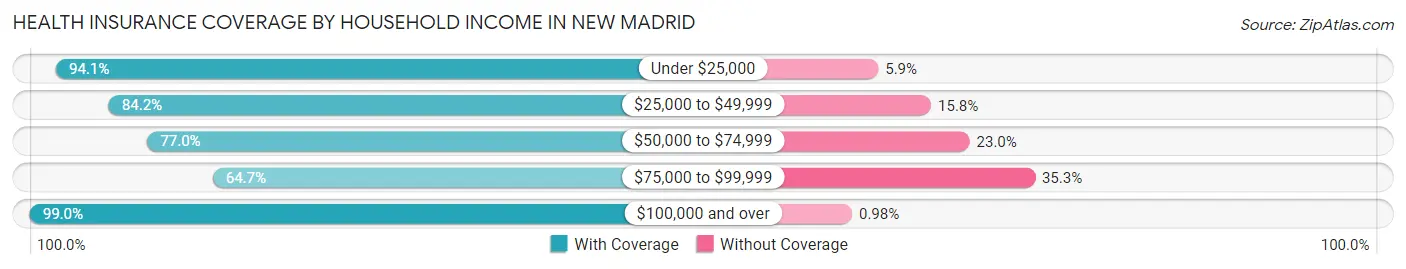
| Household Income | With Coverage | Without Coverage |
| Under $25,000 | 351 (94.1%) | 22 (5.9%) |
| $25,000 to $49,999 | 549 (84.2%) | 103 (15.8%) |
| $50,000 to $74,999 | 609 (77.0%) | 182 (23.0%) |
| $75,000 to $99,999 | 202 (64.7%) | 110 (35.3%) |
| $100,000 and over | 506 (99.0%) | 5 (1.0%) |
Public vs Private Health Insurance Coverage by Age in New Madrid
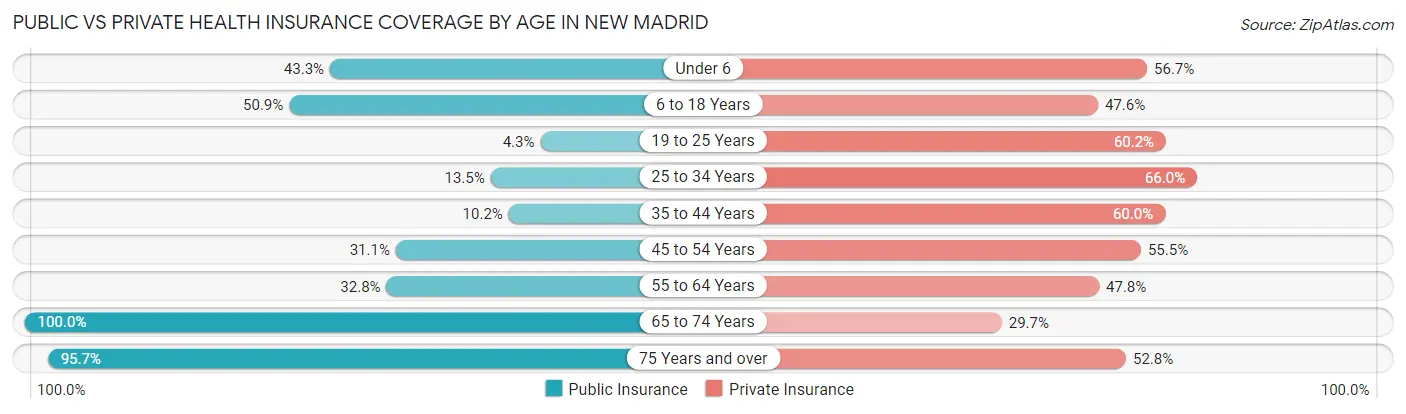
| Age Bracket | Public Insurance | Private Insurance |
| Under 6 | 78 (43.3%) | 102 (56.7%) |
| 6 to 18 Years | 199 (50.9%) | 186 (47.6%) |
| 19 to 25 Years | 16 (4.3%) | 225 (60.2%) |
| 25 to 34 Years | 25 (13.5%) | 122 (65.9%) |
| 35 to 44 Years | 33 (10.2%) | 195 (60.0%) |
| 45 to 54 Years | 121 (31.1%) | 216 (55.5%) |
| 55 to 64 Years | 66 (32.8%) | 96 (47.8%) |
| 65 to 74 Years | 431 (100.0%) | 128 (29.7%) |
| 75 Years and over | 156 (95.7%) | 86 (52.8%) |
| Total | 1,125 (42.6%) | 1,356 (51.4%) |
Disability Status by Sex by Age in New Madrid
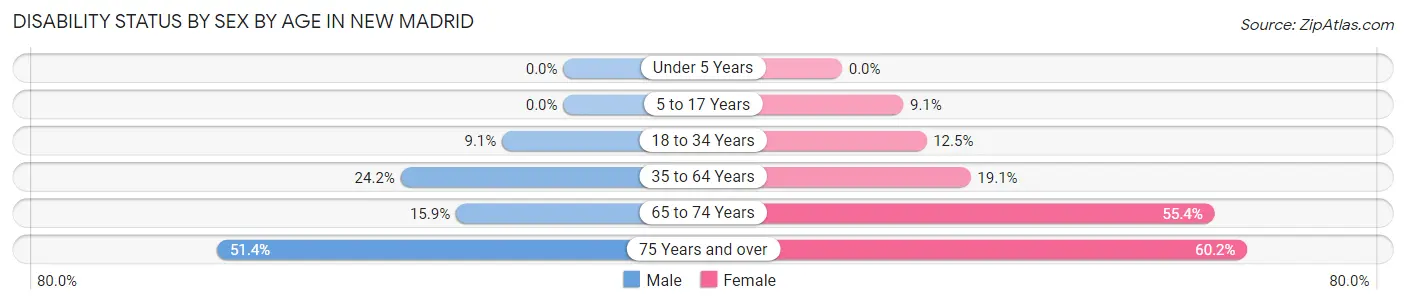
| Age Bracket | Male | Female |
| Under 5 Years | 0 (0.0%) | 0 (0.0%) |
| 5 to 17 Years | 0 (0.0%) | 11 (9.1%) |
| 18 to 34 Years | 26 (9.1%) | 39 (12.5%) |
| 35 to 64 Years | 130 (24.2%) | 72 (19.1%) |
| 65 to 74 Years | 33 (15.9%) | 124 (55.4%) |
| 75 Years and over | 36 (51.4%) | 56 (60.2%) |
Disability Class by Sex by Age in New Madrid
Disability Class: Hearing Difficulty
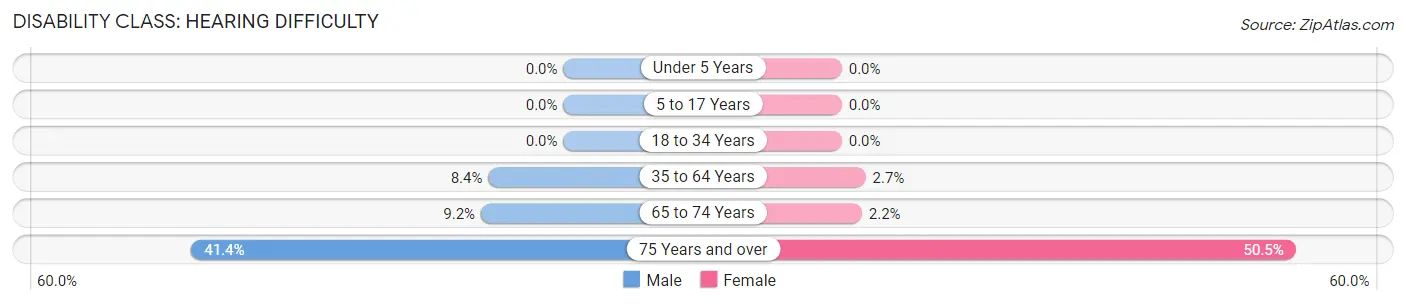
| Age Bracket | Male | Female |
| Under 5 Years | 0 (0.0%) | 0 (0.0%) |
| 5 to 17 Years | 0 (0.0%) | 0 (0.0%) |
| 18 to 34 Years | 0 (0.0%) | 0 (0.0%) |
| 35 to 64 Years | 45 (8.4%) | 10 (2.6%) |
| 65 to 74 Years | 19 (9.2%) | 5 (2.2%) |
| 75 Years and over | 29 (41.4%) | 47 (50.5%) |
Disability Class: Vision Difficulty
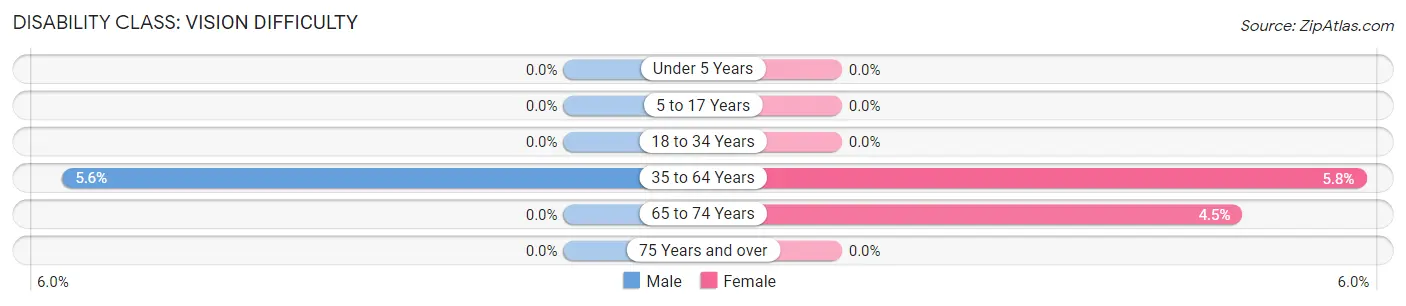
| Age Bracket | Male | Female |
| Under 5 Years | 0 (0.0%) | 0 (0.0%) |
| 5 to 17 Years | 0 (0.0%) | 0 (0.0%) |
| 18 to 34 Years | 0 (0.0%) | 0 (0.0%) |
| 35 to 64 Years | 30 (5.6%) | 22 (5.8%) |
| 65 to 74 Years | 0 (0.0%) | 10 (4.5%) |
| 75 Years and over | 0 (0.0%) | 0 (0.0%) |
Disability Class: Cognitive Difficulty
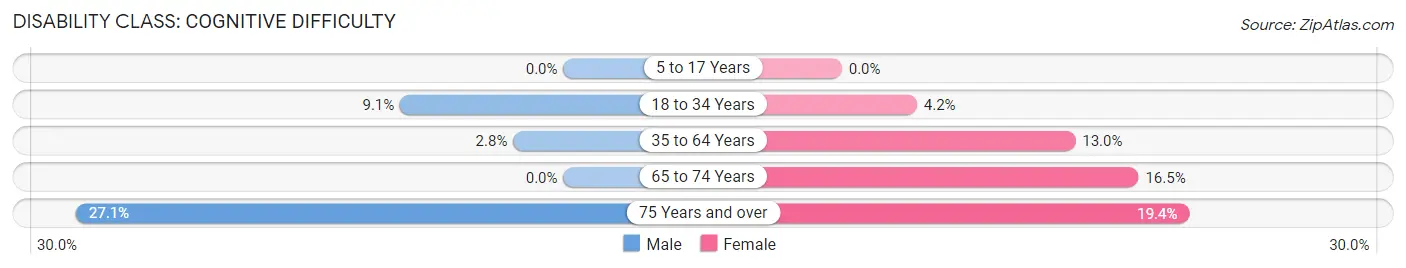
| Age Bracket | Male | Female |
| 5 to 17 Years | 0 (0.0%) | 0 (0.0%) |
| 18 to 34 Years | 26 (9.1%) | 13 (4.2%) |
| 35 to 64 Years | 15 (2.8%) | 49 (13.0%) |
| 65 to 74 Years | 0 (0.0%) | 37 (16.5%) |
| 75 Years and over | 19 (27.1%) | 18 (19.4%) |
Disability Class: Ambulatory Difficulty
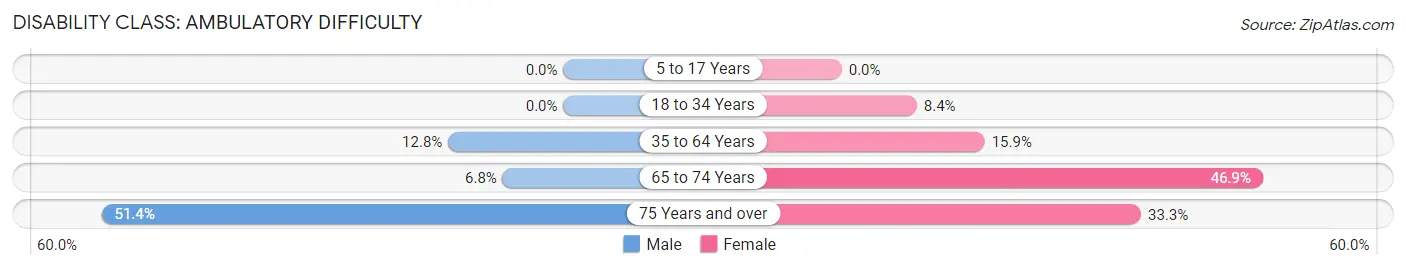
| Age Bracket | Male | Female |
| 5 to 17 Years | 0 (0.0%) | 0 (0.0%) |
| 18 to 34 Years | 0 (0.0%) | 26 (8.4%) |
| 35 to 64 Years | 69 (12.8%) | 60 (15.9%) |
| 65 to 74 Years | 14 (6.8%) | 105 (46.9%) |
| 75 Years and over | 36 (51.4%) | 31 (33.3%) |
Disability Class: Self-Care Difficulty
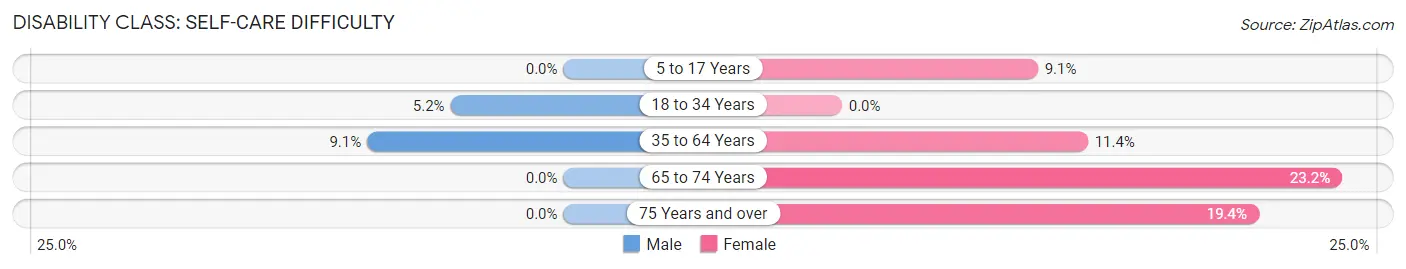
| Age Bracket | Male | Female |
| 5 to 17 Years | 0 (0.0%) | 11 (9.1%) |
| 18 to 34 Years | 15 (5.2%) | 0 (0.0%) |
| 35 to 64 Years | 49 (9.1%) | 43 (11.4%) |
| 65 to 74 Years | 0 (0.0%) | 52 (23.2%) |
| 75 Years and over | 0 (0.0%) | 18 (19.4%) |
Technology Access in New Madrid
Computing Device Access in New Madrid
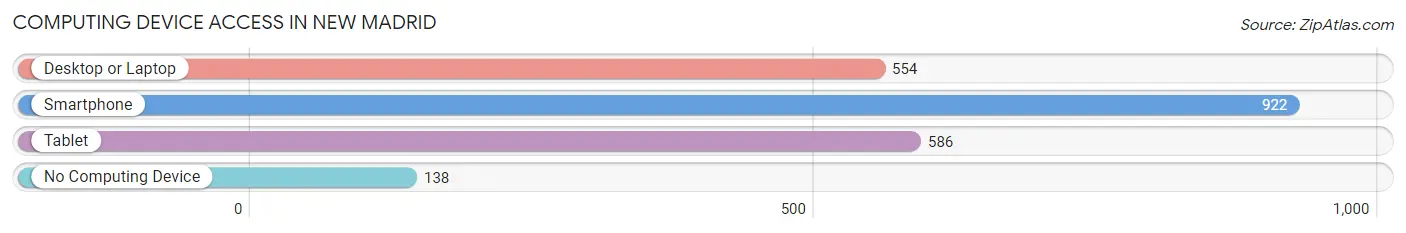
| Device Type | # Households | % Households |
| Desktop or Laptop | 554 | 47.1% |
| Smartphone | 922 | 78.5% |
| Tablet | 586 | 49.9% |
| No Computing Device | 138 | 11.7% |
| Total | 1,175 | 100.0% |
Internet Access in New Madrid
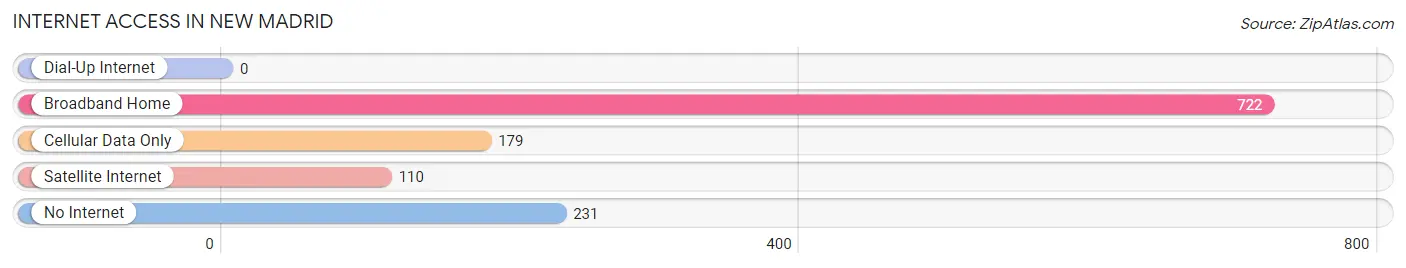
| Internet Type | # Households | % Households |
| Dial-Up Internet | 0 | 0.0% |
| Broadband Home | 722 | 61.5% |
| Cellular Data Only | 179 | 15.2% |
| Satellite Internet | 110 | 9.4% |
| No Internet | 231 | 19.7% |
| Total | 1,175 | 100.0% |
New Madrid Summary
New Madrid, Missouri is a small city located in the southeastern corner of the state, near the Mississippi River. It is the county seat of New Madrid County and is part of the Sikeston-New Madrid Micropolitan Statistical Area. The city has a population of 3,116 as of the 2010 census, and is the largest city in the county.
History
New Madrid was founded in 1789 by Spanish Governor Esteban Rodríguez Miró, who named it after Madrid, Spain. The city was originally part of the Louisiana Territory, and was part of the Missouri Territory when it was created in 1812. During the War of 1812, the city was the site of the Battle of New Madrid, which was fought between the United States and the British. The city was also the site of several earthquakes in 1811 and 1812, which caused significant damage to the area.
In the 19th century, New Madrid was a major port on the Mississippi River, and was a center of trade and commerce. The city was also a major stop on the Underground Railroad, and was home to several prominent abolitionists.
Geography
New Madrid is located at the confluence of the Mississippi and Ohio Rivers, in the southeastern corner of Missouri. The city is situated on a floodplain, and is prone to flooding. The city is located in the New Madrid Seismic Zone, which is an area of high seismic activity.
The city has a total area of 4.2 square miles, of which 4.1 square miles is land and 0.1 square miles is water.
Economy
The economy of New Madrid is largely based on agriculture and manufacturing. The city is home to several large agricultural operations, including a large poultry processing plant. The city is also home to several manufacturing companies, including a large paper mill.
The city is also home to several retail stores, restaurants, and other businesses. The city is served by the New Madrid County Airport, which offers flights to St. Louis and Memphis.
Demographics
As of the 2010 census, the population of New Madrid was 3,116. The racial makeup of the city was 79.2% White, 17.7% African American, 0.3% Native American, 0.2% Asian, 0.1% Pacific Islander, 0.7% from other races, and 1.9% from two or more races. Hispanic or Latino of any race were 2.2% of the population.
The median income for a household in the city was $30,938, and the median income for a family was $37,917. The per capita income for the city was $15,945. About 18.2% of families and 22.2% of the population were below the poverty line, including 33.3% of those under age 18 and 16.2% of those age 65 or over.
Common Questions
What is Per Capita Income in New Madrid?
Per Capita income in New Madrid is $25,846.
What is the Median Family Income in New Madrid?
Median Family Income in New Madrid is $59,458.
What is the Median Household income in New Madrid?
Median Household Income in New Madrid is $42,443.
What is Income or Wage Gap in New Madrid?
Income or Wage Gap in New Madrid is 11.9%.
Women in New Madrid earn 88.1 cents for every dollar earned by a man.
What is Inequality or Gini Index in New Madrid?
Inequality or Gini Index in New Madrid is 0.40.
What is the Total Population of New Madrid?
Total Population of New Madrid is 2,761.
What is the Total Male Population of New Madrid?
Total Male Population of New Madrid is 1,562.
What is the Total Female Population of New Madrid?
Total Female Population of New Madrid is 1,199.
What is the Ratio of Males per 100 Females in New Madrid?
There are 130.28 Males per 100 Females in New Madrid.
What is the Ratio of Females per 100 Males in New Madrid?
There are 76.76 Females per 100 Males in New Madrid.
What is the Median Population Age in New Madrid?
Median Population Age in New Madrid is 41.9 Years.
What is the Average Family Size in New Madrid
Average Family Size in New Madrid is 3.0 People.
What is the Average Household Size in New Madrid
Average Household Size in New Madrid is 2.2 People.
How Large is the Labor Force in New Madrid?
There are 1,104 People in the Labor Forcein in New Madrid.
What is the Percentage of People in the Labor Force in New Madrid?
48.2% of People are in the Labor Force in New Madrid.
What is the Unemployment Rate in New Madrid?
Unemployment Rate in New Madrid is 2.3%.