New Franklin, MO Map & Demographics
New Franklin Map
New Franklin Overview
$23,861
PER CAPITA INCOME
$60,469
AVG FAMILY INCOME
$47,768
AVG HOUSEHOLD INCOME
11.6%
WAGE / INCOME GAP [ % ]
88.4¢/ $1
WAGE / INCOME GAP [ $ ]
0.42
INEQUALITY / GINI INDEX
1,057
TOTAL POPULATION
535
MALE POPULATION
522
FEMALE POPULATION
102.49
MALES / 100 FEMALES
97.57
FEMALES / 100 MALES
39.8
MEDIAN AGE
3.7
AVG FAMILY SIZE
3.1
AVG HOUSEHOLD SIZE
446
LABOR FORCE [ PEOPLE ]
54.6%
PERCENT IN LABOR FORCE
2.2%
UNEMPLOYMENT RATE
New Franklin Zip Codes
New Franklin Area Codes
Income in New Franklin
Income Overview in New Franklin
Per Capita Income in New Franklin is $23,861, while median incomes of families and households are $60,469 and $47,768 respectively.
| Characteristic | Number | Measure |
| Per Capita Income | 1,057 | $23,861 |
| Median Family Income | 227 | $60,469 |
| Mean Family Income | 227 | $73,158 |
| Median Household Income | 345 | $47,768 |
| Mean Household Income | 345 | $64,301 |
| Income Deficit | 227 | $0 |
| Wage / Income Gap (%) | 1,057 | 11.58% |
| Wage / Income Gap ($) | 1,057 | 88.42¢ per $1 |
| Gini / Inequality Index | 1,057 | 0.42 |
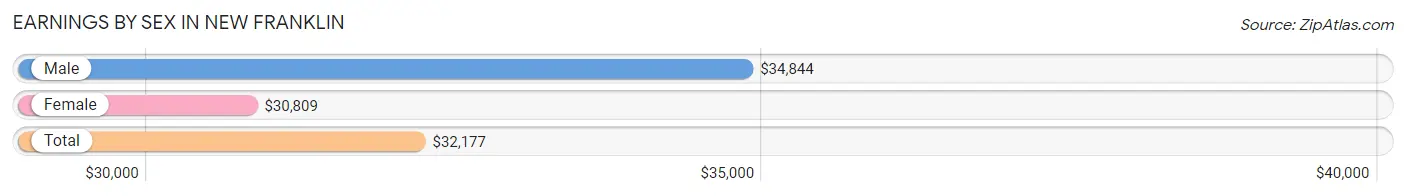
Earnings by Sex in New Franklin
Average Earnings in New Franklin are $32,177, $34,844 for men and $30,809 for women, a difference of 11.6%.
| Sex | Number | Average Earnings |
| Male | 233 (50.6%) | $34,844 |
| Female | 227 (49.3%) | $30,809 |
| Total | 460 (100.0%) | $32,177 |
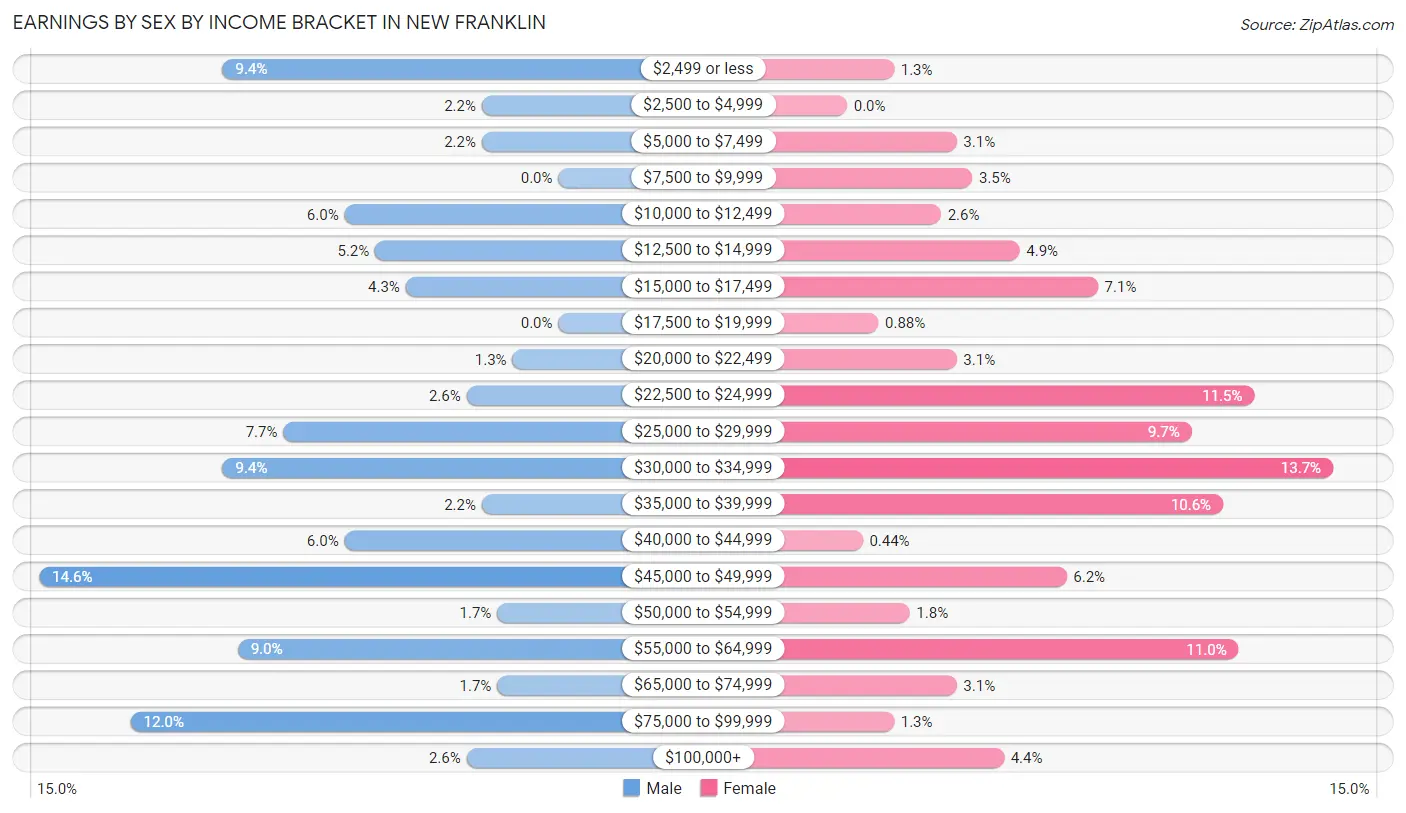
Earnings by Sex by Income Bracket in New Franklin
The most common earnings brackets in New Franklin are $45,000 to $49,999 for men (34 | 14.6%) and $30,000 to $34,999 for women (31 | 13.7%).
| Income | Male | Female |
| $2,499 or less | 22 (9.4%) | 3 (1.3%) |
| $2,500 to $4,999 | 5 (2.1%) | 0 (0.0%) |
| $5,000 to $7,499 | 5 (2.1%) | 7 (3.1%) |
| $7,500 to $9,999 | 0 (0.0%) | 8 (3.5%) |
| $10,000 to $12,499 | 14 (6.0%) | 6 (2.6%) |
| $12,500 to $14,999 | 12 (5.1%) | 11 (4.9%) |
| $15,000 to $17,499 | 10 (4.3%) | 16 (7.0%) |
| $17,500 to $19,999 | 0 (0.0%) | 2 (0.9%) |
| $20,000 to $22,499 | 3 (1.3%) | 7 (3.1%) |
| $22,500 to $24,999 | 6 (2.6%) | 26 (11.5%) |
| $25,000 to $29,999 | 18 (7.7%) | 22 (9.7%) |
| $30,000 to $34,999 | 22 (9.4%) | 31 (13.7%) |
| $35,000 to $39,999 | 5 (2.1%) | 24 (10.6%) |
| $40,000 to $44,999 | 14 (6.0%) | 1 (0.4%) |
| $45,000 to $49,999 | 34 (14.6%) | 14 (6.2%) |
| $50,000 to $54,999 | 4 (1.7%) | 4 (1.8%) |
| $55,000 to $64,999 | 21 (9.0%) | 25 (11.0%) |
| $65,000 to $74,999 | 4 (1.7%) | 7 (3.1%) |
| $75,000 to $99,999 | 28 (12.0%) | 3 (1.3%) |
| $100,000+ | 6 (2.6%) | 10 (4.4%) |
| Total | 233 (100.0%) | 227 (100.0%) |
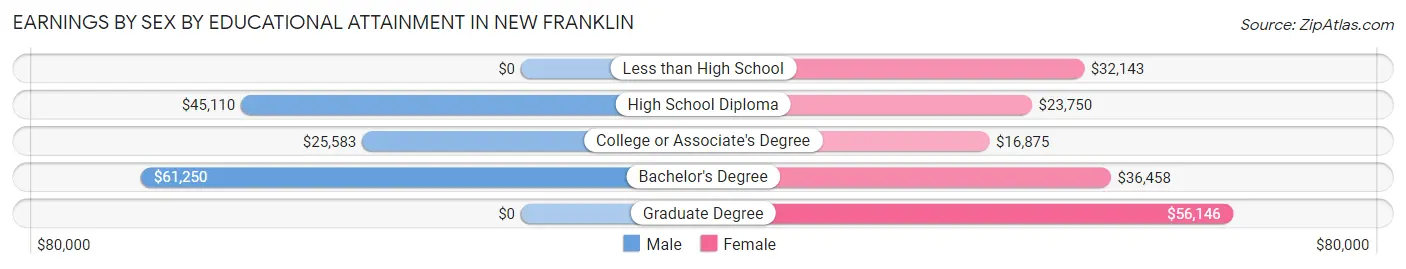
Earnings by Sex by Educational Attainment in New Franklin
Average earnings in New Franklin are $41,250 for men and $31,591 for women, a difference of 23.4%. Men with an educational attainment of bachelor's degree enjoy the highest average annual earnings of $61,250, while those with college or associate's degree education earn the least with $25,583. Women with an educational attainment of graduate degree earn the most with the average annual earnings of $56,146, while those with college or associate's degree education have the smallest earnings of $16,875.
| Educational Attainment | Male Income | Female Income |
| Less than High School | - | - |
| High School Diploma | $45,110 | $23,750 |
| College or Associate's Degree | $25,583 | $16,875 |
| Bachelor's Degree | $61,250 | $36,458 |
| Graduate Degree | - | - |
| Total | $41,250 | $31,591 |
Family Income in New Franklin
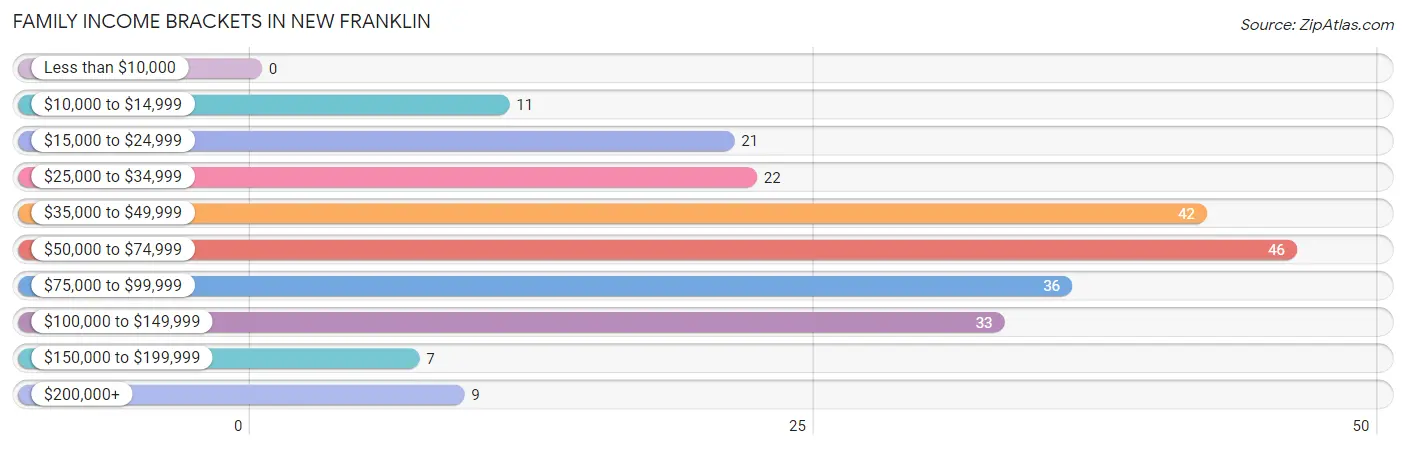
Family Income Brackets in New Franklin
According to the New Franklin family income data, there are 46 families falling into the $50,000 to $74,999 income range, which is the most common income bracket and makes up 20.3% of all families.
| Income Bracket | # Families | % Families |
| Less than $10,000 | 0 | 0.0% |
| $10,000 to $14,999 | 11 | 4.8% |
| $15,000 to $24,999 | 21 | 9.3% |
| $25,000 to $34,999 | 22 | 9.7% |
| $35,000 to $49,999 | 42 | 18.5% |
| $50,000 to $74,999 | 46 | 20.3% |
| $75,000 to $99,999 | 36 | 15.9% |
| $100,000 to $149,999 | 33 | 14.5% |
| $150,000 to $199,999 | 7 | 3.1% |
| $200,000+ | 9 | 4.0% |
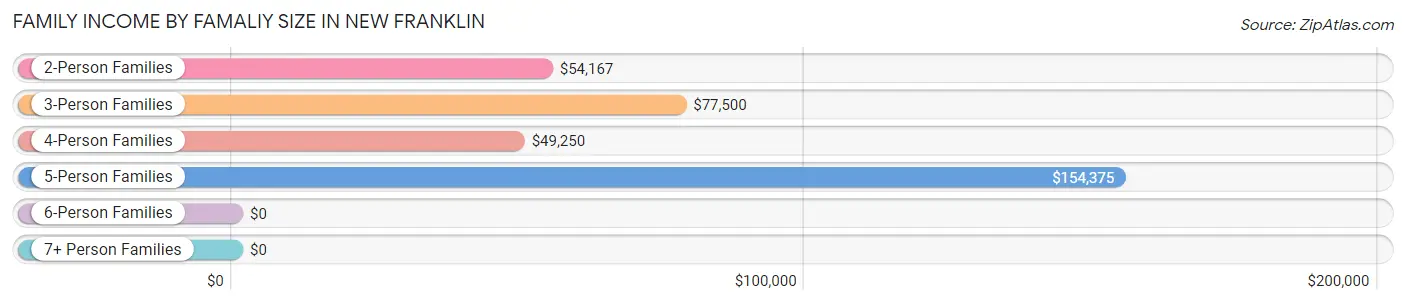
Family Income by Famaliy Size in New Franklin
5-person families (5 | 2.2%) account for the highest median family income in New Franklin with $154,375 per family, while 5-person families (5 | 2.2%) have the highest median income of $30,875 per family member.
| Income Bracket | # Families | Median Income |
| 2-Person Families | 112 (49.3%) | $54,167 |
| 3-Person Families | 50 (22.0%) | $77,500 |
| 4-Person Families | 41 (18.1%) | $49,250 |
| 5-Person Families | 5 (2.2%) | $154,375 |
| 6-Person Families | 14 (6.2%) | $0 |
| 7+ Person Families | 5 (2.2%) | $0 |
| Total | 227 (100.0%) | $60,469 |
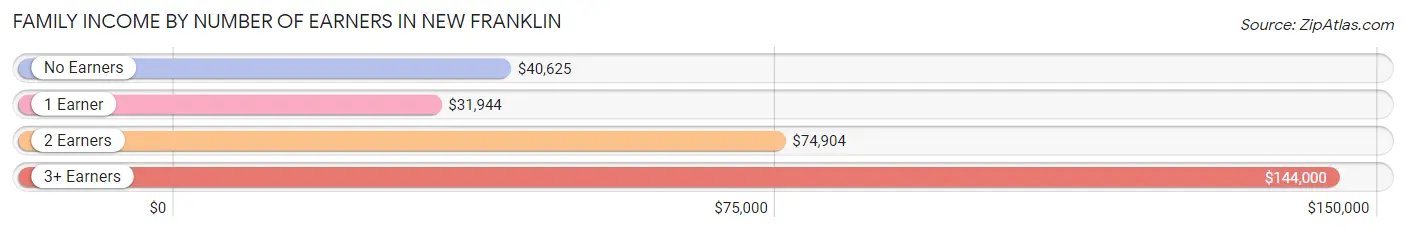
Family Income by Number of Earners in New Franklin
The median family income in New Franklin is $60,469, with families comprising 3+ earners (14) having the highest median family income of $144,000, while families with 1 earner (64) have the lowest median family income of $31,944, accounting for 6.2% and 28.2% of families, respectively.
| Number of Earners | # Families | Median Income |
| No Earners | 46 (20.3%) | $40,625 |
| 1 Earner | 64 (28.2%) | $31,944 |
| 2 Earners | 103 (45.4%) | $74,904 |
| 3+ Earners | 14 (6.2%) | $144,000 |
| Total | 227 (100.0%) | $60,469 |
Household Income in New Franklin
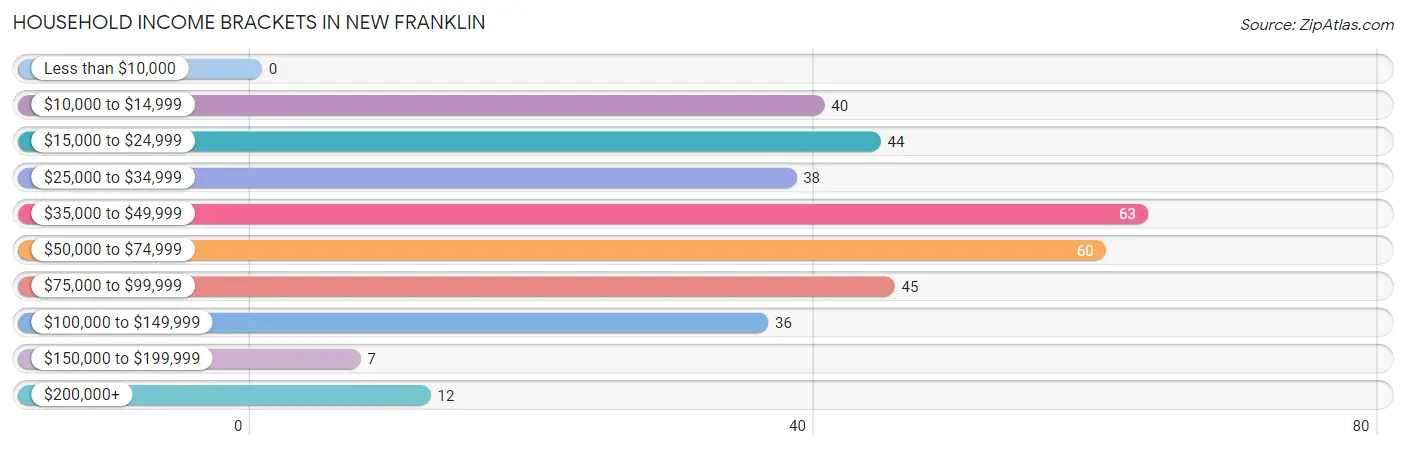
Household Income Brackets in New Franklin
With 63 households falling in the category, the $35,000 to $49,999 income range is the most frequent in New Franklin, accounting for 18.3% of all households.
| Income Bracket | # Households | % Households |
| Less than $10,000 | 0 | 0.0% |
| $10,000 to $14,999 | 40 | 11.6% |
| $15,000 to $24,999 | 44 | 12.8% |
| $25,000 to $34,999 | 38 | 11.0% |
| $35,000 to $49,999 | 63 | 18.3% |
| $50,000 to $74,999 | 60 | 17.4% |
| $75,000 to $99,999 | 45 | 13.0% |
| $100,000 to $149,999 | 36 | 10.4% |
| $150,000 to $199,999 | 7 | 2.0% |
| $200,000+ | 12 | 3.5% |
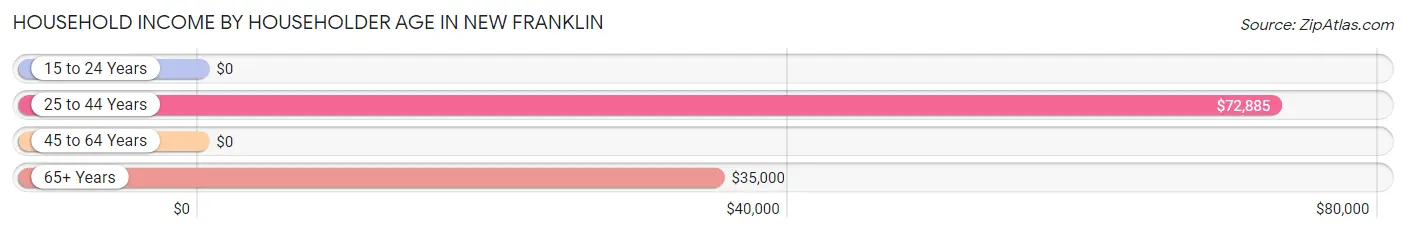
Household Income by Householder Age in New Franklin
The median household income in New Franklin is $47,768, with the highest median household income of $72,885 found in the 25 to 44 years age bracket for the primary householder. A total of 122 households (35.4%) fall into this category. Meanwhile, the 15 to 24 years age bracket for the primary householder has the lowest median household income of $0, with 8 households (2.3%) in this group.
| Income Bracket | # Households | Median Income |
| 15 to 24 Years | 8 (2.3%) | $0 |
| 25 to 44 Years | 122 (35.4%) | $72,885 |
| 45 to 64 Years | 81 (23.5%) | $0 |
| 65+ Years | 134 (38.8%) | $35,000 |
| Total | 345 (100.0%) | $47,768 |
Poverty in New Franklin
Income Below Poverty by Sex and Age in New Franklin
With 24.3% poverty level for males and 13.8% for females among the residents of New Franklin, 15 year old males and under 5 year old females are the most vulnerable to poverty, with 8 males (100.0%) and 20 females (58.8%) in their respective age groups living below the poverty level.
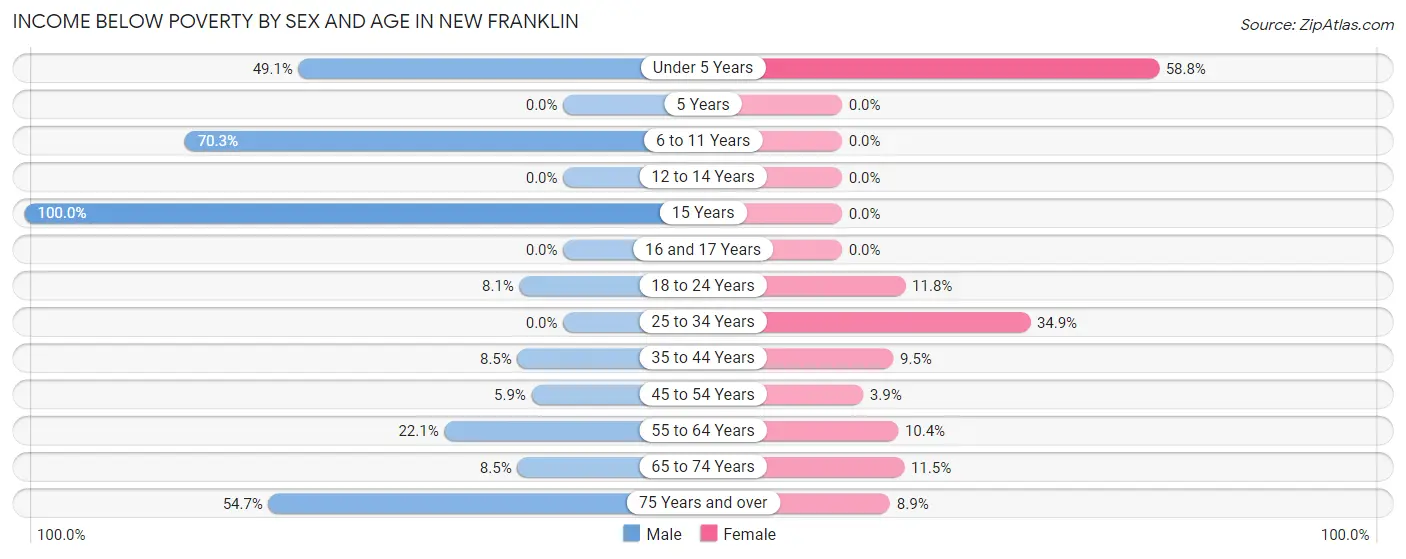
| Age Bracket | Male | Female |
| Under 5 Years | 28 (49.1%) | 20 (58.8%) |
| 5 Years | 0 (0.0%) | 0 (0.0%) |
| 6 to 11 Years | 26 (70.3%) | 0 (0.0%) |
| 12 to 14 Years | 0 (0.0%) | 0 (0.0%) |
| 15 Years | 8 (100.0%) | 0 (0.0%) |
| 16 and 17 Years | 0 (0.0%) | 0 (0.0%) |
| 18 to 24 Years | 3 (8.1%) | 4 (11.8%) |
| 25 to 34 Years | 0 (0.0%) | 22 (34.9%) |
| 35 to 44 Years | 9 (8.5%) | 8 (9.5%) |
| 45 to 54 Years | 1 (5.9%) | 2 (3.9%) |
| 55 to 64 Years | 15 (22.1%) | 5 (10.4%) |
| 65 to 74 Years | 4 (8.5%) | 6 (11.5%) |
| 75 Years and over | 35 (54.7%) | 5 (8.9%) |
| Total | 129 (24.3%) | 72 (13.8%) |
Income Above Poverty by Sex and Age in New Franklin
According to the poverty statistics in New Franklin, males aged 5 years and females aged 6 to 11 years are the age groups that are most secure financially, with 100.0% of males and 100.0% of females in these age groups living above the poverty line.
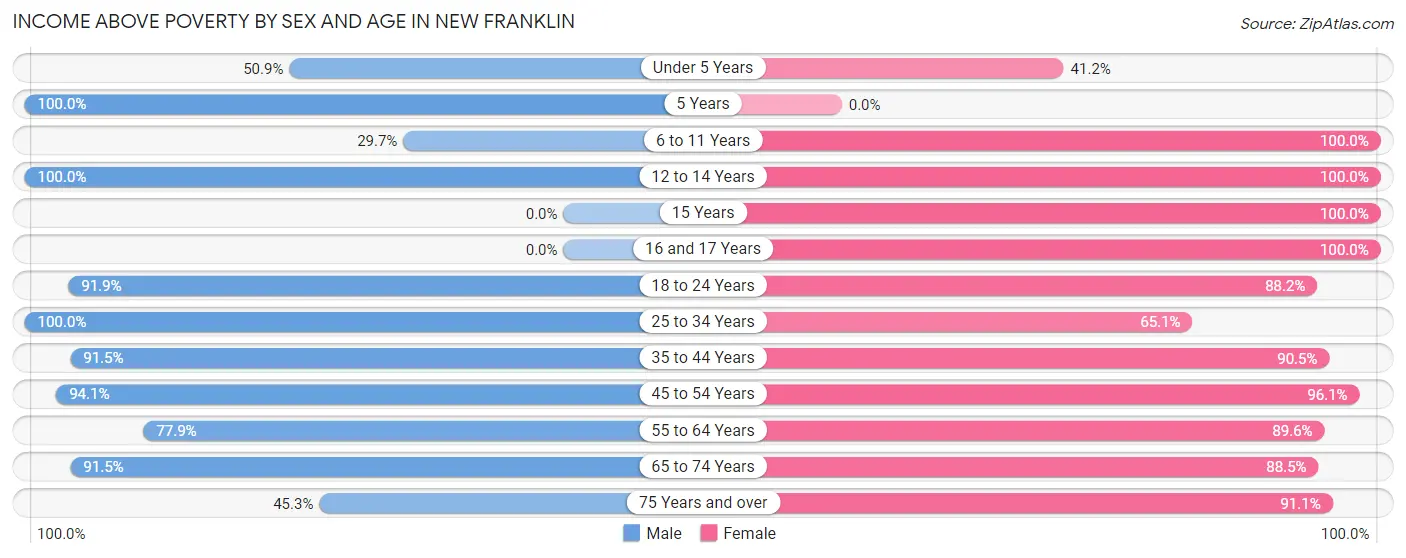
| Age Bracket | Male | Female |
| Under 5 Years | 29 (50.9%) | 14 (41.2%) |
| 5 Years | 4 (100.0%) | 0 (0.0%) |
| 6 to 11 Years | 11 (29.7%) | 43 (100.0%) |
| 12 to 14 Years | 14 (100.0%) | 29 (100.0%) |
| 15 Years | 0 (0.0%) | 8 (100.0%) |
| 16 and 17 Years | 0 (0.0%) | 19 (100.0%) |
| 18 to 24 Years | 34 (91.9%) | 30 (88.2%) |
| 25 to 34 Years | 71 (100.0%) | 41 (65.1%) |
| 35 to 44 Years | 97 (91.5%) | 76 (90.5%) |
| 45 to 54 Years | 16 (94.1%) | 49 (96.1%) |
| 55 to 64 Years | 53 (77.9%) | 43 (89.6%) |
| 65 to 74 Years | 43 (91.5%) | 46 (88.5%) |
| 75 Years and over | 29 (45.3%) | 51 (91.1%) |
| Total | 401 (75.7%) | 449 (86.2%) |
Income Below Poverty Among Married-Couple Families in New Franklin
The poverty statistics for married-couple families in New Franklin show that 5.7% or 9 of the total 159 families live below the poverty line. Families with 3 or 4 children have the highest poverty rate of 69.2%, comprising of 9 families. On the other hand, families with no children have the lowest poverty rate of 0.0%, which includes 0 families.
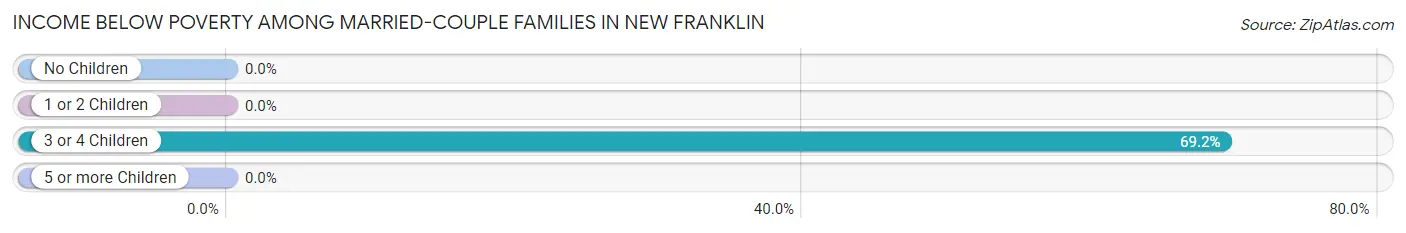
| Children | Above Poverty | Below Poverty |
| No Children | 84 (100.0%) | 0 (0.0%) |
| 1 or 2 Children | 62 (100.0%) | 0 (0.0%) |
| 3 or 4 Children | 4 (30.8%) | 9 (69.2%) |
| 5 or more Children | 0 (0.0%) | 0 (0.0%) |
| Total | 150 (94.3%) | 9 (5.7%) |
Income Below Poverty Among Single-Parent Households in New Franklin
According to the poverty data in New Franklin, 10.0% or 1 single-father households and 37.9% or 22 single-mother households are living below the poverty line. Among single-father households, those with no children have the highest poverty rate, with 1 households (16.7%) experiencing poverty. Likewise, among single-mother households, those with 1 or 2 children have the highest poverty rate, with 13 households (100.0%) falling below the poverty line.
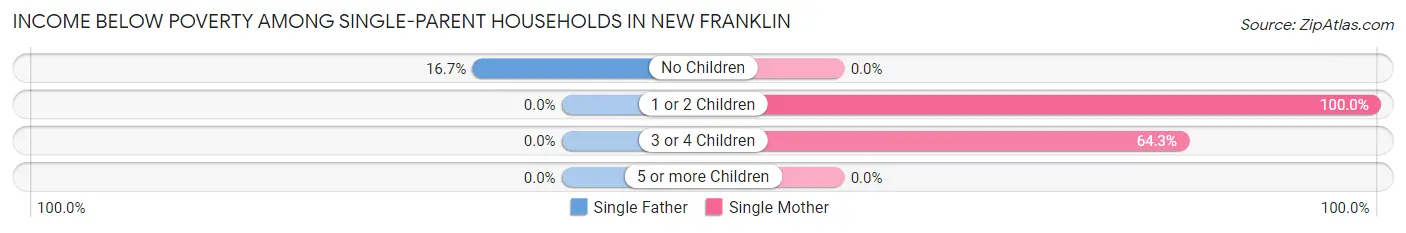
| Children | Single Father | Single Mother |
| No Children | 1 (16.7%) | 0 (0.0%) |
| 1 or 2 Children | 0 (0.0%) | 13 (100.0%) |
| 3 or 4 Children | 0 (0.0%) | 9 (64.3%) |
| 5 or more Children | 0 (0.0%) | 0 (0.0%) |
| Total | 1 (10.0%) | 22 (37.9%) |
Income Below Poverty Among Married-Couple vs Single-Parent Households in New Franklin
The poverty data for New Franklin shows that 9 of the married-couple family households (5.7%) and 23 of the single-parent households (33.8%) are living below the poverty level. Within the married-couple family households, those with 3 or 4 children have the highest poverty rate, with 9 households (69.2%) falling below the poverty line. Among the single-parent households, those with 1 or 2 children have the highest poverty rate, with 13 household (76.5%) living below poverty.
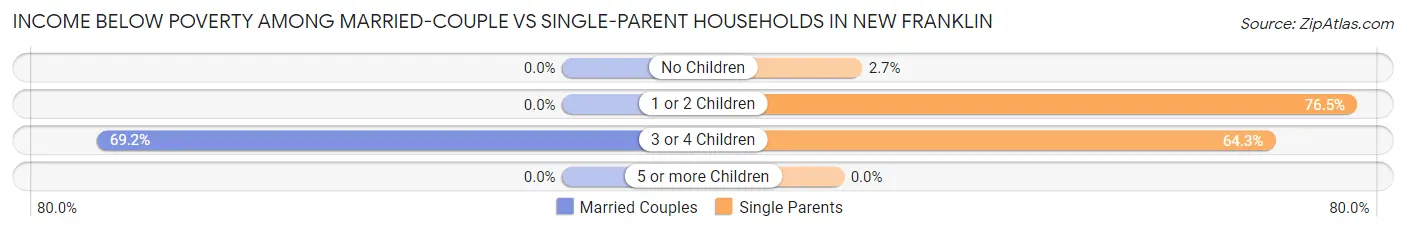
| Children | Married-Couple Families | Single-Parent Households |
| No Children | 0 (0.0%) | 1 (2.7%) |
| 1 or 2 Children | 0 (0.0%) | 13 (76.5%) |
| 3 or 4 Children | 9 (69.2%) | 9 (64.3%) |
| 5 or more Children | 0 (0.0%) | 0 (0.0%) |
| Total | 9 (5.7%) | 23 (33.8%) |
Race in New Franklin
The most populous races in New Franklin are White / Caucasian (940 | 88.9%), Black / African American (66 | 6.2%), and Two or more Races (34 | 3.2%).
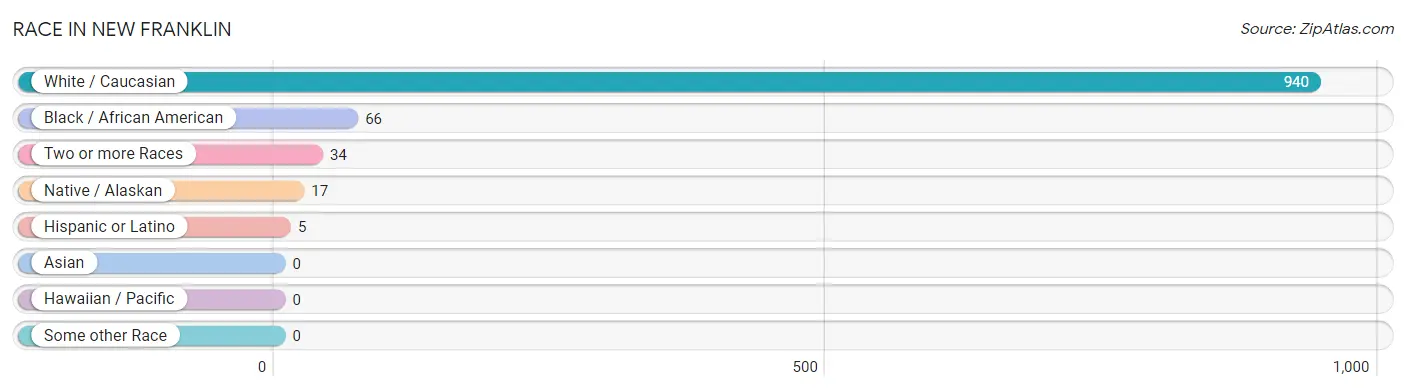
| Race | # Population | % Population |
| Asian | 0 | 0.0% |
| Black / African American | 66 | 6.2% |
| Hawaiian / Pacific | 0 | 0.0% |
| Hispanic or Latino | 5 | 0.5% |
| Native / Alaskan | 17 | 1.6% |
| White / Caucasian | 940 | 88.9% |
| Two or more Races | 34 | 3.2% |
| Some other Race | 0 | 0.0% |
| Total | 1,057 | 100.0% |
Ancestry in New Franklin
The most populous ancestries reported in New Franklin are German (302 | 28.6%), English (188 | 17.8%), Irish (132 | 12.5%), Cajun (31 | 2.9%), and American (20 | 1.9%), together accounting for 63.7% of all New Franklin residents.
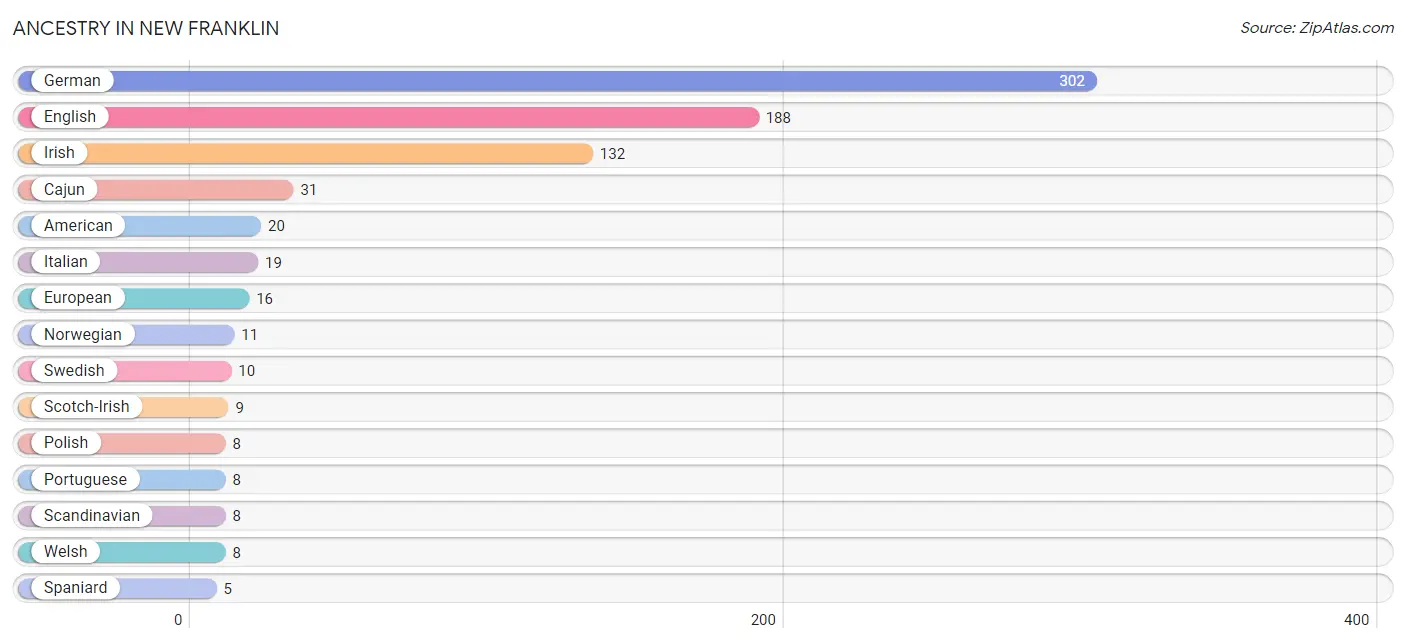
| Ancestry | # Population | % Population |
| American | 20 | 1.9% |
| Blackfeet | 3 | 0.3% |
| Cajun | 31 | 2.9% |
| Dutch | 3 | 0.3% |
| English | 188 | 17.8% |
| European | 16 | 1.5% |
| German | 302 | 28.6% |
| Irish | 132 | 12.5% |
| Italian | 19 | 1.8% |
| Native Hawaiian | 2 | 0.2% |
| Norwegian | 11 | 1.0% |
| Polish | 8 | 0.8% |
| Portuguese | 8 | 0.8% |
| Scandinavian | 8 | 0.8% |
| Scotch-Irish | 9 | 0.9% |
| Scottish | 3 | 0.3% |
| Spaniard | 5 | 0.5% |
| Swedish | 10 | 0.9% |
| Welsh | 8 | 0.8% | View All 19 Rows |
Immigrants in New Franklin

| Immigration Origin | # Population | % Population | View All 0 Rows |
Sex and Age in New Franklin
Sex and Age in New Franklin
The most populous age groups in New Franklin are 40 to 44 Years (85 | 15.9%) for men and 35 to 39 Years (47 | 9.0%) for women.
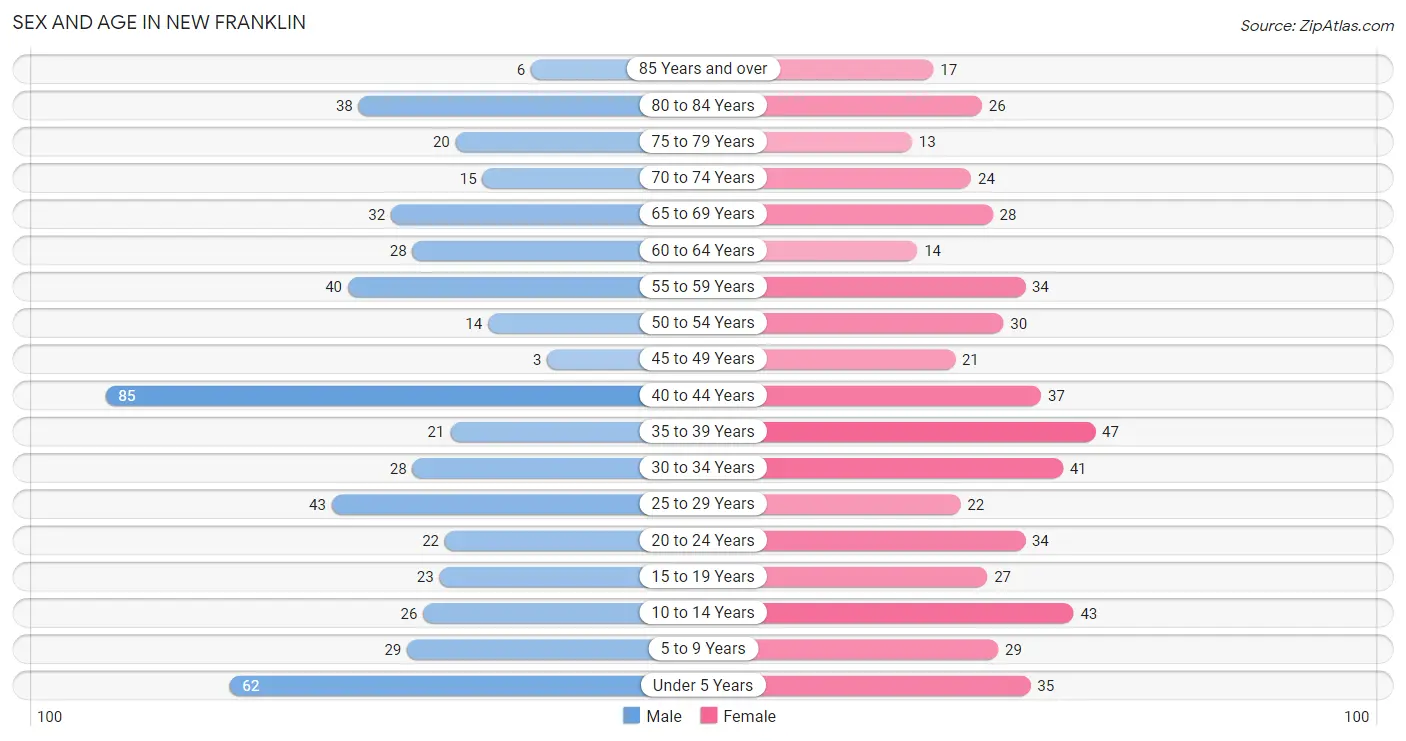
| Age Bracket | Male | Female |
| Under 5 Years | 62 (11.6%) | 35 (6.7%) |
| 5 to 9 Years | 29 (5.4%) | 29 (5.6%) |
| 10 to 14 Years | 26 (4.9%) | 43 (8.2%) |
| 15 to 19 Years | 23 (4.3%) | 27 (5.2%) |
| 20 to 24 Years | 22 (4.1%) | 34 (6.5%) |
| 25 to 29 Years | 43 (8.0%) | 22 (4.2%) |
| 30 to 34 Years | 28 (5.2%) | 41 (7.9%) |
| 35 to 39 Years | 21 (3.9%) | 47 (9.0%) |
| 40 to 44 Years | 85 (15.9%) | 37 (7.1%) |
| 45 to 49 Years | 3 (0.6%) | 21 (4.0%) |
| 50 to 54 Years | 14 (2.6%) | 30 (5.8%) |
| 55 to 59 Years | 40 (7.5%) | 34 (6.5%) |
| 60 to 64 Years | 28 (5.2%) | 14 (2.7%) |
| 65 to 69 Years | 32 (6.0%) | 28 (5.4%) |
| 70 to 74 Years | 15 (2.8%) | 24 (4.6%) |
| 75 to 79 Years | 20 (3.7%) | 13 (2.5%) |
| 80 to 84 Years | 38 (7.1%) | 26 (5.0%) |
| 85 Years and over | 6 (1.1%) | 17 (3.3%) |
| Total | 535 (100.0%) | 522 (100.0%) |
Families and Households in New Franklin
Median Family Size in New Franklin
The median family size in New Franklin is 3.74 persons per family, with married-couple families (159 | 70.0%) accounting for the largest median family size of 3.84 persons per family. On the other hand, single female/mother families (58 | 25.6%) represent the smallest median family size with 3.52 persons per family.
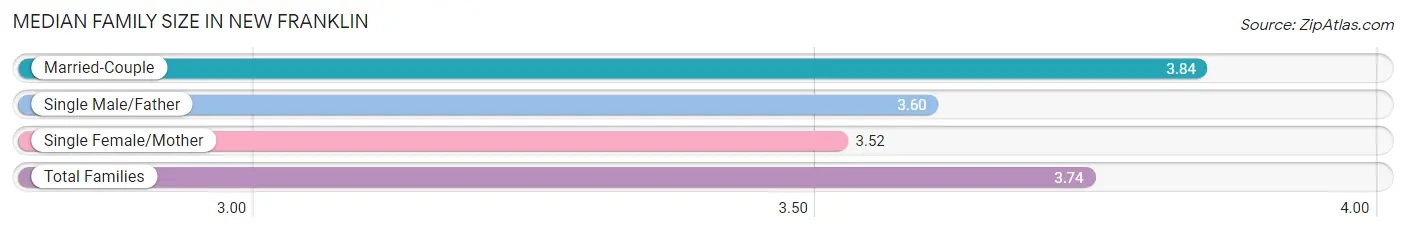
| Family Type | # Families | Family Size |
| Married-Couple | 159 (70.0%) | 3.84 |
| Single Male/Father | 10 (4.4%) | 3.60 |
| Single Female/Mother | 58 (25.6%) | 3.52 |
| Total Families | 227 (100.0%) | 3.74 |
Median Household Size in New Franklin
The median household size in New Franklin is 3.06 persons per household, with single male/father households (10 | 2.9%) accounting for the largest median household size of 7.7 persons per household. non-family households (118 | 34.2%) represent the smallest median household size with 1.29 persons per household.
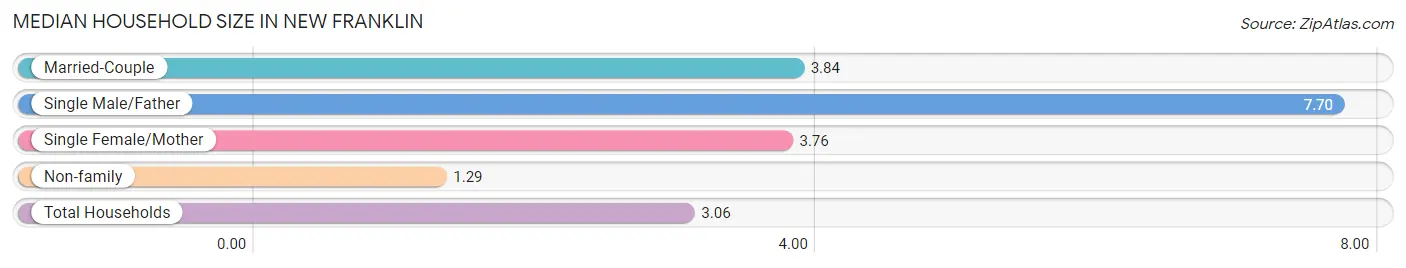
| Household Type | # Households | Household Size |
| Married-Couple | 159 (46.1%) | 3.84 |
| Single Male/Father | 10 (2.9%) | 7.70 |
| Single Female/Mother | 58 (16.8%) | 3.76 |
| Non-family | 118 (34.2%) | 1.29 |
| Total Households | 345 (100.0%) | 3.06 |
Household Size by Marriage Status in New Franklin
Out of a total of 345 households in New Franklin, 227 (65.8%) are family households, while 118 (34.2%) are nonfamily households. The most numerous type of family households are 2-person households, comprising 107, and the most common type of nonfamily households are 1-person households, comprising 94.
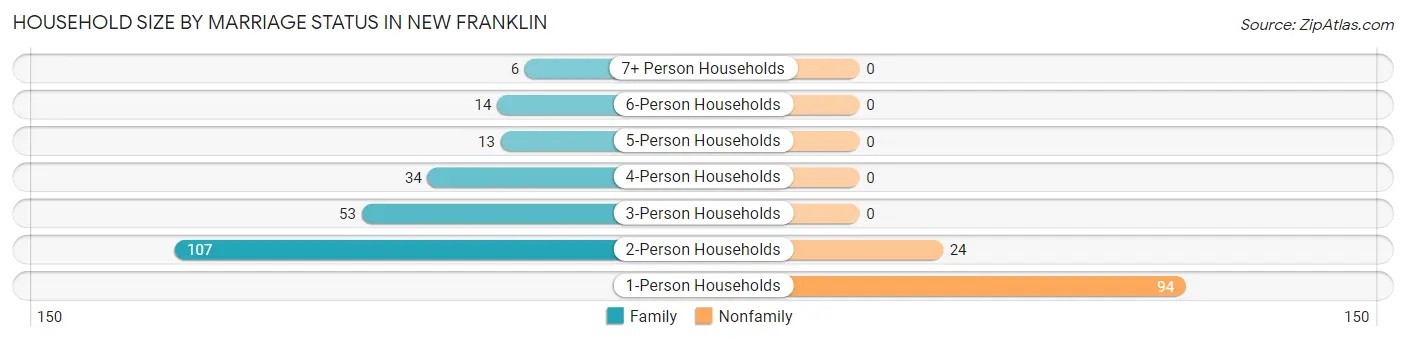
| Household Size | Family Households | Nonfamily Households |
| 1-Person Households | - | 94 (27.3%) |
| 2-Person Households | 107 (31.0%) | 24 (7.0%) |
| 3-Person Households | 53 (15.4%) | 0 (0.0%) |
| 4-Person Households | 34 (9.9%) | 0 (0.0%) |
| 5-Person Households | 13 (3.8%) | 0 (0.0%) |
| 6-Person Households | 14 (4.1%) | 0 (0.0%) |
| 7+ Person Households | 6 (1.7%) | 0 (0.0%) |
| Total | 227 (65.8%) | 118 (34.2%) |
Female Fertility in New Franklin
Fertility by Age in New Franklin
Average fertility rate in New Franklin is 96.0 births per 1,000 women. Women in the age bracket of 20 to 34 years have the highest fertility rate with 237.0 births per 1,000 women. Women in the age bracket of 20 to 34 years acount for 100.0% of all women with births.
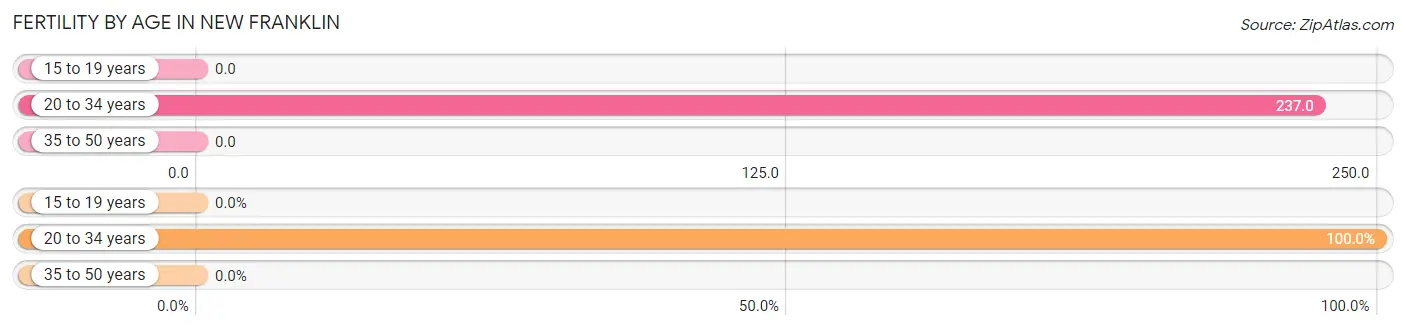
| Age Bracket | Women with Births | Births / 1,000 Women |
| 15 to 19 years | 0 (0.0%) | 0.0 |
| 20 to 34 years | 23 (100.0%) | 237.0 |
| 35 to 50 years | 0 (0.0%) | 0.0 |
| Total | 23 (100.0%) | 96.0 |
Fertility by Age by Marriage Status in New Franklin
52.2% of women with births (23) in New Franklin are married. The highest percentage of unmarried women with births falls into 20 to 34 years age bracket with 47.8% of them unmarried at the time of birth, while the lowest percentage of unmarried women with births belong to 20 to 34 years age bracket with 47.8% of them unmarried.
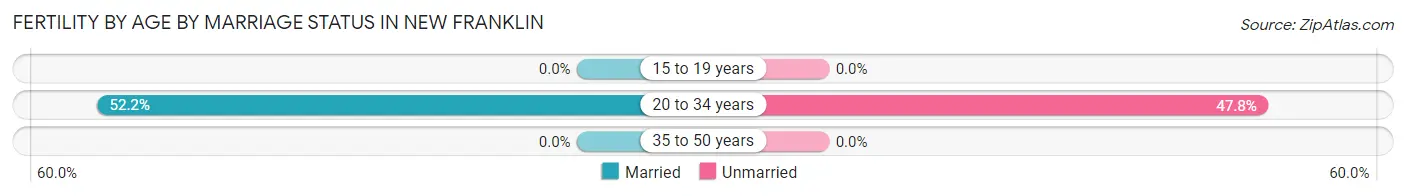
| Age Bracket | Married | Unmarried |
| 15 to 19 years | 0 (0.0%) | 0 (0.0%) |
| 20 to 34 years | 12 (52.2%) | 11 (47.8%) |
| 35 to 50 years | 0 (0.0%) | 0 (0.0%) |
| Total | 12 (52.2%) | 11 (47.8%) |
Fertility by Education in New Franklin
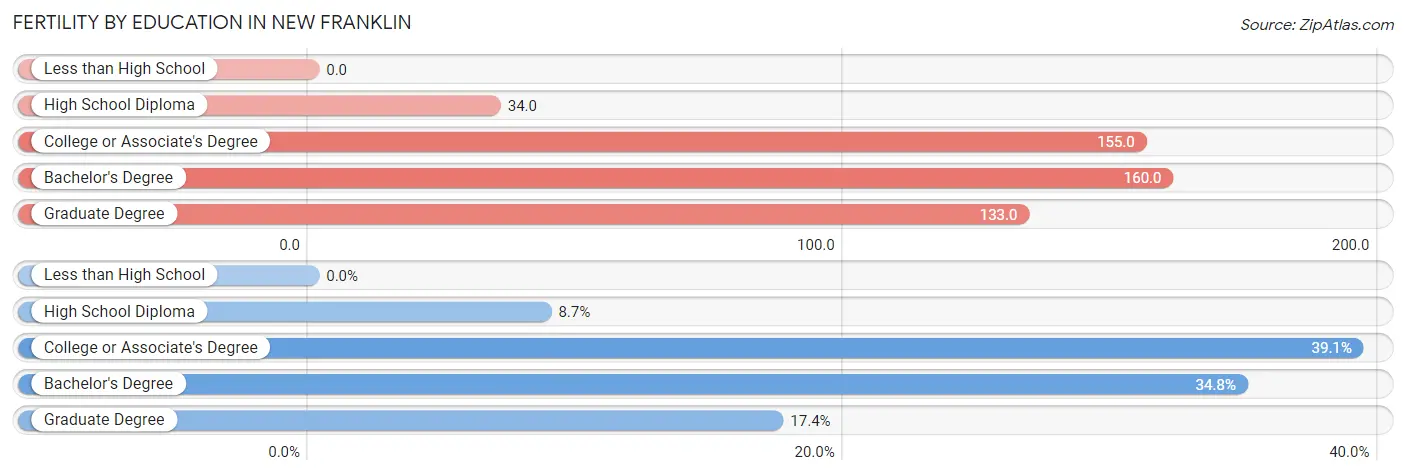
| Educational Attainment | Women with Births | Births / 1,000 Women |
| Less than High School | 0 (0.0%) | 0.0 |
| High School Diploma | 2 (8.7%) | 34.0 |
| College or Associate's Degree | 9 (39.1%) | 155.0 |
| Bachelor's Degree | 8 (34.8%) | 160.0 |
| Graduate Degree | 4 (17.4%) | 133.0 |
| Total | 23 (100.0%) | 96.0 |
Fertility by Education by Marriage Status in New Franklin
47.8% of women with births in New Franklin are unmarried. Women with the educational attainment of bachelor's degree are most likely to be married with 100.0% of them married at childbirth, while women with the educational attainment of high school diploma are least likely to be married with 100.0% of them unmarried at childbirth.
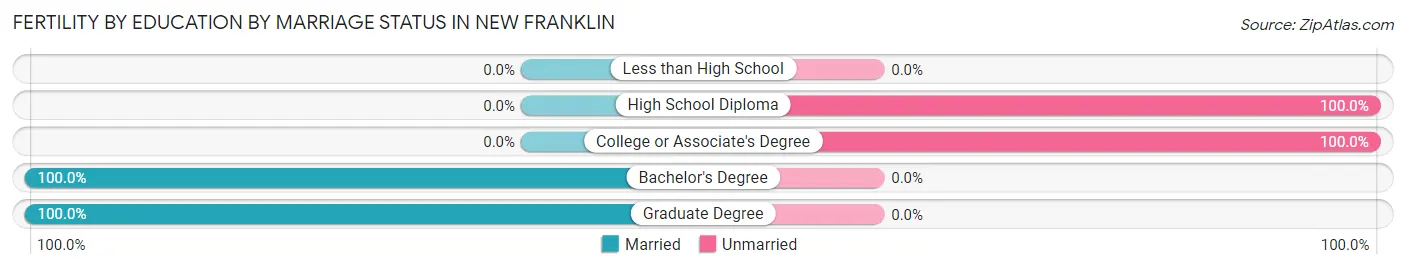
| Educational Attainment | Married | Unmarried |
| Less than High School | 0 (0.0%) | 0 (0.0%) |
| High School Diploma | 0 (0.0%) | 2 (100.0%) |
| College or Associate's Degree | 0 (0.0%) | 9 (100.0%) |
| Bachelor's Degree | 8 (100.0%) | 0 (0.0%) |
| Graduate Degree | 4 (100.0%) | 0 (0.0%) |
| Total | 12 (52.2%) | 11 (47.8%) |
Employment Characteristics in New Franklin
Employment by Class of Employer in New Franklin
Among the 436 employed individuals in New Franklin, private company employees (289 | 66.3%), local government employees (44 | 10.1%), and not-for-profit organizations (35 | 8.0%) make up the most common classes of employment.
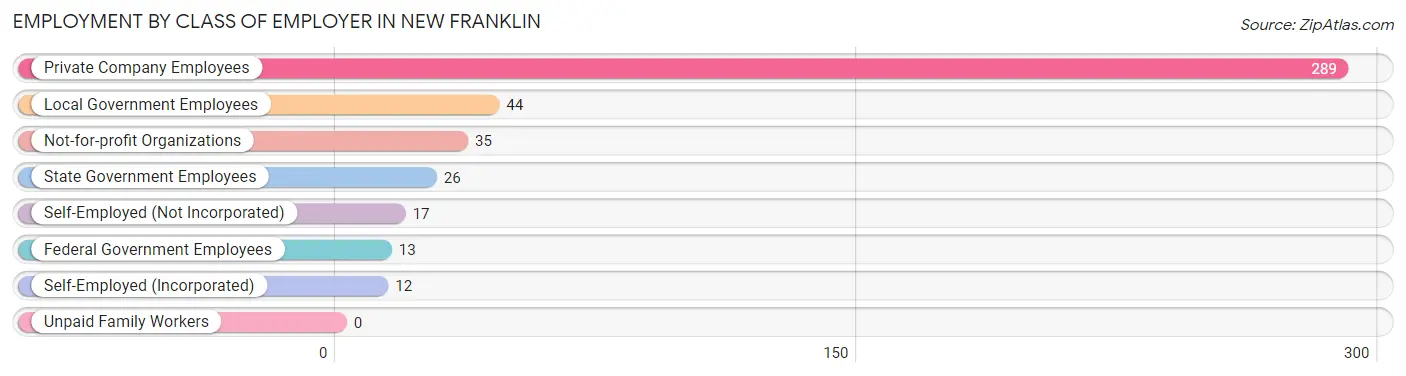
| Employer Class | # Employees | % Employees |
| Private Company Employees | 289 | 66.3% |
| Self-Employed (Incorporated) | 12 | 2.8% |
| Self-Employed (Not Incorporated) | 17 | 3.9% |
| Not-for-profit Organizations | 35 | 8.0% |
| Local Government Employees | 44 | 10.1% |
| State Government Employees | 26 | 6.0% |
| Federal Government Employees | 13 | 3.0% |
| Unpaid Family Workers | 0 | 0.0% |
| Total | 436 | 100.0% |
Employment Status by Age in New Franklin
According to the labor force statistics for New Franklin, out of the total population over 16 years of age (817), 54.6% or 446 individuals are in the labor force, with 2.2% or 10 of them unemployed. The age group with the highest labor force participation rate is 30 to 34 years, with 97.1% or 67 individuals in the labor force. Within the labor force, the 16 to 19 years age range has the highest percentage of unemployed individuals, with 23.8% or 5 of them being unemployed.
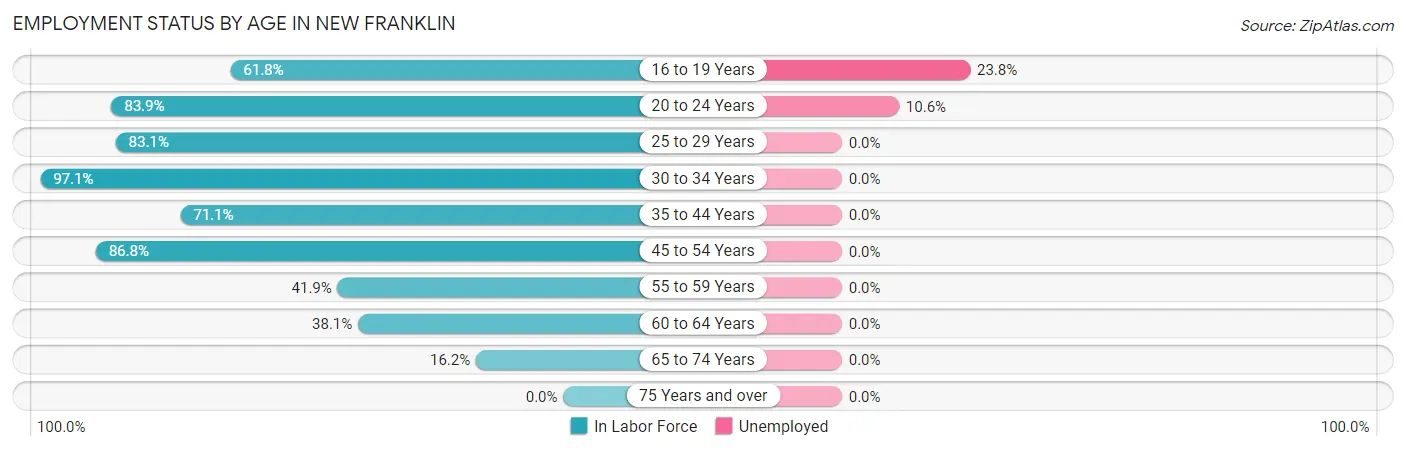
| Age Bracket | In Labor Force | Unemployed |
| 16 to 19 Years | 21 (61.8%) | 5 (23.8%) |
| 20 to 24 Years | 47 (83.9%) | 5 (10.6%) |
| 25 to 29 Years | 54 (83.1%) | 0 (0.0%) |
| 30 to 34 Years | 67 (97.1%) | 0 (0.0%) |
| 35 to 44 Years | 135 (71.1%) | 0 (0.0%) |
| 45 to 54 Years | 59 (86.8%) | 0 (0.0%) |
| 55 to 59 Years | 31 (41.9%) | 0 (0.0%) |
| 60 to 64 Years | 16 (38.1%) | 0 (0.0%) |
| 65 to 74 Years | 16 (16.2%) | 0 (0.0%) |
| 75 Years and over | 0 (0.0%) | 0 (0.0%) |
| Total | 446 (54.6%) | 10 (2.2%) |
Employment Status by Educational Attainment in New Franklin
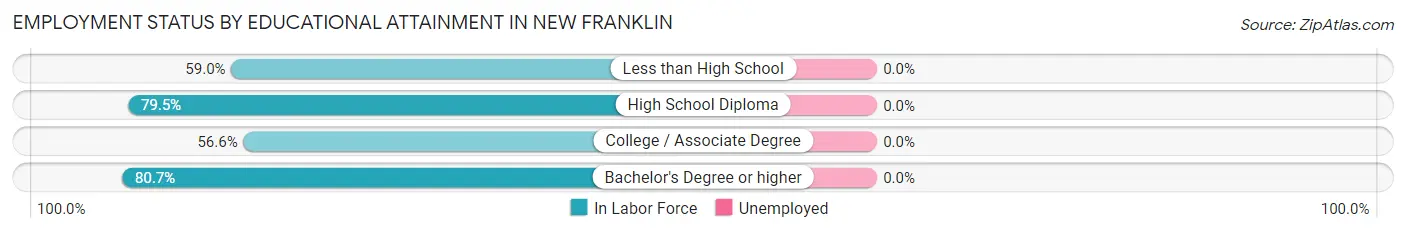
| Educational Attainment | In Labor Force | Unemployed |
| Less than High School | 36 (59.0%) | 0 (0.0%) |
| High School Diploma | 140 (79.5%) | 0 (0.0%) |
| College / Associate Degree | 77 (56.6%) | 0 (0.0%) |
| Bachelor's Degree or higher | 109 (80.7%) | 0 (0.0%) |
| Total | 362 (71.3%) | 0 (0.0%) |
Employment Occupations by Sex in New Franklin
Management, Business, Science and Arts Occupations
The most common Management, Business, Science and Arts occupations in New Franklin are Management (40 | 9.2%), Community & Social Service (36 | 8.3%), Education Instruction & Library (27 | 6.2%), Business & Financial (22 | 5.1%), and Health Diagnosing & Treating (14 | 3.2%).
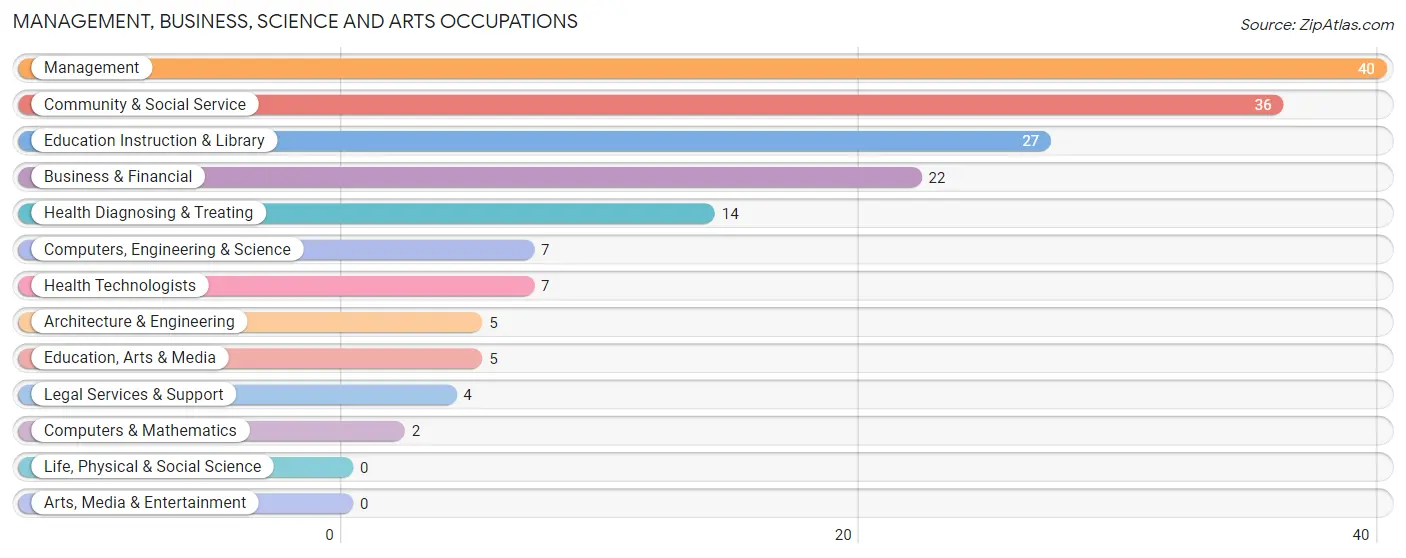
Management, Business, Science and Arts Occupations by Sex
Within the Management, Business, Science and Arts occupations in New Franklin, the most male-oriented occupations are Architecture & Engineering (100.0%), Computers, Engineering & Science (71.4%), and Business & Financial (59.1%), while the most female-oriented occupations are Computers & Mathematics (100.0%), Education, Arts & Media (100.0%), and Legal Services & Support (100.0%).
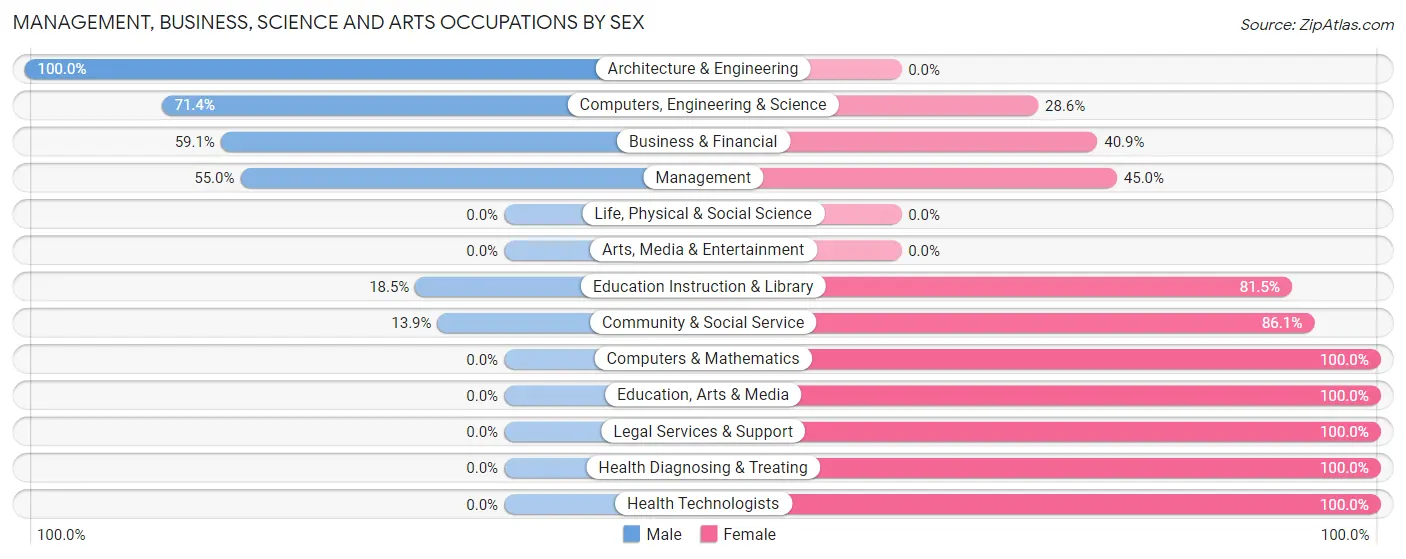
| Occupation | Male | Female |
| Management | 22 (55.0%) | 18 (45.0%) |
| Business & Financial | 13 (59.1%) | 9 (40.9%) |
| Computers, Engineering & Science | 5 (71.4%) | 2 (28.6%) |
| Computers & Mathematics | 0 (0.0%) | 2 (100.0%) |
| Architecture & Engineering | 5 (100.0%) | 0 (0.0%) |
| Life, Physical & Social Science | 0 (0.0%) | 0 (0.0%) |
| Community & Social Service | 5 (13.9%) | 31 (86.1%) |
| Education, Arts & Media | 0 (0.0%) | 5 (100.0%) |
| Legal Services & Support | 0 (0.0%) | 4 (100.0%) |
| Education Instruction & Library | 5 (18.5%) | 22 (81.5%) |
| Arts, Media & Entertainment | 0 (0.0%) | 0 (0.0%) |
| Health Diagnosing & Treating | 0 (0.0%) | 14 (100.0%) |
| Health Technologists | 0 (0.0%) | 7 (100.0%) |
| Total (Category) | 45 (37.8%) | 74 (62.2%) |
| Total (Overall) | 227 (52.1%) | 209 (47.9%) |
Services Occupations
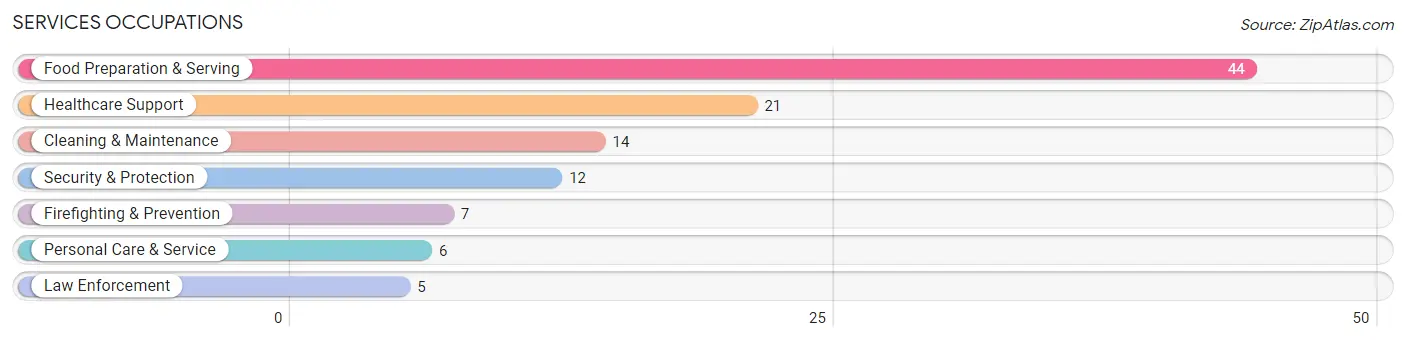
The most common Services occupations in New Franklin are Food Preparation & Serving (44 | 10.1%), Healthcare Support (21 | 4.8%), Cleaning & Maintenance (14 | 3.2%), Security & Protection (12 | 2.8%), and Firefighting & Prevention (7 | 1.6%).
Services Occupations by Sex
Within the Services occupations in New Franklin, the most male-oriented occupations are Law Enforcement (100.0%), Cleaning & Maintenance (100.0%), and Security & Protection (41.7%), while the most female-oriented occupations are Healthcare Support (100.0%), Firefighting & Prevention (100.0%), and Personal Care & Service (66.7%).
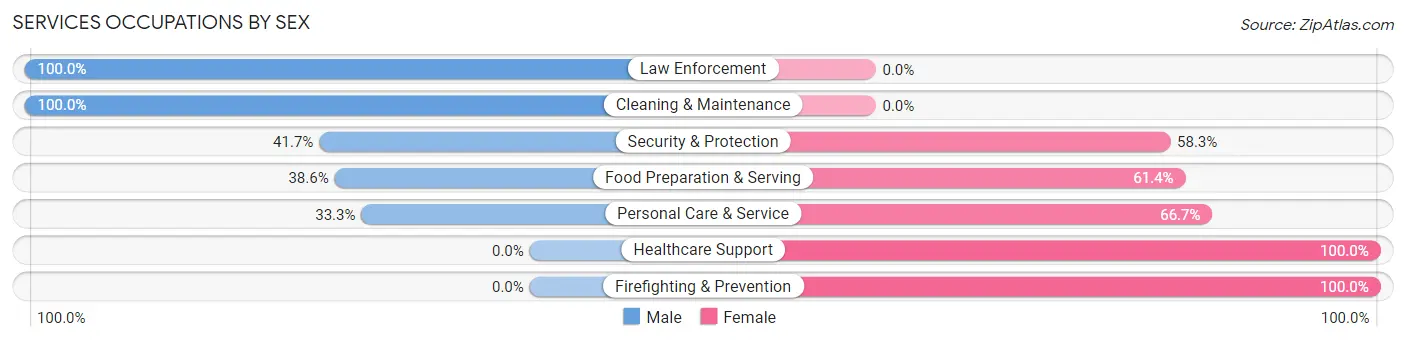
| Occupation | Male | Female |
| Healthcare Support | 0 (0.0%) | 21 (100.0%) |
| Security & Protection | 5 (41.7%) | 7 (58.3%) |
| Firefighting & Prevention | 0 (0.0%) | 7 (100.0%) |
| Law Enforcement | 5 (100.0%) | 0 (0.0%) |
| Food Preparation & Serving | 17 (38.6%) | 27 (61.4%) |
| Cleaning & Maintenance | 14 (100.0%) | 0 (0.0%) |
| Personal Care & Service | 2 (33.3%) | 4 (66.7%) |
| Total (Category) | 38 (39.2%) | 59 (60.8%) |
| Total (Overall) | 227 (52.1%) | 209 (47.9%) |
Sales and Office Occupations
The most common Sales and Office occupations in New Franklin are Office & Administration (43 | 9.9%), and Sales & Related (38 | 8.7%).

Sales and Office Occupations by Sex

| Occupation | Male | Female |
| Sales & Related | 8 (21.0%) | 30 (78.9%) |
| Office & Administration | 8 (18.6%) | 35 (81.4%) |
| Total (Category) | 16 (19.8%) | 65 (80.2%) |
| Total (Overall) | 227 (52.1%) | 209 (47.9%) |
Natural Resources, Construction and Maintenance Occupations
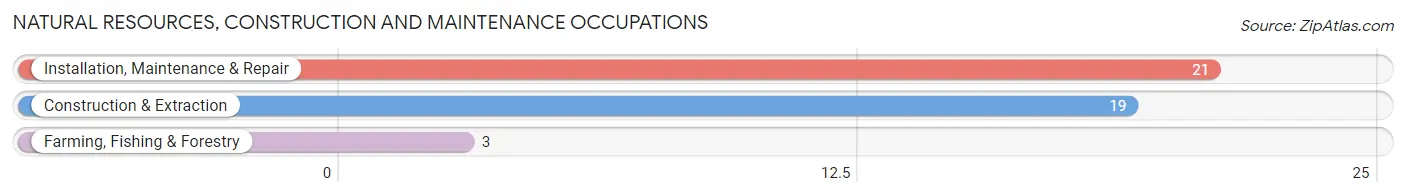
The most common Natural Resources, Construction and Maintenance occupations in New Franklin are Installation, Maintenance & Repair (21 | 4.8%), Construction & Extraction (19 | 4.4%), and Farming, Fishing & Forestry (3 | 0.7%).
Natural Resources, Construction and Maintenance Occupations by Sex
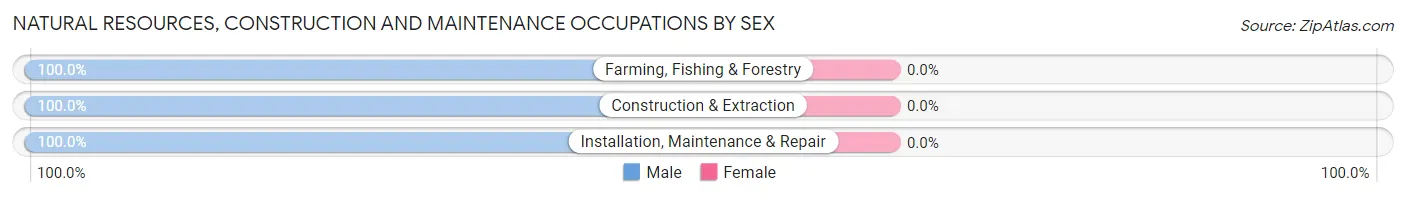
| Occupation | Male | Female |
| Farming, Fishing & Forestry | 3 (100.0%) | 0 (0.0%) |
| Construction & Extraction | 19 (100.0%) | 0 (0.0%) |
| Installation, Maintenance & Repair | 21 (100.0%) | 0 (0.0%) |
| Total (Category) | 43 (100.0%) | 0 (0.0%) |
| Total (Overall) | 227 (52.1%) | 209 (47.9%) |
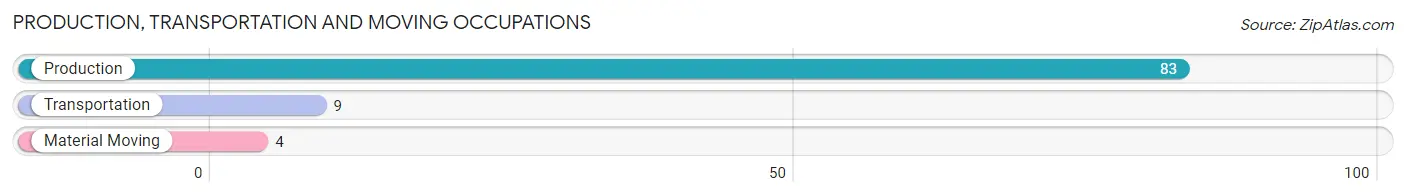
Production, Transportation and Moving Occupations
The most common Production, Transportation and Moving occupations in New Franklin are Production (83 | 19.0%), Transportation (9 | 2.1%), and Material Moving (4 | 0.9%).
Production, Transportation and Moving Occupations by Sex
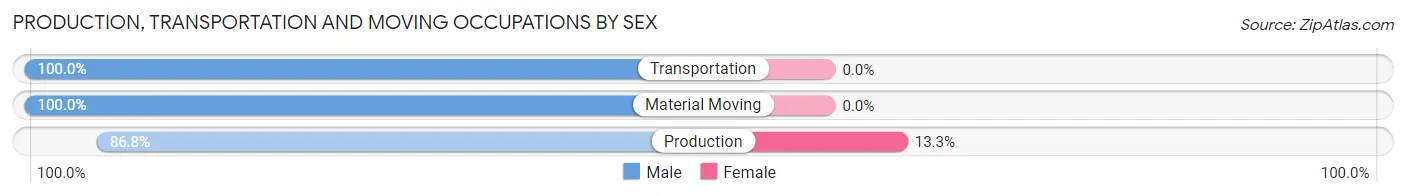
| Occupation | Male | Female |
| Production | 72 (86.8%) | 11 (13.3%) |
| Transportation | 9 (100.0%) | 0 (0.0%) |
| Material Moving | 4 (100.0%) | 0 (0.0%) |
| Total (Category) | 85 (88.5%) | 11 (11.5%) |
| Total (Overall) | 227 (52.1%) | 209 (47.9%) |
Employment Industries by Sex in New Franklin
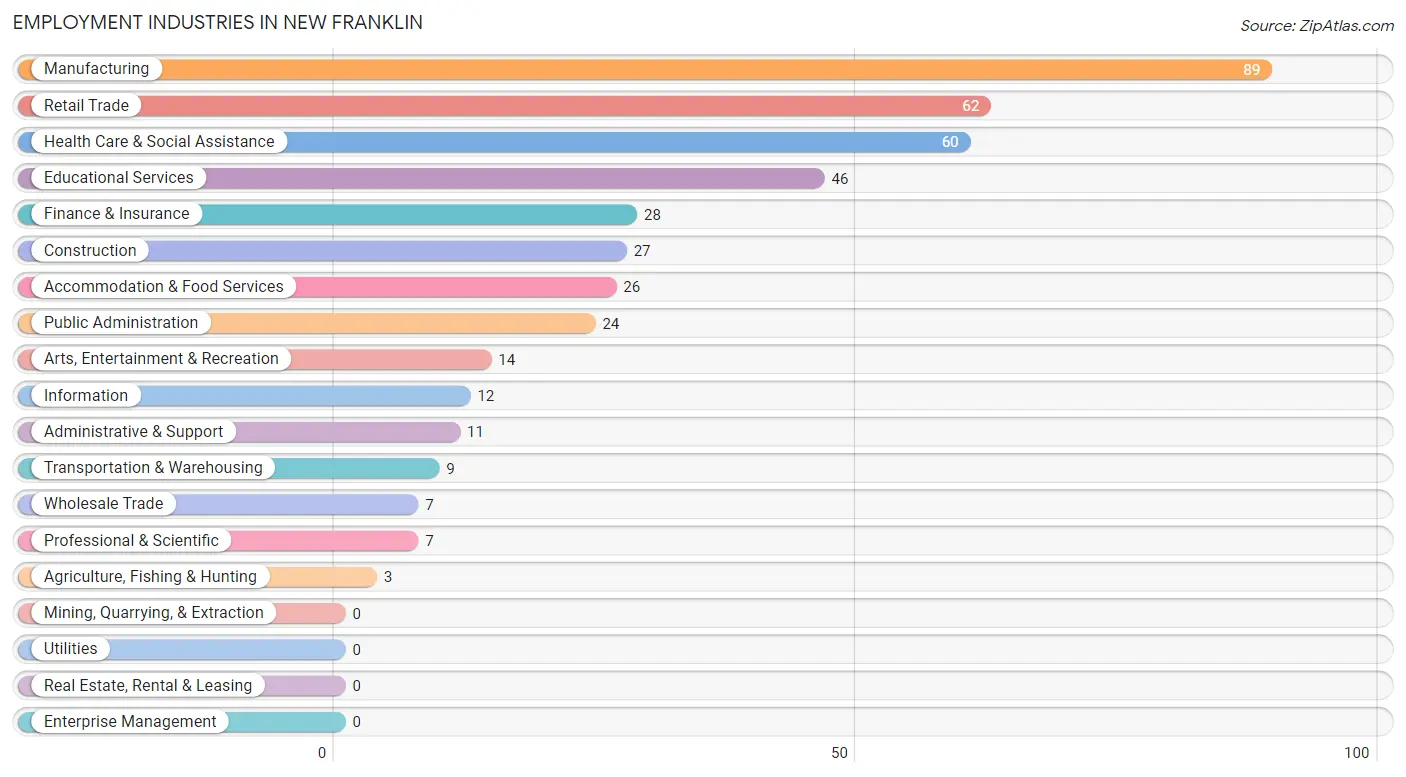
Employment Industries in New Franklin
The major employment industries in New Franklin include Manufacturing (89 | 20.4%), Retail Trade (62 | 14.2%), Health Care & Social Assistance (60 | 13.8%), Educational Services (46 | 10.5%), and Finance & Insurance (28 | 6.4%).
Employment Industries by Sex in New Franklin
The New Franklin industries that see more men than women are Agriculture, Fishing & Hunting (100.0%), Construction (100.0%), and Wholesale Trade (100.0%), whereas the industries that tend to have a higher number of women are Information (100.0%), Finance & Insurance (89.3%), and Health Care & Social Assistance (85.0%).
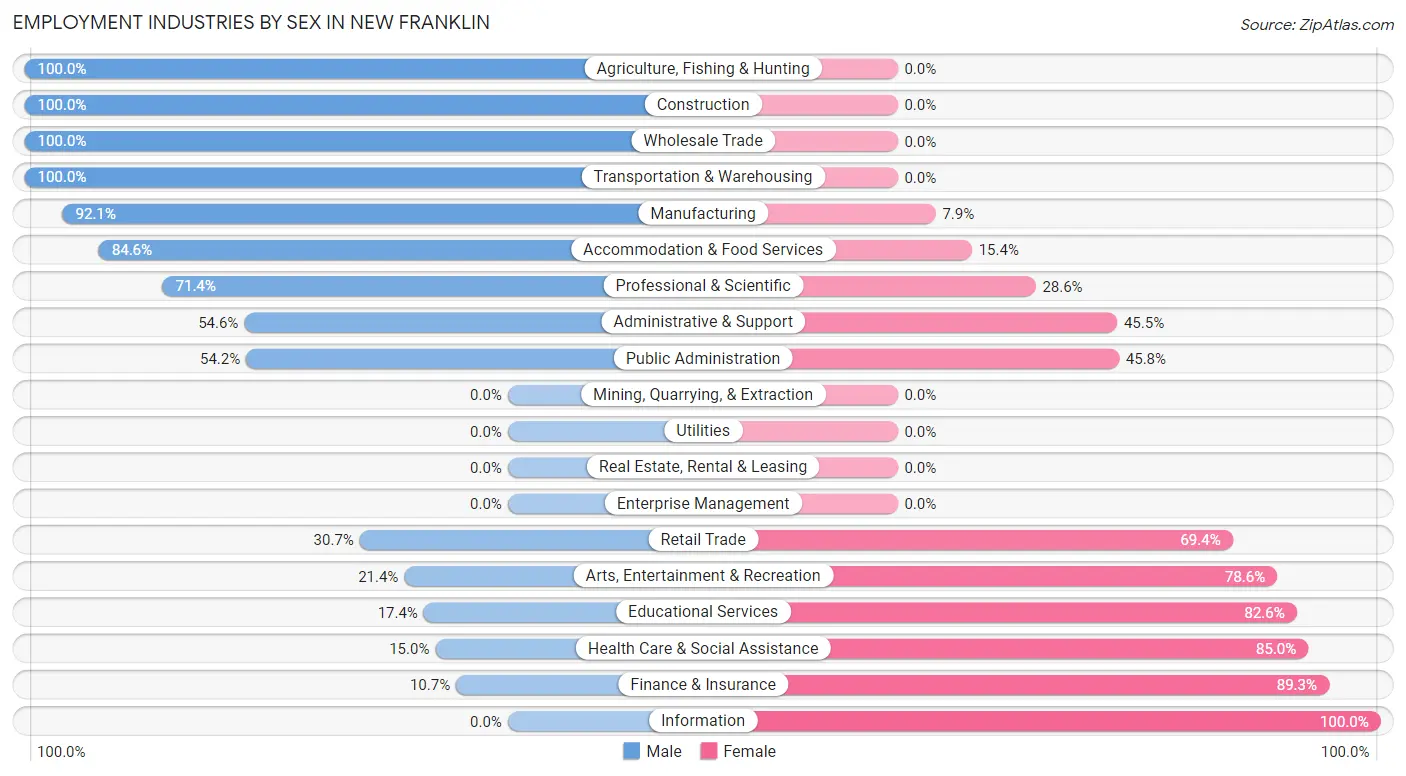
| Industry | Male | Female |
| Agriculture, Fishing & Hunting | 3 (100.0%) | 0 (0.0%) |
| Mining, Quarrying, & Extraction | 0 (0.0%) | 0 (0.0%) |
| Construction | 27 (100.0%) | 0 (0.0%) |
| Manufacturing | 82 (92.1%) | 7 (7.9%) |
| Wholesale Trade | 7 (100.0%) | 0 (0.0%) |
| Retail Trade | 19 (30.6%) | 43 (69.4%) |
| Transportation & Warehousing | 9 (100.0%) | 0 (0.0%) |
| Utilities | 0 (0.0%) | 0 (0.0%) |
| Information | 0 (0.0%) | 12 (100.0%) |
| Finance & Insurance | 3 (10.7%) | 25 (89.3%) |
| Real Estate, Rental & Leasing | 0 (0.0%) | 0 (0.0%) |
| Professional & Scientific | 5 (71.4%) | 2 (28.6%) |
| Enterprise Management | 0 (0.0%) | 0 (0.0%) |
| Administrative & Support | 6 (54.5%) | 5 (45.5%) |
| Educational Services | 8 (17.4%) | 38 (82.6%) |
| Health Care & Social Assistance | 9 (15.0%) | 51 (85.0%) |
| Arts, Entertainment & Recreation | 3 (21.4%) | 11 (78.6%) |
| Accommodation & Food Services | 22 (84.6%) | 4 (15.4%) |
| Public Administration | 13 (54.2%) | 11 (45.8%) |
| Total | 227 (52.1%) | 209 (47.9%) |
Education in New Franklin
School Enrollment in New Franklin
The most common levels of schooling among the 188 students in New Franklin are middle school (59 | 31.4%), high school (44 | 23.4%), and elementary school (43 | 22.9%).
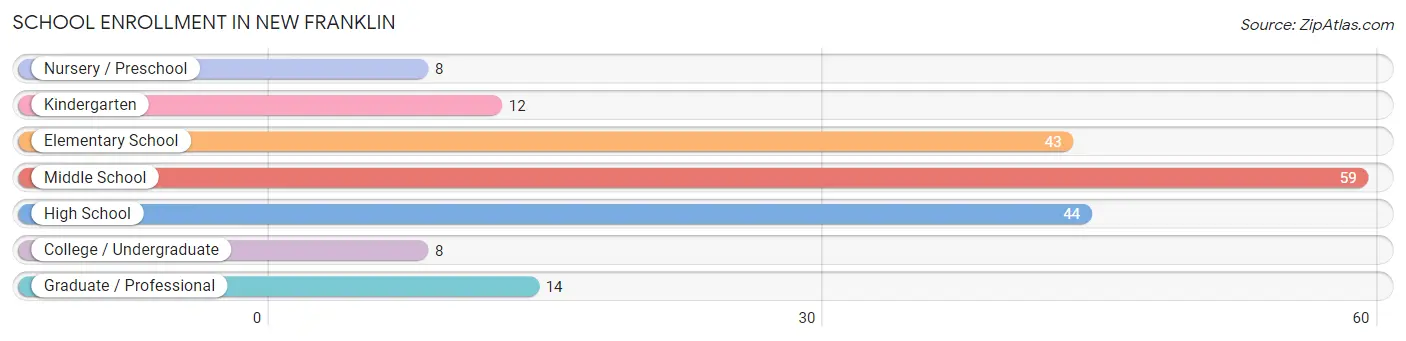
| School Level | # Students | % Students |
| Nursery / Preschool | 8 | 4.3% |
| Kindergarten | 12 | 6.4% |
| Elementary School | 43 | 22.9% |
| Middle School | 59 | 31.4% |
| High School | 44 | 23.4% |
| College / Undergraduate | 8 | 4.3% |
| Graduate / Professional | 14 | 7.4% |
| Total | 188 | 100.0% |
School Enrollment by Age by Funding Source in New Franklin
Out of a total of 188 students who are enrolled in schools in New Franklin, 35 (18.6%) attend a private institution, while the remaining 153 (81.4%) are enrolled in public schools. The age group of 3 to 4 year olds has the highest likelihood of being enrolled in private schools, with 4 (50.0% in the age bracket) enrolled. Conversely, the age group of 18 to 19 year olds has the lowest likelihood of being enrolled in a private school, with 4 (100.0% in the age bracket) attending a public institution.
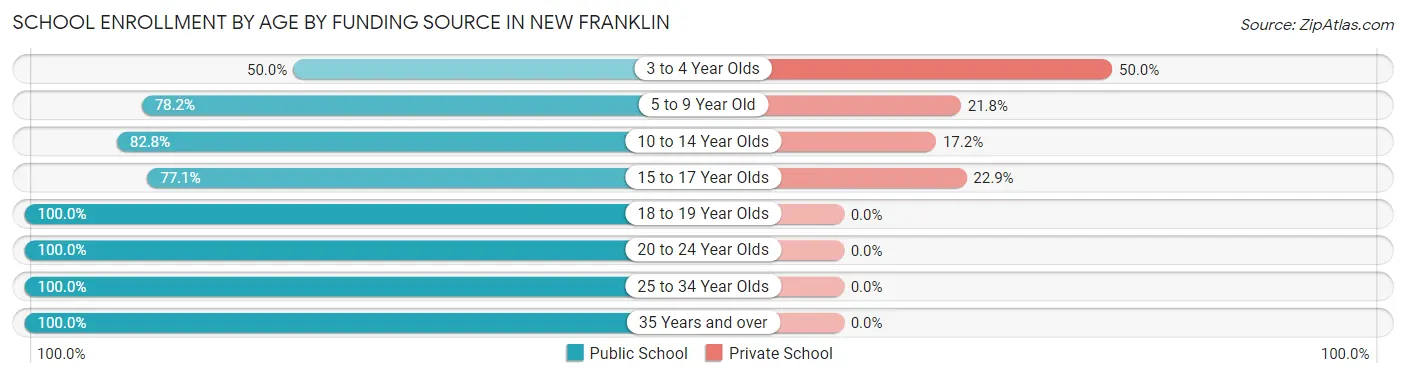
| Age Bracket | Public School | Private School |
| 3 to 4 Year Olds | 4 (50.0%) | 4 (50.0%) |
| 5 to 9 Year Old | 43 (78.2%) | 12 (21.8%) |
| 10 to 14 Year Olds | 53 (82.8%) | 11 (17.2%) |
| 15 to 17 Year Olds | 27 (77.1%) | 8 (22.9%) |
| 18 to 19 Year Olds | 4 (100.0%) | 0 (0.0%) |
| 20 to 24 Year Olds | 4 (100.0%) | 0 (0.0%) |
| 25 to 34 Year Olds | 14 (100.0%) | 0 (0.0%) |
| 35 Years and over | 4 (100.0%) | 0 (0.0%) |
| Total | 153 (81.4%) | 35 (18.6%) |
Educational Attainment by Field of Study in New Franklin
Education (51 | 30.2%), business (40 | 23.7%), liberal arts & history (18 | 10.6%), computers & mathematics (16 | 9.5%), and science & technology (14 | 8.3%) are the most common fields of study among 169 individuals in New Franklin who have obtained a bachelor's degree or higher.
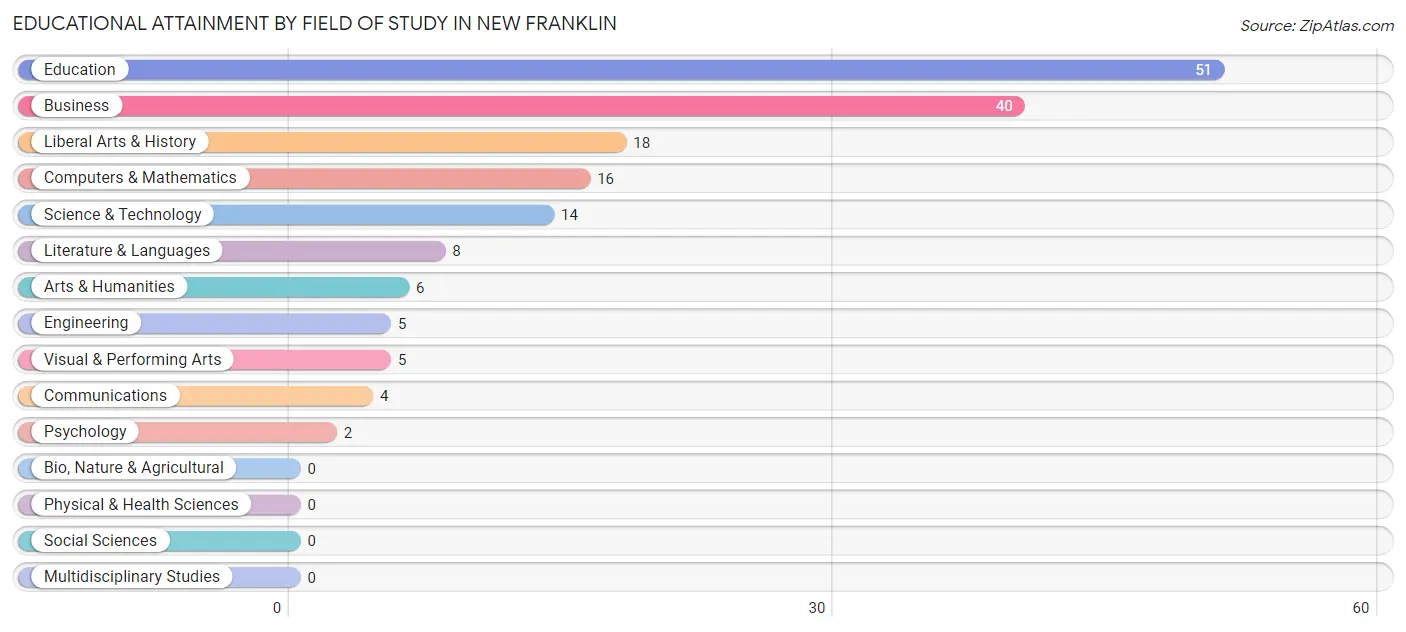
| Field of Study | # Graduates | % Graduates |
| Computers & Mathematics | 16 | 9.5% |
| Bio, Nature & Agricultural | 0 | 0.0% |
| Physical & Health Sciences | 0 | 0.0% |
| Psychology | 2 | 1.2% |
| Social Sciences | 0 | 0.0% |
| Engineering | 5 | 3.0% |
| Multidisciplinary Studies | 0 | 0.0% |
| Science & Technology | 14 | 8.3% |
| Business | 40 | 23.7% |
| Education | 51 | 30.2% |
| Literature & Languages | 8 | 4.7% |
| Liberal Arts & History | 18 | 10.6% |
| Visual & Performing Arts | 5 | 3.0% |
| Communications | 4 | 2.4% |
| Arts & Humanities | 6 | 3.5% |
| Total | 169 | 100.0% |
Transportation & Commute in New Franklin
Vehicle Availability by Sex in New Franklin
The most prevalent vehicle ownership categories in New Franklin are males with 2 vehicles (117, accounting for 51.5%) and females with 2 vehicles (123, making up 56.0%).
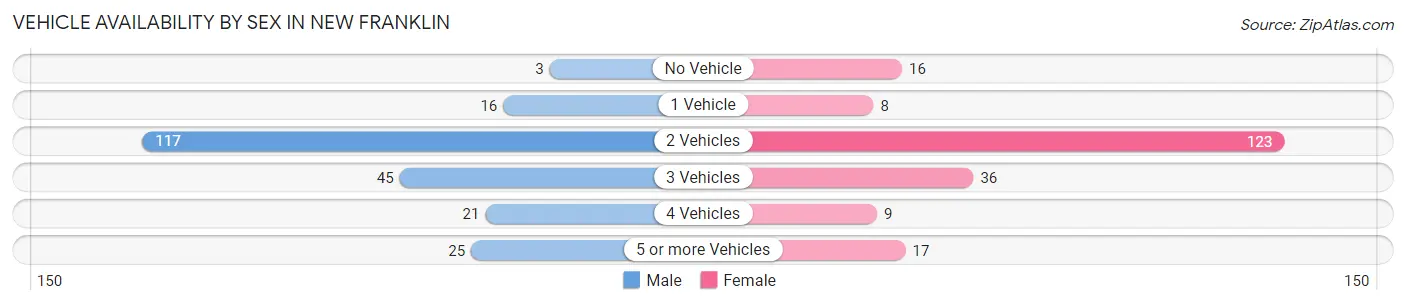
| Vehicles Available | Male | Female |
| No Vehicle | 3 (1.3%) | 16 (7.7%) |
| 1 Vehicle | 16 (7.0%) | 8 (3.8%) |
| 2 Vehicles | 117 (51.5%) | 123 (58.9%) |
| 3 Vehicles | 45 (19.8%) | 36 (17.2%) |
| 4 Vehicles | 21 (9.2%) | 9 (4.3%) |
| 5 or more Vehicles | 25 (11.0%) | 17 (8.1%) |
| Total | 227 (100.0%) | 209 (100.0%) |
Commute Time in New Franklin
The most frequently occuring commute durations in New Franklin are 20 to 24 minutes (76 commuters, 17.8%), 10 to 14 minutes (69 commuters, 16.2%), and 30 to 34 minutes (43 commuters, 10.1%).
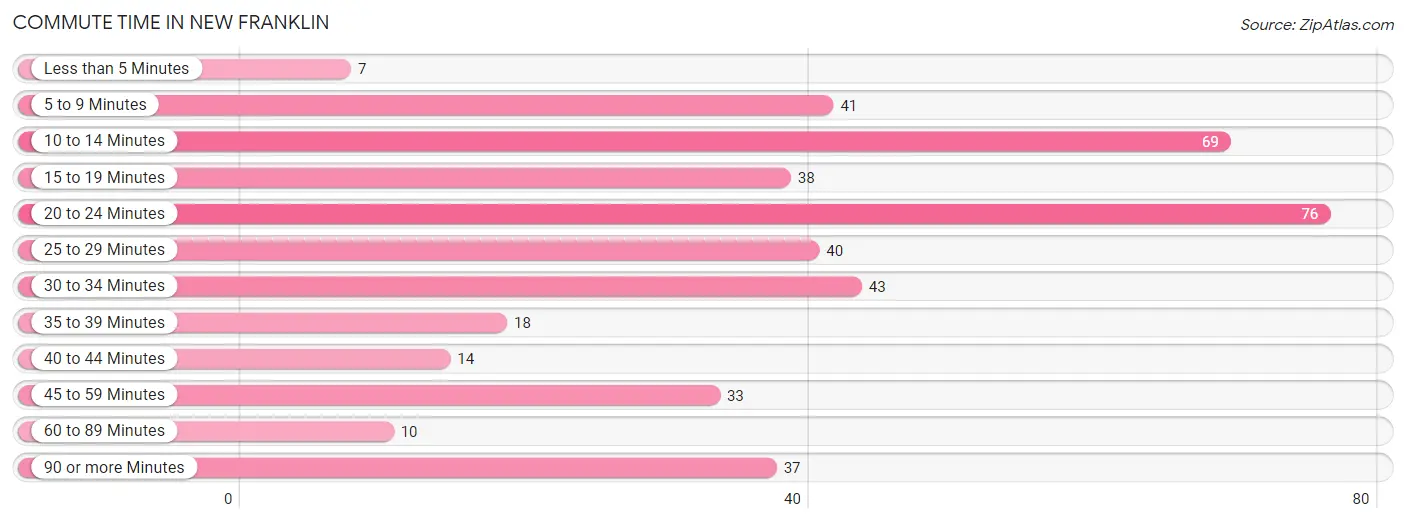
| Commute Time | # Commuters | % Commuters |
| Less than 5 Minutes | 7 | 1.6% |
| 5 to 9 Minutes | 41 | 9.6% |
| 10 to 14 Minutes | 69 | 16.2% |
| 15 to 19 Minutes | 38 | 8.9% |
| 20 to 24 Minutes | 76 | 17.8% |
| 25 to 29 Minutes | 40 | 9.4% |
| 30 to 34 Minutes | 43 | 10.1% |
| 35 to 39 Minutes | 18 | 4.2% |
| 40 to 44 Minutes | 14 | 3.3% |
| 45 to 59 Minutes | 33 | 7.7% |
| 60 to 89 Minutes | 10 | 2.4% |
| 90 or more Minutes | 37 | 8.7% |
Commute Time by Sex in New Franklin
The most common commute times in New Franklin are 20 to 24 minutes (56 commuters, 25.5%) for males and 10 to 14 minutes (39 commuters, 18.9%) for females.
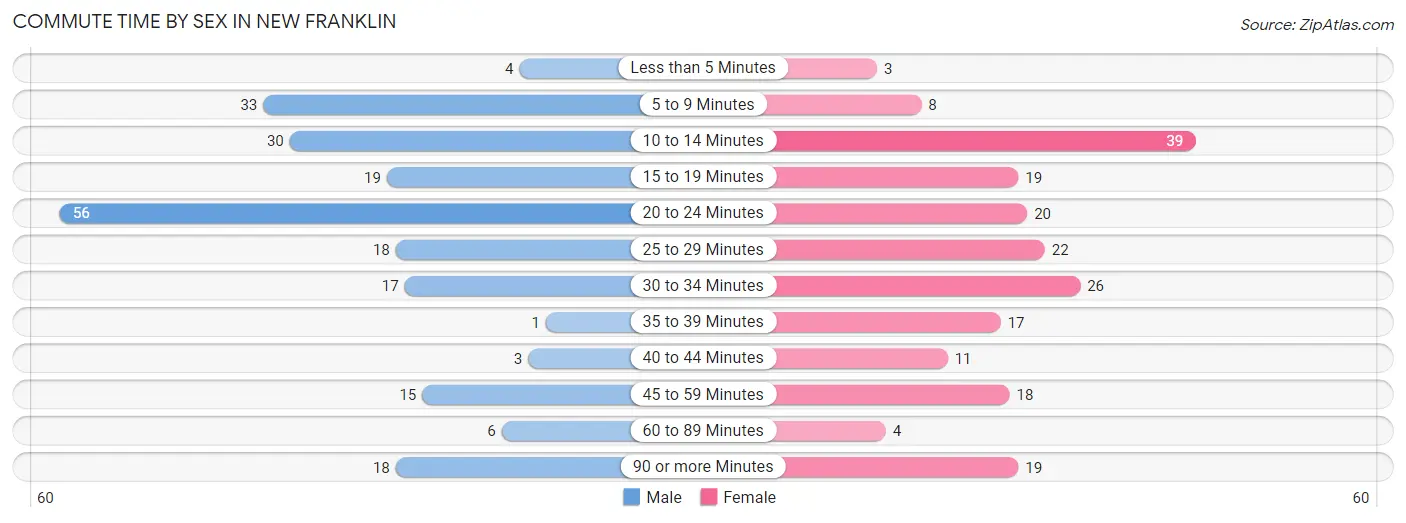
| Commute Time | Male | Female |
| Less than 5 Minutes | 4 (1.8%) | 3 (1.5%) |
| 5 to 9 Minutes | 33 (15.0%) | 8 (3.9%) |
| 10 to 14 Minutes | 30 (13.6%) | 39 (18.9%) |
| 15 to 19 Minutes | 19 (8.6%) | 19 (9.2%) |
| 20 to 24 Minutes | 56 (25.5%) | 20 (9.7%) |
| 25 to 29 Minutes | 18 (8.2%) | 22 (10.7%) |
| 30 to 34 Minutes | 17 (7.7%) | 26 (12.6%) |
| 35 to 39 Minutes | 1 (0.4%) | 17 (8.3%) |
| 40 to 44 Minutes | 3 (1.4%) | 11 (5.3%) |
| 45 to 59 Minutes | 15 (6.8%) | 18 (8.7%) |
| 60 to 89 Minutes | 6 (2.7%) | 4 (1.9%) |
| 90 or more Minutes | 18 (8.2%) | 19 (9.2%) |
Time of Departure to Work by Sex in New Franklin
The most frequent times of departure to work in New Franklin are 6:00 AM to 6:29 AM (51, 23.2%) for males and 7:00 AM to 7:29 AM (40, 19.4%) for females.
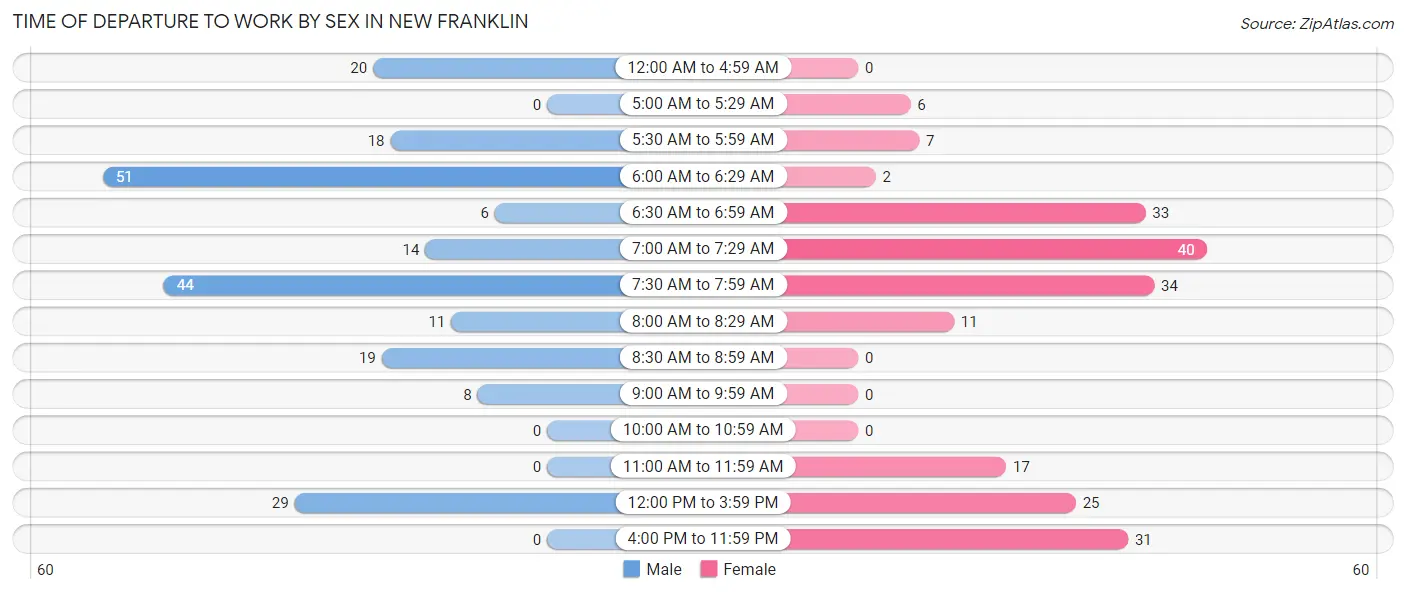
| Time of Departure | Male | Female |
| 12:00 AM to 4:59 AM | 20 (9.1%) | 0 (0.0%) |
| 5:00 AM to 5:29 AM | 0 (0.0%) | 6 (2.9%) |
| 5:30 AM to 5:59 AM | 18 (8.2%) | 7 (3.4%) |
| 6:00 AM to 6:29 AM | 51 (23.2%) | 2 (1.0%) |
| 6:30 AM to 6:59 AM | 6 (2.7%) | 33 (16.0%) |
| 7:00 AM to 7:29 AM | 14 (6.4%) | 40 (19.4%) |
| 7:30 AM to 7:59 AM | 44 (20.0%) | 34 (16.5%) |
| 8:00 AM to 8:29 AM | 11 (5.0%) | 11 (5.3%) |
| 8:30 AM to 8:59 AM | 19 (8.6%) | 0 (0.0%) |
| 9:00 AM to 9:59 AM | 8 (3.6%) | 0 (0.0%) |
| 10:00 AM to 10:59 AM | 0 (0.0%) | 0 (0.0%) |
| 11:00 AM to 11:59 AM | 0 (0.0%) | 17 (8.3%) |
| 12:00 PM to 3:59 PM | 29 (13.2%) | 25 (12.1%) |
| 4:00 PM to 11:59 PM | 0 (0.0%) | 31 (15.0%) |
| Total | 220 (100.0%) | 206 (100.0%) |
Housing Occupancy in New Franklin
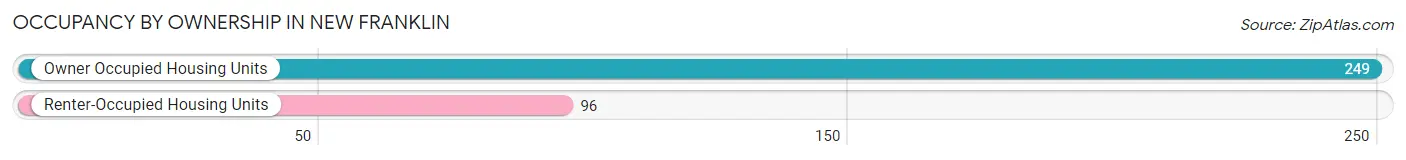
Occupancy by Ownership in New Franklin
Of the total 345 dwellings in New Franklin, owner-occupied units account for 249 (72.2%), while renter-occupied units make up 96 (27.8%).
| Occupancy | # Housing Units | % Housing Units |
| Owner Occupied Housing Units | 249 | 72.2% |
| Renter-Occupied Housing Units | 96 | 27.8% |
| Total Occupied Housing Units | 345 | 100.0% |
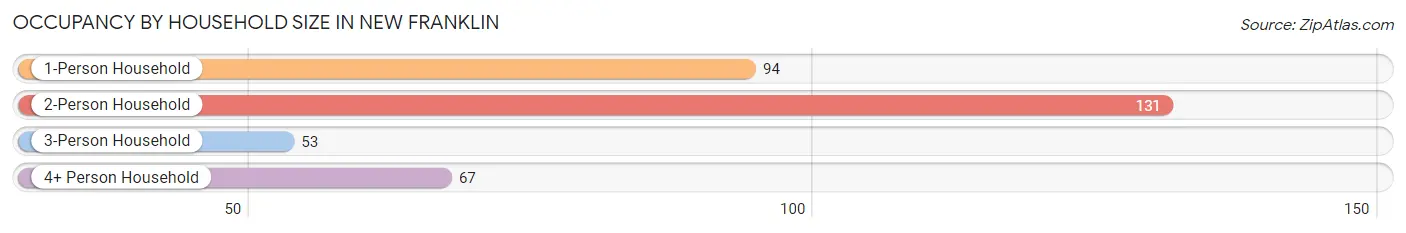
Occupancy by Household Size in New Franklin
| Household Size | # Housing Units | % Housing Units |
| 1-Person Household | 94 | 27.3% |
| 2-Person Household | 131 | 38.0% |
| 3-Person Household | 53 | 15.4% |
| 4+ Person Household | 67 | 19.4% |
| Total Housing Units | 345 | 100.0% |
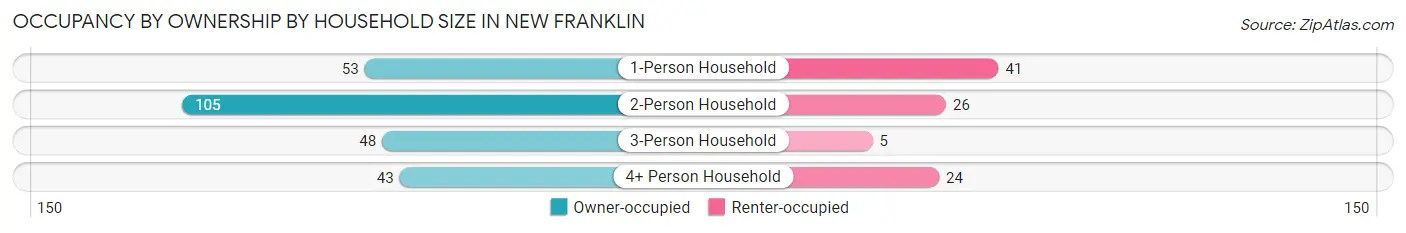
Occupancy by Ownership by Household Size in New Franklin
| Household Size | Owner-occupied | Renter-occupied |
| 1-Person Household | 53 (56.4%) | 41 (43.6%) |
| 2-Person Household | 105 (80.1%) | 26 (19.9%) |
| 3-Person Household | 48 (90.6%) | 5 (9.4%) |
| 4+ Person Household | 43 (64.2%) | 24 (35.8%) |
| Total Housing Units | 249 (72.2%) | 96 (27.8%) |
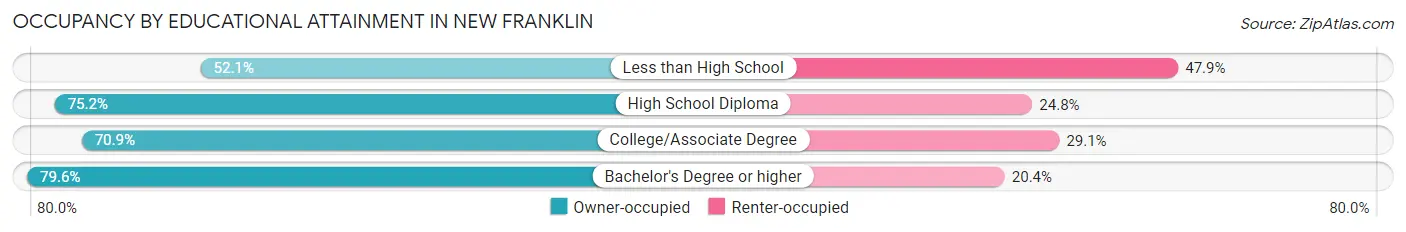
Occupancy by Educational Attainment in New Franklin
| Household Size | Owner-occupied | Renter-occupied |
| Less than High School | 25 (52.1%) | 23 (47.9%) |
| High School Diploma | 85 (75.2%) | 28 (24.8%) |
| College/Associate Degree | 61 (70.9%) | 25 (29.1%) |
| Bachelor's Degree or higher | 78 (79.6%) | 20 (20.4%) |
Occupancy by Age of Householder in New Franklin
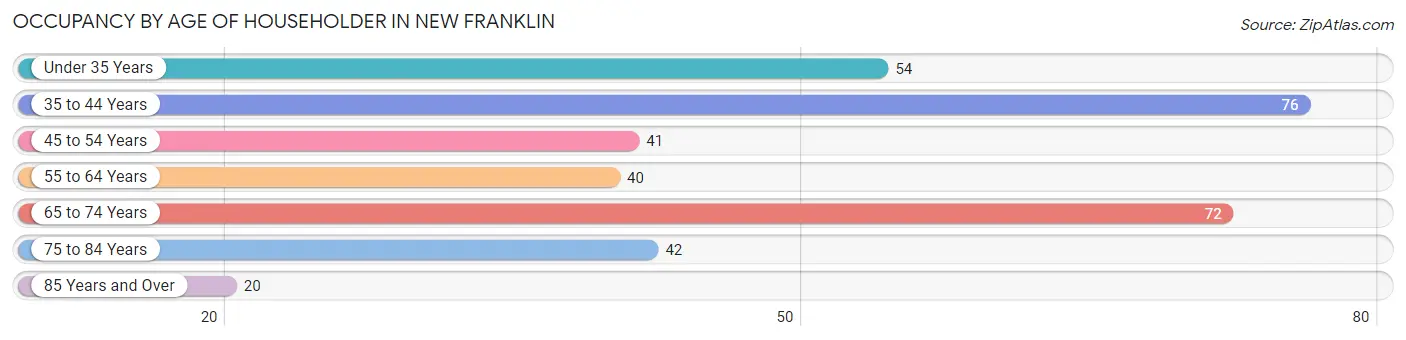
| Age Bracket | # Households | % Households |
| Under 35 Years | 54 | 15.7% |
| 35 to 44 Years | 76 | 22.0% |
| 45 to 54 Years | 41 | 11.9% |
| 55 to 64 Years | 40 | 11.6% |
| 65 to 74 Years | 72 | 20.9% |
| 75 to 84 Years | 42 | 12.2% |
| 85 Years and Over | 20 | 5.8% |
| Total | 345 | 100.0% |
Housing Finances in New Franklin
Median Income by Occupancy in New Franklin
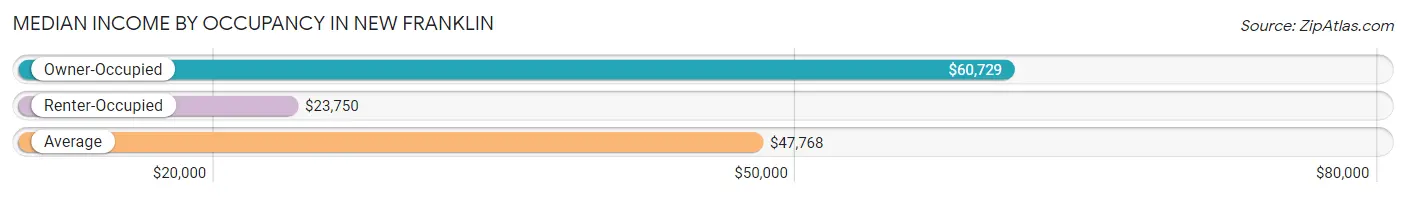
| Occupancy Type | # Households | Median Income |
| Owner-Occupied | 249 (72.2%) | $60,729 |
| Renter-Occupied | 96 (27.8%) | $23,750 |
| Average | 345 (100.0%) | $47,768 |
Occupancy by Householder Income Bracket in New Franklin
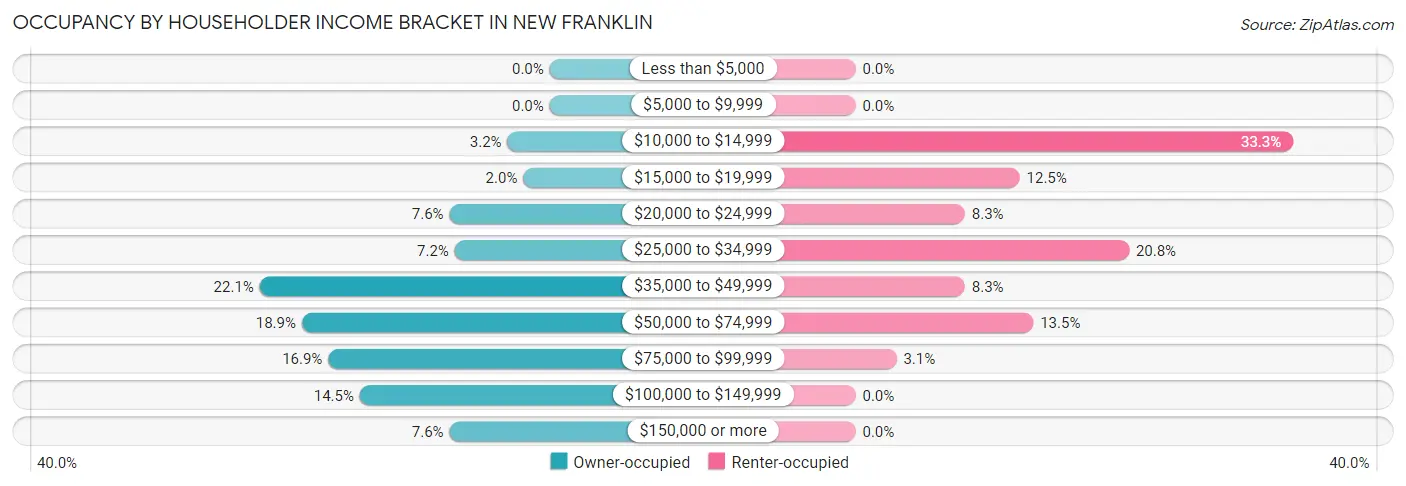
| Income Bracket | Owner-occupied | Renter-occupied |
| Less than $5,000 | 0 (0.0%) | 0 (0.0%) |
| $5,000 to $9,999 | 0 (0.0%) | 0 (0.0%) |
| $10,000 to $14,999 | 8 (3.2%) | 32 (33.3%) |
| $15,000 to $19,999 | 5 (2.0%) | 12 (12.5%) |
| $20,000 to $24,999 | 19 (7.6%) | 8 (8.3%) |
| $25,000 to $34,999 | 18 (7.2%) | 20 (20.8%) |
| $35,000 to $49,999 | 55 (22.1%) | 8 (8.3%) |
| $50,000 to $74,999 | 47 (18.9%) | 13 (13.5%) |
| $75,000 to $99,999 | 42 (16.9%) | 3 (3.1%) |
| $100,000 to $149,999 | 36 (14.5%) | 0 (0.0%) |
| $150,000 or more | 19 (7.6%) | 0 (0.0%) |
| Total | 249 (100.0%) | 96 (100.0%) |
Monthly Housing Cost Tiers in New Franklin
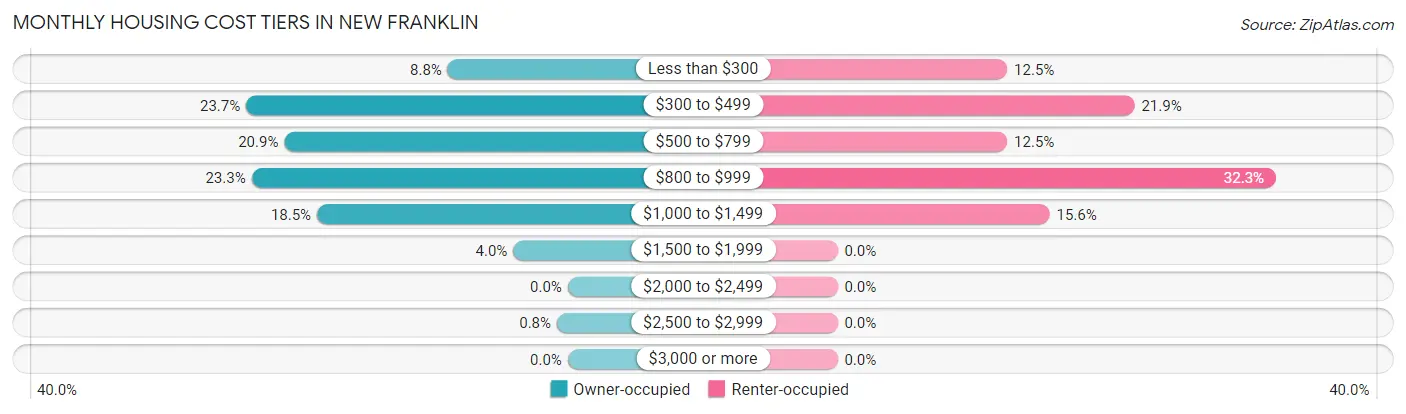
| Monthly Cost | Owner-occupied | Renter-occupied |
| Less than $300 | 22 (8.8%) | 12 (12.5%) |
| $300 to $499 | 59 (23.7%) | 21 (21.9%) |
| $500 to $799 | 52 (20.9%) | 12 (12.5%) |
| $800 to $999 | 58 (23.3%) | 31 (32.3%) |
| $1,000 to $1,499 | 46 (18.5%) | 15 (15.6%) |
| $1,500 to $1,999 | 10 (4.0%) | 0 (0.0%) |
| $2,000 to $2,499 | 0 (0.0%) | 0 (0.0%) |
| $2,500 to $2,999 | 2 (0.8%) | 0 (0.0%) |
| $3,000 or more | 0 (0.0%) | 0 (0.0%) |
| Total | 249 (100.0%) | 96 (100.0%) |
Physical Housing Characteristics in New Franklin
Housing Structures in New Franklin
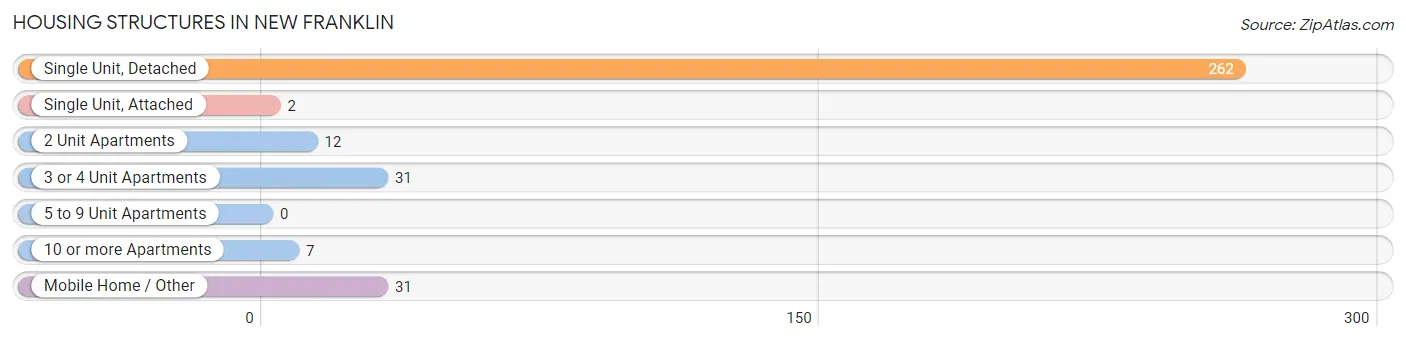
| Structure Type | # Housing Units | % Housing Units |
| Single Unit, Detached | 262 | 75.9% |
| Single Unit, Attached | 2 | 0.6% |
| 2 Unit Apartments | 12 | 3.5% |
| 3 or 4 Unit Apartments | 31 | 9.0% |
| 5 to 9 Unit Apartments | 0 | 0.0% |
| 10 or more Apartments | 7 | 2.0% |
| Mobile Home / Other | 31 | 9.0% |
| Total | 345 | 100.0% |
Housing Structures by Occupancy in New Franklin
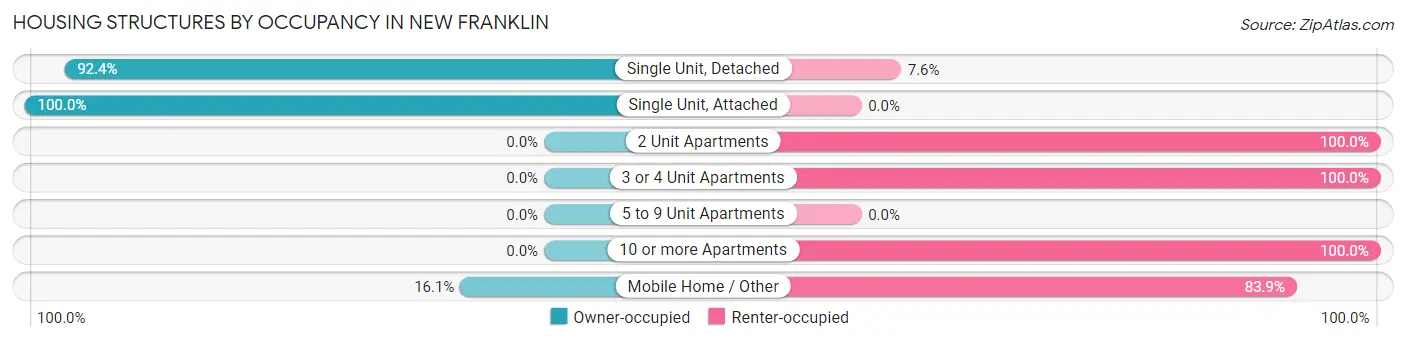
| Structure Type | Owner-occupied | Renter-occupied |
| Single Unit, Detached | 242 (92.4%) | 20 (7.6%) |
| Single Unit, Attached | 2 (100.0%) | 0 (0.0%) |
| 2 Unit Apartments | 0 (0.0%) | 12 (100.0%) |
| 3 or 4 Unit Apartments | 0 (0.0%) | 31 (100.0%) |
| 5 to 9 Unit Apartments | 0 (0.0%) | 0 (0.0%) |
| 10 or more Apartments | 0 (0.0%) | 7 (100.0%) |
| Mobile Home / Other | 5 (16.1%) | 26 (83.9%) |
| Total | 249 (72.2%) | 96 (27.8%) |
Housing Structures by Number of Rooms in New Franklin
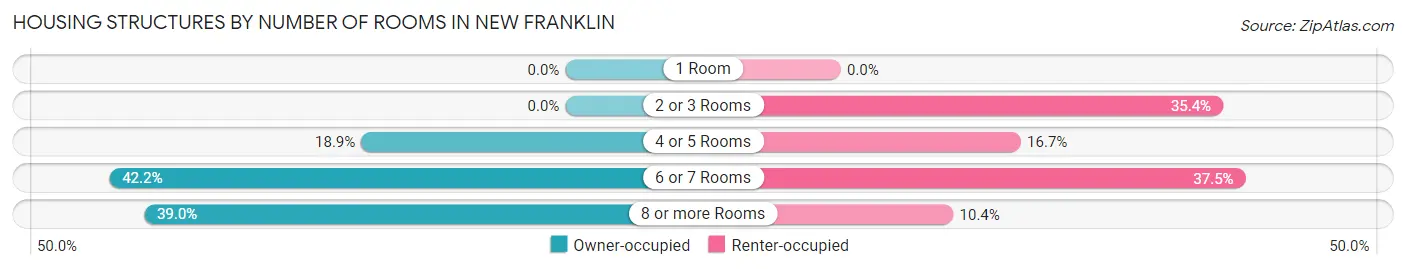
| Number of Rooms | Owner-occupied | Renter-occupied |
| 1 Room | 0 (0.0%) | 0 (0.0%) |
| 2 or 3 Rooms | 0 (0.0%) | 34 (35.4%) |
| 4 or 5 Rooms | 47 (18.9%) | 16 (16.7%) |
| 6 or 7 Rooms | 105 (42.2%) | 36 (37.5%) |
| 8 or more Rooms | 97 (39.0%) | 10 (10.4%) |
| Total | 249 (100.0%) | 96 (100.0%) |
Housing Structure by Heating Type in New Franklin
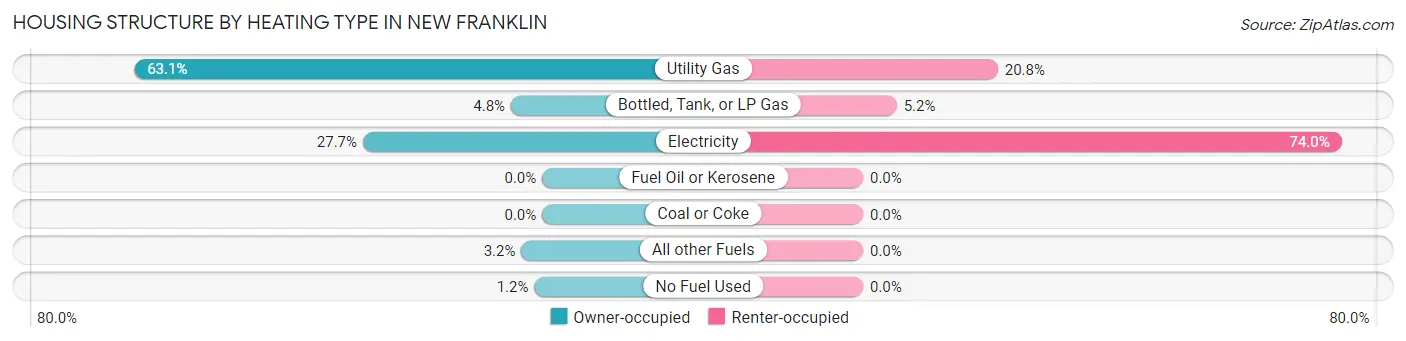
| Heating Type | Owner-occupied | Renter-occupied |
| Utility Gas | 157 (63.0%) | 20 (20.8%) |
| Bottled, Tank, or LP Gas | 12 (4.8%) | 5 (5.2%) |
| Electricity | 69 (27.7%) | 71 (74.0%) |
| Fuel Oil or Kerosene | 0 (0.0%) | 0 (0.0%) |
| Coal or Coke | 0 (0.0%) | 0 (0.0%) |
| All other Fuels | 8 (3.2%) | 0 (0.0%) |
| No Fuel Used | 3 (1.2%) | 0 (0.0%) |
| Total | 249 (100.0%) | 96 (100.0%) |
Household Vehicle Usage in New Franklin
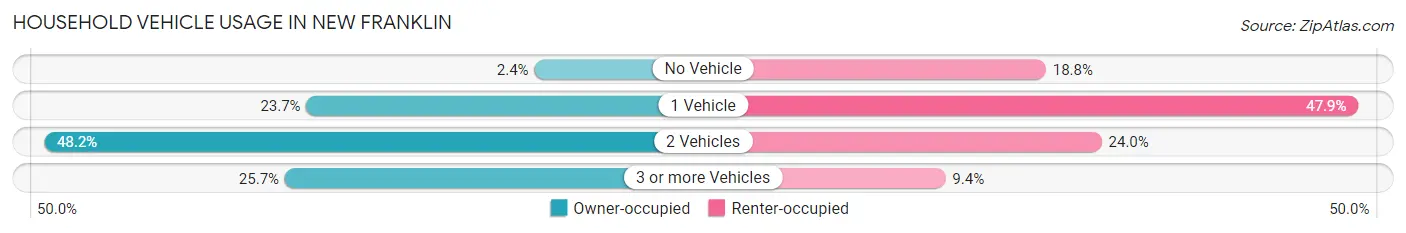
| Vehicles per Household | Owner-occupied | Renter-occupied |
| No Vehicle | 6 (2.4%) | 18 (18.8%) |
| 1 Vehicle | 59 (23.7%) | 46 (47.9%) |
| 2 Vehicles | 120 (48.2%) | 23 (24.0%) |
| 3 or more Vehicles | 64 (25.7%) | 9 (9.4%) |
| Total | 249 (100.0%) | 96 (100.0%) |
Real Estate & Mortgages in New Franklin
Real Estate and Mortgage Overview in New Franklin
| Characteristic | Without Mortgage | With Mortgage |
| Housing Units | 111 | 138 |
| Median Property Value | $93,100 | $118,400 |
| Median Household Income | $46,328 | $12 |
| Monthly Housing Costs | $427 | $0 |
| Real Estate Taxes | $1,097 | $5 |
Property Value by Mortgage Status in New Franklin
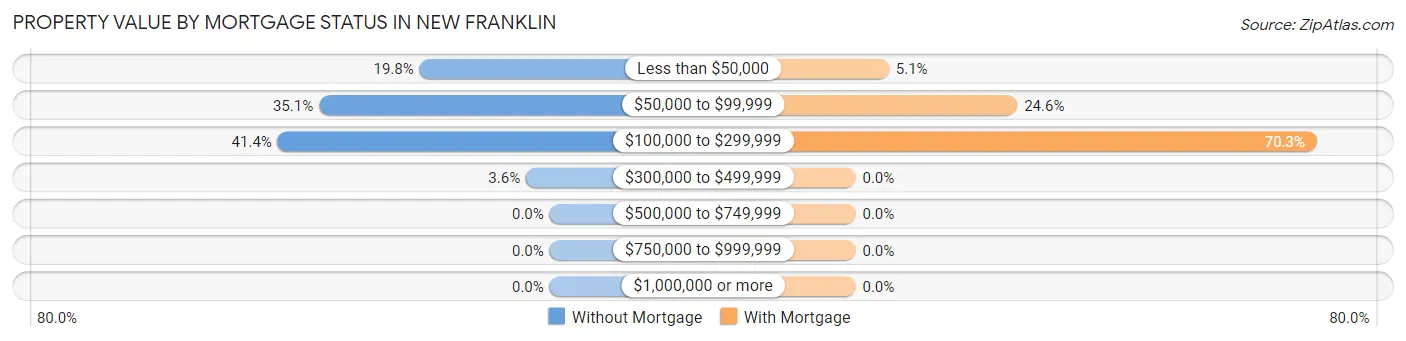
| Property Value | Without Mortgage | With Mortgage |
| Less than $50,000 | 22 (19.8%) | 7 (5.1%) |
| $50,000 to $99,999 | 39 (35.1%) | 34 (24.6%) |
| $100,000 to $299,999 | 46 (41.4%) | 97 (70.3%) |
| $300,000 to $499,999 | 4 (3.6%) | 0 (0.0%) |
| $500,000 to $749,999 | 0 (0.0%) | 0 (0.0%) |
| $750,000 to $999,999 | 0 (0.0%) | 0 (0.0%) |
| $1,000,000 or more | 0 (0.0%) | 0 (0.0%) |
| Total | 111 (100.0%) | 138 (100.0%) |
Household Income by Mortgage Status in New Franklin
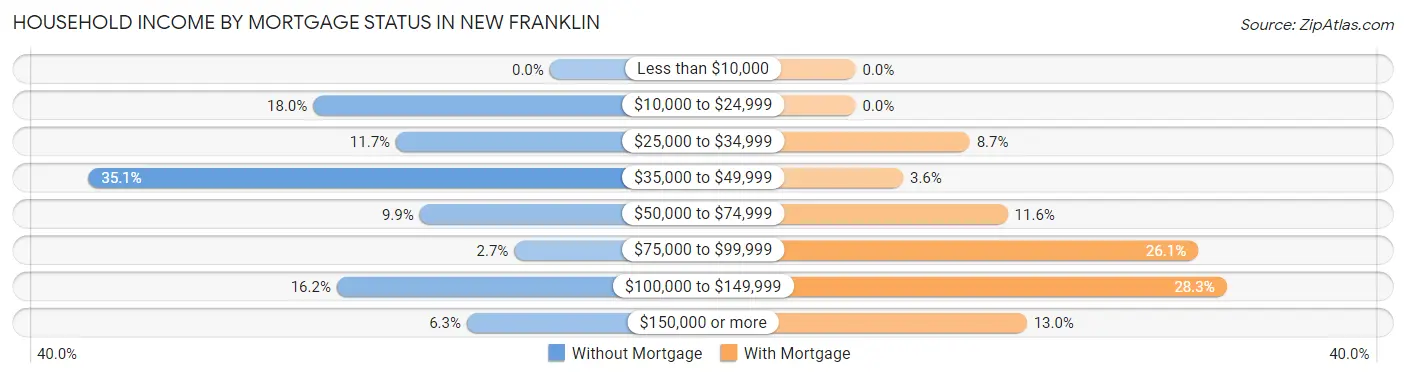
| Household Income | Without Mortgage | With Mortgage |
| Less than $10,000 | 0 (0.0%) | 0 (0.0%) |
| $10,000 to $24,999 | 20 (18.0%) | 0 (0.0%) |
| $25,000 to $34,999 | 13 (11.7%) | 12 (8.7%) |
| $35,000 to $49,999 | 39 (35.1%) | 5 (3.6%) |
| $50,000 to $74,999 | 11 (9.9%) | 16 (11.6%) |
| $75,000 to $99,999 | 3 (2.7%) | 36 (26.1%) |
| $100,000 to $149,999 | 18 (16.2%) | 39 (28.3%) |
| $150,000 or more | 7 (6.3%) | 18 (13.0%) |
| Total | 111 (100.0%) | 138 (100.0%) |
Property Value to Household Income Ratio in New Franklin
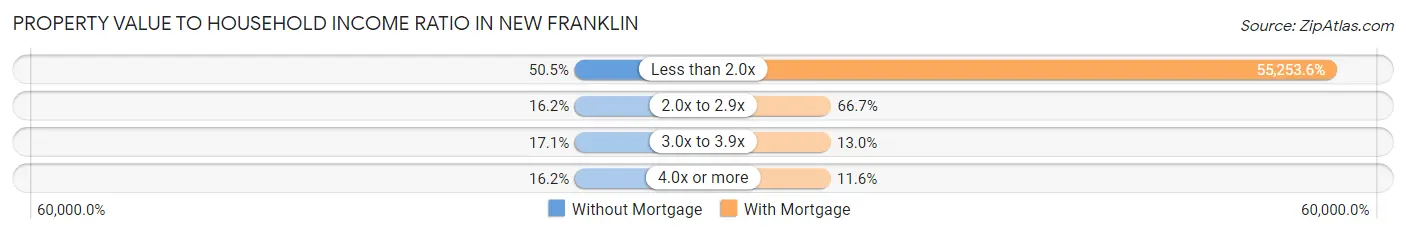
| Value-to-Income Ratio | Without Mortgage | With Mortgage |
| Less than 2.0x | 56 (50.4%) | 76,250 (55,253.6%) |
| 2.0x to 2.9x | 18 (16.2%) | 92 (66.7%) |
| 3.0x to 3.9x | 19 (17.1%) | 18 (13.0%) |
| 4.0x or more | 18 (16.2%) | 16 (11.6%) |
| Total | 111 (100.0%) | 138 (100.0%) |
Real Estate Taxes by Mortgage Status in New Franklin
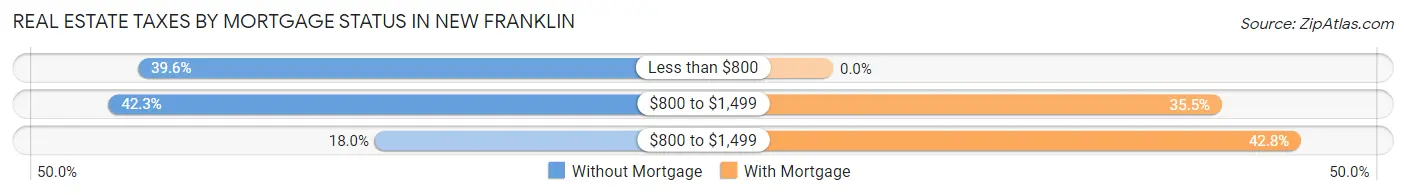
| Property Taxes | Without Mortgage | With Mortgage |
| Less than $800 | 44 (39.6%) | 0 (0.0%) |
| $800 to $1,499 | 47 (42.3%) | 49 (35.5%) |
| $800 to $1,499 | 20 (18.0%) | 59 (42.7%) |
| Total | 111 (100.0%) | 138 (100.0%) |
Health & Disability in New Franklin
Health Insurance Coverage by Age in New Franklin
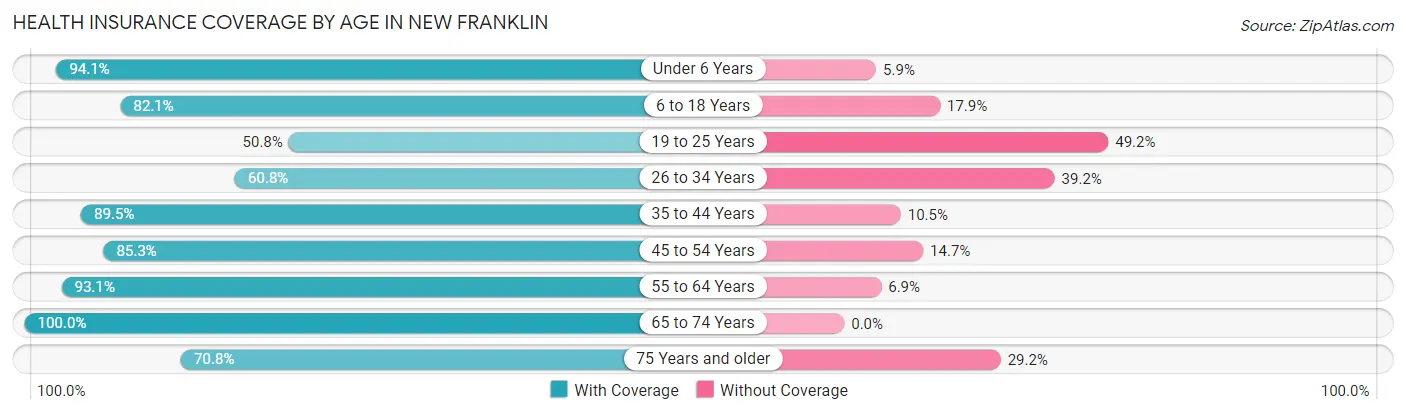
| Age Bracket | With Coverage | Without Coverage |
| Under 6 Years | 95 (94.1%) | 6 (5.9%) |
| 6 to 18 Years | 138 (82.1%) | 30 (17.9%) |
| 19 to 25 Years | 33 (50.8%) | 32 (49.2%) |
| 26 to 34 Years | 79 (60.8%) | 51 (39.2%) |
| 35 to 44 Years | 170 (89.5%) | 20 (10.5%) |
| 45 to 54 Years | 58 (85.3%) | 10 (14.7%) |
| 55 to 64 Years | 108 (93.1%) | 8 (6.9%) |
| 65 to 74 Years | 99 (100.0%) | 0 (0.0%) |
| 75 Years and older | 85 (70.8%) | 35 (29.2%) |
| Total | 865 (81.8%) | 192 (18.2%) |
Health Insurance Coverage by Citizenship Status in New Franklin
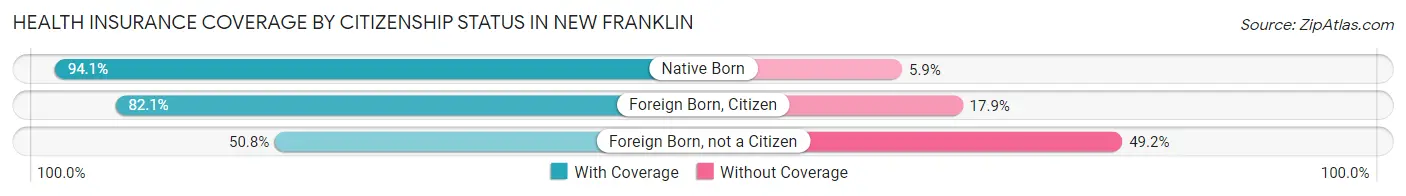
| Citizenship Status | With Coverage | Without Coverage |
| Native Born | 95 (94.1%) | 6 (5.9%) |
| Foreign Born, Citizen | 138 (82.1%) | 30 (17.9%) |
| Foreign Born, not a Citizen | 33 (50.8%) | 32 (49.2%) |
Health Insurance Coverage by Household Income in New Franklin
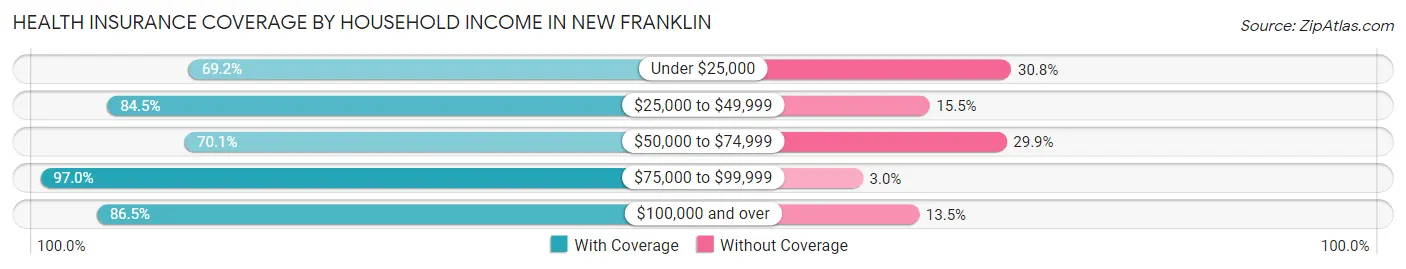
| Household Income | With Coverage | Without Coverage |
| Under $25,000 | 108 (69.2%) | 48 (30.8%) |
| $25,000 to $49,999 | 273 (84.5%) | 50 (15.5%) |
| $50,000 to $74,999 | 129 (70.1%) | 55 (29.9%) |
| $75,000 to $99,999 | 131 (97.0%) | 4 (3.0%) |
| $100,000 and over | 224 (86.5%) | 35 (13.5%) |
Public vs Private Health Insurance Coverage by Age in New Franklin
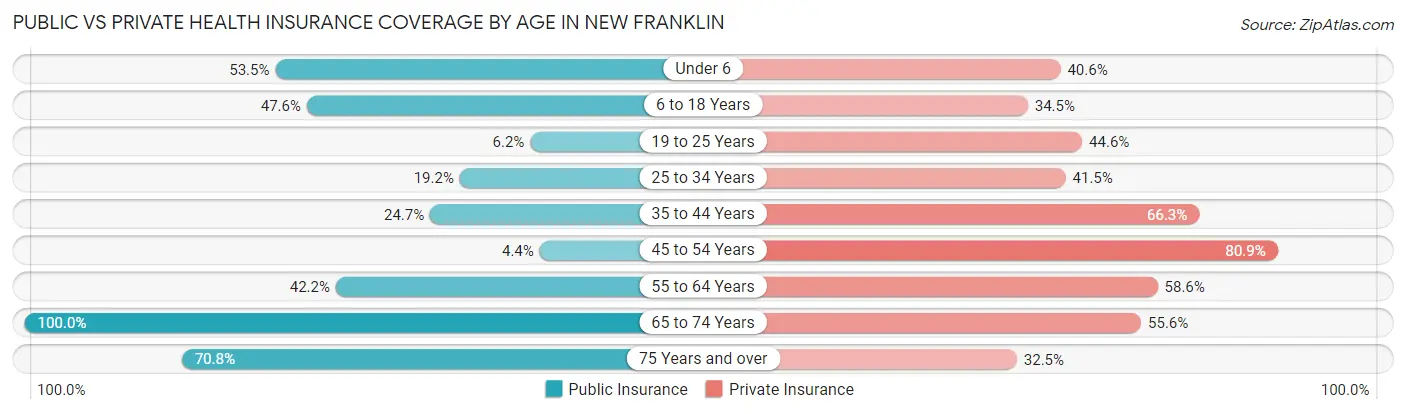
| Age Bracket | Public Insurance | Private Insurance |
| Under 6 | 54 (53.5%) | 41 (40.6%) |
| 6 to 18 Years | 80 (47.6%) | 58 (34.5%) |
| 19 to 25 Years | 4 (6.1%) | 29 (44.6%) |
| 25 to 34 Years | 25 (19.2%) | 54 (41.5%) |
| 35 to 44 Years | 47 (24.7%) | 126 (66.3%) |
| 45 to 54 Years | 3 (4.4%) | 55 (80.9%) |
| 55 to 64 Years | 49 (42.2%) | 68 (58.6%) |
| 65 to 74 Years | 99 (100.0%) | 55 (55.6%) |
| 75 Years and over | 85 (70.8%) | 39 (32.5%) |
| Total | 446 (42.2%) | 525 (49.7%) |
Disability Status by Sex by Age in New Franklin
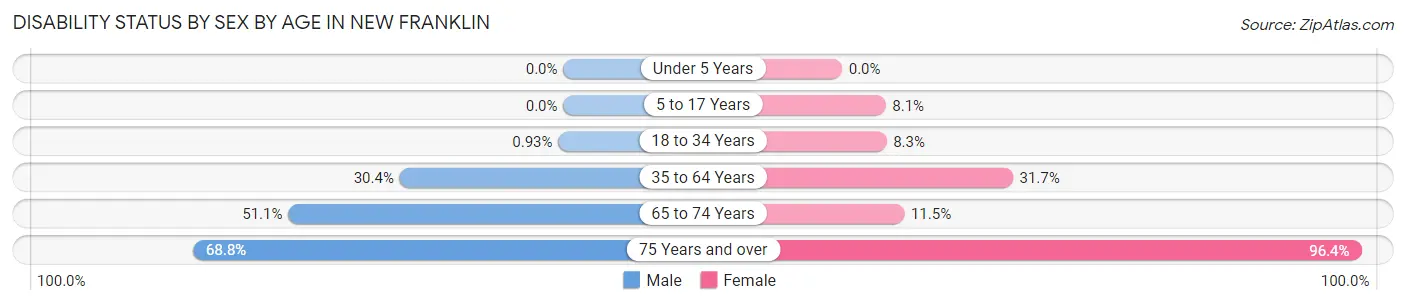
| Age Bracket | Male | Female |
| Under 5 Years | 0 (0.0%) | 0 (0.0%) |
| 5 to 17 Years | 0 (0.0%) | 8 (8.1%) |
| 18 to 34 Years | 1 (0.9%) | 8 (8.3%) |
| 35 to 64 Years | 58 (30.4%) | 58 (31.7%) |
| 65 to 74 Years | 24 (51.1%) | 6 (11.5%) |
| 75 Years and over | 44 (68.8%) | 54 (96.4%) |
Disability Class by Sex by Age in New Franklin
Disability Class: Hearing Difficulty
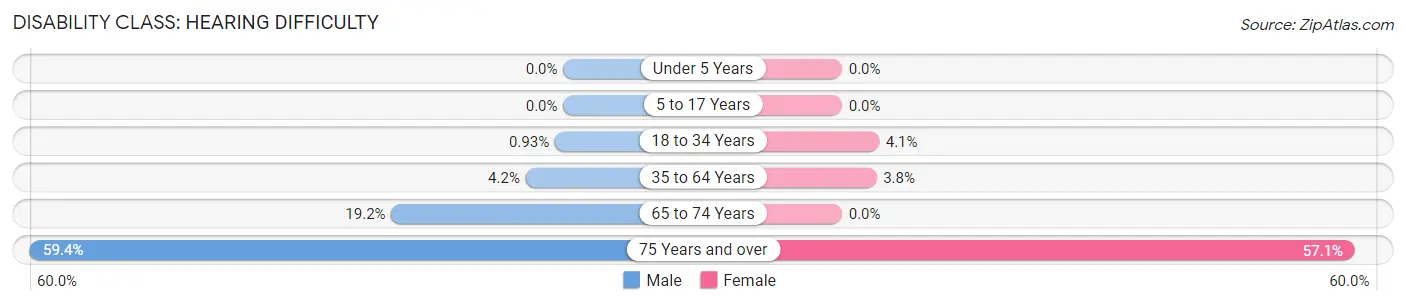
| Age Bracket | Male | Female |
| Under 5 Years | 0 (0.0%) | 0 (0.0%) |
| 5 to 17 Years | 0 (0.0%) | 0 (0.0%) |
| 18 to 34 Years | 1 (0.9%) | 4 (4.1%) |
| 35 to 64 Years | 8 (4.2%) | 7 (3.8%) |
| 65 to 74 Years | 9 (19.2%) | 0 (0.0%) |
| 75 Years and over | 38 (59.4%) | 32 (57.1%) |
Disability Class: Vision Difficulty
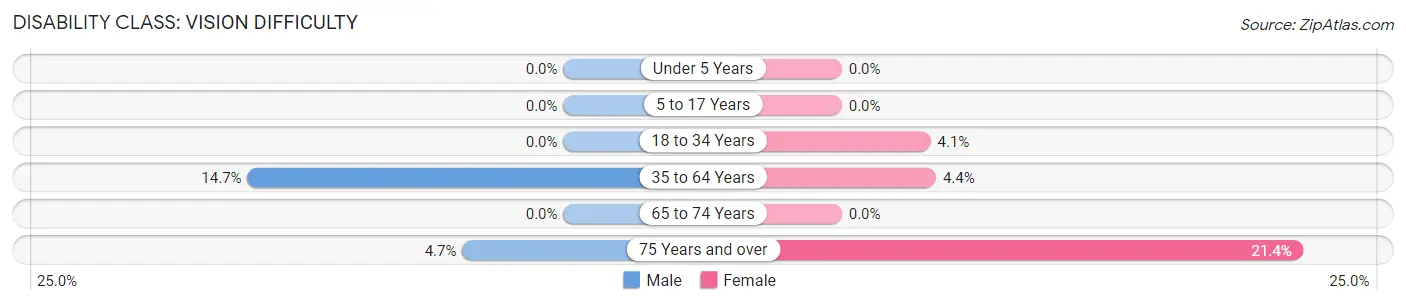
| Age Bracket | Male | Female |
| Under 5 Years | 0 (0.0%) | 0 (0.0%) |
| 5 to 17 Years | 0 (0.0%) | 0 (0.0%) |
| 18 to 34 Years | 0 (0.0%) | 4 (4.1%) |
| 35 to 64 Years | 28 (14.7%) | 8 (4.4%) |
| 65 to 74 Years | 0 (0.0%) | 0 (0.0%) |
| 75 Years and over | 3 (4.7%) | 12 (21.4%) |
Disability Class: Cognitive Difficulty
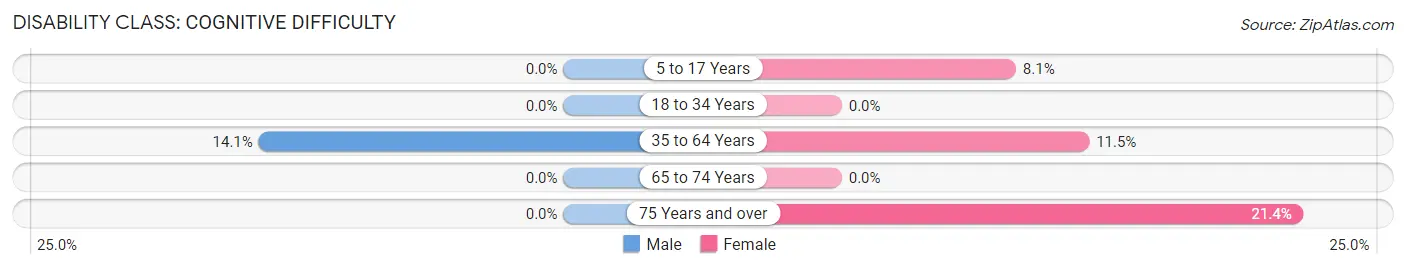
| Age Bracket | Male | Female |
| 5 to 17 Years | 0 (0.0%) | 8 (8.1%) |
| 18 to 34 Years | 0 (0.0%) | 0 (0.0%) |
| 35 to 64 Years | 27 (14.1%) | 21 (11.5%) |
| 65 to 74 Years | 0 (0.0%) | 0 (0.0%) |
| 75 Years and over | 0 (0.0%) | 12 (21.4%) |
Disability Class: Ambulatory Difficulty
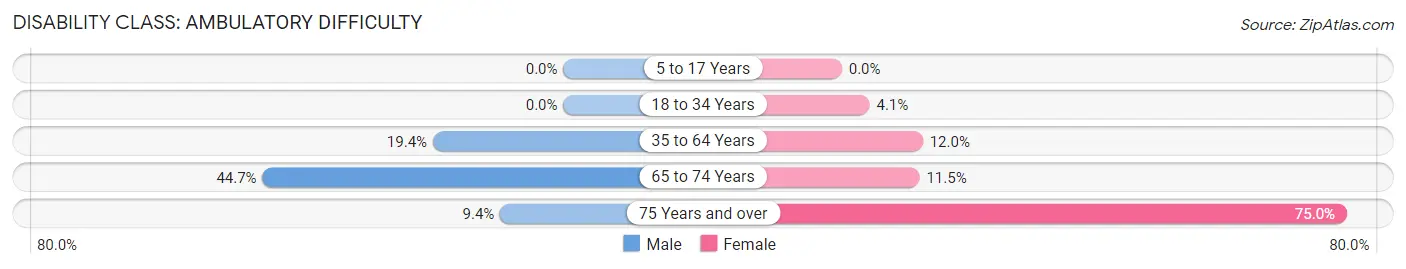
| Age Bracket | Male | Female |
| 5 to 17 Years | 0 (0.0%) | 0 (0.0%) |
| 18 to 34 Years | 0 (0.0%) | 4 (4.1%) |
| 35 to 64 Years | 37 (19.4%) | 22 (12.0%) |
| 65 to 74 Years | 21 (44.7%) | 6 (11.5%) |
| 75 Years and over | 6 (9.4%) | 42 (75.0%) |
Disability Class: Self-Care Difficulty
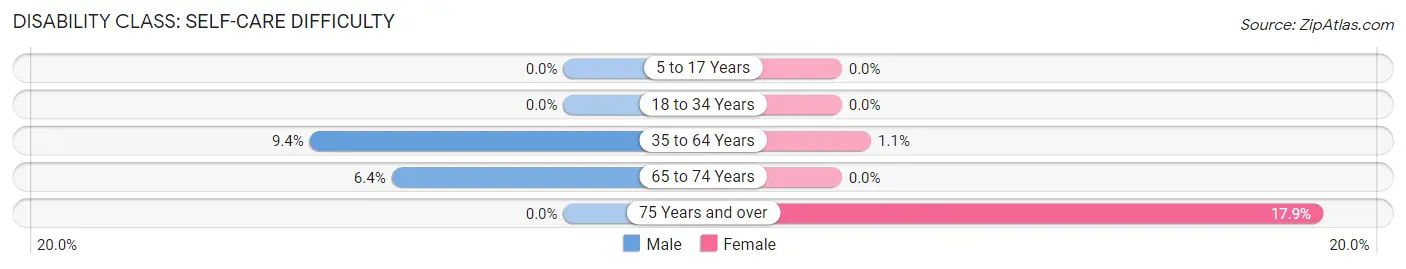
| Age Bracket | Male | Female |
| 5 to 17 Years | 0 (0.0%) | 0 (0.0%) |
| 18 to 34 Years | 0 (0.0%) | 0 (0.0%) |
| 35 to 64 Years | 18 (9.4%) | 2 (1.1%) |
| 65 to 74 Years | 3 (6.4%) | 0 (0.0%) |
| 75 Years and over | 0 (0.0%) | 10 (17.9%) |
Technology Access in New Franklin
Computing Device Access in New Franklin
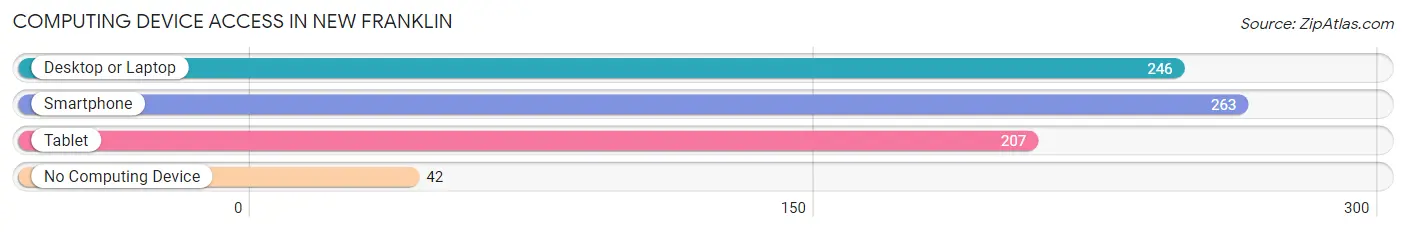
| Device Type | # Households | % Households |
| Desktop or Laptop | 246 | 71.3% |
| Smartphone | 263 | 76.2% |
| Tablet | 207 | 60.0% |
| No Computing Device | 42 | 12.2% |
| Total | 345 | 100.0% |
Internet Access in New Franklin
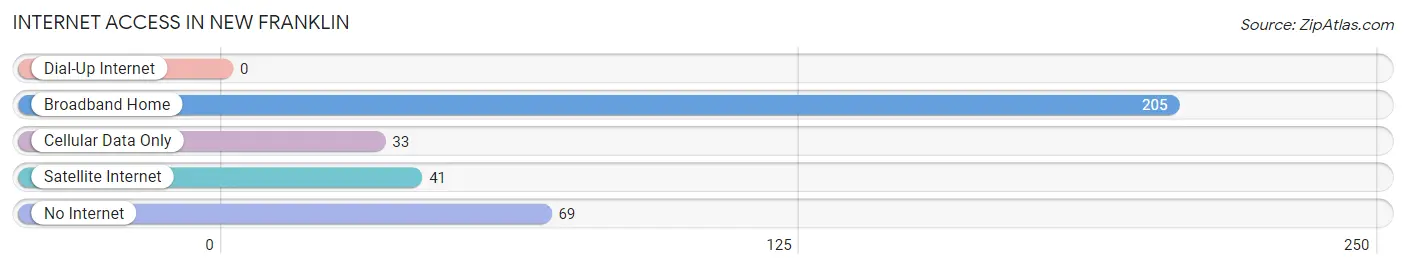
| Internet Type | # Households | % Households |
| Dial-Up Internet | 0 | 0.0% |
| Broadband Home | 205 | 59.4% |
| Cellular Data Only | 33 | 9.6% |
| Satellite Internet | 41 | 11.9% |
| No Internet | 69 | 20.0% |
| Total | 345 | 100.0% |
New Franklin Summary
New Franklin is a small city located in Howard County, Missouri. It is situated on the banks of the Missouri River, approximately 30 miles east of Columbia. The city has a population of 1,845 people, according to the 2010 census.
History
New Franklin was founded in 1819 by a group of settlers from Franklin, Tennessee. The town was named after the original settlers’ hometown. The town was originally a trading post and a stop on the Santa Fe Trail. In 1821, the town was officially incorporated.
In the late 1800s, the town began to grow and prosper. The railroad came to town in 1887, and the town became a hub for the surrounding area. The town also became a center for the timber industry, with several sawmills and lumber yards.
In the early 1900s, the town began to decline. The railroad was abandoned in the 1920s, and the timber industry began to decline. The town was hit hard by the Great Depression, and many of the businesses closed.
In the 1950s, the town began to experience a resurgence. The town was revitalized by the construction of a new bridge over the Missouri River, which allowed for easier access to the town. The town also began to attract new businesses, such as a furniture factory and a canning factory.
Geography
New Franklin is located in Howard County, Missouri. The city is situated on the banks of the Missouri River, approximately 30 miles east of Columbia. The city has a total area of 1.2 square miles, all of which is land.
The city is located in a rural area, with rolling hills and farmland. The climate is humid continental, with hot summers and cold winters. The average annual temperature is 54 degrees Fahrenheit.
Economy
The economy of New Franklin is largely based on agriculture. The town is home to several farms, which produce corn, soybeans, wheat, and hay. The town also has several small businesses, such as a furniture factory, a canning factory, and a lumber yard.
The town is also home to several restaurants and shops. The town also has a small airport, which serves the surrounding area.
Demographics
According to the 2010 census, the population of New Franklin is 1,845 people. The population is largely white (94.3%), with a small percentage of African Americans (2.2%) and Hispanics (2.2%). The median household income is $37,500, and the median home value is $90,000.
The town is served by the New Franklin School District, which includes an elementary school, a middle school, and a high school. The town also has a public library and a community center.
Conclusion
New Franklin is a small city located in Howard County, Missouri. It is situated on the banks of the Missouri River, approximately 30 miles east of Columbia. The city has a population of 1,845 people, according to the 2010 census. The economy of New Franklin is largely based on agriculture, with several small businesses and restaurants. The town is served by the New Franklin School District, and has a public library and a community center.
Common Questions
What is Per Capita Income in New Franklin?
Per Capita income in New Franklin is $23,861.
What is the Median Family Income in New Franklin?
Median Family Income in New Franklin is $60,469.
What is the Median Household income in New Franklin?
Median Household Income in New Franklin is $47,768.
What is Income or Wage Gap in New Franklin?
Income or Wage Gap in New Franklin is 11.6%.
Women in New Franklin earn 88.4 cents for every dollar earned by a man.
What is Inequality or Gini Index in New Franklin?
Inequality or Gini Index in New Franklin is 0.42.
What is the Total Population of New Franklin?
Total Population of New Franklin is 1,057.
What is the Total Male Population of New Franklin?
Total Male Population of New Franklin is 535.
What is the Total Female Population of New Franklin?
Total Female Population of New Franklin is 522.
What is the Ratio of Males per 100 Females in New Franklin?
There are 102.49 Males per 100 Females in New Franklin.
What is the Ratio of Females per 100 Males in New Franklin?
There are 97.57 Females per 100 Males in New Franklin.
What is the Median Population Age in New Franklin?
Median Population Age in New Franklin is 39.8 Years.
What is the Average Family Size in New Franklin
Average Family Size in New Franklin is 3.7 People.
What is the Average Household Size in New Franklin
Average Household Size in New Franklin is 3.1 People.
How Large is the Labor Force in New Franklin?
There are 446 People in the Labor Forcein in New Franklin.
What is the Percentage of People in the Labor Force in New Franklin?
54.6% of People are in the Labor Force in New Franklin.
What is the Unemployment Rate in New Franklin?
Unemployment Rate in New Franklin is 2.2%.