New Bloomfield, MO Map & Demographics
New Bloomfield Map
New Bloomfield Overview
$28,255
PER CAPITA INCOME
$81,250
AVG FAMILY INCOME
$71,607
AVG HOUSEHOLD INCOME
13.5%
WAGE / INCOME GAP [ % ]
86.5¢/ $1
WAGE / INCOME GAP [ $ ]
0.29
INEQUALITY / GINI INDEX
909
TOTAL POPULATION
521
MALE POPULATION
388
FEMALE POPULATION
134.28
MALES / 100 FEMALES
74.47
FEMALES / 100 MALES
47.2
MEDIAN AGE
3.0
AVG FAMILY SIZE
2.5
AVG HOUSEHOLD SIZE
590
LABOR FORCE [ PEOPLE ]
75.9%
PERCENT IN LABOR FORCE
3.4%
UNEMPLOYMENT RATE
New Bloomfield Zip Codes
New Bloomfield Area Codes
Income in New Bloomfield
Income Overview in New Bloomfield
Per Capita Income in New Bloomfield is $28,255, while median incomes of families and households are $81,250 and $71,607 respectively.
| Characteristic | Number | Measure |
| Per Capita Income | 909 | $28,255 |
| Median Family Income | 256 | $81,250 |
| Mean Family Income | 256 | $73,784 |
| Median Household Income | 360 | $71,607 |
| Mean Household Income | 360 | $69,986 |
| Income Deficit | 256 | $0 |
| Wage / Income Gap (%) | 909 | 13.53% |
| Wage / Income Gap ($) | 909 | 86.47¢ per $1 |
| Gini / Inequality Index | 909 | 0.29 |
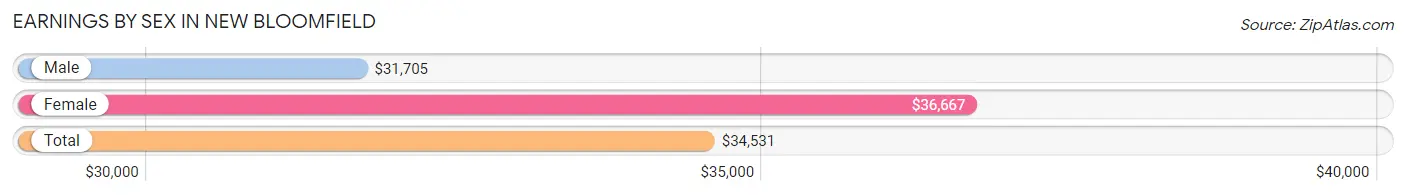
Earnings by Sex in New Bloomfield
Average Earnings in New Bloomfield are $34,531, $31,705 for men and $36,667 for women, a difference of 13.5%.
| Sex | Number | Average Earnings |
| Male | 409 (68.7%) | $31,705 |
| Female | 186 (31.3%) | $36,667 |
| Total | 595 (100.0%) | $34,531 |
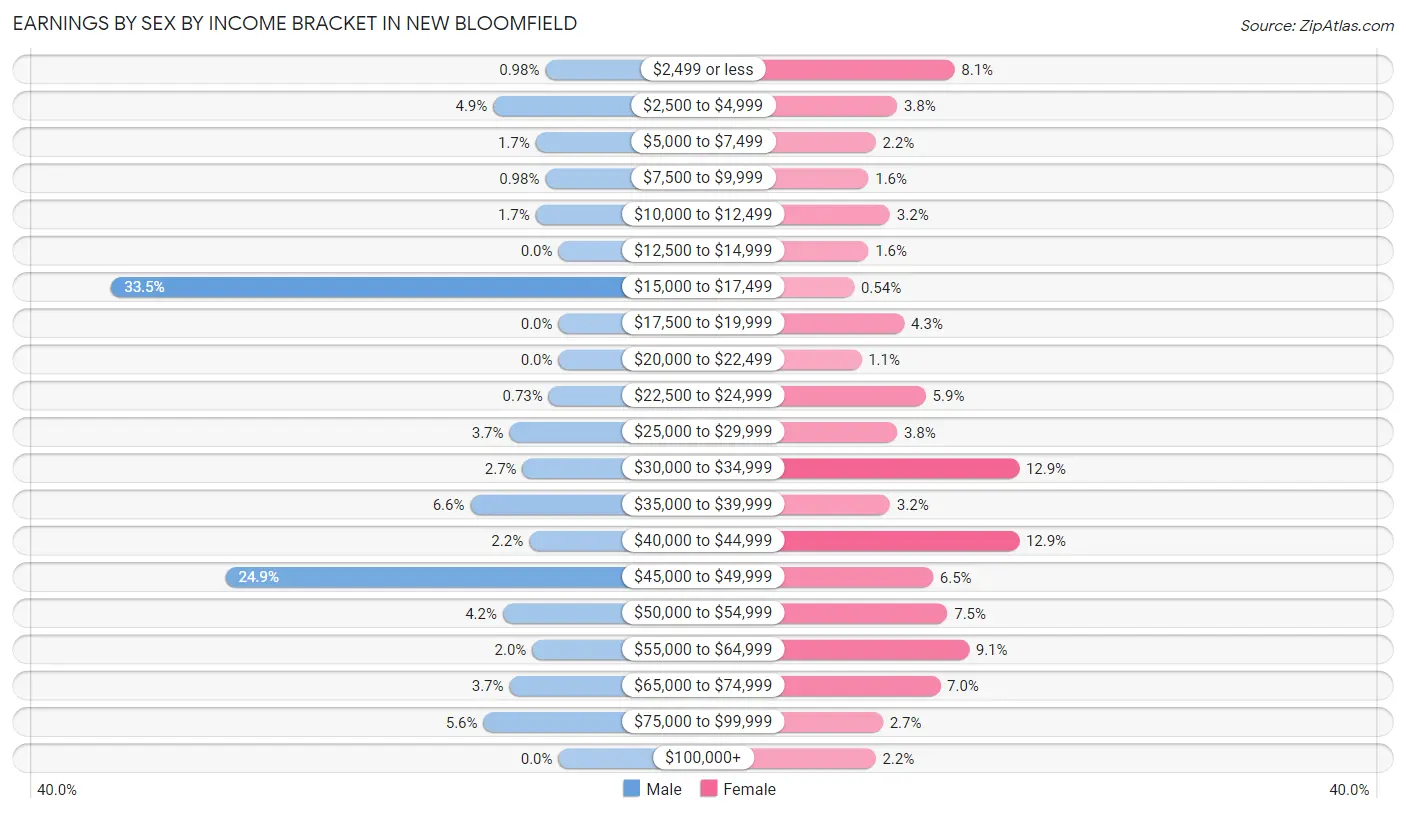
Earnings by Sex by Income Bracket in New Bloomfield
The most common earnings brackets in New Bloomfield are $15,000 to $17,499 for men (137 | 33.5%) and $30,000 to $34,999 for women (24 | 12.9%).
| Income | Male | Female |
| $2,499 or less | 4 (1.0%) | 15 (8.1%) |
| $2,500 to $4,999 | 20 (4.9%) | 7 (3.8%) |
| $5,000 to $7,499 | 7 (1.7%) | 4 (2.1%) |
| $7,500 to $9,999 | 4 (1.0%) | 3 (1.6%) |
| $10,000 to $12,499 | 7 (1.7%) | 6 (3.2%) |
| $12,500 to $14,999 | 0 (0.0%) | 3 (1.6%) |
| $15,000 to $17,499 | 137 (33.5%) | 1 (0.5%) |
| $17,500 to $19,999 | 0 (0.0%) | 8 (4.3%) |
| $20,000 to $22,499 | 0 (0.0%) | 2 (1.1%) |
| $22,500 to $24,999 | 3 (0.7%) | 11 (5.9%) |
| $25,000 to $29,999 | 15 (3.7%) | 7 (3.8%) |
| $30,000 to $34,999 | 11 (2.7%) | 24 (12.9%) |
| $35,000 to $39,999 | 27 (6.6%) | 6 (3.2%) |
| $40,000 to $44,999 | 9 (2.2%) | 24 (12.9%) |
| $45,000 to $49,999 | 102 (24.9%) | 12 (6.5%) |
| $50,000 to $54,999 | 17 (4.2%) | 14 (7.5%) |
| $55,000 to $64,999 | 8 (2.0%) | 17 (9.1%) |
| $65,000 to $74,999 | 15 (3.7%) | 13 (7.0%) |
| $75,000 to $99,999 | 23 (5.6%) | 5 (2.7%) |
| $100,000+ | 0 (0.0%) | 4 (2.1%) |
| Total | 409 (100.0%) | 186 (100.0%) |
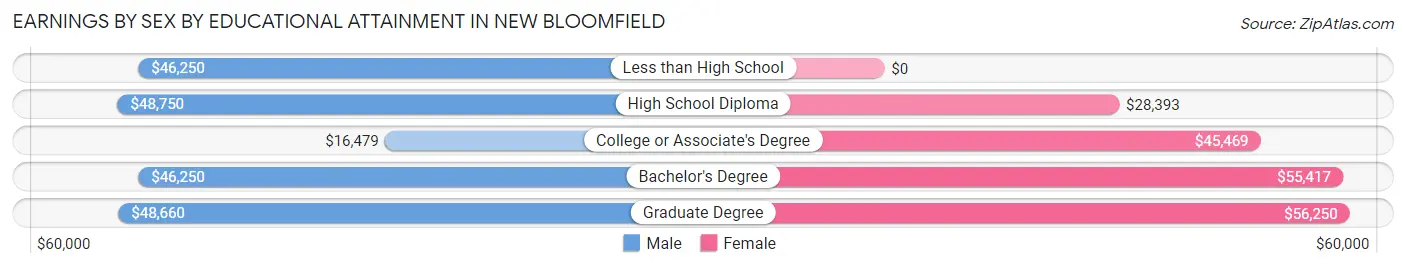
Earnings by Sex by Educational Attainment in New Bloomfield
Average earnings in New Bloomfield are $37,000 for men and $41,000 for women, a difference of 9.8%. Men with an educational attainment of high school diploma enjoy the highest average annual earnings of $48,750, while those with college or associate's degree education earn the least with $16,479. Women with an educational attainment of graduate degree earn the most with the average annual earnings of $56,250, while those with high school diploma education have the smallest earnings of $28,393.
| Educational Attainment | Male Income | Female Income |
| Less than High School | $46,250 | $0 |
| High School Diploma | $48,750 | $28,393 |
| College or Associate's Degree | $16,479 | $45,469 |
| Bachelor's Degree | $46,250 | $55,417 |
| Graduate Degree | $48,660 | $56,250 |
| Total | $37,000 | $41,000 |
Family Income in New Bloomfield
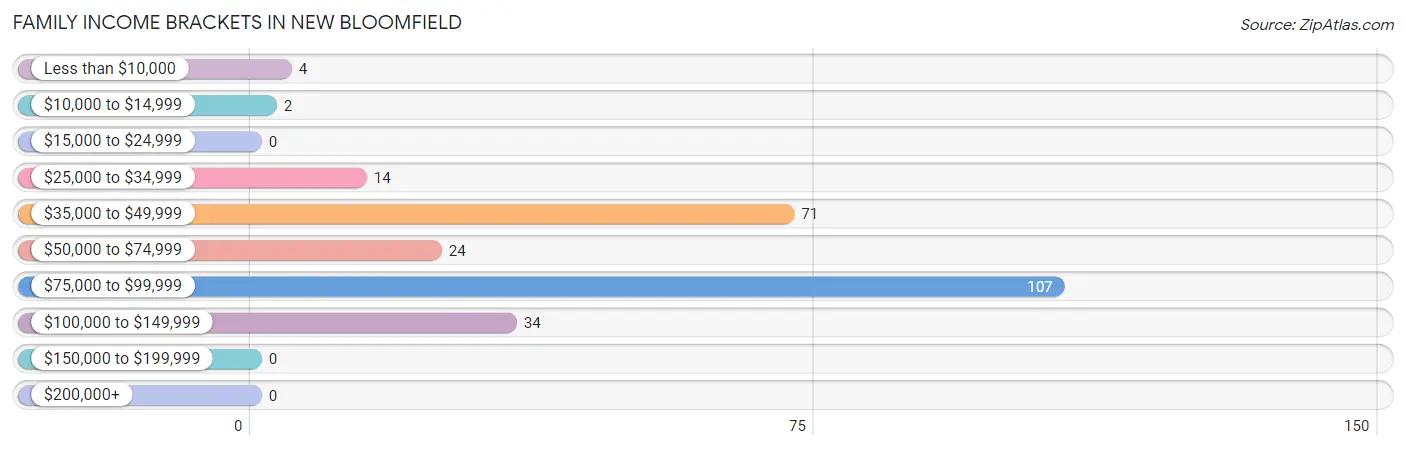
Family Income Brackets in New Bloomfield
According to the New Bloomfield family income data, there are 107 families falling into the $75,000 to $99,999 income range, which is the most common income bracket and makes up 41.8% of all families.
| Income Bracket | # Families | % Families |
| Less than $10,000 | 4 | 1.6% |
| $10,000 to $14,999 | 2 | 0.8% |
| $15,000 to $24,999 | 0 | 0.0% |
| $25,000 to $34,999 | 14 | 5.5% |
| $35,000 to $49,999 | 71 | 27.7% |
| $50,000 to $74,999 | 24 | 9.4% |
| $75,000 to $99,999 | 107 | 41.8% |
| $100,000 to $149,999 | 34 | 13.3% |
| $150,000 to $199,999 | 0 | 0.0% |
| $200,000+ | 0 | 0.0% |
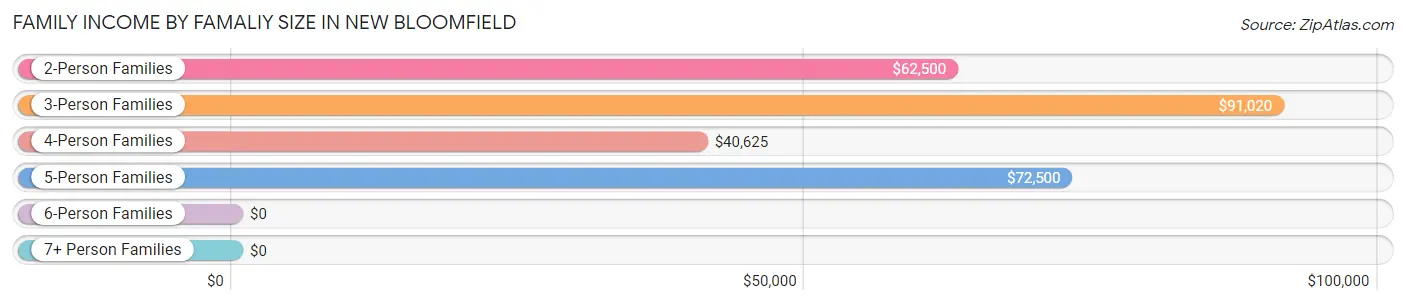
Family Income by Famaliy Size in New Bloomfield
3-person families (100 | 39.1%) account for the highest median family income in New Bloomfield with $91,020 per family, while 2-person families (100 | 39.1%) have the highest median income of $31,250 per family member.
| Income Bracket | # Families | Median Income |
| 2-Person Families | 100 (39.1%) | $62,500 |
| 3-Person Families | 100 (39.1%) | $91,020 |
| 4-Person Families | 24 (9.4%) | $40,625 |
| 5-Person Families | 32 (12.5%) | $72,500 |
| 6-Person Families | 0 (0.0%) | $0 |
| 7+ Person Families | 0 (0.0%) | $0 |
| Total | 256 (100.0%) | $81,250 |
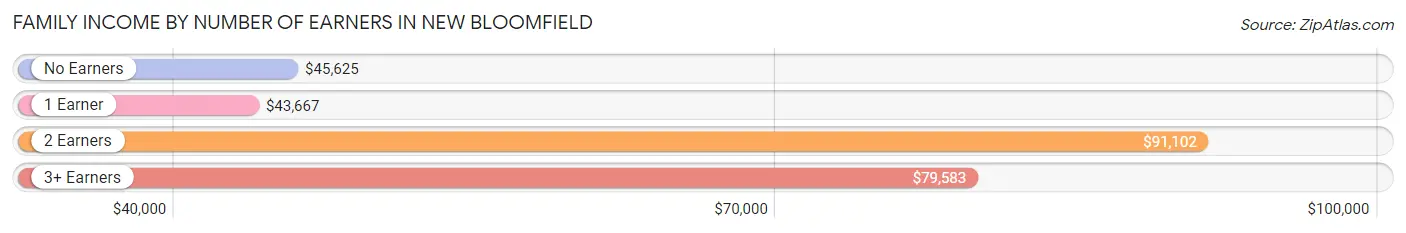
Family Income by Number of Earners in New Bloomfield
The median family income in New Bloomfield is $81,250, with families comprising 2 earners (137) having the highest median family income of $91,102, while families with 1 earner (84) have the lowest median family income of $43,667, accounting for 53.5% and 32.8% of families, respectively.
| Number of Earners | # Families | Median Income |
| No Earners | 17 (6.6%) | $45,625 |
| 1 Earner | 84 (32.8%) | $43,667 |
| 2 Earners | 137 (53.5%) | $91,102 |
| 3+ Earners | 18 (7.0%) | $79,583 |
| Total | 256 (100.0%) | $81,250 |
Household Income in New Bloomfield
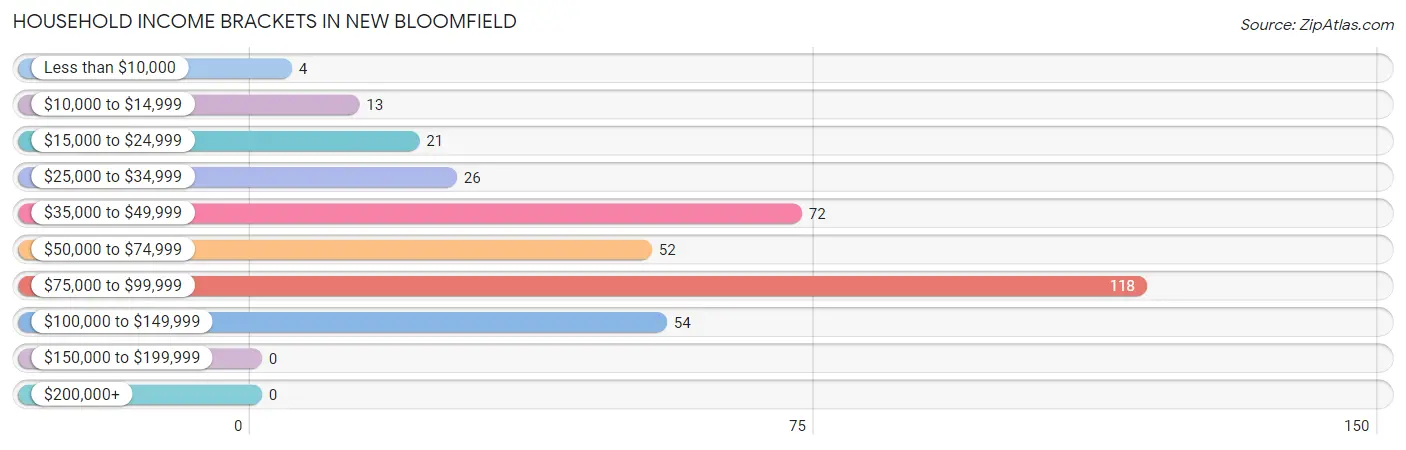
Household Income Brackets in New Bloomfield
With 118 households falling in the category, the $75,000 to $99,999 income range is the most frequent in New Bloomfield, accounting for 32.8% of all households.
| Income Bracket | # Households | % Households |
| Less than $10,000 | 4 | 1.1% |
| $10,000 to $14,999 | 13 | 3.6% |
| $15,000 to $24,999 | 21 | 5.8% |
| $25,000 to $34,999 | 26 | 7.2% |
| $35,000 to $49,999 | 72 | 20.0% |
| $50,000 to $74,999 | 52 | 14.4% |
| $75,000 to $99,999 | 118 | 32.8% |
| $100,000 to $149,999 | 54 | 15.0% |
| $150,000 to $199,999 | 0 | 0.0% |
| $200,000+ | 0 | 0.0% |
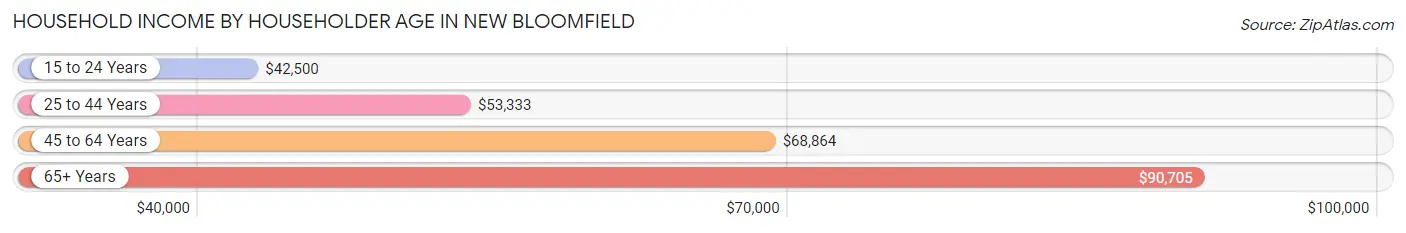
Household Income by Householder Age in New Bloomfield
The median household income in New Bloomfield is $71,607, with the highest median household income of $90,705 found in the 65+ years age bracket for the primary householder. A total of 128 households (35.6%) fall into this category. Meanwhile, the 15 to 24 years age bracket for the primary householder has the lowest median household income of $42,500, with 16 households (4.4%) in this group.
| Income Bracket | # Households | Median Income |
| 15 to 24 Years | 16 (4.4%) | $42,500 |
| 25 to 44 Years | 102 (28.3%) | $53,333 |
| 45 to 64 Years | 114 (31.7%) | $68,864 |
| 65+ Years | 128 (35.6%) | $90,705 |
| Total | 360 (100.0%) | $71,607 |
Poverty in New Bloomfield
Income Below Poverty by Sex and Age in New Bloomfield
With 3.7% poverty level for males and 4.4% for females among the residents of New Bloomfield, under 5 year old males and 18 to 24 year old females are the most vulnerable to poverty, with 3 males (33.3%) and 3 females (25.0%) in their respective age groups living below the poverty level.
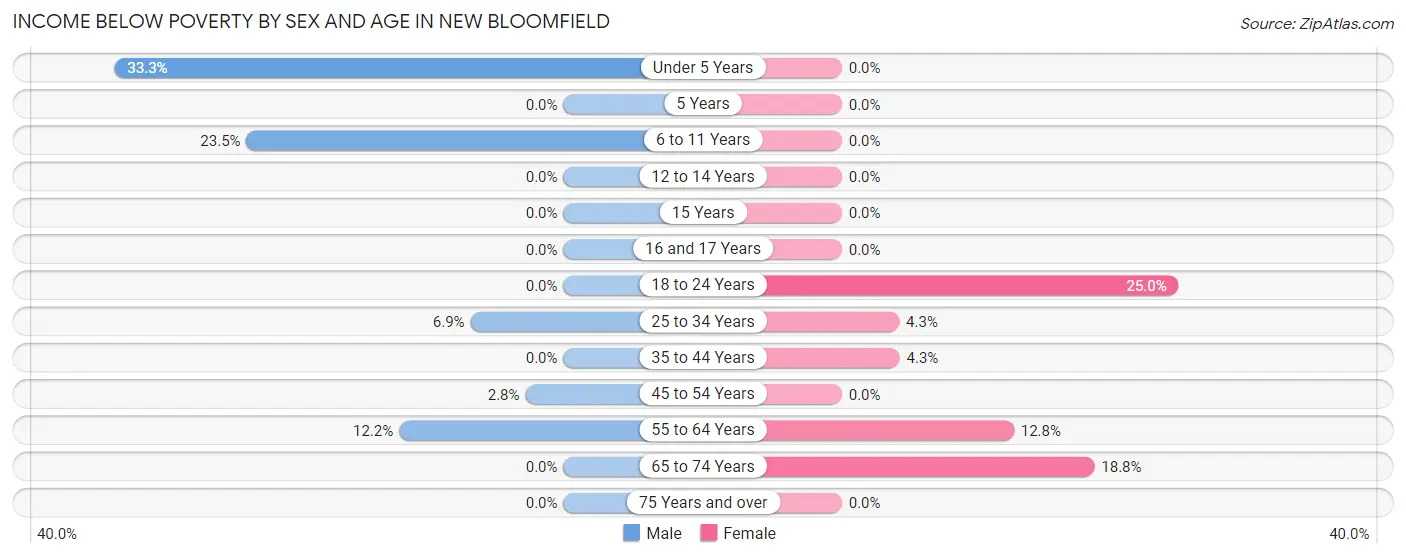
| Age Bracket | Male | Female |
| Under 5 Years | 3 (33.3%) | 0 (0.0%) |
| 5 Years | 0 (0.0%) | 0 (0.0%) |
| 6 to 11 Years | 4 (23.5%) | 0 (0.0%) |
| 12 to 14 Years | 0 (0.0%) | 0 (0.0%) |
| 15 Years | 0 (0.0%) | 0 (0.0%) |
| 16 and 17 Years | 0 (0.0%) | 0 (0.0%) |
| 18 to 24 Years | 0 (0.0%) | 3 (25.0%) |
| 25 to 34 Years | 2 (6.9%) | 2 (4.3%) |
| 35 to 44 Years | 0 (0.0%) | 3 (4.3%) |
| 45 to 54 Years | 5 (2.8%) | 0 (0.0%) |
| 55 to 64 Years | 5 (12.2%) | 6 (12.8%) |
| 65 to 74 Years | 0 (0.0%) | 3 (18.8%) |
| 75 Years and over | 0 (0.0%) | 0 (0.0%) |
| Total | 19 (3.7%) | 17 (4.4%) |
Income Above Poverty by Sex and Age in New Bloomfield
According to the poverty statistics in New Bloomfield, males aged 5 years and females aged under 5 years are the age groups that are most secure financially, with 100.0% of males and 100.0% of females in these age groups living above the poverty line.
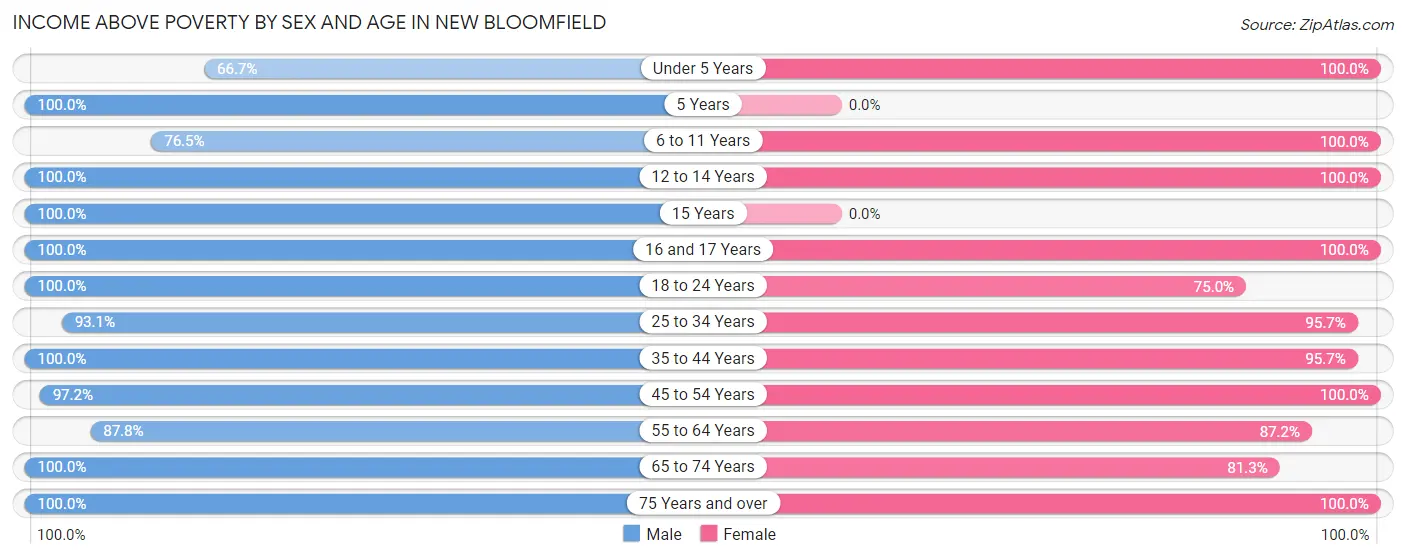
| Age Bracket | Male | Female |
| Under 5 Years | 6 (66.7%) | 16 (100.0%) |
| 5 Years | 3 (100.0%) | 0 (0.0%) |
| 6 to 11 Years | 13 (76.5%) | 29 (100.0%) |
| 12 to 14 Years | 19 (100.0%) | 28 (100.0%) |
| 15 Years | 5 (100.0%) | 0 (0.0%) |
| 16 and 17 Years | 17 (100.0%) | 7 (100.0%) |
| 18 to 24 Years | 47 (100.0%) | 9 (75.0%) |
| 25 to 34 Years | 27 (93.1%) | 45 (95.7%) |
| 35 to 44 Years | 51 (100.0%) | 67 (95.7%) |
| 45 to 54 Years | 172 (97.2%) | 52 (100.0%) |
| 55 to 64 Years | 36 (87.8%) | 41 (87.2%) |
| 65 to 74 Years | 86 (100.0%) | 13 (81.2%) |
| 75 Years and over | 14 (100.0%) | 64 (100.0%) |
| Total | 496 (96.3%) | 371 (95.6%) |
Income Below Poverty Among Married-Couple Families in New Bloomfield
The poverty statistics for married-couple families in New Bloomfield show that 3.0% or 6 of the total 198 families live below the poverty line. Families with 3 or 4 children have the highest poverty rate of 11.8%, comprising of 2 families. On the other hand, families with 1 or 2 children have the lowest poverty rate of 0.0%, which includes 0 families.
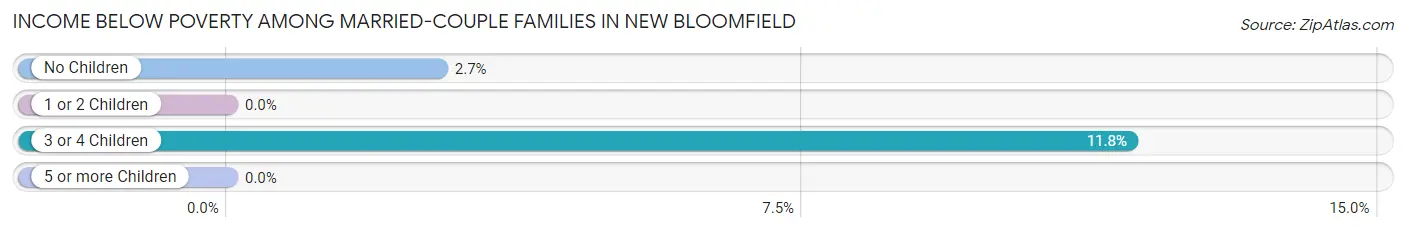
| Children | Above Poverty | Below Poverty |
| No Children | 142 (97.3%) | 4 (2.7%) |
| 1 or 2 Children | 35 (100.0%) | 0 (0.0%) |
| 3 or 4 Children | 15 (88.2%) | 2 (11.8%) |
| 5 or more Children | 0 (0.0%) | 0 (0.0%) |
| Total | 192 (97.0%) | 6 (3.0%) |
Income Below Poverty Among Single-Parent Households in New Bloomfield
| Children | Single Father | Single Mother |
| No Children | 0 (0.0%) | 0 (0.0%) |
| 1 or 2 Children | 0 (0.0%) | 0 (0.0%) |
| 3 or 4 Children | 0 (0.0%) | 0 (0.0%) |
| 5 or more Children | 0 (0.0%) | 0 (0.0%) |
| Total | 0 (0.0%) | 0 (0.0%) |
Income Below Poverty Among Married-Couple vs Single-Parent Households in New Bloomfield
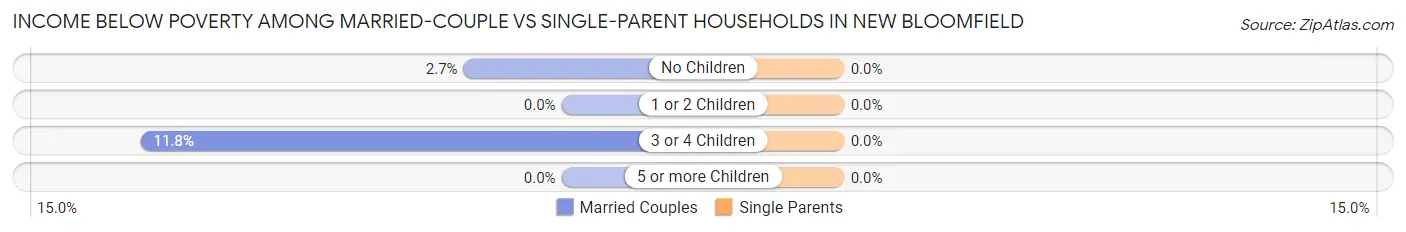
| Children | Married-Couple Families | Single-Parent Households |
| No Children | 4 (2.7%) | 0 (0.0%) |
| 1 or 2 Children | 0 (0.0%) | 0 (0.0%) |
| 3 or 4 Children | 2 (11.8%) | 0 (0.0%) |
| 5 or more Children | 0 (0.0%) | 0 (0.0%) |
| Total | 6 (3.0%) | 0 (0.0%) |
Race in New Bloomfield
The most populous races in New Bloomfield are White / Caucasian (828 | 91.1%), Two or more Races (76 | 8.4%), and Hispanic or Latino (26 | 2.9%).
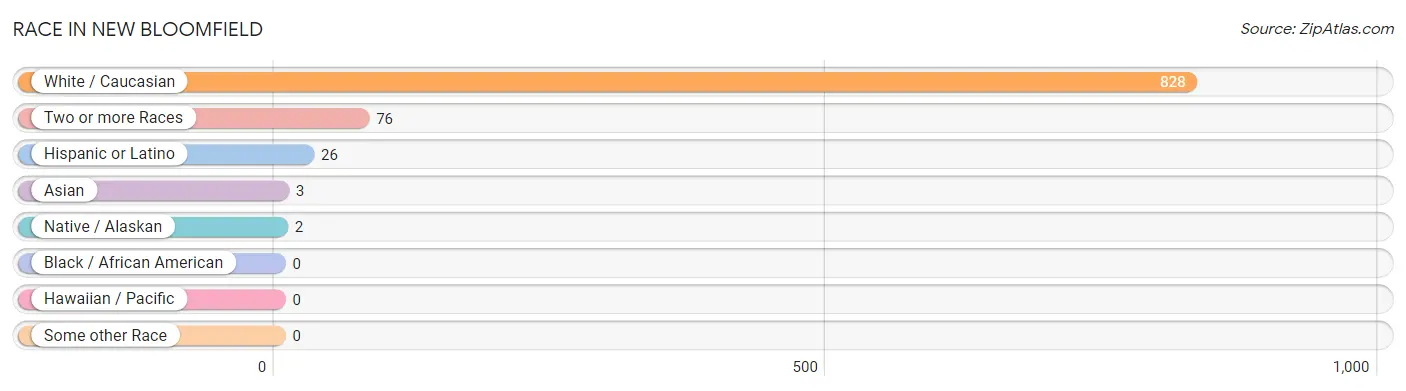
| Race | # Population | % Population |
| Asian | 3 | 0.3% |
| Black / African American | 0 | 0.0% |
| Hawaiian / Pacific | 0 | 0.0% |
| Hispanic or Latino | 26 | 2.9% |
| Native / Alaskan | 2 | 0.2% |
| White / Caucasian | 828 | 91.1% |
| Two or more Races | 76 | 8.4% |
| Some other Race | 0 | 0.0% |
| Total | 909 | 100.0% |
Ancestry in New Bloomfield
The most populous ancestries reported in New Bloomfield are American (308 | 33.9%), German (166 | 18.3%), English (71 | 7.8%), Irish (36 | 4.0%), and Cherokee (23 | 2.5%), together accounting for 66.4% of all New Bloomfield residents.
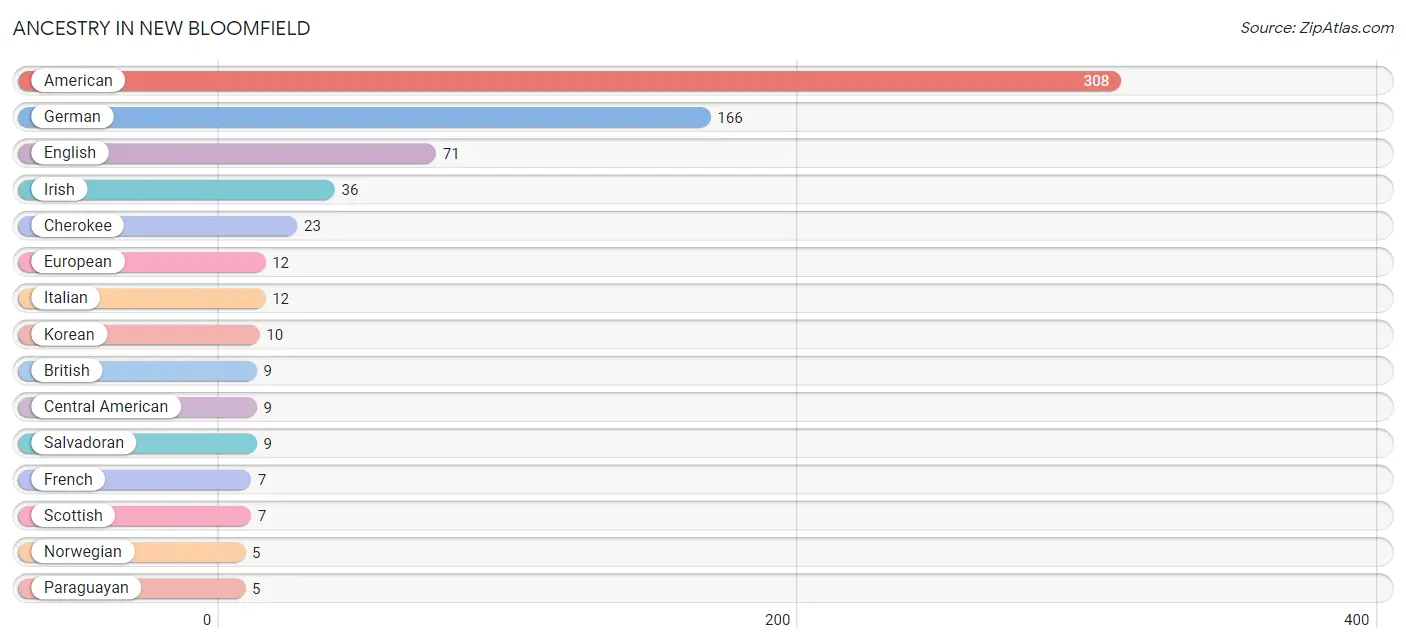
| Ancestry | # Population | % Population |
| American | 308 | 33.9% |
| British | 9 | 1.0% |
| Central American | 9 | 1.0% |
| Cherokee | 23 | 2.5% |
| Dutch | 2 | 0.2% |
| English | 71 | 7.8% |
| European | 12 | 1.3% |
| French | 7 | 0.8% |
| German | 166 | 18.3% |
| Irish | 36 | 4.0% |
| Italian | 12 | 1.3% |
| Korean | 10 | 1.1% |
| Mexican | 3 | 0.3% |
| Northern European | 4 | 0.4% |
| Norwegian | 5 | 0.5% |
| Pakistani | 2 | 0.2% |
| Paraguayan | 5 | 0.5% |
| Polish | 5 | 0.5% |
| Salvadoran | 9 | 1.0% |
| Scandinavian | 4 | 0.4% |
| Scotch-Irish | 2 | 0.2% |
| Scottish | 7 | 0.8% |
| South American | 5 | 0.5% |
| Swiss | 1 | 0.1% |
| Welsh | 3 | 0.3% | View All 25 Rows |
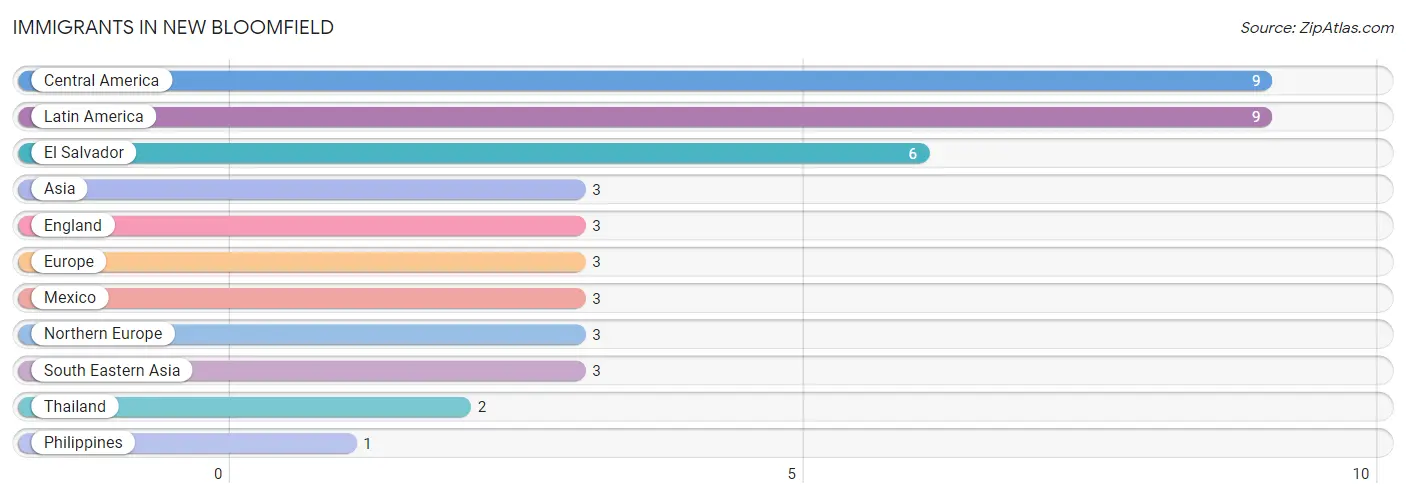
Immigrants in New Bloomfield
The most numerous immigrant groups reported in New Bloomfield came from Central America (9 | 1.0%), Latin America (9 | 1.0%), El Salvador (6 | 0.7%), Asia (3 | 0.3%), and England (3 | 0.3%), together accounting for 3.3% of all New Bloomfield residents.
| Immigration Origin | # Population | % Population |
| Asia | 3 | 0.3% |
| Central America | 9 | 1.0% |
| El Salvador | 6 | 0.7% |
| England | 3 | 0.3% |
| Europe | 3 | 0.3% |
| Latin America | 9 | 1.0% |
| Mexico | 3 | 0.3% |
| Northern Europe | 3 | 0.3% |
| Philippines | 1 | 0.1% |
| South Eastern Asia | 3 | 0.3% |
| Thailand | 2 | 0.2% | View All 11 Rows |
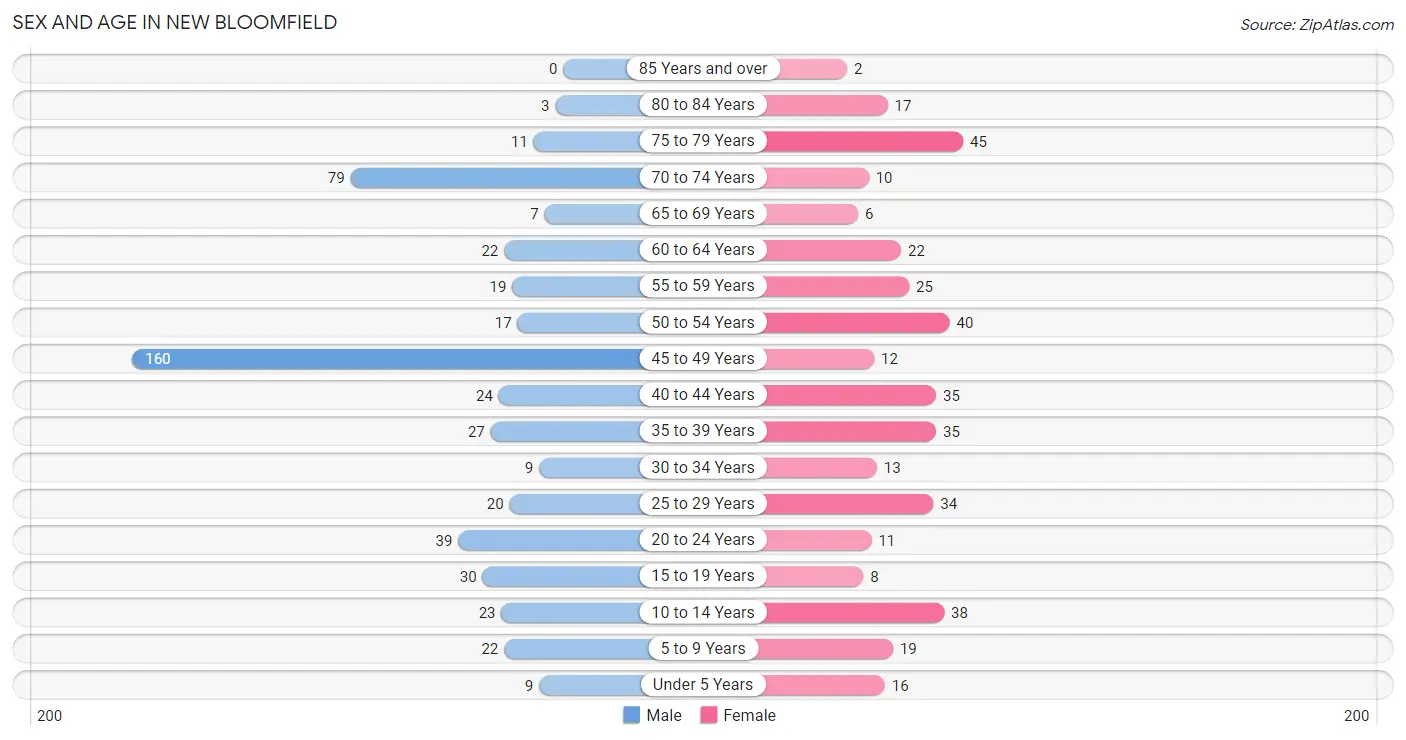
Sex and Age in New Bloomfield
Sex and Age in New Bloomfield
The most populous age groups in New Bloomfield are 45 to 49 Years (160 | 30.7%) for men and 75 to 79 Years (45 | 11.6%) for women.
| Age Bracket | Male | Female |
| Under 5 Years | 9 (1.7%) | 16 (4.1%) |
| 5 to 9 Years | 22 (4.2%) | 19 (4.9%) |
| 10 to 14 Years | 23 (4.4%) | 38 (9.8%) |
| 15 to 19 Years | 30 (5.8%) | 8 (2.1%) |
| 20 to 24 Years | 39 (7.5%) | 11 (2.8%) |
| 25 to 29 Years | 20 (3.8%) | 34 (8.8%) |
| 30 to 34 Years | 9 (1.7%) | 13 (3.4%) |
| 35 to 39 Years | 27 (5.2%) | 35 (9.0%) |
| 40 to 44 Years | 24 (4.6%) | 35 (9.0%) |
| 45 to 49 Years | 160 (30.7%) | 12 (3.1%) |
| 50 to 54 Years | 17 (3.3%) | 40 (10.3%) |
| 55 to 59 Years | 19 (3.6%) | 25 (6.4%) |
| 60 to 64 Years | 22 (4.2%) | 22 (5.7%) |
| 65 to 69 Years | 7 (1.3%) | 6 (1.5%) |
| 70 to 74 Years | 79 (15.2%) | 10 (2.6%) |
| 75 to 79 Years | 11 (2.1%) | 45 (11.6%) |
| 80 to 84 Years | 3 (0.6%) | 17 (4.4%) |
| 85 Years and over | 0 (0.0%) | 2 (0.5%) |
| Total | 521 (100.0%) | 388 (100.0%) |
Families and Households in New Bloomfield
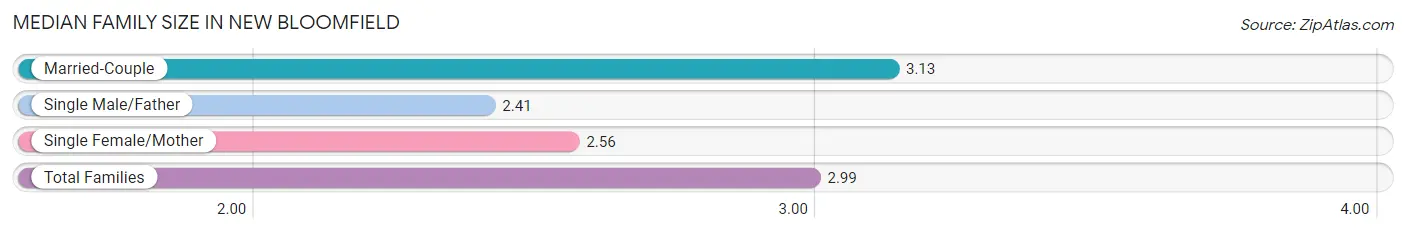
Median Family Size in New Bloomfield
The median family size in New Bloomfield is 2.99 persons per family, with married-couple families (198 | 77.3%) accounting for the largest median family size of 3.13 persons per family. On the other hand, single male/father families (17 | 6.6%) represent the smallest median family size with 2.41 persons per family.
| Family Type | # Families | Family Size |
| Married-Couple | 198 (77.3%) | 3.13 |
| Single Male/Father | 17 (6.6%) | 2.41 |
| Single Female/Mother | 41 (16.0%) | 2.56 |
| Total Families | 256 (100.0%) | 2.99 |
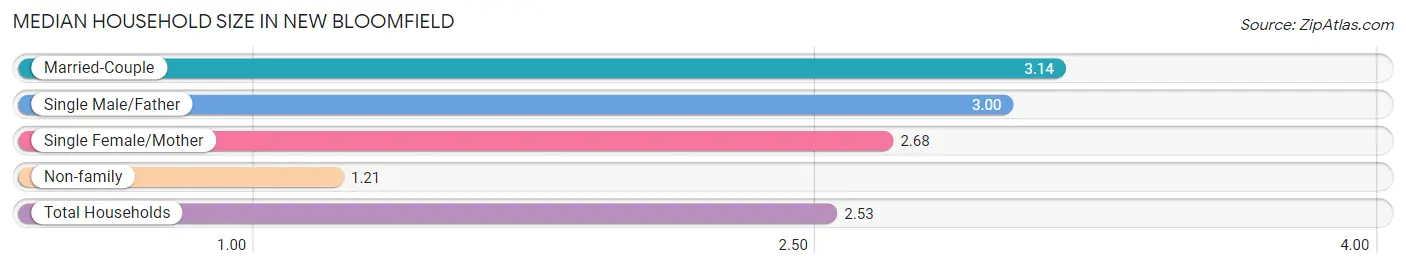
Median Household Size in New Bloomfield
The median household size in New Bloomfield is 2.53 persons per household, with married-couple households (198 | 55.0%) accounting for the largest median household size of 3.14 persons per household. non-family households (104 | 28.9%) represent the smallest median household size with 1.21 persons per household.
| Household Type | # Households | Household Size |
| Married-Couple | 198 (55.0%) | 3.14 |
| Single Male/Father | 17 (4.7%) | 3.00 |
| Single Female/Mother | 41 (11.4%) | 2.68 |
| Non-family | 104 (28.9%) | 1.21 |
| Total Households | 360 (100.0%) | 2.53 |
Household Size by Marriage Status in New Bloomfield
Out of a total of 360 households in New Bloomfield, 256 (71.1%) are family households, while 104 (28.9%) are nonfamily households. The most numerous type of family households are 3-person households, comprising 100, and the most common type of nonfamily households are 1-person households, comprising 88.
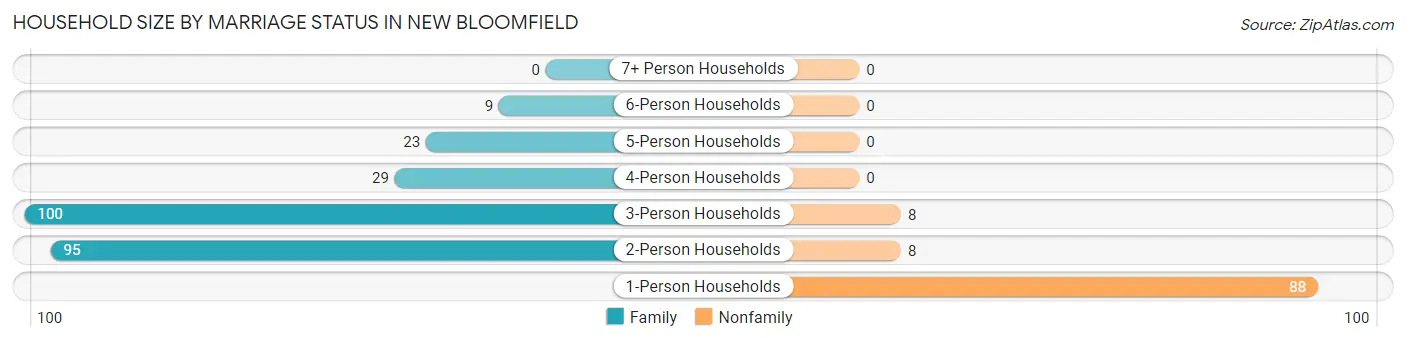
| Household Size | Family Households | Nonfamily Households |
| 1-Person Households | - | 88 (24.4%) |
| 2-Person Households | 95 (26.4%) | 8 (2.2%) |
| 3-Person Households | 100 (27.8%) | 8 (2.2%) |
| 4-Person Households | 29 (8.1%) | 0 (0.0%) |
| 5-Person Households | 23 (6.4%) | 0 (0.0%) |
| 6-Person Households | 9 (2.5%) | 0 (0.0%) |
| 7+ Person Households | 0 (0.0%) | 0 (0.0%) |
| Total | 256 (71.1%) | 104 (28.9%) |
Female Fertility in New Bloomfield
Fertility by Age in New Bloomfield
Average fertility rate in New Bloomfield is 54.0 births per 1,000 women. Women in the age bracket of 20 to 34 years have the highest fertility rate with 138.0 births per 1,000 women. Women in the age bracket of 20 to 34 years acount for 100.0% of all women with births.
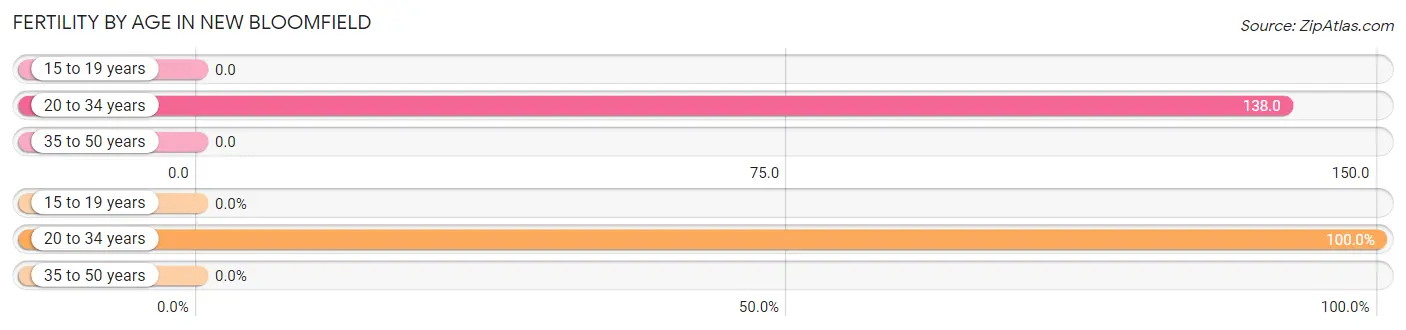
| Age Bracket | Women with Births | Births / 1,000 Women |
| 15 to 19 years | 0 (0.0%) | 0.0 |
| 20 to 34 years | 8 (100.0%) | 138.0 |
| 35 to 50 years | 0 (0.0%) | 0.0 |
| Total | 8 (100.0%) | 54.0 |
Fertility by Age by Marriage Status in New Bloomfield
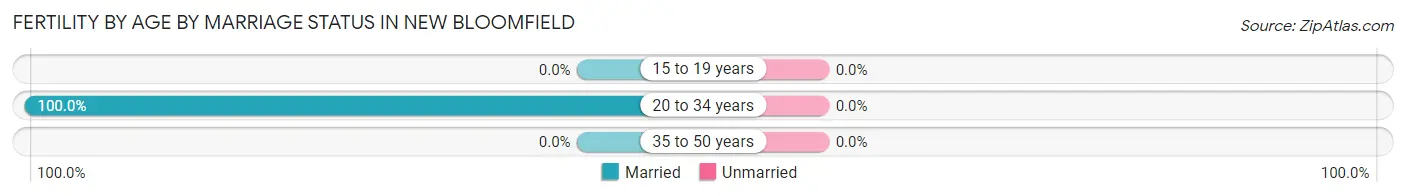
| Age Bracket | Married | Unmarried |
| 15 to 19 years | 0 (0.0%) | 0 (0.0%) |
| 20 to 34 years | 8 (100.0%) | 0 (0.0%) |
| 35 to 50 years | 0 (0.0%) | 0 (0.0%) |
| Total | 8 (100.0%) | 0 (0.0%) |
Fertility by Education in New Bloomfield
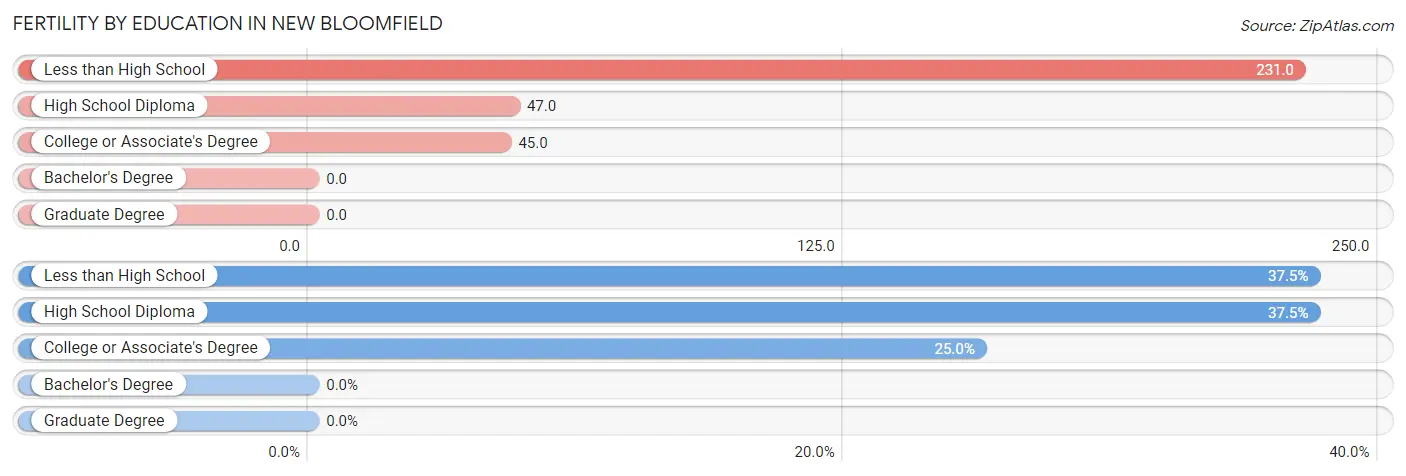
| Educational Attainment | Women with Births | Births / 1,000 Women |
| Less than High School | 3 (37.5%) | 231.0 |
| High School Diploma | 3 (37.5%) | 47.0 |
| College or Associate's Degree | 2 (25.0%) | 45.0 |
| Bachelor's Degree | 0 (0.0%) | 0.0 |
| Graduate Degree | 0 (0.0%) | 0.0 |
| Total | 8 (100.0%) | 54.0 |
Fertility by Education by Marriage Status in New Bloomfield
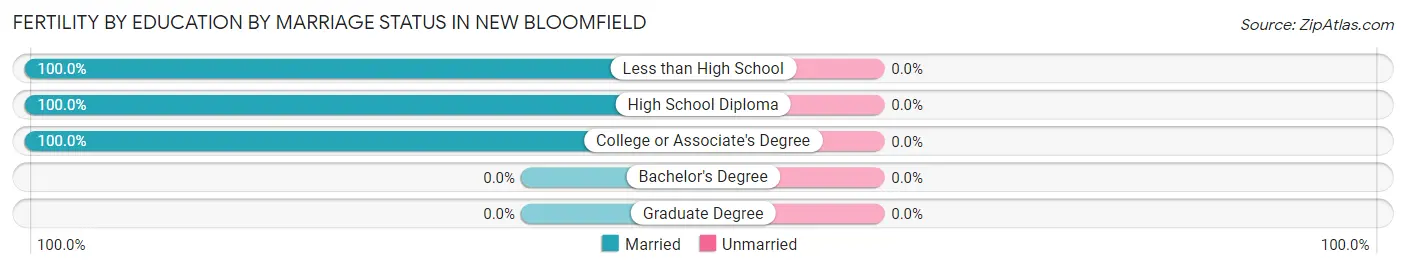
| Educational Attainment | Married | Unmarried |
| Less than High School | 3 (100.0%) | 0 (0.0%) |
| High School Diploma | 3 (100.0%) | 0 (0.0%) |
| College or Associate's Degree | 2 (100.0%) | 0 (0.0%) |
| Bachelor's Degree | 0 (0.0%) | 0 (0.0%) |
| Graduate Degree | 0 (0.0%) | 0 (0.0%) |
| Total | 8 (100.0%) | 0 (0.0%) |
Employment Characteristics in New Bloomfield
Employment by Class of Employer in New Bloomfield
Among the 570 employed individuals in New Bloomfield, private company employees (336 | 59.0%), not-for-profit organizations (95 | 16.7%), and state government employees (63 | 11.1%) make up the most common classes of employment.
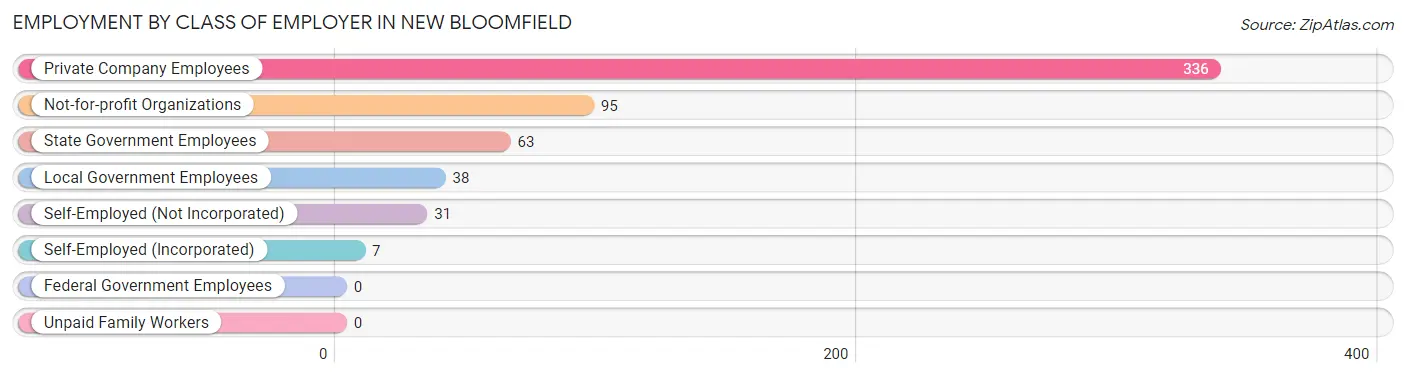
| Employer Class | # Employees | % Employees |
| Private Company Employees | 336 | 59.0% |
| Self-Employed (Incorporated) | 7 | 1.2% |
| Self-Employed (Not Incorporated) | 31 | 5.4% |
| Not-for-profit Organizations | 95 | 16.7% |
| Local Government Employees | 38 | 6.7% |
| State Government Employees | 63 | 11.1% |
| Federal Government Employees | 0 | 0.0% |
| Unpaid Family Workers | 0 | 0.0% |
| Total | 570 | 100.0% |
Employment Status by Age in New Bloomfield
According to the labor force statistics for New Bloomfield, out of the total population over 16 years of age (777), 75.9% or 590 individuals are in the labor force, with 3.4% or 20 of them unemployed. The age group with the highest labor force participation rate is 30 to 34 years, with 100.0% or 22 individuals in the labor force. Within the labor force, the 25 to 29 years age range has the highest percentage of unemployed individuals, with 30.3% or 10 of them being unemployed.
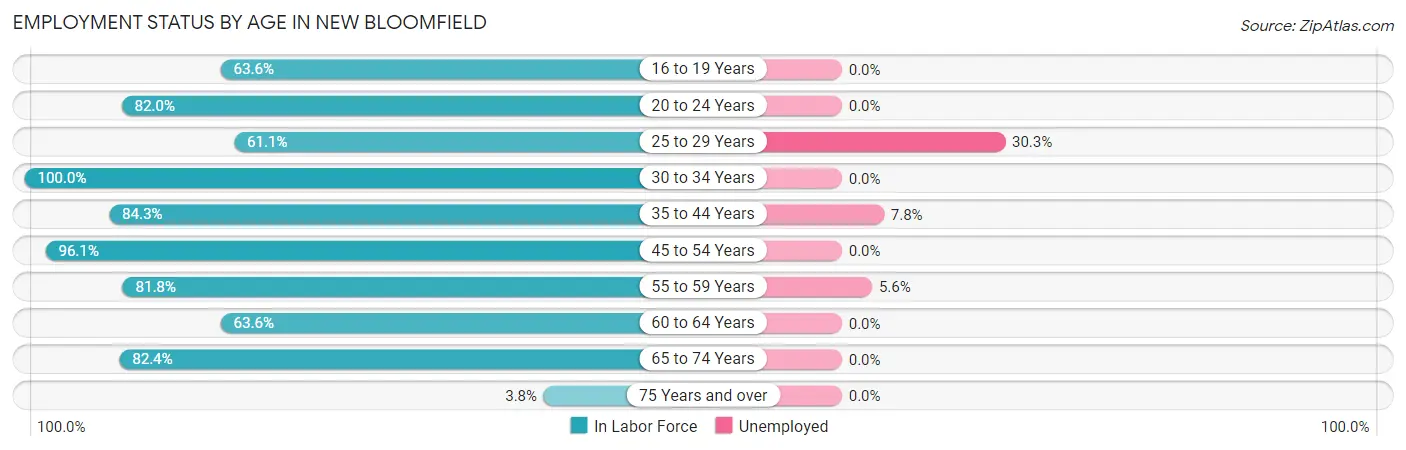
| Age Bracket | In Labor Force | Unemployed |
| 16 to 19 Years | 21 (63.6%) | 0 (0.0%) |
| 20 to 24 Years | 41 (82.0%) | 0 (0.0%) |
| 25 to 29 Years | 33 (61.1%) | 10 (30.3%) |
| 30 to 34 Years | 22 (100.0%) | 0 (0.0%) |
| 35 to 44 Years | 102 (84.3%) | 8 (7.8%) |
| 45 to 54 Years | 220 (96.1%) | 0 (0.0%) |
| 55 to 59 Years | 36 (81.8%) | 2 (5.6%) |
| 60 to 64 Years | 28 (63.6%) | 0 (0.0%) |
| 65 to 74 Years | 84 (82.4%) | 0 (0.0%) |
| 75 Years and over | 3 (3.8%) | 0 (0.0%) |
| Total | 590 (75.9%) | 20 (3.4%) |
Employment Status by Educational Attainment in New Bloomfield
According to labor force statistics for New Bloomfield, 85.8% of individuals (441) out of the total population between 25 and 64 years of age (514) are in the labor force, with 4.5% or 20 of them being unemployed. The group with the highest labor force participation rate are those with the educational attainment of bachelor's degree or higher, with 100.0% or 87 individuals in the labor force. Within the labor force, individuals with high school diploma education have the highest percentage of unemployment, with 15.4% or 18 of them being unemployed.
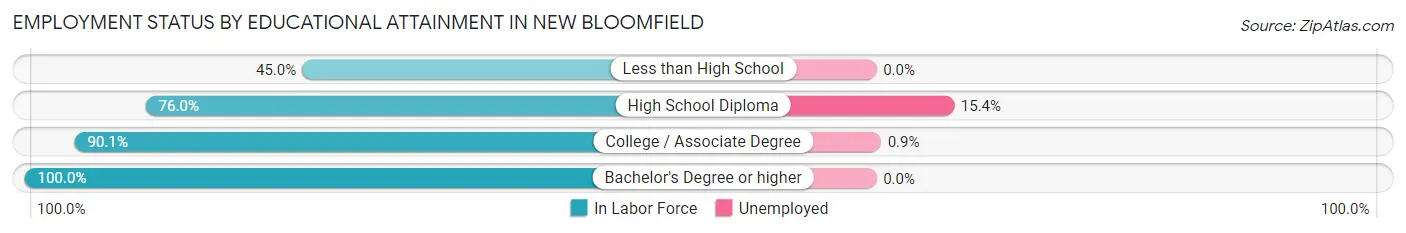
| Educational Attainment | In Labor Force | Unemployed |
| Less than High School | 9 (45.0%) | 0 (0.0%) |
| High School Diploma | 117 (76.0%) | 24 (15.4%) |
| College / Associate Degree | 228 (90.1%) | 2 (0.9%) |
| Bachelor's Degree or higher | 87 (100.0%) | 0 (0.0%) |
| Total | 441 (85.8%) | 23 (4.5%) |
Employment Occupations by Sex in New Bloomfield
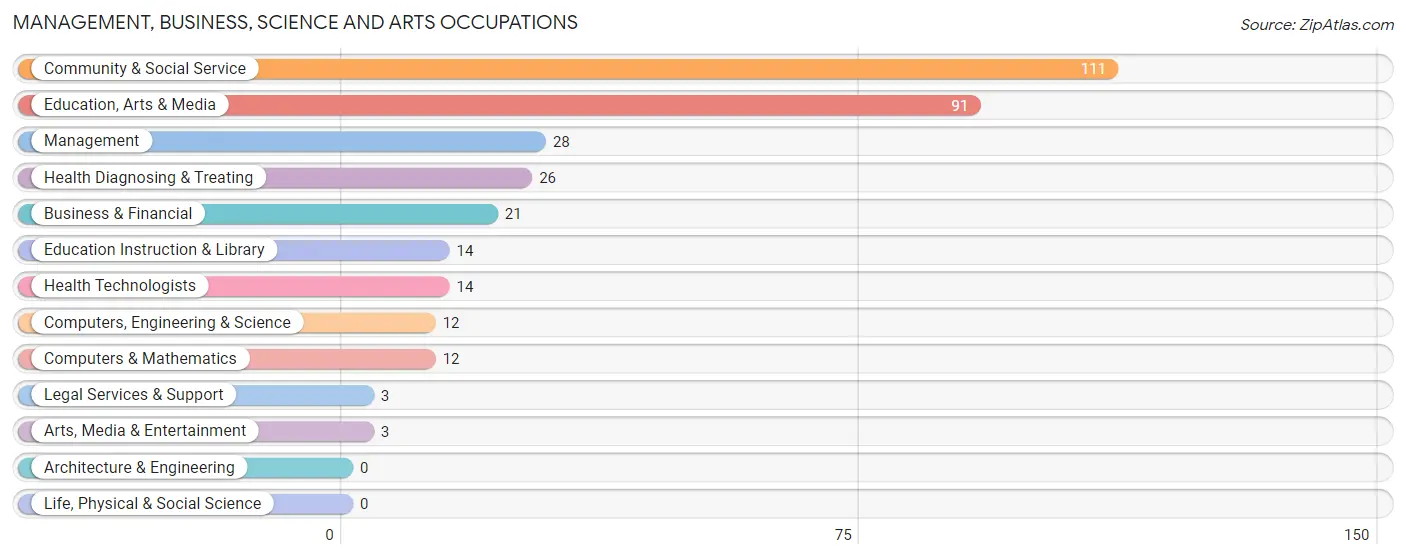
Management, Business, Science and Arts Occupations
The most common Management, Business, Science and Arts occupations in New Bloomfield are Community & Social Service (111 | 19.5%), Education, Arts & Media (91 | 16.0%), Management (28 | 4.9%), Health Diagnosing & Treating (26 | 4.6%), and Business & Financial (21 | 3.7%).
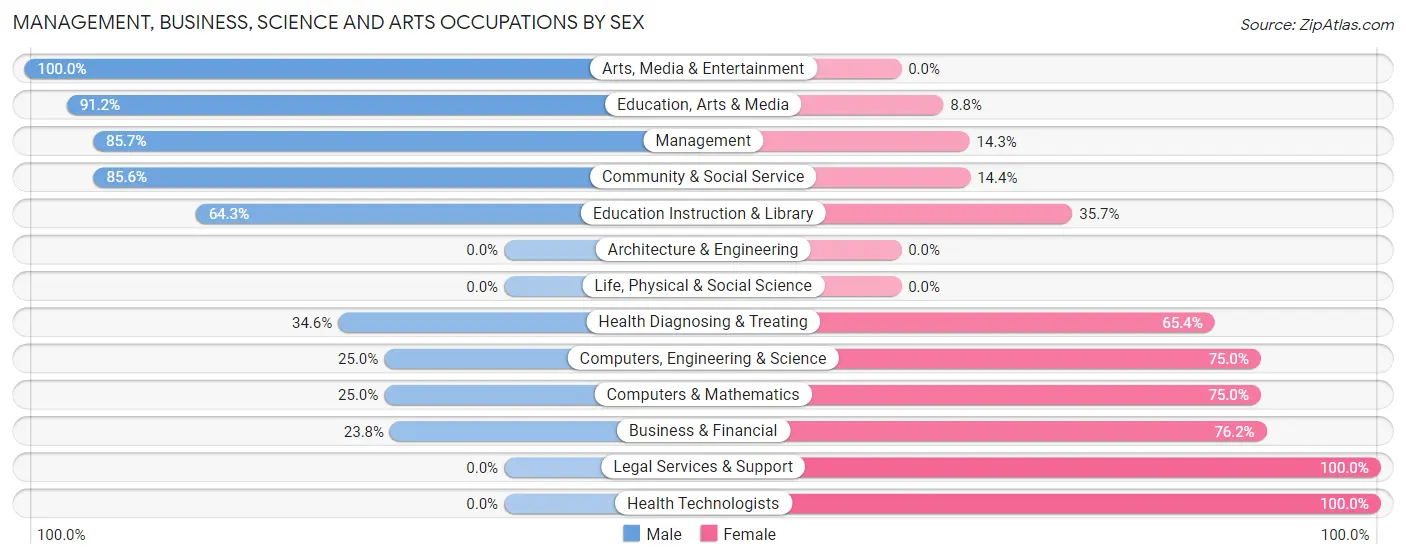
Management, Business, Science and Arts Occupations by Sex
Within the Management, Business, Science and Arts occupations in New Bloomfield, the most male-oriented occupations are Arts, Media & Entertainment (100.0%), Education, Arts & Media (91.2%), and Management (85.7%), while the most female-oriented occupations are Legal Services & Support (100.0%), Health Technologists (100.0%), and Business & Financial (76.2%).
| Occupation | Male | Female |
| Management | 24 (85.7%) | 4 (14.3%) |
| Business & Financial | 5 (23.8%) | 16 (76.2%) |
| Computers, Engineering & Science | 3 (25.0%) | 9 (75.0%) |
| Computers & Mathematics | 3 (25.0%) | 9 (75.0%) |
| Architecture & Engineering | 0 (0.0%) | 0 (0.0%) |
| Life, Physical & Social Science | 0 (0.0%) | 0 (0.0%) |
| Community & Social Service | 95 (85.6%) | 16 (14.4%) |
| Education, Arts & Media | 83 (91.2%) | 8 (8.8%) |
| Legal Services & Support | 0 (0.0%) | 3 (100.0%) |
| Education Instruction & Library | 9 (64.3%) | 5 (35.7%) |
| Arts, Media & Entertainment | 3 (100.0%) | 0 (0.0%) |
| Health Diagnosing & Treating | 9 (34.6%) | 17 (65.4%) |
| Health Technologists | 0 (0.0%) | 14 (100.0%) |
| Total (Category) | 136 (68.7%) | 62 (31.3%) |
| Total (Overall) | 400 (70.2%) | 170 (29.8%) |
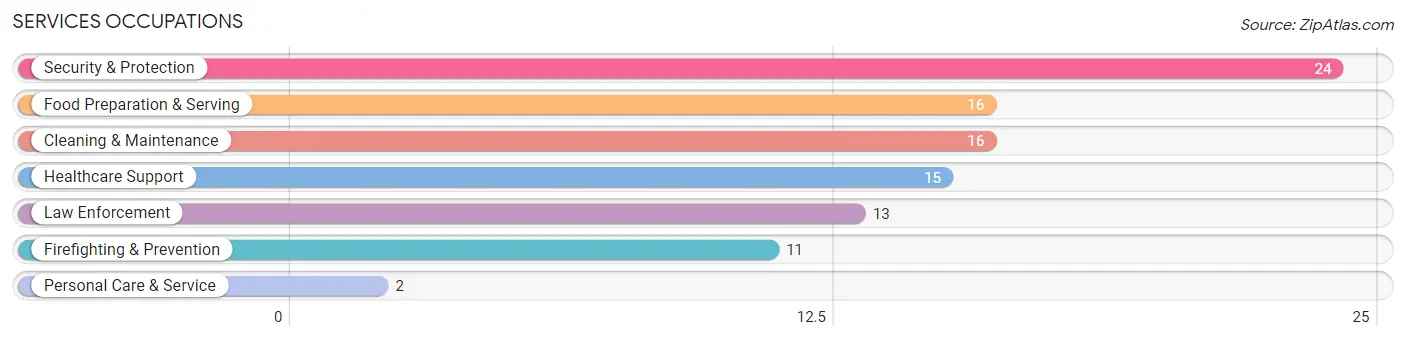
Services Occupations
The most common Services occupations in New Bloomfield are Security & Protection (24 | 4.2%), Food Preparation & Serving (16 | 2.8%), Cleaning & Maintenance (16 | 2.8%), Healthcare Support (15 | 2.6%), and Law Enforcement (13 | 2.3%).
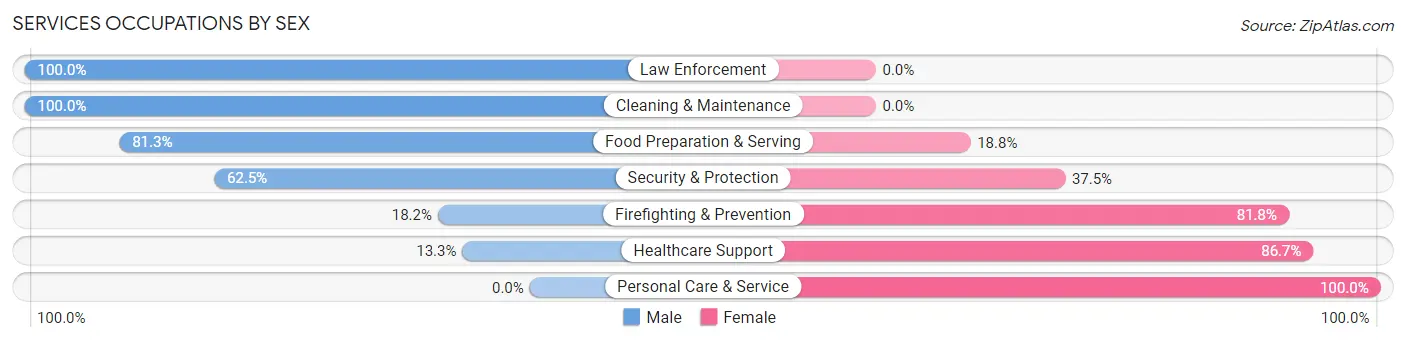
Services Occupations by Sex
Within the Services occupations in New Bloomfield, the most male-oriented occupations are Law Enforcement (100.0%), Cleaning & Maintenance (100.0%), and Food Preparation & Serving (81.2%), while the most female-oriented occupations are Personal Care & Service (100.0%), Healthcare Support (86.7%), and Firefighting & Prevention (81.8%).
| Occupation | Male | Female |
| Healthcare Support | 2 (13.3%) | 13 (86.7%) |
| Security & Protection | 15 (62.5%) | 9 (37.5%) |
| Firefighting & Prevention | 2 (18.2%) | 9 (81.8%) |
| Law Enforcement | 13 (100.0%) | 0 (0.0%) |
| Food Preparation & Serving | 13 (81.2%) | 3 (18.8%) |
| Cleaning & Maintenance | 16 (100.0%) | 0 (0.0%) |
| Personal Care & Service | 0 (0.0%) | 2 (100.0%) |
| Total (Category) | 46 (63.0%) | 27 (37.0%) |
| Total (Overall) | 400 (70.2%) | 170 (29.8%) |
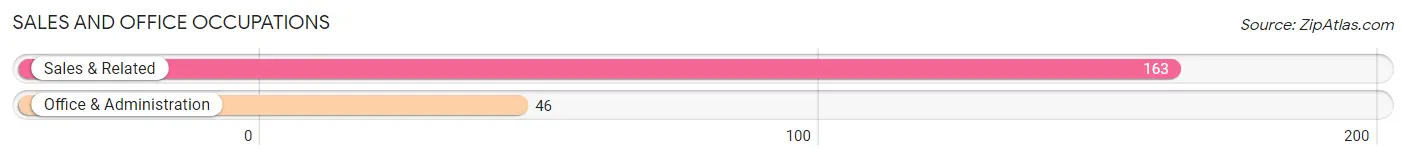
Sales and Office Occupations
The most common Sales and Office occupations in New Bloomfield are Sales & Related (163 | 28.6%), and Office & Administration (46 | 8.1%).
Sales and Office Occupations by Sex
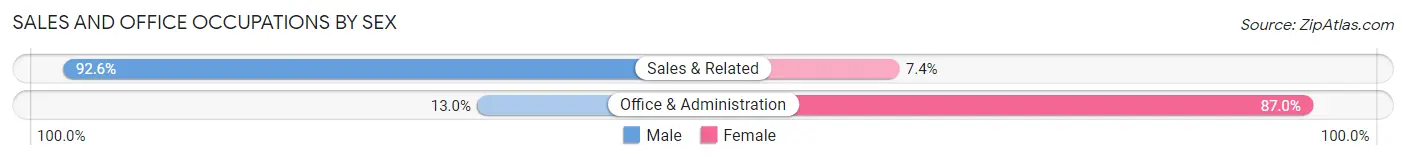
| Occupation | Male | Female |
| Sales & Related | 151 (92.6%) | 12 (7.4%) |
| Office & Administration | 6 (13.0%) | 40 (87.0%) |
| Total (Category) | 157 (75.1%) | 52 (24.9%) |
| Total (Overall) | 400 (70.2%) | 170 (29.8%) |
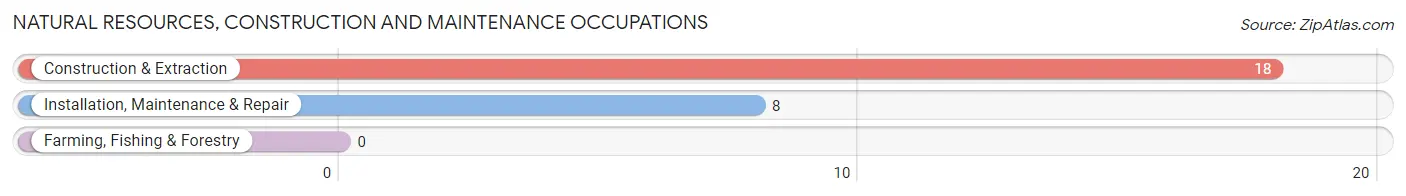
Natural Resources, Construction and Maintenance Occupations
The most common Natural Resources, Construction and Maintenance occupations in New Bloomfield are Construction & Extraction (18 | 3.2%), and Installation, Maintenance & Repair (8 | 1.4%).
Natural Resources, Construction and Maintenance Occupations by Sex
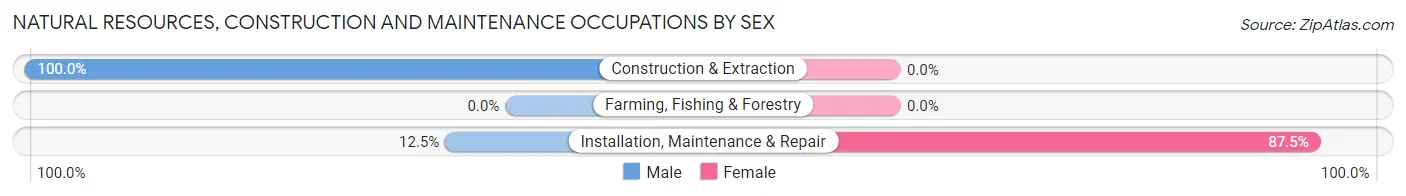
| Occupation | Male | Female |
| Farming, Fishing & Forestry | 0 (0.0%) | 0 (0.0%) |
| Construction & Extraction | 18 (100.0%) | 0 (0.0%) |
| Installation, Maintenance & Repair | 1 (12.5%) | 7 (87.5%) |
| Total (Category) | 19 (73.1%) | 7 (26.9%) |
| Total (Overall) | 400 (70.2%) | 170 (29.8%) |
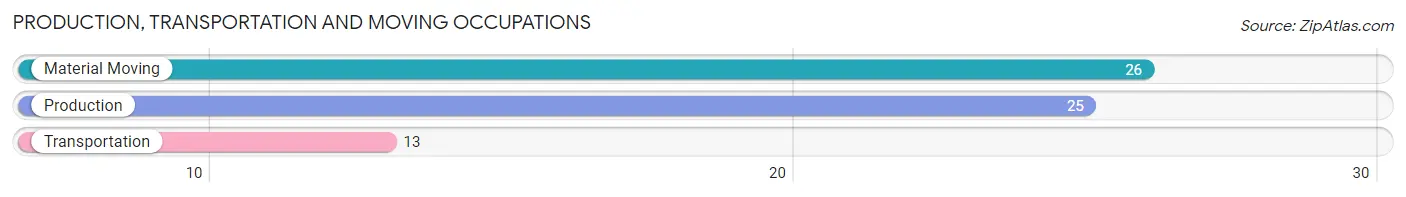
Production, Transportation and Moving Occupations
The most common Production, Transportation and Moving occupations in New Bloomfield are Material Moving (26 | 4.6%), Production (25 | 4.4%), and Transportation (13 | 2.3%).
Production, Transportation and Moving Occupations by Sex
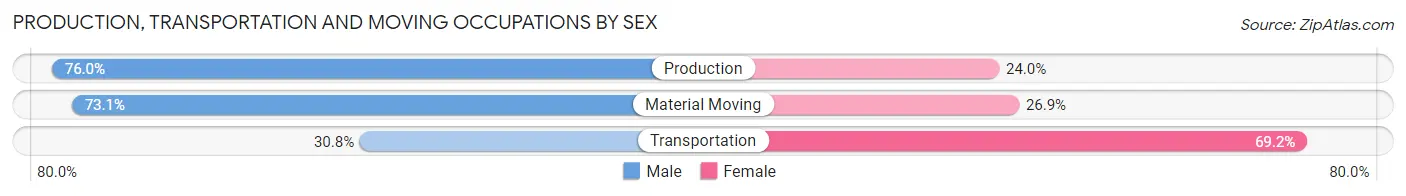
| Occupation | Male | Female |
| Production | 19 (76.0%) | 6 (24.0%) |
| Transportation | 4 (30.8%) | 9 (69.2%) |
| Material Moving | 19 (73.1%) | 7 (26.9%) |
| Total (Category) | 42 (65.6%) | 22 (34.4%) |
| Total (Overall) | 400 (70.2%) | 170 (29.8%) |
Employment Industries by Sex in New Bloomfield
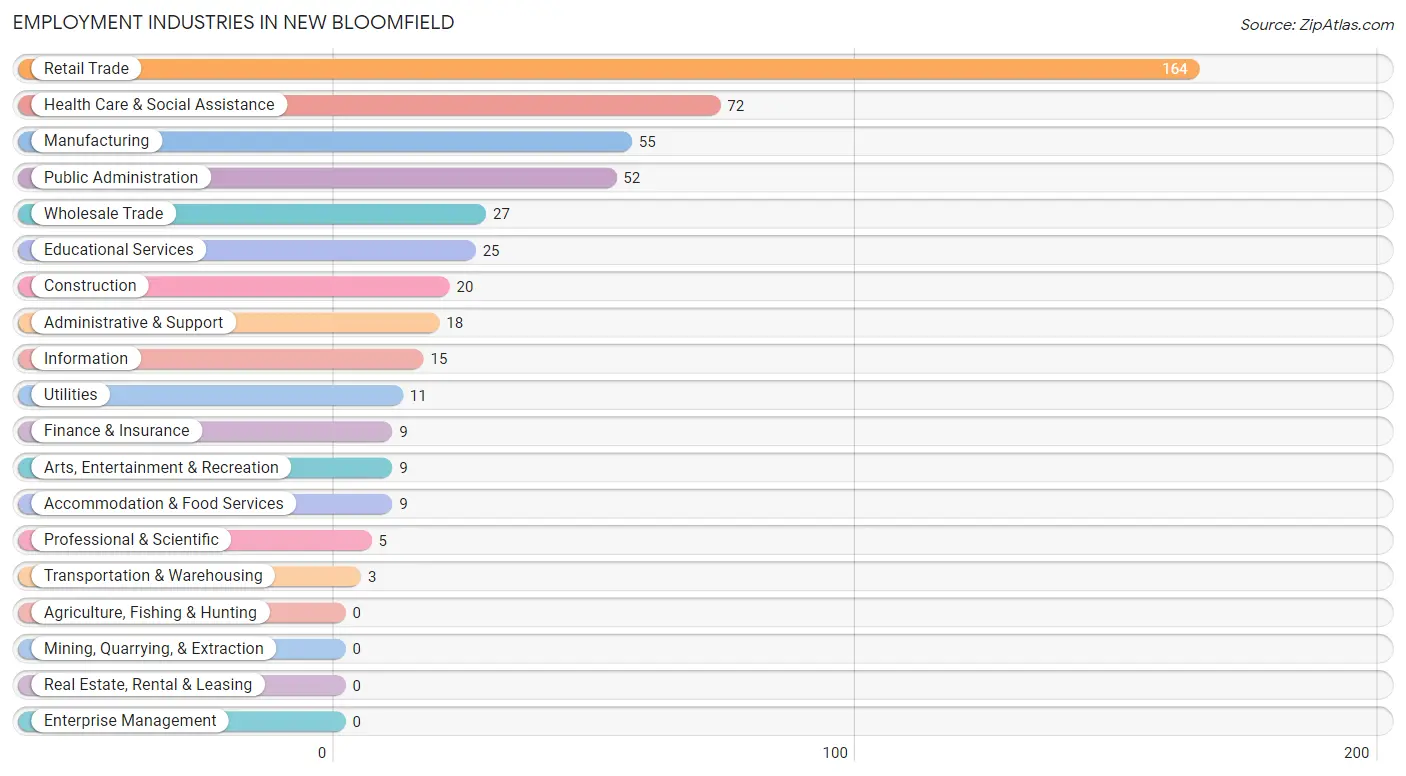
Employment Industries in New Bloomfield
The major employment industries in New Bloomfield include Retail Trade (164 | 28.8%), Health Care & Social Assistance (72 | 12.6%), Manufacturing (55 | 9.7%), Public Administration (52 | 9.1%), and Wholesale Trade (27 | 4.7%).
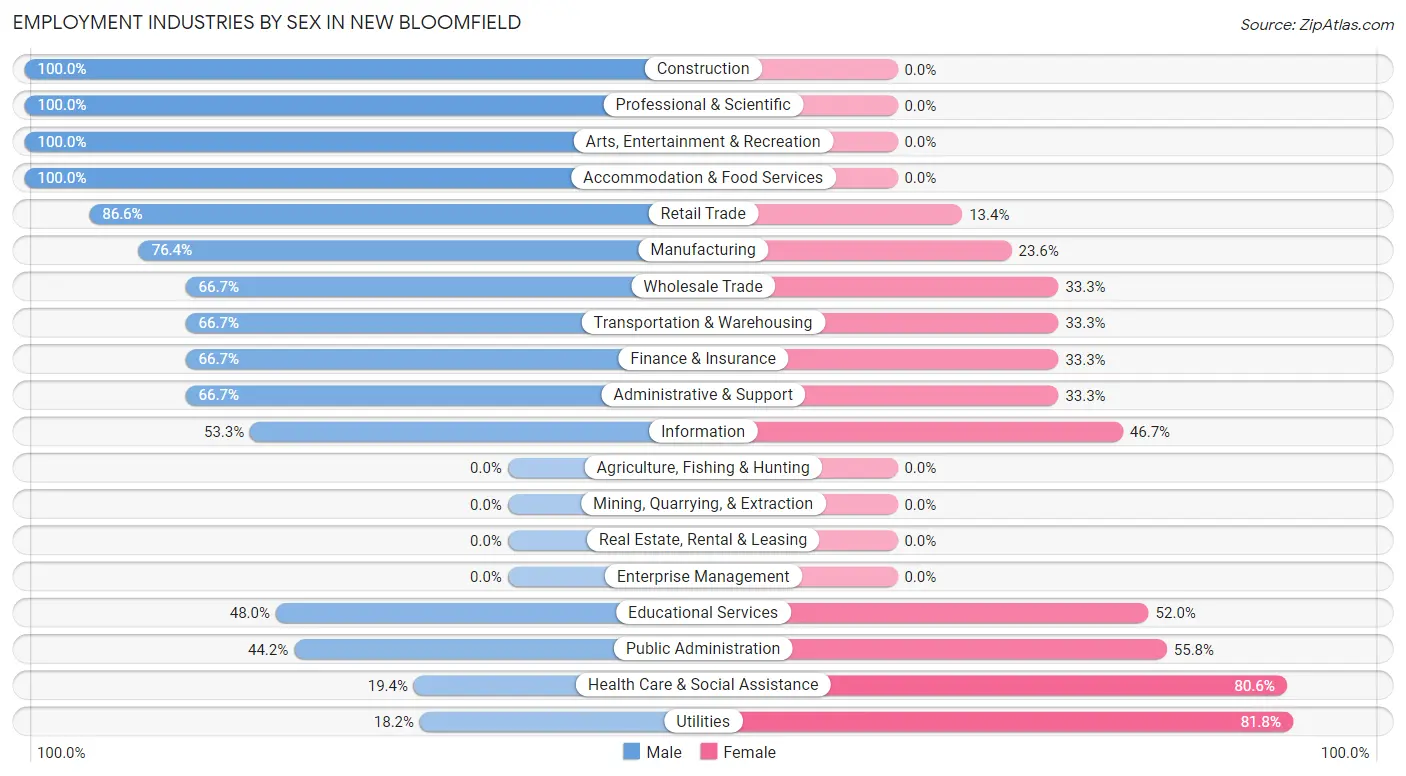
Employment Industries by Sex in New Bloomfield
The New Bloomfield industries that see more men than women are Construction (100.0%), Professional & Scientific (100.0%), and Arts, Entertainment & Recreation (100.0%), whereas the industries that tend to have a higher number of women are Utilities (81.8%), Health Care & Social Assistance (80.6%), and Public Administration (55.8%).
| Industry | Male | Female |
| Agriculture, Fishing & Hunting | 0 (0.0%) | 0 (0.0%) |
| Mining, Quarrying, & Extraction | 0 (0.0%) | 0 (0.0%) |
| Construction | 20 (100.0%) | 0 (0.0%) |
| Manufacturing | 42 (76.4%) | 13 (23.6%) |
| Wholesale Trade | 18 (66.7%) | 9 (33.3%) |
| Retail Trade | 142 (86.6%) | 22 (13.4%) |
| Transportation & Warehousing | 2 (66.7%) | 1 (33.3%) |
| Utilities | 2 (18.2%) | 9 (81.8%) |
| Information | 8 (53.3%) | 7 (46.7%) |
| Finance & Insurance | 6 (66.7%) | 3 (33.3%) |
| Real Estate, Rental & Leasing | 0 (0.0%) | 0 (0.0%) |
| Professional & Scientific | 5 (100.0%) | 0 (0.0%) |
| Enterprise Management | 0 (0.0%) | 0 (0.0%) |
| Administrative & Support | 12 (66.7%) | 6 (33.3%) |
| Educational Services | 12 (48.0%) | 13 (52.0%) |
| Health Care & Social Assistance | 14 (19.4%) | 58 (80.6%) |
| Arts, Entertainment & Recreation | 9 (100.0%) | 0 (0.0%) |
| Accommodation & Food Services | 9 (100.0%) | 0 (0.0%) |
| Public Administration | 23 (44.2%) | 29 (55.8%) |
| Total | 400 (70.2%) | 170 (29.8%) |
Education in New Bloomfield
School Enrollment in New Bloomfield
The most common levels of schooling among the 151 students in New Bloomfield are middle school (49 | 32.5%), high school (42 | 27.8%), and college / undergraduate (21 | 13.9%).
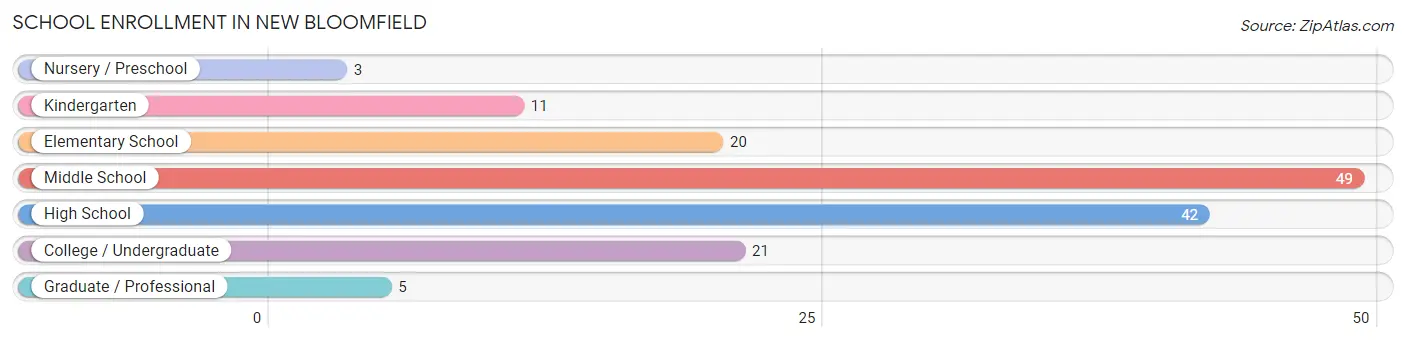
| School Level | # Students | % Students |
| Nursery / Preschool | 3 | 2.0% |
| Kindergarten | 11 | 7.3% |
| Elementary School | 20 | 13.3% |
| Middle School | 49 | 32.5% |
| High School | 42 | 27.8% |
| College / Undergraduate | 21 | 13.9% |
| Graduate / Professional | 5 | 3.3% |
| Total | 151 | 100.0% |
School Enrollment by Age by Funding Source in New Bloomfield
Out of a total of 151 students who are enrolled in schools in New Bloomfield, 13 (8.6%) attend a private institution, while the remaining 138 (91.4%) are enrolled in public schools. The age group of 20 to 24 year olds has the highest likelihood of being enrolled in private schools, with 3 (60.0% in the age bracket) enrolled. Conversely, the age group of 3 to 4 year olds has the lowest likelihood of being enrolled in a private school, with 3 (100.0% in the age bracket) attending a public institution.
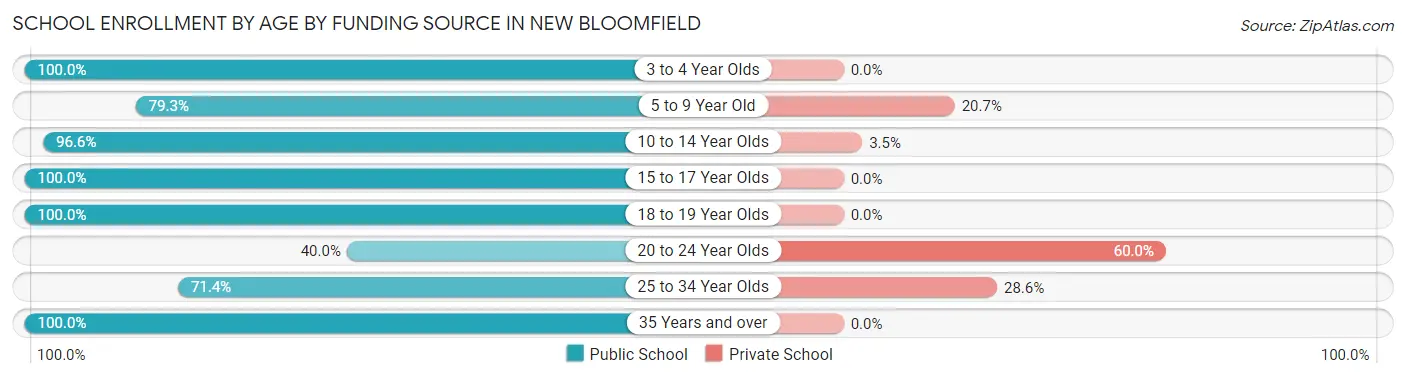
| Age Bracket | Public School | Private School |
| 3 to 4 Year Olds | 3 (100.0%) | 0 (0.0%) |
| 5 to 9 Year Old | 23 (79.3%) | 6 (20.7%) |
| 10 to 14 Year Olds | 56 (96.6%) | 2 (3.5%) |
| 15 to 17 Year Olds | 29 (100.0%) | 0 (0.0%) |
| 18 to 19 Year Olds | 8 (100.0%) | 0 (0.0%) |
| 20 to 24 Year Olds | 2 (40.0%) | 3 (60.0%) |
| 25 to 34 Year Olds | 5 (71.4%) | 2 (28.6%) |
| 35 Years and over | 12 (100.0%) | 0 (0.0%) |
| Total | 138 (91.4%) | 13 (8.6%) |
Educational Attainment by Field of Study in New Bloomfield
Business (89 | 38.7%), liberal arts & history (42 | 18.3%), education (21 | 9.1%), computers & mathematics (18 | 7.8%), and arts & humanities (13 | 5.7%) are the most common fields of study among 230 individuals in New Bloomfield who have obtained a bachelor's degree or higher.
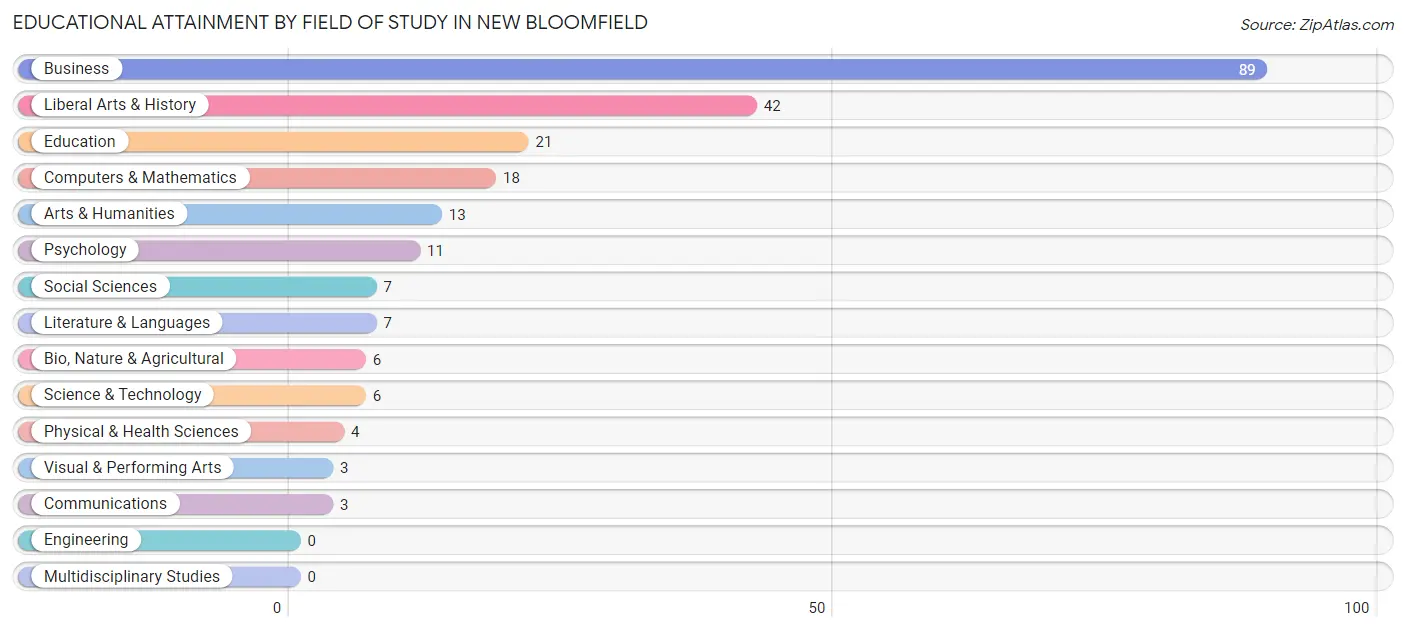
| Field of Study | # Graduates | % Graduates |
| Computers & Mathematics | 18 | 7.8% |
| Bio, Nature & Agricultural | 6 | 2.6% |
| Physical & Health Sciences | 4 | 1.7% |
| Psychology | 11 | 4.8% |
| Social Sciences | 7 | 3.0% |
| Engineering | 0 | 0.0% |
| Multidisciplinary Studies | 0 | 0.0% |
| Science & Technology | 6 | 2.6% |
| Business | 89 | 38.7% |
| Education | 21 | 9.1% |
| Literature & Languages | 7 | 3.0% |
| Liberal Arts & History | 42 | 18.3% |
| Visual & Performing Arts | 3 | 1.3% |
| Communications | 3 | 1.3% |
| Arts & Humanities | 13 | 5.7% |
| Total | 230 | 100.0% |
Transportation & Commute in New Bloomfield
Vehicle Availability by Sex in New Bloomfield
The most prevalent vehicle ownership categories in New Bloomfield are males with 3 vehicles (239, accounting for 59.8%) and females with 3 vehicles (28, making up 140.6%).
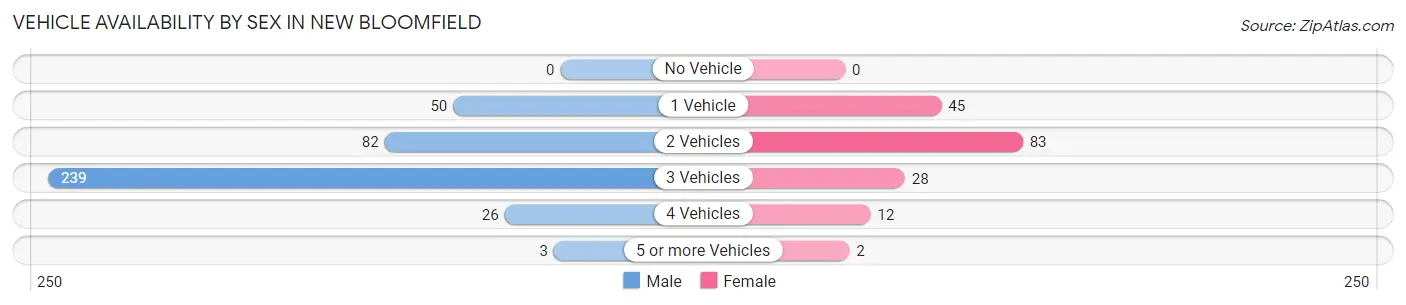
| Vehicles Available | Male | Female |
| No Vehicle | 0 (0.0%) | 0 (0.0%) |
| 1 Vehicle | 50 (12.5%) | 45 (26.5%) |
| 2 Vehicles | 82 (20.5%) | 83 (48.8%) |
| 3 Vehicles | 239 (59.8%) | 28 (16.5%) |
| 4 Vehicles | 26 (6.5%) | 12 (7.1%) |
| 5 or more Vehicles | 3 (0.7%) | 2 (1.2%) |
| Total | 400 (100.0%) | 170 (100.0%) |
Commute Time in New Bloomfield
The most frequently occuring commute durations in New Bloomfield are 45 to 59 minutes (157 commuters, 30.3%), 20 to 24 minutes (104 commuters, 20.1%), and less than 5 minutes (92 commuters, 17.8%).
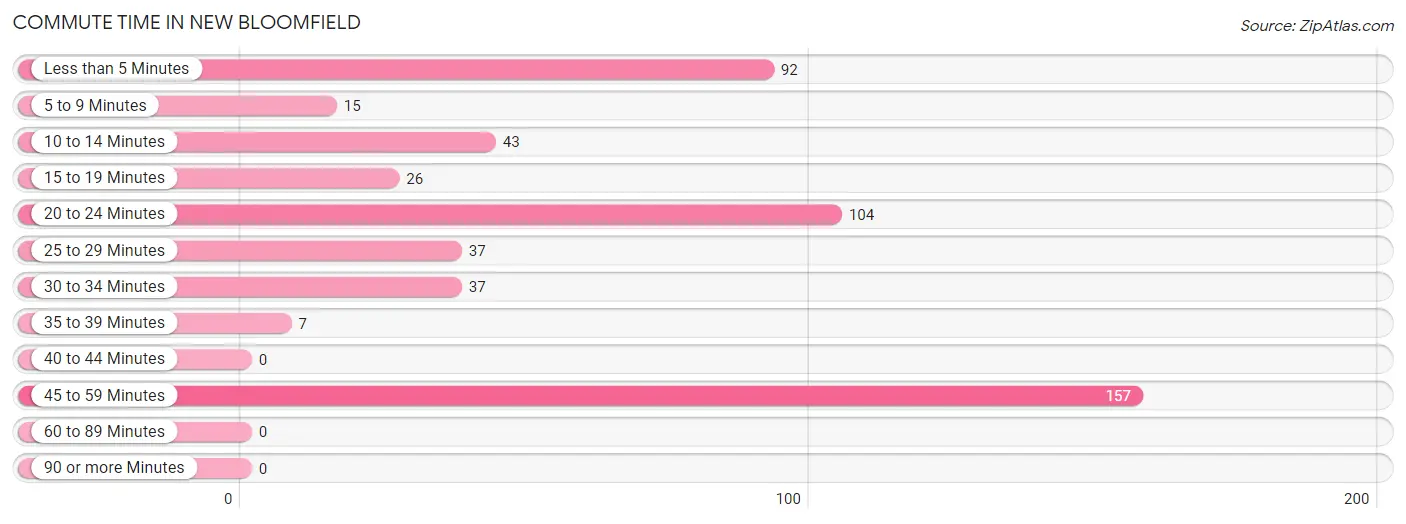
| Commute Time | # Commuters | % Commuters |
| Less than 5 Minutes | 92 | 17.8% |
| 5 to 9 Minutes | 15 | 2.9% |
| 10 to 14 Minutes | 43 | 8.3% |
| 15 to 19 Minutes | 26 | 5.0% |
| 20 to 24 Minutes | 104 | 20.1% |
| 25 to 29 Minutes | 37 | 7.1% |
| 30 to 34 Minutes | 37 | 7.1% |
| 35 to 39 Minutes | 7 | 1.3% |
| 40 to 44 Minutes | 0 | 0.0% |
| 45 to 59 Minutes | 157 | 30.3% |
| 60 to 89 Minutes | 0 | 0.0% |
| 90 or more Minutes | 0 | 0.0% |
Commute Time by Sex in New Bloomfield
The most common commute times in New Bloomfield are 45 to 59 minutes (148 commuters, 40.2%) for males and 20 to 24 minutes (55 commuters, 36.7%) for females.
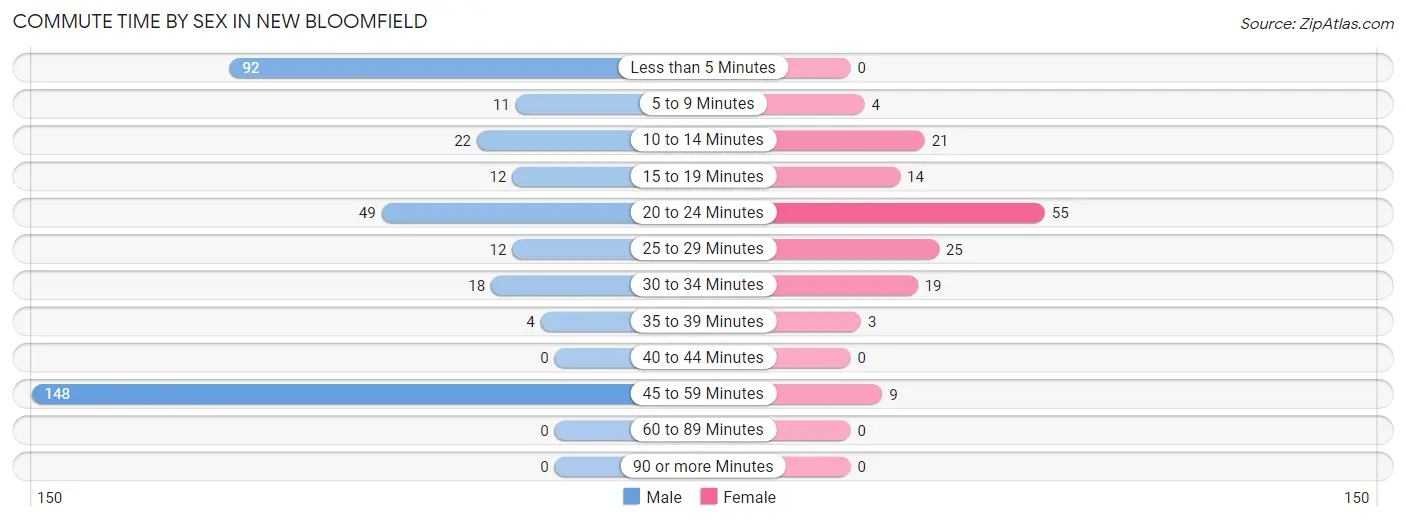
| Commute Time | Male | Female |
| Less than 5 Minutes | 92 (25.0%) | 0 (0.0%) |
| 5 to 9 Minutes | 11 (3.0%) | 4 (2.7%) |
| 10 to 14 Minutes | 22 (6.0%) | 21 (14.0%) |
| 15 to 19 Minutes | 12 (3.3%) | 14 (9.3%) |
| 20 to 24 Minutes | 49 (13.3%) | 55 (36.7%) |
| 25 to 29 Minutes | 12 (3.3%) | 25 (16.7%) |
| 30 to 34 Minutes | 18 (4.9%) | 19 (12.7%) |
| 35 to 39 Minutes | 4 (1.1%) | 3 (2.0%) |
| 40 to 44 Minutes | 0 (0.0%) | 0 (0.0%) |
| 45 to 59 Minutes | 148 (40.2%) | 9 (6.0%) |
| 60 to 89 Minutes | 0 (0.0%) | 0 (0.0%) |
| 90 or more Minutes | 0 (0.0%) | 0 (0.0%) |
Time of Departure to Work by Sex in New Bloomfield
The most frequent times of departure to work in New Bloomfield are 9:00 AM to 9:59 AM (216, 58.7%) for males and 6:00 AM to 6:29 AM (30, 20.0%) for females.
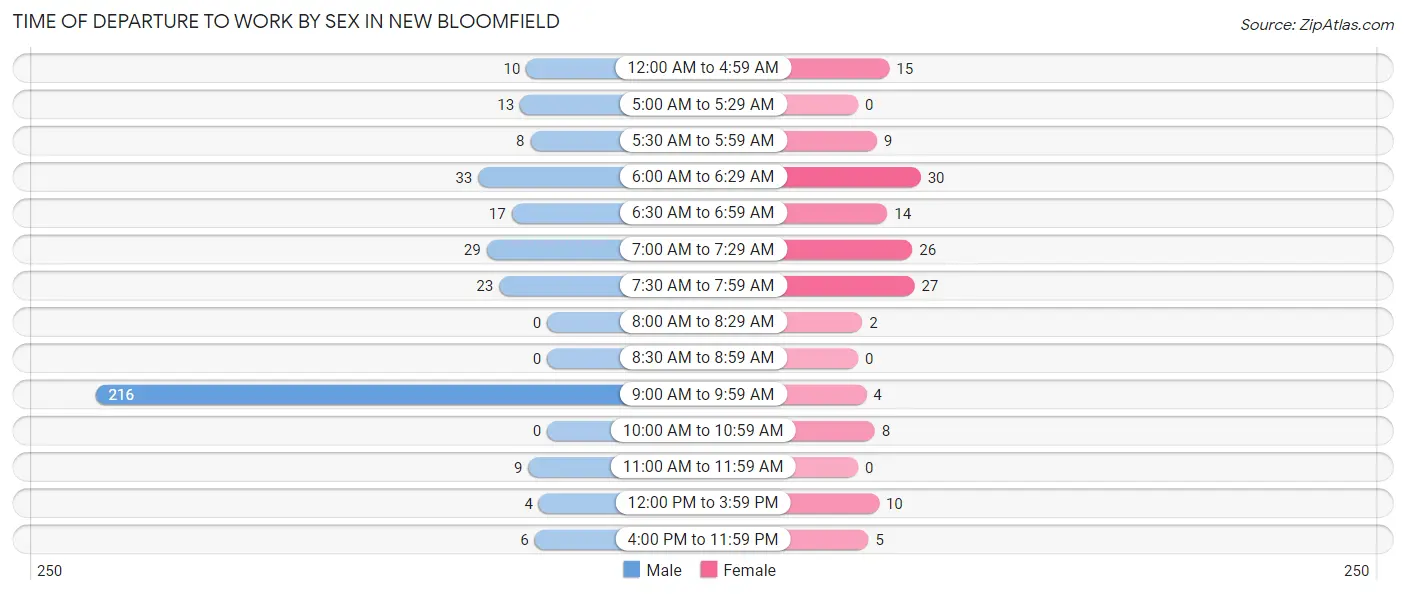
| Time of Departure | Male | Female |
| 12:00 AM to 4:59 AM | 10 (2.7%) | 15 (10.0%) |
| 5:00 AM to 5:29 AM | 13 (3.5%) | 0 (0.0%) |
| 5:30 AM to 5:59 AM | 8 (2.2%) | 9 (6.0%) |
| 6:00 AM to 6:29 AM | 33 (9.0%) | 30 (20.0%) |
| 6:30 AM to 6:59 AM | 17 (4.6%) | 14 (9.3%) |
| 7:00 AM to 7:29 AM | 29 (7.9%) | 26 (17.3%) |
| 7:30 AM to 7:59 AM | 23 (6.2%) | 27 (18.0%) |
| 8:00 AM to 8:29 AM | 0 (0.0%) | 2 (1.3%) |
| 8:30 AM to 8:59 AM | 0 (0.0%) | 0 (0.0%) |
| 9:00 AM to 9:59 AM | 216 (58.7%) | 4 (2.7%) |
| 10:00 AM to 10:59 AM | 0 (0.0%) | 8 (5.3%) |
| 11:00 AM to 11:59 AM | 9 (2.5%) | 0 (0.0%) |
| 12:00 PM to 3:59 PM | 4 (1.1%) | 10 (6.7%) |
| 4:00 PM to 11:59 PM | 6 (1.6%) | 5 (3.3%) |
| Total | 368 (100.0%) | 150 (100.0%) |
Housing Occupancy in New Bloomfield
Occupancy by Ownership in New Bloomfield
Of the total 360 dwellings in New Bloomfield, owner-occupied units account for 176 (48.9%), while renter-occupied units make up 184 (51.1%).
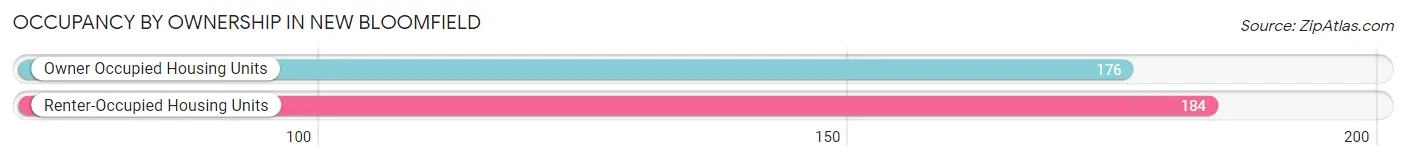
| Occupancy | # Housing Units | % Housing Units |
| Owner Occupied Housing Units | 176 | 48.9% |
| Renter-Occupied Housing Units | 184 | 51.1% |
| Total Occupied Housing Units | 360 | 100.0% |
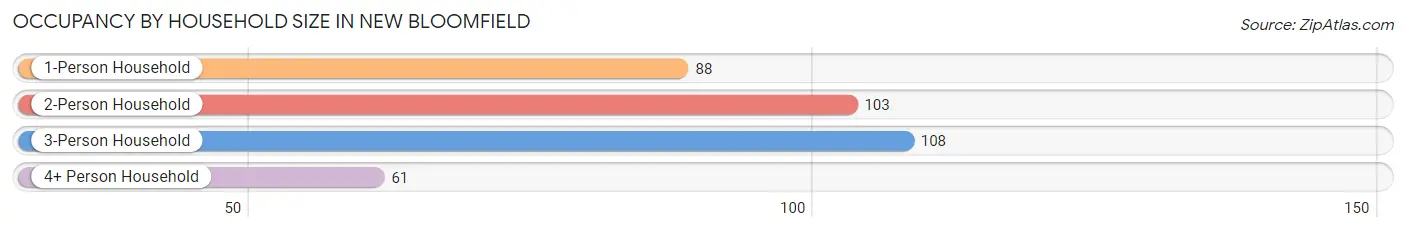
Occupancy by Household Size in New Bloomfield
| Household Size | # Housing Units | % Housing Units |
| 1-Person Household | 88 | 24.4% |
| 2-Person Household | 103 | 28.6% |
| 3-Person Household | 108 | 30.0% |
| 4+ Person Household | 61 | 16.9% |
| Total Housing Units | 360 | 100.0% |
Occupancy by Ownership by Household Size in New Bloomfield
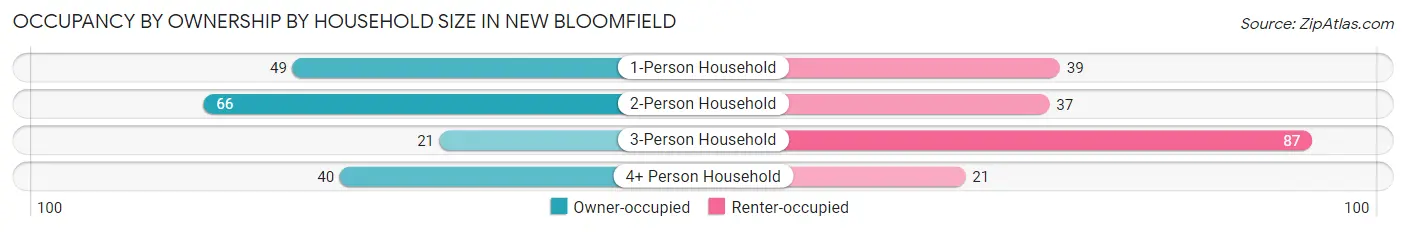
| Household Size | Owner-occupied | Renter-occupied |
| 1-Person Household | 49 (55.7%) | 39 (44.3%) |
| 2-Person Household | 66 (64.1%) | 37 (35.9%) |
| 3-Person Household | 21 (19.4%) | 87 (80.6%) |
| 4+ Person Household | 40 (65.6%) | 21 (34.4%) |
| Total Housing Units | 176 (48.9%) | 184 (51.1%) |
Occupancy by Educational Attainment in New Bloomfield
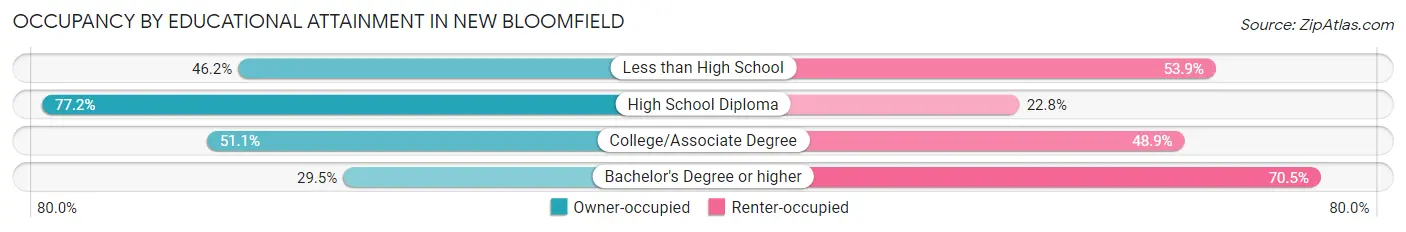
| Household Size | Owner-occupied | Renter-occupied |
| Less than High School | 6 (46.2%) | 7 (53.8%) |
| High School Diploma | 78 (77.2%) | 23 (22.8%) |
| College/Associate Degree | 46 (51.1%) | 44 (48.9%) |
| Bachelor's Degree or higher | 46 (29.5%) | 110 (70.5%) |
Occupancy by Age of Householder in New Bloomfield
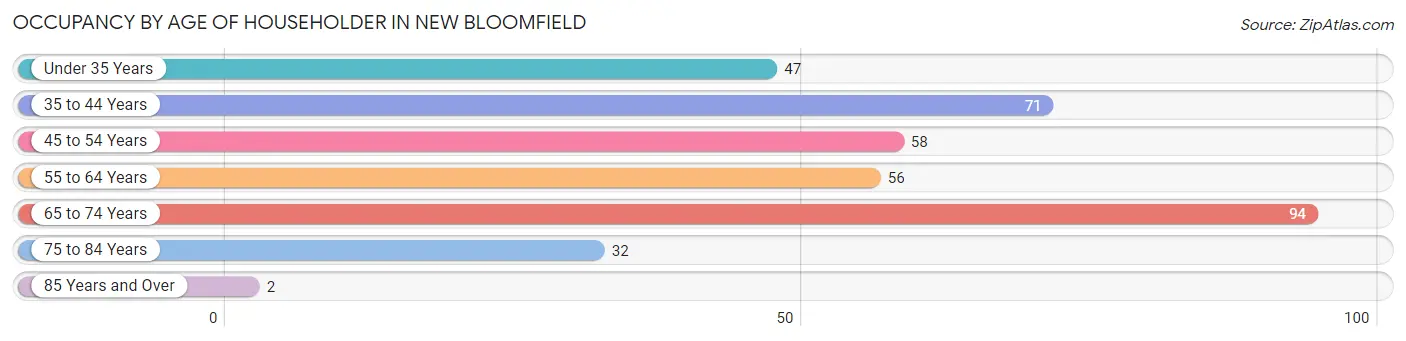
| Age Bracket | # Households | % Households |
| Under 35 Years | 47 | 13.1% |
| 35 to 44 Years | 71 | 19.7% |
| 45 to 54 Years | 58 | 16.1% |
| 55 to 64 Years | 56 | 15.6% |
| 65 to 74 Years | 94 | 26.1% |
| 75 to 84 Years | 32 | 8.9% |
| 85 Years and Over | 2 | 0.6% |
| Total | 360 | 100.0% |
Housing Finances in New Bloomfield
Median Income by Occupancy in New Bloomfield
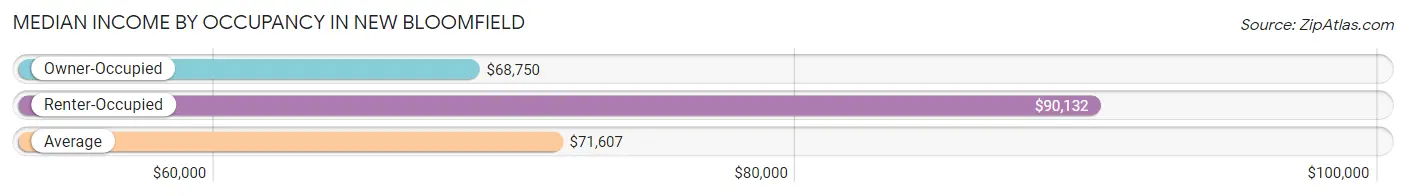
| Occupancy Type | # Households | Median Income |
| Owner-Occupied | 176 (48.9%) | $68,750 |
| Renter-Occupied | 184 (51.1%) | $90,132 |
| Average | 360 (100.0%) | $71,607 |
Occupancy by Householder Income Bracket in New Bloomfield
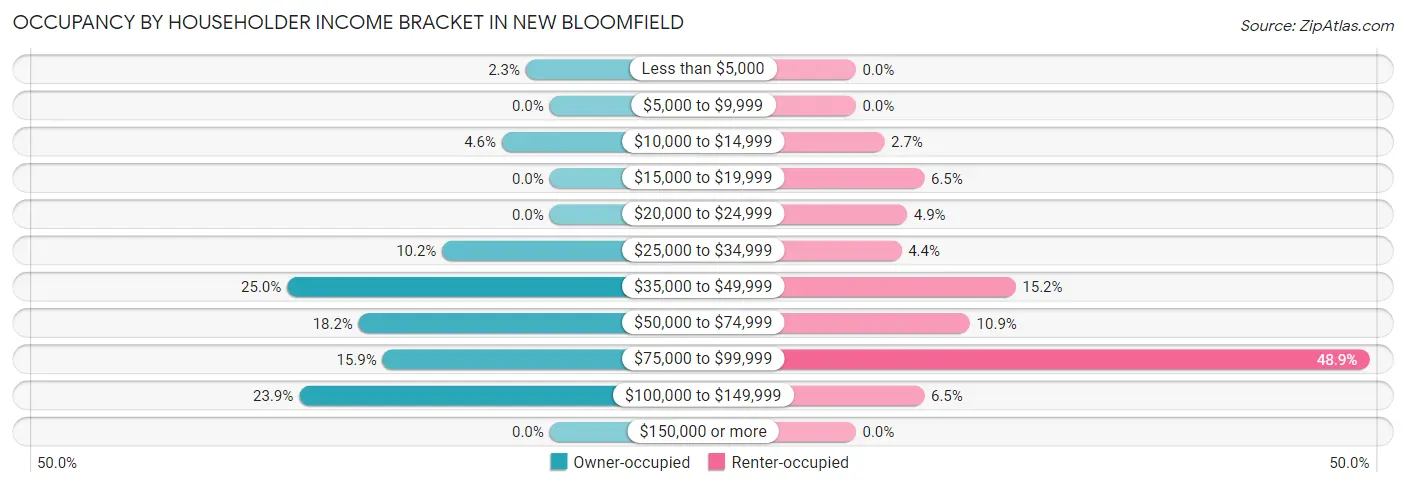
| Income Bracket | Owner-occupied | Renter-occupied |
| Less than $5,000 | 4 (2.3%) | 0 (0.0%) |
| $5,000 to $9,999 | 0 (0.0%) | 0 (0.0%) |
| $10,000 to $14,999 | 8 (4.5%) | 5 (2.7%) |
| $15,000 to $19,999 | 0 (0.0%) | 12 (6.5%) |
| $20,000 to $24,999 | 0 (0.0%) | 9 (4.9%) |
| $25,000 to $34,999 | 18 (10.2%) | 8 (4.3%) |
| $35,000 to $49,999 | 44 (25.0%) | 28 (15.2%) |
| $50,000 to $74,999 | 32 (18.2%) | 20 (10.9%) |
| $75,000 to $99,999 | 28 (15.9%) | 90 (48.9%) |
| $100,000 to $149,999 | 42 (23.9%) | 12 (6.5%) |
| $150,000 or more | 0 (0.0%) | 0 (0.0%) |
| Total | 176 (100.0%) | 184 (100.0%) |
Monthly Housing Cost Tiers in New Bloomfield
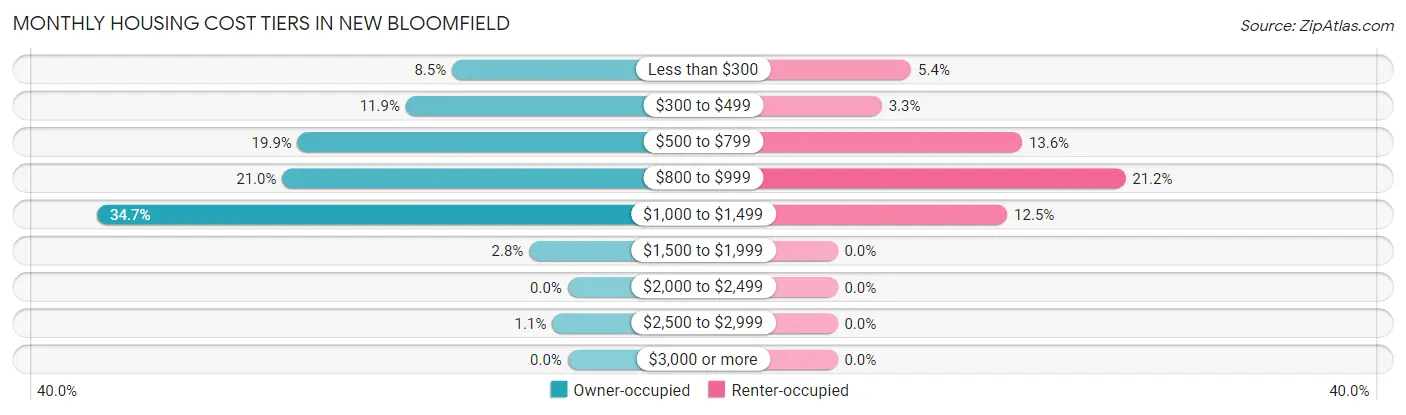
| Monthly Cost | Owner-occupied | Renter-occupied |
| Less than $300 | 15 (8.5%) | 10 (5.4%) |
| $300 to $499 | 21 (11.9%) | 6 (3.3%) |
| $500 to $799 | 35 (19.9%) | 25 (13.6%) |
| $800 to $999 | 37 (21.0%) | 39 (21.2%) |
| $1,000 to $1,499 | 61 (34.7%) | 23 (12.5%) |
| $1,500 to $1,999 | 5 (2.8%) | 0 (0.0%) |
| $2,000 to $2,499 | 0 (0.0%) | 0 (0.0%) |
| $2,500 to $2,999 | 2 (1.1%) | 0 (0.0%) |
| $3,000 or more | 0 (0.0%) | 0 (0.0%) |
| Total | 176 (100.0%) | 184 (100.0%) |
Physical Housing Characteristics in New Bloomfield
Housing Structures in New Bloomfield
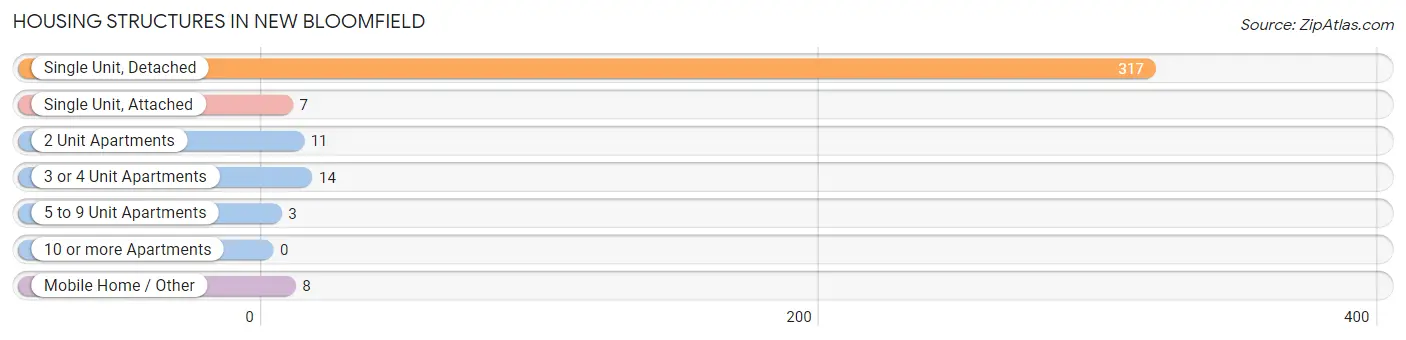
| Structure Type | # Housing Units | % Housing Units |
| Single Unit, Detached | 317 | 88.1% |
| Single Unit, Attached | 7 | 1.9% |
| 2 Unit Apartments | 11 | 3.1% |
| 3 or 4 Unit Apartments | 14 | 3.9% |
| 5 to 9 Unit Apartments | 3 | 0.8% |
| 10 or more Apartments | 0 | 0.0% |
| Mobile Home / Other | 8 | 2.2% |
| Total | 360 | 100.0% |
Housing Structures by Occupancy in New Bloomfield
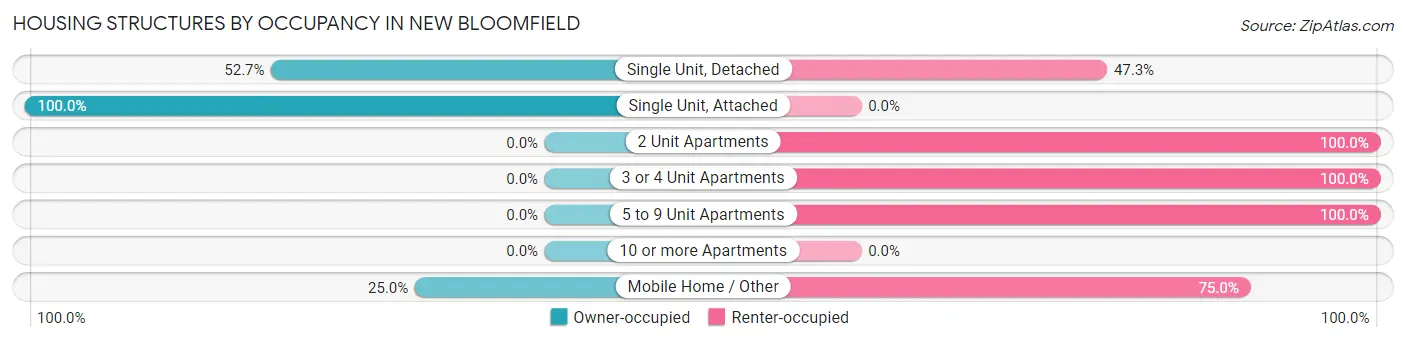
| Structure Type | Owner-occupied | Renter-occupied |
| Single Unit, Detached | 167 (52.7%) | 150 (47.3%) |
| Single Unit, Attached | 7 (100.0%) | 0 (0.0%) |
| 2 Unit Apartments | 0 (0.0%) | 11 (100.0%) |
| 3 or 4 Unit Apartments | 0 (0.0%) | 14 (100.0%) |
| 5 to 9 Unit Apartments | 0 (0.0%) | 3 (100.0%) |
| 10 or more Apartments | 0 (0.0%) | 0 (0.0%) |
| Mobile Home / Other | 2 (25.0%) | 6 (75.0%) |
| Total | 176 (48.9%) | 184 (51.1%) |
Housing Structures by Number of Rooms in New Bloomfield
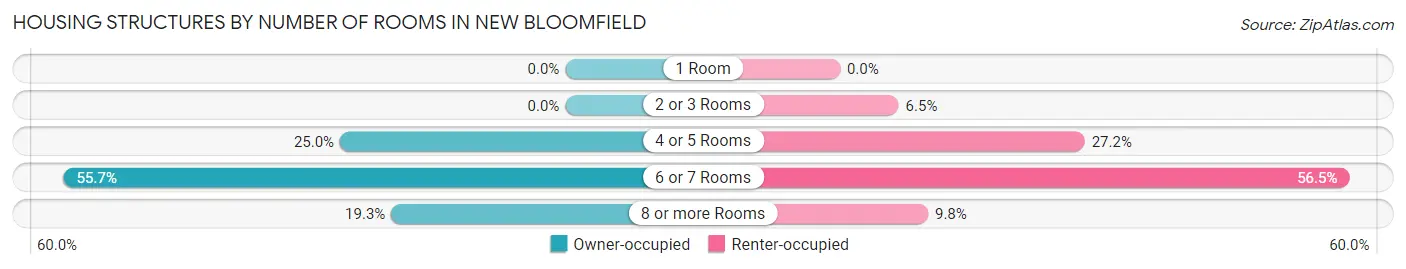
| Number of Rooms | Owner-occupied | Renter-occupied |
| 1 Room | 0 (0.0%) | 0 (0.0%) |
| 2 or 3 Rooms | 0 (0.0%) | 12 (6.5%) |
| 4 or 5 Rooms | 44 (25.0%) | 50 (27.2%) |
| 6 or 7 Rooms | 98 (55.7%) | 104 (56.5%) |
| 8 or more Rooms | 34 (19.3%) | 18 (9.8%) |
| Total | 176 (100.0%) | 184 (100.0%) |
Housing Structure by Heating Type in New Bloomfield
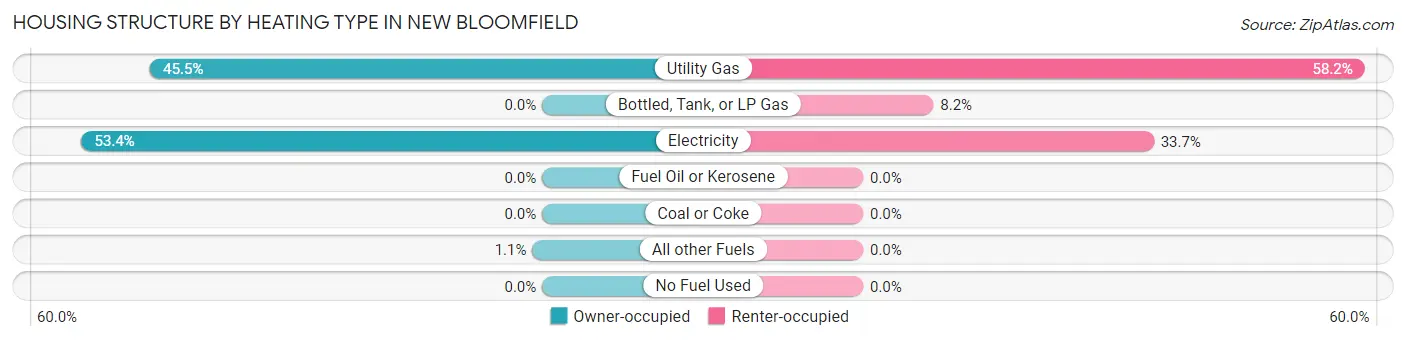
| Heating Type | Owner-occupied | Renter-occupied |
| Utility Gas | 80 (45.5%) | 107 (58.2%) |
| Bottled, Tank, or LP Gas | 0 (0.0%) | 15 (8.2%) |
| Electricity | 94 (53.4%) | 62 (33.7%) |
| Fuel Oil or Kerosene | 0 (0.0%) | 0 (0.0%) |
| Coal or Coke | 0 (0.0%) | 0 (0.0%) |
| All other Fuels | 2 (1.1%) | 0 (0.0%) |
| No Fuel Used | 0 (0.0%) | 0 (0.0%) |
| Total | 176 (100.0%) | 184 (100.0%) |
Household Vehicle Usage in New Bloomfield
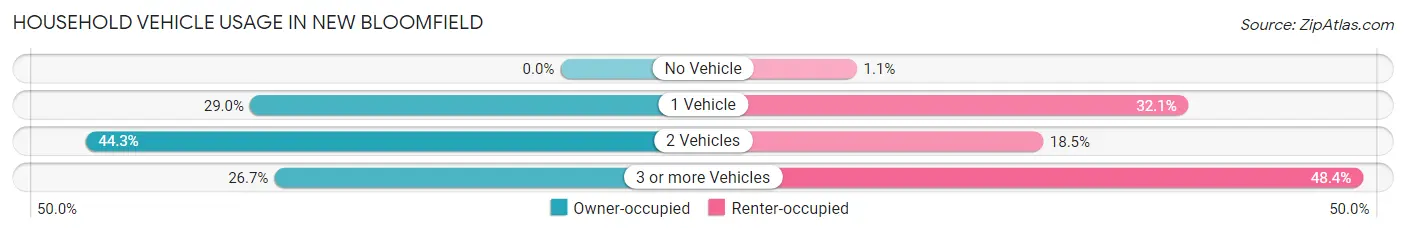
| Vehicles per Household | Owner-occupied | Renter-occupied |
| No Vehicle | 0 (0.0%) | 2 (1.1%) |
| 1 Vehicle | 51 (29.0%) | 59 (32.1%) |
| 2 Vehicles | 78 (44.3%) | 34 (18.5%) |
| 3 or more Vehicles | 47 (26.7%) | 89 (48.4%) |
| Total | 176 (100.0%) | 184 (100.0%) |
Real Estate & Mortgages in New Bloomfield
Real Estate and Mortgage Overview in New Bloomfield
| Characteristic | Without Mortgage | With Mortgage |
| Housing Units | 51 | 125 |
| Median Property Value | $126,100 | $136,000 |
| Median Household Income | $45,250 | $0 |
| Monthly Housing Costs | $430 | $0 |
| Real Estate Taxes | $1,404 | $0 |
Property Value by Mortgage Status in New Bloomfield
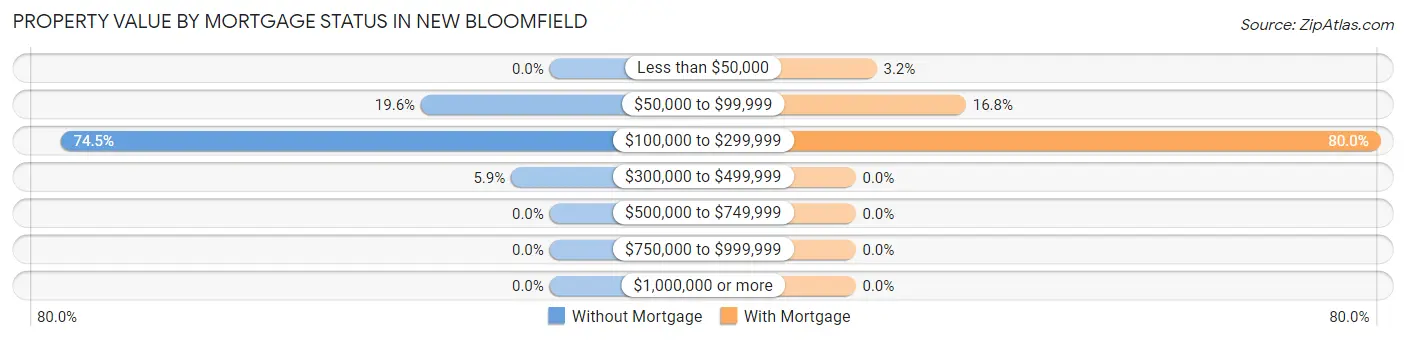
| Property Value | Without Mortgage | With Mortgage |
| Less than $50,000 | 0 (0.0%) | 4 (3.2%) |
| $50,000 to $99,999 | 10 (19.6%) | 21 (16.8%) |
| $100,000 to $299,999 | 38 (74.5%) | 100 (80.0%) |
| $300,000 to $499,999 | 3 (5.9%) | 0 (0.0%) |
| $500,000 to $749,999 | 0 (0.0%) | 0 (0.0%) |
| $750,000 to $999,999 | 0 (0.0%) | 0 (0.0%) |
| $1,000,000 or more | 0 (0.0%) | 0 (0.0%) |
| Total | 51 (100.0%) | 125 (100.0%) |
Household Income by Mortgage Status in New Bloomfield
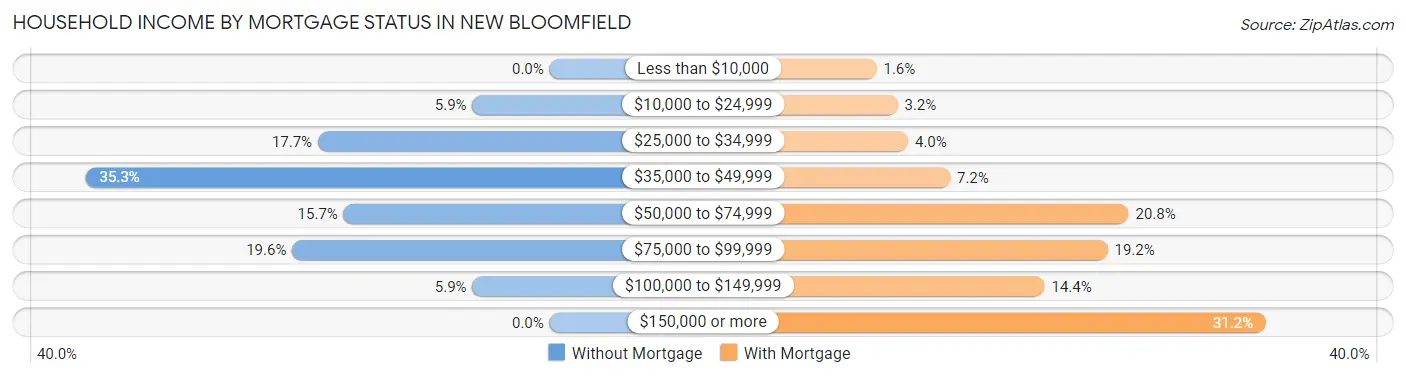
| Household Income | Without Mortgage | With Mortgage |
| Less than $10,000 | 0 (0.0%) | 2 (1.6%) |
| $10,000 to $24,999 | 3 (5.9%) | 4 (3.2%) |
| $25,000 to $34,999 | 9 (17.6%) | 5 (4.0%) |
| $35,000 to $49,999 | 18 (35.3%) | 9 (7.2%) |
| $50,000 to $74,999 | 8 (15.7%) | 26 (20.8%) |
| $75,000 to $99,999 | 10 (19.6%) | 24 (19.2%) |
| $100,000 to $149,999 | 3 (5.9%) | 18 (14.4%) |
| $150,000 or more | 0 (0.0%) | 39 (31.2%) |
| Total | 51 (100.0%) | 125 (100.0%) |
Property Value to Household Income Ratio in New Bloomfield
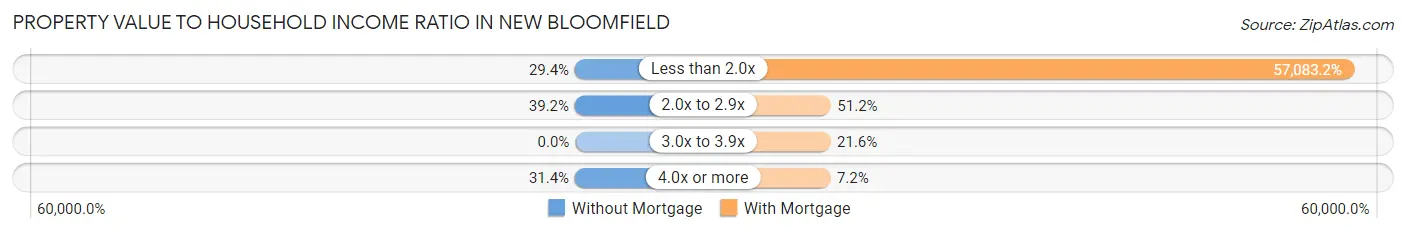
| Value-to-Income Ratio | Without Mortgage | With Mortgage |
| Less than 2.0x | 15 (29.4%) | 71,354 (57,083.2%) |
| 2.0x to 2.9x | 20 (39.2%) | 64 (51.2%) |
| 3.0x to 3.9x | 0 (0.0%) | 27 (21.6%) |
| 4.0x or more | 16 (31.4%) | 9 (7.2%) |
| Total | 51 (100.0%) | 125 (100.0%) |
Real Estate Taxes by Mortgage Status in New Bloomfield
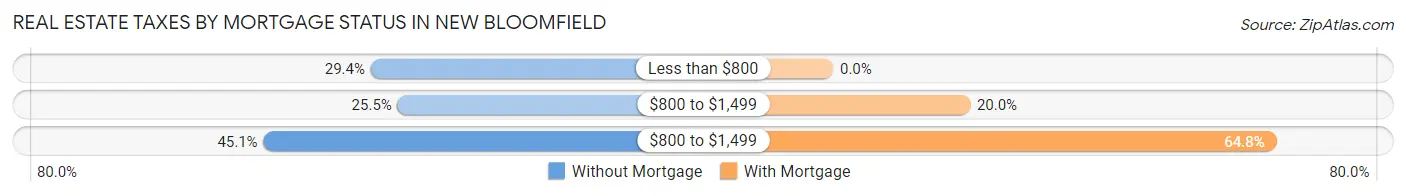
| Property Taxes | Without Mortgage | With Mortgage |
| Less than $800 | 15 (29.4%) | 0 (0.0%) |
| $800 to $1,499 | 13 (25.5%) | 25 (20.0%) |
| $800 to $1,499 | 23 (45.1%) | 81 (64.8%) |
| Total | 51 (100.0%) | 125 (100.0%) |
Health & Disability in New Bloomfield
Health Insurance Coverage by Age in New Bloomfield
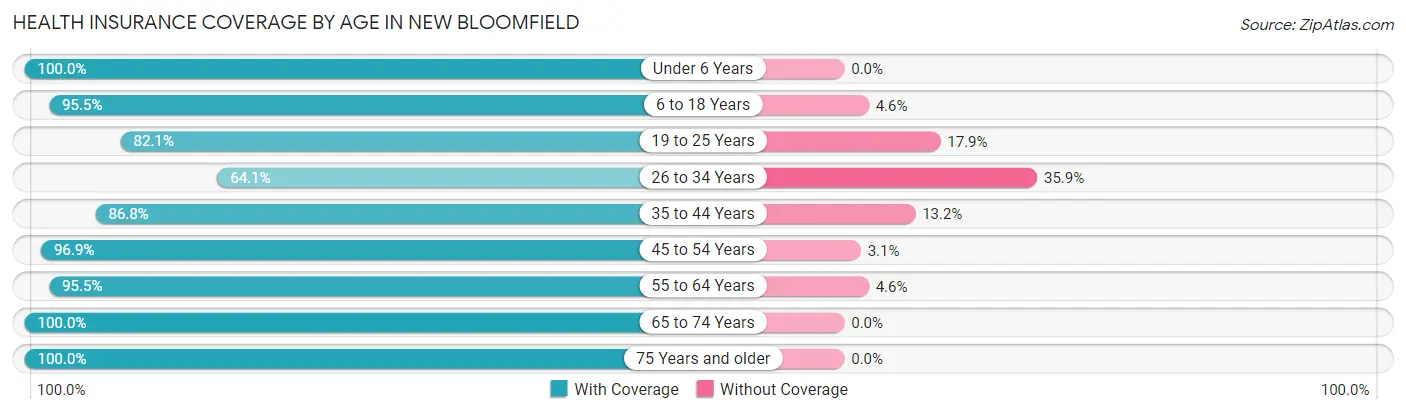
| Age Bracket | With Coverage | Without Coverage |
| Under 6 Years | 28 (100.0%) | 0 (0.0%) |
| 6 to 18 Years | 126 (95.5%) | 6 (4.5%) |
| 19 to 25 Years | 55 (82.1%) | 12 (17.9%) |
| 26 to 34 Years | 41 (64.1%) | 23 (35.9%) |
| 35 to 44 Years | 105 (86.8%) | 16 (13.2%) |
| 45 to 54 Years | 222 (96.9%) | 7 (3.1%) |
| 55 to 64 Years | 84 (95.5%) | 4 (4.5%) |
| 65 to 74 Years | 102 (100.0%) | 0 (0.0%) |
| 75 Years and older | 78 (100.0%) | 0 (0.0%) |
| Total | 841 (92.5%) | 68 (7.5%) |
Health Insurance Coverage by Citizenship Status in New Bloomfield
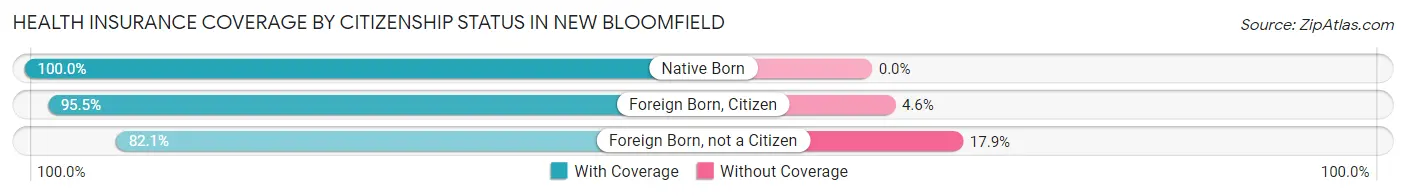
| Citizenship Status | With Coverage | Without Coverage |
| Native Born | 28 (100.0%) | 0 (0.0%) |
| Foreign Born, Citizen | 126 (95.5%) | 6 (4.5%) |
| Foreign Born, not a Citizen | 55 (82.1%) | 12 (17.9%) |
Health Insurance Coverage by Household Income in New Bloomfield
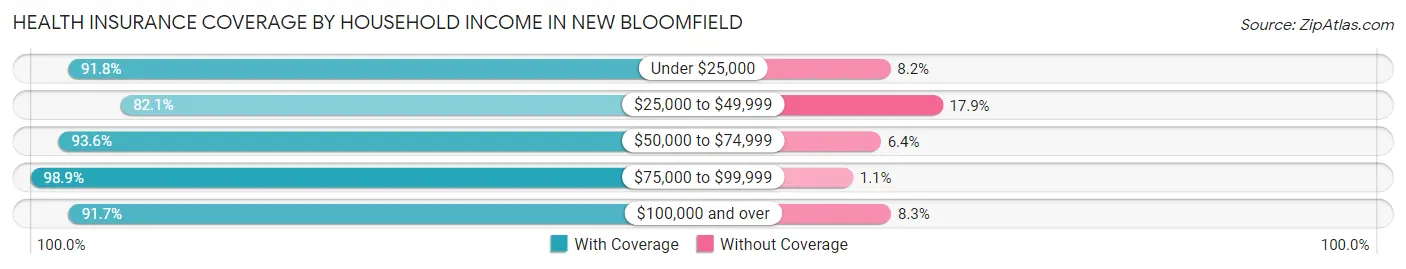
| Household Income | With Coverage | Without Coverage |
| Under $25,000 | 45 (91.8%) | 4 (8.2%) |
| $25,000 to $49,999 | 174 (82.1%) | 38 (17.9%) |
| $50,000 to $74,999 | 103 (93.6%) | 7 (6.4%) |
| $75,000 to $99,999 | 353 (98.9%) | 4 (1.1%) |
| $100,000 and over | 166 (91.7%) | 15 (8.3%) |
Public vs Private Health Insurance Coverage by Age in New Bloomfield
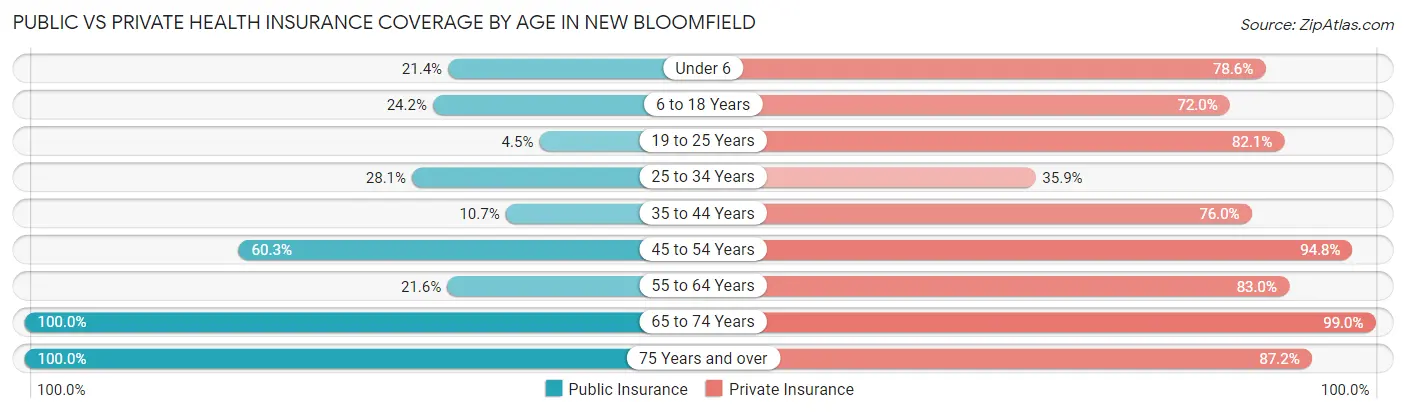
| Age Bracket | Public Insurance | Private Insurance |
| Under 6 | 6 (21.4%) | 22 (78.6%) |
| 6 to 18 Years | 32 (24.2%) | 95 (72.0%) |
| 19 to 25 Years | 3 (4.5%) | 55 (82.1%) |
| 25 to 34 Years | 18 (28.1%) | 23 (35.9%) |
| 35 to 44 Years | 13 (10.7%) | 92 (76.0%) |
| 45 to 54 Years | 138 (60.3%) | 217 (94.8%) |
| 55 to 64 Years | 19 (21.6%) | 73 (83.0%) |
| 65 to 74 Years | 102 (100.0%) | 101 (99.0%) |
| 75 Years and over | 78 (100.0%) | 68 (87.2%) |
| Total | 409 (45.0%) | 746 (82.1%) |
Disability Status by Sex by Age in New Bloomfield
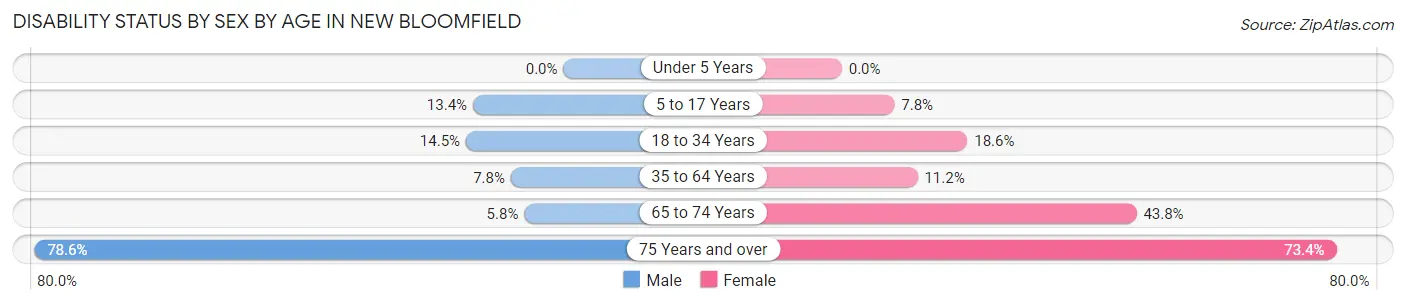
| Age Bracket | Male | Female |
| Under 5 Years | 0 (0.0%) | 0 (0.0%) |
| 5 to 17 Years | 9 (13.4%) | 5 (7.8%) |
| 18 to 34 Years | 11 (14.5%) | 11 (18.6%) |
| 35 to 64 Years | 21 (7.8%) | 19 (11.2%) |
| 65 to 74 Years | 5 (5.8%) | 7 (43.8%) |
| 75 Years and over | 11 (78.6%) | 47 (73.4%) |
Disability Class by Sex by Age in New Bloomfield
Disability Class: Hearing Difficulty
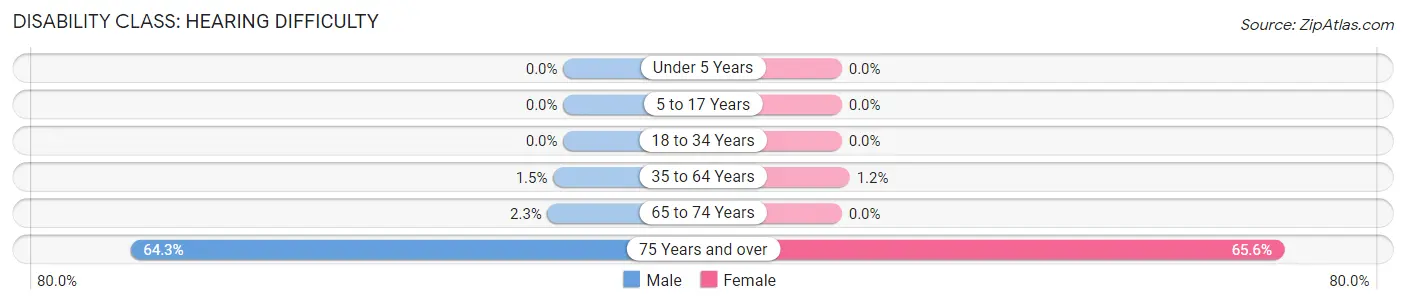
| Age Bracket | Male | Female |
| Under 5 Years | 0 (0.0%) | 0 (0.0%) |
| 5 to 17 Years | 0 (0.0%) | 0 (0.0%) |
| 18 to 34 Years | 0 (0.0%) | 0 (0.0%) |
| 35 to 64 Years | 4 (1.5%) | 2 (1.2%) |
| 65 to 74 Years | 2 (2.3%) | 0 (0.0%) |
| 75 Years and over | 9 (64.3%) | 42 (65.6%) |
Disability Class: Vision Difficulty
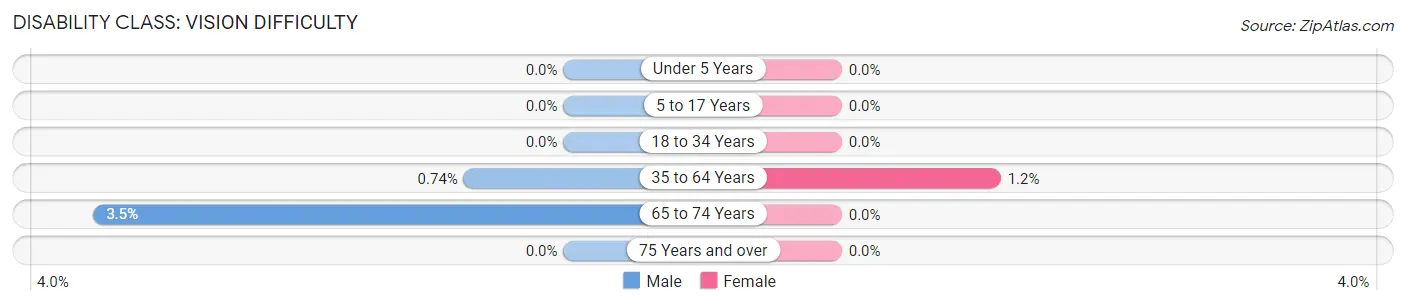
| Age Bracket | Male | Female |
| Under 5 Years | 0 (0.0%) | 0 (0.0%) |
| 5 to 17 Years | 0 (0.0%) | 0 (0.0%) |
| 18 to 34 Years | 0 (0.0%) | 0 (0.0%) |
| 35 to 64 Years | 2 (0.7%) | 2 (1.2%) |
| 65 to 74 Years | 3 (3.5%) | 0 (0.0%) |
| 75 Years and over | 0 (0.0%) | 0 (0.0%) |
Disability Class: Cognitive Difficulty
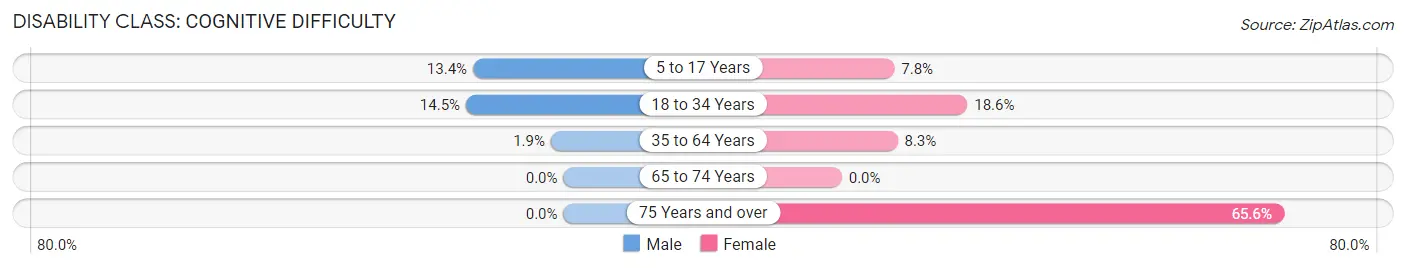
| Age Bracket | Male | Female |
| 5 to 17 Years | 9 (13.4%) | 5 (7.8%) |
| 18 to 34 Years | 11 (14.5%) | 11 (18.6%) |
| 35 to 64 Years | 5 (1.9%) | 14 (8.3%) |
| 65 to 74 Years | 0 (0.0%) | 0 (0.0%) |
| 75 Years and over | 0 (0.0%) | 42 (65.6%) |
Disability Class: Ambulatory Difficulty
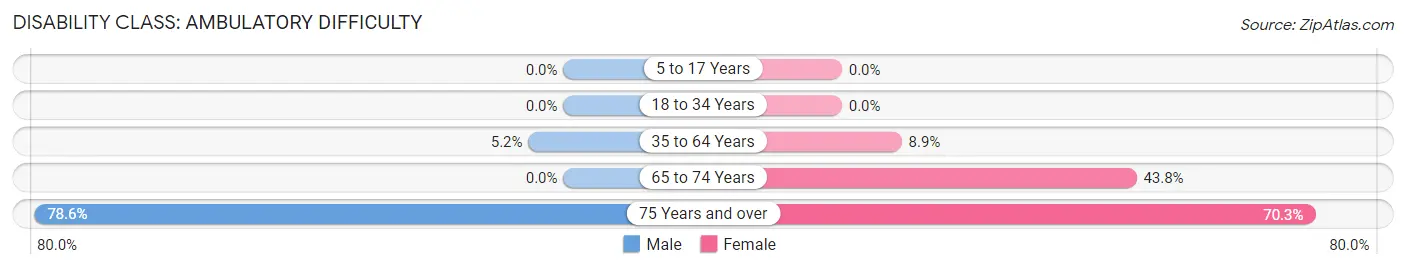
| Age Bracket | Male | Female |
| 5 to 17 Years | 0 (0.0%) | 0 (0.0%) |
| 18 to 34 Years | 0 (0.0%) | 0 (0.0%) |
| 35 to 64 Years | 14 (5.2%) | 15 (8.9%) |
| 65 to 74 Years | 0 (0.0%) | 7 (43.8%) |
| 75 Years and over | 11 (78.6%) | 45 (70.3%) |
Disability Class: Self-Care Difficulty
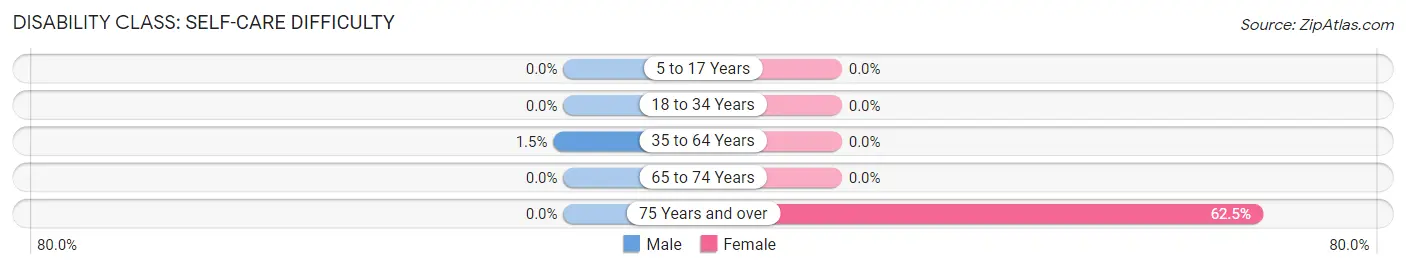
| Age Bracket | Male | Female |
| 5 to 17 Years | 0 (0.0%) | 0 (0.0%) |
| 18 to 34 Years | 0 (0.0%) | 0 (0.0%) |
| 35 to 64 Years | 4 (1.5%) | 0 (0.0%) |
| 65 to 74 Years | 0 (0.0%) | 0 (0.0%) |
| 75 Years and over | 0 (0.0%) | 40 (62.5%) |
Technology Access in New Bloomfield
Computing Device Access in New Bloomfield
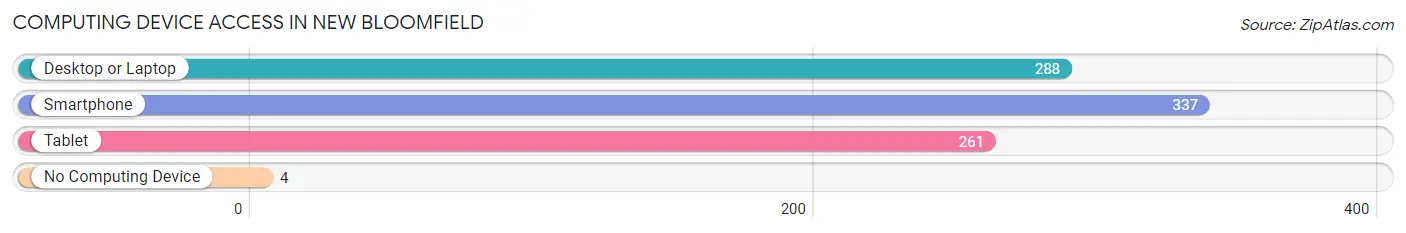
| Device Type | # Households | % Households |
| Desktop or Laptop | 288 | 80.0% |
| Smartphone | 337 | 93.6% |
| Tablet | 261 | 72.5% |
| No Computing Device | 4 | 1.1% |
| Total | 360 | 100.0% |
Internet Access in New Bloomfield
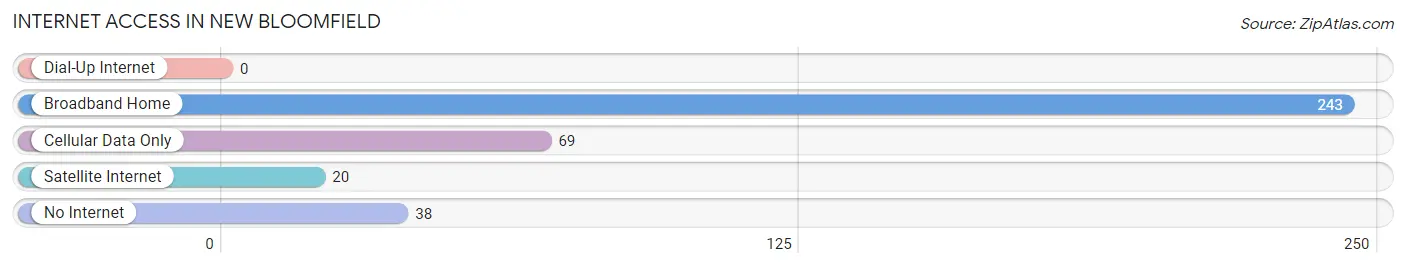
| Internet Type | # Households | % Households |
| Dial-Up Internet | 0 | 0.0% |
| Broadband Home | 243 | 67.5% |
| Cellular Data Only | 69 | 19.2% |
| Satellite Internet | 20 | 5.6% |
| No Internet | 38 | 10.6% |
| Total | 360 | 100.0% |
New Bloomfield Summary
Bloomfield, Missouri is a small town located in the eastern part of the state, in Callaway County. It is situated on the banks of the Missouri River, and is part of the Jefferson City Metropolitan Statistical Area. The town has a population of approximately 1,500 people, and is known for its rural charm and small-town atmosphere.
History
The area that is now Bloomfield was first settled in the early 1800s by a group of settlers from Kentucky. The town was originally known as “New Bloomfield”, and was officially incorporated in 1837. The town was named after the nearby town of Bloomfield, Kentucky, which was named after the blooming wildflowers that grew in the area.
In the late 1800s, the town was a major stop on the Hannibal and St. Joseph Railroad, which connected St. Louis to Kansas City. The railroad brought a great deal of economic growth to the area, and the town quickly became a hub for trade and commerce.
In the early 1900s, the town was home to several large businesses, including a flour mill, a brickyard, and a furniture factory. The town also had a thriving agricultural industry, and was known for its production of corn, wheat, and other crops.
Geography
Bloomfield is located in the eastern part of Missouri, in Callaway County. It is situated on the banks of the Missouri River, and is part of the Jefferson City Metropolitan Statistical Area. The town is located approximately 30 miles east of Jefferson City, and is about an hour and a half drive from St. Louis.
The town is situated in a rural area, and is surrounded by rolling hills and farmland. The town is located in a temperate climate, and experiences hot summers and cold winters.
Economy
The economy of Bloomfield is largely based on agriculture and tourism. The town is home to several large farms, which produce corn, wheat, and other crops. The town is also home to several small businesses, including restaurants, shops, and other services.
The town is also a popular tourist destination, and is known for its rural charm and small-town atmosphere. The town is home to several historic sites, including the Callaway County Courthouse and the Bloomfield Historic District.
Demographics
As of the 2010 census, the population of Bloomfield was 1,521. The town is predominantly white, with a small African American population. The median household income in the town is $37,000, and the median home value is $90,000. The town has a low unemployment rate, and the majority of the population is employed in the agricultural and tourism industries.
Common Questions
What is Per Capita Income in New Bloomfield?
Per Capita income in New Bloomfield is $28,255.
What is the Median Family Income in New Bloomfield?
Median Family Income in New Bloomfield is $81,250.
What is the Median Household income in New Bloomfield?
Median Household Income in New Bloomfield is $71,607.
What is Income or Wage Gap in New Bloomfield?
Income or Wage Gap in New Bloomfield is 13.5%.
Women in New Bloomfield earn 86.5 cents for every dollar earned by a man.
What is Inequality or Gini Index in New Bloomfield?
Inequality or Gini Index in New Bloomfield is 0.29.
What is the Total Population of New Bloomfield?
Total Population of New Bloomfield is 909.
What is the Total Male Population of New Bloomfield?
Total Male Population of New Bloomfield is 521.
What is the Total Female Population of New Bloomfield?
Total Female Population of New Bloomfield is 388.
What is the Ratio of Males per 100 Females in New Bloomfield?
There are 134.28 Males per 100 Females in New Bloomfield.
What is the Ratio of Females per 100 Males in New Bloomfield?
There are 74.47 Females per 100 Males in New Bloomfield.
What is the Median Population Age in New Bloomfield?
Median Population Age in New Bloomfield is 47.2 Years.
What is the Average Family Size in New Bloomfield
Average Family Size in New Bloomfield is 3.0 People.
What is the Average Household Size in New Bloomfield
Average Household Size in New Bloomfield is 2.5 People.
How Large is the Labor Force in New Bloomfield?
There are 590 People in the Labor Forcein in New Bloomfield.
What is the Percentage of People in the Labor Force in New Bloomfield?
75.9% of People are in the Labor Force in New Bloomfield.
What is the Unemployment Rate in New Bloomfield?
Unemployment Rate in New Bloomfield is 3.4%.