Morrison, MO Map & Demographics
Morrison Map
Morrison Overview
$21,861
PER CAPITA INCOME
$56,250
AVG FAMILY INCOME
$36,875
AVG HOUSEHOLD INCOME
45.0%
WAGE / INCOME GAP [ % ]
55.0¢/ $1
WAGE / INCOME GAP [ $ ]
0.42
INEQUALITY / GINI INDEX
59
TOTAL POPULATION
25
MALE POPULATION
34
FEMALE POPULATION
73.53
MALES / 100 FEMALES
136.00
FEMALES / 100 MALES
56.1
MEDIAN AGE
2.7
AVG FAMILY SIZE
2.2
AVG HOUSEHOLD SIZE
17
LABOR FORCE [ PEOPLE ]
32.7%
PERCENT IN LABOR FORCE
Morrison Zip Codes
Morrison Area Codes
Income in Morrison
Income Overview in Morrison
Per Capita Income in Morrison is $21,861, while median incomes of families and households are $56,250 and $36,875 respectively.
| Characteristic | Number | Measure |
| Per Capita Income | 59 | $21,861 |
| Median Family Income | 18 | $56,250 |
| Mean Family Income | 18 | $57,306 |
| Median Household Income | 27 | $36,875 |
| Mean Household Income | 27 | $48,178 |
| Income Deficit | 18 | $0 |
| Wage / Income Gap (%) | 59 | 45.00% |
| Wage / Income Gap ($) | 59 | 55.00¢ per $1 |
| Gini / Inequality Index | 59 | 0.42 |
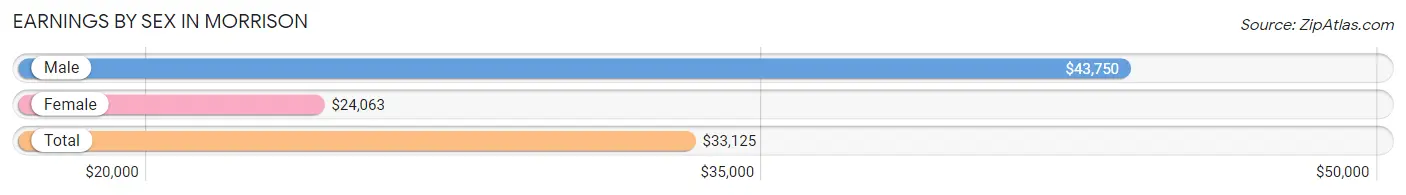
Earnings by Sex in Morrison
Average Earnings in Morrison are $33,125, $43,750 for men and $24,063 for women, a difference of 45.0%.
| Sex | Number | Average Earnings |
| Male | 10 (52.6%) | $43,750 |
| Female | 9 (47.4%) | $24,063 |
| Total | 19 (100.0%) | $33,125 |
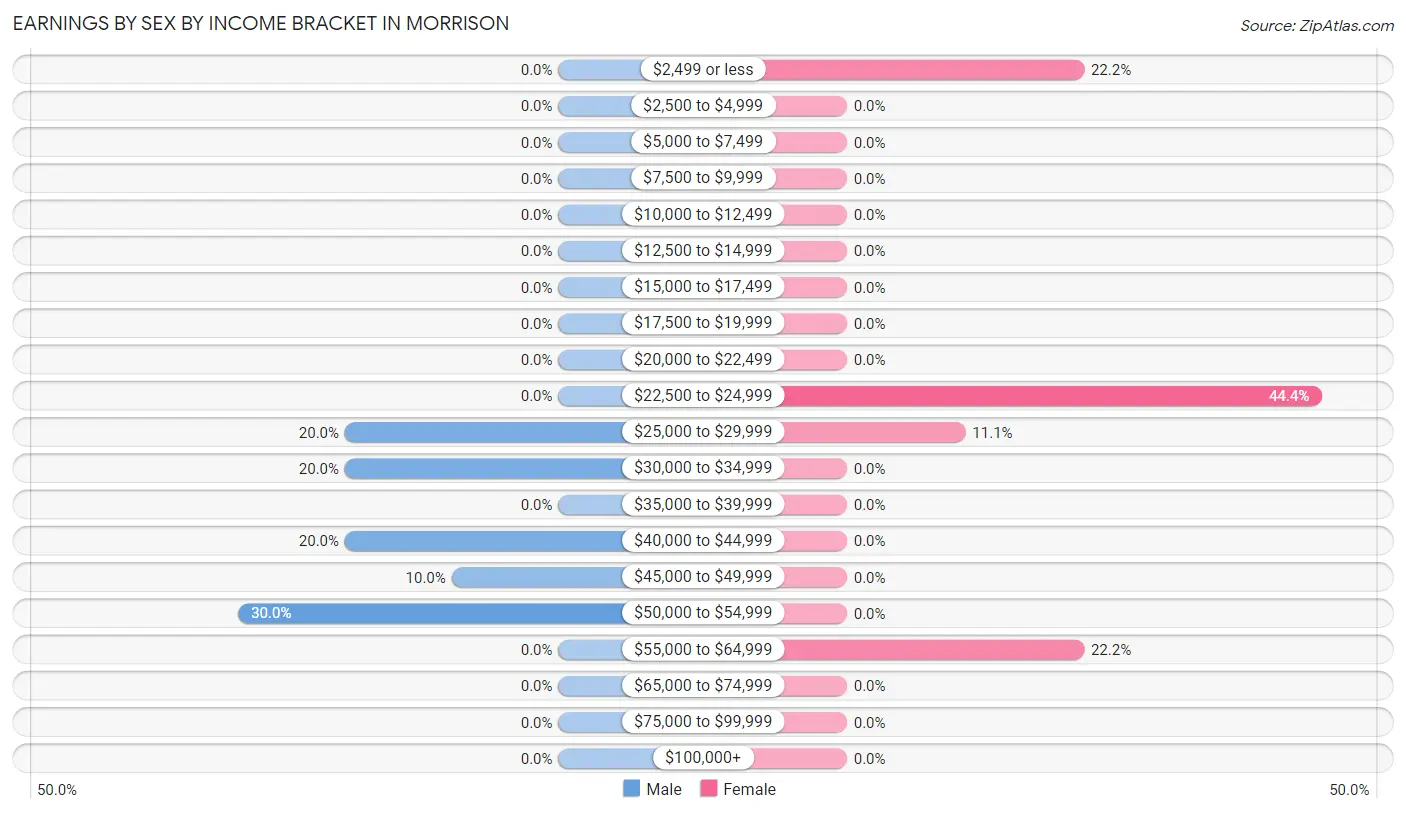
Earnings by Sex by Income Bracket in Morrison
The most common earnings brackets in Morrison are $50,000 to $54,999 for men (3 | 30.0%) and $22,500 to $24,999 for women (4 | 44.4%).
| Income | Male | Female |
| $2,499 or less | 0 (0.0%) | 2 (22.2%) |
| $2,500 to $4,999 | 0 (0.0%) | 0 (0.0%) |
| $5,000 to $7,499 | 0 (0.0%) | 0 (0.0%) |
| $7,500 to $9,999 | 0 (0.0%) | 0 (0.0%) |
| $10,000 to $12,499 | 0 (0.0%) | 0 (0.0%) |
| $12,500 to $14,999 | 0 (0.0%) | 0 (0.0%) |
| $15,000 to $17,499 | 0 (0.0%) | 0 (0.0%) |
| $17,500 to $19,999 | 0 (0.0%) | 0 (0.0%) |
| $20,000 to $22,499 | 0 (0.0%) | 0 (0.0%) |
| $22,500 to $24,999 | 0 (0.0%) | 4 (44.4%) |
| $25,000 to $29,999 | 2 (20.0%) | 1 (11.1%) |
| $30,000 to $34,999 | 2 (20.0%) | 0 (0.0%) |
| $35,000 to $39,999 | 0 (0.0%) | 0 (0.0%) |
| $40,000 to $44,999 | 2 (20.0%) | 0 (0.0%) |
| $45,000 to $49,999 | 1 (10.0%) | 0 (0.0%) |
| $50,000 to $54,999 | 3 (30.0%) | 0 (0.0%) |
| $55,000 to $64,999 | 0 (0.0%) | 2 (22.2%) |
| $65,000 to $74,999 | 0 (0.0%) | 0 (0.0%) |
| $75,000 to $99,999 | 0 (0.0%) | 0 (0.0%) |
| $100,000+ | 0 (0.0%) | 0 (0.0%) |
| Total | 10 (100.0%) | 9 (100.0%) |
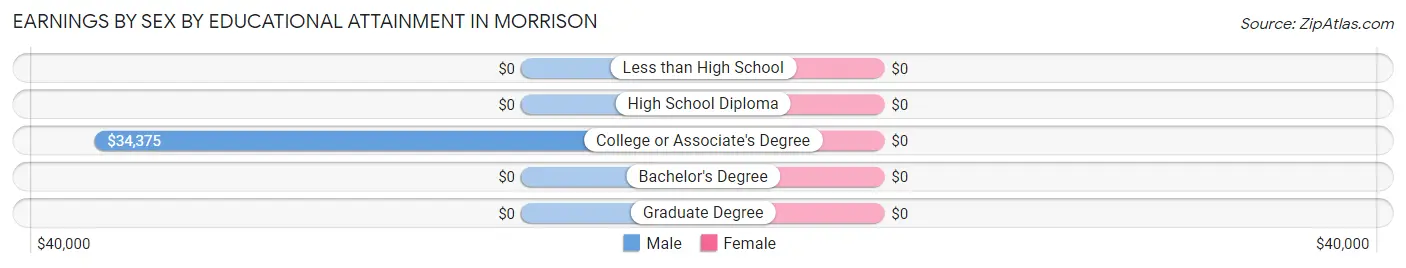
Earnings by Sex by Educational Attainment in Morrison
| Educational Attainment | Male Income | Female Income |
| Less than High School | - | - |
| High School Diploma | - | - |
| College or Associate's Degree | $34,375 | $0 |
| Bachelor's Degree | - | - |
| Graduate Degree | - | - |
| Total | $43,750 | $0 |
Family Income in Morrison
Family Income Brackets in Morrison
According to the Morrison family income data, there are 5 families falling into the $75,000 to $99,999 income range, which is the most common income bracket and makes up 27.8% of all families.
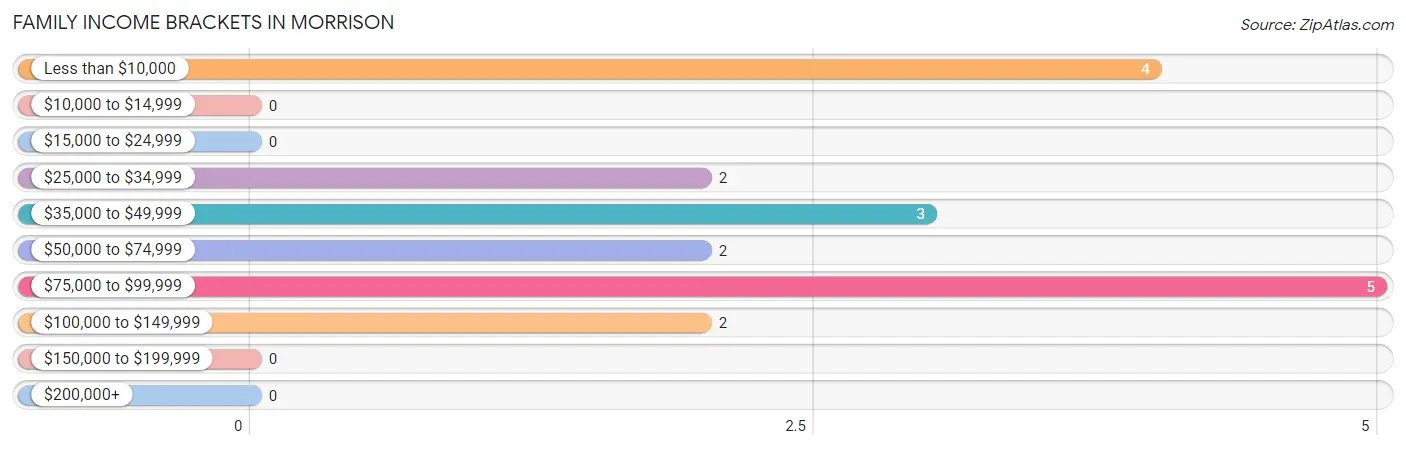
| Income Bracket | # Families | % Families |
| Less than $10,000 | 4 | 22.2% |
| $10,000 to $14,999 | 0 | 0.0% |
| $15,000 to $24,999 | 0 | 0.0% |
| $25,000 to $34,999 | 2 | 11.1% |
| $35,000 to $49,999 | 3 | 16.7% |
| $50,000 to $74,999 | 2 | 11.1% |
| $75,000 to $99,999 | 5 | 27.8% |
| $100,000 to $149,999 | 2 | 11.1% |
| $150,000 to $199,999 | 0 | 0.0% |
| $200,000+ | 0 | 0.0% |
Family Income by Famaliy Size in Morrison
| Income Bracket | # Families | Median Income |
| 2-Person Families | 11 (61.1%) | $0 |
| 3-Person Families | 5 (27.8%) | $0 |
| 4-Person Families | 0 (0.0%) | $0 |
| 5-Person Families | 0 (0.0%) | $0 |
| 6-Person Families | 2 (11.1%) | $0 |
| 7+ Person Families | 0 (0.0%) | $0 |
| Total | 18 (100.0%) | $56,250 |
Family Income by Number of Earners in Morrison
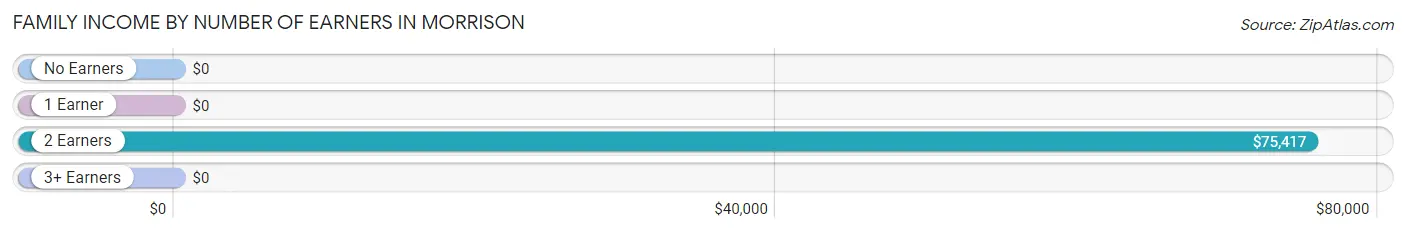
| Number of Earners | # Families | Median Income |
| No Earners | 9 (50.0%) | $0 |
| 1 Earner | 0 (0.0%) | $0 |
| 2 Earners | 9 (50.0%) | $75,417 |
| 3+ Earners | 0 (0.0%) | $0 |
| Total | 18 (100.0%) | $56,250 |
Household Income in Morrison
Household Income Brackets in Morrison
With 5 households falling in the category, the $15,000 to $24,999 income range is the most frequent in Morrison, accounting for 18.5% of all households.
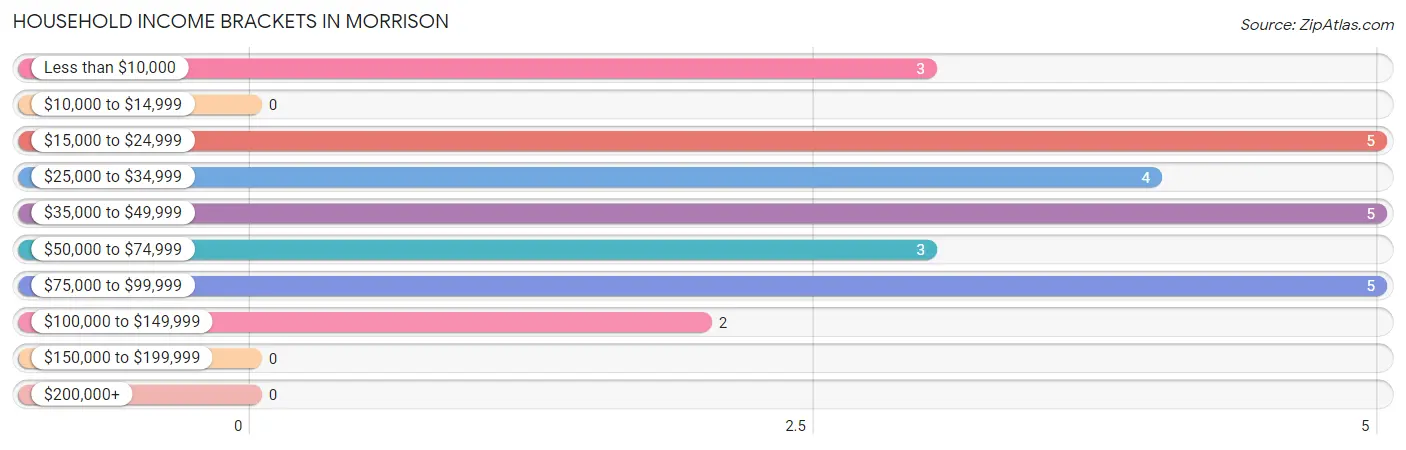
| Income Bracket | # Households | % Households |
| Less than $10,000 | 3 | 11.1% |
| $10,000 to $14,999 | 0 | 0.0% |
| $15,000 to $24,999 | 5 | 18.5% |
| $25,000 to $34,999 | 4 | 14.8% |
| $35,000 to $49,999 | 5 | 18.5% |
| $50,000 to $74,999 | 3 | 11.1% |
| $75,000 to $99,999 | 5 | 18.5% |
| $100,000 to $149,999 | 2 | 7.4% |
| $150,000 to $199,999 | 0 | 0.0% |
| $200,000+ | 0 | 0.0% |
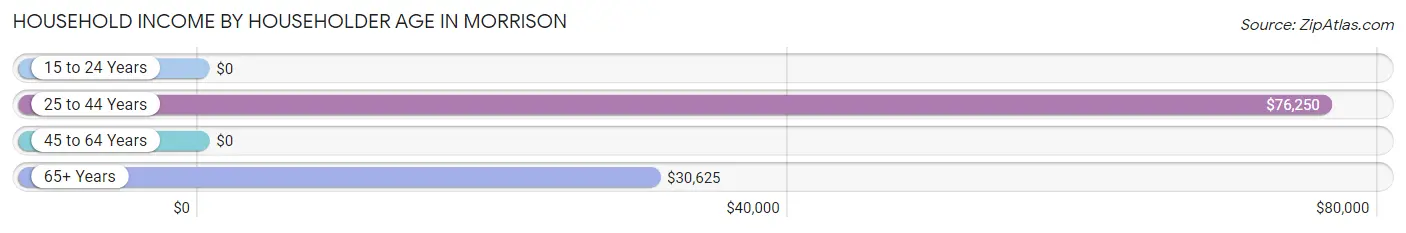
Household Income by Householder Age in Morrison
The median household income in Morrison is $36,875, with the highest median household income of $76,250 found in the 25 to 44 years age bracket for the primary householder. A total of 7 households (25.9%) fall into this category.
| Income Bracket | # Households | Median Income |
| 15 to 24 Years | 0 (0.0%) | $0 |
| 25 to 44 Years | 7 (25.9%) | $76,250 |
| 45 to 64 Years | 11 (40.7%) | $0 |
| 65+ Years | 9 (33.3%) | $30,625 |
| Total | 27 (100.0%) | $36,875 |
Poverty in Morrison
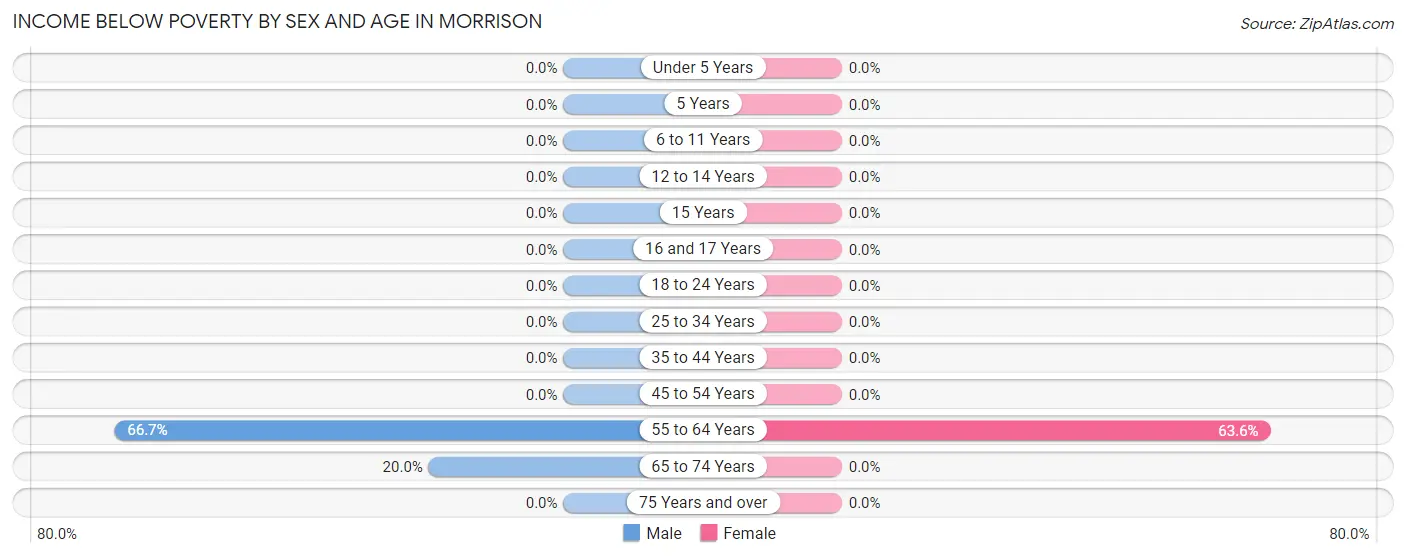
Income Below Poverty by Sex and Age in Morrison
With 20.0% poverty level for males and 20.6% for females among the residents of Morrison, 55 to 64 year old males and 55 to 64 year old females are the most vulnerable to poverty, with 4 males (66.7%) and 7 females (63.6%) in their respective age groups living below the poverty level.
| Age Bracket | Male | Female |
| Under 5 Years | 0 (0.0%) | 0 (0.0%) |
| 5 Years | 0 (0.0%) | 0 (0.0%) |
| 6 to 11 Years | 0 (0.0%) | 0 (0.0%) |
| 12 to 14 Years | 0 (0.0%) | 0 (0.0%) |
| 15 Years | 0 (0.0%) | 0 (0.0%) |
| 16 and 17 Years | 0 (0.0%) | 0 (0.0%) |
| 18 to 24 Years | 0 (0.0%) | 0 (0.0%) |
| 25 to 34 Years | 0 (0.0%) | 0 (0.0%) |
| 35 to 44 Years | 0 (0.0%) | 0 (0.0%) |
| 45 to 54 Years | 0 (0.0%) | 0 (0.0%) |
| 55 to 64 Years | 4 (66.7%) | 7 (63.6%) |
| 65 to 74 Years | 1 (20.0%) | 0 (0.0%) |
| 75 Years and over | 0 (0.0%) | 0 (0.0%) |
| Total | 5 (20.0%) | 7 (20.6%) |
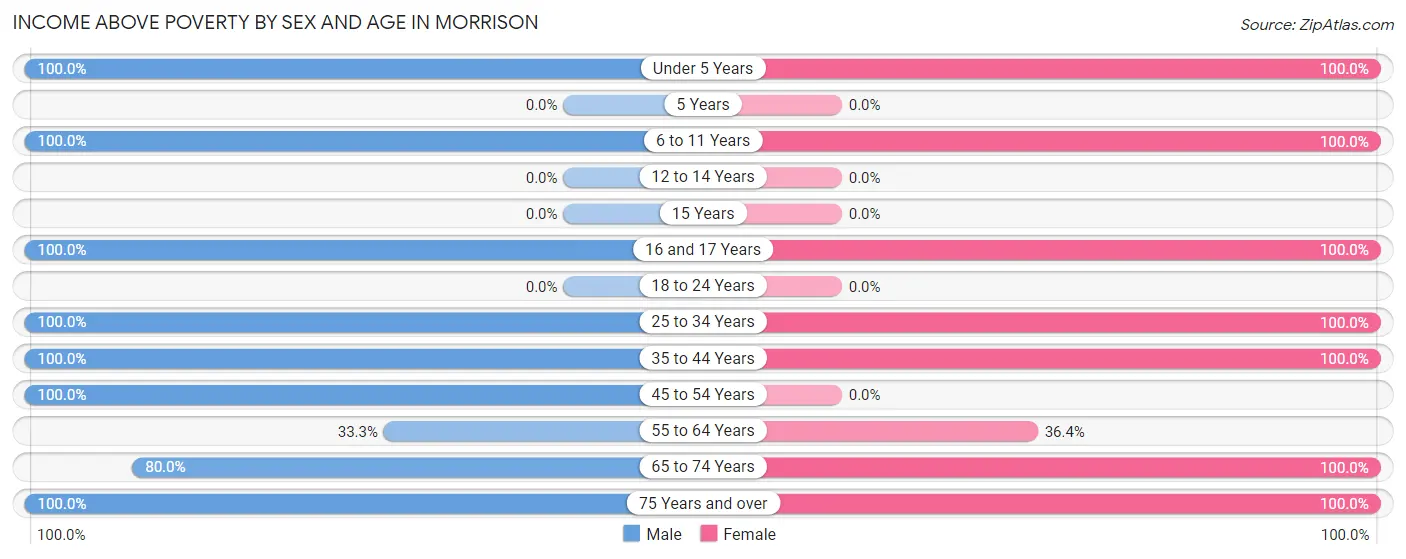
Income Above Poverty by Sex and Age in Morrison
According to the poverty statistics in Morrison, males aged under 5 years and females aged under 5 years are the age groups that are most secure financially, with 100.0% of males and 100.0% of females in these age groups living above the poverty line.
| Age Bracket | Male | Female |
| Under 5 Years | 1 (100.0%) | 1 (100.0%) |
| 5 Years | 0 (0.0%) | 0 (0.0%) |
| 6 to 11 Years | 1 (100.0%) | 4 (100.0%) |
| 12 to 14 Years | 0 (0.0%) | 0 (0.0%) |
| 15 Years | 0 (0.0%) | 0 (0.0%) |
| 16 and 17 Years | 2 (100.0%) | 2 (100.0%) |
| 18 to 24 Years | 0 (0.0%) | 0 (0.0%) |
| 25 to 34 Years | 2 (100.0%) | 2 (100.0%) |
| 35 to 44 Years | 5 (100.0%) | 7 (100.0%) |
| 45 to 54 Years | 2 (100.0%) | 0 (0.0%) |
| 55 to 64 Years | 2 (33.3%) | 4 (36.4%) |
| 65 to 74 Years | 4 (80.0%) | 4 (100.0%) |
| 75 Years and over | 1 (100.0%) | 3 (100.0%) |
| Total | 20 (80.0%) | 27 (79.4%) |
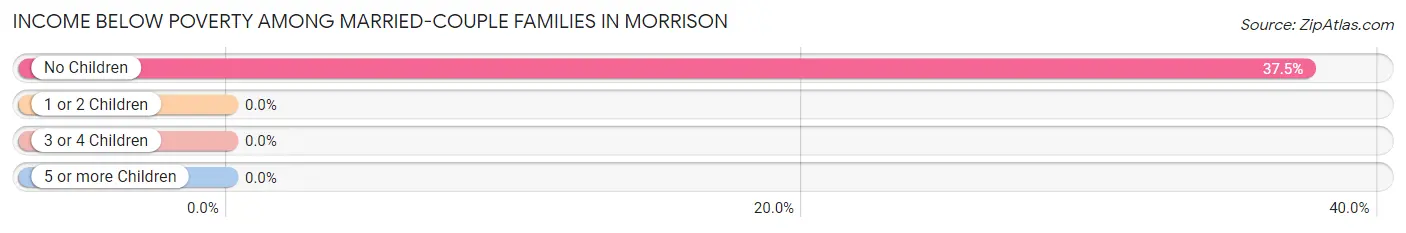
Income Below Poverty Among Married-Couple Families in Morrison
The poverty statistics for married-couple families in Morrison show that 20.0% or 3 of the total 15 families live below the poverty line. Families with no children have the highest poverty rate of 37.5%, comprising of 3 families. On the other hand, families with 1 or 2 children have the lowest poverty rate of 0.0%, which includes 0 families.
| Children | Above Poverty | Below Poverty |
| No Children | 5 (62.5%) | 3 (37.5%) |
| 1 or 2 Children | 5 (100.0%) | 0 (0.0%) |
| 3 or 4 Children | 2 (100.0%) | 0 (0.0%) |
| 5 or more Children | 0 (0.0%) | 0 (0.0%) |
| Total | 12 (80.0%) | 3 (20.0%) |
Income Below Poverty Among Single-Parent Households in Morrison
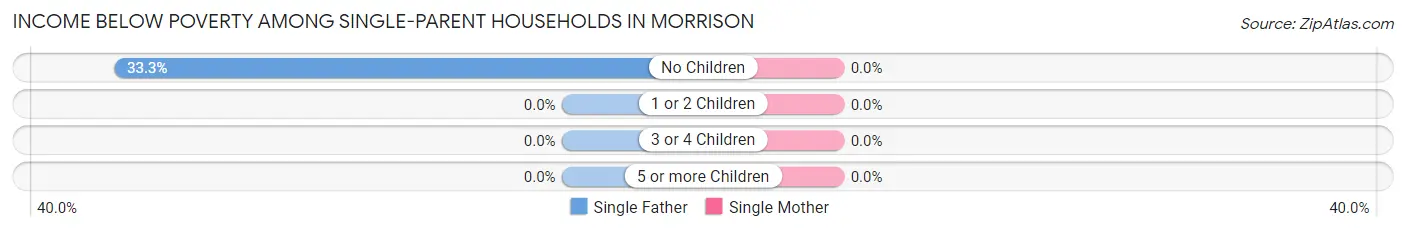
| Children | Single Father | Single Mother |
| No Children | 1 (33.3%) | 0 (0.0%) |
| 1 or 2 Children | 0 (0.0%) | 0 (0.0%) |
| 3 or 4 Children | 0 (0.0%) | 0 (0.0%) |
| 5 or more Children | 0 (0.0%) | 0 (0.0%) |
| Total | 1 (33.3%) | 0 (0.0%) |
Income Below Poverty Among Married-Couple vs Single-Parent Households in Morrison
The poverty data for Morrison shows that 3 of the married-couple family households (20.0%) and 1 of the single-parent households (33.3%) are living below the poverty level. Within the married-couple family households, those with no children have the highest poverty rate, with 3 households (37.5%) falling below the poverty line. Among the single-parent households, those with no children have the highest poverty rate, with 1 household (33.3%) living below poverty.
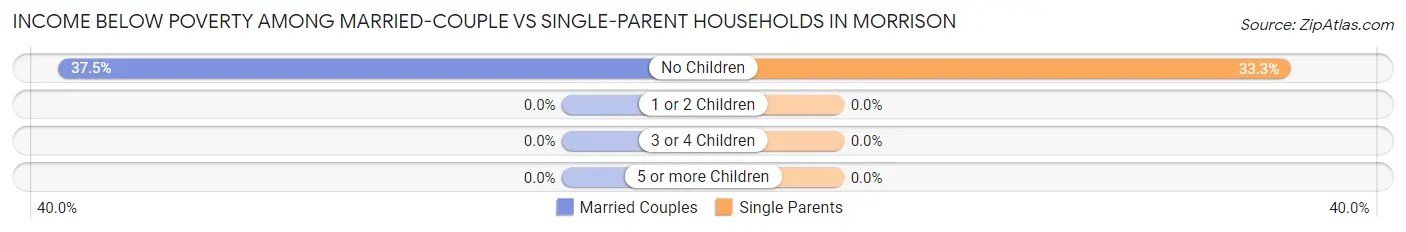
| Children | Married-Couple Families | Single-Parent Households |
| No Children | 3 (37.5%) | 1 (33.3%) |
| 1 or 2 Children | 0 (0.0%) | 0 (0.0%) |
| 3 or 4 Children | 0 (0.0%) | 0 (0.0%) |
| 5 or more Children | 0 (0.0%) | 0 (0.0%) |
| Total | 3 (20.0%) | 1 (33.3%) |
Race in Morrison
The most populous races in Morrison are White / Caucasian (56 | 94.9%), and Two or more Races (3 | 5.1%).
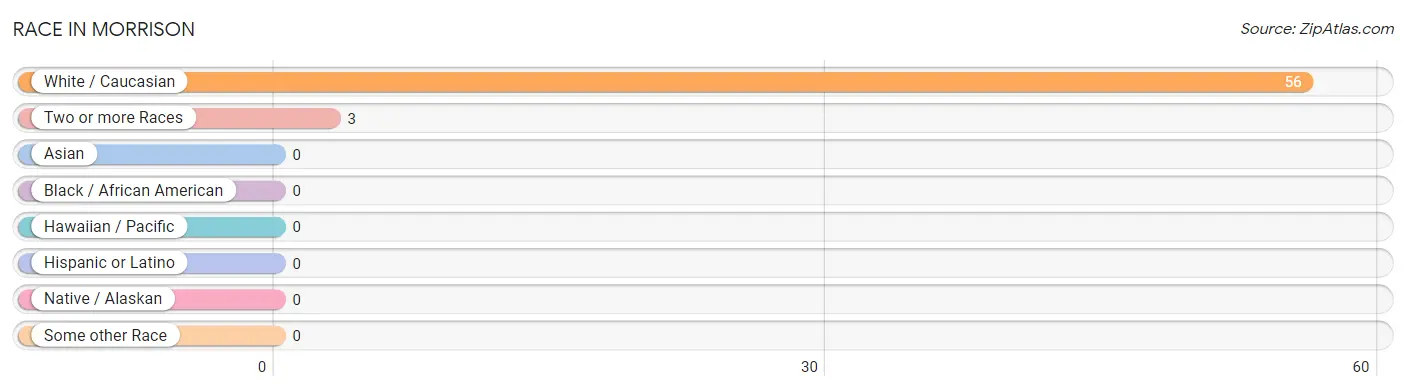
| Race | # Population | % Population |
| Asian | 0 | 0.0% |
| Black / African American | 0 | 0.0% |
| Hawaiian / Pacific | 0 | 0.0% |
| Hispanic or Latino | 0 | 0.0% |
| Native / Alaskan | 0 | 0.0% |
| White / Caucasian | 56 | 94.9% |
| Two or more Races | 3 | 5.1% |
| Some other Race | 0 | 0.0% |
| Total | 59 | 100.0% |
Ancestry in Morrison
The most populous ancestries reported in Morrison are German (13 | 22.0%), English (11 | 18.6%), American (9 | 15.2%), Norwegian (4 | 6.8%), and Blackfeet (3 | 5.1%), together accounting for 67.8% of all Morrison residents.
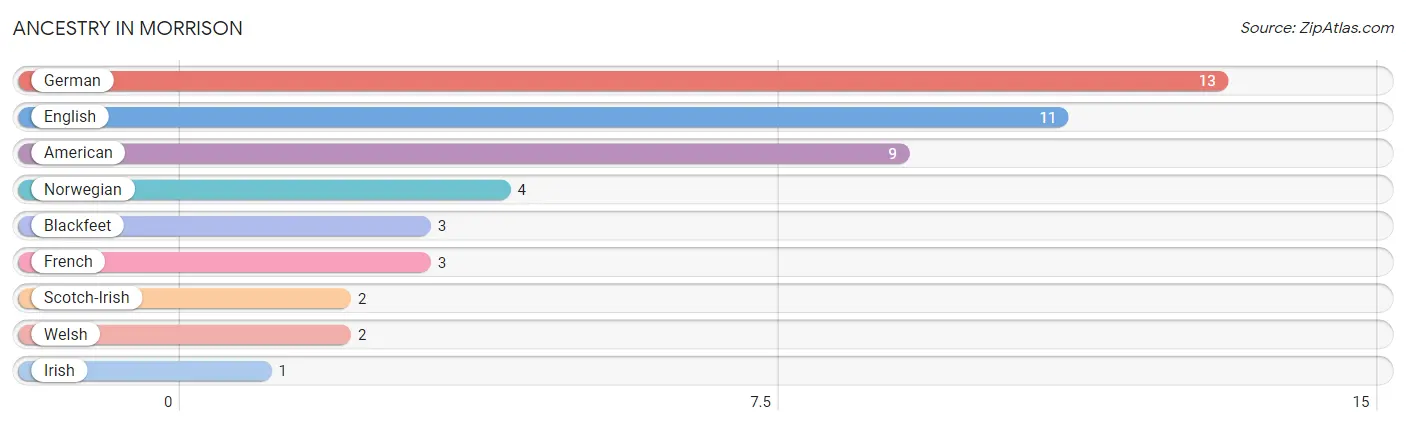
| Ancestry | # Population | % Population |
| American | 9 | 15.2% |
| Blackfeet | 3 | 5.1% |
| English | 11 | 18.6% |
| French | 3 | 5.1% |
| German | 13 | 22.0% |
| Irish | 1 | 1.7% |
| Norwegian | 4 | 6.8% |
| Scotch-Irish | 2 | 3.4% |
| Welsh | 2 | 3.4% | View All 9 Rows |
Immigrants in Morrison

| Immigration Origin | # Population | % Population | View All 0 Rows |
Sex and Age in Morrison
Sex and Age in Morrison
The most populous age groups in Morrison are 40 to 44 Years (5 | 20.0%) for men and 40 to 44 Years (7 | 20.6%) for women.
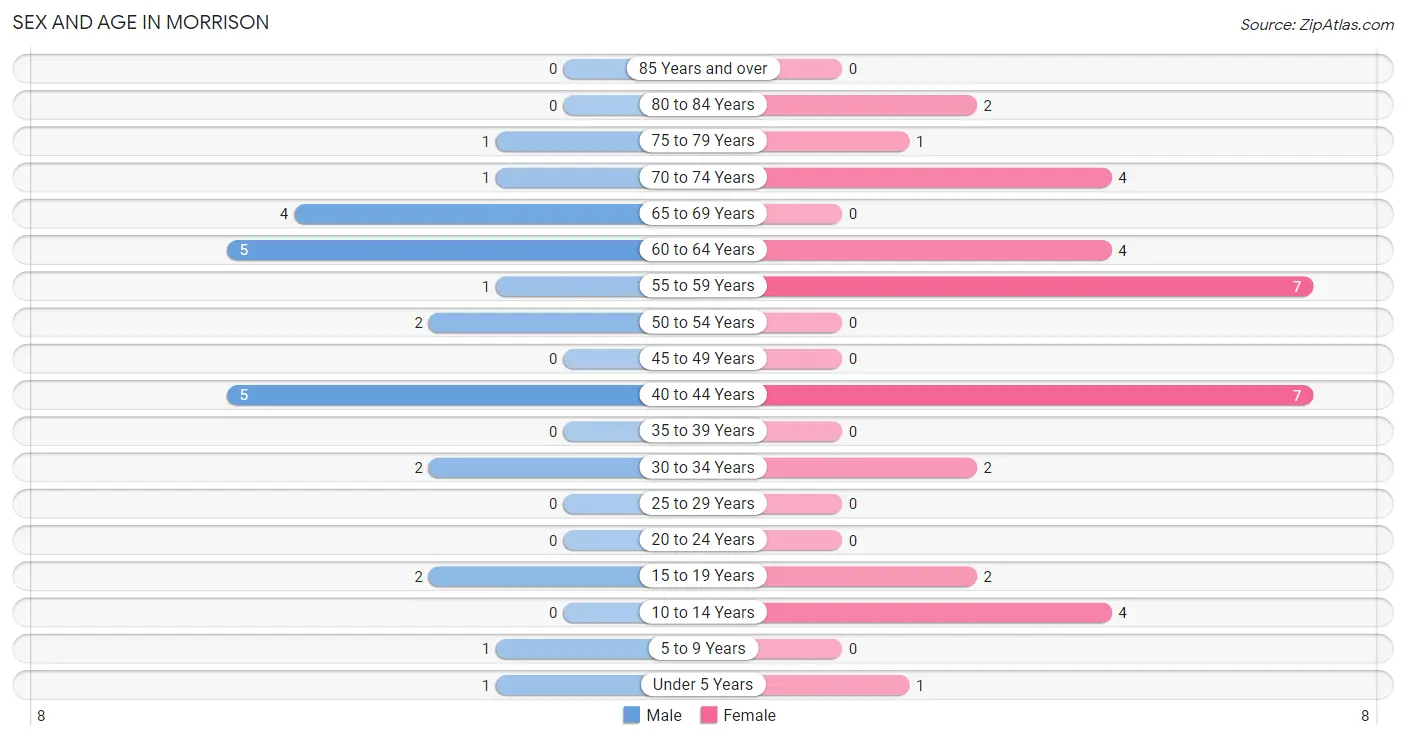
| Age Bracket | Male | Female |
| Under 5 Years | 1 (4.0%) | 1 (2.9%) |
| 5 to 9 Years | 1 (4.0%) | 0 (0.0%) |
| 10 to 14 Years | 0 (0.0%) | 4 (11.8%) |
| 15 to 19 Years | 2 (8.0%) | 2 (5.9%) |
| 20 to 24 Years | 0 (0.0%) | 0 (0.0%) |
| 25 to 29 Years | 0 (0.0%) | 0 (0.0%) |
| 30 to 34 Years | 2 (8.0%) | 2 (5.9%) |
| 35 to 39 Years | 0 (0.0%) | 0 (0.0%) |
| 40 to 44 Years | 5 (20.0%) | 7 (20.6%) |
| 45 to 49 Years | 0 (0.0%) | 0 (0.0%) |
| 50 to 54 Years | 2 (8.0%) | 0 (0.0%) |
| 55 to 59 Years | 1 (4.0%) | 7 (20.6%) |
| 60 to 64 Years | 5 (20.0%) | 4 (11.8%) |
| 65 to 69 Years | 4 (16.0%) | 0 (0.0%) |
| 70 to 74 Years | 1 (4.0%) | 4 (11.8%) |
| 75 to 79 Years | 1 (4.0%) | 1 (2.9%) |
| 80 to 84 Years | 0 (0.0%) | 2 (5.9%) |
| 85 Years and over | 0 (0.0%) | 0 (0.0%) |
| Total | 25 (100.0%) | 34 (100.0%) |
Families and Households in Morrison
Median Family Size in Morrison
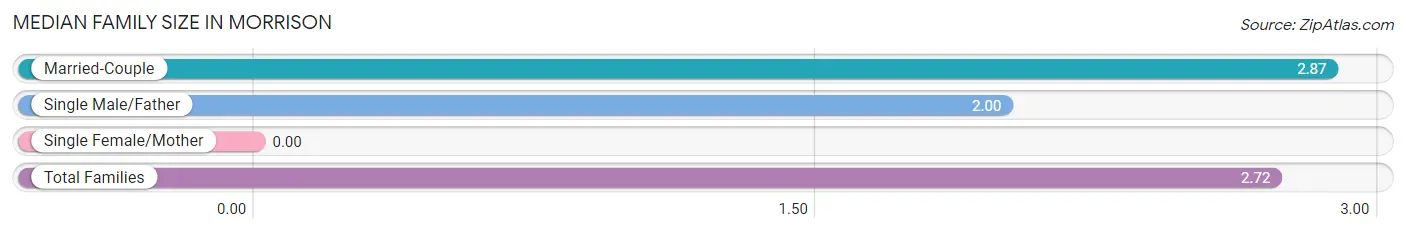
| Family Type | # Families | Family Size |
| Married-Couple | 15 (83.3%) | 2.87 |
| Single Male/Father | 3 (16.7%) | 2.00 |
| Single Female/Mother | 0 (0.0%) | - |
| Total Families | 18 (100.0%) | 2.72 |
Median Household Size in Morrison
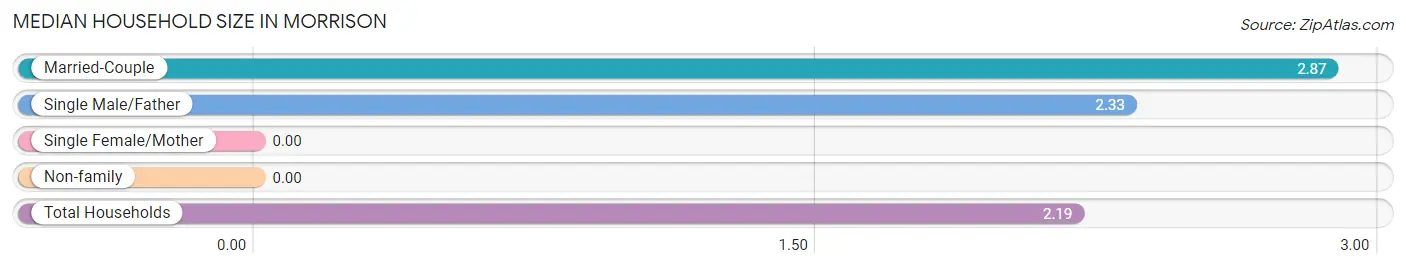
| Household Type | # Households | Household Size |
| Married-Couple | 15 (55.6%) | 2.87 |
| Single Male/Father | 3 (11.1%) | 2.33 |
| Single Female/Mother | 0 (0.0%) | - |
| Non-family | 9 (33.3%) | - |
| Total Households | 27 (100.0%) | 2.19 |
Household Size by Marriage Status in Morrison
Out of a total of 27 households in Morrison, 18 (66.7%) are family households, while 9 (33.3%) are nonfamily households. The most numerous type of family households are 2-person households, comprising 10, and the most common type of nonfamily households are 1-person households, comprising 9.
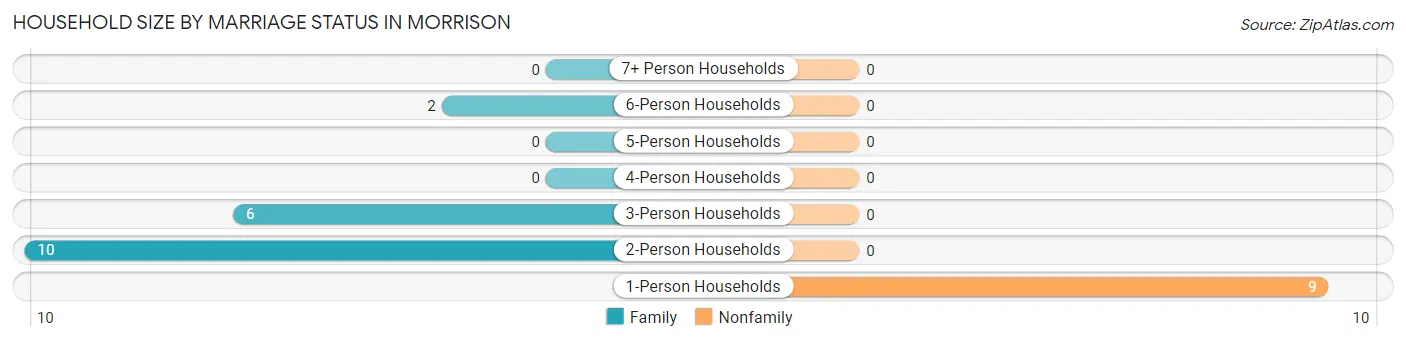
| Household Size | Family Households | Nonfamily Households |
| 1-Person Households | - | 9 (33.3%) |
| 2-Person Households | 10 (37.0%) | 0 (0.0%) |
| 3-Person Households | 6 (22.2%) | 0 (0.0%) |
| 4-Person Households | 0 (0.0%) | 0 (0.0%) |
| 5-Person Households | 0 (0.0%) | 0 (0.0%) |
| 6-Person Households | 2 (7.4%) | 0 (0.0%) |
| 7+ Person Households | 0 (0.0%) | 0 (0.0%) |
| Total | 18 (66.7%) | 9 (33.3%) |
Female Fertility in Morrison
Fertility by Age in Morrison
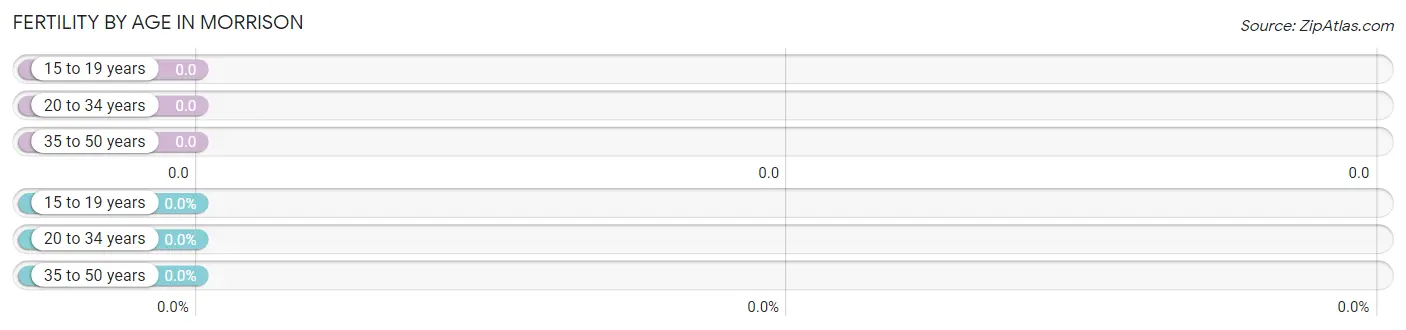
| Age Bracket | Women with Births | Births / 1,000 Women |
| 15 to 19 years | 0 (0.0%) | 0.0 |
| 20 to 34 years | 0 (0.0%) | 0.0 |
| 35 to 50 years | 0 (0.0%) | 0.0 |
| Total | 0 (0.0%) | 0.0 |
Fertility by Age by Marriage Status in Morrison
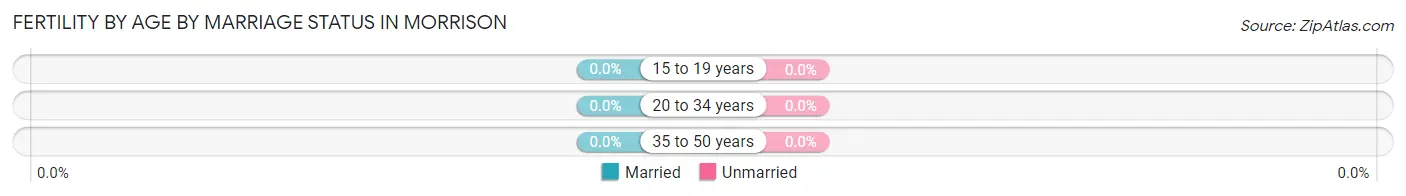
| Age Bracket | Married | Unmarried |
| 15 to 19 years | 0 (0.0%) | 0 (0.0%) |
| 20 to 34 years | 0 (0.0%) | 0 (0.0%) |
| 35 to 50 years | 0 (0.0%) | 0 (0.0%) |
| Total | 0 (0.0%) | 0 (0.0%) |
Fertility by Education in Morrison
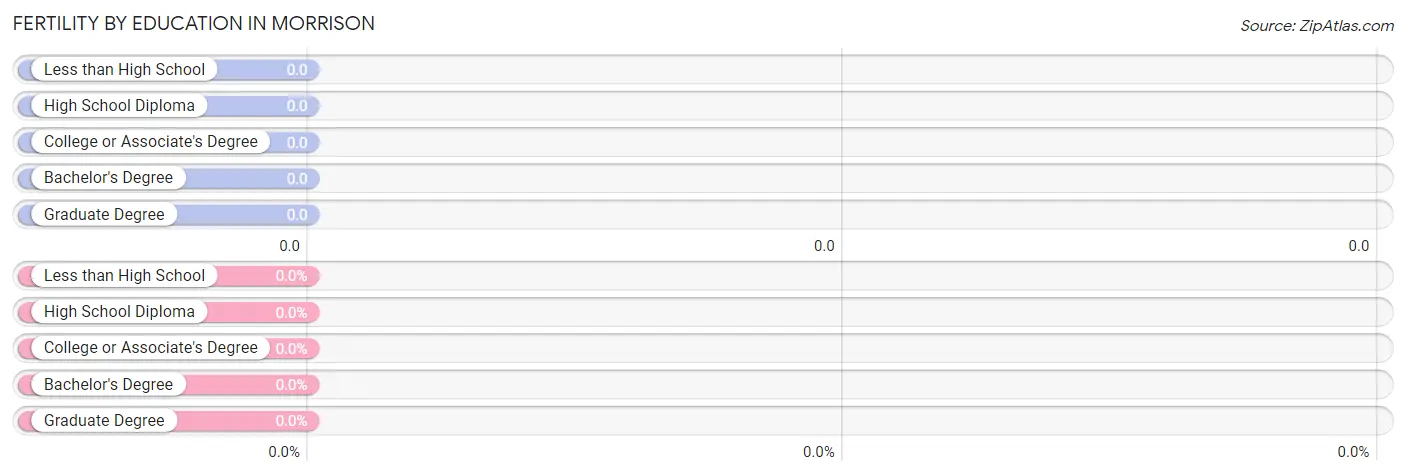
| Educational Attainment | Women with Births | Births / 1,000 Women |
| Less than High School | 0 (0.0%) | 0.0 |
| High School Diploma | 0 (0.0%) | 0.0 |
| College or Associate's Degree | 0 (0.0%) | 0.0 |
| Bachelor's Degree | 0 (0.0%) | 0.0 |
| Graduate Degree | 0 (0.0%) | 0.0 |
| Total | 0 (0.0%) | 0.0 |
Fertility by Education by Marriage Status in Morrison
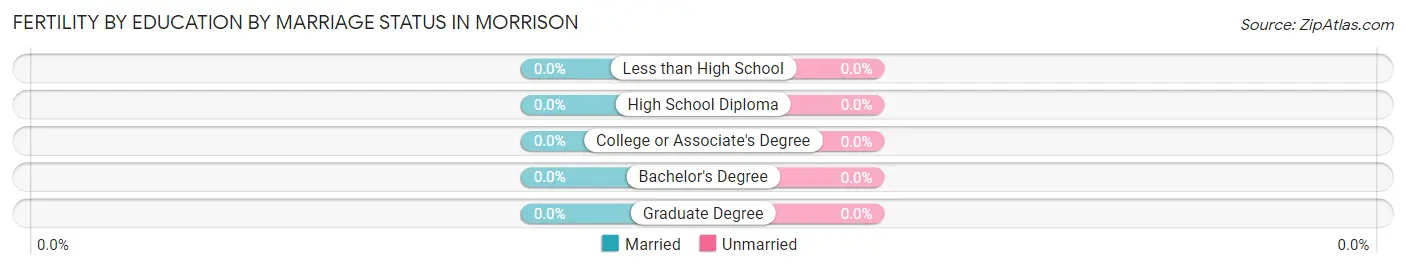
| Educational Attainment | Married | Unmarried |
| Less than High School | 0 (0.0%) | 0 (0.0%) |
| High School Diploma | 0 (0.0%) | 0 (0.0%) |
| College or Associate's Degree | 0 (0.0%) | 0 (0.0%) |
| Bachelor's Degree | 0 (0.0%) | 0 (0.0%) |
| Graduate Degree | 0 (0.0%) | 0 (0.0%) |
| Total | 0 (0.0%) | 0 (0.0%) |
Employment Characteristics in Morrison
Employment by Class of Employer in Morrison
Among the 17 employed individuals in Morrison, private company employees (11 | 64.7%), not-for-profit organizations (3 | 17.6%), and self-employed (not incorporated) (2 | 11.8%) make up the most common classes of employment.
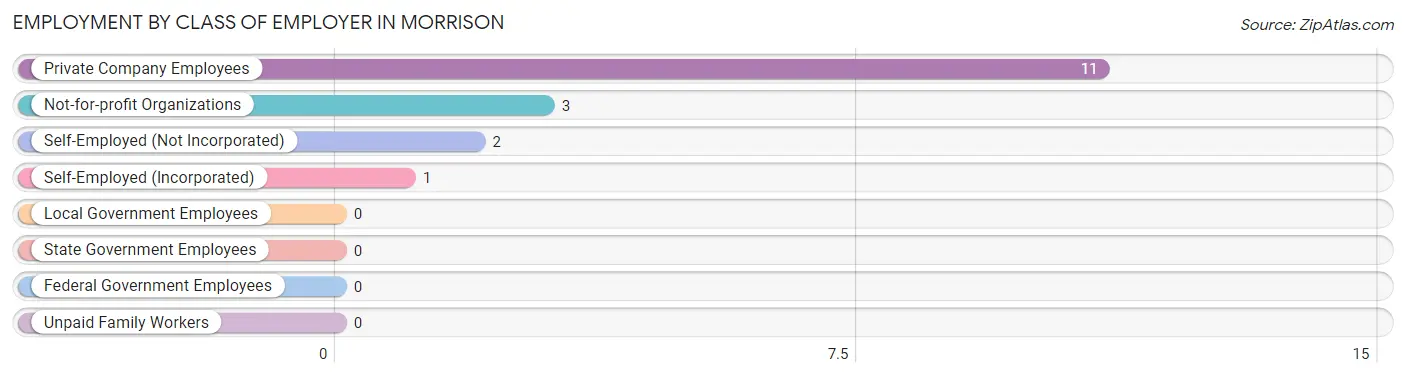
| Employer Class | # Employees | % Employees |
| Private Company Employees | 11 | 64.7% |
| Self-Employed (Incorporated) | 1 | 5.9% |
| Self-Employed (Not Incorporated) | 2 | 11.8% |
| Not-for-profit Organizations | 3 | 17.6% |
| Local Government Employees | 0 | 0.0% |
| State Government Employees | 0 | 0.0% |
| Federal Government Employees | 0 | 0.0% |
| Unpaid Family Workers | 0 | 0.0% |
| Total | 17 | 100.0% |
Employment Status by Age in Morrison
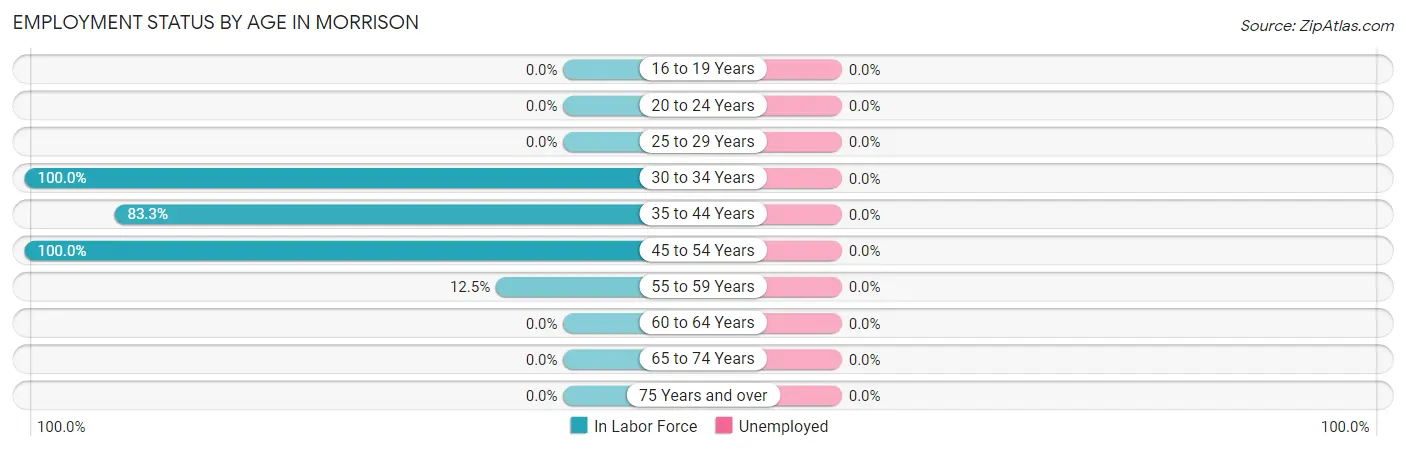
| Age Bracket | In Labor Force | Unemployed |
| 16 to 19 Years | 0 (0.0%) | 0 (0.0%) |
| 20 to 24 Years | 0 (0.0%) | 0 (0.0%) |
| 25 to 29 Years | 0 (0.0%) | 0 (0.0%) |
| 30 to 34 Years | 4 (100.0%) | 0 (0.0%) |
| 35 to 44 Years | 10 (83.3%) | 0 (0.0%) |
| 45 to 54 Years | 2 (100.0%) | 0 (0.0%) |
| 55 to 59 Years | 1 (12.5%) | 0 (0.0%) |
| 60 to 64 Years | 0 (0.0%) | 0 (0.0%) |
| 65 to 74 Years | 0 (0.0%) | 0 (0.0%) |
| 75 Years and over | 0 (0.0%) | 0 (0.0%) |
| Total | 17 (32.7%) | 0 (0.0%) |
Employment Status by Educational Attainment in Morrison
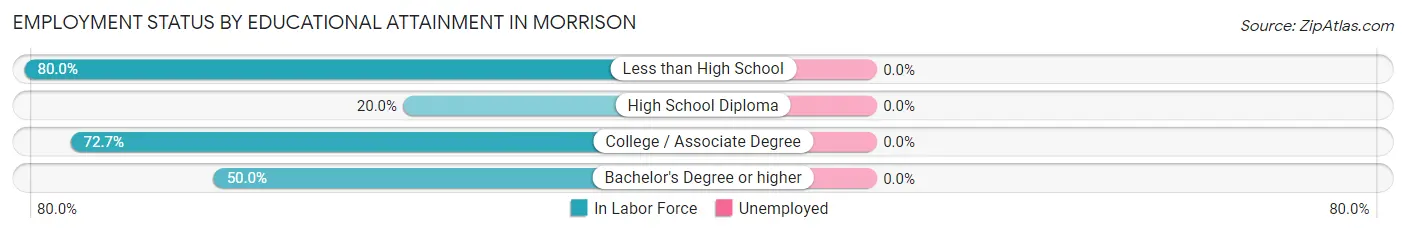
| Educational Attainment | In Labor Force | Unemployed |
| Less than High School | 4 (80.0%) | 0 (0.0%) |
| High School Diploma | 3 (20.0%) | 0 (0.0%) |
| College / Associate Degree | 8 (72.7%) | 0 (0.0%) |
| Bachelor's Degree or higher | 2 (50.0%) | 0 (0.0%) |
| Total | 17 (48.6%) | 0 (0.0%) |
Employment Occupations by Sex in Morrison
Management, Business, Science and Arts Occupations
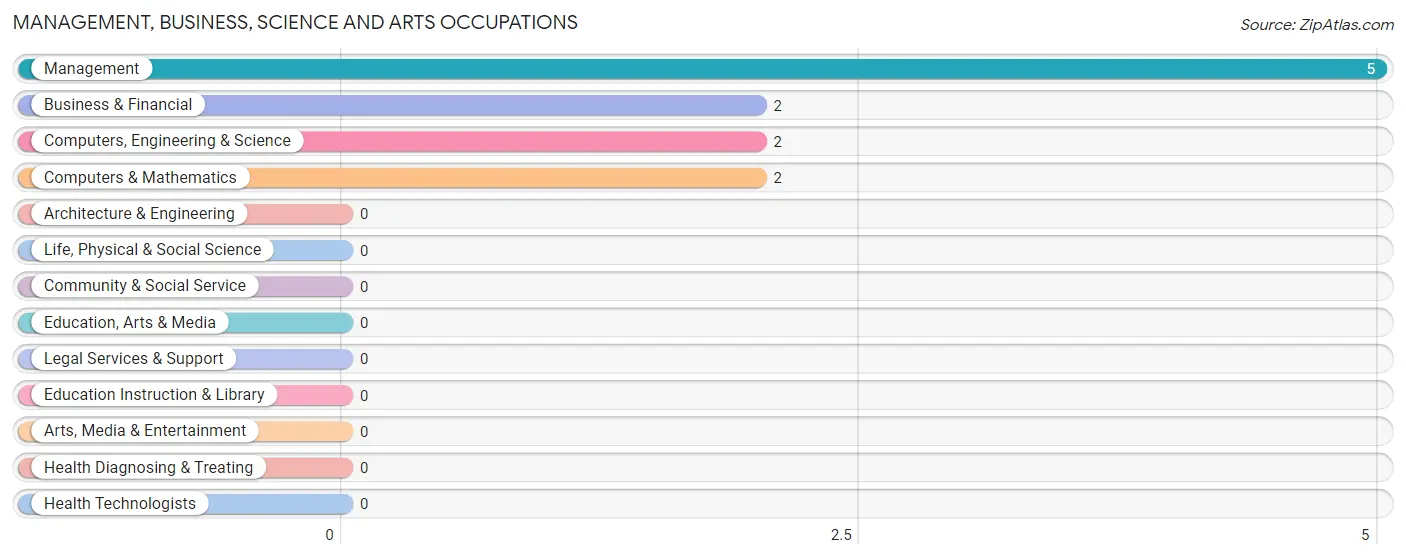
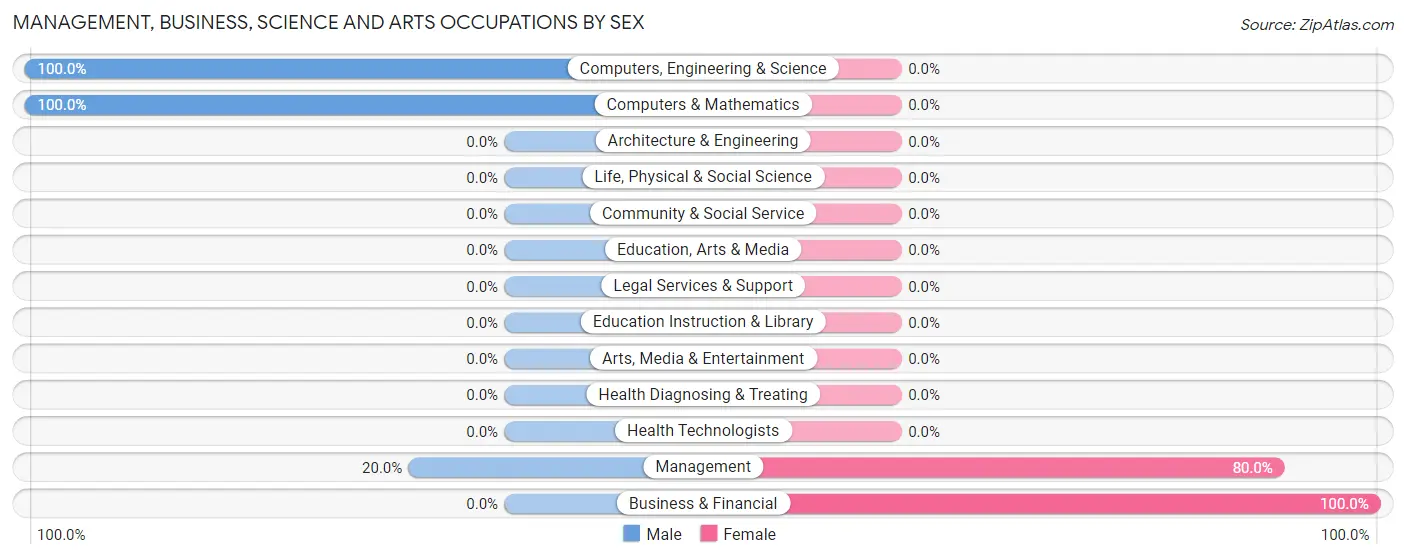
The most common Management, Business, Science and Arts occupations in Morrison are Management (5 | 29.4%), Business & Financial (2 | 11.8%), Computers, Engineering & Science (2 | 11.8%), and Computers & Mathematics (2 | 11.8%).
Management, Business, Science and Arts Occupations by Sex
Within the Management, Business, Science and Arts occupations in Morrison, the most male-oriented occupations are Computers, Engineering & Science (100.0%), Computers & Mathematics (100.0%), and Management (20.0%), while the most female-oriented occupations are Business & Financial (100.0%), and Management (80.0%).
| Occupation | Male | Female |
| Management | 1 (20.0%) | 4 (80.0%) |
| Business & Financial | 0 (0.0%) | 2 (100.0%) |
| Computers, Engineering & Science | 2 (100.0%) | 0 (0.0%) |
| Computers & Mathematics | 2 (100.0%) | 0 (0.0%) |
| Architecture & Engineering | 0 (0.0%) | 0 (0.0%) |
| Life, Physical & Social Science | 0 (0.0%) | 0 (0.0%) |
| Community & Social Service | 0 (0.0%) | 0 (0.0%) |
| Education, Arts & Media | 0 (0.0%) | 0 (0.0%) |
| Legal Services & Support | 0 (0.0%) | 0 (0.0%) |
| Education Instruction & Library | 0 (0.0%) | 0 (0.0%) |
| Arts, Media & Entertainment | 0 (0.0%) | 0 (0.0%) |
| Health Diagnosing & Treating | 0 (0.0%) | 0 (0.0%) |
| Health Technologists | 0 (0.0%) | 0 (0.0%) |
| Total (Category) | 3 (33.3%) | 6 (66.7%) |
| Total (Overall) | 10 (58.8%) | 7 (41.2%) |
Services Occupations
The most common Services occupations in Morrison are , and Cleaning & Maintenance (3 | 17.6%).
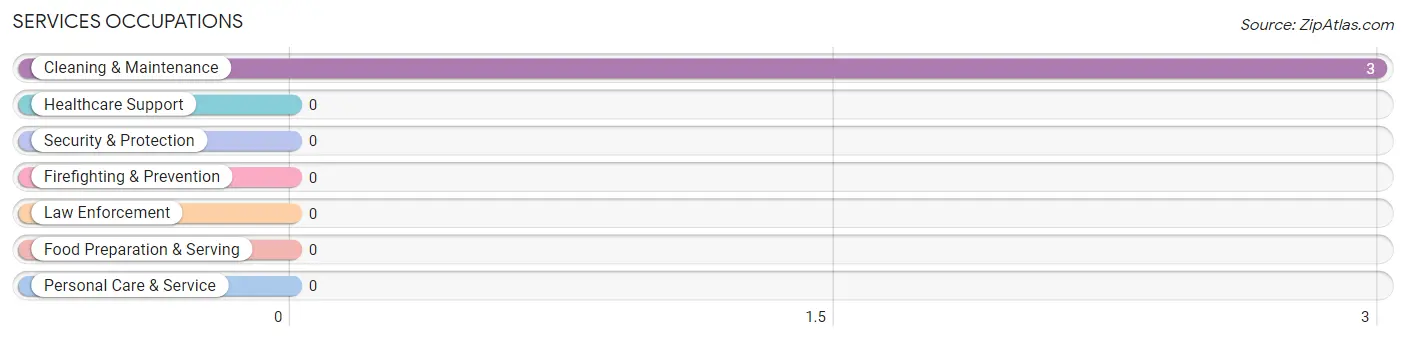
Services Occupations by Sex
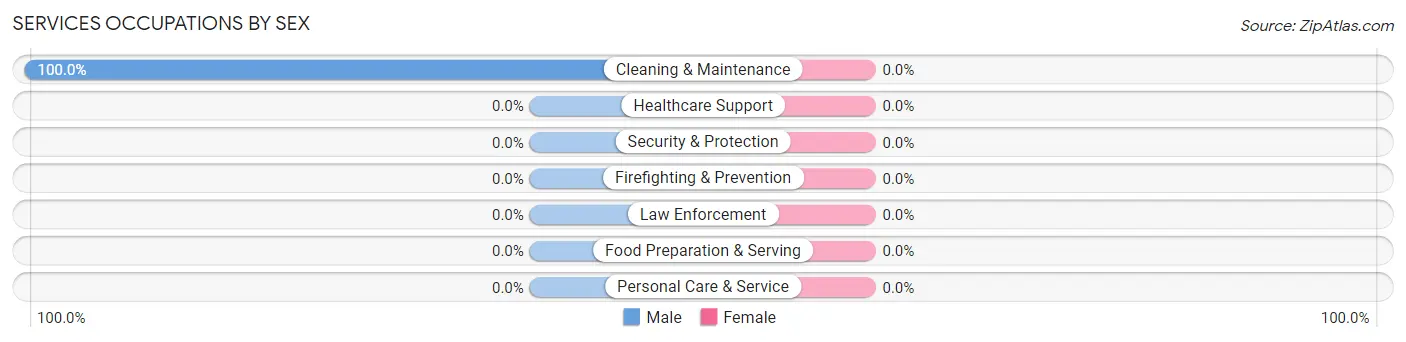
| Occupation | Male | Female |
| Healthcare Support | 0 (0.0%) | 0 (0.0%) |
| Security & Protection | 0 (0.0%) | 0 (0.0%) |
| Firefighting & Prevention | 0 (0.0%) | 0 (0.0%) |
| Law Enforcement | 0 (0.0%) | 0 (0.0%) |
| Food Preparation & Serving | 0 (0.0%) | 0 (0.0%) |
| Cleaning & Maintenance | 3 (100.0%) | 0 (0.0%) |
| Personal Care & Service | 0 (0.0%) | 0 (0.0%) |
| Total (Category) | 3 (100.0%) | 0 (0.0%) |
| Total (Overall) | 10 (58.8%) | 7 (41.2%) |
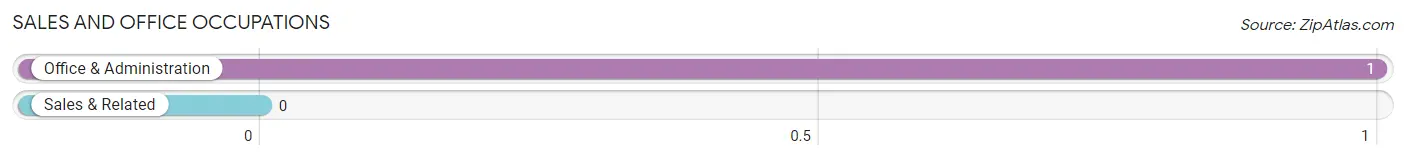
Sales and Office Occupations
The most common Sales and Office occupations in Morrison are , and Office & Administration (1 | 5.9%).
Sales and Office Occupations by Sex
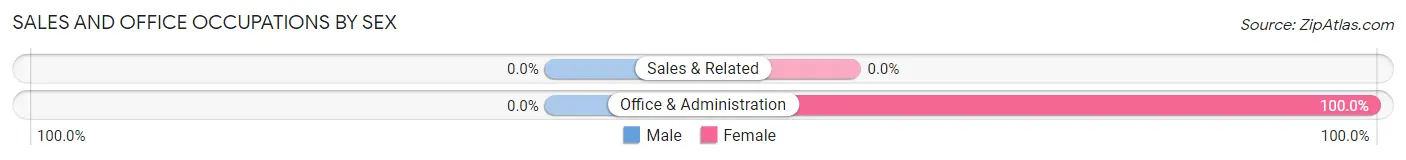
| Occupation | Male | Female |
| Sales & Related | 0 (0.0%) | 0 (0.0%) |
| Office & Administration | 0 (0.0%) | 1 (100.0%) |
| Total (Category) | 0 (0.0%) | 1 (100.0%) |
| Total (Overall) | 10 (58.8%) | 7 (41.2%) |
Natural Resources, Construction and Maintenance Occupations
The most common Natural Resources, Construction and Maintenance occupations in Morrison are Construction & Extraction (2 | 11.8%), and Installation, Maintenance & Repair (2 | 11.8%).
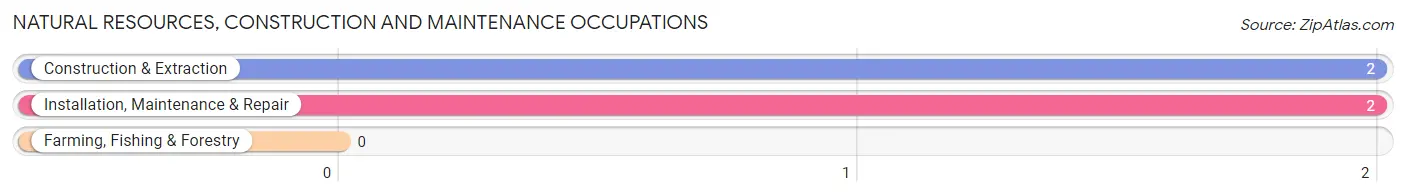
Natural Resources, Construction and Maintenance Occupations by Sex
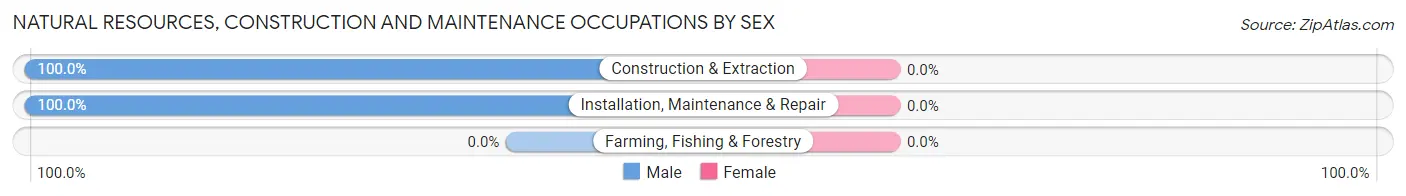
| Occupation | Male | Female |
| Farming, Fishing & Forestry | 0 (0.0%) | 0 (0.0%) |
| Construction & Extraction | 2 (100.0%) | 0 (0.0%) |
| Installation, Maintenance & Repair | 2 (100.0%) | 0 (0.0%) |
| Total (Category) | 4 (100.0%) | 0 (0.0%) |
| Total (Overall) | 10 (58.8%) | 7 (41.2%) |
Production, Transportation and Moving Occupations
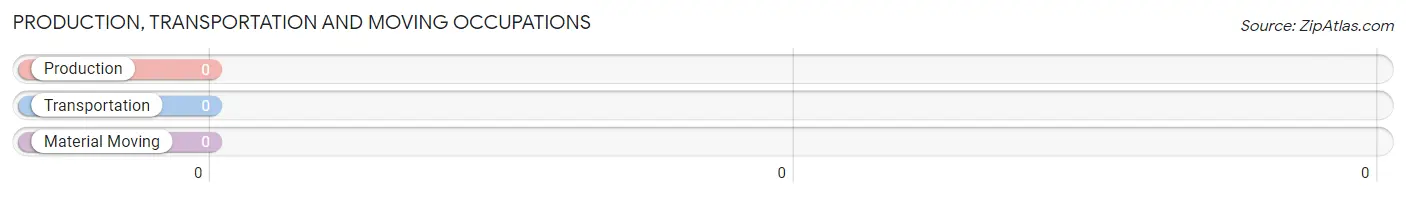
Production, Transportation and Moving Occupations by Sex
| Occupation | Male | Female |
| Production | 0 (0.0%) | 0 (0.0%) |
| Transportation | 0 (0.0%) | 0 (0.0%) |
| Material Moving | 0 (0.0%) | 0 (0.0%) |
| Total (Category) | 0 (0.0%) | 0 (0.0%) |
| Total (Overall) | 10 (58.8%) | 7 (41.2%) |
Employment Industries by Sex in Morrison
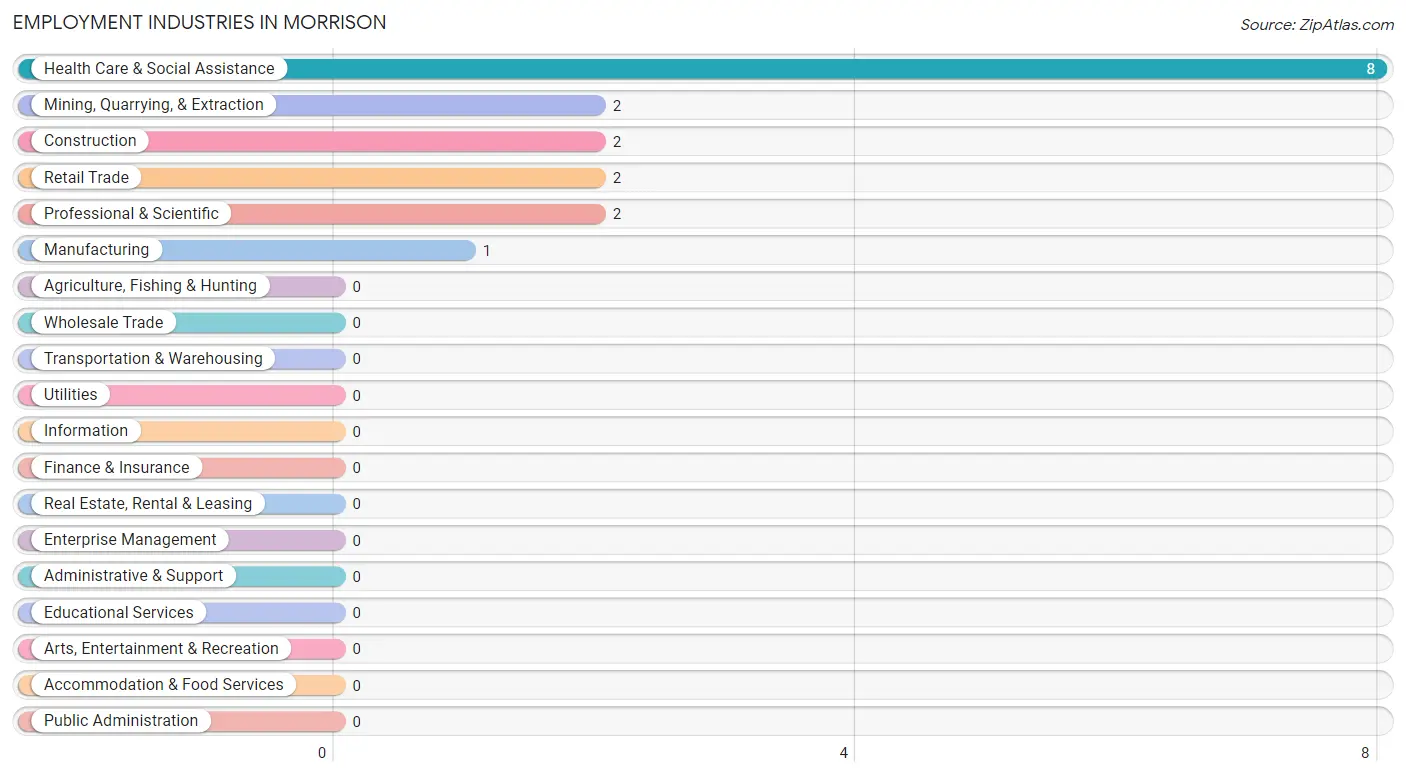
Employment Industries in Morrison
The major employment industries in Morrison include Health Care & Social Assistance (8 | 47.1%), Mining, Quarrying, & Extraction (2 | 11.8%), Construction (2 | 11.8%), Retail Trade (2 | 11.8%), and Professional & Scientific (2 | 11.8%).
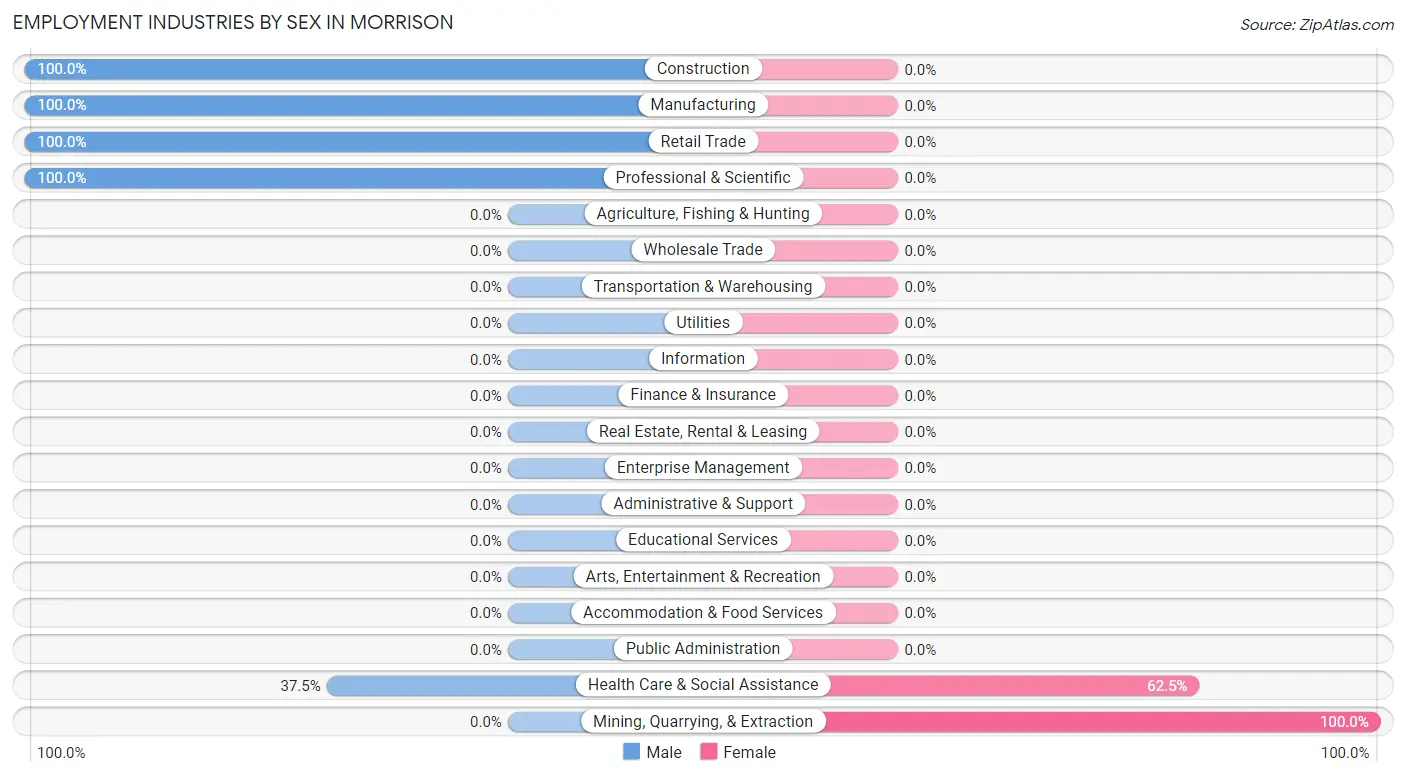
Employment Industries by Sex in Morrison
The Morrison industries that see more men than women are Construction (100.0%), Manufacturing (100.0%), and Retail Trade (100.0%), whereas the industries that tend to have a higher number of women are Mining, Quarrying, & Extraction (100.0%), and Health Care & Social Assistance (62.5%).
| Industry | Male | Female |
| Agriculture, Fishing & Hunting | 0 (0.0%) | 0 (0.0%) |
| Mining, Quarrying, & Extraction | 0 (0.0%) | 2 (100.0%) |
| Construction | 2 (100.0%) | 0 (0.0%) |
| Manufacturing | 1 (100.0%) | 0 (0.0%) |
| Wholesale Trade | 0 (0.0%) | 0 (0.0%) |
| Retail Trade | 2 (100.0%) | 0 (0.0%) |
| Transportation & Warehousing | 0 (0.0%) | 0 (0.0%) |
| Utilities | 0 (0.0%) | 0 (0.0%) |
| Information | 0 (0.0%) | 0 (0.0%) |
| Finance & Insurance | 0 (0.0%) | 0 (0.0%) |
| Real Estate, Rental & Leasing | 0 (0.0%) | 0 (0.0%) |
| Professional & Scientific | 2 (100.0%) | 0 (0.0%) |
| Enterprise Management | 0 (0.0%) | 0 (0.0%) |
| Administrative & Support | 0 (0.0%) | 0 (0.0%) |
| Educational Services | 0 (0.0%) | 0 (0.0%) |
| Health Care & Social Assistance | 3 (37.5%) | 5 (62.5%) |
| Arts, Entertainment & Recreation | 0 (0.0%) | 0 (0.0%) |
| Accommodation & Food Services | 0 (0.0%) | 0 (0.0%) |
| Public Administration | 0 (0.0%) | 0 (0.0%) |
| Total | 10 (58.8%) | 7 (41.2%) |
Education in Morrison
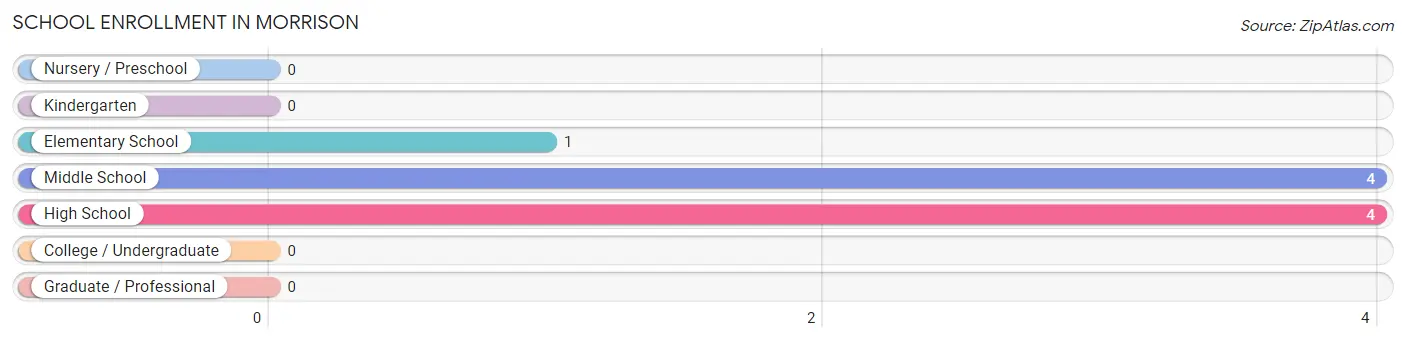
School Enrollment in Morrison
The most common levels of schooling among the 9 students in Morrison are middle school (4 | 44.4%), high school (4 | 44.4%), and elementary school (1 | 11.1%).
| School Level | # Students | % Students |
| Nursery / Preschool | 0 | 0.0% |
| Kindergarten | 0 | 0.0% |
| Elementary School | 1 | 11.1% |
| Middle School | 4 | 44.4% |
| High School | 4 | 44.4% |
| College / Undergraduate | 0 | 0.0% |
| Graduate / Professional | 0 | 0.0% |
| Total | 9 | 100.0% |
School Enrollment by Age by Funding Source in Morrison
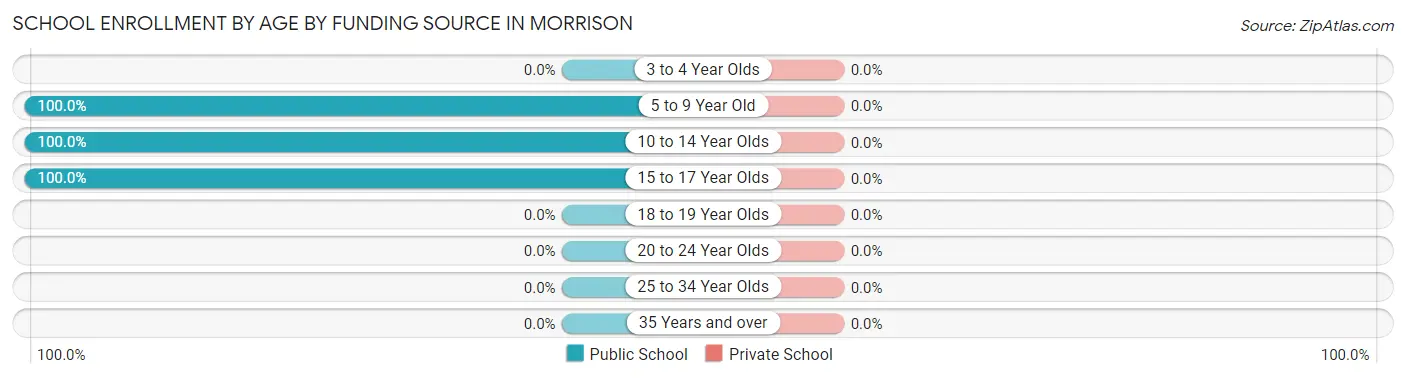
| Age Bracket | Public School | Private School |
| 3 to 4 Year Olds | 0 (0.0%) | 0 (0.0%) |
| 5 to 9 Year Old | 1 (100.0%) | 0 (0.0%) |
| 10 to 14 Year Olds | 4 (100.0%) | 0 (0.0%) |
| 15 to 17 Year Olds | 4 (100.0%) | 0 (0.0%) |
| 18 to 19 Year Olds | 0 (0.0%) | 0 (0.0%) |
| 20 to 24 Year Olds | 0 (0.0%) | 0 (0.0%) |
| 25 to 34 Year Olds | 0 (0.0%) | 0 (0.0%) |
| 35 Years and over | 0 (0.0%) | 0 (0.0%) |
| Total | 9 (100.0%) | 0 (0.0%) |
Educational Attainment by Field of Study in Morrison
Bio, nature & agricultural (2 | 33.3%), physical & health sciences (2 | 33.3%), and business (2 | 33.3%) are the most common fields of study among 6 individuals in Morrison who have obtained a bachelor's degree or higher.
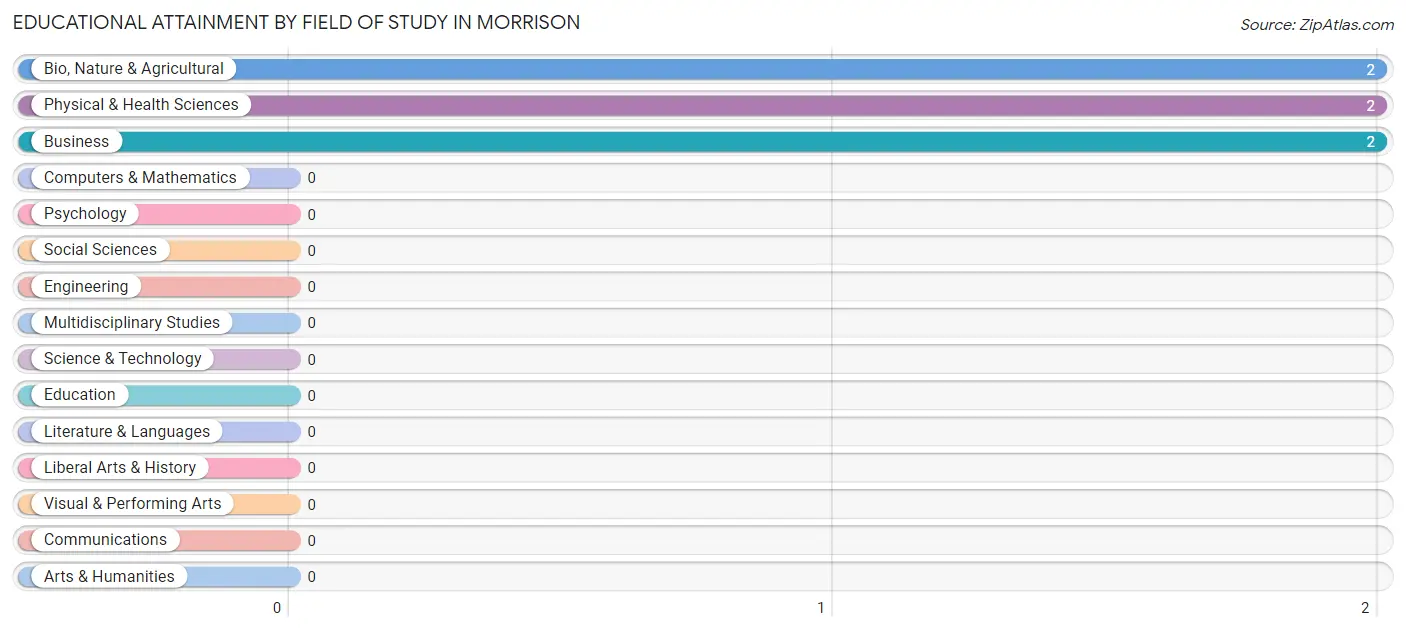
| Field of Study | # Graduates | % Graduates |
| Computers & Mathematics | 0 | 0.0% |
| Bio, Nature & Agricultural | 2 | 33.3% |
| Physical & Health Sciences | 2 | 33.3% |
| Psychology | 0 | 0.0% |
| Social Sciences | 0 | 0.0% |
| Engineering | 0 | 0.0% |
| Multidisciplinary Studies | 0 | 0.0% |
| Science & Technology | 0 | 0.0% |
| Business | 2 | 33.3% |
| Education | 0 | 0.0% |
| Literature & Languages | 0 | 0.0% |
| Liberal Arts & History | 0 | 0.0% |
| Visual & Performing Arts | 0 | 0.0% |
| Communications | 0 | 0.0% |
| Arts & Humanities | 0 | 0.0% |
| Total | 6 | 100.0% |
Transportation & Commute in Morrison
Vehicle Availability by Sex in Morrison
The most prevalent vehicle ownership categories in Morrison are males with 2 vehicles (4, accounting for 40.0%) and females with 2 vehicles (3, making up 57.1%).
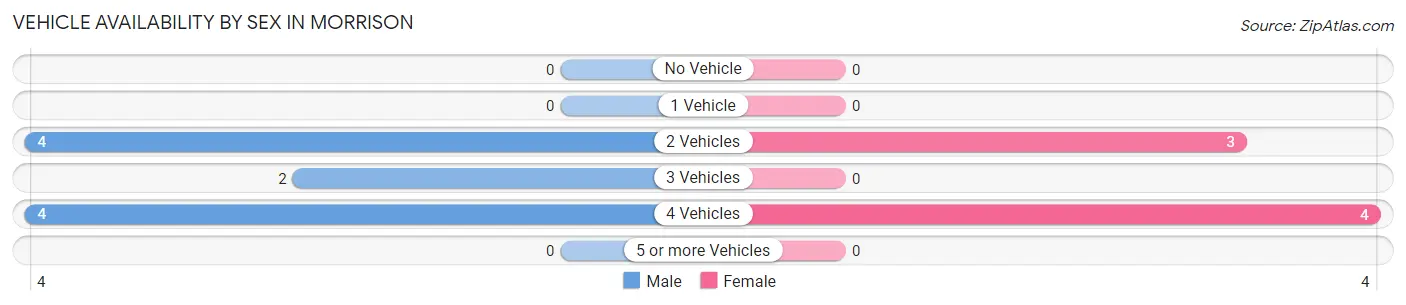
| Vehicles Available | Male | Female |
| No Vehicle | 0 (0.0%) | 0 (0.0%) |
| 1 Vehicle | 0 (0.0%) | 0 (0.0%) |
| 2 Vehicles | 4 (40.0%) | 3 (42.9%) |
| 3 Vehicles | 2 (20.0%) | 0 (0.0%) |
| 4 Vehicles | 4 (40.0%) | 4 (57.1%) |
| 5 or more Vehicles | 0 (0.0%) | 0 (0.0%) |
| Total | 10 (100.0%) | 7 (100.0%) |
Commute Time in Morrison
The most frequently occuring commute durations in Morrison are 60 to 89 minutes (6 commuters, 35.3%), 90 or more minutes (5 commuters, 29.4%), and 30 to 34 minutes (3 commuters, 17.6%).
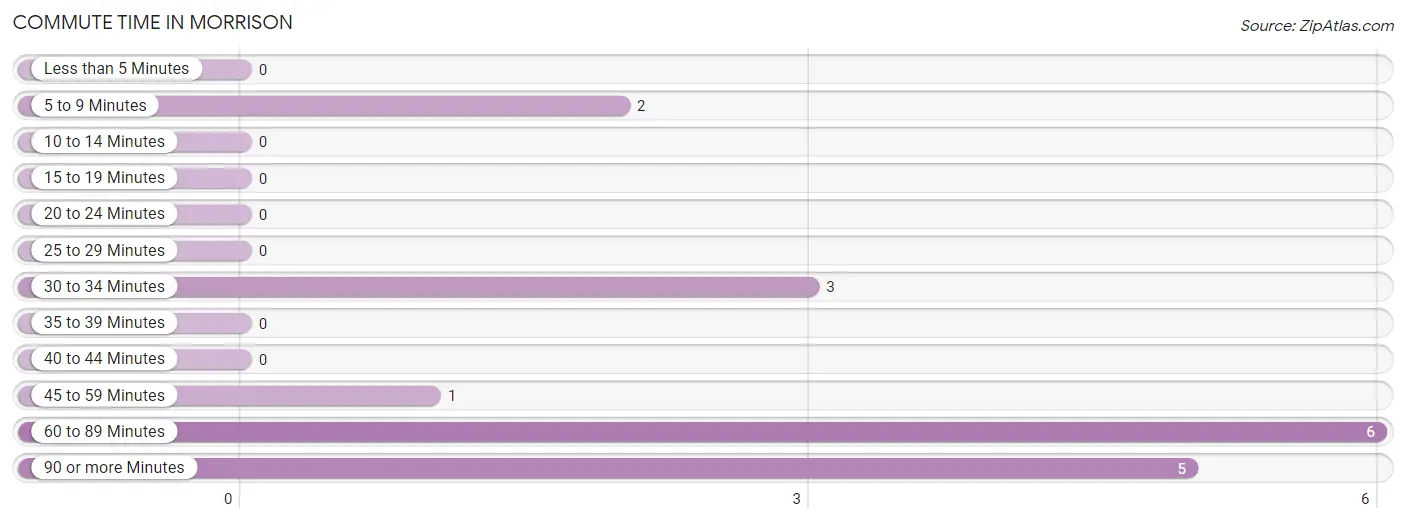
| Commute Time | # Commuters | % Commuters |
| Less than 5 Minutes | 0 | 0.0% |
| 5 to 9 Minutes | 2 | 11.8% |
| 10 to 14 Minutes | 0 | 0.0% |
| 15 to 19 Minutes | 0 | 0.0% |
| 20 to 24 Minutes | 0 | 0.0% |
| 25 to 29 Minutes | 0 | 0.0% |
| 30 to 34 Minutes | 3 | 17.6% |
| 35 to 39 Minutes | 0 | 0.0% |
| 40 to 44 Minutes | 0 | 0.0% |
| 45 to 59 Minutes | 1 | 5.9% |
| 60 to 89 Minutes | 6 | 35.3% |
| 90 or more Minutes | 5 | 29.4% |
Commute Time by Sex in Morrison
The most common commute times in Morrison are 90 or more minutes (5 commuters, 50.0%) for males and 60 to 89 minutes (6 commuters, 85.7%) for females.
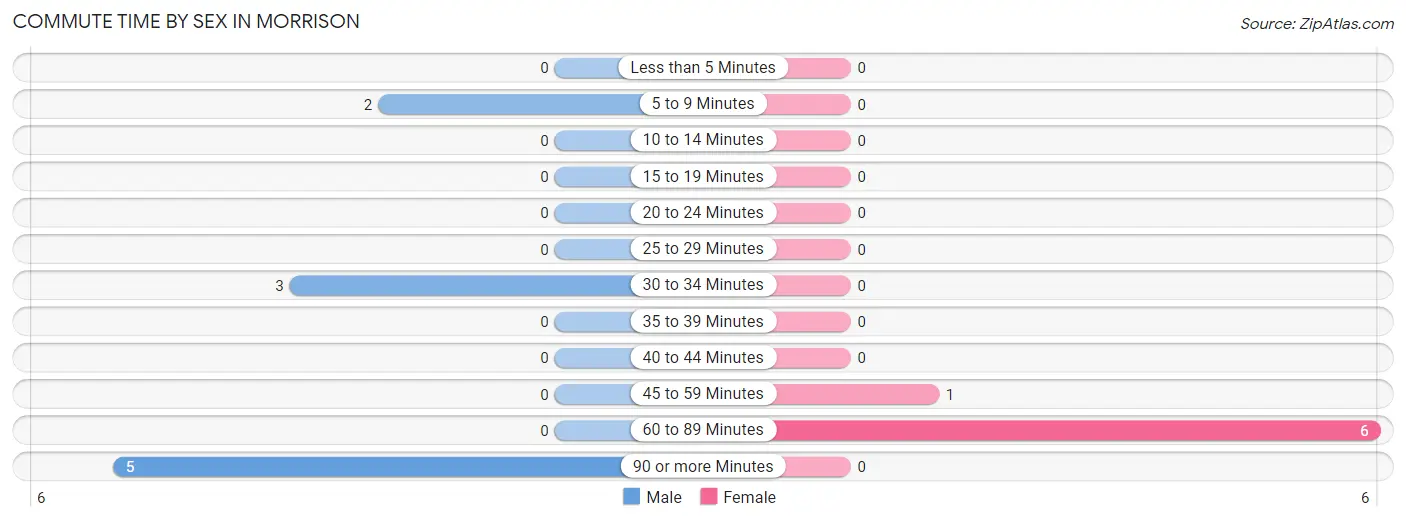
| Commute Time | Male | Female |
| Less than 5 Minutes | 0 (0.0%) | 0 (0.0%) |
| 5 to 9 Minutes | 2 (20.0%) | 0 (0.0%) |
| 10 to 14 Minutes | 0 (0.0%) | 0 (0.0%) |
| 15 to 19 Minutes | 0 (0.0%) | 0 (0.0%) |
| 20 to 24 Minutes | 0 (0.0%) | 0 (0.0%) |
| 25 to 29 Minutes | 0 (0.0%) | 0 (0.0%) |
| 30 to 34 Minutes | 3 (30.0%) | 0 (0.0%) |
| 35 to 39 Minutes | 0 (0.0%) | 0 (0.0%) |
| 40 to 44 Minutes | 0 (0.0%) | 0 (0.0%) |
| 45 to 59 Minutes | 0 (0.0%) | 1 (14.3%) |
| 60 to 89 Minutes | 0 (0.0%) | 6 (85.7%) |
| 90 or more Minutes | 5 (50.0%) | 0 (0.0%) |
Time of Departure to Work by Sex in Morrison
The most frequent times of departure to work in Morrison are 7:30 AM to 7:59 AM (5, 50.0%) for males and 12:00 AM to 4:59 AM (4, 57.1%) for females.
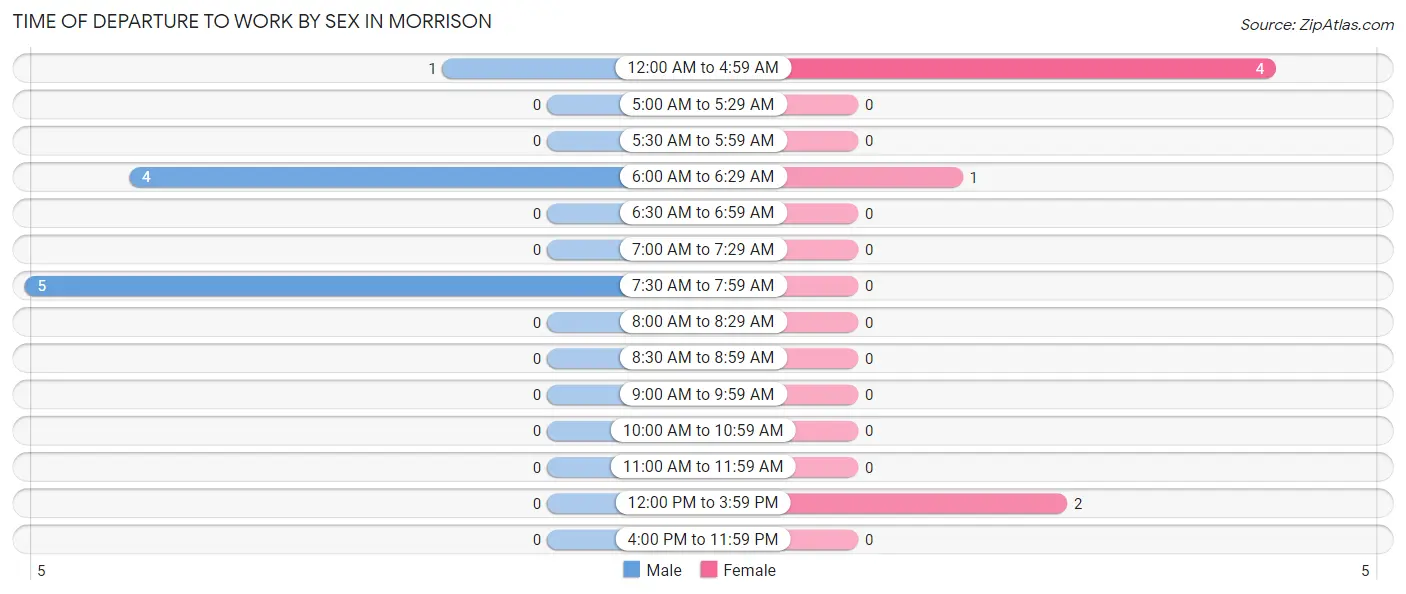
| Time of Departure | Male | Female |
| 12:00 AM to 4:59 AM | 1 (10.0%) | 4 (57.1%) |
| 5:00 AM to 5:29 AM | 0 (0.0%) | 0 (0.0%) |
| 5:30 AM to 5:59 AM | 0 (0.0%) | 0 (0.0%) |
| 6:00 AM to 6:29 AM | 4 (40.0%) | 1 (14.3%) |
| 6:30 AM to 6:59 AM | 0 (0.0%) | 0 (0.0%) |
| 7:00 AM to 7:29 AM | 0 (0.0%) | 0 (0.0%) |
| 7:30 AM to 7:59 AM | 5 (50.0%) | 0 (0.0%) |
| 8:00 AM to 8:29 AM | 0 (0.0%) | 0 (0.0%) |
| 8:30 AM to 8:59 AM | 0 (0.0%) | 0 (0.0%) |
| 9:00 AM to 9:59 AM | 0 (0.0%) | 0 (0.0%) |
| 10:00 AM to 10:59 AM | 0 (0.0%) | 0 (0.0%) |
| 11:00 AM to 11:59 AM | 0 (0.0%) | 0 (0.0%) |
| 12:00 PM to 3:59 PM | 0 (0.0%) | 2 (28.6%) |
| 4:00 PM to 11:59 PM | 0 (0.0%) | 0 (0.0%) |
| Total | 10 (100.0%) | 7 (100.0%) |
Housing Occupancy in Morrison
Occupancy by Ownership in Morrison
Of the total 27 dwellings in Morrison, owner-occupied units account for 27 (100.0%), while renter-occupied units make up 0 (0.0%).
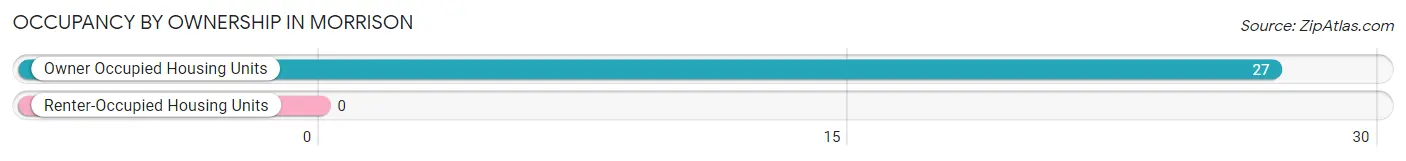
| Occupancy | # Housing Units | % Housing Units |
| Owner Occupied Housing Units | 27 | 100.0% |
| Renter-Occupied Housing Units | 0 | 0.0% |
| Total Occupied Housing Units | 27 | 100.0% |
Occupancy by Household Size in Morrison
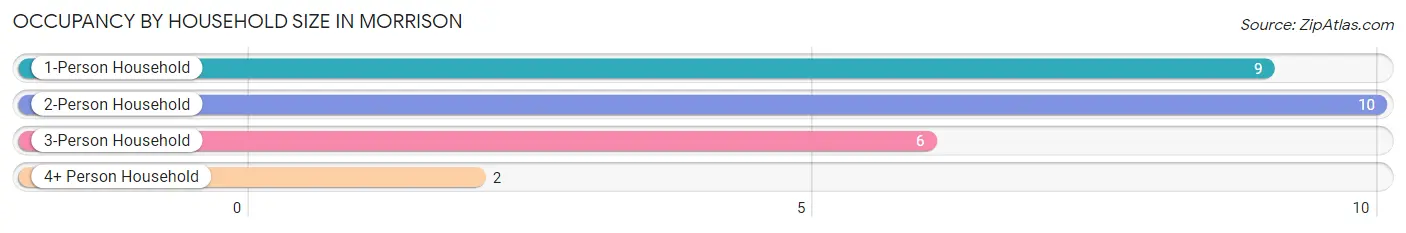
| Household Size | # Housing Units | % Housing Units |
| 1-Person Household | 9 | 33.3% |
| 2-Person Household | 10 | 37.0% |
| 3-Person Household | 6 | 22.2% |
| 4+ Person Household | 2 | 7.4% |
| Total Housing Units | 27 | 100.0% |
Occupancy by Ownership by Household Size in Morrison
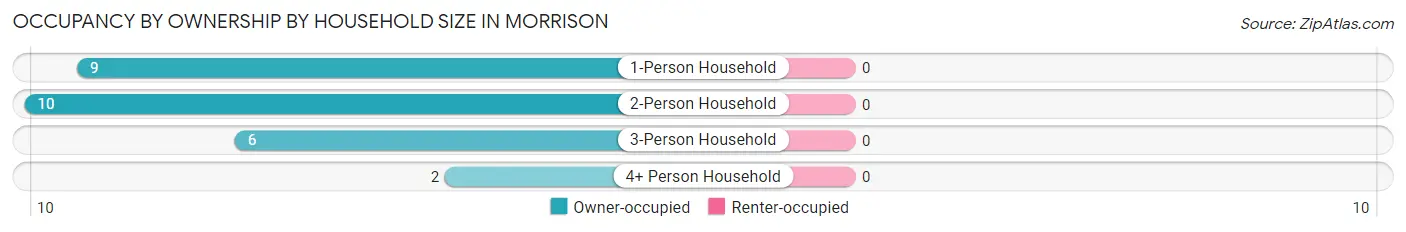
| Household Size | Owner-occupied | Renter-occupied |
| 1-Person Household | 9 (100.0%) | 0 (0.0%) |
| 2-Person Household | 10 (100.0%) | 0 (0.0%) |
| 3-Person Household | 6 (100.0%) | 0 (0.0%) |
| 4+ Person Household | 2 (100.0%) | 0 (0.0%) |
| Total Housing Units | 27 (100.0%) | 0 (0.0%) |
Occupancy by Educational Attainment in Morrison
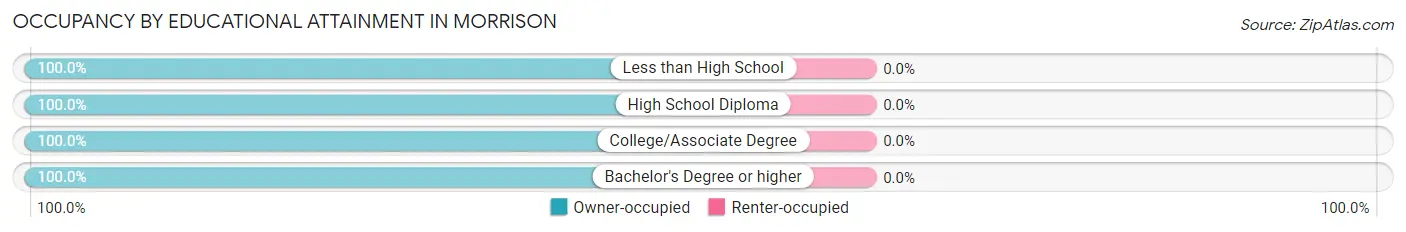
| Household Size | Owner-occupied | Renter-occupied |
| Less than High School | 4 (100.0%) | 0 (0.0%) |
| High School Diploma | 14 (100.0%) | 0 (0.0%) |
| College/Associate Degree | 5 (100.0%) | 0 (0.0%) |
| Bachelor's Degree or higher | 4 (100.0%) | 0 (0.0%) |
Occupancy by Age of Householder in Morrison
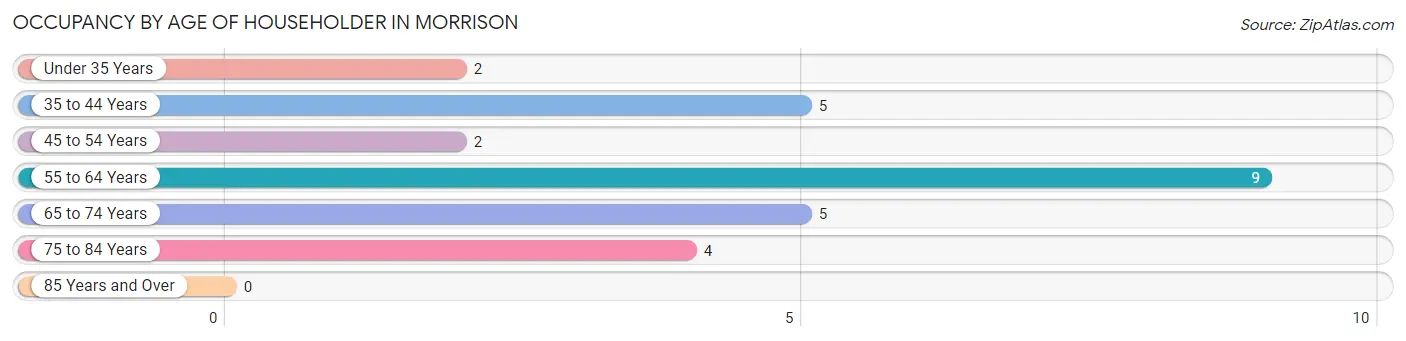
| Age Bracket | # Households | % Households |
| Under 35 Years | 2 | 7.4% |
| 35 to 44 Years | 5 | 18.5% |
| 45 to 54 Years | 2 | 7.4% |
| 55 to 64 Years | 9 | 33.3% |
| 65 to 74 Years | 5 | 18.5% |
| 75 to 84 Years | 4 | 14.8% |
| 85 Years and Over | 0 | 0.0% |
| Total | 27 | 100.0% |
Housing Finances in Morrison
Median Income by Occupancy in Morrison
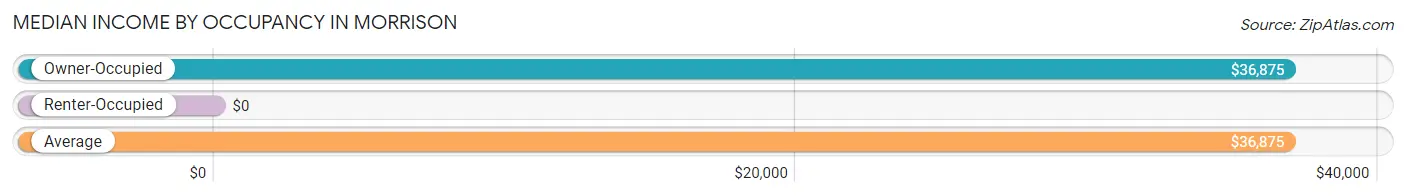
| Occupancy Type | # Households | Median Income |
| Owner-Occupied | 27 (100.0%) | $36,875 |
| Renter-Occupied | 0 (0.0%) | $0 |
| Average | 27 (100.0%) | $36,875 |
Occupancy by Householder Income Bracket in Morrison
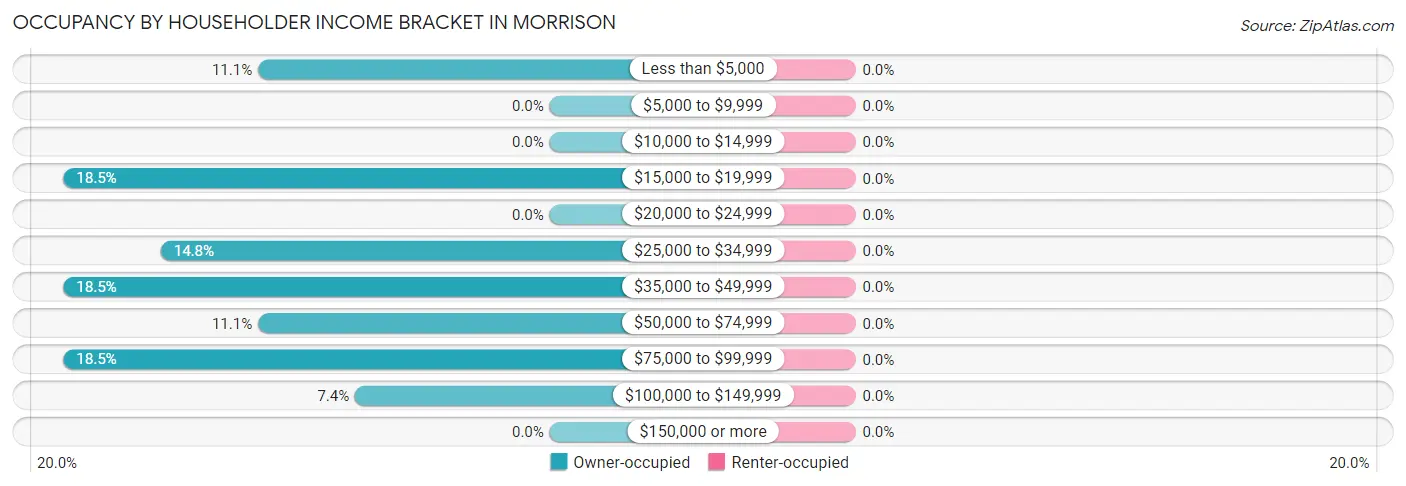
| Income Bracket | Owner-occupied | Renter-occupied |
| Less than $5,000 | 3 (11.1%) | 0 (0.0%) |
| $5,000 to $9,999 | 0 (0.0%) | 0 (0.0%) |
| $10,000 to $14,999 | 0 (0.0%) | 0 (0.0%) |
| $15,000 to $19,999 | 5 (18.5%) | 0 (0.0%) |
| $20,000 to $24,999 | 0 (0.0%) | 0 (0.0%) |
| $25,000 to $34,999 | 4 (14.8%) | 0 (0.0%) |
| $35,000 to $49,999 | 5 (18.5%) | 0 (0.0%) |
| $50,000 to $74,999 | 3 (11.1%) | 0 (0.0%) |
| $75,000 to $99,999 | 5 (18.5%) | 0 (0.0%) |
| $100,000 to $149,999 | 2 (7.4%) | 0 (0.0%) |
| $150,000 or more | 0 (0.0%) | 0 (0.0%) |
| Total | 27 (100.0%) | 0 (0.0%) |
Monthly Housing Cost Tiers in Morrison
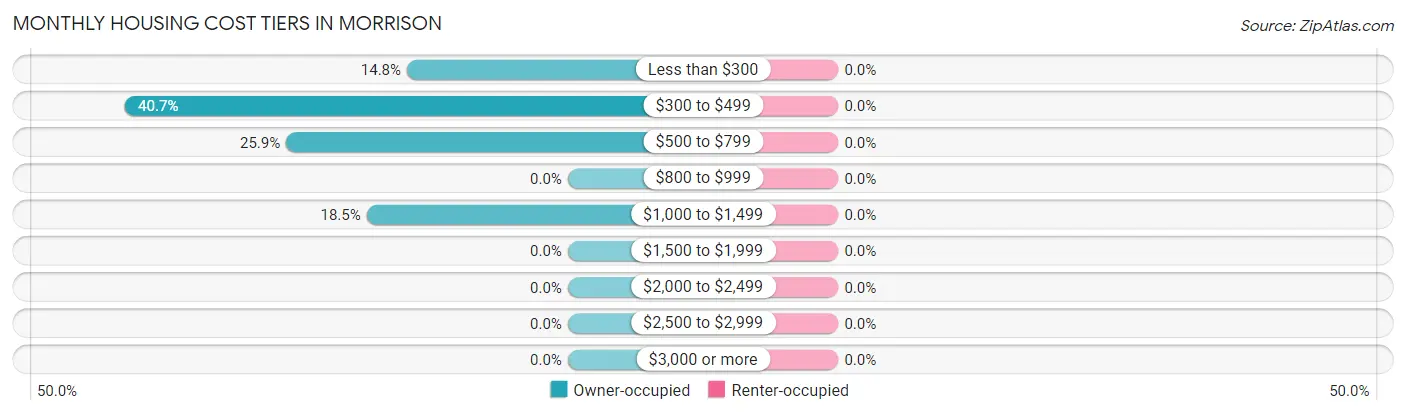
| Monthly Cost | Owner-occupied | Renter-occupied |
| Less than $300 | 4 (14.8%) | 0 (0.0%) |
| $300 to $499 | 11 (40.7%) | 0 (0.0%) |
| $500 to $799 | 7 (25.9%) | 0 (0.0%) |
| $800 to $999 | 0 (0.0%) | 0 (0.0%) |
| $1,000 to $1,499 | 5 (18.5%) | 0 (0.0%) |
| $1,500 to $1,999 | 0 (0.0%) | 0 (0.0%) |
| $2,000 to $2,499 | 0 (0.0%) | 0 (0.0%) |
| $2,500 to $2,999 | 0 (0.0%) | 0 (0.0%) |
| $3,000 or more | 0 (0.0%) | 0 (0.0%) |
| Total | 27 (100.0%) | 0 (0.0%) |
Physical Housing Characteristics in Morrison
Housing Structures in Morrison
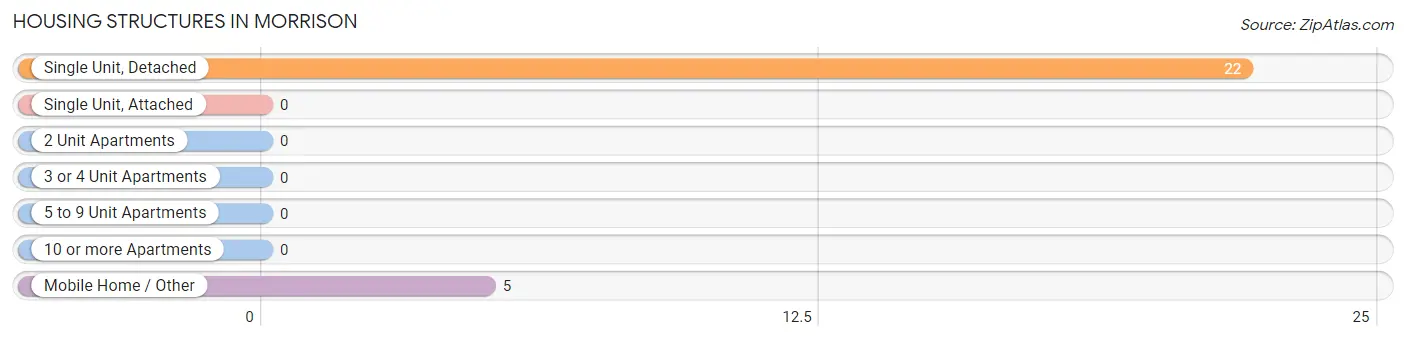
| Structure Type | # Housing Units | % Housing Units |
| Single Unit, Detached | 22 | 81.5% |
| Single Unit, Attached | 0 | 0.0% |
| 2 Unit Apartments | 0 | 0.0% |
| 3 or 4 Unit Apartments | 0 | 0.0% |
| 5 to 9 Unit Apartments | 0 | 0.0% |
| 10 or more Apartments | 0 | 0.0% |
| Mobile Home / Other | 5 | 18.5% |
| Total | 27 | 100.0% |
Housing Structures by Occupancy in Morrison
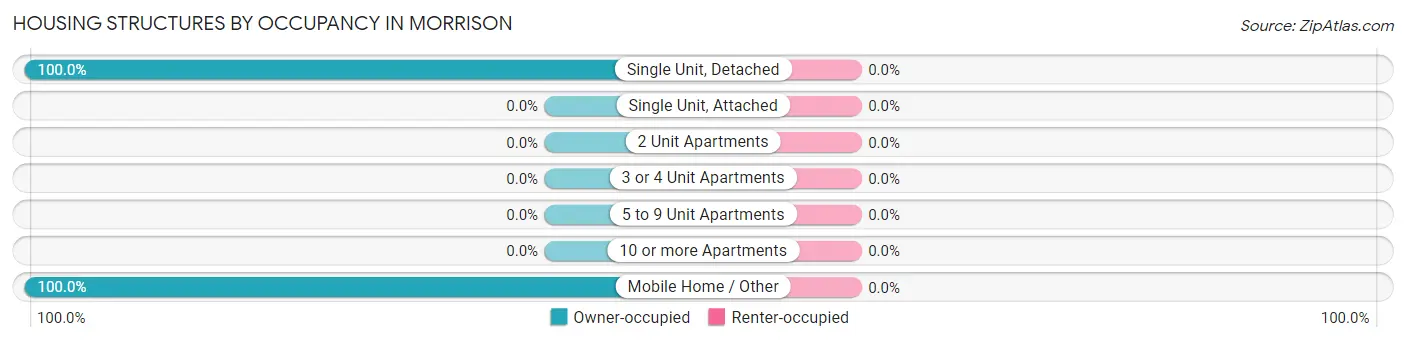
| Structure Type | Owner-occupied | Renter-occupied |
| Single Unit, Detached | 22 (100.0%) | 0 (0.0%) |
| Single Unit, Attached | 0 (0.0%) | 0 (0.0%) |
| 2 Unit Apartments | 0 (0.0%) | 0 (0.0%) |
| 3 or 4 Unit Apartments | 0 (0.0%) | 0 (0.0%) |
| 5 to 9 Unit Apartments | 0 (0.0%) | 0 (0.0%) |
| 10 or more Apartments | 0 (0.0%) | 0 (0.0%) |
| Mobile Home / Other | 5 (100.0%) | 0 (0.0%) |
| Total | 27 (100.0%) | 0 (0.0%) |
Housing Structures by Number of Rooms in Morrison
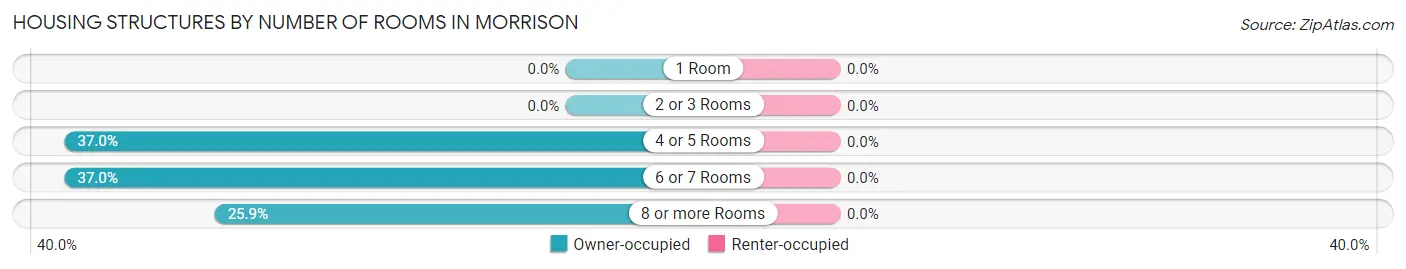
| Number of Rooms | Owner-occupied | Renter-occupied |
| 1 Room | 0 (0.0%) | 0 (0.0%) |
| 2 or 3 Rooms | 0 (0.0%) | 0 (0.0%) |
| 4 or 5 Rooms | 10 (37.0%) | 0 (0.0%) |
| 6 or 7 Rooms | 10 (37.0%) | 0 (0.0%) |
| 8 or more Rooms | 7 (25.9%) | 0 (0.0%) |
| Total | 27 (100.0%) | 0 (0.0%) |
Housing Structure by Heating Type in Morrison
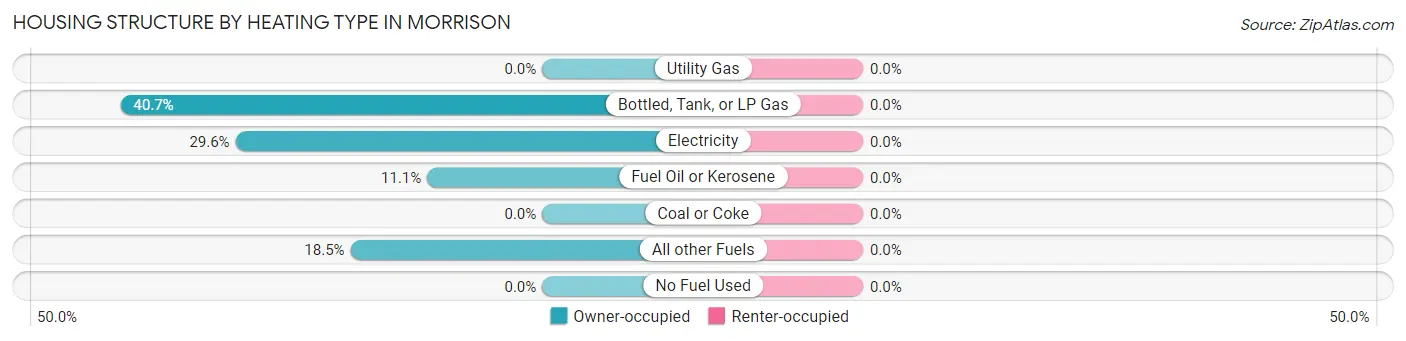
| Heating Type | Owner-occupied | Renter-occupied |
| Utility Gas | 0 (0.0%) | 0 (0.0%) |
| Bottled, Tank, or LP Gas | 11 (40.7%) | 0 (0.0%) |
| Electricity | 8 (29.6%) | 0 (0.0%) |
| Fuel Oil or Kerosene | 3 (11.1%) | 0 (0.0%) |
| Coal or Coke | 0 (0.0%) | 0 (0.0%) |
| All other Fuels | 5 (18.5%) | 0 (0.0%) |
| No Fuel Used | 0 (0.0%) | 0 (0.0%) |
| Total | 27 (100.0%) | 0 (0.0%) |
Household Vehicle Usage in Morrison
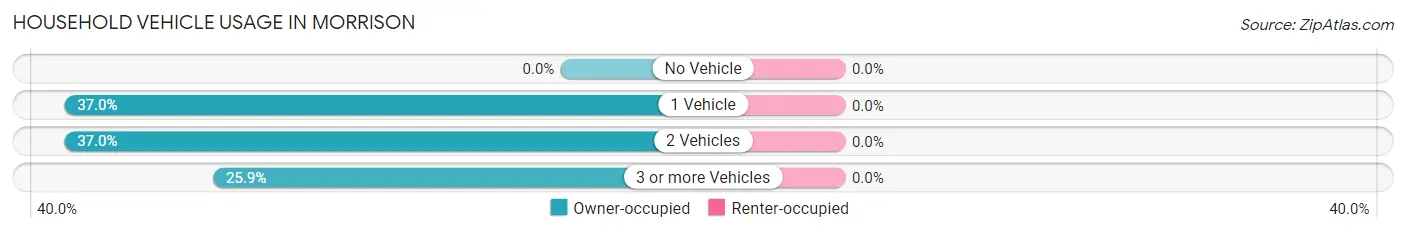
| Vehicles per Household | Owner-occupied | Renter-occupied |
| No Vehicle | 0 (0.0%) | 0 (0.0%) |
| 1 Vehicle | 10 (37.0%) | 0 (0.0%) |
| 2 Vehicles | 10 (37.0%) | 0 (0.0%) |
| 3 or more Vehicles | 7 (25.9%) | 0 (0.0%) |
| Total | 27 (100.0%) | 0 (0.0%) |
Real Estate & Mortgages in Morrison
Real Estate and Mortgage Overview in Morrison
| Characteristic | Without Mortgage | With Mortgage |
| Housing Units | 21 | 6 |
| Median Property Value | $53,800 | $135,000 |
| Median Household Income | $34,375 | $0 |
| Monthly Housing Costs | $379 | $0 |
| Real Estate Taxes | $400 | $0 |
Property Value by Mortgage Status in Morrison
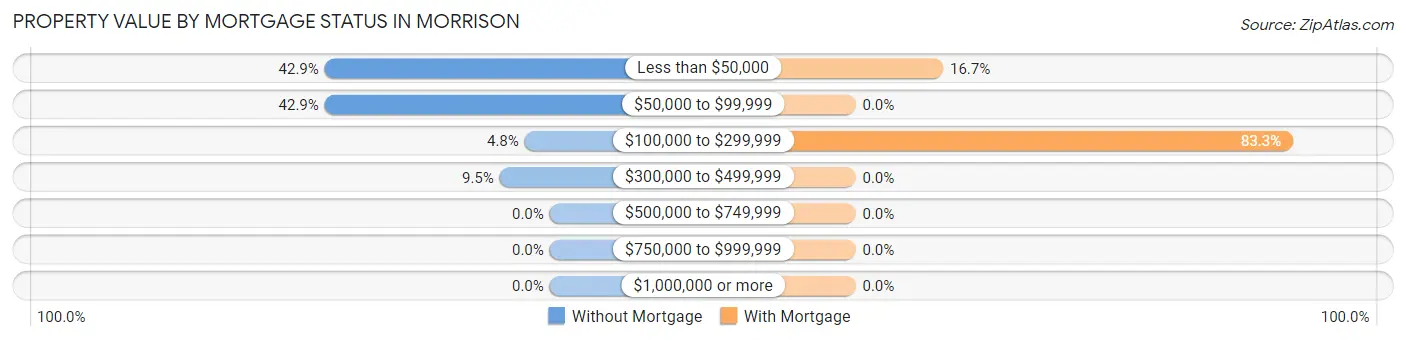
| Property Value | Without Mortgage | With Mortgage |
| Less than $50,000 | 9 (42.9%) | 1 (16.7%) |
| $50,000 to $99,999 | 9 (42.9%) | 0 (0.0%) |
| $100,000 to $299,999 | 1 (4.8%) | 5 (83.3%) |
| $300,000 to $499,999 | 2 (9.5%) | 0 (0.0%) |
| $500,000 to $749,999 | 0 (0.0%) | 0 (0.0%) |
| $750,000 to $999,999 | 0 (0.0%) | 0 (0.0%) |
| $1,000,000 or more | 0 (0.0%) | 0 (0.0%) |
| Total | 21 (100.0%) | 6 (100.0%) |
Household Income by Mortgage Status in Morrison
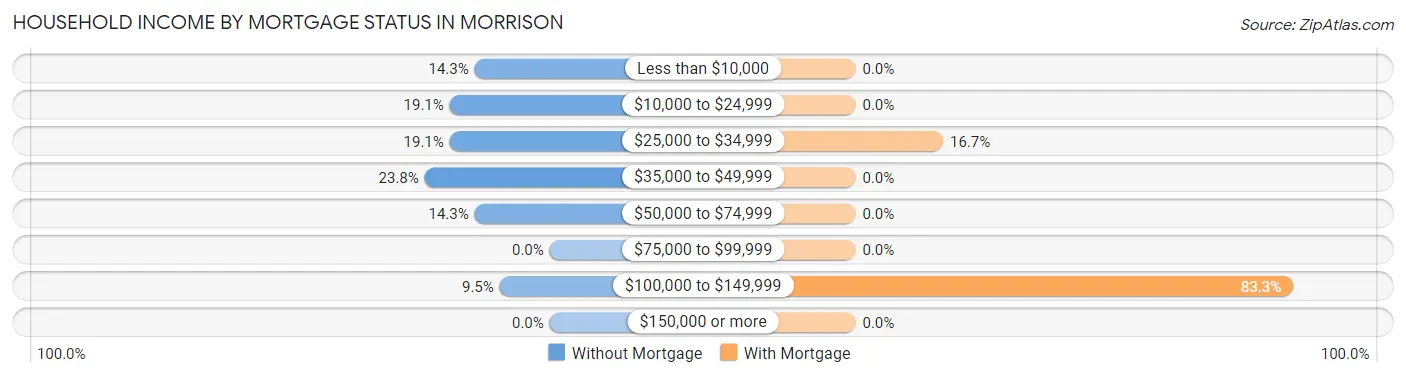
| Household Income | Without Mortgage | With Mortgage |
| Less than $10,000 | 3 (14.3%) | 0 (0.0%) |
| $10,000 to $24,999 | 4 (19.1%) | 0 (0.0%) |
| $25,000 to $34,999 | 4 (19.1%) | 1 (16.7%) |
| $35,000 to $49,999 | 5 (23.8%) | 0 (0.0%) |
| $50,000 to $74,999 | 3 (14.3%) | 0 (0.0%) |
| $75,000 to $99,999 | 0 (0.0%) | 0 (0.0%) |
| $100,000 to $149,999 | 2 (9.5%) | 5 (83.3%) |
| $150,000 or more | 0 (0.0%) | 0 (0.0%) |
| Total | 21 (100.0%) | 6 (100.0%) |
Property Value to Household Income Ratio in Morrison
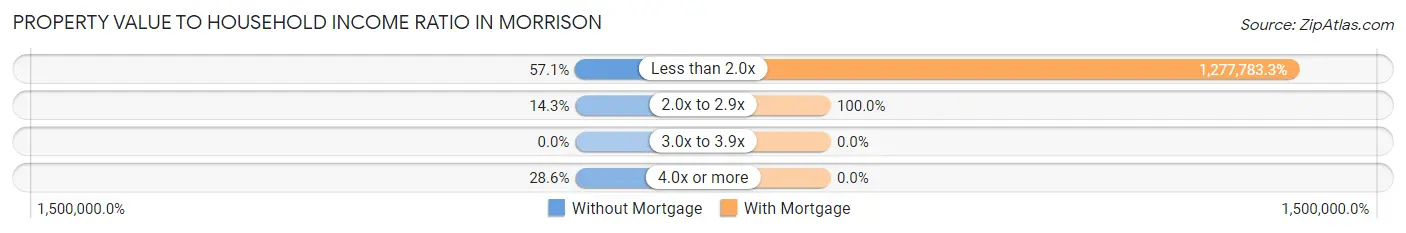
| Value-to-Income Ratio | Without Mortgage | With Mortgage |
| Less than 2.0x | 12 (57.1%) | 76,667 (1,277,783.3%) |
| 2.0x to 2.9x | 3 (14.3%) | 6 (100.0%) |
| 3.0x to 3.9x | 0 (0.0%) | 0 (0.0%) |
| 4.0x or more | 6 (28.6%) | 0 (0.0%) |
| Total | 21 (100.0%) | 6 (100.0%) |
Real Estate Taxes by Mortgage Status in Morrison
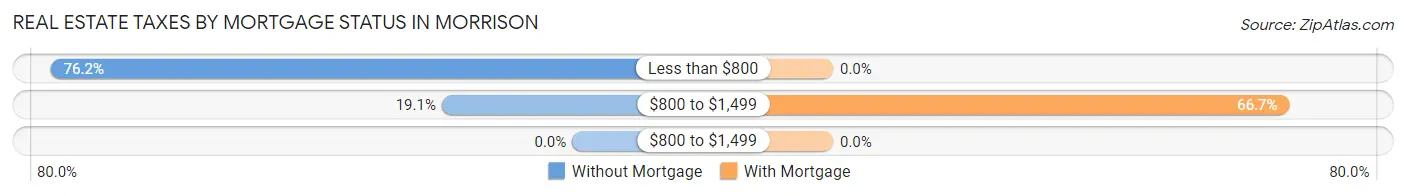
| Property Taxes | Without Mortgage | With Mortgage |
| Less than $800 | 16 (76.2%) | 0 (0.0%) |
| $800 to $1,499 | 4 (19.1%) | 4 (66.7%) |
| $800 to $1,499 | 0 (0.0%) | 0 (0.0%) |
| Total | 21 (100.0%) | 6 (100.0%) |
Health & Disability in Morrison
Health Insurance Coverage by Age in Morrison
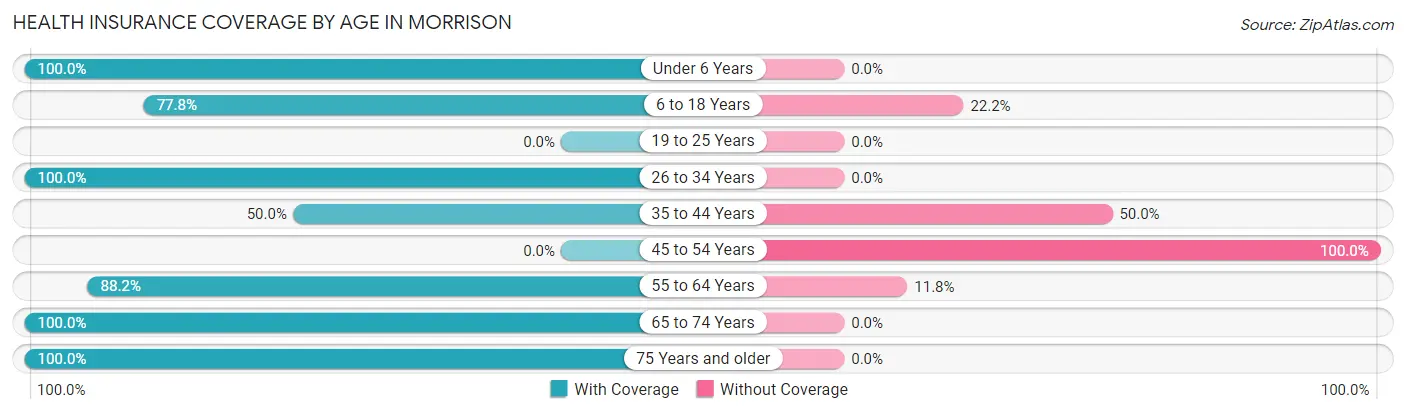
| Age Bracket | With Coverage | Without Coverage |
| Under 6 Years | 2 (100.0%) | 0 (0.0%) |
| 6 to 18 Years | 7 (77.8%) | 2 (22.2%) |
| 19 to 25 Years | 0 (0.0%) | 0 (0.0%) |
| 26 to 34 Years | 4 (100.0%) | 0 (0.0%) |
| 35 to 44 Years | 6 (50.0%) | 6 (50.0%) |
| 45 to 54 Years | 0 (0.0%) | 2 (100.0%) |
| 55 to 64 Years | 15 (88.2%) | 2 (11.8%) |
| 65 to 74 Years | 9 (100.0%) | 0 (0.0%) |
| 75 Years and older | 4 (100.0%) | 0 (0.0%) |
| Total | 47 (79.7%) | 12 (20.3%) |
Health Insurance Coverage by Citizenship Status in Morrison
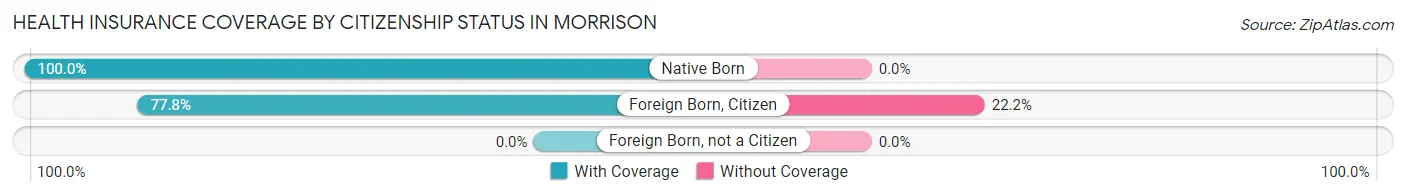
| Citizenship Status | With Coverage | Without Coverage |
| Native Born | 2 (100.0%) | 0 (0.0%) |
| Foreign Born, Citizen | 7 (77.8%) | 2 (22.2%) |
| Foreign Born, not a Citizen | 0 (0.0%) | 0 (0.0%) |
Health Insurance Coverage by Household Income in Morrison
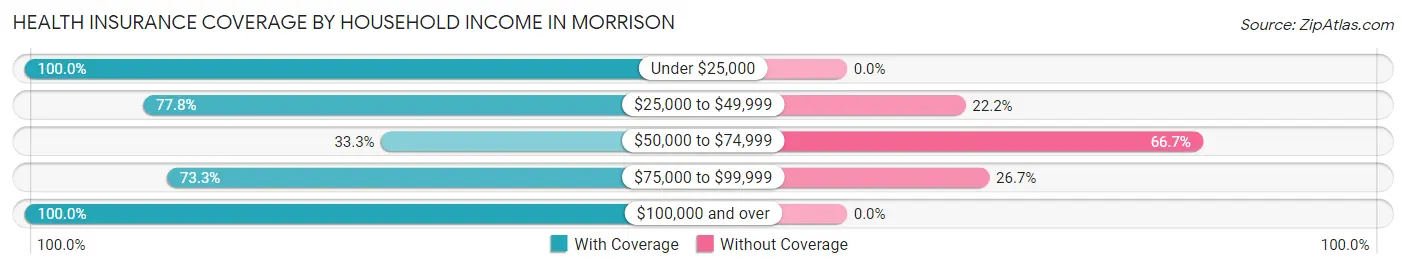
| Household Income | With Coverage | Without Coverage |
| Under $25,000 | 16 (100.0%) | 0 (0.0%) |
| $25,000 to $49,999 | 14 (77.8%) | 4 (22.2%) |
| $50,000 to $74,999 | 2 (33.3%) | 4 (66.7%) |
| $75,000 to $99,999 | 11 (73.3%) | 4 (26.7%) |
| $100,000 and over | 4 (100.0%) | 0 (0.0%) |
Public vs Private Health Insurance Coverage by Age in Morrison
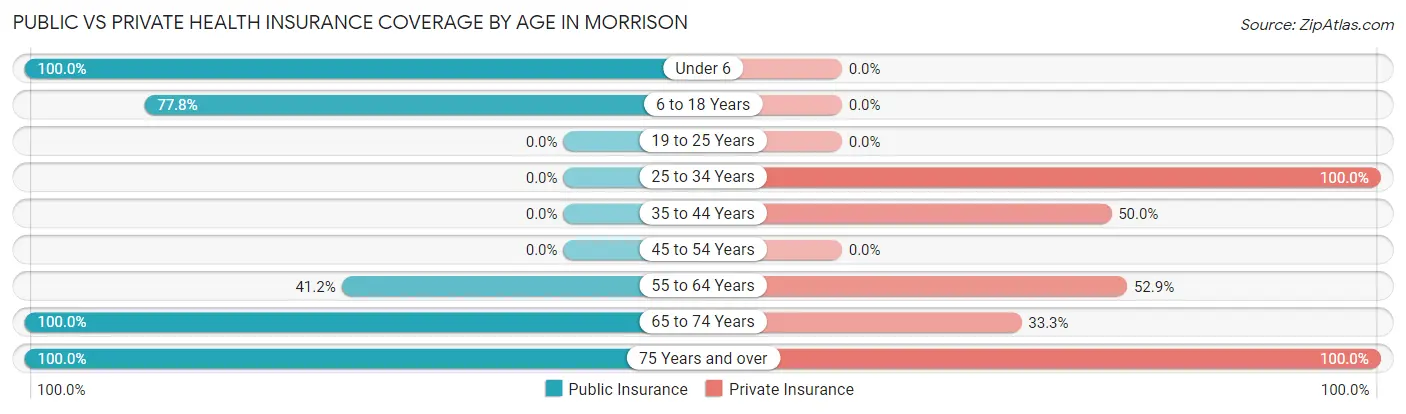
| Age Bracket | Public Insurance | Private Insurance |
| Under 6 | 2 (100.0%) | 0 (0.0%) |
| 6 to 18 Years | 7 (77.8%) | 0 (0.0%) |
| 19 to 25 Years | 0 (0.0%) | 0 (0.0%) |
| 25 to 34 Years | 0 (0.0%) | 4 (100.0%) |
| 35 to 44 Years | 0 (0.0%) | 6 (50.0%) |
| 45 to 54 Years | 0 (0.0%) | 0 (0.0%) |
| 55 to 64 Years | 7 (41.2%) | 9 (52.9%) |
| 65 to 74 Years | 9 (100.0%) | 3 (33.3%) |
| 75 Years and over | 4 (100.0%) | 4 (100.0%) |
| Total | 29 (49.1%) | 26 (44.1%) |
Disability Status by Sex by Age in Morrison
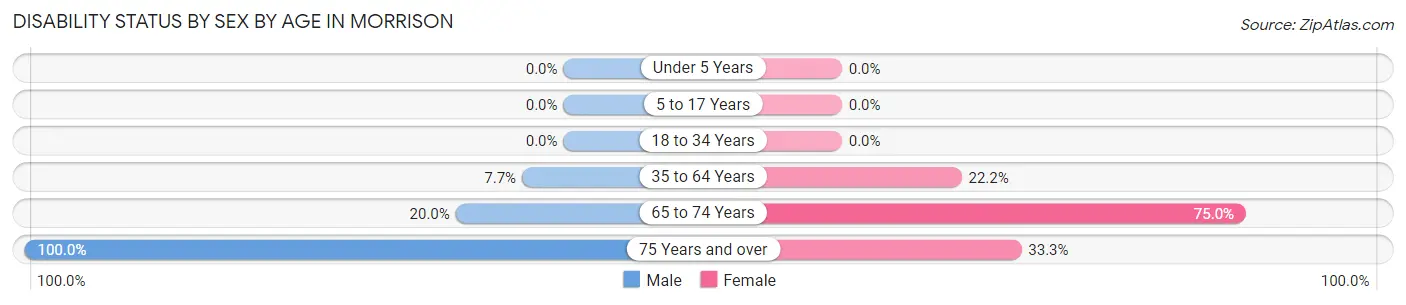
| Age Bracket | Male | Female |
| Under 5 Years | 0 (0.0%) | 0 (0.0%) |
| 5 to 17 Years | 0 (0.0%) | 0 (0.0%) |
| 18 to 34 Years | 0 (0.0%) | 0 (0.0%) |
| 35 to 64 Years | 1 (7.7%) | 4 (22.2%) |
| 65 to 74 Years | 1 (20.0%) | 3 (75.0%) |
| 75 Years and over | 1 (100.0%) | 1 (33.3%) |
Disability Class by Sex by Age in Morrison
Disability Class: Hearing Difficulty
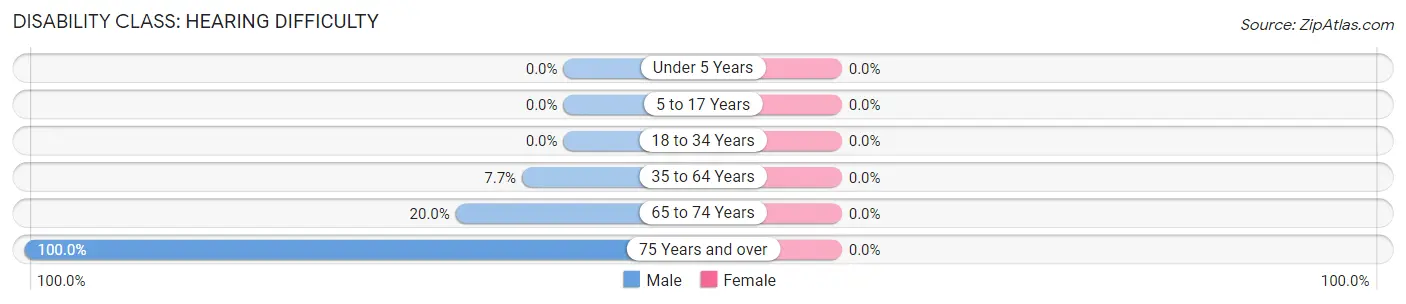
| Age Bracket | Male | Female |
| Under 5 Years | 0 (0.0%) | 0 (0.0%) |
| 5 to 17 Years | 0 (0.0%) | 0 (0.0%) |
| 18 to 34 Years | 0 (0.0%) | 0 (0.0%) |
| 35 to 64 Years | 1 (7.7%) | 0 (0.0%) |
| 65 to 74 Years | 1 (20.0%) | 0 (0.0%) |
| 75 Years and over | 1 (100.0%) | 0 (0.0%) |
Disability Class: Vision Difficulty
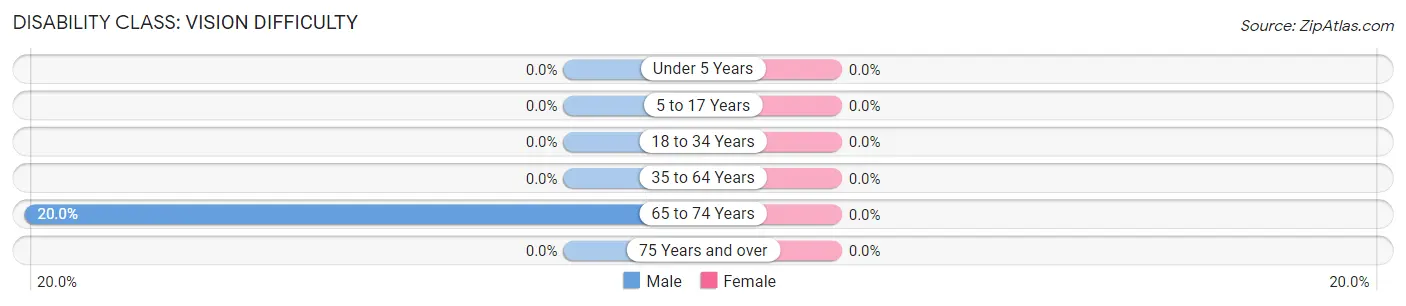
| Age Bracket | Male | Female |
| Under 5 Years | 0 (0.0%) | 0 (0.0%) |
| 5 to 17 Years | 0 (0.0%) | 0 (0.0%) |
| 18 to 34 Years | 0 (0.0%) | 0 (0.0%) |
| 35 to 64 Years | 0 (0.0%) | 0 (0.0%) |
| 65 to 74 Years | 1 (20.0%) | 0 (0.0%) |
| 75 Years and over | 0 (0.0%) | 0 (0.0%) |
Disability Class: Cognitive Difficulty
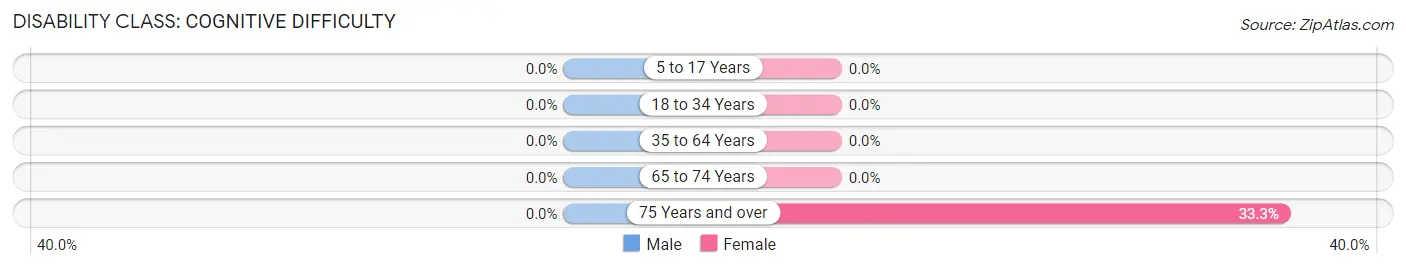
| Age Bracket | Male | Female |
| 5 to 17 Years | 0 (0.0%) | 0 (0.0%) |
| 18 to 34 Years | 0 (0.0%) | 0 (0.0%) |
| 35 to 64 Years | 0 (0.0%) | 0 (0.0%) |
| 65 to 74 Years | 0 (0.0%) | 0 (0.0%) |
| 75 Years and over | 0 (0.0%) | 1 (33.3%) |
Disability Class: Ambulatory Difficulty
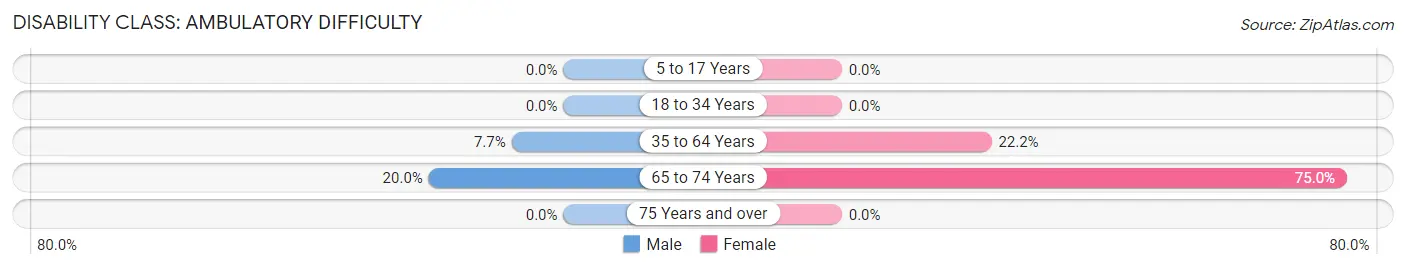
| Age Bracket | Male | Female |
| 5 to 17 Years | 0 (0.0%) | 0 (0.0%) |
| 18 to 34 Years | 0 (0.0%) | 0 (0.0%) |
| 35 to 64 Years | 1 (7.7%) | 4 (22.2%) |
| 65 to 74 Years | 1 (20.0%) | 3 (75.0%) |
| 75 Years and over | 0 (0.0%) | 0 (0.0%) |
Disability Class: Self-Care Difficulty
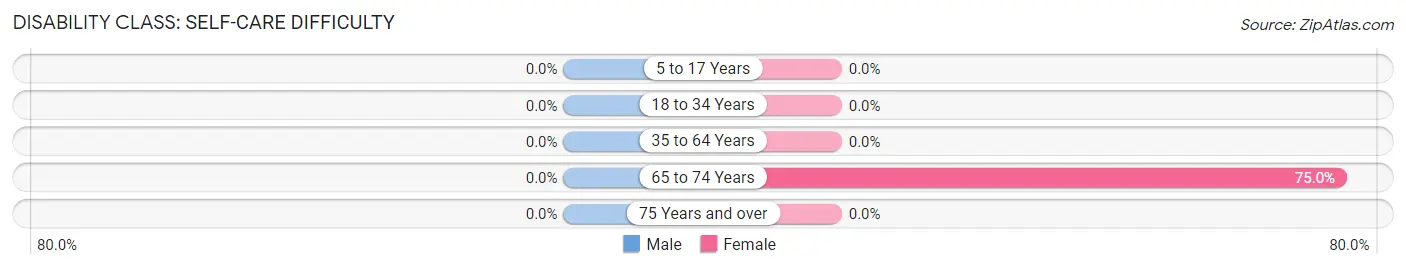
| Age Bracket | Male | Female |
| 5 to 17 Years | 0 (0.0%) | 0 (0.0%) |
| 18 to 34 Years | 0 (0.0%) | 0 (0.0%) |
| 35 to 64 Years | 0 (0.0%) | 0 (0.0%) |
| 65 to 74 Years | 0 (0.0%) | 3 (75.0%) |
| 75 Years and over | 0 (0.0%) | 0 (0.0%) |
Technology Access in Morrison
Computing Device Access in Morrison
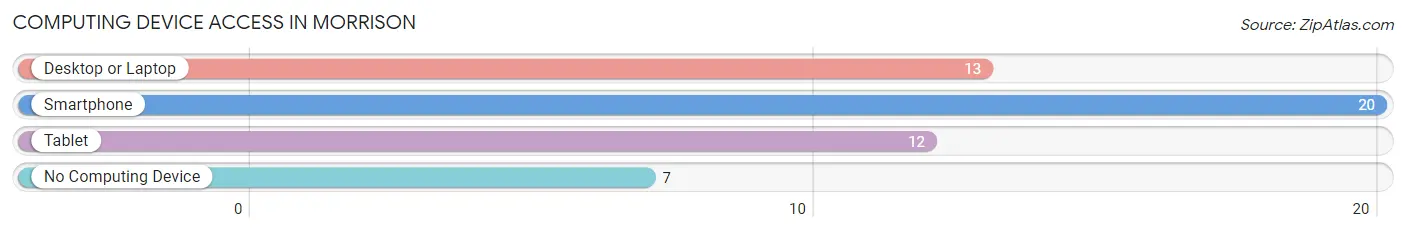
| Device Type | # Households | % Households |
| Desktop or Laptop | 13 | 48.1% |
| Smartphone | 20 | 74.1% |
| Tablet | 12 | 44.4% |
| No Computing Device | 7 | 25.9% |
| Total | 27 | 100.0% |
Internet Access in Morrison
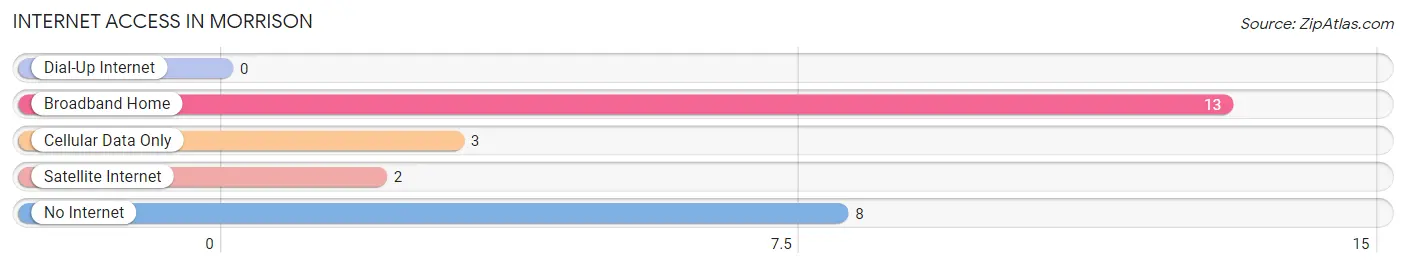
| Internet Type | # Households | % Households |
| Dial-Up Internet | 0 | 0.0% |
| Broadband Home | 13 | 48.1% |
| Cellular Data Only | 3 | 11.1% |
| Satellite Internet | 2 | 7.4% |
| No Internet | 8 | 29.6% |
| Total | 27 | 100.0% |
Morrison Summary
Morrison is a small town located in the state of Missouri, in the United States. It is situated in the northwest corner of the state, in the Ozark Mountains. The town has a population of approximately 1,000 people, and is part of the St. Louis metropolitan area.
History
Morrison was founded in 1845 by a group of settlers from Kentucky. The town was named after a local settler, William Morrison, who was the first to settle in the area. The town was originally a farming community, and the main crops grown were corn, wheat, and oats. In the late 19th century, the town began to grow and develop, and by the early 20th century, it had become a thriving community.
In the early 1900s, the town was home to several businesses, including a general store, a blacksmith shop, and a sawmill. The town also had a post office, a bank, and a school. In the 1920s, the town was connected to the rest of the state by a railroad line, which allowed for increased trade and commerce.
Geography
Morrison is located in the Ozark Mountains, in the northwest corner of Missouri. The town is situated on the banks of the Osage River, and is surrounded by rolling hills and forests. The town is located approximately 30 miles from St. Louis, and is part of the St. Louis metropolitan area.
The climate in Morrison is humid subtropical, with hot, humid summers and cold, wet winters. The average annual temperature is around 55 degrees Fahrenheit, and the average annual precipitation is around 40 inches.
Economy
The economy of Morrison is largely based on agriculture and tourism. The town is home to several farms, which produce a variety of crops, including corn, wheat, oats, and hay. The town is also home to several wineries, which produce a variety of wines.
Tourism is an important part of the economy of Morrison. The town is home to several attractions, including the Ozark National Scenic Riverways, which is a popular destination for canoeing, fishing, and camping. The town is also home to several historic sites, including the Morrison Historic District, which is listed on the National Register of Historic Places.
Demographics
As of the 2010 census, the population of Morrison was 1,000 people. The racial makeup of the town was 97.2% White, 0.7% African American, 0.3% Native American, 0.2% Asian, 0.1% Pacific Islander, and 1.5% from other races. The median household income in Morrison was $37,500, and the median family income was $45,000. The per capita income in Morrison was $19,000.
Conclusion
Morrison is a small town located in the Ozark Mountains of Missouri. The town has a population of approximately 1,000 people, and is part of the St. Louis metropolitan area. The economy of Morrison is largely based on agriculture and tourism, and the town is home to several attractions, including the Ozark National Scenic Riverways. The racial makeup of the town is predominantly White, with a small percentage of African American, Native American, Asian, and Pacific Islander residents. The median household income in Morrison is $37,500, and the median family income is $45,000.
Common Questions
What is Per Capita Income in Morrison?
Per Capita income in Morrison is $21,861.
What is the Median Family Income in Morrison?
Median Family Income in Morrison is $56,250.
What is the Median Household income in Morrison?
Median Household Income in Morrison is $36,875.
What is Income or Wage Gap in Morrison?
Income or Wage Gap in Morrison is 45.0%.
Women in Morrison earn 55.0 cents for every dollar earned by a man.
What is Inequality or Gini Index in Morrison?
Inequality or Gini Index in Morrison is 0.42.
What is the Total Population of Morrison?
Total Population of Morrison is 59.
What is the Total Male Population of Morrison?
Total Male Population of Morrison is 25.
What is the Total Female Population of Morrison?
Total Female Population of Morrison is 34.
What is the Ratio of Males per 100 Females in Morrison?
There are 73.53 Males per 100 Females in Morrison.
What is the Ratio of Females per 100 Males in Morrison?
There are 136.00 Females per 100 Males in Morrison.
What is the Median Population Age in Morrison?
Median Population Age in Morrison is 56.1 Years.
What is the Average Family Size in Morrison
Average Family Size in Morrison is 2.7 People.
What is the Average Household Size in Morrison
Average Household Size in Morrison is 2.2 People.
How Large is the Labor Force in Morrison?
There are 17 People in the Labor Forcein in Morrison.
What is the Percentage of People in the Labor Force in Morrison?
32.7% of People are in the Labor Force in Morrison.