Montgomery City, MO Map & Demographics
Montgomery City Map
Montgomery City Overview
$27,090
PER CAPITA INCOME
$73,860
AVG FAMILY INCOME
$47,465
AVG HOUSEHOLD INCOME
43.1%
WAGE / INCOME GAP [ % ]
56.9¢/ $1
WAGE / INCOME GAP [ $ ]
0.43
INEQUALITY / GINI INDEX
2,817
TOTAL POPULATION
1,324
MALE POPULATION
1,493
FEMALE POPULATION
88.68
MALES / 100 FEMALES
112.76
FEMALES / 100 MALES
38.2
MEDIAN AGE
3.0
AVG FAMILY SIZE
2.2
AVG HOUSEHOLD SIZE
1,424
LABOR FORCE [ PEOPLE ]
64.0%
PERCENT IN LABOR FORCE
4.0%
UNEMPLOYMENT RATE
Montgomery City Zip Codes
Montgomery City Area Codes
Income in Montgomery City
Income Overview in Montgomery City
Per Capita Income in Montgomery City is $27,090, while median incomes of families and households are $73,860 and $47,465 respectively.
| Characteristic | Number | Measure |
| Per Capita Income | 2,817 | $27,090 |
| Median Family Income | 675 | $73,860 |
| Mean Family Income | 675 | $77,012 |
| Median Household Income | 1,269 | $47,465 |
| Mean Household Income | 1,269 | $58,553 |
| Income Deficit | 675 | $0 |
| Wage / Income Gap (%) | 2,817 | 43.06% |
| Wage / Income Gap ($) | 2,817 | 56.94¢ per $1 |
| Gini / Inequality Index | 2,817 | 0.43 |
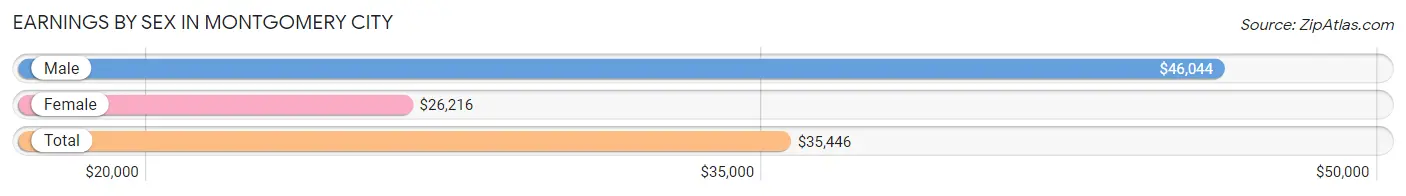
Earnings by Sex in Montgomery City
Average Earnings in Montgomery City are $35,446, $46,044 for men and $26,216 for women, a difference of 43.1%.
| Sex | Number | Average Earnings |
| Male | 715 (47.8%) | $46,044 |
| Female | 782 (52.2%) | $26,216 |
| Total | 1,497 (100.0%) | $35,446 |
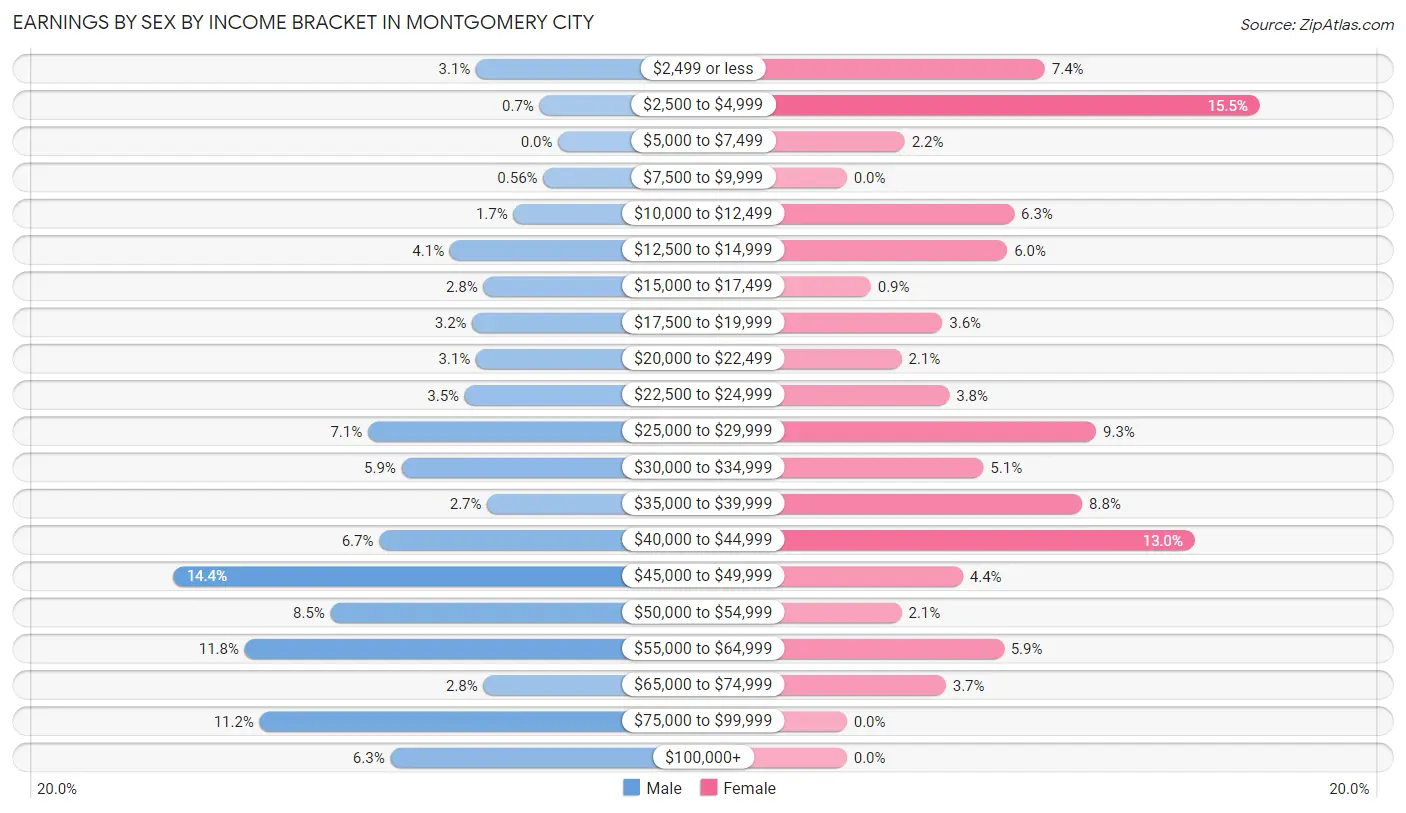
Earnings by Sex by Income Bracket in Montgomery City
The most common earnings brackets in Montgomery City are $45,000 to $49,999 for men (103 | 14.4%) and $2,500 to $4,999 for women (121 | 15.5%).
| Income | Male | Female |
| $2,499 or less | 22 (3.1%) | 58 (7.4%) |
| $2,500 to $4,999 | 5 (0.7%) | 121 (15.5%) |
| $5,000 to $7,499 | 0 (0.0%) | 17 (2.2%) |
| $7,500 to $9,999 | 4 (0.6%) | 0 (0.0%) |
| $10,000 to $12,499 | 12 (1.7%) | 49 (6.3%) |
| $12,500 to $14,999 | 29 (4.1%) | 47 (6.0%) |
| $15,000 to $17,499 | 20 (2.8%) | 7 (0.9%) |
| $17,500 to $19,999 | 23 (3.2%) | 28 (3.6%) |
| $20,000 to $22,499 | 22 (3.1%) | 16 (2.1%) |
| $22,500 to $24,999 | 25 (3.5%) | 30 (3.8%) |
| $25,000 to $29,999 | 51 (7.1%) | 73 (9.3%) |
| $30,000 to $34,999 | 42 (5.9%) | 40 (5.1%) |
| $35,000 to $39,999 | 19 (2.7%) | 69 (8.8%) |
| $40,000 to $44,999 | 48 (6.7%) | 102 (13.0%) |
| $45,000 to $49,999 | 103 (14.4%) | 34 (4.3%) |
| $50,000 to $54,999 | 61 (8.5%) | 16 (2.1%) |
| $55,000 to $64,999 | 84 (11.7%) | 46 (5.9%) |
| $65,000 to $74,999 | 20 (2.8%) | 29 (3.7%) |
| $75,000 to $99,999 | 80 (11.2%) | 0 (0.0%) |
| $100,000+ | 45 (6.3%) | 0 (0.0%) |
| Total | 715 (100.0%) | 782 (100.0%) |
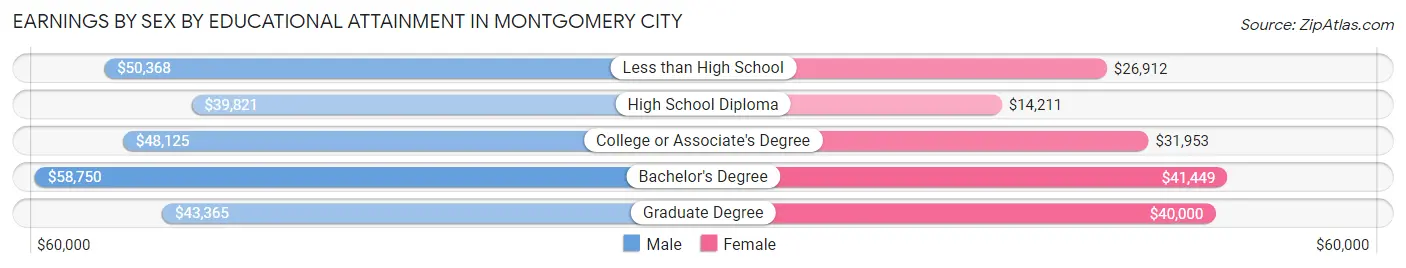
Earnings by Sex by Educational Attainment in Montgomery City
Average earnings in Montgomery City are $46,912 for men and $30,197 for women, a difference of 35.6%. Men with an educational attainment of bachelor's degree enjoy the highest average annual earnings of $58,750, while those with high school diploma education earn the least with $39,821. Women with an educational attainment of bachelor's degree earn the most with the average annual earnings of $41,449, while those with high school diploma education have the smallest earnings of $14,211.
| Educational Attainment | Male Income | Female Income |
| Less than High School | $50,368 | $26,912 |
| High School Diploma | $39,821 | $14,211 |
| College or Associate's Degree | $48,125 | $31,953 |
| Bachelor's Degree | $58,750 | $41,449 |
| Graduate Degree | $43,365 | $40,000 |
| Total | $46,912 | $30,197 |
Family Income in Montgomery City
Family Income Brackets in Montgomery City
According to the Montgomery City family income data, there are 137 families falling into the $100,000 to $149,999 income range, which is the most common income bracket and makes up 20.3% of all families. Conversely, the less than $10,000 income bracket is the least frequent group with only 13 families (1.9%) belonging to this category.
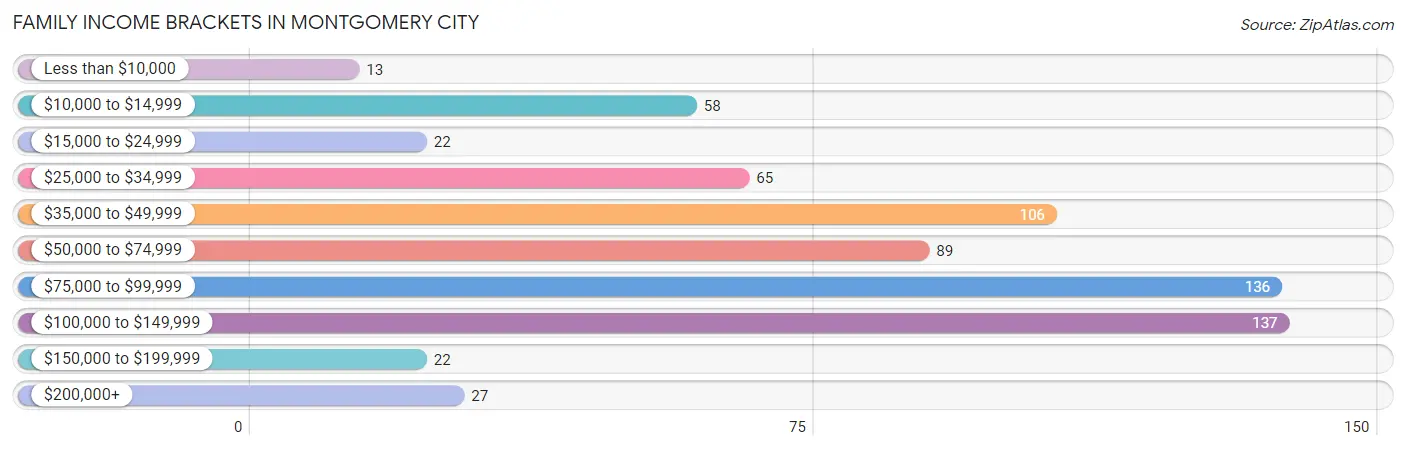
| Income Bracket | # Families | % Families |
| Less than $10,000 | 13 | 1.9% |
| $10,000 to $14,999 | 58 | 8.6% |
| $15,000 to $24,999 | 22 | 3.3% |
| $25,000 to $34,999 | 65 | 9.6% |
| $35,000 to $49,999 | 106 | 15.7% |
| $50,000 to $74,999 | 89 | 13.2% |
| $75,000 to $99,999 | 136 | 20.1% |
| $100,000 to $149,999 | 137 | 20.3% |
| $150,000 to $199,999 | 22 | 3.3% |
| $200,000+ | 27 | 4.0% |
Family Income by Famaliy Size in Montgomery City
5-person families (87 | 12.9%) account for the highest median family income in Montgomery City with $94,219 per family, while 3-person families (161 | 23.8%) have the highest median income of $29,413 per family member.
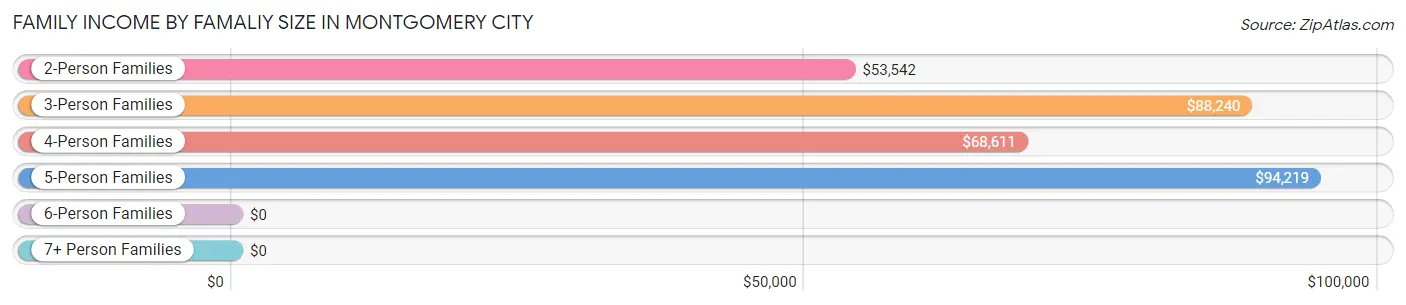
| Income Bracket | # Families | Median Income |
| 2-Person Families | 311 (46.1%) | $53,542 |
| 3-Person Families | 161 (23.8%) | $88,240 |
| 4-Person Families | 114 (16.9%) | $68,611 |
| 5-Person Families | 87 (12.9%) | $94,219 |
| 6-Person Families | 2 (0.3%) | $0 |
| 7+ Person Families | 0 (0.0%) | $0 |
| Total | 675 (100.0%) | $73,860 |
Family Income by Number of Earners in Montgomery City
The median family income in Montgomery City is $73,860, with families comprising 3+ earners (35) having the highest median family income of $146,563, while families with 1 earner (261) have the lowest median family income of $35,625, accounting for 5.2% and 38.7% of families, respectively.
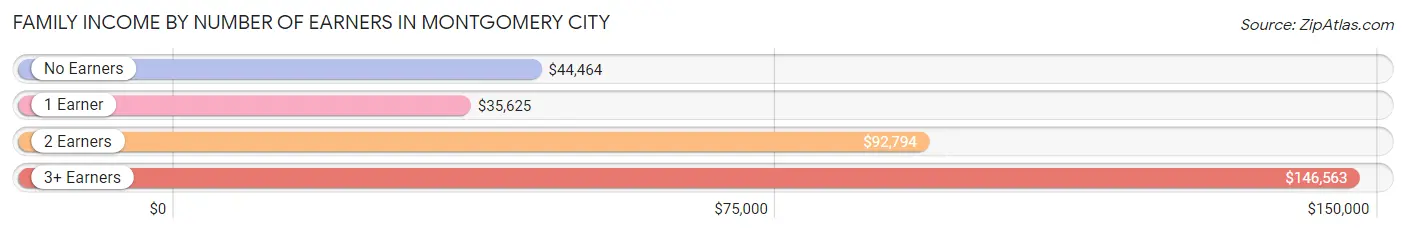
| Number of Earners | # Families | Median Income |
| No Earners | 73 (10.8%) | $44,464 |
| 1 Earner | 261 (38.7%) | $35,625 |
| 2 Earners | 306 (45.3%) | $92,794 |
| 3+ Earners | 35 (5.2%) | $146,563 |
| Total | 675 (100.0%) | $73,860 |
Household Income in Montgomery City
Household Income Brackets in Montgomery City
With 209 households falling in the category, the $50,000 to $74,999 income range is the most frequent in Montgomery City, accounting for 16.5% of all households. In contrast, only 27 households (2.1%) fall into the $200,000+ income bracket, making it the least populous group.
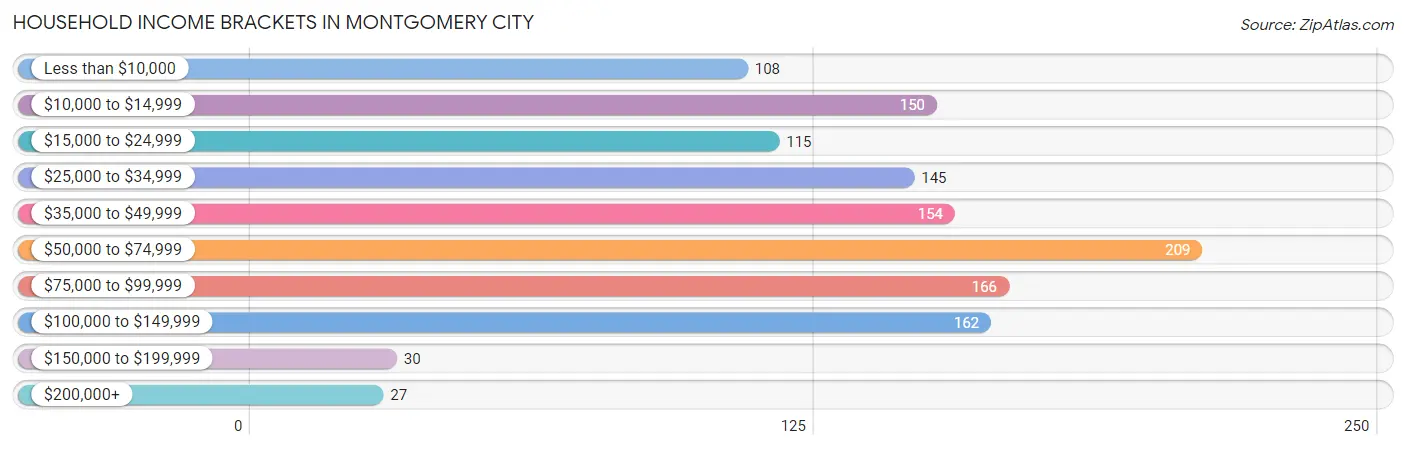
| Income Bracket | # Households | % Households |
| Less than $10,000 | 108 | 8.5% |
| $10,000 to $14,999 | 150 | 11.8% |
| $15,000 to $24,999 | 115 | 9.1% |
| $25,000 to $34,999 | 145 | 11.4% |
| $35,000 to $49,999 | 154 | 12.1% |
| $50,000 to $74,999 | 209 | 16.5% |
| $75,000 to $99,999 | 166 | 13.1% |
| $100,000 to $149,999 | 162 | 12.8% |
| $150,000 to $199,999 | 30 | 2.4% |
| $200,000+ | 27 | 2.1% |
Household Income by Householder Age in Montgomery City
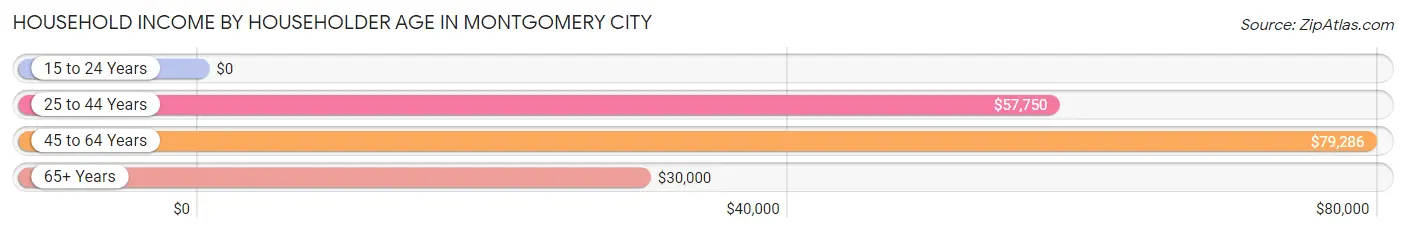
The median household income in Montgomery City is $47,465, with the highest median household income of $79,286 found in the 45 to 64 years age bracket for the primary householder. A total of 386 households (30.4%) fall into this category. Meanwhile, the 15 to 24 years age bracket for the primary householder has the lowest median household income of $0, with 120 households (9.5%) in this group.
| Income Bracket | # Households | Median Income |
| 15 to 24 Years | 120 (9.5%) | $0 |
| 25 to 44 Years | 385 (30.3%) | $57,750 |
| 45 to 64 Years | 386 (30.4%) | $79,286 |
| 65+ Years | 378 (29.8%) | $30,000 |
| Total | 1,269 (100.0%) | $47,465 |
Poverty in Montgomery City
Income Below Poverty by Sex and Age in Montgomery City
With 17.3% poverty level for males and 17.6% for females among the residents of Montgomery City, 5 year old males and 18 to 24 year old females are the most vulnerable to poverty, with 25 males (65.8%) and 62 females (63.3%) in their respective age groups living below the poverty level.
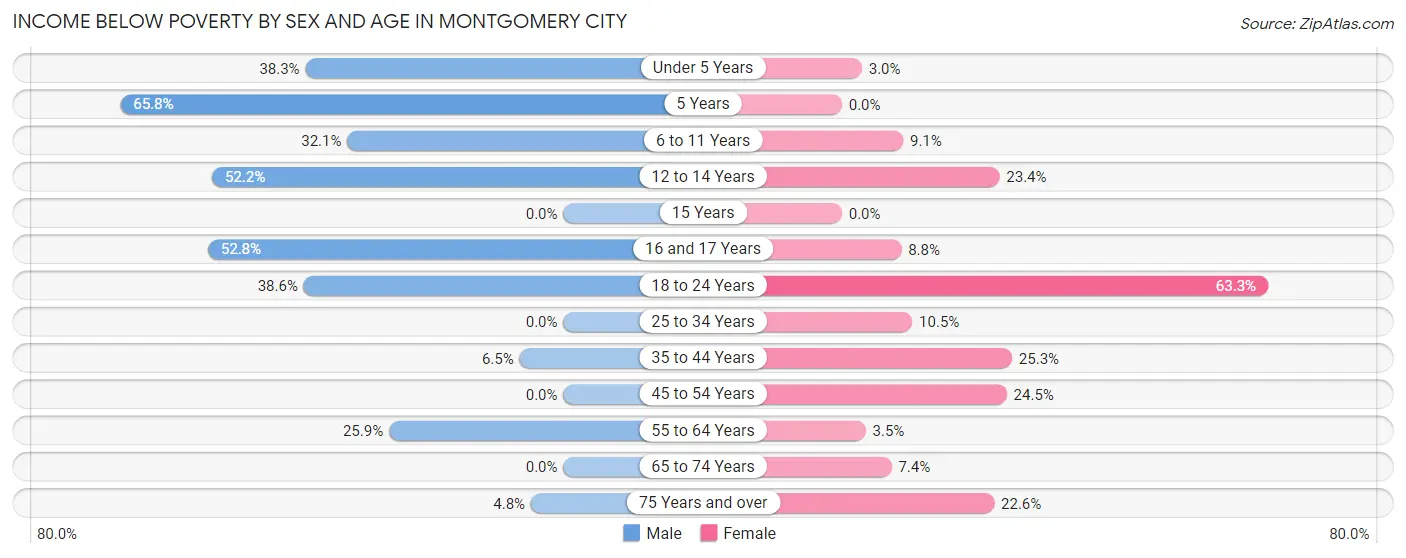
| Age Bracket | Male | Female |
| Under 5 Years | 54 (38.3%) | 3 (3.0%) |
| 5 Years | 25 (65.8%) | 0 (0.0%) |
| 6 to 11 Years | 34 (32.1%) | 8 (9.1%) |
| 12 to 14 Years | 12 (52.2%) | 11 (23.4%) |
| 15 Years | 0 (0.0%) | 0 (0.0%) |
| 16 and 17 Years | 19 (52.8%) | 6 (8.8%) |
| 18 to 24 Years | 32 (38.6%) | 62 (63.3%) |
| 25 to 34 Years | 0 (0.0%) | 23 (10.4%) |
| 35 to 44 Years | 13 (6.5%) | 48 (25.3%) |
| 45 to 54 Years | 0 (0.0%) | 47 (24.5%) |
| 55 to 64 Years | 29 (25.9%) | 6 (3.5%) |
| 65 to 74 Years | 0 (0.0%) | 9 (7.4%) |
| 75 Years and over | 4 (4.8%) | 38 (22.6%) |
| Total | 222 (17.3%) | 261 (17.6%) |
Income Above Poverty by Sex and Age in Montgomery City
According to the poverty statistics in Montgomery City, males aged 15 years and females aged 5 years are the age groups that are most secure financially, with 100.0% of males and 100.0% of females in these age groups living above the poverty line.
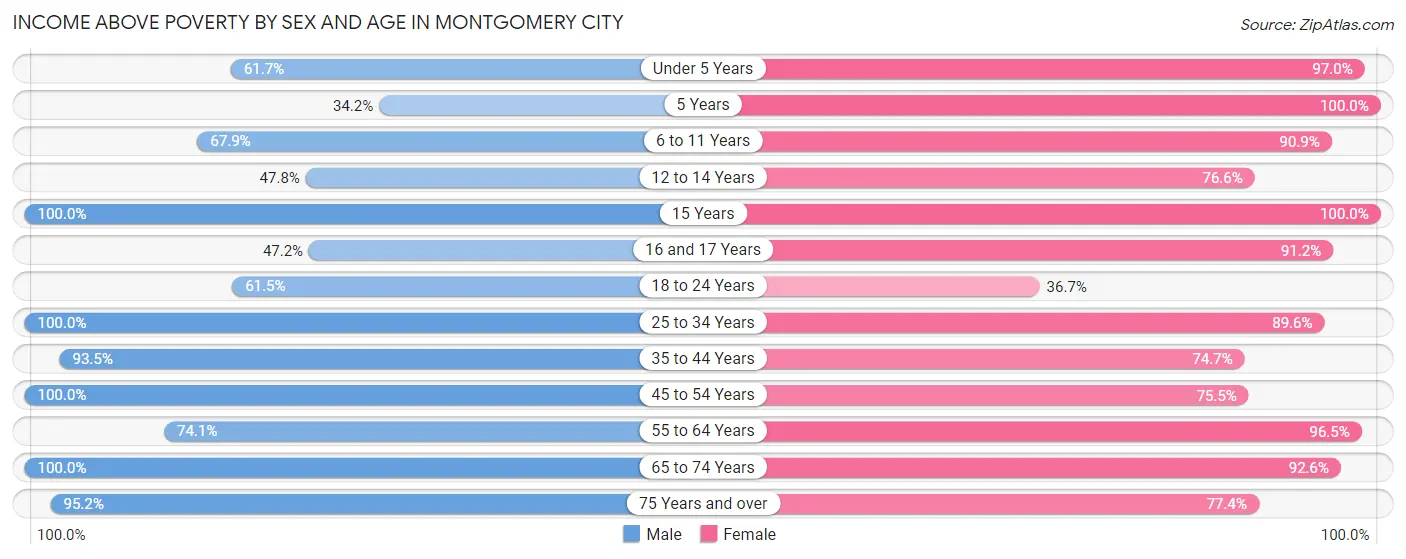
| Age Bracket | Male | Female |
| Under 5 Years | 87 (61.7%) | 98 (97.0%) |
| 5 Years | 13 (34.2%) | 5 (100.0%) |
| 6 to 11 Years | 72 (67.9%) | 80 (90.9%) |
| 12 to 14 Years | 11 (47.8%) | 36 (76.6%) |
| 15 Years | 21 (100.0%) | 13 (100.0%) |
| 16 and 17 Years | 17 (47.2%) | 62 (91.2%) |
| 18 to 24 Years | 51 (61.5%) | 36 (36.7%) |
| 25 to 34 Years | 177 (100.0%) | 197 (89.5%) |
| 35 to 44 Years | 187 (93.5%) | 142 (74.7%) |
| 45 to 54 Years | 182 (100.0%) | 145 (75.5%) |
| 55 to 64 Years | 83 (74.1%) | 164 (96.5%) |
| 65 to 74 Years | 79 (100.0%) | 113 (92.6%) |
| 75 Years and over | 79 (95.2%) | 130 (77.4%) |
| Total | 1,059 (82.7%) | 1,221 (82.4%) |
Income Below Poverty Among Married-Couple Families in Montgomery City
The poverty statistics for married-couple families in Montgomery City show that 4.2% or 20 of the total 474 families live below the poverty line. Families with 3 or 4 children have the highest poverty rate of 18.9%, comprising of 7 families. On the other hand, families with no children have the lowest poverty rate of 1.7%, which includes 4 families.
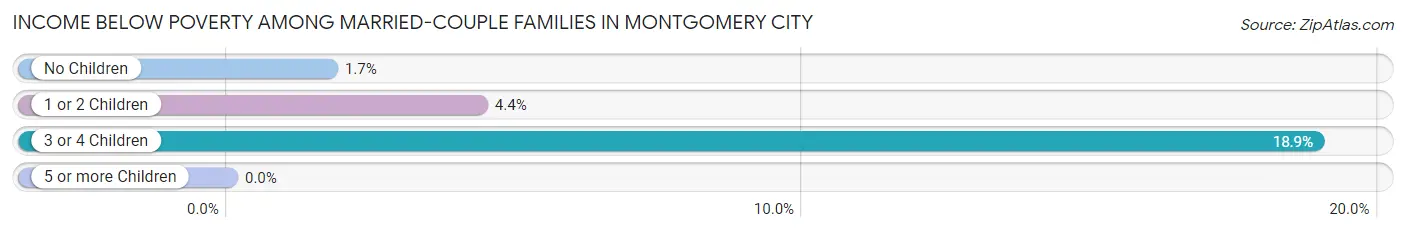
| Children | Above Poverty | Below Poverty |
| No Children | 226 (98.3%) | 4 (1.7%) |
| 1 or 2 Children | 198 (95.7%) | 9 (4.3%) |
| 3 or 4 Children | 30 (81.1%) | 7 (18.9%) |
| 5 or more Children | 0 (0.0%) | 0 (0.0%) |
| Total | 454 (95.8%) | 20 (4.2%) |
Income Below Poverty Among Single-Parent Households in Montgomery City
According to the poverty data in Montgomery City, 41.8% or 23 single-father households and 37.0% or 54 single-mother households are living below the poverty line. Among single-father households, those with 1 or 2 children have the highest poverty rate, with 23 households (54.8%) experiencing poverty. Likewise, among single-mother households, those with 3 or 4 children have the highest poverty rate, with 17 households (100.0%) falling below the poverty line.
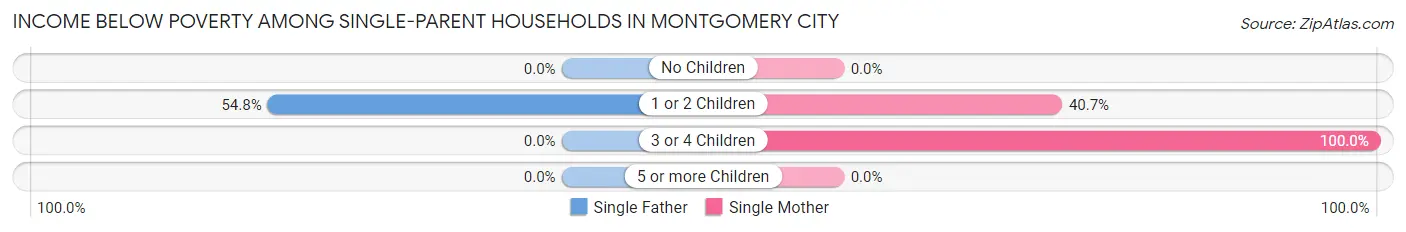
| Children | Single Father | Single Mother |
| No Children | 0 (0.0%) | 0 (0.0%) |
| 1 or 2 Children | 23 (54.8%) | 37 (40.7%) |
| 3 or 4 Children | 0 (0.0%) | 17 (100.0%) |
| 5 or more Children | 0 (0.0%) | 0 (0.0%) |
| Total | 23 (41.8%) | 54 (37.0%) |
Income Below Poverty Among Married-Couple vs Single-Parent Households in Montgomery City
The poverty data for Montgomery City shows that 20 of the married-couple family households (4.2%) and 77 of the single-parent households (38.3%) are living below the poverty level. Within the married-couple family households, those with 3 or 4 children have the highest poverty rate, with 7 households (18.9%) falling below the poverty line. Among the single-parent households, those with 3 or 4 children have the highest poverty rate, with 17 household (56.7%) living below poverty.
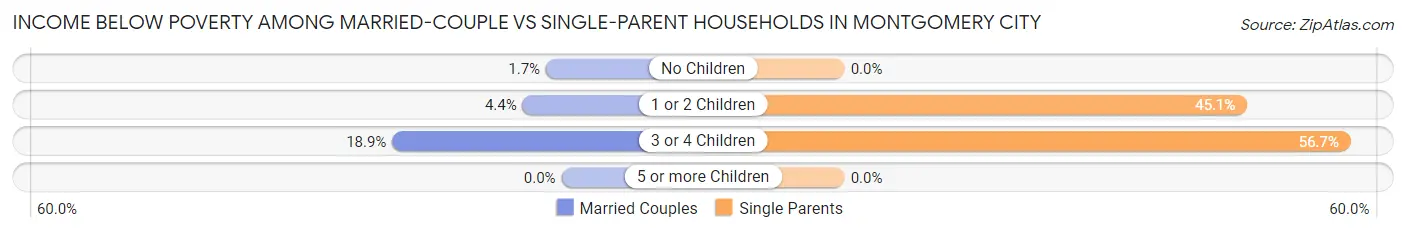
| Children | Married-Couple Families | Single-Parent Households |
| No Children | 4 (1.7%) | 0 (0.0%) |
| 1 or 2 Children | 9 (4.3%) | 60 (45.1%) |
| 3 or 4 Children | 7 (18.9%) | 17 (56.7%) |
| 5 or more Children | 0 (0.0%) | 0 (0.0%) |
| Total | 20 (4.2%) | 77 (38.3%) |
Race in Montgomery City
The most populous races in Montgomery City are White / Caucasian (2,474 | 87.8%), Black / African American (138 | 4.9%), and Two or more Races (122 | 4.3%).
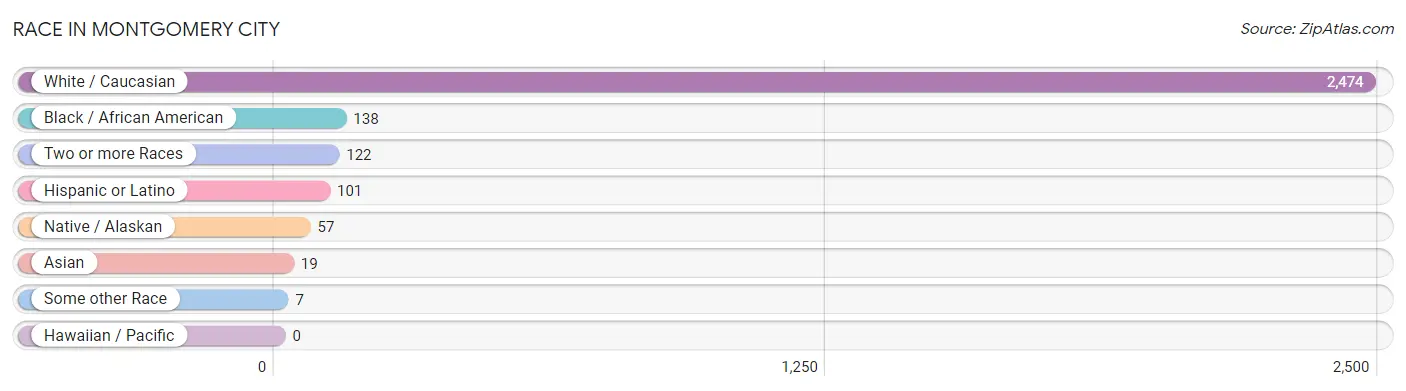
| Race | # Population | % Population |
| Asian | 19 | 0.7% |
| Black / African American | 138 | 4.9% |
| Hawaiian / Pacific | 0 | 0.0% |
| Hispanic or Latino | 101 | 3.6% |
| Native / Alaskan | 57 | 2.0% |
| White / Caucasian | 2,474 | 87.8% |
| Two or more Races | 122 | 4.3% |
| Some other Race | 7 | 0.3% |
| Total | 2,817 | 100.0% |
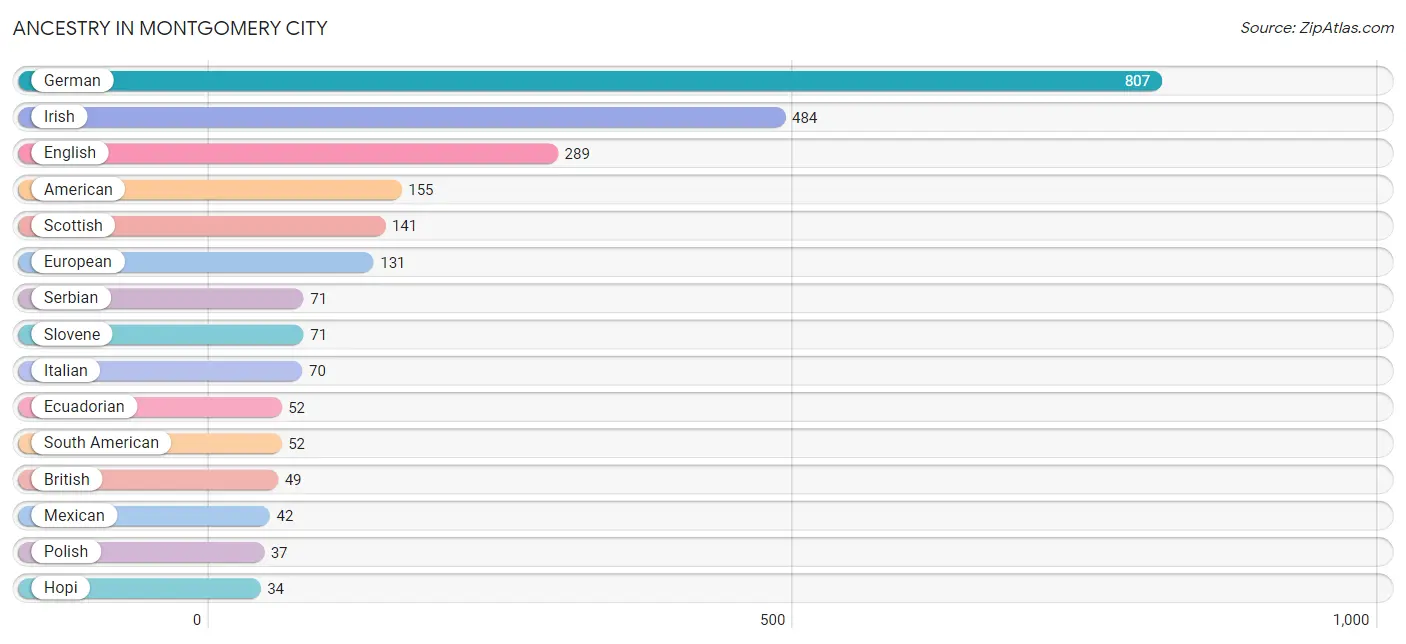
Ancestry in Montgomery City
The most populous ancestries reported in Montgomery City are German (807 | 28.6%), Irish (484 | 17.2%), English (289 | 10.3%), American (155 | 5.5%), and Scottish (141 | 5.0%), together accounting for 66.6% of all Montgomery City residents.
| Ancestry | # Population | % Population |
| African | 29 | 1.0% |
| American | 155 | 5.5% |
| Armenian | 9 | 0.3% |
| British | 49 | 1.7% |
| Cherokee | 12 | 0.4% |
| Czech | 11 | 0.4% |
| Danish | 5 | 0.2% |
| Dutch | 19 | 0.7% |
| Ecuadorian | 52 | 1.8% |
| English | 289 | 10.3% |
| European | 131 | 4.6% |
| French | 31 | 1.1% |
| French American Indian | 14 | 0.5% |
| French Canadian | 23 | 0.8% |
| German | 807 | 28.6% |
| Hopi | 34 | 1.2% |
| Irish | 484 | 17.2% |
| Italian | 70 | 2.5% |
| Korean | 24 | 0.9% |
| Mexican | 42 | 1.5% |
| Norwegian | 8 | 0.3% |
| Polish | 37 | 1.3% |
| Puerto Rican | 7 | 0.3% |
| Scotch-Irish | 28 | 1.0% |
| Scottish | 141 | 5.0% |
| Serbian | 71 | 2.5% |
| Slovak | 3 | 0.1% |
| Slovene | 71 | 2.5% |
| South American | 52 | 1.8% |
| Subsaharan African | 29 | 1.0% |
| Swedish | 30 | 1.1% |
| Swiss | 6 | 0.2% |
| Ukrainian | 21 | 0.7% |
| Welsh | 16 | 0.6% | View All 34 Rows |
Immigrants in Montgomery City
The most numerous immigrant groups reported in Montgomery City came from Asia (19 | 0.7%), Philippines (19 | 0.7%), South Eastern Asia (19 | 0.7%), Europe (10 | 0.4%), and Eastern Europe (6 | 0.2%), together accounting for 2.6% of all Montgomery City residents.
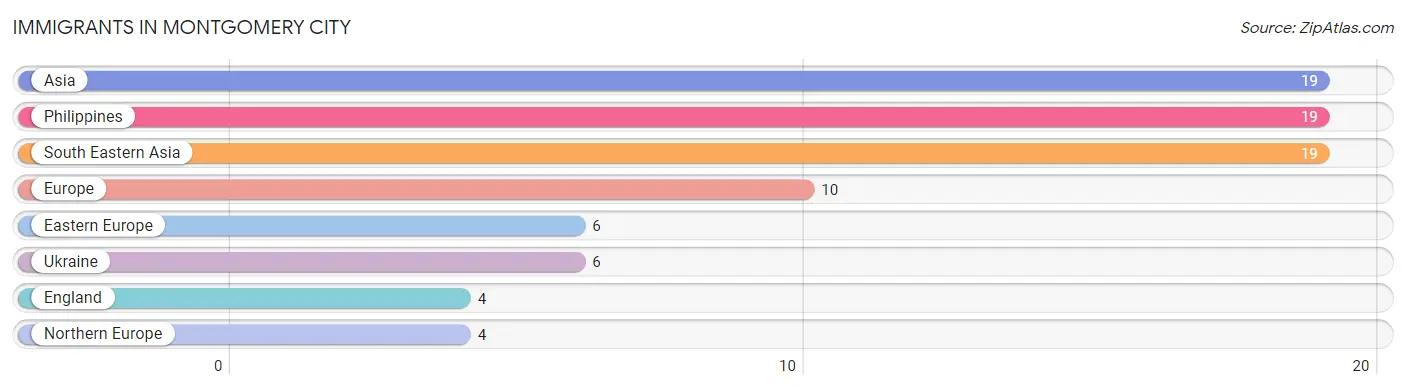
| Immigration Origin | # Population | % Population |
| Asia | 19 | 0.7% |
| Eastern Europe | 6 | 0.2% |
| England | 4 | 0.1% |
| Europe | 10 | 0.4% |
| Northern Europe | 4 | 0.1% |
| Philippines | 19 | 0.7% |
| South Eastern Asia | 19 | 0.7% |
| Ukraine | 6 | 0.2% | View All 8 Rows |
Sex and Age in Montgomery City
Sex and Age in Montgomery City
The most populous age groups in Montgomery City are Under 5 Years (142 | 10.7%) for men and 25 to 29 Years (130 | 8.7%) for women.
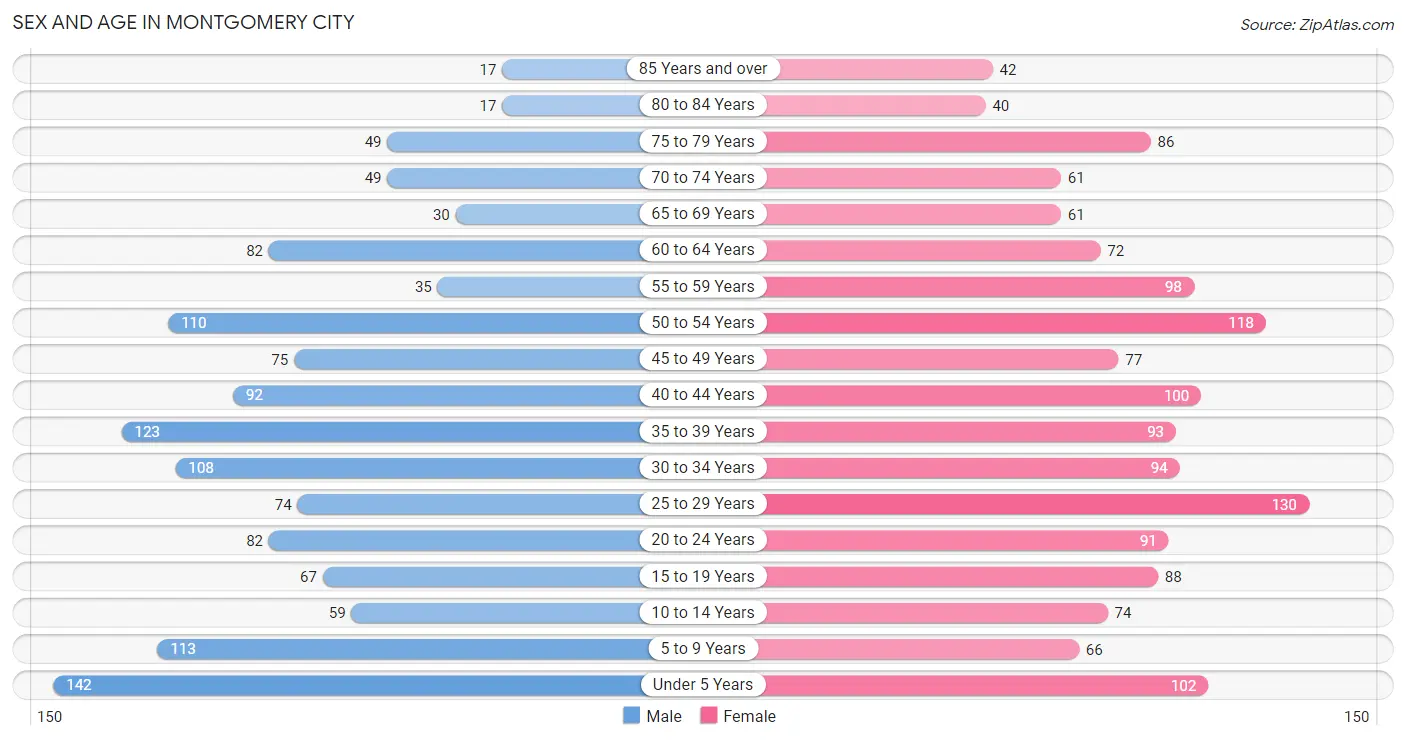
| Age Bracket | Male | Female |
| Under 5 Years | 142 (10.7%) | 102 (6.8%) |
| 5 to 9 Years | 113 (8.5%) | 66 (4.4%) |
| 10 to 14 Years | 59 (4.5%) | 74 (5.0%) |
| 15 to 19 Years | 67 (5.1%) | 88 (5.9%) |
| 20 to 24 Years | 82 (6.2%) | 91 (6.1%) |
| 25 to 29 Years | 74 (5.6%) | 130 (8.7%) |
| 30 to 34 Years | 108 (8.2%) | 94 (6.3%) |
| 35 to 39 Years | 123 (9.3%) | 93 (6.2%) |
| 40 to 44 Years | 92 (7.0%) | 100 (6.7%) |
| 45 to 49 Years | 75 (5.7%) | 77 (5.2%) |
| 50 to 54 Years | 110 (8.3%) | 118 (7.9%) |
| 55 to 59 Years | 35 (2.6%) | 98 (6.6%) |
| 60 to 64 Years | 82 (6.2%) | 72 (4.8%) |
| 65 to 69 Years | 30 (2.3%) | 61 (4.1%) |
| 70 to 74 Years | 49 (3.7%) | 61 (4.1%) |
| 75 to 79 Years | 49 (3.7%) | 86 (5.8%) |
| 80 to 84 Years | 17 (1.3%) | 40 (2.7%) |
| 85 Years and over | 17 (1.3%) | 42 (2.8%) |
| Total | 1,324 (100.0%) | 1,493 (100.0%) |
Families and Households in Montgomery City
Median Family Size in Montgomery City
The median family size in Montgomery City is 3.03 persons per family, with married-couple families (474 | 70.2%) accounting for the largest median family size of 3.18 persons per family. On the other hand, single female/mother families (146 | 21.6%) represent the smallest median family size with 2.62 persons per family.
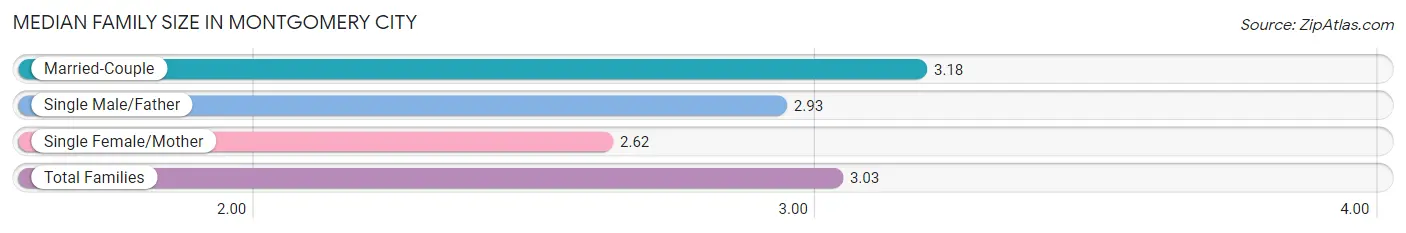
| Family Type | # Families | Family Size |
| Married-Couple | 474 (70.2%) | 3.18 |
| Single Male/Father | 55 (8.2%) | 2.93 |
| Single Female/Mother | 146 (21.6%) | 2.62 |
| Total Families | 675 (100.0%) | 3.03 |
Median Household Size in Montgomery City
The median household size in Montgomery City is 2.17 persons per household, with married-couple households (474 | 37.3%) accounting for the largest median household size of 3.19 persons per household. non-family households (594 | 46.8%) represent the smallest median household size with 1.14 persons per household.
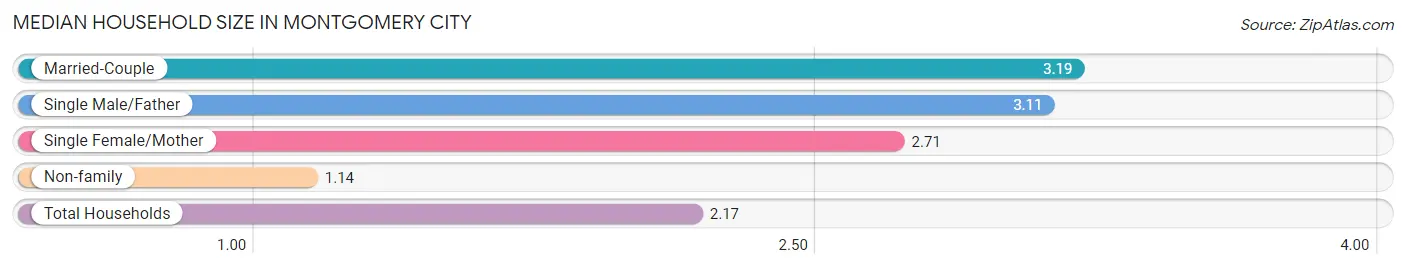
| Household Type | # Households | Household Size |
| Married-Couple | 474 (37.3%) | 3.19 |
| Single Male/Father | 55 (4.3%) | 3.11 |
| Single Female/Mother | 146 (11.5%) | 2.71 |
| Non-family | 594 (46.8%) | 1.14 |
| Total Households | 1,269 (100.0%) | 2.17 |
Household Size by Marriage Status in Montgomery City
Out of a total of 1,269 households in Montgomery City, 675 (53.2%) are family households, while 594 (46.8%) are nonfamily households. The most numerous type of family households are 2-person households, comprising 294, and the most common type of nonfamily households are 1-person households, comprising 523.
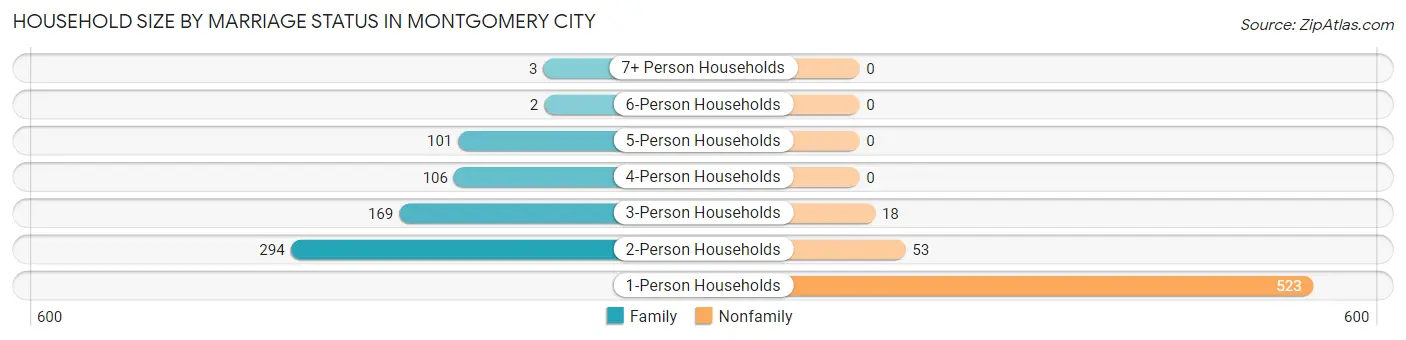
| Household Size | Family Households | Nonfamily Households |
| 1-Person Households | - | 523 (41.2%) |
| 2-Person Households | 294 (23.2%) | 53 (4.2%) |
| 3-Person Households | 169 (13.3%) | 18 (1.4%) |
| 4-Person Households | 106 (8.4%) | 0 (0.0%) |
| 5-Person Households | 101 (8.0%) | 0 (0.0%) |
| 6-Person Households | 2 (0.2%) | 0 (0.0%) |
| 7+ Person Households | 3 (0.2%) | 0 (0.0%) |
| Total | 675 (53.2%) | 594 (46.8%) |
Female Fertility in Montgomery City
Fertility by Age in Montgomery City
Average fertility rate in Montgomery City is 53.0 births per 1,000 women. Women in the age bracket of 20 to 34 years have the highest fertility rate with 114.0 births per 1,000 women. Women in the age bracket of 20 to 34 years acount for 100.0% of all women with births.
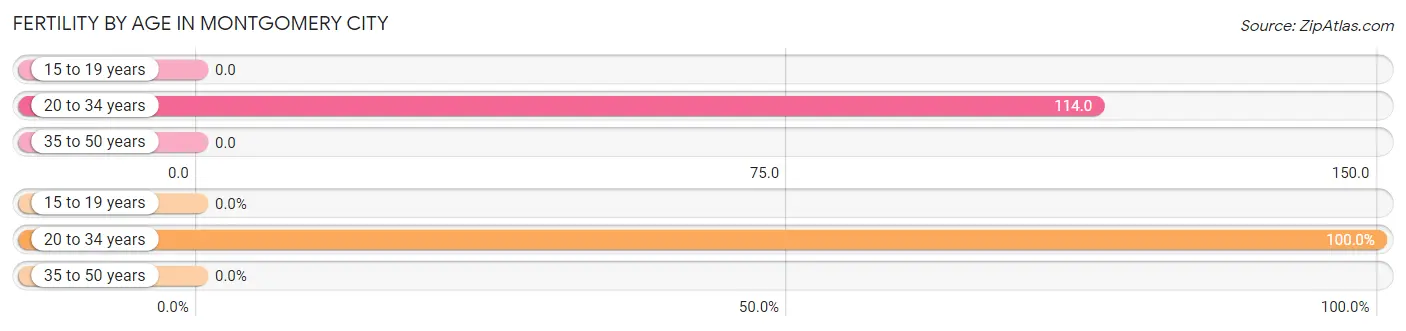
| Age Bracket | Women with Births | Births / 1,000 Women |
| 15 to 19 years | 0 (0.0%) | 0.0 |
| 20 to 34 years | 36 (100.0%) | 114.0 |
| 35 to 50 years | 0 (0.0%) | 0.0 |
| Total | 36 (100.0%) | 53.0 |
Fertility by Age by Marriage Status in Montgomery City
77.8% of women with births (36) in Montgomery City are married. The highest percentage of unmarried women with births falls into 20 to 34 years age bracket with 22.2% of them unmarried at the time of birth, while the lowest percentage of unmarried women with births belong to 20 to 34 years age bracket with 22.2% of them unmarried.
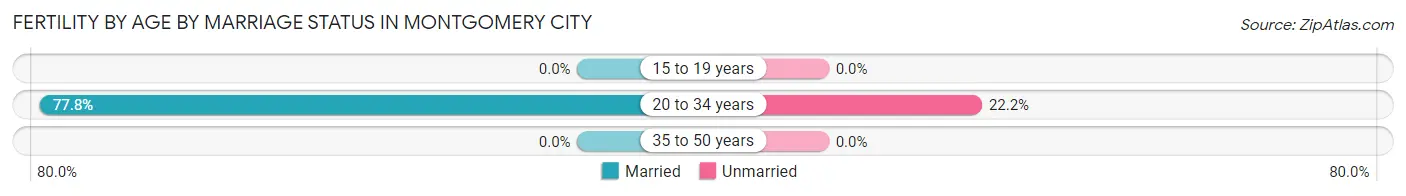
| Age Bracket | Married | Unmarried |
| 15 to 19 years | 0 (0.0%) | 0 (0.0%) |
| 20 to 34 years | 28 (77.8%) | 8 (22.2%) |
| 35 to 50 years | 0 (0.0%) | 0 (0.0%) |
| Total | 28 (77.8%) | 8 (22.2%) |
Fertility by Education in Montgomery City
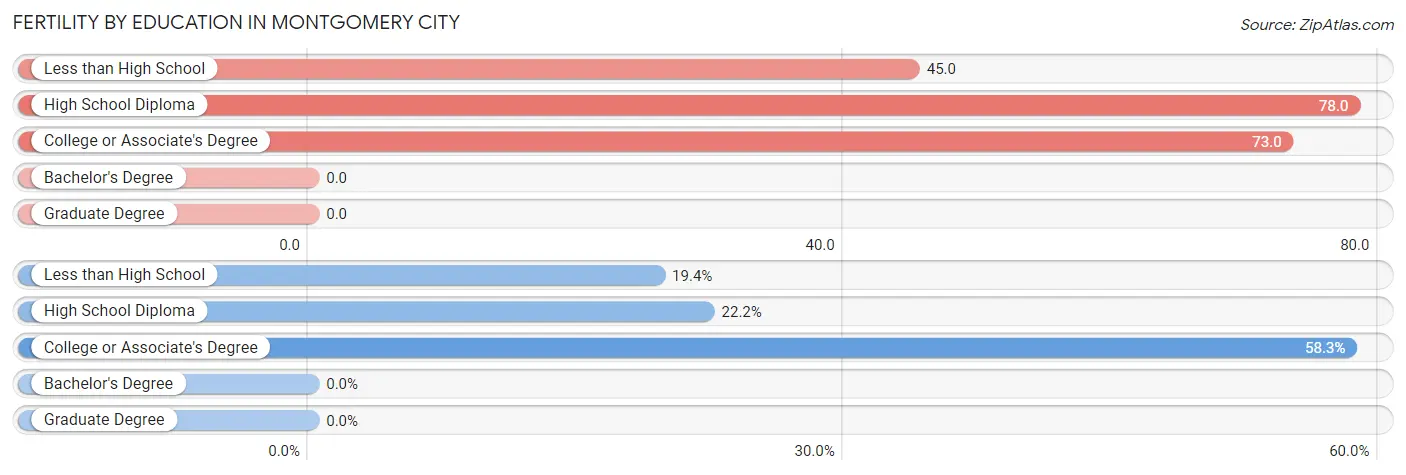
| Educational Attainment | Women with Births | Births / 1,000 Women |
| Less than High School | 7 (19.4%) | 45.0 |
| High School Diploma | 8 (22.2%) | 78.0 |
| College or Associate's Degree | 21 (58.3%) | 73.0 |
| Bachelor's Degree | 0 (0.0%) | 0.0 |
| Graduate Degree | 0 (0.0%) | 0.0 |
| Total | 36 (100.0%) | 53.0 |
Fertility by Education by Marriage Status in Montgomery City
22.2% of women with births in Montgomery City are unmarried. Women with the educational attainment of less than high school are most likely to be married with 100.0% of them married at childbirth, while women with the educational attainment of high school diploma are least likely to be married with 100.0% of them unmarried at childbirth.
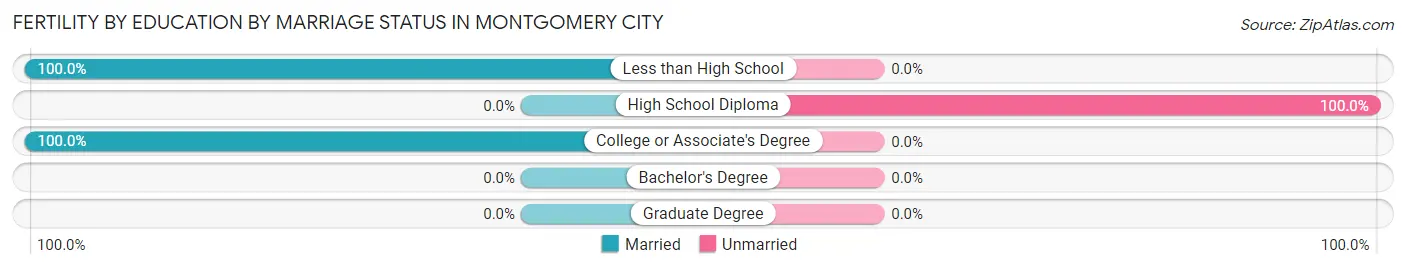
| Educational Attainment | Married | Unmarried |
| Less than High School | 7 (100.0%) | 0 (0.0%) |
| High School Diploma | 0 (0.0%) | 8 (100.0%) |
| College or Associate's Degree | 21 (100.0%) | 0 (0.0%) |
| Bachelor's Degree | 0 (0.0%) | 0 (0.0%) |
| Graduate Degree | 0 (0.0%) | 0 (0.0%) |
| Total | 28 (77.8%) | 8 (22.2%) |
Employment Characteristics in Montgomery City
Employment by Class of Employer in Montgomery City
Among the 1,319 employed individuals in Montgomery City, private company employees (843 | 63.9%), not-for-profit organizations (203 | 15.4%), and local government employees (127 | 9.6%) make up the most common classes of employment.
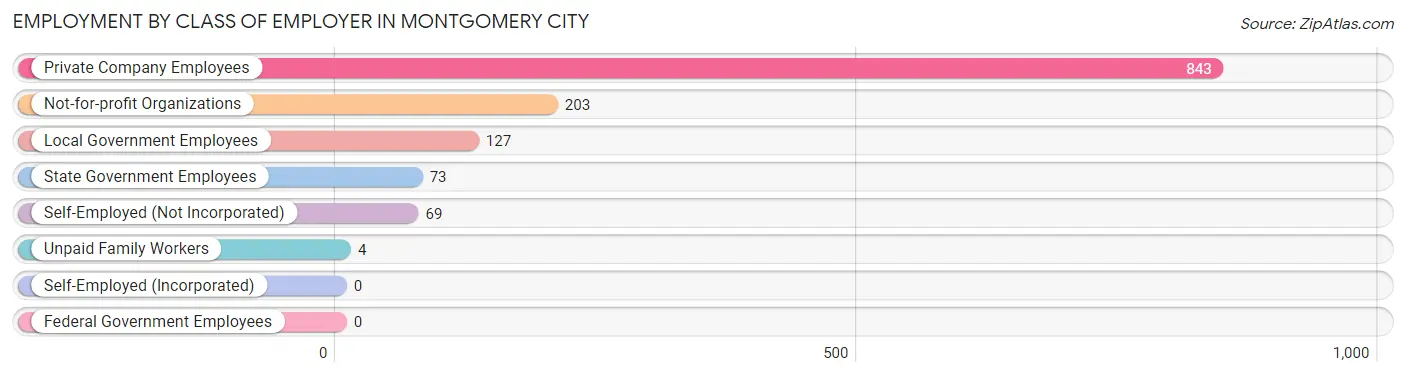
| Employer Class | # Employees | % Employees |
| Private Company Employees | 843 | 63.9% |
| Self-Employed (Incorporated) | 0 | 0.0% |
| Self-Employed (Not Incorporated) | 69 | 5.2% |
| Not-for-profit Organizations | 203 | 15.4% |
| Local Government Employees | 127 | 9.6% |
| State Government Employees | 73 | 5.5% |
| Federal Government Employees | 0 | 0.0% |
| Unpaid Family Workers | 4 | 0.3% |
| Total | 1,319 | 100.0% |
Employment Status by Age in Montgomery City
According to the labor force statistics for Montgomery City, out of the total population over 16 years of age (2,225), 64.0% or 1,424 individuals are in the labor force, with 4.0% or 57 of them unemployed. The age group with the highest labor force participation rate is 25 to 29 years, with 88.7% or 181 individuals in the labor force. Within the labor force, the 75 years and over age range has the highest percentage of unemployed individuals, with 31.6% or 12 of them being unemployed.
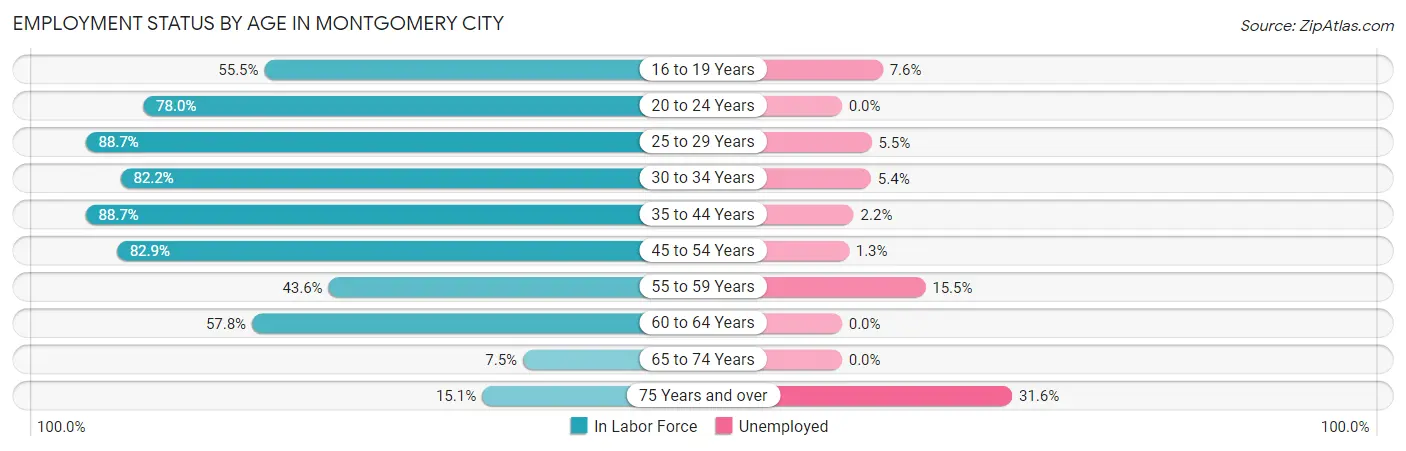
| Age Bracket | In Labor Force | Unemployed |
| 16 to 19 Years | 66 (55.5%) | 5 (7.6%) |
| 20 to 24 Years | 135 (78.0%) | 0 (0.0%) |
| 25 to 29 Years | 181 (88.7%) | 10 (5.5%) |
| 30 to 34 Years | 166 (82.2%) | 9 (5.4%) |
| 35 to 44 Years | 362 (88.7%) | 8 (2.2%) |
| 45 to 54 Years | 315 (82.9%) | 4 (1.3%) |
| 55 to 59 Years | 58 (43.6%) | 9 (15.5%) |
| 60 to 64 Years | 89 (57.8%) | 0 (0.0%) |
| 65 to 74 Years | 15 (7.5%) | 0 (0.0%) |
| 75 Years and over | 38 (15.1%) | 12 (31.6%) |
| Total | 1,424 (64.0%) | 57 (4.0%) |
Employment Status by Educational Attainment in Montgomery City
According to labor force statistics for Montgomery City, 79.1% of individuals (1,171) out of the total population between 25 and 64 years of age (1,481) are in the labor force, with 3.4% or 40 of them being unemployed. The group with the highest labor force participation rate are those with the educational attainment of bachelor's degree or higher, with 87.5% or 300 individuals in the labor force. Within the labor force, individuals with bachelor's degree or higher education have the highest percentage of unemployment, with 7.7% or 23 of them being unemployed.
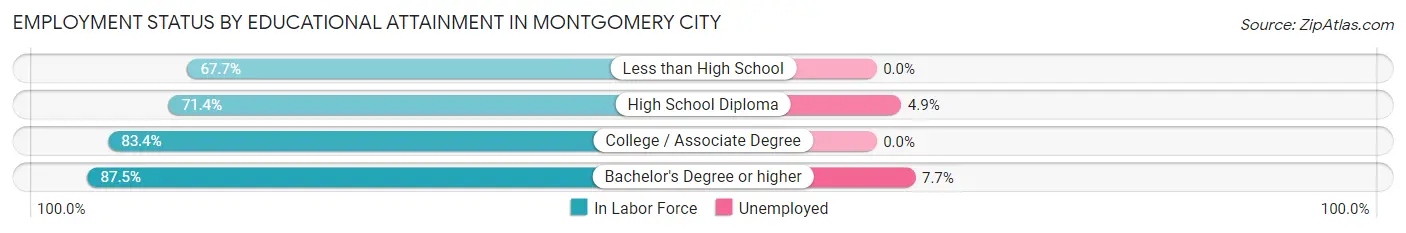
| Educational Attainment | In Labor Force | Unemployed |
| Less than High School | 86 (67.7%) | 0 (0.0%) |
| High School Diploma | 344 (71.4%) | 24 (4.9%) |
| College / Associate Degree | 441 (83.4%) | 0 (0.0%) |
| Bachelor's Degree or higher | 300 (87.5%) | 26 (7.7%) |
| Total | 1,171 (79.1%) | 50 (3.4%) |
Employment Occupations by Sex in Montgomery City
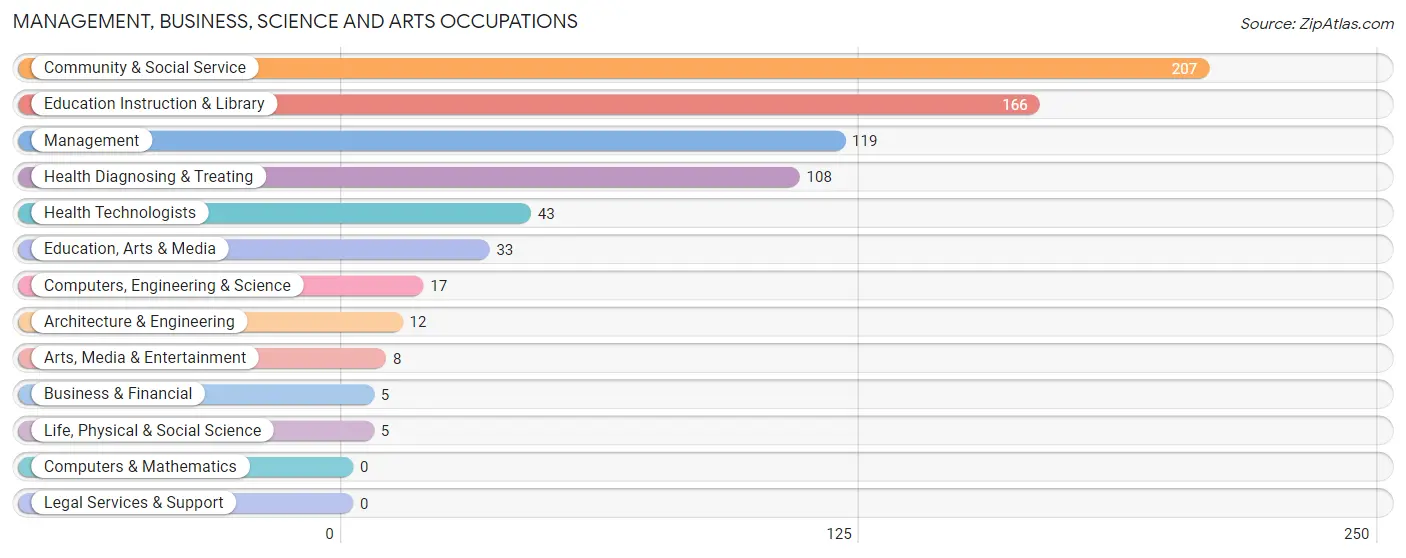
Management, Business, Science and Arts Occupations
The most common Management, Business, Science and Arts occupations in Montgomery City are Community & Social Service (207 | 15.1%), Education Instruction & Library (166 | 12.1%), Management (119 | 8.7%), Health Diagnosing & Treating (108 | 7.9%), and Health Technologists (43 | 3.1%).
Management, Business, Science and Arts Occupations by Sex
Within the Management, Business, Science and Arts occupations in Montgomery City, the most male-oriented occupations are Computers, Engineering & Science (100.0%), Architecture & Engineering (100.0%), and Life, Physical & Social Science (100.0%), while the most female-oriented occupations are Business & Financial (100.0%), Arts, Media & Entertainment (100.0%), and Health Technologists (100.0%).
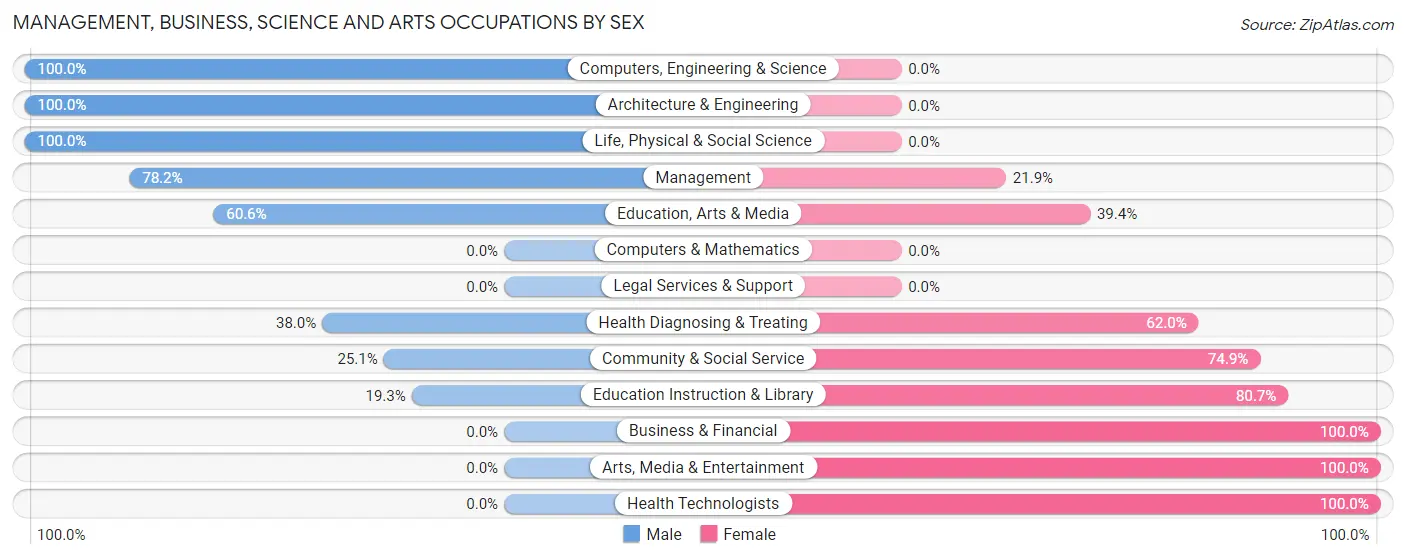
| Occupation | Male | Female |
| Management | 93 (78.1%) | 26 (21.8%) |
| Business & Financial | 0 (0.0%) | 5 (100.0%) |
| Computers, Engineering & Science | 17 (100.0%) | 0 (0.0%) |
| Computers & Mathematics | 0 (0.0%) | 0 (0.0%) |
| Architecture & Engineering | 12 (100.0%) | 0 (0.0%) |
| Life, Physical & Social Science | 5 (100.0%) | 0 (0.0%) |
| Community & Social Service | 52 (25.1%) | 155 (74.9%) |
| Education, Arts & Media | 20 (60.6%) | 13 (39.4%) |
| Legal Services & Support | 0 (0.0%) | 0 (0.0%) |
| Education Instruction & Library | 32 (19.3%) | 134 (80.7%) |
| Arts, Media & Entertainment | 0 (0.0%) | 8 (100.0%) |
| Health Diagnosing & Treating | 41 (38.0%) | 67 (62.0%) |
| Health Technologists | 0 (0.0%) | 43 (100.0%) |
| Total (Category) | 203 (44.5%) | 253 (55.5%) |
| Total (Overall) | 668 (48.8%) | 700 (51.2%) |
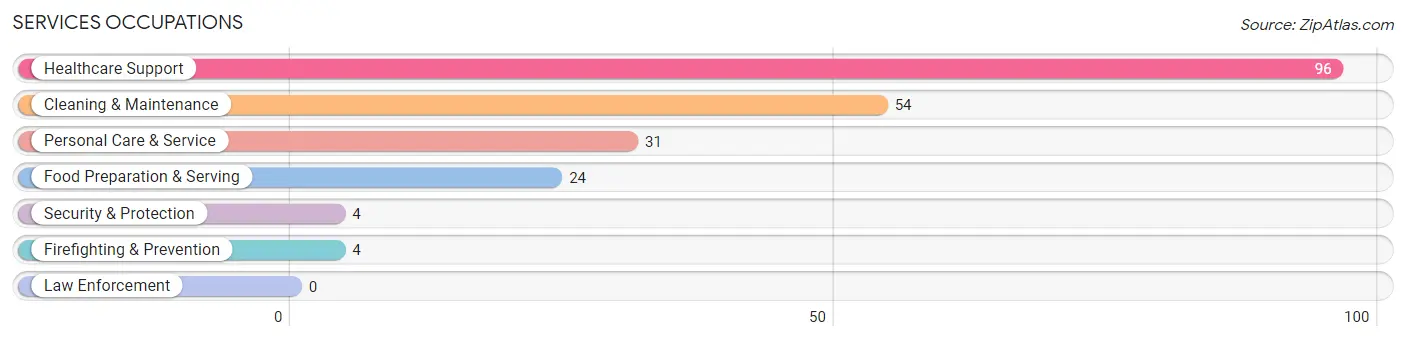
Services Occupations
The most common Services occupations in Montgomery City are Healthcare Support (96 | 7.0%), Cleaning & Maintenance (54 | 4.0%), Personal Care & Service (31 | 2.3%), Food Preparation & Serving (24 | 1.8%), and Security & Protection (4 | 0.3%).
Services Occupations by Sex
Within the Services occupations in Montgomery City, the most male-oriented occupations are Security & Protection (100.0%), Firefighting & Prevention (100.0%), and Cleaning & Maintenance (48.1%), while the most female-oriented occupations are Personal Care & Service (87.1%), Food Preparation & Serving (75.0%), and Healthcare Support (65.6%).
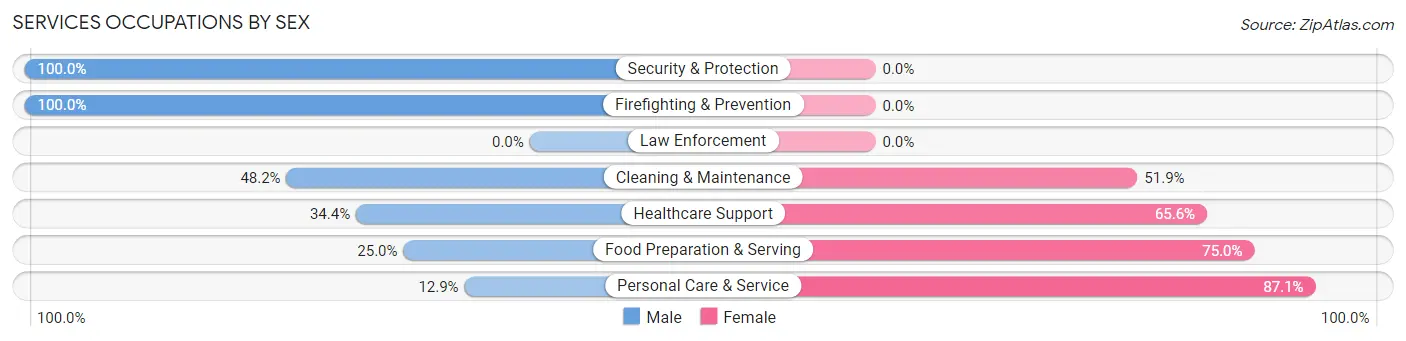
| Occupation | Male | Female |
| Healthcare Support | 33 (34.4%) | 63 (65.6%) |
| Security & Protection | 4 (100.0%) | 0 (0.0%) |
| Firefighting & Prevention | 4 (100.0%) | 0 (0.0%) |
| Law Enforcement | 0 (0.0%) | 0 (0.0%) |
| Food Preparation & Serving | 6 (25.0%) | 18 (75.0%) |
| Cleaning & Maintenance | 26 (48.1%) | 28 (51.8%) |
| Personal Care & Service | 4 (12.9%) | 27 (87.1%) |
| Total (Category) | 73 (34.9%) | 136 (65.1%) |
| Total (Overall) | 668 (48.8%) | 700 (51.2%) |
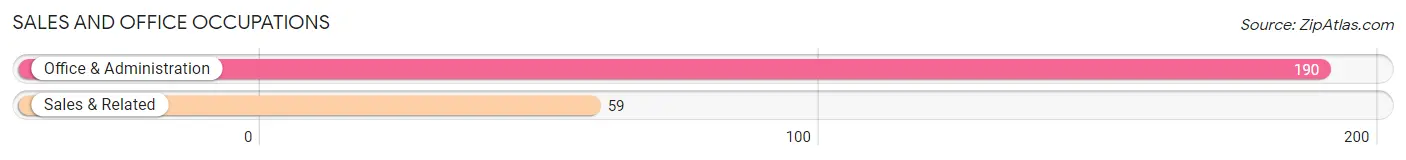
Sales and Office Occupations
The most common Sales and Office occupations in Montgomery City are Office & Administration (190 | 13.9%), and Sales & Related (59 | 4.3%).
Sales and Office Occupations by Sex
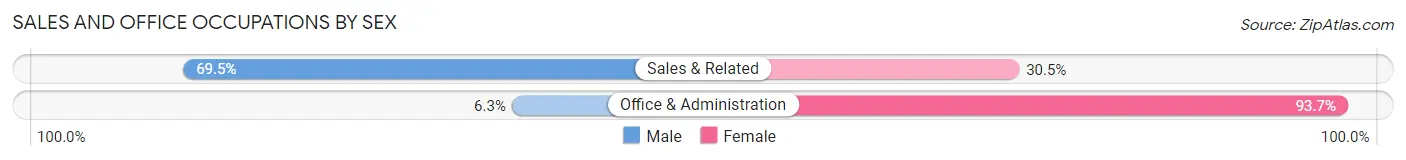
| Occupation | Male | Female |
| Sales & Related | 41 (69.5%) | 18 (30.5%) |
| Office & Administration | 12 (6.3%) | 178 (93.7%) |
| Total (Category) | 53 (21.3%) | 196 (78.7%) |
| Total (Overall) | 668 (48.8%) | 700 (51.2%) |
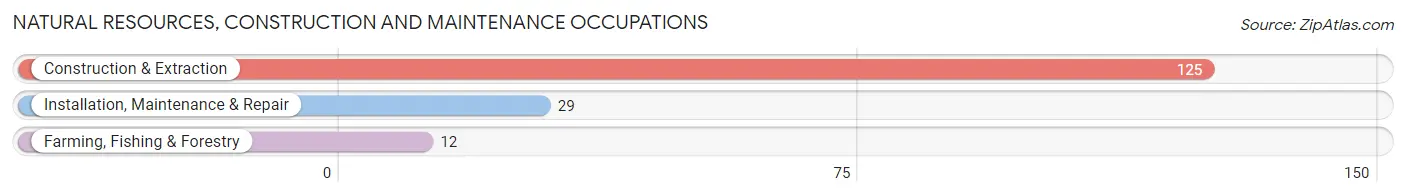
Natural Resources, Construction and Maintenance Occupations
The most common Natural Resources, Construction and Maintenance occupations in Montgomery City are Construction & Extraction (125 | 9.1%), Installation, Maintenance & Repair (29 | 2.1%), and Farming, Fishing & Forestry (12 | 0.9%).
Natural Resources, Construction and Maintenance Occupations by Sex
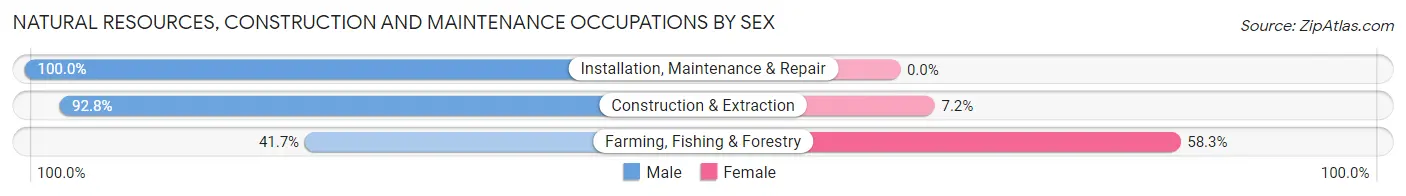
| Occupation | Male | Female |
| Farming, Fishing & Forestry | 5 (41.7%) | 7 (58.3%) |
| Construction & Extraction | 116 (92.8%) | 9 (7.2%) |
| Installation, Maintenance & Repair | 29 (100.0%) | 0 (0.0%) |
| Total (Category) | 150 (90.4%) | 16 (9.6%) |
| Total (Overall) | 668 (48.8%) | 700 (51.2%) |
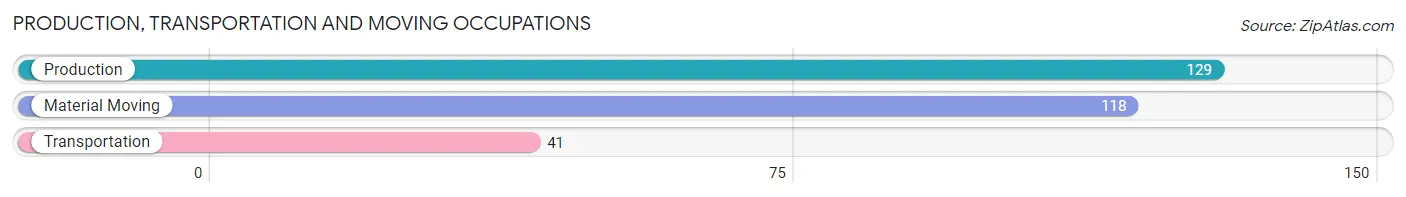
Production, Transportation and Moving Occupations
The most common Production, Transportation and Moving occupations in Montgomery City are Production (129 | 9.4%), Material Moving (118 | 8.6%), and Transportation (41 | 3.0%).
Production, Transportation and Moving Occupations by Sex
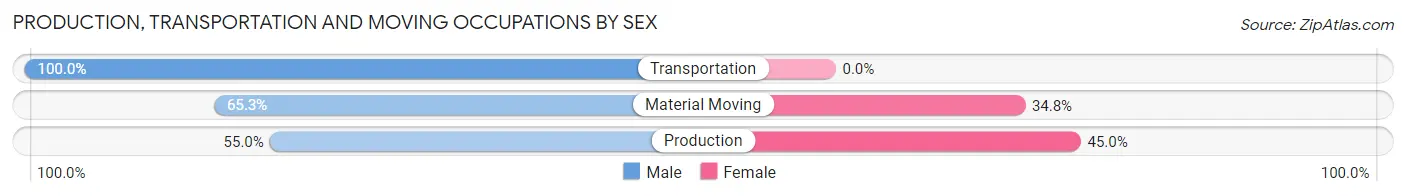
| Occupation | Male | Female |
| Production | 71 (55.0%) | 58 (45.0%) |
| Transportation | 41 (100.0%) | 0 (0.0%) |
| Material Moving | 77 (65.2%) | 41 (34.7%) |
| Total (Category) | 189 (65.6%) | 99 (34.4%) |
| Total (Overall) | 668 (48.8%) | 700 (51.2%) |
Employment Industries by Sex in Montgomery City
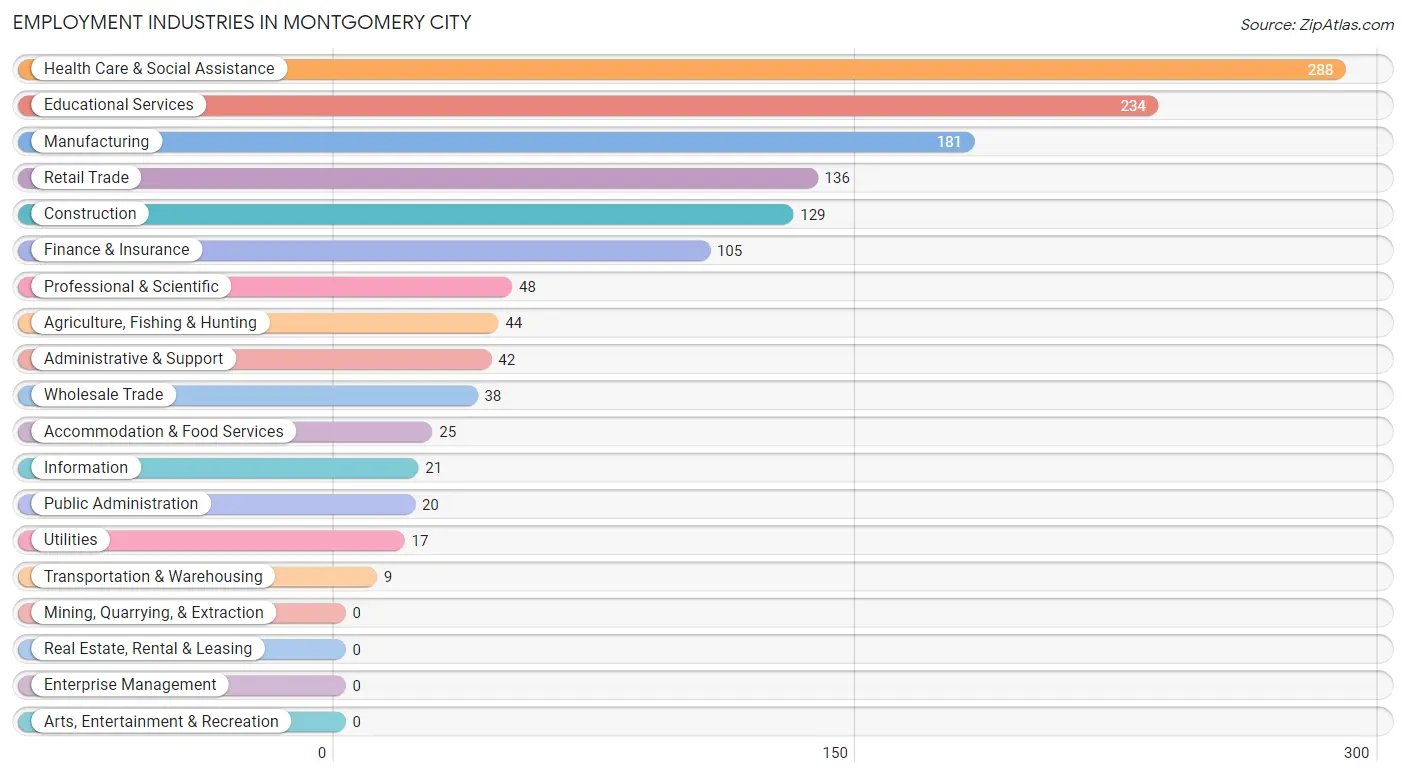
Employment Industries in Montgomery City
The major employment industries in Montgomery City include Health Care & Social Assistance (288 | 21.0%), Educational Services (234 | 17.1%), Manufacturing (181 | 13.2%), Retail Trade (136 | 9.9%), and Construction (129 | 9.4%).
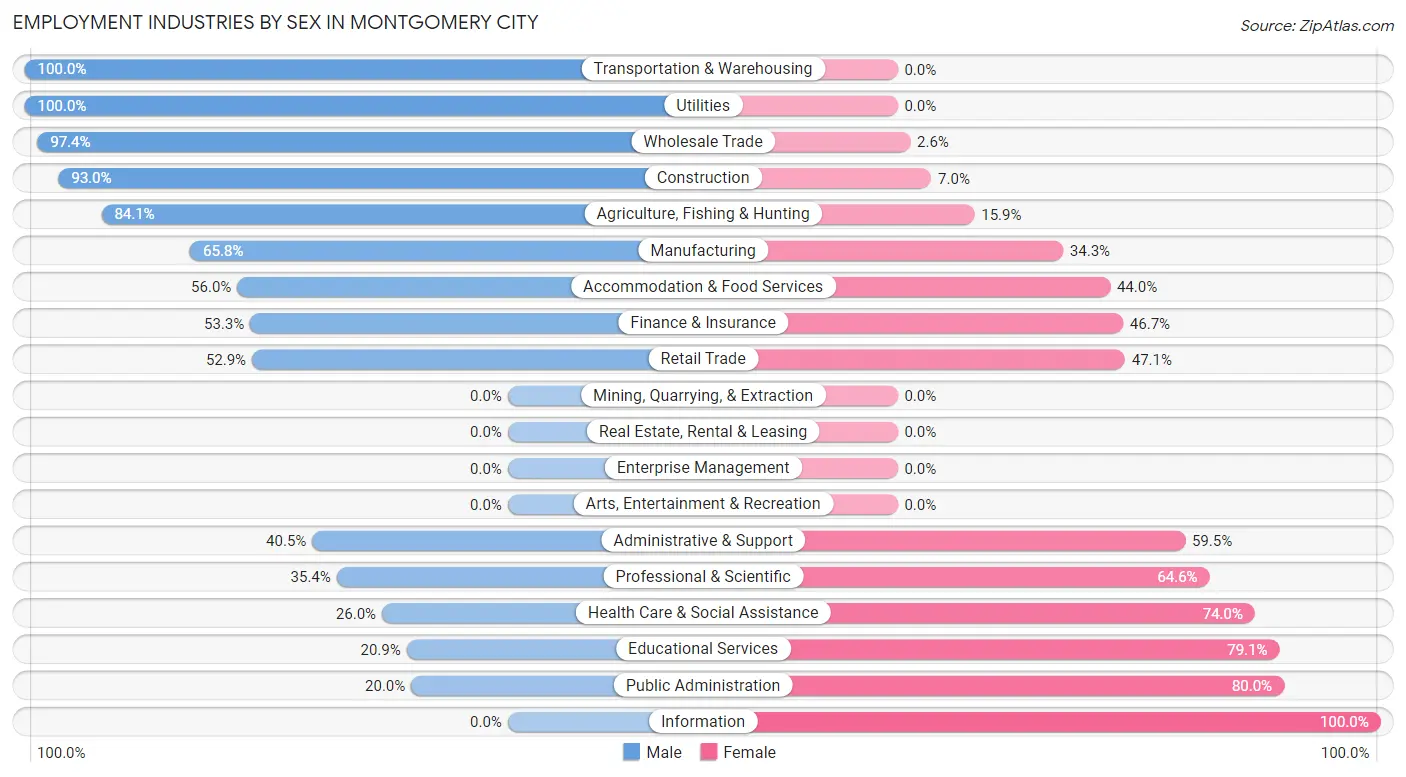
Employment Industries by Sex in Montgomery City
The Montgomery City industries that see more men than women are Transportation & Warehousing (100.0%), Utilities (100.0%), and Wholesale Trade (97.4%), whereas the industries that tend to have a higher number of women are Information (100.0%), Public Administration (80.0%), and Educational Services (79.1%).
| Industry | Male | Female |
| Agriculture, Fishing & Hunting | 37 (84.1%) | 7 (15.9%) |
| Mining, Quarrying, & Extraction | 0 (0.0%) | 0 (0.0%) |
| Construction | 120 (93.0%) | 9 (7.0%) |
| Manufacturing | 119 (65.7%) | 62 (34.3%) |
| Wholesale Trade | 37 (97.4%) | 1 (2.6%) |
| Retail Trade | 72 (52.9%) | 64 (47.1%) |
| Transportation & Warehousing | 9 (100.0%) | 0 (0.0%) |
| Utilities | 17 (100.0%) | 0 (0.0%) |
| Information | 0 (0.0%) | 21 (100.0%) |
| Finance & Insurance | 56 (53.3%) | 49 (46.7%) |
| Real Estate, Rental & Leasing | 0 (0.0%) | 0 (0.0%) |
| Professional & Scientific | 17 (35.4%) | 31 (64.6%) |
| Enterprise Management | 0 (0.0%) | 0 (0.0%) |
| Administrative & Support | 17 (40.5%) | 25 (59.5%) |
| Educational Services | 49 (20.9%) | 185 (79.1%) |
| Health Care & Social Assistance | 75 (26.0%) | 213 (74.0%) |
| Arts, Entertainment & Recreation | 0 (0.0%) | 0 (0.0%) |
| Accommodation & Food Services | 14 (56.0%) | 11 (44.0%) |
| Public Administration | 4 (20.0%) | 16 (80.0%) |
| Total | 668 (48.8%) | 700 (51.2%) |
Education in Montgomery City
School Enrollment in Montgomery City
The most common levels of schooling among the 627 students in Montgomery City are high school (156 | 24.9%), college / undergraduate (156 | 24.9%), and elementary school (137 | 21.8%).
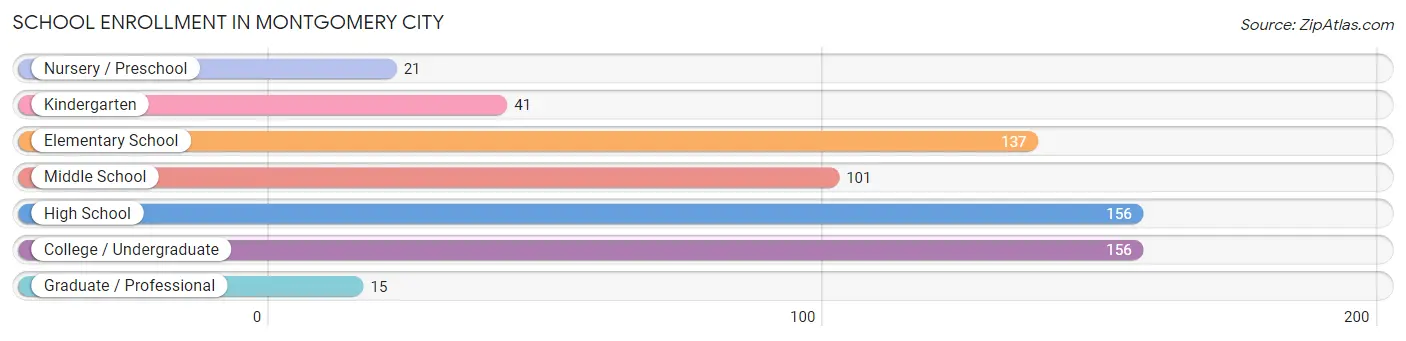
| School Level | # Students | % Students |
| Nursery / Preschool | 21 | 3.4% |
| Kindergarten | 41 | 6.5% |
| Elementary School | 137 | 21.8% |
| Middle School | 101 | 16.1% |
| High School | 156 | 24.9% |
| College / Undergraduate | 156 | 24.9% |
| Graduate / Professional | 15 | 2.4% |
| Total | 627 | 100.0% |
School Enrollment by Age by Funding Source in Montgomery City
Out of a total of 627 students who are enrolled in schools in Montgomery City, 32 (5.1%) attend a private institution, while the remaining 595 (94.9%) are enrolled in public schools. The age group of 25 to 34 year olds has the highest likelihood of being enrolled in private schools, with 5 (15.1% in the age bracket) enrolled. Conversely, the age group of 3 to 4 year olds has the lowest likelihood of being enrolled in a private school, with 16 (100.0% in the age bracket) attending a public institution.
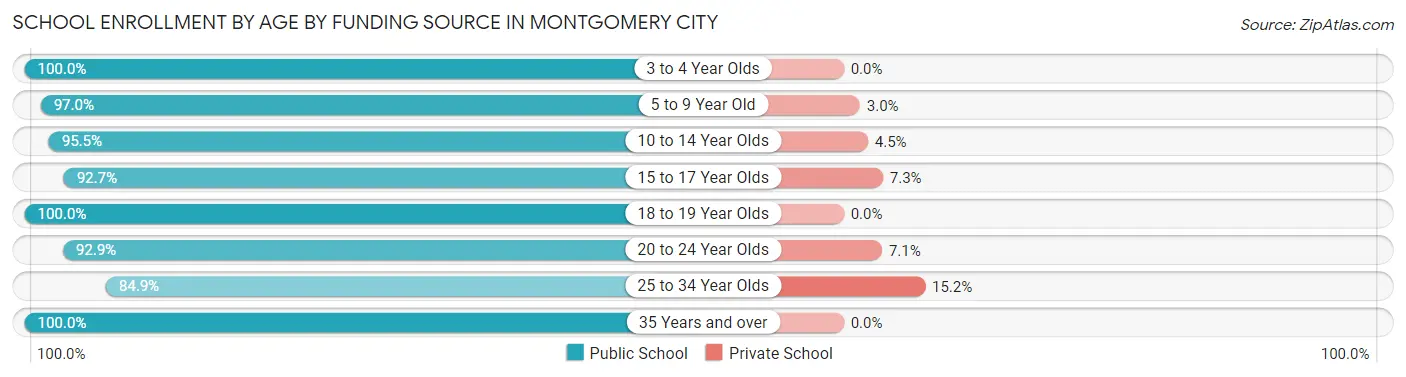
| Age Bracket | Public School | Private School |
| 3 to 4 Year Olds | 16 (100.0%) | 0 (0.0%) |
| 5 to 9 Year Old | 161 (97.0%) | 5 (3.0%) |
| 10 to 14 Year Olds | 127 (95.5%) | 6 (4.5%) |
| 15 to 17 Year Olds | 127 (92.7%) | 10 (7.3%) |
| 18 to 19 Year Olds | 4 (100.0%) | 0 (0.0%) |
| 20 to 24 Year Olds | 78 (92.9%) | 6 (7.1%) |
| 25 to 34 Year Olds | 28 (84.9%) | 5 (15.1%) |
| 35 Years and over | 54 (100.0%) | 0 (0.0%) |
| Total | 595 (94.9%) | 32 (5.1%) |
Educational Attainment by Field of Study in Montgomery City
Education (137 | 31.4%), liberal arts & history (71 | 16.3%), bio, nature & agricultural (57 | 13.1%), business (56 | 12.8%), and arts & humanities (22 | 5.1%) are the most common fields of study among 436 individuals in Montgomery City who have obtained a bachelor's degree or higher.
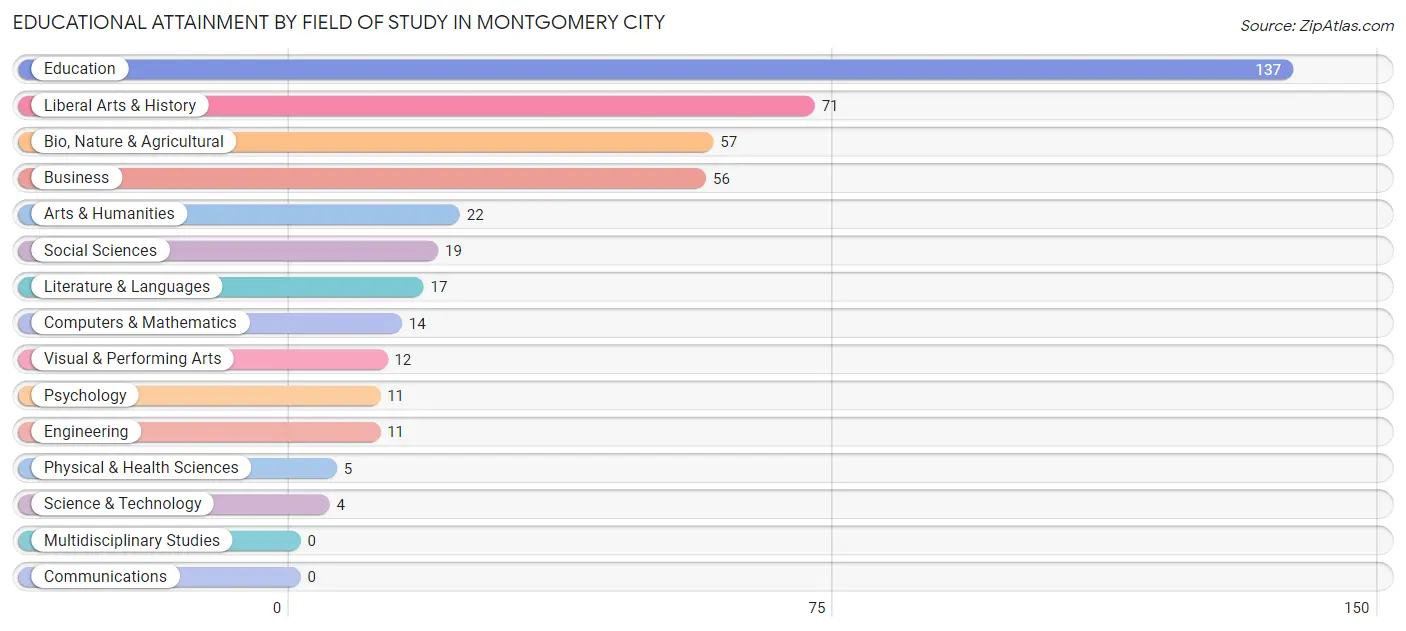
| Field of Study | # Graduates | % Graduates |
| Computers & Mathematics | 14 | 3.2% |
| Bio, Nature & Agricultural | 57 | 13.1% |
| Physical & Health Sciences | 5 | 1.1% |
| Psychology | 11 | 2.5% |
| Social Sciences | 19 | 4.4% |
| Engineering | 11 | 2.5% |
| Multidisciplinary Studies | 0 | 0.0% |
| Science & Technology | 4 | 0.9% |
| Business | 56 | 12.8% |
| Education | 137 | 31.4% |
| Literature & Languages | 17 | 3.9% |
| Liberal Arts & History | 71 | 16.3% |
| Visual & Performing Arts | 12 | 2.8% |
| Communications | 0 | 0.0% |
| Arts & Humanities | 22 | 5.1% |
| Total | 436 | 100.0% |
Transportation & Commute in Montgomery City
Vehicle Availability by Sex in Montgomery City
The most prevalent vehicle ownership categories in Montgomery City are males with 2 vehicles (271, accounting for 42.2%) and females with 2 vehicles (260, making up 40.2%).
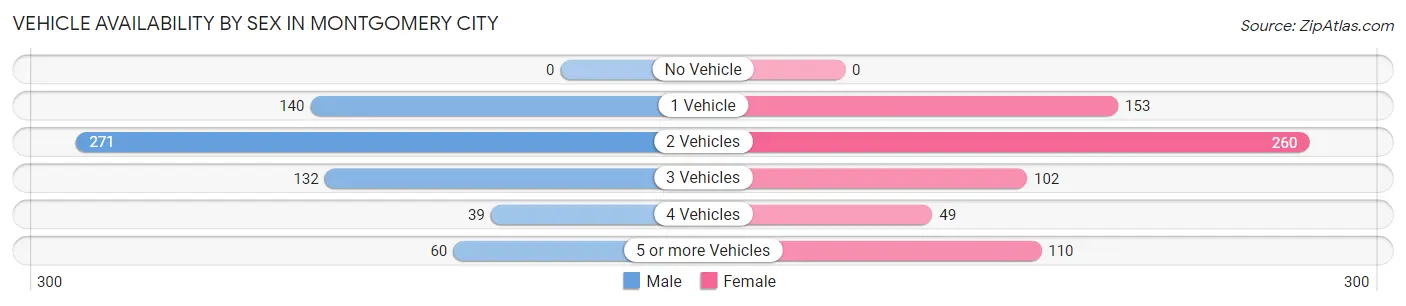
| Vehicles Available | Male | Female |
| No Vehicle | 0 (0.0%) | 0 (0.0%) |
| 1 Vehicle | 140 (21.8%) | 153 (22.7%) |
| 2 Vehicles | 271 (42.2%) | 260 (38.6%) |
| 3 Vehicles | 132 (20.6%) | 102 (15.1%) |
| 4 Vehicles | 39 (6.1%) | 49 (7.3%) |
| 5 or more Vehicles | 60 (9.3%) | 110 (16.3%) |
| Total | 642 (100.0%) | 674 (100.0%) |
Commute Time in Montgomery City
The most frequently occuring commute durations in Montgomery City are 5 to 9 minutes (236 commuters, 19.7%), 45 to 59 minutes (206 commuters, 17.2%), and 30 to 34 minutes (162 commuters, 13.5%).
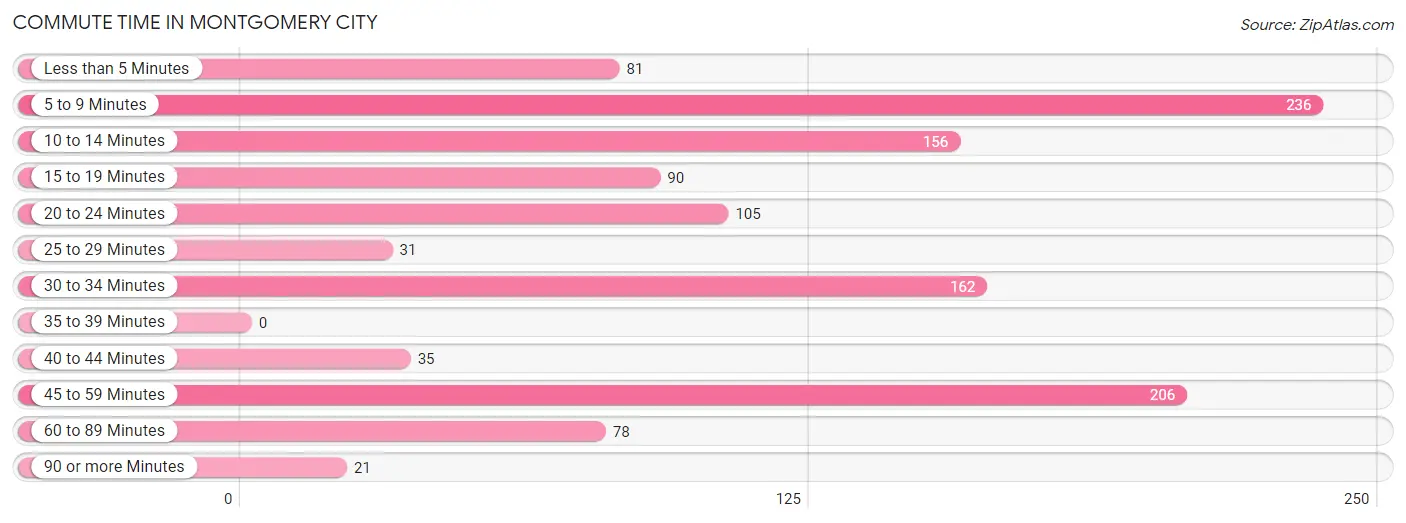
| Commute Time | # Commuters | % Commuters |
| Less than 5 Minutes | 81 | 6.7% |
| 5 to 9 Minutes | 236 | 19.7% |
| 10 to 14 Minutes | 156 | 13.0% |
| 15 to 19 Minutes | 90 | 7.5% |
| 20 to 24 Minutes | 105 | 8.7% |
| 25 to 29 Minutes | 31 | 2.6% |
| 30 to 34 Minutes | 162 | 13.5% |
| 35 to 39 Minutes | 0 | 0.0% |
| 40 to 44 Minutes | 35 | 2.9% |
| 45 to 59 Minutes | 206 | 17.2% |
| 60 to 89 Minutes | 78 | 6.5% |
| 90 or more Minutes | 21 | 1.8% |
Commute Time by Sex in Montgomery City
The most common commute times in Montgomery City are 45 to 59 minutes (122 commuters, 19.6%) for males and 5 to 9 minutes (129 commuters, 22.4%) for females.
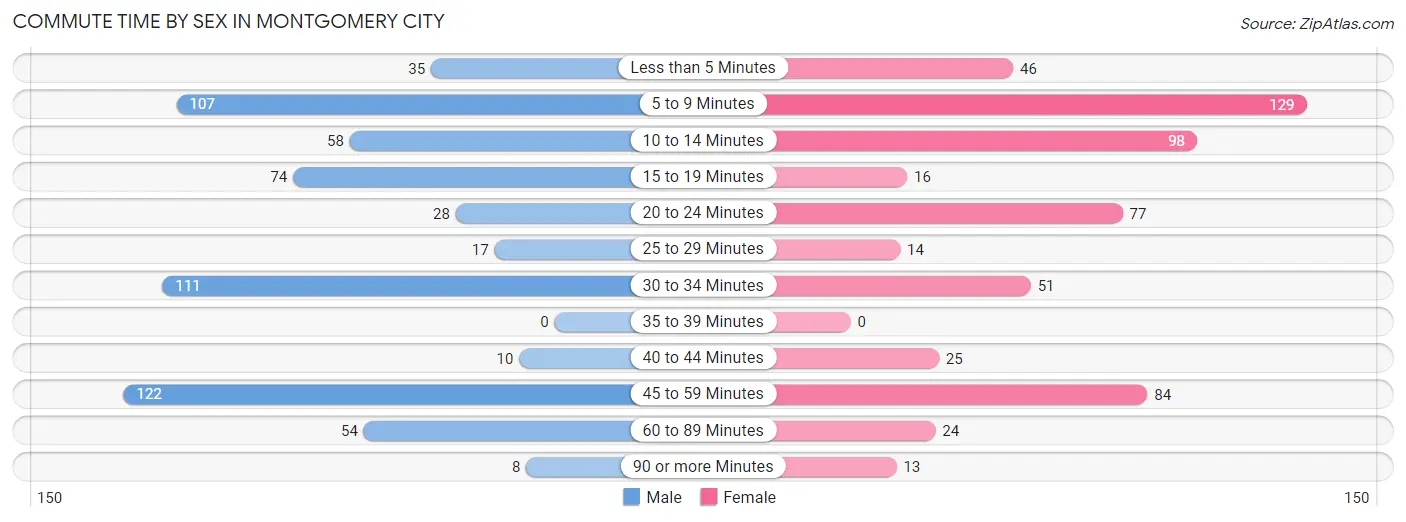
| Commute Time | Male | Female |
| Less than 5 Minutes | 35 (5.6%) | 46 (8.0%) |
| 5 to 9 Minutes | 107 (17.2%) | 129 (22.4%) |
| 10 to 14 Minutes | 58 (9.3%) | 98 (17.0%) |
| 15 to 19 Minutes | 74 (11.9%) | 16 (2.8%) |
| 20 to 24 Minutes | 28 (4.5%) | 77 (13.3%) |
| 25 to 29 Minutes | 17 (2.7%) | 14 (2.4%) |
| 30 to 34 Minutes | 111 (17.8%) | 51 (8.8%) |
| 35 to 39 Minutes | 0 (0.0%) | 0 (0.0%) |
| 40 to 44 Minutes | 10 (1.6%) | 25 (4.3%) |
| 45 to 59 Minutes | 122 (19.6%) | 84 (14.6%) |
| 60 to 89 Minutes | 54 (8.6%) | 24 (4.2%) |
| 90 or more Minutes | 8 (1.3%) | 13 (2.2%) |
Time of Departure to Work by Sex in Montgomery City
The most frequent times of departure to work in Montgomery City are 5:30 AM to 5:59 AM (100, 16.0%) for males and 7:30 AM to 7:59 AM (145, 25.1%) for females.
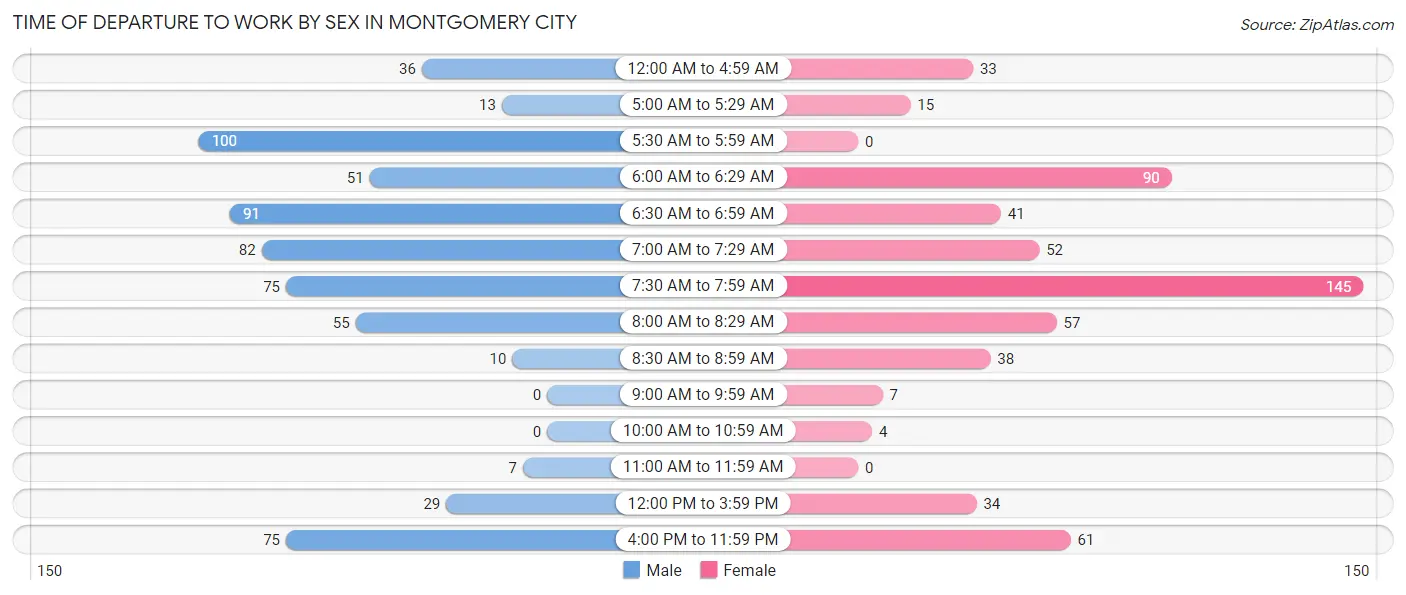
| Time of Departure | Male | Female |
| 12:00 AM to 4:59 AM | 36 (5.8%) | 33 (5.7%) |
| 5:00 AM to 5:29 AM | 13 (2.1%) | 15 (2.6%) |
| 5:30 AM to 5:59 AM | 100 (16.0%) | 0 (0.0%) |
| 6:00 AM to 6:29 AM | 51 (8.2%) | 90 (15.6%) |
| 6:30 AM to 6:59 AM | 91 (14.6%) | 41 (7.1%) |
| 7:00 AM to 7:29 AM | 82 (13.1%) | 52 (9.0%) |
| 7:30 AM to 7:59 AM | 75 (12.0%) | 145 (25.1%) |
| 8:00 AM to 8:29 AM | 55 (8.8%) | 57 (9.9%) |
| 8:30 AM to 8:59 AM | 10 (1.6%) | 38 (6.6%) |
| 9:00 AM to 9:59 AM | 0 (0.0%) | 7 (1.2%) |
| 10:00 AM to 10:59 AM | 0 (0.0%) | 4 (0.7%) |
| 11:00 AM to 11:59 AM | 7 (1.1%) | 0 (0.0%) |
| 12:00 PM to 3:59 PM | 29 (4.6%) | 34 (5.9%) |
| 4:00 PM to 11:59 PM | 75 (12.0%) | 61 (10.6%) |
| Total | 624 (100.0%) | 577 (100.0%) |
Housing Occupancy in Montgomery City
Occupancy by Ownership in Montgomery City
Of the total 1,269 dwellings in Montgomery City, owner-occupied units account for 834 (65.7%), while renter-occupied units make up 435 (34.3%).
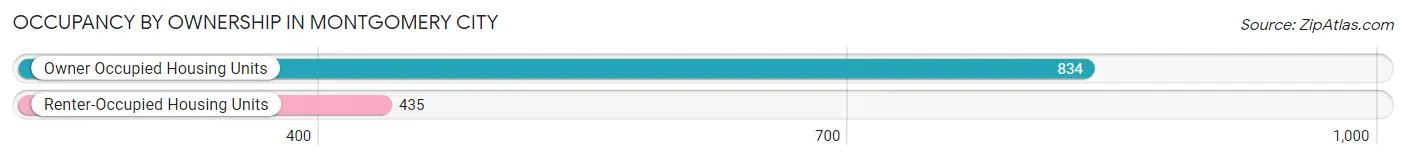
| Occupancy | # Housing Units | % Housing Units |
| Owner Occupied Housing Units | 834 | 65.7% |
| Renter-Occupied Housing Units | 435 | 34.3% |
| Total Occupied Housing Units | 1,269 | 100.0% |
Occupancy by Household Size in Montgomery City
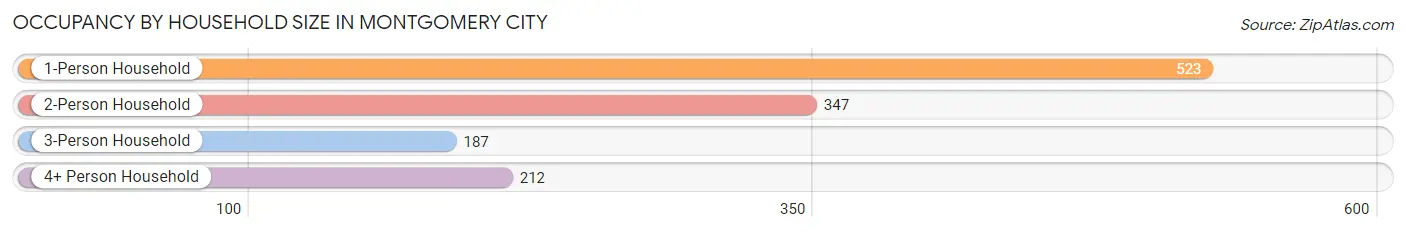
| Household Size | # Housing Units | % Housing Units |
| 1-Person Household | 523 | 41.2% |
| 2-Person Household | 347 | 27.3% |
| 3-Person Household | 187 | 14.7% |
| 4+ Person Household | 212 | 16.7% |
| Total Housing Units | 1,269 | 100.0% |
Occupancy by Ownership by Household Size in Montgomery City
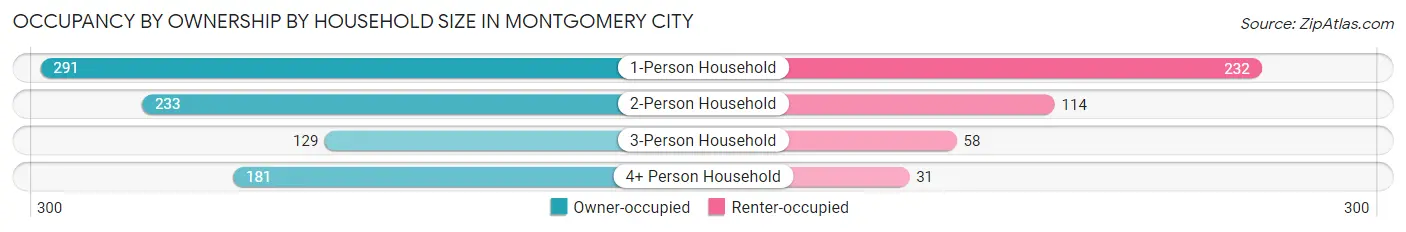
| Household Size | Owner-occupied | Renter-occupied |
| 1-Person Household | 291 (55.6%) | 232 (44.4%) |
| 2-Person Household | 233 (67.1%) | 114 (32.9%) |
| 3-Person Household | 129 (69.0%) | 58 (31.0%) |
| 4+ Person Household | 181 (85.4%) | 31 (14.6%) |
| Total Housing Units | 834 (65.7%) | 435 (34.3%) |
Occupancy by Educational Attainment in Montgomery City
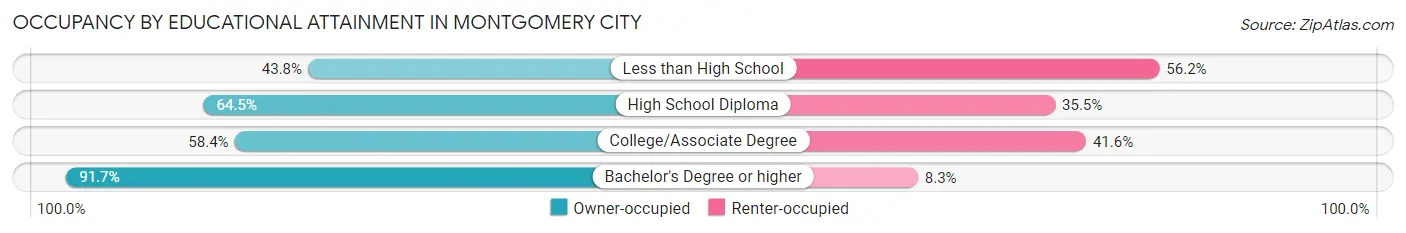
| Household Size | Owner-occupied | Renter-occupied |
| Less than High School | 64 (43.8%) | 82 (56.2%) |
| High School Diploma | 311 (64.5%) | 171 (35.5%) |
| College/Associate Degree | 226 (58.4%) | 161 (41.6%) |
| Bachelor's Degree or higher | 233 (91.7%) | 21 (8.3%) |
Occupancy by Age of Householder in Montgomery City
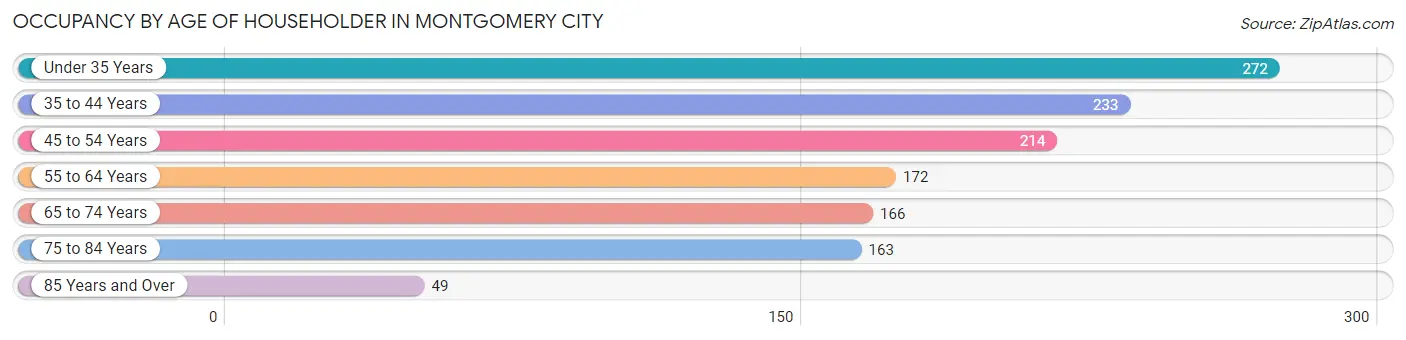
| Age Bracket | # Households | % Households |
| Under 35 Years | 272 | 21.4% |
| 35 to 44 Years | 233 | 18.4% |
| 45 to 54 Years | 214 | 16.9% |
| 55 to 64 Years | 172 | 13.6% |
| 65 to 74 Years | 166 | 13.1% |
| 75 to 84 Years | 163 | 12.8% |
| 85 Years and Over | 49 | 3.9% |
| Total | 1,269 | 100.0% |
Housing Finances in Montgomery City
Median Income by Occupancy in Montgomery City
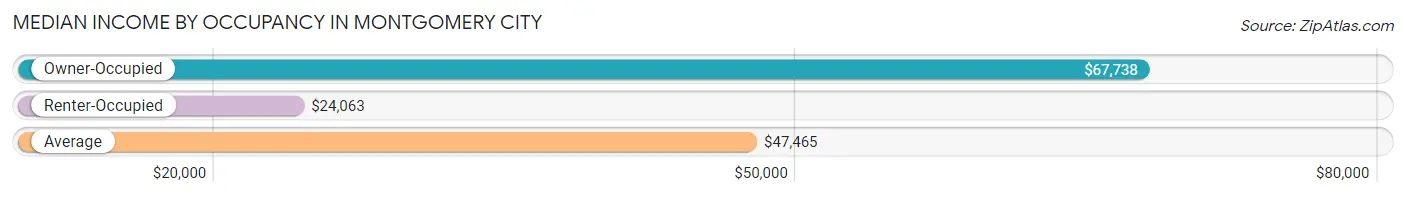
| Occupancy Type | # Households | Median Income |
| Owner-Occupied | 834 (65.7%) | $67,738 |
| Renter-Occupied | 435 (34.3%) | $24,063 |
| Average | 1,269 (100.0%) | $47,465 |
Occupancy by Householder Income Bracket in Montgomery City
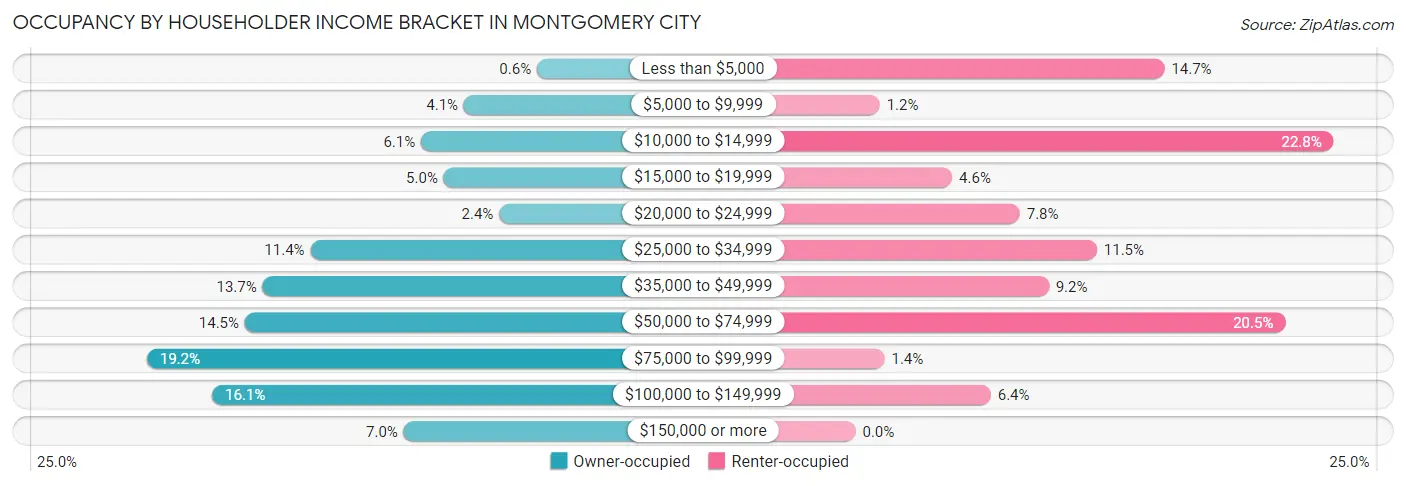
| Income Bracket | Owner-occupied | Renter-occupied |
| Less than $5,000 | 5 (0.6%) | 64 (14.7%) |
| $5,000 to $9,999 | 34 (4.1%) | 5 (1.1%) |
| $10,000 to $14,999 | 51 (6.1%) | 99 (22.8%) |
| $15,000 to $19,999 | 42 (5.0%) | 20 (4.6%) |
| $20,000 to $24,999 | 20 (2.4%) | 34 (7.8%) |
| $25,000 to $34,999 | 95 (11.4%) | 50 (11.5%) |
| $35,000 to $49,999 | 114 (13.7%) | 40 (9.2%) |
| $50,000 to $74,999 | 121 (14.5%) | 89 (20.5%) |
| $75,000 to $99,999 | 160 (19.2%) | 6 (1.4%) |
| $100,000 to $149,999 | 134 (16.1%) | 28 (6.4%) |
| $150,000 or more | 58 (7.0%) | 0 (0.0%) |
| Total | 834 (100.0%) | 435 (100.0%) |
Monthly Housing Cost Tiers in Montgomery City
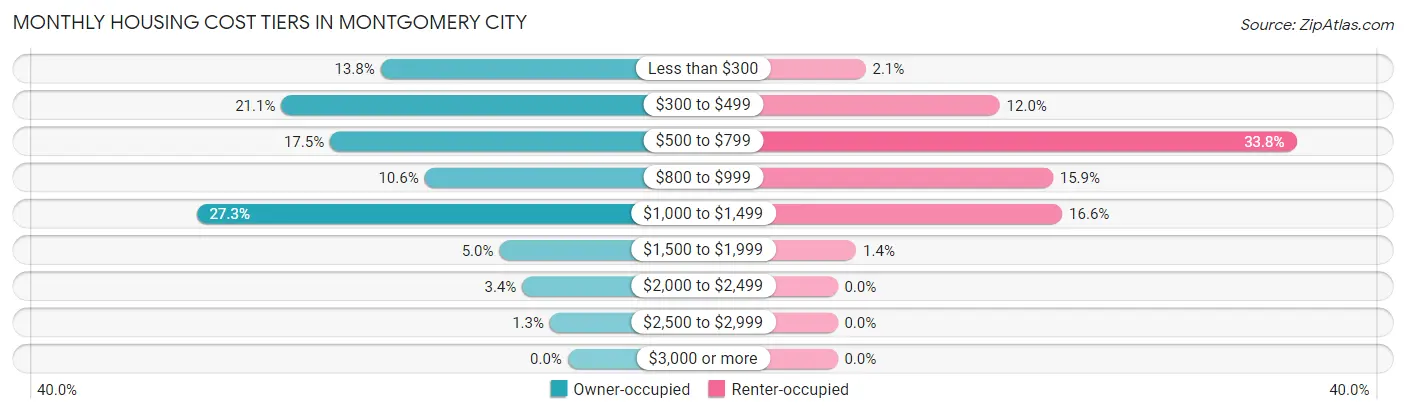
| Monthly Cost | Owner-occupied | Renter-occupied |
| Less than $300 | 115 (13.8%) | 9 (2.1%) |
| $300 to $499 | 176 (21.1%) | 52 (11.9%) |
| $500 to $799 | 146 (17.5%) | 147 (33.8%) |
| $800 to $999 | 88 (10.5%) | 69 (15.9%) |
| $1,000 to $1,499 | 228 (27.3%) | 72 (16.6%) |
| $1,500 to $1,999 | 42 (5.0%) | 6 (1.4%) |
| $2,000 to $2,499 | 28 (3.4%) | 0 (0.0%) |
| $2,500 to $2,999 | 11 (1.3%) | 0 (0.0%) |
| $3,000 or more | 0 (0.0%) | 0 (0.0%) |
| Total | 834 (100.0%) | 435 (100.0%) |
Physical Housing Characteristics in Montgomery City
Housing Structures in Montgomery City
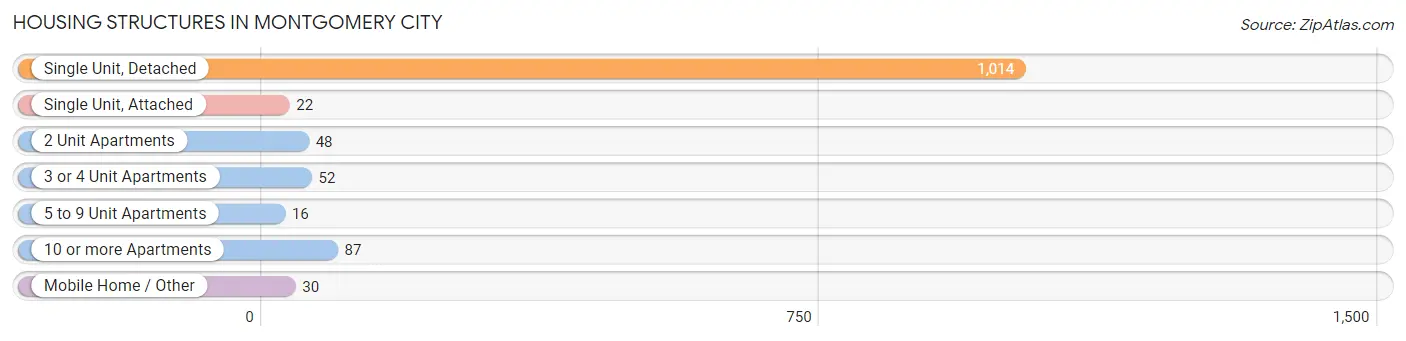
| Structure Type | # Housing Units | % Housing Units |
| Single Unit, Detached | 1,014 | 79.9% |
| Single Unit, Attached | 22 | 1.7% |
| 2 Unit Apartments | 48 | 3.8% |
| 3 or 4 Unit Apartments | 52 | 4.1% |
| 5 to 9 Unit Apartments | 16 | 1.3% |
| 10 or more Apartments | 87 | 6.9% |
| Mobile Home / Other | 30 | 2.4% |
| Total | 1,269 | 100.0% |
Housing Structures by Occupancy in Montgomery City
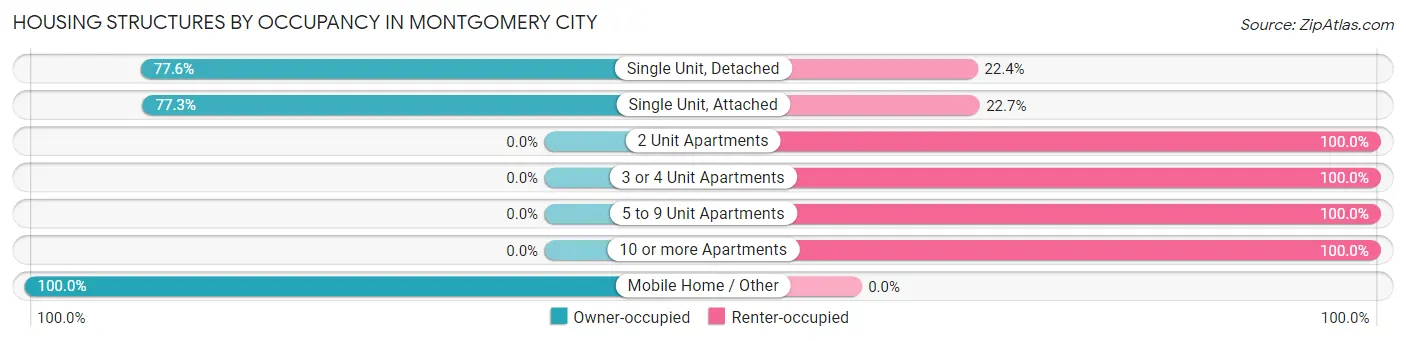
| Structure Type | Owner-occupied | Renter-occupied |
| Single Unit, Detached | 787 (77.6%) | 227 (22.4%) |
| Single Unit, Attached | 17 (77.3%) | 5 (22.7%) |
| 2 Unit Apartments | 0 (0.0%) | 48 (100.0%) |
| 3 or 4 Unit Apartments | 0 (0.0%) | 52 (100.0%) |
| 5 to 9 Unit Apartments | 0 (0.0%) | 16 (100.0%) |
| 10 or more Apartments | 0 (0.0%) | 87 (100.0%) |
| Mobile Home / Other | 30 (100.0%) | 0 (0.0%) |
| Total | 834 (65.7%) | 435 (34.3%) |
Housing Structures by Number of Rooms in Montgomery City
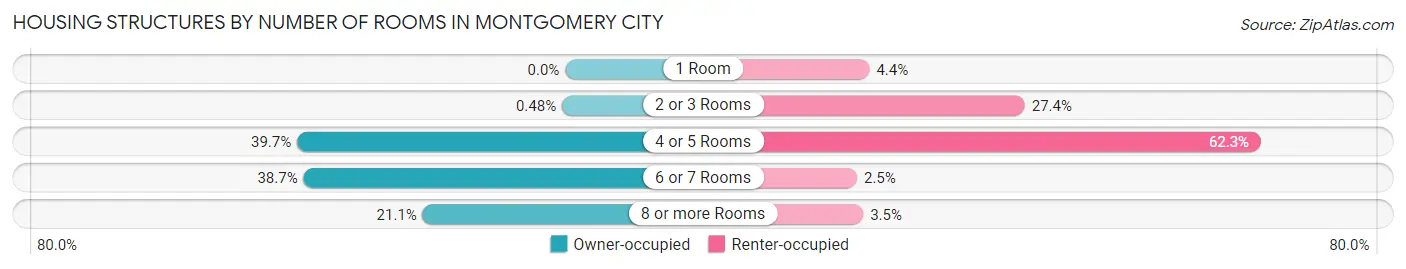
| Number of Rooms | Owner-occupied | Renter-occupied |
| 1 Room | 0 (0.0%) | 19 (4.4%) |
| 2 or 3 Rooms | 4 (0.5%) | 119 (27.4%) |
| 4 or 5 Rooms | 331 (39.7%) | 271 (62.3%) |
| 6 or 7 Rooms | 323 (38.7%) | 11 (2.5%) |
| 8 or more Rooms | 176 (21.1%) | 15 (3.5%) |
| Total | 834 (100.0%) | 435 (100.0%) |
Housing Structure by Heating Type in Montgomery City
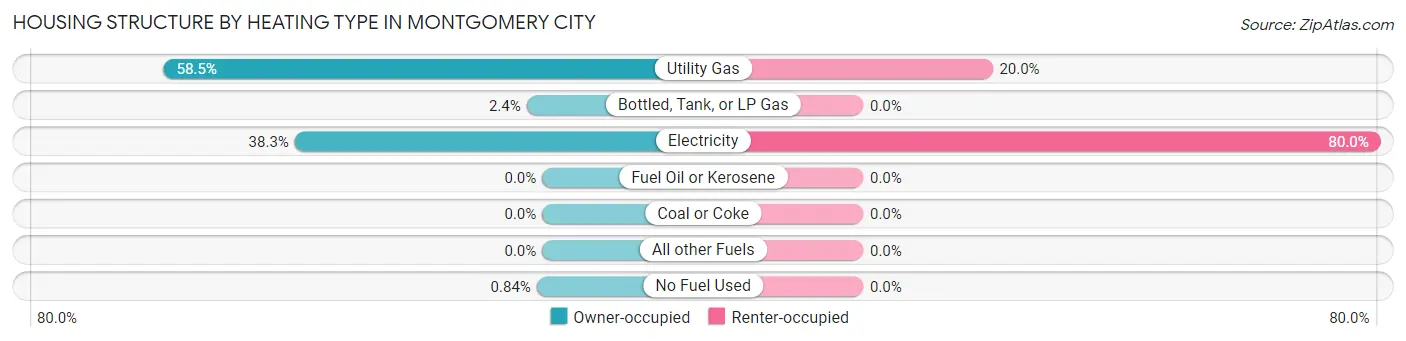
| Heating Type | Owner-occupied | Renter-occupied |
| Utility Gas | 488 (58.5%) | 87 (20.0%) |
| Bottled, Tank, or LP Gas | 20 (2.4%) | 0 (0.0%) |
| Electricity | 319 (38.3%) | 348 (80.0%) |
| Fuel Oil or Kerosene | 0 (0.0%) | 0 (0.0%) |
| Coal or Coke | 0 (0.0%) | 0 (0.0%) |
| All other Fuels | 0 (0.0%) | 0 (0.0%) |
| No Fuel Used | 7 (0.8%) | 0 (0.0%) |
| Total | 834 (100.0%) | 435 (100.0%) |
Household Vehicle Usage in Montgomery City
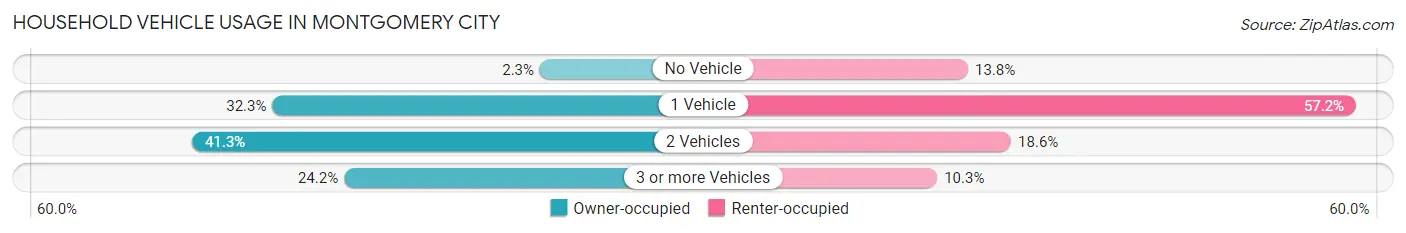
| Vehicles per Household | Owner-occupied | Renter-occupied |
| No Vehicle | 19 (2.3%) | 60 (13.8%) |
| 1 Vehicle | 269 (32.3%) | 249 (57.2%) |
| 2 Vehicles | 344 (41.2%) | 81 (18.6%) |
| 3 or more Vehicles | 202 (24.2%) | 45 (10.3%) |
| Total | 834 (100.0%) | 435 (100.0%) |
Real Estate & Mortgages in Montgomery City
Real Estate and Mortgage Overview in Montgomery City
| Characteristic | Without Mortgage | With Mortgage |
| Housing Units | 449 | 385 |
| Median Property Value | $117,400 | $145,300 |
| Median Household Income | $46,354 | $42 |
| Monthly Housing Costs | $440 | $0 |
| Real Estate Taxes | $1,135 | $0 |
Property Value by Mortgage Status in Montgomery City
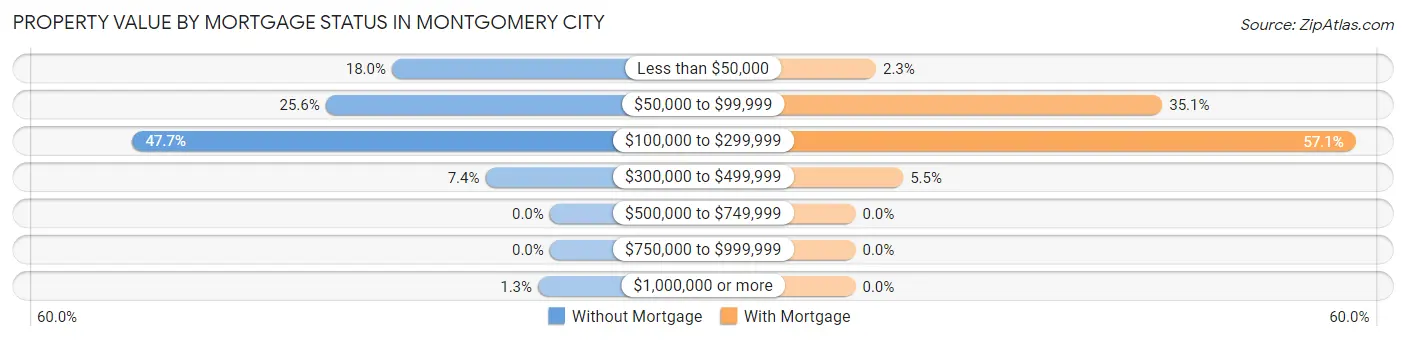
| Property Value | Without Mortgage | With Mortgage |
| Less than $50,000 | 81 (18.0%) | 9 (2.3%) |
| $50,000 to $99,999 | 115 (25.6%) | 135 (35.1%) |
| $100,000 to $299,999 | 214 (47.7%) | 220 (57.1%) |
| $300,000 to $499,999 | 33 (7.3%) | 21 (5.4%) |
| $500,000 to $749,999 | 0 (0.0%) | 0 (0.0%) |
| $750,000 to $999,999 | 0 (0.0%) | 0 (0.0%) |
| $1,000,000 or more | 6 (1.3%) | 0 (0.0%) |
| Total | 449 (100.0%) | 385 (100.0%) |
Household Income by Mortgage Status in Montgomery City
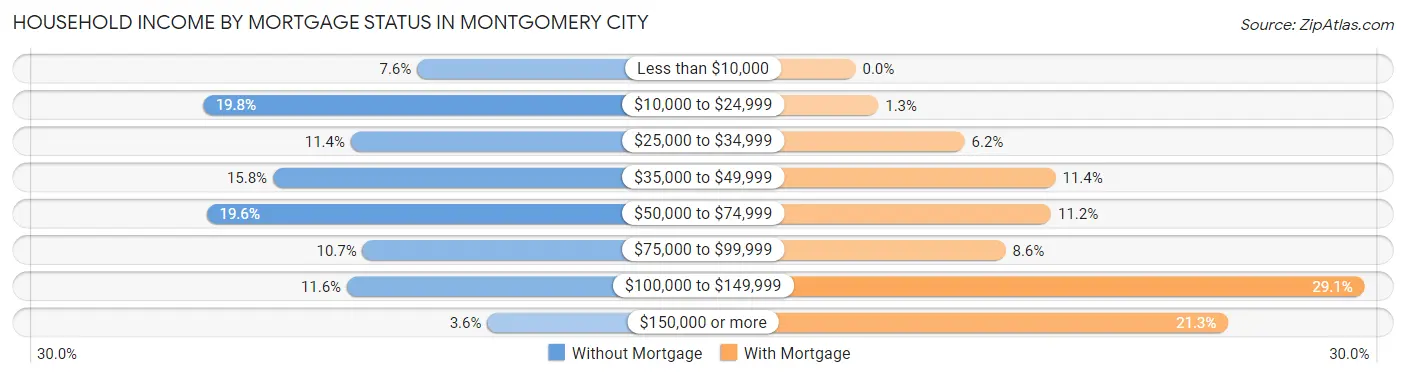
| Household Income | Without Mortgage | With Mortgage |
| Less than $10,000 | 34 (7.6%) | 0 (0.0%) |
| $10,000 to $24,999 | 89 (19.8%) | 5 (1.3%) |
| $25,000 to $34,999 | 51 (11.4%) | 24 (6.2%) |
| $35,000 to $49,999 | 71 (15.8%) | 44 (11.4%) |
| $50,000 to $74,999 | 88 (19.6%) | 43 (11.2%) |
| $75,000 to $99,999 | 48 (10.7%) | 33 (8.6%) |
| $100,000 to $149,999 | 52 (11.6%) | 112 (29.1%) |
| $150,000 or more | 16 (3.6%) | 82 (21.3%) |
| Total | 449 (100.0%) | 385 (100.0%) |
Property Value to Household Income Ratio in Montgomery City
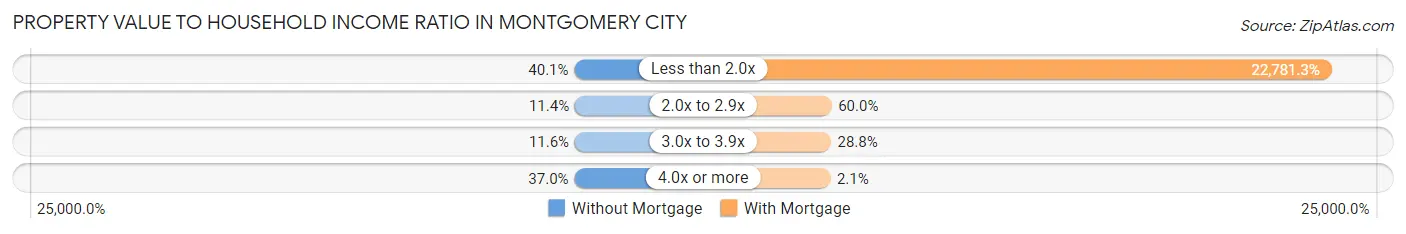
| Value-to-Income Ratio | Without Mortgage | With Mortgage |
| Less than 2.0x | 180 (40.1%) | 87,708 (22,781.3%) |
| 2.0x to 2.9x | 51 (11.4%) | 231 (60.0%) |
| 3.0x to 3.9x | 52 (11.6%) | 111 (28.8%) |
| 4.0x or more | 166 (37.0%) | 8 (2.1%) |
| Total | 449 (100.0%) | 385 (100.0%) |
Real Estate Taxes by Mortgage Status in Montgomery City
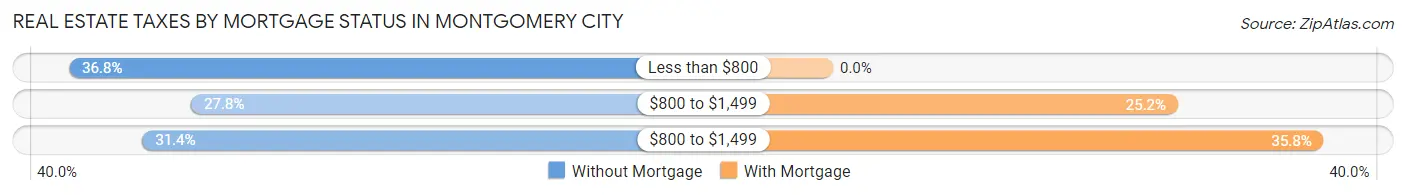
| Property Taxes | Without Mortgage | With Mortgage |
| Less than $800 | 165 (36.7%) | 0 (0.0%) |
| $800 to $1,499 | 125 (27.8%) | 97 (25.2%) |
| $800 to $1,499 | 141 (31.4%) | 138 (35.8%) |
| Total | 449 (100.0%) | 385 (100.0%) |
Health & Disability in Montgomery City
Health Insurance Coverage by Age in Montgomery City
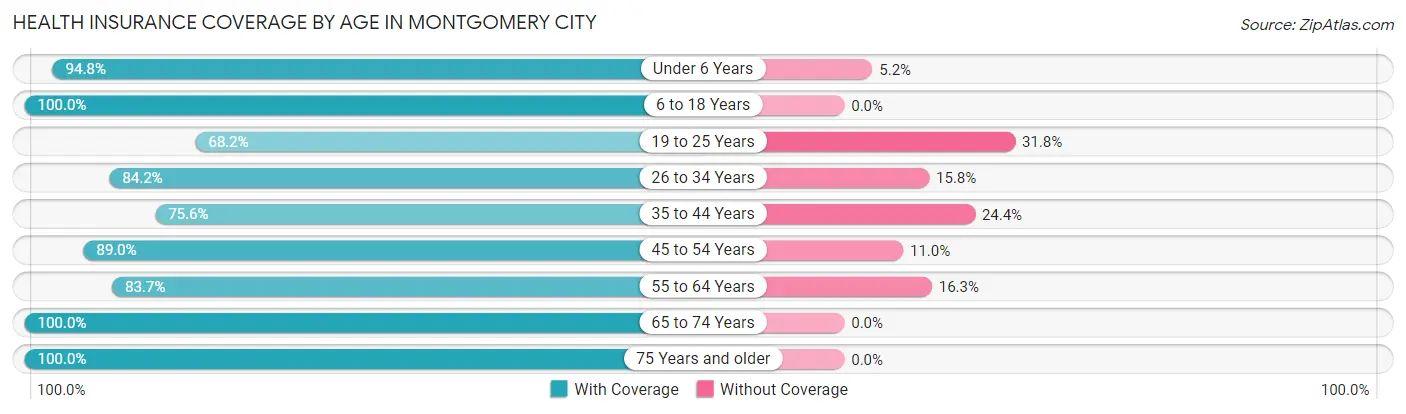
| Age Bracket | With Coverage | Without Coverage |
| Under 6 Years | 272 (94.8%) | 15 (5.2%) |
| 6 to 18 Years | 406 (100.0%) | 0 (0.0%) |
| 19 to 25 Years | 137 (68.2%) | 64 (31.8%) |
| 26 to 34 Years | 314 (84.2%) | 59 (15.8%) |
| 35 to 44 Years | 295 (75.6%) | 95 (24.4%) |
| 45 to 54 Years | 333 (89.0%) | 41 (11.0%) |
| 55 to 64 Years | 236 (83.7%) | 46 (16.3%) |
| 65 to 74 Years | 201 (100.0%) | 0 (0.0%) |
| 75 Years and older | 251 (100.0%) | 0 (0.0%) |
| Total | 2,445 (88.4%) | 320 (11.6%) |
Health Insurance Coverage by Citizenship Status in Montgomery City
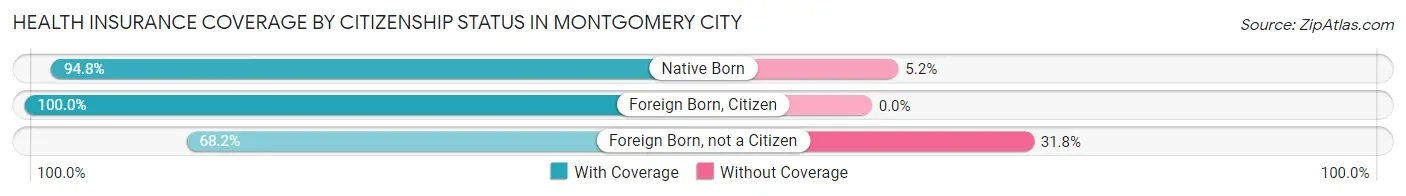
| Citizenship Status | With Coverage | Without Coverage |
| Native Born | 272 (94.8%) | 15 (5.2%) |
| Foreign Born, Citizen | 406 (100.0%) | 0 (0.0%) |
| Foreign Born, not a Citizen | 137 (68.2%) | 64 (31.8%) |
Health Insurance Coverage by Household Income in Montgomery City
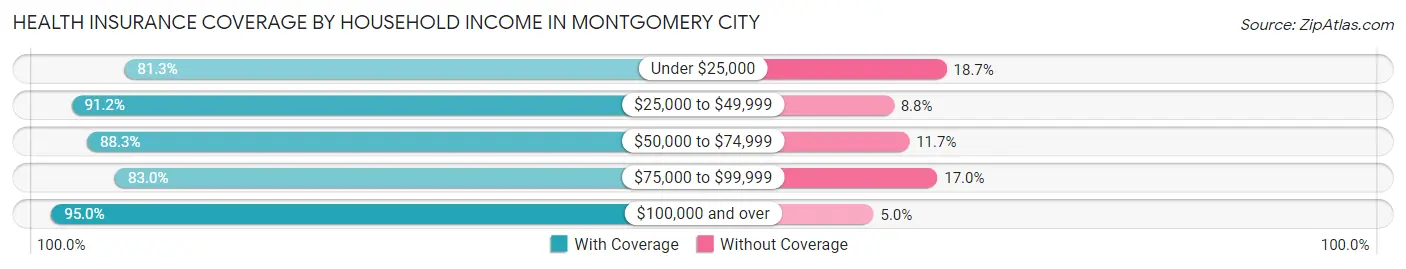
| Household Income | With Coverage | Without Coverage |
| Under $25,000 | 439 (81.3%) | 101 (18.7%) |
| $25,000 to $49,999 | 488 (91.2%) | 47 (8.8%) |
| $50,000 to $74,999 | 453 (88.3%) | 60 (11.7%) |
| $75,000 to $99,999 | 372 (83.0%) | 76 (17.0%) |
| $100,000 and over | 682 (95.0%) | 36 (5.0%) |
Public vs Private Health Insurance Coverage by Age in Montgomery City
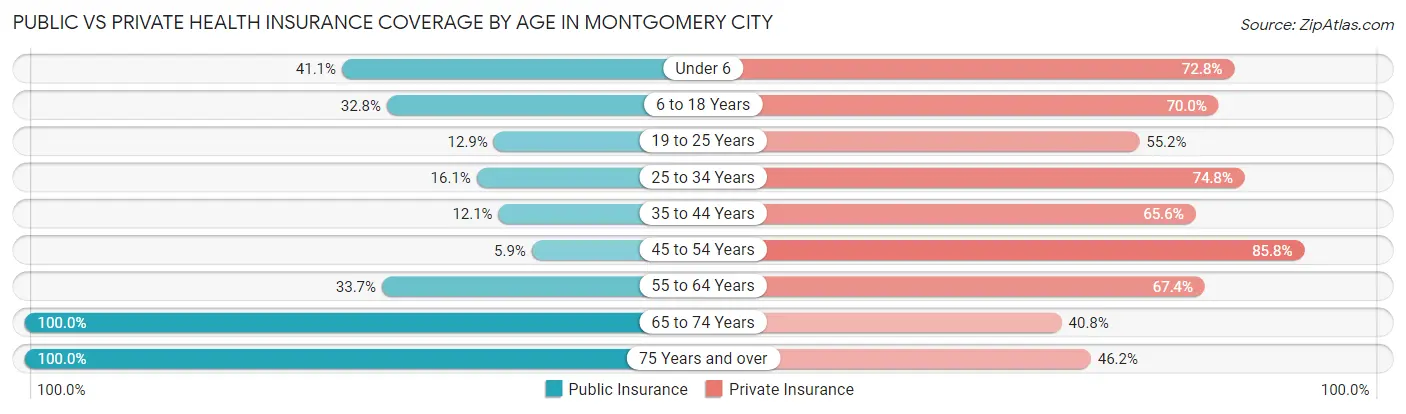
| Age Bracket | Public Insurance | Private Insurance |
| Under 6 | 118 (41.1%) | 209 (72.8%) |
| 6 to 18 Years | 133 (32.8%) | 284 (70.0%) |
| 19 to 25 Years | 26 (12.9%) | 111 (55.2%) |
| 25 to 34 Years | 60 (16.1%) | 279 (74.8%) |
| 35 to 44 Years | 47 (12.0%) | 256 (65.6%) |
| 45 to 54 Years | 22 (5.9%) | 321 (85.8%) |
| 55 to 64 Years | 95 (33.7%) | 190 (67.4%) |
| 65 to 74 Years | 201 (100.0%) | 82 (40.8%) |
| 75 Years and over | 251 (100.0%) | 116 (46.2%) |
| Total | 953 (34.5%) | 1,848 (66.8%) |
Disability Status by Sex by Age in Montgomery City
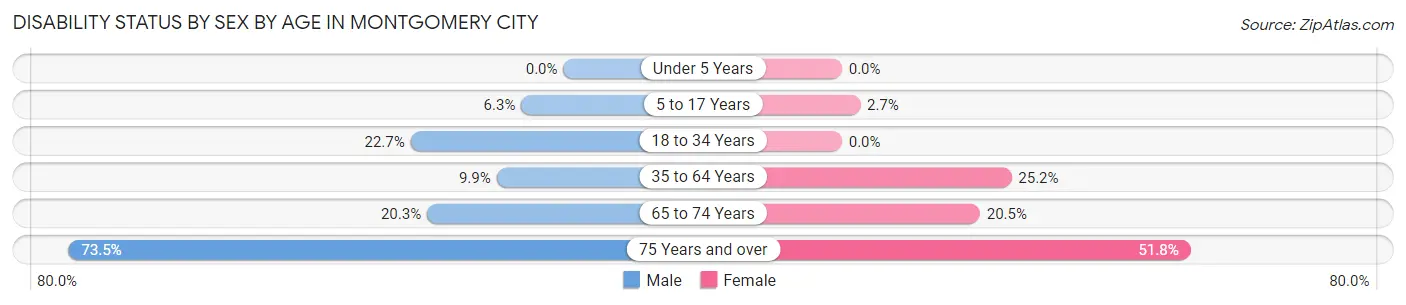
| Age Bracket | Male | Female |
| Under 5 Years | 0 (0.0%) | 0 (0.0%) |
| 5 to 17 Years | 14 (6.2%) | 6 (2.7%) |
| 18 to 34 Years | 59 (22.7%) | 0 (0.0%) |
| 35 to 64 Years | 49 (9.9%) | 139 (25.2%) |
| 65 to 74 Years | 16 (20.3%) | 25 (20.5%) |
| 75 Years and over | 61 (73.5%) | 87 (51.8%) |
Disability Class by Sex by Age in Montgomery City
Disability Class: Hearing Difficulty
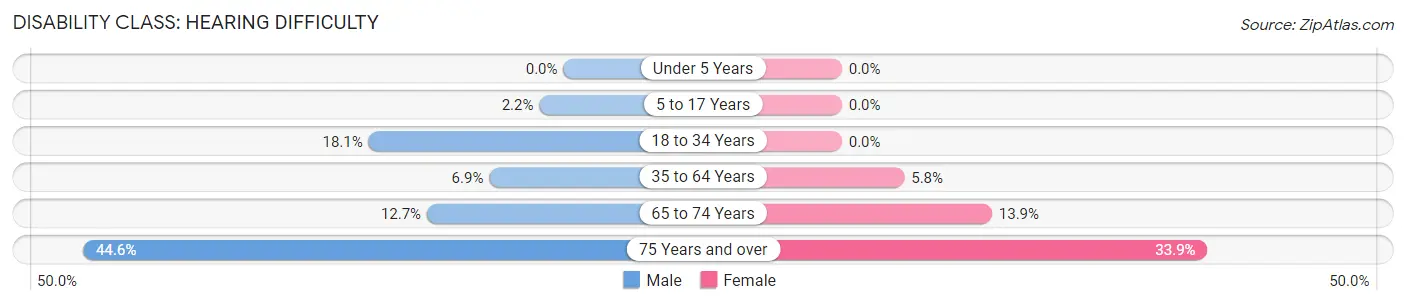
| Age Bracket | Male | Female |
| Under 5 Years | 0 (0.0%) | 0 (0.0%) |
| 5 to 17 Years | 5 (2.2%) | 0 (0.0%) |
| 18 to 34 Years | 47 (18.1%) | 0 (0.0%) |
| 35 to 64 Years | 34 (6.9%) | 32 (5.8%) |
| 65 to 74 Years | 10 (12.7%) | 17 (13.9%) |
| 75 Years and over | 37 (44.6%) | 57 (33.9%) |
Disability Class: Vision Difficulty
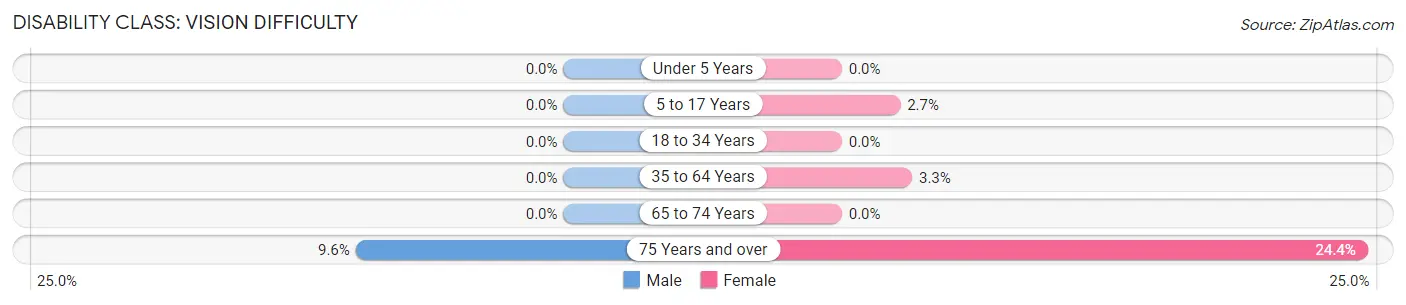
| Age Bracket | Male | Female |
| Under 5 Years | 0 (0.0%) | 0 (0.0%) |
| 5 to 17 Years | 0 (0.0%) | 6 (2.7%) |
| 18 to 34 Years | 0 (0.0%) | 0 (0.0%) |
| 35 to 64 Years | 0 (0.0%) | 18 (3.3%) |
| 65 to 74 Years | 0 (0.0%) | 0 (0.0%) |
| 75 Years and over | 8 (9.6%) | 41 (24.4%) |
Disability Class: Cognitive Difficulty
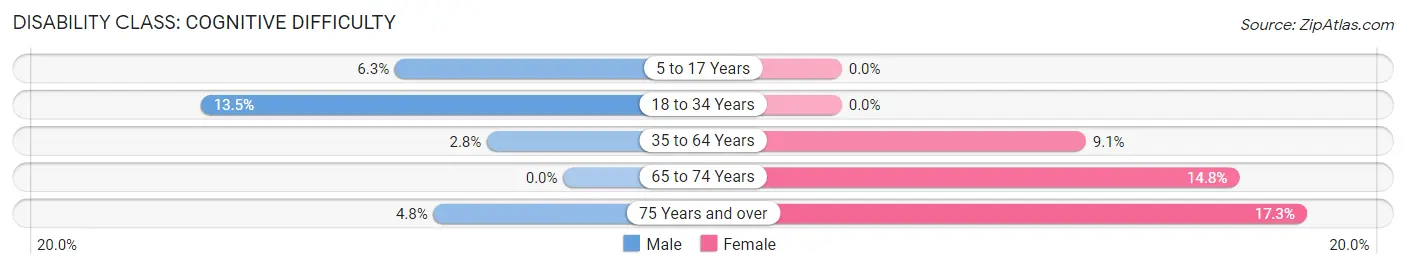
| Age Bracket | Male | Female |
| 5 to 17 Years | 14 (6.2%) | 0 (0.0%) |
| 18 to 34 Years | 35 (13.5%) | 0 (0.0%) |
| 35 to 64 Years | 14 (2.8%) | 50 (9.1%) |
| 65 to 74 Years | 0 (0.0%) | 18 (14.7%) |
| 75 Years and over | 4 (4.8%) | 29 (17.3%) |
Disability Class: Ambulatory Difficulty
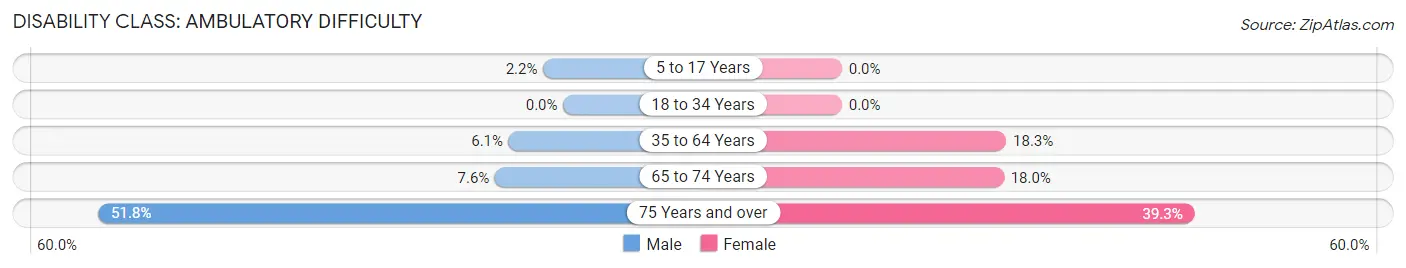
| Age Bracket | Male | Female |
| 5 to 17 Years | 5 (2.2%) | 0 (0.0%) |
| 18 to 34 Years | 0 (0.0%) | 0 (0.0%) |
| 35 to 64 Years | 30 (6.1%) | 101 (18.3%) |
| 65 to 74 Years | 6 (7.6%) | 22 (18.0%) |
| 75 Years and over | 43 (51.8%) | 66 (39.3%) |
Disability Class: Self-Care Difficulty
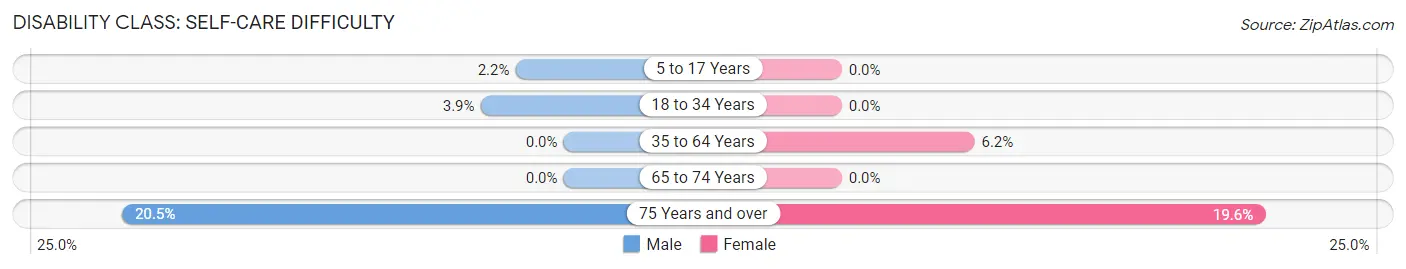
| Age Bracket | Male | Female |
| 5 to 17 Years | 5 (2.2%) | 0 (0.0%) |
| 18 to 34 Years | 10 (3.8%) | 0 (0.0%) |
| 35 to 64 Years | 0 (0.0%) | 34 (6.2%) |
| 65 to 74 Years | 0 (0.0%) | 0 (0.0%) |
| 75 Years and over | 17 (20.5%) | 33 (19.6%) |
Technology Access in Montgomery City
Computing Device Access in Montgomery City
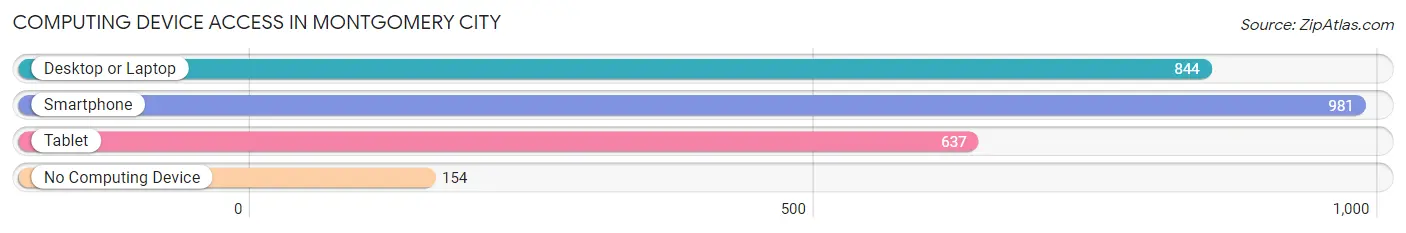
| Device Type | # Households | % Households |
| Desktop or Laptop | 844 | 66.5% |
| Smartphone | 981 | 77.3% |
| Tablet | 637 | 50.2% |
| No Computing Device | 154 | 12.1% |
| Total | 1,269 | 100.0% |
Internet Access in Montgomery City
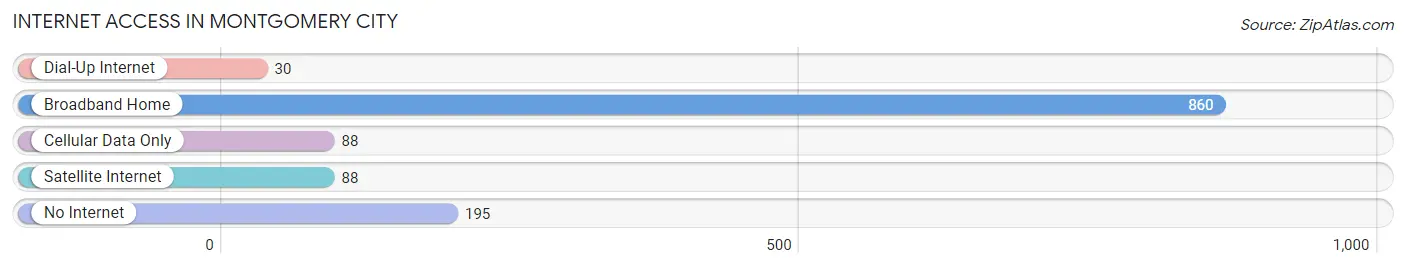
| Internet Type | # Households | % Households |
| Dial-Up Internet | 30 | 2.4% |
| Broadband Home | 860 | 67.8% |
| Cellular Data Only | 88 | 6.9% |
| Satellite Internet | 88 | 6.9% |
| No Internet | 195 | 15.4% |
| Total | 1,269 | 100.0% |
Montgomery City Summary
Montgomery City, Missouri is a small town located in Montgomery County, Missouri. It is situated in the north-central part of the state, approximately 50 miles northeast of St. Louis. The town has a population of approximately 1,800 people and is the county seat of Montgomery County.
History
Montgomery City was founded in 1819 by a group of settlers from Kentucky. The town was named after Richard Montgomery, a Revolutionary War hero. The town was incorporated in 1837 and was the first county seat of Montgomery County.
In the early days, Montgomery City was a thriving agricultural community. The town was home to several mills, including a grist mill, a saw mill, and a woolen mill. The town also had a blacksmith shop, a general store, and a post office.
In the late 1800s, the town began to experience a period of growth. The railroad arrived in 1881, and the town was connected to St. Louis by rail. This allowed for the transportation of goods and people to and from the city.
In the early 1900s, Montgomery City experienced a period of decline. The railroad was abandoned in the 1920s, and the town's population began to decline. The town was also hit hard by the Great Depression.
In the 1950s, Montgomery City began to experience a period of revitalization. The town was connected to the interstate highway system in the 1960s, and the population began to grow again.
Geography
Montgomery City is located in the north-central part of Missouri, approximately 50 miles northeast of St. Louis. The town is situated in the Missouri River Valley, and is surrounded by rolling hills and farmland. The town is located at the intersection of Interstate 70 and U.S. Route 61.
The climate in Montgomery City is humid continental, with hot summers and cold winters. The average annual temperature is around 54 degrees Fahrenheit. The average annual precipitation is around 40 inches.
Economy
The economy of Montgomery City is largely based on agriculture. The town is home to several farms, and the surrounding area is known for its production of corn, soybeans, and wheat.
The town is also home to several small businesses, including restaurants, retail stores, and service providers. The town is also home to a few manufacturing companies, including a furniture factory and a plastics factory.
Demographics
As of the 2010 census, the population of Montgomery City was 1,811. The racial makeup of the town was 97.3% White, 0.7% African American, 0.3% Native American, 0.2% Asian, 0.1% Pacific Islander, 0.3% from other races, and 1.2% from two or more races. Hispanic or Latino of any race were 1.2% of the population.
The median household income in Montgomery City was $37,917, and the median family income was $45,938. The per capita income was $19,945. About 11.2% of families and 14.2% of the population were below the poverty line, including 19.2% of those under age 18 and 8.2% of those age 65 or over.
Common Questions
What is Per Capita Income in Montgomery City?
Per Capita income in Montgomery City is $27,090.
What is the Median Family Income in Montgomery City?
Median Family Income in Montgomery City is $73,860.
What is the Median Household income in Montgomery City?
Median Household Income in Montgomery City is $47,465.
What is Income or Wage Gap in Montgomery City?
Income or Wage Gap in Montgomery City is 43.1%.
Women in Montgomery City earn 56.9 cents for every dollar earned by a man.
What is Inequality or Gini Index in Montgomery City?
Inequality or Gini Index in Montgomery City is 0.43.
What is the Total Population of Montgomery City?
Total Population of Montgomery City is 2,817.
What is the Total Male Population of Montgomery City?
Total Male Population of Montgomery City is 1,324.
What is the Total Female Population of Montgomery City?
Total Female Population of Montgomery City is 1,493.
What is the Ratio of Males per 100 Females in Montgomery City?
There are 88.68 Males per 100 Females in Montgomery City.
What is the Ratio of Females per 100 Males in Montgomery City?
There are 112.76 Females per 100 Males in Montgomery City.
What is the Median Population Age in Montgomery City?
Median Population Age in Montgomery City is 38.2 Years.
What is the Average Family Size in Montgomery City
Average Family Size in Montgomery City is 3.0 People.
What is the Average Household Size in Montgomery City
Average Household Size in Montgomery City is 2.2 People.
How Large is the Labor Force in Montgomery City?
There are 1,424 People in the Labor Forcein in Montgomery City.
What is the Percentage of People in the Labor Force in Montgomery City?
64.0% of People are in the Labor Force in Montgomery City.
What is the Unemployment Rate in Montgomery City?
Unemployment Rate in Montgomery City is 4.0%.