Mexico, MO Map & Demographics
Mexico Map
Mexico Overview
$26,785
PER CAPITA INCOME
$56,034
AVG FAMILY INCOME
$47,585
AVG HOUSEHOLD INCOME
23.3%
WAGE / INCOME GAP [ % ]
76.7¢/ $1
WAGE / INCOME GAP [ $ ]
$11,531
FAMILY INCOME DEFICIT
0.45
INEQUALITY / GINI INDEX
11,502
TOTAL POPULATION
5,204
MALE POPULATION
6,298
FEMALE POPULATION
82.63
MALES / 100 FEMALES
121.02
FEMALES / 100 MALES
36.6
MEDIAN AGE
3.3
AVG FAMILY SIZE
2.5
AVG HOUSEHOLD SIZE
5,693
LABOR FORCE [ PEOPLE ]
61.9%
PERCENT IN LABOR FORCE
5.7%
UNEMPLOYMENT RATE
Mexico Zip Codes
Mexico Area Codes
Income in Mexico
Income Overview in Mexico
Per Capita Income in Mexico is $26,785, while median incomes of families and households are $56,034 and $47,585 respectively.
| Characteristic | Number | Measure |
| Per Capita Income | 11,502 | $26,785 |
| Median Family Income | 2,783 | $56,034 |
| Mean Family Income | 2,783 | $70,945 |
| Median Household Income | 4,393 | $47,585 |
| Mean Household Income | 4,393 | $64,173 |
| Income Deficit | 2,783 | $11,531 |
| Wage / Income Gap (%) | 11,502 | 23.28% |
| Wage / Income Gap ($) | 11,502 | 76.72¢ per $1 |
| Gini / Inequality Index | 11,502 | 0.45 |
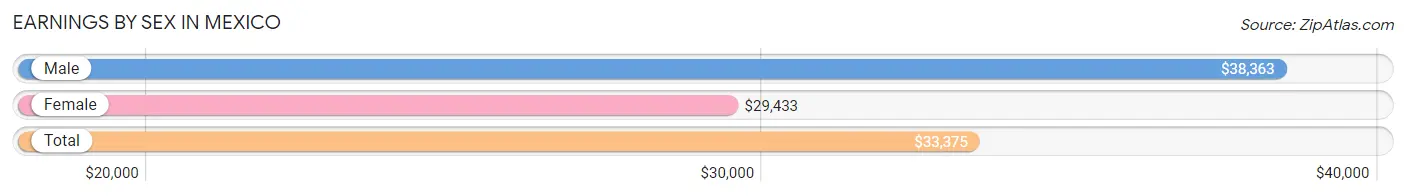
Earnings by Sex in Mexico
Average Earnings in Mexico are $33,375, $38,363 for men and $29,433 for women, a difference of 23.3%.
| Sex | Number | Average Earnings |
| Male | 2,663 (45.8%) | $38,363 |
| Female | 3,148 (54.2%) | $29,433 |
| Total | 5,811 (100.0%) | $33,375 |
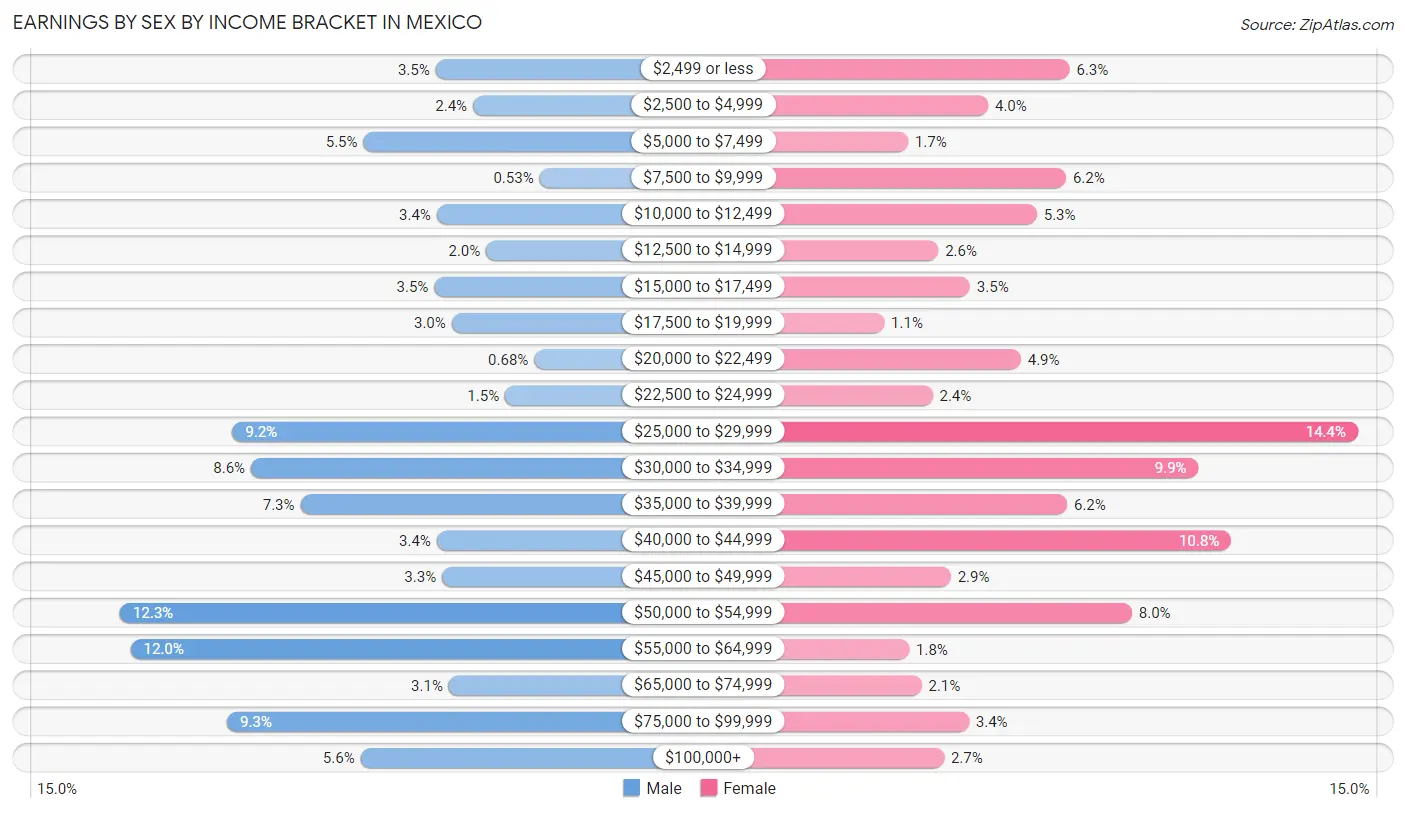
Earnings by Sex by Income Bracket in Mexico
The most common earnings brackets in Mexico are $50,000 to $54,999 for men (328 | 12.3%) and $25,000 to $29,999 for women (452 | 14.4%).
| Income | Male | Female |
| $2,499 or less | 92 (3.5%) | 197 (6.3%) |
| $2,500 to $4,999 | 64 (2.4%) | 125 (4.0%) |
| $5,000 to $7,499 | 146 (5.5%) | 54 (1.7%) |
| $7,500 to $9,999 | 14 (0.5%) | 194 (6.2%) |
| $10,000 to $12,499 | 91 (3.4%) | 168 (5.3%) |
| $12,500 to $14,999 | 54 (2.0%) | 81 (2.6%) |
| $15,000 to $17,499 | 93 (3.5%) | 109 (3.5%) |
| $17,500 to $19,999 | 80 (3.0%) | 33 (1.1%) |
| $20,000 to $22,499 | 18 (0.7%) | 154 (4.9%) |
| $22,500 to $24,999 | 40 (1.5%) | 76 (2.4%) |
| $25,000 to $29,999 | 244 (9.2%) | 452 (14.4%) |
| $30,000 to $34,999 | 230 (8.6%) | 311 (9.9%) |
| $35,000 to $39,999 | 193 (7.2%) | 195 (6.2%) |
| $40,000 to $44,999 | 91 (3.4%) | 340 (10.8%) |
| $45,000 to $49,999 | 87 (3.3%) | 92 (2.9%) |
| $50,000 to $54,999 | 328 (12.3%) | 252 (8.0%) |
| $55,000 to $64,999 | 320 (12.0%) | 55 (1.8%) |
| $65,000 to $74,999 | 82 (3.1%) | 66 (2.1%) |
| $75,000 to $99,999 | 248 (9.3%) | 108 (3.4%) |
| $100,000+ | 148 (5.6%) | 86 (2.7%) |
| Total | 2,663 (100.0%) | 3,148 (100.0%) |
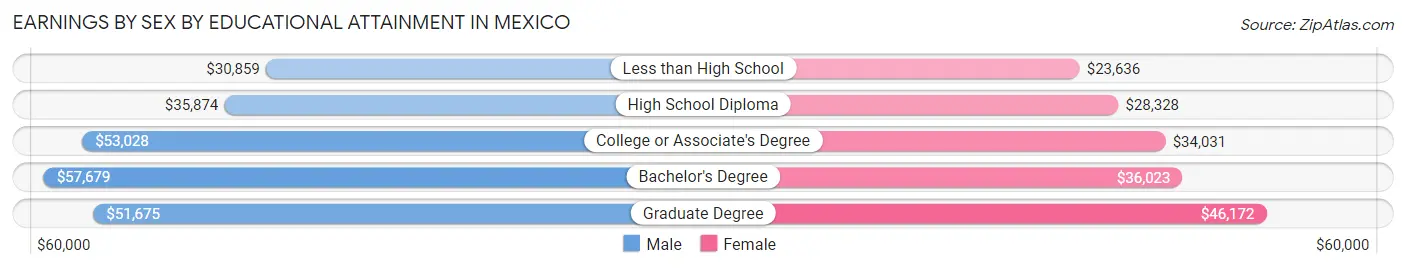
Earnings by Sex by Educational Attainment in Mexico
Average earnings in Mexico are $44,722 for men and $32,686 for women, a difference of 26.9%. Men with an educational attainment of bachelor's degree enjoy the highest average annual earnings of $57,679, while those with less than high school education earn the least with $30,859. Women with an educational attainment of graduate degree earn the most with the average annual earnings of $46,172, while those with less than high school education have the smallest earnings of $23,636.
| Educational Attainment | Male Income | Female Income |
| Less than High School | $30,859 | $23,636 |
| High School Diploma | $35,874 | $28,328 |
| College or Associate's Degree | $53,028 | $34,031 |
| Bachelor's Degree | $57,679 | $36,023 |
| Graduate Degree | $51,675 | $46,172 |
| Total | $44,722 | $32,686 |
Family Income in Mexico
Family Income Brackets in Mexico
According to the Mexico family income data, there are 534 families falling into the $50,000 to $74,999 income range, which is the most common income bracket and makes up 19.2% of all families. Conversely, the $150,000 to $199,999 income bracket is the least frequent group with only 50 families (1.8%) belonging to this category.
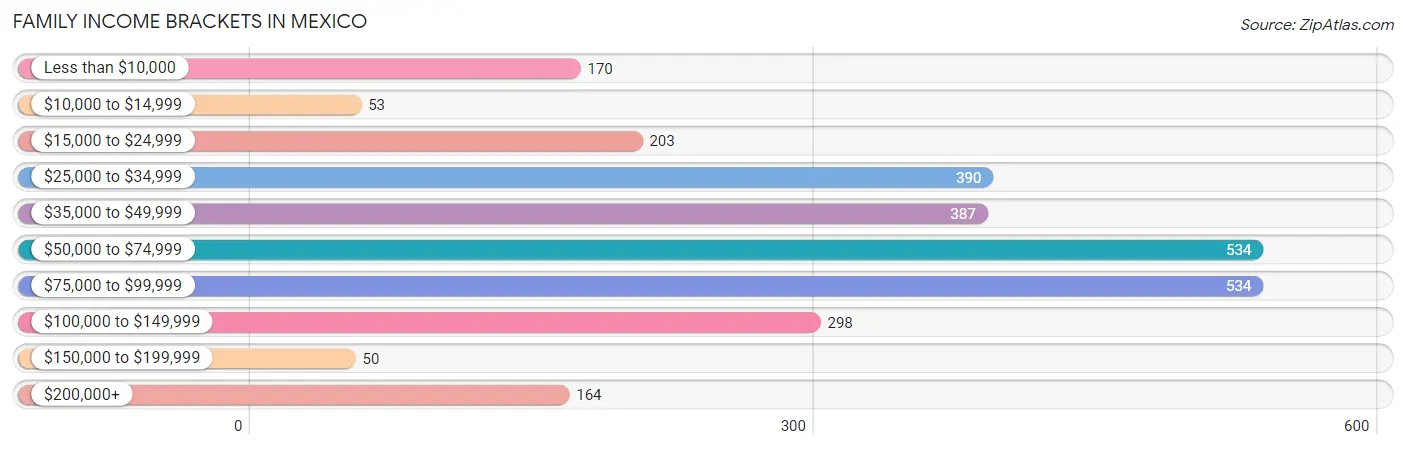
| Income Bracket | # Families | % Families |
| Less than $10,000 | 170 | 6.1% |
| $10,000 to $14,999 | 53 | 1.9% |
| $15,000 to $24,999 | 203 | 7.3% |
| $25,000 to $34,999 | 390 | 14.0% |
| $35,000 to $49,999 | 387 | 13.9% |
| $50,000 to $74,999 | 534 | 19.2% |
| $75,000 to $99,999 | 534 | 19.2% |
| $100,000 to $149,999 | 298 | 10.7% |
| $150,000 to $199,999 | 50 | 1.8% |
| $200,000+ | 164 | 5.9% |
Family Income by Famaliy Size in Mexico
5-person families (241 | 8.7%) account for the highest median family income in Mexico with $71,094 per family, while 2-person families (1,323 | 47.5%) have the highest median income of $26,890 per family member.
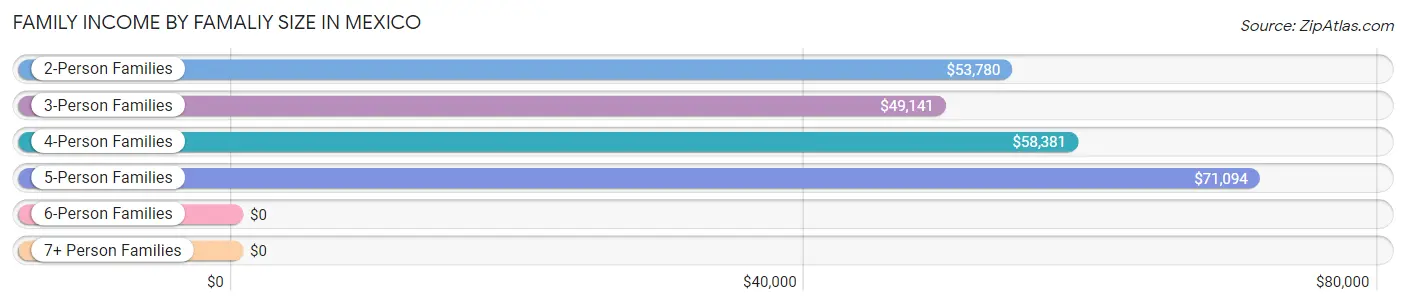
| Income Bracket | # Families | Median Income |
| 2-Person Families | 1,323 (47.5%) | $53,780 |
| 3-Person Families | 713 (25.6%) | $49,141 |
| 4-Person Families | 429 (15.4%) | $58,381 |
| 5-Person Families | 241 (8.7%) | $71,094 |
| 6-Person Families | 71 (2.5%) | $0 |
| 7+ Person Families | 6 (0.2%) | $0 |
| Total | 2,783 (100.0%) | $56,034 |
Family Income by Number of Earners in Mexico
The median family income in Mexico is $56,034, with families comprising 3+ earners (245) having the highest median family income of $217,750, while families with no earners (543) have the lowest median family income of $33,373, accounting for 8.8% and 19.5% of families, respectively.
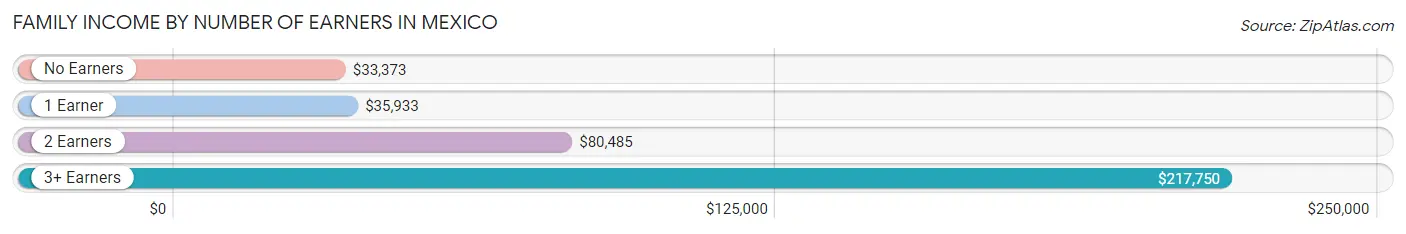
| Number of Earners | # Families | Median Income |
| No Earners | 543 (19.5%) | $33,373 |
| 1 Earner | 910 (32.7%) | $35,933 |
| 2 Earners | 1,085 (39.0%) | $80,485 |
| 3+ Earners | 245 (8.8%) | $217,750 |
| Total | 2,783 (100.0%) | $56,034 |
Household Income in Mexico
Household Income Brackets in Mexico
With 791 households falling in the category, the $50,000 to $74,999 income range is the most frequent in Mexico, accounting for 18.0% of all households. In contrast, only 62 households (1.4%) fall into the $150,000 to $199,999 income bracket, making it the least populous group.
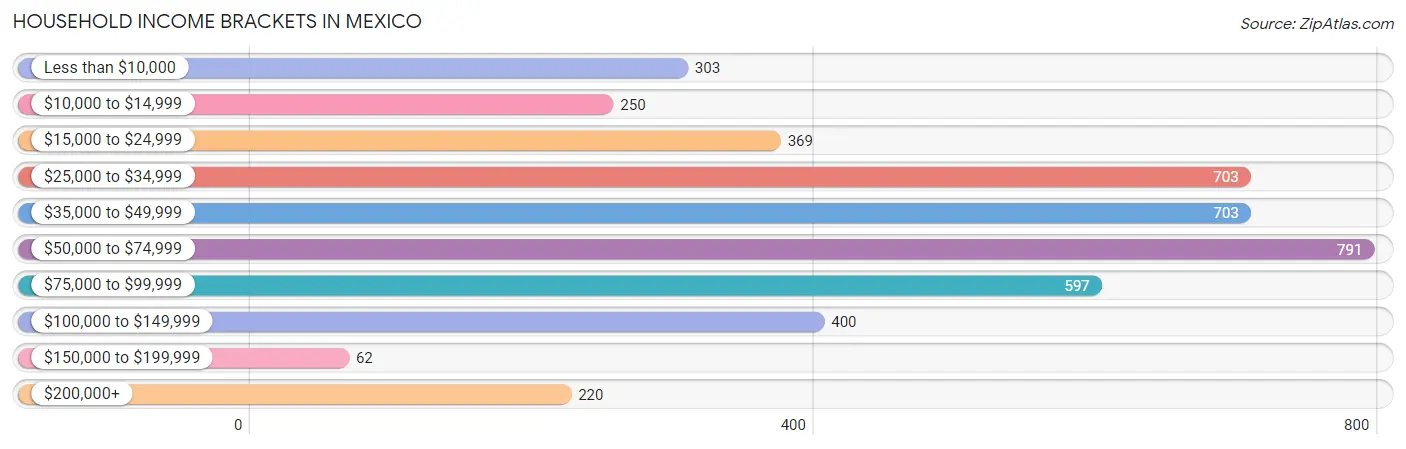
| Income Bracket | # Households | % Households |
| Less than $10,000 | 303 | 6.9% |
| $10,000 to $14,999 | 250 | 5.7% |
| $15,000 to $24,999 | 369 | 8.4% |
| $25,000 to $34,999 | 703 | 16.0% |
| $35,000 to $49,999 | 703 | 16.0% |
| $50,000 to $74,999 | 791 | 18.0% |
| $75,000 to $99,999 | 597 | 13.6% |
| $100,000 to $149,999 | 400 | 9.1% |
| $150,000 to $199,999 | 62 | 1.4% |
| $200,000+ | 220 | 5.0% |
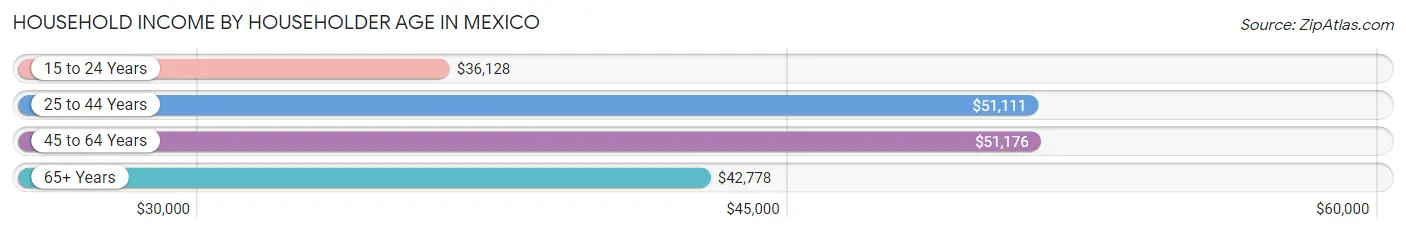
Household Income by Householder Age in Mexico
The median household income in Mexico is $47,585, with the highest median household income of $51,176 found in the 45 to 64 years age bracket for the primary householder. A total of 1,490 households (33.9%) fall into this category. Meanwhile, the 15 to 24 years age bracket for the primary householder has the lowest median household income of $36,128, with 197 households (4.5%) in this group.
| Income Bracket | # Households | Median Income |
| 15 to 24 Years | 197 (4.5%) | $36,128 |
| 25 to 44 Years | 1,538 (35.0%) | $51,111 |
| 45 to 64 Years | 1,490 (33.9%) | $51,176 |
| 65+ Years | 1,168 (26.6%) | $42,778 |
| Total | 4,393 (100.0%) | $47,585 |
Poverty in Mexico
Income Below Poverty by Sex and Age in Mexico
With 14.5% poverty level for males and 19.2% for females among the residents of Mexico, 15 year old males and 15 year old females are the most vulnerable to poverty, with 48 males (42.5%) and 43 females (55.1%) in their respective age groups living below the poverty level.
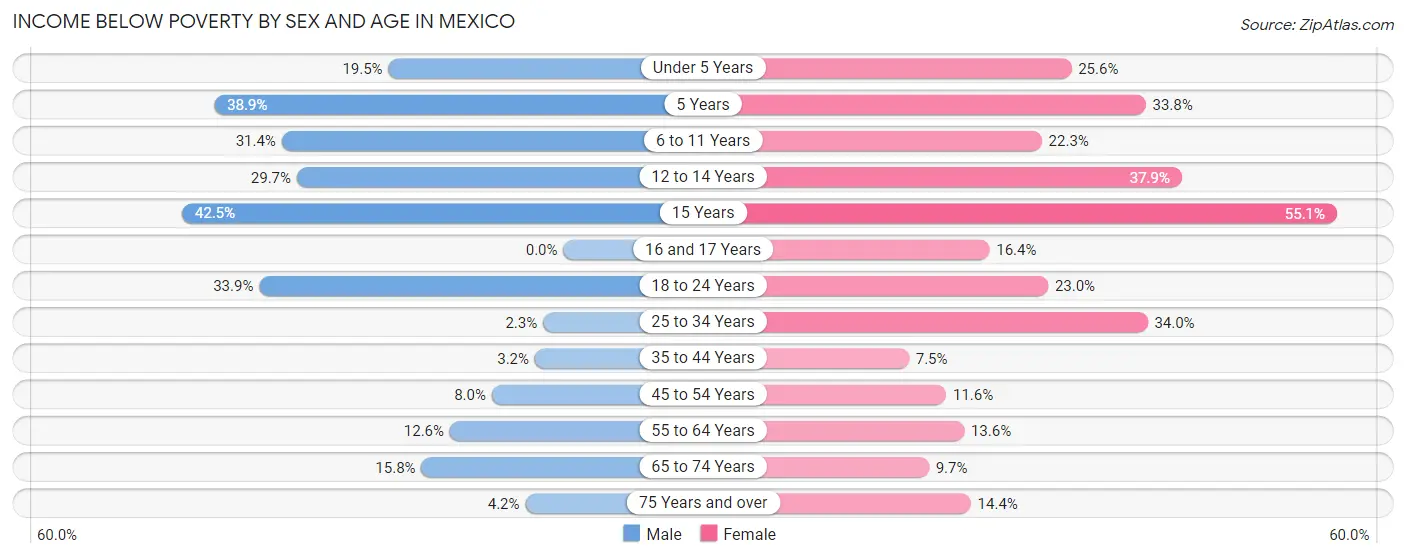
| Age Bracket | Male | Female |
| Under 5 Years | 97 (19.5%) | 82 (25.6%) |
| 5 Years | 7 (38.9%) | 45 (33.8%) |
| 6 to 11 Years | 160 (31.4%) | 69 (22.3%) |
| 12 to 14 Years | 46 (29.7%) | 39 (37.9%) |
| 15 Years | 48 (42.5%) | 43 (55.1%) |
| 16 and 17 Years | 0 (0.0%) | 23 (16.4%) |
| 18 to 24 Years | 126 (33.9%) | 132 (23.0%) |
| 25 to 34 Years | 19 (2.3%) | 367 (34.0%) |
| 35 to 44 Years | 15 (3.2%) | 64 (7.5%) |
| 45 to 54 Years | 47 (8.0%) | 67 (11.6%) |
| 55 to 64 Years | 88 (12.6%) | 118 (13.6%) |
| 65 to 74 Years | 74 (15.8%) | 63 (9.7%) |
| 75 Years and over | 13 (4.2%) | 67 (14.3%) |
| Total | 740 (14.5%) | 1,179 (19.2%) |
Income Above Poverty by Sex and Age in Mexico
According to the poverty statistics in Mexico, males aged 16 and 17 years and females aged 35 to 44 years are the age groups that are most secure financially, with 100.0% of males and 92.5% of females in these age groups living above the poverty line.
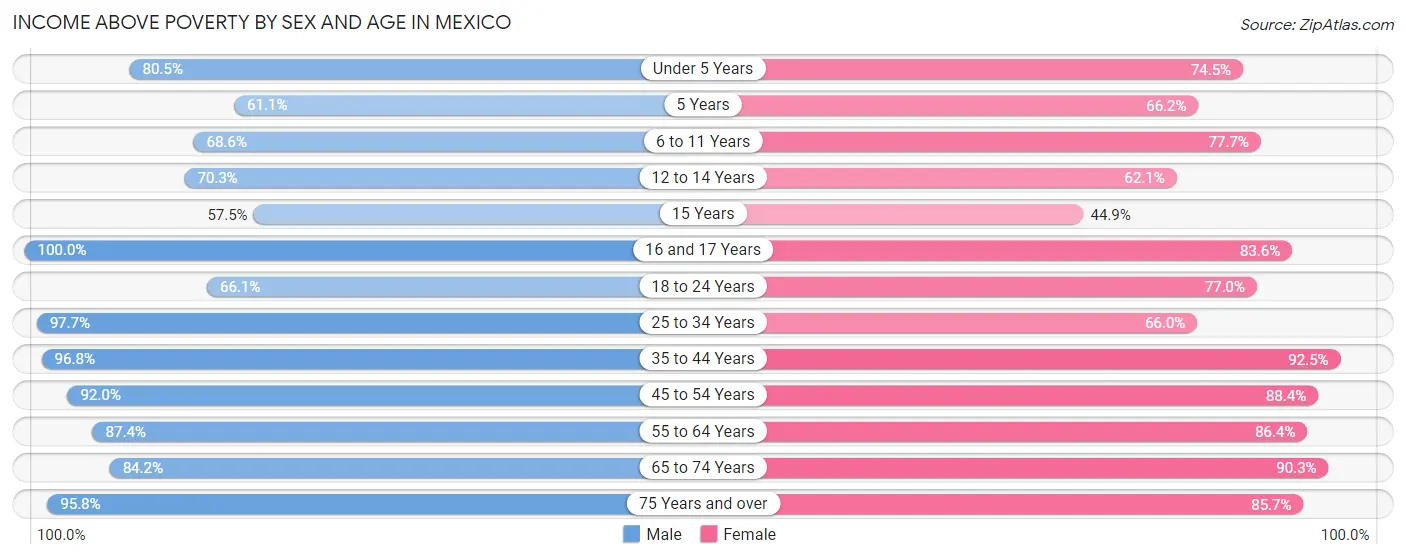
| Age Bracket | Male | Female |
| Under 5 Years | 401 (80.5%) | 239 (74.5%) |
| 5 Years | 11 (61.1%) | 88 (66.2%) |
| 6 to 11 Years | 350 (68.6%) | 241 (77.7%) |
| 12 to 14 Years | 109 (70.3%) | 64 (62.1%) |
| 15 Years | 65 (57.5%) | 35 (44.9%) |
| 16 and 17 Years | 78 (100.0%) | 117 (83.6%) |
| 18 to 24 Years | 246 (66.1%) | 443 (77.0%) |
| 25 to 34 Years | 820 (97.7%) | 711 (66.0%) |
| 35 to 44 Years | 458 (96.8%) | 794 (92.5%) |
| 45 to 54 Years | 543 (92.0%) | 510 (88.4%) |
| 55 to 64 Years | 608 (87.4%) | 749 (86.4%) |
| 65 to 74 Years | 394 (84.2%) | 588 (90.3%) |
| 75 Years and over | 294 (95.8%) | 400 (85.7%) |
| Total | 4,377 (85.5%) | 4,979 (80.8%) |
Income Below Poverty Among Married-Couple Families in Mexico
The poverty statistics for married-couple families in Mexico show that 1.6% or 28 of the total 1,773 families live below the poverty line. Families with no children have the highest poverty rate of 2.6%, comprising of 28 families. On the other hand, families with 1 or 2 children have the lowest poverty rate of 0.0%, which includes 0 families.
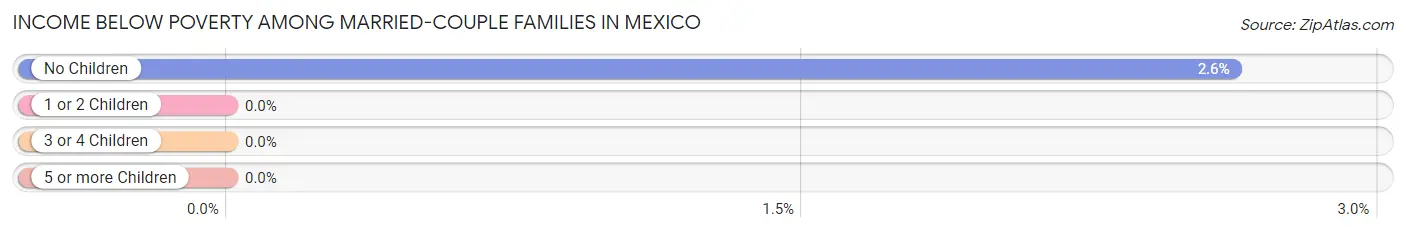
| Children | Above Poverty | Below Poverty |
| No Children | 1,039 (97.4%) | 28 (2.6%) |
| 1 or 2 Children | 593 (100.0%) | 0 (0.0%) |
| 3 or 4 Children | 107 (100.0%) | 0 (0.0%) |
| 5 or more Children | 6 (100.0%) | 0 (0.0%) |
| Total | 1,745 (98.4%) | 28 (1.6%) |
Income Below Poverty Among Single-Parent Households in Mexico
According to the poverty data in Mexico, 23.6% or 46 single-father households and 39.1% or 319 single-mother households are living below the poverty line. Among single-father households, those with 1 or 2 children have the highest poverty rate, with 32 households (47.8%) experiencing poverty. Likewise, among single-mother households, those with 3 or 4 children have the highest poverty rate, with 51 households (57.3%) falling below the poverty line.
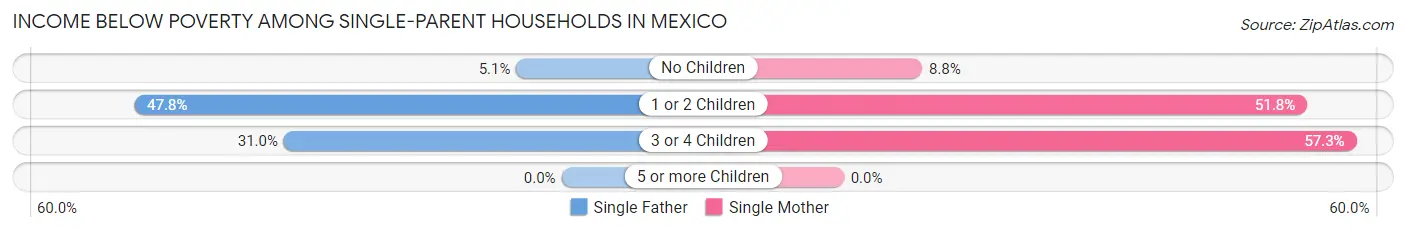
| Children | Single Father | Single Mother |
| No Children | 5 (5.1%) | 22 (8.8%) |
| 1 or 2 Children | 32 (47.8%) | 246 (51.8%) |
| 3 or 4 Children | 9 (31.0%) | 51 (57.3%) |
| 5 or more Children | 0 (0.0%) | 0 (0.0%) |
| Total | 46 (23.6%) | 319 (39.1%) |
Income Below Poverty Among Married-Couple vs Single-Parent Households in Mexico
The poverty data for Mexico shows that 28 of the married-couple family households (1.6%) and 365 of the single-parent households (36.1%) are living below the poverty level. Within the married-couple family households, those with no children have the highest poverty rate, with 28 households (2.6%) falling below the poverty line. Among the single-parent households, those with 1 or 2 children have the highest poverty rate, with 278 household (51.3%) living below poverty.
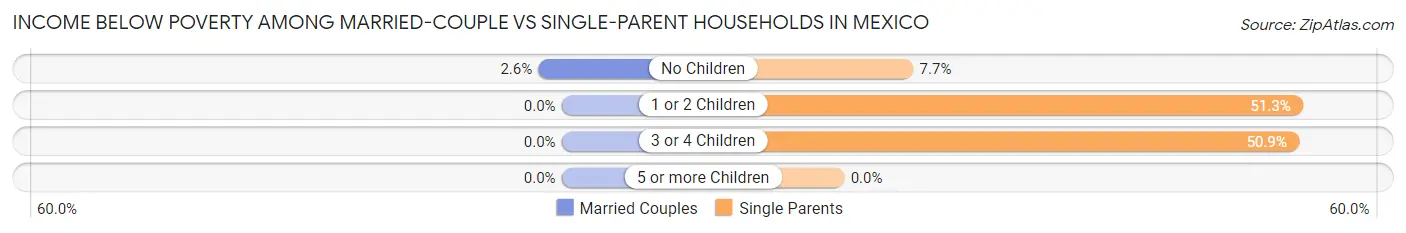
| Children | Married-Couple Families | Single-Parent Households |
| No Children | 28 (2.6%) | 27 (7.7%) |
| 1 or 2 Children | 0 (0.0%) | 278 (51.3%) |
| 3 or 4 Children | 0 (0.0%) | 60 (50.8%) |
| 5 or more Children | 0 (0.0%) | 0 (0.0%) |
| Total | 28 (1.6%) | 365 (36.1%) |
Race in Mexico
The most populous races in Mexico are White / Caucasian (9,927 | 86.3%), Two or more Races (714 | 6.2%), and Black / African American (668 | 5.8%).
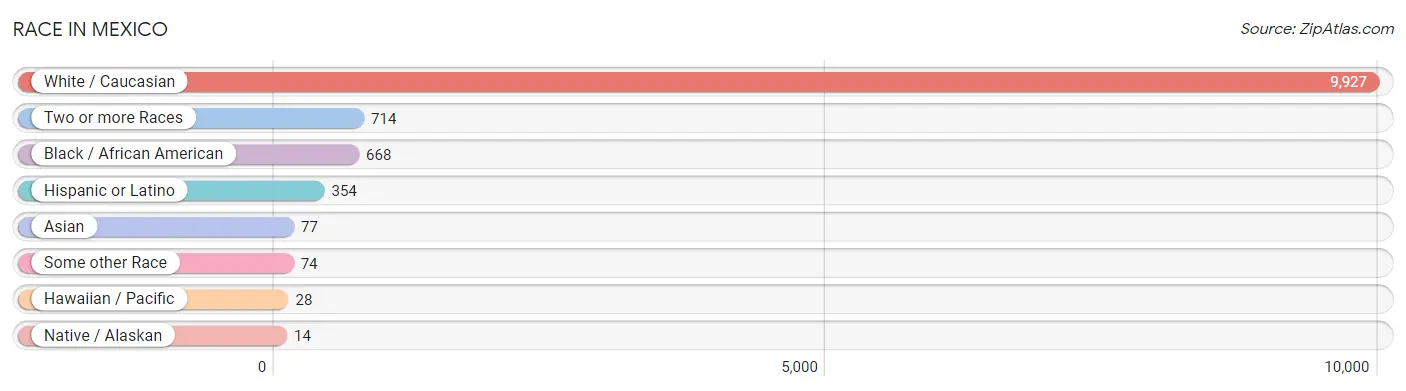
| Race | # Population | % Population |
| Asian | 77 | 0.7% |
| Black / African American | 668 | 5.8% |
| Hawaiian / Pacific | 28 | 0.2% |
| Hispanic or Latino | 354 | 3.1% |
| Native / Alaskan | 14 | 0.1% |
| White / Caucasian | 9,927 | 86.3% |
| Two or more Races | 714 | 6.2% |
| Some other Race | 74 | 0.6% |
| Total | 11,502 | 100.0% |
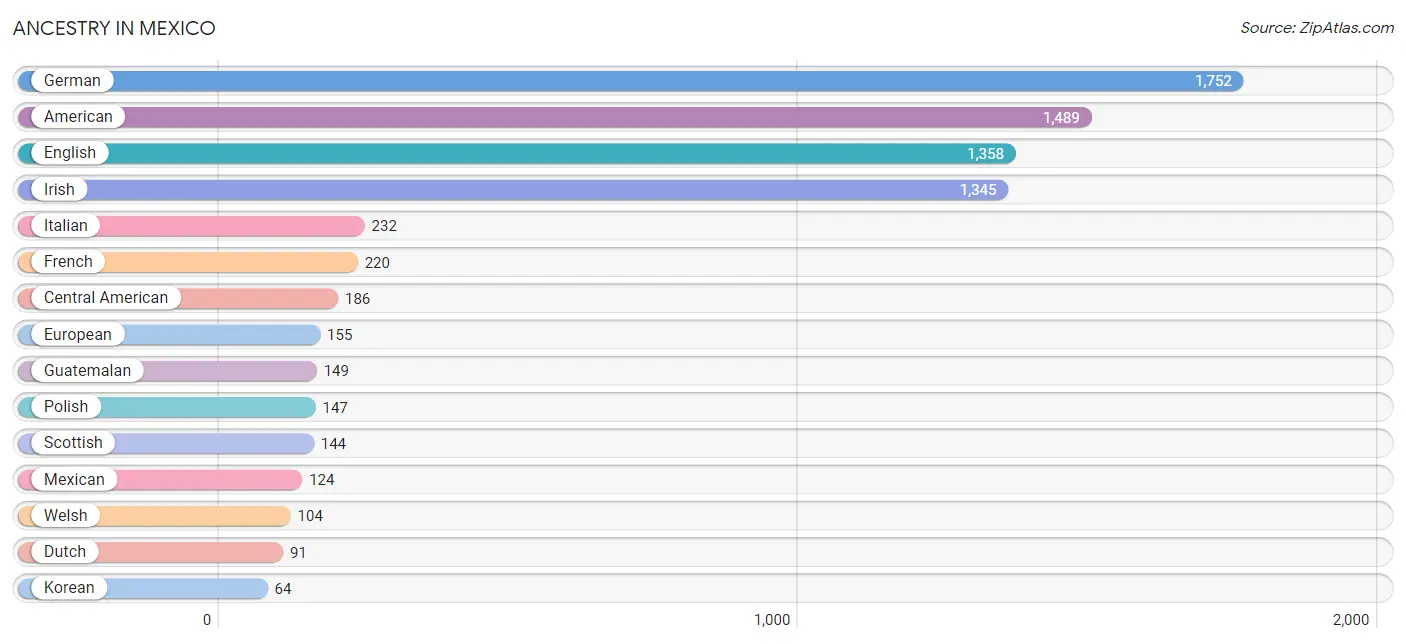
Ancestry in Mexico
The most populous ancestries reported in Mexico are German (1,752 | 15.2%), American (1,489 | 13.0%), English (1,358 | 11.8%), Irish (1,345 | 11.7%), and Italian (232 | 2.0%), together accounting for 53.7% of all Mexico residents.
| Ancestry | # Population | % Population |
| African | 1 | 0.0% |
| American | 1,489 | 13.0% |
| British | 47 | 0.4% |
| Central American | 186 | 1.6% |
| Cherokee | 11 | 0.1% |
| Chickasaw | 6 | 0.1% |
| Choctaw | 16 | 0.1% |
| Cuban | 44 | 0.4% |
| Czech | 10 | 0.1% |
| Danish | 26 | 0.2% |
| Dutch | 91 | 0.8% |
| Eastern European | 36 | 0.3% |
| English | 1,358 | 11.8% |
| European | 155 | 1.3% |
| French | 220 | 1.9% |
| French Canadian | 18 | 0.2% |
| German | 1,752 | 15.2% |
| Guatemalan | 149 | 1.3% |
| Indian (Asian) | 3 | 0.0% |
| Irish | 1,345 | 11.7% |
| Italian | 232 | 2.0% |
| Korean | 64 | 0.6% |
| Mexican | 124 | 1.1% |
| Native Hawaiian | 24 | 0.2% |
| Navajo | 32 | 0.3% |
| Norwegian | 10 | 0.1% |
| Polish | 147 | 1.3% |
| Portuguese | 6 | 0.1% |
| Salvadoran | 37 | 0.3% |
| Scandinavian | 30 | 0.3% |
| Scotch-Irish | 42 | 0.4% |
| Scottish | 144 | 1.3% |
| Sioux | 23 | 0.2% |
| Sri Lankan | 46 | 0.4% |
| Subsaharan African | 1 | 0.0% |
| Swedish | 21 | 0.2% |
| Swiss | 13 | 0.1% |
| Welsh | 104 | 0.9% | View All 38 Rows |
Immigrants in Mexico
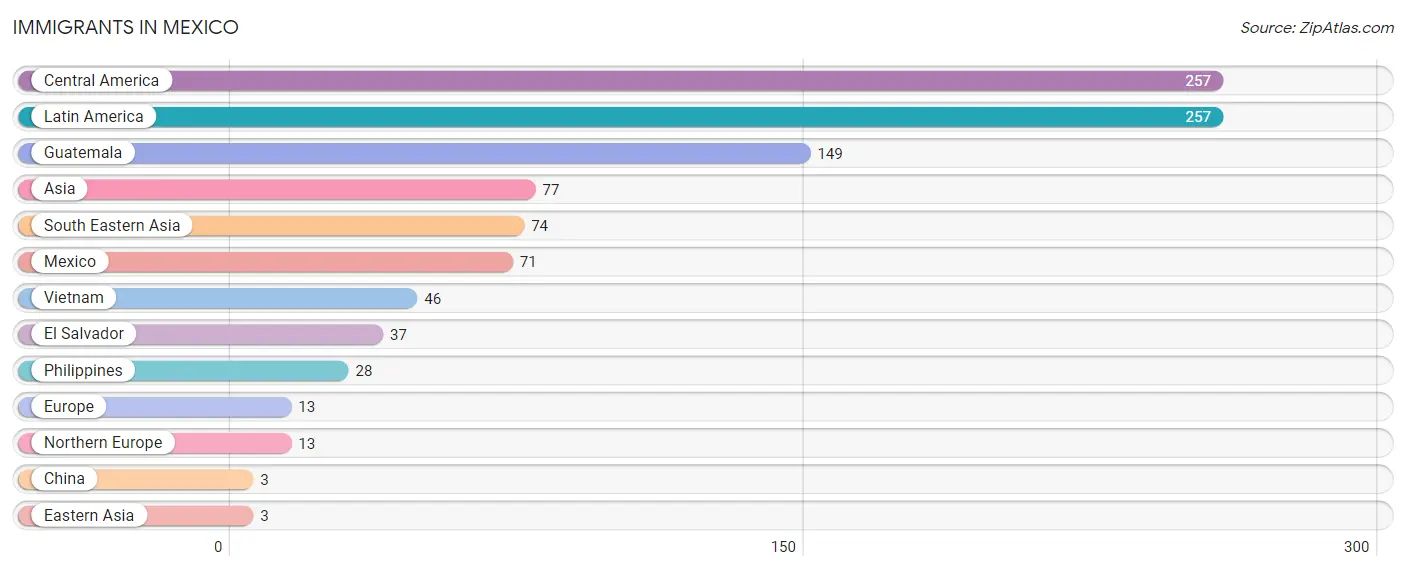
The most numerous immigrant groups reported in Mexico came from Central America (257 | 2.2%), Latin America (257 | 2.2%), Guatemala (149 | 1.3%), Asia (77 | 0.7%), and South Eastern Asia (74 | 0.6%), together accounting for 7.1% of all Mexico residents.
| Immigration Origin | # Population | % Population |
| Asia | 77 | 0.7% |
| Central America | 257 | 2.2% |
| China | 3 | 0.0% |
| Eastern Asia | 3 | 0.0% |
| El Salvador | 37 | 0.3% |
| Europe | 13 | 0.1% |
| Guatemala | 149 | 1.3% |
| Latin America | 257 | 2.2% |
| Mexico | 71 | 0.6% |
| Northern Europe | 13 | 0.1% |
| Philippines | 28 | 0.2% |
| South Eastern Asia | 74 | 0.6% |
| Vietnam | 46 | 0.4% | View All 13 Rows |
Sex and Age in Mexico
Sex and Age in Mexico
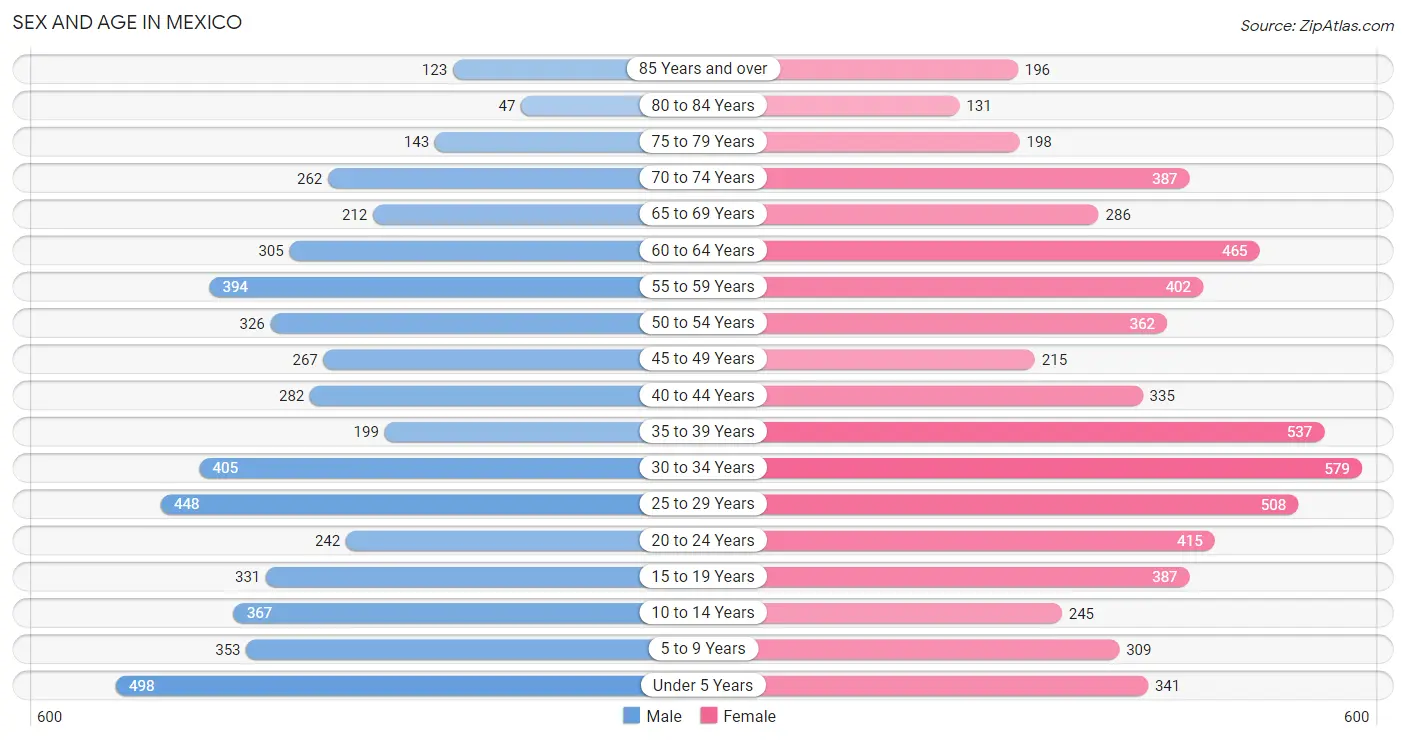
The most populous age groups in Mexico are Under 5 Years (498 | 9.6%) for men and 30 to 34 Years (579 | 9.2%) for women.
| Age Bracket | Male | Female |
| Under 5 Years | 498 (9.6%) | 341 (5.4%) |
| 5 to 9 Years | 353 (6.8%) | 309 (4.9%) |
| 10 to 14 Years | 367 (7.0%) | 245 (3.9%) |
| 15 to 19 Years | 331 (6.4%) | 387 (6.1%) |
| 20 to 24 Years | 242 (4.6%) | 415 (6.6%) |
| 25 to 29 Years | 448 (8.6%) | 508 (8.1%) |
| 30 to 34 Years | 405 (7.8%) | 579 (9.2%) |
| 35 to 39 Years | 199 (3.8%) | 537 (8.5%) |
| 40 to 44 Years | 282 (5.4%) | 335 (5.3%) |
| 45 to 49 Years | 267 (5.1%) | 215 (3.4%) |
| 50 to 54 Years | 326 (6.3%) | 362 (5.8%) |
| 55 to 59 Years | 394 (7.6%) | 402 (6.4%) |
| 60 to 64 Years | 305 (5.9%) | 465 (7.4%) |
| 65 to 69 Years | 212 (4.1%) | 286 (4.5%) |
| 70 to 74 Years | 262 (5.0%) | 387 (6.1%) |
| 75 to 79 Years | 143 (2.8%) | 198 (3.1%) |
| 80 to 84 Years | 47 (0.9%) | 131 (2.1%) |
| 85 Years and over | 123 (2.4%) | 196 (3.1%) |
| Total | 5,204 (100.0%) | 6,298 (100.0%) |
Families and Households in Mexico
Median Family Size in Mexico
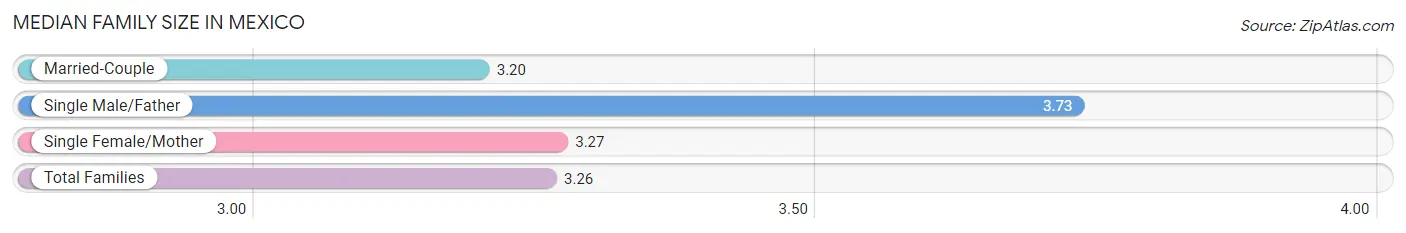
The median family size in Mexico is 3.26 persons per family, with single male/father families (195 | 7.0%) accounting for the largest median family size of 3.73 persons per family. On the other hand, married-couple families (1,773 | 63.7%) represent the smallest median family size with 3.20 persons per family.
| Family Type | # Families | Family Size |
| Married-Couple | 1,773 (63.7%) | 3.20 |
| Single Male/Father | 195 (7.0%) | 3.73 |
| Single Female/Mother | 815 (29.3%) | 3.27 |
| Total Families | 2,783 (100.0%) | 3.26 |
Median Household Size in Mexico
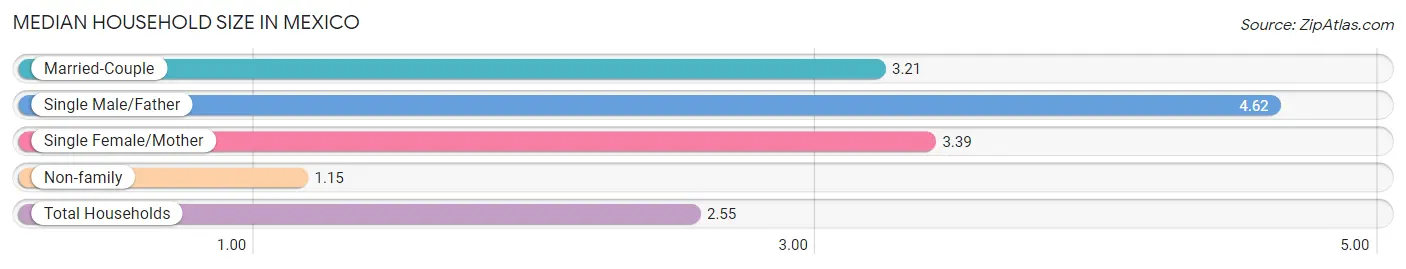
The median household size in Mexico is 2.55 persons per household, with single male/father households (195 | 4.4%) accounting for the largest median household size of 4.62 persons per household. non-family households (1,610 | 36.6%) represent the smallest median household size with 1.15 persons per household.
| Household Type | # Households | Household Size |
| Married-Couple | 1,773 (40.4%) | 3.21 |
| Single Male/Father | 195 (4.4%) | 4.62 |
| Single Female/Mother | 815 (18.5%) | 3.39 |
| Non-family | 1,610 (36.6%) | 1.15 |
| Total Households | 4,393 (100.0%) | 2.55 |
Household Size by Marriage Status in Mexico
Out of a total of 4,393 households in Mexico, 2,783 (63.3%) are family households, while 1,610 (36.6%) are nonfamily households. The most numerous type of family households are 2-person households, comprising 1,268, and the most common type of nonfamily households are 1-person households, comprising 1,478.
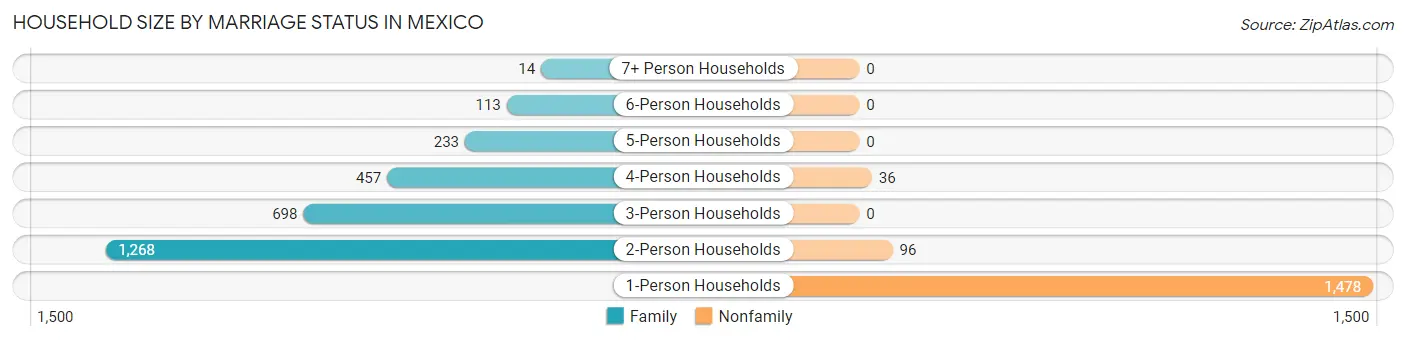
| Household Size | Family Households | Nonfamily Households |
| 1-Person Households | - | 1,478 (33.6%) |
| 2-Person Households | 1,268 (28.9%) | 96 (2.2%) |
| 3-Person Households | 698 (15.9%) | 0 (0.0%) |
| 4-Person Households | 457 (10.4%) | 36 (0.8%) |
| 5-Person Households | 233 (5.3%) | 0 (0.0%) |
| 6-Person Households | 113 (2.6%) | 0 (0.0%) |
| 7+ Person Households | 14 (0.3%) | 0 (0.0%) |
| Total | 2,783 (63.3%) | 1,610 (36.6%) |
Female Fertility in Mexico
Fertility by Age in Mexico
Average fertility rate in Mexico is 98.0 births per 1,000 women. Women in the age bracket of 20 to 34 years have the highest fertility rate with 151.0 births per 1,000 women. Women in the age bracket of 20 to 34 years acount for 77.2% of all women with births.
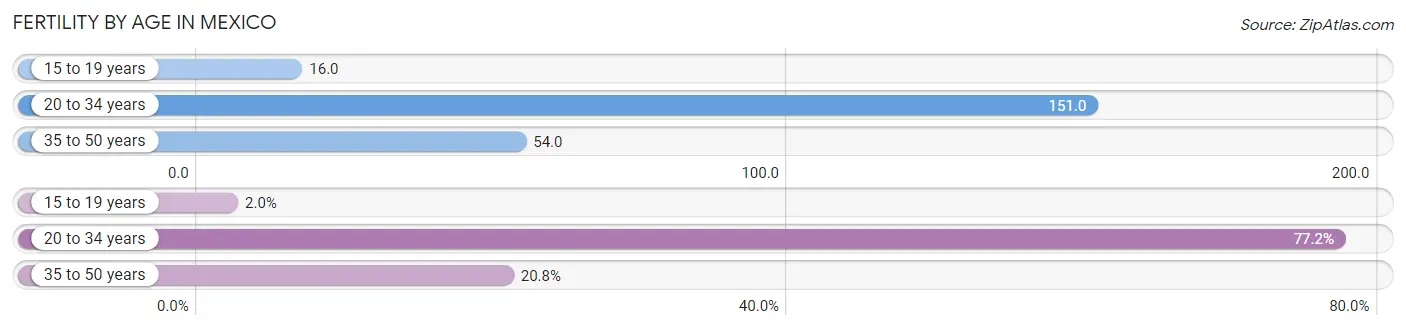
| Age Bracket | Women with Births | Births / 1,000 Women |
| 15 to 19 years | 6 (2.0%) | 16.0 |
| 20 to 34 years | 227 (77.2%) | 151.0 |
| 35 to 50 years | 61 (20.7%) | 54.0 |
| Total | 294 (100.0%) | 98.0 |
Fertility by Age by Marriage Status in Mexico
77.9% of women with births (294) in Mexico are married. The highest percentage of unmarried women with births falls into 15 to 19 years age bracket with 100.0% of them unmarried at the time of birth, while the lowest percentage of unmarried women with births belong to 35 to 50 years age bracket with 0.0% of them unmarried.
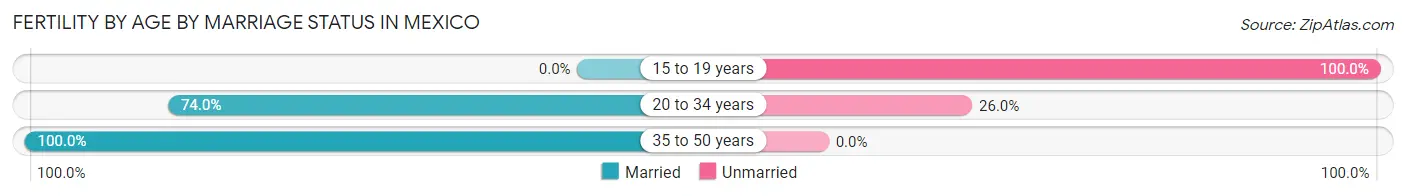
| Age Bracket | Married | Unmarried |
| 15 to 19 years | 0 (0.0%) | 6 (100.0%) |
| 20 to 34 years | 168 (74.0%) | 59 (26.0%) |
| 35 to 50 years | 61 (100.0%) | 0 (0.0%) |
| Total | 229 (77.9%) | 65 (22.1%) |
Fertility by Education in Mexico
Average fertility rate in Mexico is 98.0 births per 1,000 women. Women with the education attainment of bachelor's degree have the highest fertility rate of 271.0 births per 1,000 women, while women with the education attainment of high school diploma have the lowest fertility at 47.0 births per 1,000 women. Women with the education attainment of college or associate's degree represent 33.3% of all women with births.
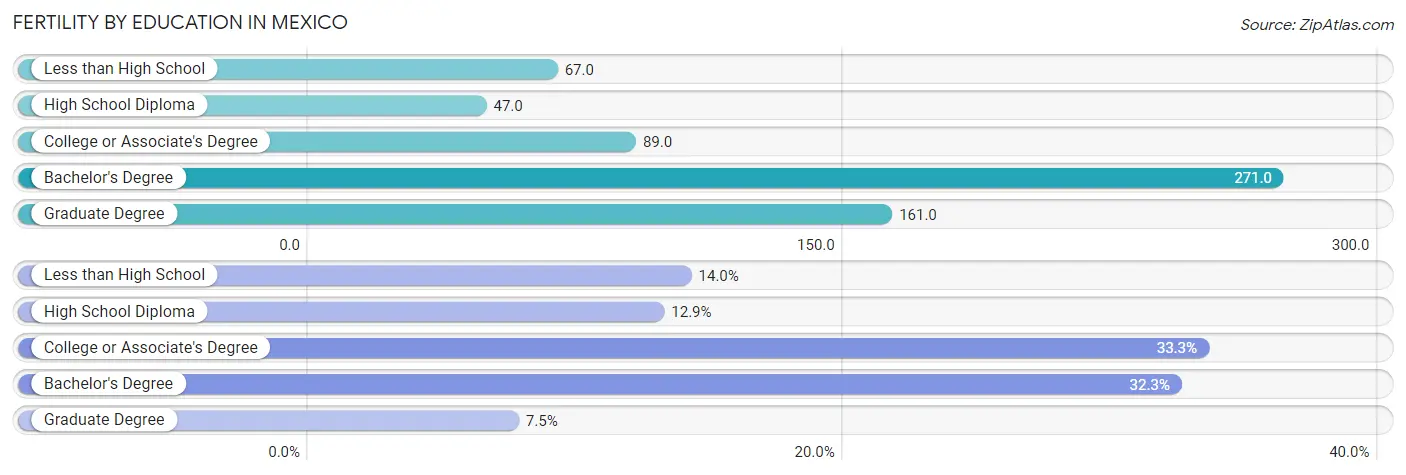
| Educational Attainment | Women with Births | Births / 1,000 Women |
| Less than High School | 41 (14.0%) | 67.0 |
| High School Diploma | 38 (12.9%) | 47.0 |
| College or Associate's Degree | 98 (33.3%) | 89.0 |
| Bachelor's Degree | 95 (32.3%) | 271.0 |
| Graduate Degree | 22 (7.5%) | 161.0 |
| Total | 294 (100.0%) | 98.0 |
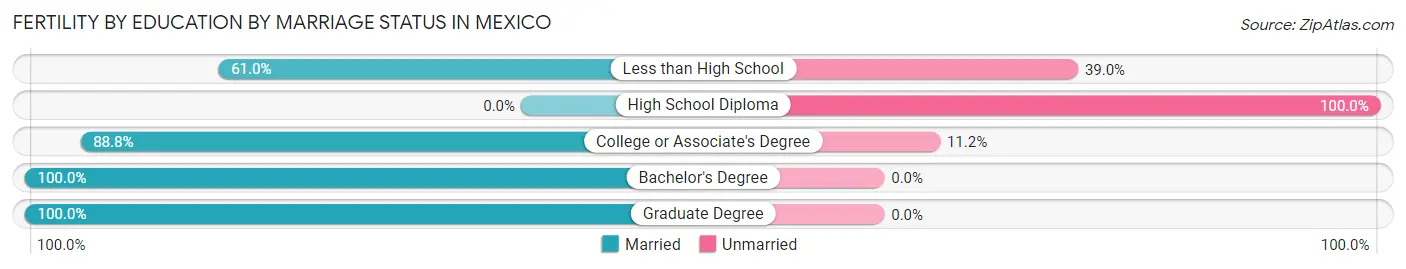
Fertility by Education by Marriage Status in Mexico
22.1% of women with births in Mexico are unmarried. Women with the educational attainment of bachelor's degree are most likely to be married with 100.0% of them married at childbirth, while women with the educational attainment of high school diploma are least likely to be married with 100.0% of them unmarried at childbirth.
| Educational Attainment | Married | Unmarried |
| Less than High School | 25 (61.0%) | 16 (39.0%) |
| High School Diploma | 0 (0.0%) | 38 (100.0%) |
| College or Associate's Degree | 87 (88.8%) | 11 (11.2%) |
| Bachelor's Degree | 95 (100.0%) | 0 (0.0%) |
| Graduate Degree | 22 (100.0%) | 0 (0.0%) |
| Total | 229 (77.9%) | 65 (22.1%) |
Employment Characteristics in Mexico
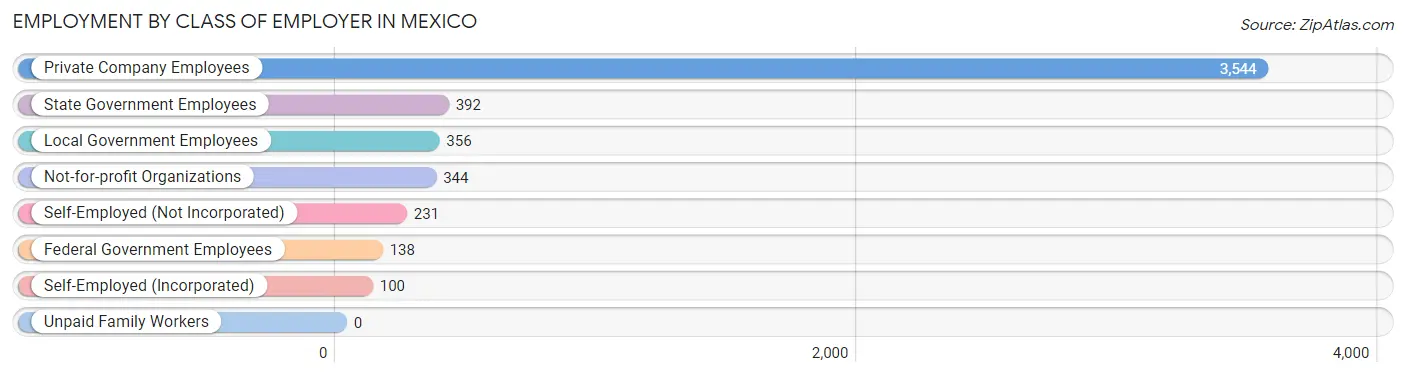
Employment by Class of Employer in Mexico
Among the 5,105 employed individuals in Mexico, private company employees (3,544 | 69.4%), state government employees (392 | 7.7%), and local government employees (356 | 7.0%) make up the most common classes of employment.
| Employer Class | # Employees | % Employees |
| Private Company Employees | 3,544 | 69.4% |
| Self-Employed (Incorporated) | 100 | 2.0% |
| Self-Employed (Not Incorporated) | 231 | 4.5% |
| Not-for-profit Organizations | 344 | 6.7% |
| Local Government Employees | 356 | 7.0% |
| State Government Employees | 392 | 7.7% |
| Federal Government Employees | 138 | 2.7% |
| Unpaid Family Workers | 0 | 0.0% |
| Total | 5,105 | 100.0% |
Employment Status by Age in Mexico
According to the labor force statistics for Mexico, out of the total population over 16 years of age (9,197), 61.9% or 5,693 individuals are in the labor force, with 5.7% or 325 of them unemployed. The age group with the highest labor force participation rate is 25 to 29 years, with 86.8% or 830 individuals in the labor force. Within the labor force, the 30 to 34 years age range has the highest percentage of unemployed individuals, with 19.2% or 148 of them being unemployed.
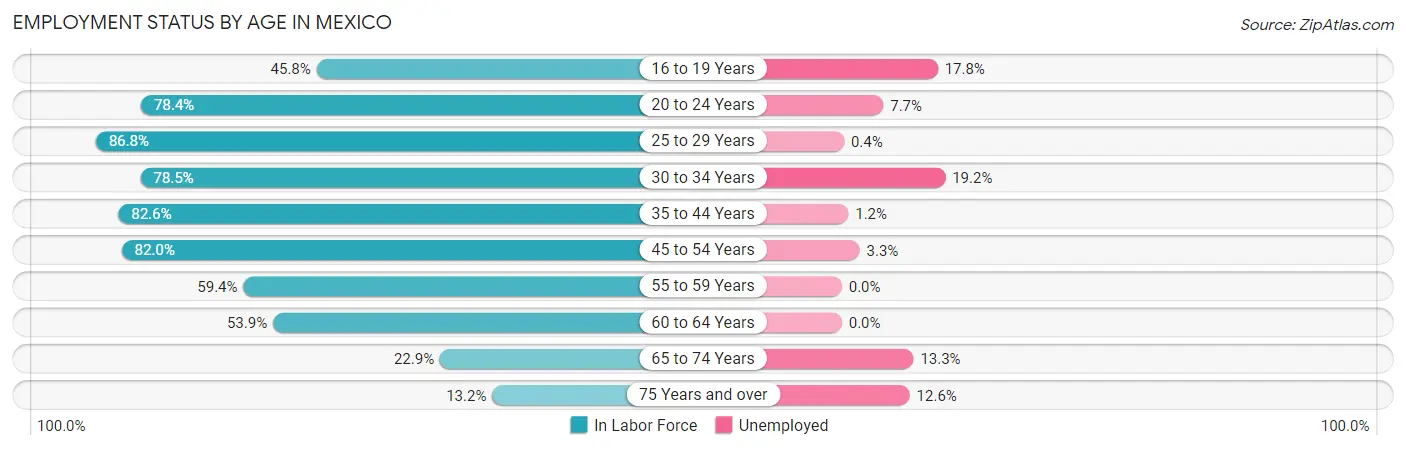
| Age Bracket | In Labor Force | Unemployed |
| 16 to 19 Years | 241 (45.8%) | 43 (17.8%) |
| 20 to 24 Years | 515 (78.4%) | 40 (7.7%) |
| 25 to 29 Years | 830 (86.8%) | 3 (0.4%) |
| 30 to 34 Years | 772 (78.5%) | 148 (19.2%) |
| 35 to 44 Years | 1,118 (82.6%) | 13 (1.2%) |
| 45 to 54 Years | 959 (82.0%) | 32 (3.3%) |
| 55 to 59 Years | 473 (59.4%) | 0 (0.0%) |
| 60 to 64 Years | 415 (53.9%) | 0 (0.0%) |
| 65 to 74 Years | 263 (22.9%) | 35 (13.3%) |
| 75 Years and over | 111 (13.2%) | 14 (12.6%) |
| Total | 5,693 (61.9%) | 325 (5.7%) |
Employment Status by Educational Attainment in Mexico
According to labor force statistics for Mexico, 75.8% of individuals (4,570) out of the total population between 25 and 64 years of age (6,029) are in the labor force, with 4.3% or 197 of them being unemployed. The group with the highest labor force participation rate are those with the educational attainment of bachelor's degree or higher, with 90.5% or 903 individuals in the labor force. Within the labor force, individuals with college / associate degree education have the highest percentage of unemployment, with 6.5% or 119 of them being unemployed.
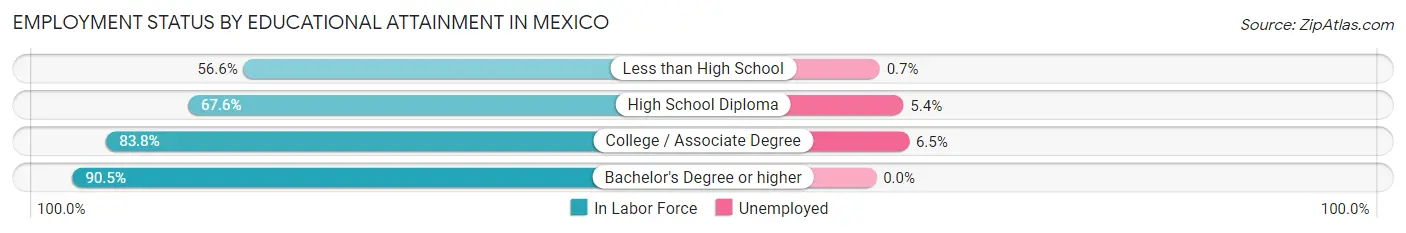
| Educational Attainment | In Labor Force | Unemployed |
| Less than High School | 457 (56.6%) | 6 (0.7%) |
| High School Diploma | 1,380 (67.6%) | 110 (5.4%) |
| College / Associate Degree | 1,828 (83.8%) | 142 (6.5%) |
| Bachelor's Degree or higher | 903 (90.5%) | 0 (0.0%) |
| Total | 4,570 (75.8%) | 259 (4.3%) |
Employment Occupations by Sex in Mexico
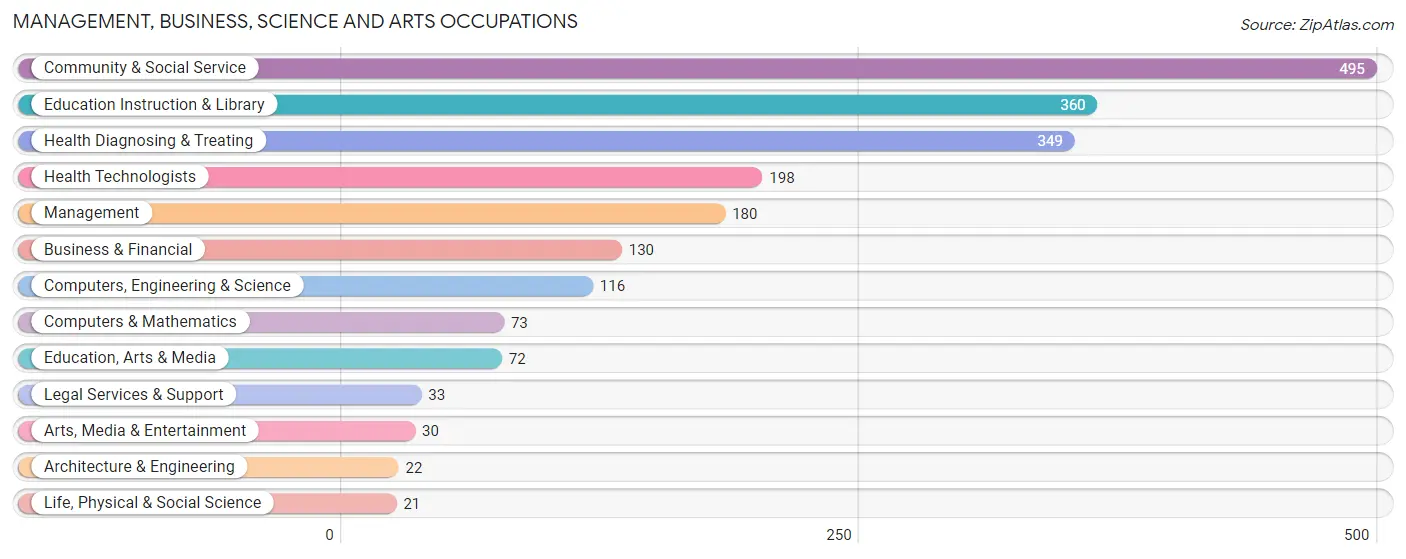
Management, Business, Science and Arts Occupations
The most common Management, Business, Science and Arts occupations in Mexico are Community & Social Service (495 | 9.2%), Education Instruction & Library (360 | 6.7%), Health Diagnosing & Treating (349 | 6.5%), Health Technologists (198 | 3.7%), and Management (180 | 3.4%).
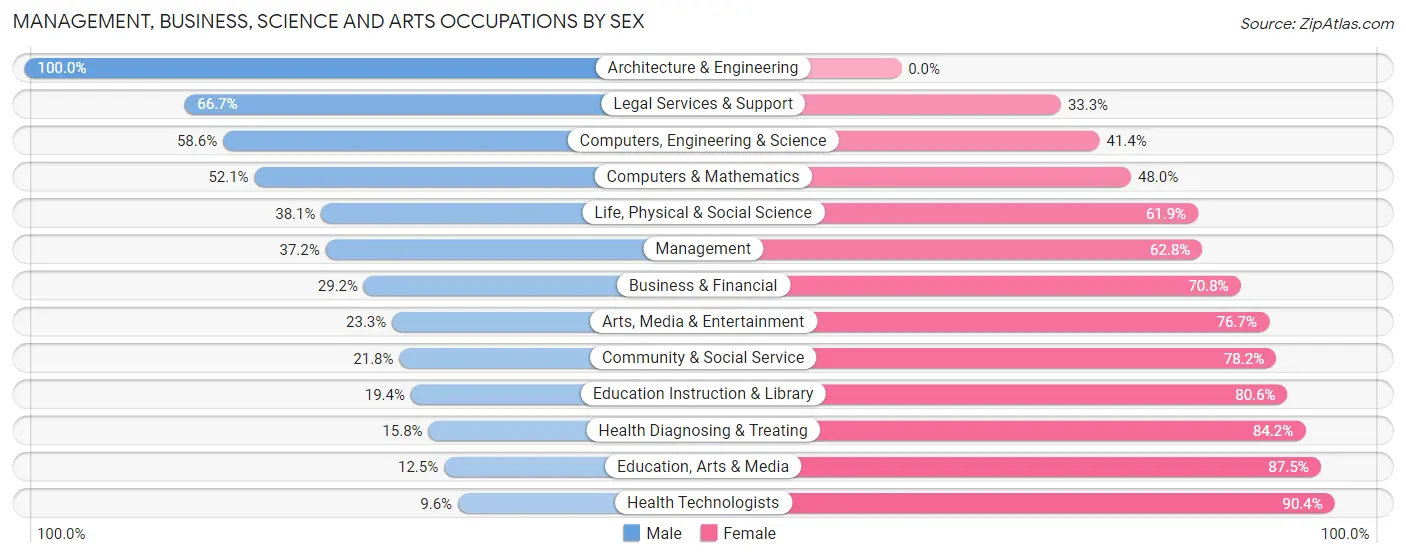
Management, Business, Science and Arts Occupations by Sex
Within the Management, Business, Science and Arts occupations in Mexico, the most male-oriented occupations are Architecture & Engineering (100.0%), Legal Services & Support (66.7%), and Computers, Engineering & Science (58.6%), while the most female-oriented occupations are Health Technologists (90.4%), Education, Arts & Media (87.5%), and Health Diagnosing & Treating (84.2%).
| Occupation | Male | Female |
| Management | 67 (37.2%) | 113 (62.8%) |
| Business & Financial | 38 (29.2%) | 92 (70.8%) |
| Computers, Engineering & Science | 68 (58.6%) | 48 (41.4%) |
| Computers & Mathematics | 38 (52.0%) | 35 (47.9%) |
| Architecture & Engineering | 22 (100.0%) | 0 (0.0%) |
| Life, Physical & Social Science | 8 (38.1%) | 13 (61.9%) |
| Community & Social Service | 108 (21.8%) | 387 (78.2%) |
| Education, Arts & Media | 9 (12.5%) | 63 (87.5%) |
| Legal Services & Support | 22 (66.7%) | 11 (33.3%) |
| Education Instruction & Library | 70 (19.4%) | 290 (80.6%) |
| Arts, Media & Entertainment | 7 (23.3%) | 23 (76.7%) |
| Health Diagnosing & Treating | 55 (15.8%) | 294 (84.2%) |
| Health Technologists | 19 (9.6%) | 179 (90.4%) |
| Total (Category) | 336 (26.5%) | 934 (73.5%) |
| Total (Overall) | 2,519 (47.0%) | 2,845 (53.0%) |
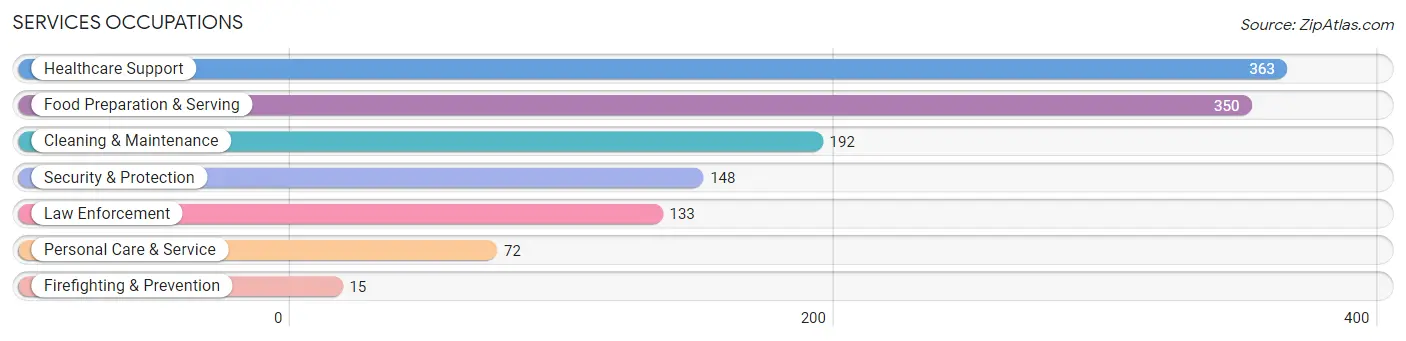
Services Occupations
The most common Services occupations in Mexico are Healthcare Support (363 | 6.8%), Food Preparation & Serving (350 | 6.5%), Cleaning & Maintenance (192 | 3.6%), Security & Protection (148 | 2.8%), and Law Enforcement (133 | 2.5%).
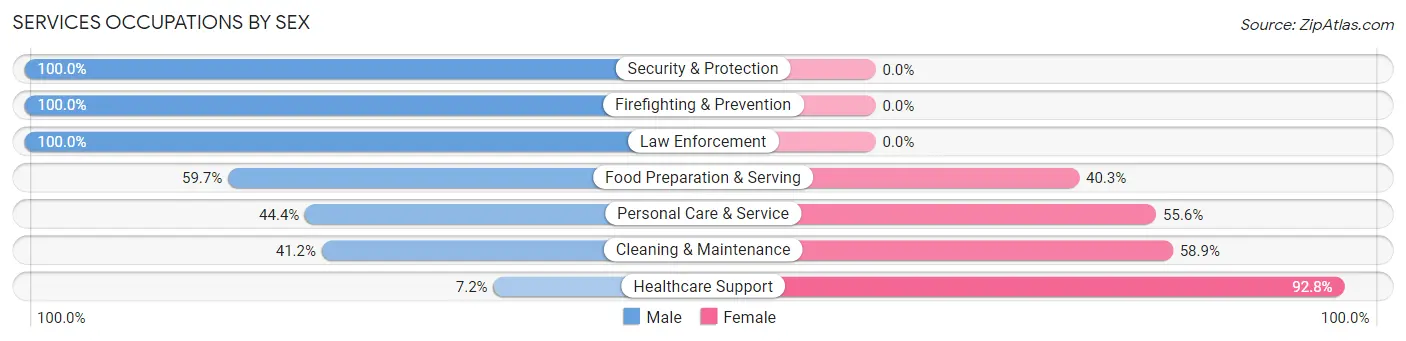
Services Occupations by Sex
Within the Services occupations in Mexico, the most male-oriented occupations are Security & Protection (100.0%), Firefighting & Prevention (100.0%), and Law Enforcement (100.0%), while the most female-oriented occupations are Healthcare Support (92.8%), Cleaning & Maintenance (58.9%), and Personal Care & Service (55.6%).
| Occupation | Male | Female |
| Healthcare Support | 26 (7.2%) | 337 (92.8%) |
| Security & Protection | 148 (100.0%) | 0 (0.0%) |
| Firefighting & Prevention | 15 (100.0%) | 0 (0.0%) |
| Law Enforcement | 133 (100.0%) | 0 (0.0%) |
| Food Preparation & Serving | 209 (59.7%) | 141 (40.3%) |
| Cleaning & Maintenance | 79 (41.1%) | 113 (58.9%) |
| Personal Care & Service | 32 (44.4%) | 40 (55.6%) |
| Total (Category) | 494 (43.9%) | 631 (56.1%) |
| Total (Overall) | 2,519 (47.0%) | 2,845 (53.0%) |
Sales and Office Occupations
The most common Sales and Office occupations in Mexico are Office & Administration (668 | 12.4%), and Sales & Related (452 | 8.4%).

Sales and Office Occupations by Sex

| Occupation | Male | Female |
| Sales & Related | 122 (27.0%) | 330 (73.0%) |
| Office & Administration | 124 (18.6%) | 544 (81.4%) |
| Total (Category) | 246 (22.0%) | 874 (78.0%) |
| Total (Overall) | 2,519 (47.0%) | 2,845 (53.0%) |
Natural Resources, Construction and Maintenance Occupations
The most common Natural Resources, Construction and Maintenance occupations in Mexico are Installation, Maintenance & Repair (190 | 3.5%), Construction & Extraction (180 | 3.4%), and Farming, Fishing & Forestry (101 | 1.9%).
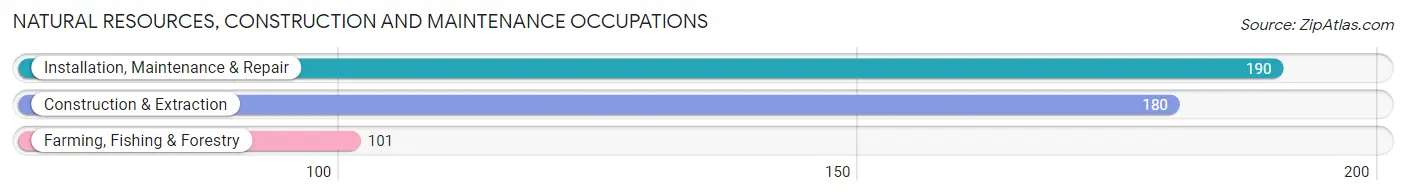
Natural Resources, Construction and Maintenance Occupations by Sex
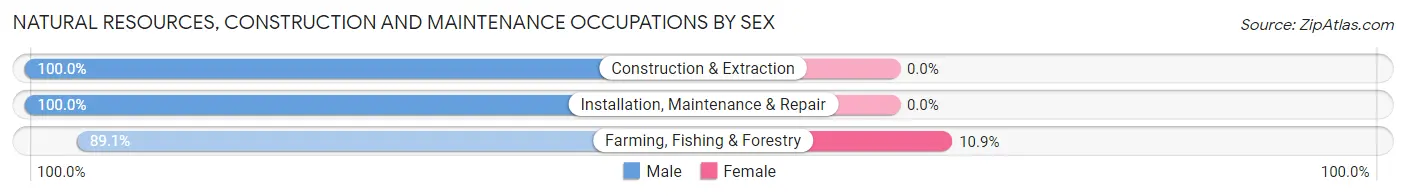
| Occupation | Male | Female |
| Farming, Fishing & Forestry | 90 (89.1%) | 11 (10.9%) |
| Construction & Extraction | 180 (100.0%) | 0 (0.0%) |
| Installation, Maintenance & Repair | 190 (100.0%) | 0 (0.0%) |
| Total (Category) | 460 (97.7%) | 11 (2.3%) |
| Total (Overall) | 2,519 (47.0%) | 2,845 (53.0%) |
Production, Transportation and Moving Occupations
The most common Production, Transportation and Moving occupations in Mexico are Production (662 | 12.3%), Transportation (374 | 7.0%), and Material Moving (342 | 6.4%).
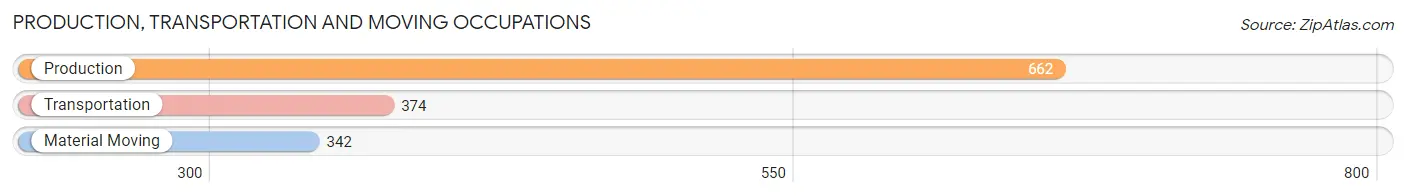
Production, Transportation and Moving Occupations by Sex
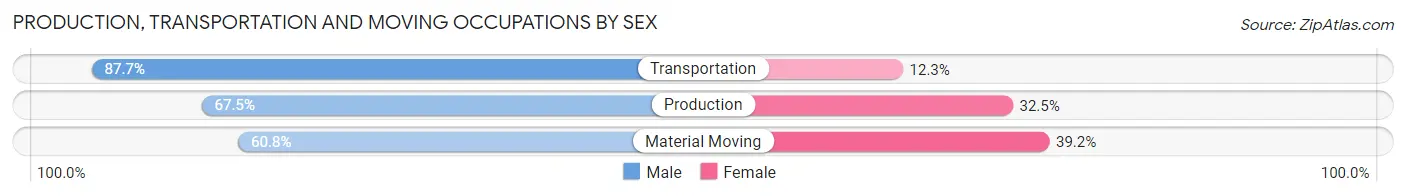
| Occupation | Male | Female |
| Production | 447 (67.5%) | 215 (32.5%) |
| Transportation | 328 (87.7%) | 46 (12.3%) |
| Material Moving | 208 (60.8%) | 134 (39.2%) |
| Total (Category) | 983 (71.3%) | 395 (28.7%) |
| Total (Overall) | 2,519 (47.0%) | 2,845 (53.0%) |
Employment Industries by Sex in Mexico
Employment Industries in Mexico
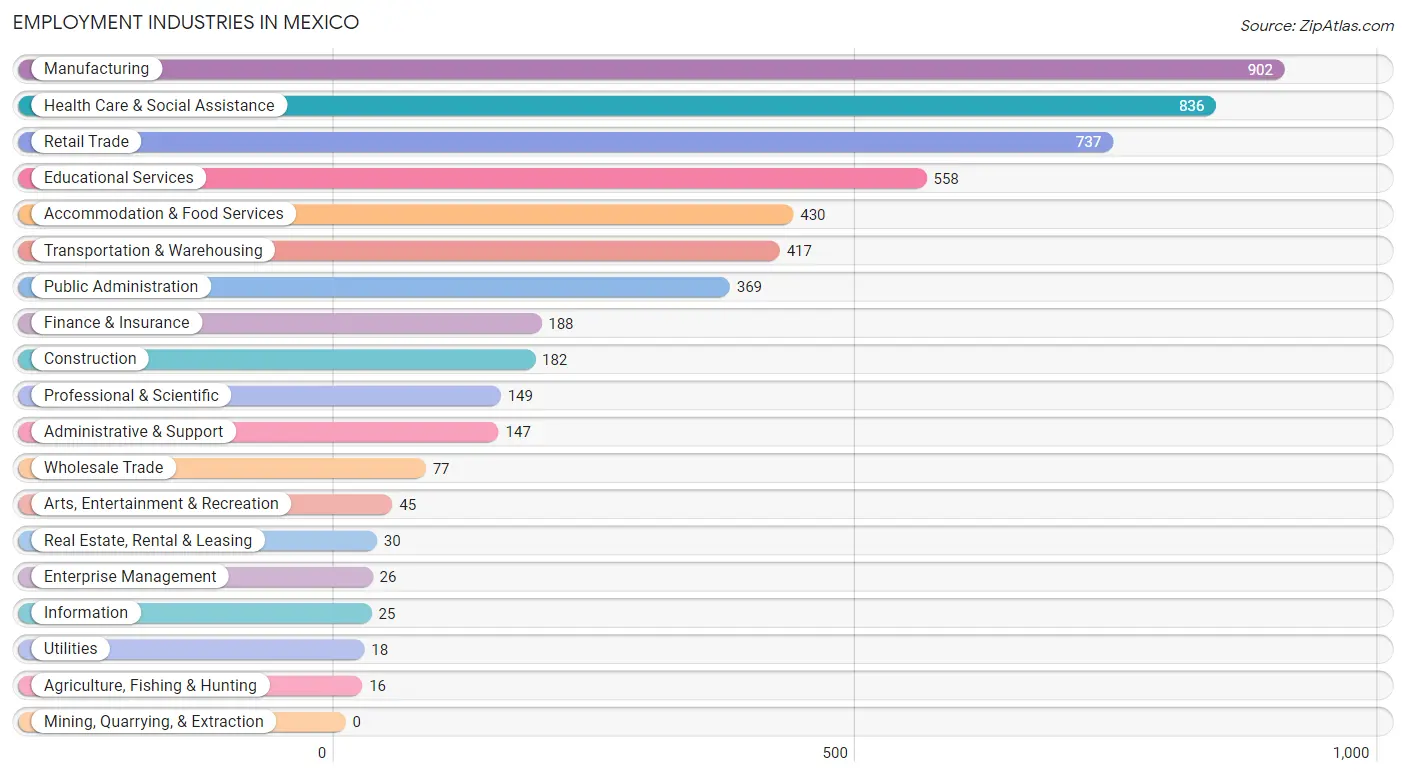
The major employment industries in Mexico include Manufacturing (902 | 16.8%), Health Care & Social Assistance (836 | 15.6%), Retail Trade (737 | 13.7%), Educational Services (558 | 10.4%), and Accommodation & Food Services (430 | 8.0%).
Employment Industries by Sex in Mexico
The Mexico industries that see more men than women are Agriculture, Fishing & Hunting (100.0%), Construction (100.0%), and Utilities (100.0%), whereas the industries that tend to have a higher number of women are Professional & Scientific (87.3%), Health Care & Social Assistance (83.7%), and Finance & Insurance (78.7%).
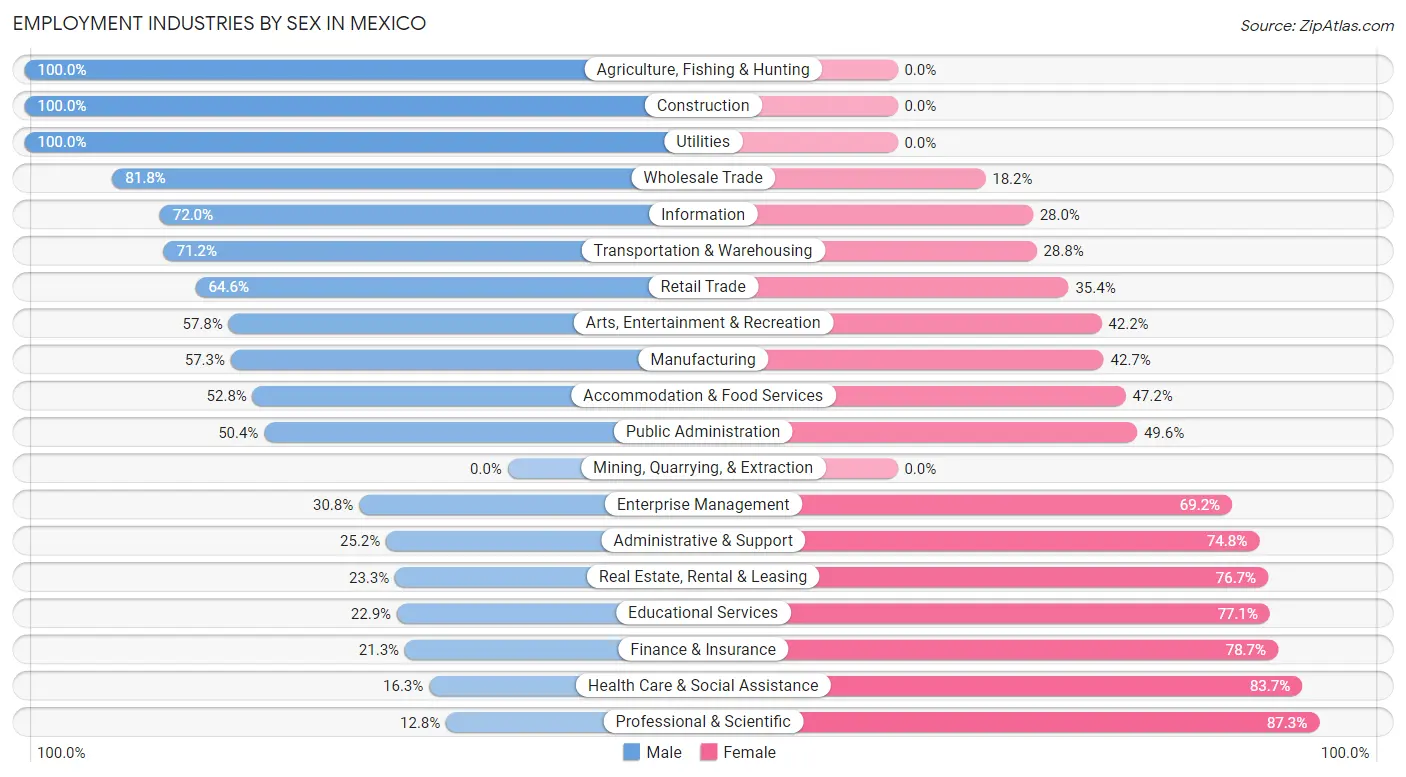
| Industry | Male | Female |
| Agriculture, Fishing & Hunting | 16 (100.0%) | 0 (0.0%) |
| Mining, Quarrying, & Extraction | 0 (0.0%) | 0 (0.0%) |
| Construction | 182 (100.0%) | 0 (0.0%) |
| Manufacturing | 517 (57.3%) | 385 (42.7%) |
| Wholesale Trade | 63 (81.8%) | 14 (18.2%) |
| Retail Trade | 476 (64.6%) | 261 (35.4%) |
| Transportation & Warehousing | 297 (71.2%) | 120 (28.8%) |
| Utilities | 18 (100.0%) | 0 (0.0%) |
| Information | 18 (72.0%) | 7 (28.0%) |
| Finance & Insurance | 40 (21.3%) | 148 (78.7%) |
| Real Estate, Rental & Leasing | 7 (23.3%) | 23 (76.7%) |
| Professional & Scientific | 19 (12.8%) | 130 (87.3%) |
| Enterprise Management | 8 (30.8%) | 18 (69.2%) |
| Administrative & Support | 37 (25.2%) | 110 (74.8%) |
| Educational Services | 128 (22.9%) | 430 (77.1%) |
| Health Care & Social Assistance | 136 (16.3%) | 700 (83.7%) |
| Arts, Entertainment & Recreation | 26 (57.8%) | 19 (42.2%) |
| Accommodation & Food Services | 227 (52.8%) | 203 (47.2%) |
| Public Administration | 186 (50.4%) | 183 (49.6%) |
| Total | 2,519 (47.0%) | 2,845 (53.0%) |
Education in Mexico
School Enrollment in Mexico
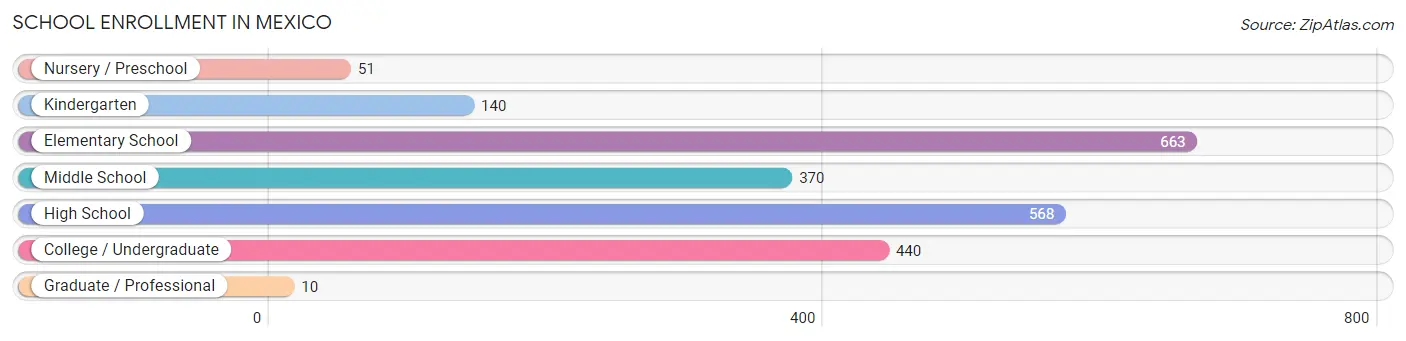
The most common levels of schooling among the 2,242 students in Mexico are elementary school (663 | 29.6%), high school (568 | 25.3%), and college / undergraduate (440 | 19.6%).
| School Level | # Students | % Students |
| Nursery / Preschool | 51 | 2.3% |
| Kindergarten | 140 | 6.2% |
| Elementary School | 663 | 29.6% |
| Middle School | 370 | 16.5% |
| High School | 568 | 25.3% |
| College / Undergraduate | 440 | 19.6% |
| Graduate / Professional | 10 | 0.4% |
| Total | 2,242 | 100.0% |
School Enrollment by Age by Funding Source in Mexico
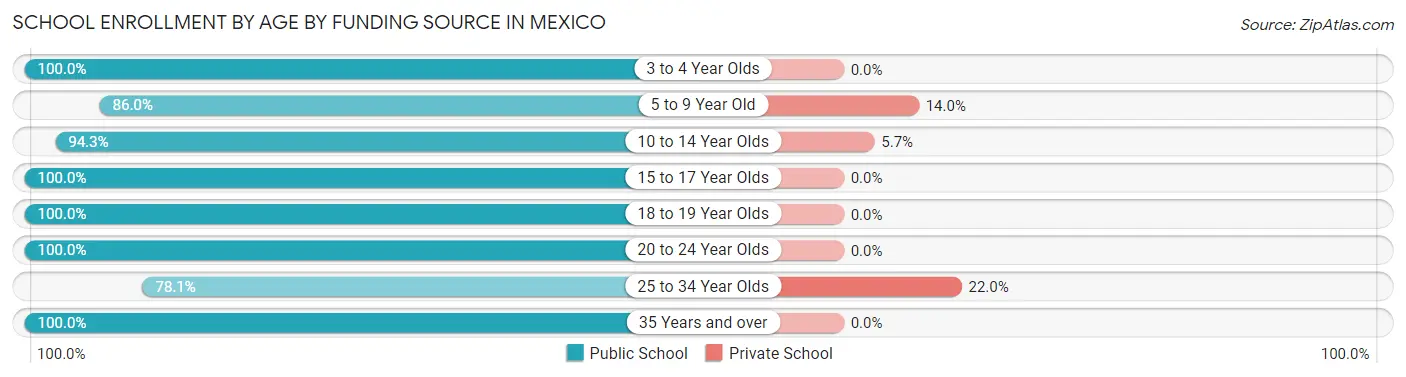
Out of a total of 2,242 students who are enrolled in schools in Mexico, 164 (7.3%) attend a private institution, while the remaining 2,078 (92.7%) are enrolled in public schools. The age group of 25 to 34 year olds has the highest likelihood of being enrolled in private schools, with 45 (22.0% in the age bracket) enrolled. Conversely, the age group of 3 to 4 year olds has the lowest likelihood of being enrolled in a private school, with 44 (100.0% in the age bracket) attending a public institution.
| Age Bracket | Public School | Private School |
| 3 to 4 Year Olds | 44 (100.0%) | 0 (0.0%) |
| 5 to 9 Year Old | 517 (86.0%) | 84 (14.0%) |
| 10 to 14 Year Olds | 577 (94.3%) | 35 (5.7%) |
| 15 to 17 Year Olds | 354 (100.0%) | 0 (0.0%) |
| 18 to 19 Year Olds | 116 (100.0%) | 0 (0.0%) |
| 20 to 24 Year Olds | 208 (100.0%) | 0 (0.0%) |
| 25 to 34 Year Olds | 160 (78.0%) | 45 (22.0%) |
| 35 Years and over | 102 (100.0%) | 0 (0.0%) |
| Total | 2,078 (92.7%) | 164 (7.3%) |
Educational Attainment by Field of Study in Mexico
Education (415 | 31.9%), business (170 | 13.1%), arts & humanities (150 | 11.5%), science & technology (131 | 10.1%), and liberal arts & history (91 | 7.0%) are the most common fields of study among 1,302 individuals in Mexico who have obtained a bachelor's degree or higher.
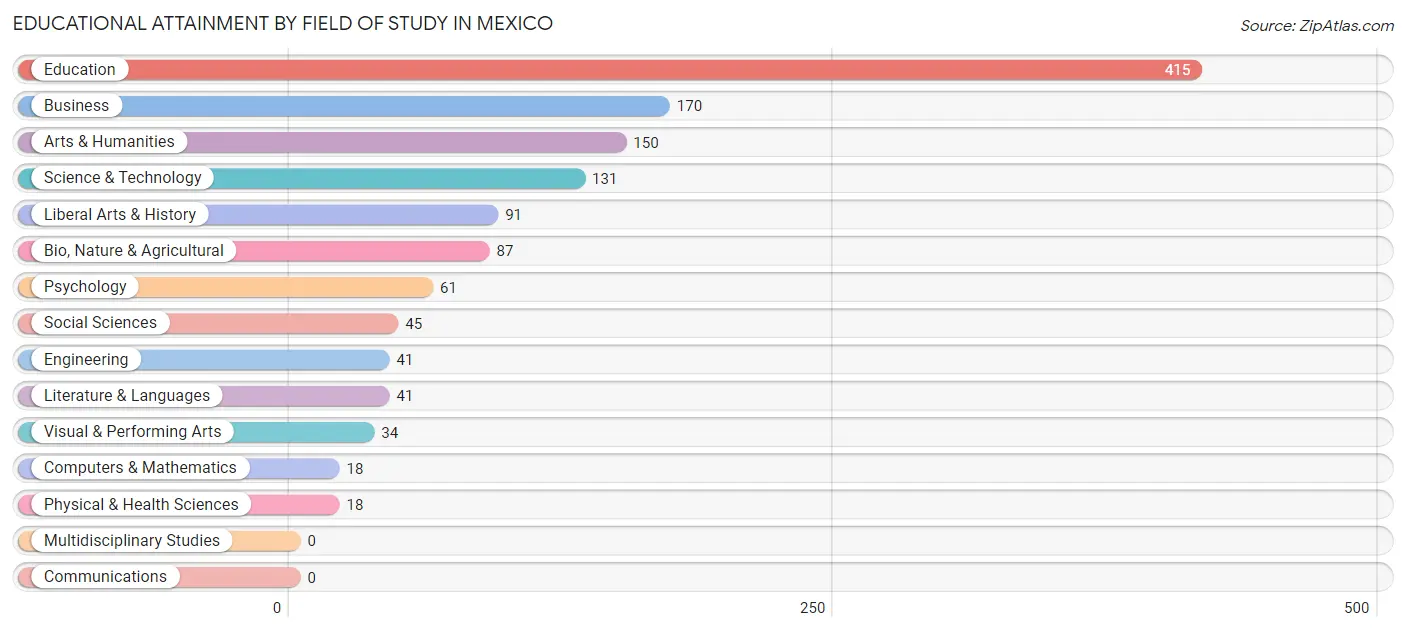
| Field of Study | # Graduates | % Graduates |
| Computers & Mathematics | 18 | 1.4% |
| Bio, Nature & Agricultural | 87 | 6.7% |
| Physical & Health Sciences | 18 | 1.4% |
| Psychology | 61 | 4.7% |
| Social Sciences | 45 | 3.5% |
| Engineering | 41 | 3.2% |
| Multidisciplinary Studies | 0 | 0.0% |
| Science & Technology | 131 | 10.1% |
| Business | 170 | 13.1% |
| Education | 415 | 31.9% |
| Literature & Languages | 41 | 3.2% |
| Liberal Arts & History | 91 | 7.0% |
| Visual & Performing Arts | 34 | 2.6% |
| Communications | 0 | 0.0% |
| Arts & Humanities | 150 | 11.5% |
| Total | 1,302 | 100.0% |
Transportation & Commute in Mexico
Vehicle Availability by Sex in Mexico
The most prevalent vehicle ownership categories in Mexico are males with 2 vehicles (826, accounting for 35.9%) and females with 2 vehicles (1,049, making up 29.5%).
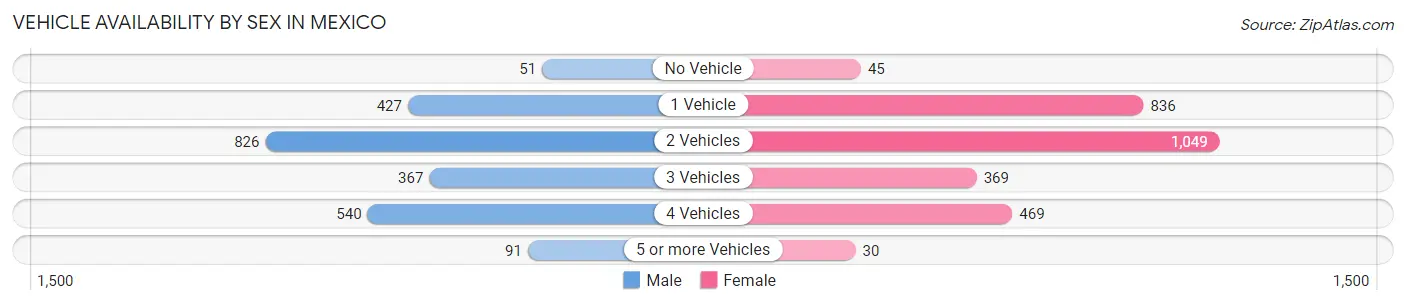
| Vehicles Available | Male | Female |
| No Vehicle | 51 (2.2%) | 45 (1.6%) |
| 1 Vehicle | 427 (18.5%) | 836 (29.9%) |
| 2 Vehicles | 826 (35.9%) | 1,049 (37.5%) |
| 3 Vehicles | 367 (15.9%) | 369 (13.2%) |
| 4 Vehicles | 540 (23.5%) | 469 (16.8%) |
| 5 or more Vehicles | 91 (4.0%) | 30 (1.1%) |
| Total | 2,302 (100.0%) | 2,798 (100.0%) |
Commute Time in Mexico
The most frequently occuring commute durations in Mexico are 5 to 9 minutes (1,662 commuters, 33.4%), 10 to 14 minutes (729 commuters, 14.6%), and 45 to 59 minutes (614 commuters, 12.3%).
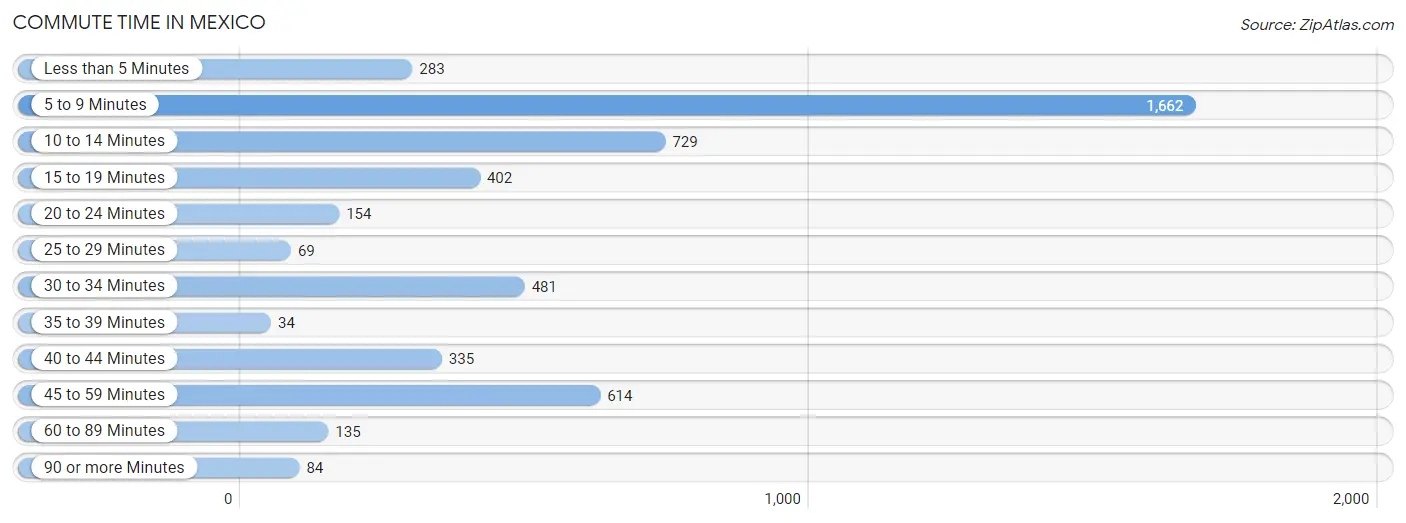
| Commute Time | # Commuters | % Commuters |
| Less than 5 Minutes | 283 | 5.7% |
| 5 to 9 Minutes | 1,662 | 33.4% |
| 10 to 14 Minutes | 729 | 14.6% |
| 15 to 19 Minutes | 402 | 8.1% |
| 20 to 24 Minutes | 154 | 3.1% |
| 25 to 29 Minutes | 69 | 1.4% |
| 30 to 34 Minutes | 481 | 9.7% |
| 35 to 39 Minutes | 34 | 0.7% |
| 40 to 44 Minutes | 335 | 6.7% |
| 45 to 59 Minutes | 614 | 12.3% |
| 60 to 89 Minutes | 135 | 2.7% |
| 90 or more Minutes | 84 | 1.7% |
Commute Time by Sex in Mexico
The most common commute times in Mexico are 5 to 9 minutes (618 commuters, 27.9%) for males and 5 to 9 minutes (1,044 commuters, 37.7%) for females.
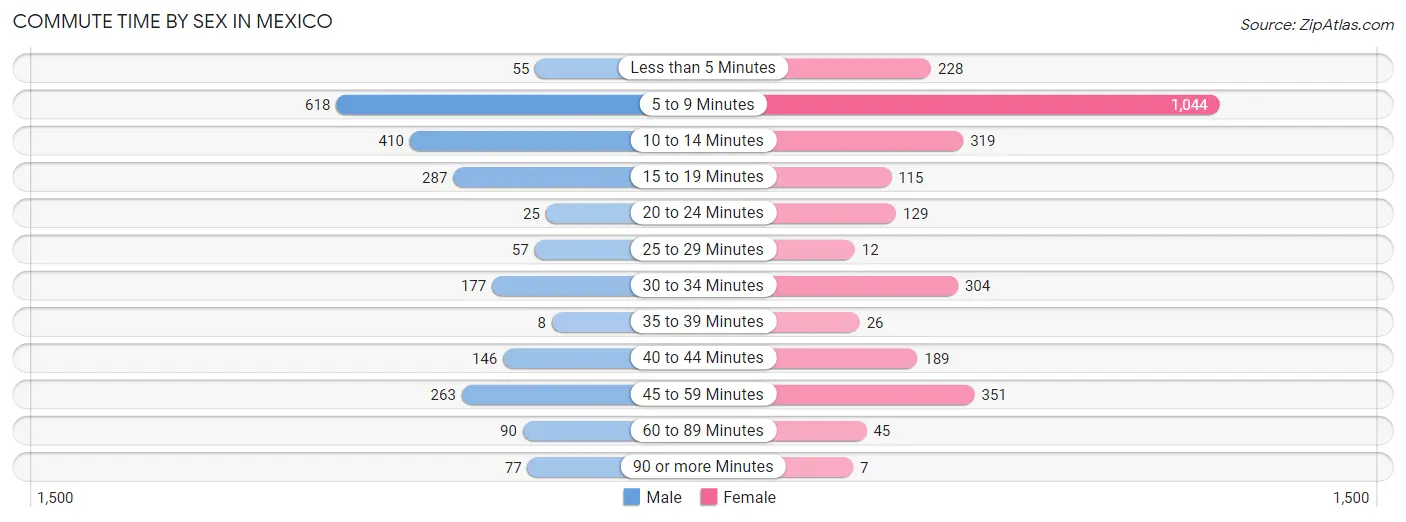
| Commute Time | Male | Female |
| Less than 5 Minutes | 55 (2.5%) | 228 (8.2%) |
| 5 to 9 Minutes | 618 (27.9%) | 1,044 (37.7%) |
| 10 to 14 Minutes | 410 (18.5%) | 319 (11.5%) |
| 15 to 19 Minutes | 287 (13.0%) | 115 (4.2%) |
| 20 to 24 Minutes | 25 (1.1%) | 129 (4.7%) |
| 25 to 29 Minutes | 57 (2.6%) | 12 (0.4%) |
| 30 to 34 Minutes | 177 (8.0%) | 304 (11.0%) |
| 35 to 39 Minutes | 8 (0.4%) | 26 (0.9%) |
| 40 to 44 Minutes | 146 (6.6%) | 189 (6.8%) |
| 45 to 59 Minutes | 263 (11.9%) | 351 (12.7%) |
| 60 to 89 Minutes | 90 (4.1%) | 45 (1.6%) |
| 90 or more Minutes | 77 (3.5%) | 7 (0.3%) |
Time of Departure to Work by Sex in Mexico
The most frequent times of departure to work in Mexico are 12:00 PM to 3:59 PM (358, 16.2%) for males and 7:00 AM to 7:29 AM (496, 17.9%) for females.
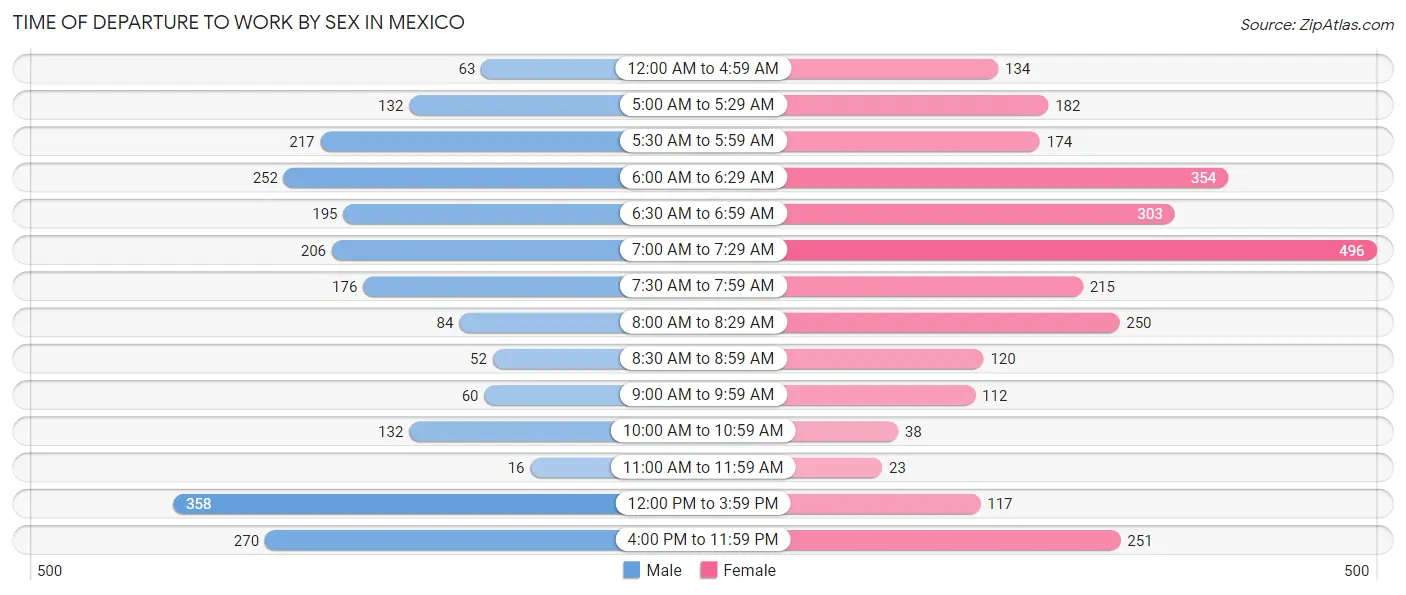
| Time of Departure | Male | Female |
| 12:00 AM to 4:59 AM | 63 (2.9%) | 134 (4.8%) |
| 5:00 AM to 5:29 AM | 132 (6.0%) | 182 (6.6%) |
| 5:30 AM to 5:59 AM | 217 (9.8%) | 174 (6.3%) |
| 6:00 AM to 6:29 AM | 252 (11.4%) | 354 (12.8%) |
| 6:30 AM to 6:59 AM | 195 (8.8%) | 303 (10.9%) |
| 7:00 AM to 7:29 AM | 206 (9.3%) | 496 (17.9%) |
| 7:30 AM to 7:59 AM | 176 (8.0%) | 215 (7.8%) |
| 8:00 AM to 8:29 AM | 84 (3.8%) | 250 (9.0%) |
| 8:30 AM to 8:59 AM | 52 (2.4%) | 120 (4.3%) |
| 9:00 AM to 9:59 AM | 60 (2.7%) | 112 (4.0%) |
| 10:00 AM to 10:59 AM | 132 (6.0%) | 38 (1.4%) |
| 11:00 AM to 11:59 AM | 16 (0.7%) | 23 (0.8%) |
| 12:00 PM to 3:59 PM | 358 (16.2%) | 117 (4.2%) |
| 4:00 PM to 11:59 PM | 270 (12.2%) | 251 (9.1%) |
| Total | 2,213 (100.0%) | 2,769 (100.0%) |
Housing Occupancy in Mexico
Occupancy by Ownership in Mexico
Of the total 4,393 dwellings in Mexico, owner-occupied units account for 2,751 (62.6%), while renter-occupied units make up 1,642 (37.4%).
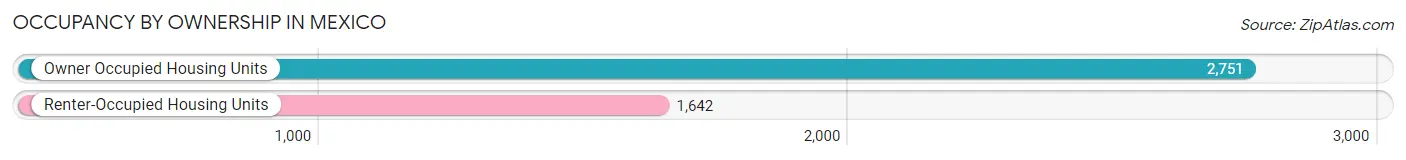
| Occupancy | # Housing Units | % Housing Units |
| Owner Occupied Housing Units | 2,751 | 62.6% |
| Renter-Occupied Housing Units | 1,642 | 37.4% |
| Total Occupied Housing Units | 4,393 | 100.0% |
Occupancy by Household Size in Mexico
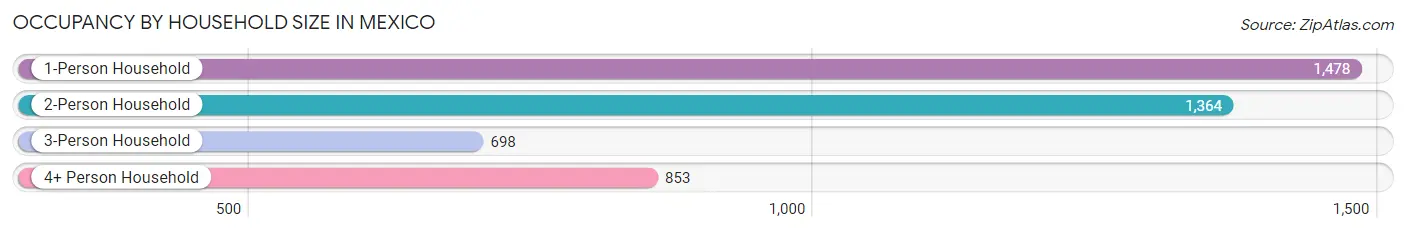
| Household Size | # Housing Units | % Housing Units |
| 1-Person Household | 1,478 | 33.6% |
| 2-Person Household | 1,364 | 31.0% |
| 3-Person Household | 698 | 15.9% |
| 4+ Person Household | 853 | 19.4% |
| Total Housing Units | 4,393 | 100.0% |
Occupancy by Ownership by Household Size in Mexico
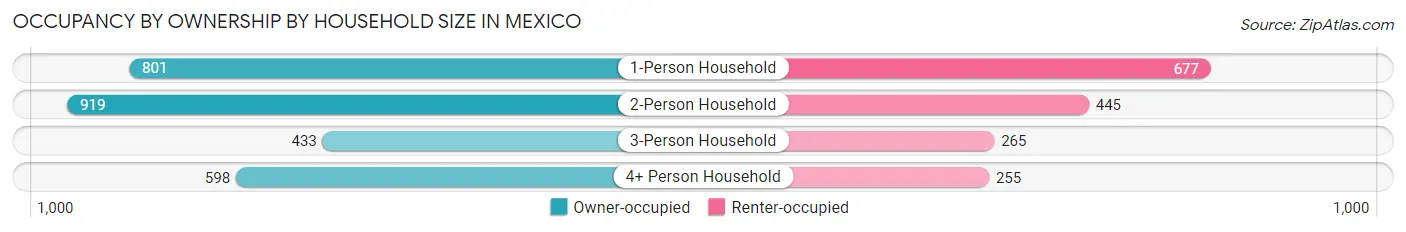
| Household Size | Owner-occupied | Renter-occupied |
| 1-Person Household | 801 (54.2%) | 677 (45.8%) |
| 2-Person Household | 919 (67.4%) | 445 (32.6%) |
| 3-Person Household | 433 (62.0%) | 265 (38.0%) |
| 4+ Person Household | 598 (70.1%) | 255 (29.9%) |
| Total Housing Units | 2,751 (62.6%) | 1,642 (37.4%) |
Occupancy by Educational Attainment in Mexico
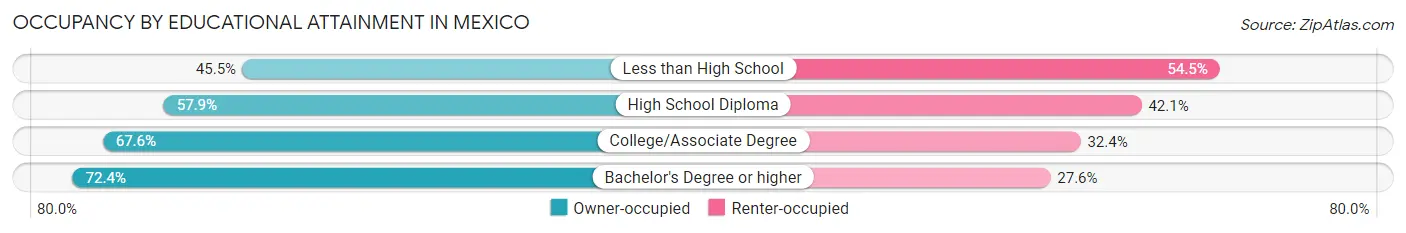
| Household Size | Owner-occupied | Renter-occupied |
| Less than High School | 219 (45.5%) | 262 (54.5%) |
| High School Diploma | 889 (57.9%) | 646 (42.1%) |
| College/Associate Degree | 1,093 (67.6%) | 524 (32.4%) |
| Bachelor's Degree or higher | 550 (72.4%) | 210 (27.6%) |
Occupancy by Age of Householder in Mexico
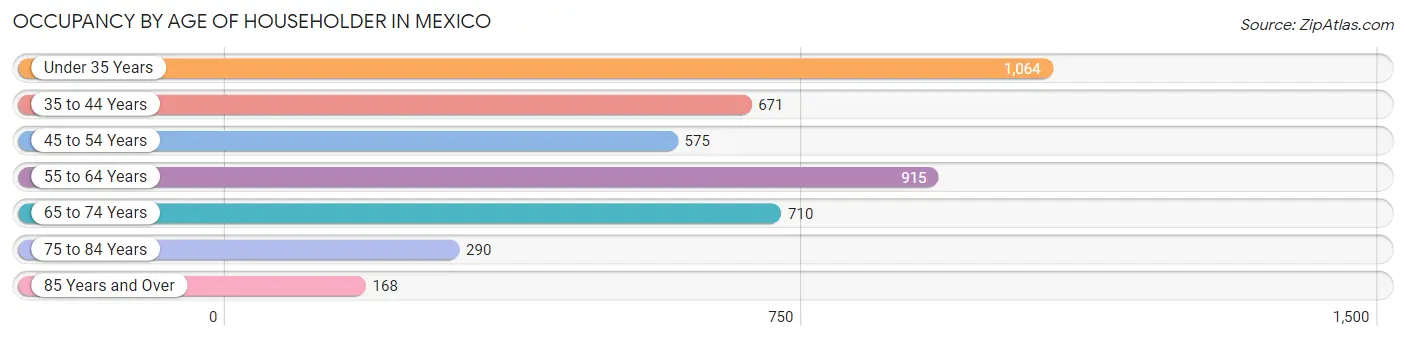
| Age Bracket | # Households | % Households |
| Under 35 Years | 1,064 | 24.2% |
| 35 to 44 Years | 671 | 15.3% |
| 45 to 54 Years | 575 | 13.1% |
| 55 to 64 Years | 915 | 20.8% |
| 65 to 74 Years | 710 | 16.2% |
| 75 to 84 Years | 290 | 6.6% |
| 85 Years and Over | 168 | 3.8% |
| Total | 4,393 | 100.0% |
Housing Finances in Mexico
Median Income by Occupancy in Mexico
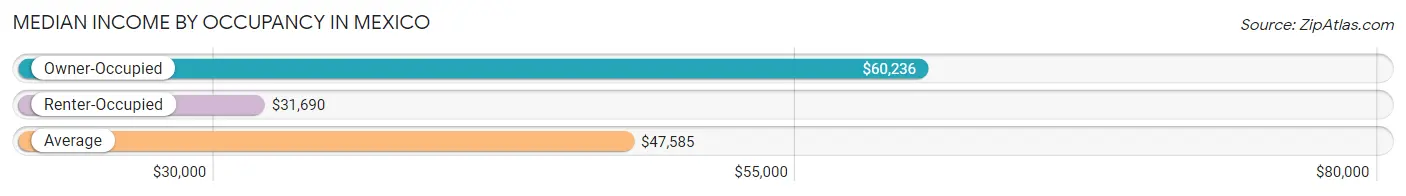
| Occupancy Type | # Households | Median Income |
| Owner-Occupied | 2,751 (62.6%) | $60,236 |
| Renter-Occupied | 1,642 (37.4%) | $31,690 |
| Average | 4,393 (100.0%) | $47,585 |
Occupancy by Householder Income Bracket in Mexico
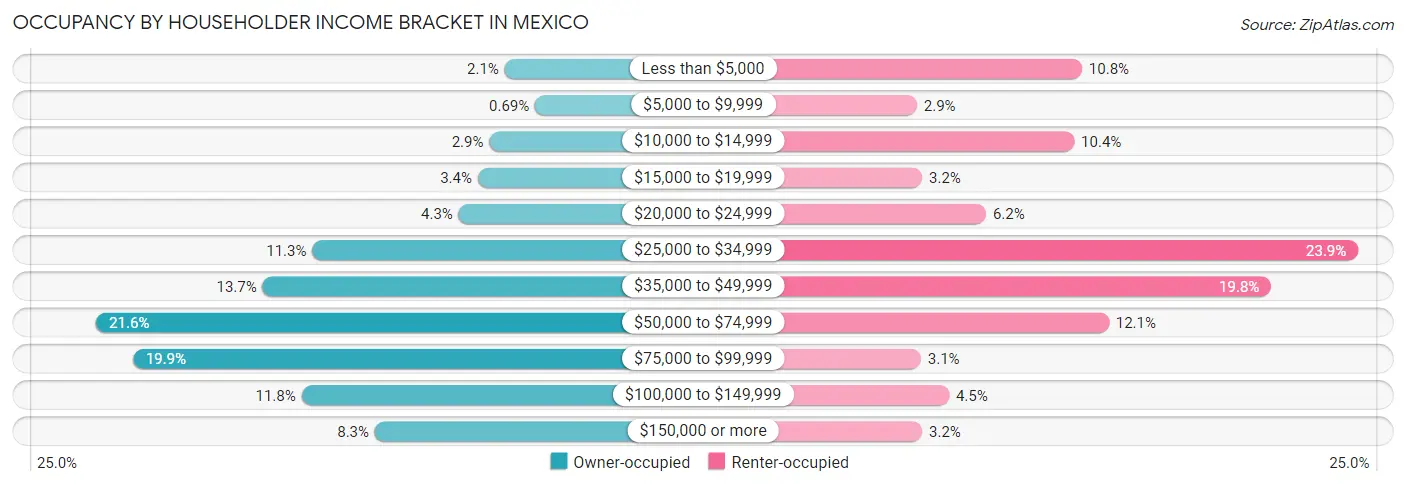
| Income Bracket | Owner-occupied | Renter-occupied |
| Less than $5,000 | 59 (2.1%) | 177 (10.8%) |
| $5,000 to $9,999 | 19 (0.7%) | 48 (2.9%) |
| $10,000 to $14,999 | 79 (2.9%) | 171 (10.4%) |
| $15,000 to $19,999 | 94 (3.4%) | 52 (3.2%) |
| $20,000 to $24,999 | 119 (4.3%) | 102 (6.2%) |
| $25,000 to $34,999 | 311 (11.3%) | 393 (23.9%) |
| $35,000 to $49,999 | 376 (13.7%) | 325 (19.8%) |
| $50,000 to $74,999 | 594 (21.6%) | 198 (12.1%) |
| $75,000 to $99,999 | 546 (19.9%) | 51 (3.1%) |
| $100,000 to $149,999 | 325 (11.8%) | 73 (4.4%) |
| $150,000 or more | 229 (8.3%) | 52 (3.2%) |
| Total | 2,751 (100.0%) | 1,642 (100.0%) |
Monthly Housing Cost Tiers in Mexico
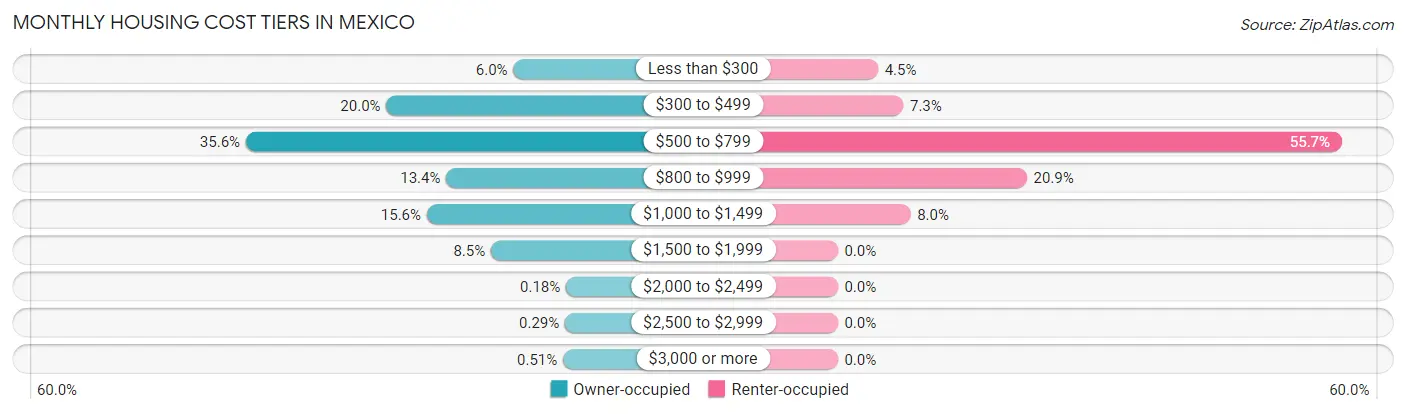
| Monthly Cost | Owner-occupied | Renter-occupied |
| Less than $300 | 165 (6.0%) | 73 (4.4%) |
| $300 to $499 | 551 (20.0%) | 119 (7.2%) |
| $500 to $799 | 978 (35.5%) | 915 (55.7%) |
| $800 to $999 | 369 (13.4%) | 343 (20.9%) |
| $1,000 to $1,499 | 428 (15.6%) | 132 (8.0%) |
| $1,500 to $1,999 | 233 (8.5%) | 0 (0.0%) |
| $2,000 to $2,499 | 5 (0.2%) | 0 (0.0%) |
| $2,500 to $2,999 | 8 (0.3%) | 0 (0.0%) |
| $3,000 or more | 14 (0.5%) | 0 (0.0%) |
| Total | 2,751 (100.0%) | 1,642 (100.0%) |
Physical Housing Characteristics in Mexico
Housing Structures in Mexico
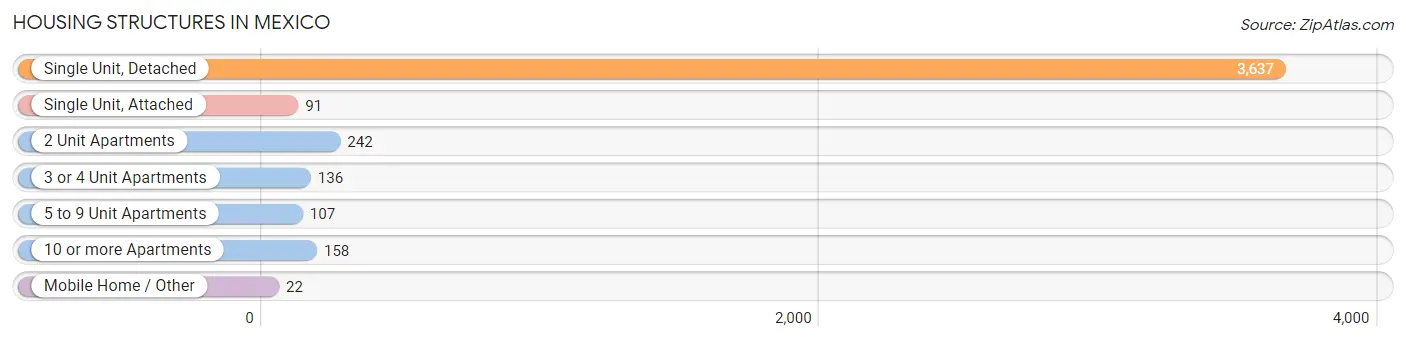
| Structure Type | # Housing Units | % Housing Units |
| Single Unit, Detached | 3,637 | 82.8% |
| Single Unit, Attached | 91 | 2.1% |
| 2 Unit Apartments | 242 | 5.5% |
| 3 or 4 Unit Apartments | 136 | 3.1% |
| 5 to 9 Unit Apartments | 107 | 2.4% |
| 10 or more Apartments | 158 | 3.6% |
| Mobile Home / Other | 22 | 0.5% |
| Total | 4,393 | 100.0% |
Housing Structures by Occupancy in Mexico
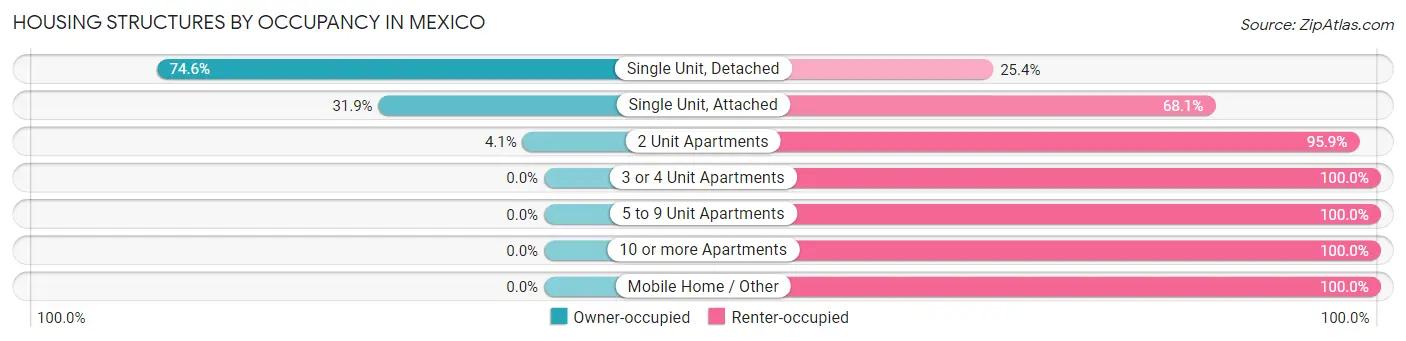
| Structure Type | Owner-occupied | Renter-occupied |
| Single Unit, Detached | 2,712 (74.6%) | 925 (25.4%) |
| Single Unit, Attached | 29 (31.9%) | 62 (68.1%) |
| 2 Unit Apartments | 10 (4.1%) | 232 (95.9%) |
| 3 or 4 Unit Apartments | 0 (0.0%) | 136 (100.0%) |
| 5 to 9 Unit Apartments | 0 (0.0%) | 107 (100.0%) |
| 10 or more Apartments | 0 (0.0%) | 158 (100.0%) |
| Mobile Home / Other | 0 (0.0%) | 22 (100.0%) |
| Total | 2,751 (62.6%) | 1,642 (37.4%) |
Housing Structures by Number of Rooms in Mexico
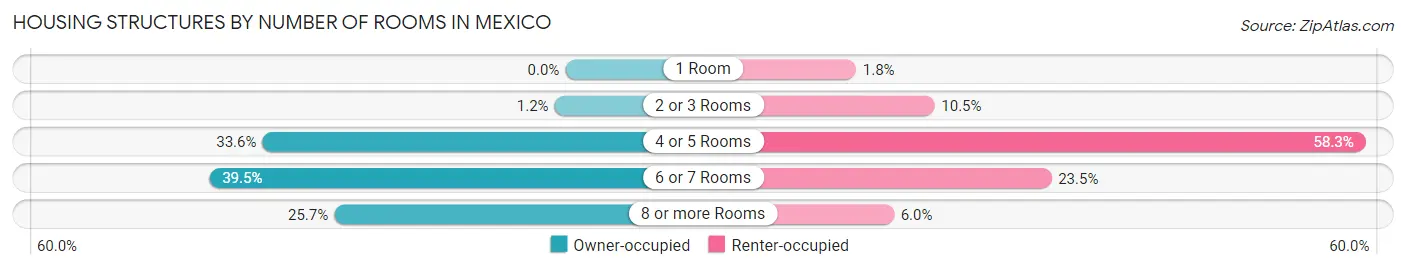
| Number of Rooms | Owner-occupied | Renter-occupied |
| 1 Room | 0 (0.0%) | 29 (1.8%) |
| 2 or 3 Rooms | 33 (1.2%) | 172 (10.5%) |
| 4 or 5 Rooms | 925 (33.6%) | 958 (58.3%) |
| 6 or 7 Rooms | 1,087 (39.5%) | 385 (23.4%) |
| 8 or more Rooms | 706 (25.7%) | 98 (6.0%) |
| Total | 2,751 (100.0%) | 1,642 (100.0%) |
Housing Structure by Heating Type in Mexico
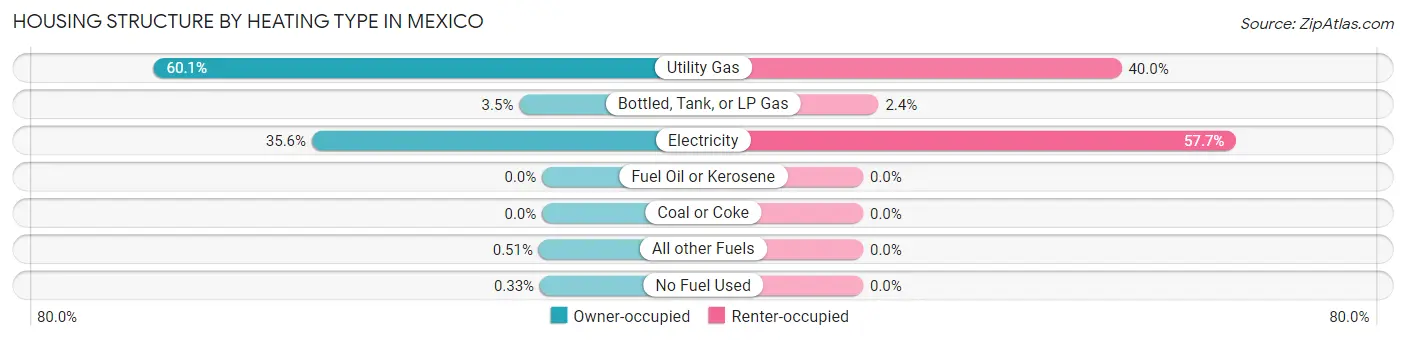
| Heating Type | Owner-occupied | Renter-occupied |
| Utility Gas | 1,652 (60.1%) | 656 (40.0%) |
| Bottled, Tank, or LP Gas | 97 (3.5%) | 39 (2.4%) |
| Electricity | 979 (35.6%) | 947 (57.7%) |
| Fuel Oil or Kerosene | 0 (0.0%) | 0 (0.0%) |
| Coal or Coke | 0 (0.0%) | 0 (0.0%) |
| All other Fuels | 14 (0.5%) | 0 (0.0%) |
| No Fuel Used | 9 (0.3%) | 0 (0.0%) |
| Total | 2,751 (100.0%) | 1,642 (100.0%) |
Household Vehicle Usage in Mexico
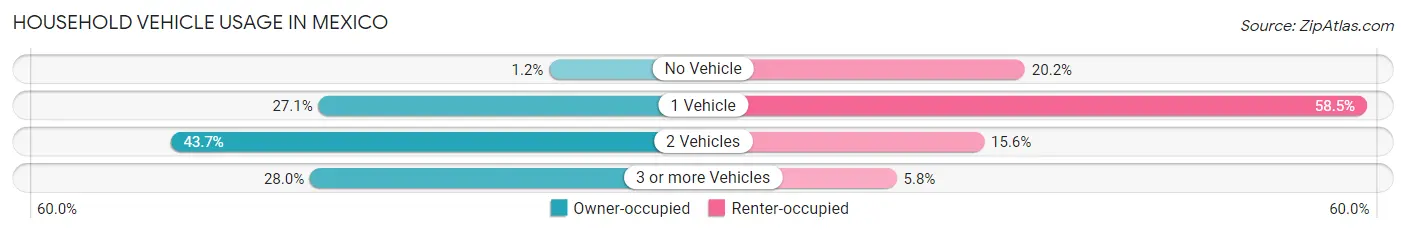
| Vehicles per Household | Owner-occupied | Renter-occupied |
| No Vehicle | 34 (1.2%) | 331 (20.2%) |
| 1 Vehicle | 745 (27.1%) | 960 (58.5%) |
| 2 Vehicles | 1,201 (43.7%) | 256 (15.6%) |
| 3 or more Vehicles | 771 (28.0%) | 95 (5.8%) |
| Total | 2,751 (100.0%) | 1,642 (100.0%) |
Real Estate & Mortgages in Mexico
Real Estate and Mortgage Overview in Mexico
| Characteristic | Without Mortgage | With Mortgage |
| Housing Units | 1,097 | 1,654 |
| Median Property Value | $117,600 | $104,200 |
| Median Household Income | $54,375 | $190 |
| Monthly Housing Costs | $426 | $14 |
| Real Estate Taxes | $1,115 | $21 |
Property Value by Mortgage Status in Mexico
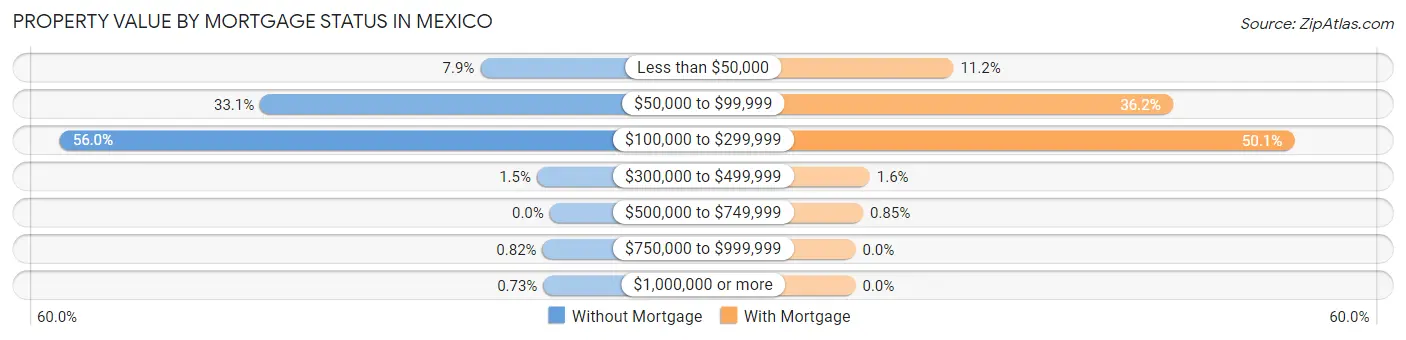
| Property Value | Without Mortgage | With Mortgage |
| Less than $50,000 | 87 (7.9%) | 185 (11.2%) |
| $50,000 to $99,999 | 363 (33.1%) | 599 (36.2%) |
| $100,000 to $299,999 | 614 (56.0%) | 829 (50.1%) |
| $300,000 to $499,999 | 16 (1.5%) | 27 (1.6%) |
| $500,000 to $749,999 | 0 (0.0%) | 14 (0.9%) |
| $750,000 to $999,999 | 9 (0.8%) | 0 (0.0%) |
| $1,000,000 or more | 8 (0.7%) | 0 (0.0%) |
| Total | 1,097 (100.0%) | 1,654 (100.0%) |
Household Income by Mortgage Status in Mexico
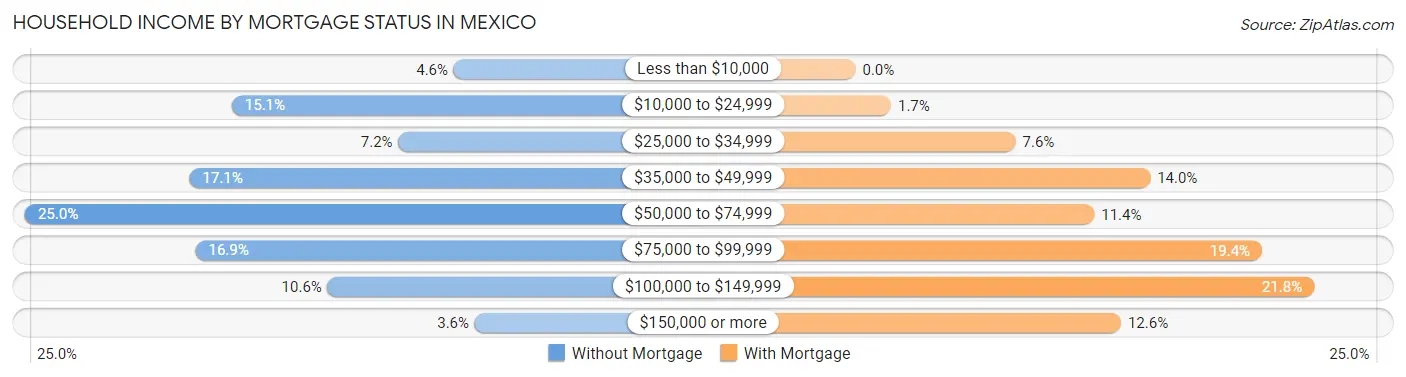
| Household Income | Without Mortgage | With Mortgage |
| Less than $10,000 | 50 (4.6%) | 0 (0.0%) |
| $10,000 to $24,999 | 166 (15.1%) | 28 (1.7%) |
| $25,000 to $34,999 | 79 (7.2%) | 126 (7.6%) |
| $35,000 to $49,999 | 188 (17.1%) | 232 (14.0%) |
| $50,000 to $74,999 | 274 (25.0%) | 188 (11.4%) |
| $75,000 to $99,999 | 185 (16.9%) | 320 (19.4%) |
| $100,000 to $149,999 | 116 (10.6%) | 361 (21.8%) |
| $150,000 or more | 39 (3.6%) | 209 (12.6%) |
| Total | 1,097 (100.0%) | 1,654 (100.0%) |
Property Value to Household Income Ratio in Mexico
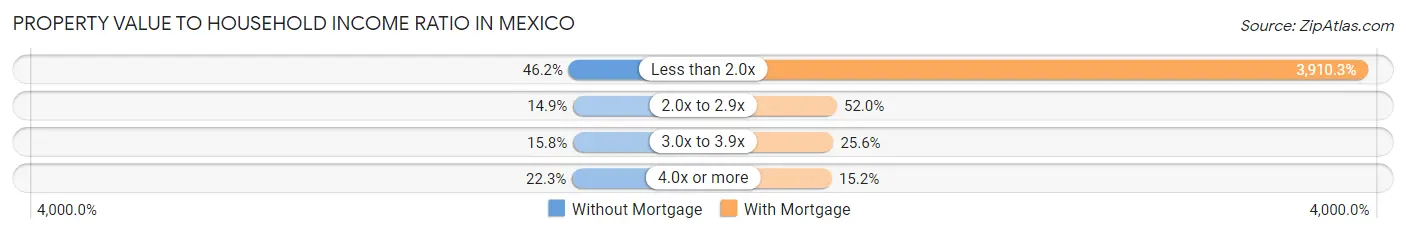
| Value-to-Income Ratio | Without Mortgage | With Mortgage |
| Less than 2.0x | 507 (46.2%) | 64,677 (3,910.3%) |
| 2.0x to 2.9x | 163 (14.9%) | 860 (52.0%) |
| 3.0x to 3.9x | 173 (15.8%) | 424 (25.6%) |
| 4.0x or more | 245 (22.3%) | 251 (15.2%) |
| Total | 1,097 (100.0%) | 1,654 (100.0%) |
Real Estate Taxes by Mortgage Status in Mexico
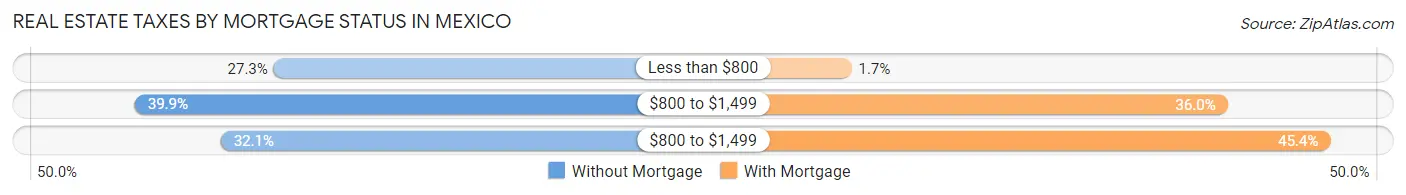
| Property Taxes | Without Mortgage | With Mortgage |
| Less than $800 | 299 (27.3%) | 28 (1.7%) |
| $800 to $1,499 | 438 (39.9%) | 596 (36.0%) |
| $800 to $1,499 | 352 (32.1%) | 751 (45.4%) |
| Total | 1,097 (100.0%) | 1,654 (100.0%) |
Health & Disability in Mexico
Health Insurance Coverage by Age in Mexico
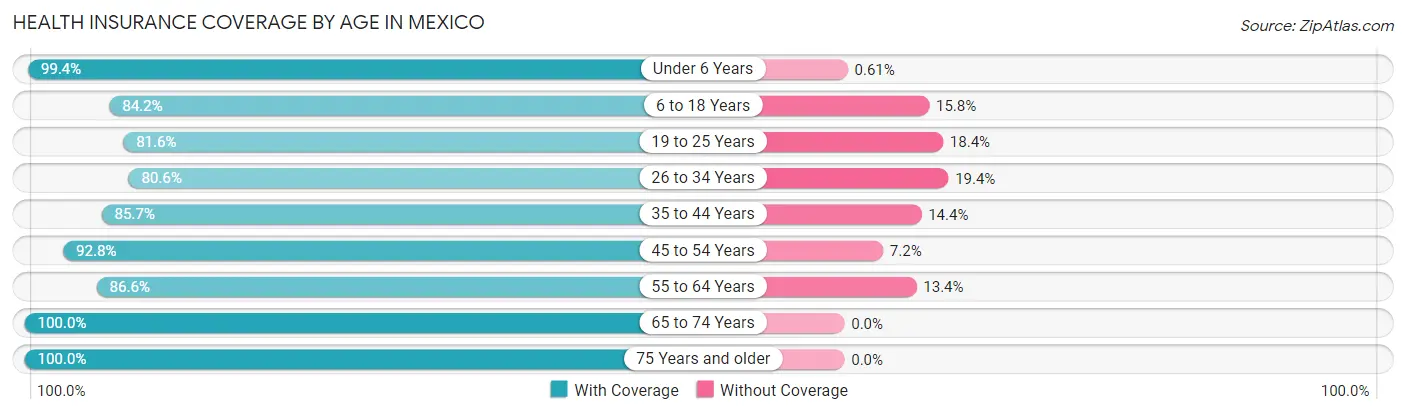
| Age Bracket | With Coverage | Without Coverage |
| Under 6 Years | 984 (99.4%) | 6 (0.6%) |
| 6 to 18 Years | 1,434 (84.2%) | 269 (15.8%) |
| 19 to 25 Years | 741 (81.6%) | 167 (18.4%) |
| 26 to 34 Years | 1,431 (80.6%) | 344 (19.4%) |
| 35 to 44 Years | 1,140 (85.7%) | 191 (14.3%) |
| 45 to 54 Years | 1,083 (92.8%) | 84 (7.2%) |
| 55 to 64 Years | 1,353 (86.6%) | 210 (13.4%) |
| 65 to 74 Years | 1,119 (100.0%) | 0 (0.0%) |
| 75 Years and older | 774 (100.0%) | 0 (0.0%) |
| Total | 10,059 (88.8%) | 1,271 (11.2%) |
Health Insurance Coverage by Citizenship Status in Mexico
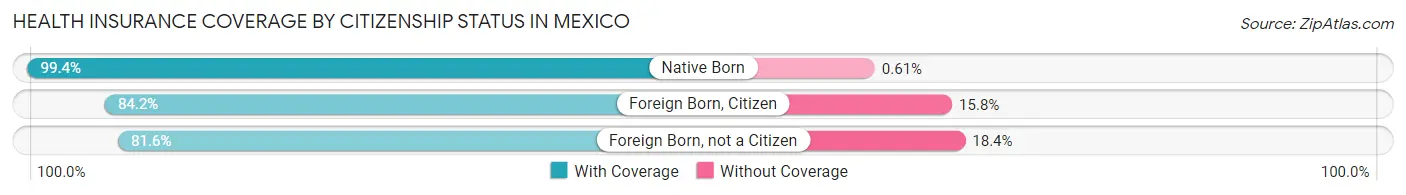
| Citizenship Status | With Coverage | Without Coverage |
| Native Born | 984 (99.4%) | 6 (0.6%) |
| Foreign Born, Citizen | 1,434 (84.2%) | 269 (15.8%) |
| Foreign Born, not a Citizen | 741 (81.6%) | 167 (18.4%) |
Health Insurance Coverage by Household Income in Mexico
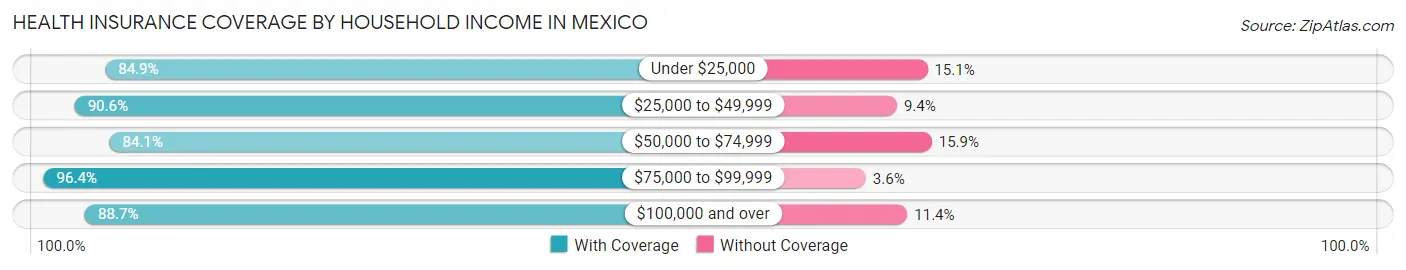
| Household Income | With Coverage | Without Coverage |
| Under $25,000 | 1,460 (84.9%) | 260 (15.1%) |
| $25,000 to $49,999 | 2,862 (90.6%) | 297 (9.4%) |
| $50,000 to $74,999 | 1,731 (84.1%) | 328 (15.9%) |
| $75,000 to $99,999 | 1,536 (96.4%) | 57 (3.6%) |
| $100,000 and over | 2,366 (88.6%) | 303 (11.4%) |
Public vs Private Health Insurance Coverage by Age in Mexico
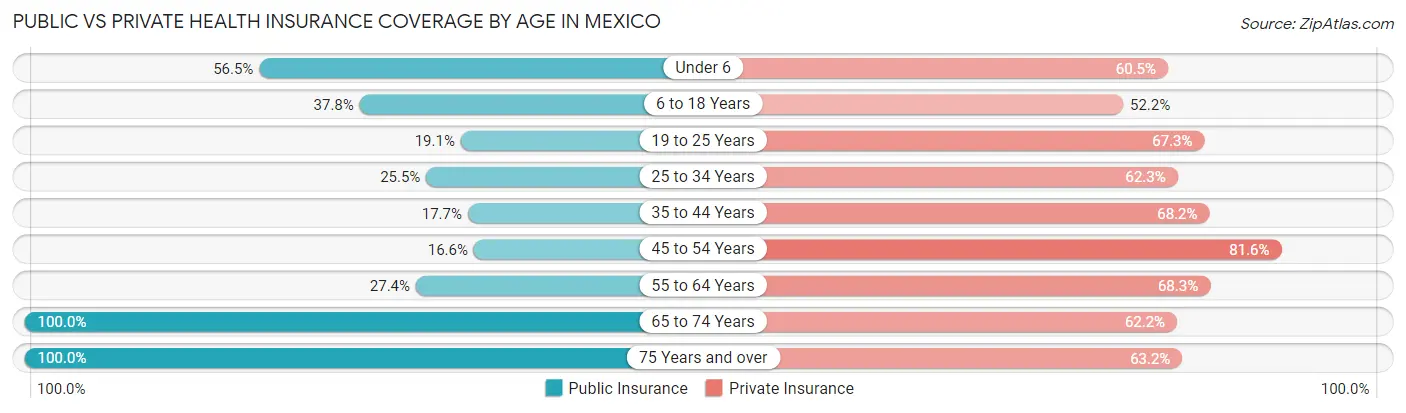
| Age Bracket | Public Insurance | Private Insurance |
| Under 6 | 559 (56.5%) | 599 (60.5%) |
| 6 to 18 Years | 644 (37.8%) | 889 (52.2%) |
| 19 to 25 Years | 173 (19.1%) | 611 (67.3%) |
| 25 to 34 Years | 452 (25.5%) | 1,106 (62.3%) |
| 35 to 44 Years | 236 (17.7%) | 908 (68.2%) |
| 45 to 54 Years | 194 (16.6%) | 952 (81.6%) |
| 55 to 64 Years | 428 (27.4%) | 1,068 (68.3%) |
| 65 to 74 Years | 1,119 (100.0%) | 696 (62.2%) |
| 75 Years and over | 774 (100.0%) | 489 (63.2%) |
| Total | 4,579 (40.4%) | 7,318 (64.6%) |
Disability Status by Sex by Age in Mexico
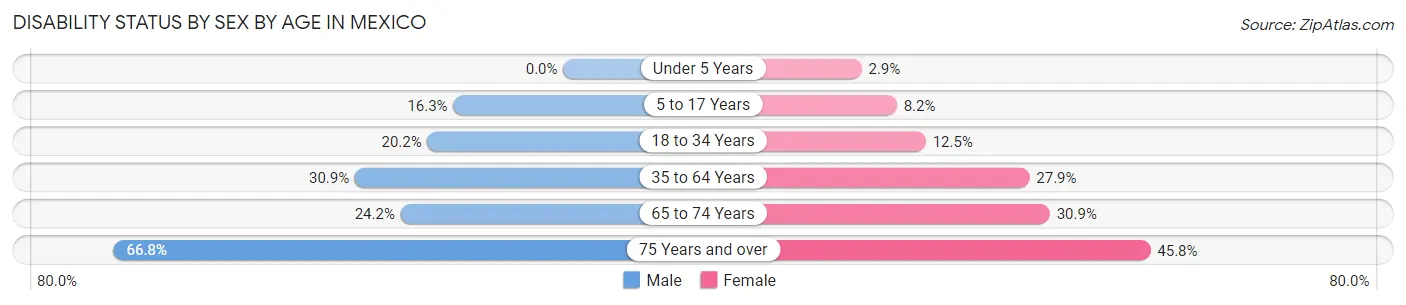
| Age Bracket | Male | Female |
| Under 5 Years | 0 (0.0%) | 10 (2.9%) |
| 5 to 17 Years | 148 (16.3%) | 63 (8.2%) |
| 18 to 34 Years | 243 (20.2%) | 206 (12.5%) |
| 35 to 64 Years | 544 (30.9%) | 641 (27.9%) |
| 65 to 74 Years | 113 (24.1%) | 201 (30.9%) |
| 75 Years and over | 205 (66.8%) | 214 (45.8%) |
Disability Class by Sex by Age in Mexico
Disability Class: Hearing Difficulty
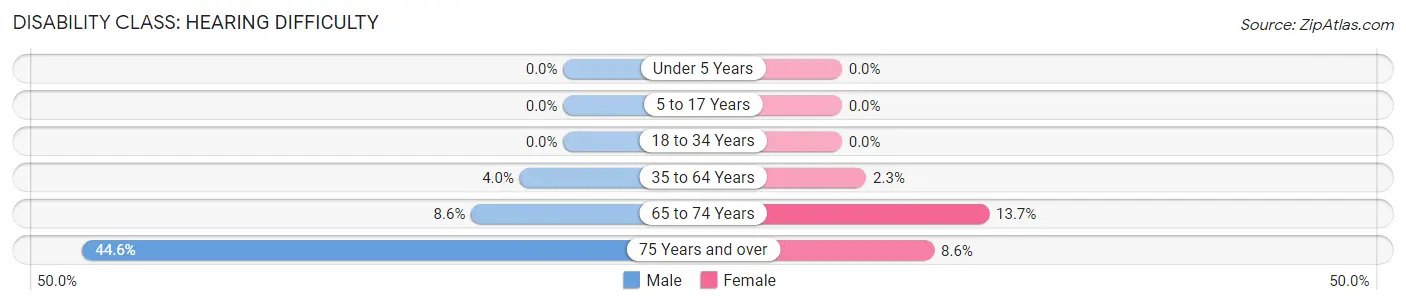
| Age Bracket | Male | Female |
| Under 5 Years | 0 (0.0%) | 0 (0.0%) |
| 5 to 17 Years | 0 (0.0%) | 0 (0.0%) |
| 18 to 34 Years | 0 (0.0%) | 0 (0.0%) |
| 35 to 64 Years | 71 (4.0%) | 52 (2.3%) |
| 65 to 74 Years | 40 (8.6%) | 89 (13.7%) |
| 75 Years and over | 137 (44.6%) | 40 (8.6%) |
Disability Class: Vision Difficulty
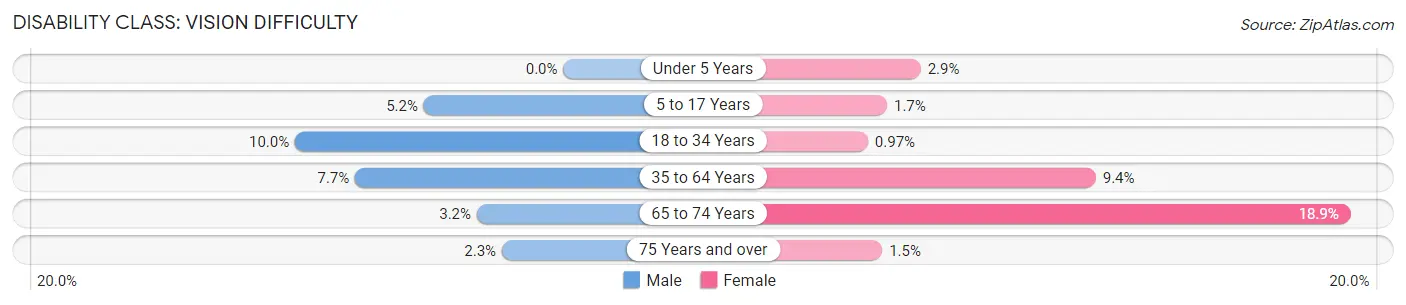
| Age Bracket | Male | Female |
| Under 5 Years | 0 (0.0%) | 10 (2.9%) |
| 5 to 17 Years | 47 (5.2%) | 13 (1.7%) |
| 18 to 34 Years | 120 (10.0%) | 16 (1.0%) |
| 35 to 64 Years | 136 (7.7%) | 217 (9.4%) |
| 65 to 74 Years | 15 (3.2%) | 123 (18.9%) |
| 75 Years and over | 7 (2.3%) | 7 (1.5%) |
Disability Class: Cognitive Difficulty
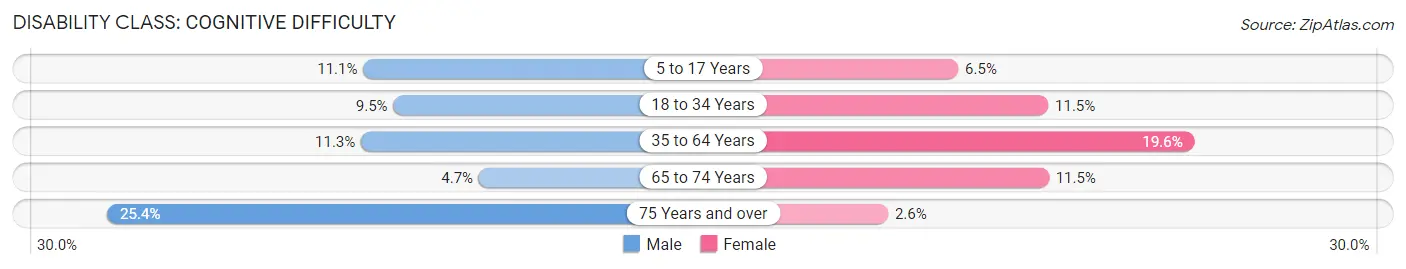
| Age Bracket | Male | Female |
| 5 to 17 Years | 101 (11.1%) | 50 (6.5%) |
| 18 to 34 Years | 114 (9.5%) | 190 (11.5%) |
| 35 to 64 Years | 198 (11.3%) | 452 (19.6%) |
| 65 to 74 Years | 22 (4.7%) | 75 (11.5%) |
| 75 Years and over | 78 (25.4%) | 12 (2.6%) |
Disability Class: Ambulatory Difficulty
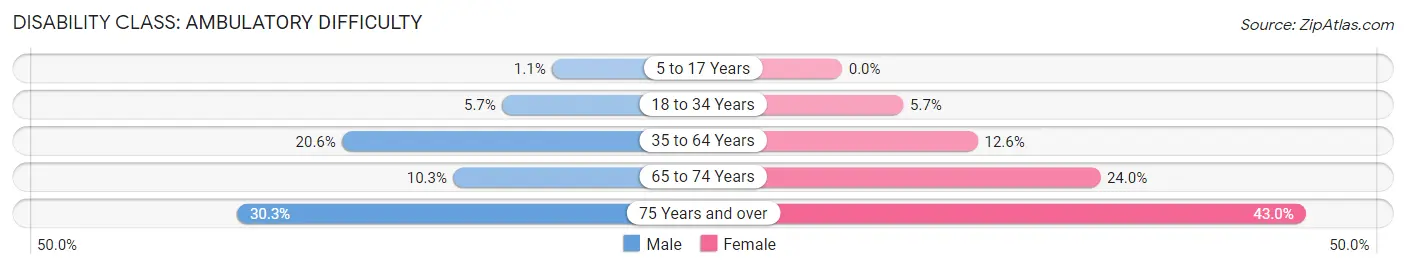
| Age Bracket | Male | Female |
| 5 to 17 Years | 10 (1.1%) | 0 (0.0%) |
| 18 to 34 Years | 69 (5.7%) | 94 (5.7%) |
| 35 to 64 Years | 362 (20.6%) | 290 (12.6%) |
| 65 to 74 Years | 48 (10.3%) | 156 (24.0%) |
| 75 Years and over | 93 (30.3%) | 201 (43.0%) |
Disability Class: Self-Care Difficulty
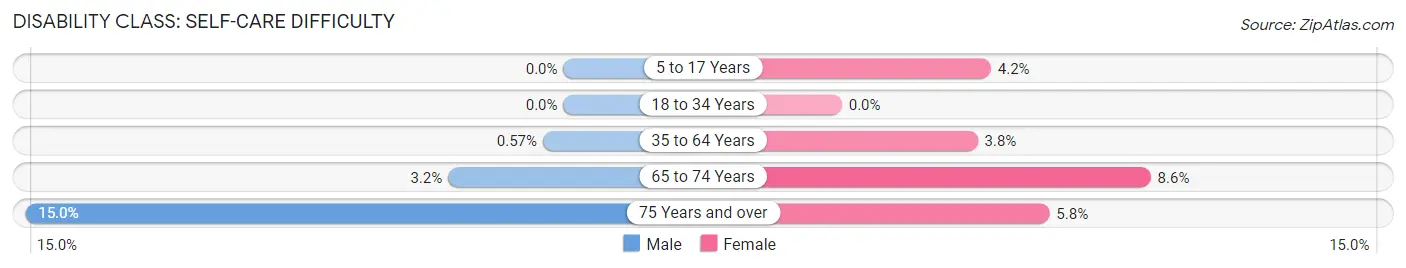
| Age Bracket | Male | Female |
| 5 to 17 Years | 0 (0.0%) | 32 (4.2%) |
| 18 to 34 Years | 0 (0.0%) | 0 (0.0%) |
| 35 to 64 Years | 10 (0.6%) | 87 (3.8%) |
| 65 to 74 Years | 15 (3.2%) | 56 (8.6%) |
| 75 Years and over | 46 (15.0%) | 27 (5.8%) |
Technology Access in Mexico
Computing Device Access in Mexico
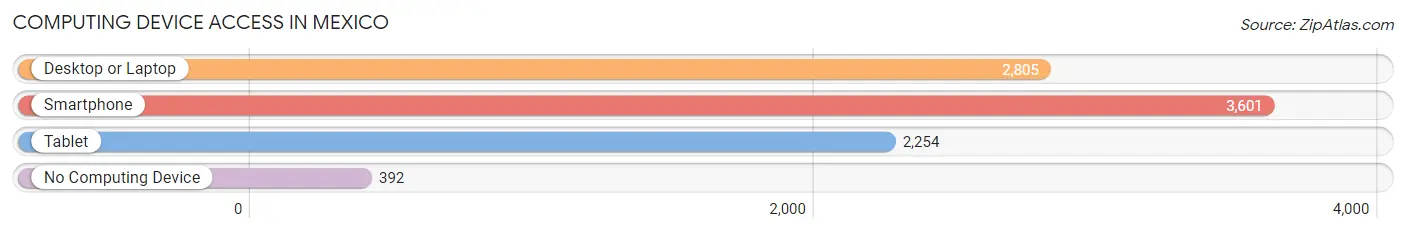
| Device Type | # Households | % Households |
| Desktop or Laptop | 2,805 | 63.8% |
| Smartphone | 3,601 | 82.0% |
| Tablet | 2,254 | 51.3% |
| No Computing Device | 392 | 8.9% |
| Total | 4,393 | 100.0% |
Internet Access in Mexico
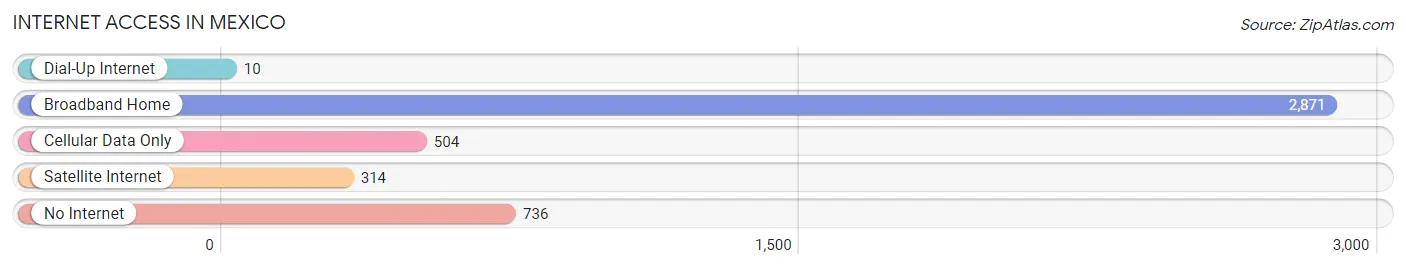
| Internet Type | # Households | % Households |
| Dial-Up Internet | 10 | 0.2% |
| Broadband Home | 2,871 | 65.3% |
| Cellular Data Only | 504 | 11.5% |
| Satellite Internet | 314 | 7.1% |
| No Internet | 736 | 16.8% |
| Total | 4,393 | 100.0% |
Mexico Summary
Mexico, Missouri is a city located in Audrain County in the state of Missouri. It is the county seat of Audrain County and is located approximately 50 miles northeast of the state capital, Jefferson City. The city has a population of 11,543 as of the 2010 census, making it the largest city in Audrain County.
Geography
Mexico is located at the intersection of U.S. Route 54 and Missouri Route 15. It is situated in the northern part of the state, approximately 50 miles northeast of the state capital, Jefferson City. The city is located in the Missouri River Valley, and is surrounded by rolling hills and farmland. The city is located in the Central Standard Time Zone and observes Daylight Saving Time.
The city has a total area of 8.2 square miles, of which 8.1 square miles is land and 0.1 square miles is water. The city is located at an elevation of 845 feet above sea level.
History
Mexico was founded in 1836 by William Becknell, who was the first settler in the area. The city was named after the country of Mexico, which was in the news at the time due to the Texas Revolution. The city was incorporated in 1855 and was designated as the county seat of Audrain County in 1867.
The city experienced rapid growth in the late 19th and early 20th centuries, due to its location on the Missouri Pacific Railroad. The city was also home to several manufacturing plants, including a shoe factory, a furniture factory, and a canning factory.
Economy
Mexico’s economy is largely based on agriculture and manufacturing. The city is home to several large employers, including Mexico Manufacturing Company, which produces automotive parts, and Mexico Canning Company, which produces canned fruits and vegetables. The city is also home to several smaller businesses, including retail stores, restaurants, and service providers.
Demographics
As of the 2010 census, Mexico had a population of 11,543. The racial makeup of the city was 87.3% White, 8.2% African American, 0.5% Native American, 0.7% Asian, 0.1% Pacific Islander, 1.2% from other races, and 2.0% from two or more races. Hispanic or Latino of any race were 3.2% of the population.
The median income for a household in the city was $35,945, and the median income for a family was $45,945. The per capita income for the city was $19,945. About 15.2% of families and 18.2% of the population were below the poverty line, including 25.2% of those under age 18 and 11.2% of those age 65 or over.
Education
Mexico is served by the Mexico Public School District, which includes four elementary schools, one middle school, and one high school. The city is also home to several private schools, including St. Brendan Catholic School and Mexico Christian Academy. The city is also home to Central Methodist University-Mexico, which offers undergraduate and graduate degree programs.
Conclusion
Mexico, Missouri is a city located in Audrain County in the state of Missouri. It is the county seat of Audrain County and is located approximately 50 miles northeast of the state capital, Jefferson City. The city has a population of 11,543 as of the 2010 census, making it the largest city in Audrain County. The city’s economy is largely based on agriculture and manufacturing, and it is home to several large employers. The city is served by the Mexico Public School District, and is also home to several private schools and Central Methodist University-Mexico.
Common Questions
What is Per Capita Income in Mexico?
Per Capita income in Mexico is $26,785.
What is the Median Family Income in Mexico?
Median Family Income in Mexico is $56,034.
What is the Median Household income in Mexico?
Median Household Income in Mexico is $47,585.
What is Income or Wage Gap in Mexico?
Income or Wage Gap in Mexico is 23.3%.
Women in Mexico earn 76.7 cents for every dollar earned by a man.
What is Family Income Deficit in Mexico?
Family Income Deficit in Mexico is $11,531.
Families that are below poverty line in Mexico earn $11,531 less on average than the poverty threshold level.
What is Inequality or Gini Index in Mexico?
Inequality or Gini Index in Mexico is 0.45.
What is the Total Population of Mexico?
Total Population of Mexico is 11,502.
What is the Total Male Population of Mexico?
Total Male Population of Mexico is 5,204.
What is the Total Female Population of Mexico?
Total Female Population of Mexico is 6,298.
What is the Ratio of Males per 100 Females in Mexico?
There are 82.63 Males per 100 Females in Mexico.
What is the Ratio of Females per 100 Males in Mexico?
There are 121.02 Females per 100 Males in Mexico.
What is the Median Population Age in Mexico?
Median Population Age in Mexico is 36.6 Years.
What is the Average Family Size in Mexico
Average Family Size in Mexico is 3.3 People.
What is the Average Household Size in Mexico
Average Household Size in Mexico is 2.5 People.
How Large is the Labor Force in Mexico?
There are 5,693 People in the Labor Forcein in Mexico.
What is the Percentage of People in the Labor Force in Mexico?
61.9% of People are in the Labor Force in Mexico.
What is the Unemployment Rate in Mexico?
Unemployment Rate in Mexico is 5.7%.