Maryville, MO Map & Demographics
Maryville Map
Maryville Overview
$23,574
PER CAPITA INCOME
$68,723
AVG FAMILY INCOME
$49,144
AVG HOUSEHOLD INCOME
40.0%
WAGE / INCOME GAP [ % ]
60.0¢/ $1
WAGE / INCOME GAP [ $ ]
0.43
INEQUALITY / GINI INDEX
10,691
TOTAL POPULATION
4,868
MALE POPULATION
5,823
FEMALE POPULATION
83.60
MALES / 100 FEMALES
119.62
FEMALES / 100 MALES
25.0
MEDIAN AGE
2.6
AVG FAMILY SIZE
2.1
AVG HOUSEHOLD SIZE
5,217
LABOR FORCE [ PEOPLE ]
54.7%
PERCENT IN LABOR FORCE
2.4%
UNEMPLOYMENT RATE
Maryville Zip Codes
Maryville Area Codes
Income in Maryville
Income Overview in Maryville
Per Capita Income in Maryville is $23,574, while median incomes of families and households are $68,723 and $49,144 respectively.
| Characteristic | Number | Measure |
| Per Capita Income | 10,691 | $23,574 |
| Median Family Income | 1,957 | $68,723 |
| Mean Family Income | 1,957 | $80,186 |
| Median Household Income | 4,003 | $49,144 |
| Mean Household Income | 4,003 | $59,469 |
| Income Deficit | 1,957 | $0 |
| Wage / Income Gap (%) | 10,691 | 40.05% |
| Wage / Income Gap ($) | 10,691 | 59.95¢ per $1 |
| Gini / Inequality Index | 10,691 | 0.43 |
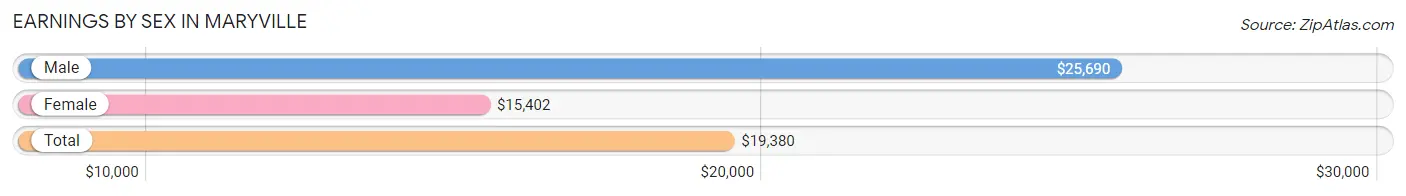
Earnings by Sex in Maryville
Average Earnings in Maryville are $19,380, $25,690 for men and $15,402 for women, a difference of 40.1%.
| Sex | Number | Average Earnings |
| Male | 3,156 (49.9%) | $25,690 |
| Female | 3,166 (50.1%) | $15,402 |
| Total | 6,322 (100.0%) | $19,380 |
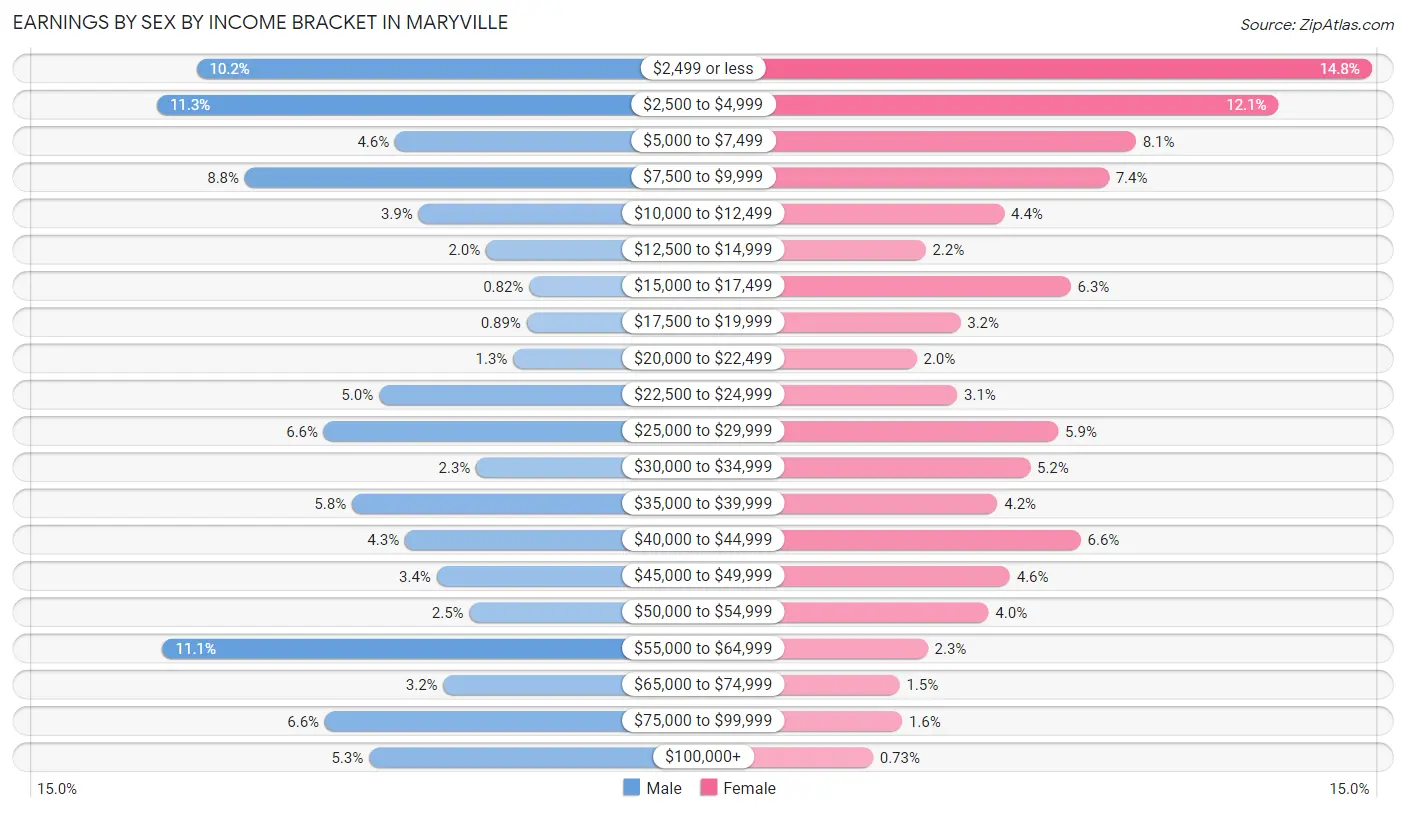
Earnings by Sex by Income Bracket in Maryville
The most common earnings brackets in Maryville are $2,500 to $4,999 for men (356 | 11.3%) and $2,499 or less for women (467 | 14.7%).
| Income | Male | Female |
| $2,499 or less | 321 (10.2%) | 467 (14.7%) |
| $2,500 to $4,999 | 356 (11.3%) | 384 (12.1%) |
| $5,000 to $7,499 | 145 (4.6%) | 257 (8.1%) |
| $7,500 to $9,999 | 278 (8.8%) | 233 (7.4%) |
| $10,000 to $12,499 | 124 (3.9%) | 140 (4.4%) |
| $12,500 to $14,999 | 64 (2.0%) | 70 (2.2%) |
| $15,000 to $17,499 | 26 (0.8%) | 199 (6.3%) |
| $17,500 to $19,999 | 28 (0.9%) | 101 (3.2%) |
| $20,000 to $22,499 | 40 (1.3%) | 62 (2.0%) |
| $22,500 to $24,999 | 159 (5.0%) | 98 (3.1%) |
| $25,000 to $29,999 | 208 (6.6%) | 188 (5.9%) |
| $30,000 to $34,999 | 73 (2.3%) | 163 (5.1%) |
| $35,000 to $39,999 | 183 (5.8%) | 134 (4.2%) |
| $40,000 to $44,999 | 136 (4.3%) | 208 (6.6%) |
| $45,000 to $49,999 | 108 (3.4%) | 145 (4.6%) |
| $50,000 to $54,999 | 79 (2.5%) | 126 (4.0%) |
| $55,000 to $64,999 | 351 (11.1%) | 72 (2.3%) |
| $65,000 to $74,999 | 102 (3.2%) | 47 (1.5%) |
| $75,000 to $99,999 | 207 (6.6%) | 49 (1.5%) |
| $100,000+ | 168 (5.3%) | 23 (0.7%) |
| Total | 3,156 (100.0%) | 3,166 (100.0%) |
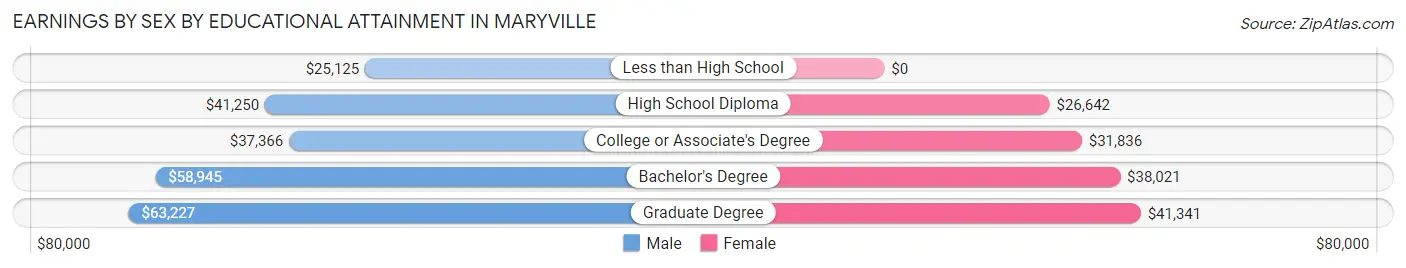
Earnings by Sex by Educational Attainment in Maryville
Average earnings in Maryville are $49,637 for men and $33,947 for women, a difference of 31.6%. Men with an educational attainment of graduate degree enjoy the highest average annual earnings of $63,227, while those with less than high school education earn the least with $25,125. Women with an educational attainment of graduate degree earn the most with the average annual earnings of $41,341, while those with high school diploma education have the smallest earnings of $26,642.
| Educational Attainment | Male Income | Female Income |
| Less than High School | $25,125 | $0 |
| High School Diploma | $41,250 | $26,642 |
| College or Associate's Degree | $37,366 | $31,836 |
| Bachelor's Degree | $58,945 | $38,021 |
| Graduate Degree | $63,227 | $41,341 |
| Total | $49,637 | $33,947 |
Family Income in Maryville
Family Income Brackets in Maryville
According to the Maryville family income data, there are 493 families falling into the $50,000 to $74,999 income range, which is the most common income bracket and makes up 25.2% of all families. Conversely, the $200,000+ income bracket is the least frequent group with only 76 families (3.9%) belonging to this category.
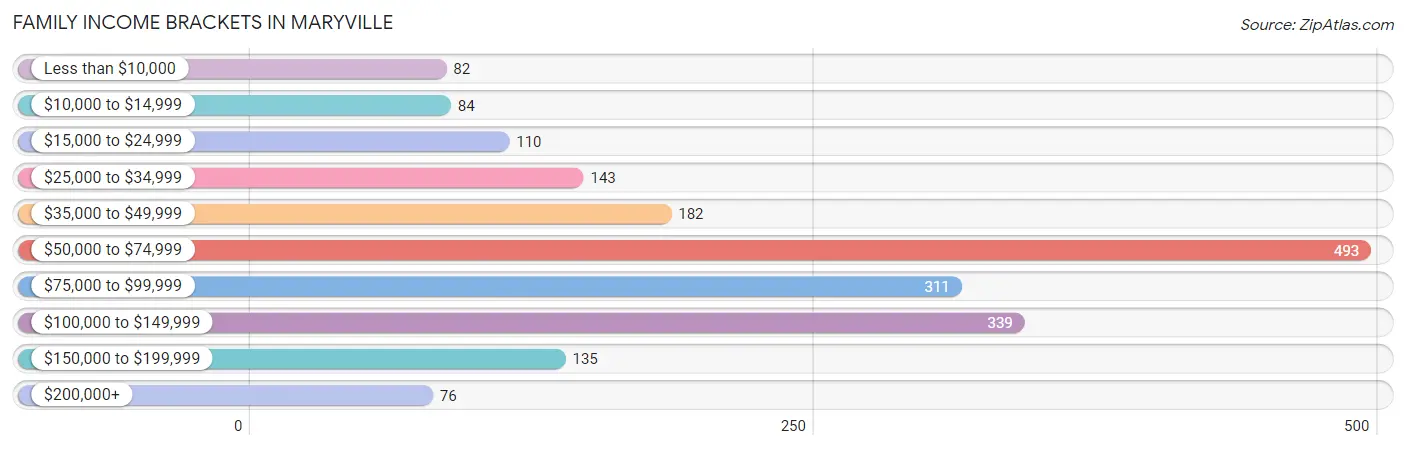
| Income Bracket | # Families | % Families |
| Less than $10,000 | 82 | 4.2% |
| $10,000 to $14,999 | 84 | 4.3% |
| $15,000 to $24,999 | 110 | 5.6% |
| $25,000 to $34,999 | 143 | 7.3% |
| $35,000 to $49,999 | 182 | 9.3% |
| $50,000 to $74,999 | 493 | 25.2% |
| $75,000 to $99,999 | 311 | 15.9% |
| $100,000 to $149,999 | 339 | 17.3% |
| $150,000 to $199,999 | 135 | 6.9% |
| $200,000+ | 76 | 3.9% |
Family Income by Famaliy Size in Maryville
2-person families (1,189 | 60.8%) account for the highest median family income in Maryville with $72,734 per family, while 2-person families (1,189 | 60.8%) have the highest median income of $36,367 per family member.
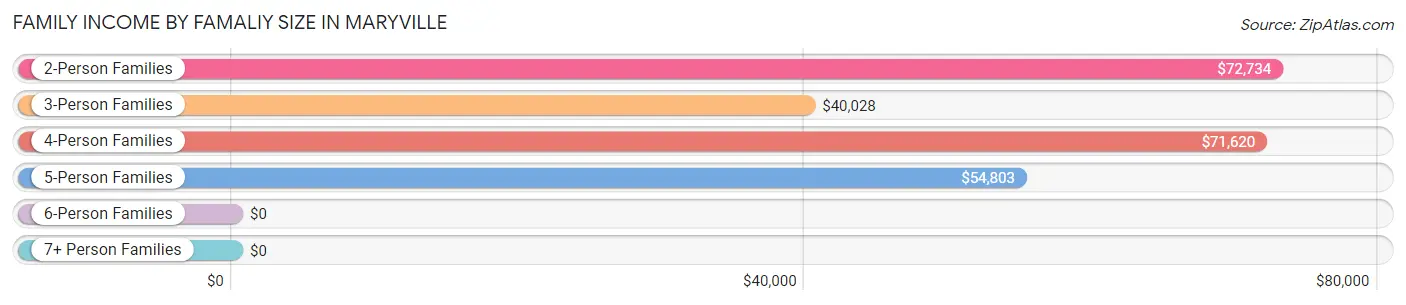
| Income Bracket | # Families | Median Income |
| 2-Person Families | 1,189 (60.8%) | $72,734 |
| 3-Person Families | 315 (16.1%) | $40,028 |
| 4-Person Families | 327 (16.7%) | $71,620 |
| 5-Person Families | 105 (5.4%) | $54,803 |
| 6-Person Families | 21 (1.1%) | $0 |
| 7+ Person Families | 0 (0.0%) | $0 |
| Total | 1,957 (100.0%) | $68,723 |
Family Income by Number of Earners in Maryville
The median family income in Maryville is $68,723, with families comprising 3+ earners (82) having the highest median family income of $92,083, while families with 1 earner (737) have the lowest median family income of $54,156, accounting for 4.2% and 37.7% of families, respectively.
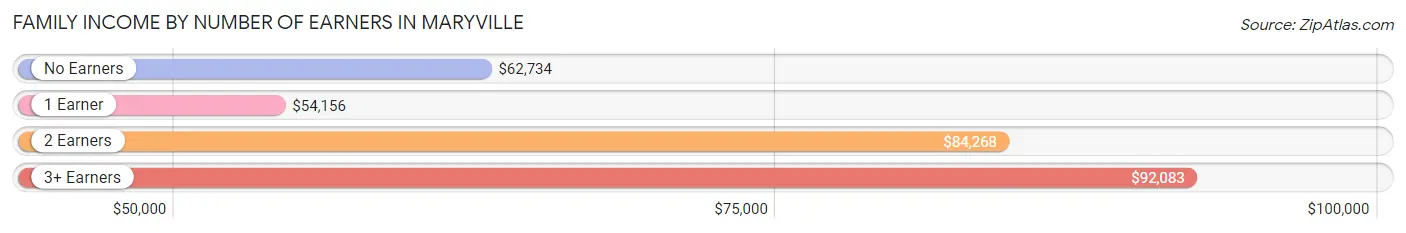
| Number of Earners | # Families | Median Income |
| No Earners | 290 (14.8%) | $62,734 |
| 1 Earner | 737 (37.7%) | $54,156 |
| 2 Earners | 848 (43.3%) | $84,268 |
| 3+ Earners | 82 (4.2%) | $92,083 |
| Total | 1,957 (100.0%) | $68,723 |
Household Income in Maryville
Household Income Brackets in Maryville
With 829 households falling in the category, the $50,000 to $74,999 income range is the most frequent in Maryville, accounting for 20.7% of all households. In contrast, only 76 households (1.9%) fall into the $200,000+ income bracket, making it the least populous group.
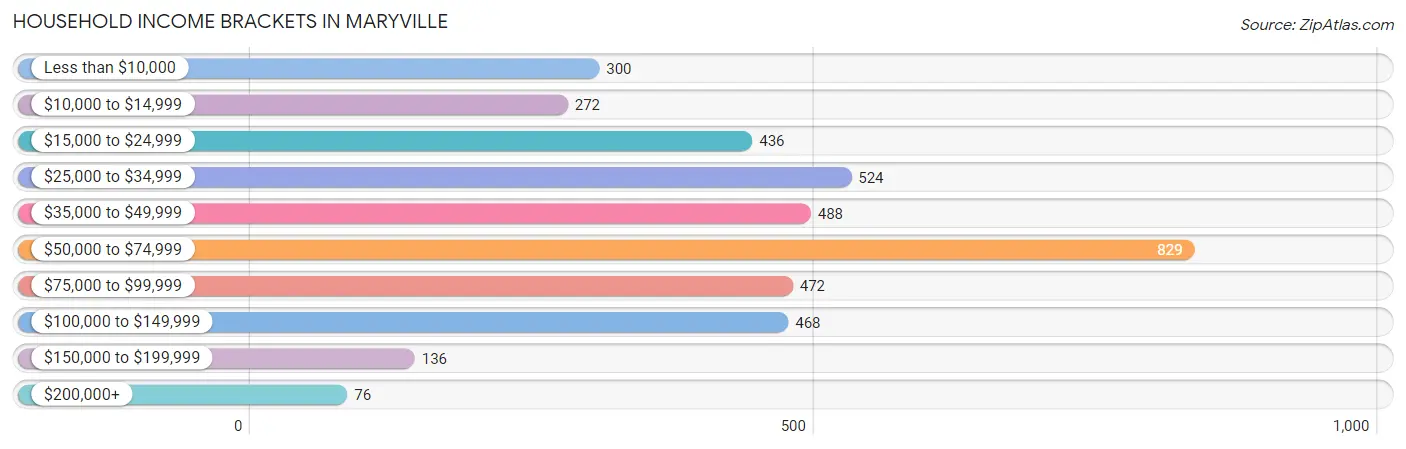
| Income Bracket | # Households | % Households |
| Less than $10,000 | 300 | 7.5% |
| $10,000 to $14,999 | 272 | 6.8% |
| $15,000 to $24,999 | 436 | 10.9% |
| $25,000 to $34,999 | 524 | 13.1% |
| $35,000 to $49,999 | 488 | 12.2% |
| $50,000 to $74,999 | 829 | 20.7% |
| $75,000 to $99,999 | 472 | 11.8% |
| $100,000 to $149,999 | 468 | 11.7% |
| $150,000 to $199,999 | 136 | 3.4% |
| $200,000+ | 76 | 1.9% |
Household Income by Householder Age in Maryville
The median household income in Maryville is $49,144, with the highest median household income of $66,538 found in the 25 to 44 years age bracket for the primary householder. A total of 1,124 households (28.1%) fall into this category. Meanwhile, the 15 to 24 years age bracket for the primary householder has the lowest median household income of $23,606, with 813 households (20.3%) in this group.
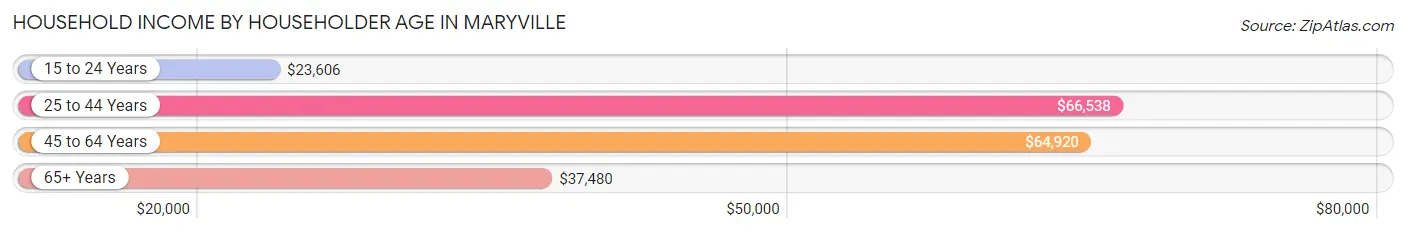
| Income Bracket | # Households | Median Income |
| 15 to 24 Years | 813 (20.3%) | $23,606 |
| 25 to 44 Years | 1,124 (28.1%) | $66,538 |
| 45 to 64 Years | 1,105 (27.6%) | $64,920 |
| 65+ Years | 961 (24.0%) | $37,480 |
| Total | 4,003 (100.0%) | $49,144 |
Poverty in Maryville
Income Below Poverty by Sex and Age in Maryville
With 27.1% poverty level for males and 25.0% for females among the residents of Maryville, 16 and 17 year old males and 18 to 24 year old females are the most vulnerable to poverty, with 46 males (67.6%) and 740 females (77.8%) in their respective age groups living below the poverty level.
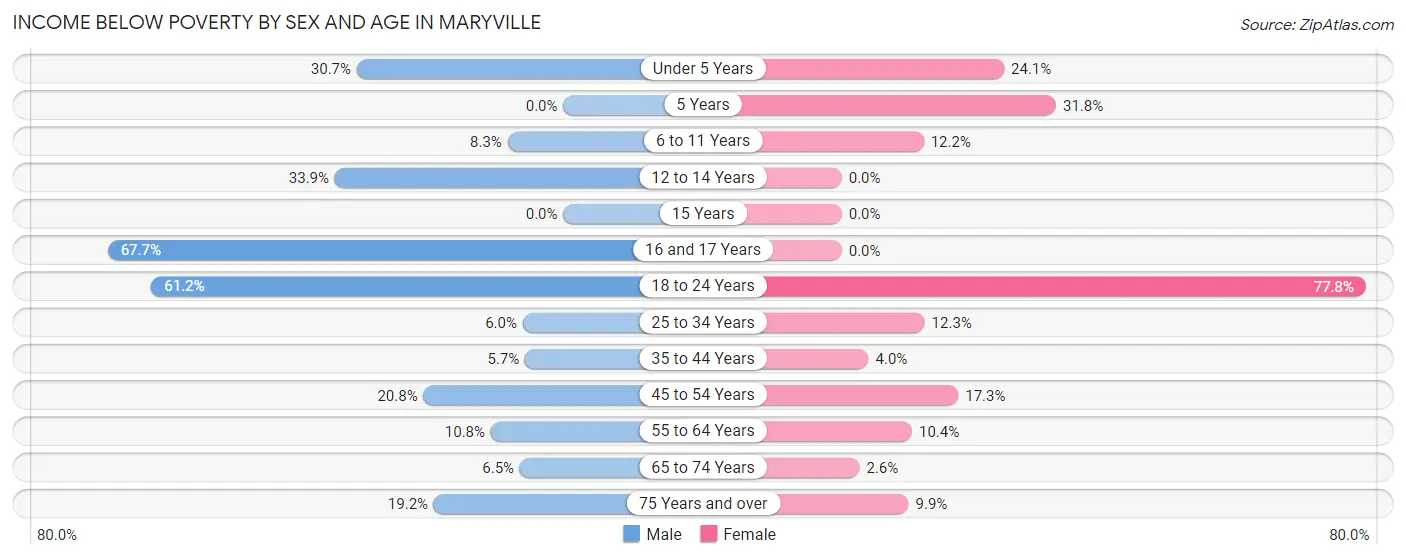
| Age Bracket | Male | Female |
| Under 5 Years | 65 (30.7%) | 60 (24.1%) |
| 5 Years | 0 (0.0%) | 7 (31.8%) |
| 6 to 11 Years | 10 (8.3%) | 31 (12.2%) |
| 12 to 14 Years | 38 (33.9%) | 0 (0.0%) |
| 15 Years | 0 (0.0%) | 0 (0.0%) |
| 16 and 17 Years | 46 (67.6%) | 0 (0.0%) |
| 18 to 24 Years | 671 (61.2%) | 740 (77.8%) |
| 25 to 34 Years | 28 (6.0%) | 68 (12.3%) |
| 35 to 44 Years | 26 (5.7%) | 17 (4.0%) |
| 45 to 54 Years | 86 (20.8%) | 87 (17.3%) |
| 55 to 64 Years | 44 (10.8%) | 51 (10.4%) |
| 65 to 74 Years | 24 (6.5%) | 11 (2.6%) |
| 75 Years and over | 54 (19.2%) | 36 (9.9%) |
| Total | 1,092 (27.1%) | 1,108 (25.0%) |
Income Above Poverty by Sex and Age in Maryville
According to the poverty statistics in Maryville, males aged 5 years and females aged 12 to 14 years are the age groups that are most secure financially, with 100.0% of males and 100.0% of females in these age groups living above the poverty line.
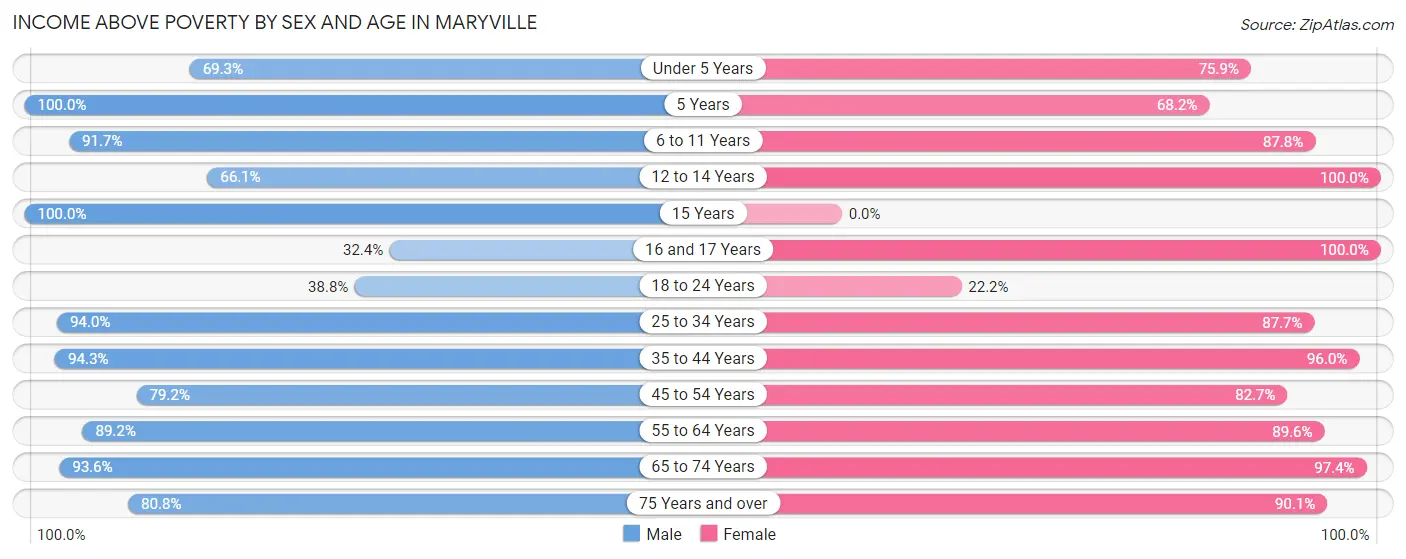
| Age Bracket | Male | Female |
| Under 5 Years | 147 (69.3%) | 189 (75.9%) |
| 5 Years | 10 (100.0%) | 15 (68.2%) |
| 6 to 11 Years | 111 (91.7%) | 224 (87.8%) |
| 12 to 14 Years | 74 (66.1%) | 125 (100.0%) |
| 15 Years | 11 (100.0%) | 0 (0.0%) |
| 16 and 17 Years | 22 (32.4%) | 82 (100.0%) |
| 18 to 24 Years | 426 (38.8%) | 211 (22.2%) |
| 25 to 34 Years | 437 (94.0%) | 485 (87.7%) |
| 35 to 44 Years | 432 (94.3%) | 410 (96.0%) |
| 45 to 54 Years | 328 (79.2%) | 416 (82.7%) |
| 55 to 64 Years | 365 (89.2%) | 438 (89.6%) |
| 65 to 74 Years | 348 (93.5%) | 408 (97.4%) |
| 75 Years and over | 227 (80.8%) | 327 (90.1%) |
| Total | 2,938 (72.9%) | 3,330 (75.0%) |
Income Below Poverty Among Married-Couple Families in Maryville
The poverty statistics for married-couple families in Maryville show that 4.8% or 67 of the total 1,383 families live below the poverty line. Families with 1 or 2 children have the highest poverty rate of 7.1%, comprising of 28 families. On the other hand, families with 3 or 4 children have the lowest poverty rate of 0.0%, which includes 0 families.
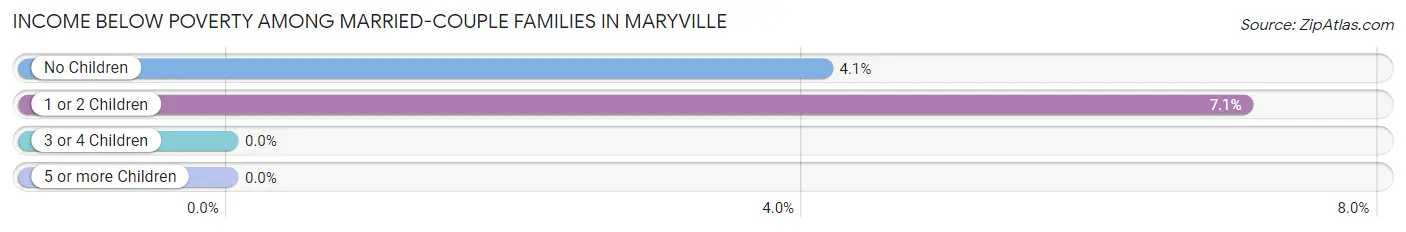
| Children | Above Poverty | Below Poverty |
| No Children | 902 (95.9%) | 39 (4.1%) |
| 1 or 2 Children | 368 (92.9%) | 28 (7.1%) |
| 3 or 4 Children | 46 (100.0%) | 0 (0.0%) |
| 5 or more Children | 0 (0.0%) | 0 (0.0%) |
| Total | 1,316 (95.2%) | 67 (4.8%) |
Income Below Poverty Among Single-Parent Households in Maryville
According to the poverty data in Maryville, 17.8% or 24 single-father households and 40.1% or 176 single-mother households are living below the poverty line. Among single-father households, those with no children have the highest poverty rate, with 24 households (23.5%) experiencing poverty. Likewise, among single-mother households, those with 1 or 2 children have the highest poverty rate, with 142 households (54.2%) falling below the poverty line.
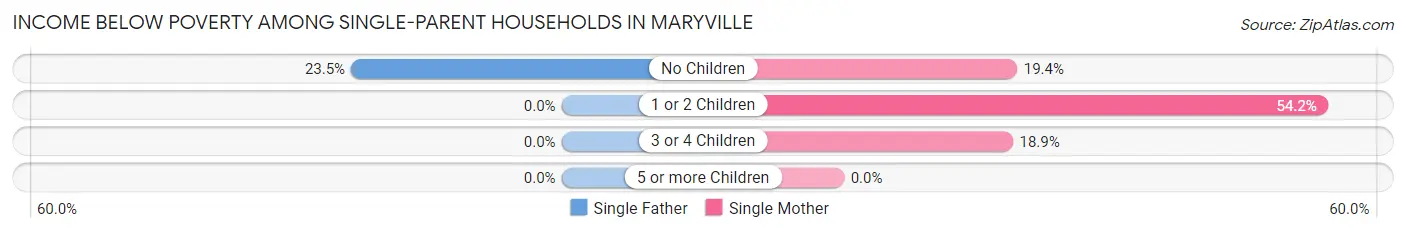
| Children | Single Father | Single Mother |
| No Children | 24 (23.5%) | 24 (19.4%) |
| 1 or 2 Children | 0 (0.0%) | 142 (54.2%) |
| 3 or 4 Children | 0 (0.0%) | 10 (18.9%) |
| 5 or more Children | 0 (0.0%) | 0 (0.0%) |
| Total | 24 (17.8%) | 176 (40.1%) |
Income Below Poverty Among Married-Couple vs Single-Parent Households in Maryville
The poverty data for Maryville shows that 67 of the married-couple family households (4.8%) and 200 of the single-parent households (34.8%) are living below the poverty level. Within the married-couple family households, those with 1 or 2 children have the highest poverty rate, with 28 households (7.1%) falling below the poverty line. Among the single-parent households, those with 1 or 2 children have the highest poverty rate, with 142 household (49.8%) living below poverty.
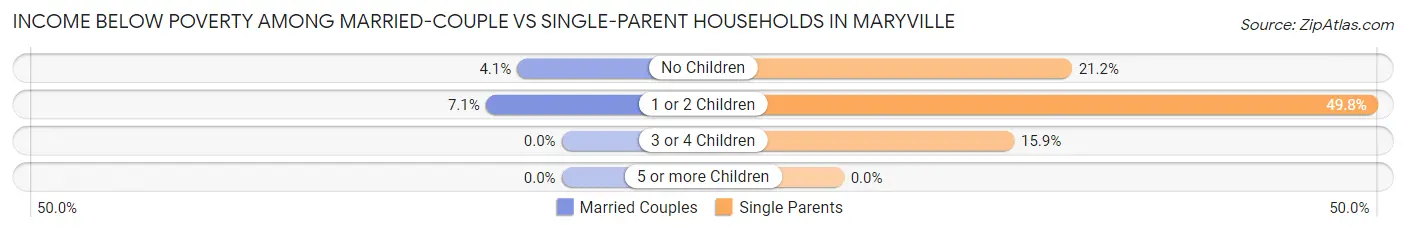
| Children | Married-Couple Families | Single-Parent Households |
| No Children | 39 (4.1%) | 48 (21.2%) |
| 1 or 2 Children | 28 (7.1%) | 142 (49.8%) |
| 3 or 4 Children | 0 (0.0%) | 10 (15.9%) |
| 5 or more Children | 0 (0.0%) | 0 (0.0%) |
| Total | 67 (4.8%) | 200 (34.8%) |
Race in Maryville
The most populous races in Maryville are White / Caucasian (9,779 | 91.5%), Black / African American (369 | 3.5%), and Hispanic or Latino (285 | 2.7%).
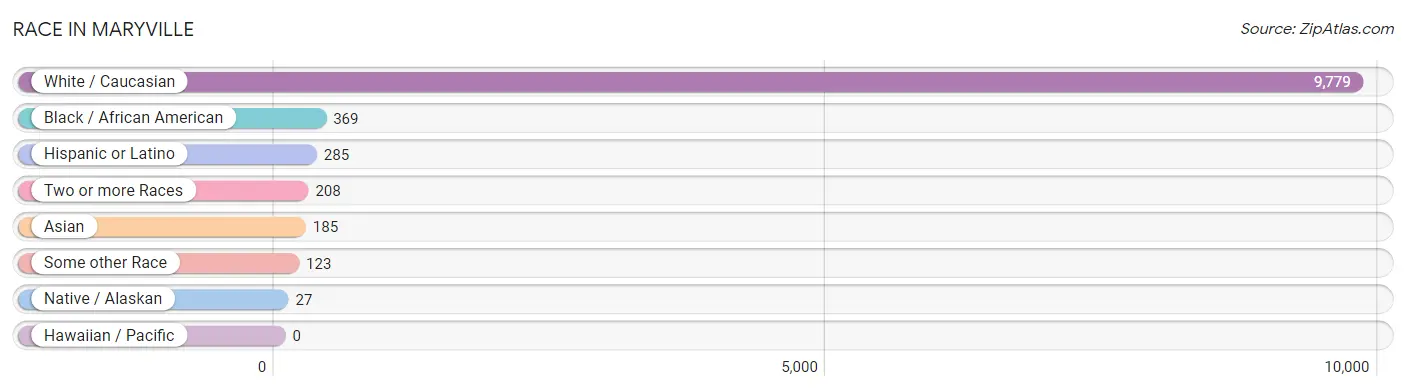
| Race | # Population | % Population |
| Asian | 185 | 1.7% |
| Black / African American | 369 | 3.5% |
| Hawaiian / Pacific | 0 | 0.0% |
| Hispanic or Latino | 285 | 2.7% |
| Native / Alaskan | 27 | 0.3% |
| White / Caucasian | 9,779 | 91.5% |
| Two or more Races | 208 | 1.9% |
| Some other Race | 123 | 1.1% |
| Total | 10,691 | 100.0% |
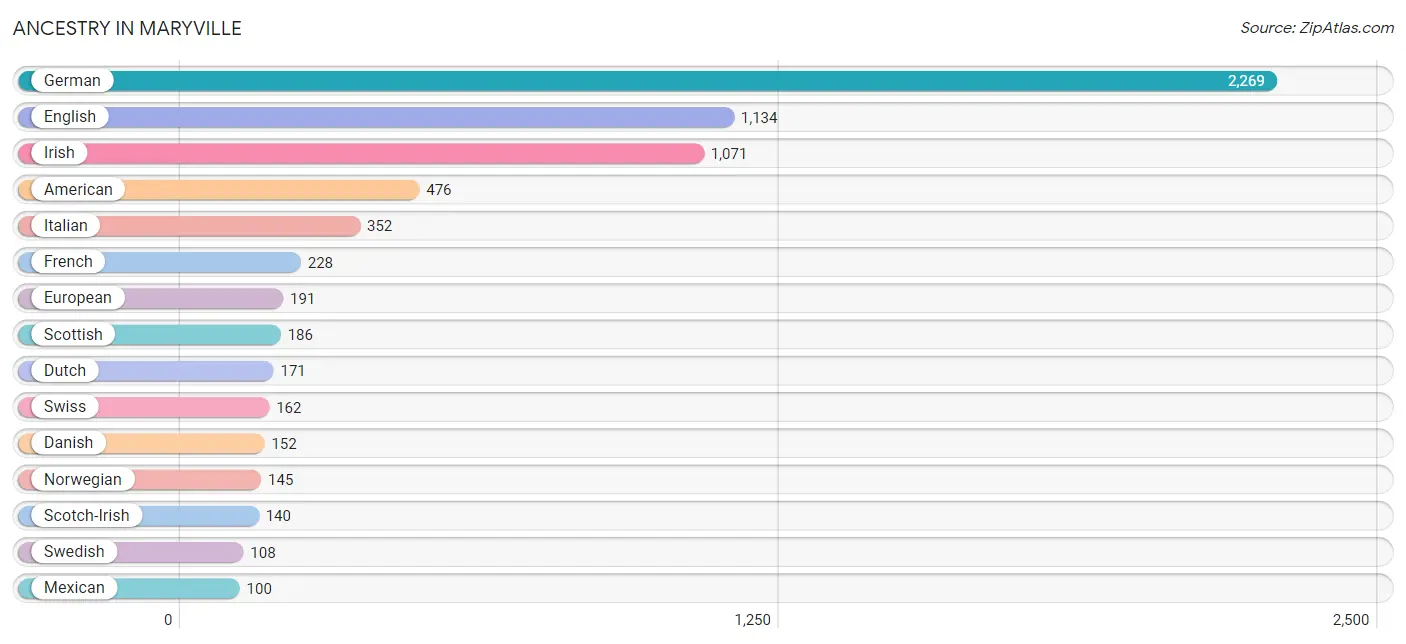
Ancestry in Maryville
The most populous ancestries reported in Maryville are German (2,269 | 21.2%), English (1,134 | 10.6%), Irish (1,071 | 10.0%), American (476 | 4.4%), and Italian (352 | 3.3%), together accounting for 49.6% of all Maryville residents.
| Ancestry | # Population | % Population |
| African | 45 | 0.4% |
| American | 476 | 4.4% |
| Austrian | 4 | 0.0% |
| British | 35 | 0.3% |
| Burmese | 8 | 0.1% |
| Canadian | 11 | 0.1% |
| Central American | 17 | 0.2% |
| Cherokee | 14 | 0.1% |
| Costa Rican | 2 | 0.0% |
| Creek | 18 | 0.2% |
| Croatian | 24 | 0.2% |
| Cuban | 17 | 0.2% |
| Czech | 70 | 0.6% |
| Danish | 152 | 1.4% |
| Dominican | 3 | 0.0% |
| Dutch | 171 | 1.6% |
| Eastern European | 41 | 0.4% |
| English | 1,134 | 10.6% |
| European | 191 | 1.8% |
| French | 228 | 2.1% |
| French Canadian | 19 | 0.2% |
| German | 2,269 | 21.2% |
| Greek | 15 | 0.1% |
| Hungarian | 11 | 0.1% |
| Indian (Asian) | 27 | 0.3% |
| Irish | 1,071 | 10.0% |
| Italian | 352 | 3.3% |
| Japanese | 13 | 0.1% |
| Korean | 90 | 0.8% |
| Mexican | 100 | 0.9% |
| Navajo | 11 | 0.1% |
| Nigerian | 10 | 0.1% |
| Norwegian | 145 | 1.4% |
| Polish | 91 | 0.9% |
| Potawatomi | 9 | 0.1% |
| Puerto Rican | 80 | 0.7% |
| Russian | 23 | 0.2% |
| Salvadoran | 15 | 0.1% |
| Samoan | 10 | 0.1% |
| Scandinavian | 24 | 0.2% |
| Scotch-Irish | 140 | 1.3% |
| Scottish | 186 | 1.7% |
| Sioux | 2 | 0.0% |
| Subsaharan African | 55 | 0.5% |
| Swedish | 108 | 1.0% |
| Swiss | 162 | 1.5% |
| Thai | 83 | 0.8% |
| Turkish | 20 | 0.2% |
| Welsh | 16 | 0.2% | View All 49 Rows |
Immigrants in Maryville
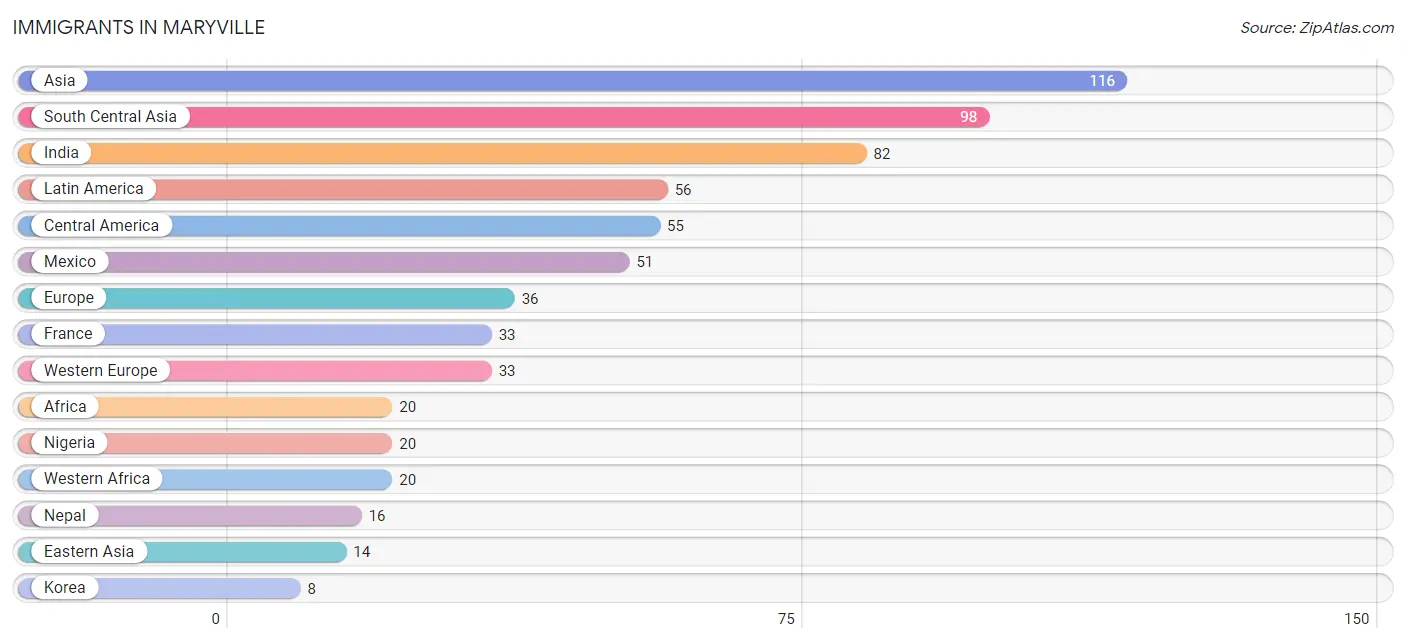
The most numerous immigrant groups reported in Maryville came from Asia (116 | 1.1%), South Central Asia (98 | 0.9%), India (82 | 0.8%), Latin America (56 | 0.5%), and Central America (55 | 0.5%), together accounting for 3.8% of all Maryville residents.
| Immigration Origin | # Population | % Population |
| Africa | 20 | 0.2% |
| Asia | 116 | 1.1% |
| Central America | 55 | 0.5% |
| China | 6 | 0.1% |
| Eastern Asia | 14 | 0.1% |
| El Salvador | 4 | 0.0% |
| England | 3 | 0.0% |
| Europe | 36 | 0.3% |
| France | 33 | 0.3% |
| Hong Kong | 6 | 0.1% |
| India | 82 | 0.8% |
| Korea | 8 | 0.1% |
| Latin America | 56 | 0.5% |
| Mexico | 51 | 0.5% |
| Nepal | 16 | 0.2% |
| Nigeria | 20 | 0.2% |
| Northern Europe | 3 | 0.0% |
| Philippines | 4 | 0.0% |
| South America | 1 | 0.0% |
| South Central Asia | 98 | 0.9% |
| South Eastern Asia | 4 | 0.0% |
| Western Africa | 20 | 0.2% |
| Western Europe | 33 | 0.3% | View All 23 Rows |
Sex and Age in Maryville
Sex and Age in Maryville
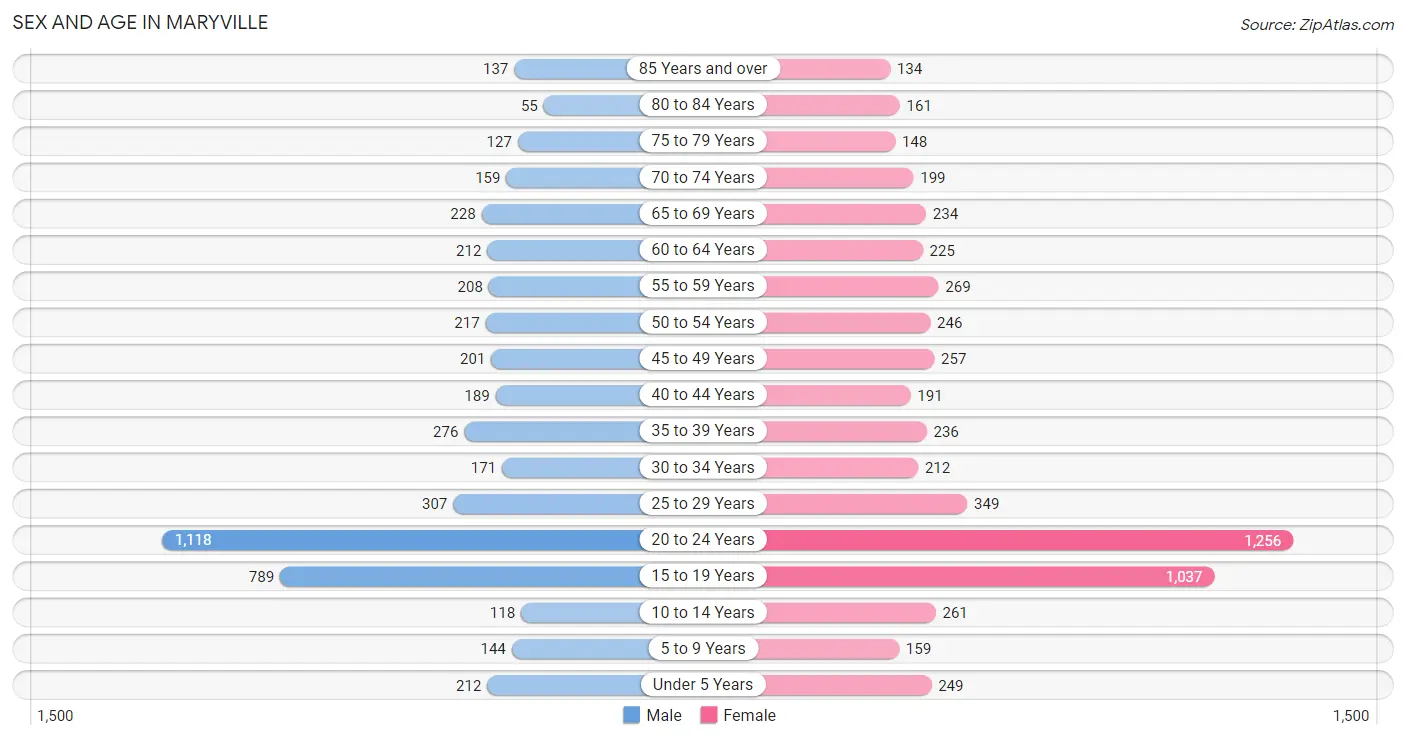
The most populous age groups in Maryville are 20 to 24 Years (1,118 | 23.0%) for men and 20 to 24 Years (1,256 | 21.6%) for women.
| Age Bracket | Male | Female |
| Under 5 Years | 212 (4.3%) | 249 (4.3%) |
| 5 to 9 Years | 144 (3.0%) | 159 (2.7%) |
| 10 to 14 Years | 118 (2.4%) | 261 (4.5%) |
| 15 to 19 Years | 789 (16.2%) | 1,037 (17.8%) |
| 20 to 24 Years | 1,118 (23.0%) | 1,256 (21.6%) |
| 25 to 29 Years | 307 (6.3%) | 349 (6.0%) |
| 30 to 34 Years | 171 (3.5%) | 212 (3.6%) |
| 35 to 39 Years | 276 (5.7%) | 236 (4.1%) |
| 40 to 44 Years | 189 (3.9%) | 191 (3.3%) |
| 45 to 49 Years | 201 (4.1%) | 257 (4.4%) |
| 50 to 54 Years | 217 (4.5%) | 246 (4.2%) |
| 55 to 59 Years | 208 (4.3%) | 269 (4.6%) |
| 60 to 64 Years | 212 (4.3%) | 225 (3.9%) |
| 65 to 69 Years | 228 (4.7%) | 234 (4.0%) |
| 70 to 74 Years | 159 (3.3%) | 199 (3.4%) |
| 75 to 79 Years | 127 (2.6%) | 148 (2.5%) |
| 80 to 84 Years | 55 (1.1%) | 161 (2.8%) |
| 85 Years and over | 137 (2.8%) | 134 (2.3%) |
| Total | 4,868 (100.0%) | 5,823 (100.0%) |
Families and Households in Maryville
Median Family Size in Maryville
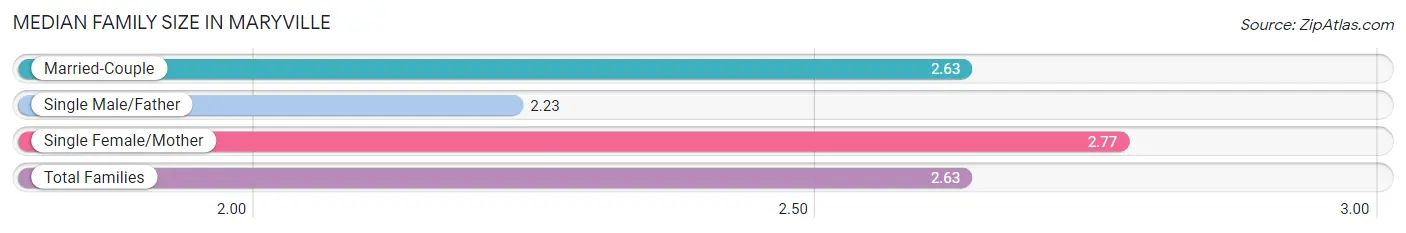
The median family size in Maryville is 2.63 persons per family, with single female/mother families (439 | 22.4%) accounting for the largest median family size of 2.77 persons per family. On the other hand, single male/father families (135 | 6.9%) represent the smallest median family size with 2.23 persons per family.
| Family Type | # Families | Family Size |
| Married-Couple | 1,383 (70.7%) | 2.63 |
| Single Male/Father | 135 (6.9%) | 2.23 |
| Single Female/Mother | 439 (22.4%) | 2.77 |
| Total Families | 1,957 (100.0%) | 2.63 |
Median Household Size in Maryville
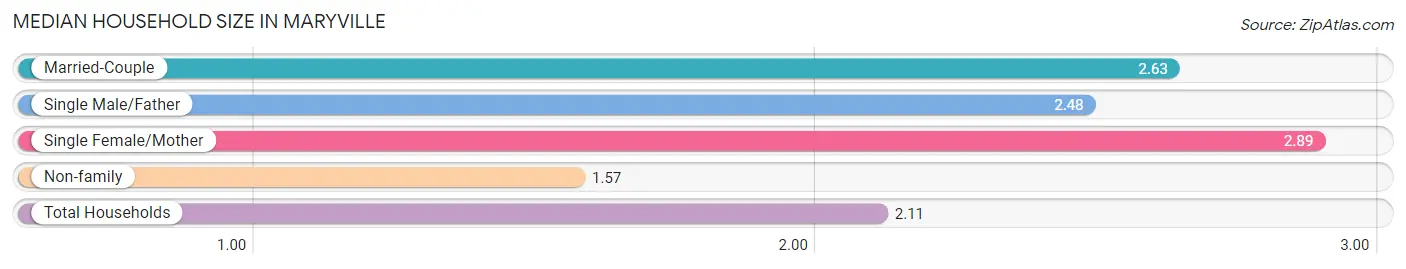
The median household size in Maryville is 2.11 persons per household, with single female/mother households (439 | 11.0%) accounting for the largest median household size of 2.89 persons per household. non-family households (2,046 | 51.1%) represent the smallest median household size with 1.57 persons per household.
| Household Type | # Households | Household Size |
| Married-Couple | 1,383 (34.5%) | 2.63 |
| Single Male/Father | 135 (3.4%) | 2.48 |
| Single Female/Mother | 439 (11.0%) | 2.89 |
| Non-family | 2,046 (51.1%) | 1.57 |
| Total Households | 4,003 (100.0%) | 2.11 |
Household Size by Marriage Status in Maryville
Out of a total of 4,003 households in Maryville, 1,957 (48.9%) are family households, while 2,046 (51.1%) are nonfamily households. The most numerous type of family households are 2-person households, comprising 1,143, and the most common type of nonfamily households are 1-person households, comprising 1,386.
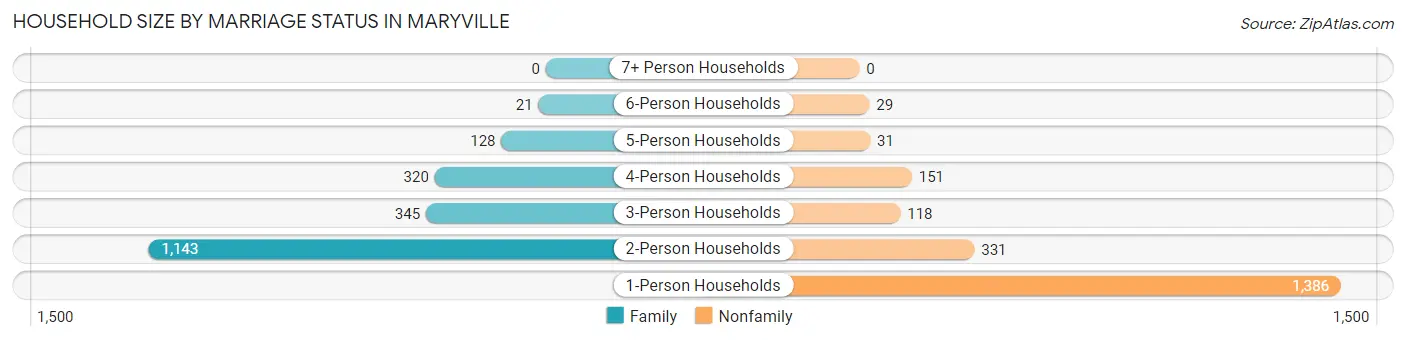
| Household Size | Family Households | Nonfamily Households |
| 1-Person Households | - | 1,386 (34.6%) |
| 2-Person Households | 1,143 (28.5%) | 331 (8.3%) |
| 3-Person Households | 345 (8.6%) | 118 (2.9%) |
| 4-Person Households | 320 (8.0%) | 151 (3.8%) |
| 5-Person Households | 128 (3.2%) | 31 (0.8%) |
| 6-Person Households | 21 (0.5%) | 29 (0.7%) |
| 7+ Person Households | 0 (0.0%) | 0 (0.0%) |
| Total | 1,957 (48.9%) | 2,046 (51.1%) |
Female Fertility in Maryville
Fertility by Age in Maryville
Average fertility rate in Maryville is 40.0 births per 1,000 women. Women in the age bracket of 20 to 34 years have the highest fertility rate with 69.0 births per 1,000 women. Women in the age bracket of 20 to 34 years acount for 87.4% of all women with births.
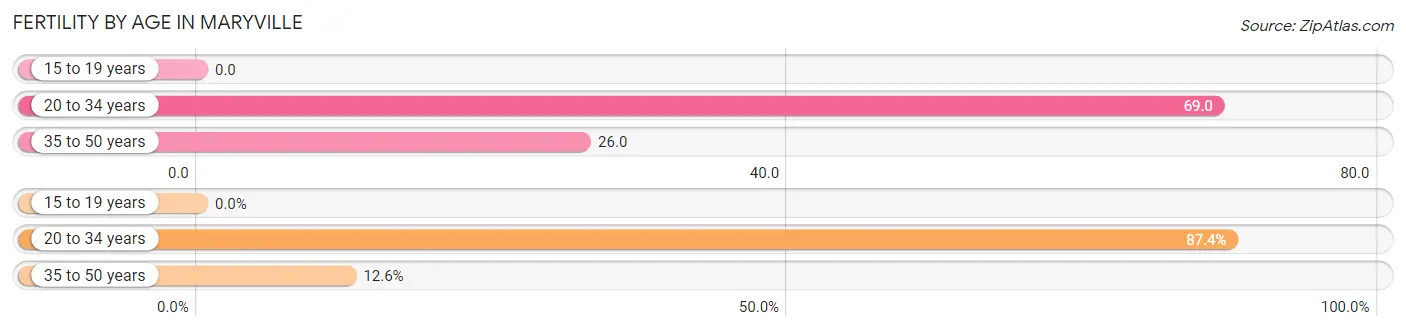
| Age Bracket | Women with Births | Births / 1,000 Women |
| 15 to 19 years | 0 (0.0%) | 0.0 |
| 20 to 34 years | 125 (87.4%) | 69.0 |
| 35 to 50 years | 18 (12.6%) | 26.0 |
| Total | 143 (100.0%) | 40.0 |
Fertility by Age by Marriage Status in Maryville
55.9% of women with births (143) in Maryville are married. The highest percentage of unmarried women with births falls into 20 to 34 years age bracket with 50.4% of them unmarried at the time of birth, while the lowest percentage of unmarried women with births belong to 35 to 50 years age bracket with 0.0% of them unmarried.
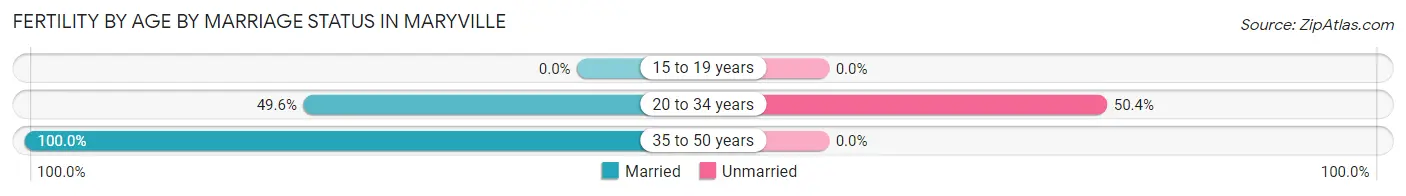
| Age Bracket | Married | Unmarried |
| 15 to 19 years | 0 (0.0%) | 0 (0.0%) |
| 20 to 34 years | 62 (49.6%) | 63 (50.4%) |
| 35 to 50 years | 18 (100.0%) | 0 (0.0%) |
| Total | 80 (55.9%) | 63 (44.1%) |
Fertility by Education in Maryville
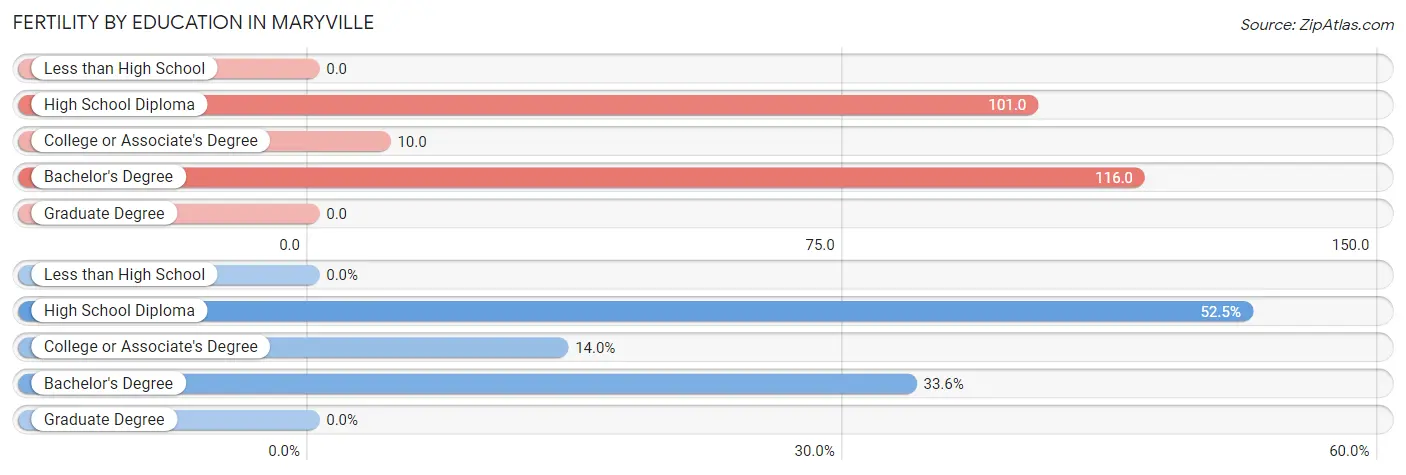
| Educational Attainment | Women with Births | Births / 1,000 Women |
| Less than High School | 0 (0.0%) | 0.0 |
| High School Diploma | 75 (52.4%) | 101.0 |
| College or Associate's Degree | 20 (14.0%) | 10.0 |
| Bachelor's Degree | 48 (33.6%) | 116.0 |
| Graduate Degree | 0 (0.0%) | 0.0 |
| Total | 143 (100.0%) | 40.0 |
Fertility by Education by Marriage Status in Maryville
44.1% of women with births in Maryville are unmarried. Women with the educational attainment of high school diploma are most likely to be married with 69.3% of them married at childbirth, while women with the educational attainment of bachelor's degree are least likely to be married with 64.6% of them unmarried at childbirth.
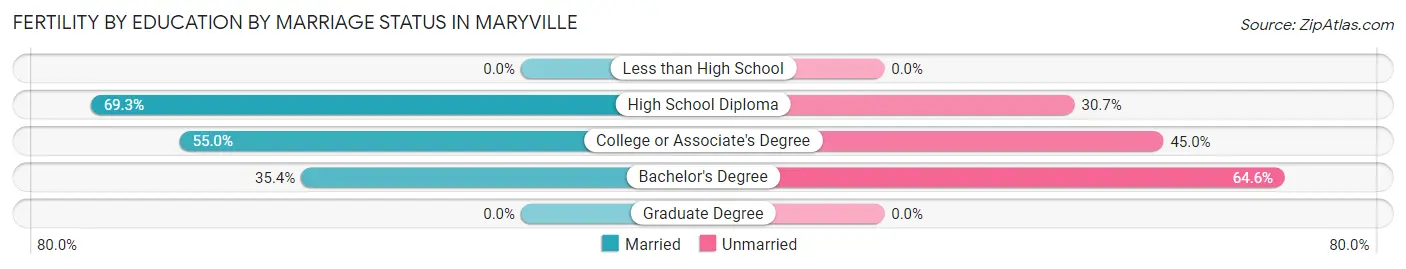
| Educational Attainment | Married | Unmarried |
| Less than High School | 0 (0.0%) | 0 (0.0%) |
| High School Diploma | 52 (69.3%) | 23 (30.7%) |
| College or Associate's Degree | 11 (55.0%) | 9 (45.0%) |
| Bachelor's Degree | 17 (35.4%) | 31 (64.6%) |
| Graduate Degree | 0 (0.0%) | 0 (0.0%) |
| Total | 80 (55.9%) | 63 (44.1%) |
Employment Characteristics in Maryville
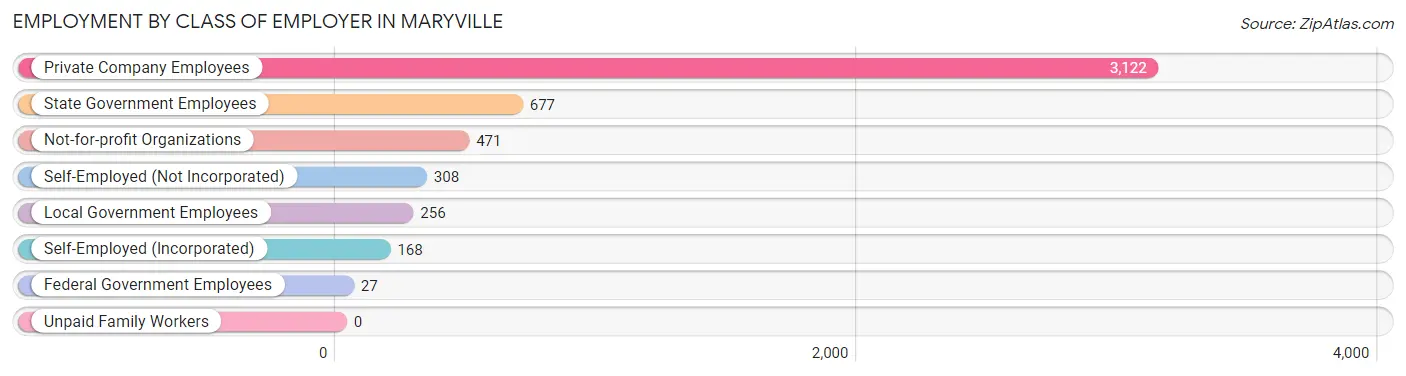
Employment by Class of Employer in Maryville
Among the 5,029 employed individuals in Maryville, private company employees (3,122 | 62.1%), state government employees (677 | 13.5%), and not-for-profit organizations (471 | 9.4%) make up the most common classes of employment.
| Employer Class | # Employees | % Employees |
| Private Company Employees | 3,122 | 62.1% |
| Self-Employed (Incorporated) | 168 | 3.3% |
| Self-Employed (Not Incorporated) | 308 | 6.1% |
| Not-for-profit Organizations | 471 | 9.4% |
| Local Government Employees | 256 | 5.1% |
| State Government Employees | 677 | 13.5% |
| Federal Government Employees | 27 | 0.5% |
| Unpaid Family Workers | 0 | 0.0% |
| Total | 5,029 | 100.0% |
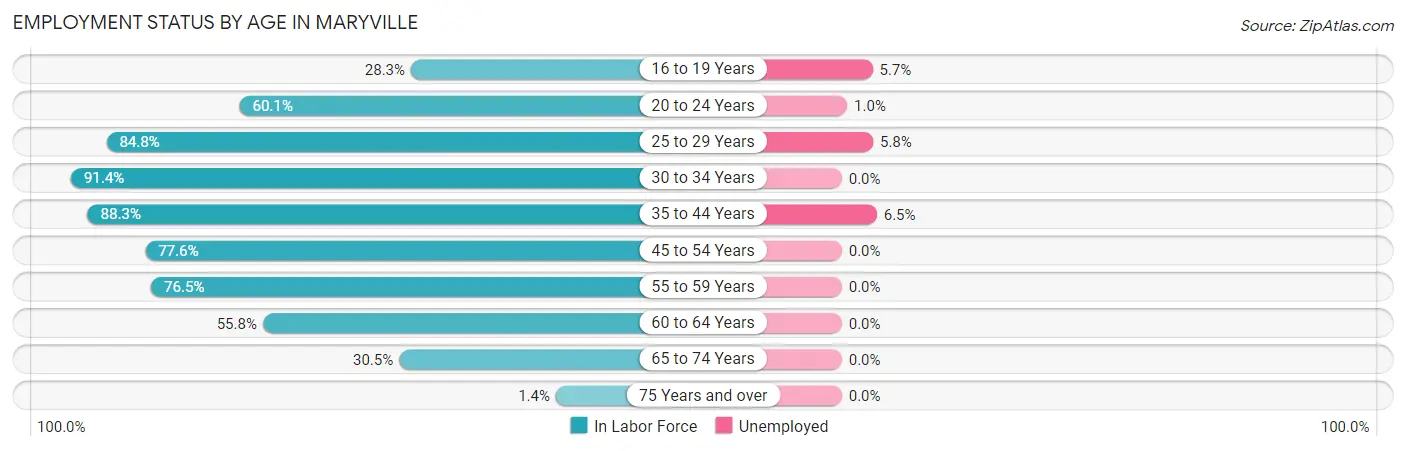
Employment Status by Age in Maryville
According to the labor force statistics for Maryville, out of the total population over 16 years of age (9,537), 54.7% or 5,217 individuals are in the labor force, with 2.4% or 125 of them unemployed. The age group with the highest labor force participation rate is 30 to 34 years, with 91.4% or 350 individuals in the labor force. Within the labor force, the 35 to 44 years age range has the highest percentage of unemployed individuals, with 6.5% or 51 of them being unemployed.
| Age Bracket | In Labor Force | Unemployed |
| 16 to 19 Years | 514 (28.3%) | 29 (5.7%) |
| 20 to 24 Years | 1,427 (60.1%) | 14 (1.0%) |
| 25 to 29 Years | 556 (84.8%) | 32 (5.8%) |
| 30 to 34 Years | 350 (91.4%) | 0 (0.0%) |
| 35 to 44 Years | 788 (88.3%) | 51 (6.5%) |
| 45 to 54 Years | 715 (77.6%) | 0 (0.0%) |
| 55 to 59 Years | 365 (76.5%) | 0 (0.0%) |
| 60 to 64 Years | 244 (55.8%) | 0 (0.0%) |
| 65 to 74 Years | 250 (30.5%) | 0 (0.0%) |
| 75 Years and over | 11 (1.4%) | 0 (0.0%) |
| Total | 5,217 (54.7%) | 125 (2.4%) |
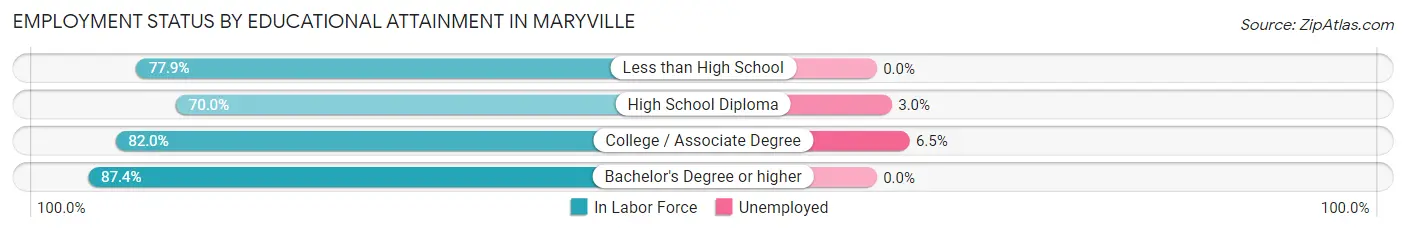
Employment Status by Educational Attainment in Maryville
According to labor force statistics for Maryville, 80.1% of individuals (3,017) out of the total population between 25 and 64 years of age (3,766) are in the labor force, with 2.8% or 84 of them being unemployed. The group with the highest labor force participation rate are those with the educational attainment of bachelor's degree or higher, with 87.4% or 1,222 individuals in the labor force. Within the labor force, individuals with college / associate degree education have the highest percentage of unemployment, with 6.5% or 58 of them being unemployed.
| Educational Attainment | In Labor Force | Unemployed |
| Less than High School | 81 (77.9%) | 0 (0.0%) |
| High School Diploma | 823 (70.0%) | 35 (3.0%) |
| College / Associate Degree | 892 (82.0%) | 71 (6.5%) |
| Bachelor's Degree or higher | 1,222 (87.4%) | 0 (0.0%) |
| Total | 3,017 (80.1%) | 105 (2.8%) |
Employment Occupations by Sex in Maryville
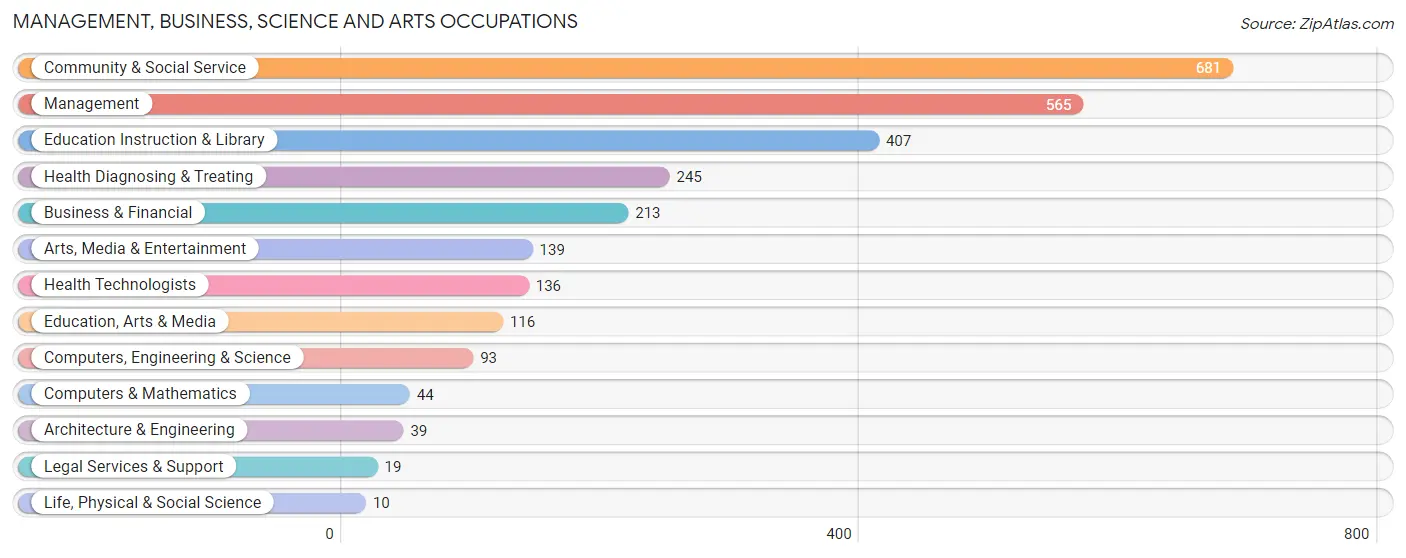
Management, Business, Science and Arts Occupations
The most common Management, Business, Science and Arts occupations in Maryville are Community & Social Service (681 | 13.4%), Management (565 | 11.1%), Education Instruction & Library (407 | 8.0%), Health Diagnosing & Treating (245 | 4.8%), and Business & Financial (213 | 4.2%).
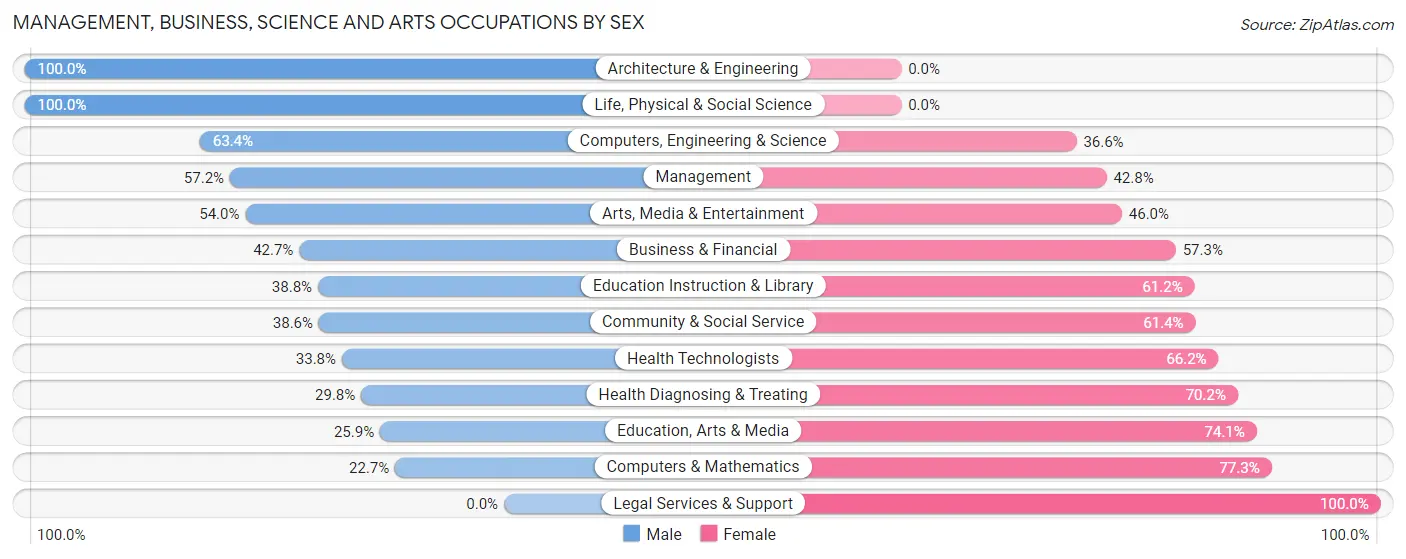
Management, Business, Science and Arts Occupations by Sex
Within the Management, Business, Science and Arts occupations in Maryville, the most male-oriented occupations are Architecture & Engineering (100.0%), Life, Physical & Social Science (100.0%), and Computers, Engineering & Science (63.4%), while the most female-oriented occupations are Legal Services & Support (100.0%), Computers & Mathematics (77.3%), and Education, Arts & Media (74.1%).
| Occupation | Male | Female |
| Management | 323 (57.2%) | 242 (42.8%) |
| Business & Financial | 91 (42.7%) | 122 (57.3%) |
| Computers, Engineering & Science | 59 (63.4%) | 34 (36.6%) |
| Computers & Mathematics | 10 (22.7%) | 34 (77.3%) |
| Architecture & Engineering | 39 (100.0%) | 0 (0.0%) |
| Life, Physical & Social Science | 10 (100.0%) | 0 (0.0%) |
| Community & Social Service | 263 (38.6%) | 418 (61.4%) |
| Education, Arts & Media | 30 (25.9%) | 86 (74.1%) |
| Legal Services & Support | 0 (0.0%) | 19 (100.0%) |
| Education Instruction & Library | 158 (38.8%) | 249 (61.2%) |
| Arts, Media & Entertainment | 75 (54.0%) | 64 (46.0%) |
| Health Diagnosing & Treating | 73 (29.8%) | 172 (70.2%) |
| Health Technologists | 46 (33.8%) | 90 (66.2%) |
| Total (Category) | 809 (45.0%) | 988 (55.0%) |
| Total (Overall) | 2,513 (49.3%) | 2,580 (50.7%) |
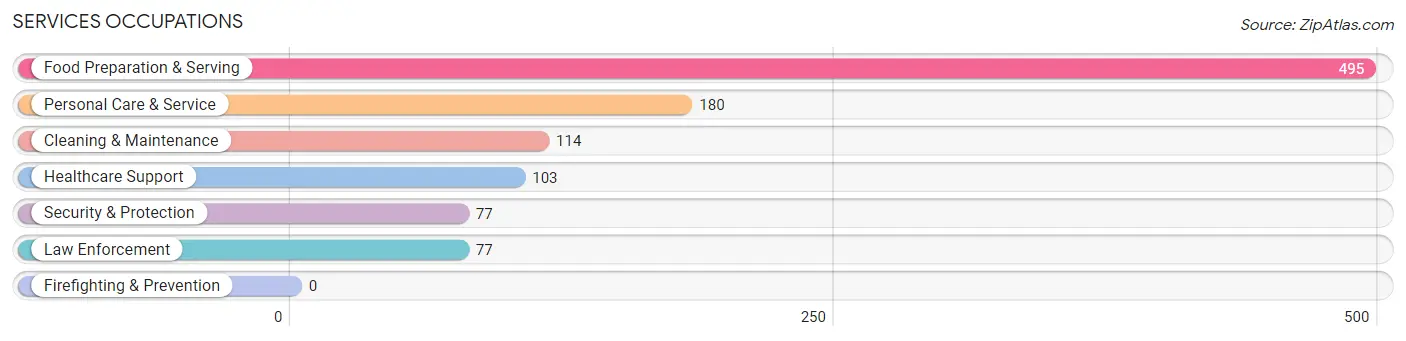
Services Occupations
The most common Services occupations in Maryville are Food Preparation & Serving (495 | 9.7%), Personal Care & Service (180 | 3.5%), Cleaning & Maintenance (114 | 2.2%), Healthcare Support (103 | 2.0%), and Security & Protection (77 | 1.5%).
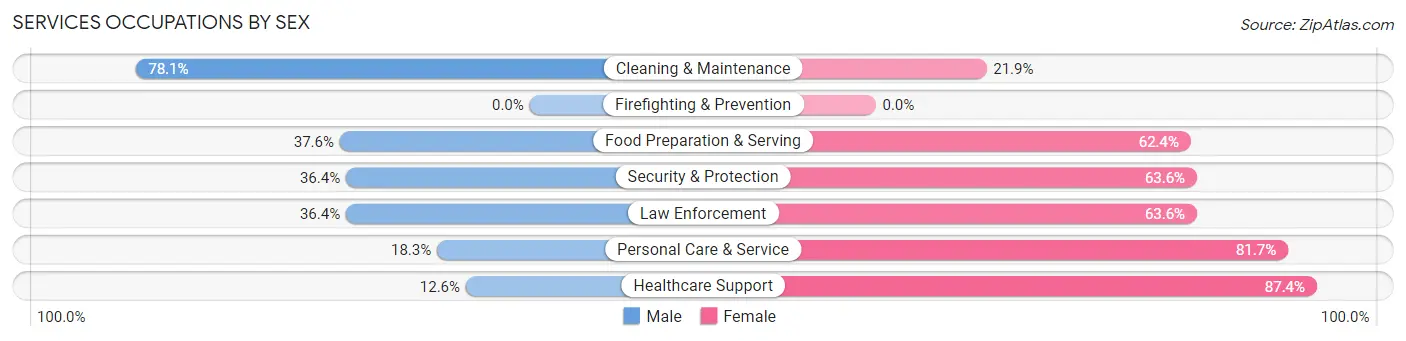
Services Occupations by Sex
Within the Services occupations in Maryville, the most male-oriented occupations are Cleaning & Maintenance (78.1%), Food Preparation & Serving (37.6%), and Security & Protection (36.4%), while the most female-oriented occupations are Healthcare Support (87.4%), Personal Care & Service (81.7%), and Security & Protection (63.6%).
| Occupation | Male | Female |
| Healthcare Support | 13 (12.6%) | 90 (87.4%) |
| Security & Protection | 28 (36.4%) | 49 (63.6%) |
| Firefighting & Prevention | 0 (0.0%) | 0 (0.0%) |
| Law Enforcement | 28 (36.4%) | 49 (63.6%) |
| Food Preparation & Serving | 186 (37.6%) | 309 (62.4%) |
| Cleaning & Maintenance | 89 (78.1%) | 25 (21.9%) |
| Personal Care & Service | 33 (18.3%) | 147 (81.7%) |
| Total (Category) | 349 (36.0%) | 620 (64.0%) |
| Total (Overall) | 2,513 (49.3%) | 2,580 (50.7%) |
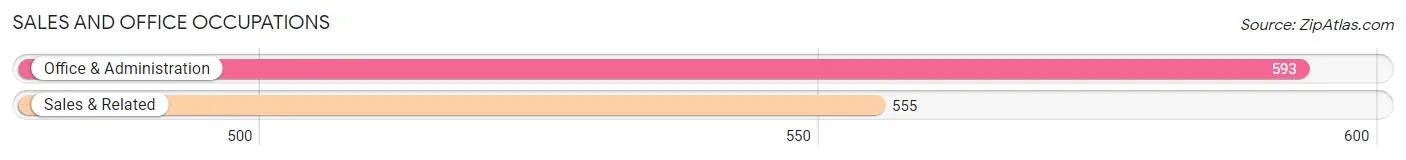
Sales and Office Occupations
The most common Sales and Office occupations in Maryville are Office & Administration (593 | 11.6%), and Sales & Related (555 | 10.9%).
Sales and Office Occupations by Sex
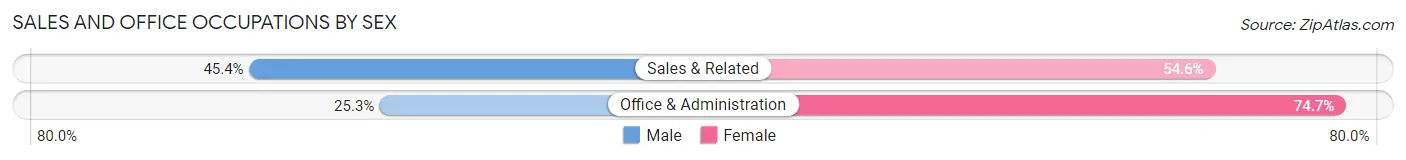
| Occupation | Male | Female |
| Sales & Related | 252 (45.4%) | 303 (54.6%) |
| Office & Administration | 150 (25.3%) | 443 (74.7%) |
| Total (Category) | 402 (35.0%) | 746 (65.0%) |
| Total (Overall) | 2,513 (49.3%) | 2,580 (50.7%) |
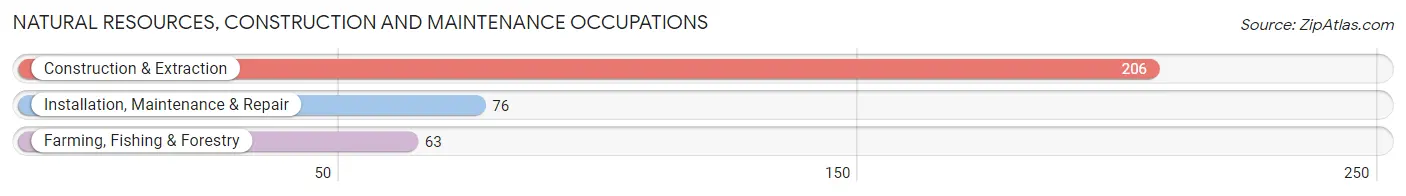
Natural Resources, Construction and Maintenance Occupations
The most common Natural Resources, Construction and Maintenance occupations in Maryville are Construction & Extraction (206 | 4.0%), Installation, Maintenance & Repair (76 | 1.5%), and Farming, Fishing & Forestry (63 | 1.2%).
Natural Resources, Construction and Maintenance Occupations by Sex
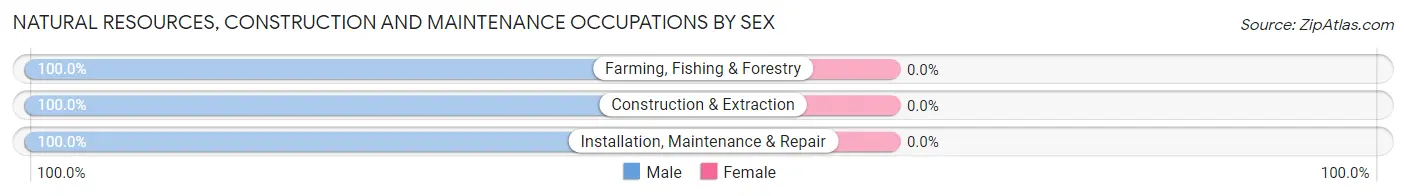
| Occupation | Male | Female |
| Farming, Fishing & Forestry | 63 (100.0%) | 0 (0.0%) |
| Construction & Extraction | 206 (100.0%) | 0 (0.0%) |
| Installation, Maintenance & Repair | 76 (100.0%) | 0 (0.0%) |
| Total (Category) | 345 (100.0%) | 0 (0.0%) |
| Total (Overall) | 2,513 (49.3%) | 2,580 (50.7%) |
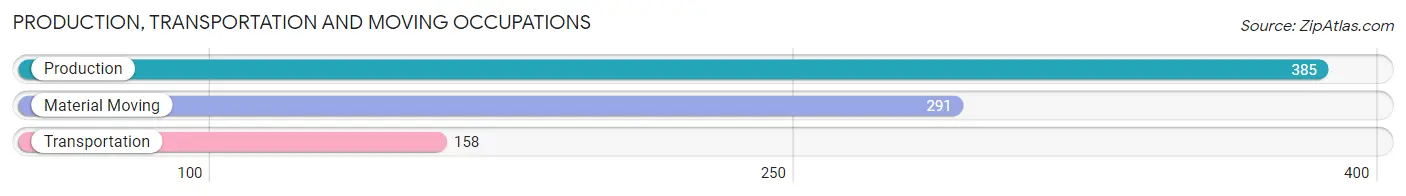
Production, Transportation and Moving Occupations
The most common Production, Transportation and Moving occupations in Maryville are Production (385 | 7.6%), Material Moving (291 | 5.7%), and Transportation (158 | 3.1%).
Production, Transportation and Moving Occupations by Sex
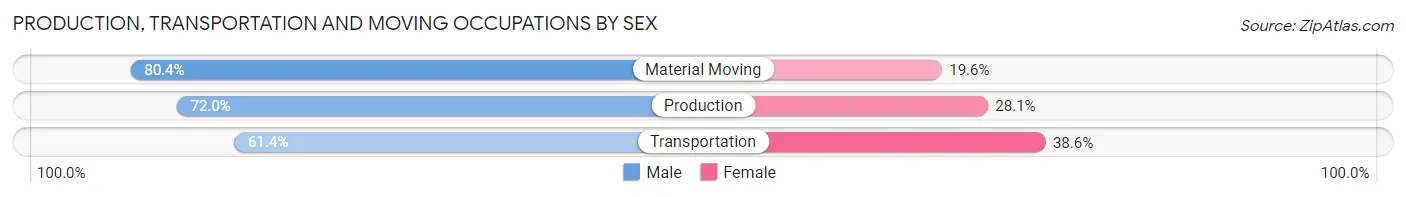
| Occupation | Male | Female |
| Production | 277 (72.0%) | 108 (28.1%) |
| Transportation | 97 (61.4%) | 61 (38.6%) |
| Material Moving | 234 (80.4%) | 57 (19.6%) |
| Total (Category) | 608 (72.9%) | 226 (27.1%) |
| Total (Overall) | 2,513 (49.3%) | 2,580 (50.7%) |
Employment Industries by Sex in Maryville
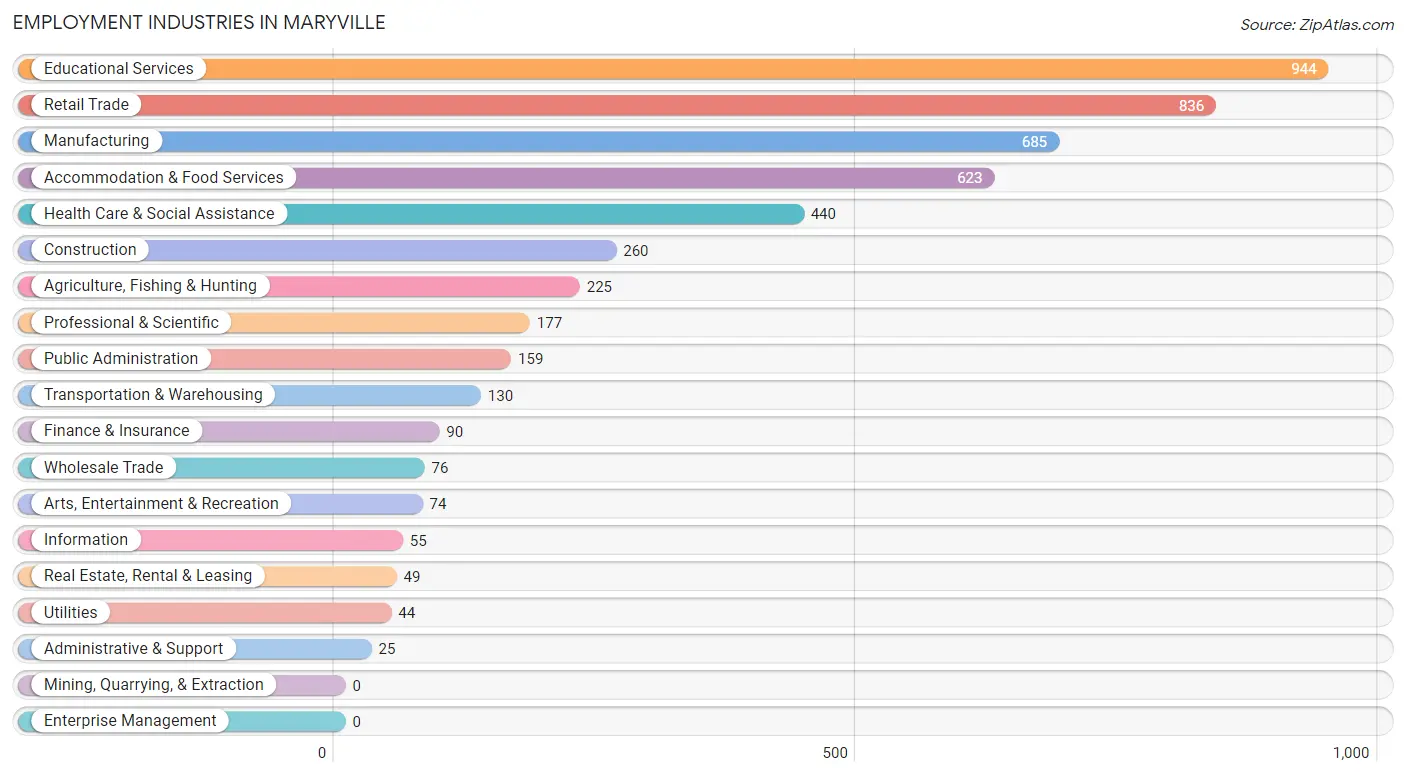
Employment Industries in Maryville
The major employment industries in Maryville include Educational Services (944 | 18.5%), Retail Trade (836 | 16.4%), Manufacturing (685 | 13.5%), Accommodation & Food Services (623 | 12.2%), and Health Care & Social Assistance (440 | 8.6%).
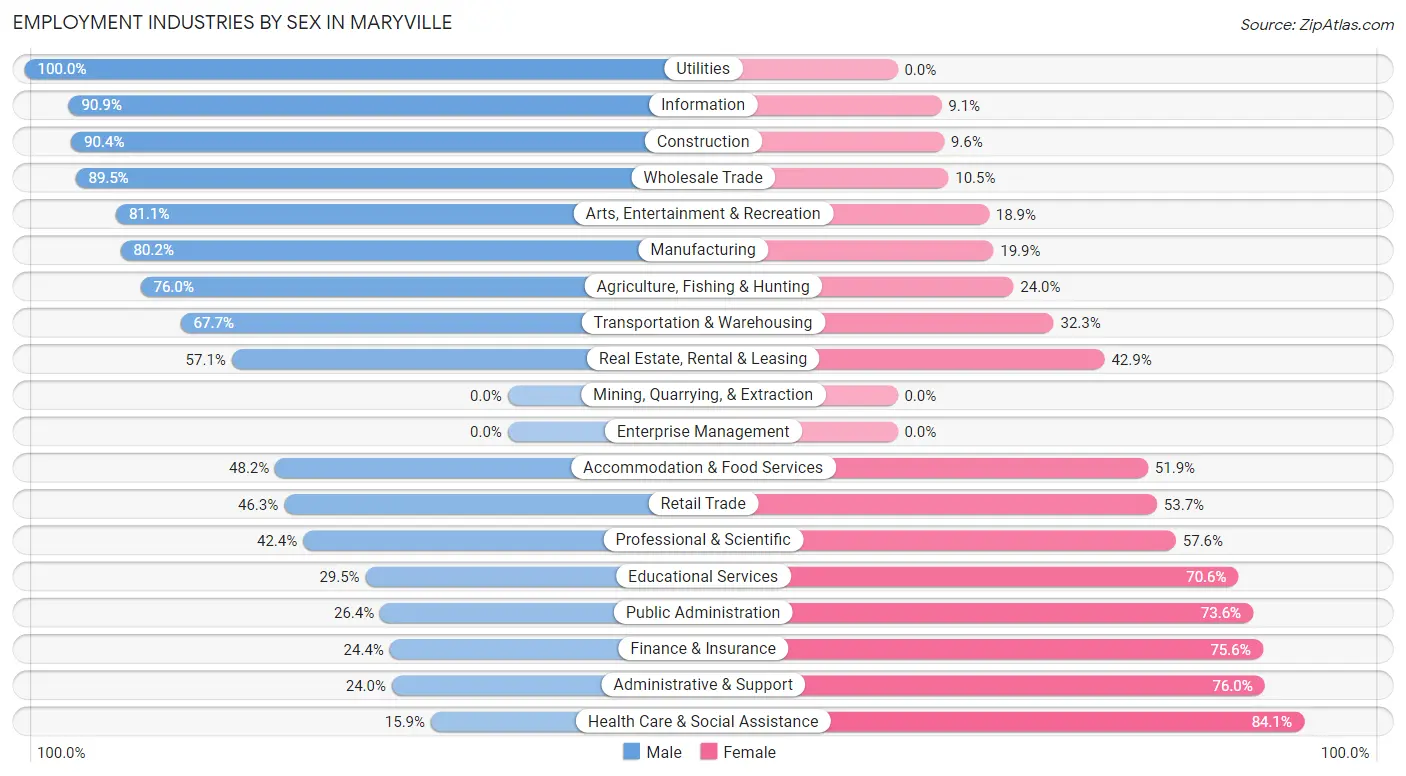
Employment Industries by Sex in Maryville
The Maryville industries that see more men than women are Utilities (100.0%), Information (90.9%), and Construction (90.4%), whereas the industries that tend to have a higher number of women are Health Care & Social Assistance (84.1%), Administrative & Support (76.0%), and Finance & Insurance (75.6%).
| Industry | Male | Female |
| Agriculture, Fishing & Hunting | 171 (76.0%) | 54 (24.0%) |
| Mining, Quarrying, & Extraction | 0 (0.0%) | 0 (0.0%) |
| Construction | 235 (90.4%) | 25 (9.6%) |
| Manufacturing | 549 (80.1%) | 136 (19.9%) |
| Wholesale Trade | 68 (89.5%) | 8 (10.5%) |
| Retail Trade | 387 (46.3%) | 449 (53.7%) |
| Transportation & Warehousing | 88 (67.7%) | 42 (32.3%) |
| Utilities | 44 (100.0%) | 0 (0.0%) |
| Information | 50 (90.9%) | 5 (9.1%) |
| Finance & Insurance | 22 (24.4%) | 68 (75.6%) |
| Real Estate, Rental & Leasing | 28 (57.1%) | 21 (42.9%) |
| Professional & Scientific | 75 (42.4%) | 102 (57.6%) |
| Enterprise Management | 0 (0.0%) | 0 (0.0%) |
| Administrative & Support | 6 (24.0%) | 19 (76.0%) |
| Educational Services | 278 (29.4%) | 666 (70.6%) |
| Health Care & Social Assistance | 70 (15.9%) | 370 (84.1%) |
| Arts, Entertainment & Recreation | 60 (81.1%) | 14 (18.9%) |
| Accommodation & Food Services | 300 (48.1%) | 323 (51.8%) |
| Public Administration | 42 (26.4%) | 117 (73.6%) |
| Total | 2,513 (49.3%) | 2,580 (50.7%) |
Education in Maryville
School Enrollment in Maryville
The most common levels of schooling among the 4,817 students in Maryville are college / undergraduate (3,545 | 73.6%), middle school (320 | 6.6%), and high school (284 | 5.9%).
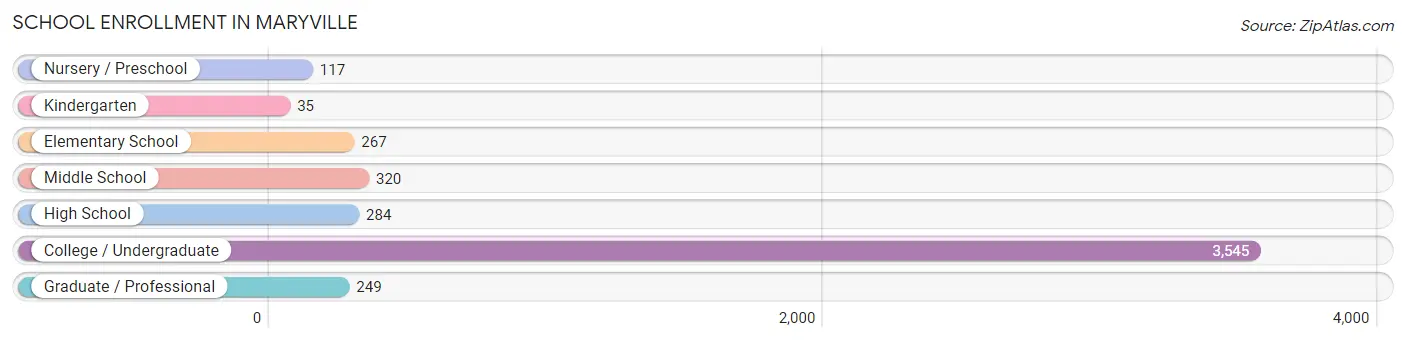
| School Level | # Students | % Students |
| Nursery / Preschool | 117 | 2.4% |
| Kindergarten | 35 | 0.7% |
| Elementary School | 267 | 5.5% |
| Middle School | 320 | 6.6% |
| High School | 284 | 5.9% |
| College / Undergraduate | 3,545 | 73.6% |
| Graduate / Professional | 249 | 5.2% |
| Total | 4,817 | 100.0% |
School Enrollment by Age by Funding Source in Maryville
Out of a total of 4,817 students who are enrolled in schools in Maryville, 236 (4.9%) attend a private institution, while the remaining 4,581 (95.1%) are enrolled in public schools. The age group of 3 to 4 year olds has the highest likelihood of being enrolled in private schools, with 30 (29.4% in the age bracket) enrolled. Conversely, the age group of 18 to 19 year olds has the lowest likelihood of being enrolled in a private school, with 1,531 (98.9% in the age bracket) attending a public institution.
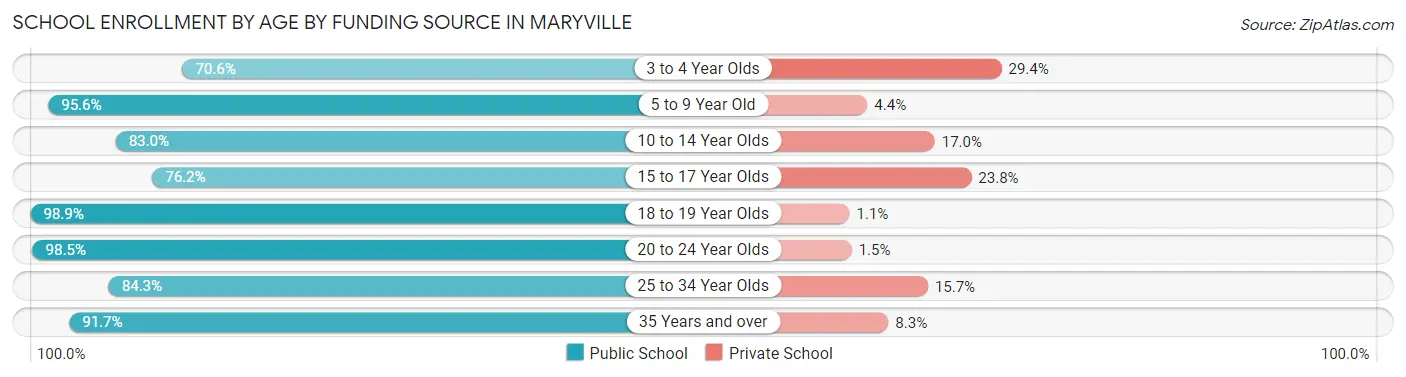
| Age Bracket | Public School | Private School |
| 3 to 4 Year Olds | 72 (70.6%) | 30 (29.4%) |
| 5 to 9 Year Old | 281 (95.6%) | 13 (4.4%) |
| 10 to 14 Year Olds | 308 (83.0%) | 63 (17.0%) |
| 15 to 17 Year Olds | 189 (76.2%) | 59 (23.8%) |
| 18 to 19 Year Olds | 1,531 (98.9%) | 17 (1.1%) |
| 20 to 24 Year Olds | 2,030 (98.5%) | 31 (1.5%) |
| 25 to 34 Year Olds | 102 (84.3%) | 19 (15.7%) |
| 35 Years and over | 66 (91.7%) | 6 (8.3%) |
| Total | 4,581 (95.1%) | 236 (4.9%) |
Educational Attainment by Field of Study in Maryville
Education (545 | 30.3%), bio, nature & agricultural (233 | 12.9%), business (204 | 11.3%), arts & humanities (127 | 7.1%), and communications (110 | 6.1%) are the most common fields of study among 1,800 individuals in Maryville who have obtained a bachelor's degree or higher.
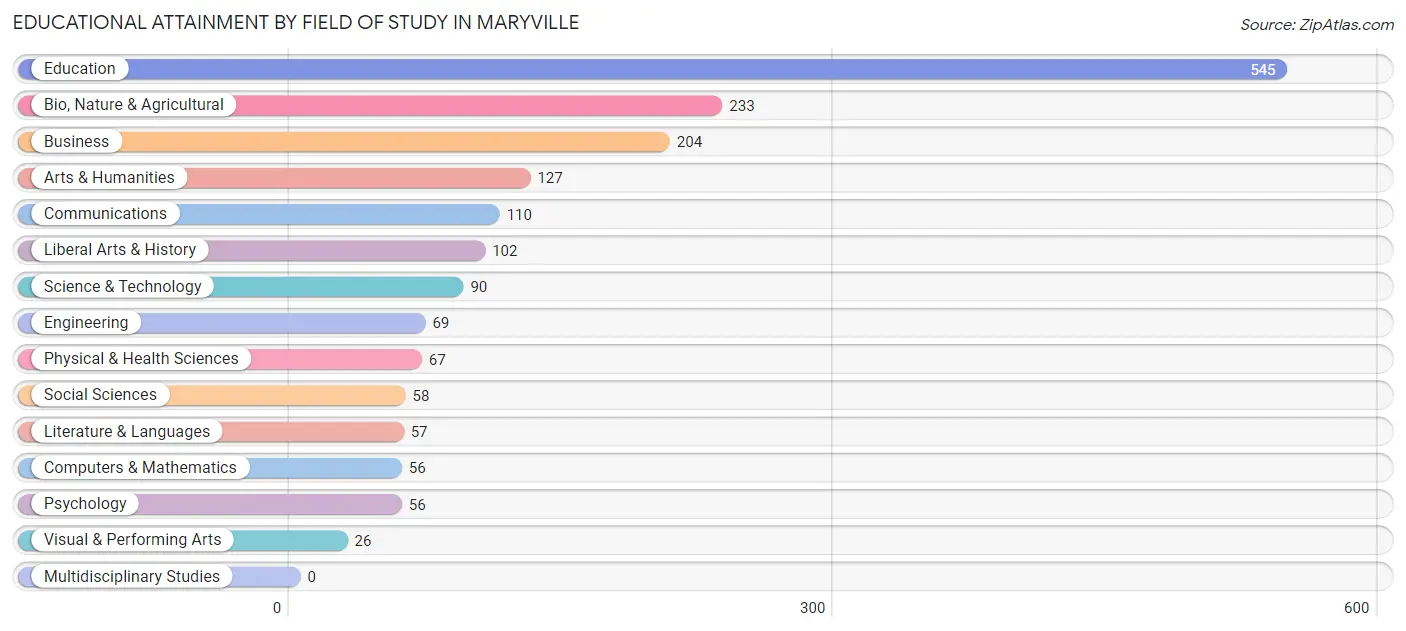
| Field of Study | # Graduates | % Graduates |
| Computers & Mathematics | 56 | 3.1% |
| Bio, Nature & Agricultural | 233 | 12.9% |
| Physical & Health Sciences | 67 | 3.7% |
| Psychology | 56 | 3.1% |
| Social Sciences | 58 | 3.2% |
| Engineering | 69 | 3.8% |
| Multidisciplinary Studies | 0 | 0.0% |
| Science & Technology | 90 | 5.0% |
| Business | 204 | 11.3% |
| Education | 545 | 30.3% |
| Literature & Languages | 57 | 3.2% |
| Liberal Arts & History | 102 | 5.7% |
| Visual & Performing Arts | 26 | 1.4% |
| Communications | 110 | 6.1% |
| Arts & Humanities | 127 | 7.1% |
| Total | 1,800 | 100.0% |
Transportation & Commute in Maryville
Vehicle Availability by Sex in Maryville
The most prevalent vehicle ownership categories in Maryville are males with 2 vehicles (941, accounting for 40.3%) and females with 2 vehicles (789, making up 42.2%).
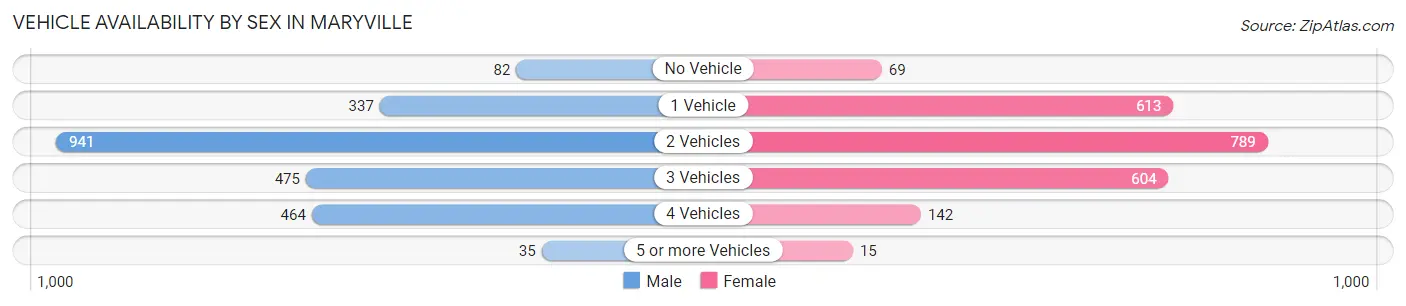
| Vehicles Available | Male | Female |
| No Vehicle | 82 (3.5%) | 69 (3.1%) |
| 1 Vehicle | 337 (14.4%) | 613 (27.5%) |
| 2 Vehicles | 941 (40.3%) | 789 (35.3%) |
| 3 Vehicles | 475 (20.3%) | 604 (27.1%) |
| 4 Vehicles | 464 (19.9%) | 142 (6.4%) |
| 5 or more Vehicles | 35 (1.5%) | 15 (0.7%) |
| Total | 2,334 (100.0%) | 2,232 (100.0%) |
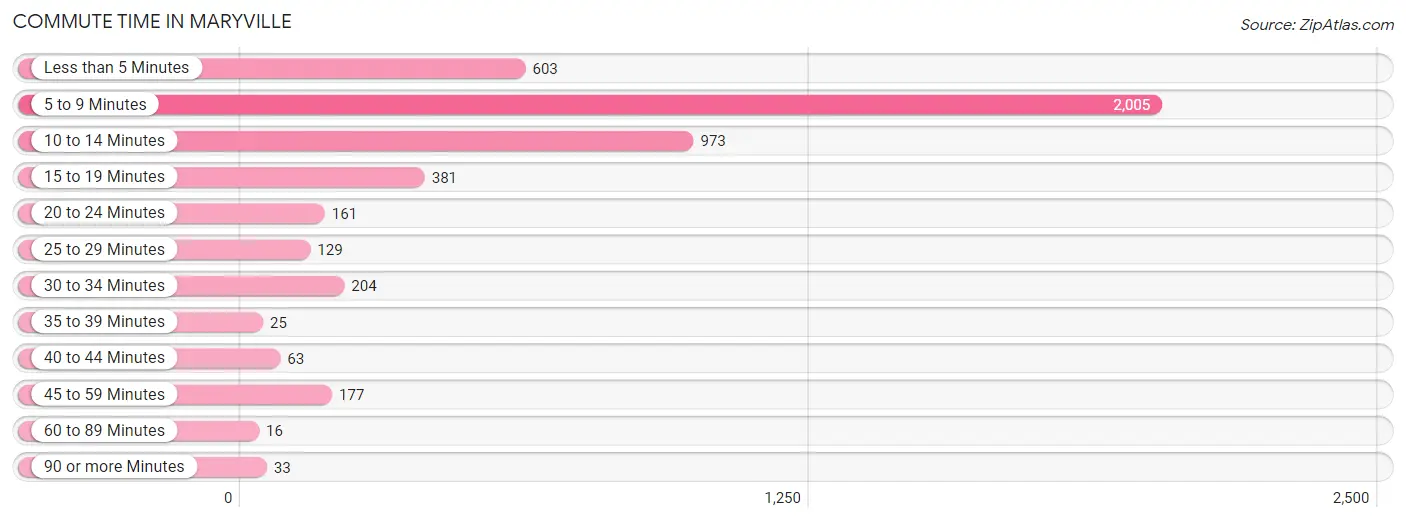
Commute Time in Maryville
The most frequently occuring commute durations in Maryville are 5 to 9 minutes (2,005 commuters, 42.0%), 10 to 14 minutes (973 commuters, 20.4%), and less than 5 minutes (603 commuters, 12.6%).
| Commute Time | # Commuters | % Commuters |
| Less than 5 Minutes | 603 | 12.6% |
| 5 to 9 Minutes | 2,005 | 42.0% |
| 10 to 14 Minutes | 973 | 20.4% |
| 15 to 19 Minutes | 381 | 8.0% |
| 20 to 24 Minutes | 161 | 3.4% |
| 25 to 29 Minutes | 129 | 2.7% |
| 30 to 34 Minutes | 204 | 4.3% |
| 35 to 39 Minutes | 25 | 0.5% |
| 40 to 44 Minutes | 63 | 1.3% |
| 45 to 59 Minutes | 177 | 3.7% |
| 60 to 89 Minutes | 16 | 0.3% |
| 90 or more Minutes | 33 | 0.7% |
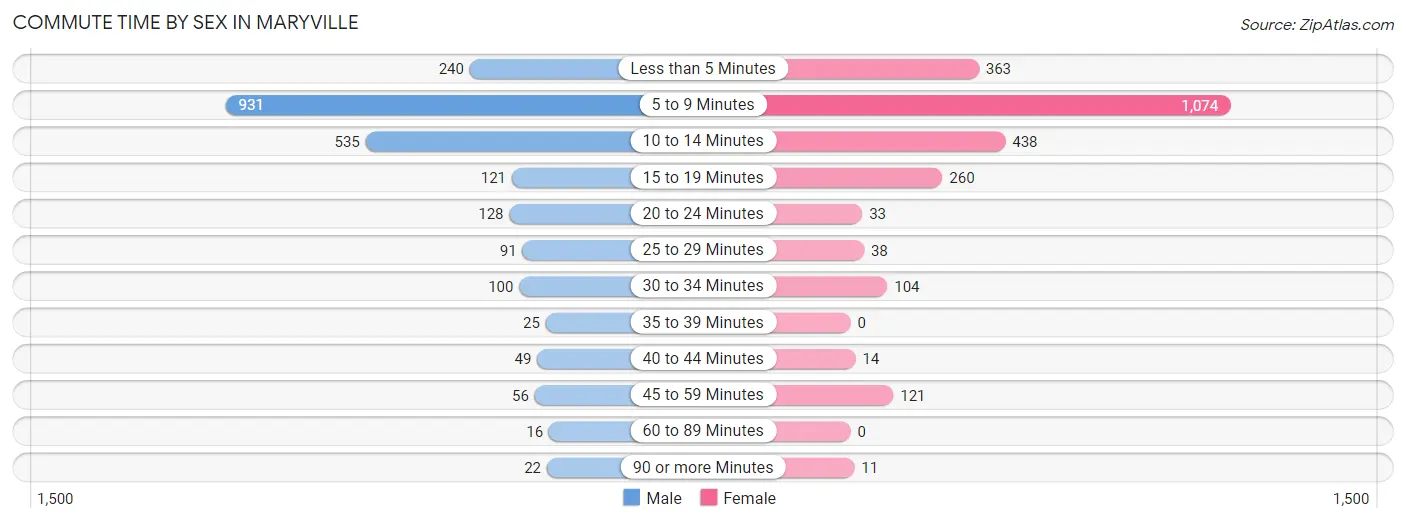
Commute Time by Sex in Maryville
The most common commute times in Maryville are 5 to 9 minutes (931 commuters, 40.2%) for males and 5 to 9 minutes (1,074 commuters, 43.7%) for females.
| Commute Time | Male | Female |
| Less than 5 Minutes | 240 (10.4%) | 363 (14.8%) |
| 5 to 9 Minutes | 931 (40.2%) | 1,074 (43.7%) |
| 10 to 14 Minutes | 535 (23.1%) | 438 (17.8%) |
| 15 to 19 Minutes | 121 (5.2%) | 260 (10.6%) |
| 20 to 24 Minutes | 128 (5.5%) | 33 (1.3%) |
| 25 to 29 Minutes | 91 (3.9%) | 38 (1.5%) |
| 30 to 34 Minutes | 100 (4.3%) | 104 (4.2%) |
| 35 to 39 Minutes | 25 (1.1%) | 0 (0.0%) |
| 40 to 44 Minutes | 49 (2.1%) | 14 (0.6%) |
| 45 to 59 Minutes | 56 (2.4%) | 121 (4.9%) |
| 60 to 89 Minutes | 16 (0.7%) | 0 (0.0%) |
| 90 or more Minutes | 22 (0.9%) | 11 (0.4%) |
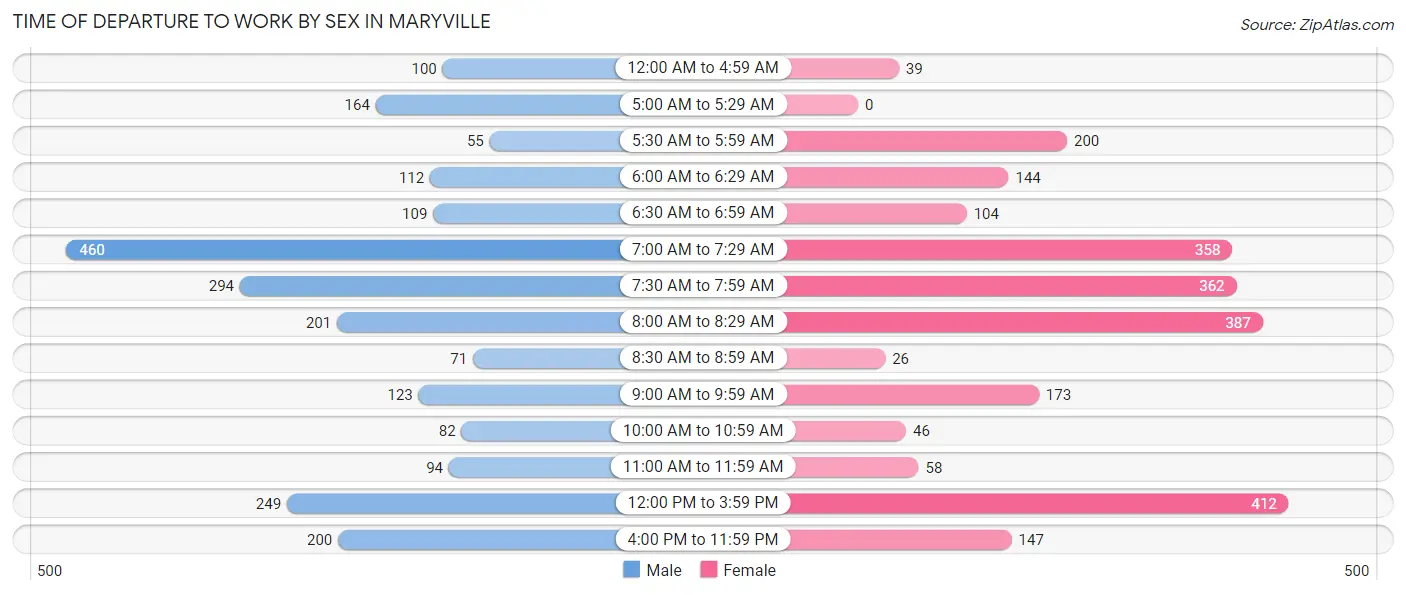
Time of Departure to Work by Sex in Maryville
The most frequent times of departure to work in Maryville are 7:00 AM to 7:29 AM (460, 19.9%) for males and 12:00 PM to 3:59 PM (412, 16.8%) for females.
| Time of Departure | Male | Female |
| 12:00 AM to 4:59 AM | 100 (4.3%) | 39 (1.6%) |
| 5:00 AM to 5:29 AM | 164 (7.1%) | 0 (0.0%) |
| 5:30 AM to 5:59 AM | 55 (2.4%) | 200 (8.1%) |
| 6:00 AM to 6:29 AM | 112 (4.8%) | 144 (5.9%) |
| 6:30 AM to 6:59 AM | 109 (4.7%) | 104 (4.2%) |
| 7:00 AM to 7:29 AM | 460 (19.9%) | 358 (14.6%) |
| 7:30 AM to 7:59 AM | 294 (12.7%) | 362 (14.7%) |
| 8:00 AM to 8:29 AM | 201 (8.7%) | 387 (15.8%) |
| 8:30 AM to 8:59 AM | 71 (3.1%) | 26 (1.1%) |
| 9:00 AM to 9:59 AM | 123 (5.3%) | 173 (7.0%) |
| 10:00 AM to 10:59 AM | 82 (3.5%) | 46 (1.9%) |
| 11:00 AM to 11:59 AM | 94 (4.1%) | 58 (2.4%) |
| 12:00 PM to 3:59 PM | 249 (10.8%) | 412 (16.8%) |
| 4:00 PM to 11:59 PM | 200 (8.6%) | 147 (6.0%) |
| Total | 2,314 (100.0%) | 2,456 (100.0%) |
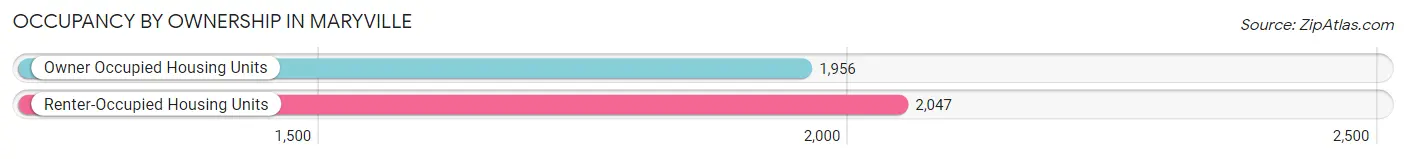
Housing Occupancy in Maryville
Occupancy by Ownership in Maryville
Of the total 4,003 dwellings in Maryville, owner-occupied units account for 1,956 (48.9%), while renter-occupied units make up 2,047 (51.1%).
| Occupancy | # Housing Units | % Housing Units |
| Owner Occupied Housing Units | 1,956 | 48.9% |
| Renter-Occupied Housing Units | 2,047 | 51.1% |
| Total Occupied Housing Units | 4,003 | 100.0% |
Occupancy by Household Size in Maryville
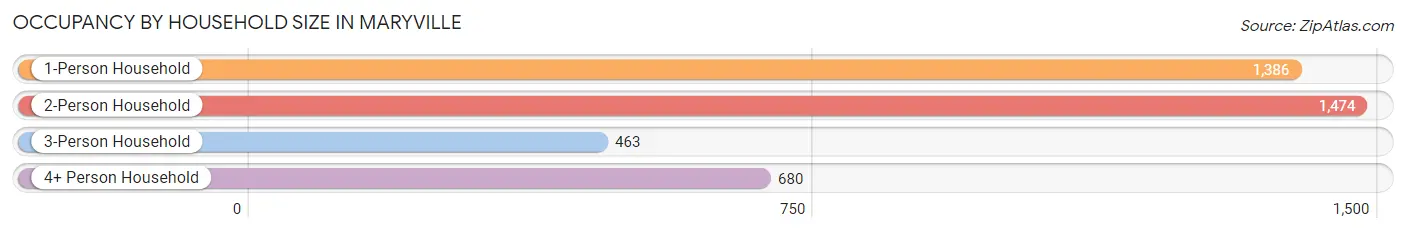
| Household Size | # Housing Units | % Housing Units |
| 1-Person Household | 1,386 | 34.6% |
| 2-Person Household | 1,474 | 36.8% |
| 3-Person Household | 463 | 11.6% |
| 4+ Person Household | 680 | 17.0% |
| Total Housing Units | 4,003 | 100.0% |
Occupancy by Ownership by Household Size in Maryville
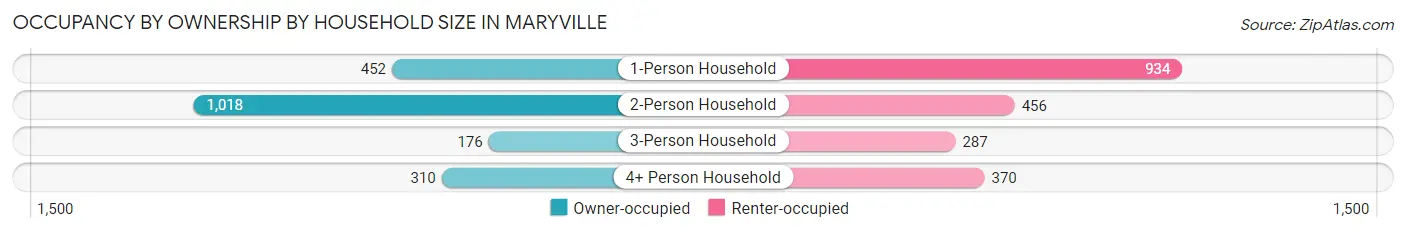
| Household Size | Owner-occupied | Renter-occupied |
| 1-Person Household | 452 (32.6%) | 934 (67.4%) |
| 2-Person Household | 1,018 (69.1%) | 456 (30.9%) |
| 3-Person Household | 176 (38.0%) | 287 (62.0%) |
| 4+ Person Household | 310 (45.6%) | 370 (54.4%) |
| Total Housing Units | 1,956 (48.9%) | 2,047 (51.1%) |
Occupancy by Educational Attainment in Maryville
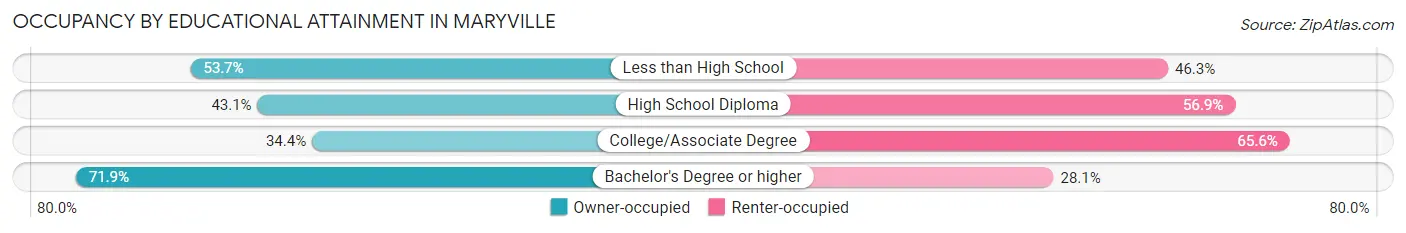
| Household Size | Owner-occupied | Renter-occupied |
| Less than High School | 58 (53.7%) | 50 (46.3%) |
| High School Diploma | 469 (43.1%) | 620 (56.9%) |
| College/Associate Degree | 540 (34.4%) | 1,029 (65.6%) |
| Bachelor's Degree or higher | 889 (71.9%) | 348 (28.1%) |
Occupancy by Age of Householder in Maryville
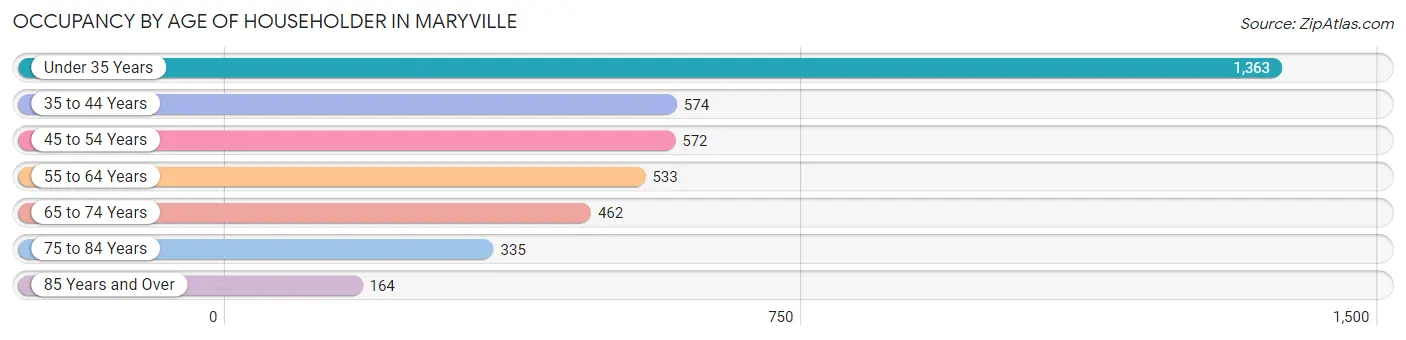
| Age Bracket | # Households | % Households |
| Under 35 Years | 1,363 | 34.1% |
| 35 to 44 Years | 574 | 14.3% |
| 45 to 54 Years | 572 | 14.3% |
| 55 to 64 Years | 533 | 13.3% |
| 65 to 74 Years | 462 | 11.5% |
| 75 to 84 Years | 335 | 8.4% |
| 85 Years and Over | 164 | 4.1% |
| Total | 4,003 | 100.0% |
Housing Finances in Maryville
Median Income by Occupancy in Maryville
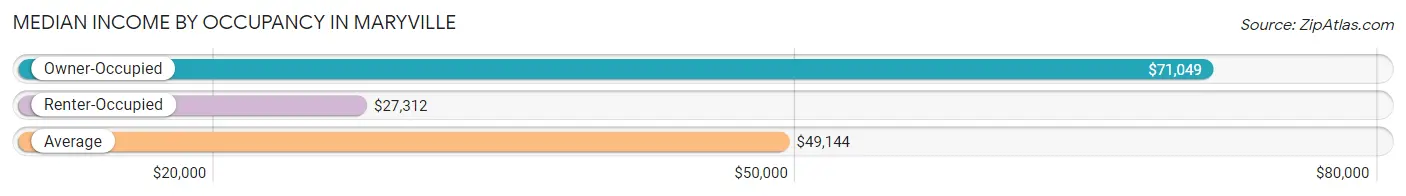
| Occupancy Type | # Households | Median Income |
| Owner-Occupied | 1,956 (48.9%) | $71,049 |
| Renter-Occupied | 2,047 (51.1%) | $27,312 |
| Average | 4,003 (100.0%) | $49,144 |
Occupancy by Householder Income Bracket in Maryville
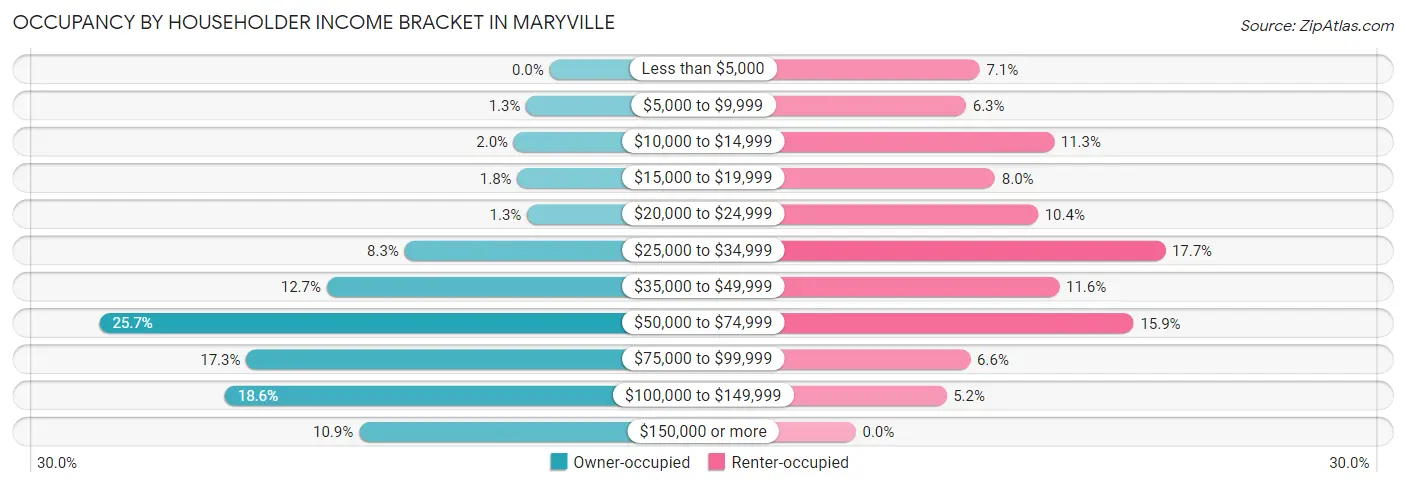
| Income Bracket | Owner-occupied | Renter-occupied |
| Less than $5,000 | 0 (0.0%) | 145 (7.1%) |
| $5,000 to $9,999 | 26 (1.3%) | 129 (6.3%) |
| $10,000 to $14,999 | 40 (2.0%) | 232 (11.3%) |
| $15,000 to $19,999 | 36 (1.8%) | 163 (8.0%) |
| $20,000 to $24,999 | 25 (1.3%) | 213 (10.4%) |
| $25,000 to $34,999 | 162 (8.3%) | 362 (17.7%) |
| $35,000 to $49,999 | 249 (12.7%) | 238 (11.6%) |
| $50,000 to $74,999 | 503 (25.7%) | 325 (15.9%) |
| $75,000 to $99,999 | 339 (17.3%) | 134 (6.6%) |
| $100,000 to $149,999 | 363 (18.6%) | 106 (5.2%) |
| $150,000 or more | 213 (10.9%) | 0 (0.0%) |
| Total | 1,956 (100.0%) | 2,047 (100.0%) |
Monthly Housing Cost Tiers in Maryville
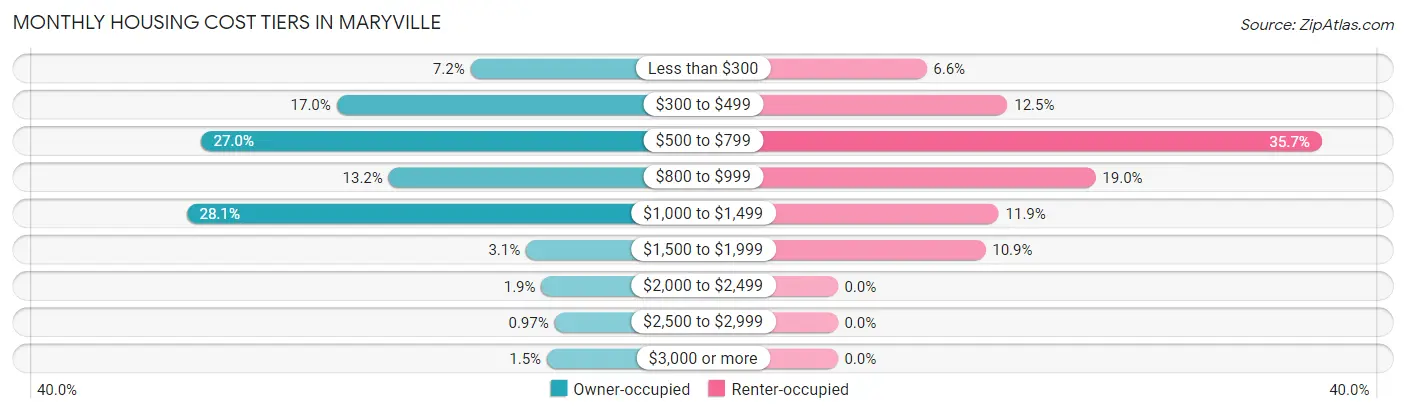
| Monthly Cost | Owner-occupied | Renter-occupied |
| Less than $300 | 140 (7.2%) | 134 (6.6%) |
| $300 to $499 | 333 (17.0%) | 256 (12.5%) |
| $500 to $799 | 529 (27.0%) | 730 (35.7%) |
| $800 to $999 | 258 (13.2%) | 389 (19.0%) |
| $1,000 to $1,499 | 549 (28.1%) | 243 (11.9%) |
| $1,500 to $1,999 | 60 (3.1%) | 223 (10.9%) |
| $2,000 to $2,499 | 38 (1.9%) | 0 (0.0%) |
| $2,500 to $2,999 | 19 (1.0%) | 0 (0.0%) |
| $3,000 or more | 30 (1.5%) | 0 (0.0%) |
| Total | 1,956 (100.0%) | 2,047 (100.0%) |
Physical Housing Characteristics in Maryville
Housing Structures in Maryville
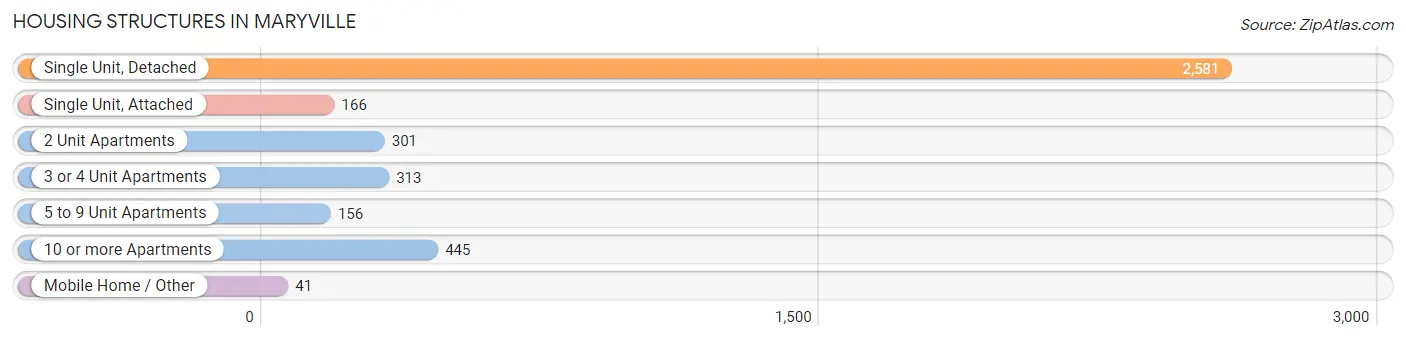
| Structure Type | # Housing Units | % Housing Units |
| Single Unit, Detached | 2,581 | 64.5% |
| Single Unit, Attached | 166 | 4.2% |
| 2 Unit Apartments | 301 | 7.5% |
| 3 or 4 Unit Apartments | 313 | 7.8% |
| 5 to 9 Unit Apartments | 156 | 3.9% |
| 10 or more Apartments | 445 | 11.1% |
| Mobile Home / Other | 41 | 1.0% |
| Total | 4,003 | 100.0% |
Housing Structures by Occupancy in Maryville
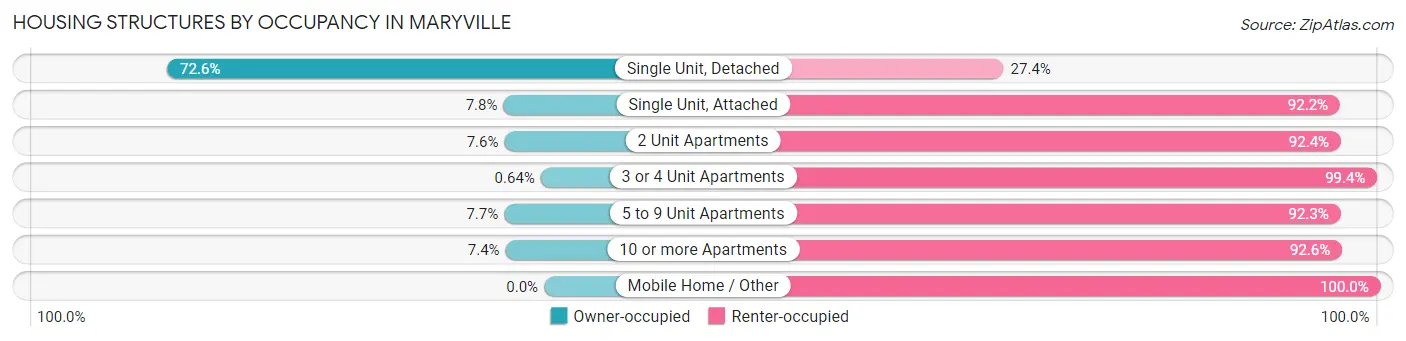
| Structure Type | Owner-occupied | Renter-occupied |
| Single Unit, Detached | 1,873 (72.6%) | 708 (27.4%) |
| Single Unit, Attached | 13 (7.8%) | 153 (92.2%) |
| 2 Unit Apartments | 23 (7.6%) | 278 (92.4%) |
| 3 or 4 Unit Apartments | 2 (0.6%) | 311 (99.4%) |
| 5 to 9 Unit Apartments | 12 (7.7%) | 144 (92.3%) |
| 10 or more Apartments | 33 (7.4%) | 412 (92.6%) |
| Mobile Home / Other | 0 (0.0%) | 41 (100.0%) |
| Total | 1,956 (48.9%) | 2,047 (51.1%) |
Housing Structures by Number of Rooms in Maryville
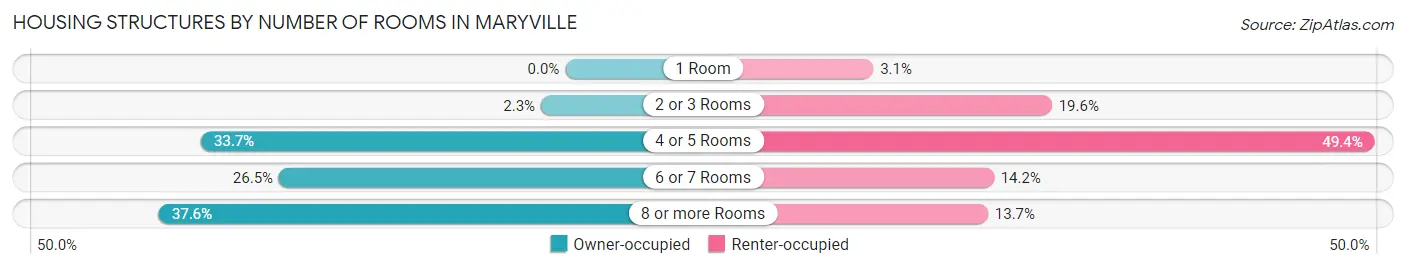
| Number of Rooms | Owner-occupied | Renter-occupied |
| 1 Room | 0 (0.0%) | 63 (3.1%) |
| 2 or 3 Rooms | 44 (2.2%) | 401 (19.6%) |
| 4 or 5 Rooms | 659 (33.7%) | 1,012 (49.4%) |
| 6 or 7 Rooms | 518 (26.5%) | 291 (14.2%) |
| 8 or more Rooms | 735 (37.6%) | 280 (13.7%) |
| Total | 1,956 (100.0%) | 2,047 (100.0%) |
Housing Structure by Heating Type in Maryville
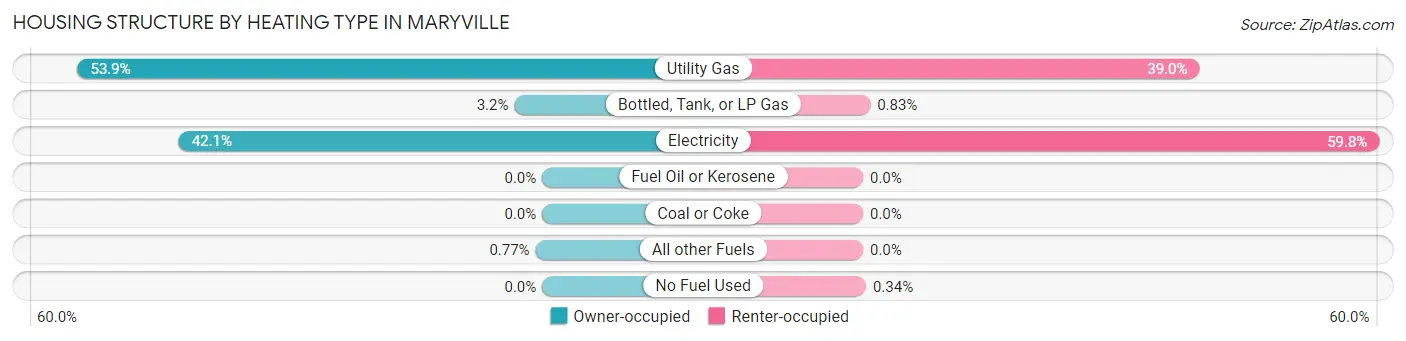
| Heating Type | Owner-occupied | Renter-occupied |
| Utility Gas | 1,054 (53.9%) | 798 (39.0%) |
| Bottled, Tank, or LP Gas | 63 (3.2%) | 17 (0.8%) |
| Electricity | 824 (42.1%) | 1,225 (59.8%) |
| Fuel Oil or Kerosene | 0 (0.0%) | 0 (0.0%) |
| Coal or Coke | 0 (0.0%) | 0 (0.0%) |
| All other Fuels | 15 (0.8%) | 0 (0.0%) |
| No Fuel Used | 0 (0.0%) | 7 (0.3%) |
| Total | 1,956 (100.0%) | 2,047 (100.0%) |
Household Vehicle Usage in Maryville
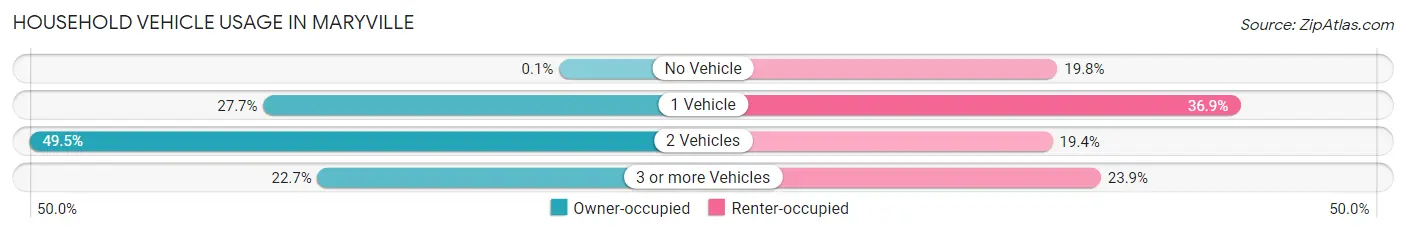
| Vehicles per Household | Owner-occupied | Renter-occupied |
| No Vehicle | 2 (0.1%) | 406 (19.8%) |
| 1 Vehicle | 542 (27.7%) | 755 (36.9%) |
| 2 Vehicles | 969 (49.5%) | 397 (19.4%) |
| 3 or more Vehicles | 443 (22.7%) | 489 (23.9%) |
| Total | 1,956 (100.0%) | 2,047 (100.0%) |
Real Estate & Mortgages in Maryville
Real Estate and Mortgage Overview in Maryville
| Characteristic | Without Mortgage | With Mortgage |
| Housing Units | 845 | 1,111 |
| Median Property Value | $193,800 | $152,500 |
| Median Household Income | $68,460 | $133 |
| Monthly Housing Costs | $482 | $30 |
| Real Estate Taxes | $1,729 | $0 |
Property Value by Mortgage Status in Maryville
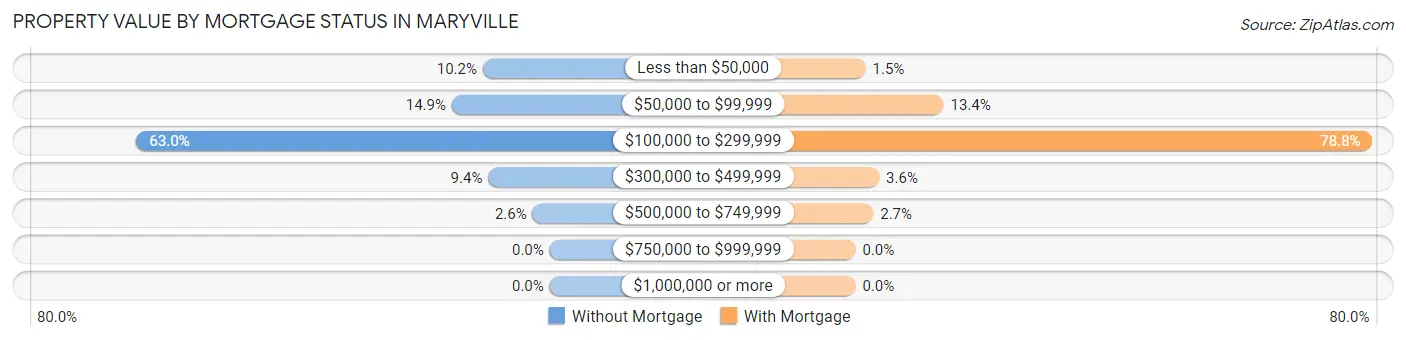
| Property Value | Without Mortgage | With Mortgage |
| Less than $50,000 | 86 (10.2%) | 17 (1.5%) |
| $50,000 to $99,999 | 126 (14.9%) | 149 (13.4%) |
| $100,000 to $299,999 | 532 (63.0%) | 875 (78.8%) |
| $300,000 to $499,999 | 79 (9.3%) | 40 (3.6%) |
| $500,000 to $749,999 | 22 (2.6%) | 30 (2.7%) |
| $750,000 to $999,999 | 0 (0.0%) | 0 (0.0%) |
| $1,000,000 or more | 0 (0.0%) | 0 (0.0%) |
| Total | 845 (100.0%) | 1,111 (100.0%) |
Household Income by Mortgage Status in Maryville
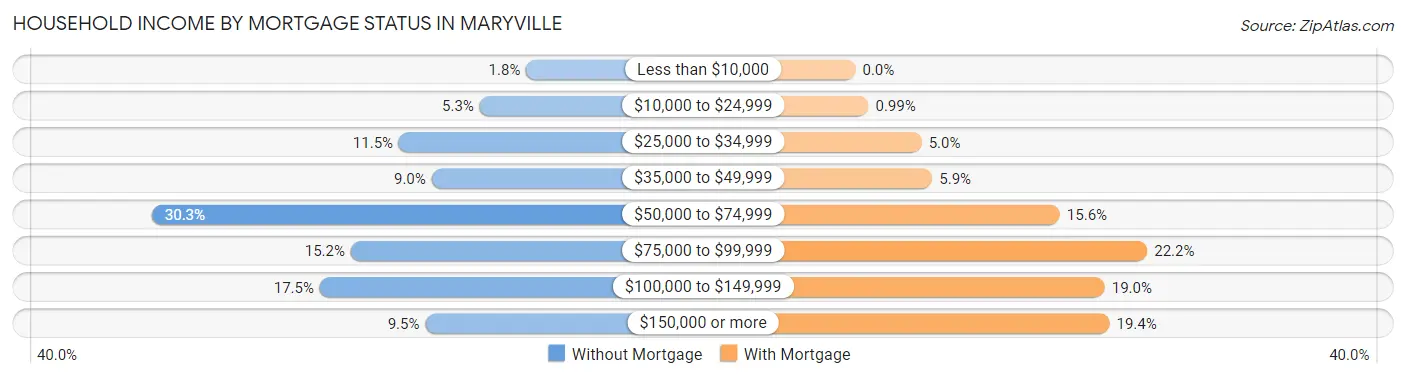
| Household Income | Without Mortgage | With Mortgage |
| Less than $10,000 | 15 (1.8%) | 0 (0.0%) |
| $10,000 to $24,999 | 45 (5.3%) | 11 (1.0%) |
| $25,000 to $34,999 | 97 (11.5%) | 56 (5.0%) |
| $35,000 to $49,999 | 76 (9.0%) | 65 (5.9%) |
| $50,000 to $74,999 | 256 (30.3%) | 173 (15.6%) |
| $75,000 to $99,999 | 128 (15.1%) | 247 (22.2%) |
| $100,000 to $149,999 | 148 (17.5%) | 211 (19.0%) |
| $150,000 or more | 80 (9.5%) | 215 (19.4%) |
| Total | 845 (100.0%) | 1,111 (100.0%) |
Property Value to Household Income Ratio in Maryville
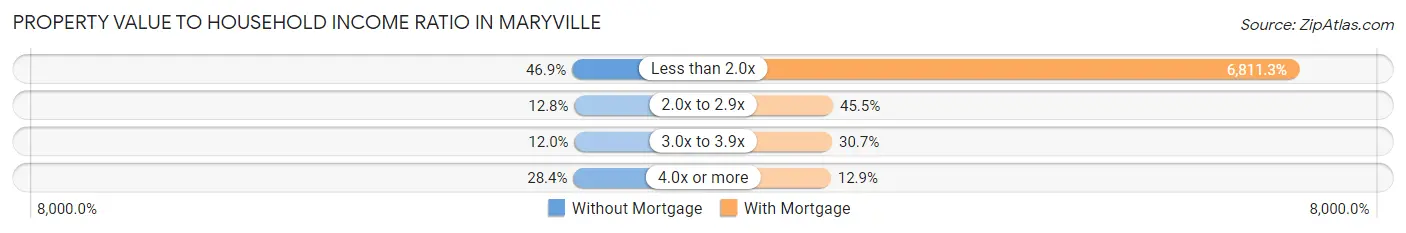
| Value-to-Income Ratio | Without Mortgage | With Mortgage |
| Less than 2.0x | 396 (46.9%) | 75,673 (6,811.2%) |
| 2.0x to 2.9x | 108 (12.8%) | 505 (45.5%) |
| 3.0x to 3.9x | 101 (11.9%) | 341 (30.7%) |
| 4.0x or more | 240 (28.4%) | 143 (12.9%) |
| Total | 845 (100.0%) | 1,111 (100.0%) |
Real Estate Taxes by Mortgage Status in Maryville
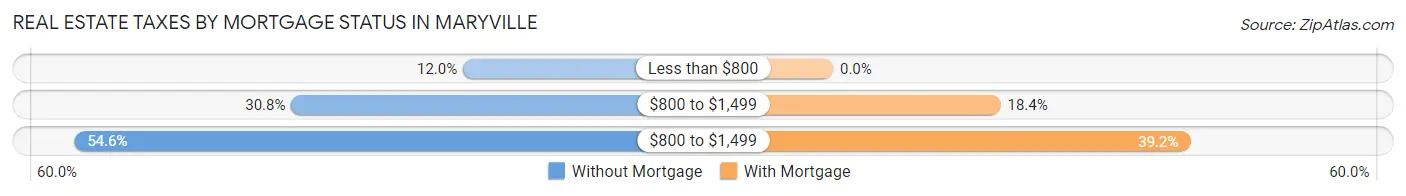
| Property Taxes | Without Mortgage | With Mortgage |
| Less than $800 | 101 (11.9%) | 0 (0.0%) |
| $800 to $1,499 | 260 (30.8%) | 204 (18.4%) |
| $800 to $1,499 | 461 (54.6%) | 435 (39.2%) |
| Total | 845 (100.0%) | 1,111 (100.0%) |
Health & Disability in Maryville
Health Insurance Coverage by Age in Maryville
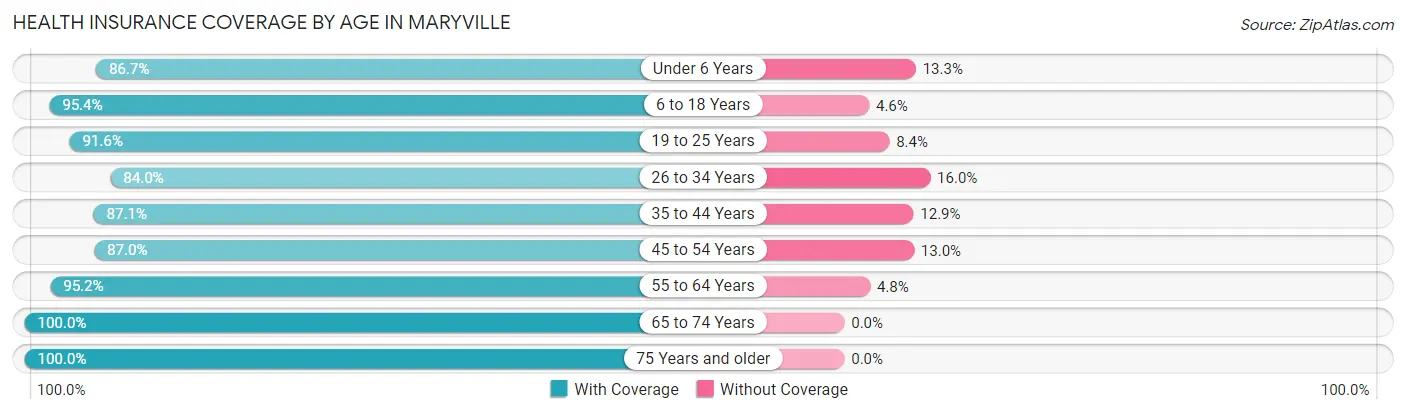
| Age Bracket | With Coverage | Without Coverage |
| Under 6 Years | 436 (86.7%) | 67 (13.3%) |
| 6 to 18 Years | 1,572 (95.4%) | 76 (4.6%) |
| 19 to 25 Years | 3,006 (91.6%) | 275 (8.4%) |
| 26 to 34 Years | 750 (84.0%) | 143 (16.0%) |
| 35 to 44 Years | 771 (87.1%) | 114 (12.9%) |
| 45 to 54 Years | 798 (87.0%) | 119 (13.0%) |
| 55 to 64 Years | 855 (95.2%) | 43 (4.8%) |
| 65 to 74 Years | 791 (100.0%) | 0 (0.0%) |
| 75 Years and older | 644 (100.0%) | 0 (0.0%) |
| Total | 9,623 (92.0%) | 837 (8.0%) |
Health Insurance Coverage by Citizenship Status in Maryville
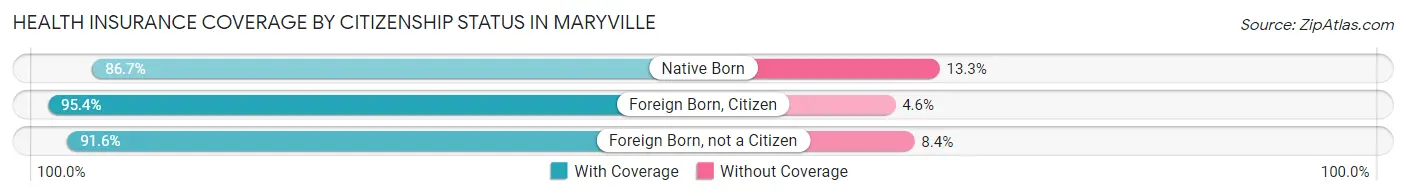
| Citizenship Status | With Coverage | Without Coverage |
| Native Born | 436 (86.7%) | 67 (13.3%) |
| Foreign Born, Citizen | 1,572 (95.4%) | 76 (4.6%) |
| Foreign Born, not a Citizen | 3,006 (91.6%) | 275 (8.4%) |
Health Insurance Coverage by Household Income in Maryville
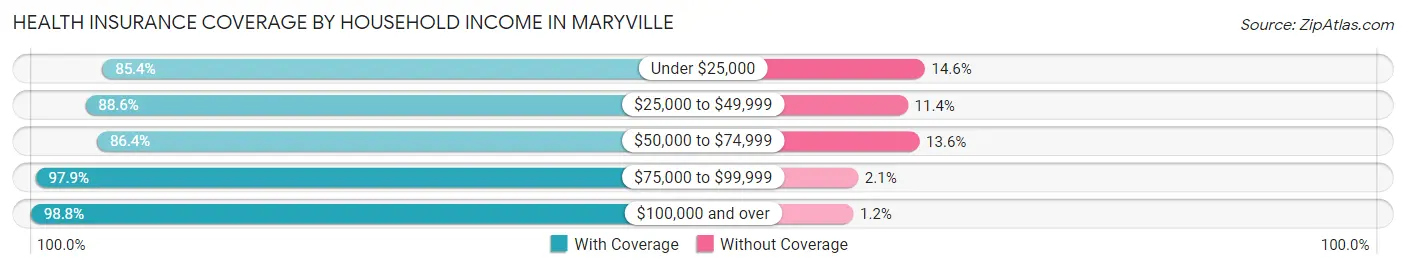
| Household Income | With Coverage | Without Coverage |
| Under $25,000 | 1,425 (85.4%) | 243 (14.6%) |
| $25,000 to $49,999 | 1,655 (88.6%) | 213 (11.4%) |
| $50,000 to $74,999 | 1,760 (86.4%) | 276 (13.6%) |
| $75,000 to $99,999 | 1,083 (97.9%) | 23 (2.1%) |
| $100,000 and over | 1,760 (98.8%) | 21 (1.2%) |
Public vs Private Health Insurance Coverage by Age in Maryville
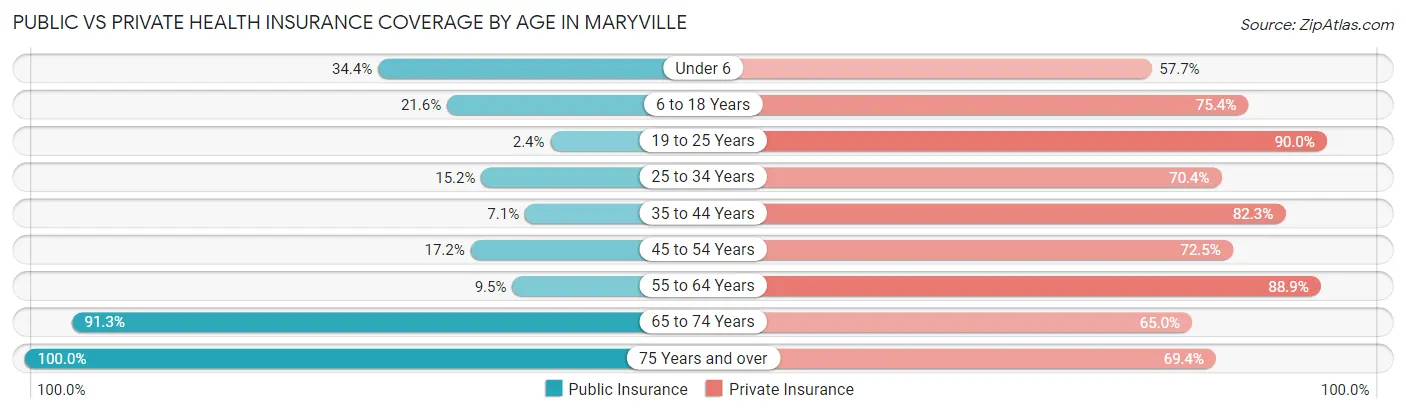
| Age Bracket | Public Insurance | Private Insurance |
| Under 6 | 173 (34.4%) | 290 (57.7%) |
| 6 to 18 Years | 356 (21.6%) | 1,243 (75.4%) |
| 19 to 25 Years | 79 (2.4%) | 2,953 (90.0%) |
| 25 to 34 Years | 136 (15.2%) | 629 (70.4%) |
| 35 to 44 Years | 63 (7.1%) | 728 (82.3%) |
| 45 to 54 Years | 158 (17.2%) | 665 (72.5%) |
| 55 to 64 Years | 85 (9.5%) | 798 (88.9%) |
| 65 to 74 Years | 722 (91.3%) | 514 (65.0%) |
| 75 Years and over | 644 (100.0%) | 447 (69.4%) |
| Total | 2,416 (23.1%) | 8,267 (79.0%) |
Disability Status by Sex by Age in Maryville
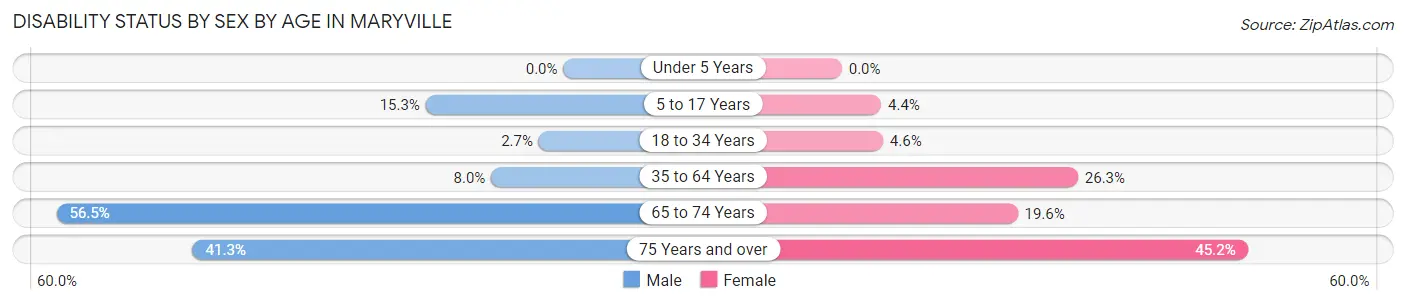
| Age Bracket | Male | Female |
| Under 5 Years | 0 (0.0%) | 0 (0.0%) |
| 5 to 17 Years | 61 (15.3%) | 23 (4.4%) |
| 18 to 34 Years | 61 (2.7%) | 124 (4.6%) |
| 35 to 64 Years | 103 (8.0%) | 373 (26.3%) |
| 65 to 74 Years | 210 (56.5%) | 82 (19.6%) |
| 75 Years and over | 116 (41.3%) | 164 (45.2%) |
Disability Class by Sex by Age in Maryville
Disability Class: Hearing Difficulty
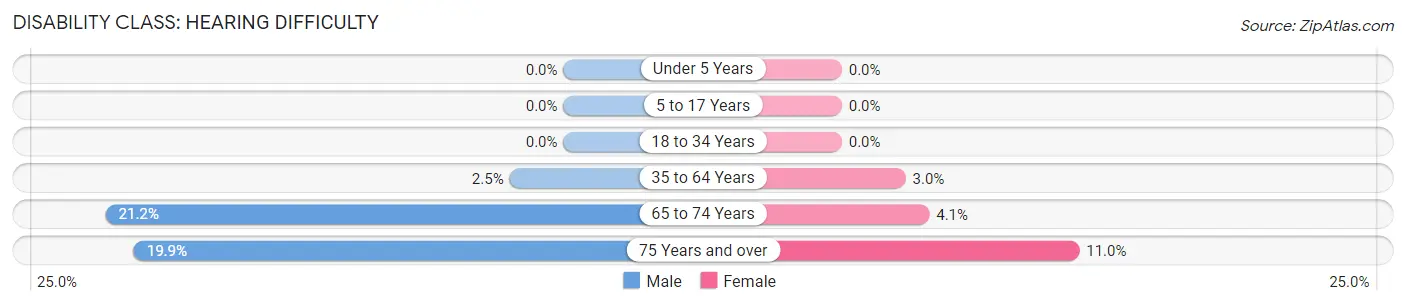
| Age Bracket | Male | Female |
| Under 5 Years | 0 (0.0%) | 0 (0.0%) |
| 5 to 17 Years | 0 (0.0%) | 0 (0.0%) |
| 18 to 34 Years | 0 (0.0%) | 0 (0.0%) |
| 35 to 64 Years | 32 (2.5%) | 42 (3.0%) |
| 65 to 74 Years | 79 (21.2%) | 17 (4.1%) |
| 75 Years and over | 56 (19.9%) | 40 (11.0%) |
Disability Class: Vision Difficulty
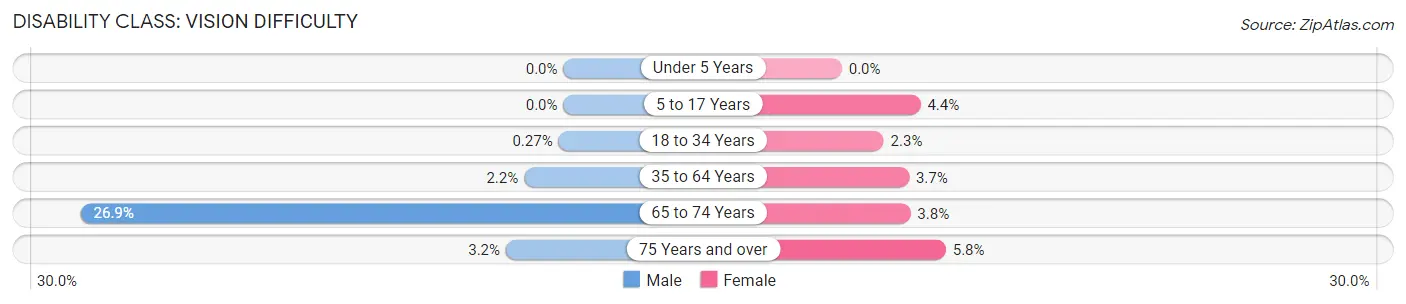
| Age Bracket | Male | Female |
| Under 5 Years | 0 (0.0%) | 0 (0.0%) |
| 5 to 17 Years | 0 (0.0%) | 23 (4.4%) |
| 18 to 34 Years | 6 (0.3%) | 63 (2.3%) |
| 35 to 64 Years | 28 (2.2%) | 53 (3.7%) |
| 65 to 74 Years | 100 (26.9%) | 16 (3.8%) |
| 75 Years and over | 9 (3.2%) | 21 (5.8%) |
Disability Class: Cognitive Difficulty
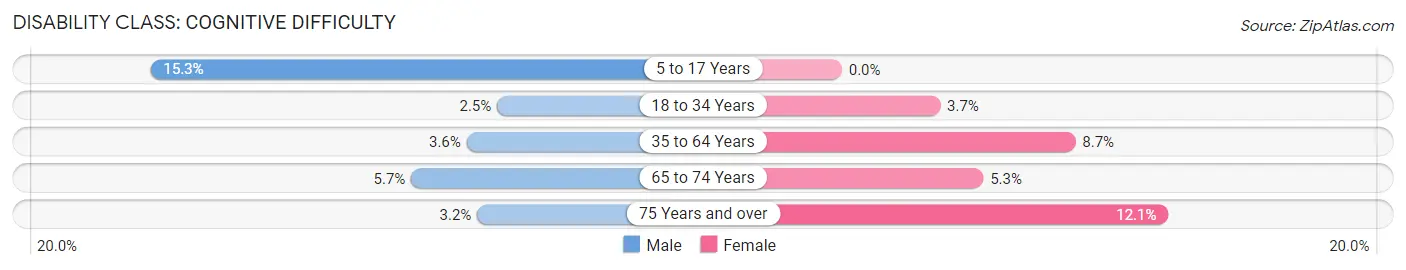
| Age Bracket | Male | Female |
| 5 to 17 Years | 61 (15.3%) | 0 (0.0%) |
| 18 to 34 Years | 55 (2.5%) | 99 (3.6%) |
| 35 to 64 Years | 46 (3.6%) | 123 (8.7%) |
| 65 to 74 Years | 21 (5.7%) | 22 (5.2%) |
| 75 Years and over | 9 (3.2%) | 44 (12.1%) |
Disability Class: Ambulatory Difficulty
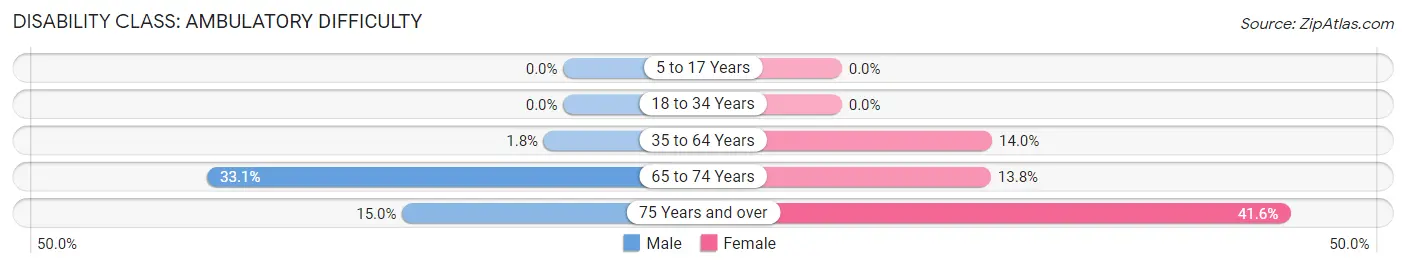
| Age Bracket | Male | Female |
| 5 to 17 Years | 0 (0.0%) | 0 (0.0%) |
| 18 to 34 Years | 0 (0.0%) | 0 (0.0%) |
| 35 to 64 Years | 23 (1.8%) | 198 (14.0%) |
| 65 to 74 Years | 123 (33.1%) | 58 (13.8%) |
| 75 Years and over | 42 (14.9%) | 151 (41.6%) |
Disability Class: Self-Care Difficulty
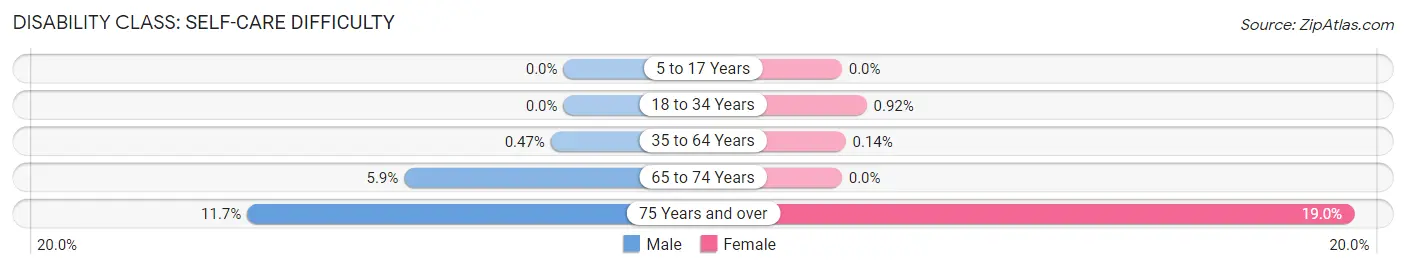
| Age Bracket | Male | Female |
| 5 to 17 Years | 0 (0.0%) | 0 (0.0%) |
| 18 to 34 Years | 0 (0.0%) | 25 (0.9%) |
| 35 to 64 Years | 6 (0.5%) | 2 (0.1%) |
| 65 to 74 Years | 22 (5.9%) | 0 (0.0%) |
| 75 Years and over | 33 (11.7%) | 69 (19.0%) |
Technology Access in Maryville
Computing Device Access in Maryville
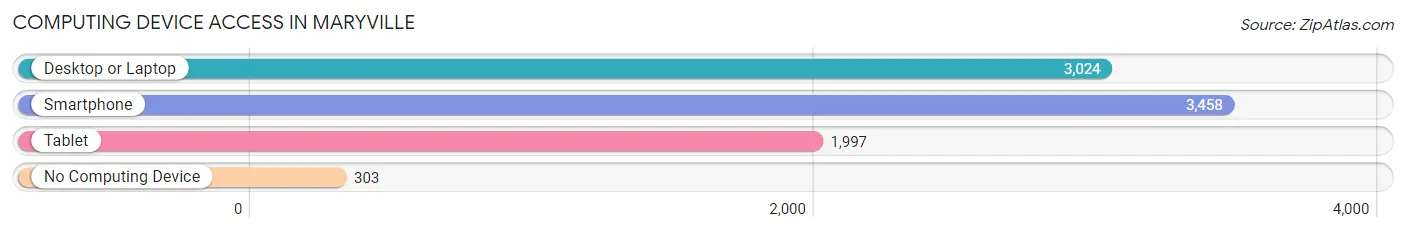
| Device Type | # Households | % Households |
| Desktop or Laptop | 3,024 | 75.5% |
| Smartphone | 3,458 | 86.4% |
| Tablet | 1,997 | 49.9% |
| No Computing Device | 303 | 7.6% |
| Total | 4,003 | 100.0% |
Internet Access in Maryville
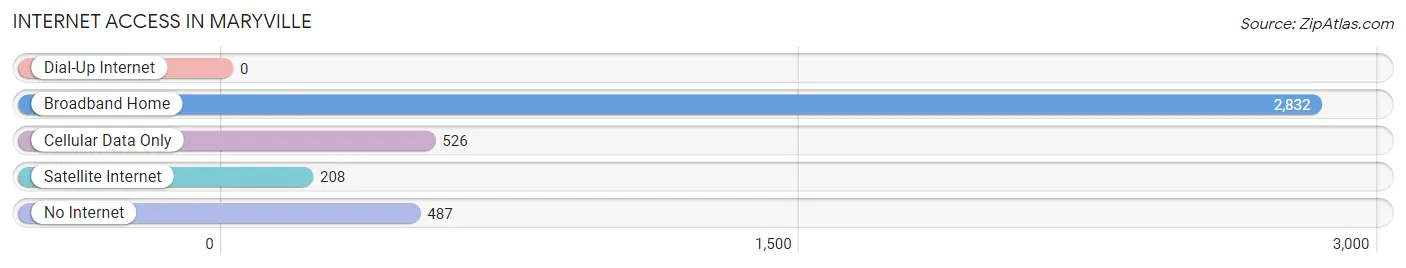
| Internet Type | # Households | % Households |
| Dial-Up Internet | 0 | 0.0% |
| Broadband Home | 2,832 | 70.8% |
| Cellular Data Only | 526 | 13.1% |
| Satellite Internet | 208 | 5.2% |
| No Internet | 487 | 12.2% |
| Total | 4,003 | 100.0% |
Maryville Summary
Maryville, Missouri is a small city located in the northwest corner of the state, in Nodaway County. It is the county seat and the largest city in the county. The city is located along the East Fork of the One Hundred and Two River, and is surrounded by rolling hills and farmland. The city has a population of 11,972, according to the 2010 census.
History
Maryville was founded in 1845 by settlers from Kentucky and Tennessee. The city was named after Mary Graham, the daughter of one of the original settlers. The city was incorporated in 1855 and was the first city in Nodaway County.
Maryville was an important stop on the Hannibal and St. Joseph Railroad, which connected the city to St. Joseph, Missouri. The railroad was completed in 1859 and was the first transcontinental railroad in the United States. The railroad brought economic growth to the city and helped to make it a regional center for commerce and industry.
Maryville was also an important stop on the Pony Express, which ran from St. Joseph to Sacramento, California. The Pony Express was in operation from 1860 to 1861 and was the first fast mail service in the United States.
Geography
Maryville is located in the northwest corner of Missouri, in Nodaway County. The city is located along the East Fork of the One Hundred and Two River, and is surrounded by rolling hills and farmland. The city has a total area of 8.3 square miles, of which 8.2 square miles is land and 0.1 square miles is water.
The climate in Maryville is humid continental, with hot, humid summers and cold, dry winters. The average temperature in July is 81°F and the average temperature in January is 24°F. The average annual precipitation is 36 inches.
Economy
The economy of Maryville is largely based on agriculture and manufacturing. The city is home to several large manufacturing companies, including ConAgra Foods, which produces food products, and Nodaway Valley Foods, which produces canned and frozen foods.
Maryville is also home to Northwest Missouri State University, which is a public university with an enrollment of over 6,000 students. The university is a major employer in the city and provides a significant economic impact to the local economy.
Demographics
According to the 2010 census, Maryville has a population of 11,972. The racial makeup of the city is 90.3% White, 4.2% African American, 0.7% Native American, 0.7% Asian, 0.1% Pacific Islander, 1.7% from other races, and 2.1% from two or more races. The median household income is $37,945 and the median family income is $45,945. The per capita income is $19,945.
Maryville is a small city with a rich history and a diverse economy. The city is home to a variety of industries, including manufacturing, agriculture, and higher education. The city has a population of 11,972, and is a great place to live and work.
Common Questions
What is Per Capita Income in Maryville?
Per Capita income in Maryville is $23,574.
What is the Median Family Income in Maryville?
Median Family Income in Maryville is $68,723.
What is the Median Household income in Maryville?
Median Household Income in Maryville is $49,144.
What is Income or Wage Gap in Maryville?
Income or Wage Gap in Maryville is 40.0%.
Women in Maryville earn 60.0 cents for every dollar earned by a man.
What is Inequality or Gini Index in Maryville?
Inequality or Gini Index in Maryville is 0.43.
What is the Total Population of Maryville?
Total Population of Maryville is 10,691.
What is the Total Male Population of Maryville?
Total Male Population of Maryville is 4,868.
What is the Total Female Population of Maryville?
Total Female Population of Maryville is 5,823.
What is the Ratio of Males per 100 Females in Maryville?
There are 83.60 Males per 100 Females in Maryville.
What is the Ratio of Females per 100 Males in Maryville?
There are 119.62 Females per 100 Males in Maryville.
What is the Median Population Age in Maryville?
Median Population Age in Maryville is 25.0 Years.
What is the Average Family Size in Maryville
Average Family Size in Maryville is 2.6 People.
What is the Average Household Size in Maryville
Average Household Size in Maryville is 2.1 People.
How Large is the Labor Force in Maryville?
There are 5,217 People in the Labor Forcein in Maryville.
What is the Percentage of People in the Labor Force in Maryville?
54.7% of People are in the Labor Force in Maryville.
What is the Unemployment Rate in Maryville?
Unemployment Rate in Maryville is 2.4%.