Marceline, MO Map & Demographics
Marceline Map
Marceline Overview
$26,767
PER CAPITA INCOME
$51,000
AVG FAMILY INCOME
$47,596
AVG HOUSEHOLD INCOME
26.2%
WAGE / INCOME GAP [ % ]
73.8¢/ $1
WAGE / INCOME GAP [ $ ]
0.46
INEQUALITY / GINI INDEX
2,190
TOTAL POPULATION
1,098
MALE POPULATION
1,092
FEMALE POPULATION
100.55
MALES / 100 FEMALES
99.45
FEMALES / 100 MALES
34.2
MEDIAN AGE
3.4
AVG FAMILY SIZE
2.7
AVG HOUSEHOLD SIZE
982
LABOR FORCE [ PEOPLE ]
61.1%
PERCENT IN LABOR FORCE
4.5%
UNEMPLOYMENT RATE
Marceline Zip Codes
Marceline Area Codes
Income in Marceline
Income Overview in Marceline
Per Capita Income in Marceline is $26,767, while median incomes of families and households are $51,000 and $47,596 respectively.
| Characteristic | Number | Measure |
| Per Capita Income | 2,190 | $26,767 |
| Median Family Income | 526 | $51,000 |
| Mean Family Income | 526 | $72,839 |
| Median Household Income | 813 | $47,596 |
| Mean Household Income | 813 | $65,917 |
| Income Deficit | 526 | $0 |
| Wage / Income Gap (%) | 2,190 | 26.23% |
| Wage / Income Gap ($) | 2,190 | 73.77¢ per $1 |
| Gini / Inequality Index | 2,190 | 0.46 |
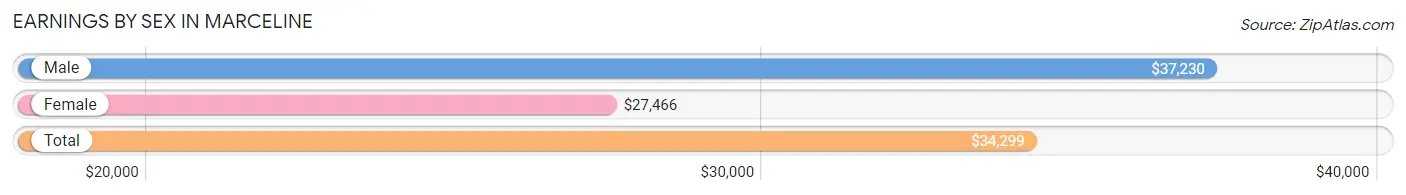
Earnings by Sex in Marceline
Average Earnings in Marceline are $34,299, $37,230 for men and $27,466 for women, a difference of 26.2%.
| Sex | Number | Average Earnings |
| Male | 550 (55.1%) | $37,230 |
| Female | 449 (44.9%) | $27,466 |
| Total | 999 (100.0%) | $34,299 |
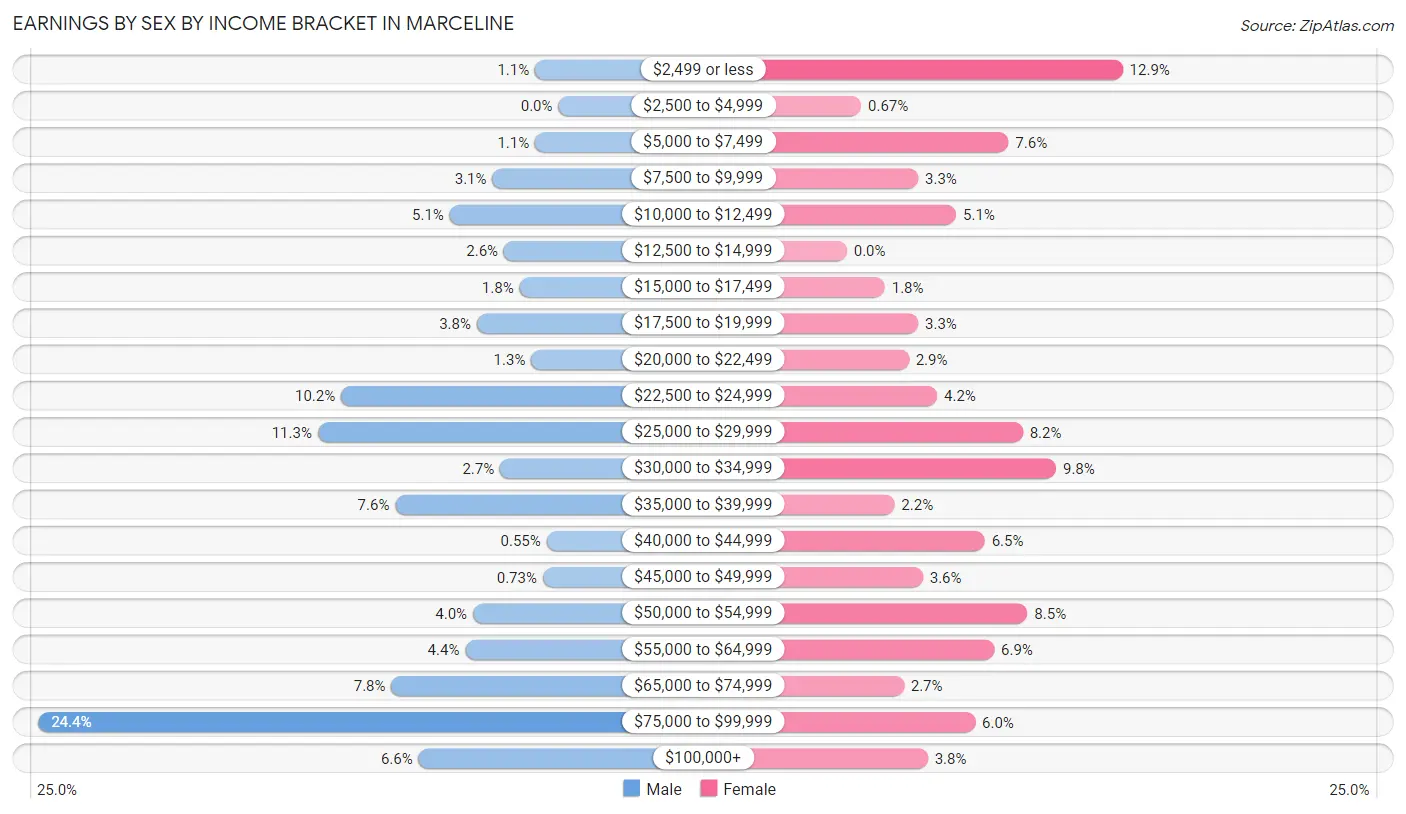
Earnings by Sex by Income Bracket in Marceline
The most common earnings brackets in Marceline are $75,000 to $99,999 for men (134 | 24.4%) and $2,499 or less for women (58 | 12.9%).
| Income | Male | Female |
| $2,499 or less | 6 (1.1%) | 58 (12.9%) |
| $2,500 to $4,999 | 0 (0.0%) | 3 (0.7%) |
| $5,000 to $7,499 | 6 (1.1%) | 34 (7.6%) |
| $7,500 to $9,999 | 17 (3.1%) | 15 (3.3%) |
| $10,000 to $12,499 | 28 (5.1%) | 23 (5.1%) |
| $12,500 to $14,999 | 14 (2.5%) | 0 (0.0%) |
| $15,000 to $17,499 | 10 (1.8%) | 8 (1.8%) |
| $17,500 to $19,999 | 21 (3.8%) | 15 (3.3%) |
| $20,000 to $22,499 | 7 (1.3%) | 13 (2.9%) |
| $22,500 to $24,999 | 56 (10.2%) | 19 (4.2%) |
| $25,000 to $29,999 | 62 (11.3%) | 37 (8.2%) |
| $30,000 to $34,999 | 15 (2.7%) | 44 (9.8%) |
| $35,000 to $39,999 | 42 (7.6%) | 10 (2.2%) |
| $40,000 to $44,999 | 3 (0.5%) | 29 (6.5%) |
| $45,000 to $49,999 | 4 (0.7%) | 16 (3.6%) |
| $50,000 to $54,999 | 22 (4.0%) | 38 (8.5%) |
| $55,000 to $64,999 | 24 (4.4%) | 31 (6.9%) |
| $65,000 to $74,999 | 43 (7.8%) | 12 (2.7%) |
| $75,000 to $99,999 | 134 (24.4%) | 27 (6.0%) |
| $100,000+ | 36 (6.6%) | 17 (3.8%) |
| Total | 550 (100.0%) | 449 (100.0%) |
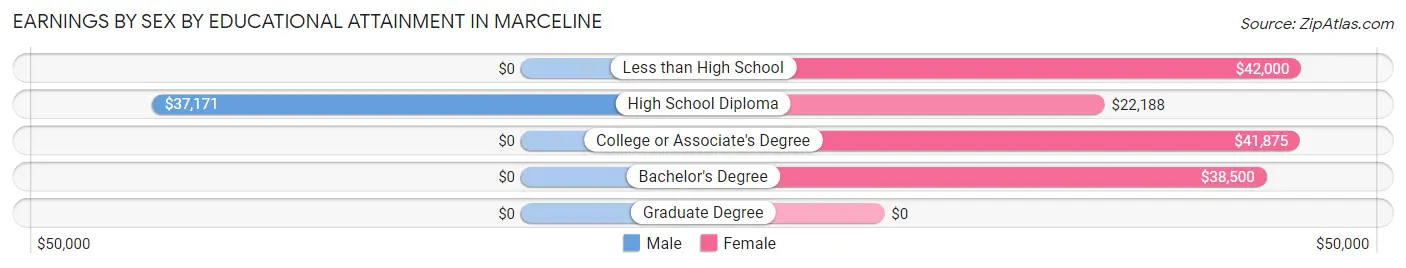
Earnings by Sex by Educational Attainment in Marceline
Average earnings in Marceline are $45,313 for men and $33,276 for women, a difference of 26.6%. Men with an educational attainment of high school diploma enjoy the highest average annual earnings of $37,171, while those with high school diploma education earn the least with $37,171. Women with an educational attainment of less than high school earn the most with the average annual earnings of $42,000, while those with high school diploma education have the smallest earnings of $22,188.
| Educational Attainment | Male Income | Female Income |
| Less than High School | - | - |
| High School Diploma | $37,171 | $22,188 |
| College or Associate's Degree | - | - |
| Bachelor's Degree | - | - |
| Graduate Degree | - | - |
| Total | $45,313 | $33,276 |
Family Income in Marceline
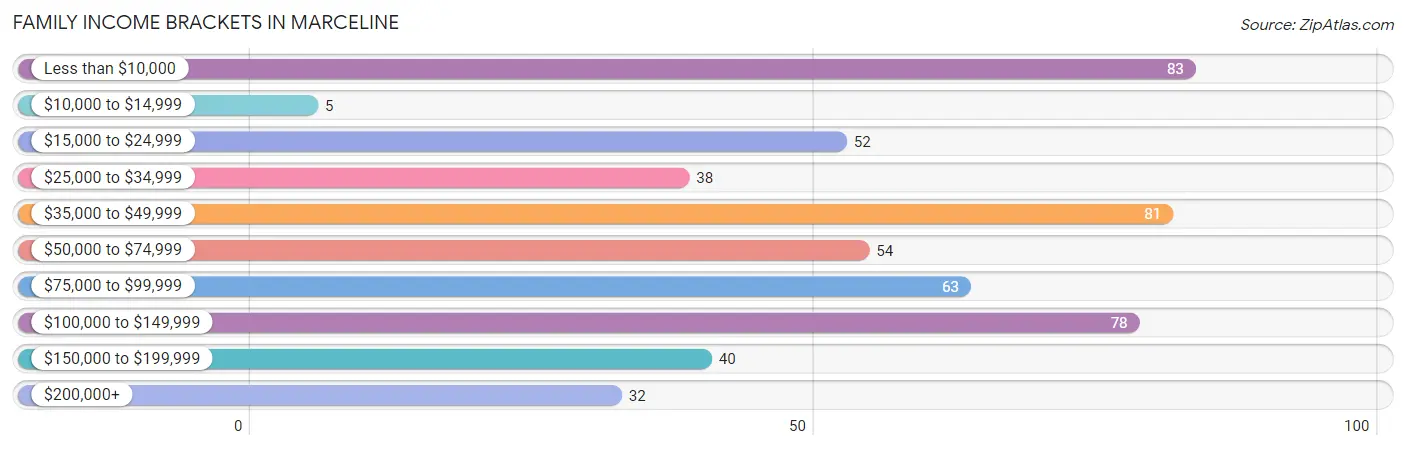
Family Income Brackets in Marceline
According to the Marceline family income data, there are 83 families falling into the less than $10,000 income range, which is the most common income bracket and makes up 15.8% of all families. Conversely, the $10,000 to $14,999 income bracket is the least frequent group with only 5 families (0.9%) belonging to this category.
| Income Bracket | # Families | % Families |
| Less than $10,000 | 83 | 15.8% |
| $10,000 to $14,999 | 5 | 1.0% |
| $15,000 to $24,999 | 52 | 9.9% |
| $25,000 to $34,999 | 38 | 7.2% |
| $35,000 to $49,999 | 81 | 15.4% |
| $50,000 to $74,999 | 54 | 10.3% |
| $75,000 to $99,999 | 63 | 12.0% |
| $100,000 to $149,999 | 78 | 14.8% |
| $150,000 to $199,999 | 40 | 7.6% |
| $200,000+ | 32 | 6.1% |
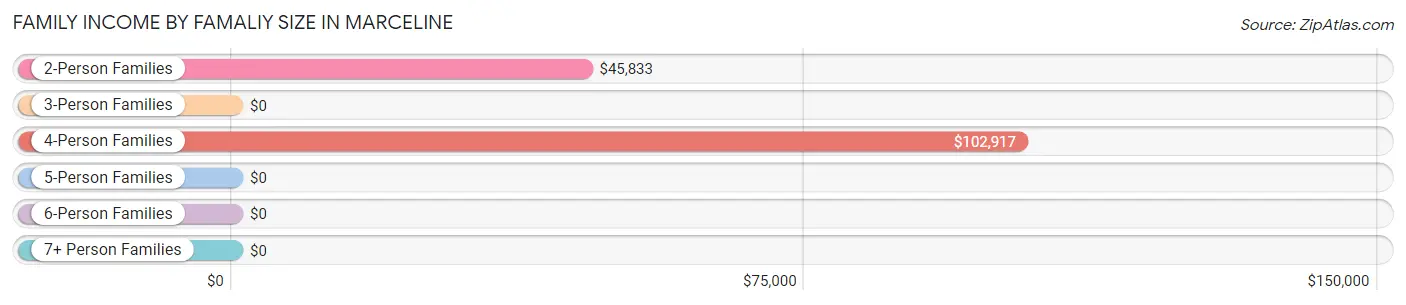
Family Income by Famaliy Size in Marceline
4-person families (120 | 22.8%) account for the highest median family income in Marceline with $102,917 per family, while 4-person families (120 | 22.8%) have the highest median income of $25,729 per family member.
| Income Bracket | # Families | Median Income |
| 2-Person Families | 230 (43.7%) | $45,833 |
| 3-Person Families | 61 (11.6%) | $0 |
| 4-Person Families | 120 (22.8%) | $102,917 |
| 5-Person Families | 92 (17.5%) | $0 |
| 6-Person Families | 23 (4.4%) | $0 |
| 7+ Person Families | 0 (0.0%) | $0 |
| Total | 526 (100.0%) | $51,000 |
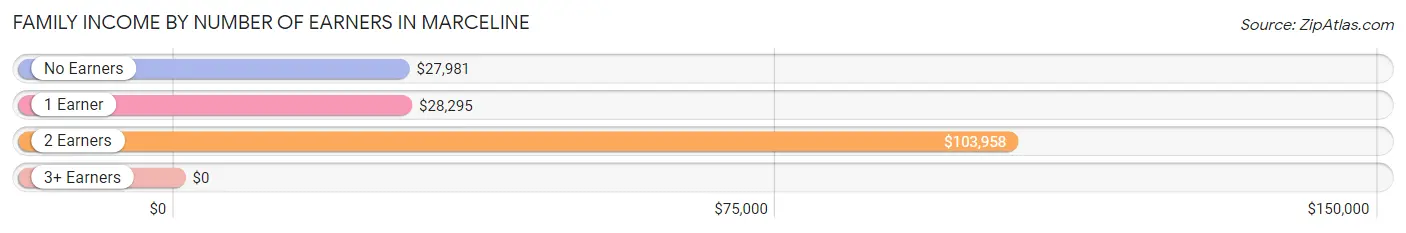
Family Income by Number of Earners in Marceline
| Number of Earners | # Families | Median Income |
| No Earners | 107 (20.3%) | $27,981 |
| 1 Earner | 199 (37.8%) | $28,295 |
| 2 Earners | 190 (36.1%) | $103,958 |
| 3+ Earners | 30 (5.7%) | $0 |
| Total | 526 (100.0%) | $51,000 |
Household Income in Marceline
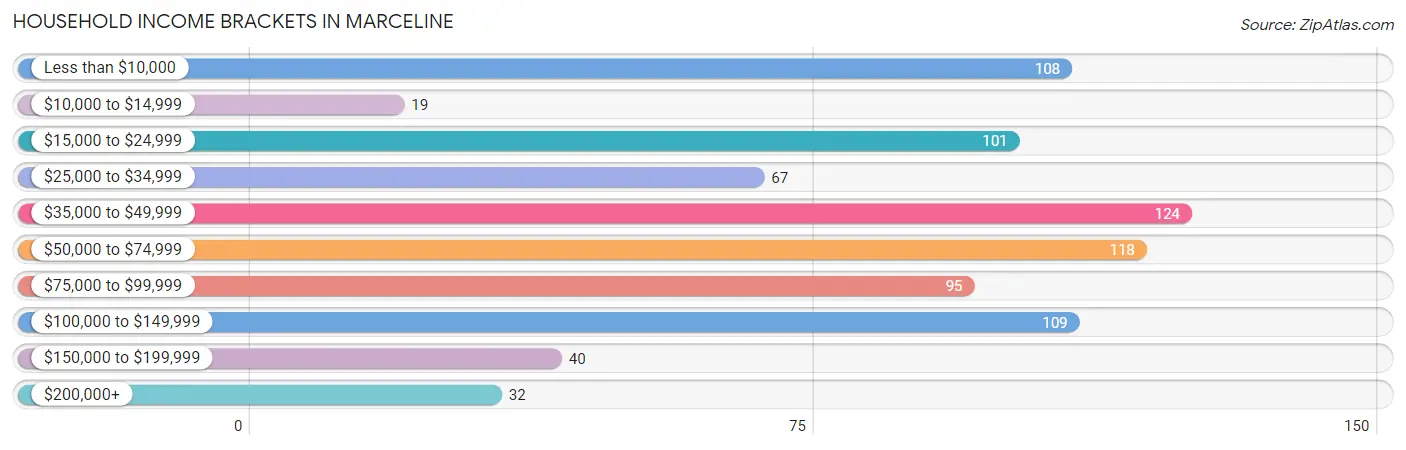
Household Income Brackets in Marceline
With 124 households falling in the category, the $35,000 to $49,999 income range is the most frequent in Marceline, accounting for 15.2% of all households. In contrast, only 19 households (2.3%) fall into the $10,000 to $14,999 income bracket, making it the least populous group.
| Income Bracket | # Households | % Households |
| Less than $10,000 | 108 | 13.3% |
| $10,000 to $14,999 | 19 | 2.3% |
| $15,000 to $24,999 | 101 | 12.4% |
| $25,000 to $34,999 | 67 | 8.2% |
| $35,000 to $49,999 | 124 | 15.3% |
| $50,000 to $74,999 | 118 | 14.5% |
| $75,000 to $99,999 | 95 | 11.7% |
| $100,000 to $149,999 | 109 | 13.4% |
| $150,000 to $199,999 | 40 | 4.9% |
| $200,000+ | 32 | 3.9% |
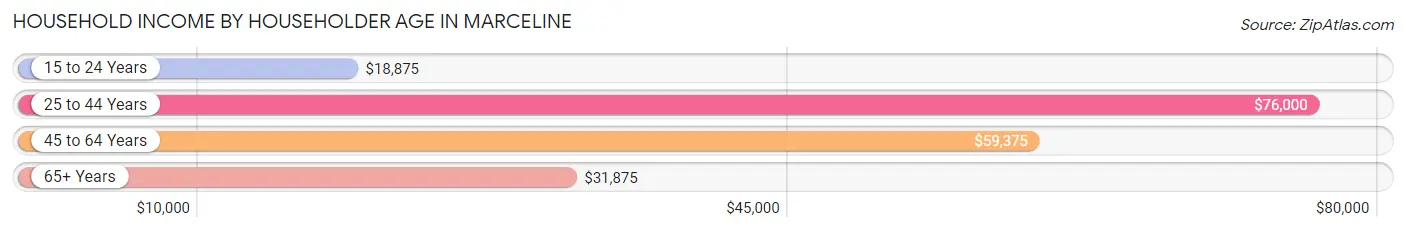
Household Income by Householder Age in Marceline
The median household income in Marceline is $47,596, with the highest median household income of $76,000 found in the 25 to 44 years age bracket for the primary householder. A total of 208 households (25.6%) fall into this category. Meanwhile, the 15 to 24 years age bracket for the primary householder has the lowest median household income of $18,875, with 49 households (6.0%) in this group.
| Income Bracket | # Households | Median Income |
| 15 to 24 Years | 49 (6.0%) | $18,875 |
| 25 to 44 Years | 208 (25.6%) | $76,000 |
| 45 to 64 Years | 319 (39.2%) | $59,375 |
| 65+ Years | 237 (29.1%) | $31,875 |
| Total | 813 (100.0%) | $47,596 |
Poverty in Marceline
Income Below Poverty by Sex and Age in Marceline
With 20.0% poverty level for males and 27.9% for females among the residents of Marceline, 5 year old males and under 5 year old females are the most vulnerable to poverty, with 15 males (62.5%) and 53 females (81.5%) in their respective age groups living below the poverty level.
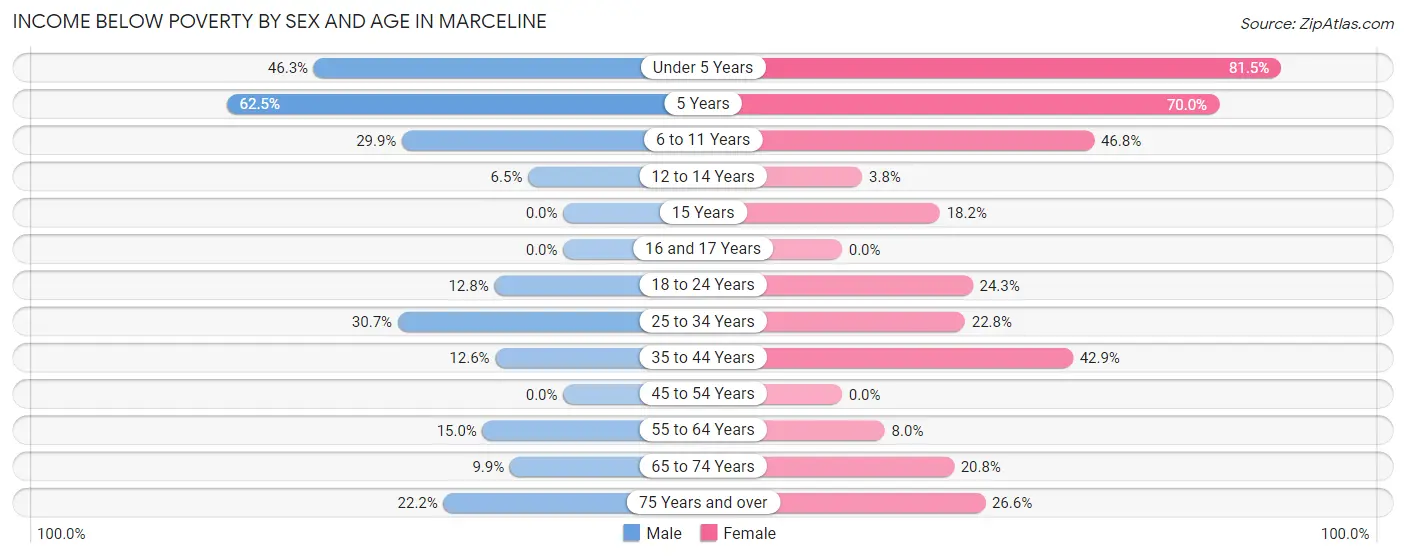
| Age Bracket | Male | Female |
| Under 5 Years | 50 (46.3%) | 53 (81.5%) |
| 5 Years | 15 (62.5%) | 35 (70.0%) |
| 6 to 11 Years | 35 (29.9%) | 44 (46.8%) |
| 12 to 14 Years | 3 (6.5%) | 2 (3.8%) |
| 15 Years | 0 (0.0%) | 2 (18.2%) |
| 16 and 17 Years | 0 (0.0%) | 0 (0.0%) |
| 18 to 24 Years | 17 (12.8%) | 25 (24.3%) |
| 25 to 34 Years | 39 (30.7%) | 29 (22.8%) |
| 35 to 44 Years | 14 (12.6%) | 57 (42.9%) |
| 45 to 54 Years | 0 (0.0%) | 0 (0.0%) |
| 55 to 64 Years | 25 (15.0%) | 9 (8.0%) |
| 65 to 74 Years | 9 (9.9%) | 27 (20.8%) |
| 75 Years and over | 12 (22.2%) | 21 (26.6%) |
| Total | 219 (20.0%) | 304 (27.9%) |
Income Above Poverty by Sex and Age in Marceline
According to the poverty statistics in Marceline, males aged 15 years and females aged 16 and 17 years are the age groups that are most secure financially, with 100.0% of males and 100.0% of females in these age groups living above the poverty line.
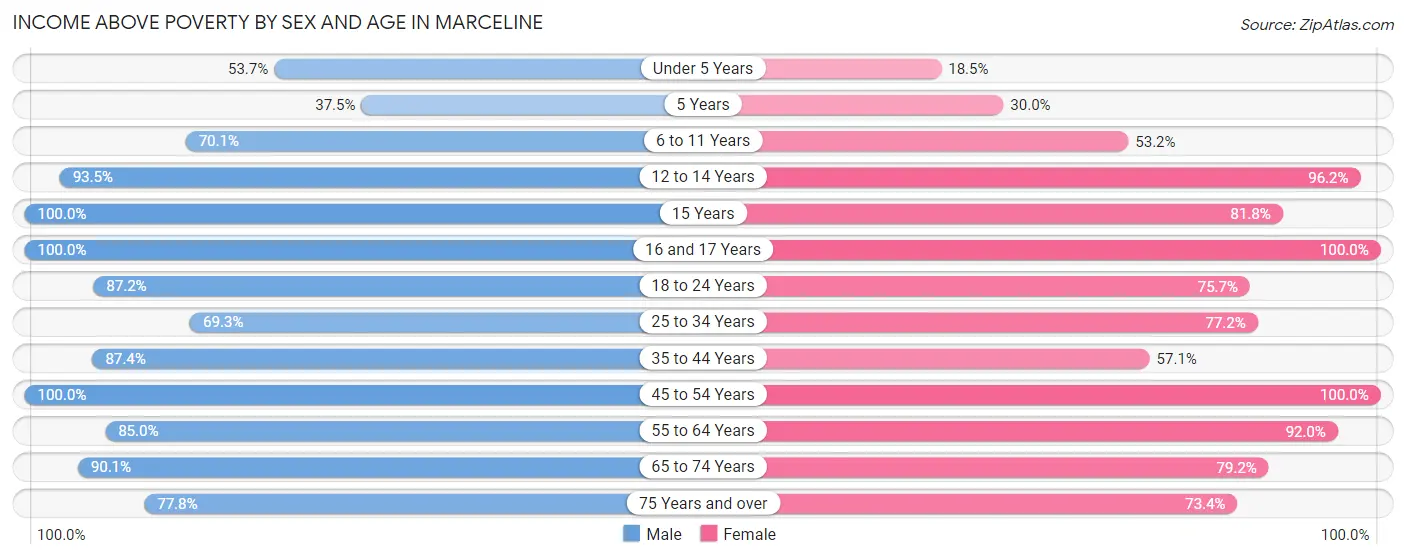
| Age Bracket | Male | Female |
| Under 5 Years | 58 (53.7%) | 12 (18.5%) |
| 5 Years | 9 (37.5%) | 15 (30.0%) |
| 6 to 11 Years | 82 (70.1%) | 50 (53.2%) |
| 12 to 14 Years | 43 (93.5%) | 51 (96.2%) |
| 15 Years | 11 (100.0%) | 9 (81.8%) |
| 16 and 17 Years | 20 (100.0%) | 13 (100.0%) |
| 18 to 24 Years | 116 (87.2%) | 78 (75.7%) |
| 25 to 34 Years | 88 (69.3%) | 98 (77.2%) |
| 35 to 44 Years | 97 (87.4%) | 76 (57.1%) |
| 45 to 54 Years | 89 (100.0%) | 118 (100.0%) |
| 55 to 64 Years | 142 (85.0%) | 104 (92.0%) |
| 65 to 74 Years | 82 (90.1%) | 103 (79.2%) |
| 75 Years and over | 42 (77.8%) | 58 (73.4%) |
| Total | 879 (80.0%) | 785 (72.1%) |
Income Below Poverty Among Married-Couple Families in Marceline
The poverty statistics for married-couple families in Marceline show that 10.4% or 37 of the total 354 families live below the poverty line. Families with 3 or 4 children have the highest poverty rate of 25.5%, comprising of 14 families. On the other hand, families with 1 or 2 children have the lowest poverty rate of 4.8%, which includes 5 families.
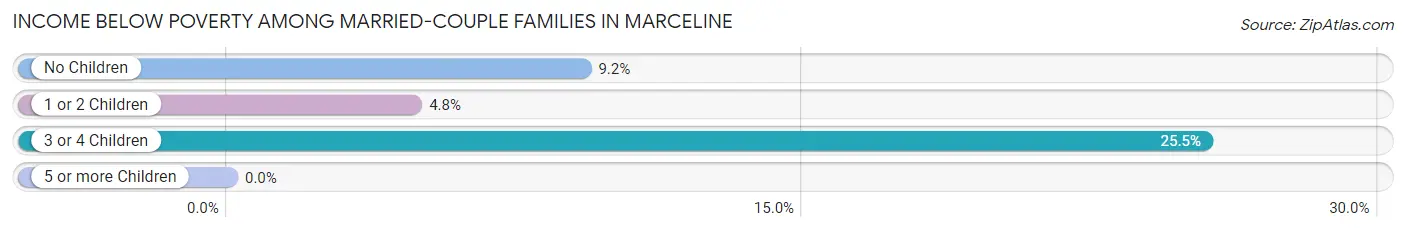
| Children | Above Poverty | Below Poverty |
| No Children | 177 (90.8%) | 18 (9.2%) |
| 1 or 2 Children | 99 (95.2%) | 5 (4.8%) |
| 3 or 4 Children | 41 (74.6%) | 14 (25.5%) |
| 5 or more Children | 0 (0.0%) | 0 (0.0%) |
| Total | 317 (89.5%) | 37 (10.4%) |
Income Below Poverty Among Single-Parent Households in Marceline
According to the poverty data in Marceline, 21.6% or 11 single-father households and 60.3% or 73 single-mother households are living below the poverty line. Among single-father households, those with 3 or 4 children have the highest poverty rate, with 11 households (45.8%) experiencing poverty. Likewise, among single-mother households, those with 3 or 4 children have the highest poverty rate, with 31 households (81.6%) falling below the poverty line.
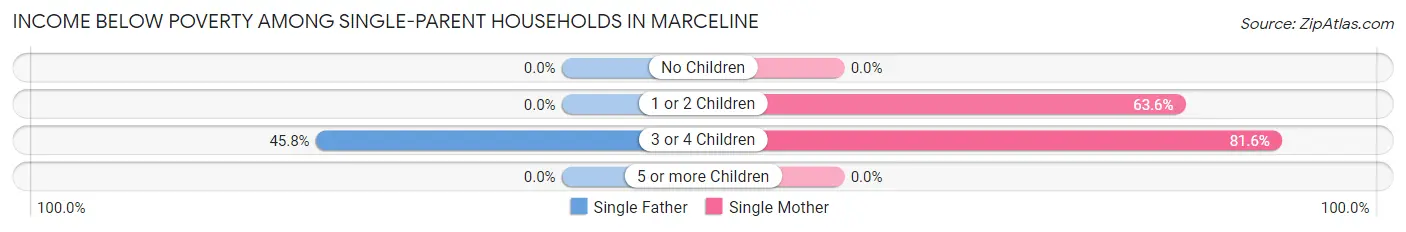
| Children | Single Father | Single Mother |
| No Children | 0 (0.0%) | 0 (0.0%) |
| 1 or 2 Children | 0 (0.0%) | 42 (63.6%) |
| 3 or 4 Children | 11 (45.8%) | 31 (81.6%) |
| 5 or more Children | 0 (0.0%) | 0 (0.0%) |
| Total | 11 (21.6%) | 73 (60.3%) |
Income Below Poverty Among Married-Couple vs Single-Parent Households in Marceline
The poverty data for Marceline shows that 37 of the married-couple family households (10.4%) and 84 of the single-parent households (48.8%) are living below the poverty level. Within the married-couple family households, those with 3 or 4 children have the highest poverty rate, with 14 households (25.5%) falling below the poverty line. Among the single-parent households, those with 3 or 4 children have the highest poverty rate, with 42 household (67.7%) living below poverty.
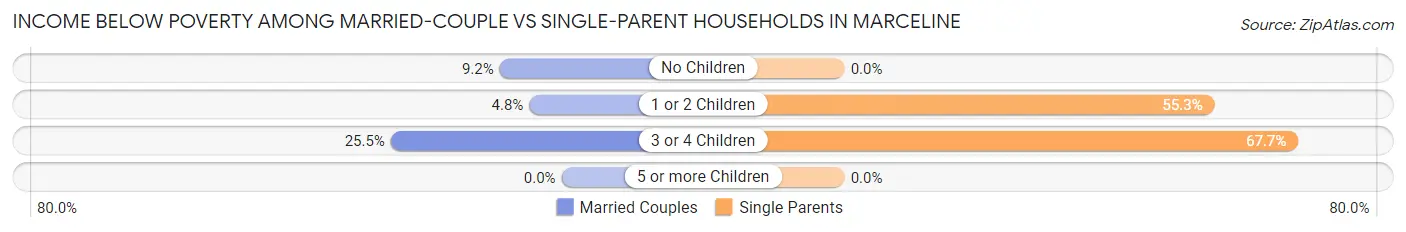
| Children | Married-Couple Families | Single-Parent Households |
| No Children | 18 (9.2%) | 0 (0.0%) |
| 1 or 2 Children | 5 (4.8%) | 42 (55.3%) |
| 3 or 4 Children | 14 (25.5%) | 42 (67.7%) |
| 5 or more Children | 0 (0.0%) | 0 (0.0%) |
| Total | 37 (10.4%) | 84 (48.8%) |
Race in Marceline
The most populous races in Marceline are White / Caucasian (2,055 | 93.8%), Hispanic or Latino (135 | 6.2%), and Two or more Races (108 | 4.9%).
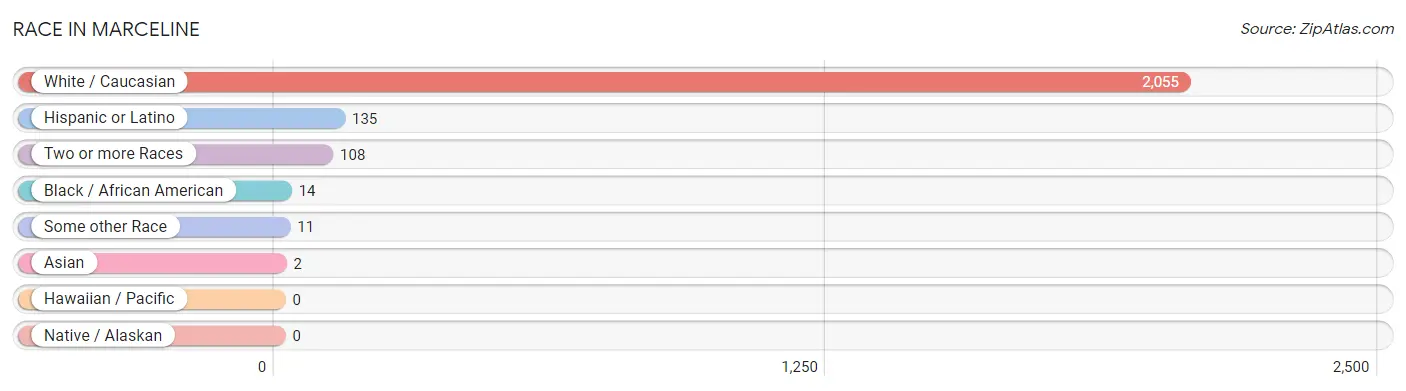
| Race | # Population | % Population |
| Asian | 2 | 0.1% |
| Black / African American | 14 | 0.6% |
| Hawaiian / Pacific | 0 | 0.0% |
| Hispanic or Latino | 135 | 6.2% |
| Native / Alaskan | 0 | 0.0% |
| White / Caucasian | 2,055 | 93.8% |
| Two or more Races | 108 | 4.9% |
| Some other Race | 11 | 0.5% |
| Total | 2,190 | 100.0% |
Ancestry in Marceline
The most populous ancestries reported in Marceline are German (305 | 13.9%), American (192 | 8.8%), Irish (174 | 8.0%), English (139 | 6.4%), and Mexican (110 | 5.0%), together accounting for 42.0% of all Marceline residents.
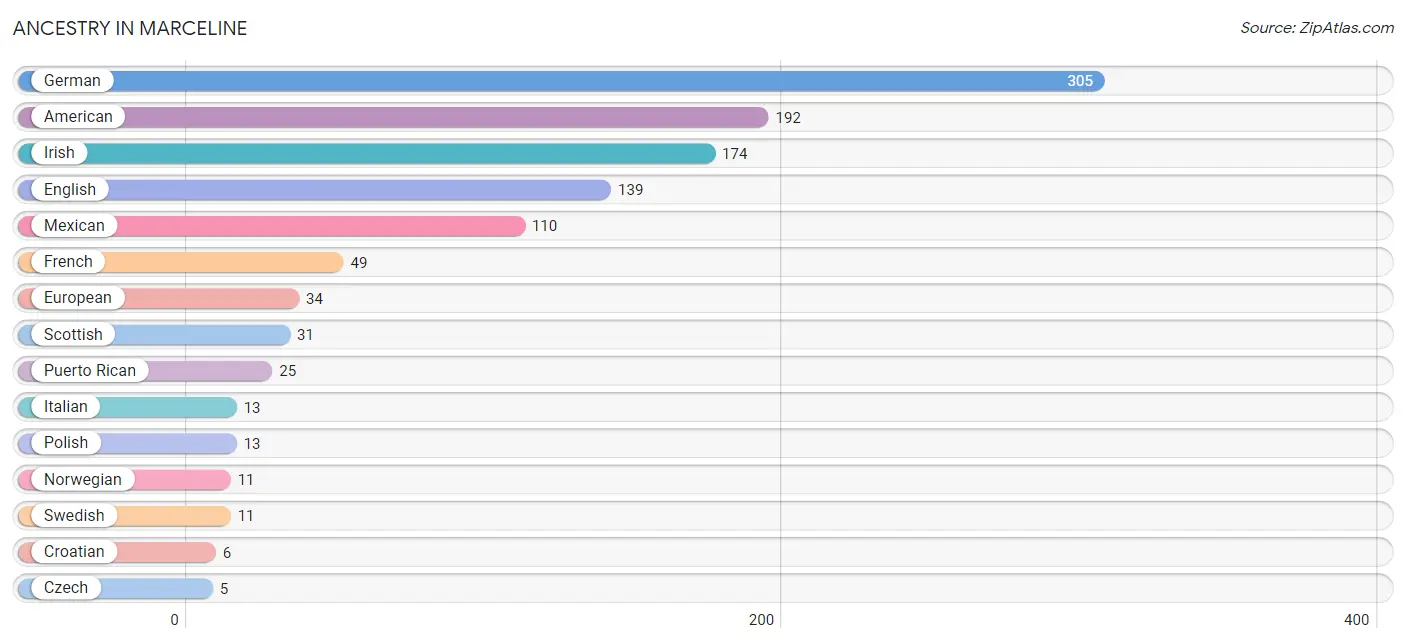
| Ancestry | # Population | % Population |
| American | 192 | 8.8% |
| Croatian | 6 | 0.3% |
| Czech | 5 | 0.2% |
| Czechoslovakian | 5 | 0.2% |
| English | 139 | 6.4% |
| European | 34 | 1.5% |
| French | 49 | 2.2% |
| German | 305 | 13.9% |
| Irish | 174 | 8.0% |
| Italian | 13 | 0.6% |
| Mexican | 110 | 5.0% |
| Native Hawaiian | 2 | 0.1% |
| Norwegian | 11 | 0.5% |
| Polish | 13 | 0.6% |
| Puerto Rican | 25 | 1.1% |
| Scotch-Irish | 3 | 0.1% |
| Scottish | 31 | 1.4% |
| Sri Lankan | 2 | 0.1% |
| Swedish | 11 | 0.5% |
| Swiss | 3 | 0.1% | View All 20 Rows |
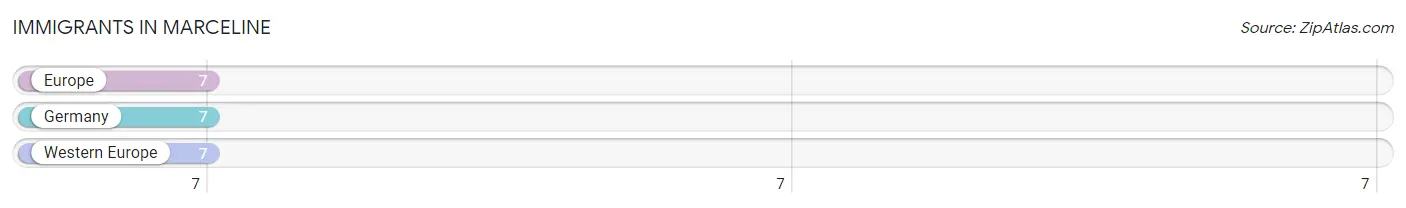
Immigrants in Marceline
The most numerous immigrant groups reported in Marceline came from Europe (7 | 0.3%), Germany (7 | 0.3%), and Western Europe (7 | 0.3%), together accounting for 1.0% of all Marceline residents.
| Immigration Origin | # Population | % Population |
| Europe | 7 | 0.3% |
| Germany | 7 | 0.3% |
| Western Europe | 7 | 0.3% | View All 3 Rows |
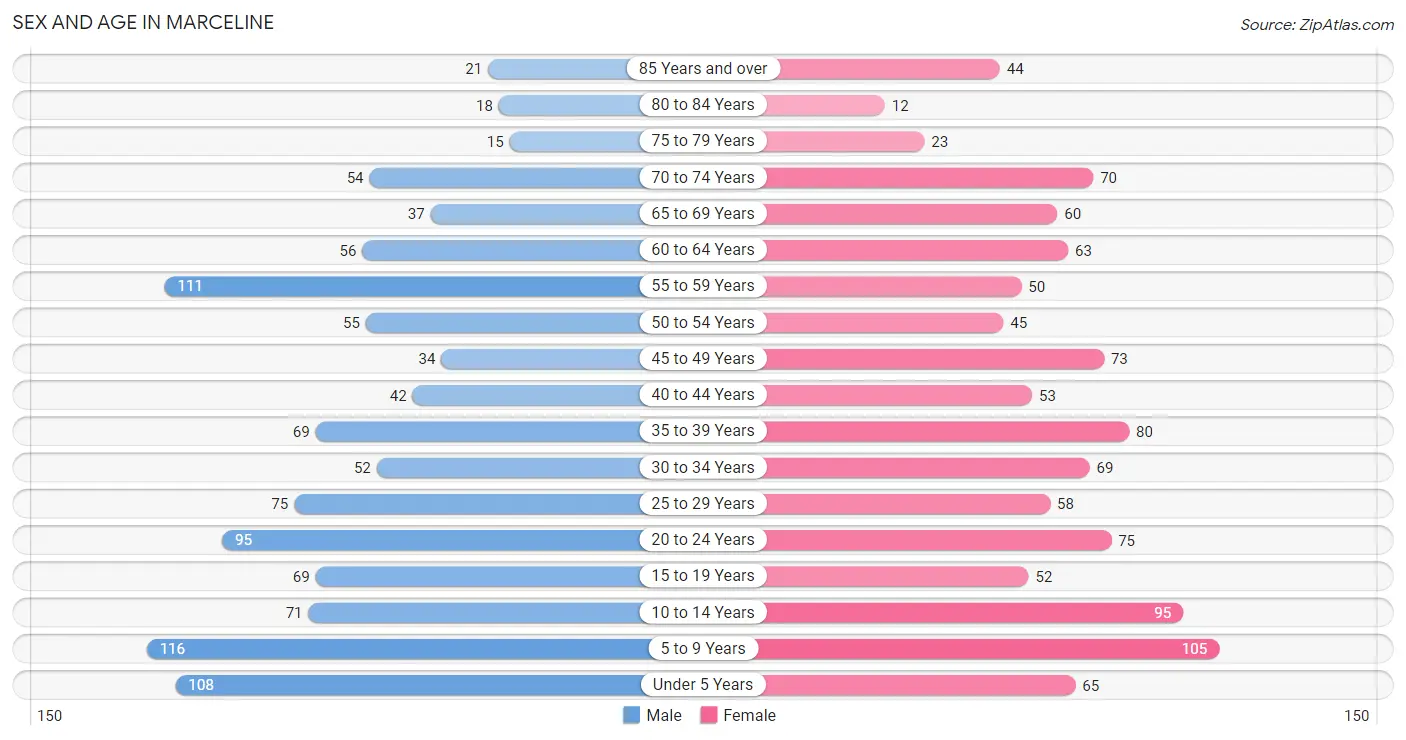
Sex and Age in Marceline
Sex and Age in Marceline
The most populous age groups in Marceline are 5 to 9 Years (116 | 10.6%) for men and 5 to 9 Years (105 | 9.6%) for women.
| Age Bracket | Male | Female |
| Under 5 Years | 108 (9.8%) | 65 (5.9%) |
| 5 to 9 Years | 116 (10.6%) | 105 (9.6%) |
| 10 to 14 Years | 71 (6.5%) | 95 (8.7%) |
| 15 to 19 Years | 69 (6.3%) | 52 (4.8%) |
| 20 to 24 Years | 95 (8.6%) | 75 (6.9%) |
| 25 to 29 Years | 75 (6.8%) | 58 (5.3%) |
| 30 to 34 Years | 52 (4.7%) | 69 (6.3%) |
| 35 to 39 Years | 69 (6.3%) | 80 (7.3%) |
| 40 to 44 Years | 42 (3.8%) | 53 (4.9%) |
| 45 to 49 Years | 34 (3.1%) | 73 (6.7%) |
| 50 to 54 Years | 55 (5.0%) | 45 (4.1%) |
| 55 to 59 Years | 111 (10.1%) | 50 (4.6%) |
| 60 to 64 Years | 56 (5.1%) | 63 (5.8%) |
| 65 to 69 Years | 37 (3.4%) | 60 (5.5%) |
| 70 to 74 Years | 54 (4.9%) | 70 (6.4%) |
| 75 to 79 Years | 15 (1.4%) | 23 (2.1%) |
| 80 to 84 Years | 18 (1.6%) | 12 (1.1%) |
| 85 Years and over | 21 (1.9%) | 44 (4.0%) |
| Total | 1,098 (100.0%) | 1,092 (100.0%) |
Families and Households in Marceline
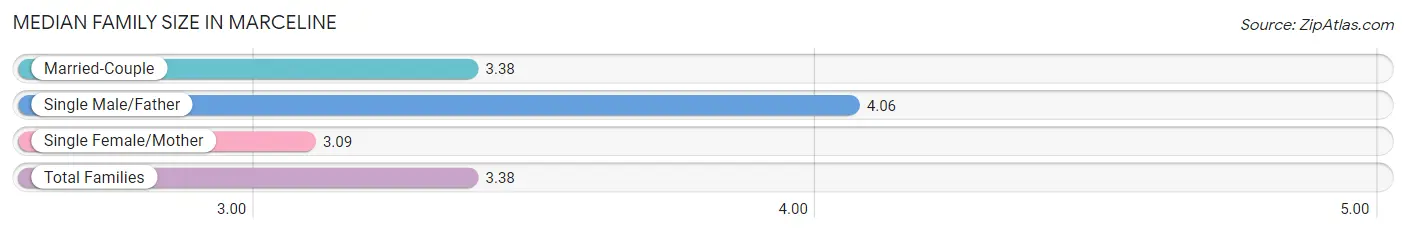
Median Family Size in Marceline
The median family size in Marceline is 3.38 persons per family, with single male/father families (51 | 9.7%) accounting for the largest median family size of 4.06 persons per family. On the other hand, single female/mother families (121 | 23.0%) represent the smallest median family size with 3.09 persons per family.
| Family Type | # Families | Family Size |
| Married-Couple | 354 (67.3%) | 3.38 |
| Single Male/Father | 51 (9.7%) | 4.06 |
| Single Female/Mother | 121 (23.0%) | 3.09 |
| Total Families | 526 (100.0%) | 3.38 |
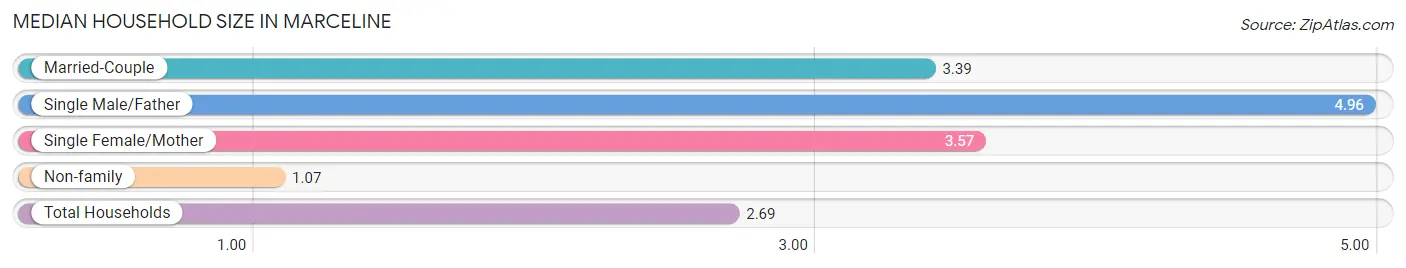
Median Household Size in Marceline
The median household size in Marceline is 2.69 persons per household, with single male/father households (51 | 6.3%) accounting for the largest median household size of 4.96 persons per household. non-family households (287 | 35.3%) represent the smallest median household size with 1.07 persons per household.
| Household Type | # Households | Household Size |
| Married-Couple | 354 (43.5%) | 3.39 |
| Single Male/Father | 51 (6.3%) | 4.96 |
| Single Female/Mother | 121 (14.9%) | 3.57 |
| Non-family | 287 (35.3%) | 1.07 |
| Total Households | 813 (100.0%) | 2.69 |
Household Size by Marriage Status in Marceline
Out of a total of 813 households in Marceline, 526 (64.7%) are family households, while 287 (35.3%) are nonfamily households. The most numerous type of family households are 2-person households, comprising 193, and the most common type of nonfamily households are 1-person households, comprising 271.
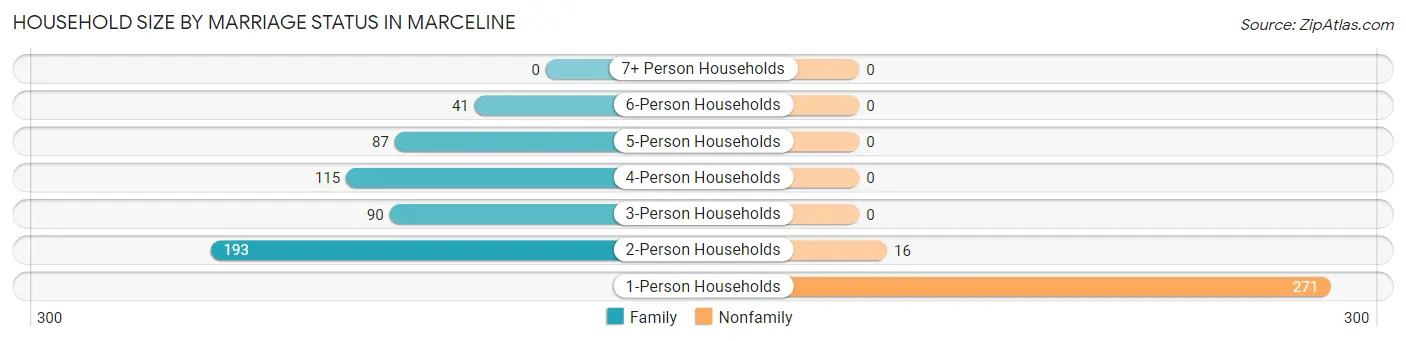
| Household Size | Family Households | Nonfamily Households |
| 1-Person Households | - | 271 (33.3%) |
| 2-Person Households | 193 (23.7%) | 16 (2.0%) |
| 3-Person Households | 90 (11.1%) | 0 (0.0%) |
| 4-Person Households | 115 (14.1%) | 0 (0.0%) |
| 5-Person Households | 87 (10.7%) | 0 (0.0%) |
| 6-Person Households | 41 (5.0%) | 0 (0.0%) |
| 7+ Person Households | 0 (0.0%) | 0 (0.0%) |
| Total | 526 (64.7%) | 287 (35.3%) |
Female Fertility in Marceline
Fertility by Age in Marceline
Average fertility rate in Marceline is 23.0 births per 1,000 women. Women in the age bracket of 35 to 50 years have the highest fertility rate with 32.0 births per 1,000 women. Women in the age bracket of 35 to 50 years acount for 63.6% of all women with births.
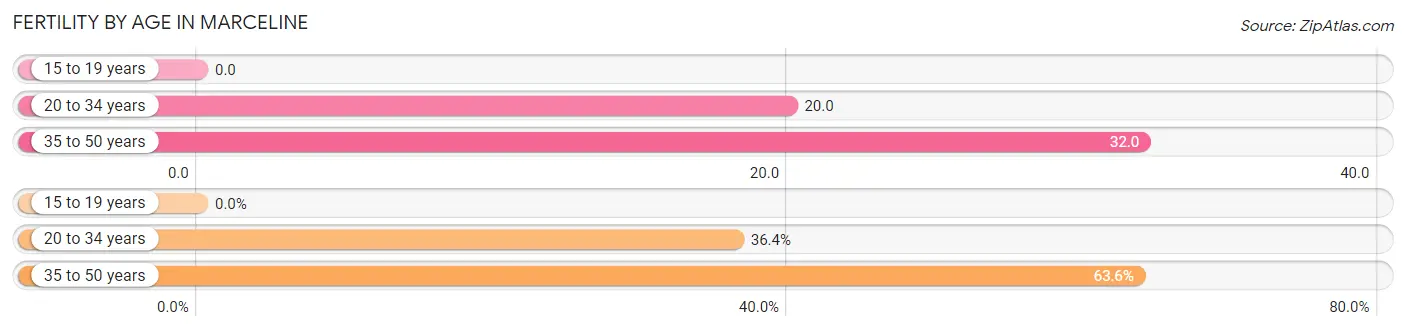
| Age Bracket | Women with Births | Births / 1,000 Women |
| 15 to 19 years | 0 (0.0%) | 0.0 |
| 20 to 34 years | 4 (36.4%) | 20.0 |
| 35 to 50 years | 7 (63.6%) | 32.0 |
| Total | 11 (100.0%) | 23.0 |
Fertility by Age by Marriage Status in Marceline
36.4% of women with births (11) in Marceline are married. The highest percentage of unmarried women with births falls into 35 to 50 years age bracket with 100.0% of them unmarried at the time of birth, while the lowest percentage of unmarried women with births belong to 20 to 34 years age bracket with 0.0% of them unmarried.
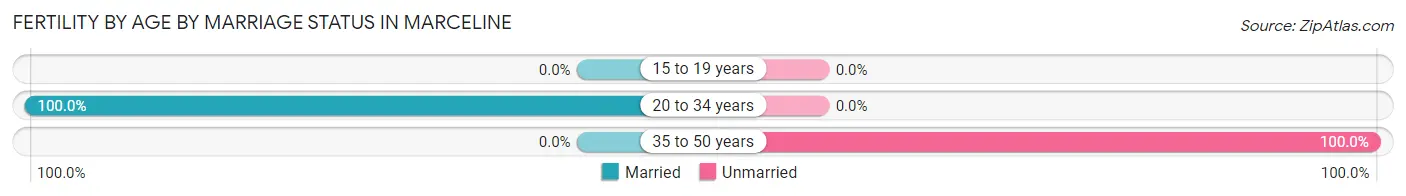
| Age Bracket | Married | Unmarried |
| 15 to 19 years | 0 (0.0%) | 0 (0.0%) |
| 20 to 34 years | 4 (100.0%) | 0 (0.0%) |
| 35 to 50 years | 0 (0.0%) | 7 (100.0%) |
| Total | 4 (36.4%) | 7 (63.6%) |
Fertility by Education in Marceline
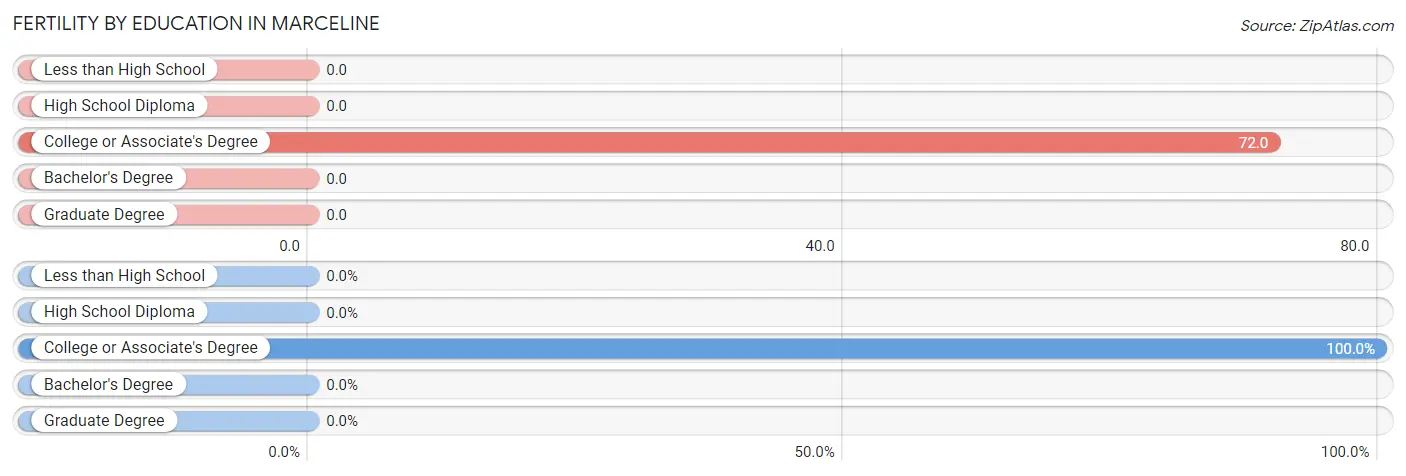
| Educational Attainment | Women with Births | Births / 1,000 Women |
| Less than High School | 0 (0.0%) | 0.0 |
| High School Diploma | 0 (0.0%) | 0.0 |
| College or Associate's Degree | 11 (100.0%) | 72.0 |
| Bachelor's Degree | 0 (0.0%) | 0.0 |
| Graduate Degree | 0 (0.0%) | 0.0 |
| Total | 11 (100.0%) | 23.0 |
Fertility by Education by Marriage Status in Marceline
63.6% of women with births in Marceline are unmarried. Women with the educational attainment of college or associate's degree are most likely to be married with 36.4% of them married at childbirth, while women with the educational attainment of college or associate's degree are least likely to be married with 63.6% of them unmarried at childbirth.
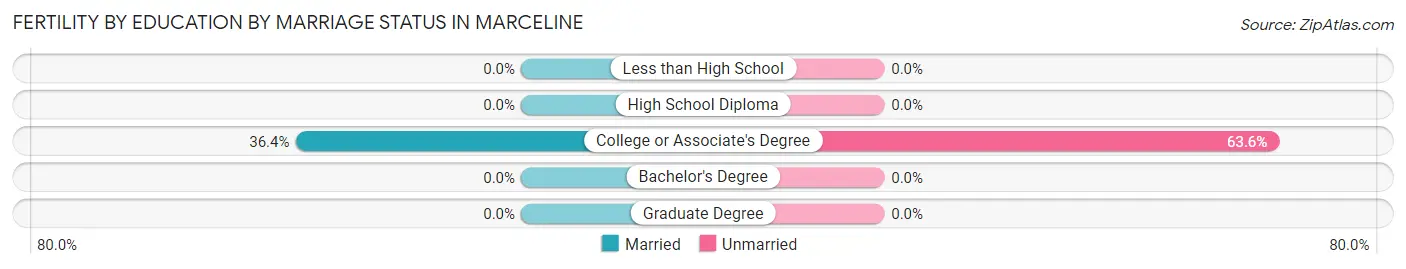
| Educational Attainment | Married | Unmarried |
| Less than High School | 0 (0.0%) | 0 (0.0%) |
| High School Diploma | 0 (0.0%) | 0 (0.0%) |
| College or Associate's Degree | 4 (36.4%) | 7 (63.6%) |
| Bachelor's Degree | 0 (0.0%) | 0 (0.0%) |
| Graduate Degree | 0 (0.0%) | 0 (0.0%) |
| Total | 4 (36.4%) | 7 (63.6%) |
Employment Characteristics in Marceline
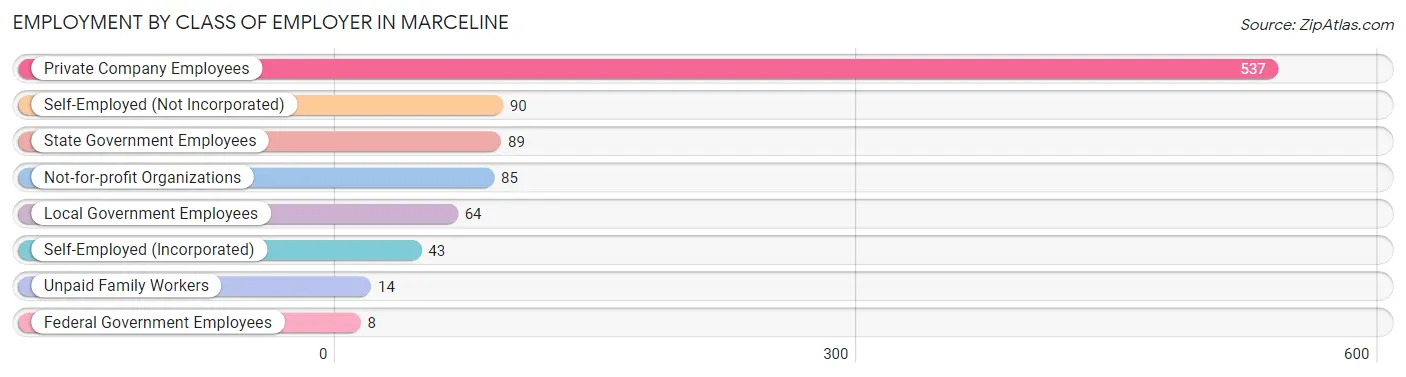
Employment by Class of Employer in Marceline
Among the 930 employed individuals in Marceline, private company employees (537 | 57.7%), self-employed (not incorporated) (90 | 9.7%), and state government employees (89 | 9.6%) make up the most common classes of employment.
| Employer Class | # Employees | % Employees |
| Private Company Employees | 537 | 57.7% |
| Self-Employed (Incorporated) | 43 | 4.6% |
| Self-Employed (Not Incorporated) | 90 | 9.7% |
| Not-for-profit Organizations | 85 | 9.1% |
| Local Government Employees | 64 | 6.9% |
| State Government Employees | 89 | 9.6% |
| Federal Government Employees | 8 | 0.9% |
| Unpaid Family Workers | 14 | 1.5% |
| Total | 930 | 100.0% |
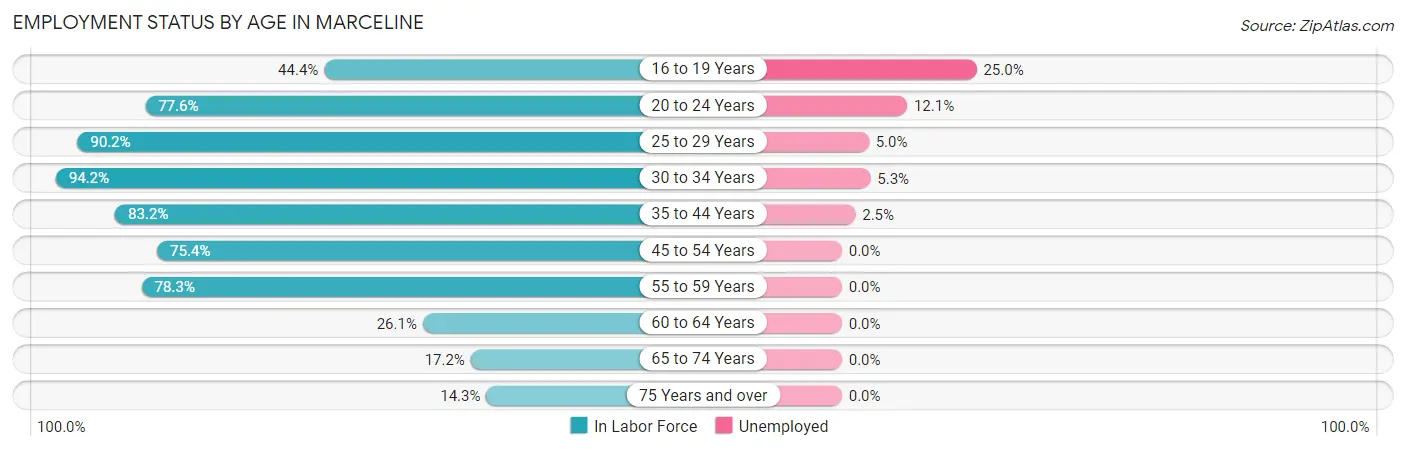
Employment Status by Age in Marceline
According to the labor force statistics for Marceline, out of the total population over 16 years of age (1,608), 61.1% or 982 individuals are in the labor force, with 4.5% or 44 of them unemployed. The age group with the highest labor force participation rate is 30 to 34 years, with 94.2% or 114 individuals in the labor force. Within the labor force, the 16 to 19 years age range has the highest percentage of unemployed individuals, with 25.0% or 11 of them being unemployed.
| Age Bracket | In Labor Force | Unemployed |
| 16 to 19 Years | 44 (44.4%) | 11 (25.0%) |
| 20 to 24 Years | 132 (77.6%) | 16 (12.1%) |
| 25 to 29 Years | 120 (90.2%) | 6 (5.0%) |
| 30 to 34 Years | 114 (94.2%) | 6 (5.3%) |
| 35 to 44 Years | 203 (83.2%) | 5 (2.5%) |
| 45 to 54 Years | 156 (75.4%) | 0 (0.0%) |
| 55 to 59 Years | 126 (78.3%) | 0 (0.0%) |
| 60 to 64 Years | 31 (26.1%) | 0 (0.0%) |
| 65 to 74 Years | 38 (17.2%) | 0 (0.0%) |
| 75 Years and over | 19 (14.3%) | 0 (0.0%) |
| Total | 982 (61.1%) | 44 (4.5%) |
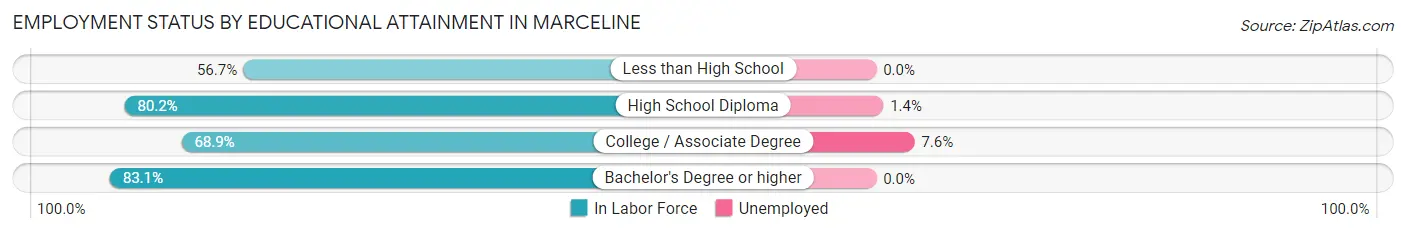
Employment Status by Educational Attainment in Marceline
According to labor force statistics for Marceline, 76.1% of individuals (750) out of the total population between 25 and 64 years of age (985) are in the labor force, with 2.3% or 17 of them being unemployed. The group with the highest labor force participation rate are those with the educational attainment of bachelor's degree or higher, with 83.1% or 133 individuals in the labor force. Within the labor force, individuals with college / associate degree education have the highest percentage of unemployment, with 7.6% or 11 of them being unemployed.
| Educational Attainment | In Labor Force | Unemployed |
| Less than High School | 51 (56.7%) | 0 (0.0%) |
| High School Diploma | 422 (80.2%) | 7 (1.4%) |
| College / Associate Degree | 144 (68.9%) | 16 (7.6%) |
| Bachelor's Degree or higher | 133 (83.1%) | 0 (0.0%) |
| Total | 750 (76.1%) | 23 (2.3%) |
Employment Occupations by Sex in Marceline
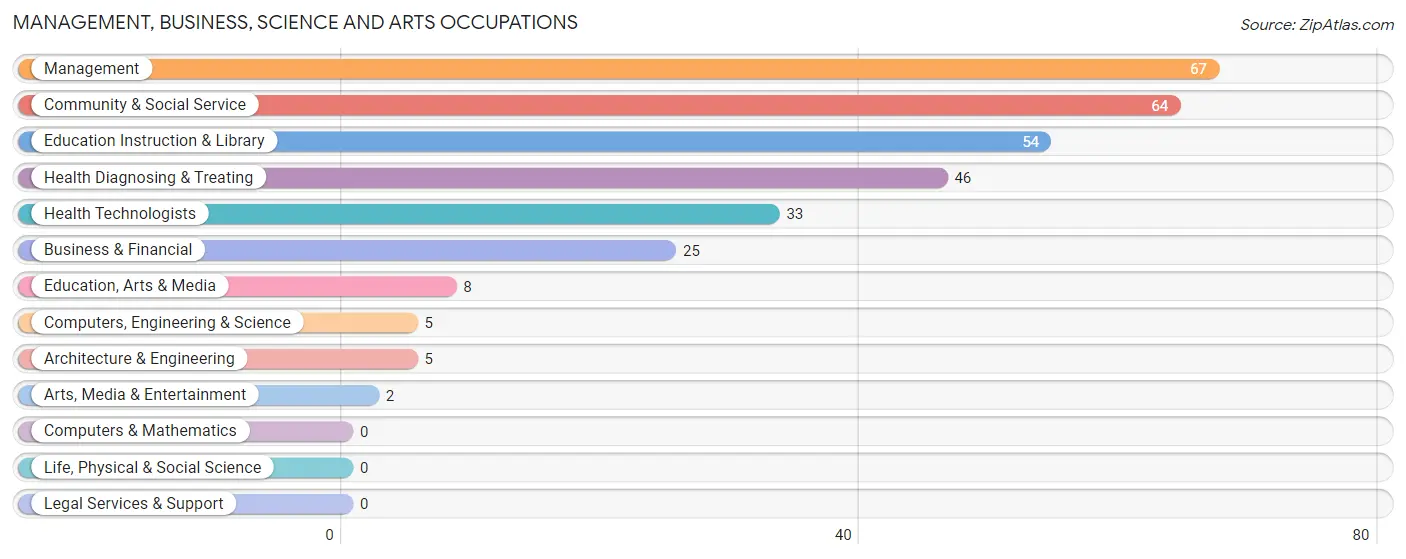
Management, Business, Science and Arts Occupations
The most common Management, Business, Science and Arts occupations in Marceline are Management (67 | 7.1%), Community & Social Service (64 | 6.8%), Education Instruction & Library (54 | 5.8%), Health Diagnosing & Treating (46 | 4.9%), and Health Technologists (33 | 3.5%).
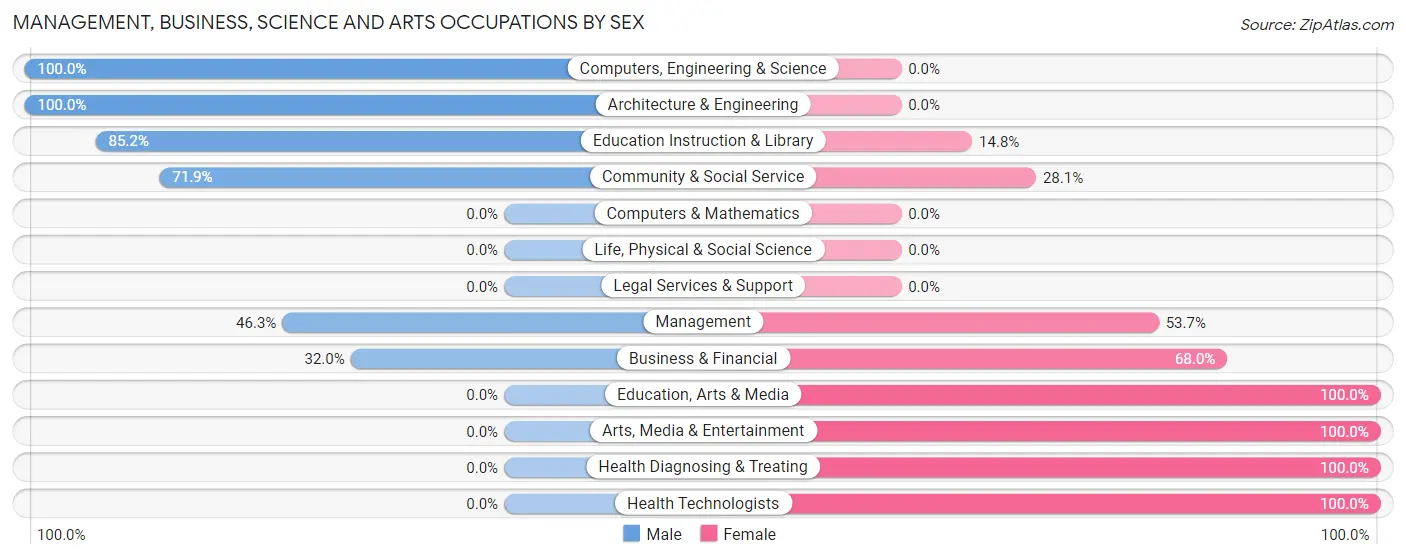
Management, Business, Science and Arts Occupations by Sex
Within the Management, Business, Science and Arts occupations in Marceline, the most male-oriented occupations are Computers, Engineering & Science (100.0%), Architecture & Engineering (100.0%), and Education Instruction & Library (85.2%), while the most female-oriented occupations are Education, Arts & Media (100.0%), Arts, Media & Entertainment (100.0%), and Health Diagnosing & Treating (100.0%).
| Occupation | Male | Female |
| Management | 31 (46.3%) | 36 (53.7%) |
| Business & Financial | 8 (32.0%) | 17 (68.0%) |
| Computers, Engineering & Science | 5 (100.0%) | 0 (0.0%) |
| Computers & Mathematics | 0 (0.0%) | 0 (0.0%) |
| Architecture & Engineering | 5 (100.0%) | 0 (0.0%) |
| Life, Physical & Social Science | 0 (0.0%) | 0 (0.0%) |
| Community & Social Service | 46 (71.9%) | 18 (28.1%) |
| Education, Arts & Media | 0 (0.0%) | 8 (100.0%) |
| Legal Services & Support | 0 (0.0%) | 0 (0.0%) |
| Education Instruction & Library | 46 (85.2%) | 8 (14.8%) |
| Arts, Media & Entertainment | 0 (0.0%) | 2 (100.0%) |
| Health Diagnosing & Treating | 0 (0.0%) | 46 (100.0%) |
| Health Technologists | 0 (0.0%) | 33 (100.0%) |
| Total (Category) | 90 (43.5%) | 117 (56.5%) |
| Total (Overall) | 506 (53.9%) | 433 (46.1%) |
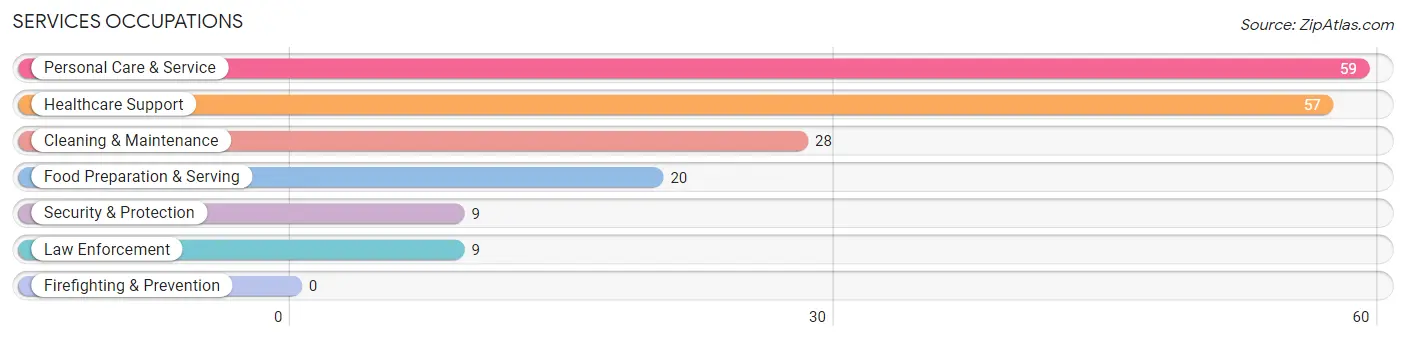
Services Occupations
The most common Services occupations in Marceline are Personal Care & Service (59 | 6.3%), Healthcare Support (57 | 6.1%), Cleaning & Maintenance (28 | 3.0%), Food Preparation & Serving (20 | 2.1%), and Security & Protection (9 | 1.0%).
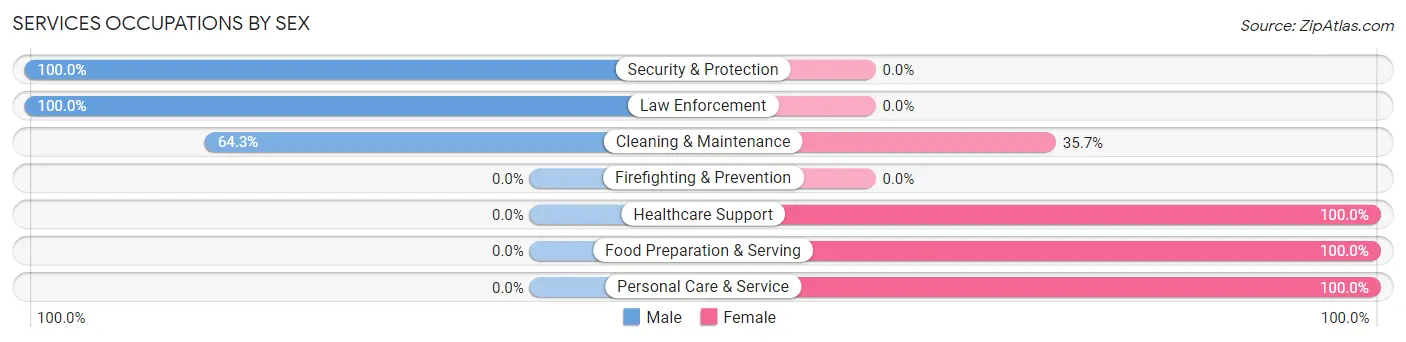
Services Occupations by Sex
Within the Services occupations in Marceline, the most male-oriented occupations are Security & Protection (100.0%), Law Enforcement (100.0%), and Cleaning & Maintenance (64.3%), while the most female-oriented occupations are Healthcare Support (100.0%), Food Preparation & Serving (100.0%), and Personal Care & Service (100.0%).
| Occupation | Male | Female |
| Healthcare Support | 0 (0.0%) | 57 (100.0%) |
| Security & Protection | 9 (100.0%) | 0 (0.0%) |
| Firefighting & Prevention | 0 (0.0%) | 0 (0.0%) |
| Law Enforcement | 9 (100.0%) | 0 (0.0%) |
| Food Preparation & Serving | 0 (0.0%) | 20 (100.0%) |
| Cleaning & Maintenance | 18 (64.3%) | 10 (35.7%) |
| Personal Care & Service | 0 (0.0%) | 59 (100.0%) |
| Total (Category) | 27 (15.6%) | 146 (84.4%) |
| Total (Overall) | 506 (53.9%) | 433 (46.1%) |
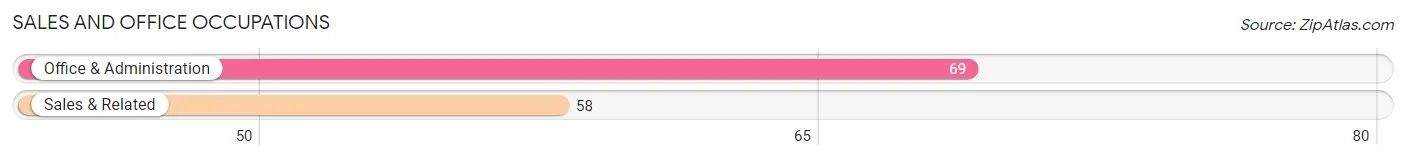
Sales and Office Occupations
The most common Sales and Office occupations in Marceline are Office & Administration (69 | 7.3%), and Sales & Related (58 | 6.2%).
Sales and Office Occupations by Sex
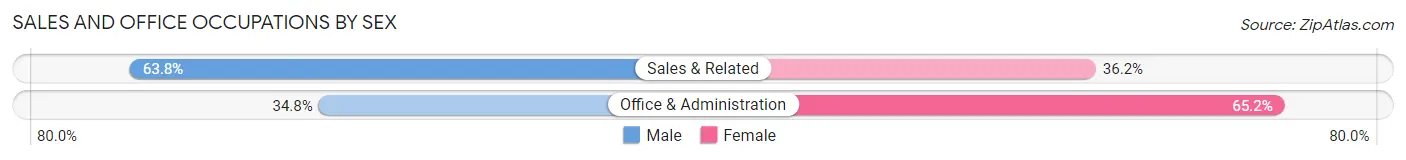
| Occupation | Male | Female |
| Sales & Related | 37 (63.8%) | 21 (36.2%) |
| Office & Administration | 24 (34.8%) | 45 (65.2%) |
| Total (Category) | 61 (48.0%) | 66 (52.0%) |
| Total (Overall) | 506 (53.9%) | 433 (46.1%) |
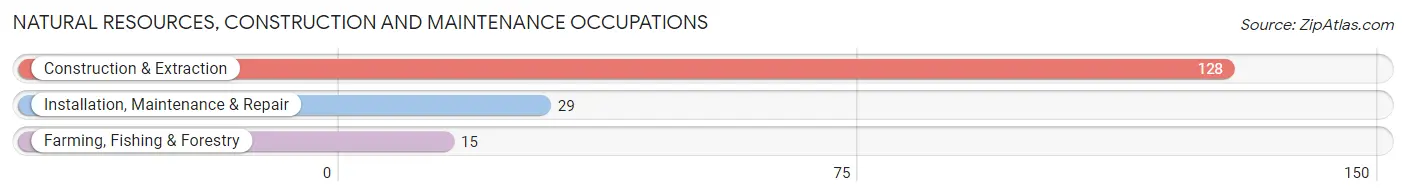
Natural Resources, Construction and Maintenance Occupations
The most common Natural Resources, Construction and Maintenance occupations in Marceline are Construction & Extraction (128 | 13.6%), Installation, Maintenance & Repair (29 | 3.1%), and Farming, Fishing & Forestry (15 | 1.6%).
Natural Resources, Construction and Maintenance Occupations by Sex
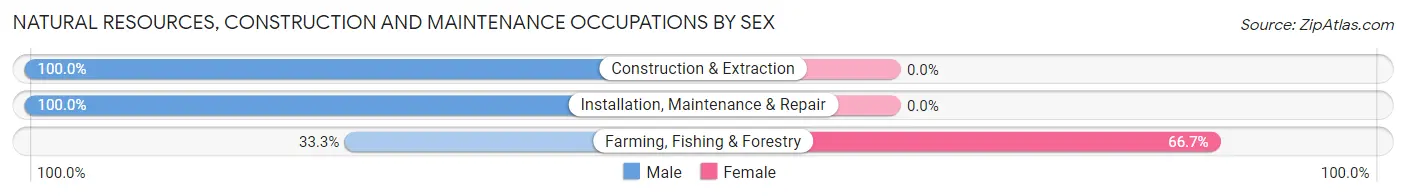
| Occupation | Male | Female |
| Farming, Fishing & Forestry | 5 (33.3%) | 10 (66.7%) |
| Construction & Extraction | 128 (100.0%) | 0 (0.0%) |
| Installation, Maintenance & Repair | 29 (100.0%) | 0 (0.0%) |
| Total (Category) | 162 (94.2%) | 10 (5.8%) |
| Total (Overall) | 506 (53.9%) | 433 (46.1%) |
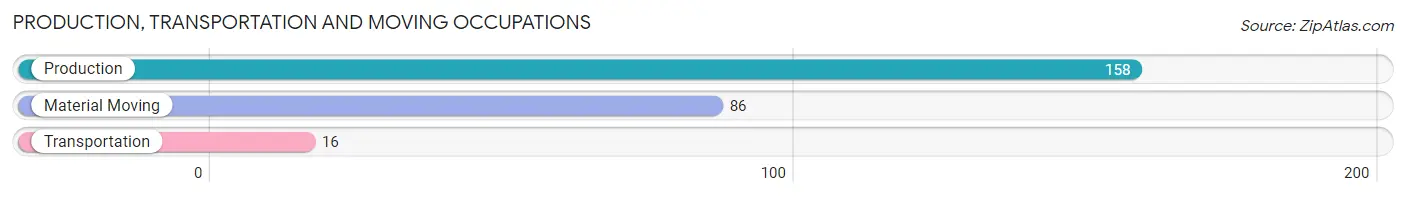
Production, Transportation and Moving Occupations
The most common Production, Transportation and Moving occupations in Marceline are Production (158 | 16.8%), Material Moving (86 | 9.2%), and Transportation (16 | 1.7%).
Production, Transportation and Moving Occupations by Sex
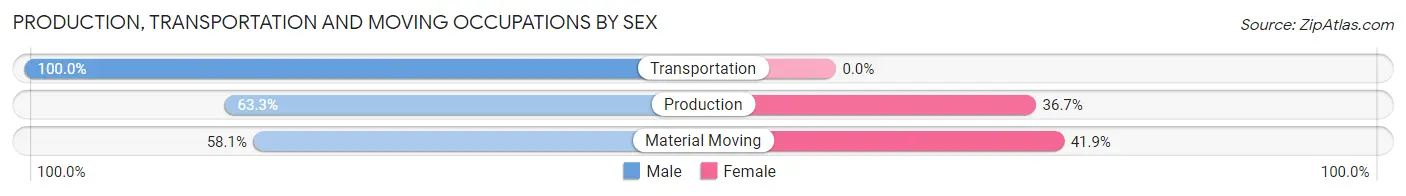
| Occupation | Male | Female |
| Production | 100 (63.3%) | 58 (36.7%) |
| Transportation | 16 (100.0%) | 0 (0.0%) |
| Material Moving | 50 (58.1%) | 36 (41.9%) |
| Total (Category) | 166 (63.8%) | 94 (36.1%) |
| Total (Overall) | 506 (53.9%) | 433 (46.1%) |
Employment Industries by Sex in Marceline
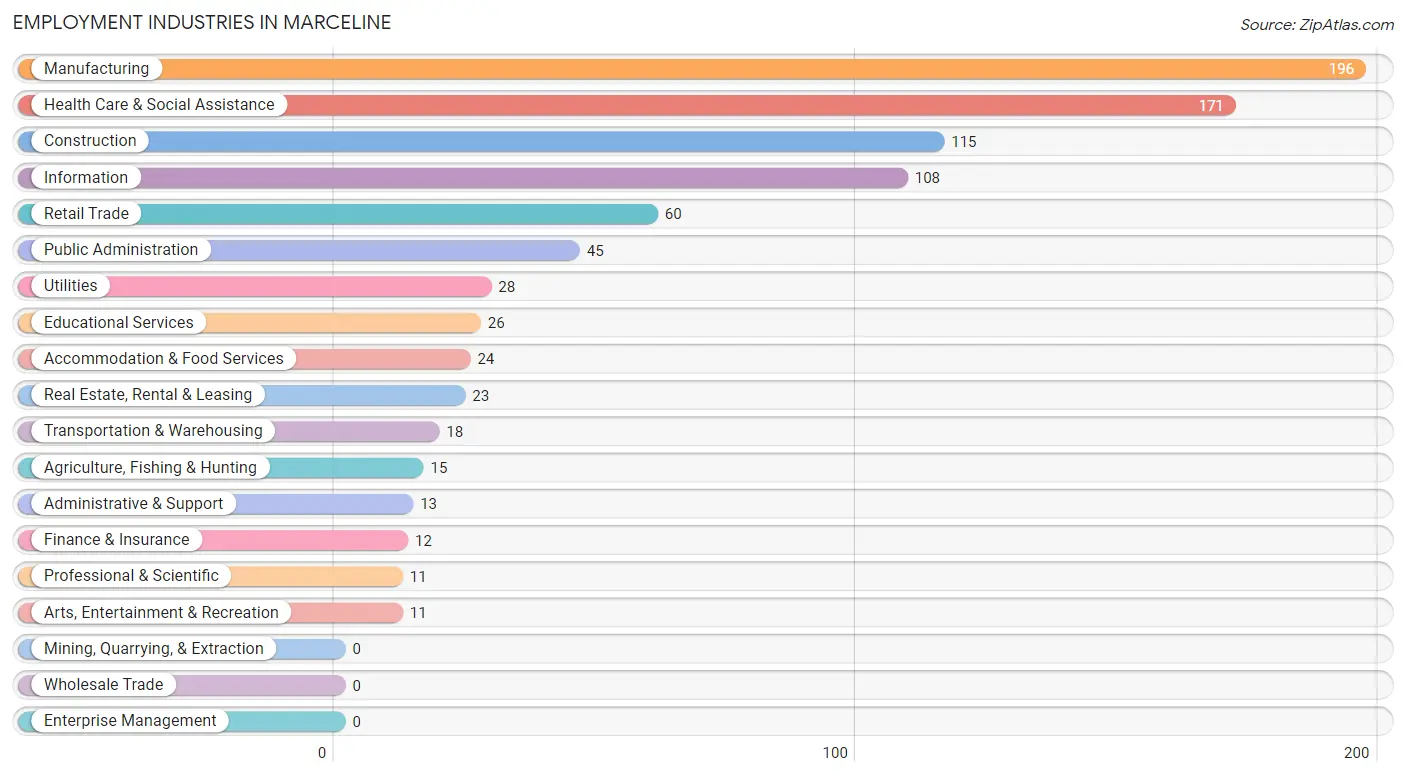
Employment Industries in Marceline
The major employment industries in Marceline include Manufacturing (196 | 20.9%), Health Care & Social Assistance (171 | 18.2%), Construction (115 | 12.2%), Information (108 | 11.5%), and Retail Trade (60 | 6.4%).
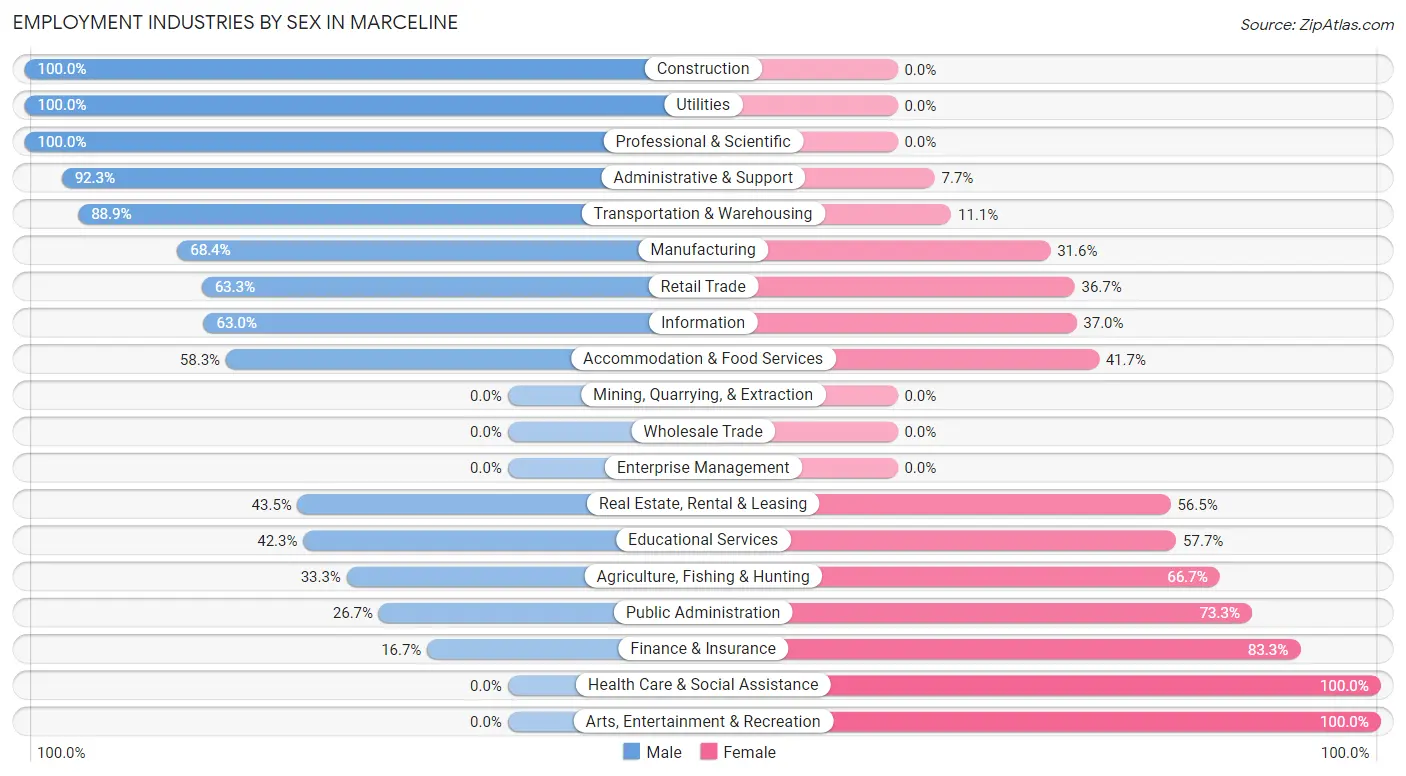
Employment Industries by Sex in Marceline
The Marceline industries that see more men than women are Construction (100.0%), Utilities (100.0%), and Professional & Scientific (100.0%), whereas the industries that tend to have a higher number of women are Health Care & Social Assistance (100.0%), Arts, Entertainment & Recreation (100.0%), and Finance & Insurance (83.3%).
| Industry | Male | Female |
| Agriculture, Fishing & Hunting | 5 (33.3%) | 10 (66.7%) |
| Mining, Quarrying, & Extraction | 0 (0.0%) | 0 (0.0%) |
| Construction | 115 (100.0%) | 0 (0.0%) |
| Manufacturing | 134 (68.4%) | 62 (31.6%) |
| Wholesale Trade | 0 (0.0%) | 0 (0.0%) |
| Retail Trade | 38 (63.3%) | 22 (36.7%) |
| Transportation & Warehousing | 16 (88.9%) | 2 (11.1%) |
| Utilities | 28 (100.0%) | 0 (0.0%) |
| Information | 68 (63.0%) | 40 (37.0%) |
| Finance & Insurance | 2 (16.7%) | 10 (83.3%) |
| Real Estate, Rental & Leasing | 10 (43.5%) | 13 (56.5%) |
| Professional & Scientific | 11 (100.0%) | 0 (0.0%) |
| Enterprise Management | 0 (0.0%) | 0 (0.0%) |
| Administrative & Support | 12 (92.3%) | 1 (7.7%) |
| Educational Services | 11 (42.3%) | 15 (57.7%) |
| Health Care & Social Assistance | 0 (0.0%) | 171 (100.0%) |
| Arts, Entertainment & Recreation | 0 (0.0%) | 11 (100.0%) |
| Accommodation & Food Services | 14 (58.3%) | 10 (41.7%) |
| Public Administration | 12 (26.7%) | 33 (73.3%) |
| Total | 506 (53.9%) | 433 (46.1%) |
Education in Marceline
School Enrollment in Marceline
The most common levels of schooling among the 522 students in Marceline are elementary school (153 | 29.3%), middle school (134 | 25.7%), and high school (102 | 19.5%).
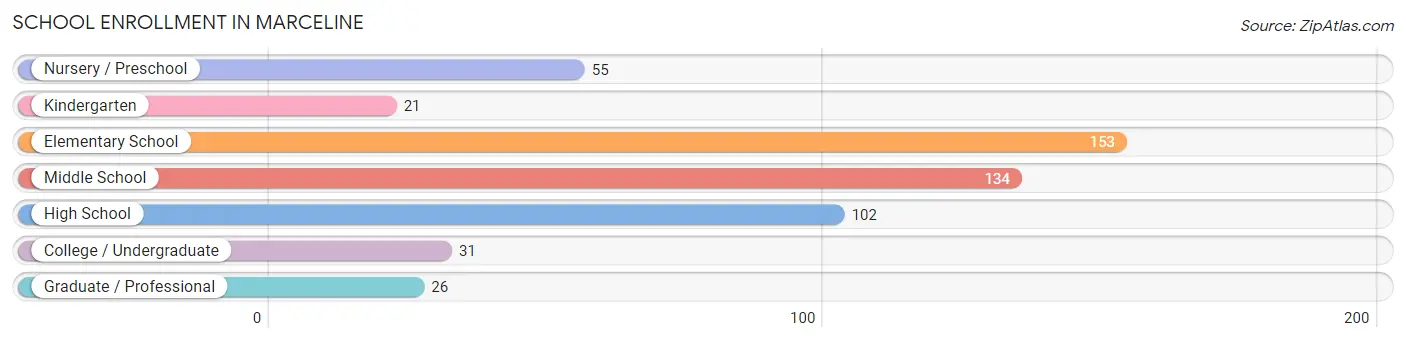
| School Level | # Students | % Students |
| Nursery / Preschool | 55 | 10.5% |
| Kindergarten | 21 | 4.0% |
| Elementary School | 153 | 29.3% |
| Middle School | 134 | 25.7% |
| High School | 102 | 19.5% |
| College / Undergraduate | 31 | 5.9% |
| Graduate / Professional | 26 | 5.0% |
| Total | 522 | 100.0% |
School Enrollment by Age by Funding Source in Marceline
Out of a total of 522 students who are enrolled in schools in Marceline, 56 (10.7%) attend a private institution, while the remaining 466 (89.3%) are enrolled in public schools. The age group of 18 to 19 year olds has the highest likelihood of being enrolled in private schools, with 28 (68.3% in the age bracket) enrolled. Conversely, the age group of 3 to 4 year olds has the lowest likelihood of being enrolled in a private school, with 40 (100.0% in the age bracket) attending a public institution.
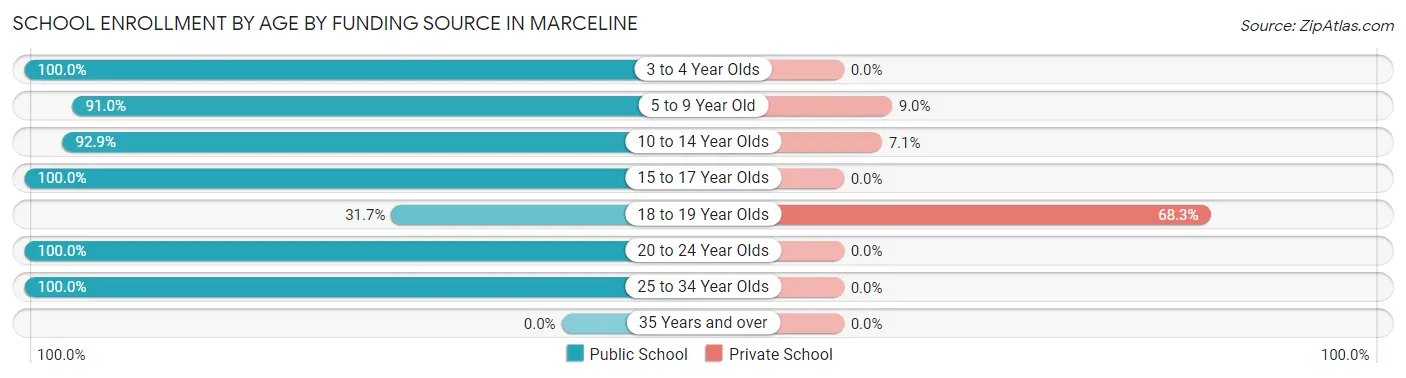
| Age Bracket | Public School | Private School |
| 3 to 4 Year Olds | 40 (100.0%) | 0 (0.0%) |
| 5 to 9 Year Old | 183 (91.0%) | 18 (9.0%) |
| 10 to 14 Year Olds | 131 (92.9%) | 10 (7.1%) |
| 15 to 17 Year Olds | 55 (100.0%) | 0 (0.0%) |
| 18 to 19 Year Olds | 13 (31.7%) | 28 (68.3%) |
| 20 to 24 Year Olds | 41 (100.0%) | 0 (0.0%) |
| 25 to 34 Year Olds | 3 (100.0%) | 0 (0.0%) |
| 35 Years and over | 0 (0.0%) | 0 (0.0%) |
| Total | 466 (89.3%) | 56 (10.7%) |
Educational Attainment by Field of Study in Marceline
Education (47 | 24.9%), business (36 | 19.1%), science & technology (30 | 15.9%), communications (25 | 13.2%), and engineering (22 | 11.6%) are the most common fields of study among 189 individuals in Marceline who have obtained a bachelor's degree or higher.
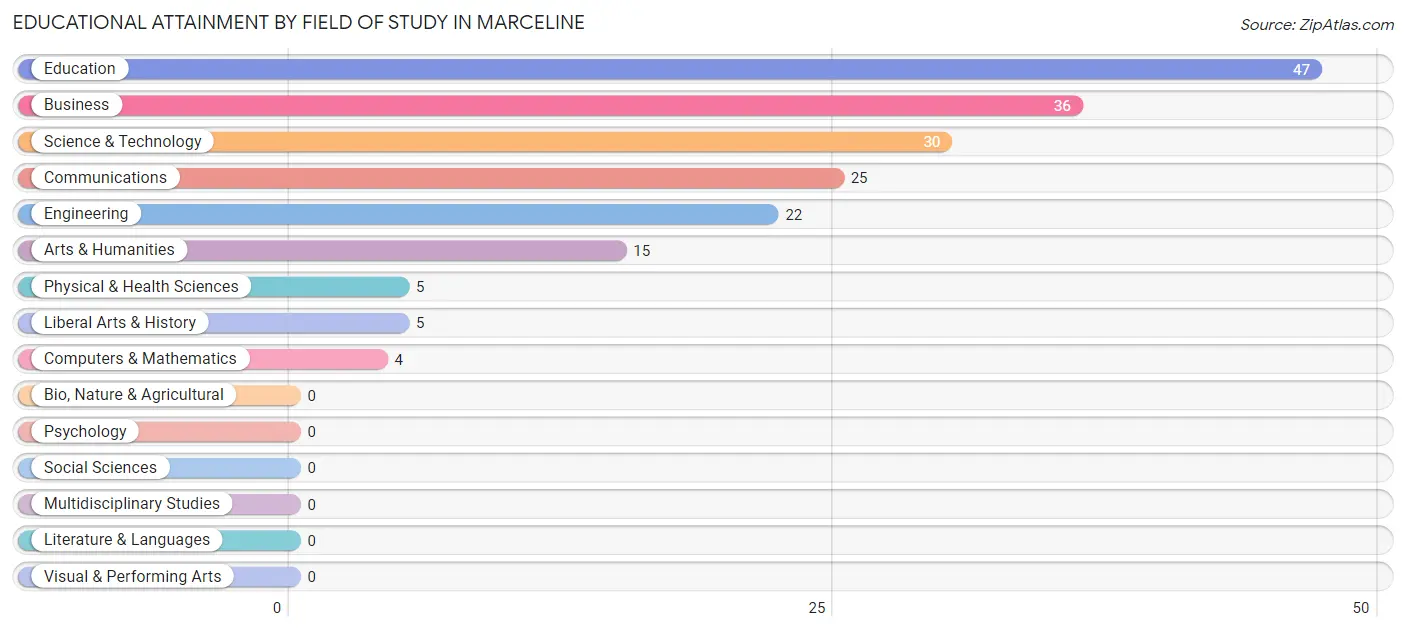
| Field of Study | # Graduates | % Graduates |
| Computers & Mathematics | 4 | 2.1% |
| Bio, Nature & Agricultural | 0 | 0.0% |
| Physical & Health Sciences | 5 | 2.6% |
| Psychology | 0 | 0.0% |
| Social Sciences | 0 | 0.0% |
| Engineering | 22 | 11.6% |
| Multidisciplinary Studies | 0 | 0.0% |
| Science & Technology | 30 | 15.9% |
| Business | 36 | 19.1% |
| Education | 47 | 24.9% |
| Literature & Languages | 0 | 0.0% |
| Liberal Arts & History | 5 | 2.6% |
| Visual & Performing Arts | 0 | 0.0% |
| Communications | 25 | 13.2% |
| Arts & Humanities | 15 | 7.9% |
| Total | 189 | 100.0% |
Transportation & Commute in Marceline
Vehicle Availability by Sex in Marceline
The most prevalent vehicle ownership categories in Marceline are males with 3 vehicles (162, accounting for 32.0%) and females with 3 vehicles (89, making up 38.2%).
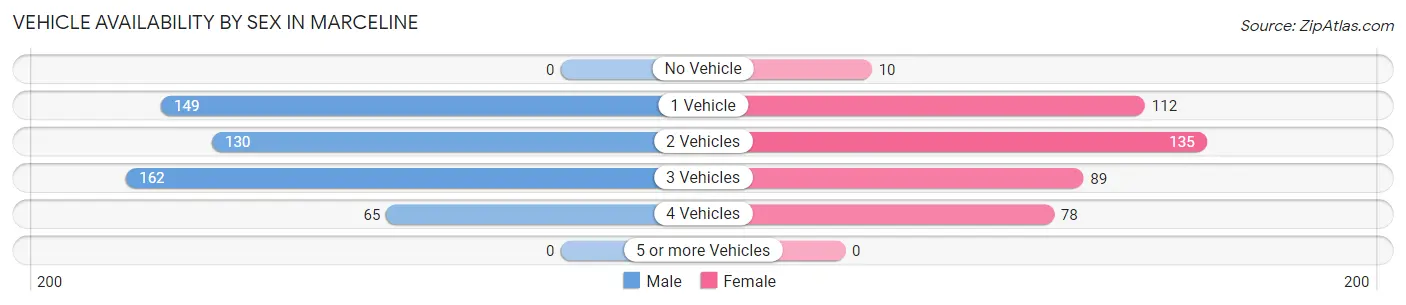
| Vehicles Available | Male | Female |
| No Vehicle | 0 (0.0%) | 10 (2.4%) |
| 1 Vehicle | 149 (29.4%) | 112 (26.4%) |
| 2 Vehicles | 130 (25.7%) | 135 (31.8%) |
| 3 Vehicles | 162 (32.0%) | 89 (21.0%) |
| 4 Vehicles | 65 (12.9%) | 78 (18.4%) |
| 5 or more Vehicles | 0 (0.0%) | 0 (0.0%) |
| Total | 506 (100.0%) | 424 (100.0%) |
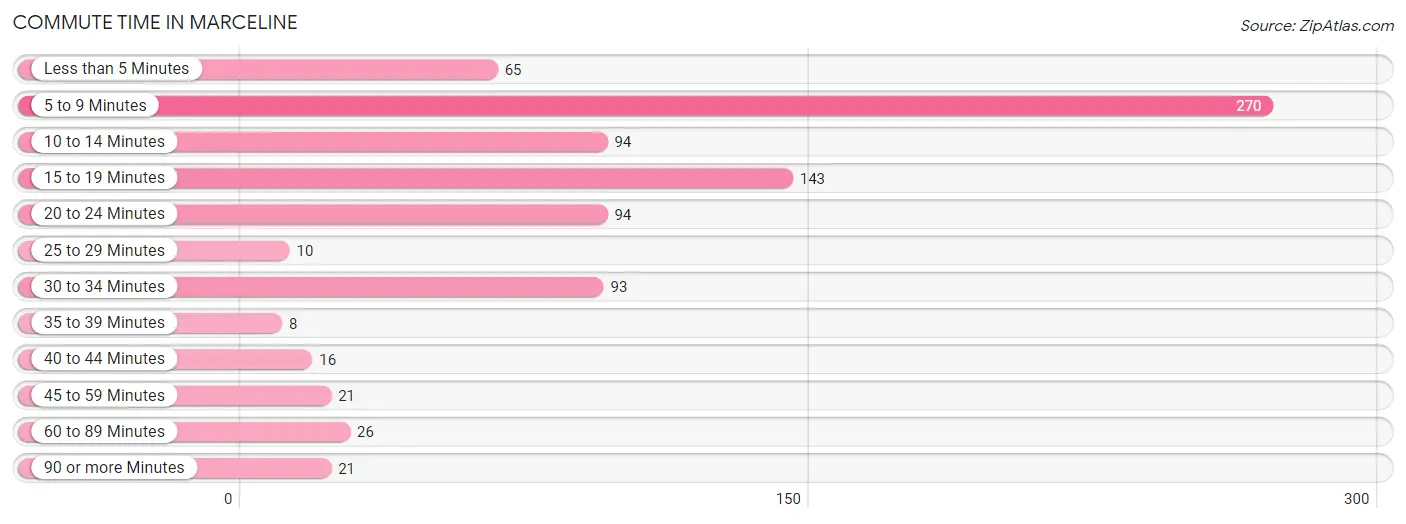
Commute Time in Marceline
The most frequently occuring commute durations in Marceline are 5 to 9 minutes (270 commuters, 31.4%), 15 to 19 minutes (143 commuters, 16.6%), and 10 to 14 minutes (94 commuters, 10.9%).
| Commute Time | # Commuters | % Commuters |
| Less than 5 Minutes | 65 | 7.5% |
| 5 to 9 Minutes | 270 | 31.4% |
| 10 to 14 Minutes | 94 | 10.9% |
| 15 to 19 Minutes | 143 | 16.6% |
| 20 to 24 Minutes | 94 | 10.9% |
| 25 to 29 Minutes | 10 | 1.2% |
| 30 to 34 Minutes | 93 | 10.8% |
| 35 to 39 Minutes | 8 | 0.9% |
| 40 to 44 Minutes | 16 | 1.9% |
| 45 to 59 Minutes | 21 | 2.4% |
| 60 to 89 Minutes | 26 | 3.0% |
| 90 or more Minutes | 21 | 2.4% |
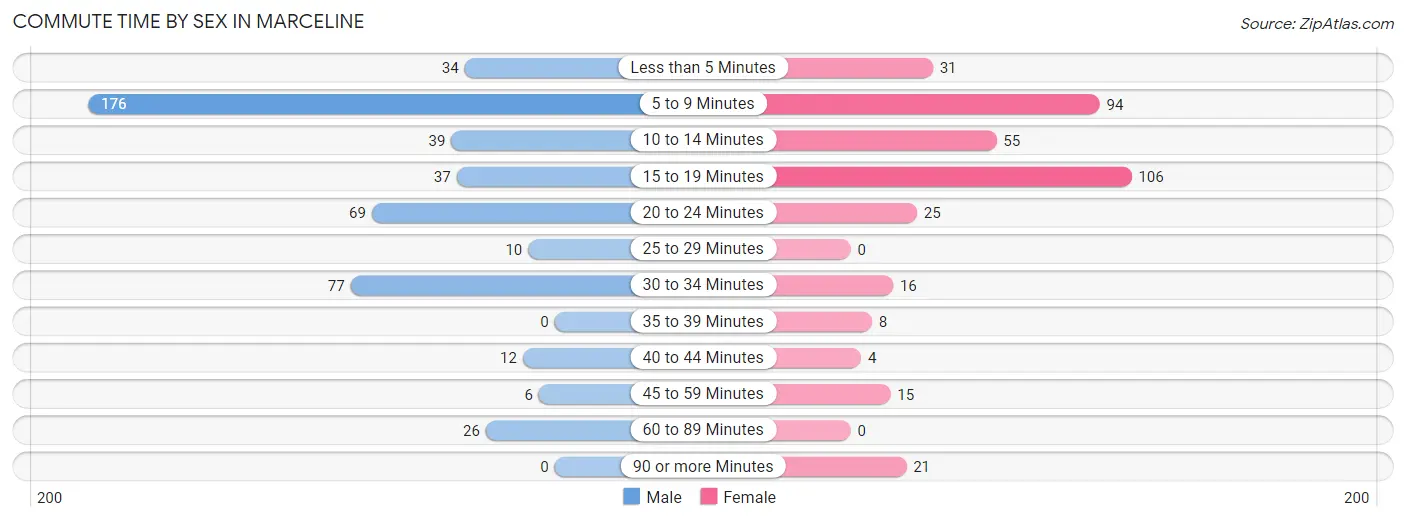
Commute Time by Sex in Marceline
The most common commute times in Marceline are 5 to 9 minutes (176 commuters, 36.2%) for males and 15 to 19 minutes (106 commuters, 28.3%) for females.
| Commute Time | Male | Female |
| Less than 5 Minutes | 34 (7.0%) | 31 (8.3%) |
| 5 to 9 Minutes | 176 (36.2%) | 94 (25.1%) |
| 10 to 14 Minutes | 39 (8.0%) | 55 (14.7%) |
| 15 to 19 Minutes | 37 (7.6%) | 106 (28.3%) |
| 20 to 24 Minutes | 69 (14.2%) | 25 (6.7%) |
| 25 to 29 Minutes | 10 (2.1%) | 0 (0.0%) |
| 30 to 34 Minutes | 77 (15.8%) | 16 (4.3%) |
| 35 to 39 Minutes | 0 (0.0%) | 8 (2.1%) |
| 40 to 44 Minutes | 12 (2.5%) | 4 (1.1%) |
| 45 to 59 Minutes | 6 (1.2%) | 15 (4.0%) |
| 60 to 89 Minutes | 26 (5.3%) | 0 (0.0%) |
| 90 or more Minutes | 0 (0.0%) | 21 (5.6%) |
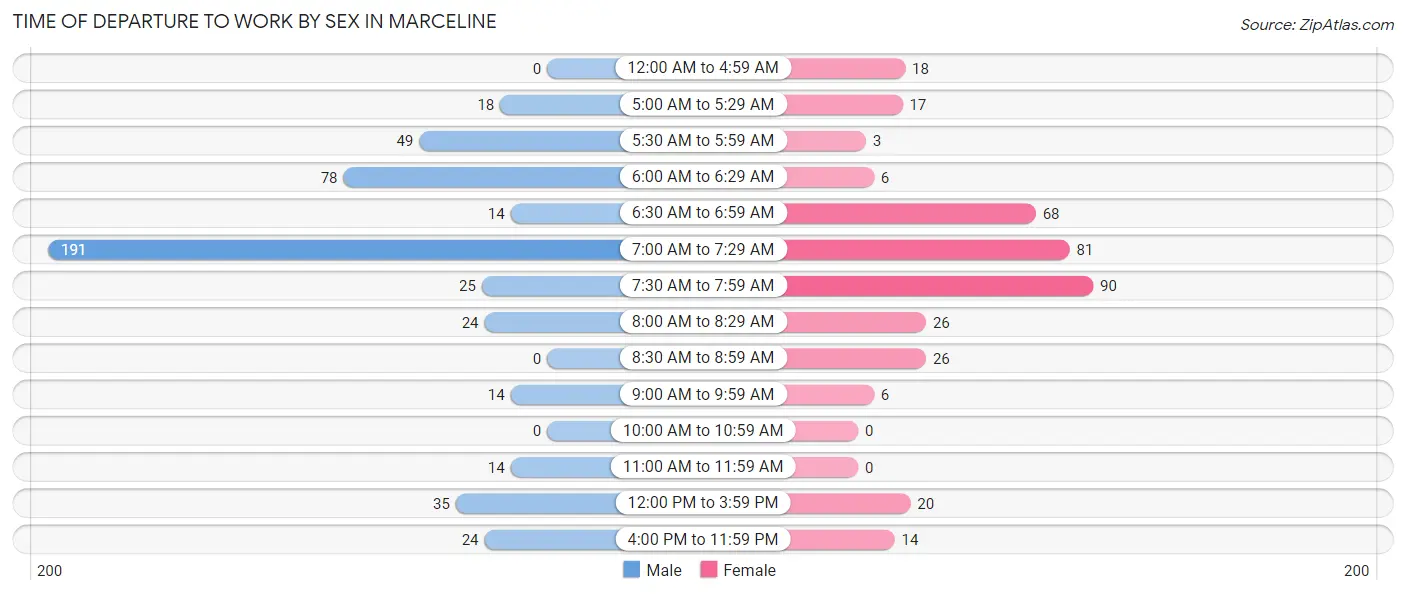
Time of Departure to Work by Sex in Marceline
The most frequent times of departure to work in Marceline are 7:00 AM to 7:29 AM (191, 39.3%) for males and 7:30 AM to 7:59 AM (90, 24.0%) for females.
| Time of Departure | Male | Female |
| 12:00 AM to 4:59 AM | 0 (0.0%) | 18 (4.8%) |
| 5:00 AM to 5:29 AM | 18 (3.7%) | 17 (4.5%) |
| 5:30 AM to 5:59 AM | 49 (10.1%) | 3 (0.8%) |
| 6:00 AM to 6:29 AM | 78 (16.1%) | 6 (1.6%) |
| 6:30 AM to 6:59 AM | 14 (2.9%) | 68 (18.1%) |
| 7:00 AM to 7:29 AM | 191 (39.3%) | 81 (21.6%) |
| 7:30 AM to 7:59 AM | 25 (5.1%) | 90 (24.0%) |
| 8:00 AM to 8:29 AM | 24 (4.9%) | 26 (6.9%) |
| 8:30 AM to 8:59 AM | 0 (0.0%) | 26 (6.9%) |
| 9:00 AM to 9:59 AM | 14 (2.9%) | 6 (1.6%) |
| 10:00 AM to 10:59 AM | 0 (0.0%) | 0 (0.0%) |
| 11:00 AM to 11:59 AM | 14 (2.9%) | 0 (0.0%) |
| 12:00 PM to 3:59 PM | 35 (7.2%) | 20 (5.3%) |
| 4:00 PM to 11:59 PM | 24 (4.9%) | 14 (3.7%) |
| Total | 486 (100.0%) | 375 (100.0%) |
Housing Occupancy in Marceline
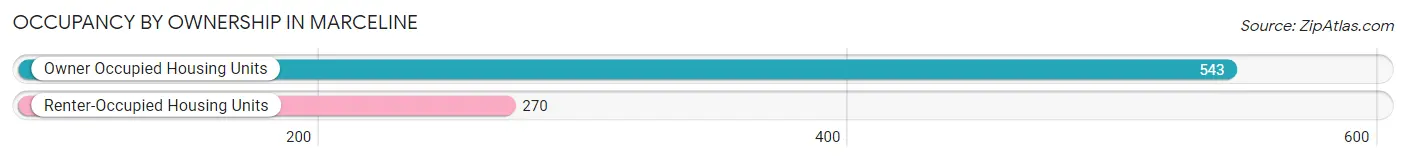
Occupancy by Ownership in Marceline
Of the total 813 dwellings in Marceline, owner-occupied units account for 543 (66.8%), while renter-occupied units make up 270 (33.2%).
| Occupancy | # Housing Units | % Housing Units |
| Owner Occupied Housing Units | 543 | 66.8% |
| Renter-Occupied Housing Units | 270 | 33.2% |
| Total Occupied Housing Units | 813 | 100.0% |
Occupancy by Household Size in Marceline
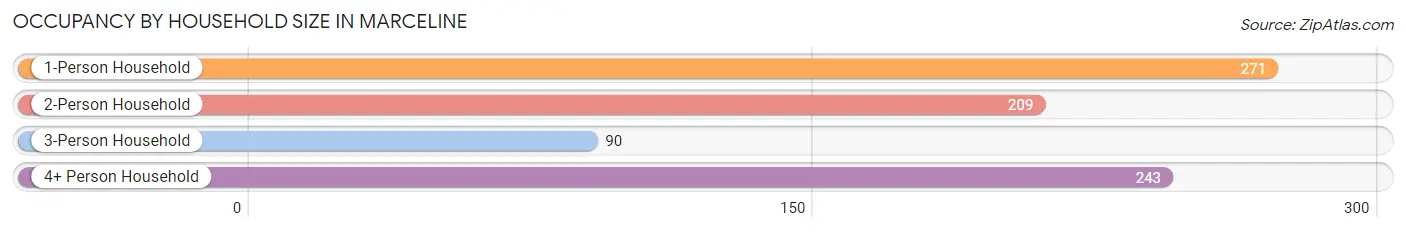
| Household Size | # Housing Units | % Housing Units |
| 1-Person Household | 271 | 33.3% |
| 2-Person Household | 209 | 25.7% |
| 3-Person Household | 90 | 11.1% |
| 4+ Person Household | 243 | 29.9% |
| Total Housing Units | 813 | 100.0% |
Occupancy by Ownership by Household Size in Marceline
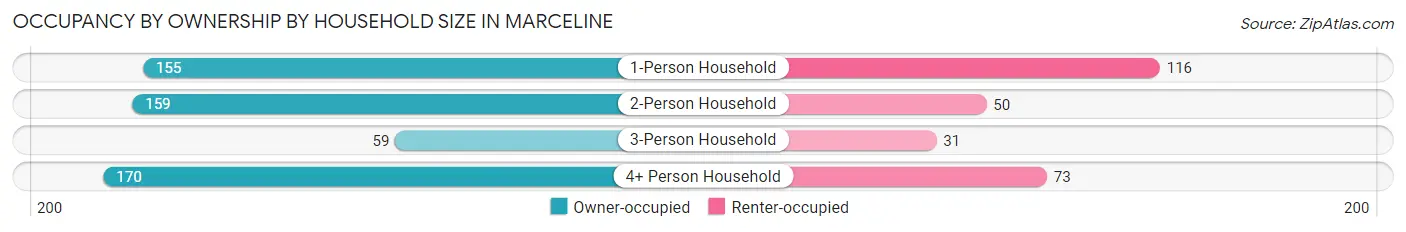
| Household Size | Owner-occupied | Renter-occupied |
| 1-Person Household | 155 (57.2%) | 116 (42.8%) |
| 2-Person Household | 159 (76.1%) | 50 (23.9%) |
| 3-Person Household | 59 (65.6%) | 31 (34.4%) |
| 4+ Person Household | 170 (70.0%) | 73 (30.0%) |
| Total Housing Units | 543 (66.8%) | 270 (33.2%) |
Occupancy by Educational Attainment in Marceline
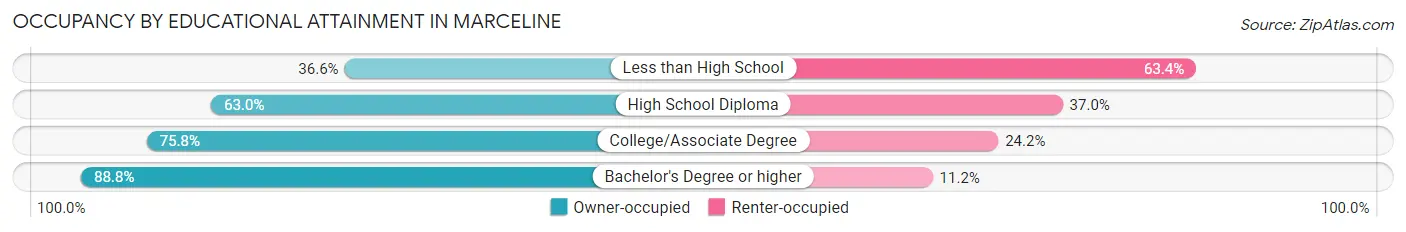
| Household Size | Owner-occupied | Renter-occupied |
| Less than High School | 30 (36.6%) | 52 (63.4%) |
| High School Diploma | 283 (63.0%) | 166 (37.0%) |
| College/Associate Degree | 119 (75.8%) | 38 (24.2%) |
| Bachelor's Degree or higher | 111 (88.8%) | 14 (11.2%) |
Occupancy by Age of Householder in Marceline
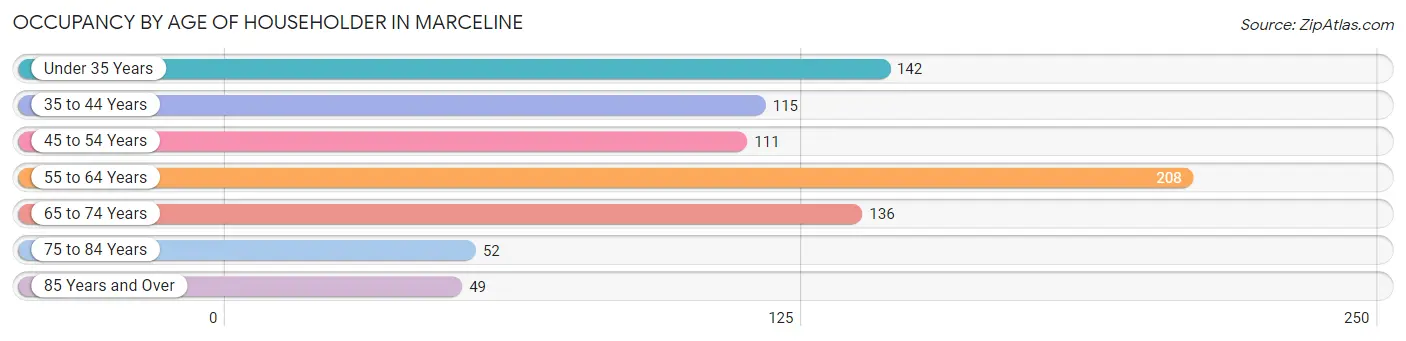
| Age Bracket | # Households | % Households |
| Under 35 Years | 142 | 17.5% |
| 35 to 44 Years | 115 | 14.1% |
| 45 to 54 Years | 111 | 13.7% |
| 55 to 64 Years | 208 | 25.6% |
| 65 to 74 Years | 136 | 16.7% |
| 75 to 84 Years | 52 | 6.4% |
| 85 Years and Over | 49 | 6.0% |
| Total | 813 | 100.0% |
Housing Finances in Marceline
Median Income by Occupancy in Marceline
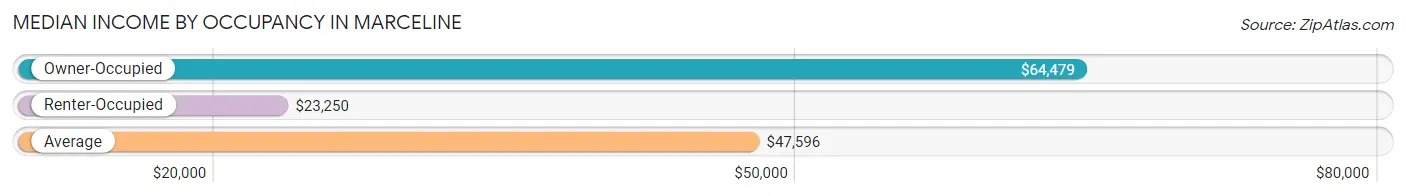
| Occupancy Type | # Households | Median Income |
| Owner-Occupied | 543 (66.8%) | $64,479 |
| Renter-Occupied | 270 (33.2%) | $23,250 |
| Average | 813 (100.0%) | $47,596 |
Occupancy by Householder Income Bracket in Marceline
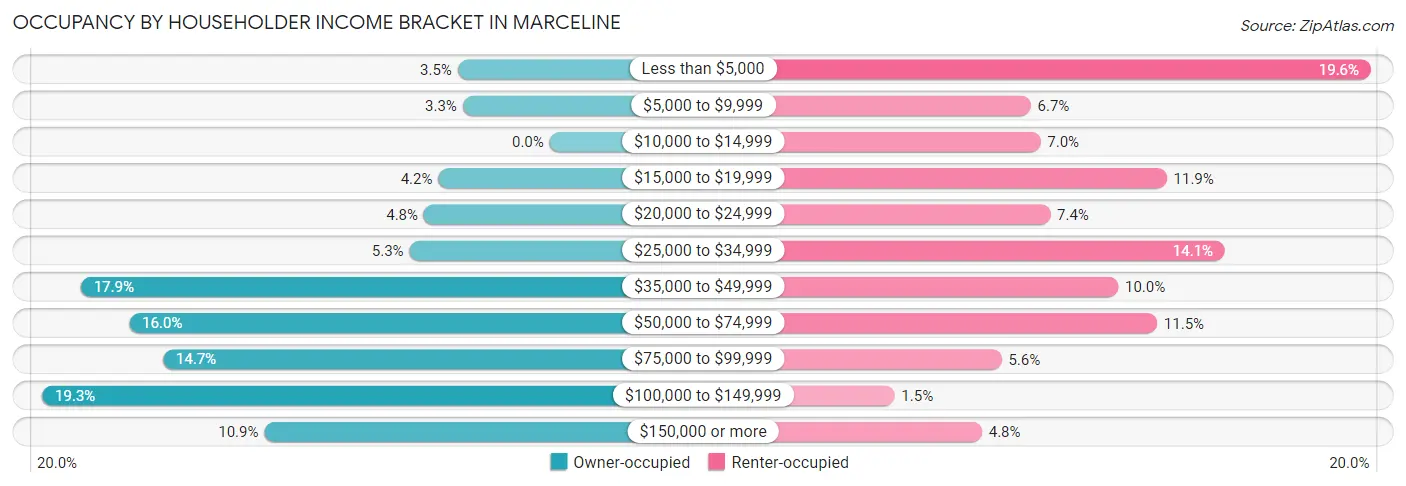
| Income Bracket | Owner-occupied | Renter-occupied |
| Less than $5,000 | 19 (3.5%) | 53 (19.6%) |
| $5,000 to $9,999 | 18 (3.3%) | 18 (6.7%) |
| $10,000 to $14,999 | 0 (0.0%) | 19 (7.0%) |
| $15,000 to $19,999 | 23 (4.2%) | 32 (11.8%) |
| $20,000 to $24,999 | 26 (4.8%) | 20 (7.4%) |
| $25,000 to $34,999 | 29 (5.3%) | 38 (14.1%) |
| $35,000 to $49,999 | 97 (17.9%) | 27 (10.0%) |
| $50,000 to $74,999 | 87 (16.0%) | 31 (11.5%) |
| $75,000 to $99,999 | 80 (14.7%) | 15 (5.6%) |
| $100,000 to $149,999 | 105 (19.3%) | 4 (1.5%) |
| $150,000 or more | 59 (10.9%) | 13 (4.8%) |
| Total | 543 (100.0%) | 270 (100.0%) |
Monthly Housing Cost Tiers in Marceline
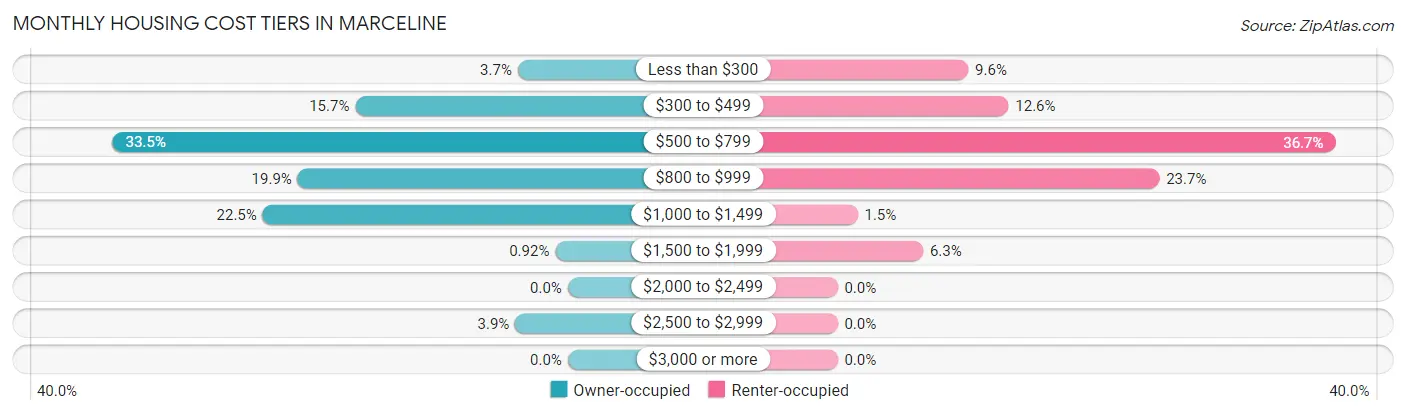
| Monthly Cost | Owner-occupied | Renter-occupied |
| Less than $300 | 20 (3.7%) | 26 (9.6%) |
| $300 to $499 | 85 (15.7%) | 34 (12.6%) |
| $500 to $799 | 182 (33.5%) | 99 (36.7%) |
| $800 to $999 | 108 (19.9%) | 64 (23.7%) |
| $1,000 to $1,499 | 122 (22.5%) | 4 (1.5%) |
| $1,500 to $1,999 | 5 (0.9%) | 17 (6.3%) |
| $2,000 to $2,499 | 0 (0.0%) | 0 (0.0%) |
| $2,500 to $2,999 | 21 (3.9%) | 0 (0.0%) |
| $3,000 or more | 0 (0.0%) | 0 (0.0%) |
| Total | 543 (100.0%) | 270 (100.0%) |
Physical Housing Characteristics in Marceline
Housing Structures in Marceline
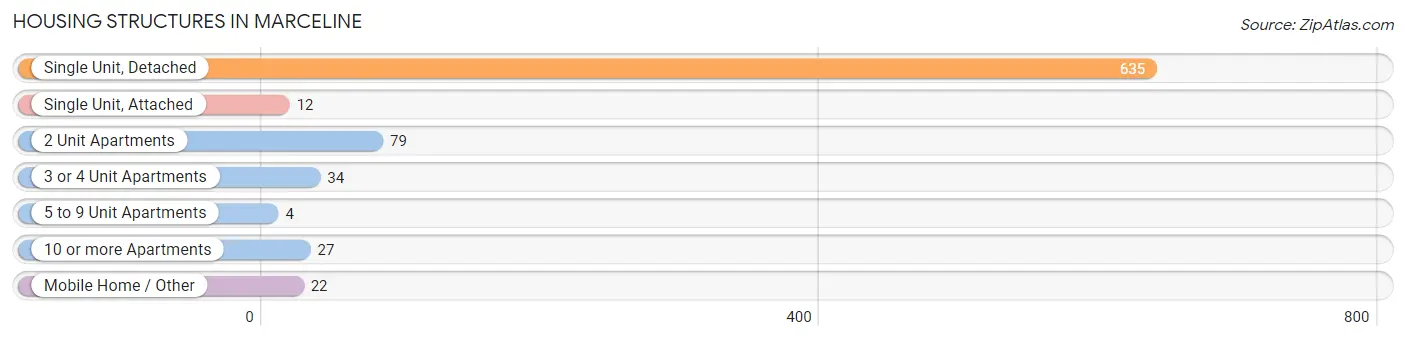
| Structure Type | # Housing Units | % Housing Units |
| Single Unit, Detached | 635 | 78.1% |
| Single Unit, Attached | 12 | 1.5% |
| 2 Unit Apartments | 79 | 9.7% |
| 3 or 4 Unit Apartments | 34 | 4.2% |
| 5 to 9 Unit Apartments | 4 | 0.5% |
| 10 or more Apartments | 27 | 3.3% |
| Mobile Home / Other | 22 | 2.7% |
| Total | 813 | 100.0% |
Housing Structures by Occupancy in Marceline
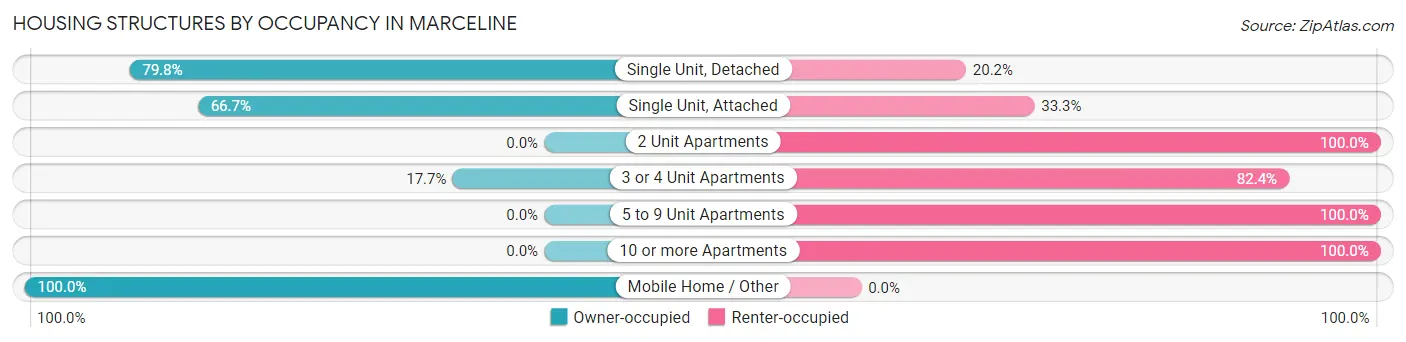
| Structure Type | Owner-occupied | Renter-occupied |
| Single Unit, Detached | 507 (79.8%) | 128 (20.2%) |
| Single Unit, Attached | 8 (66.7%) | 4 (33.3%) |
| 2 Unit Apartments | 0 (0.0%) | 79 (100.0%) |
| 3 or 4 Unit Apartments | 6 (17.6%) | 28 (82.4%) |
| 5 to 9 Unit Apartments | 0 (0.0%) | 4 (100.0%) |
| 10 or more Apartments | 0 (0.0%) | 27 (100.0%) |
| Mobile Home / Other | 22 (100.0%) | 0 (0.0%) |
| Total | 543 (66.8%) | 270 (33.2%) |
Housing Structures by Number of Rooms in Marceline
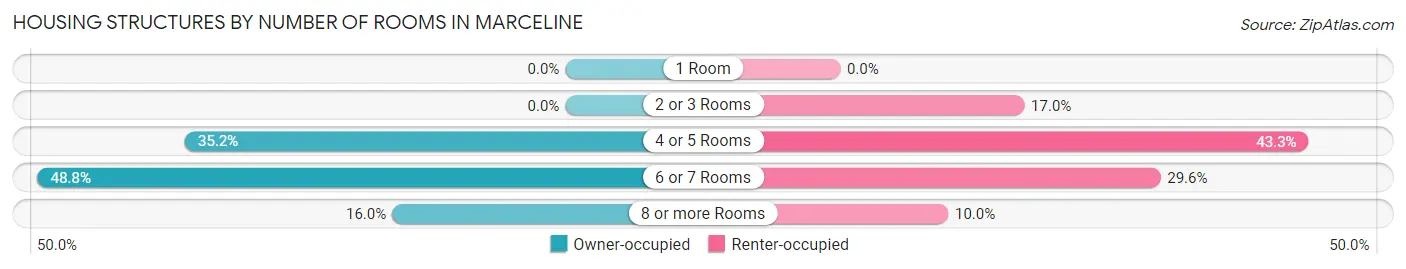
| Number of Rooms | Owner-occupied | Renter-occupied |
| 1 Room | 0 (0.0%) | 0 (0.0%) |
| 2 or 3 Rooms | 0 (0.0%) | 46 (17.0%) |
| 4 or 5 Rooms | 191 (35.2%) | 117 (43.3%) |
| 6 or 7 Rooms | 265 (48.8%) | 80 (29.6%) |
| 8 or more Rooms | 87 (16.0%) | 27 (10.0%) |
| Total | 543 (100.0%) | 270 (100.0%) |
Housing Structure by Heating Type in Marceline
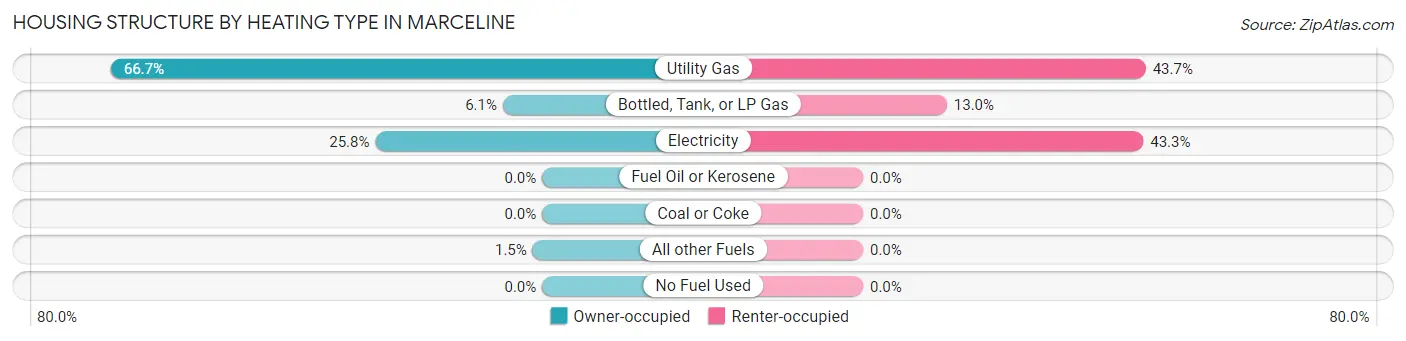
| Heating Type | Owner-occupied | Renter-occupied |
| Utility Gas | 362 (66.7%) | 118 (43.7%) |
| Bottled, Tank, or LP Gas | 33 (6.1%) | 35 (13.0%) |
| Electricity | 140 (25.8%) | 117 (43.3%) |
| Fuel Oil or Kerosene | 0 (0.0%) | 0 (0.0%) |
| Coal or Coke | 0 (0.0%) | 0 (0.0%) |
| All other Fuels | 8 (1.5%) | 0 (0.0%) |
| No Fuel Used | 0 (0.0%) | 0 (0.0%) |
| Total | 543 (100.0%) | 270 (100.0%) |
Household Vehicle Usage in Marceline
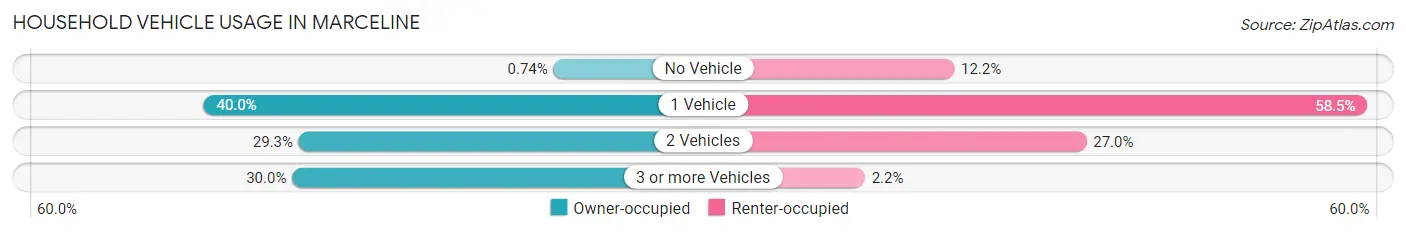
| Vehicles per Household | Owner-occupied | Renter-occupied |
| No Vehicle | 4 (0.7%) | 33 (12.2%) |
| 1 Vehicle | 217 (40.0%) | 158 (58.5%) |
| 2 Vehicles | 159 (29.3%) | 73 (27.0%) |
| 3 or more Vehicles | 163 (30.0%) | 6 (2.2%) |
| Total | 543 (100.0%) | 270 (100.0%) |
Real Estate & Mortgages in Marceline
Real Estate and Mortgage Overview in Marceline
| Characteristic | Without Mortgage | With Mortgage |
| Housing Units | 224 | 319 |
| Median Property Value | $108,300 | $84,200 |
| Median Household Income | $52,500 | $26 |
| Monthly Housing Costs | $514 | $0 |
| Real Estate Taxes | $743 | $6 |
Property Value by Mortgage Status in Marceline
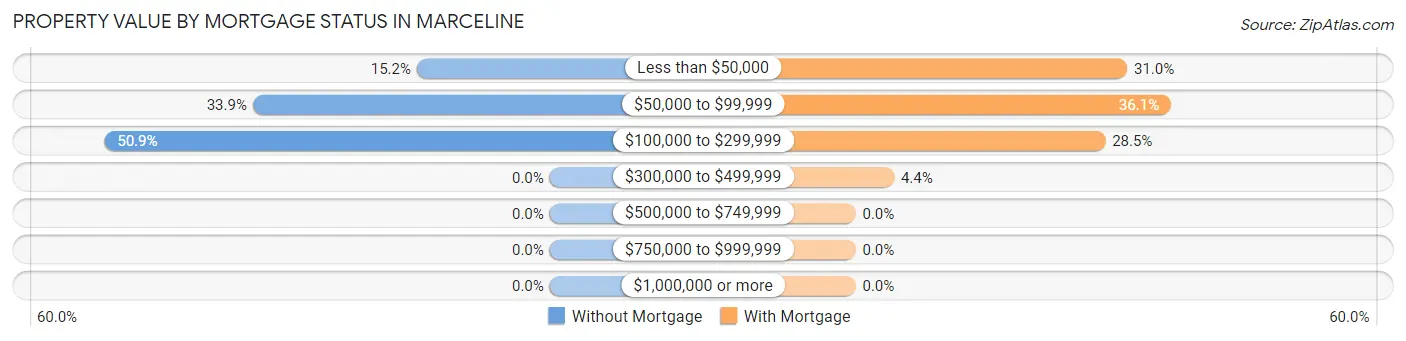
| Property Value | Without Mortgage | With Mortgage |
| Less than $50,000 | 34 (15.2%) | 99 (31.0%) |
| $50,000 to $99,999 | 76 (33.9%) | 115 (36.0%) |
| $100,000 to $299,999 | 114 (50.9%) | 91 (28.5%) |
| $300,000 to $499,999 | 0 (0.0%) | 14 (4.4%) |
| $500,000 to $749,999 | 0 (0.0%) | 0 (0.0%) |
| $750,000 to $999,999 | 0 (0.0%) | 0 (0.0%) |
| $1,000,000 or more | 0 (0.0%) | 0 (0.0%) |
| Total | 224 (100.0%) | 319 (100.0%) |
Household Income by Mortgage Status in Marceline
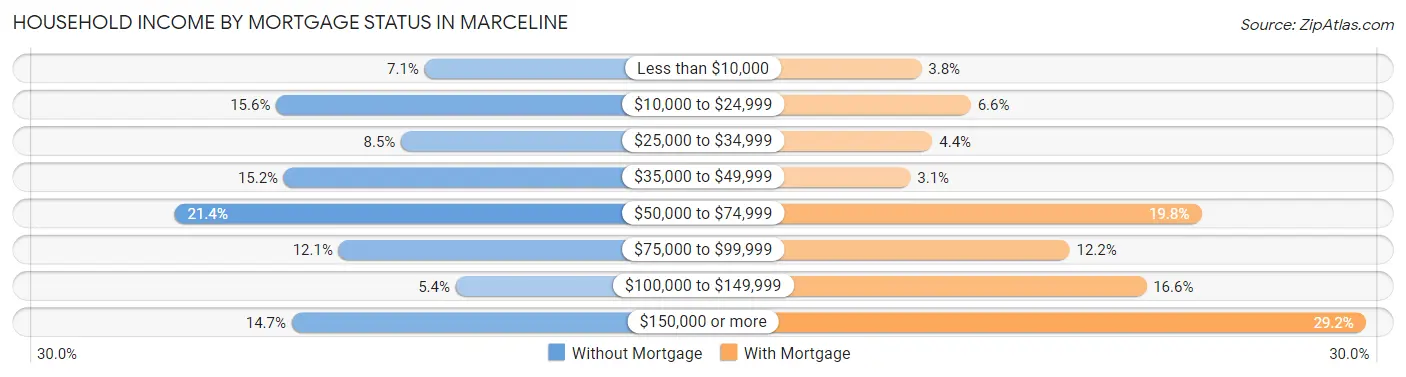
| Household Income | Without Mortgage | With Mortgage |
| Less than $10,000 | 16 (7.1%) | 12 (3.8%) |
| $10,000 to $24,999 | 35 (15.6%) | 21 (6.6%) |
| $25,000 to $34,999 | 19 (8.5%) | 14 (4.4%) |
| $35,000 to $49,999 | 34 (15.2%) | 10 (3.1%) |
| $50,000 to $74,999 | 48 (21.4%) | 63 (19.8%) |
| $75,000 to $99,999 | 27 (12.0%) | 39 (12.2%) |
| $100,000 to $149,999 | 12 (5.4%) | 53 (16.6%) |
| $150,000 or more | 33 (14.7%) | 93 (29.1%) |
| Total | 224 (100.0%) | 319 (100.0%) |
Property Value to Household Income Ratio in Marceline
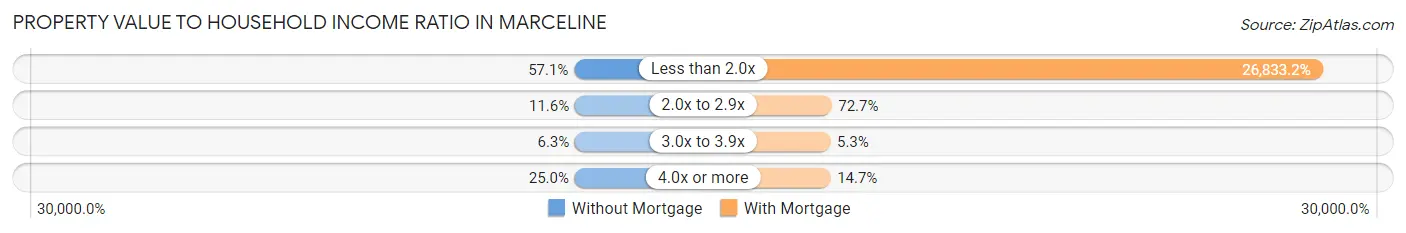
| Value-to-Income Ratio | Without Mortgage | With Mortgage |
| Less than 2.0x | 128 (57.1%) | 85,598 (26,833.2%) |
| 2.0x to 2.9x | 26 (11.6%) | 232 (72.7%) |
| 3.0x to 3.9x | 14 (6.2%) | 17 (5.3%) |
| 4.0x or more | 56 (25.0%) | 47 (14.7%) |
| Total | 224 (100.0%) | 319 (100.0%) |
Real Estate Taxes by Mortgage Status in Marceline
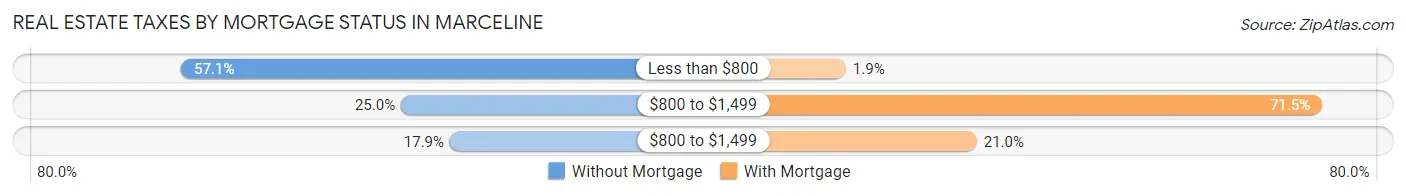
| Property Taxes | Without Mortgage | With Mortgage |
| Less than $800 | 128 (57.1%) | 6 (1.9%) |
| $800 to $1,499 | 56 (25.0%) | 228 (71.5%) |
| $800 to $1,499 | 40 (17.9%) | 67 (21.0%) |
| Total | 224 (100.0%) | 319 (100.0%) |
Health & Disability in Marceline
Health Insurance Coverage by Age in Marceline
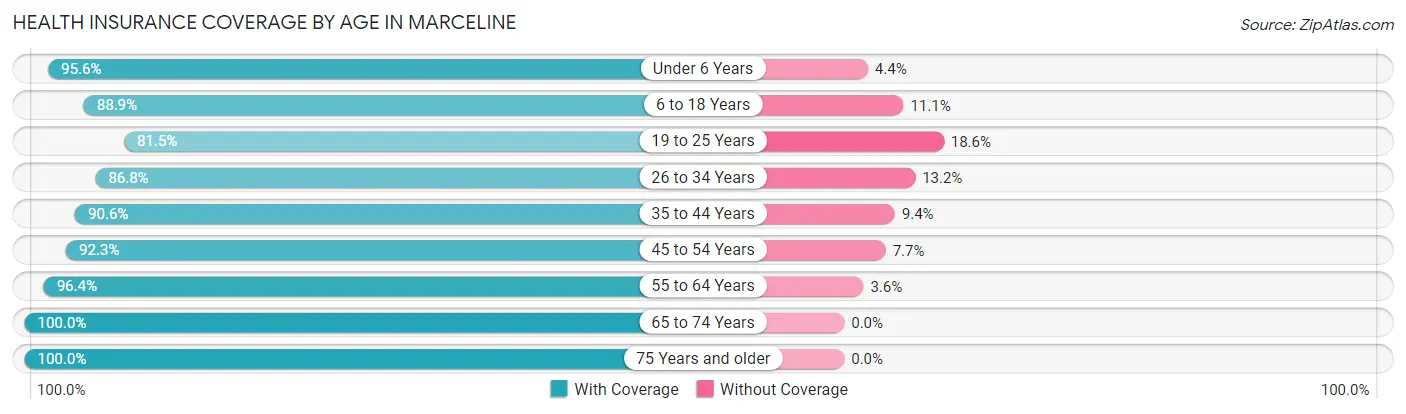
| Age Bracket | With Coverage | Without Coverage |
| Under 6 Years | 239 (95.6%) | 11 (4.4%) |
| 6 to 18 Years | 362 (88.9%) | 45 (11.1%) |
| 19 to 25 Years | 180 (81.5%) | 41 (18.5%) |
| 26 to 34 Years | 197 (86.8%) | 30 (13.2%) |
| 35 to 44 Years | 221 (90.6%) | 23 (9.4%) |
| 45 to 54 Years | 191 (92.3%) | 16 (7.7%) |
| 55 to 64 Years | 270 (96.4%) | 10 (3.6%) |
| 65 to 74 Years | 221 (100.0%) | 0 (0.0%) |
| 75 Years and older | 133 (100.0%) | 0 (0.0%) |
| Total | 2,014 (92.0%) | 176 (8.0%) |
Health Insurance Coverage by Citizenship Status in Marceline
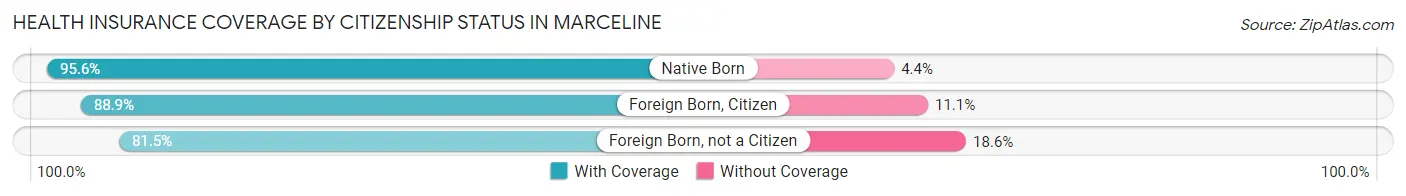
| Citizenship Status | With Coverage | Without Coverage |
| Native Born | 239 (95.6%) | 11 (4.4%) |
| Foreign Born, Citizen | 362 (88.9%) | 45 (11.1%) |
| Foreign Born, not a Citizen | 180 (81.5%) | 41 (18.5%) |
Health Insurance Coverage by Household Income in Marceline
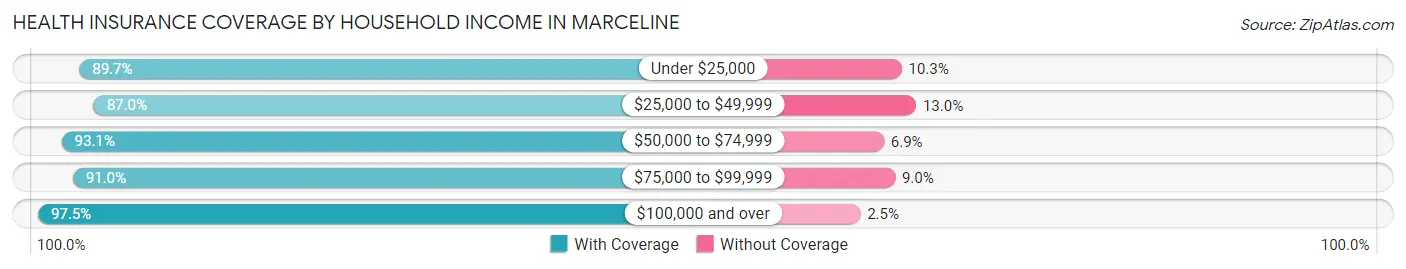
| Household Income | With Coverage | Without Coverage |
| Under $25,000 | 420 (89.7%) | 48 (10.3%) |
| $25,000 to $49,999 | 470 (87.0%) | 70 (13.0%) |
| $50,000 to $74,999 | 201 (93.1%) | 15 (6.9%) |
| $75,000 to $99,999 | 262 (91.0%) | 26 (9.0%) |
| $100,000 and over | 661 (97.5%) | 17 (2.5%) |
Public vs Private Health Insurance Coverage by Age in Marceline
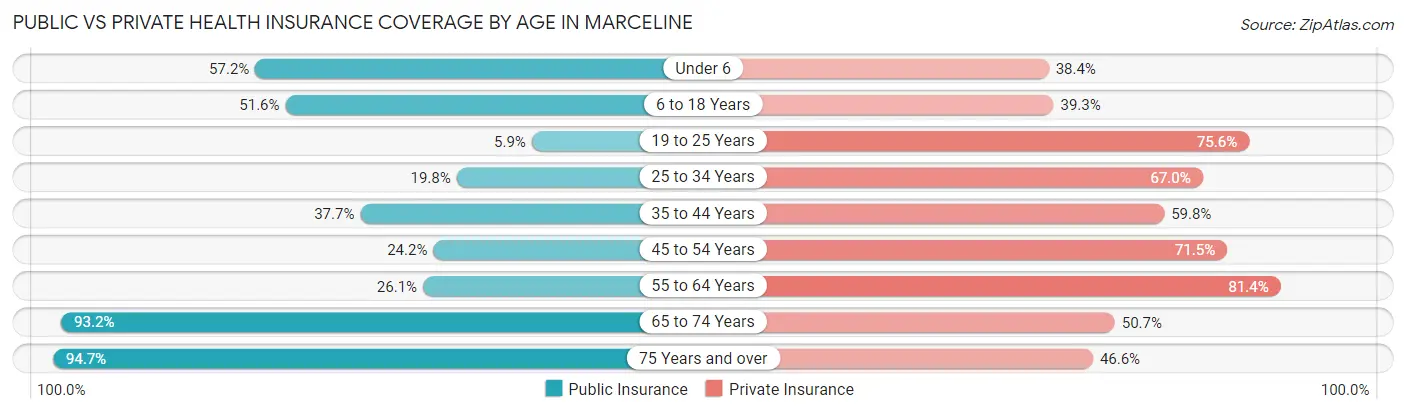
| Age Bracket | Public Insurance | Private Insurance |
| Under 6 | 143 (57.2%) | 96 (38.4%) |
| 6 to 18 Years | 210 (51.6%) | 160 (39.3%) |
| 19 to 25 Years | 13 (5.9%) | 167 (75.6%) |
| 25 to 34 Years | 45 (19.8%) | 152 (67.0%) |
| 35 to 44 Years | 92 (37.7%) | 146 (59.8%) |
| 45 to 54 Years | 50 (24.1%) | 148 (71.5%) |
| 55 to 64 Years | 73 (26.1%) | 228 (81.4%) |
| 65 to 74 Years | 206 (93.2%) | 112 (50.7%) |
| 75 Years and over | 126 (94.7%) | 62 (46.6%) |
| Total | 958 (43.7%) | 1,271 (58.0%) |
Disability Status by Sex by Age in Marceline
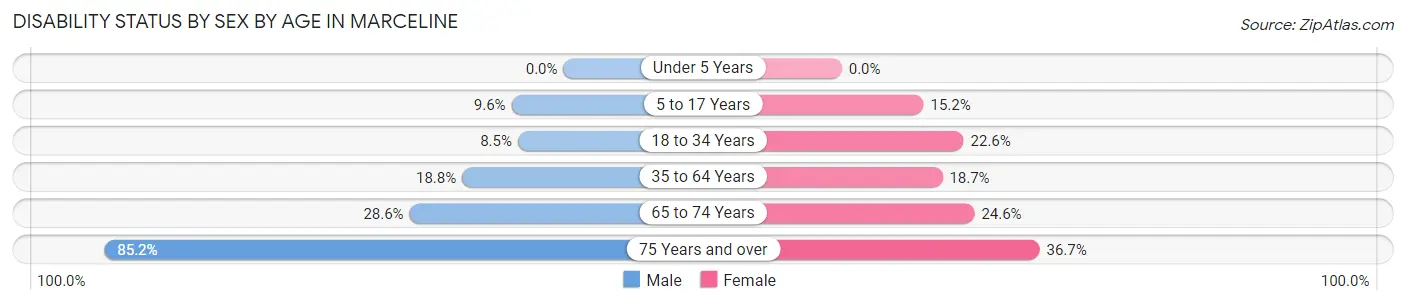
| Age Bracket | Male | Female |
| Under 5 Years | 0 (0.0%) | 0 (0.0%) |
| 5 to 17 Years | 21 (9.6%) | 34 (15.2%) |
| 18 to 34 Years | 22 (8.5%) | 52 (22.6%) |
| 35 to 64 Years | 69 (18.8%) | 68 (18.7%) |
| 65 to 74 Years | 26 (28.6%) | 32 (24.6%) |
| 75 Years and over | 46 (85.2%) | 29 (36.7%) |
Disability Class by Sex by Age in Marceline
Disability Class: Hearing Difficulty
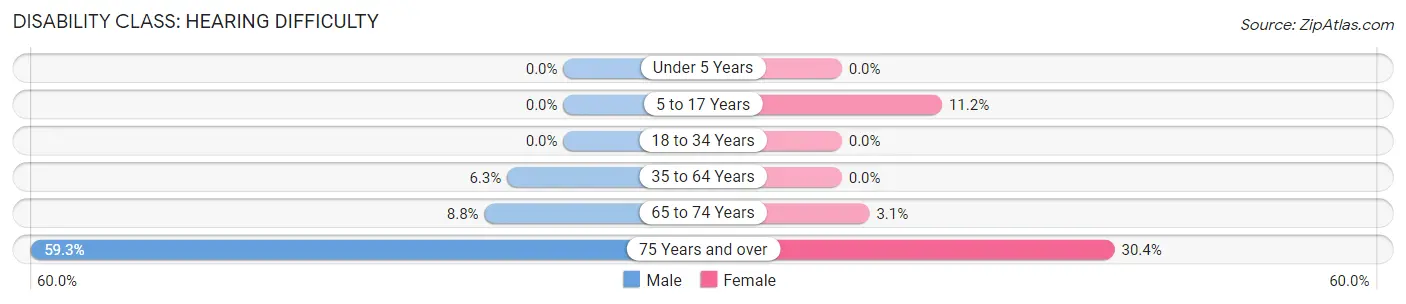
| Age Bracket | Male | Female |
| Under 5 Years | 0 (0.0%) | 0 (0.0%) |
| 5 to 17 Years | 0 (0.0%) | 25 (11.2%) |
| 18 to 34 Years | 0 (0.0%) | 0 (0.0%) |
| 35 to 64 Years | 23 (6.3%) | 0 (0.0%) |
| 65 to 74 Years | 8 (8.8%) | 4 (3.1%) |
| 75 Years and over | 32 (59.3%) | 24 (30.4%) |
Disability Class: Vision Difficulty
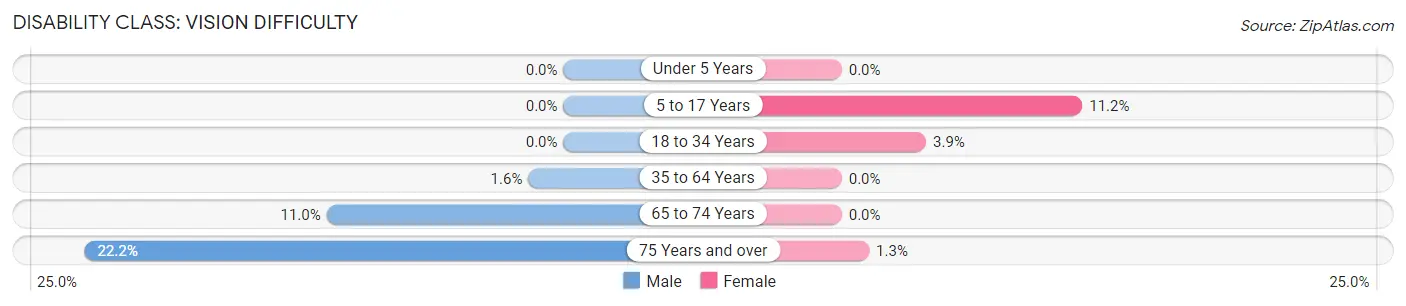
| Age Bracket | Male | Female |
| Under 5 Years | 0 (0.0%) | 0 (0.0%) |
| 5 to 17 Years | 0 (0.0%) | 25 (11.2%) |
| 18 to 34 Years | 0 (0.0%) | 9 (3.9%) |
| 35 to 64 Years | 6 (1.6%) | 0 (0.0%) |
| 65 to 74 Years | 10 (11.0%) | 0 (0.0%) |
| 75 Years and over | 12 (22.2%) | 1 (1.3%) |
Disability Class: Cognitive Difficulty
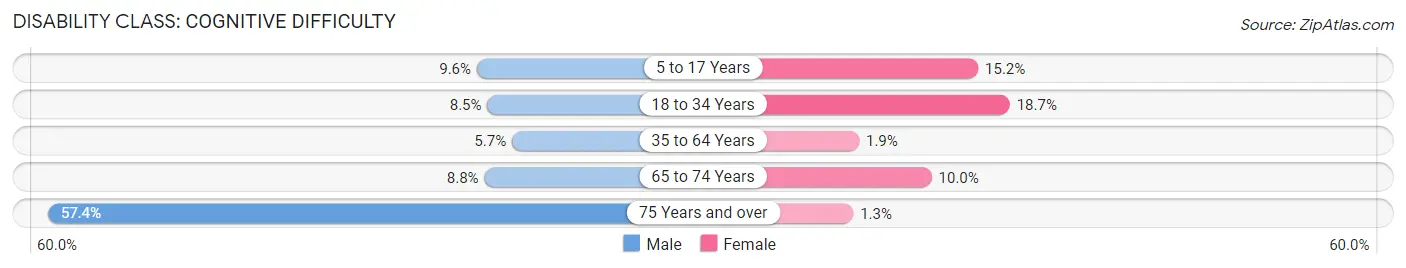
| Age Bracket | Male | Female |
| 5 to 17 Years | 21 (9.6%) | 34 (15.2%) |
| 18 to 34 Years | 22 (8.5%) | 43 (18.7%) |
| 35 to 64 Years | 21 (5.7%) | 7 (1.9%) |
| 65 to 74 Years | 8 (8.8%) | 13 (10.0%) |
| 75 Years and over | 31 (57.4%) | 1 (1.3%) |
Disability Class: Ambulatory Difficulty
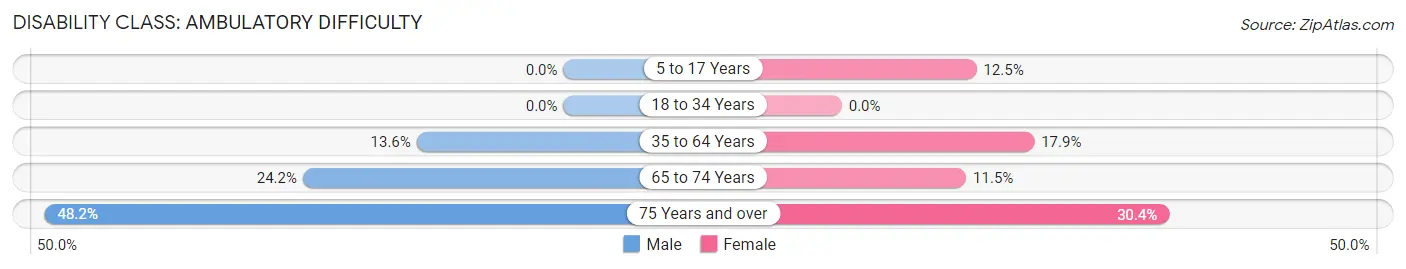
| Age Bracket | Male | Female |
| 5 to 17 Years | 0 (0.0%) | 28 (12.5%) |
| 18 to 34 Years | 0 (0.0%) | 0 (0.0%) |
| 35 to 64 Years | 50 (13.6%) | 65 (17.9%) |
| 65 to 74 Years | 22 (24.2%) | 15 (11.5%) |
| 75 Years and over | 26 (48.1%) | 24 (30.4%) |
Disability Class: Self-Care Difficulty
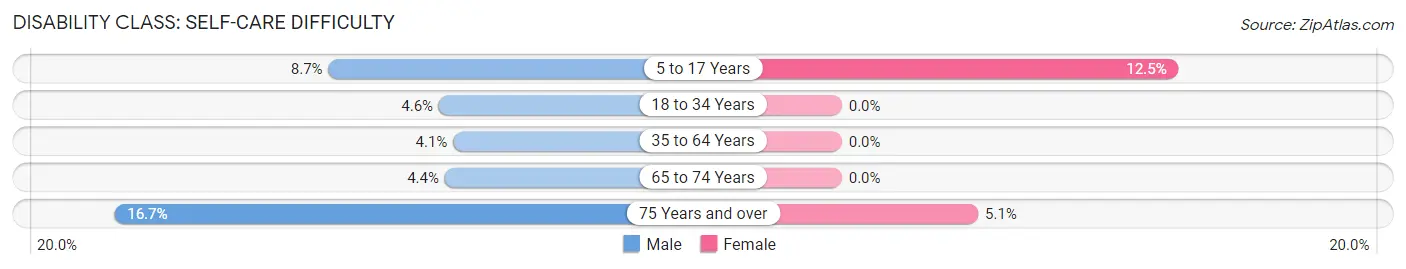
| Age Bracket | Male | Female |
| 5 to 17 Years | 19 (8.7%) | 28 (12.5%) |
| 18 to 34 Years | 12 (4.6%) | 0 (0.0%) |
| 35 to 64 Years | 15 (4.1%) | 0 (0.0%) |
| 65 to 74 Years | 4 (4.4%) | 0 (0.0%) |
| 75 Years and over | 9 (16.7%) | 4 (5.1%) |
Technology Access in Marceline
Computing Device Access in Marceline
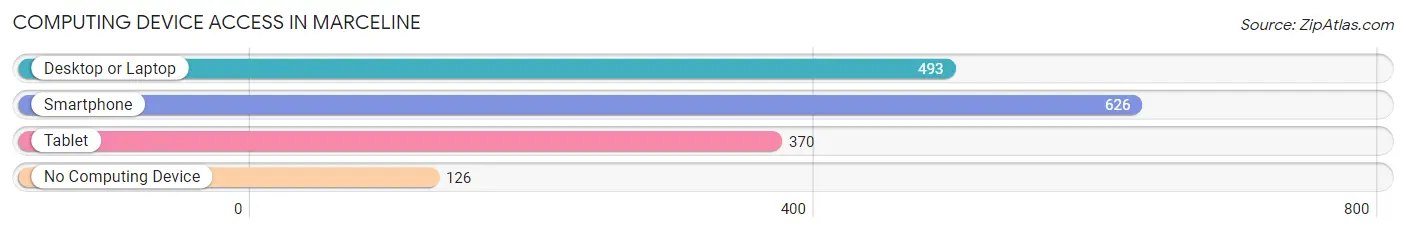
| Device Type | # Households | % Households |
| Desktop or Laptop | 493 | 60.6% |
| Smartphone | 626 | 77.0% |
| Tablet | 370 | 45.5% |
| No Computing Device | 126 | 15.5% |
| Total | 813 | 100.0% |
Internet Access in Marceline
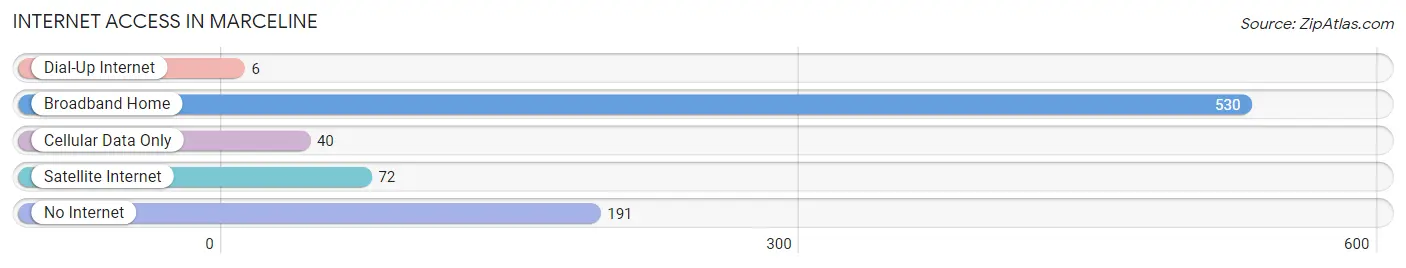
| Internet Type | # Households | % Households |
| Dial-Up Internet | 6 | 0.7% |
| Broadband Home | 530 | 65.2% |
| Cellular Data Only | 40 | 4.9% |
| Satellite Internet | 72 | 8.9% |
| No Internet | 191 | 23.5% |
| Total | 813 | 100.0% |
Marceline Summary
Marceline, Missouri is a small town located in Linn County, in the north-central part of the state. It is situated along the Chariton River, and is the birthplace of Walt Disney. The town has a population of 2,221, according to the 2010 census.
History
Marceline was founded in 1887 by the Santa Fe Railroad. The town was named after Marcelline, the daughter of a railroad official. The town was incorporated in 1891.
Marceline was the childhood home of Walt Disney, who lived there from 1906 to 1911. He attended school in Marceline, and his family owned a farm just outside of town. Disney's memories of Marceline were the inspiration for many of his films, including "Snow White and the Seven Dwarfs" and "Bambi".
Geography
Marceline is located in north-central Missouri, in Linn County. It is situated along the Chariton River, and is about 50 miles east of Kansas City. The town has a total area of 1.3 square miles, all of which is land.
Economy
Marceline's economy is largely based on agriculture. The town is home to several large farms, and the surrounding area is known for its production of corn, soybeans, and wheat.
Marceline is also home to several small businesses, including a grocery store, a hardware store, and a restaurant. The town is also home to the Walt Disney Hometown Museum, which celebrates the life and work of Walt Disney.
Demographics
According to the 2010 census, Marceline has a population of 2,221. The median age is 38.7 years, and the median household income is $37,917. The town is predominantly white (95.2%), with a small African American population (2.2%).
Marceline is served by the Marceline R-V School District, which includes an elementary school, a middle school, and a high school. The town is also home to the Marceline Public Library.
Marceline is a small town with a rich history and a strong sense of community. It is the birthplace of Walt Disney, and his memories of the town have inspired many of his films. The town's economy is largely based on agriculture, and it is home to several small businesses. Marceline is a diverse community, with a population of 2,221, according to the 2010 census.
Common Questions
What is Per Capita Income in Marceline?
Per Capita income in Marceline is $26,767.
What is the Median Family Income in Marceline?
Median Family Income in Marceline is $51,000.
What is the Median Household income in Marceline?
Median Household Income in Marceline is $47,596.
What is Income or Wage Gap in Marceline?
Income or Wage Gap in Marceline is 26.2%.
Women in Marceline earn 73.8 cents for every dollar earned by a man.
What is Inequality or Gini Index in Marceline?
Inequality or Gini Index in Marceline is 0.46.
What is the Total Population of Marceline?
Total Population of Marceline is 2,190.
What is the Total Male Population of Marceline?
Total Male Population of Marceline is 1,098.
What is the Total Female Population of Marceline?
Total Female Population of Marceline is 1,092.
What is the Ratio of Males per 100 Females in Marceline?
There are 100.55 Males per 100 Females in Marceline.
What is the Ratio of Females per 100 Males in Marceline?
There are 99.45 Females per 100 Males in Marceline.
What is the Median Population Age in Marceline?
Median Population Age in Marceline is 34.2 Years.
What is the Average Family Size in Marceline
Average Family Size in Marceline is 3.4 People.
What is the Average Household Size in Marceline
Average Household Size in Marceline is 2.7 People.
How Large is the Labor Force in Marceline?
There are 982 People in the Labor Forcein in Marceline.
What is the Percentage of People in the Labor Force in Marceline?
61.1% of People are in the Labor Force in Marceline.
What is the Unemployment Rate in Marceline?
Unemployment Rate in Marceline is 4.5%.