Madison, MO Map & Demographics
Madison Map
Madison Overview
$21,495
PER CAPITA INCOME
$51,042
AVG FAMILY INCOME
$42,500
AVG HOUSEHOLD INCOME
31.0%
WAGE / INCOME GAP [ % ]
69.0¢/ $1
WAGE / INCOME GAP [ $ ]
0.39
INEQUALITY / GINI INDEX
389
TOTAL POPULATION
185
MALE POPULATION
204
FEMALE POPULATION
90.69
MALES / 100 FEMALES
110.27
FEMALES / 100 MALES
34.6
MEDIAN AGE
3.4
AVG FAMILY SIZE
2.4
AVG HOUSEHOLD SIZE
175
LABOR FORCE [ PEOPLE ]
59.7%
PERCENT IN LABOR FORCE
Madison Zip Codes
Madison Area Codes
Income in Madison
Income Overview in Madison
Per Capita Income in Madison is $21,495, while median incomes of families and households are $51,042 and $42,500 respectively.
| Characteristic | Number | Measure |
| Per Capita Income | 389 | $21,495 |
| Median Family Income | 91 | $51,042 |
| Mean Family Income | 91 | $53,602 |
| Median Household Income | 160 | $42,500 |
| Mean Household Income | 160 | $44,643 |
| Income Deficit | 91 | $0 |
| Wage / Income Gap (%) | 389 | 30.98% |
| Wage / Income Gap ($) | 389 | 69.02¢ per $1 |
| Gini / Inequality Index | 389 | 0.39 |
Earnings by Sex in Madison
Average Earnings in Madison are $36,116, $39,205 for men and $27,059 for women, a difference of 31.0%.
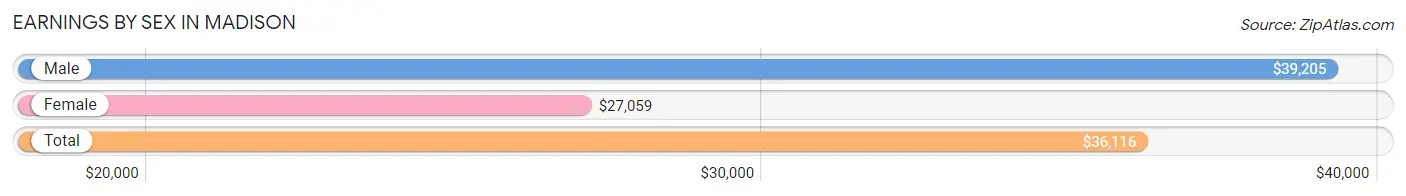
| Sex | Number | Average Earnings |
| Male | 93 (52.5%) | $39,205 |
| Female | 84 (47.5%) | $27,059 |
| Total | 177 (100.0%) | $36,116 |
Earnings by Sex by Income Bracket in Madison
The most common earnings brackets in Madison are $35,000 to $39,999 for men (28 | 30.1%) and $25,000 to $29,999 for women (22 | 26.2%).
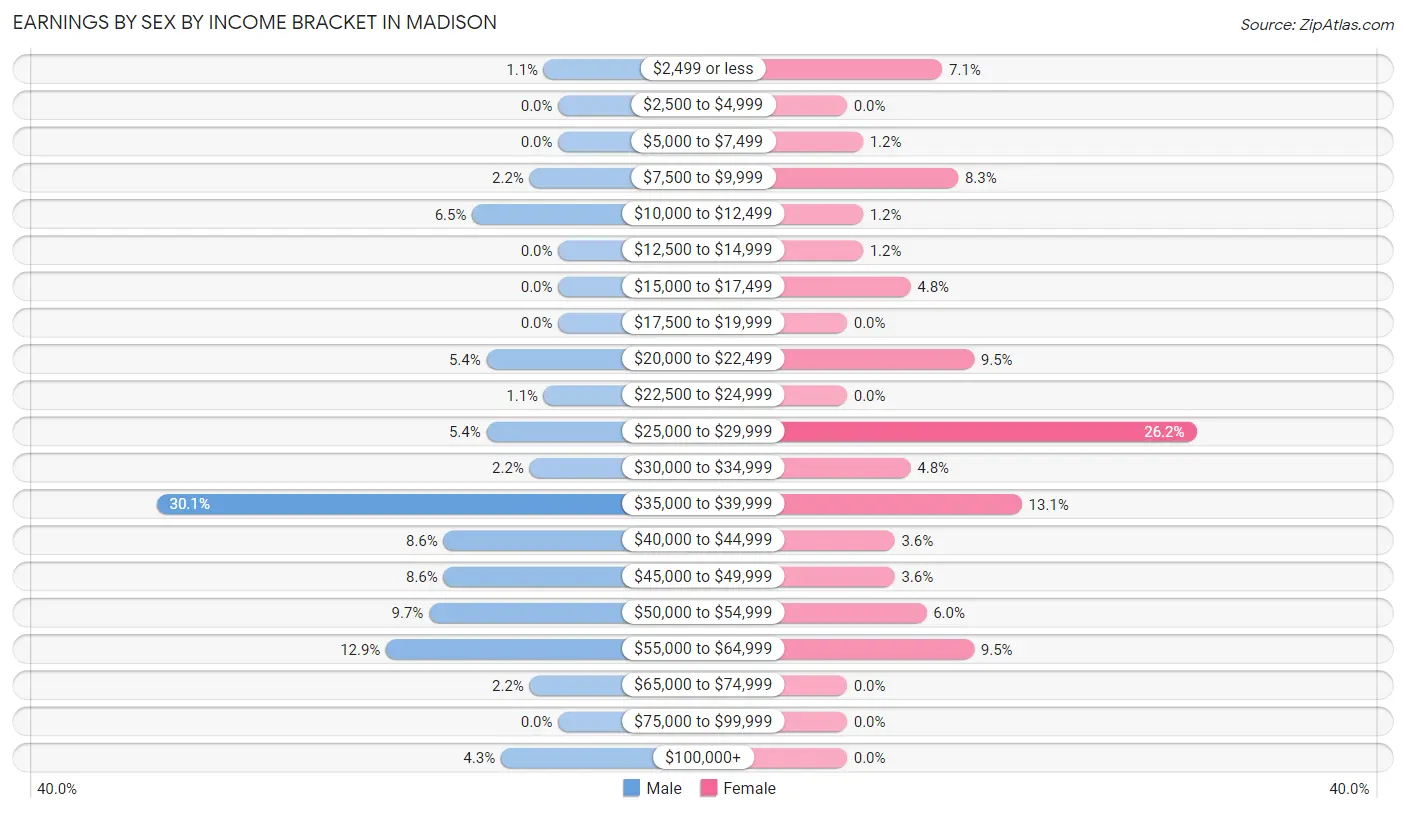
| Income | Male | Female |
| $2,499 or less | 1 (1.1%) | 6 (7.1%) |
| $2,500 to $4,999 | 0 (0.0%) | 0 (0.0%) |
| $5,000 to $7,499 | 0 (0.0%) | 1 (1.2%) |
| $7,500 to $9,999 | 2 (2.1%) | 7 (8.3%) |
| $10,000 to $12,499 | 6 (6.5%) | 1 (1.2%) |
| $12,500 to $14,999 | 0 (0.0%) | 1 (1.2%) |
| $15,000 to $17,499 | 0 (0.0%) | 4 (4.8%) |
| $17,500 to $19,999 | 0 (0.0%) | 0 (0.0%) |
| $20,000 to $22,499 | 5 (5.4%) | 8 (9.5%) |
| $22,500 to $24,999 | 1 (1.1%) | 0 (0.0%) |
| $25,000 to $29,999 | 5 (5.4%) | 22 (26.2%) |
| $30,000 to $34,999 | 2 (2.1%) | 4 (4.8%) |
| $35,000 to $39,999 | 28 (30.1%) | 11 (13.1%) |
| $40,000 to $44,999 | 8 (8.6%) | 3 (3.6%) |
| $45,000 to $49,999 | 8 (8.6%) | 3 (3.6%) |
| $50,000 to $54,999 | 9 (9.7%) | 5 (5.9%) |
| $55,000 to $64,999 | 12 (12.9%) | 8 (9.5%) |
| $65,000 to $74,999 | 2 (2.1%) | 0 (0.0%) |
| $75,000 to $99,999 | 0 (0.0%) | 0 (0.0%) |
| $100,000+ | 4 (4.3%) | 0 (0.0%) |
| Total | 93 (100.0%) | 84 (100.0%) |
Earnings by Sex by Educational Attainment in Madison
Average earnings in Madison are $39,659 for men and $28,750 for women, a difference of 27.5%. Men with an educational attainment of high school diploma enjoy the highest average annual earnings of $39,318, while those with college or associate's degree education earn the least with $36,944. Women with an educational attainment of college or associate's degree earn the most with the average annual earnings of $29,000, while those with high school diploma education have the smallest earnings of $26,875.
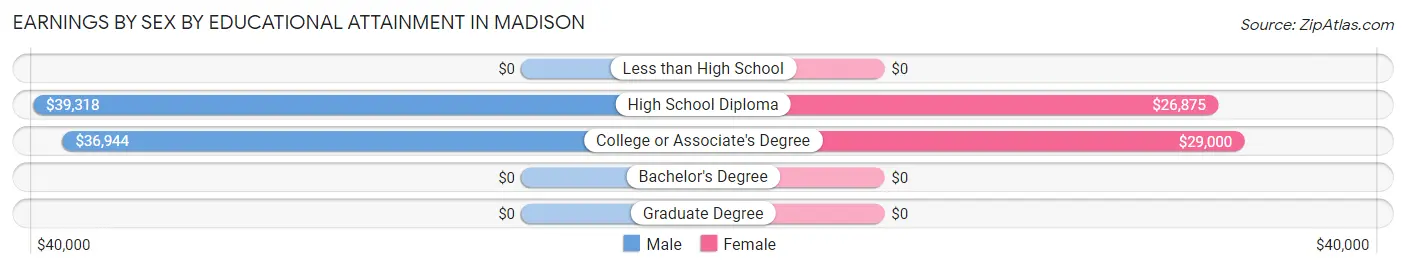
| Educational Attainment | Male Income | Female Income |
| Less than High School | - | - |
| High School Diploma | $39,318 | $26,875 |
| College or Associate's Degree | $36,944 | $29,000 |
| Bachelor's Degree | - | - |
| Graduate Degree | - | - |
| Total | $39,659 | $28,750 |
Family Income in Madison
Family Income Brackets in Madison
According to the Madison family income data, there are 26 families falling into the $50,000 to $74,999 income range, which is the most common income bracket and makes up 28.6% of all families.
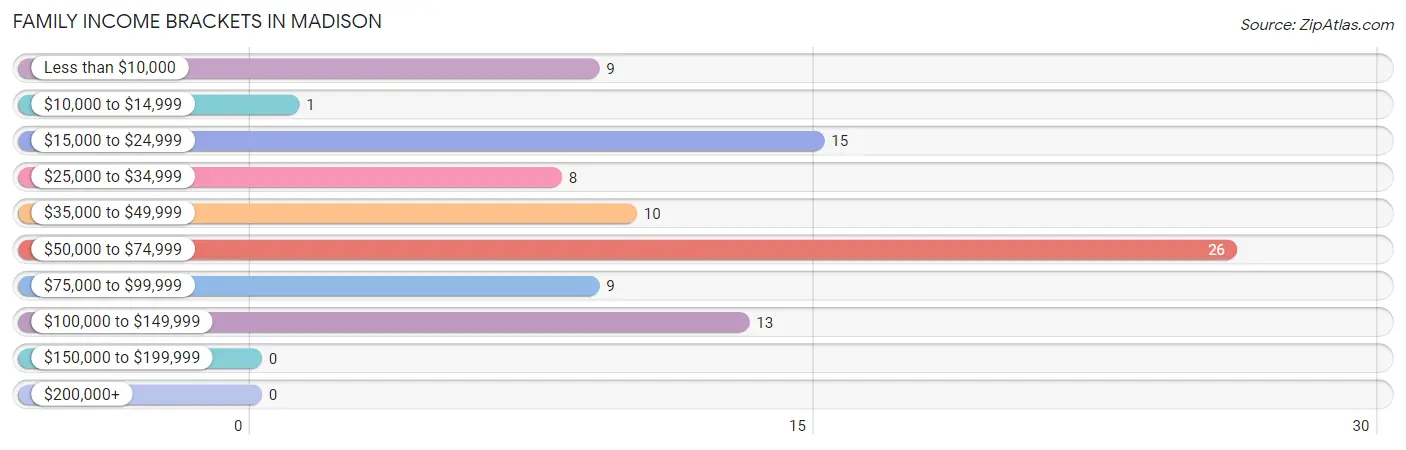
| Income Bracket | # Families | % Families |
| Less than $10,000 | 9 | 9.9% |
| $10,000 to $14,999 | 1 | 1.1% |
| $15,000 to $24,999 | 15 | 16.5% |
| $25,000 to $34,999 | 8 | 8.8% |
| $35,000 to $49,999 | 10 | 11.0% |
| $50,000 to $74,999 | 26 | 28.6% |
| $75,000 to $99,999 | 9 | 9.9% |
| $100,000 to $149,999 | 13 | 14.3% |
| $150,000 to $199,999 | 0 | 0.0% |
| $200,000+ | 0 | 0.0% |
Family Income by Famaliy Size in Madison
4-person families (23 | 25.3%) account for the highest median family income in Madison with $61,607 per family, while 2-person families (46 | 50.5%) have the highest median income of $23,438 per family member.
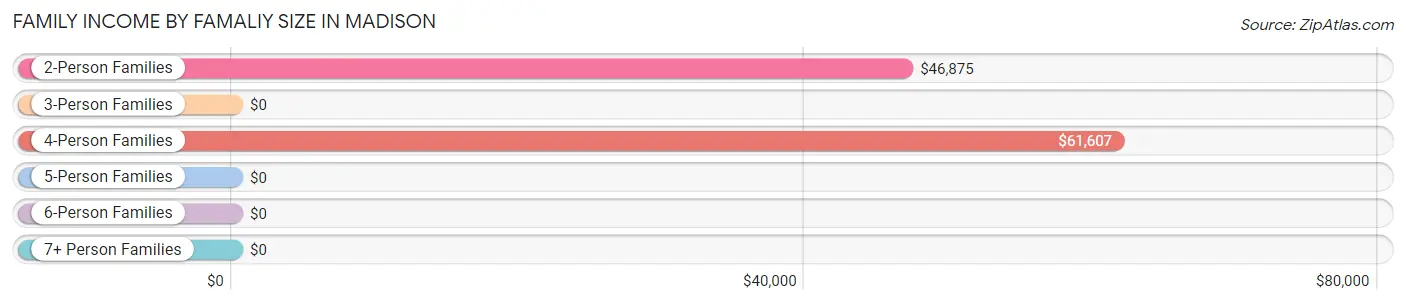
| Income Bracket | # Families | Median Income |
| 2-Person Families | 46 (50.5%) | $46,875 |
| 3-Person Families | 18 (19.8%) | $0 |
| 4-Person Families | 23 (25.3%) | $61,607 |
| 5-Person Families | 1 (1.1%) | $0 |
| 6-Person Families | 3 (3.3%) | $0 |
| 7+ Person Families | 0 (0.0%) | $0 |
| Total | 91 (100.0%) | $51,042 |
Family Income by Number of Earners in Madison
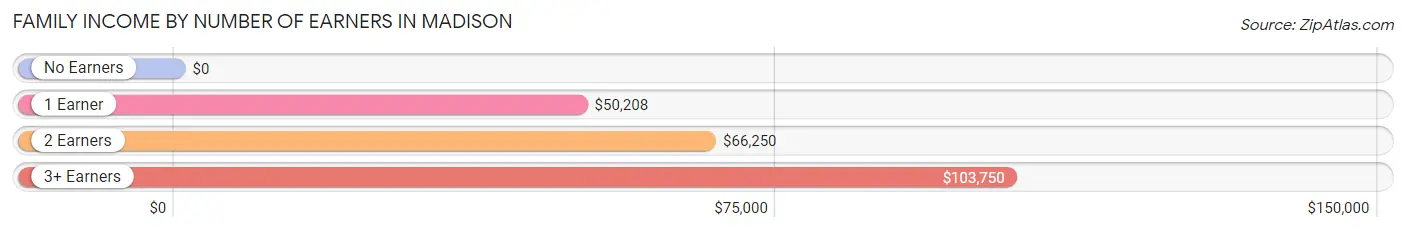
| Number of Earners | # Families | Median Income |
| No Earners | 29 (31.9%) | $0 |
| 1 Earner | 27 (29.7%) | $50,208 |
| 2 Earners | 30 (33.0%) | $66,250 |
| 3+ Earners | 5 (5.5%) | $103,750 |
| Total | 91 (100.0%) | $51,042 |
Household Income in Madison
Household Income Brackets in Madison
With 39 households falling in the category, the $50,000 to $74,999 income range is the most frequent in Madison, accounting for 24.4% of all households.
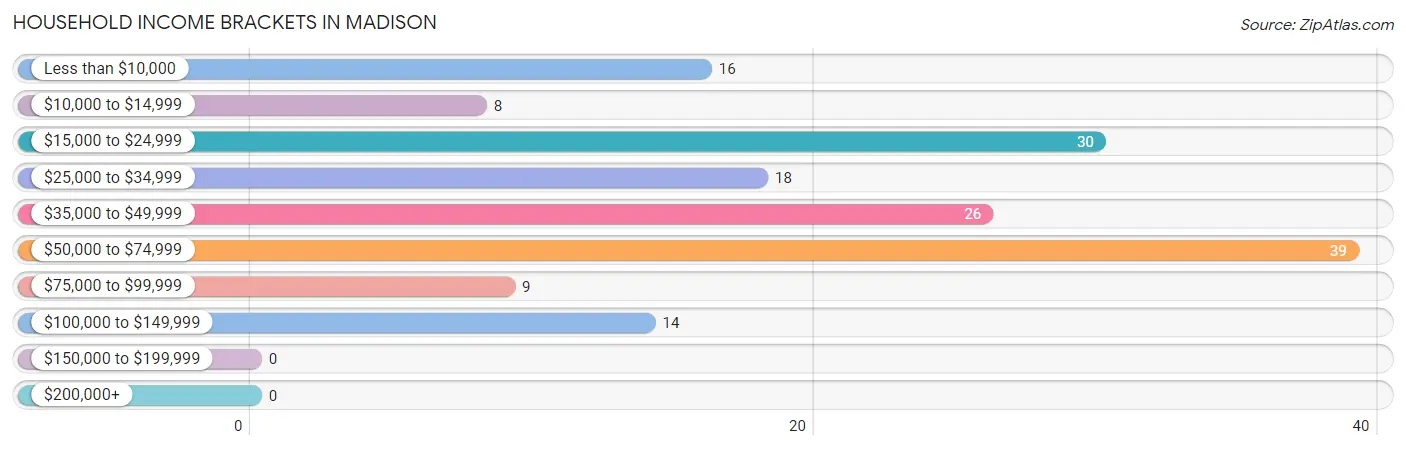
| Income Bracket | # Households | % Households |
| Less than $10,000 | 16 | 10.0% |
| $10,000 to $14,999 | 8 | 5.0% |
| $15,000 to $24,999 | 30 | 18.8% |
| $25,000 to $34,999 | 18 | 11.3% |
| $35,000 to $49,999 | 26 | 16.3% |
| $50,000 to $74,999 | 39 | 24.4% |
| $75,000 to $99,999 | 9 | 5.6% |
| $100,000 to $149,999 | 14 | 8.8% |
| $150,000 to $199,999 | 0 | 0.0% |
| $200,000+ | 0 | 0.0% |
Household Income by Householder Age in Madison
The median household income in Madison is $42,500, with the highest median household income of $54,583 found in the 25 to 44 years age bracket for the primary householder. A total of 45 households (28.1%) fall into this category. Meanwhile, the 45 to 64 years age bracket for the primary householder has the lowest median household income of $30,000, with 52 households (32.5%) in this group.
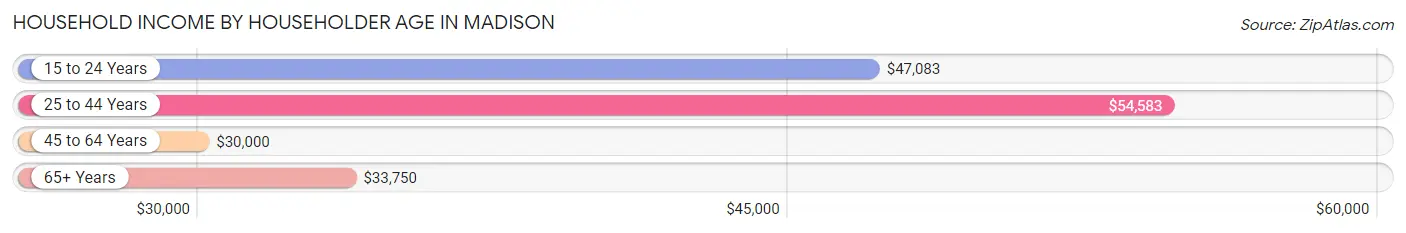
| Income Bracket | # Households | Median Income |
| 15 to 24 Years | 9 (5.6%) | $47,083 |
| 25 to 44 Years | 45 (28.1%) | $54,583 |
| 45 to 64 Years | 52 (32.5%) | $30,000 |
| 65+ Years | 54 (33.8%) | $33,750 |
| Total | 160 (100.0%) | $42,500 |
Poverty in Madison
Income Below Poverty by Sex and Age in Madison
With 10.8% poverty level for males and 25.5% for females among the residents of Madison, 5 year old males and 6 to 11 year old females are the most vulnerable to poverty, with 9 males (100.0%) and 15 females (75.0%) in their respective age groups living below the poverty level.
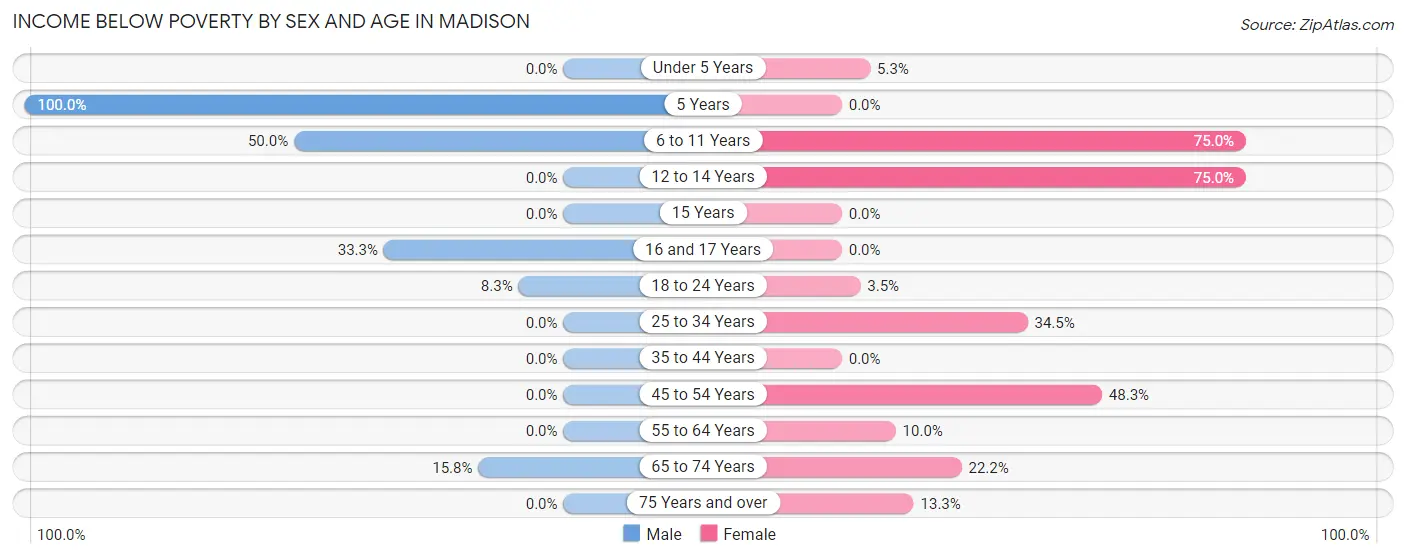
| Age Bracket | Male | Female |
| Under 5 Years | 0 (0.0%) | 1 (5.3%) |
| 5 Years | 9 (100.0%) | 0 (0.0%) |
| 6 to 11 Years | 6 (50.0%) | 15 (75.0%) |
| 12 to 14 Years | 0 (0.0%) | 3 (75.0%) |
| 15 Years | 0 (0.0%) | 0 (0.0%) |
| 16 and 17 Years | 1 (33.3%) | 0 (0.0%) |
| 18 to 24 Years | 1 (8.3%) | 1 (3.5%) |
| 25 to 34 Years | 0 (0.0%) | 10 (34.5%) |
| 35 to 44 Years | 0 (0.0%) | 0 (0.0%) |
| 45 to 54 Years | 0 (0.0%) | 14 (48.3%) |
| 55 to 64 Years | 0 (0.0%) | 2 (10.0%) |
| 65 to 74 Years | 3 (15.8%) | 4 (22.2%) |
| 75 Years and over | 0 (0.0%) | 2 (13.3%) |
| Total | 20 (10.8%) | 52 (25.5%) |
Income Above Poverty by Sex and Age in Madison
According to the poverty statistics in Madison, males aged under 5 years and females aged 15 years are the age groups that are most secure financially, with 100.0% of males and 100.0% of females in these age groups living above the poverty line.
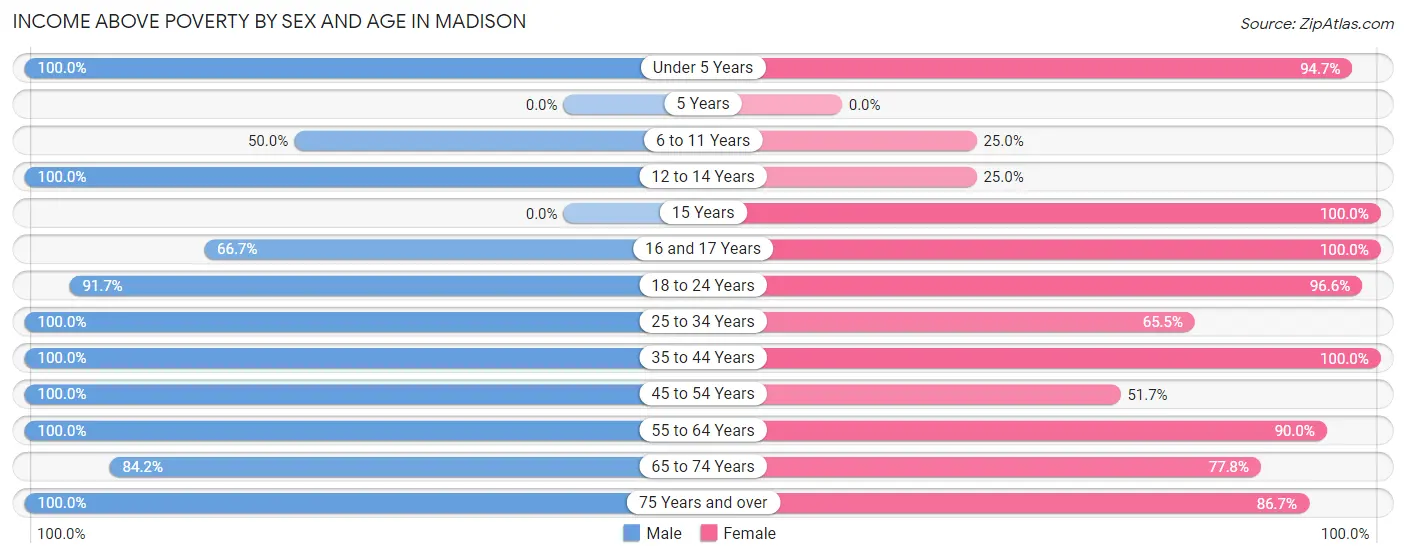
| Age Bracket | Male | Female |
| Under 5 Years | 8 (100.0%) | 18 (94.7%) |
| 5 Years | 0 (0.0%) | 0 (0.0%) |
| 6 to 11 Years | 6 (50.0%) | 5 (25.0%) |
| 12 to 14 Years | 19 (100.0%) | 1 (25.0%) |
| 15 Years | 0 (0.0%) | 5 (100.0%) |
| 16 and 17 Years | 2 (66.7%) | 2 (100.0%) |
| 18 to 24 Years | 11 (91.7%) | 28 (96.6%) |
| 25 to 34 Years | 27 (100.0%) | 19 (65.5%) |
| 35 to 44 Years | 34 (100.0%) | 14 (100.0%) |
| 45 to 54 Years | 14 (100.0%) | 15 (51.7%) |
| 55 to 64 Years | 12 (100.0%) | 18 (90.0%) |
| 65 to 74 Years | 16 (84.2%) | 14 (77.8%) |
| 75 Years and over | 16 (100.0%) | 13 (86.7%) |
| Total | 165 (89.2%) | 152 (74.5%) |
Income Below Poverty Among Married-Couple Families in Madison
The poverty statistics for married-couple families in Madison show that 18.5% or 12 of the total 65 families live below the poverty line. Families with no children have the highest poverty rate of 28.6%, comprising of 12 families. On the other hand, families with 1 or 2 children have the lowest poverty rate of 0.0%, which includes 0 families.
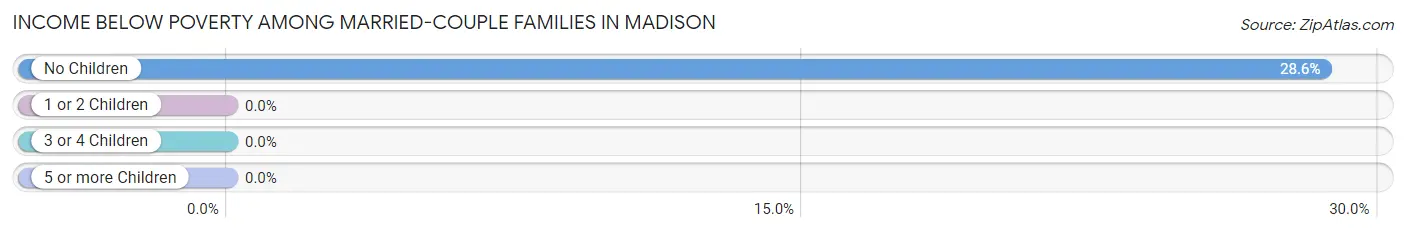
| Children | Above Poverty | Below Poverty |
| No Children | 30 (71.4%) | 12 (28.6%) |
| 1 or 2 Children | 20 (100.0%) | 0 (0.0%) |
| 3 or 4 Children | 3 (100.0%) | 0 (0.0%) |
| 5 or more Children | 0 (0.0%) | 0 (0.0%) |
| Total | 53 (81.5%) | 12 (18.5%) |
Income Below Poverty Among Single-Parent Households in Madison
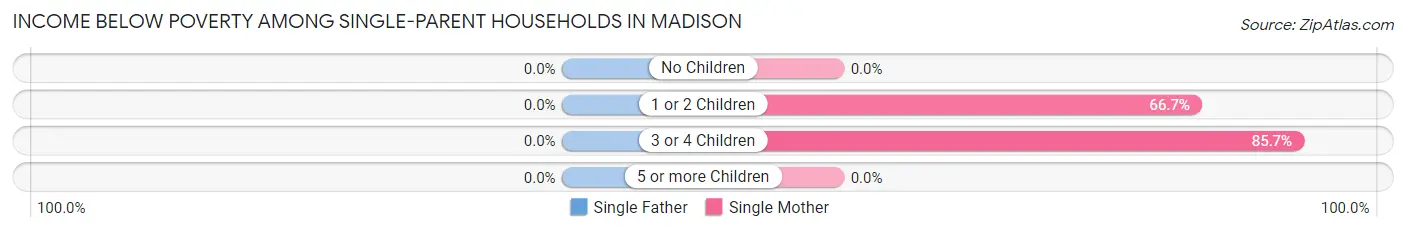
| Children | Single Father | Single Mother |
| No Children | 0 (0.0%) | 0 (0.0%) |
| 1 or 2 Children | 0 (0.0%) | 6 (66.7%) |
| 3 or 4 Children | 0 (0.0%) | 6 (85.7%) |
| 5 or more Children | 0 (0.0%) | 0 (0.0%) |
| Total | 0 (0.0%) | 12 (75.0%) |
Income Below Poverty Among Married-Couple vs Single-Parent Households in Madison
The poverty data for Madison shows that 12 of the married-couple family households (18.5%) and 12 of the single-parent households (46.2%) are living below the poverty level. Within the married-couple family households, those with no children have the highest poverty rate, with 12 households (28.6%) falling below the poverty line. Among the single-parent households, those with 3 or 4 children have the highest poverty rate, with 6 household (85.7%) living below poverty.
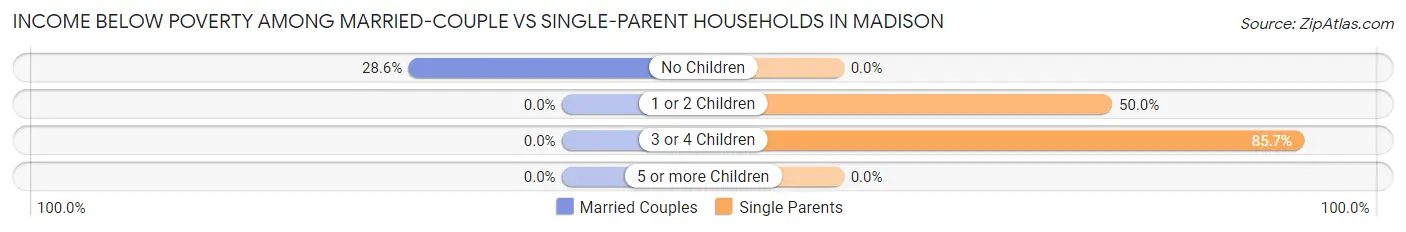
| Children | Married-Couple Families | Single-Parent Households |
| No Children | 12 (28.6%) | 0 (0.0%) |
| 1 or 2 Children | 0 (0.0%) | 6 (50.0%) |
| 3 or 4 Children | 0 (0.0%) | 6 (85.7%) |
| 5 or more Children | 0 (0.0%) | 0 (0.0%) |
| Total | 12 (18.5%) | 12 (46.2%) |
Race in Madison
The most populous races in Madison are White / Caucasian (336 | 86.4%), Two or more Races (53 | 13.6%), and Hispanic or Latino (49 | 12.6%).
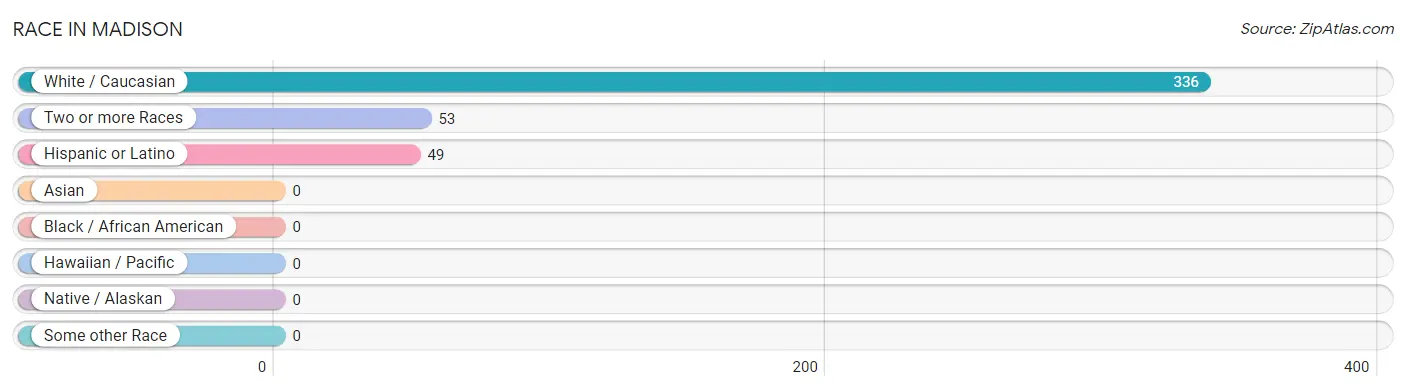
| Race | # Population | % Population |
| Asian | 0 | 0.0% |
| Black / African American | 0 | 0.0% |
| Hawaiian / Pacific | 0 | 0.0% |
| Hispanic or Latino | 49 | 12.6% |
| Native / Alaskan | 0 | 0.0% |
| White / Caucasian | 336 | 86.4% |
| Two or more Races | 53 | 13.6% |
| Some other Race | 0 | 0.0% |
| Total | 389 | 100.0% |
Ancestry in Madison
The most populous ancestries reported in Madison are English (58 | 14.9%), German (54 | 13.9%), Mexican (48 | 12.3%), Irish (35 | 9.0%), and Norwegian (15 | 3.9%), together accounting for 54.0% of all Madison residents.
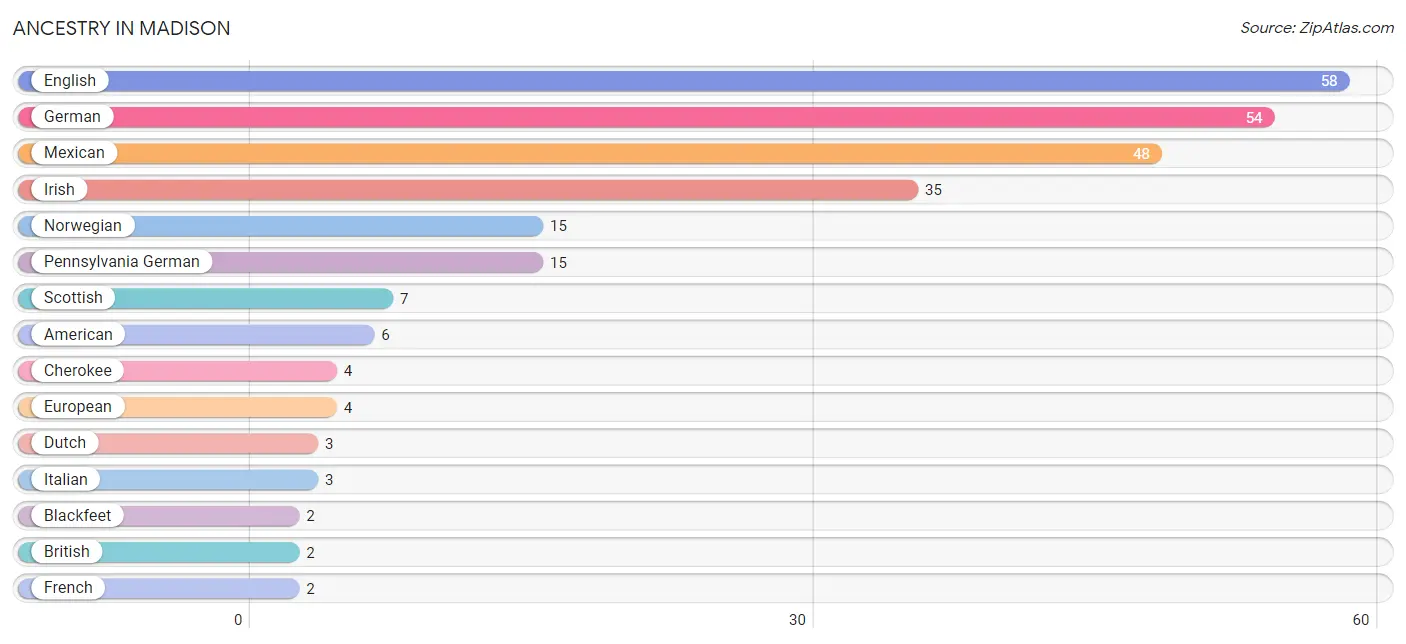
| Ancestry | # Population | % Population |
| American | 6 | 1.5% |
| Blackfeet | 2 | 0.5% |
| British | 2 | 0.5% |
| Cherokee | 4 | 1.0% |
| Danish | 1 | 0.3% |
| Dutch | 3 | 0.8% |
| English | 58 | 14.9% |
| European | 4 | 1.0% |
| French | 2 | 0.5% |
| German | 54 | 13.9% |
| Irish | 35 | 9.0% |
| Italian | 3 | 0.8% |
| Mexican | 48 | 12.3% |
| Norwegian | 15 | 3.9% |
| Pennsylvania German | 15 | 3.9% |
| Scottish | 7 | 1.8% |
| Spanish | 1 | 0.3% | View All 17 Rows |
Immigrants in Madison

| Immigration Origin | # Population | % Population | View All 0 Rows |
Sex and Age in Madison
Sex and Age in Madison
The most populous age groups in Madison are 40 to 44 Years (25 | 13.5%) for men and 20 to 24 Years (23 | 11.3%) for women.
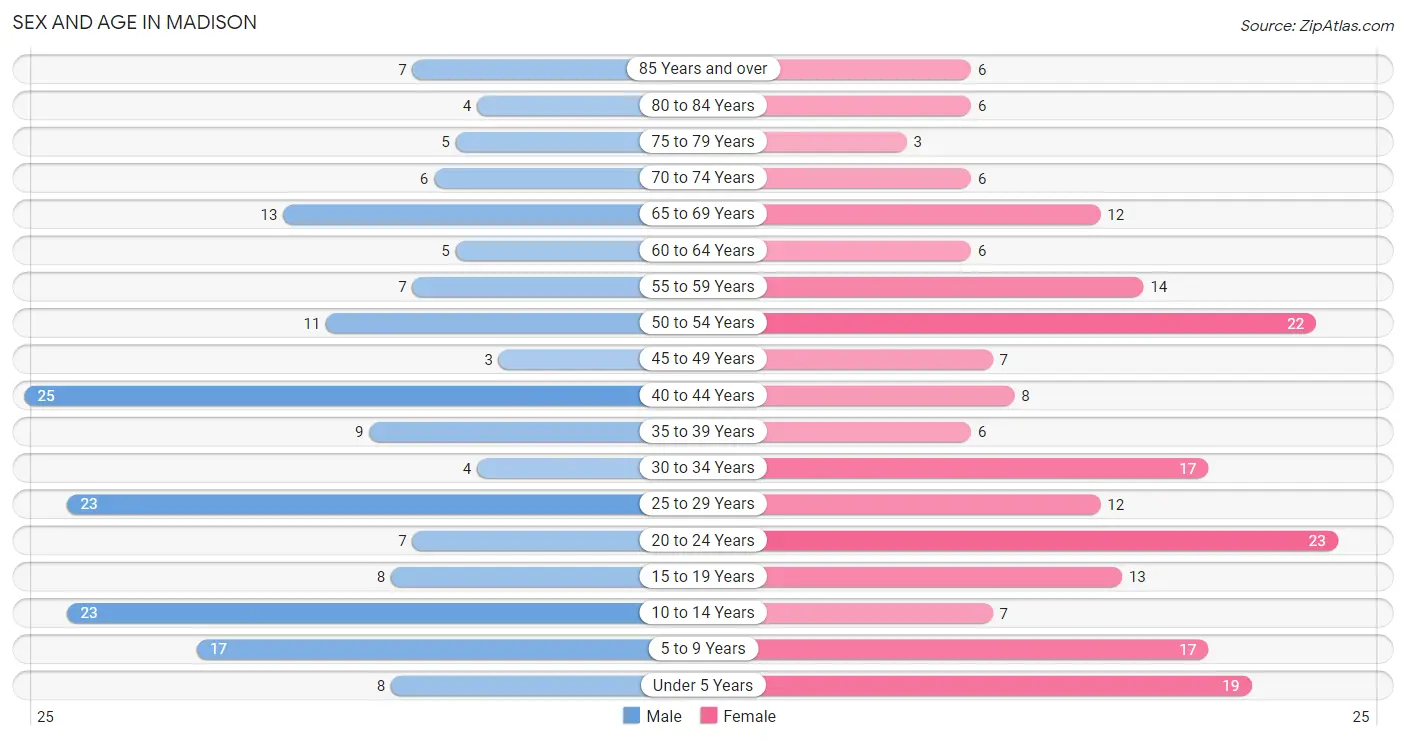
| Age Bracket | Male | Female |
| Under 5 Years | 8 (4.3%) | 19 (9.3%) |
| 5 to 9 Years | 17 (9.2%) | 17 (8.3%) |
| 10 to 14 Years | 23 (12.4%) | 7 (3.4%) |
| 15 to 19 Years | 8 (4.3%) | 13 (6.4%) |
| 20 to 24 Years | 7 (3.8%) | 23 (11.3%) |
| 25 to 29 Years | 23 (12.4%) | 12 (5.9%) |
| 30 to 34 Years | 4 (2.2%) | 17 (8.3%) |
| 35 to 39 Years | 9 (4.9%) | 6 (2.9%) |
| 40 to 44 Years | 25 (13.5%) | 8 (3.9%) |
| 45 to 49 Years | 3 (1.6%) | 7 (3.4%) |
| 50 to 54 Years | 11 (5.9%) | 22 (10.8%) |
| 55 to 59 Years | 7 (3.8%) | 14 (6.9%) |
| 60 to 64 Years | 5 (2.7%) | 6 (2.9%) |
| 65 to 69 Years | 13 (7.0%) | 12 (5.9%) |
| 70 to 74 Years | 6 (3.2%) | 6 (2.9%) |
| 75 to 79 Years | 5 (2.7%) | 3 (1.5%) |
| 80 to 84 Years | 4 (2.2%) | 6 (2.9%) |
| 85 Years and over | 7 (3.8%) | 6 (2.9%) |
| Total | 185 (100.0%) | 204 (100.0%) |
Families and Households in Madison
Median Family Size in Madison
The median family size in Madison is 3.38 persons per family, with single male/father families (10 | 11.0%) accounting for the largest median family size of 4.2 persons per family. On the other hand, married-couple families (65 | 71.4%) represent the smallest median family size with 3.12 persons per family.
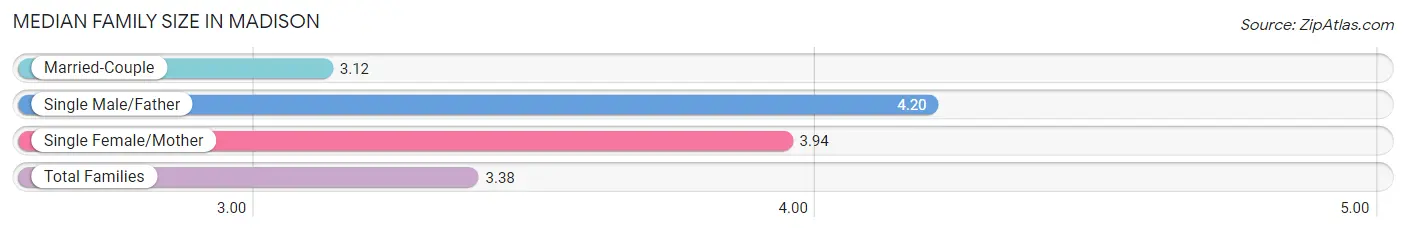
| Family Type | # Families | Family Size |
| Married-Couple | 65 (71.4%) | 3.12 |
| Single Male/Father | 10 (11.0%) | 4.20 |
| Single Female/Mother | 16 (17.6%) | 3.94 |
| Total Families | 91 (100.0%) | 3.38 |
Median Household Size in Madison
The median household size in Madison is 2.43 persons per household, with single female/mother households (16 | 10.0%) accounting for the largest median household size of 4.25 persons per household. non-family households (69 | 43.1%) represent the smallest median household size with 1.06 persons per household.
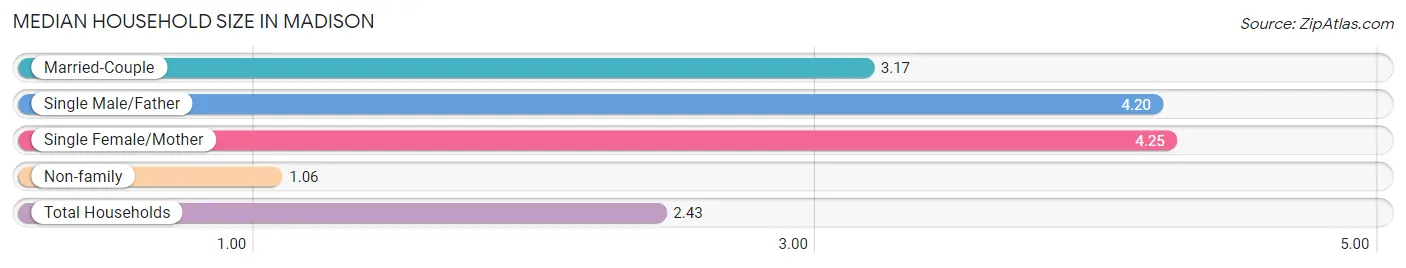
| Household Type | # Households | Household Size |
| Married-Couple | 65 (40.6%) | 3.17 |
| Single Male/Father | 10 (6.2%) | 4.20 |
| Single Female/Mother | 16 (10.0%) | 4.25 |
| Non-family | 69 (43.1%) | 1.06 |
| Total Households | 160 (100.0%) | 2.43 |
Household Size by Marriage Status in Madison
Out of a total of 160 households in Madison, 91 (56.9%) are family households, while 69 (43.1%) are nonfamily households. The most numerous type of family households are 2-person households, comprising 42, and the most common type of nonfamily households are 1-person households, comprising 66.
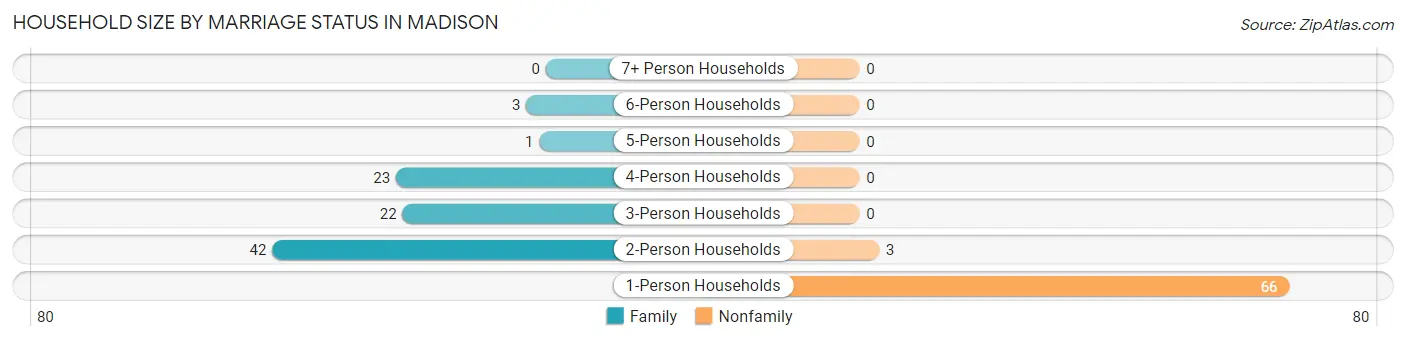
| Household Size | Family Households | Nonfamily Households |
| 1-Person Households | - | 66 (41.2%) |
| 2-Person Households | 42 (26.3%) | 3 (1.9%) |
| 3-Person Households | 22 (13.8%) | 0 (0.0%) |
| 4-Person Households | 23 (14.4%) | 0 (0.0%) |
| 5-Person Households | 1 (0.6%) | 0 (0.0%) |
| 6-Person Households | 3 (1.9%) | 0 (0.0%) |
| 7+ Person Households | 0 (0.0%) | 0 (0.0%) |
| Total | 91 (56.9%) | 69 (43.1%) |
Female Fertility in Madison
Fertility by Age in Madison
Average fertility rate in Madison is 12.0 births per 1,000 women. Women in the age bracket of 20 to 34 years have the highest fertility rate with 19.0 births per 1,000 women. Women in the age bracket of 20 to 34 years acount for 100.0% of all women with births.
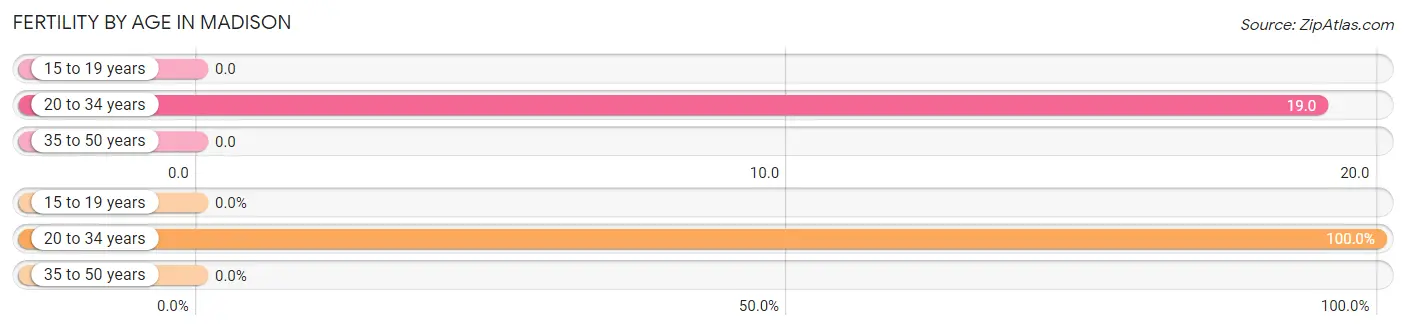
| Age Bracket | Women with Births | Births / 1,000 Women |
| 15 to 19 years | 0 (0.0%) | 0.0 |
| 20 to 34 years | 1 (100.0%) | 19.0 |
| 35 to 50 years | 0 (0.0%) | 0.0 |
| Total | 1 (100.0%) | 12.0 |
Fertility by Age by Marriage Status in Madison
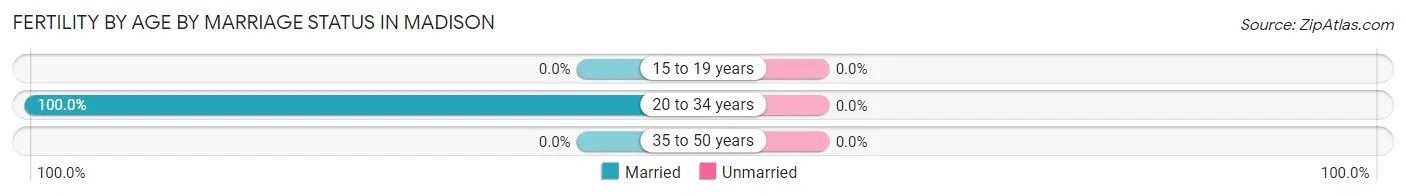
| Age Bracket | Married | Unmarried |
| 15 to 19 years | 0 (0.0%) | 0 (0.0%) |
| 20 to 34 years | 1 (100.0%) | 0 (0.0%) |
| 35 to 50 years | 0 (0.0%) | 0 (0.0%) |
| Total | 1 (100.0%) | 0 (0.0%) |
Fertility by Education in Madison
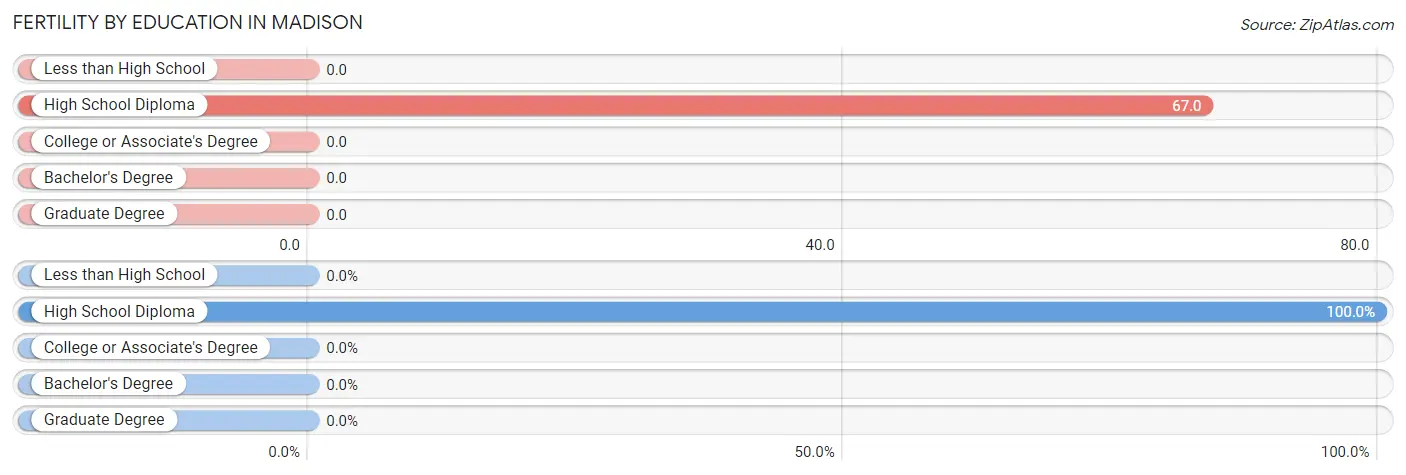
| Educational Attainment | Women with Births | Births / 1,000 Women |
| Less than High School | 0 (0.0%) | 0.0 |
| High School Diploma | 1 (100.0%) | 67.0 |
| College or Associate's Degree | 0 (0.0%) | 0.0 |
| Bachelor's Degree | 0 (0.0%) | 0.0 |
| Graduate Degree | 0 (0.0%) | 0.0 |
| Total | 1 (100.0%) | 12.0 |
Fertility by Education by Marriage Status in Madison
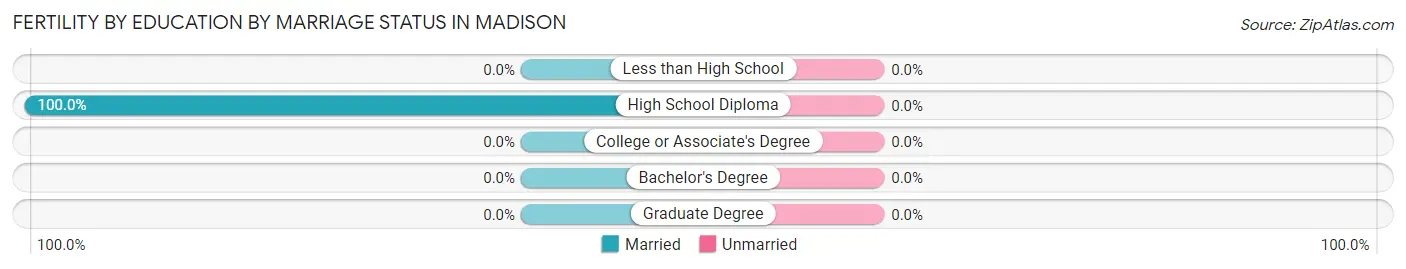
| Educational Attainment | Married | Unmarried |
| Less than High School | 0 (0.0%) | 0 (0.0%) |
| High School Diploma | 1 (100.0%) | 0 (0.0%) |
| College or Associate's Degree | 0 (0.0%) | 0 (0.0%) |
| Bachelor's Degree | 0 (0.0%) | 0 (0.0%) |
| Graduate Degree | 0 (0.0%) | 0 (0.0%) |
| Total | 1 (100.0%) | 0 (0.0%) |
Employment Characteristics in Madison
Employment by Class of Employer in Madison
Among the 175 employed individuals in Madison, private company employees (135 | 77.1%), not-for-profit organizations (13 | 7.4%), and state government employees (13 | 7.4%) make up the most common classes of employment.
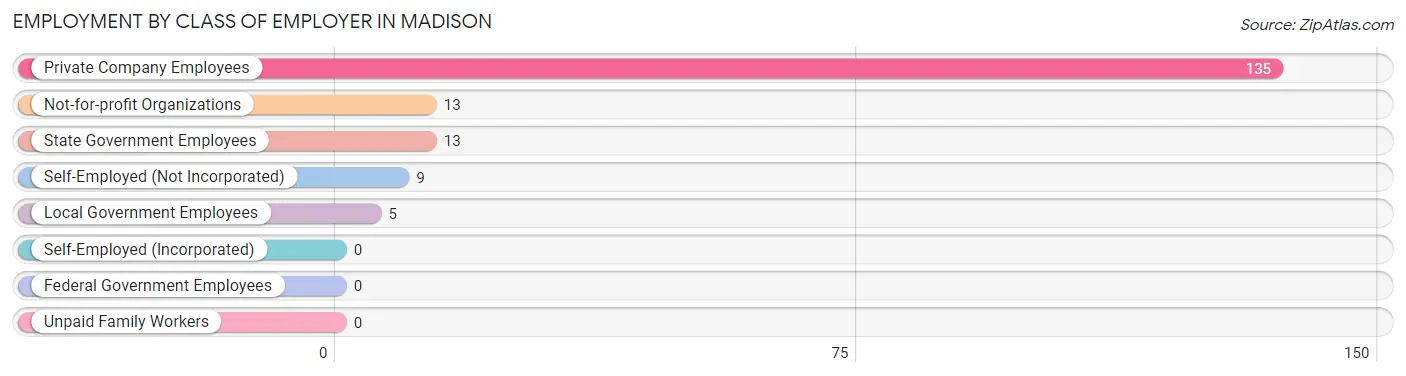
| Employer Class | # Employees | % Employees |
| Private Company Employees | 135 | 77.1% |
| Self-Employed (Incorporated) | 0 | 0.0% |
| Self-Employed (Not Incorporated) | 9 | 5.1% |
| Not-for-profit Organizations | 13 | 7.4% |
| Local Government Employees | 5 | 2.9% |
| State Government Employees | 13 | 7.4% |
| Federal Government Employees | 0 | 0.0% |
| Unpaid Family Workers | 0 | 0.0% |
| Total | 175 | 100.0% |
Employment Status by Age in Madison
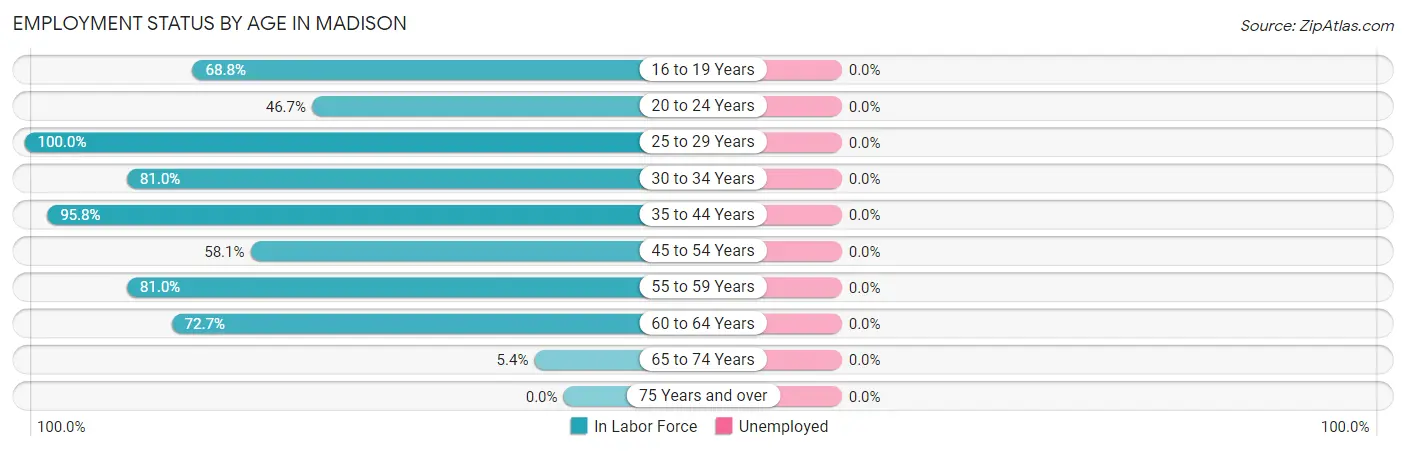
| Age Bracket | In Labor Force | Unemployed |
| 16 to 19 Years | 11 (68.8%) | 0 (0.0%) |
| 20 to 24 Years | 14 (46.7%) | 0 (0.0%) |
| 25 to 29 Years | 35 (100.0%) | 0 (0.0%) |
| 30 to 34 Years | 17 (81.0%) | 0 (0.0%) |
| 35 to 44 Years | 46 (95.8%) | 0 (0.0%) |
| 45 to 54 Years | 25 (58.1%) | 0 (0.0%) |
| 55 to 59 Years | 17 (81.0%) | 0 (0.0%) |
| 60 to 64 Years | 8 (72.7%) | 0 (0.0%) |
| 65 to 74 Years | 2 (5.4%) | 0 (0.0%) |
| 75 Years and over | 0 (0.0%) | 0 (0.0%) |
| Total | 175 (59.7%) | 0 (0.0%) |
Employment Status by Educational Attainment in Madison
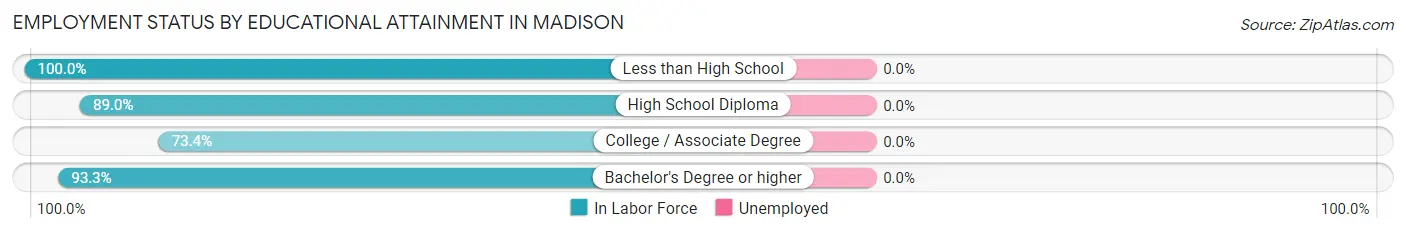
| Educational Attainment | In Labor Force | Unemployed |
| Less than High School | 3 (100.0%) | 0 (0.0%) |
| High School Diploma | 73 (89.0%) | 0 (0.0%) |
| College / Associate Degree | 58 (73.4%) | 0 (0.0%) |
| Bachelor's Degree or higher | 14 (93.3%) | 0 (0.0%) |
| Total | 148 (82.7%) | 0 (0.0%) |
Employment Occupations by Sex in Madison
Management, Business, Science and Arts Occupations
The most common Management, Business, Science and Arts occupations in Madison are Community & Social Service (11 | 6.3%), Health Diagnosing & Treating (7 | 4.0%), Legal Services & Support (6 | 3.4%), Management (5 | 2.9%), and Business & Financial (4 | 2.3%).
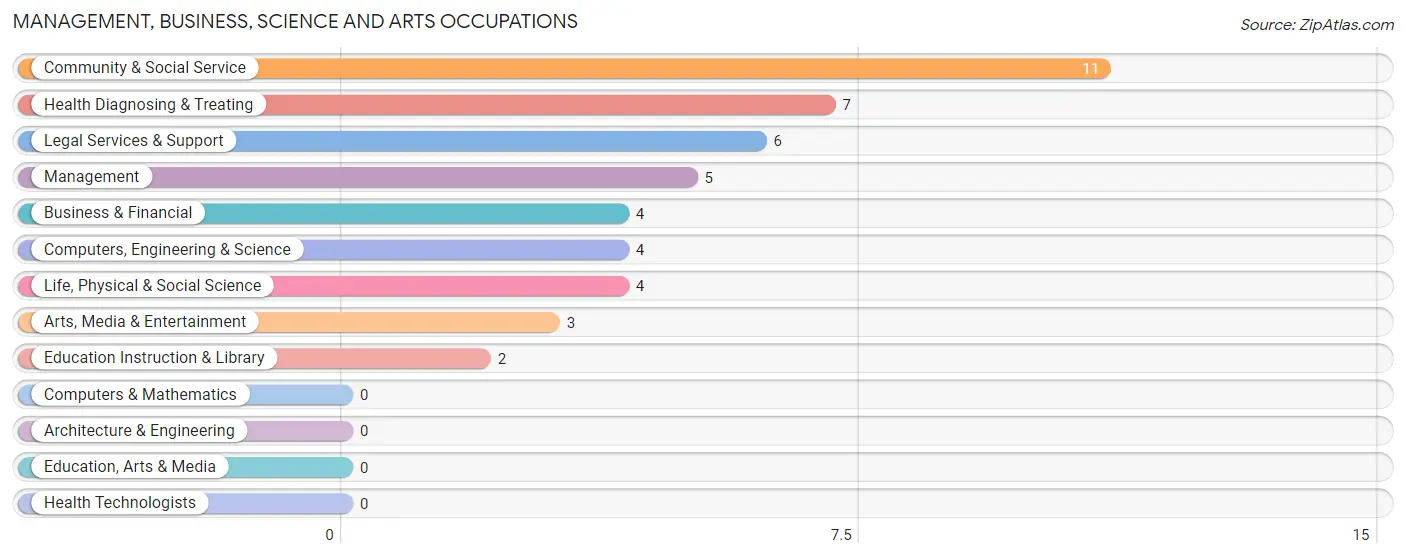
Management, Business, Science and Arts Occupations by Sex
Within the Management, Business, Science and Arts occupations in Madison, the most male-oriented occupations are Management (100.0%), Health Diagnosing & Treating (71.4%), and Legal Services & Support (66.7%), while the most female-oriented occupations are Business & Financial (100.0%), Computers, Engineering & Science (100.0%), and Life, Physical & Social Science (100.0%).
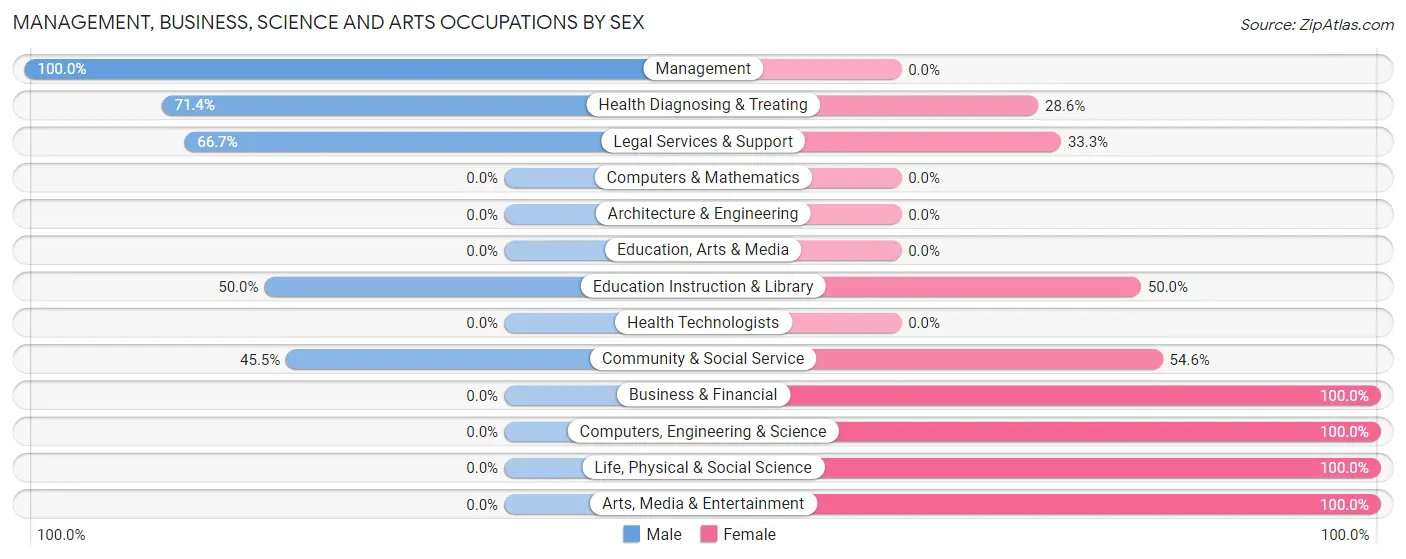
| Occupation | Male | Female |
| Management | 5 (100.0%) | 0 (0.0%) |
| Business & Financial | 0 (0.0%) | 4 (100.0%) |
| Computers, Engineering & Science | 0 (0.0%) | 4 (100.0%) |
| Computers & Mathematics | 0 (0.0%) | 0 (0.0%) |
| Architecture & Engineering | 0 (0.0%) | 0 (0.0%) |
| Life, Physical & Social Science | 0 (0.0%) | 4 (100.0%) |
| Community & Social Service | 5 (45.5%) | 6 (54.5%) |
| Education, Arts & Media | 0 (0.0%) | 0 (0.0%) |
| Legal Services & Support | 4 (66.7%) | 2 (33.3%) |
| Education Instruction & Library | 1 (50.0%) | 1 (50.0%) |
| Arts, Media & Entertainment | 0 (0.0%) | 3 (100.0%) |
| Health Diagnosing & Treating | 5 (71.4%) | 2 (28.6%) |
| Health Technologists | 0 (0.0%) | 0 (0.0%) |
| Total (Category) | 15 (48.4%) | 16 (51.6%) |
| Total (Overall) | 93 (53.1%) | 82 (46.9%) |
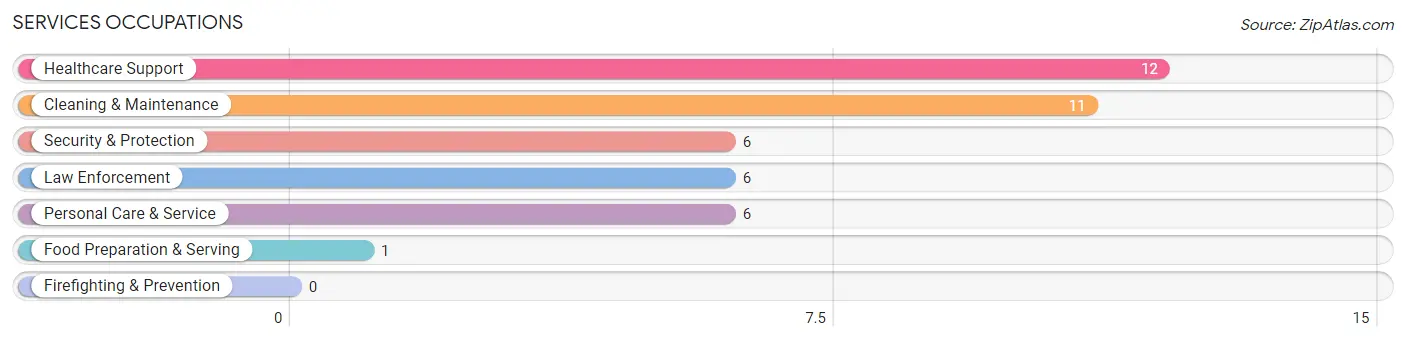
Services Occupations
The most common Services occupations in Madison are Healthcare Support (12 | 6.9%), Cleaning & Maintenance (11 | 6.3%), Security & Protection (6 | 3.4%), Law Enforcement (6 | 3.4%), and Personal Care & Service (6 | 3.4%).
Services Occupations by Sex
Within the Services occupations in Madison, the most male-oriented occupations are Security & Protection (100.0%), Law Enforcement (100.0%), and Cleaning & Maintenance (72.7%), while the most female-oriented occupations are Healthcare Support (100.0%), Food Preparation & Serving (100.0%), and Personal Care & Service (100.0%).
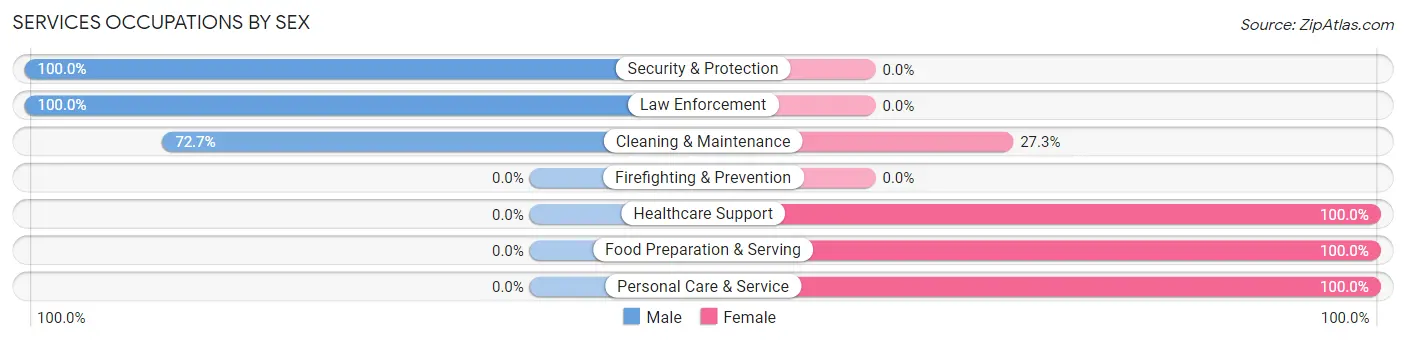
| Occupation | Male | Female |
| Healthcare Support | 0 (0.0%) | 12 (100.0%) |
| Security & Protection | 6 (100.0%) | 0 (0.0%) |
| Firefighting & Prevention | 0 (0.0%) | 0 (0.0%) |
| Law Enforcement | 6 (100.0%) | 0 (0.0%) |
| Food Preparation & Serving | 0 (0.0%) | 1 (100.0%) |
| Cleaning & Maintenance | 8 (72.7%) | 3 (27.3%) |
| Personal Care & Service | 0 (0.0%) | 6 (100.0%) |
| Total (Category) | 14 (38.9%) | 22 (61.1%) |
| Total (Overall) | 93 (53.1%) | 82 (46.9%) |
Sales and Office Occupations
The most common Sales and Office occupations in Madison are Office & Administration (38 | 21.7%), and Sales & Related (15 | 8.6%).
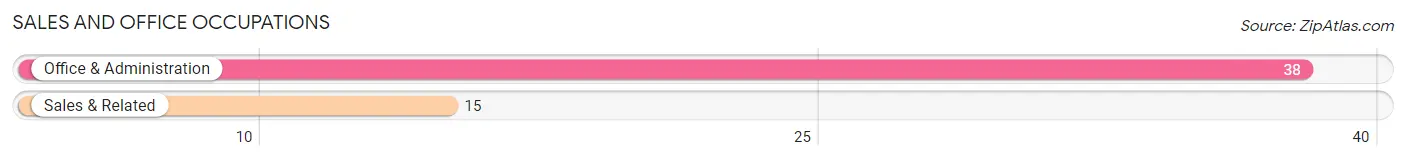
Sales and Office Occupations by Sex
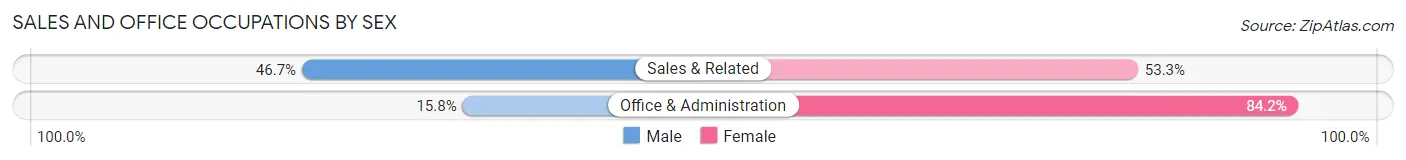
| Occupation | Male | Female |
| Sales & Related | 7 (46.7%) | 8 (53.3%) |
| Office & Administration | 6 (15.8%) | 32 (84.2%) |
| Total (Category) | 13 (24.5%) | 40 (75.5%) |
| Total (Overall) | 93 (53.1%) | 82 (46.9%) |
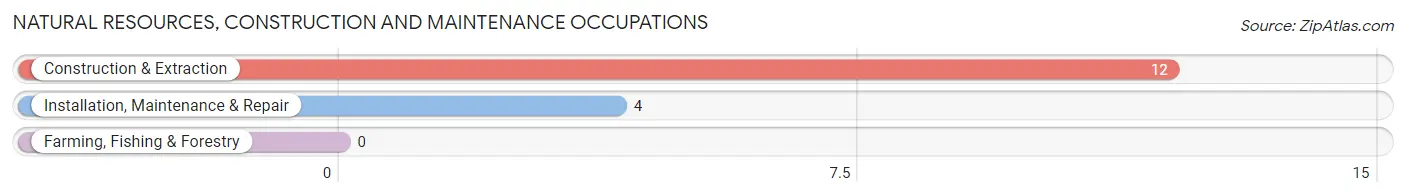
Natural Resources, Construction and Maintenance Occupations
The most common Natural Resources, Construction and Maintenance occupations in Madison are Construction & Extraction (12 | 6.9%), and Installation, Maintenance & Repair (4 | 2.3%).
Natural Resources, Construction and Maintenance Occupations by Sex
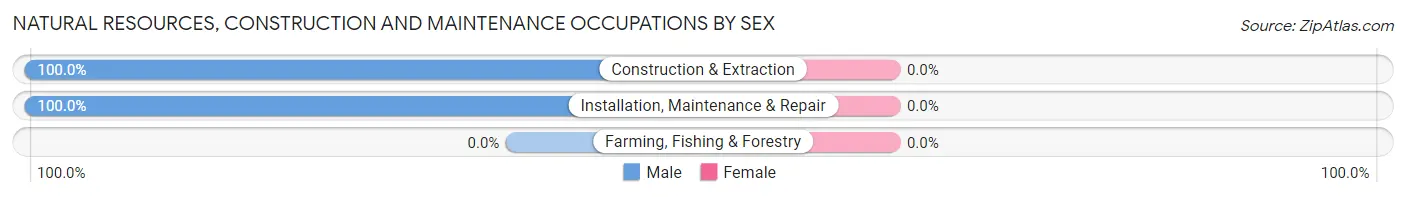
| Occupation | Male | Female |
| Farming, Fishing & Forestry | 0 (0.0%) | 0 (0.0%) |
| Construction & Extraction | 12 (100.0%) | 0 (0.0%) |
| Installation, Maintenance & Repair | 4 (100.0%) | 0 (0.0%) |
| Total (Category) | 16 (100.0%) | 0 (0.0%) |
| Total (Overall) | 93 (53.1%) | 82 (46.9%) |
Production, Transportation and Moving Occupations
The most common Production, Transportation and Moving occupations in Madison are Material Moving (23 | 13.1%), Production (13 | 7.4%), and Transportation (3 | 1.7%).
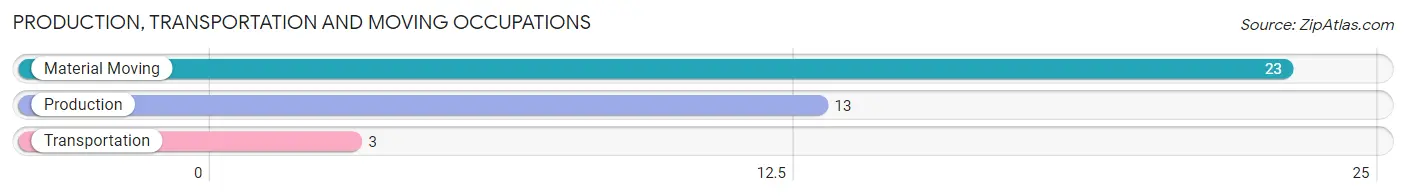
Production, Transportation and Moving Occupations by Sex
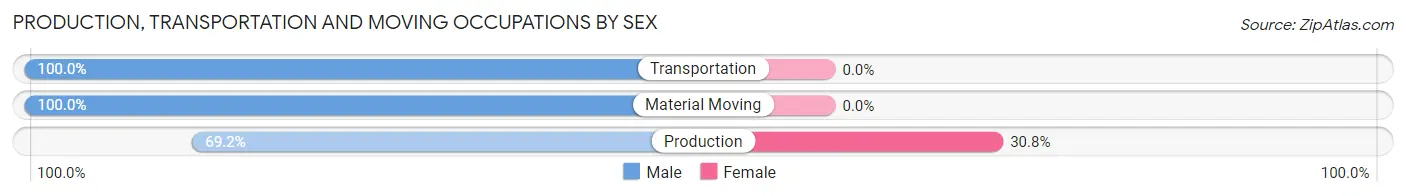
| Occupation | Male | Female |
| Production | 9 (69.2%) | 4 (30.8%) |
| Transportation | 3 (100.0%) | 0 (0.0%) |
| Material Moving | 23 (100.0%) | 0 (0.0%) |
| Total (Category) | 35 (89.7%) | 4 (10.3%) |
| Total (Overall) | 93 (53.1%) | 82 (46.9%) |
Employment Industries by Sex in Madison
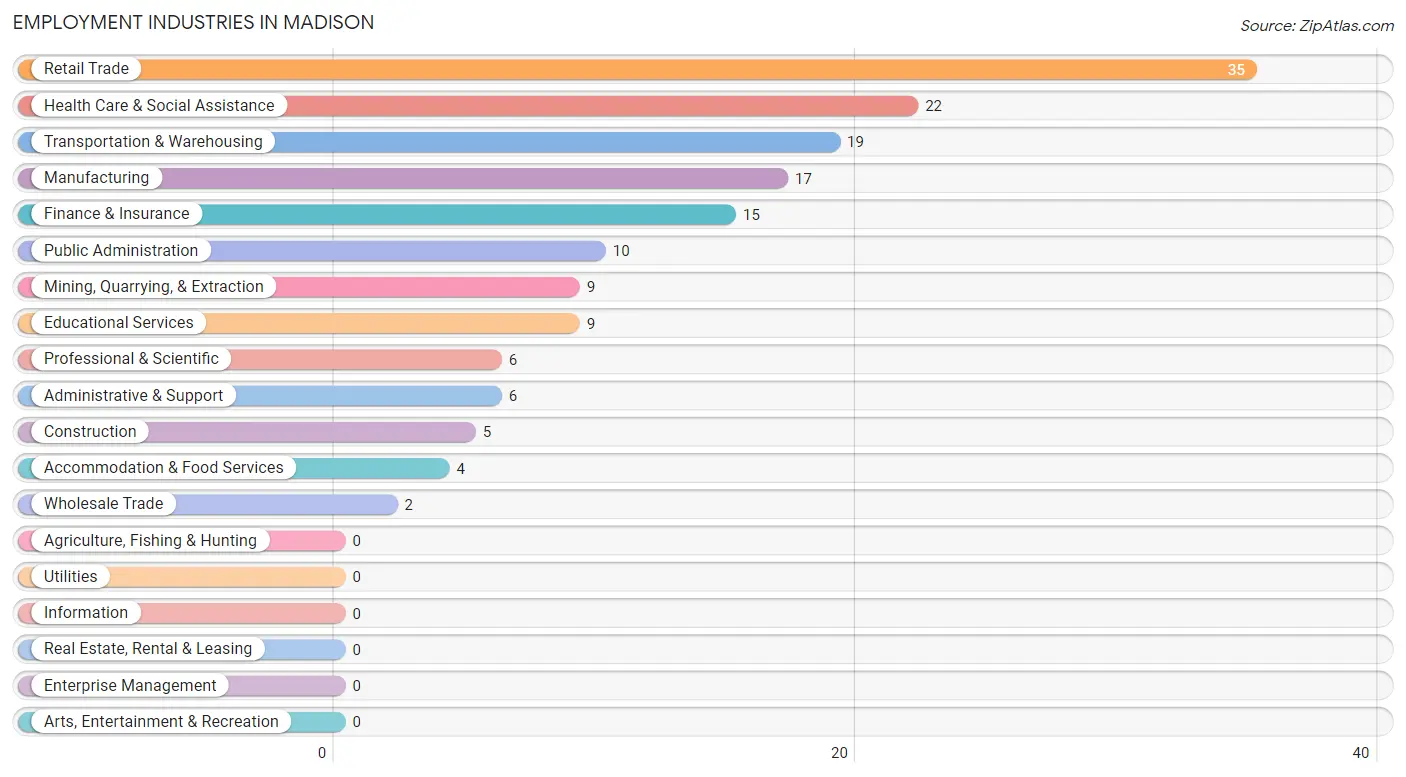
Employment Industries in Madison
The major employment industries in Madison include Retail Trade (35 | 20.0%), Health Care & Social Assistance (22 | 12.6%), Transportation & Warehousing (19 | 10.9%), Manufacturing (17 | 9.7%), and Finance & Insurance (15 | 8.6%).
Employment Industries by Sex in Madison
The Madison industries that see more men than women are Mining, Quarrying, & Extraction (100.0%), Construction (100.0%), and Wholesale Trade (100.0%), whereas the industries that tend to have a higher number of women are Finance & Insurance (100.0%), Accommodation & Food Services (100.0%), and Health Care & Social Assistance (77.3%).
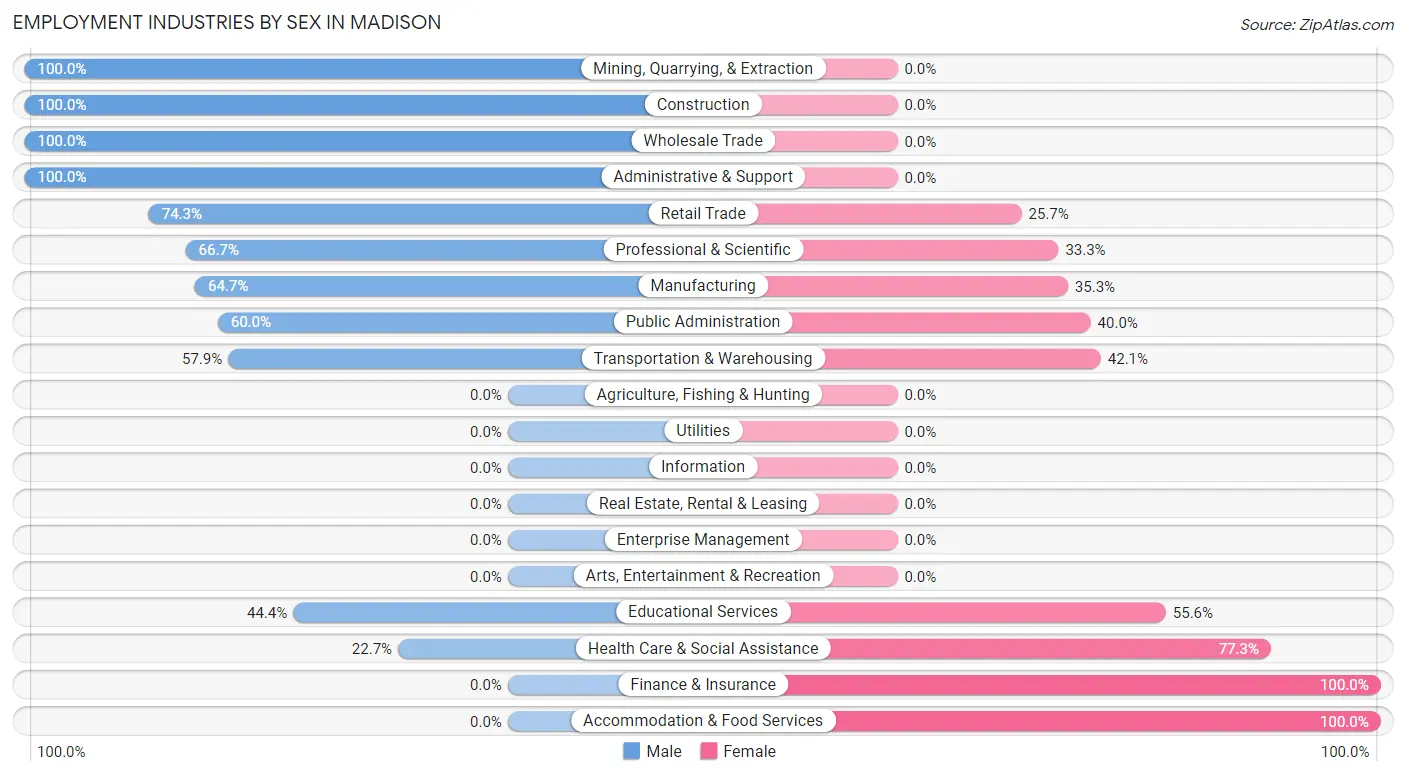
| Industry | Male | Female |
| Agriculture, Fishing & Hunting | 0 (0.0%) | 0 (0.0%) |
| Mining, Quarrying, & Extraction | 9 (100.0%) | 0 (0.0%) |
| Construction | 5 (100.0%) | 0 (0.0%) |
| Manufacturing | 11 (64.7%) | 6 (35.3%) |
| Wholesale Trade | 2 (100.0%) | 0 (0.0%) |
| Retail Trade | 26 (74.3%) | 9 (25.7%) |
| Transportation & Warehousing | 11 (57.9%) | 8 (42.1%) |
| Utilities | 0 (0.0%) | 0 (0.0%) |
| Information | 0 (0.0%) | 0 (0.0%) |
| Finance & Insurance | 0 (0.0%) | 15 (100.0%) |
| Real Estate, Rental & Leasing | 0 (0.0%) | 0 (0.0%) |
| Professional & Scientific | 4 (66.7%) | 2 (33.3%) |
| Enterprise Management | 0 (0.0%) | 0 (0.0%) |
| Administrative & Support | 6 (100.0%) | 0 (0.0%) |
| Educational Services | 4 (44.4%) | 5 (55.6%) |
| Health Care & Social Assistance | 5 (22.7%) | 17 (77.3%) |
| Arts, Entertainment & Recreation | 0 (0.0%) | 0 (0.0%) |
| Accommodation & Food Services | 0 (0.0%) | 4 (100.0%) |
| Public Administration | 6 (60.0%) | 4 (40.0%) |
| Total | 93 (53.1%) | 82 (46.9%) |
Education in Madison
School Enrollment in Madison
The most common levels of schooling among the 80 students in Madison are middle school (28 | 35.0%), elementary school (27 | 33.8%), and kindergarten (9 | 11.3%).
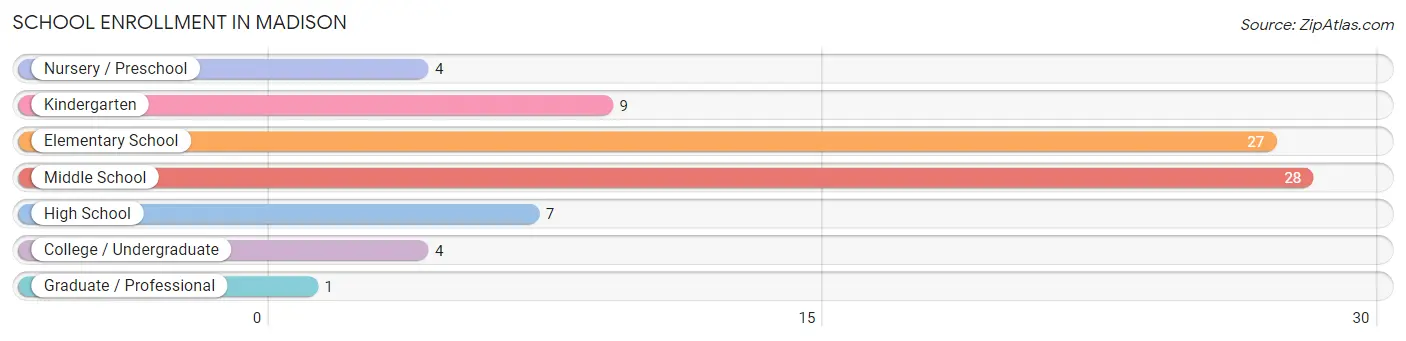
| School Level | # Students | % Students |
| Nursery / Preschool | 4 | 5.0% |
| Kindergarten | 9 | 11.3% |
| Elementary School | 27 | 33.8% |
| Middle School | 28 | 35.0% |
| High School | 7 | 8.7% |
| College / Undergraduate | 4 | 5.0% |
| Graduate / Professional | 1 | 1.3% |
| Total | 80 | 100.0% |
School Enrollment by Age by Funding Source in Madison
Out of a total of 80 students who are enrolled in schools in Madison, 11 (13.8%) attend a private institution, while the remaining 69 (86.2%) are enrolled in public schools. The age group of 20 to 24 year olds has the highest likelihood of being enrolled in private schools, with 2 (66.7% in the age bracket) enrolled. Conversely, the age group of 3 to 4 year olds has the lowest likelihood of being enrolled in a private school, with 4 (100.0% in the age bracket) attending a public institution.
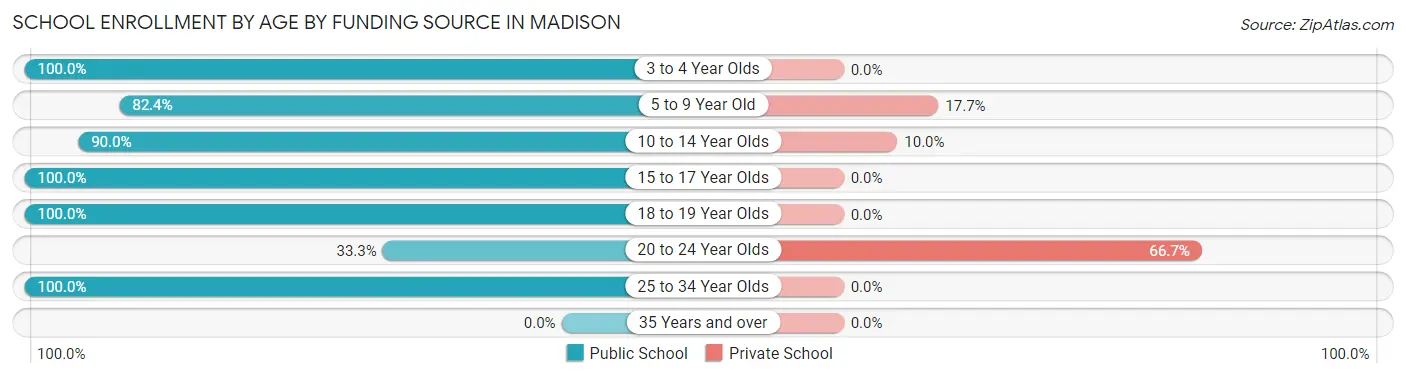
| Age Bracket | Public School | Private School |
| 3 to 4 Year Olds | 4 (100.0%) | 0 (0.0%) |
| 5 to 9 Year Old | 28 (82.4%) | 6 (17.6%) |
| 10 to 14 Year Olds | 27 (90.0%) | 3 (10.0%) |
| 15 to 17 Year Olds | 5 (100.0%) | 0 (0.0%) |
| 18 to 19 Year Olds | 2 (100.0%) | 0 (0.0%) |
| 20 to 24 Year Olds | 1 (33.3%) | 2 (66.7%) |
| 25 to 34 Year Olds | 2 (100.0%) | 0 (0.0%) |
| 35 Years and over | 0 (0.0%) | 0 (0.0%) |
| Total | 69 (86.3%) | 11 (13.8%) |
Educational Attainment by Field of Study in Madison
Business (6 | 33.3%), psychology (3 | 16.7%), social sciences (3 | 16.7%), education (3 | 16.7%), and arts & humanities (2 | 11.1%) are the most common fields of study among 18 individuals in Madison who have obtained a bachelor's degree or higher.
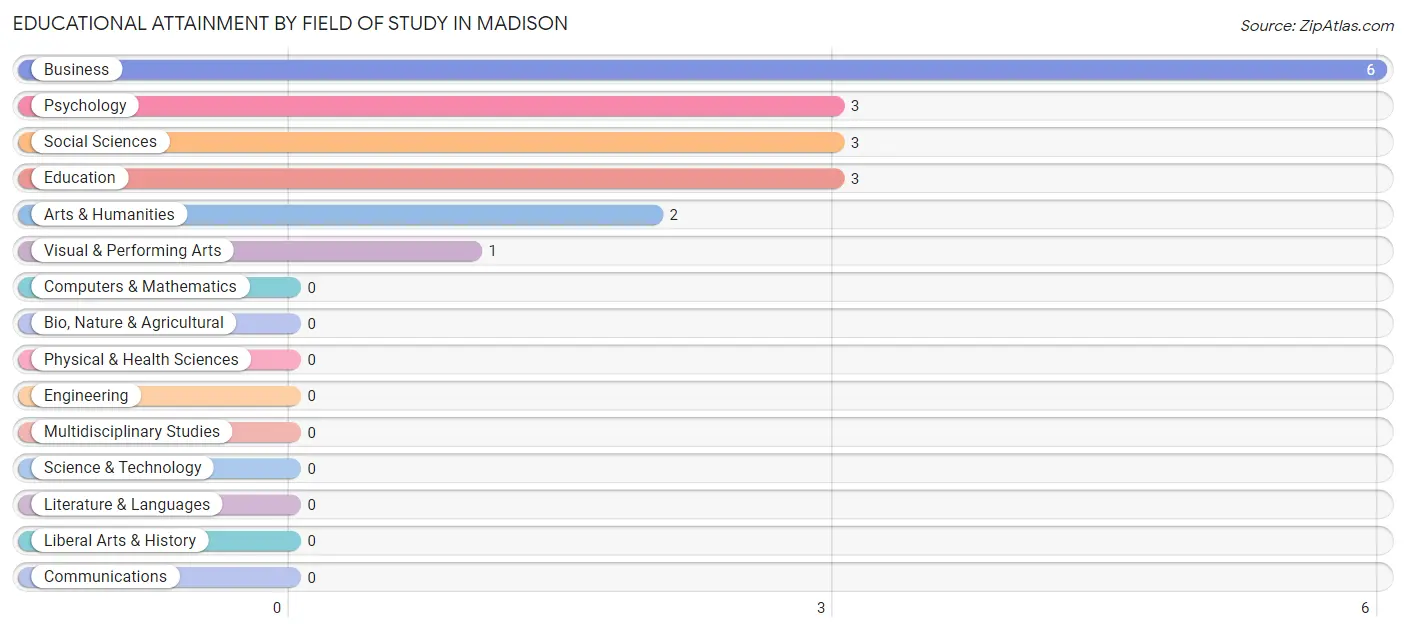
| Field of Study | # Graduates | % Graduates |
| Computers & Mathematics | 0 | 0.0% |
| Bio, Nature & Agricultural | 0 | 0.0% |
| Physical & Health Sciences | 0 | 0.0% |
| Psychology | 3 | 16.7% |
| Social Sciences | 3 | 16.7% |
| Engineering | 0 | 0.0% |
| Multidisciplinary Studies | 0 | 0.0% |
| Science & Technology | 0 | 0.0% |
| Business | 6 | 33.3% |
| Education | 3 | 16.7% |
| Literature & Languages | 0 | 0.0% |
| Liberal Arts & History | 0 | 0.0% |
| Visual & Performing Arts | 1 | 5.6% |
| Communications | 0 | 0.0% |
| Arts & Humanities | 2 | 11.1% |
| Total | 18 | 100.0% |
Transportation & Commute in Madison
Vehicle Availability by Sex in Madison
The most prevalent vehicle ownership categories in Madison are males with 2 vehicles (33, accounting for 35.5%) and females with 2 vehicles (36, making up 40.2%).
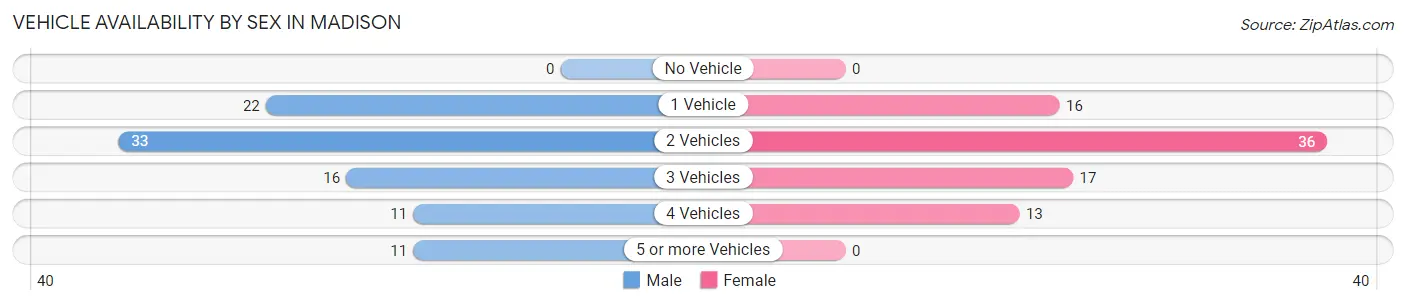
| Vehicles Available | Male | Female |
| No Vehicle | 0 (0.0%) | 0 (0.0%) |
| 1 Vehicle | 22 (23.7%) | 16 (19.5%) |
| 2 Vehicles | 33 (35.5%) | 36 (43.9%) |
| 3 Vehicles | 16 (17.2%) | 17 (20.7%) |
| 4 Vehicles | 11 (11.8%) | 13 (15.9%) |
| 5 or more Vehicles | 11 (11.8%) | 0 (0.0%) |
| Total | 93 (100.0%) | 82 (100.0%) |
Commute Time in Madison
The most frequently occuring commute durations in Madison are 20 to 24 minutes (53 commuters, 31.0%), 15 to 19 minutes (28 commuters, 16.4%), and 30 to 34 minutes (18 commuters, 10.5%).
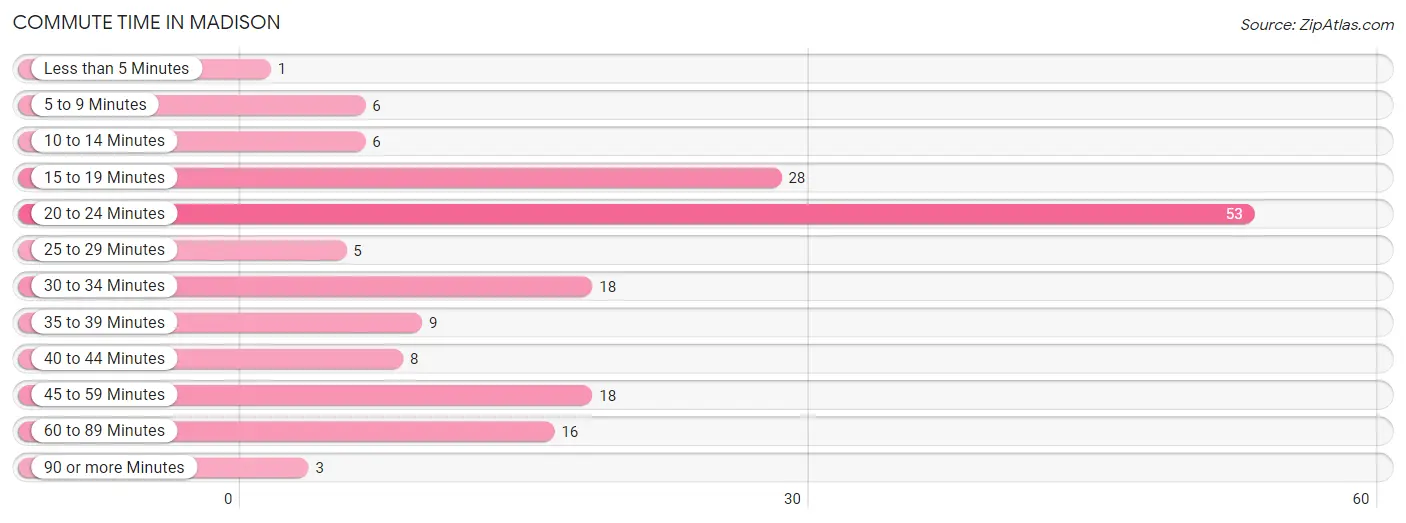
| Commute Time | # Commuters | % Commuters |
| Less than 5 Minutes | 1 | 0.6% |
| 5 to 9 Minutes | 6 | 3.5% |
| 10 to 14 Minutes | 6 | 3.5% |
| 15 to 19 Minutes | 28 | 16.4% |
| 20 to 24 Minutes | 53 | 31.0% |
| 25 to 29 Minutes | 5 | 2.9% |
| 30 to 34 Minutes | 18 | 10.5% |
| 35 to 39 Minutes | 9 | 5.3% |
| 40 to 44 Minutes | 8 | 4.7% |
| 45 to 59 Minutes | 18 | 10.5% |
| 60 to 89 Minutes | 16 | 9.4% |
| 90 or more Minutes | 3 | 1.8% |
Commute Time by Sex in Madison
The most common commute times in Madison are 15 to 19 minutes (22 commuters, 23.7%) for males and 20 to 24 minutes (38 commuters, 48.7%) for females.
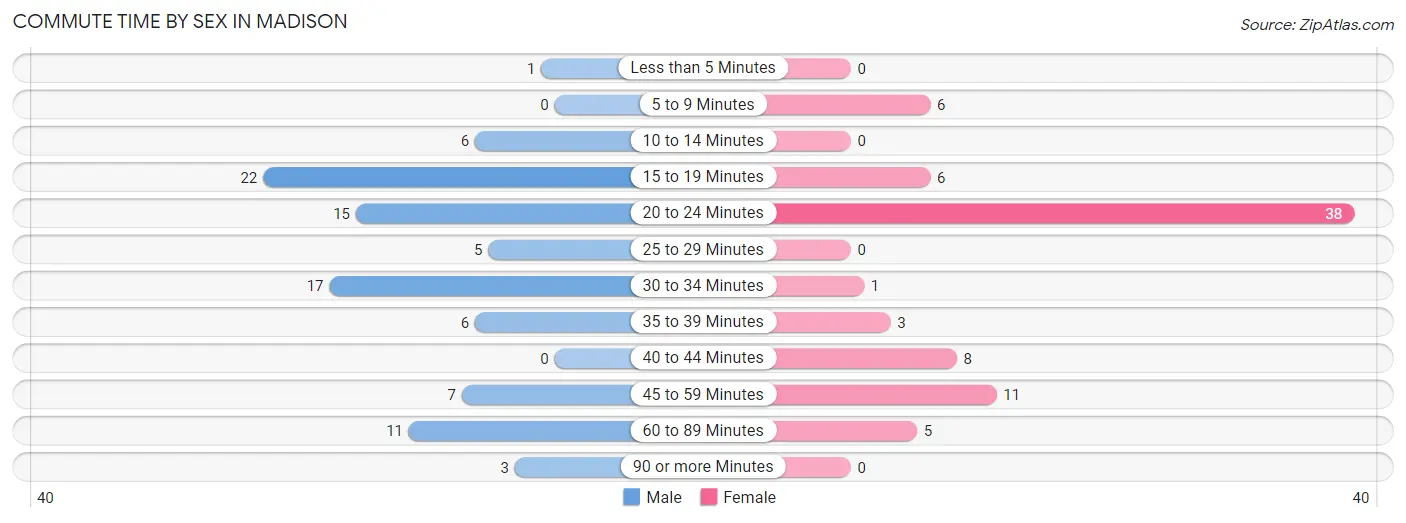
| Commute Time | Male | Female |
| Less than 5 Minutes | 1 (1.1%) | 0 (0.0%) |
| 5 to 9 Minutes | 0 (0.0%) | 6 (7.7%) |
| 10 to 14 Minutes | 6 (6.5%) | 0 (0.0%) |
| 15 to 19 Minutes | 22 (23.7%) | 6 (7.7%) |
| 20 to 24 Minutes | 15 (16.1%) | 38 (48.7%) |
| 25 to 29 Minutes | 5 (5.4%) | 0 (0.0%) |
| 30 to 34 Minutes | 17 (18.3%) | 1 (1.3%) |
| 35 to 39 Minutes | 6 (6.5%) | 3 (3.8%) |
| 40 to 44 Minutes | 0 (0.0%) | 8 (10.3%) |
| 45 to 59 Minutes | 7 (7.5%) | 11 (14.1%) |
| 60 to 89 Minutes | 11 (11.8%) | 5 (6.4%) |
| 90 or more Minutes | 3 (3.2%) | 0 (0.0%) |
Time of Departure to Work by Sex in Madison
The most frequent times of departure to work in Madison are 12:00 PM to 3:59 PM (20, 21.5%) for males and 7:30 AM to 7:59 AM (25, 32.1%) for females.
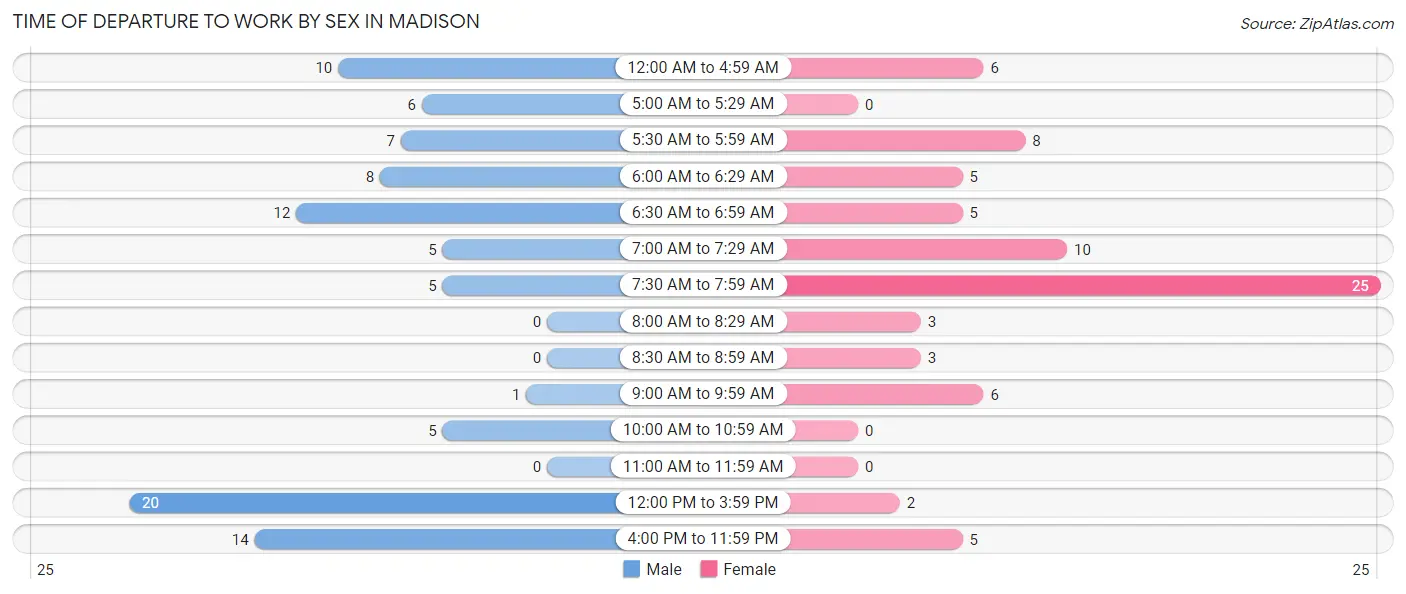
| Time of Departure | Male | Female |
| 12:00 AM to 4:59 AM | 10 (10.7%) | 6 (7.7%) |
| 5:00 AM to 5:29 AM | 6 (6.5%) | 0 (0.0%) |
| 5:30 AM to 5:59 AM | 7 (7.5%) | 8 (10.3%) |
| 6:00 AM to 6:29 AM | 8 (8.6%) | 5 (6.4%) |
| 6:30 AM to 6:59 AM | 12 (12.9%) | 5 (6.4%) |
| 7:00 AM to 7:29 AM | 5 (5.4%) | 10 (12.8%) |
| 7:30 AM to 7:59 AM | 5 (5.4%) | 25 (32.1%) |
| 8:00 AM to 8:29 AM | 0 (0.0%) | 3 (3.8%) |
| 8:30 AM to 8:59 AM | 0 (0.0%) | 3 (3.8%) |
| 9:00 AM to 9:59 AM | 1 (1.1%) | 6 (7.7%) |
| 10:00 AM to 10:59 AM | 5 (5.4%) | 0 (0.0%) |
| 11:00 AM to 11:59 AM | 0 (0.0%) | 0 (0.0%) |
| 12:00 PM to 3:59 PM | 20 (21.5%) | 2 (2.6%) |
| 4:00 PM to 11:59 PM | 14 (15.0%) | 5 (6.4%) |
| Total | 93 (100.0%) | 78 (100.0%) |
Housing Occupancy in Madison
Occupancy by Ownership in Madison
Of the total 160 dwellings in Madison, owner-occupied units account for 117 (73.1%), while renter-occupied units make up 43 (26.9%).
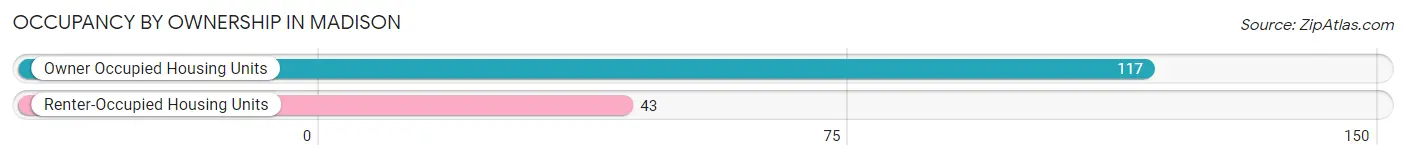
| Occupancy | # Housing Units | % Housing Units |
| Owner Occupied Housing Units | 117 | 73.1% |
| Renter-Occupied Housing Units | 43 | 26.9% |
| Total Occupied Housing Units | 160 | 100.0% |
Occupancy by Household Size in Madison
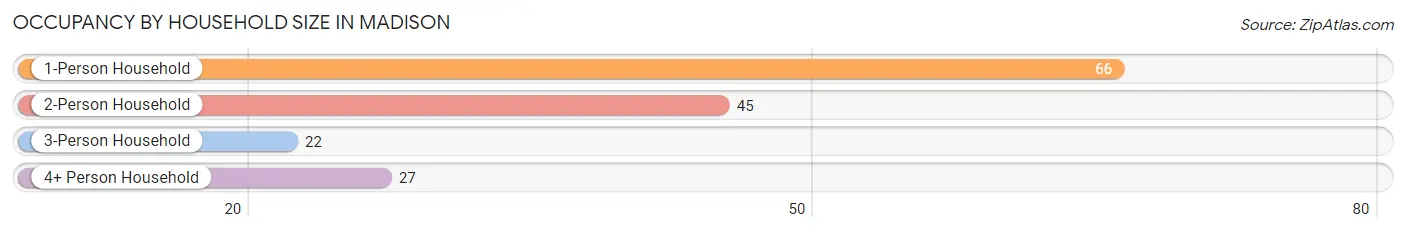
| Household Size | # Housing Units | % Housing Units |
| 1-Person Household | 66 | 41.2% |
| 2-Person Household | 45 | 28.1% |
| 3-Person Household | 22 | 13.8% |
| 4+ Person Household | 27 | 16.9% |
| Total Housing Units | 160 | 100.0% |
Occupancy by Ownership by Household Size in Madison
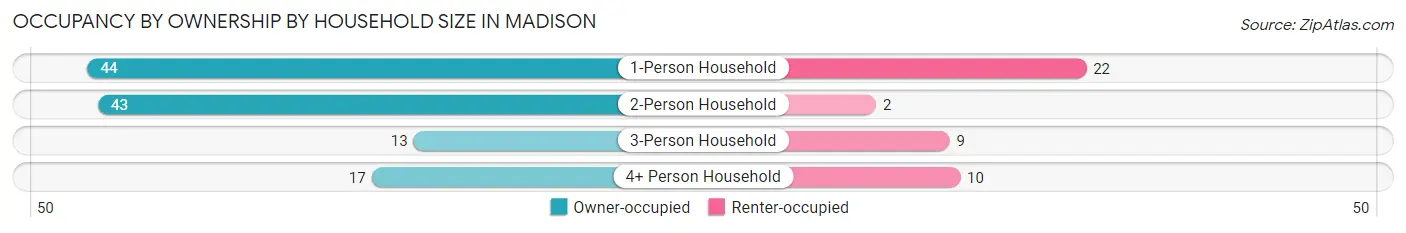
| Household Size | Owner-occupied | Renter-occupied |
| 1-Person Household | 44 (66.7%) | 22 (33.3%) |
| 2-Person Household | 43 (95.6%) | 2 (4.4%) |
| 3-Person Household | 13 (59.1%) | 9 (40.9%) |
| 4+ Person Household | 17 (63.0%) | 10 (37.0%) |
| Total Housing Units | 117 (73.1%) | 43 (26.9%) |
Occupancy by Educational Attainment in Madison
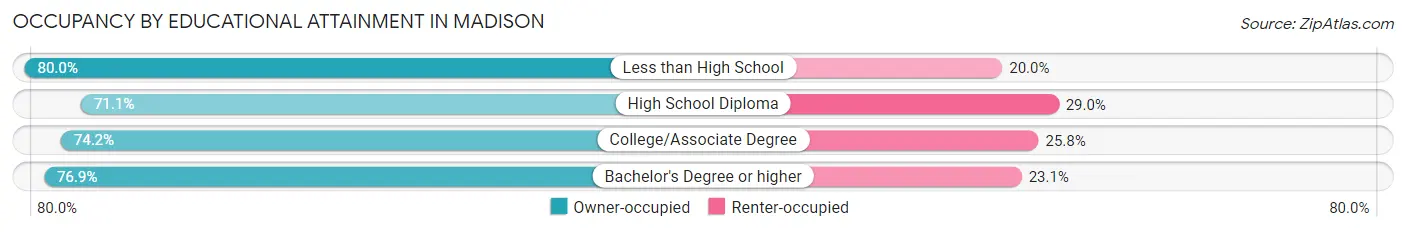
| Household Size | Owner-occupied | Renter-occupied |
| Less than High School | 4 (80.0%) | 1 (20.0%) |
| High School Diploma | 54 (71.1%) | 22 (28.9%) |
| College/Associate Degree | 49 (74.2%) | 17 (25.8%) |
| Bachelor's Degree or higher | 10 (76.9%) | 3 (23.1%) |
Occupancy by Age of Householder in Madison
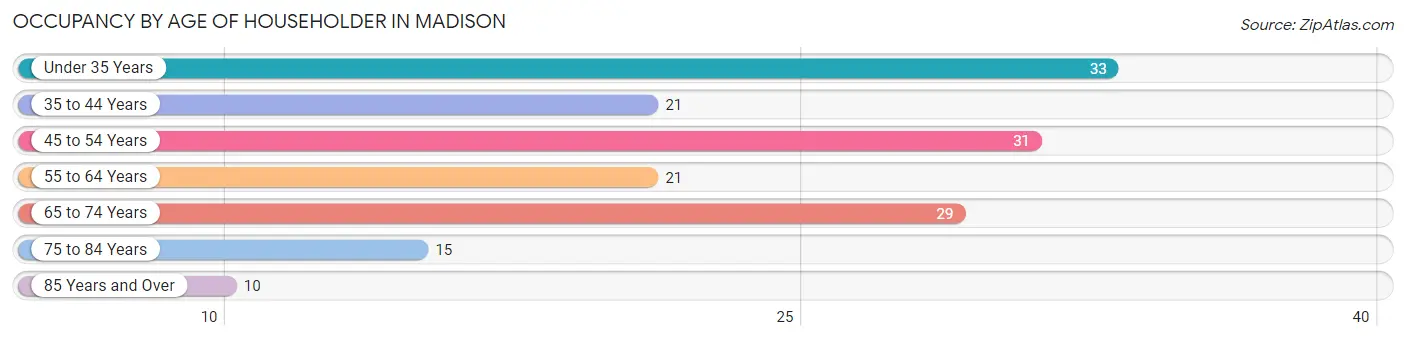
| Age Bracket | # Households | % Households |
| Under 35 Years | 33 | 20.6% |
| 35 to 44 Years | 21 | 13.1% |
| 45 to 54 Years | 31 | 19.4% |
| 55 to 64 Years | 21 | 13.1% |
| 65 to 74 Years | 29 | 18.1% |
| 75 to 84 Years | 15 | 9.4% |
| 85 Years and Over | 10 | 6.2% |
| Total | 160 | 100.0% |
Housing Finances in Madison
Median Income by Occupancy in Madison
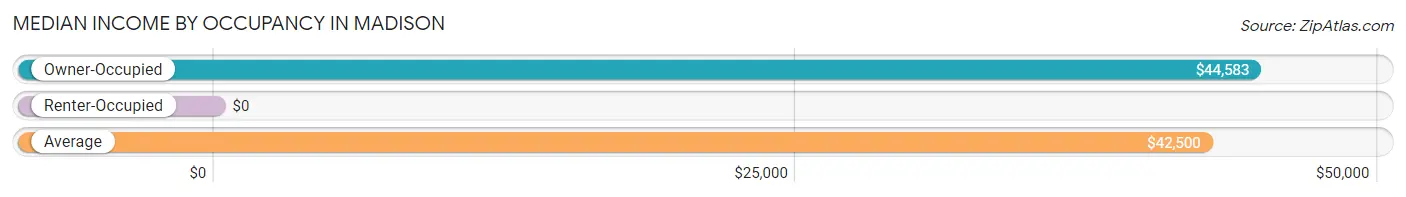
| Occupancy Type | # Households | Median Income |
| Owner-Occupied | 117 (73.1%) | $44,583 |
| Renter-Occupied | 43 (26.9%) | $0 |
| Average | 160 (100.0%) | $42,500 |
Occupancy by Householder Income Bracket in Madison
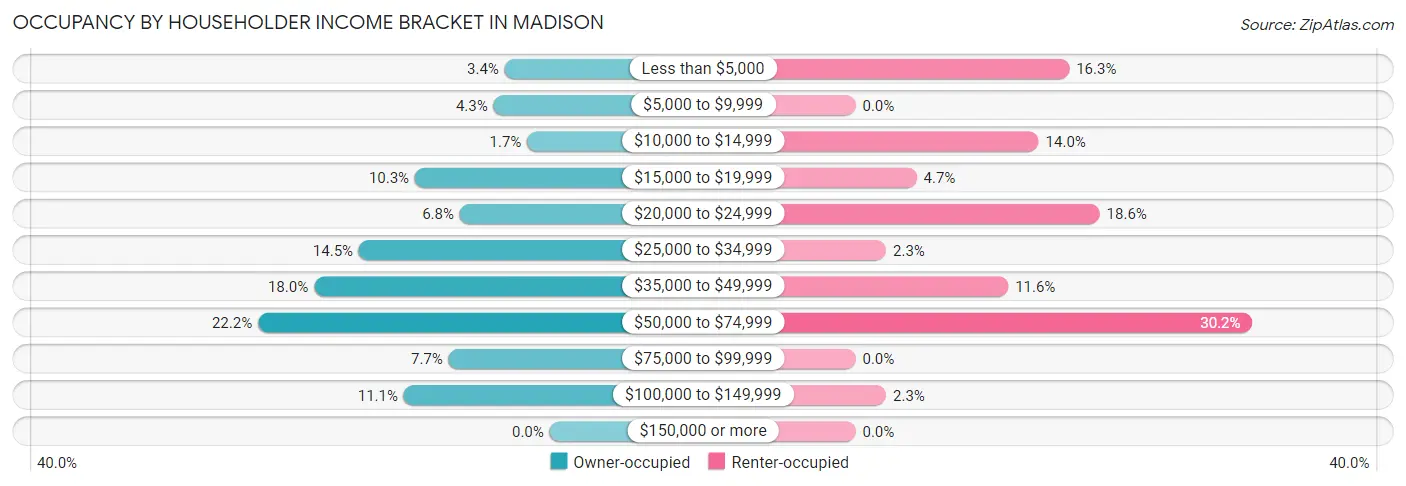
| Income Bracket | Owner-occupied | Renter-occupied |
| Less than $5,000 | 4 (3.4%) | 7 (16.3%) |
| $5,000 to $9,999 | 5 (4.3%) | 0 (0.0%) |
| $10,000 to $14,999 | 2 (1.7%) | 6 (14.0%) |
| $15,000 to $19,999 | 12 (10.3%) | 2 (4.6%) |
| $20,000 to $24,999 | 8 (6.8%) | 8 (18.6%) |
| $25,000 to $34,999 | 17 (14.5%) | 1 (2.3%) |
| $35,000 to $49,999 | 21 (17.9%) | 5 (11.6%) |
| $50,000 to $74,999 | 26 (22.2%) | 13 (30.2%) |
| $75,000 to $99,999 | 9 (7.7%) | 0 (0.0%) |
| $100,000 to $149,999 | 13 (11.1%) | 1 (2.3%) |
| $150,000 or more | 0 (0.0%) | 0 (0.0%) |
| Total | 117 (100.0%) | 43 (100.0%) |
Monthly Housing Cost Tiers in Madison
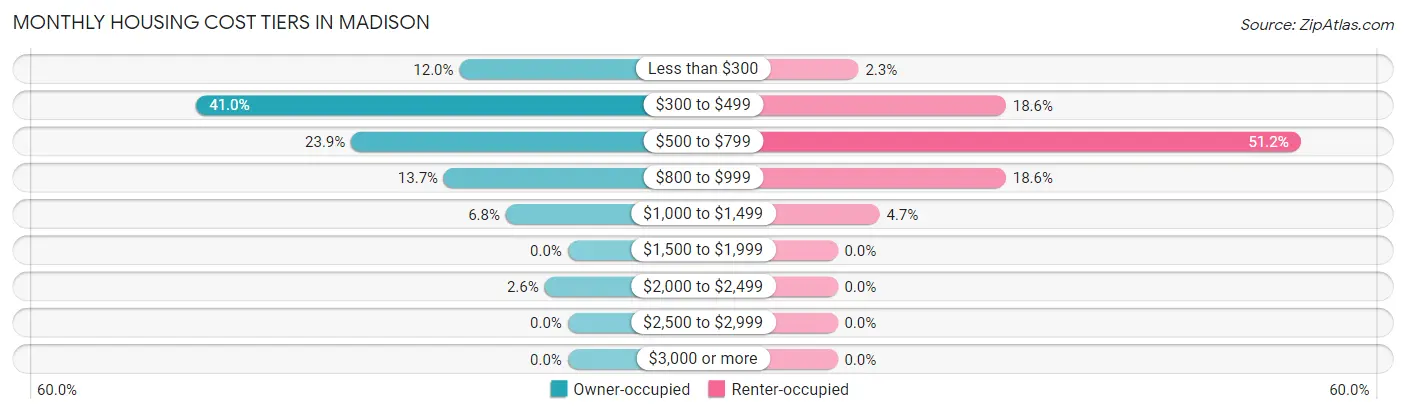
| Monthly Cost | Owner-occupied | Renter-occupied |
| Less than $300 | 14 (12.0%) | 1 (2.3%) |
| $300 to $499 | 48 (41.0%) | 8 (18.6%) |
| $500 to $799 | 28 (23.9%) | 22 (51.2%) |
| $800 to $999 | 16 (13.7%) | 8 (18.6%) |
| $1,000 to $1,499 | 8 (6.8%) | 2 (4.6%) |
| $1,500 to $1,999 | 0 (0.0%) | 0 (0.0%) |
| $2,000 to $2,499 | 3 (2.6%) | 0 (0.0%) |
| $2,500 to $2,999 | 0 (0.0%) | 0 (0.0%) |
| $3,000 or more | 0 (0.0%) | 0 (0.0%) |
| Total | 117 (100.0%) | 43 (100.0%) |
Physical Housing Characteristics in Madison
Housing Structures in Madison
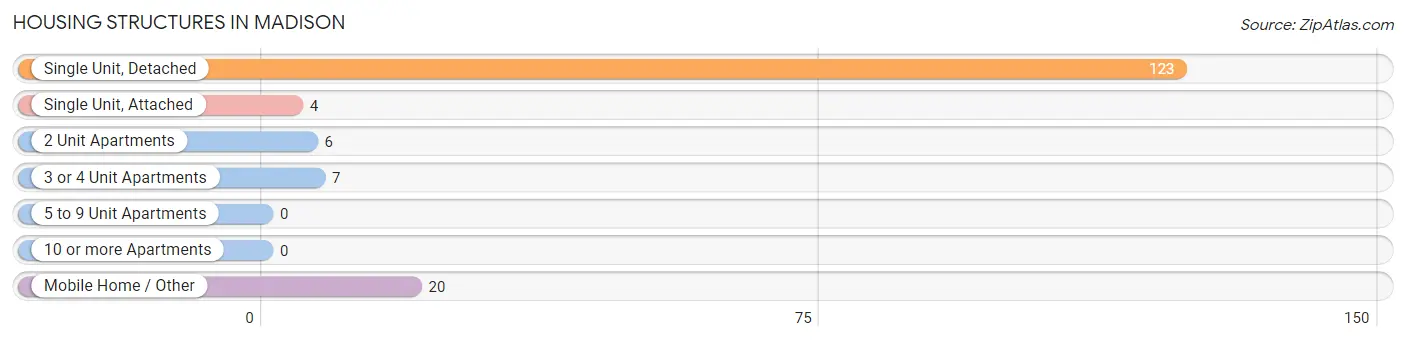
| Structure Type | # Housing Units | % Housing Units |
| Single Unit, Detached | 123 | 76.9% |
| Single Unit, Attached | 4 | 2.5% |
| 2 Unit Apartments | 6 | 3.7% |
| 3 or 4 Unit Apartments | 7 | 4.4% |
| 5 to 9 Unit Apartments | 0 | 0.0% |
| 10 or more Apartments | 0 | 0.0% |
| Mobile Home / Other | 20 | 12.5% |
| Total | 160 | 100.0% |
Housing Structures by Occupancy in Madison
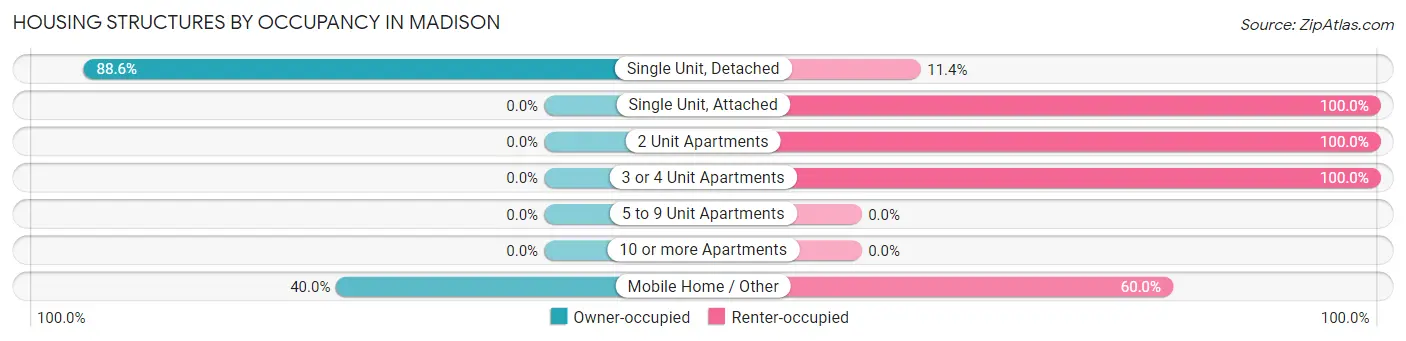
| Structure Type | Owner-occupied | Renter-occupied |
| Single Unit, Detached | 109 (88.6%) | 14 (11.4%) |
| Single Unit, Attached | 0 (0.0%) | 4 (100.0%) |
| 2 Unit Apartments | 0 (0.0%) | 6 (100.0%) |
| 3 or 4 Unit Apartments | 0 (0.0%) | 7 (100.0%) |
| 5 to 9 Unit Apartments | 0 (0.0%) | 0 (0.0%) |
| 10 or more Apartments | 0 (0.0%) | 0 (0.0%) |
| Mobile Home / Other | 8 (40.0%) | 12 (60.0%) |
| Total | 117 (73.1%) | 43 (26.9%) |
Housing Structures by Number of Rooms in Madison
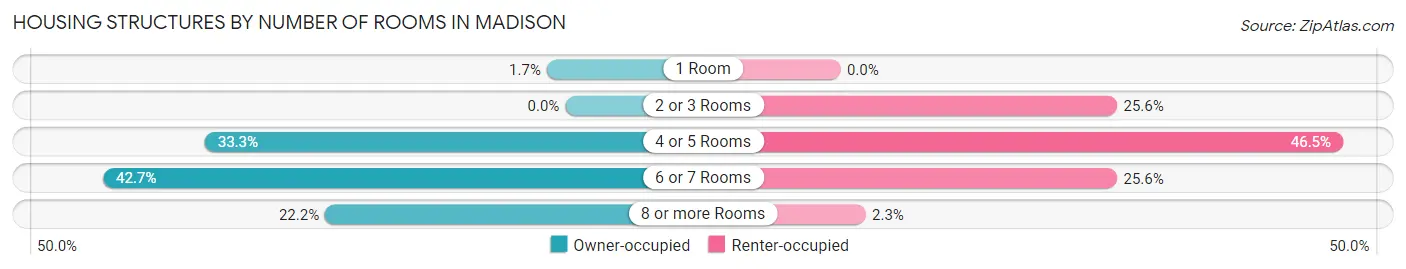
| Number of Rooms | Owner-occupied | Renter-occupied |
| 1 Room | 2 (1.7%) | 0 (0.0%) |
| 2 or 3 Rooms | 0 (0.0%) | 11 (25.6%) |
| 4 or 5 Rooms | 39 (33.3%) | 20 (46.5%) |
| 6 or 7 Rooms | 50 (42.7%) | 11 (25.6%) |
| 8 or more Rooms | 26 (22.2%) | 1 (2.3%) |
| Total | 117 (100.0%) | 43 (100.0%) |
Housing Structure by Heating Type in Madison
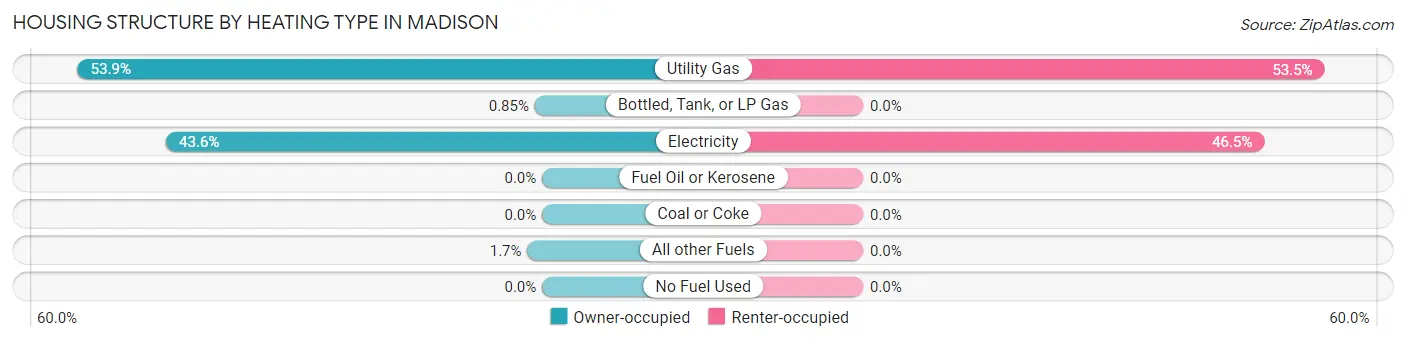
| Heating Type | Owner-occupied | Renter-occupied |
| Utility Gas | 63 (53.8%) | 23 (53.5%) |
| Bottled, Tank, or LP Gas | 1 (0.9%) | 0 (0.0%) |
| Electricity | 51 (43.6%) | 20 (46.5%) |
| Fuel Oil or Kerosene | 0 (0.0%) | 0 (0.0%) |
| Coal or Coke | 0 (0.0%) | 0 (0.0%) |
| All other Fuels | 2 (1.7%) | 0 (0.0%) |
| No Fuel Used | 0 (0.0%) | 0 (0.0%) |
| Total | 117 (100.0%) | 43 (100.0%) |
Household Vehicle Usage in Madison
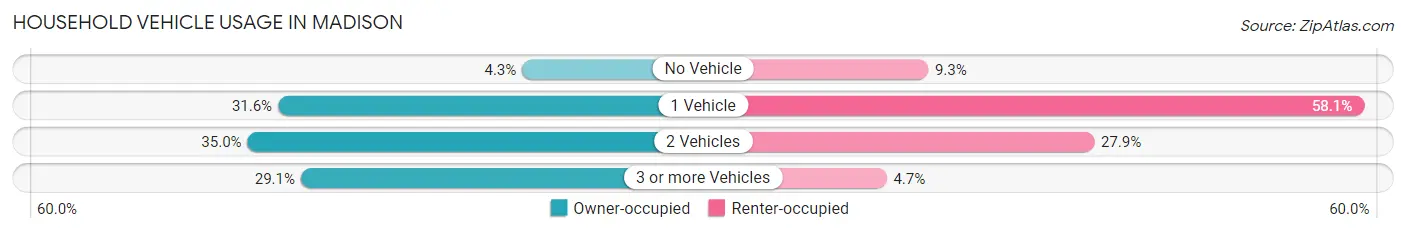
| Vehicles per Household | Owner-occupied | Renter-occupied |
| No Vehicle | 5 (4.3%) | 4 (9.3%) |
| 1 Vehicle | 37 (31.6%) | 25 (58.1%) |
| 2 Vehicles | 41 (35.0%) | 12 (27.9%) |
| 3 or more Vehicles | 34 (29.1%) | 2 (4.6%) |
| Total | 117 (100.0%) | 43 (100.0%) |
Real Estate & Mortgages in Madison
Real Estate and Mortgage Overview in Madison
| Characteristic | Without Mortgage | With Mortgage |
| Housing Units | 62 | 55 |
| Median Property Value | $122,900 | $76,900 |
| Median Household Income | $29,000 | $0 |
| Monthly Housing Costs | $359 | $0 |
| Real Estate Taxes | $700 | $2 |
Property Value by Mortgage Status in Madison
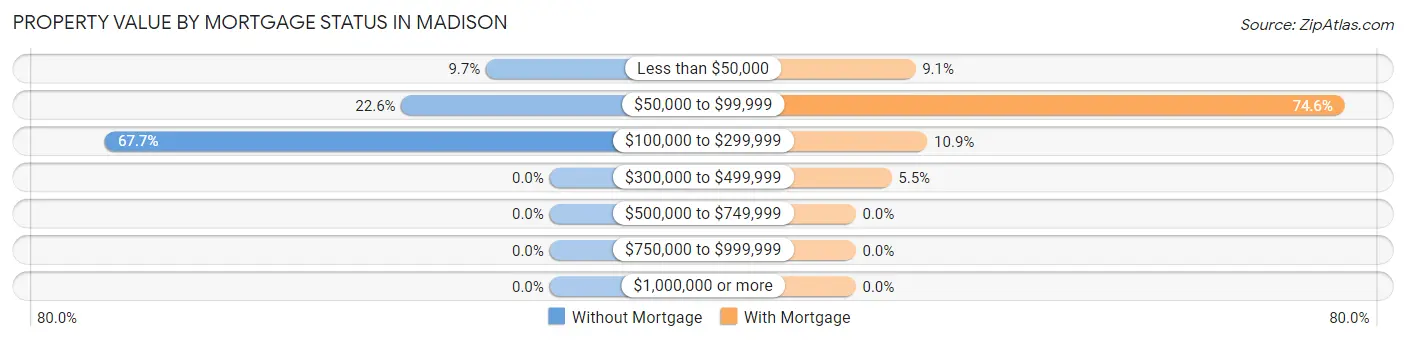
| Property Value | Without Mortgage | With Mortgage |
| Less than $50,000 | 6 (9.7%) | 5 (9.1%) |
| $50,000 to $99,999 | 14 (22.6%) | 41 (74.6%) |
| $100,000 to $299,999 | 42 (67.7%) | 6 (10.9%) |
| $300,000 to $499,999 | 0 (0.0%) | 3 (5.4%) |
| $500,000 to $749,999 | 0 (0.0%) | 0 (0.0%) |
| $750,000 to $999,999 | 0 (0.0%) | 0 (0.0%) |
| $1,000,000 or more | 0 (0.0%) | 0 (0.0%) |
| Total | 62 (100.0%) | 55 (100.0%) |
Household Income by Mortgage Status in Madison

| Household Income | Without Mortgage | With Mortgage |
| Less than $10,000 | 4 (6.5%) | 0 (0.0%) |
| $10,000 to $24,999 | 22 (35.5%) | 5 (9.1%) |
| $25,000 to $34,999 | 7 (11.3%) | 0 (0.0%) |
| $35,000 to $49,999 | 9 (14.5%) | 10 (18.2%) |
| $50,000 to $74,999 | 8 (12.9%) | 12 (21.8%) |
| $75,000 to $99,999 | 4 (6.5%) | 18 (32.7%) |
| $100,000 to $149,999 | 8 (12.9%) | 5 (9.1%) |
| $150,000 or more | 0 (0.0%) | 5 (9.1%) |
| Total | 62 (100.0%) | 55 (100.0%) |
Property Value to Household Income Ratio in Madison
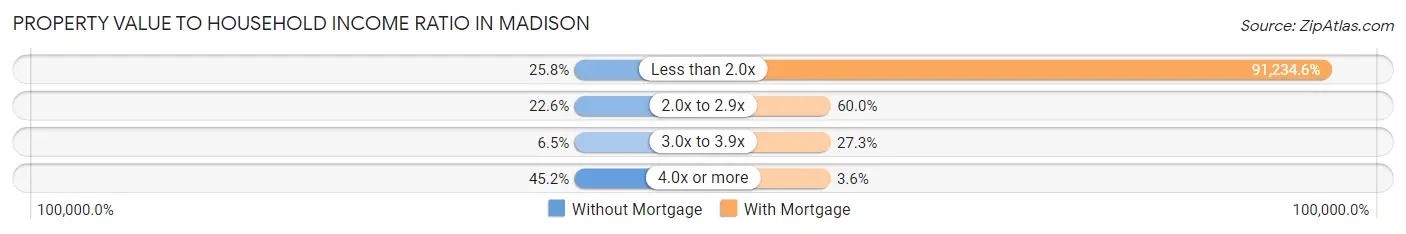
| Value-to-Income Ratio | Without Mortgage | With Mortgage |
| Less than 2.0x | 16 (25.8%) | 50,179 (91,234.6%) |
| 2.0x to 2.9x | 14 (22.6%) | 33 (60.0%) |
| 3.0x to 3.9x | 4 (6.5%) | 15 (27.3%) |
| 4.0x or more | 28 (45.2%) | 2 (3.6%) |
| Total | 62 (100.0%) | 55 (100.0%) |
Real Estate Taxes by Mortgage Status in Madison
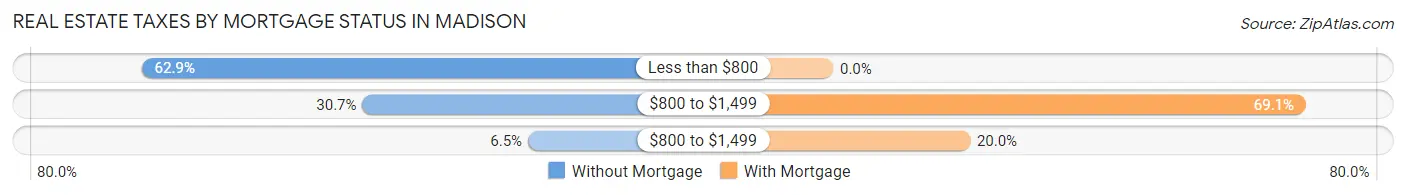
| Property Taxes | Without Mortgage | With Mortgage |
| Less than $800 | 39 (62.9%) | 0 (0.0%) |
| $800 to $1,499 | 19 (30.6%) | 38 (69.1%) |
| $800 to $1,499 | 4 (6.5%) | 11 (20.0%) |
| Total | 62 (100.0%) | 55 (100.0%) |
Health & Disability in Madison
Health Insurance Coverage by Age in Madison
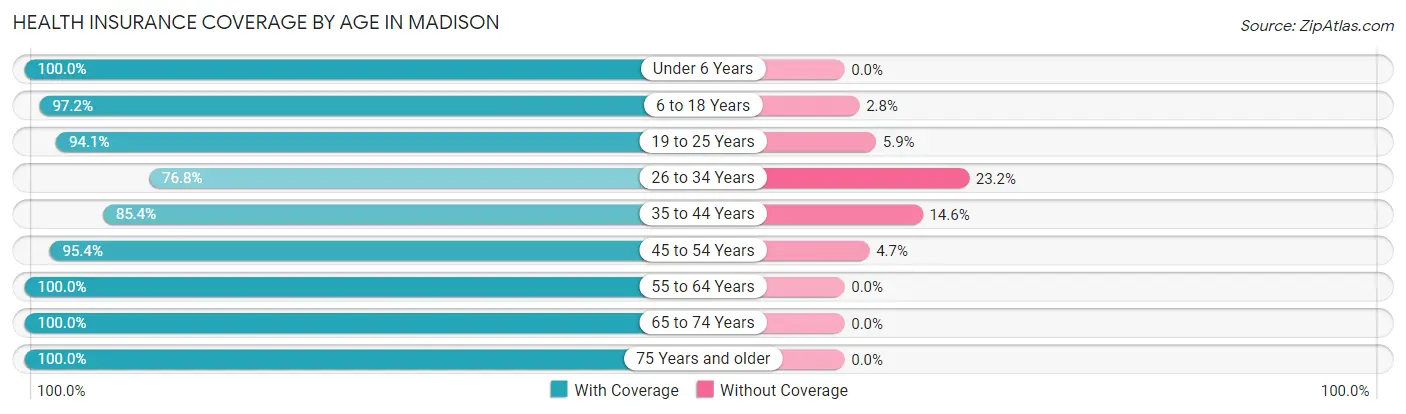
| Age Bracket | With Coverage | Without Coverage |
| Under 6 Years | 36 (100.0%) | 0 (0.0%) |
| 6 to 18 Years | 70 (97.2%) | 2 (2.8%) |
| 19 to 25 Years | 32 (94.1%) | 2 (5.9%) |
| 26 to 34 Years | 43 (76.8%) | 13 (23.2%) |
| 35 to 44 Years | 41 (85.4%) | 7 (14.6%) |
| 45 to 54 Years | 41 (95.4%) | 2 (4.6%) |
| 55 to 64 Years | 32 (100.0%) | 0 (0.0%) |
| 65 to 74 Years | 37 (100.0%) | 0 (0.0%) |
| 75 Years and older | 31 (100.0%) | 0 (0.0%) |
| Total | 363 (93.3%) | 26 (6.7%) |
Health Insurance Coverage by Citizenship Status in Madison
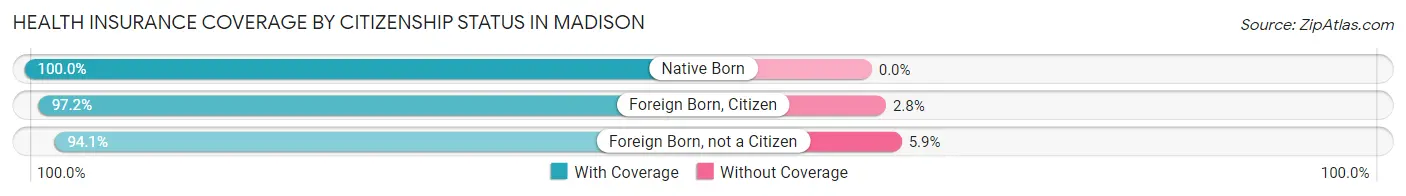
| Citizenship Status | With Coverage | Without Coverage |
| Native Born | 36 (100.0%) | 0 (0.0%) |
| Foreign Born, Citizen | 70 (97.2%) | 2 (2.8%) |
| Foreign Born, not a Citizen | 32 (94.1%) | 2 (5.9%) |
Health Insurance Coverage by Household Income in Madison
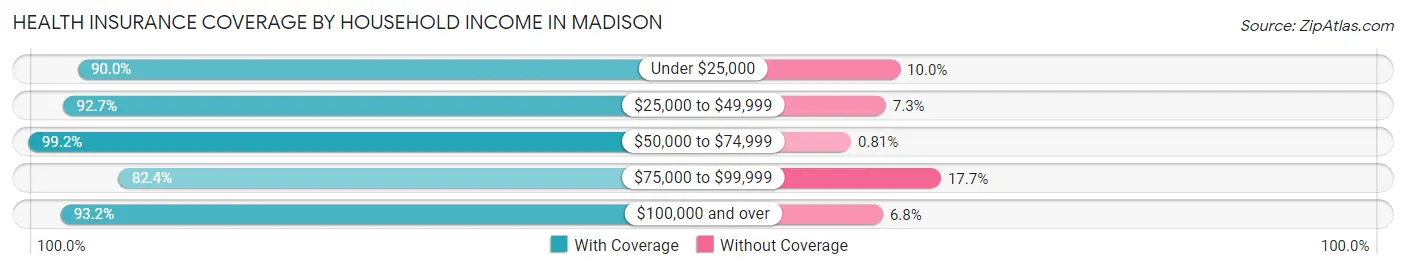
| Household Income | With Coverage | Without Coverage |
| Under $25,000 | 81 (90.0%) | 9 (10.0%) |
| $25,000 to $49,999 | 76 (92.7%) | 6 (7.3%) |
| $50,000 to $74,999 | 123 (99.2%) | 1 (0.8%) |
| $75,000 to $99,999 | 28 (82.4%) | 6 (17.6%) |
| $100,000 and over | 55 (93.2%) | 4 (6.8%) |
Public vs Private Health Insurance Coverage by Age in Madison
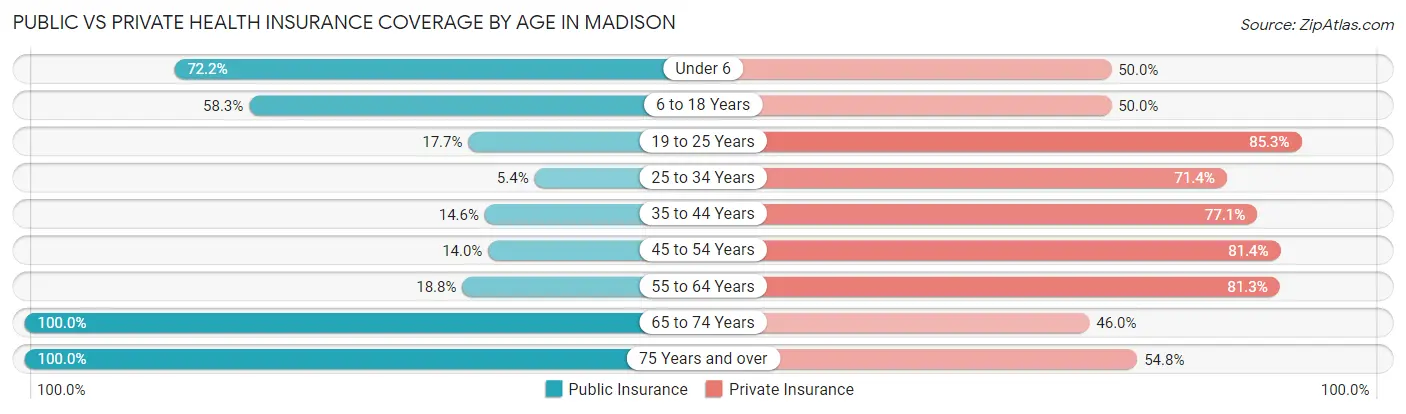
| Age Bracket | Public Insurance | Private Insurance |
| Under 6 | 26 (72.2%) | 18 (50.0%) |
| 6 to 18 Years | 42 (58.3%) | 36 (50.0%) |
| 19 to 25 Years | 6 (17.6%) | 29 (85.3%) |
| 25 to 34 Years | 3 (5.4%) | 40 (71.4%) |
| 35 to 44 Years | 7 (14.6%) | 37 (77.1%) |
| 45 to 54 Years | 6 (14.0%) | 35 (81.4%) |
| 55 to 64 Years | 6 (18.8%) | 26 (81.2%) |
| 65 to 74 Years | 37 (100.0%) | 17 (46.0%) |
| 75 Years and over | 31 (100.0%) | 17 (54.8%) |
| Total | 164 (42.2%) | 255 (65.5%) |
Disability Status by Sex by Age in Madison
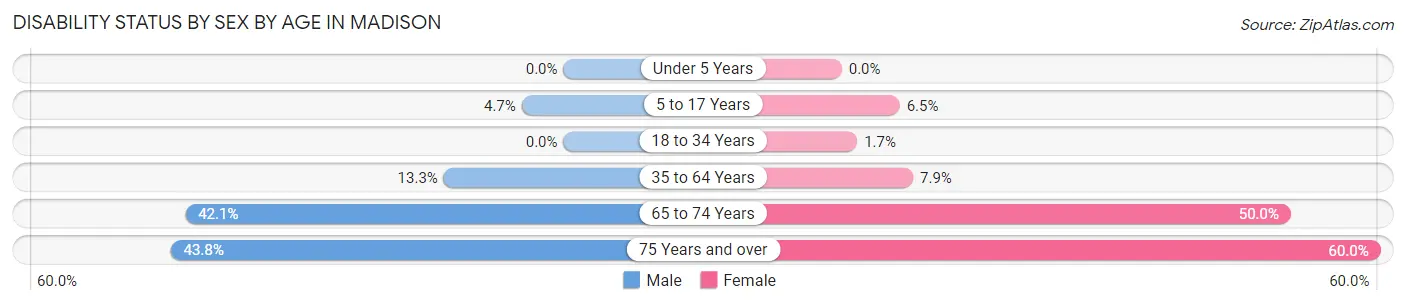
| Age Bracket | Male | Female |
| Under 5 Years | 0 (0.0%) | 0 (0.0%) |
| 5 to 17 Years | 2 (4.6%) | 2 (6.5%) |
| 18 to 34 Years | 0 (0.0%) | 1 (1.7%) |
| 35 to 64 Years | 8 (13.3%) | 5 (7.9%) |
| 65 to 74 Years | 8 (42.1%) | 9 (50.0%) |
| 75 Years and over | 7 (43.8%) | 9 (60.0%) |
Disability Class by Sex by Age in Madison
Disability Class: Hearing Difficulty
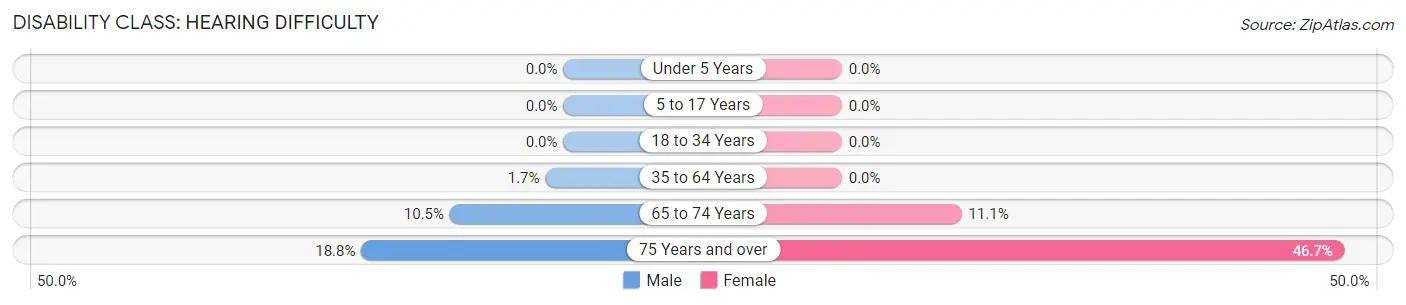
| Age Bracket | Male | Female |
| Under 5 Years | 0 (0.0%) | 0 (0.0%) |
| 5 to 17 Years | 0 (0.0%) | 0 (0.0%) |
| 18 to 34 Years | 0 (0.0%) | 0 (0.0%) |
| 35 to 64 Years | 1 (1.7%) | 0 (0.0%) |
| 65 to 74 Years | 2 (10.5%) | 2 (11.1%) |
| 75 Years and over | 3 (18.8%) | 7 (46.7%) |
Disability Class: Vision Difficulty
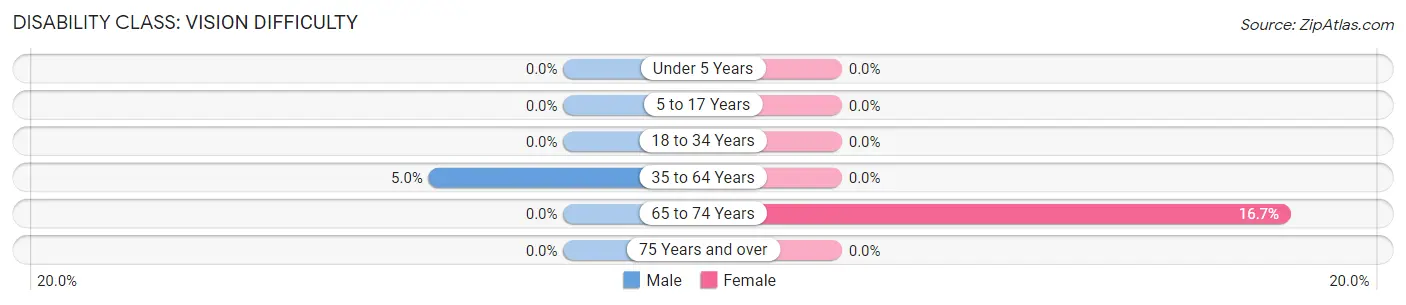
| Age Bracket | Male | Female |
| Under 5 Years | 0 (0.0%) | 0 (0.0%) |
| 5 to 17 Years | 0 (0.0%) | 0 (0.0%) |
| 18 to 34 Years | 0 (0.0%) | 0 (0.0%) |
| 35 to 64 Years | 3 (5.0%) | 0 (0.0%) |
| 65 to 74 Years | 0 (0.0%) | 3 (16.7%) |
| 75 Years and over | 0 (0.0%) | 0 (0.0%) |
Disability Class: Cognitive Difficulty
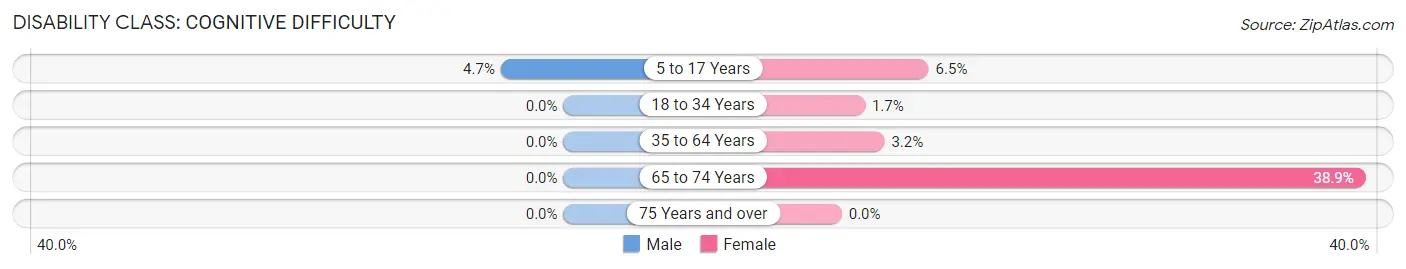
| Age Bracket | Male | Female |
| 5 to 17 Years | 2 (4.6%) | 2 (6.5%) |
| 18 to 34 Years | 0 (0.0%) | 1 (1.7%) |
| 35 to 64 Years | 0 (0.0%) | 2 (3.2%) |
| 65 to 74 Years | 0 (0.0%) | 7 (38.9%) |
| 75 Years and over | 0 (0.0%) | 0 (0.0%) |
Disability Class: Ambulatory Difficulty
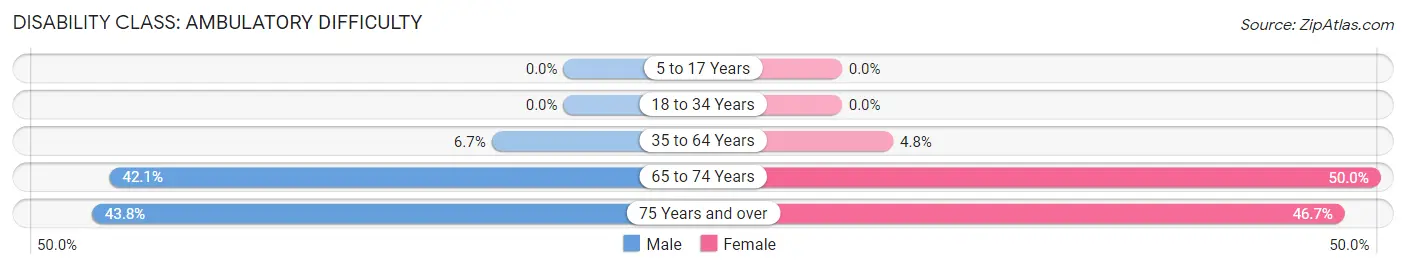
| Age Bracket | Male | Female |
| 5 to 17 Years | 0 (0.0%) | 0 (0.0%) |
| 18 to 34 Years | 0 (0.0%) | 0 (0.0%) |
| 35 to 64 Years | 4 (6.7%) | 3 (4.8%) |
| 65 to 74 Years | 8 (42.1%) | 9 (50.0%) |
| 75 Years and over | 7 (43.8%) | 7 (46.7%) |
Disability Class: Self-Care Difficulty
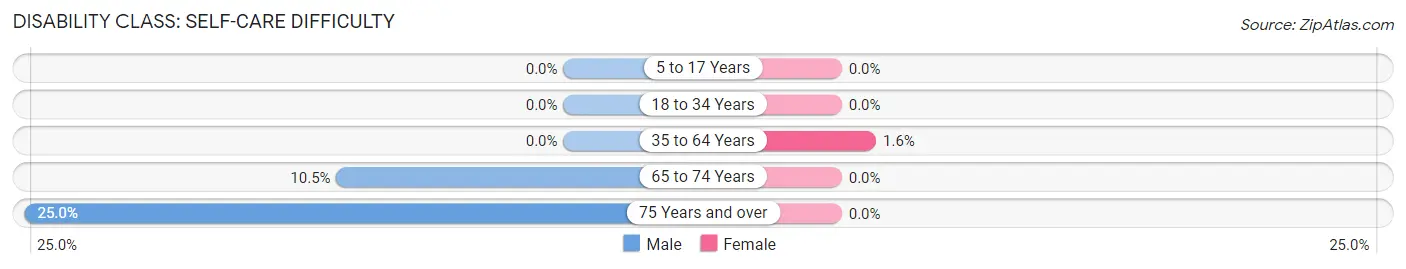
| Age Bracket | Male | Female |
| 5 to 17 Years | 0 (0.0%) | 0 (0.0%) |
| 18 to 34 Years | 0 (0.0%) | 0 (0.0%) |
| 35 to 64 Years | 0 (0.0%) | 1 (1.6%) |
| 65 to 74 Years | 2 (10.5%) | 0 (0.0%) |
| 75 Years and over | 4 (25.0%) | 0 (0.0%) |
Technology Access in Madison
Computing Device Access in Madison
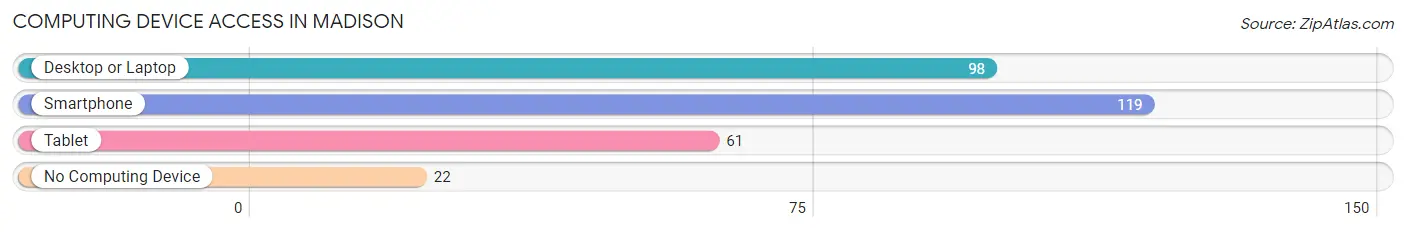
| Device Type | # Households | % Households |
| Desktop or Laptop | 98 | 61.3% |
| Smartphone | 119 | 74.4% |
| Tablet | 61 | 38.1% |
| No Computing Device | 22 | 13.8% |
| Total | 160 | 100.0% |
Internet Access in Madison
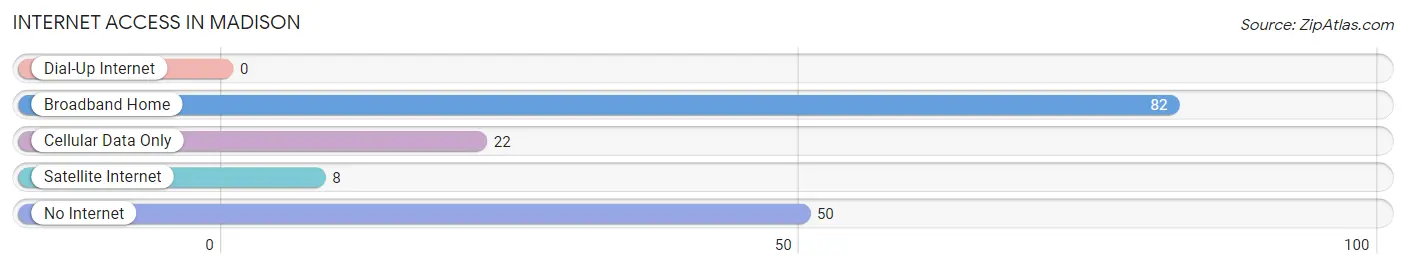
| Internet Type | # Households | % Households |
| Dial-Up Internet | 0 | 0.0% |
| Broadband Home | 82 | 51.2% |
| Cellular Data Only | 22 | 13.8% |
| Satellite Internet | 8 | 5.0% |
| No Internet | 50 | 31.2% |
| Total | 160 | 100.0% |
Madison Summary
Madison is a small city located in the state of Missouri, in the United States. It is situated in the southeastern corner of the state, in St. Francois County. The city is located on the banks of the St. Francis River, and is surrounded by rolling hills and woodlands. As of the 2010 census, the population of Madison was 1,845.
History
Madison was founded in 1818 by a group of settlers from Kentucky. The city was named after James Madison, the fourth President of the United States. The city was originally a trading post, and the settlers built a fort to protect themselves from Native American attacks. The fort was later abandoned, and the city grew slowly.
In the late 19th century, Madison became a center for the timber industry. The city was also home to several coal mines, and the population grew rapidly. By the early 20th century, Madison had become a bustling town with a population of over 2,000.
Geography
Madison is located in the southeastern corner of Missouri, in St. Francois County. The city is situated on the banks of the St. Francis River, and is surrounded by rolling hills and woodlands. The city has a total area of 2.2 square miles, all of which is land.
The climate in Madison is humid subtropical, with hot, humid summers and mild winters. The average annual temperature is around 57 degrees Fahrenheit, and the average annual precipitation is around 40 inches.
Economy
The economy of Madison is largely based on agriculture and manufacturing. The city is home to several large farms, and the surrounding area is known for its production of corn, soybeans, and wheat. The city is also home to several manufacturing companies, including a furniture factory and a plastics factory.
The city is also home to several small businesses, including restaurants, retail stores, and service providers. The city is also home to a small airport, which serves the surrounding area.
Demographics
As of the 2010 census, the population of Madison was 1,845. The racial makeup of the city was 95.3% White, 1.2% African American, 0.3% Native American, 0.2% Asian, 0.1% Pacific Islander, 0.7% from other races, and 2.3% from two or more races. Hispanic or Latino of any race were 1.7% of the population.
The median income for a household in Madison was $31,250, and the median income for a family was $37,500. The per capita income for the city was $17,845. About 17.2% of families and 20.2% of the population were below the poverty line, including 28.3% of those under age 18 and 11.2% of those age 65 or over.
Common Questions
What is Per Capita Income in Madison?
Per Capita income in Madison is $21,495.
What is the Median Family Income in Madison?
Median Family Income in Madison is $51,042.
What is the Median Household income in Madison?
Median Household Income in Madison is $42,500.
What is Income or Wage Gap in Madison?
Income or Wage Gap in Madison is 31.0%.
Women in Madison earn 69.0 cents for every dollar earned by a man.
What is Inequality or Gini Index in Madison?
Inequality or Gini Index in Madison is 0.39.
What is the Total Population of Madison?
Total Population of Madison is 389.
What is the Total Male Population of Madison?
Total Male Population of Madison is 185.
What is the Total Female Population of Madison?
Total Female Population of Madison is 204.
What is the Ratio of Males per 100 Females in Madison?
There are 90.69 Males per 100 Females in Madison.
What is the Ratio of Females per 100 Males in Madison?
There are 110.27 Females per 100 Males in Madison.
What is the Median Population Age in Madison?
Median Population Age in Madison is 34.6 Years.
What is the Average Family Size in Madison
Average Family Size in Madison is 3.4 People.
What is the Average Household Size in Madison
Average Household Size in Madison is 2.4 People.
How Large is the Labor Force in Madison?
There are 175 People in the Labor Forcein in Madison.
What is the Percentage of People in the Labor Force in Madison?
59.7% of People are in the Labor Force in Madison.