Louisiana, MO Map & Demographics
Louisiana Map
Louisiana Overview
$23,571
PER CAPITA INCOME
$73,208
AVG FAMILY INCOME
$48,410
AVG HOUSEHOLD INCOME
38.4%
WAGE / INCOME GAP [ % ]
61.6¢/ $1
WAGE / INCOME GAP [ $ ]
0.42
INEQUALITY / GINI INDEX
3,249
TOTAL POPULATION
1,750
MALE POPULATION
1,499
FEMALE POPULATION
116.74
MALES / 100 FEMALES
85.66
FEMALES / 100 MALES
38.5
MEDIAN AGE
3.2
AVG FAMILY SIZE
2.4
AVG HOUSEHOLD SIZE
1,323
LABOR FORCE [ PEOPLE ]
55.1%
PERCENT IN LABOR FORCE
6.2%
UNEMPLOYMENT RATE
Louisiana Zip Codes
Louisiana Area Codes
Income in Louisiana
Income Overview in Louisiana
Per Capita Income in Louisiana is $23,571, while median incomes of families and households are $73,208 and $48,410 respectively.
| Characteristic | Number | Measure |
| Per Capita Income | 3,249 | $23,571 |
| Median Family Income | 807 | $73,208 |
| Mean Family Income | 807 | $73,866 |
| Median Household Income | 1,323 | $48,410 |
| Mean Household Income | 1,323 | $58,566 |
| Income Deficit | 807 | $0 |
| Wage / Income Gap (%) | 3,249 | 38.40% |
| Wage / Income Gap ($) | 3,249 | 61.60¢ per $1 |
| Gini / Inequality Index | 3,249 | 0.42 |
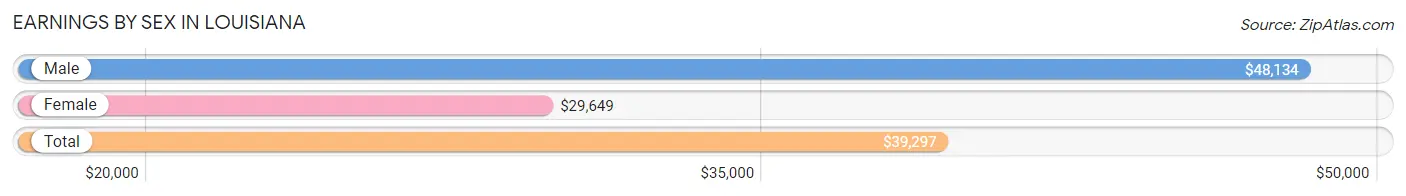
Earnings by Sex in Louisiana
Average Earnings in Louisiana are $39,297, $48,134 for men and $29,649 for women, a difference of 38.4%.
| Sex | Number | Average Earnings |
| Male | 749 (56.6%) | $48,134 |
| Female | 574 (43.4%) | $29,649 |
| Total | 1,323 (100.0%) | $39,297 |
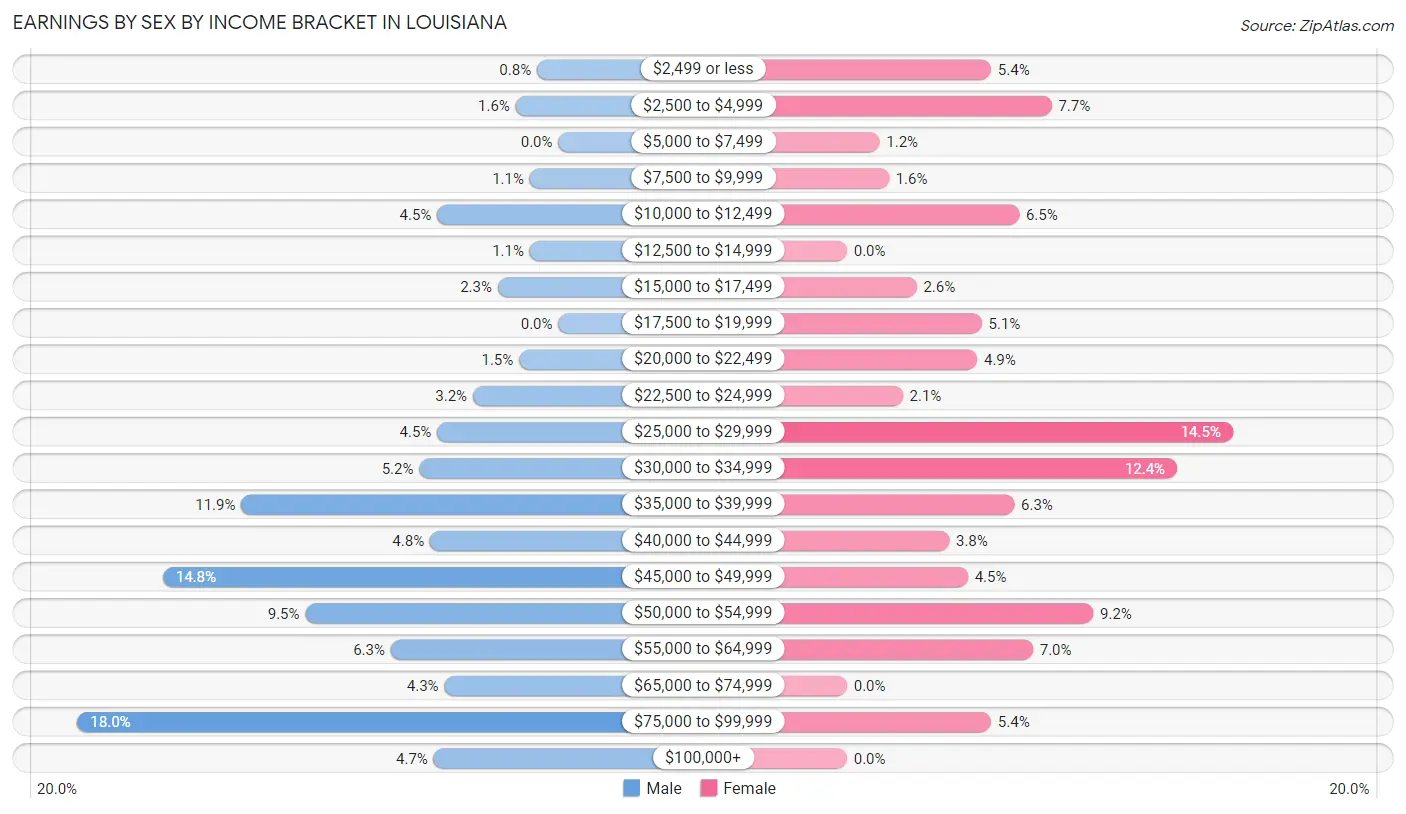
Earnings by Sex by Income Bracket in Louisiana
The most common earnings brackets in Louisiana are $75,000 to $99,999 for men (135 | 18.0%) and $25,000 to $29,999 for women (83 | 14.5%).
| Income | Male | Female |
| $2,499 or less | 6 (0.8%) | 31 (5.4%) |
| $2,500 to $4,999 | 12 (1.6%) | 44 (7.7%) |
| $5,000 to $7,499 | 0 (0.0%) | 7 (1.2%) |
| $7,500 to $9,999 | 8 (1.1%) | 9 (1.6%) |
| $10,000 to $12,499 | 34 (4.5%) | 37 (6.5%) |
| $12,500 to $14,999 | 8 (1.1%) | 0 (0.0%) |
| $15,000 to $17,499 | 17 (2.3%) | 15 (2.6%) |
| $17,500 to $19,999 | 0 (0.0%) | 29 (5.1%) |
| $20,000 to $22,499 | 11 (1.5%) | 28 (4.9%) |
| $22,500 to $24,999 | 24 (3.2%) | 12 (2.1%) |
| $25,000 to $29,999 | 34 (4.5%) | 83 (14.5%) |
| $30,000 to $34,999 | 39 (5.2%) | 71 (12.4%) |
| $35,000 to $39,999 | 89 (11.9%) | 36 (6.3%) |
| $40,000 to $44,999 | 36 (4.8%) | 22 (3.8%) |
| $45,000 to $49,999 | 111 (14.8%) | 26 (4.5%) |
| $50,000 to $54,999 | 71 (9.5%) | 53 (9.2%) |
| $55,000 to $64,999 | 47 (6.3%) | 40 (7.0%) |
| $65,000 to $74,999 | 32 (4.3%) | 0 (0.0%) |
| $75,000 to $99,999 | 135 (18.0%) | 31 (5.4%) |
| $100,000+ | 35 (4.7%) | 0 (0.0%) |
| Total | 749 (100.0%) | 574 (100.0%) |
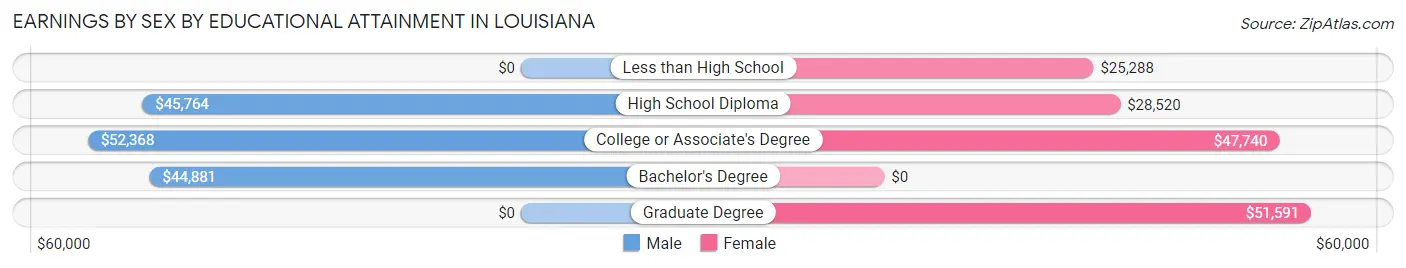
Earnings by Sex by Educational Attainment in Louisiana
Average earnings in Louisiana are $50,526 for men and $30,714 for women, a difference of 39.2%. Men with an educational attainment of college or associate's degree enjoy the highest average annual earnings of $52,368, while those with bachelor's degree education earn the least with $44,881. Women with an educational attainment of graduate degree earn the most with the average annual earnings of $51,591, while those with less than high school education have the smallest earnings of $25,288.
| Educational Attainment | Male Income | Female Income |
| Less than High School | - | - |
| High School Diploma | $45,764 | $28,520 |
| College or Associate's Degree | $52,368 | $47,740 |
| Bachelor's Degree | $44,881 | $0 |
| Graduate Degree | - | - |
| Total | $50,526 | $30,714 |
Family Income in Louisiana
Family Income Brackets in Louisiana
According to the Louisiana family income data, there are 224 families falling into the $75,000 to $99,999 income range, which is the most common income bracket and makes up 27.8% of all families. Conversely, the $25,000 to $34,999 income bracket is the least frequent group with only 15 families (1.9%) belonging to this category.
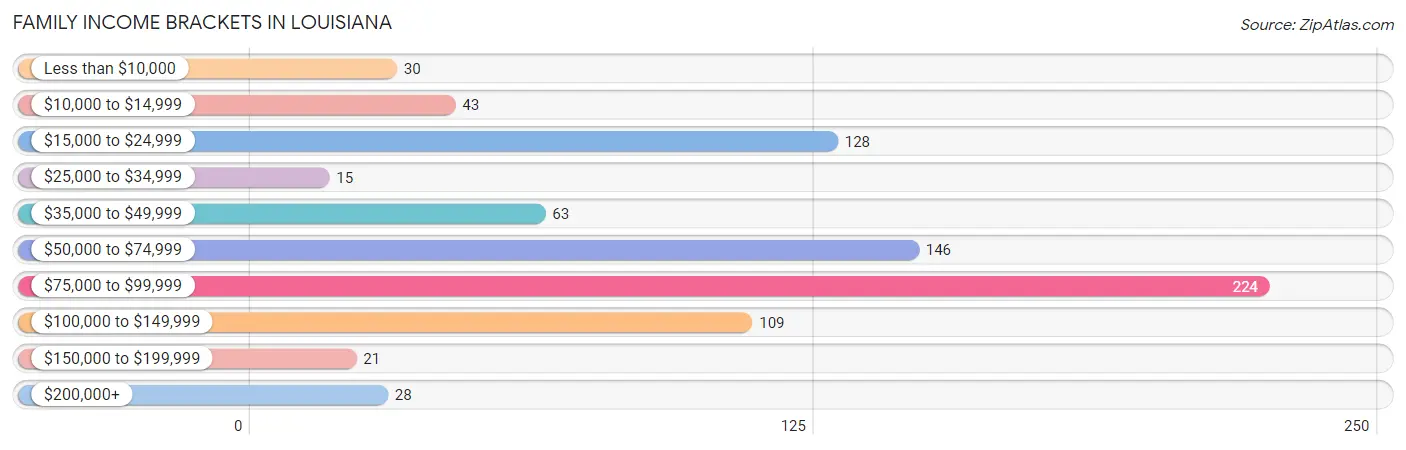
| Income Bracket | # Families | % Families |
| Less than $10,000 | 30 | 3.7% |
| $10,000 to $14,999 | 43 | 5.3% |
| $15,000 to $24,999 | 128 | 15.9% |
| $25,000 to $34,999 | 15 | 1.9% |
| $35,000 to $49,999 | 63 | 7.8% |
| $50,000 to $74,999 | 146 | 18.1% |
| $75,000 to $99,999 | 224 | 27.8% |
| $100,000 to $149,999 | 109 | 13.5% |
| $150,000 to $199,999 | 21 | 2.6% |
| $200,000+ | 28 | 3.5% |
Family Income by Famaliy Size in Louisiana
4-person families (156 | 19.3%) account for the highest median family income in Louisiana with $89,808 per family, while 2-person families (475 | 58.9%) have the highest median income of $28,562 per family member.
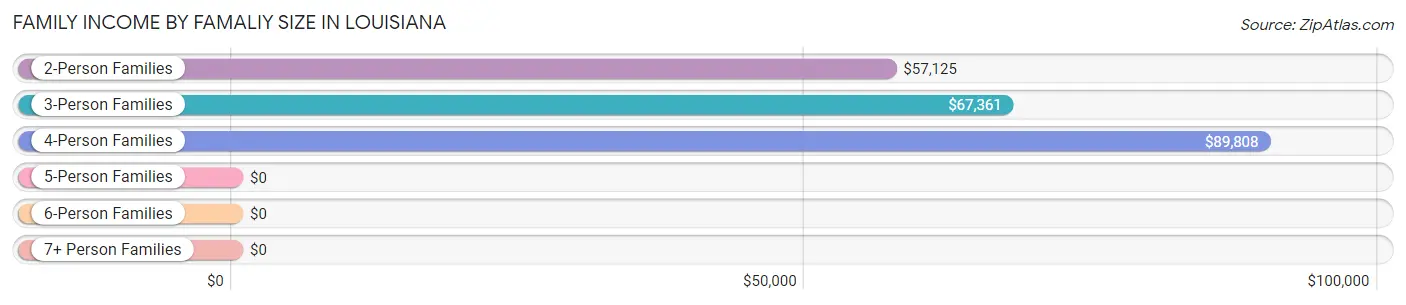
| Income Bracket | # Families | Median Income |
| 2-Person Families | 475 (58.9%) | $57,125 |
| 3-Person Families | 49 (6.1%) | $67,361 |
| 4-Person Families | 156 (19.3%) | $89,808 |
| 5-Person Families | 41 (5.1%) | $0 |
| 6-Person Families | 86 (10.7%) | $0 |
| 7+ Person Families | 0 (0.0%) | $0 |
| Total | 807 (100.0%) | $73,208 |
Family Income by Number of Earners in Louisiana
The median family income in Louisiana is $73,208, with families comprising 3+ earners (86) having the highest median family income of $122,683, while families with no earners (183) have the lowest median family income of $17,023, accounting for 10.7% and 22.7% of families, respectively.
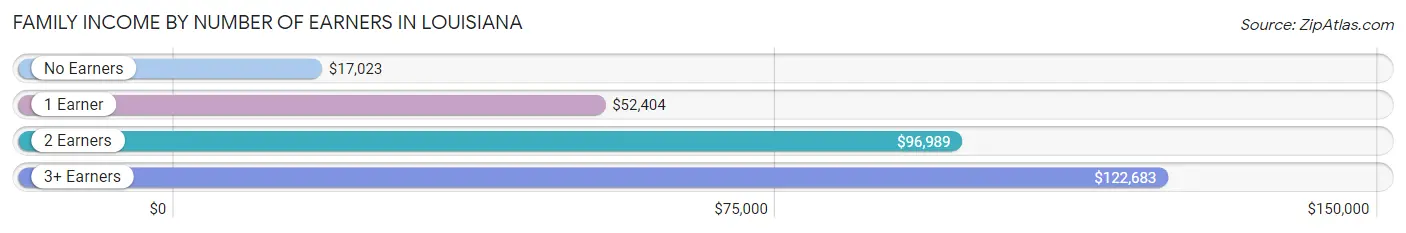
| Number of Earners | # Families | Median Income |
| No Earners | 183 (22.7%) | $17,023 |
| 1 Earner | 315 (39.0%) | $52,404 |
| 2 Earners | 223 (27.6%) | $96,989 |
| 3+ Earners | 86 (10.7%) | $122,683 |
| Total | 807 (100.0%) | $73,208 |
Household Income in Louisiana
Household Income Brackets in Louisiana
With 275 households falling in the category, the $75,000 to $99,999 income range is the most frequent in Louisiana, accounting for 20.8% of all households. In contrast, only 21 households (1.6%) fall into the $150,000 to $199,999 income bracket, making it the least populous group.
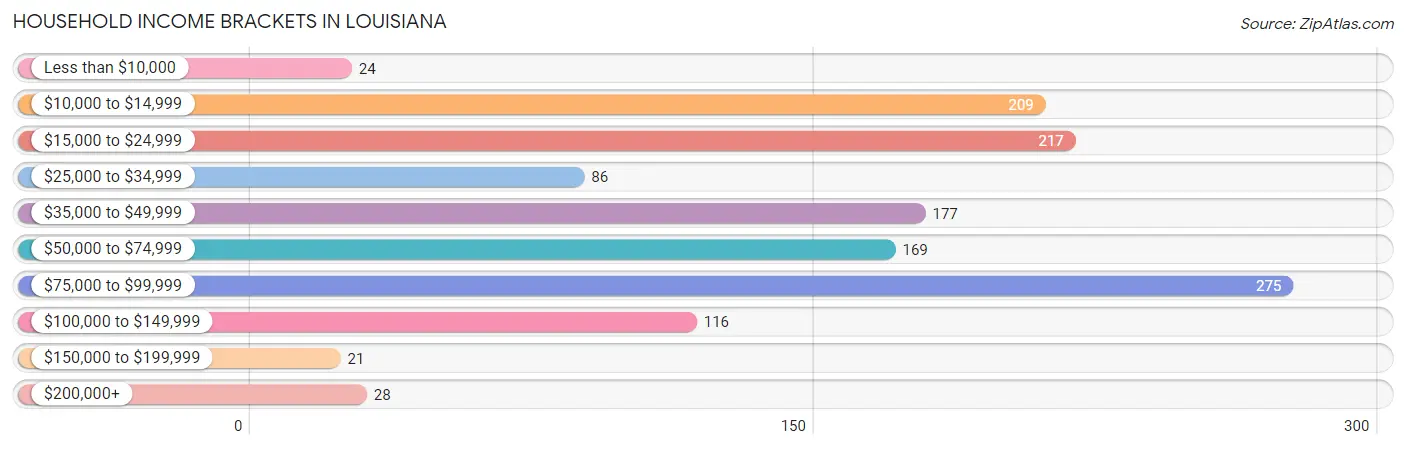
| Income Bracket | # Households | % Households |
| Less than $10,000 | 24 | 1.8% |
| $10,000 to $14,999 | 209 | 15.8% |
| $15,000 to $24,999 | 217 | 16.4% |
| $25,000 to $34,999 | 86 | 6.5% |
| $35,000 to $49,999 | 177 | 13.4% |
| $50,000 to $74,999 | 169 | 12.8% |
| $75,000 to $99,999 | 275 | 20.8% |
| $100,000 to $149,999 | 116 | 8.8% |
| $150,000 to $199,999 | 21 | 1.6% |
| $200,000+ | 28 | 2.1% |
Household Income by Householder Age in Louisiana
The median household income in Louisiana is $48,410, with the highest median household income of $88,942 found in the 25 to 44 years age bracket for the primary householder. A total of 452 households (34.2%) fall into this category. Meanwhile, the 45 to 64 years age bracket for the primary householder has the lowest median household income of $0, with 431 households (32.6%) in this group.
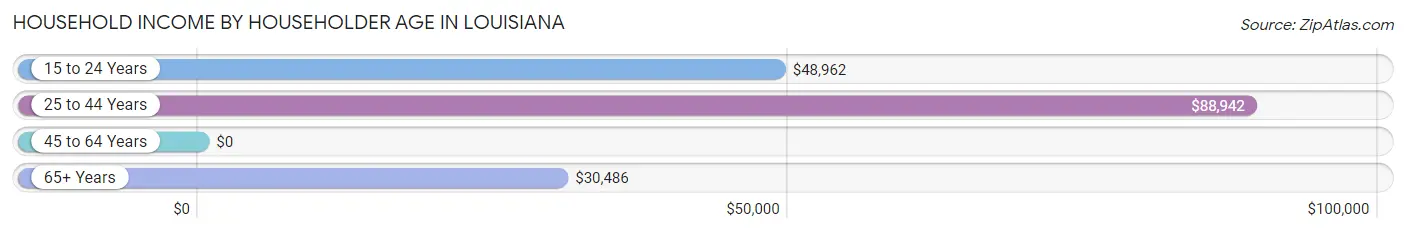
| Income Bracket | # Households | Median Income |
| 15 to 24 Years | 99 (7.5%) | $48,962 |
| 25 to 44 Years | 452 (34.2%) | $88,942 |
| 45 to 64 Years | 431 (32.6%) | $0 |
| 65+ Years | 341 (25.8%) | $30,486 |
| Total | 1,323 (100.0%) | $48,410 |
Poverty in Louisiana
Income Below Poverty by Sex and Age in Louisiana
With 24.8% poverty level for males and 26.4% for females among the residents of Louisiana, 16 and 17 year old males and 6 to 11 year old females are the most vulnerable to poverty, with 28 males (59.6%) and 32 females (64.0%) in their respective age groups living below the poverty level.
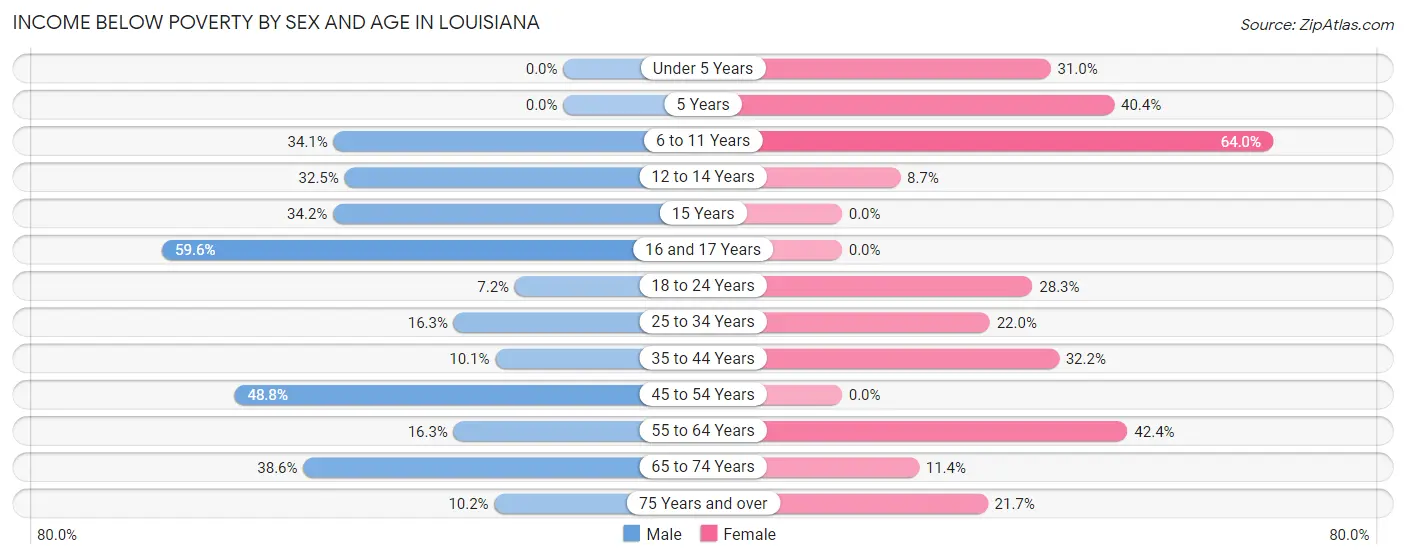
| Age Bracket | Male | Female |
| Under 5 Years | 0 (0.0%) | 31 (31.0%) |
| 5 Years | 0 (0.0%) | 38 (40.4%) |
| 6 to 11 Years | 73 (34.1%) | 32 (64.0%) |
| 12 to 14 Years | 38 (32.5%) | 9 (8.6%) |
| 15 Years | 27 (34.2%) | 0 (0.0%) |
| 16 and 17 Years | 28 (59.6%) | 0 (0.0%) |
| 18 to 24 Years | 12 (7.2%) | 15 (28.3%) |
| 25 to 34 Years | 34 (16.3%) | 38 (22.0%) |
| 35 to 44 Years | 19 (10.1%) | 67 (32.2%) |
| 45 to 54 Years | 103 (48.8%) | 0 (0.0%) |
| 55 to 64 Years | 28 (16.3%) | 123 (42.4%) |
| 65 to 74 Years | 61 (38.6%) | 12 (11.4%) |
| 75 Years and over | 9 (10.2%) | 21 (21.6%) |
| Total | 432 (24.8%) | 386 (26.4%) |
Income Above Poverty by Sex and Age in Louisiana
According to the poverty statistics in Louisiana, males aged under 5 years and females aged 16 and 17 years are the age groups that are most secure financially, with 100.0% of males and 100.0% of females in these age groups living above the poverty line.
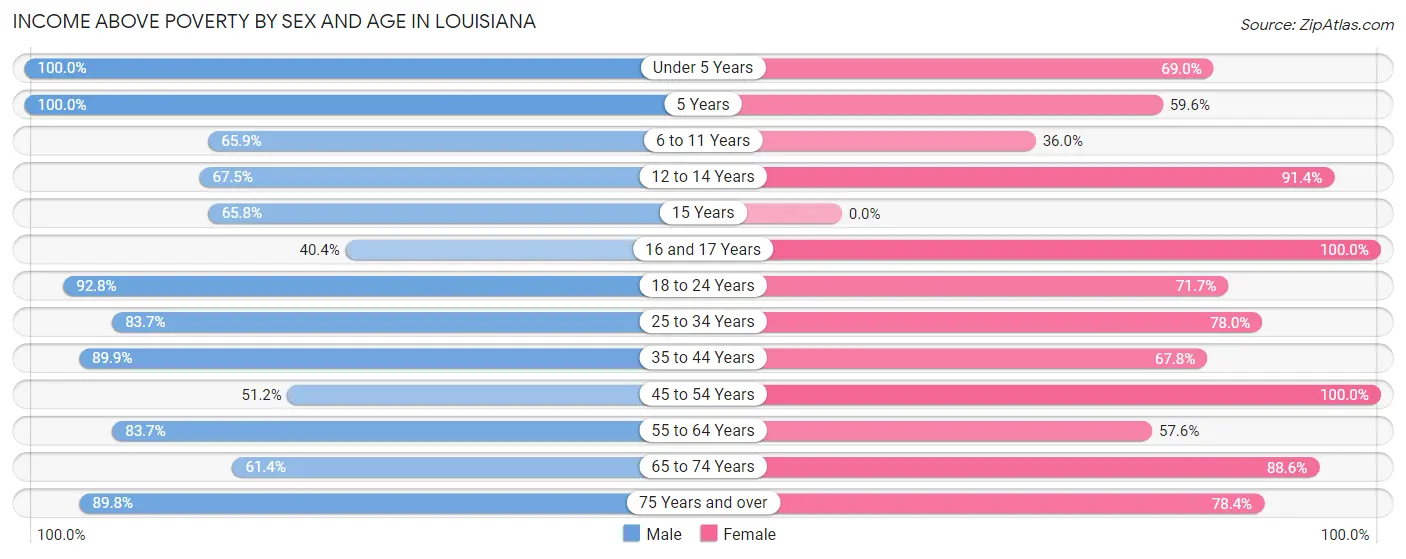
| Age Bracket | Male | Female |
| Under 5 Years | 68 (100.0%) | 69 (69.0%) |
| 5 Years | 22 (100.0%) | 56 (59.6%) |
| 6 to 11 Years | 141 (65.9%) | 18 (36.0%) |
| 12 to 14 Years | 79 (67.5%) | 95 (91.3%) |
| 15 Years | 52 (65.8%) | 0 (0.0%) |
| 16 and 17 Years | 19 (40.4%) | 33 (100.0%) |
| 18 to 24 Years | 155 (92.8%) | 38 (71.7%) |
| 25 to 34 Years | 175 (83.7%) | 135 (78.0%) |
| 35 to 44 Years | 169 (89.9%) | 141 (67.8%) |
| 45 to 54 Years | 108 (51.2%) | 153 (100.0%) |
| 55 to 64 Years | 144 (83.7%) | 167 (57.6%) |
| 65 to 74 Years | 97 (61.4%) | 93 (88.6%) |
| 75 Years and over | 79 (89.8%) | 76 (78.3%) |
| Total | 1,308 (75.2%) | 1,074 (73.6%) |
Income Below Poverty Among Married-Couple Families in Louisiana
The poverty statistics for married-couple families in Louisiana show that 6.0% or 26 of the total 432 families live below the poverty line. Families with 1 or 2 children have the highest poverty rate of 14.7%, comprising of 26 families. On the other hand, families with no children have the lowest poverty rate of 0.0%, which includes 0 families.
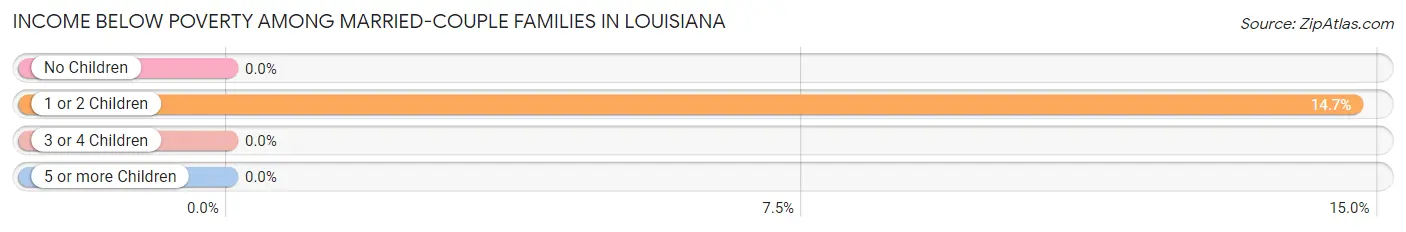
| Children | Above Poverty | Below Poverty |
| No Children | 227 (100.0%) | 0 (0.0%) |
| 1 or 2 Children | 151 (85.3%) | 26 (14.7%) |
| 3 or 4 Children | 28 (100.0%) | 0 (0.0%) |
| 5 or more Children | 0 (0.0%) | 0 (0.0%) |
| Total | 406 (94.0%) | 26 (6.0%) |
Income Below Poverty Among Single-Parent Households in Louisiana
According to the poverty data in Louisiana, 15.5% or 30 single-father households and 52.7% or 96 single-mother households are living below the poverty line. Among single-father households, those with 3 or 4 children have the highest poverty rate, with 30 households (100.0%) experiencing poverty. Likewise, among single-mother households, those with 5 or more children have the highest poverty rate, with 17 households (100.0%) falling below the poverty line.
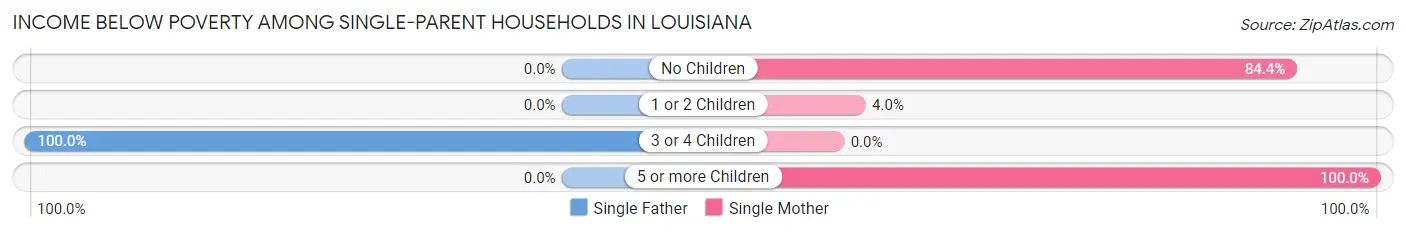
| Children | Single Father | Single Mother |
| No Children | 0 (0.0%) | 76 (84.4%) |
| 1 or 2 Children | 0 (0.0%) | 3 (4.0%) |
| 3 or 4 Children | 30 (100.0%) | 0 (0.0%) |
| 5 or more Children | 0 (0.0%) | 17 (100.0%) |
| Total | 30 (15.5%) | 96 (52.7%) |
Income Below Poverty Among Married-Couple vs Single-Parent Households in Louisiana
The poverty data for Louisiana shows that 26 of the married-couple family households (6.0%) and 126 of the single-parent households (33.6%) are living below the poverty level. Within the married-couple family households, those with 1 or 2 children have the highest poverty rate, with 26 households (14.7%) falling below the poverty line. Among the single-parent households, those with 3 or 4 children have the highest poverty rate, with 30 household (100.0%) living below poverty.
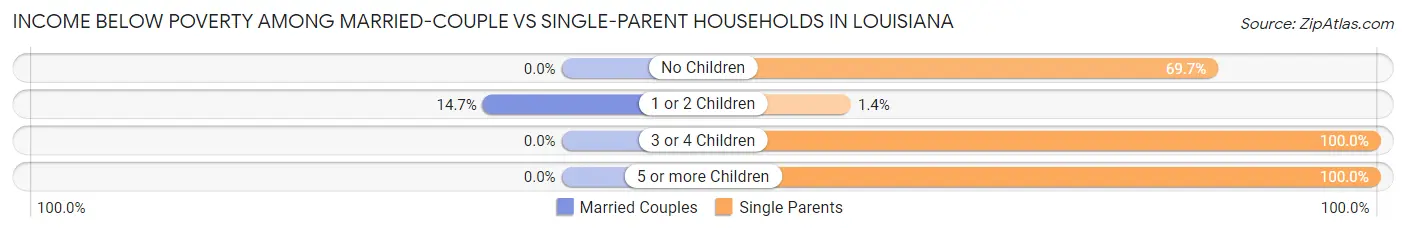
| Children | Married-Couple Families | Single-Parent Households |
| No Children | 0 (0.0%) | 76 (69.7%) |
| 1 or 2 Children | 26 (14.7%) | 3 (1.4%) |
| 3 or 4 Children | 0 (0.0%) | 30 (100.0%) |
| 5 or more Children | 0 (0.0%) | 17 (100.0%) |
| Total | 26 (6.0%) | 126 (33.6%) |
Race in Louisiana
The most populous races in Louisiana are White / Caucasian (2,852 | 87.8%), Hispanic or Latino (210 | 6.5%), and Some other Race (210 | 6.5%).
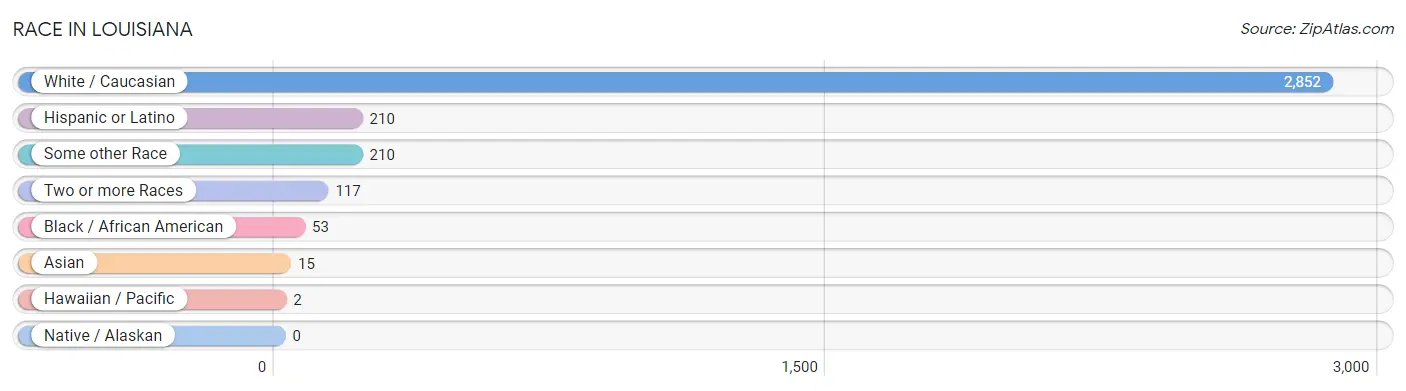
| Race | # Population | % Population |
| Asian | 15 | 0.5% |
| Black / African American | 53 | 1.6% |
| Hawaiian / Pacific | 2 | 0.1% |
| Hispanic or Latino | 210 | 6.5% |
| Native / Alaskan | 0 | 0.0% |
| White / Caucasian | 2,852 | 87.8% |
| Two or more Races | 117 | 3.6% |
| Some other Race | 210 | 6.5% |
| Total | 3,249 | 100.0% |
Ancestry in Louisiana
The most populous ancestries reported in Louisiana are Irish (426 | 13.1%), German (384 | 11.8%), American (341 | 10.5%), Mexican (210 | 6.5%), and Italian (209 | 6.4%), together accounting for 48.3% of all Louisiana residents.
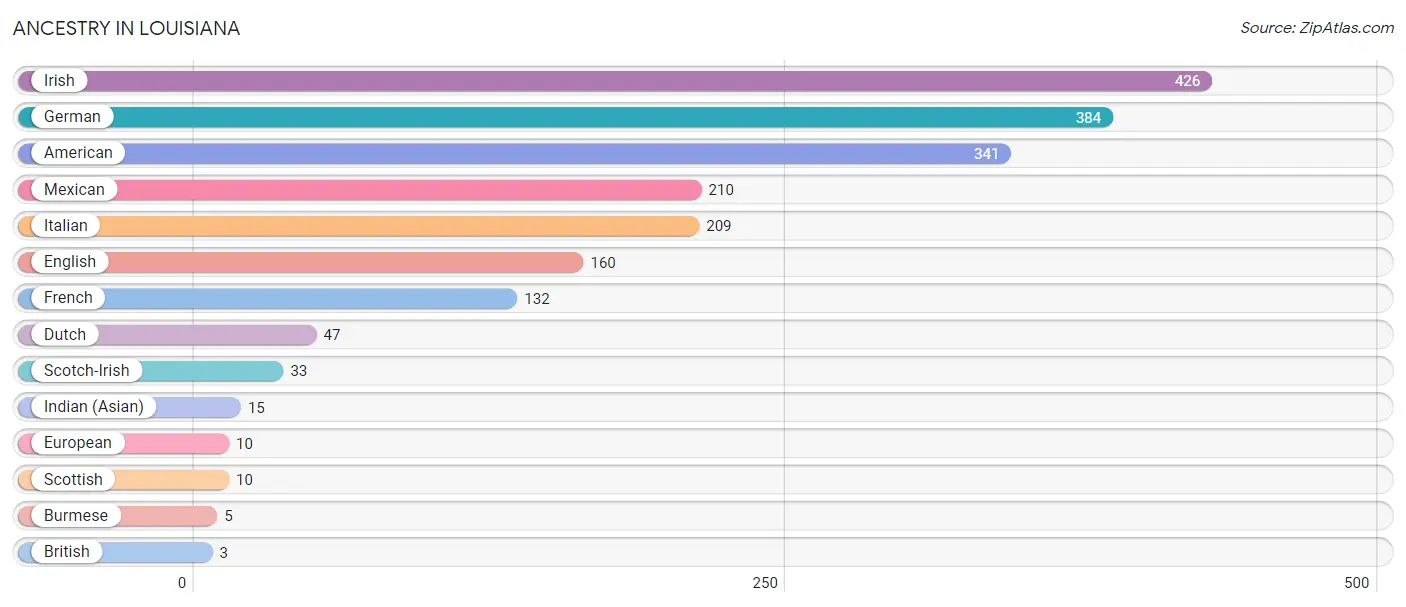
| Ancestry | # Population | % Population |
| American | 341 | 10.5% |
| British | 3 | 0.1% |
| Burmese | 5 | 0.2% |
| Dutch | 47 | 1.5% |
| English | 160 | 4.9% |
| European | 10 | 0.3% |
| French | 132 | 4.1% |
| German | 384 | 11.8% |
| Indian (Asian) | 15 | 0.5% |
| Irish | 426 | 13.1% |
| Italian | 209 | 6.4% |
| Mexican | 210 | 6.5% |
| Scotch-Irish | 33 | 1.0% |
| Scottish | 10 | 0.3% | View All 14 Rows |
Immigrants in Louisiana
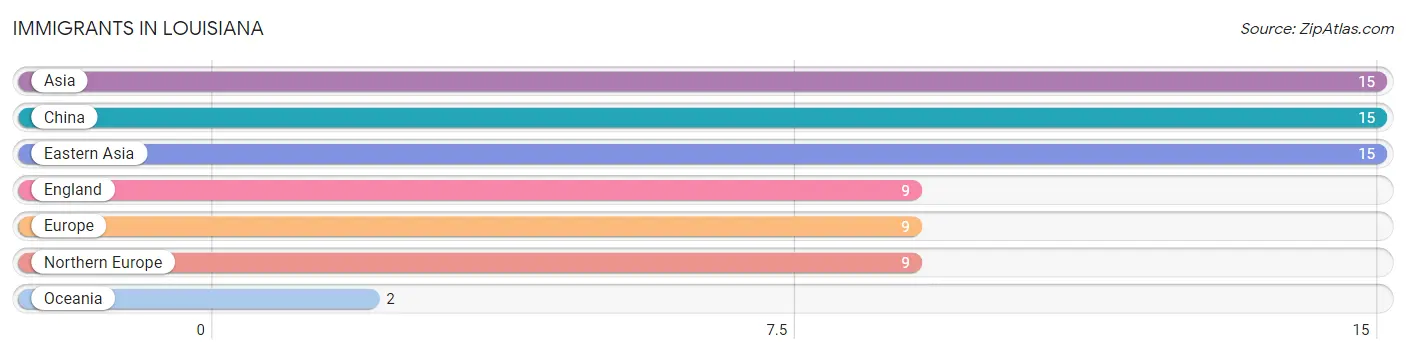
The most numerous immigrant groups reported in Louisiana came from Asia (15 | 0.5%), China (15 | 0.5%), Eastern Asia (15 | 0.5%), England (9 | 0.3%), and Europe (9 | 0.3%), together accounting for 1.9% of all Louisiana residents.
| Immigration Origin | # Population | % Population |
| Asia | 15 | 0.5% |
| China | 15 | 0.5% |
| Eastern Asia | 15 | 0.5% |
| England | 9 | 0.3% |
| Europe | 9 | 0.3% |
| Northern Europe | 9 | 0.3% |
| Oceania | 2 | 0.1% | View All 7 Rows |
Sex and Age in Louisiana
Sex and Age in Louisiana
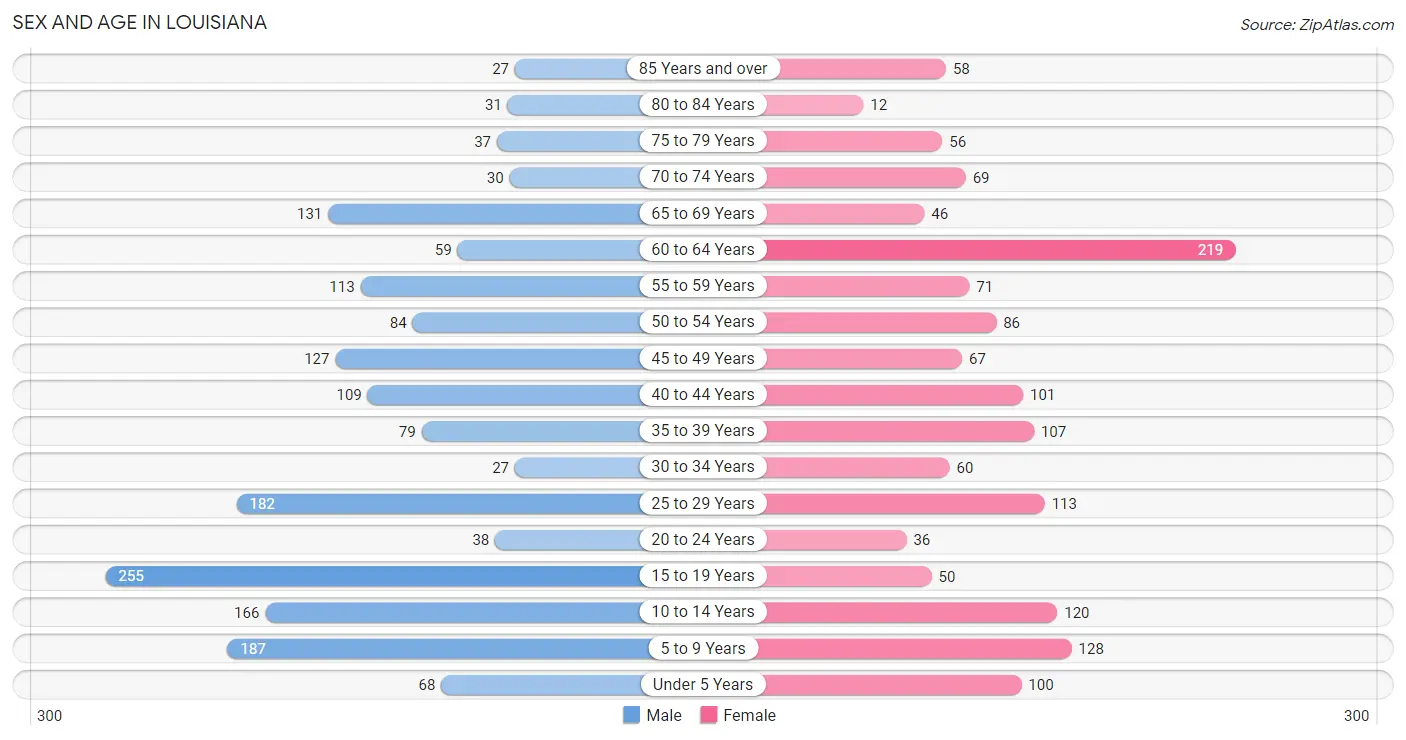
The most populous age groups in Louisiana are 15 to 19 Years (255 | 14.6%) for men and 60 to 64 Years (219 | 14.6%) for women.
| Age Bracket | Male | Female |
| Under 5 Years | 68 (3.9%) | 100 (6.7%) |
| 5 to 9 Years | 187 (10.7%) | 128 (8.5%) |
| 10 to 14 Years | 166 (9.5%) | 120 (8.0%) |
| 15 to 19 Years | 255 (14.6%) | 50 (3.3%) |
| 20 to 24 Years | 38 (2.2%) | 36 (2.4%) |
| 25 to 29 Years | 182 (10.4%) | 113 (7.5%) |
| 30 to 34 Years | 27 (1.5%) | 60 (4.0%) |
| 35 to 39 Years | 79 (4.5%) | 107 (7.1%) |
| 40 to 44 Years | 109 (6.2%) | 101 (6.7%) |
| 45 to 49 Years | 127 (7.3%) | 67 (4.5%) |
| 50 to 54 Years | 84 (4.8%) | 86 (5.7%) |
| 55 to 59 Years | 113 (6.5%) | 71 (4.7%) |
| 60 to 64 Years | 59 (3.4%) | 219 (14.6%) |
| 65 to 69 Years | 131 (7.5%) | 46 (3.1%) |
| 70 to 74 Years | 30 (1.7%) | 69 (4.6%) |
| 75 to 79 Years | 37 (2.1%) | 56 (3.7%) |
| 80 to 84 Years | 31 (1.8%) | 12 (0.8%) |
| 85 Years and over | 27 (1.5%) | 58 (3.9%) |
| Total | 1,750 (100.0%) | 1,499 (100.0%) |
Families and Households in Louisiana
Median Family Size in Louisiana
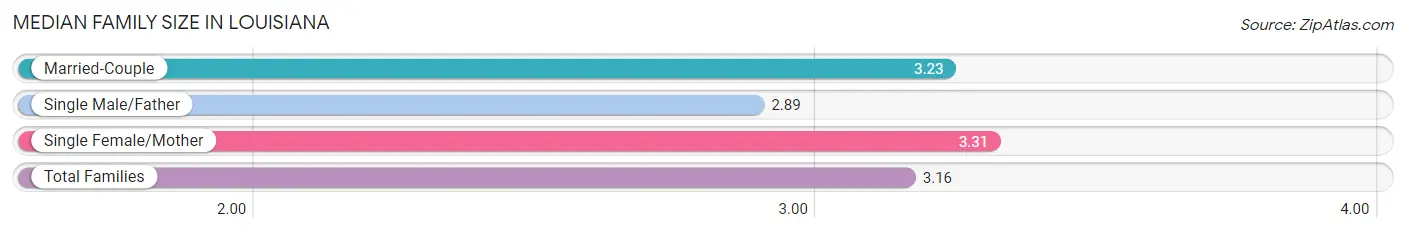
The median family size in Louisiana is 3.16 persons per family, with single female/mother families (182 | 22.6%) accounting for the largest median family size of 3.31 persons per family. On the other hand, single male/father families (193 | 23.9%) represent the smallest median family size with 2.89 persons per family.
| Family Type | # Families | Family Size |
| Married-Couple | 432 (53.5%) | 3.23 |
| Single Male/Father | 193 (23.9%) | 2.89 |
| Single Female/Mother | 182 (22.6%) | 3.31 |
| Total Families | 807 (100.0%) | 3.16 |
Median Household Size in Louisiana
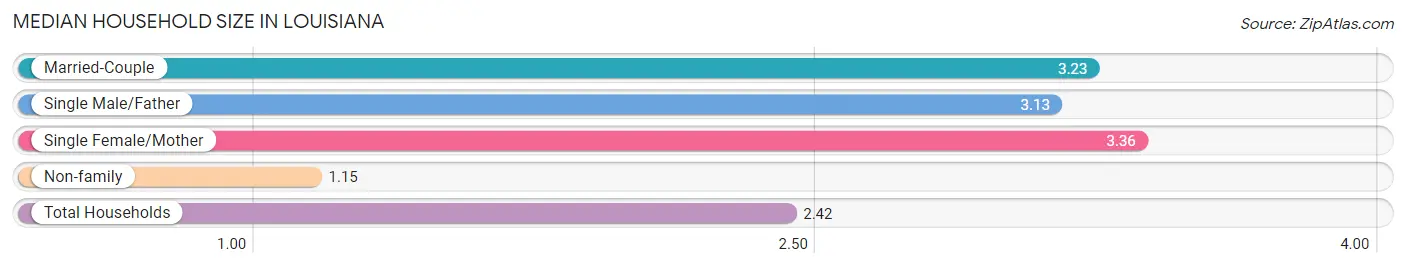
The median household size in Louisiana is 2.42 persons per household, with single female/mother households (182 | 13.8%) accounting for the largest median household size of 3.36 persons per household. non-family households (516 | 39.0%) represent the smallest median household size with 1.15 persons per household.
| Household Type | # Households | Household Size |
| Married-Couple | 432 (32.7%) | 3.23 |
| Single Male/Father | 193 (14.6%) | 3.13 |
| Single Female/Mother | 182 (13.8%) | 3.36 |
| Non-family | 516 (39.0%) | 1.15 |
| Total Households | 1,323 (100.0%) | 2.42 |
Household Size by Marriage Status in Louisiana
Out of a total of 1,323 households in Louisiana, 807 (61.0%) are family households, while 516 (39.0%) are nonfamily households. The most numerous type of family households are 2-person households, comprising 460, and the most common type of nonfamily households are 1-person households, comprising 432.
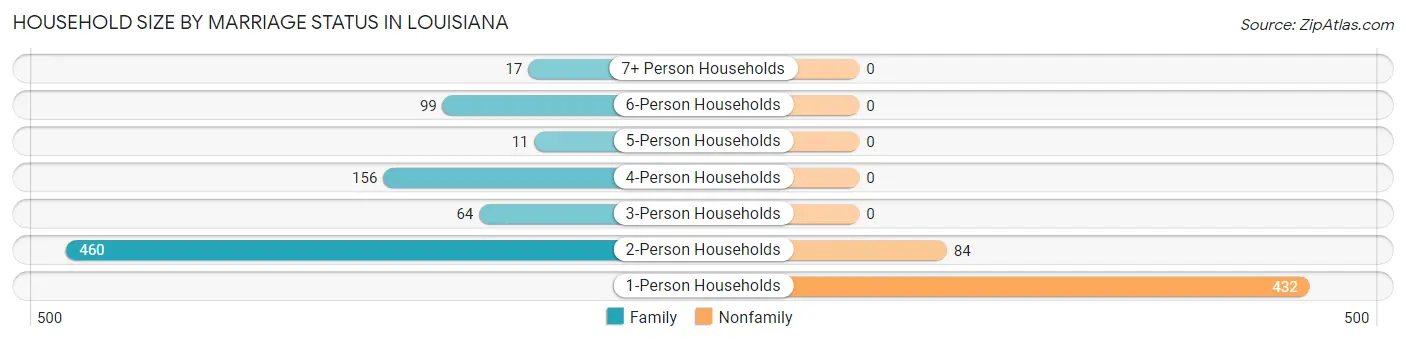
| Household Size | Family Households | Nonfamily Households |
| 1-Person Households | - | 432 (32.7%) |
| 2-Person Households | 460 (34.8%) | 84 (6.4%) |
| 3-Person Households | 64 (4.8%) | 0 (0.0%) |
| 4-Person Households | 156 (11.8%) | 0 (0.0%) |
| 5-Person Households | 11 (0.8%) | 0 (0.0%) |
| 6-Person Households | 99 (7.5%) | 0 (0.0%) |
| 7+ Person Households | 17 (1.3%) | 0 (0.0%) |
| Total | 807 (61.0%) | 516 (39.0%) |
Female Fertility in Louisiana
Fertility by Age in Louisiana
Average fertility rate in Louisiana is 155.0 births per 1,000 women. Women in the age bracket of 20 to 34 years have the highest fertility rate with 258.0 births per 1,000 women. Women in the age bracket of 20 to 34 years acount for 63.5% of all women with births.
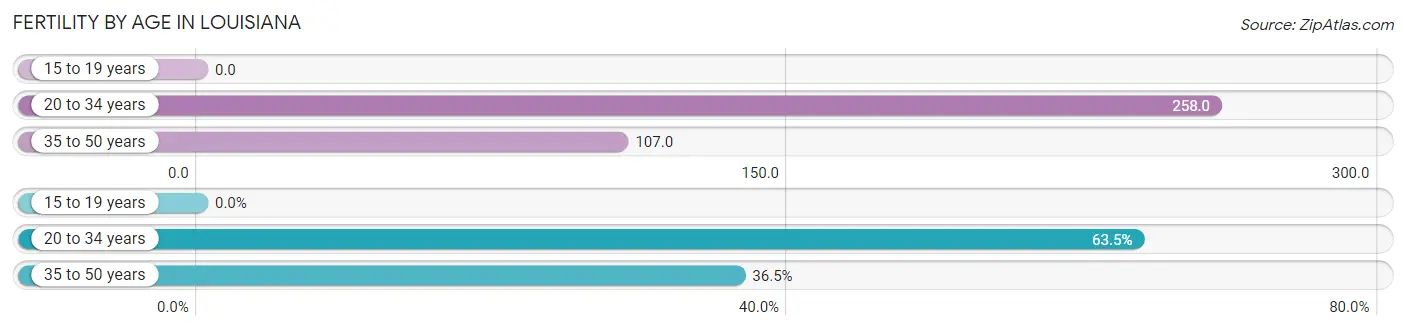
| Age Bracket | Women with Births | Births / 1,000 Women |
| 15 to 19 years | 0 (0.0%) | 0.0 |
| 20 to 34 years | 54 (63.5%) | 258.0 |
| 35 to 50 years | 31 (36.5%) | 107.0 |
| Total | 85 (100.0%) | 155.0 |
Fertility by Age by Marriage Status in Louisiana
63.5% of women with births (85) in Louisiana are married. The highest percentage of unmarried women with births falls into 35 to 50 years age bracket with 100.0% of them unmarried at the time of birth, while the lowest percentage of unmarried women with births belong to 20 to 34 years age bracket with 0.0% of them unmarried.
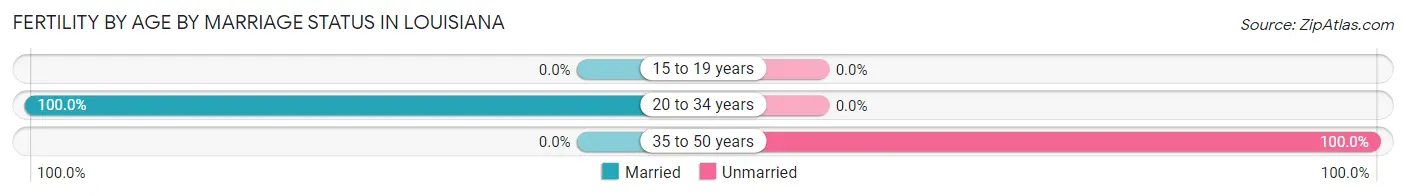
| Age Bracket | Married | Unmarried |
| 15 to 19 years | 0 (0.0%) | 0 (0.0%) |
| 20 to 34 years | 54 (100.0%) | 0 (0.0%) |
| 35 to 50 years | 0 (0.0%) | 31 (100.0%) |
| Total | 54 (63.5%) | 31 (36.5%) |
Fertility by Education in Louisiana
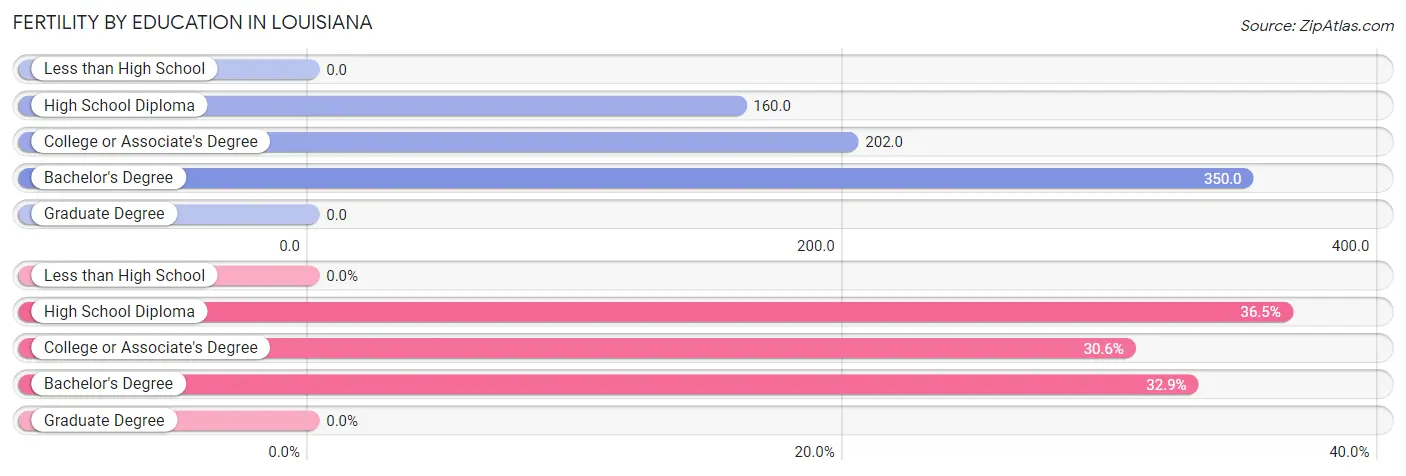
| Educational Attainment | Women with Births | Births / 1,000 Women |
| Less than High School | 0 (0.0%) | 0.0 |
| High School Diploma | 31 (36.5%) | 160.0 |
| College or Associate's Degree | 26 (30.6%) | 202.0 |
| Bachelor's Degree | 28 (32.9%) | 350.0 |
| Graduate Degree | 0 (0.0%) | 0.0 |
| Total | 85 (100.0%) | 155.0 |
Fertility by Education by Marriage Status in Louisiana
36.5% of women with births in Louisiana are unmarried. Women with the educational attainment of college or associate's degree are most likely to be married with 100.0% of them married at childbirth, while women with the educational attainment of high school diploma are least likely to be married with 100.0% of them unmarried at childbirth.
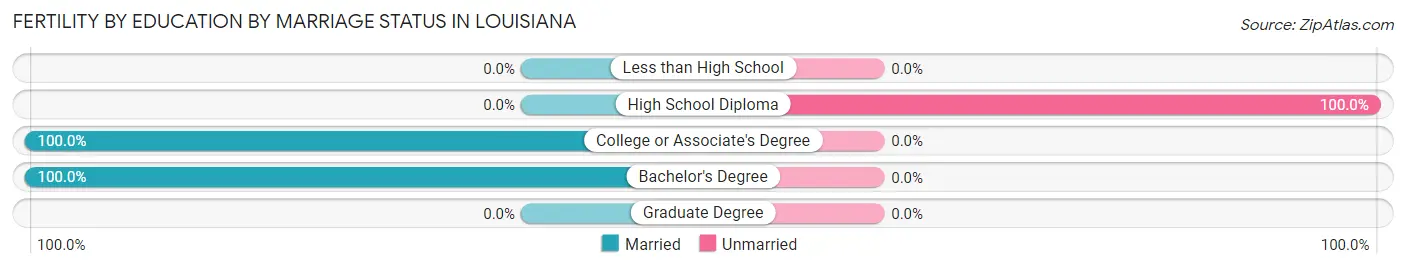
| Educational Attainment | Married | Unmarried |
| Less than High School | 0 (0.0%) | 0 (0.0%) |
| High School Diploma | 0 (0.0%) | 31 (100.0%) |
| College or Associate's Degree | 26 (100.0%) | 0 (0.0%) |
| Bachelor's Degree | 28 (100.0%) | 0 (0.0%) |
| Graduate Degree | 0 (0.0%) | 0 (0.0%) |
| Total | 54 (63.5%) | 31 (36.5%) |
Employment Characteristics in Louisiana
Employment by Class of Employer in Louisiana
Among the 1,239 employed individuals in Louisiana, private company employees (838 | 67.6%), not-for-profit organizations (152 | 12.3%), and local government employees (103 | 8.3%) make up the most common classes of employment.
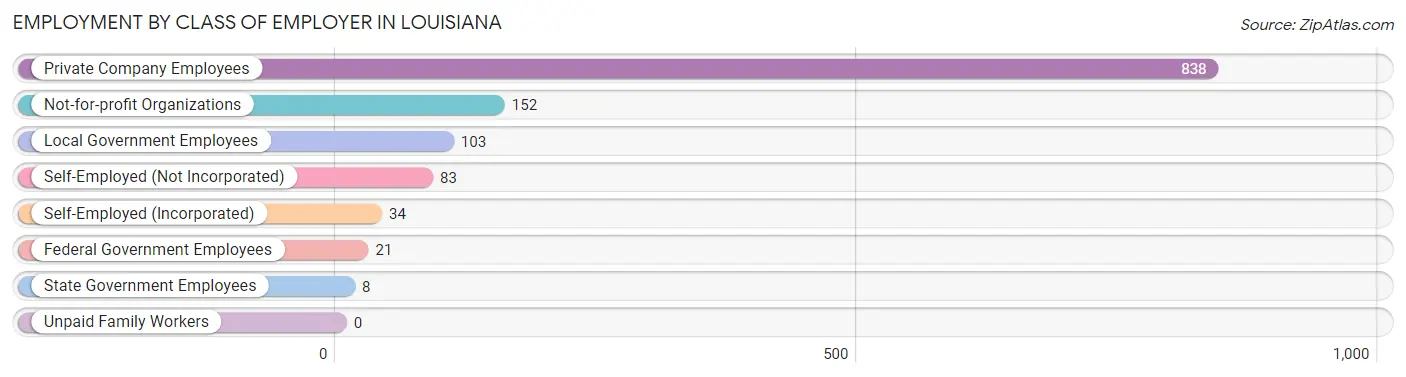
| Employer Class | # Employees | % Employees |
| Private Company Employees | 838 | 67.6% |
| Self-Employed (Incorporated) | 34 | 2.7% |
| Self-Employed (Not Incorporated) | 83 | 6.7% |
| Not-for-profit Organizations | 152 | 12.3% |
| Local Government Employees | 103 | 8.3% |
| State Government Employees | 8 | 0.6% |
| Federal Government Employees | 21 | 1.7% |
| Unpaid Family Workers | 0 | 0.0% |
| Total | 1,239 | 100.0% |
Employment Status by Age in Louisiana
According to the labor force statistics for Louisiana, out of the total population over 16 years of age (2,401), 55.1% or 1,323 individuals are in the labor force, with 6.2% or 82 of them unemployed. The age group with the highest labor force participation rate is 20 to 24 years, with 100.0% or 74 individuals in the labor force. Within the labor force, the 45 to 54 years age range has the highest percentage of unemployed individuals, with 20.3% or 48 of them being unemployed.
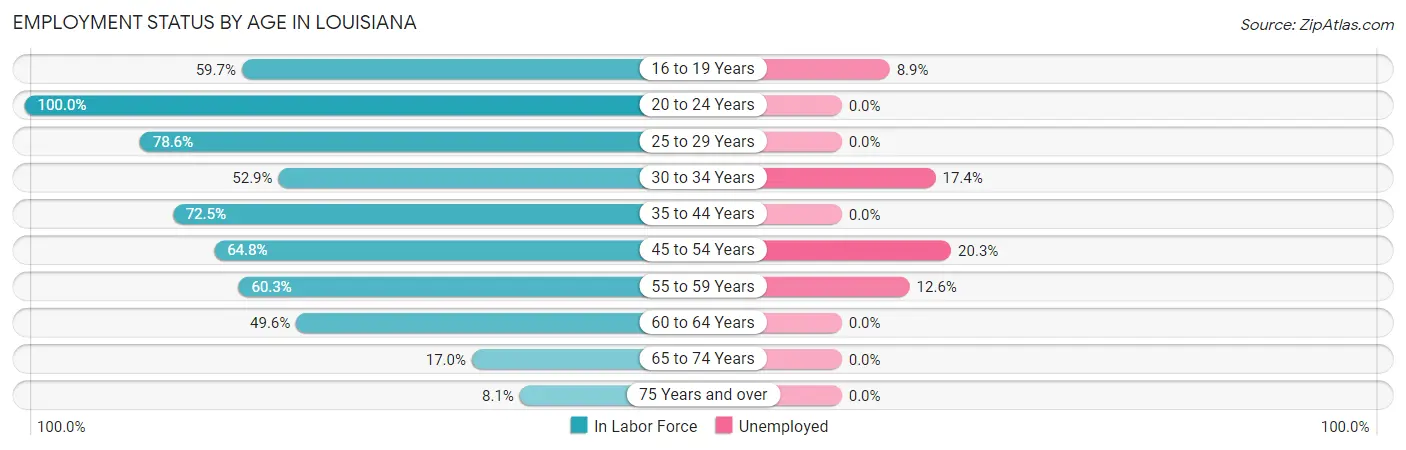
| Age Bracket | In Labor Force | Unemployed |
| 16 to 19 Years | 135 (59.7%) | 12 (8.9%) |
| 20 to 24 Years | 74 (100.0%) | 0 (0.0%) |
| 25 to 29 Years | 232 (78.6%) | 0 (0.0%) |
| 30 to 34 Years | 46 (52.9%) | 8 (17.4%) |
| 35 to 44 Years | 287 (72.5%) | 0 (0.0%) |
| 45 to 54 Years | 236 (64.8%) | 48 (20.3%) |
| 55 to 59 Years | 111 (60.3%) | 14 (12.6%) |
| 60 to 64 Years | 138 (49.6%) | 0 (0.0%) |
| 65 to 74 Years | 47 (17.0%) | 0 (0.0%) |
| 75 Years and over | 18 (8.1%) | 0 (0.0%) |
| Total | 1,323 (55.1%) | 82 (6.2%) |
Employment Status by Educational Attainment in Louisiana
According to labor force statistics for Louisiana, 65.5% of individuals (1,051) out of the total population between 25 and 64 years of age (1,604) are in the labor force, with 6.7% or 70 of them being unemployed. The group with the highest labor force participation rate are those with the educational attainment of bachelor's degree or higher, with 84.4% or 152 individuals in the labor force. Within the labor force, individuals with high school diploma education have the highest percentage of unemployment, with 12.1% or 70 of them being unemployed.
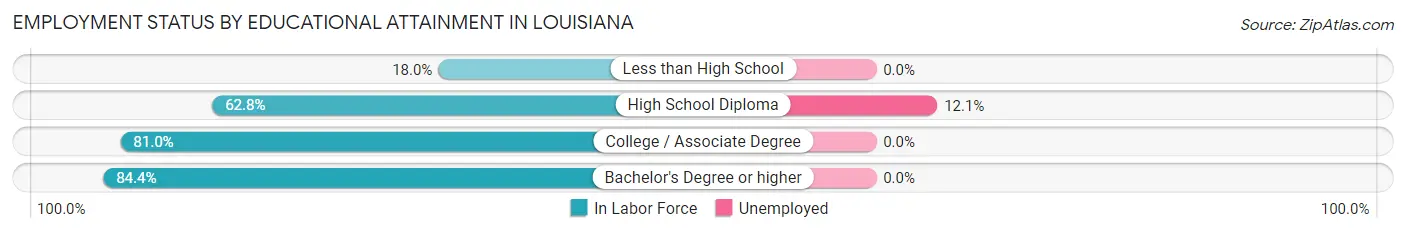
| Educational Attainment | In Labor Force | Unemployed |
| Less than High School | 25 (18.0%) | 0 (0.0%) |
| High School Diploma | 578 (62.8%) | 111 (12.1%) |
| College / Associate Degree | 295 (81.0%) | 0 (0.0%) |
| Bachelor's Degree or higher | 152 (84.4%) | 0 (0.0%) |
| Total | 1,051 (65.5%) | 107 (6.7%) |
Employment Occupations by Sex in Louisiana
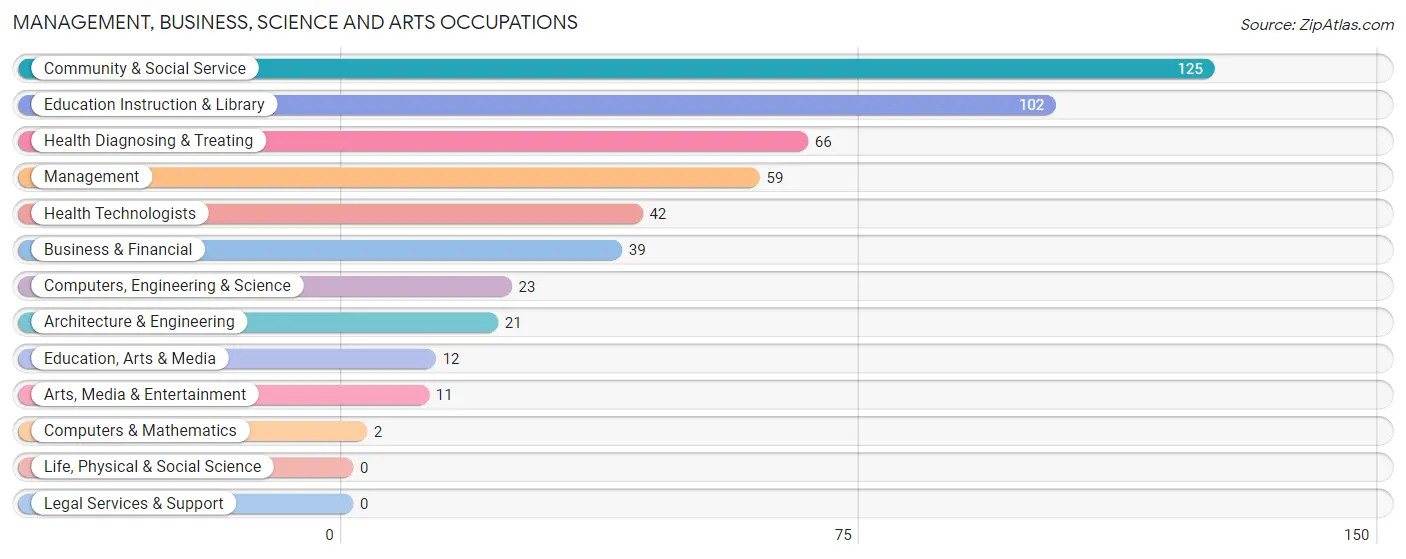
Management, Business, Science and Arts Occupations
The most common Management, Business, Science and Arts occupations in Louisiana are Community & Social Service (125 | 10.1%), Education Instruction & Library (102 | 8.2%), Health Diagnosing & Treating (66 | 5.3%), Management (59 | 4.8%), and Health Technologists (42 | 3.4%).
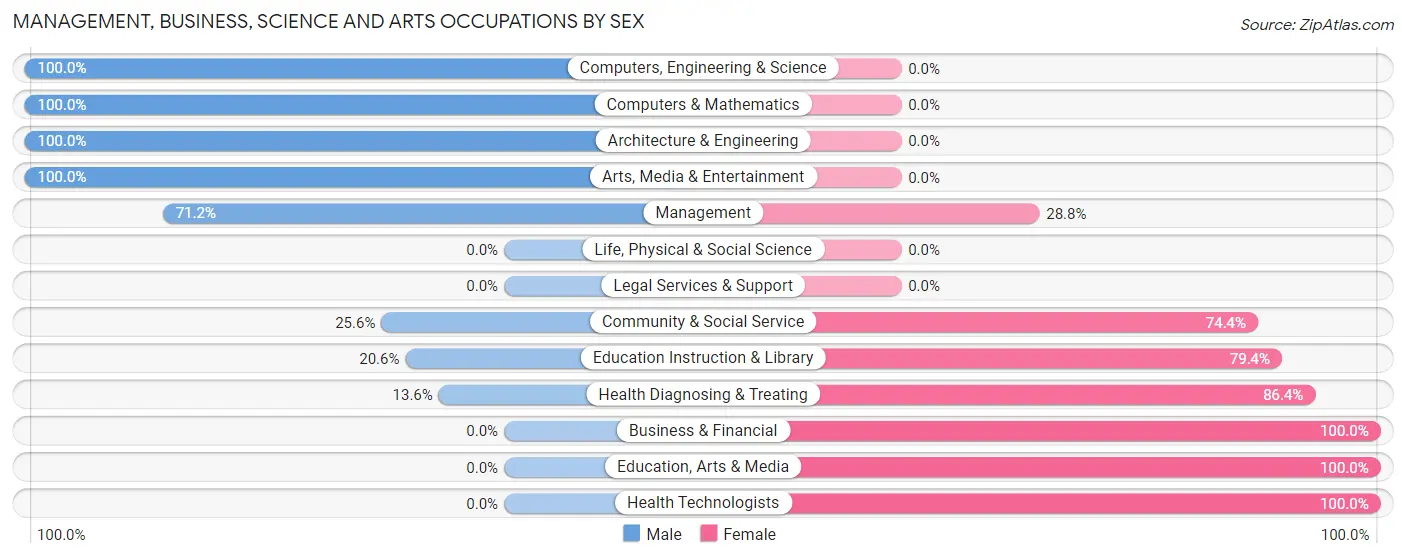
Management, Business, Science and Arts Occupations by Sex
Within the Management, Business, Science and Arts occupations in Louisiana, the most male-oriented occupations are Computers, Engineering & Science (100.0%), Computers & Mathematics (100.0%), and Architecture & Engineering (100.0%), while the most female-oriented occupations are Business & Financial (100.0%), Education, Arts & Media (100.0%), and Health Technologists (100.0%).
| Occupation | Male | Female |
| Management | 42 (71.2%) | 17 (28.8%) |
| Business & Financial | 0 (0.0%) | 39 (100.0%) |
| Computers, Engineering & Science | 23 (100.0%) | 0 (0.0%) |
| Computers & Mathematics | 2 (100.0%) | 0 (0.0%) |
| Architecture & Engineering | 21 (100.0%) | 0 (0.0%) |
| Life, Physical & Social Science | 0 (0.0%) | 0 (0.0%) |
| Community & Social Service | 32 (25.6%) | 93 (74.4%) |
| Education, Arts & Media | 0 (0.0%) | 12 (100.0%) |
| Legal Services & Support | 0 (0.0%) | 0 (0.0%) |
| Education Instruction & Library | 21 (20.6%) | 81 (79.4%) |
| Arts, Media & Entertainment | 11 (100.0%) | 0 (0.0%) |
| Health Diagnosing & Treating | 9 (13.6%) | 57 (86.4%) |
| Health Technologists | 0 (0.0%) | 42 (100.0%) |
| Total (Category) | 106 (34.0%) | 206 (66.0%) |
| Total (Overall) | 717 (57.7%) | 525 (42.3%) |
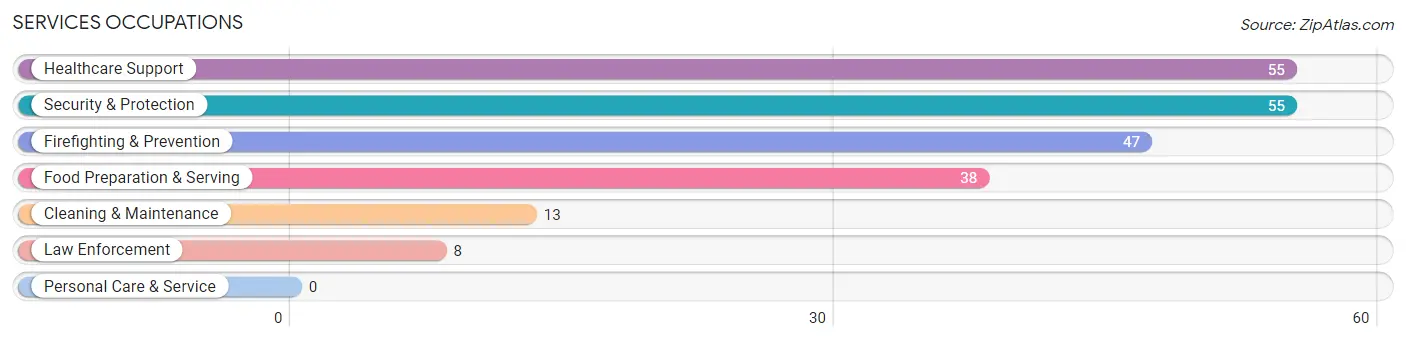
Services Occupations
The most common Services occupations in Louisiana are Healthcare Support (55 | 4.4%), Security & Protection (55 | 4.4%), Firefighting & Prevention (47 | 3.8%), Food Preparation & Serving (38 | 3.1%), and Cleaning & Maintenance (13 | 1.1%).
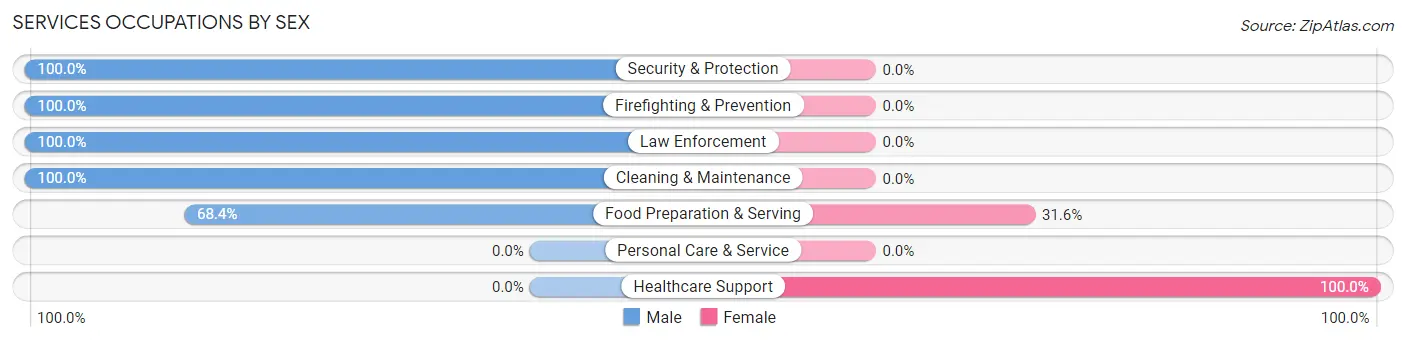
Services Occupations by Sex
Within the Services occupations in Louisiana, the most male-oriented occupations are Security & Protection (100.0%), Firefighting & Prevention (100.0%), and Law Enforcement (100.0%), while the most female-oriented occupations are Healthcare Support (100.0%), and Food Preparation & Serving (31.6%).
| Occupation | Male | Female |
| Healthcare Support | 0 (0.0%) | 55 (100.0%) |
| Security & Protection | 55 (100.0%) | 0 (0.0%) |
| Firefighting & Prevention | 47 (100.0%) | 0 (0.0%) |
| Law Enforcement | 8 (100.0%) | 0 (0.0%) |
| Food Preparation & Serving | 26 (68.4%) | 12 (31.6%) |
| Cleaning & Maintenance | 13 (100.0%) | 0 (0.0%) |
| Personal Care & Service | 0 (0.0%) | 0 (0.0%) |
| Total (Category) | 94 (58.4%) | 67 (41.6%) |
| Total (Overall) | 717 (57.7%) | 525 (42.3%) |
Sales and Office Occupations
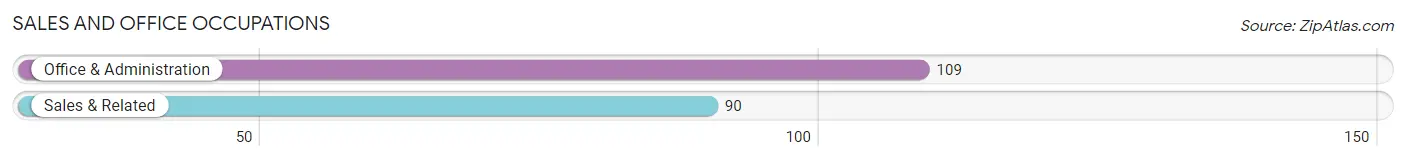
The most common Sales and Office occupations in Louisiana are Office & Administration (109 | 8.8%), and Sales & Related (90 | 7.2%).
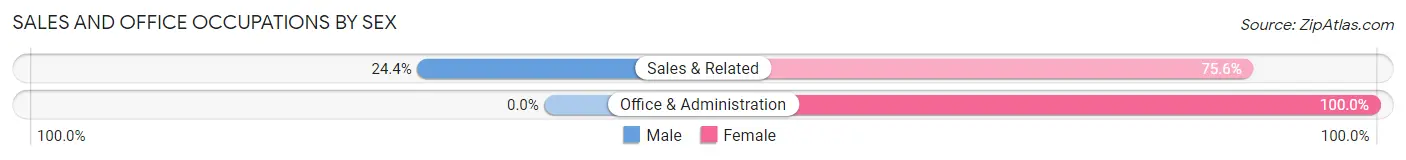
Sales and Office Occupations by Sex
| Occupation | Male | Female |
| Sales & Related | 22 (24.4%) | 68 (75.6%) |
| Office & Administration | 0 (0.0%) | 109 (100.0%) |
| Total (Category) | 22 (11.1%) | 177 (88.9%) |
| Total (Overall) | 717 (57.7%) | 525 (42.3%) |
Natural Resources, Construction and Maintenance Occupations
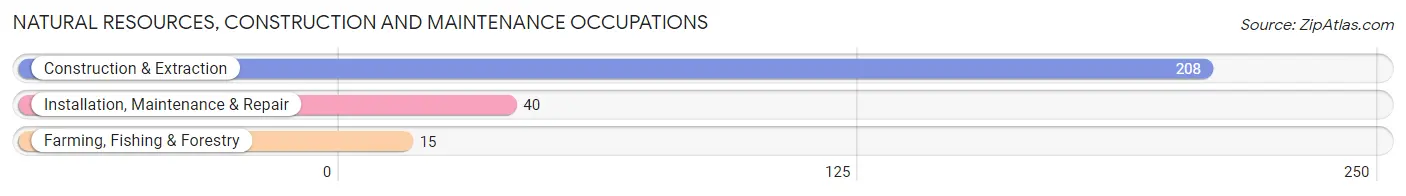
The most common Natural Resources, Construction and Maintenance occupations in Louisiana are Construction & Extraction (208 | 16.8%), Installation, Maintenance & Repair (40 | 3.2%), and Farming, Fishing & Forestry (15 | 1.2%).
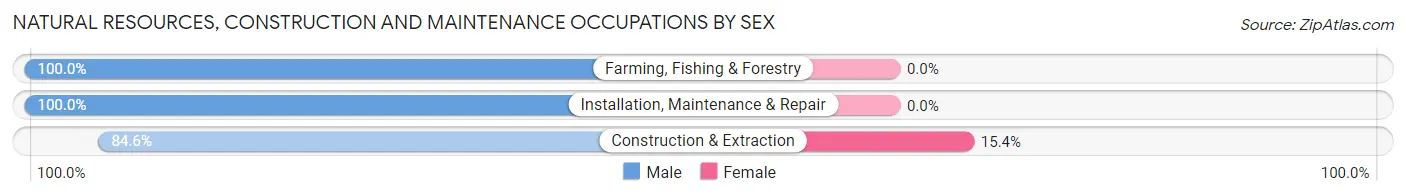
Natural Resources, Construction and Maintenance Occupations by Sex
| Occupation | Male | Female |
| Farming, Fishing & Forestry | 15 (100.0%) | 0 (0.0%) |
| Construction & Extraction | 176 (84.6%) | 32 (15.4%) |
| Installation, Maintenance & Repair | 40 (100.0%) | 0 (0.0%) |
| Total (Category) | 231 (87.8%) | 32 (12.2%) |
| Total (Overall) | 717 (57.7%) | 525 (42.3%) |
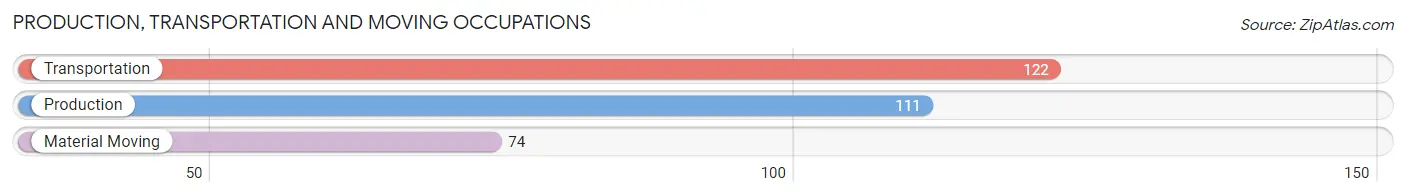
Production, Transportation and Moving Occupations
The most common Production, Transportation and Moving occupations in Louisiana are Transportation (122 | 9.8%), Production (111 | 8.9%), and Material Moving (74 | 6.0%).
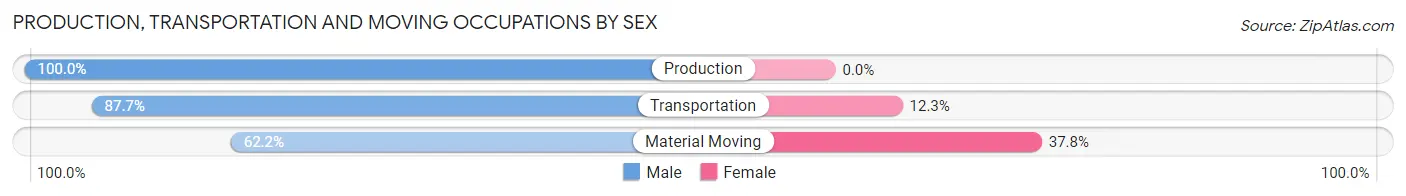
Production, Transportation and Moving Occupations by Sex
| Occupation | Male | Female |
| Production | 111 (100.0%) | 0 (0.0%) |
| Transportation | 107 (87.7%) | 15 (12.3%) |
| Material Moving | 46 (62.2%) | 28 (37.8%) |
| Total (Category) | 264 (86.0%) | 43 (14.0%) |
| Total (Overall) | 717 (57.7%) | 525 (42.3%) |
Employment Industries by Sex in Louisiana
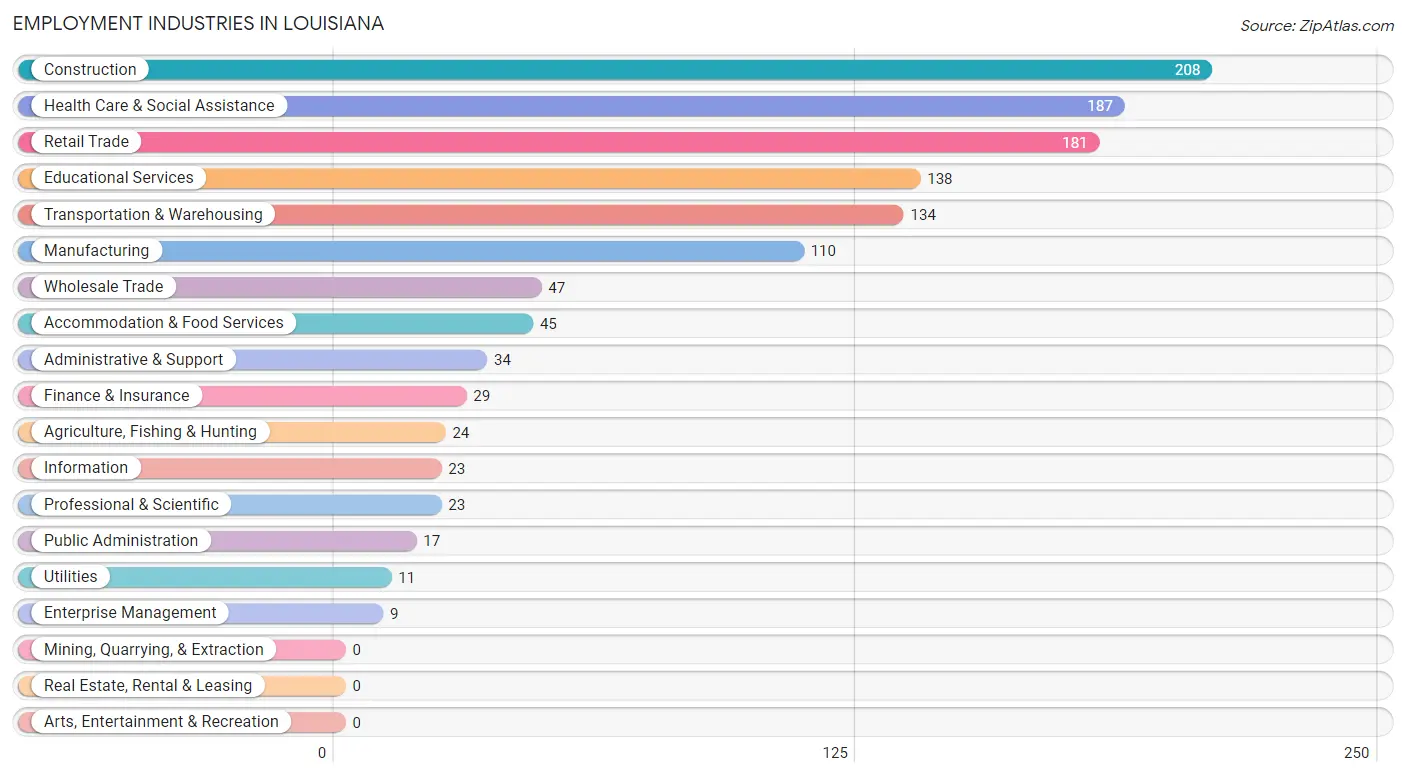
Employment Industries in Louisiana
The major employment industries in Louisiana include Construction (208 | 16.8%), Health Care & Social Assistance (187 | 15.1%), Retail Trade (181 | 14.6%), Educational Services (138 | 11.1%), and Transportation & Warehousing (134 | 10.8%).
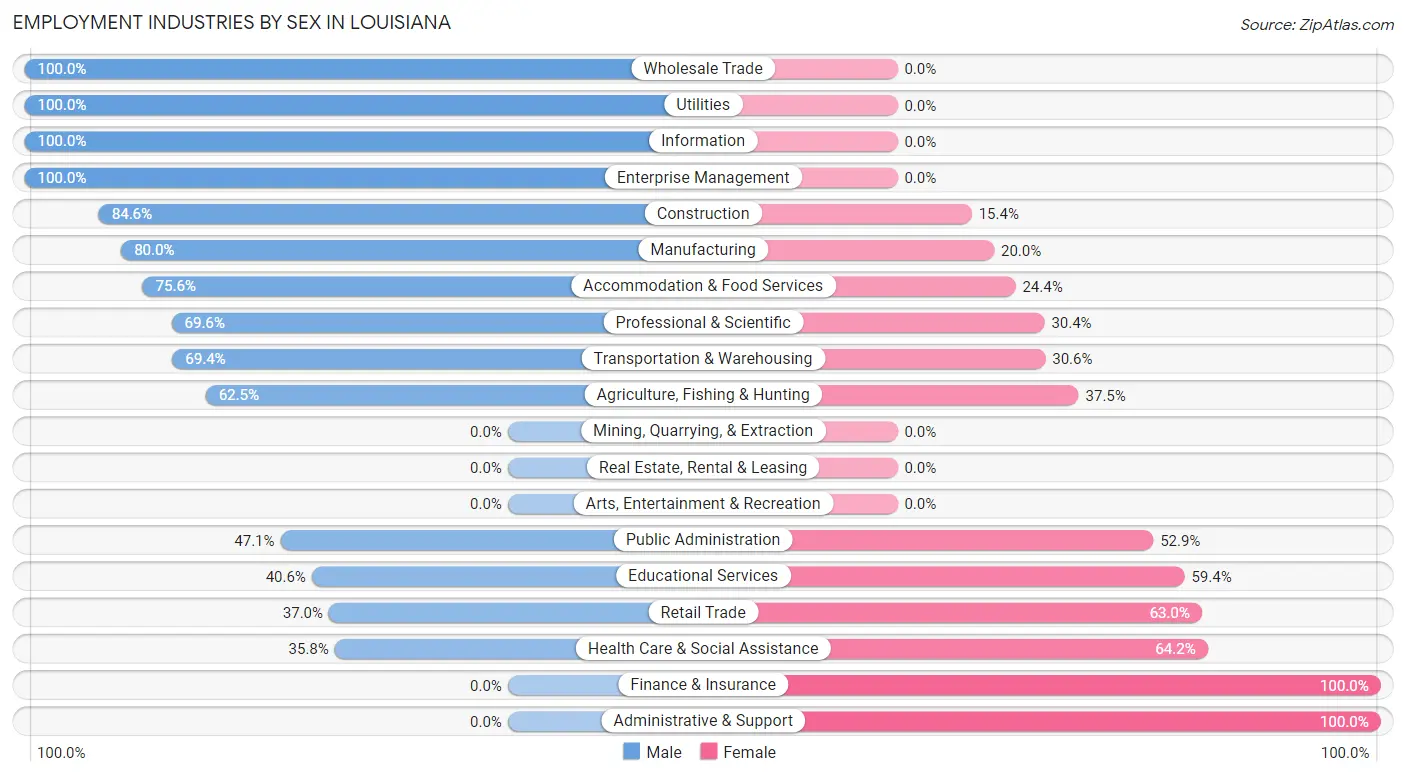
Employment Industries by Sex in Louisiana
The Louisiana industries that see more men than women are Wholesale Trade (100.0%), Utilities (100.0%), and Information (100.0%), whereas the industries that tend to have a higher number of women are Finance & Insurance (100.0%), Administrative & Support (100.0%), and Health Care & Social Assistance (64.2%).
| Industry | Male | Female |
| Agriculture, Fishing & Hunting | 15 (62.5%) | 9 (37.5%) |
| Mining, Quarrying, & Extraction | 0 (0.0%) | 0 (0.0%) |
| Construction | 176 (84.6%) | 32 (15.4%) |
| Manufacturing | 88 (80.0%) | 22 (20.0%) |
| Wholesale Trade | 47 (100.0%) | 0 (0.0%) |
| Retail Trade | 67 (37.0%) | 114 (63.0%) |
| Transportation & Warehousing | 93 (69.4%) | 41 (30.6%) |
| Utilities | 11 (100.0%) | 0 (0.0%) |
| Information | 23 (100.0%) | 0 (0.0%) |
| Finance & Insurance | 0 (0.0%) | 29 (100.0%) |
| Real Estate, Rental & Leasing | 0 (0.0%) | 0 (0.0%) |
| Professional & Scientific | 16 (69.6%) | 7 (30.4%) |
| Enterprise Management | 9 (100.0%) | 0 (0.0%) |
| Administrative & Support | 0 (0.0%) | 34 (100.0%) |
| Educational Services | 56 (40.6%) | 82 (59.4%) |
| Health Care & Social Assistance | 67 (35.8%) | 120 (64.2%) |
| Arts, Entertainment & Recreation | 0 (0.0%) | 0 (0.0%) |
| Accommodation & Food Services | 34 (75.6%) | 11 (24.4%) |
| Public Administration | 8 (47.1%) | 9 (52.9%) |
| Total | 717 (57.7%) | 525 (42.3%) |
Education in Louisiana
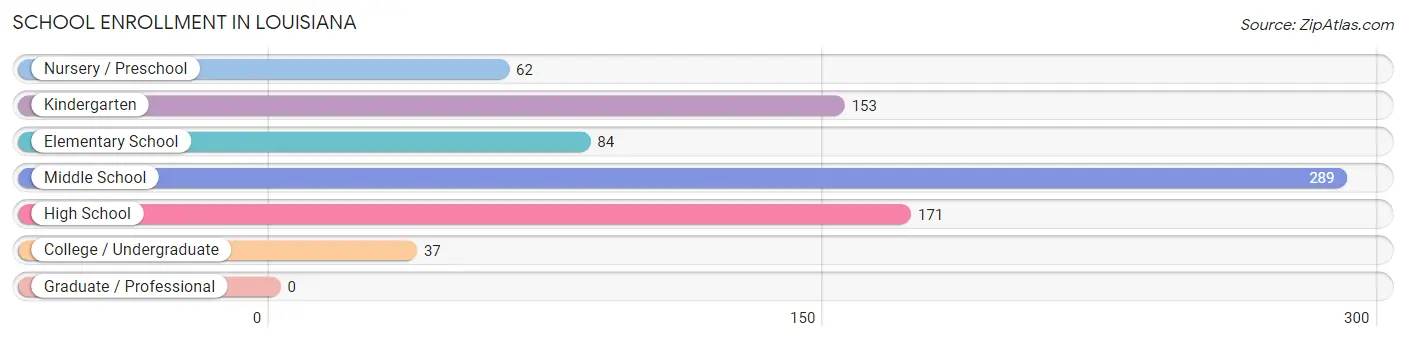
School Enrollment in Louisiana
The most common levels of schooling among the 796 students in Louisiana are middle school (289 | 36.3%), high school (171 | 21.5%), and kindergarten (153 | 19.2%).
| School Level | # Students | % Students |
| Nursery / Preschool | 62 | 7.8% |
| Kindergarten | 153 | 19.2% |
| Elementary School | 84 | 10.5% |
| Middle School | 289 | 36.3% |
| High School | 171 | 21.5% |
| College / Undergraduate | 37 | 4.6% |
| Graduate / Professional | 0 | 0.0% |
| Total | 796 | 100.0% |
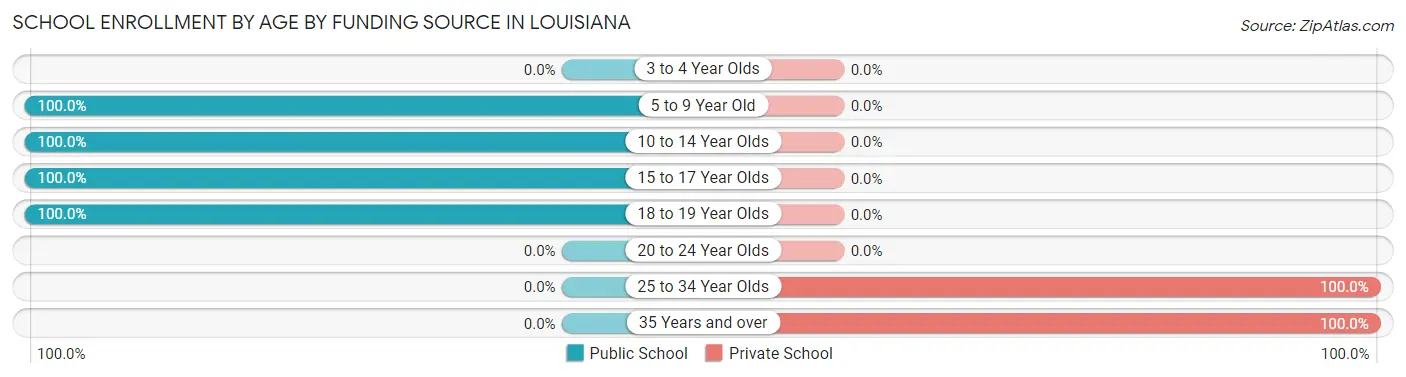
School Enrollment by Age by Funding Source in Louisiana
Out of a total of 796 students who are enrolled in schools in Louisiana, 32 (4.0%) attend a private institution, while the remaining 764 (96.0%) are enrolled in public schools. The age group of 25 to 34 year olds has the highest likelihood of being enrolled in private schools, with 26 (100.0% in the age bracket) enrolled. Conversely, the age group of 5 to 9 year old has the lowest likelihood of being enrolled in a private school, with 299 (100.0% in the age bracket) attending a public institution.
| Age Bracket | Public School | Private School |
| 3 to 4 Year Olds | 0 (0.0%) | 0 (0.0%) |
| 5 to 9 Year Old | 299 (100.0%) | 0 (0.0%) |
| 10 to 14 Year Olds | 286 (100.0%) | 0 (0.0%) |
| 15 to 17 Year Olds | 159 (100.0%) | 0 (0.0%) |
| 18 to 19 Year Olds | 20 (100.0%) | 0 (0.0%) |
| 20 to 24 Year Olds | 0 (0.0%) | 0 (0.0%) |
| 25 to 34 Year Olds | 0 (0.0%) | 26 (100.0%) |
| 35 Years and over | 0 (0.0%) | 6 (100.0%) |
| Total | 764 (96.0%) | 32 (4.0%) |
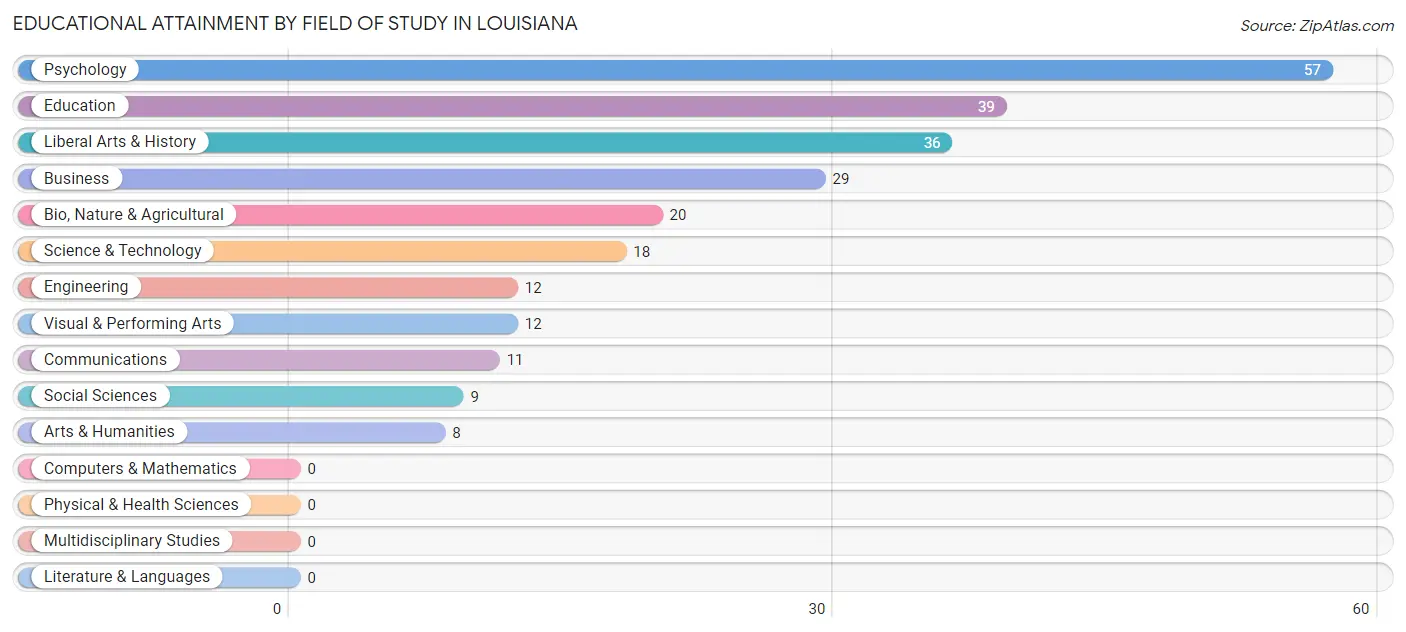
Educational Attainment by Field of Study in Louisiana
Psychology (57 | 22.7%), education (39 | 15.5%), liberal arts & history (36 | 14.3%), business (29 | 11.6%), and bio, nature & agricultural (20 | 8.0%) are the most common fields of study among 251 individuals in Louisiana who have obtained a bachelor's degree or higher.
| Field of Study | # Graduates | % Graduates |
| Computers & Mathematics | 0 | 0.0% |
| Bio, Nature & Agricultural | 20 | 8.0% |
| Physical & Health Sciences | 0 | 0.0% |
| Psychology | 57 | 22.7% |
| Social Sciences | 9 | 3.6% |
| Engineering | 12 | 4.8% |
| Multidisciplinary Studies | 0 | 0.0% |
| Science & Technology | 18 | 7.2% |
| Business | 29 | 11.6% |
| Education | 39 | 15.5% |
| Literature & Languages | 0 | 0.0% |
| Liberal Arts & History | 36 | 14.3% |
| Visual & Performing Arts | 12 | 4.8% |
| Communications | 11 | 4.4% |
| Arts & Humanities | 8 | 3.2% |
| Total | 251 | 100.0% |
Transportation & Commute in Louisiana
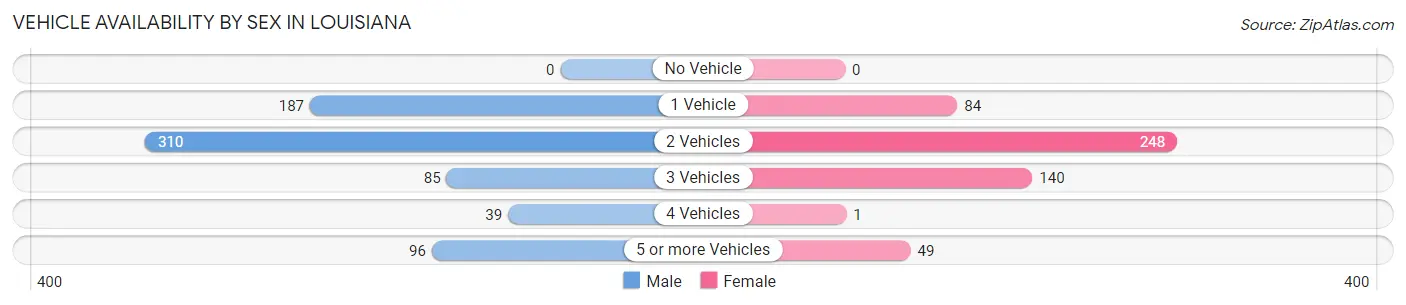
Vehicle Availability by Sex in Louisiana
The most prevalent vehicle ownership categories in Louisiana are males with 2 vehicles (310, accounting for 43.2%) and females with 2 vehicles (248, making up 59.4%).
| Vehicles Available | Male | Female |
| No Vehicle | 0 (0.0%) | 0 (0.0%) |
| 1 Vehicle | 187 (26.1%) | 84 (16.1%) |
| 2 Vehicles | 310 (43.2%) | 248 (47.5%) |
| 3 Vehicles | 85 (11.8%) | 140 (26.8%) |
| 4 Vehicles | 39 (5.4%) | 1 (0.2%) |
| 5 or more Vehicles | 96 (13.4%) | 49 (9.4%) |
| Total | 717 (100.0%) | 522 (100.0%) |
Commute Time in Louisiana
The most frequently occuring commute durations in Louisiana are 10 to 14 minutes (258 commuters, 21.3%), 5 to 9 minutes (224 commuters, 18.5%), and 20 to 24 minutes (207 commuters, 17.1%).
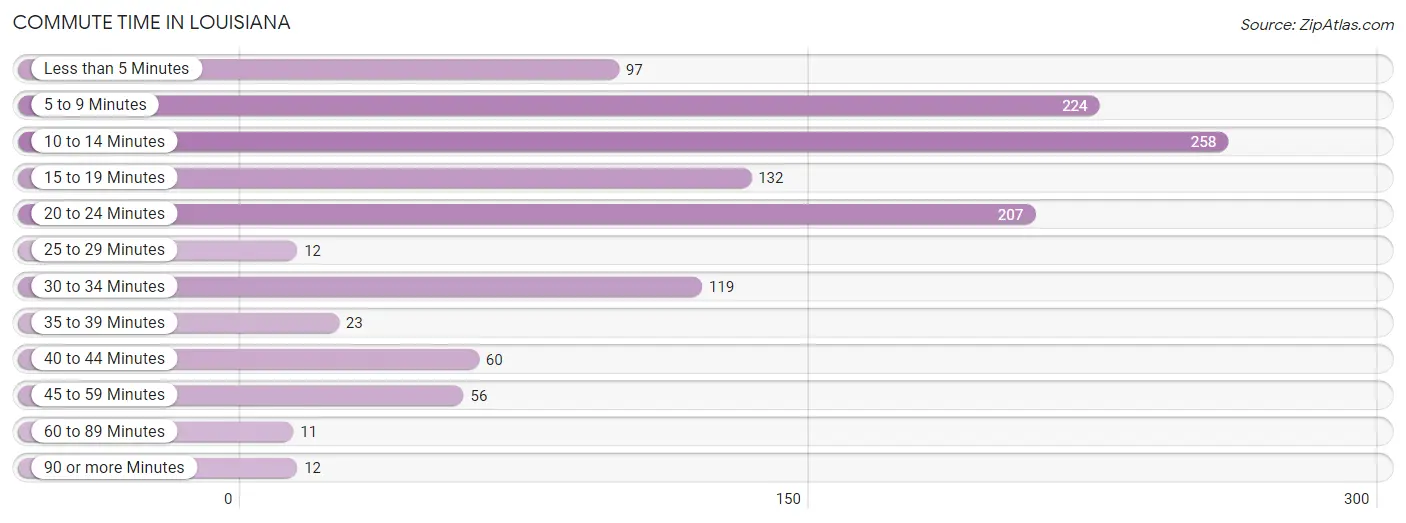
| Commute Time | # Commuters | % Commuters |
| Less than 5 Minutes | 97 | 8.0% |
| 5 to 9 Minutes | 224 | 18.5% |
| 10 to 14 Minutes | 258 | 21.3% |
| 15 to 19 Minutes | 132 | 10.9% |
| 20 to 24 Minutes | 207 | 17.1% |
| 25 to 29 Minutes | 12 | 1.0% |
| 30 to 34 Minutes | 119 | 9.8% |
| 35 to 39 Minutes | 23 | 1.9% |
| 40 to 44 Minutes | 60 | 5.0% |
| 45 to 59 Minutes | 56 | 4.6% |
| 60 to 89 Minutes | 11 | 0.9% |
| 90 or more Minutes | 12 | 1.0% |
Commute Time by Sex in Louisiana
The most common commute times in Louisiana are 10 to 14 minutes (205 commuters, 29.2%) for males and 5 to 9 minutes (152 commuters, 29.9%) for females.
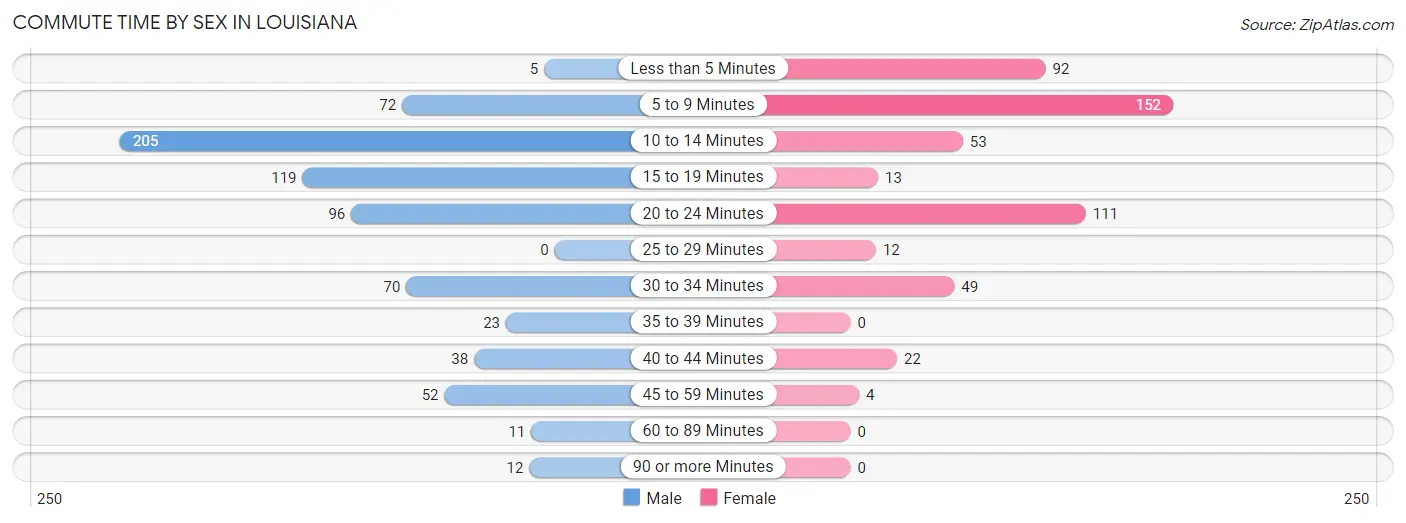
| Commute Time | Male | Female |
| Less than 5 Minutes | 5 (0.7%) | 92 (18.1%) |
| 5 to 9 Minutes | 72 (10.2%) | 152 (29.9%) |
| 10 to 14 Minutes | 205 (29.2%) | 53 (10.4%) |
| 15 to 19 Minutes | 119 (16.9%) | 13 (2.6%) |
| 20 to 24 Minutes | 96 (13.7%) | 111 (21.8%) |
| 25 to 29 Minutes | 0 (0.0%) | 12 (2.4%) |
| 30 to 34 Minutes | 70 (10.0%) | 49 (9.7%) |
| 35 to 39 Minutes | 23 (3.3%) | 0 (0.0%) |
| 40 to 44 Minutes | 38 (5.4%) | 22 (4.3%) |
| 45 to 59 Minutes | 52 (7.4%) | 4 (0.8%) |
| 60 to 89 Minutes | 11 (1.6%) | 0 (0.0%) |
| 90 or more Minutes | 12 (1.7%) | 0 (0.0%) |
Time of Departure to Work by Sex in Louisiana
The most frequent times of departure to work in Louisiana are 7:30 AM to 7:59 AM (182, 25.9%) for males and 7:00 AM to 7:29 AM (94, 18.5%) for females.
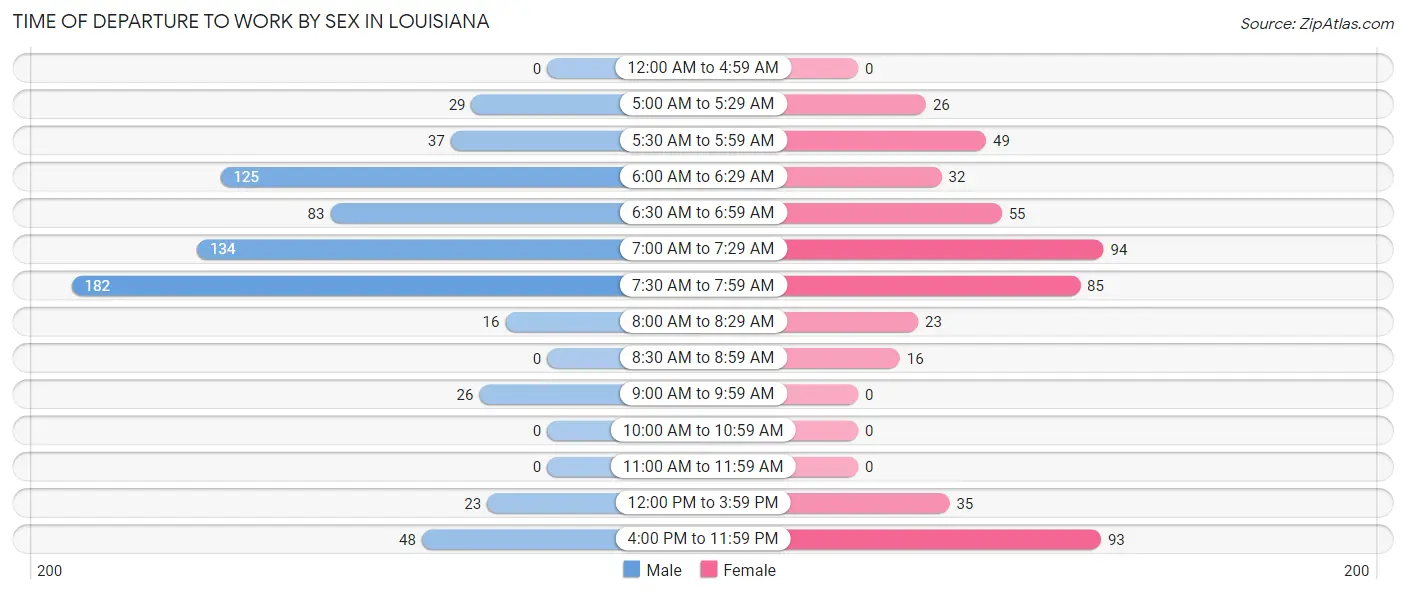
| Time of Departure | Male | Female |
| 12:00 AM to 4:59 AM | 0 (0.0%) | 0 (0.0%) |
| 5:00 AM to 5:29 AM | 29 (4.1%) | 26 (5.1%) |
| 5:30 AM to 5:59 AM | 37 (5.3%) | 49 (9.7%) |
| 6:00 AM to 6:29 AM | 125 (17.8%) | 32 (6.3%) |
| 6:30 AM to 6:59 AM | 83 (11.8%) | 55 (10.8%) |
| 7:00 AM to 7:29 AM | 134 (19.1%) | 94 (18.5%) |
| 7:30 AM to 7:59 AM | 182 (25.9%) | 85 (16.7%) |
| 8:00 AM to 8:29 AM | 16 (2.3%) | 23 (4.5%) |
| 8:30 AM to 8:59 AM | 0 (0.0%) | 16 (3.2%) |
| 9:00 AM to 9:59 AM | 26 (3.7%) | 0 (0.0%) |
| 10:00 AM to 10:59 AM | 0 (0.0%) | 0 (0.0%) |
| 11:00 AM to 11:59 AM | 0 (0.0%) | 0 (0.0%) |
| 12:00 PM to 3:59 PM | 23 (3.3%) | 35 (6.9%) |
| 4:00 PM to 11:59 PM | 48 (6.8%) | 93 (18.3%) |
| Total | 703 (100.0%) | 508 (100.0%) |
Housing Occupancy in Louisiana
Occupancy by Ownership in Louisiana
Of the total 1,323 dwellings in Louisiana, owner-occupied units account for 820 (62.0%), while renter-occupied units make up 503 (38.0%).
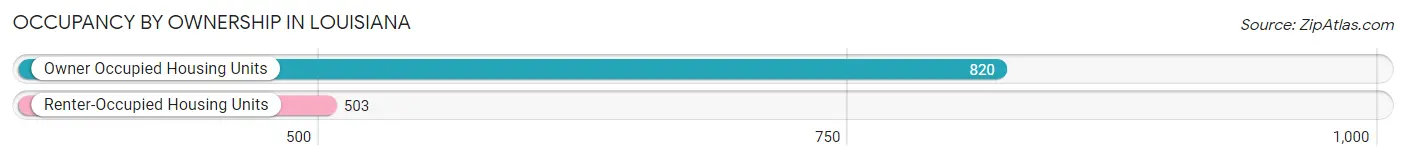
| Occupancy | # Housing Units | % Housing Units |
| Owner Occupied Housing Units | 820 | 62.0% |
| Renter-Occupied Housing Units | 503 | 38.0% |
| Total Occupied Housing Units | 1,323 | 100.0% |
Occupancy by Household Size in Louisiana
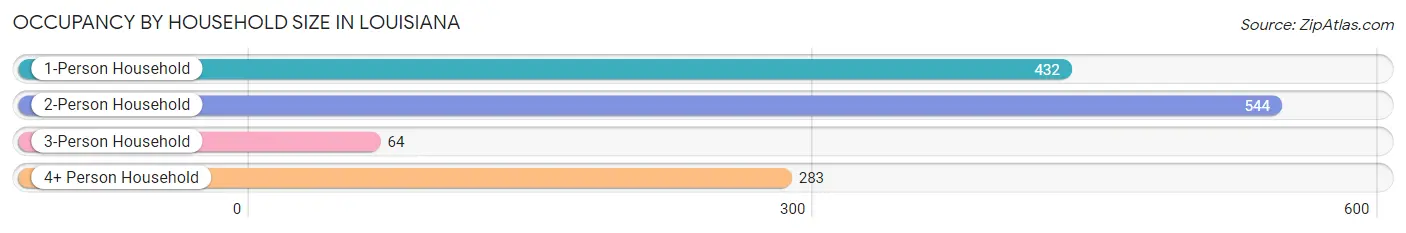
| Household Size | # Housing Units | % Housing Units |
| 1-Person Household | 432 | 32.7% |
| 2-Person Household | 544 | 41.1% |
| 3-Person Household | 64 | 4.8% |
| 4+ Person Household | 283 | 21.4% |
| Total Housing Units | 1,323 | 100.0% |
Occupancy by Ownership by Household Size in Louisiana
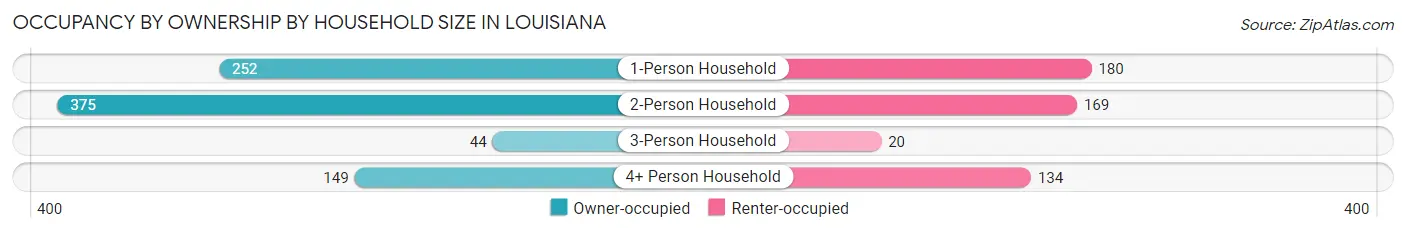
| Household Size | Owner-occupied | Renter-occupied |
| 1-Person Household | 252 (58.3%) | 180 (41.7%) |
| 2-Person Household | 375 (68.9%) | 169 (31.1%) |
| 3-Person Household | 44 (68.8%) | 20 (31.2%) |
| 4+ Person Household | 149 (52.6%) | 134 (47.3%) |
| Total Housing Units | 820 (62.0%) | 503 (38.0%) |
Occupancy by Educational Attainment in Louisiana
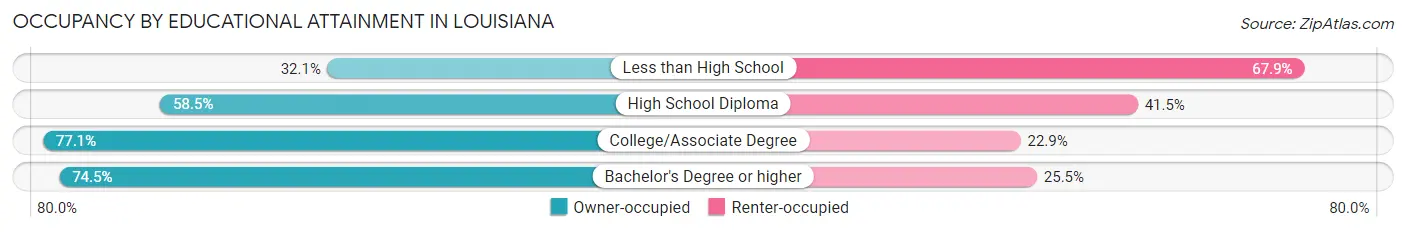
| Household Size | Owner-occupied | Renter-occupied |
| Less than High School | 51 (32.1%) | 108 (67.9%) |
| High School Diploma | 388 (58.5%) | 275 (41.5%) |
| College/Associate Degree | 229 (77.1%) | 68 (22.9%) |
| Bachelor's Degree or higher | 152 (74.5%) | 52 (25.5%) |
Occupancy by Age of Householder in Louisiana
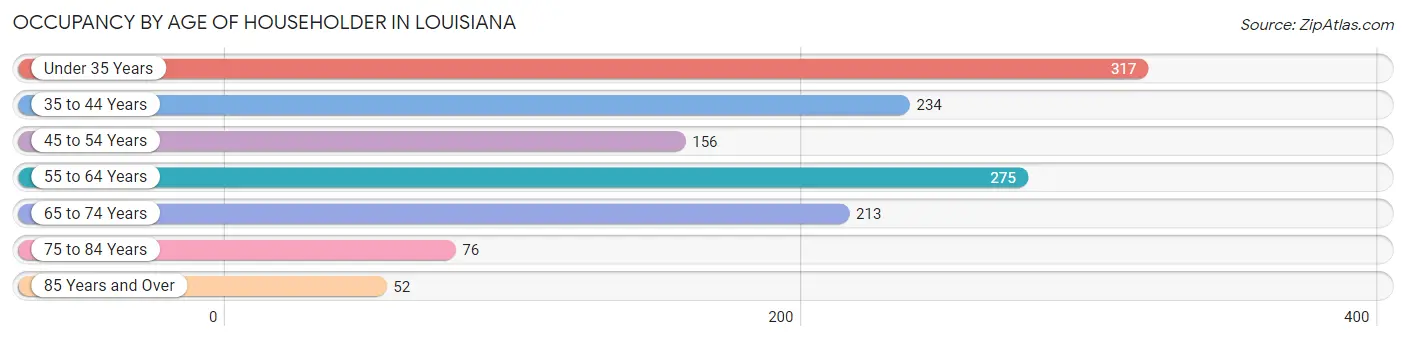
| Age Bracket | # Households | % Households |
| Under 35 Years | 317 | 24.0% |
| 35 to 44 Years | 234 | 17.7% |
| 45 to 54 Years | 156 | 11.8% |
| 55 to 64 Years | 275 | 20.8% |
| 65 to 74 Years | 213 | 16.1% |
| 75 to 84 Years | 76 | 5.7% |
| 85 Years and Over | 52 | 3.9% |
| Total | 1,323 | 100.0% |
Housing Finances in Louisiana
Median Income by Occupancy in Louisiana
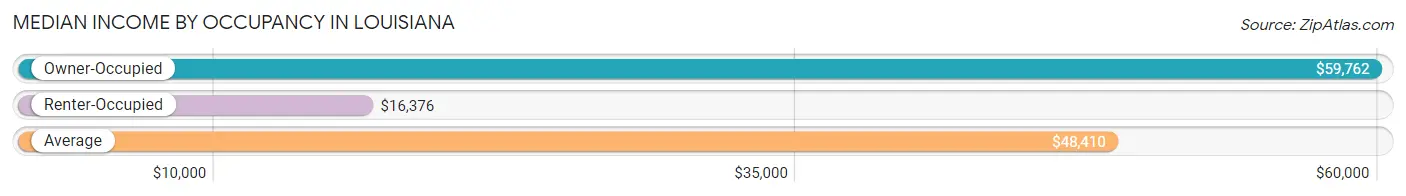
| Occupancy Type | # Households | Median Income |
| Owner-Occupied | 820 (62.0%) | $59,762 |
| Renter-Occupied | 503 (38.0%) | $16,376 |
| Average | 1,323 (100.0%) | $48,410 |
Occupancy by Householder Income Bracket in Louisiana
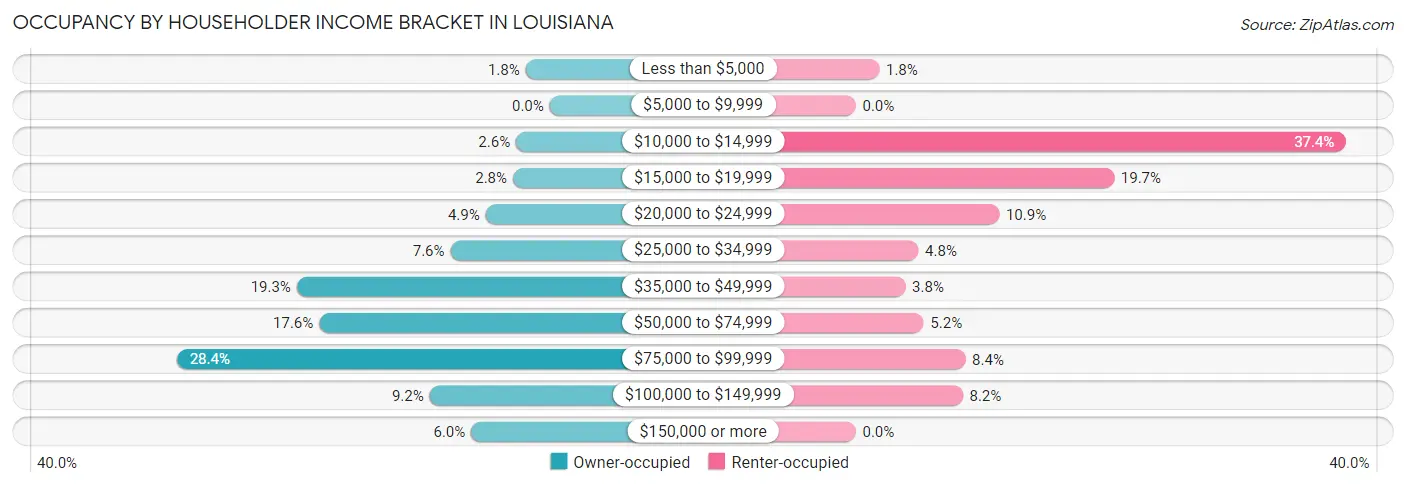
| Income Bracket | Owner-occupied | Renter-occupied |
| Less than $5,000 | 15 (1.8%) | 9 (1.8%) |
| $5,000 to $9,999 | 0 (0.0%) | 0 (0.0%) |
| $10,000 to $14,999 | 21 (2.6%) | 188 (37.4%) |
| $15,000 to $19,999 | 23 (2.8%) | 99 (19.7%) |
| $20,000 to $24,999 | 40 (4.9%) | 55 (10.9%) |
| $25,000 to $34,999 | 62 (7.6%) | 24 (4.8%) |
| $35,000 to $49,999 | 158 (19.3%) | 19 (3.8%) |
| $50,000 to $74,999 | 144 (17.6%) | 26 (5.2%) |
| $75,000 to $99,999 | 233 (28.4%) | 42 (8.4%) |
| $100,000 to $149,999 | 75 (9.1%) | 41 (8.2%) |
| $150,000 or more | 49 (6.0%) | 0 (0.0%) |
| Total | 820 (100.0%) | 503 (100.0%) |
Monthly Housing Cost Tiers in Louisiana

| Monthly Cost | Owner-occupied | Renter-occupied |
| Less than $300 | 146 (17.8%) | 105 (20.9%) |
| $300 to $499 | 237 (28.9%) | 83 (16.5%) |
| $500 to $799 | 193 (23.5%) | 119 (23.7%) |
| $800 to $999 | 109 (13.3%) | 94 (18.7%) |
| $1,000 to $1,499 | 104 (12.7%) | 52 (10.3%) |
| $1,500 to $1,999 | 5 (0.6%) | 0 (0.0%) |
| $2,000 to $2,499 | 26 (3.2%) | 0 (0.0%) |
| $2,500 to $2,999 | 0 (0.0%) | 0 (0.0%) |
| $3,000 or more | 0 (0.0%) | 0 (0.0%) |
| Total | 820 (100.0%) | 503 (100.0%) |
Physical Housing Characteristics in Louisiana
Housing Structures in Louisiana
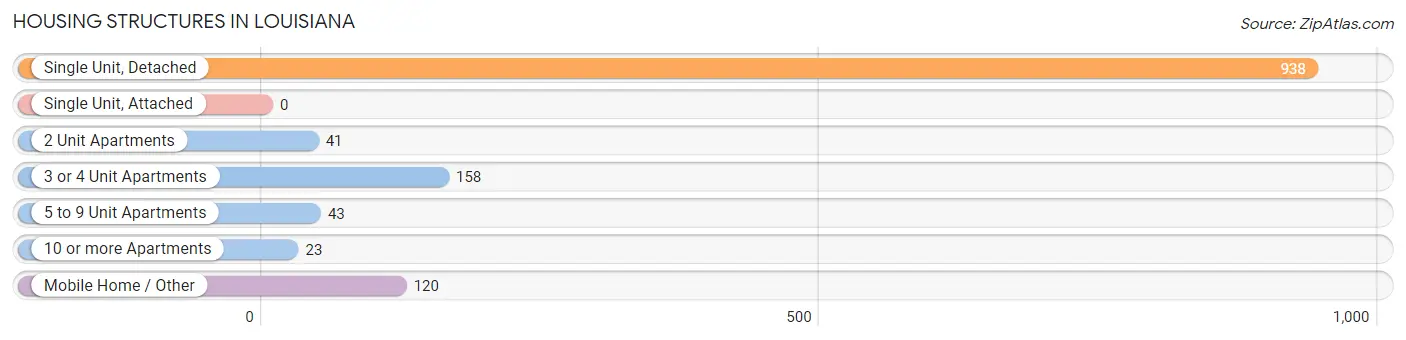
| Structure Type | # Housing Units | % Housing Units |
| Single Unit, Detached | 938 | 70.9% |
| Single Unit, Attached | 0 | 0.0% |
| 2 Unit Apartments | 41 | 3.1% |
| 3 or 4 Unit Apartments | 158 | 11.9% |
| 5 to 9 Unit Apartments | 43 | 3.3% |
| 10 or more Apartments | 23 | 1.7% |
| Mobile Home / Other | 120 | 9.1% |
| Total | 1,323 | 100.0% |
Housing Structures by Occupancy in Louisiana
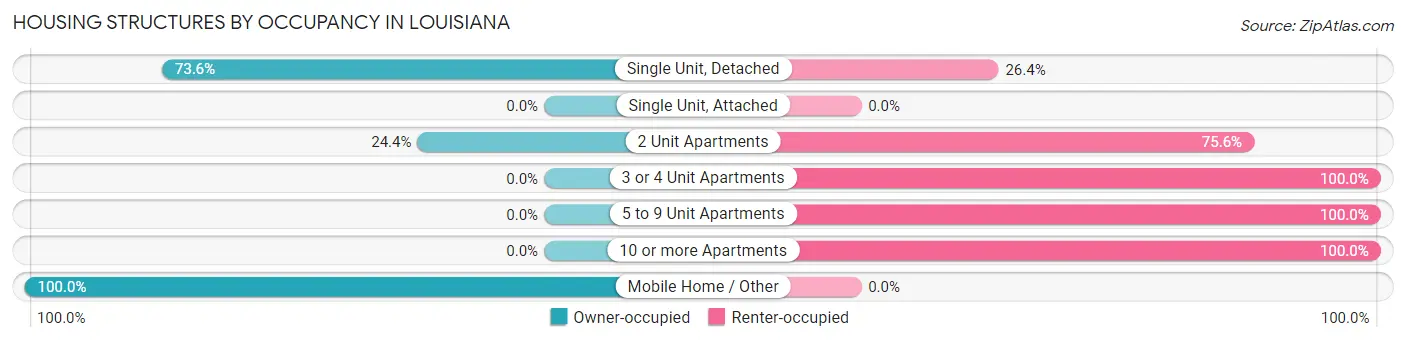
| Structure Type | Owner-occupied | Renter-occupied |
| Single Unit, Detached | 690 (73.6%) | 248 (26.4%) |
| Single Unit, Attached | 0 (0.0%) | 0 (0.0%) |
| 2 Unit Apartments | 10 (24.4%) | 31 (75.6%) |
| 3 or 4 Unit Apartments | 0 (0.0%) | 158 (100.0%) |
| 5 to 9 Unit Apartments | 0 (0.0%) | 43 (100.0%) |
| 10 or more Apartments | 0 (0.0%) | 23 (100.0%) |
| Mobile Home / Other | 120 (100.0%) | 0 (0.0%) |
| Total | 820 (62.0%) | 503 (38.0%) |
Housing Structures by Number of Rooms in Louisiana
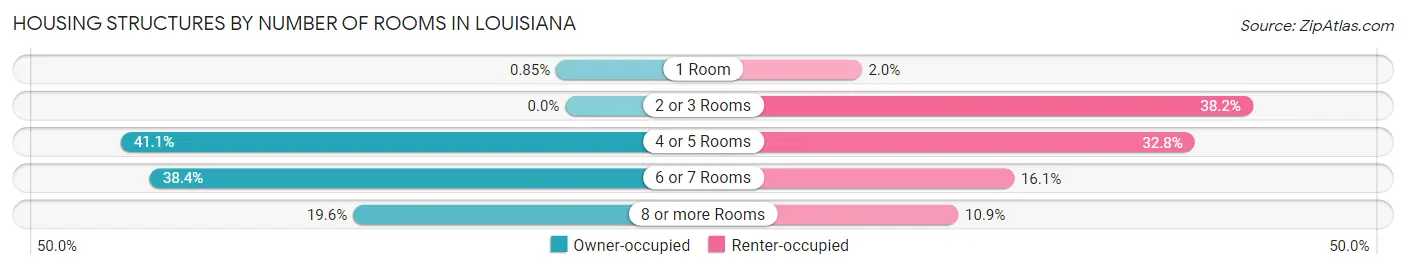
| Number of Rooms | Owner-occupied | Renter-occupied |
| 1 Room | 7 (0.9%) | 10 (2.0%) |
| 2 or 3 Rooms | 0 (0.0%) | 192 (38.2%) |
| 4 or 5 Rooms | 337 (41.1%) | 165 (32.8%) |
| 6 or 7 Rooms | 315 (38.4%) | 81 (16.1%) |
| 8 or more Rooms | 161 (19.6%) | 55 (10.9%) |
| Total | 820 (100.0%) | 503 (100.0%) |
Housing Structure by Heating Type in Louisiana
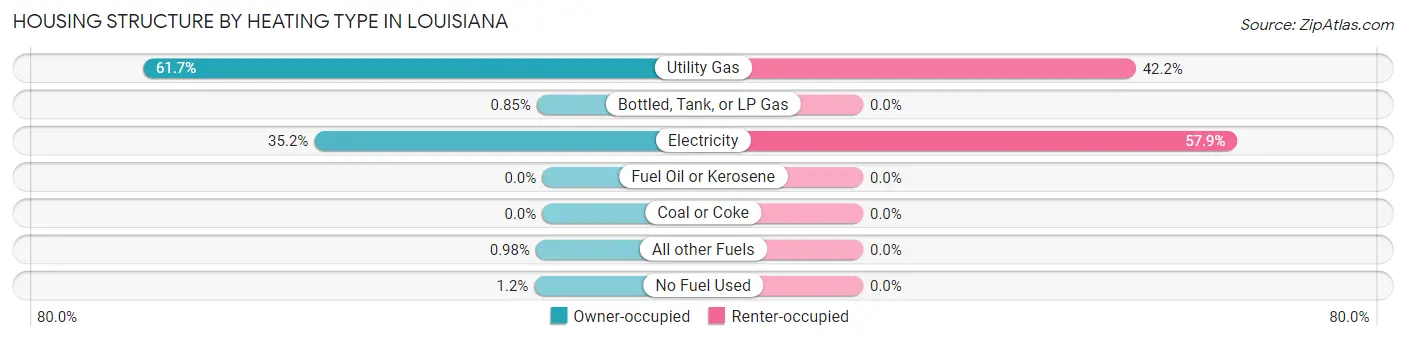
| Heating Type | Owner-occupied | Renter-occupied |
| Utility Gas | 506 (61.7%) | 212 (42.1%) |
| Bottled, Tank, or LP Gas | 7 (0.9%) | 0 (0.0%) |
| Electricity | 289 (35.2%) | 291 (57.9%) |
| Fuel Oil or Kerosene | 0 (0.0%) | 0 (0.0%) |
| Coal or Coke | 0 (0.0%) | 0 (0.0%) |
| All other Fuels | 8 (1.0%) | 0 (0.0%) |
| No Fuel Used | 10 (1.2%) | 0 (0.0%) |
| Total | 820 (100.0%) | 503 (100.0%) |
Household Vehicle Usage in Louisiana
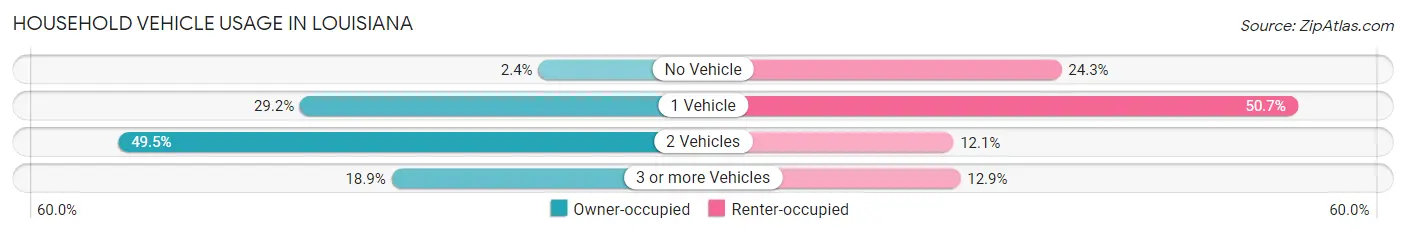
| Vehicles per Household | Owner-occupied | Renter-occupied |
| No Vehicle | 20 (2.4%) | 122 (24.2%) |
| 1 Vehicle | 239 (29.1%) | 255 (50.7%) |
| 2 Vehicles | 406 (49.5%) | 61 (12.1%) |
| 3 or more Vehicles | 155 (18.9%) | 65 (12.9%) |
| Total | 820 (100.0%) | 503 (100.0%) |
Real Estate & Mortgages in Louisiana
Real Estate and Mortgage Overview in Louisiana
| Characteristic | Without Mortgage | With Mortgage |
| Housing Units | 424 | 396 |
| Median Property Value | $61,400 | $79,700 |
| Median Household Income | $70,375 | $15 |
| Monthly Housing Costs | $341 | $0 |
| Real Estate Taxes | $523 | $0 |
Property Value by Mortgage Status in Louisiana
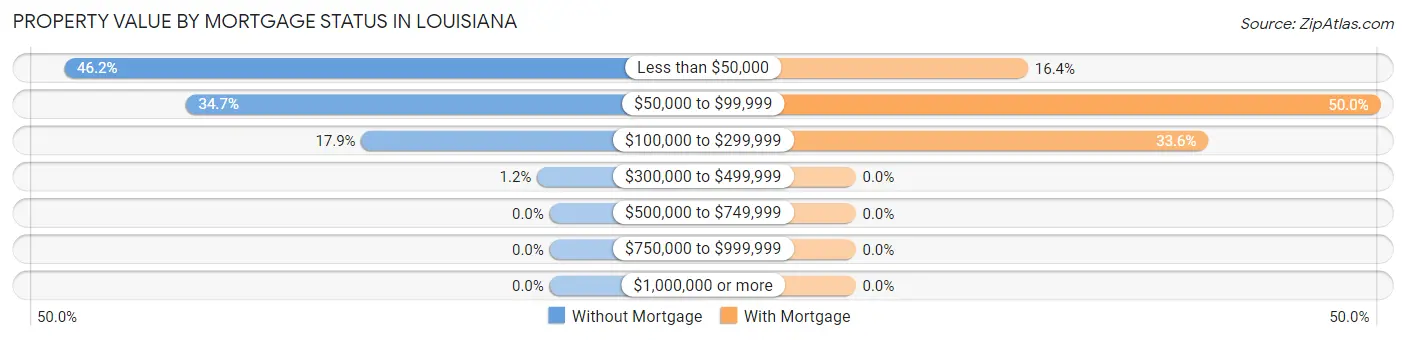
| Property Value | Without Mortgage | With Mortgage |
| Less than $50,000 | 196 (46.2%) | 65 (16.4%) |
| $50,000 to $99,999 | 147 (34.7%) | 198 (50.0%) |
| $100,000 to $299,999 | 76 (17.9%) | 133 (33.6%) |
| $300,000 to $499,999 | 5 (1.2%) | 0 (0.0%) |
| $500,000 to $749,999 | 0 (0.0%) | 0 (0.0%) |
| $750,000 to $999,999 | 0 (0.0%) | 0 (0.0%) |
| $1,000,000 or more | 0 (0.0%) | 0 (0.0%) |
| Total | 424 (100.0%) | 396 (100.0%) |
Household Income by Mortgage Status in Louisiana
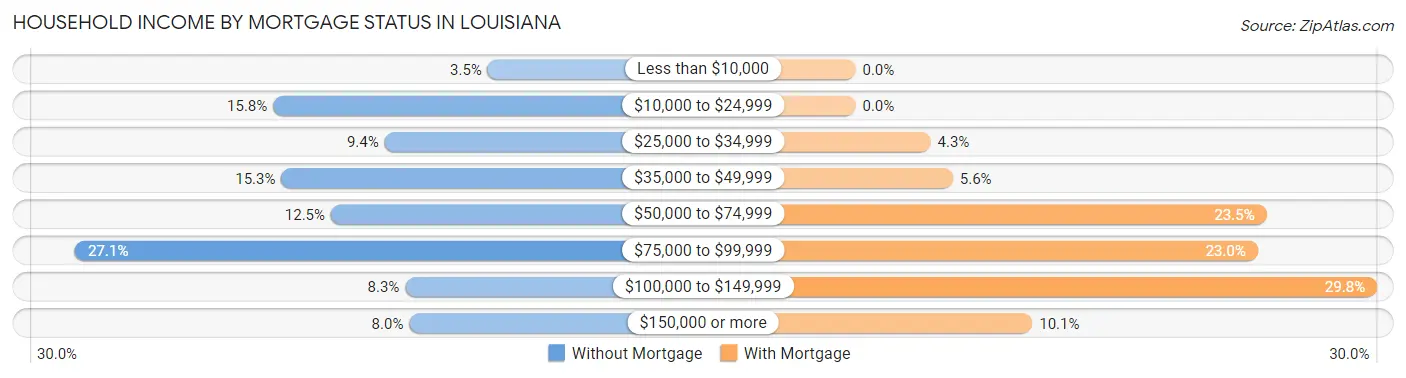
| Household Income | Without Mortgage | With Mortgage |
| Less than $10,000 | 15 (3.5%) | 0 (0.0%) |
| $10,000 to $24,999 | 67 (15.8%) | 0 (0.0%) |
| $25,000 to $34,999 | 40 (9.4%) | 17 (4.3%) |
| $35,000 to $49,999 | 65 (15.3%) | 22 (5.6%) |
| $50,000 to $74,999 | 53 (12.5%) | 93 (23.5%) |
| $75,000 to $99,999 | 115 (27.1%) | 91 (23.0%) |
| $100,000 to $149,999 | 35 (8.3%) | 118 (29.8%) |
| $150,000 or more | 34 (8.0%) | 40 (10.1%) |
| Total | 424 (100.0%) | 396 (100.0%) |
Property Value to Household Income Ratio in Louisiana
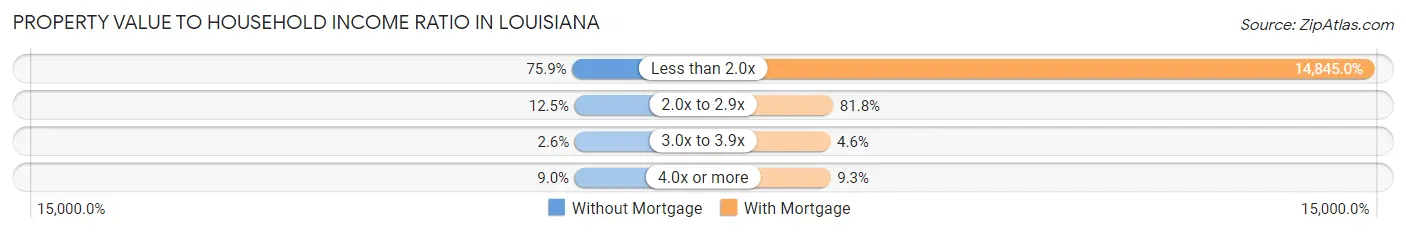
| Value-to-Income Ratio | Without Mortgage | With Mortgage |
| Less than 2.0x | 322 (75.9%) | 58,786 (14,845.0%) |
| 2.0x to 2.9x | 53 (12.5%) | 324 (81.8%) |
| 3.0x to 3.9x | 11 (2.6%) | 18 (4.5%) |
| 4.0x or more | 38 (9.0%) | 37 (9.3%) |
| Total | 424 (100.0%) | 396 (100.0%) |
Real Estate Taxes by Mortgage Status in Louisiana
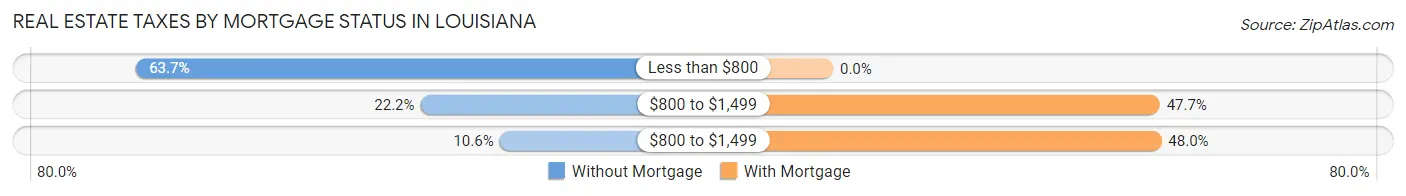
| Property Taxes | Without Mortgage | With Mortgage |
| Less than $800 | 270 (63.7%) | 0 (0.0%) |
| $800 to $1,499 | 94 (22.2%) | 189 (47.7%) |
| $800 to $1,499 | 45 (10.6%) | 190 (48.0%) |
| Total | 424 (100.0%) | 396 (100.0%) |
Health & Disability in Louisiana
Health Insurance Coverage by Age in Louisiana
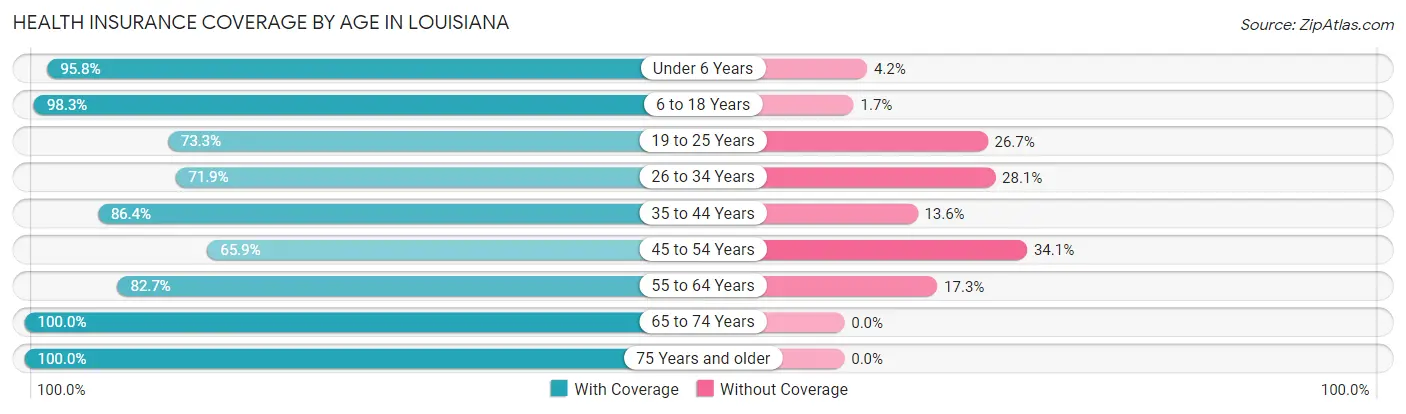
| Age Bracket | With Coverage | Without Coverage |
| Under 6 Years | 272 (95.8%) | 12 (4.2%) |
| 6 to 18 Years | 735 (98.3%) | 13 (1.7%) |
| 19 to 25 Years | 107 (73.3%) | 39 (26.7%) |
| 26 to 34 Years | 253 (71.9%) | 99 (28.1%) |
| 35 to 44 Years | 342 (86.4%) | 54 (13.6%) |
| 45 to 54 Years | 240 (65.9%) | 124 (34.1%) |
| 55 to 64 Years | 382 (82.7%) | 80 (17.3%) |
| 65 to 74 Years | 263 (100.0%) | 0 (0.0%) |
| 75 Years and older | 185 (100.0%) | 0 (0.0%) |
| Total | 2,779 (86.8%) | 421 (13.2%) |
Health Insurance Coverage by Citizenship Status in Louisiana
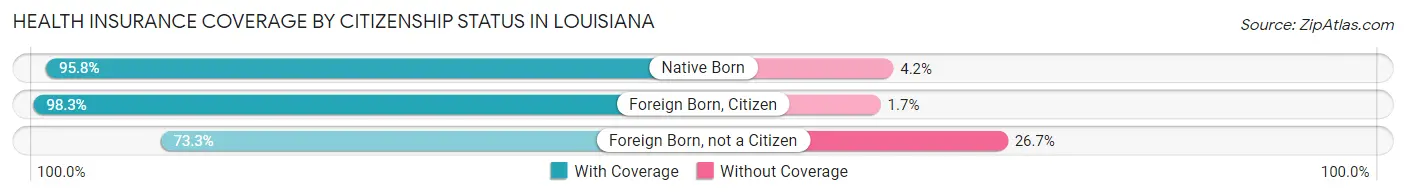
| Citizenship Status | With Coverage | Without Coverage |
| Native Born | 272 (95.8%) | 12 (4.2%) |
| Foreign Born, Citizen | 735 (98.3%) | 13 (1.7%) |
| Foreign Born, not a Citizen | 107 (73.3%) | 39 (26.7%) |
Health Insurance Coverage by Household Income in Louisiana
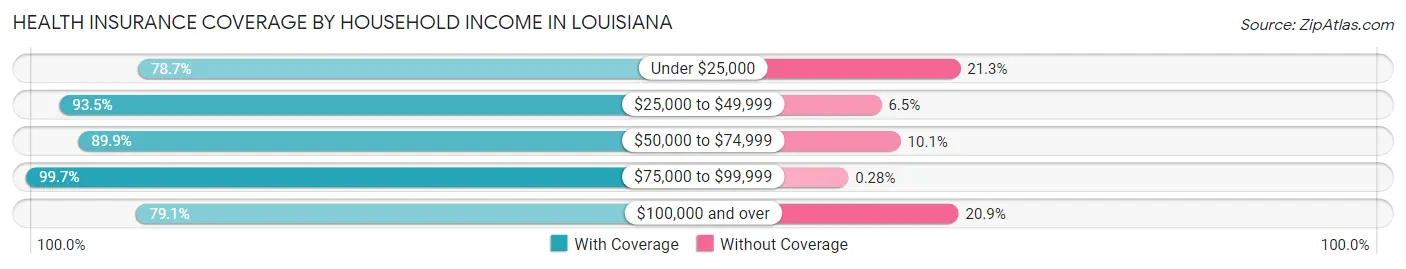
| Household Income | With Coverage | Without Coverage |
| Under $25,000 | 748 (78.7%) | 202 (21.3%) |
| $25,000 to $49,999 | 345 (93.5%) | 24 (6.5%) |
| $50,000 to $74,999 | 410 (89.9%) | 46 (10.1%) |
| $75,000 to $99,999 | 721 (99.7%) | 2 (0.3%) |
| $100,000 and over | 555 (79.1%) | 147 (20.9%) |
Public vs Private Health Insurance Coverage by Age in Louisiana
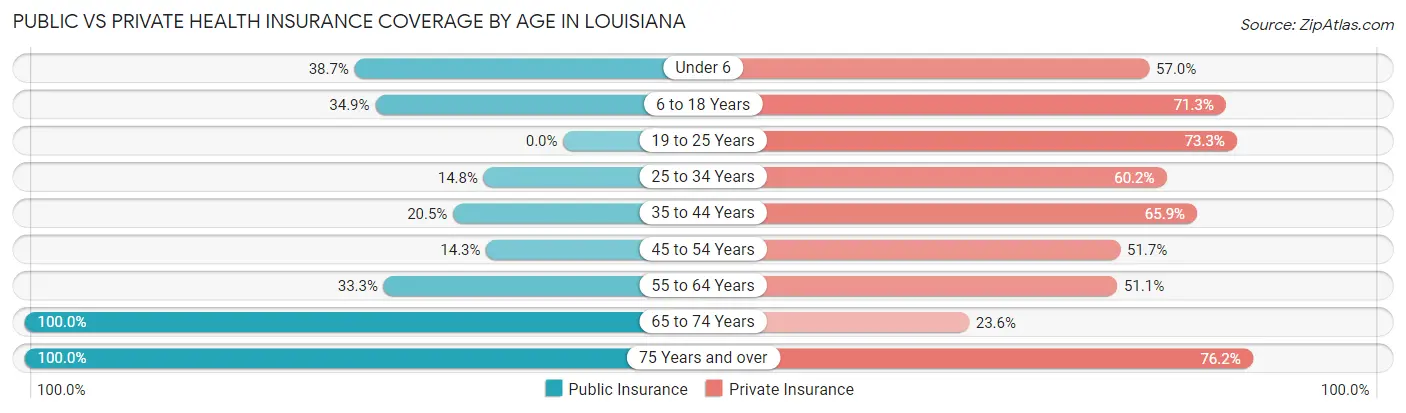
| Age Bracket | Public Insurance | Private Insurance |
| Under 6 | 110 (38.7%) | 162 (57.0%) |
| 6 to 18 Years | 261 (34.9%) | 533 (71.3%) |
| 19 to 25 Years | 0 (0.0%) | 107 (73.3%) |
| 25 to 34 Years | 52 (14.8%) | 212 (60.2%) |
| 35 to 44 Years | 81 (20.4%) | 261 (65.9%) |
| 45 to 54 Years | 52 (14.3%) | 188 (51.6%) |
| 55 to 64 Years | 154 (33.3%) | 236 (51.1%) |
| 65 to 74 Years | 263 (100.0%) | 62 (23.6%) |
| 75 Years and over | 185 (100.0%) | 141 (76.2%) |
| Total | 1,158 (36.2%) | 1,902 (59.4%) |
Disability Status by Sex by Age in Louisiana
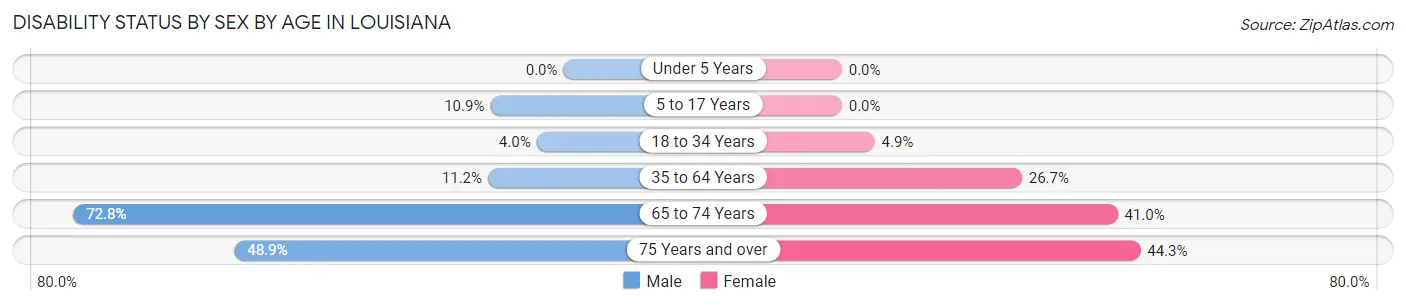
| Age Bracket | Male | Female |
| Under 5 Years | 0 (0.0%) | 0 (0.0%) |
| 5 to 17 Years | 52 (10.9%) | 0 (0.0%) |
| 18 to 34 Years | 15 (4.0%) | 11 (4.9%) |
| 35 to 64 Years | 64 (11.2%) | 174 (26.7%) |
| 65 to 74 Years | 115 (72.8%) | 43 (40.9%) |
| 75 Years and over | 43 (48.9%) | 43 (44.3%) |
Disability Class by Sex by Age in Louisiana
Disability Class: Hearing Difficulty
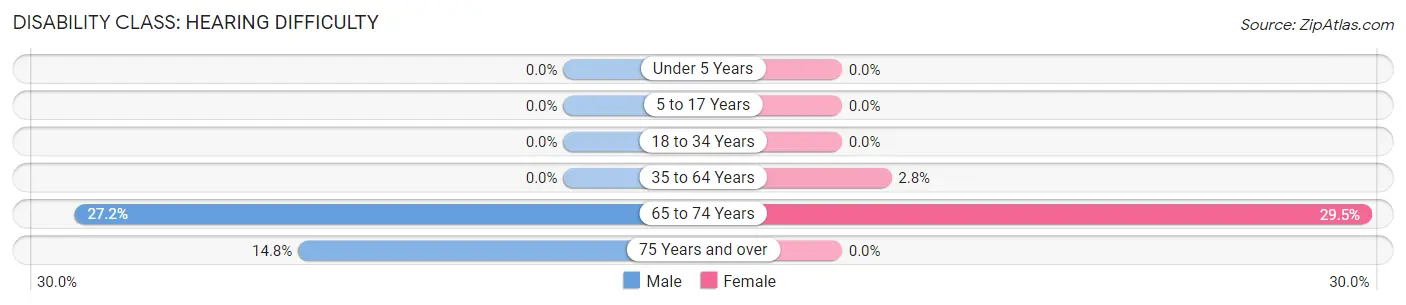
| Age Bracket | Male | Female |
| Under 5 Years | 0 (0.0%) | 0 (0.0%) |
| 5 to 17 Years | 0 (0.0%) | 0 (0.0%) |
| 18 to 34 Years | 0 (0.0%) | 0 (0.0%) |
| 35 to 64 Years | 0 (0.0%) | 18 (2.8%) |
| 65 to 74 Years | 43 (27.2%) | 31 (29.5%) |
| 75 Years and over | 13 (14.8%) | 0 (0.0%) |
Disability Class: Vision Difficulty
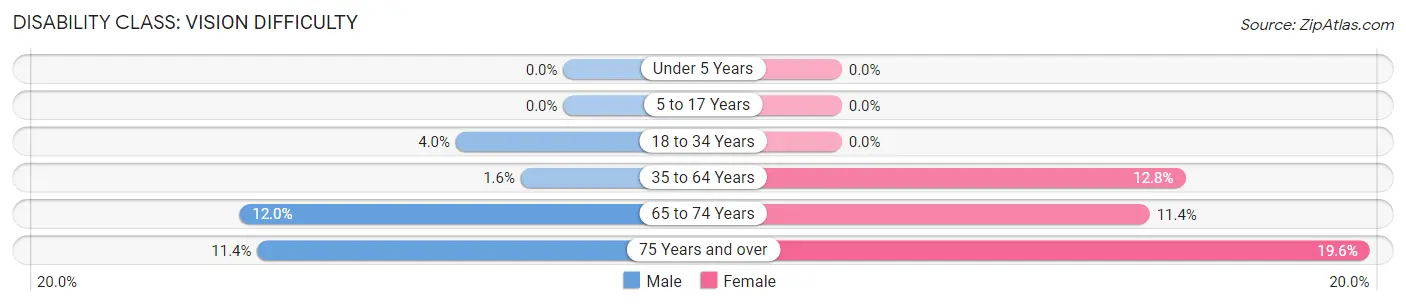
| Age Bracket | Male | Female |
| Under 5 Years | 0 (0.0%) | 0 (0.0%) |
| 5 to 17 Years | 0 (0.0%) | 0 (0.0%) |
| 18 to 34 Years | 15 (4.0%) | 0 (0.0%) |
| 35 to 64 Years | 9 (1.6%) | 83 (12.8%) |
| 65 to 74 Years | 19 (12.0%) | 12 (11.4%) |
| 75 Years and over | 10 (11.4%) | 19 (19.6%) |
Disability Class: Cognitive Difficulty
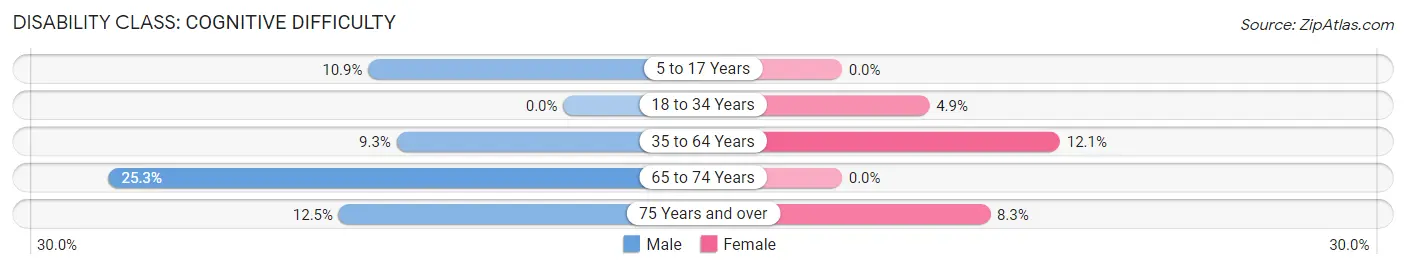
| Age Bracket | Male | Female |
| 5 to 17 Years | 52 (10.9%) | 0 (0.0%) |
| 18 to 34 Years | 0 (0.0%) | 11 (4.9%) |
| 35 to 64 Years | 53 (9.3%) | 79 (12.1%) |
| 65 to 74 Years | 40 (25.3%) | 0 (0.0%) |
| 75 Years and over | 11 (12.5%) | 8 (8.3%) |
Disability Class: Ambulatory Difficulty
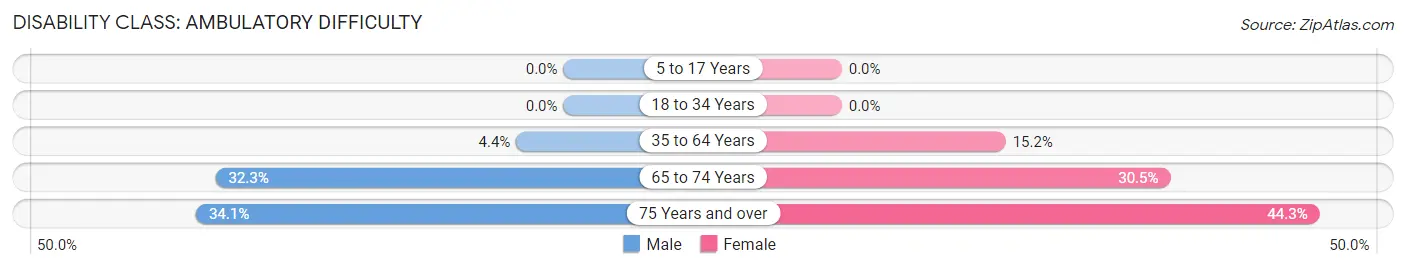
| Age Bracket | Male | Female |
| 5 to 17 Years | 0 (0.0%) | 0 (0.0%) |
| 18 to 34 Years | 0 (0.0%) | 0 (0.0%) |
| 35 to 64 Years | 25 (4.4%) | 99 (15.2%) |
| 65 to 74 Years | 51 (32.3%) | 32 (30.5%) |
| 75 Years and over | 30 (34.1%) | 43 (44.3%) |
Disability Class: Self-Care Difficulty
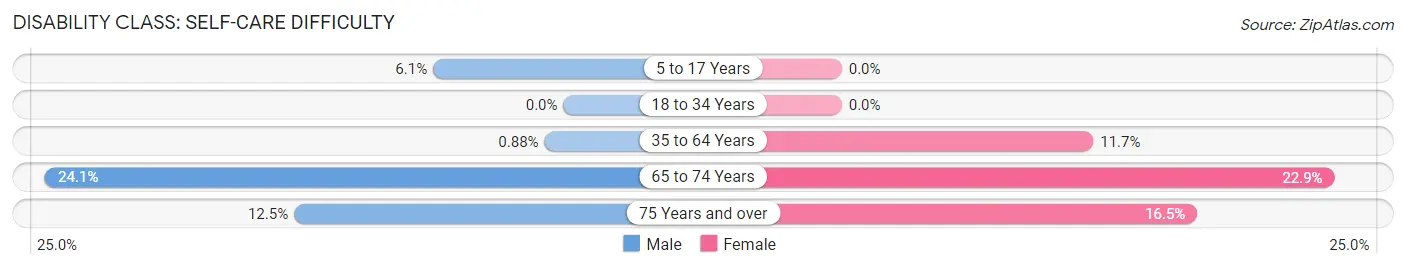
| Age Bracket | Male | Female |
| 5 to 17 Years | 29 (6.0%) | 0 (0.0%) |
| 18 to 34 Years | 0 (0.0%) | 0 (0.0%) |
| 35 to 64 Years | 5 (0.9%) | 76 (11.7%) |
| 65 to 74 Years | 38 (24.0%) | 24 (22.9%) |
| 75 Years and over | 11 (12.5%) | 16 (16.5%) |
Technology Access in Louisiana
Computing Device Access in Louisiana
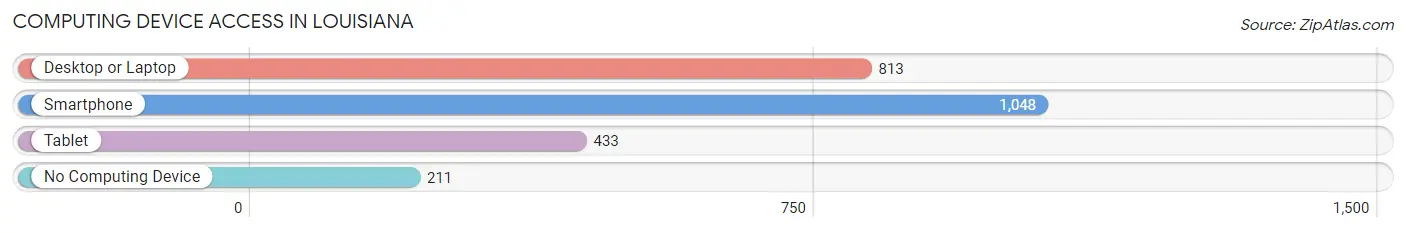
| Device Type | # Households | % Households |
| Desktop or Laptop | 813 | 61.5% |
| Smartphone | 1,048 | 79.2% |
| Tablet | 433 | 32.7% |
| No Computing Device | 211 | 16.0% |
| Total | 1,323 | 100.0% |
Internet Access in Louisiana
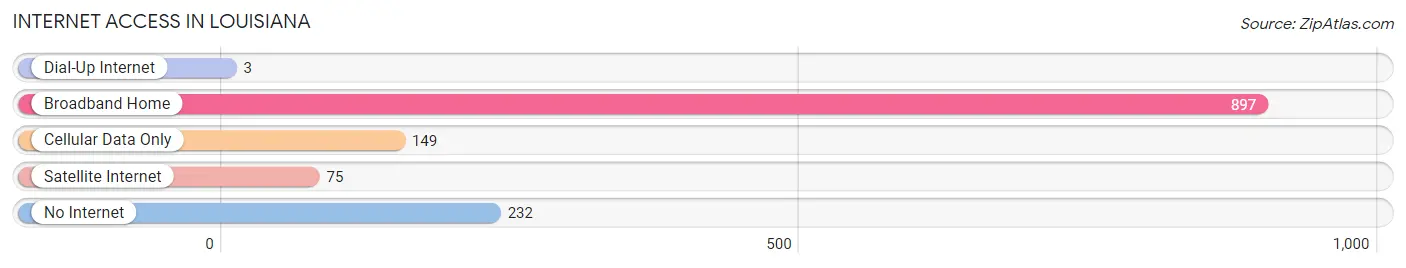
| Internet Type | # Households | % Households |
| Dial-Up Internet | 3 | 0.2% |
| Broadband Home | 897 | 67.8% |
| Cellular Data Only | 149 | 11.3% |
| Satellite Internet | 75 | 5.7% |
| No Internet | 232 | 17.5% |
| Total | 1,323 | 100.0% |
Louisiana Summary
Louisiana, Missouri is a small city located in Pike County, Missouri. It is situated on the banks of the Mississippi River, approximately 60 miles north of St. Louis. The city has a population of 4,845 as of the 2010 census, and is the county seat of Pike County.
History
The area that is now Louisiana was first settled in the early 1800s by French and German immigrants. The city was founded in 1818 and was originally known as “L’Anse a la Graisse”, which translates to “the fat man’s corner”. The name was changed to Louisiana in 1821, in honor of the French settlers who had originally settled the area.
In the early 19th century, Louisiana was a bustling river port town, with steamboats regularly docking at the city’s wharf. The city was also a major stop on the Hannibal and St. Joseph Railroad, which connected St. Louis to Hannibal, Missouri.
Geography
Louisiana is located in the eastern part of Pike County, Missouri. It is situated on the banks of the Mississippi River, approximately 60 miles north of St. Louis. The city has a total area of 4.2 square miles, all of which is land.
The city is located in the Mississippi Lowlands region, which is characterized by flat terrain and fertile soil. The climate in Louisiana is humid continental, with hot, humid summers and cold, wet winters.
Economy
The economy of Louisiana is largely based on agriculture and manufacturing. The city is home to several large manufacturing plants, including a Tyson Foods plant and a Nestle Purina plant. The city is also home to several large agricultural operations, including a large hog farm and a large poultry farm.
Louisiana is also home to several small businesses, including restaurants, retail stores, and service providers. The city is also home to several large employers, including the Pike County Courthouse, the Pike County Sheriff’s Office, and the Pike County Health Department.
Demographics
As of the 2010 census, Louisiana had a population of 4,845. The racial makeup of the city was 95.2% White, 1.2% African American, 0.3% Native American, 0.4% Asian, 0.1% Pacific Islander, 0.7% from other races, and 2.1% from two or more races. Hispanic or Latino of any race were 2.2% of the population.
The median income for a household in Louisiana was $35,938, and the median income for a family was $41,944. The per capita income for the city was $17,845. About 15.2% of families and 17.7% of the population were below the poverty line, including 25.2% of those under age 18 and 11.2% of those age 65 or over.
Common Questions
What is Per Capita Income in Louisiana?
Per Capita income in Louisiana is $23,571.
What is the Median Family Income in Louisiana?
Median Family Income in Louisiana is $73,208.
What is the Median Household income in Louisiana?
Median Household Income in Louisiana is $48,410.
What is Income or Wage Gap in Louisiana?
Income or Wage Gap in Louisiana is 38.4%.
Women in Louisiana earn 61.6 cents for every dollar earned by a man.
What is Inequality or Gini Index in Louisiana?
Inequality or Gini Index in Louisiana is 0.42.
What is the Total Population of Louisiana?
Total Population of Louisiana is 3,249.
What is the Total Male Population of Louisiana?
Total Male Population of Louisiana is 1,750.
What is the Total Female Population of Louisiana?
Total Female Population of Louisiana is 1,499.
What is the Ratio of Males per 100 Females in Louisiana?
There are 116.74 Males per 100 Females in Louisiana.
What is the Ratio of Females per 100 Males in Louisiana?
There are 85.66 Females per 100 Males in Louisiana.
What is the Median Population Age in Louisiana?
Median Population Age in Louisiana is 38.5 Years.
What is the Average Family Size in Louisiana
Average Family Size in Louisiana is 3.2 People.
What is the Average Household Size in Louisiana
Average Household Size in Louisiana is 2.4 People.
How Large is the Labor Force in Louisiana?
There are 1,323 People in the Labor Forcein in Louisiana.
What is the Percentage of People in the Labor Force in Louisiana?
55.1% of People are in the Labor Force in Louisiana.
What is the Unemployment Rate in Louisiana?
Unemployment Rate in Louisiana is 6.2%.