Longtown, MO Map & Demographics
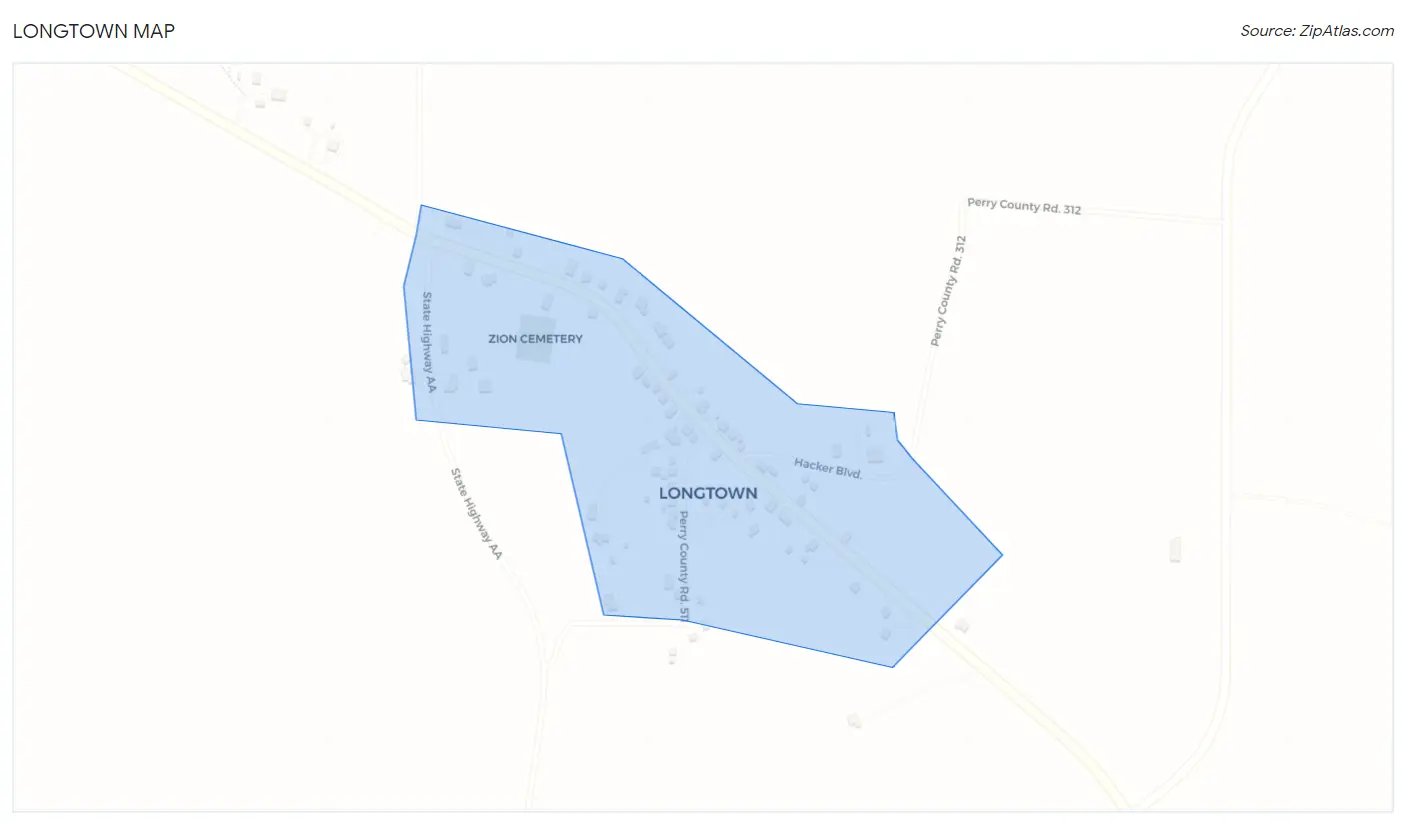
Longtown Map
Longtown Overview
$43,440
PER CAPITA INCOME
$123,125
AVG FAMILY INCOME
51.3%
WAGE / INCOME GAP [ % ]
48.7¢/ $1
WAGE / INCOME GAP [ $ ]
0.52
INEQUALITY / GINI INDEX
104
TOTAL POPULATION
58
MALE POPULATION
46
FEMALE POPULATION
126.09
MALES / 100 FEMALES
79.31
FEMALES / 100 MALES
35.8
MEDIAN AGE
3.2
AVG FAMILY SIZE
2.6
AVG HOUSEHOLD SIZE
67
LABOR FORCE [ PEOPLE ]
75.3%
PERCENT IN LABOR FORCE
Income in Longtown
Income Overview in Longtown
| Characteristic | Number | Measure |
| Per Capita Income | 104 | $43,440 |
| Median Family Income | 27 | $123,125 |
| Mean Family Income | 27 | $146,963 |
| Median Household Income | 40 | $0 |
| Mean Household Income | 40 | $112,778 |
| Income Deficit | 27 | $0 |
| Wage / Income Gap (%) | 104 | 51.29% |
| Wage / Income Gap ($) | 104 | 48.71¢ per $1 |
| Gini / Inequality Index | 104 | 0.52 |
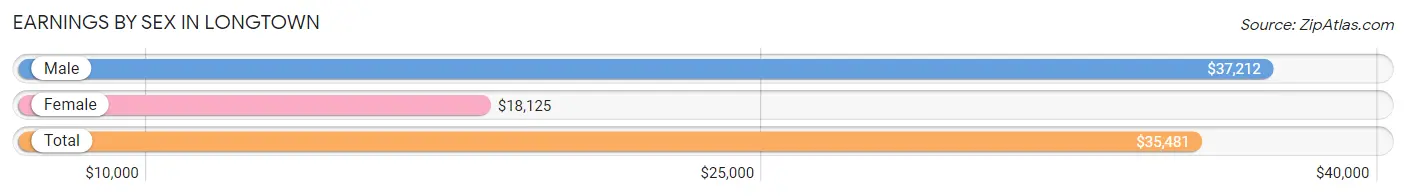
Earnings by Sex in Longtown
Average Earnings in Longtown are $35,481, $37,212 for men and $18,125 for women, a difference of 51.3%.
| Sex | Number | Average Earnings |
| Male | 35 (52.2%) | $37,212 |
| Female | 32 (47.8%) | $18,125 |
| Total | 67 (100.0%) | $35,481 |
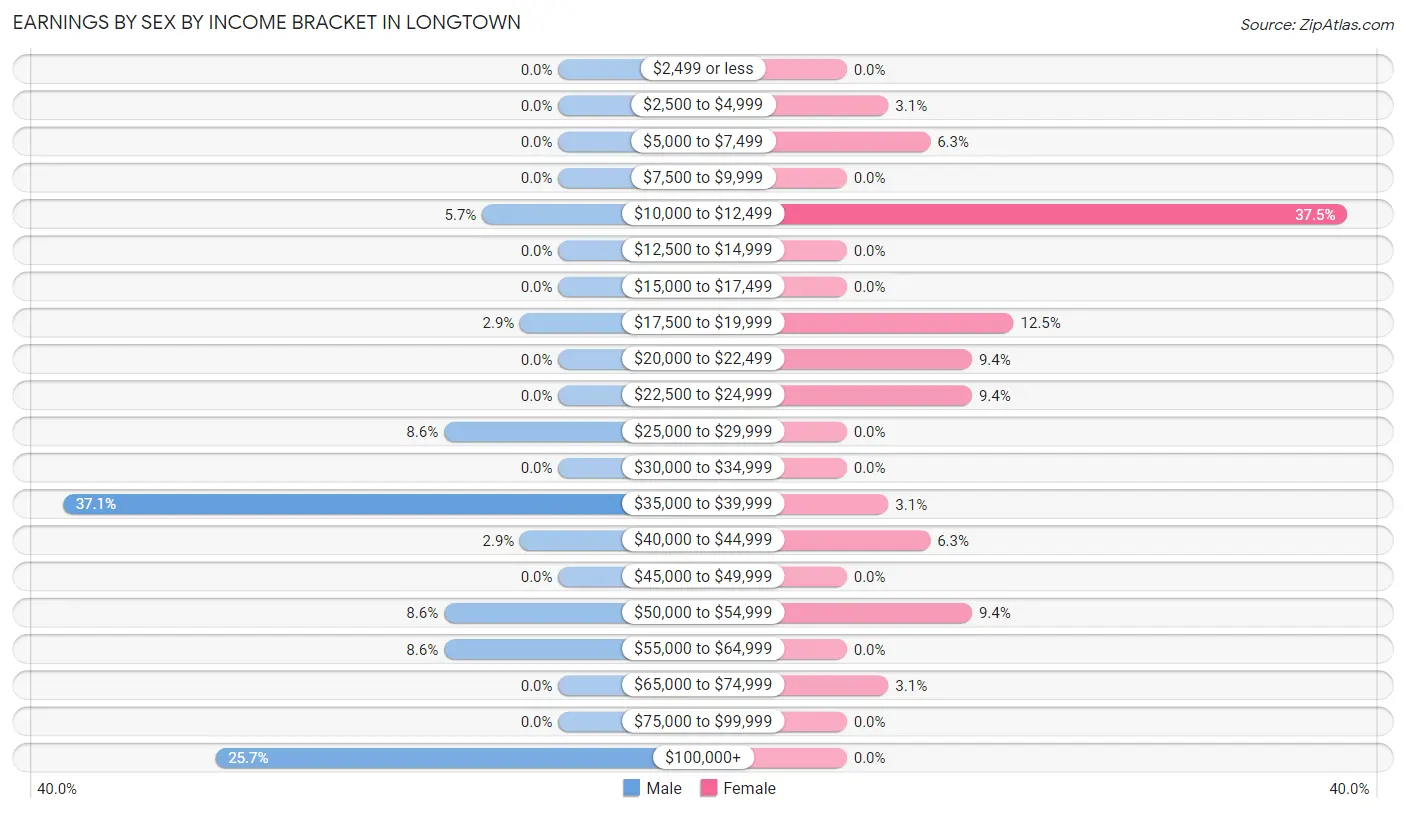
Earnings by Sex by Income Bracket in Longtown
The most common earnings brackets in Longtown are $35,000 to $39,999 for men (13 | 37.1%) and $10,000 to $12,499 for women (12 | 37.5%).
| Income | Male | Female |
| $2,499 or less | 0 (0.0%) | 0 (0.0%) |
| $2,500 to $4,999 | 0 (0.0%) | 1 (3.1%) |
| $5,000 to $7,499 | 0 (0.0%) | 2 (6.2%) |
| $7,500 to $9,999 | 0 (0.0%) | 0 (0.0%) |
| $10,000 to $12,499 | 2 (5.7%) | 12 (37.5%) |
| $12,500 to $14,999 | 0 (0.0%) | 0 (0.0%) |
| $15,000 to $17,499 | 0 (0.0%) | 0 (0.0%) |
| $17,500 to $19,999 | 1 (2.9%) | 4 (12.5%) |
| $20,000 to $22,499 | 0 (0.0%) | 3 (9.4%) |
| $22,500 to $24,999 | 0 (0.0%) | 3 (9.4%) |
| $25,000 to $29,999 | 3 (8.6%) | 0 (0.0%) |
| $30,000 to $34,999 | 0 (0.0%) | 0 (0.0%) |
| $35,000 to $39,999 | 13 (37.1%) | 1 (3.1%) |
| $40,000 to $44,999 | 1 (2.9%) | 2 (6.2%) |
| $45,000 to $49,999 | 0 (0.0%) | 0 (0.0%) |
| $50,000 to $54,999 | 3 (8.6%) | 3 (9.4%) |
| $55,000 to $64,999 | 3 (8.6%) | 0 (0.0%) |
| $65,000 to $74,999 | 0 (0.0%) | 1 (3.1%) |
| $75,000 to $99,999 | 0 (0.0%) | 0 (0.0%) |
| $100,000+ | 9 (25.7%) | 0 (0.0%) |
| Total | 35 (100.0%) | 32 (100.0%) |
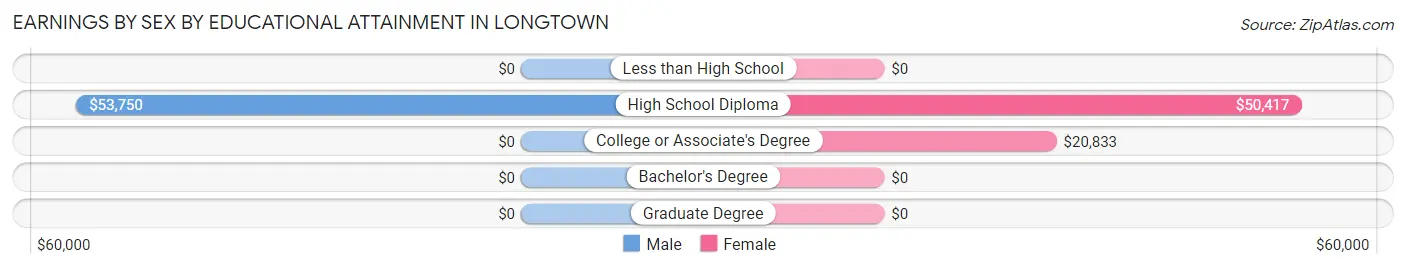
Earnings by Sex by Educational Attainment in Longtown
| Educational Attainment | Male Income | Female Income |
| Less than High School | - | - |
| High School Diploma | $53,750 | $50,417 |
| College or Associate's Degree | - | - |
| Bachelor's Degree | - | - |
| Graduate Degree | - | - |
| Total | - | - |
Family Income in Longtown
Family Income Brackets in Longtown
According to the Longtown family income data, there are 9 families falling into the $100,000 to $149,999 income range, which is the most common income bracket and makes up 33.3% of all families.
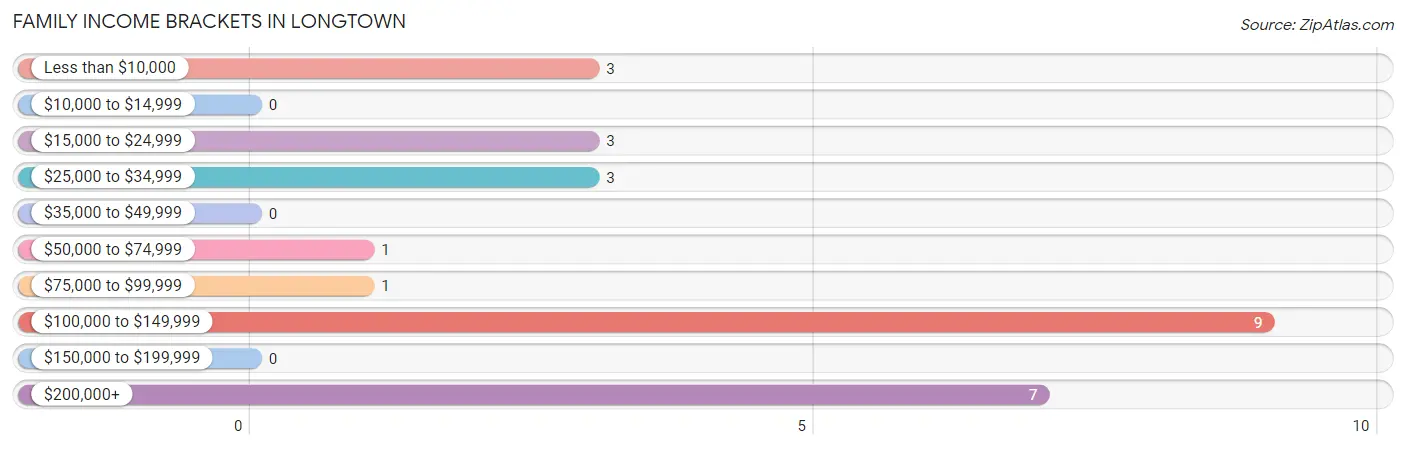
| Income Bracket | # Families | % Families |
| Less than $10,000 | 3 | 11.1% |
| $10,000 to $14,999 | 0 | 0.0% |
| $15,000 to $24,999 | 3 | 11.1% |
| $25,000 to $34,999 | 3 | 11.1% |
| $35,000 to $49,999 | 0 | 0.0% |
| $50,000 to $74,999 | 1 | 3.7% |
| $75,000 to $99,999 | 1 | 3.7% |
| $100,000 to $149,999 | 9 | 33.3% |
| $150,000 to $199,999 | 0 | 0.0% |
| $200,000+ | 7 | 25.9% |
Family Income by Famaliy Size in Longtown
2-person families (12 | 44.4%) account for the highest median family income in Longtown with $26,250 per family, while 2-person families (12 | 44.4%) have the highest median income of $13,125 per family member.
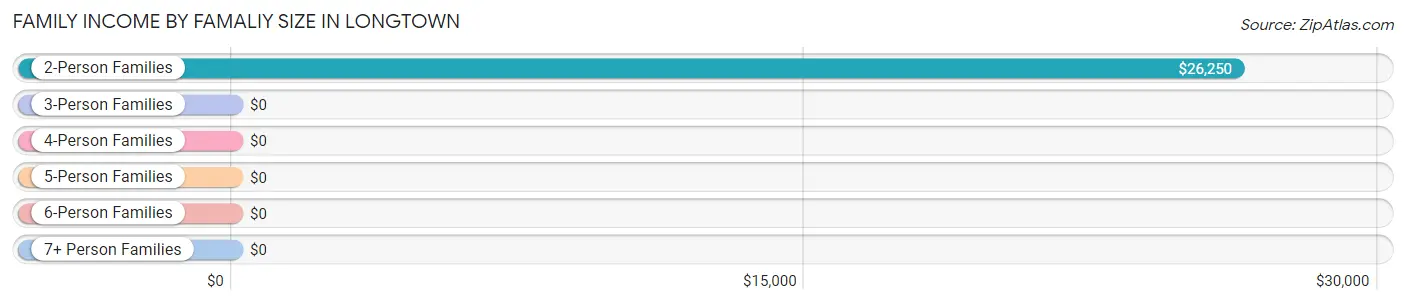
| Income Bracket | # Families | Median Income |
| 2-Person Families | 12 (44.4%) | $26,250 |
| 3-Person Families | 4 (14.8%) | $0 |
| 4-Person Families | 3 (11.1%) | $0 |
| 5-Person Families | 7 (25.9%) | $0 |
| 6-Person Families | 0 (0.0%) | $0 |
| 7+ Person Families | 1 (3.7%) | $0 |
| Total | 27 (100.0%) | $123,125 |
Family Income by Number of Earners in Longtown
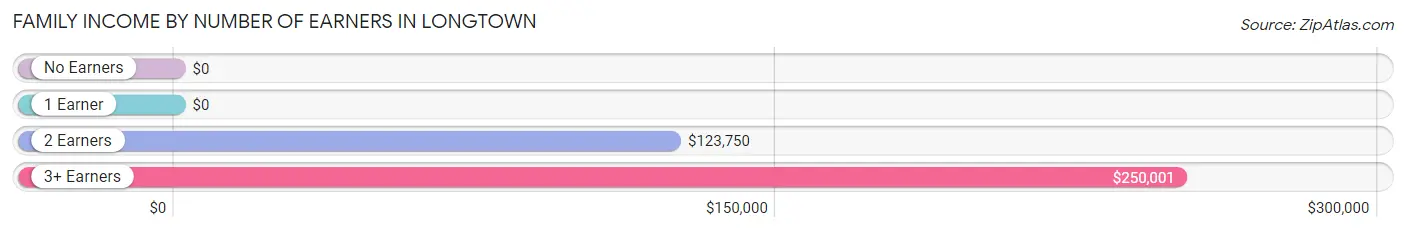
| Number of Earners | # Families | Median Income |
| No Earners | 4 (14.8%) | $0 |
| 1 Earner | 6 (22.2%) | $0 |
| 2 Earners | 6 (22.2%) | $123,750 |
| 3+ Earners | 11 (40.7%) | $250,001 |
| Total | 27 (100.0%) | $123,125 |
Household Income in Longtown
Household Income Brackets in Longtown
With 9 households falling in the category, the $100,000 to $149,999 income range is the most frequent in Longtown, accounting for 22.5% of all households.
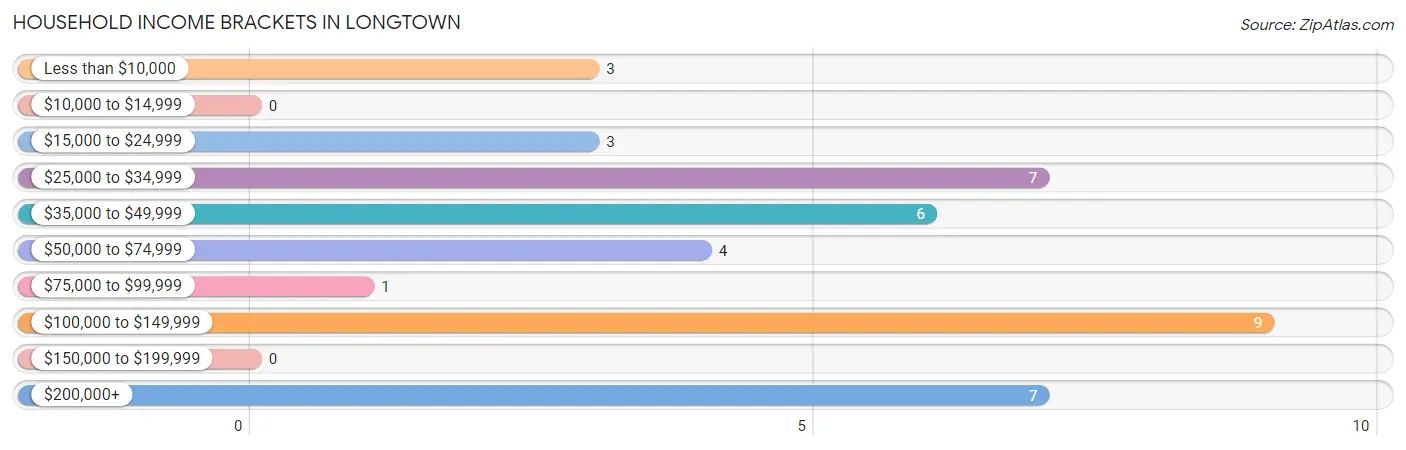
| Income Bracket | # Households | % Households |
| Less than $10,000 | 3 | 7.5% |
| $10,000 to $14,999 | 0 | 0.0% |
| $15,000 to $24,999 | 3 | 7.5% |
| $25,000 to $34,999 | 7 | 17.5% |
| $35,000 to $49,999 | 6 | 15.0% |
| $50,000 to $74,999 | 4 | 10.0% |
| $75,000 to $99,999 | 1 | 2.5% |
| $100,000 to $149,999 | 9 | 22.5% |
| $150,000 to $199,999 | 0 | 0.0% |
| $200,000+ | 7 | 17.5% |
Household Income by Householder Age in Longtown
The median household income in Longtown is $0, with the highest median household income of $111,250 found in the 25 to 44 years age bracket for the primary householder. A total of 5 households (12.5%) fall into this category. Meanwhile, the 15 to 24 years age bracket for the primary householder has the lowest median household income of $0, with 4 households (10.0%) in this group.
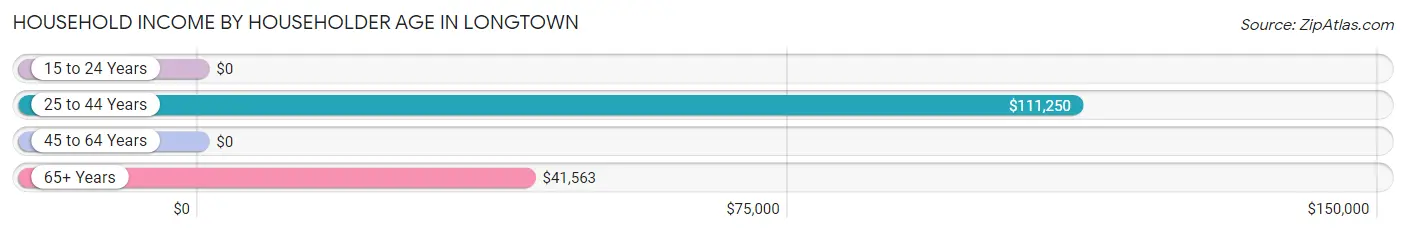
| Income Bracket | # Households | Median Income |
| 15 to 24 Years | 4 (10.0%) | $0 |
| 25 to 44 Years | 5 (12.5%) | $111,250 |
| 45 to 64 Years | 14 (35.0%) | $0 |
| 65+ Years | 17 (42.5%) | $41,563 |
| Total | 40 (100.0%) | $0 |
Poverty in Longtown
Income Below Poverty by Sex and Age in Longtown
With 10.3% poverty level for males and 6.5% for females among the residents of Longtown, 75 year old and over males and 75 year old and over females are the most vulnerable to poverty, with 2 males (50.0%) and 3 females (50.0%) in their respective age groups living below the poverty level.
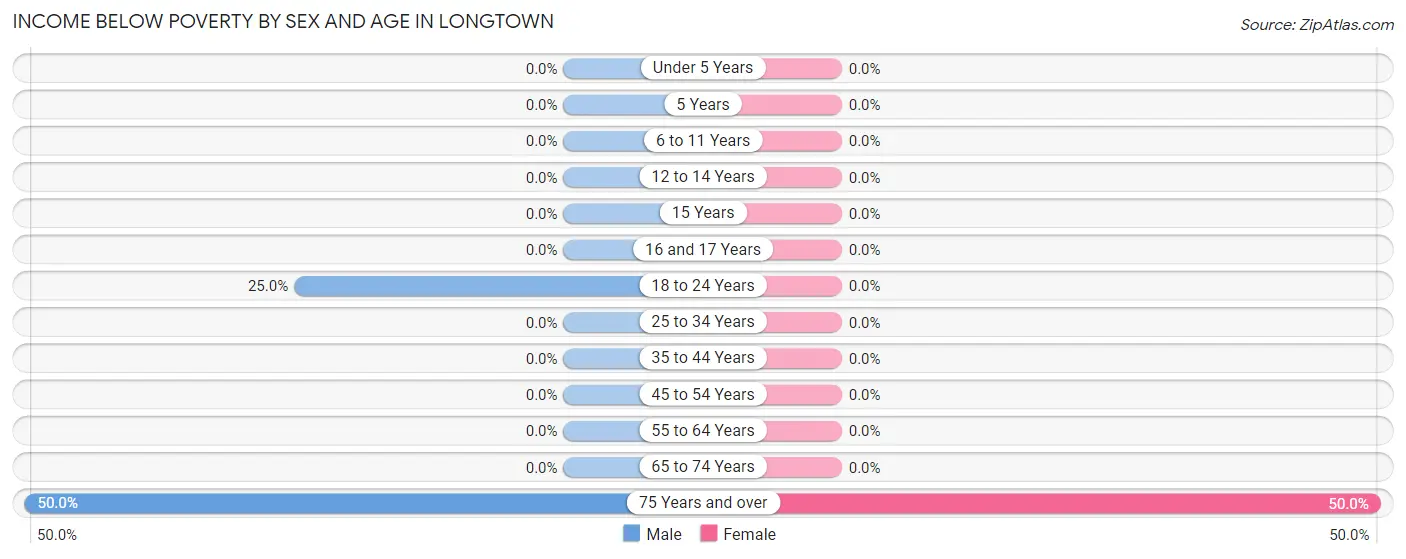
| Age Bracket | Male | Female |
| Under 5 Years | 0 (0.0%) | 0 (0.0%) |
| 5 Years | 0 (0.0%) | 0 (0.0%) |
| 6 to 11 Years | 0 (0.0%) | 0 (0.0%) |
| 12 to 14 Years | 0 (0.0%) | 0 (0.0%) |
| 15 Years | 0 (0.0%) | 0 (0.0%) |
| 16 and 17 Years | 0 (0.0%) | 0 (0.0%) |
| 18 to 24 Years | 4 (25.0%) | 0 (0.0%) |
| 25 to 34 Years | 0 (0.0%) | 0 (0.0%) |
| 35 to 44 Years | 0 (0.0%) | 0 (0.0%) |
| 45 to 54 Years | 0 (0.0%) | 0 (0.0%) |
| 55 to 64 Years | 0 (0.0%) | 0 (0.0%) |
| 65 to 74 Years | 0 (0.0%) | 0 (0.0%) |
| 75 Years and over | 2 (50.0%) | 3 (50.0%) |
| Total | 6 (10.3%) | 3 (6.5%) |
Income Above Poverty by Sex and Age in Longtown
According to the poverty statistics in Longtown, males aged under 5 years and females aged under 5 years are the age groups that are most secure financially, with 100.0% of males and 100.0% of females in these age groups living above the poverty line.
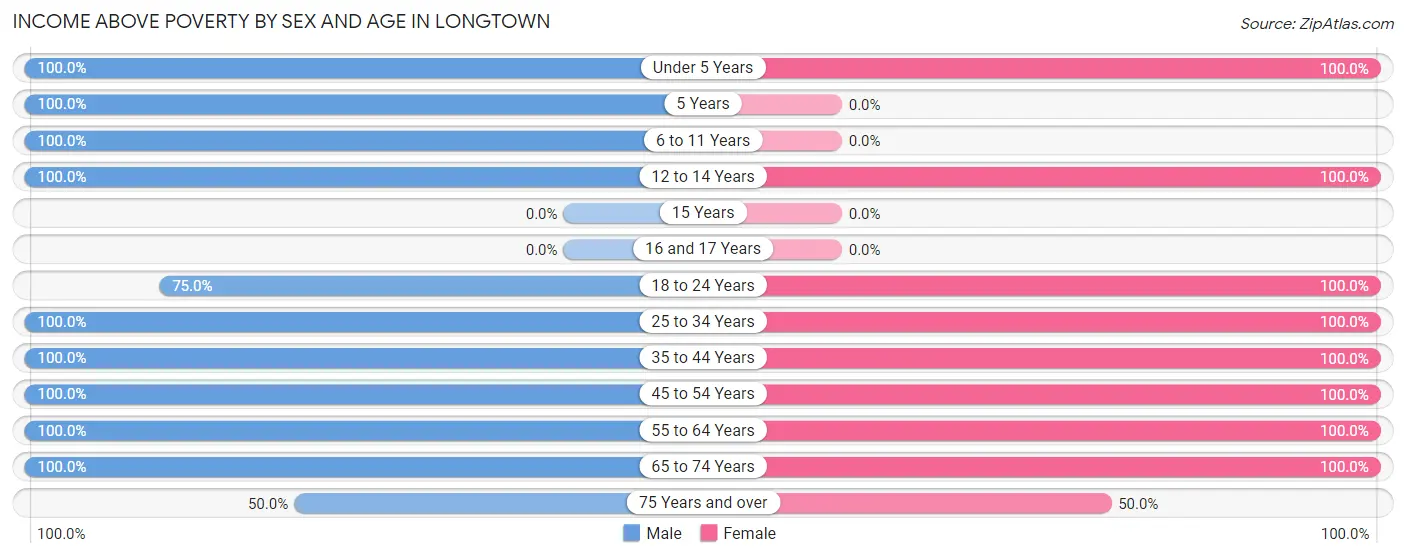
| Age Bracket | Male | Female |
| Under 5 Years | 2 (100.0%) | 1 (100.0%) |
| 5 Years | 2 (100.0%) | 0 (0.0%) |
| 6 to 11 Years | 6 (100.0%) | 0 (0.0%) |
| 12 to 14 Years | 2 (100.0%) | 2 (100.0%) |
| 15 Years | 0 (0.0%) | 0 (0.0%) |
| 16 and 17 Years | 0 (0.0%) | 0 (0.0%) |
| 18 to 24 Years | 12 (75.0%) | 14 (100.0%) |
| 25 to 34 Years | 2 (100.0%) | 2 (100.0%) |
| 35 to 44 Years | 2 (100.0%) | 7 (100.0%) |
| 45 to 54 Years | 9 (100.0%) | 3 (100.0%) |
| 55 to 64 Years | 7 (100.0%) | 4 (100.0%) |
| 65 to 74 Years | 6 (100.0%) | 7 (100.0%) |
| 75 Years and over | 2 (50.0%) | 3 (50.0%) |
| Total | 52 (89.7%) | 43 (93.5%) |
Income Below Poverty Among Married-Couple Families in Longtown
The poverty statistics for married-couple families in Longtown show that 12.5% or 3 of the total 24 families live below the poverty line. Families with no children have the highest poverty rate of 15.8%, comprising of 3 families. On the other hand, families with 1 or 2 children have the lowest poverty rate of 0.0%, which includes 0 families.
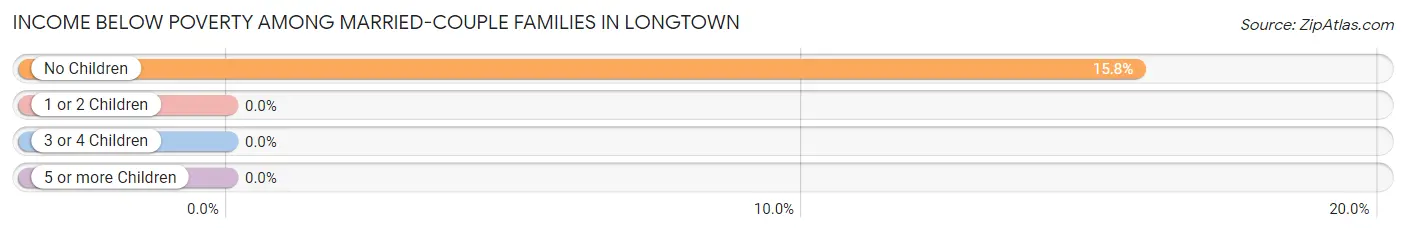
| Children | Above Poverty | Below Poverty |
| No Children | 16 (84.2%) | 3 (15.8%) |
| 1 or 2 Children | 4 (100.0%) | 0 (0.0%) |
| 3 or 4 Children | 0 (0.0%) | 0 (0.0%) |
| 5 or more Children | 1 (100.0%) | 0 (0.0%) |
| Total | 21 (87.5%) | 3 (12.5%) |
Income Below Poverty Among Single-Parent Households in Longtown
| Children | Single Father | Single Mother |
| No Children | 0 (0.0%) | 0 (0.0%) |
| 1 or 2 Children | 0 (0.0%) | 0 (0.0%) |
| 3 or 4 Children | 0 (0.0%) | 0 (0.0%) |
| 5 or more Children | 0 (0.0%) | 0 (0.0%) |
| Total | 0 (0.0%) | 0 (0.0%) |
Income Below Poverty Among Married-Couple vs Single-Parent Households in Longtown
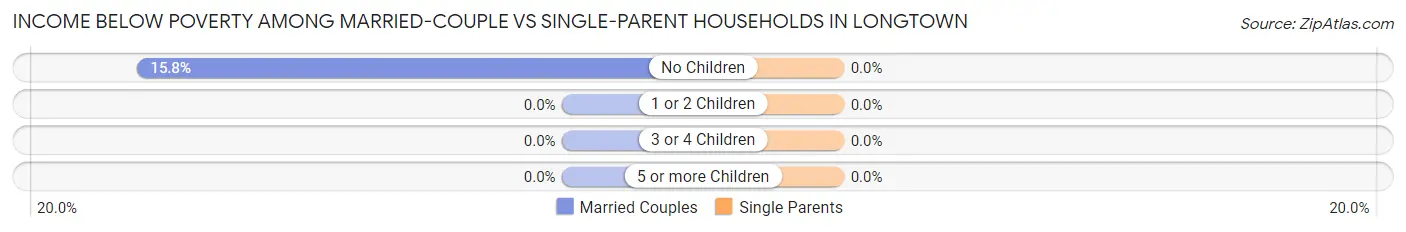
| Children | Married-Couple Families | Single-Parent Households |
| No Children | 3 (15.8%) | 0 (0.0%) |
| 1 or 2 Children | 0 (0.0%) | 0 (0.0%) |
| 3 or 4 Children | 0 (0.0%) | 0 (0.0%) |
| 5 or more Children | 0 (0.0%) | 0 (0.0%) |
| Total | 3 (12.5%) | 0 (0.0%) |
Race in Longtown
The most populous races in Longtown are White / Caucasian (102 | 98.1%), Hispanic or Latino (2 | 1.9%), and Two or more Races (2 | 1.9%).
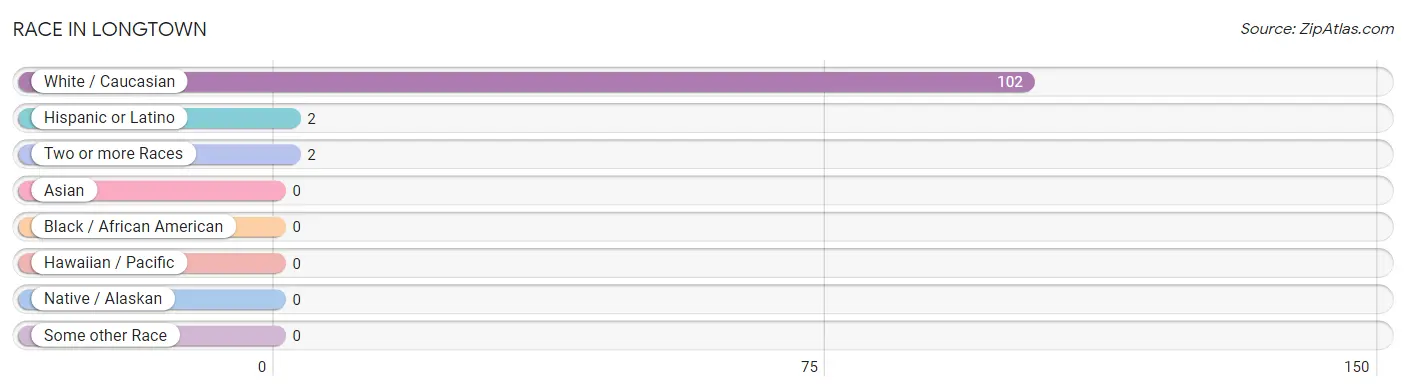
| Race | # Population | % Population |
| Asian | 0 | 0.0% |
| Black / African American | 0 | 0.0% |
| Hawaiian / Pacific | 0 | 0.0% |
| Hispanic or Latino | 2 | 1.9% |
| Native / Alaskan | 0 | 0.0% |
| White / Caucasian | 102 | 98.1% |
| Two or more Races | 2 | 1.9% |
| Some other Race | 0 | 0.0% |
| Total | 104 | 100.0% |
Ancestry in Longtown
The most populous ancestries reported in Longtown are German (54 | 51.9%), American (31 | 29.8%), French (27 | 26.0%), English (4 | 3.8%), and Irish (2 | 1.9%), together accounting for 113.5% of all Longtown residents.
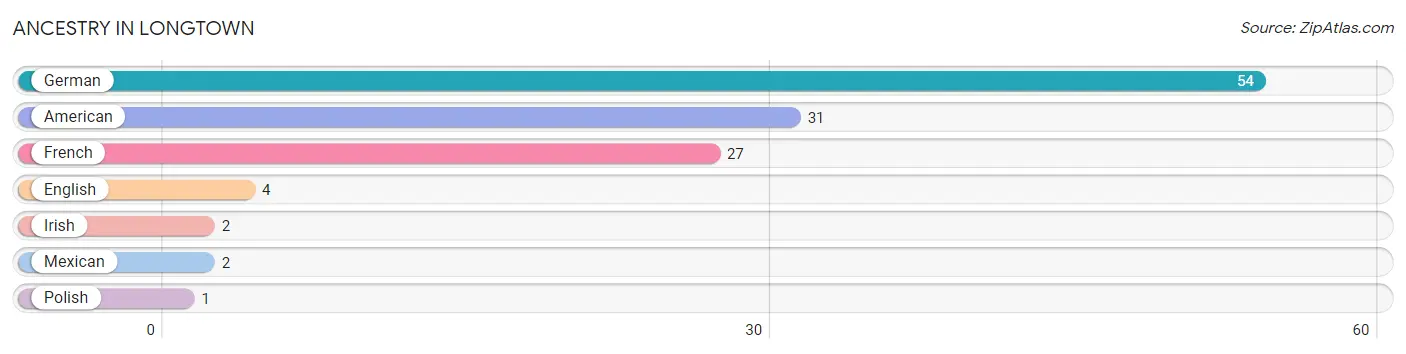
| Ancestry | # Population | % Population |
| American | 31 | 29.8% |
| English | 4 | 3.8% |
| French | 27 | 26.0% |
| German | 54 | 51.9% |
| Irish | 2 | 1.9% |
| Mexican | 2 | 1.9% |
| Polish | 1 | 1.0% | View All 7 Rows |
Immigrants in Longtown

| Immigration Origin | # Population | % Population | View All 0 Rows |
Sex and Age in Longtown
Sex and Age in Longtown
The most populous age groups in Longtown are 20 to 24 Years (16 | 27.6%) for men and 20 to 24 Years (9 | 19.6%) for women.
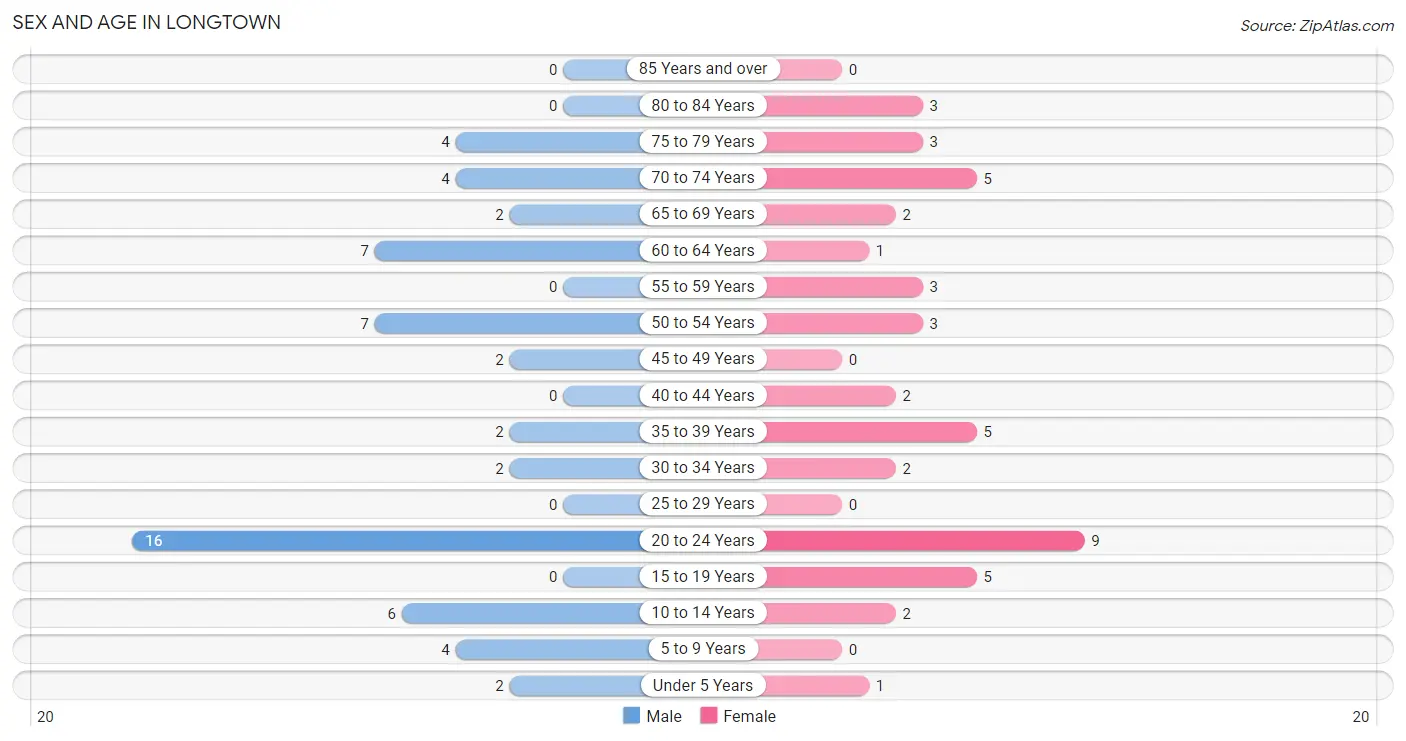
| Age Bracket | Male | Female |
| Under 5 Years | 2 (3.5%) | 1 (2.2%) |
| 5 to 9 Years | 4 (6.9%) | 0 (0.0%) |
| 10 to 14 Years | 6 (10.3%) | 2 (4.3%) |
| 15 to 19 Years | 0 (0.0%) | 5 (10.9%) |
| 20 to 24 Years | 16 (27.6%) | 9 (19.6%) |
| 25 to 29 Years | 0 (0.0%) | 0 (0.0%) |
| 30 to 34 Years | 2 (3.5%) | 2 (4.3%) |
| 35 to 39 Years | 2 (3.5%) | 5 (10.9%) |
| 40 to 44 Years | 0 (0.0%) | 2 (4.3%) |
| 45 to 49 Years | 2 (3.5%) | 0 (0.0%) |
| 50 to 54 Years | 7 (12.1%) | 3 (6.5%) |
| 55 to 59 Years | 0 (0.0%) | 3 (6.5%) |
| 60 to 64 Years | 7 (12.1%) | 1 (2.2%) |
| 65 to 69 Years | 2 (3.5%) | 2 (4.3%) |
| 70 to 74 Years | 4 (6.9%) | 5 (10.9%) |
| 75 to 79 Years | 4 (6.9%) | 3 (6.5%) |
| 80 to 84 Years | 0 (0.0%) | 3 (6.5%) |
| 85 Years and over | 0 (0.0%) | 0 (0.0%) |
| Total | 58 (100.0%) | 46 (100.0%) |
Families and Households in Longtown
Median Family Size in Longtown
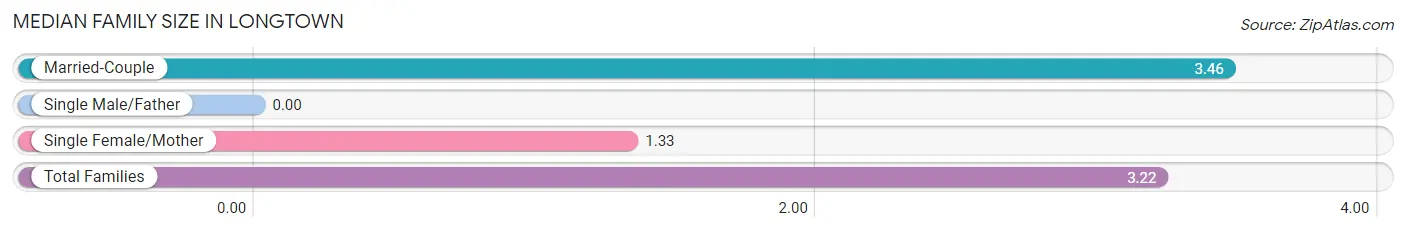
| Family Type | # Families | Family Size |
| Married-Couple | 24 (88.9%) | 3.46 |
| Single Male/Father | 0 (0.0%) | - |
| Single Female/Mother | 3 (11.1%) | 1.33 |
| Total Families | 27 (100.0%) | 3.22 |
Median Household Size in Longtown
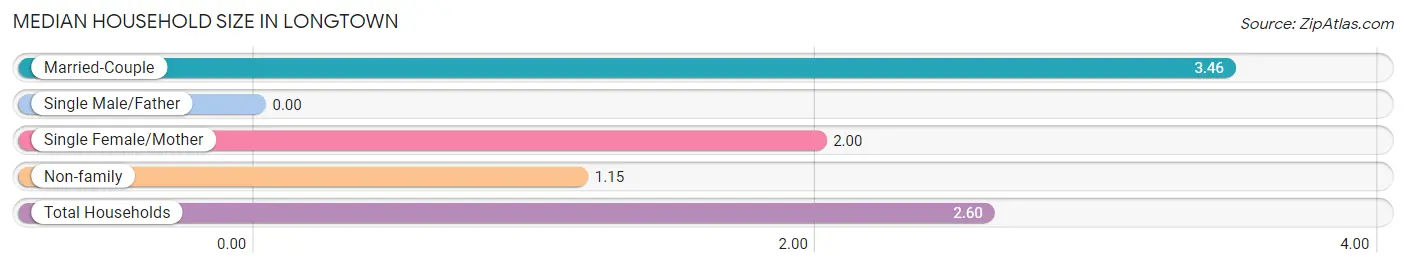
| Household Type | # Households | Household Size |
| Married-Couple | 24 (60.0%) | 3.46 |
| Single Male/Father | 0 (0.0%) | - |
| Single Female/Mother | 3 (7.5%) | 2.00 |
| Non-family | 13 (32.5%) | 1.15 |
| Total Households | 40 (100.0%) | 2.60 |
Household Size by Marriage Status in Longtown
Out of a total of 40 households in Longtown, 27 (67.5%) are family households, while 13 (32.5%) are nonfamily households. The most numerous type of family households are 2-person households, comprising 9, and the most common type of nonfamily households are 1-person households, comprising 12.
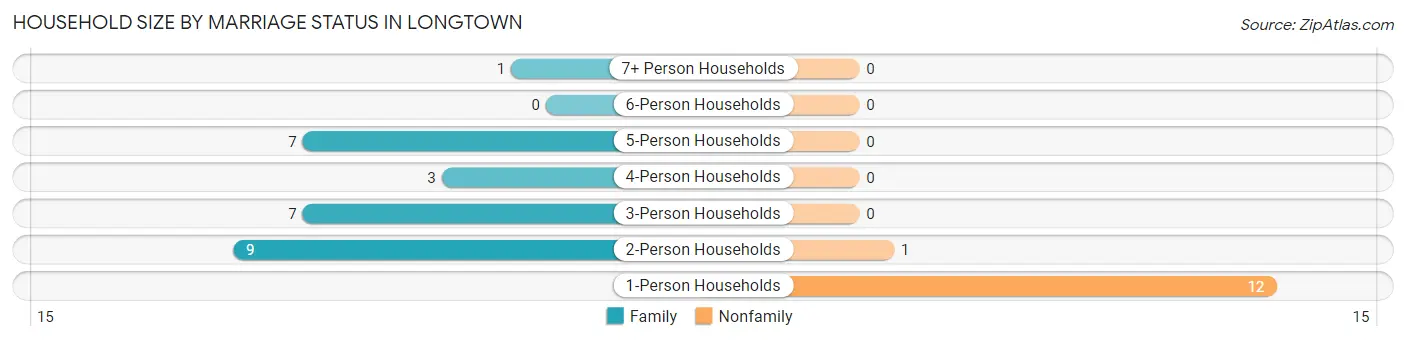
| Household Size | Family Households | Nonfamily Households |
| 1-Person Households | - | 12 (30.0%) |
| 2-Person Households | 9 (22.5%) | 1 (2.5%) |
| 3-Person Households | 7 (17.5%) | 0 (0.0%) |
| 4-Person Households | 3 (7.5%) | 0 (0.0%) |
| 5-Person Households | 7 (17.5%) | 0 (0.0%) |
| 6-Person Households | 0 (0.0%) | 0 (0.0%) |
| 7+ Person Households | 1 (2.5%) | 0 (0.0%) |
| Total | 27 (67.5%) | 13 (32.5%) |
Female Fertility in Longtown
Fertility by Age in Longtown
| Age Bracket | Women with Births | Births / 1,000 Women |
| 15 to 19 years | 0 (0.0%) | 0.0 |
| 20 to 34 years | 0 (0.0%) | 0.0 |
| 35 to 50 years | 0 (0.0%) | 0.0 |
| Total | 0 (0.0%) | 0.0 |
Fertility by Age by Marriage Status in Longtown
| Age Bracket | Married | Unmarried |
| 15 to 19 years | 0 (0.0%) | 0 (0.0%) |
| 20 to 34 years | 0 (0.0%) | 0 (0.0%) |
| 35 to 50 years | 0 (0.0%) | 0 (0.0%) |
| Total | 0 (0.0%) | 0 (0.0%) |
Fertility by Education in Longtown
| Educational Attainment | Women with Births | Births / 1,000 Women |
| Less than High School | 0 (0.0%) | 0.0 |
| High School Diploma | 0 (0.0%) | 0.0 |
| College or Associate's Degree | 0 (0.0%) | 0.0 |
| Bachelor's Degree | 0 (0.0%) | 0.0 |
| Graduate Degree | 0 (0.0%) | 0.0 |
| Total | 0 (0.0%) | 0.0 |
Fertility by Education by Marriage Status in Longtown
| Educational Attainment | Married | Unmarried |
| Less than High School | 0 (0.0%) | 0 (0.0%) |
| High School Diploma | 0 (0.0%) | 0 (0.0%) |
| College or Associate's Degree | 0 (0.0%) | 0 (0.0%) |
| Bachelor's Degree | 0 (0.0%) | 0 (0.0%) |
| Graduate Degree | 0 (0.0%) | 0 (0.0%) |
| Total | 0 (0.0%) | 0 (0.0%) |
Employment Characteristics in Longtown
Employment by Class of Employer in Longtown
Among the 64 employed individuals in Longtown, private company employees (52 | 81.2%), not-for-profit organizations (7 | 10.9%), and self-employed (not incorporated) (2 | 3.1%) make up the most common classes of employment.
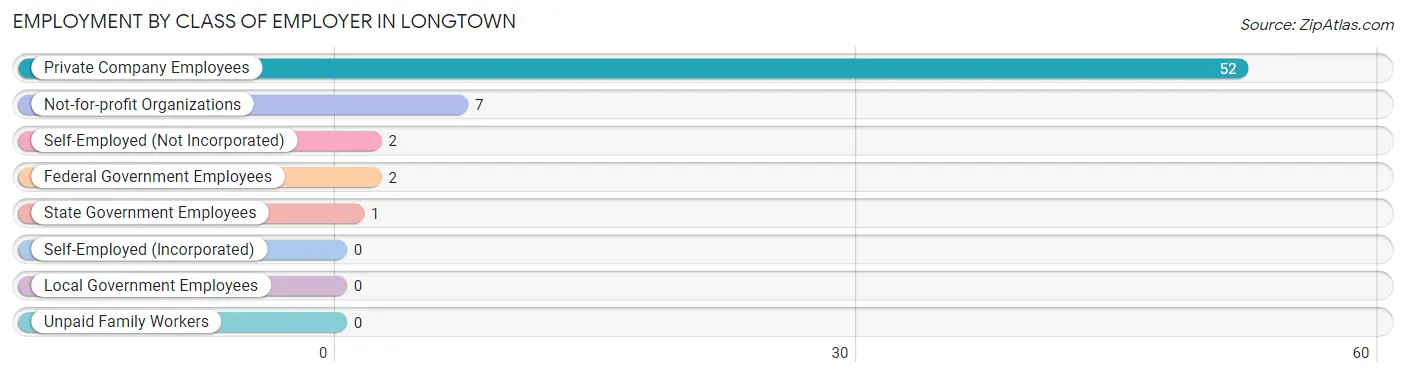
| Employer Class | # Employees | % Employees |
| Private Company Employees | 52 | 81.2% |
| Self-Employed (Incorporated) | 0 | 0.0% |
| Self-Employed (Not Incorporated) | 2 | 3.1% |
| Not-for-profit Organizations | 7 | 10.9% |
| Local Government Employees | 0 | 0.0% |
| State Government Employees | 1 | 1.6% |
| Federal Government Employees | 2 | 3.1% |
| Unpaid Family Workers | 0 | 0.0% |
| Total | 64 | 100.0% |
Employment Status by Age in Longtown
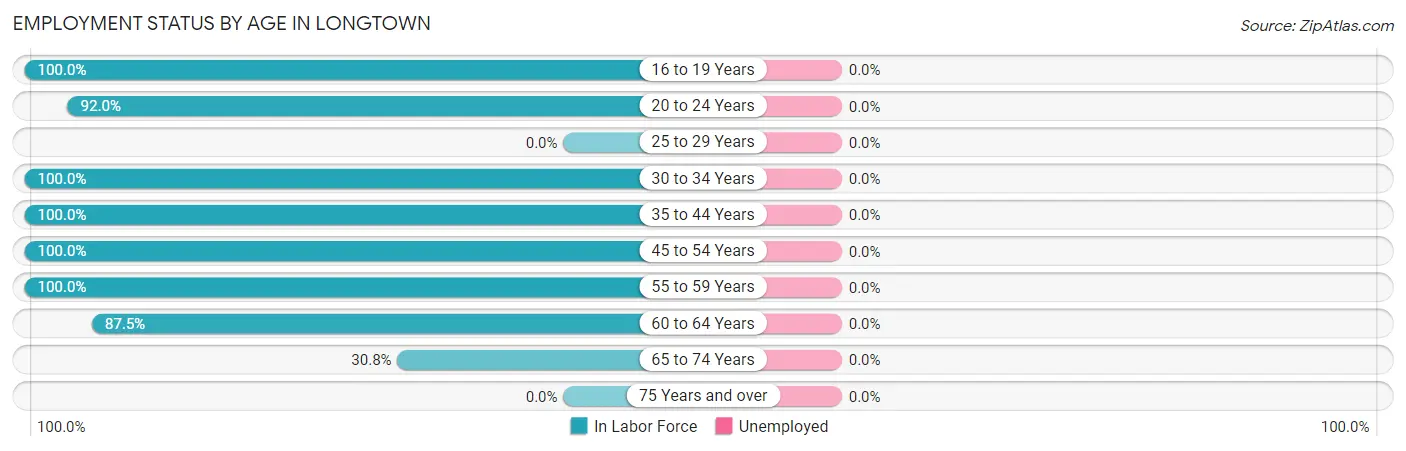
| Age Bracket | In Labor Force | Unemployed |
| 16 to 19 Years | 5 (100.0%) | 0 (0.0%) |
| 20 to 24 Years | 23 (92.0%) | 0 (0.0%) |
| 25 to 29 Years | 0 (0.0%) | 0 (0.0%) |
| 30 to 34 Years | 4 (100.0%) | 0 (0.0%) |
| 35 to 44 Years | 9 (100.0%) | 0 (0.0%) |
| 45 to 54 Years | 12 (100.0%) | 0 (0.0%) |
| 55 to 59 Years | 3 (100.0%) | 0 (0.0%) |
| 60 to 64 Years | 7 (87.5%) | 0 (0.0%) |
| 65 to 74 Years | 4 (30.8%) | 0 (0.0%) |
| 75 Years and over | 0 (0.0%) | 0 (0.0%) |
| Total | 67 (75.3%) | 0 (0.0%) |
Employment Status by Educational Attainment in Longtown
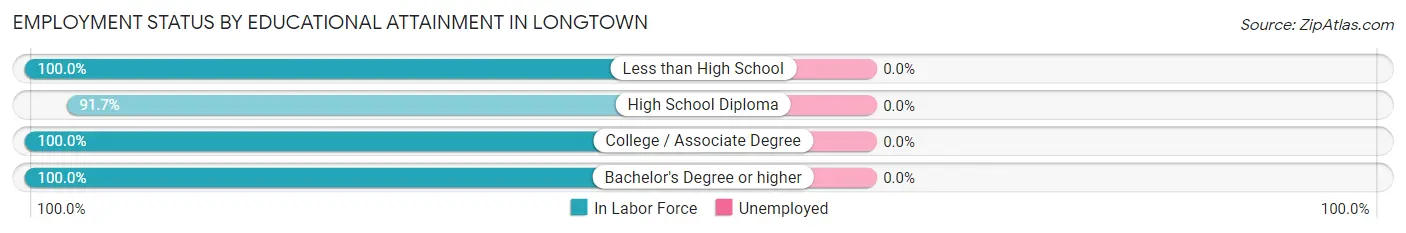
| Educational Attainment | In Labor Force | Unemployed |
| Less than High School | 4 (100.0%) | 0 (0.0%) |
| High School Diploma | 11 (91.7%) | 0 (0.0%) |
| College / Associate Degree | 19 (100.0%) | 0 (0.0%) |
| Bachelor's Degree or higher | 1 (100.0%) | 0 (0.0%) |
| Total | 35 (97.2%) | 0 (0.0%) |
Employment Occupations by Sex in Longtown
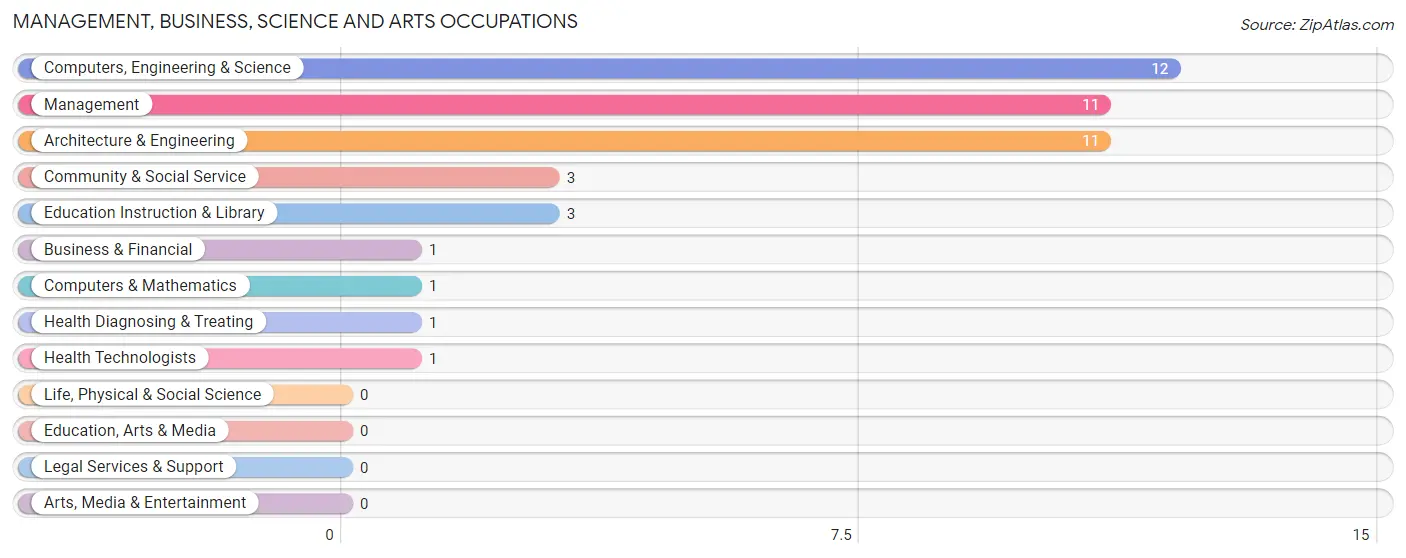
Management, Business, Science and Arts Occupations
The most common Management, Business, Science and Arts occupations in Longtown are Computers, Engineering & Science (12 | 18.5%), Management (11 | 16.9%), Architecture & Engineering (11 | 16.9%), Community & Social Service (3 | 4.6%), and Education Instruction & Library (3 | 4.6%).
Management, Business, Science and Arts Occupations by Sex
Within the Management, Business, Science and Arts occupations in Longtown, the most male-oriented occupations are Architecture & Engineering (100.0%), Computers, Engineering & Science (91.7%), and Management (90.9%), while the most female-oriented occupations are Business & Financial (100.0%), Computers & Mathematics (100.0%), and Community & Social Service (100.0%).
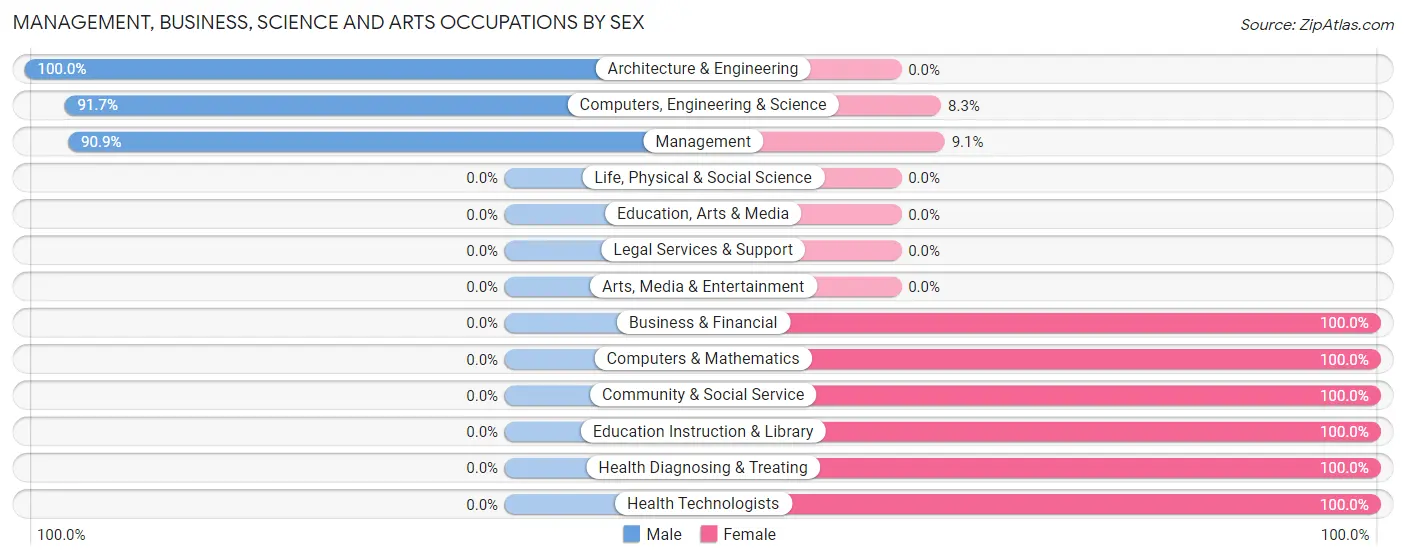
| Occupation | Male | Female |
| Management | 10 (90.9%) | 1 (9.1%) |
| Business & Financial | 0 (0.0%) | 1 (100.0%) |
| Computers, Engineering & Science | 11 (91.7%) | 1 (8.3%) |
| Computers & Mathematics | 0 (0.0%) | 1 (100.0%) |
| Architecture & Engineering | 11 (100.0%) | 0 (0.0%) |
| Life, Physical & Social Science | 0 (0.0%) | 0 (0.0%) |
| Community & Social Service | 0 (0.0%) | 3 (100.0%) |
| Education, Arts & Media | 0 (0.0%) | 0 (0.0%) |
| Legal Services & Support | 0 (0.0%) | 0 (0.0%) |
| Education Instruction & Library | 0 (0.0%) | 3 (100.0%) |
| Arts, Media & Entertainment | 0 (0.0%) | 0 (0.0%) |
| Health Diagnosing & Treating | 0 (0.0%) | 1 (100.0%) |
| Health Technologists | 0 (0.0%) | 1 (100.0%) |
| Total (Category) | 21 (75.0%) | 7 (25.0%) |
| Total (Overall) | 33 (50.8%) | 32 (49.2%) |
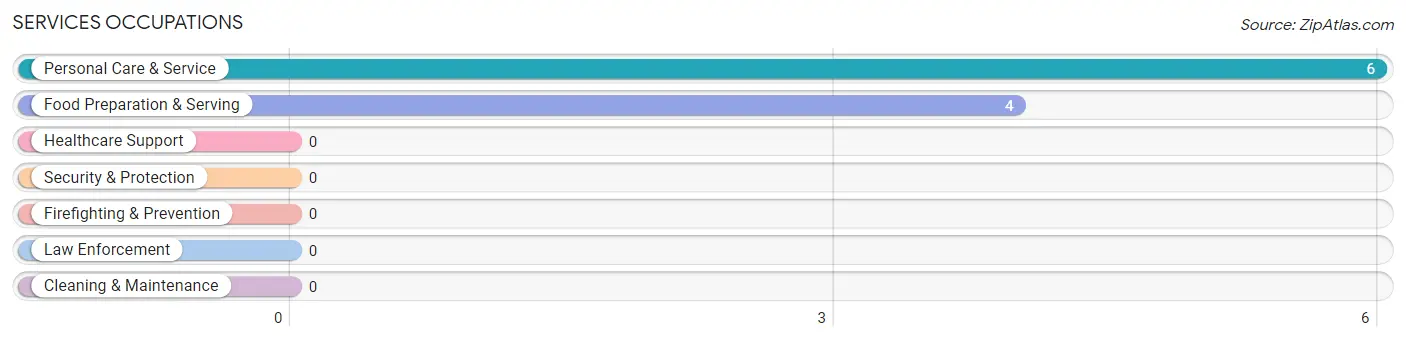
Services Occupations
The most common Services occupations in Longtown are Personal Care & Service (6 | 9.2%), and Food Preparation & Serving (4 | 6.1%).
Services Occupations by Sex
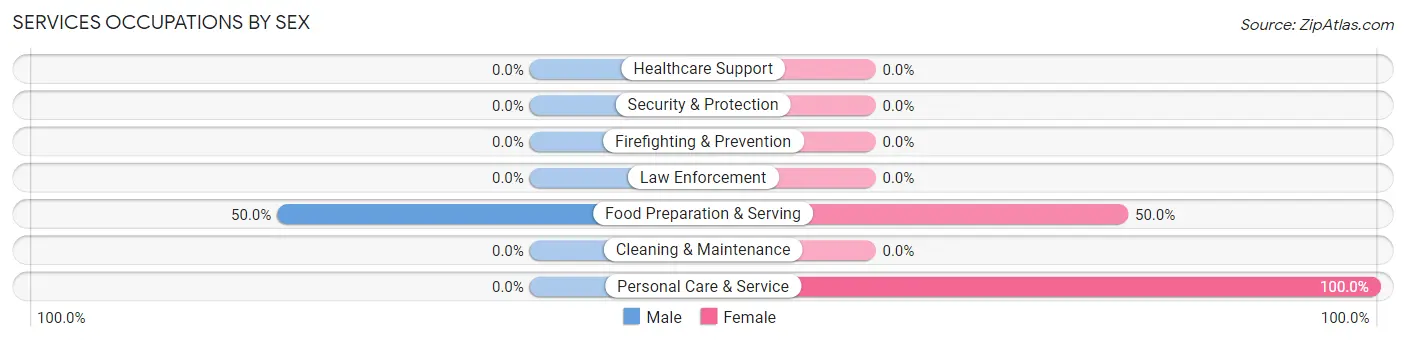
| Occupation | Male | Female |
| Healthcare Support | 0 (0.0%) | 0 (0.0%) |
| Security & Protection | 0 (0.0%) | 0 (0.0%) |
| Firefighting & Prevention | 0 (0.0%) | 0 (0.0%) |
| Law Enforcement | 0 (0.0%) | 0 (0.0%) |
| Food Preparation & Serving | 2 (50.0%) | 2 (50.0%) |
| Cleaning & Maintenance | 0 (0.0%) | 0 (0.0%) |
| Personal Care & Service | 0 (0.0%) | 6 (100.0%) |
| Total (Category) | 2 (20.0%) | 8 (80.0%) |
| Total (Overall) | 33 (50.8%) | 32 (49.2%) |
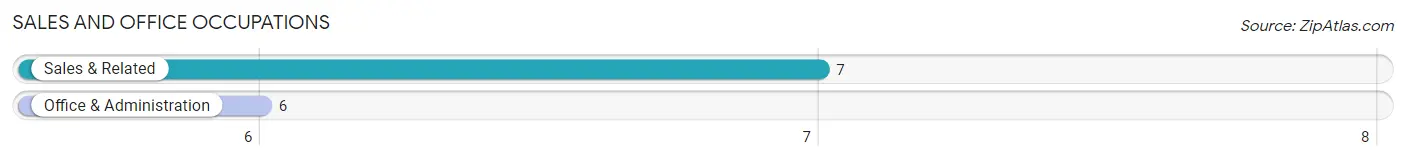
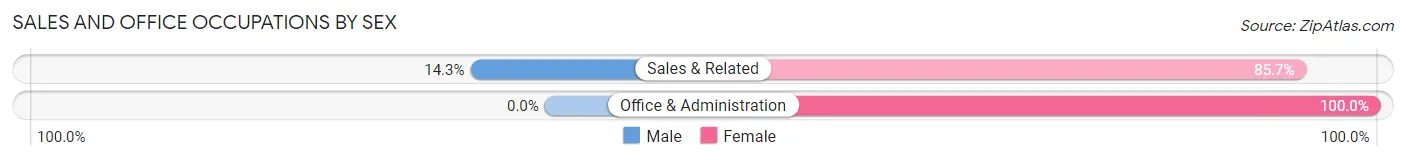
Sales and Office Occupations
The most common Sales and Office occupations in Longtown are Sales & Related (7 | 10.8%), and Office & Administration (6 | 9.2%).
Sales and Office Occupations by Sex
| Occupation | Male | Female |
| Sales & Related | 1 (14.3%) | 6 (85.7%) |
| Office & Administration | 0 (0.0%) | 6 (100.0%) |
| Total (Category) | 1 (7.7%) | 12 (92.3%) |
| Total (Overall) | 33 (50.8%) | 32 (49.2%) |
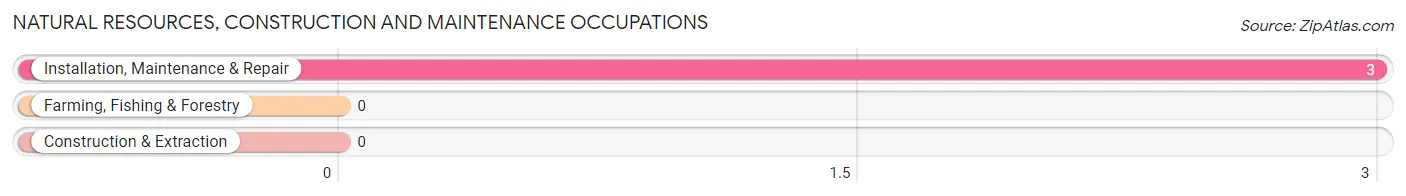
Natural Resources, Construction and Maintenance Occupations
The most common Natural Resources, Construction and Maintenance occupations in Longtown are , and Installation, Maintenance & Repair (3 | 4.6%).
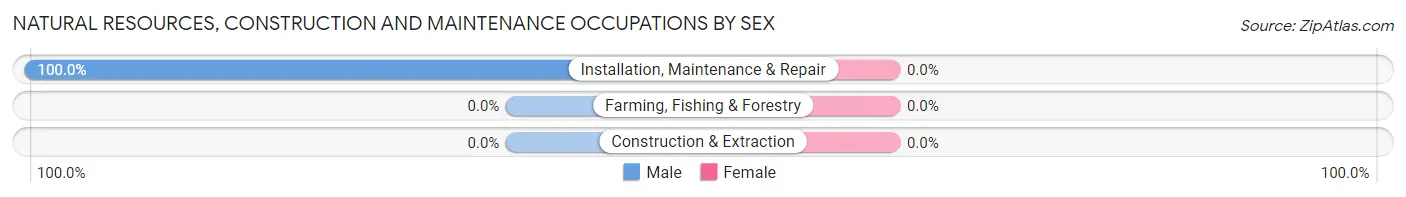
Natural Resources, Construction and Maintenance Occupations by Sex
| Occupation | Male | Female |
| Farming, Fishing & Forestry | 0 (0.0%) | 0 (0.0%) |
| Construction & Extraction | 0 (0.0%) | 0 (0.0%) |
| Installation, Maintenance & Repair | 3 (100.0%) | 0 (0.0%) |
| Total (Category) | 3 (100.0%) | 0 (0.0%) |
| Total (Overall) | 33 (50.8%) | 32 (49.2%) |
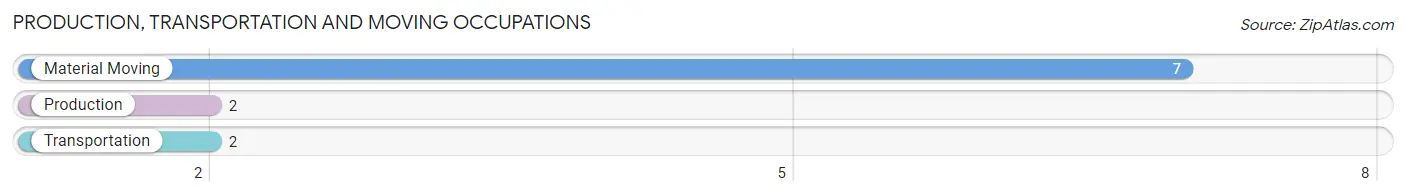
Production, Transportation and Moving Occupations
The most common Production, Transportation and Moving occupations in Longtown are Material Moving (7 | 10.8%), Production (2 | 3.1%), and Transportation (2 | 3.1%).
Production, Transportation and Moving Occupations by Sex
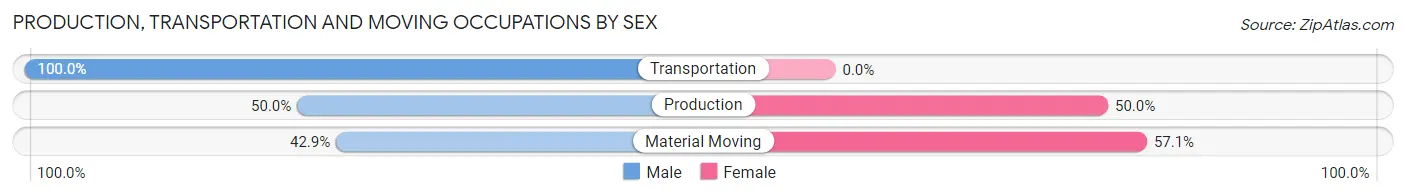
| Occupation | Male | Female |
| Production | 1 (50.0%) | 1 (50.0%) |
| Transportation | 2 (100.0%) | 0 (0.0%) |
| Material Moving | 3 (42.9%) | 4 (57.1%) |
| Total (Category) | 6 (54.5%) | 5 (45.5%) |
| Total (Overall) | 33 (50.8%) | 32 (49.2%) |
Employment Industries by Sex in Longtown
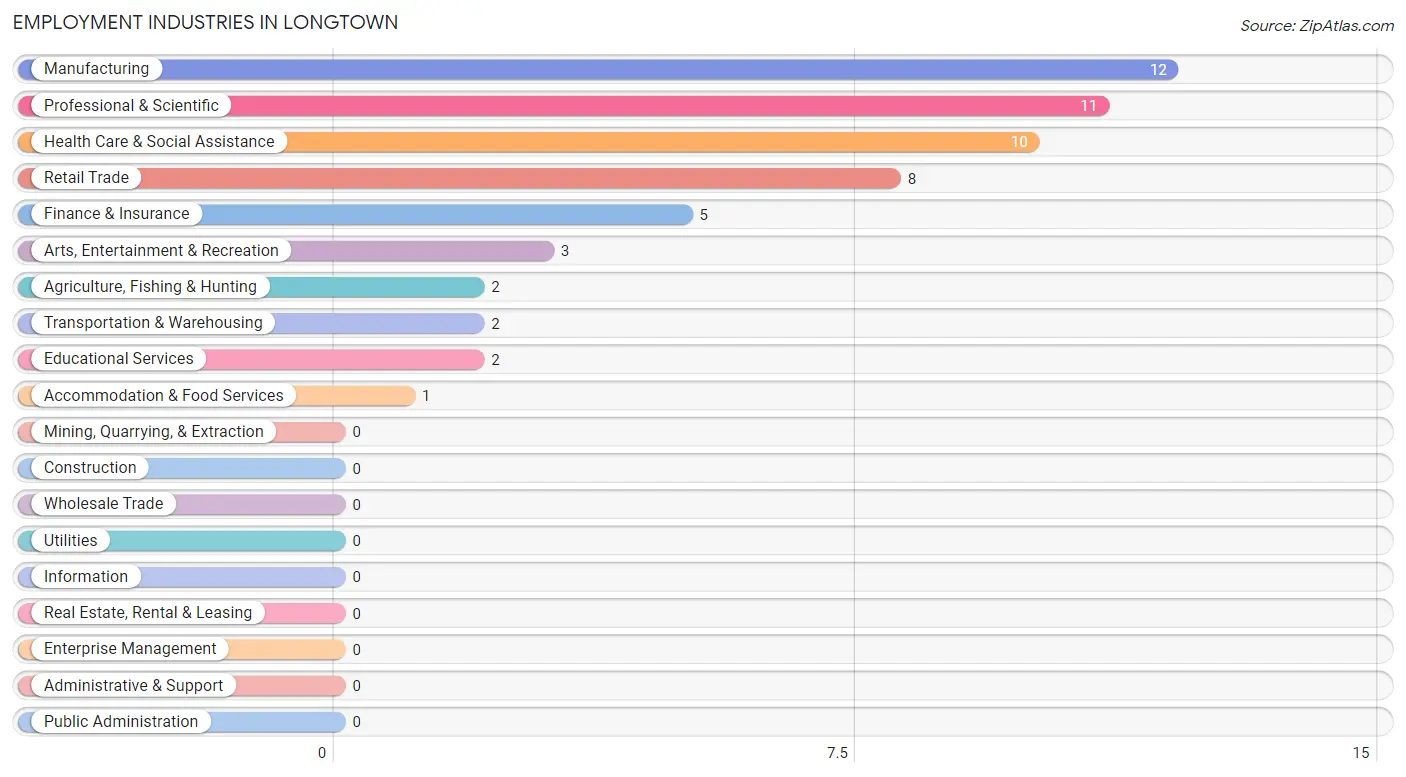
Employment Industries in Longtown
The major employment industries in Longtown include Manufacturing (12 | 18.5%), Professional & Scientific (11 | 16.9%), Health Care & Social Assistance (10 | 15.4%), Retail Trade (8 | 12.3%), and Finance & Insurance (5 | 7.7%).
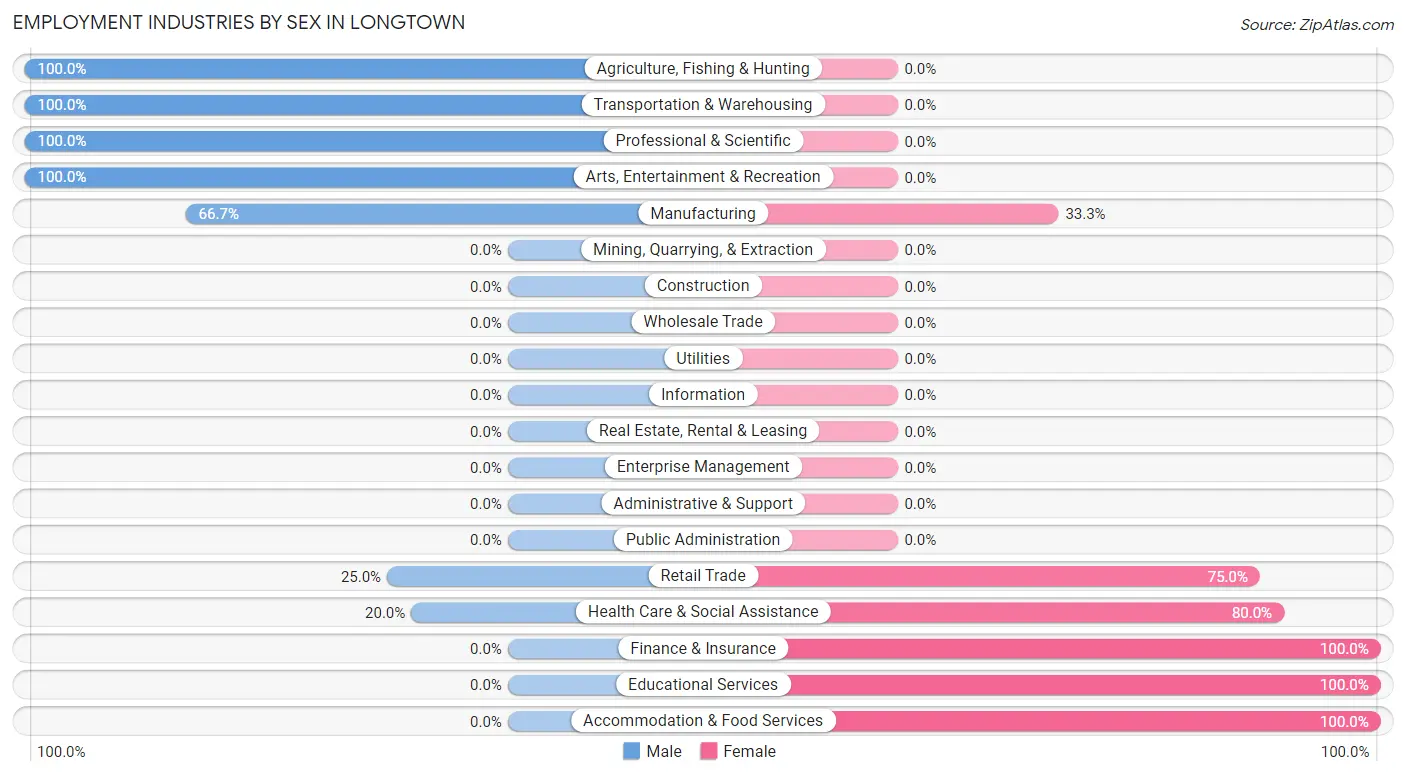
Employment Industries by Sex in Longtown
The Longtown industries that see more men than women are Agriculture, Fishing & Hunting (100.0%), Transportation & Warehousing (100.0%), and Professional & Scientific (100.0%), whereas the industries that tend to have a higher number of women are Finance & Insurance (100.0%), Educational Services (100.0%), and Accommodation & Food Services (100.0%).
| Industry | Male | Female |
| Agriculture, Fishing & Hunting | 2 (100.0%) | 0 (0.0%) |
| Mining, Quarrying, & Extraction | 0 (0.0%) | 0 (0.0%) |
| Construction | 0 (0.0%) | 0 (0.0%) |
| Manufacturing | 8 (66.7%) | 4 (33.3%) |
| Wholesale Trade | 0 (0.0%) | 0 (0.0%) |
| Retail Trade | 2 (25.0%) | 6 (75.0%) |
| Transportation & Warehousing | 2 (100.0%) | 0 (0.0%) |
| Utilities | 0 (0.0%) | 0 (0.0%) |
| Information | 0 (0.0%) | 0 (0.0%) |
| Finance & Insurance | 0 (0.0%) | 5 (100.0%) |
| Real Estate, Rental & Leasing | 0 (0.0%) | 0 (0.0%) |
| Professional & Scientific | 11 (100.0%) | 0 (0.0%) |
| Enterprise Management | 0 (0.0%) | 0 (0.0%) |
| Administrative & Support | 0 (0.0%) | 0 (0.0%) |
| Educational Services | 0 (0.0%) | 2 (100.0%) |
| Health Care & Social Assistance | 2 (20.0%) | 8 (80.0%) |
| Arts, Entertainment & Recreation | 3 (100.0%) | 0 (0.0%) |
| Accommodation & Food Services | 0 (0.0%) | 1 (100.0%) |
| Public Administration | 0 (0.0%) | 0 (0.0%) |
| Total | 33 (50.8%) | 32 (49.2%) |
Education in Longtown
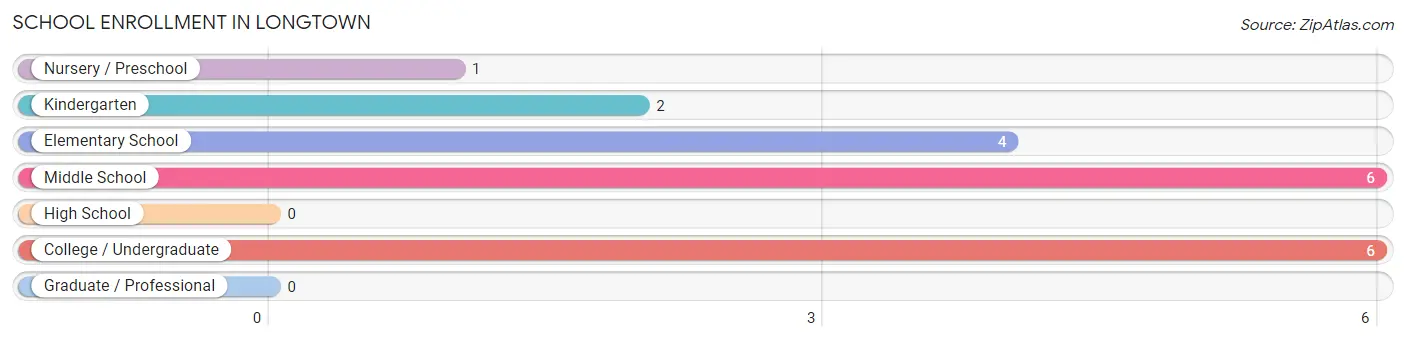
School Enrollment in Longtown
The most common levels of schooling among the 19 students in Longtown are middle school (6 | 31.6%), college / undergraduate (6 | 31.6%), and elementary school (4 | 21.0%).
| School Level | # Students | % Students |
| Nursery / Preschool | 1 | 5.3% |
| Kindergarten | 2 | 10.5% |
| Elementary School | 4 | 21.0% |
| Middle School | 6 | 31.6% |
| High School | 0 | 0.0% |
| College / Undergraduate | 6 | 31.6% |
| Graduate / Professional | 0 | 0.0% |
| Total | 19 | 100.0% |
School Enrollment by Age by Funding Source in Longtown
Out of a total of 19 students who are enrolled in schools in Longtown, 11 (57.9%) attend a private institution, while the remaining 8 (42.1%) are enrolled in public schools. The age group of 3 to 4 year olds has the highest likelihood of being enrolled in private schools, with 1 (100.0% in the age bracket) enrolled. Conversely, the age group of 18 to 19 year olds has the lowest likelihood of being enrolled in a private school, with 1 (100.0% in the age bracket) attending a public institution.
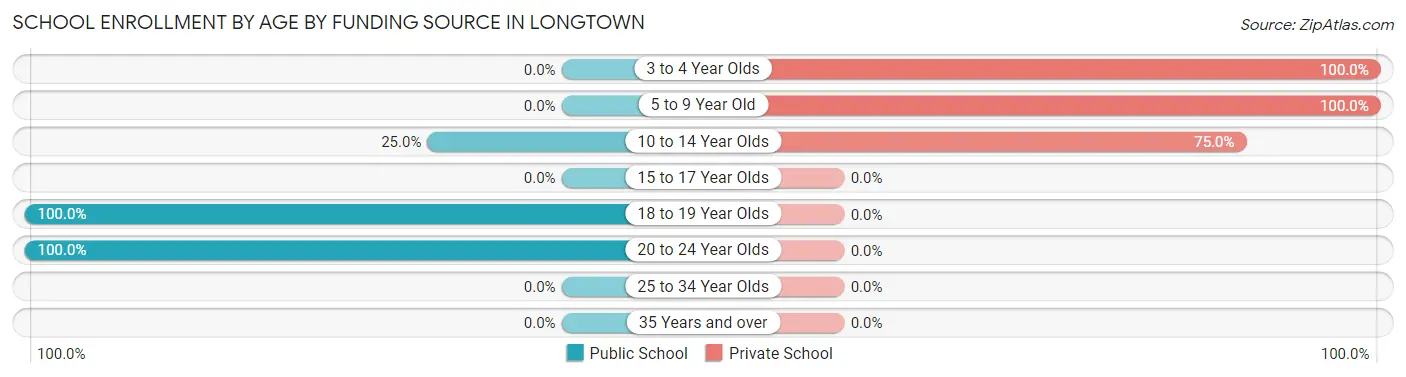
| Age Bracket | Public School | Private School |
| 3 to 4 Year Olds | 0 (0.0%) | 1 (100.0%) |
| 5 to 9 Year Old | 0 (0.0%) | 4 (100.0%) |
| 10 to 14 Year Olds | 2 (25.0%) | 6 (75.0%) |
| 15 to 17 Year Olds | 0 (0.0%) | 0 (0.0%) |
| 18 to 19 Year Olds | 1 (100.0%) | 0 (0.0%) |
| 20 to 24 Year Olds | 5 (100.0%) | 0 (0.0%) |
| 25 to 34 Year Olds | 0 (0.0%) | 0 (0.0%) |
| 35 Years and over | 0 (0.0%) | 0 (0.0%) |
| Total | 8 (42.1%) | 11 (57.9%) |
Educational Attainment by Field of Study in Longtown
Education (5 | 83.3%), and business (1 | 16.7%) are the most common fields of study among 6 individuals in Longtown who have obtained a bachelor's degree or higher.
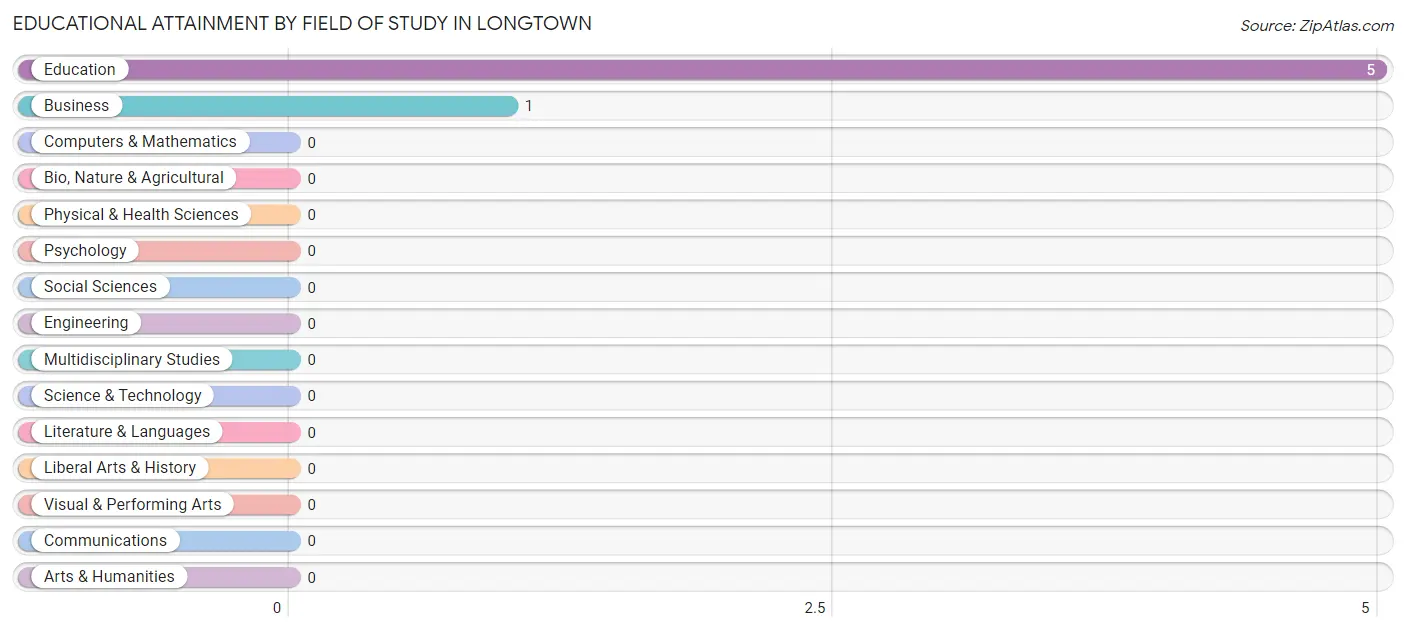
| Field of Study | # Graduates | % Graduates |
| Computers & Mathematics | 0 | 0.0% |
| Bio, Nature & Agricultural | 0 | 0.0% |
| Physical & Health Sciences | 0 | 0.0% |
| Psychology | 0 | 0.0% |
| Social Sciences | 0 | 0.0% |
| Engineering | 0 | 0.0% |
| Multidisciplinary Studies | 0 | 0.0% |
| Science & Technology | 0 | 0.0% |
| Business | 1 | 16.7% |
| Education | 5 | 83.3% |
| Literature & Languages | 0 | 0.0% |
| Liberal Arts & History | 0 | 0.0% |
| Visual & Performing Arts | 0 | 0.0% |
| Communications | 0 | 0.0% |
| Arts & Humanities | 0 | 0.0% |
| Total | 6 | 100.0% |
Transportation & Commute in Longtown
Vehicle Availability by Sex in Longtown
The most prevalent vehicle ownership categories in Longtown are males with 5 or more vehicles (18, accounting for 51.4%) and females with 5 or more vehicles (13, making up 62.1%).
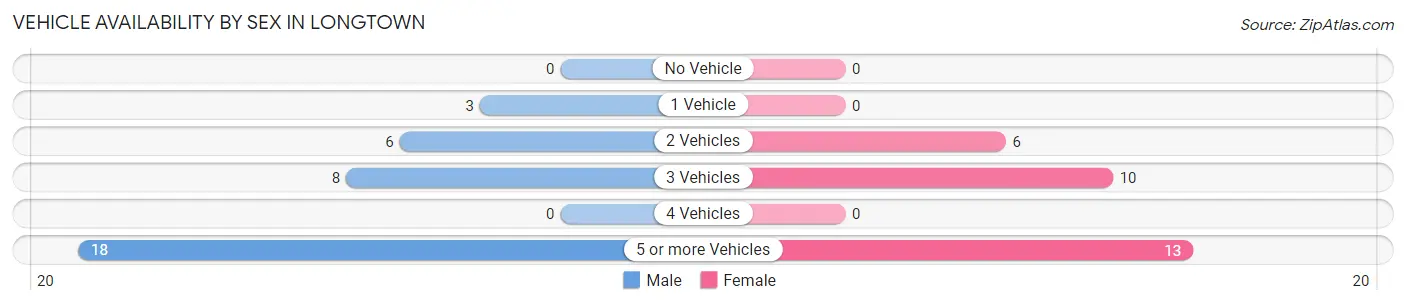
| Vehicles Available | Male | Female |
| No Vehicle | 0 (0.0%) | 0 (0.0%) |
| 1 Vehicle | 3 (8.6%) | 0 (0.0%) |
| 2 Vehicles | 6 (17.1%) | 6 (20.7%) |
| 3 Vehicles | 8 (22.9%) | 10 (34.5%) |
| 4 Vehicles | 0 (0.0%) | 0 (0.0%) |
| 5 or more Vehicles | 18 (51.4%) | 13 (44.8%) |
| Total | 35 (100.0%) | 29 (100.0%) |
Commute Time in Longtown
The most frequently occuring commute durations in Longtown are 10 to 14 minutes (29 commuters, 45.3%), 20 to 24 minutes (13 commuters, 20.3%), and 45 to 59 minutes (7 commuters, 10.9%).
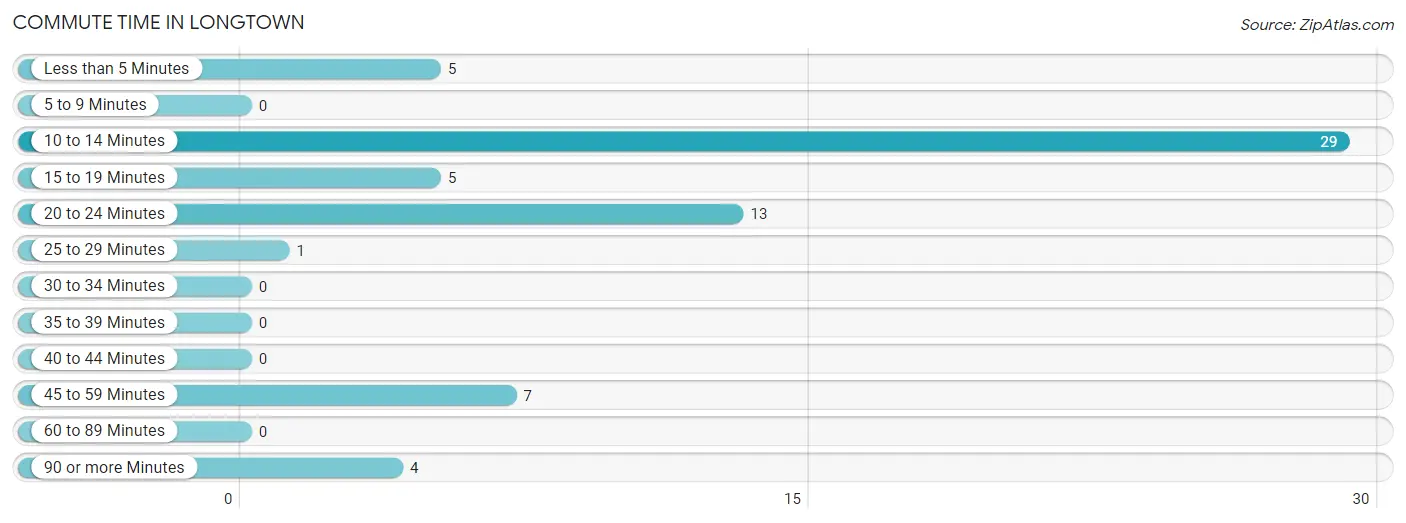
| Commute Time | # Commuters | % Commuters |
| Less than 5 Minutes | 5 | 7.8% |
| 5 to 9 Minutes | 0 | 0.0% |
| 10 to 14 Minutes | 29 | 45.3% |
| 15 to 19 Minutes | 5 | 7.8% |
| 20 to 24 Minutes | 13 | 20.3% |
| 25 to 29 Minutes | 1 | 1.6% |
| 30 to 34 Minutes | 0 | 0.0% |
| 35 to 39 Minutes | 0 | 0.0% |
| 40 to 44 Minutes | 0 | 0.0% |
| 45 to 59 Minutes | 7 | 10.9% |
| 60 to 89 Minutes | 0 | 0.0% |
| 90 or more Minutes | 4 | 6.2% |
Commute Time by Sex in Longtown
The most common commute times in Longtown are 10 to 14 minutes (18 commuters, 51.4%) for males and 10 to 14 minutes (11 commuters, 37.9%) for females.
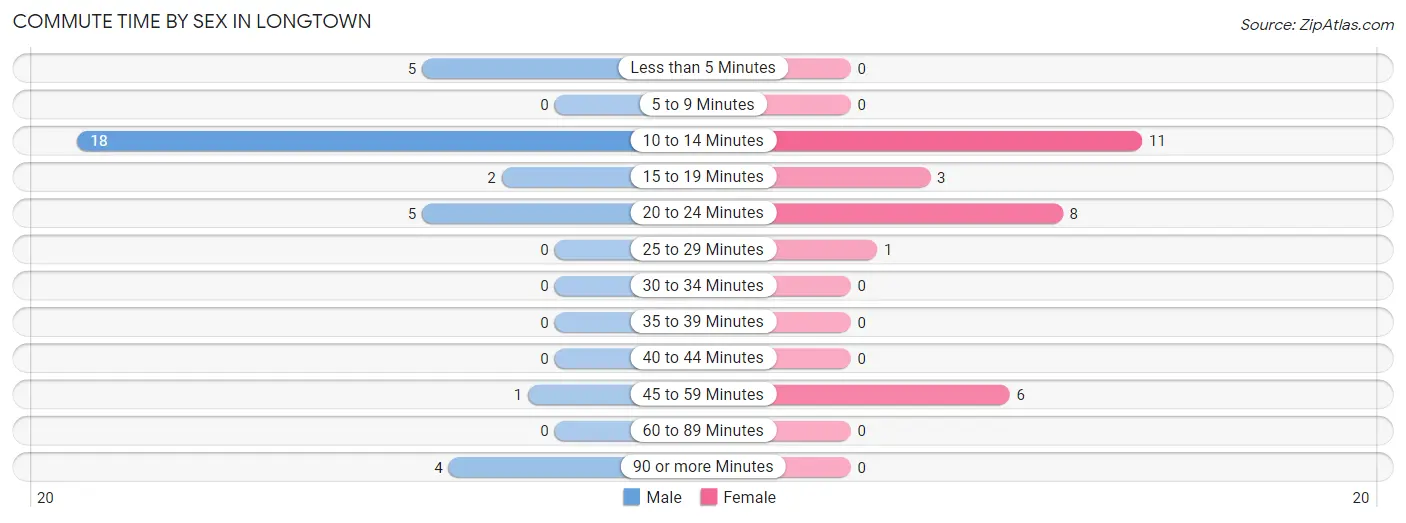
| Commute Time | Male | Female |
| Less than 5 Minutes | 5 (14.3%) | 0 (0.0%) |
| 5 to 9 Minutes | 0 (0.0%) | 0 (0.0%) |
| 10 to 14 Minutes | 18 (51.4%) | 11 (37.9%) |
| 15 to 19 Minutes | 2 (5.7%) | 3 (10.3%) |
| 20 to 24 Minutes | 5 (14.3%) | 8 (27.6%) |
| 25 to 29 Minutes | 0 (0.0%) | 1 (3.5%) |
| 30 to 34 Minutes | 0 (0.0%) | 0 (0.0%) |
| 35 to 39 Minutes | 0 (0.0%) | 0 (0.0%) |
| 40 to 44 Minutes | 0 (0.0%) | 0 (0.0%) |
| 45 to 59 Minutes | 1 (2.9%) | 6 (20.7%) |
| 60 to 89 Minutes | 0 (0.0%) | 0 (0.0%) |
| 90 or more Minutes | 4 (11.4%) | 0 (0.0%) |
Time of Departure to Work by Sex in Longtown
The most frequent times of departure to work in Longtown are 7:30 AM to 7:59 AM (15, 42.9%) for males and 7:00 AM to 7:29 AM (15, 51.7%) for females.
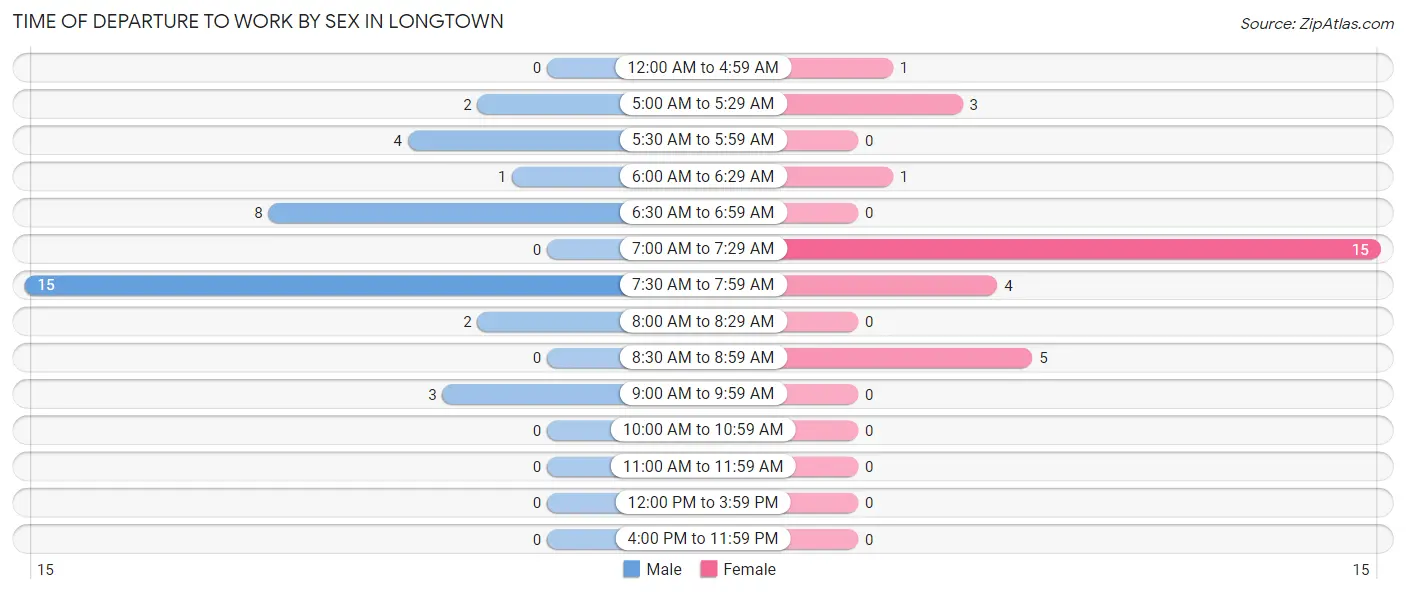
| Time of Departure | Male | Female |
| 12:00 AM to 4:59 AM | 0 (0.0%) | 1 (3.5%) |
| 5:00 AM to 5:29 AM | 2 (5.7%) | 3 (10.3%) |
| 5:30 AM to 5:59 AM | 4 (11.4%) | 0 (0.0%) |
| 6:00 AM to 6:29 AM | 1 (2.9%) | 1 (3.5%) |
| 6:30 AM to 6:59 AM | 8 (22.9%) | 0 (0.0%) |
| 7:00 AM to 7:29 AM | 0 (0.0%) | 15 (51.7%) |
| 7:30 AM to 7:59 AM | 15 (42.9%) | 4 (13.8%) |
| 8:00 AM to 8:29 AM | 2 (5.7%) | 0 (0.0%) |
| 8:30 AM to 8:59 AM | 0 (0.0%) | 5 (17.2%) |
| 9:00 AM to 9:59 AM | 3 (8.6%) | 0 (0.0%) |
| 10:00 AM to 10:59 AM | 0 (0.0%) | 0 (0.0%) |
| 11:00 AM to 11:59 AM | 0 (0.0%) | 0 (0.0%) |
| 12:00 PM to 3:59 PM | 0 (0.0%) | 0 (0.0%) |
| 4:00 PM to 11:59 PM | 0 (0.0%) | 0 (0.0%) |
| Total | 35 (100.0%) | 29 (100.0%) |
Housing Occupancy in Longtown
Occupancy by Ownership in Longtown
Of the total 40 dwellings in Longtown, owner-occupied units account for 34 (85.0%), while renter-occupied units make up 6 (15.0%).
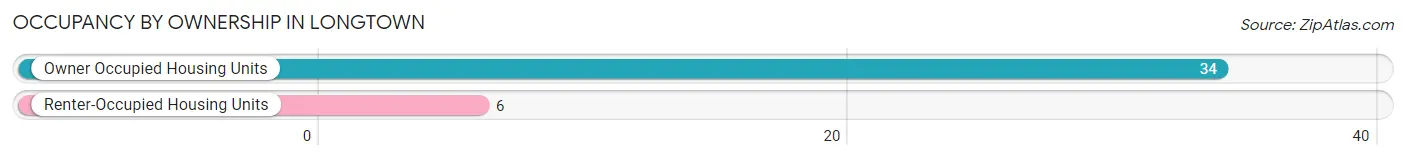
| Occupancy | # Housing Units | % Housing Units |
| Owner Occupied Housing Units | 34 | 85.0% |
| Renter-Occupied Housing Units | 6 | 15.0% |
| Total Occupied Housing Units | 40 | 100.0% |
Occupancy by Household Size in Longtown
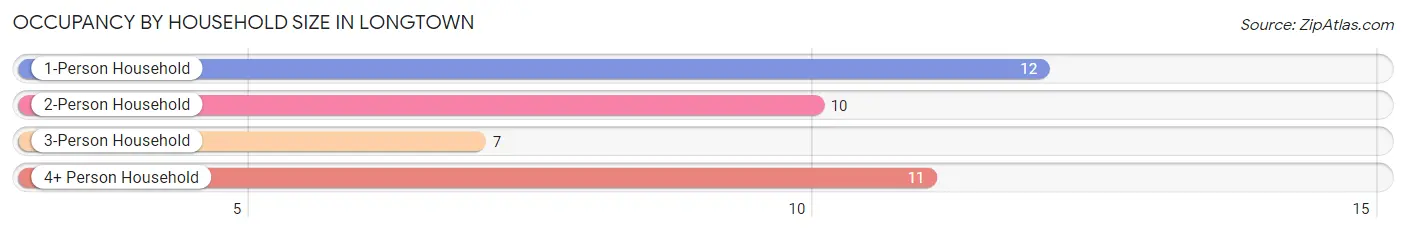
| Household Size | # Housing Units | % Housing Units |
| 1-Person Household | 12 | 30.0% |
| 2-Person Household | 10 | 25.0% |
| 3-Person Household | 7 | 17.5% |
| 4+ Person Household | 11 | 27.5% |
| Total Housing Units | 40 | 100.0% |
Occupancy by Ownership by Household Size in Longtown
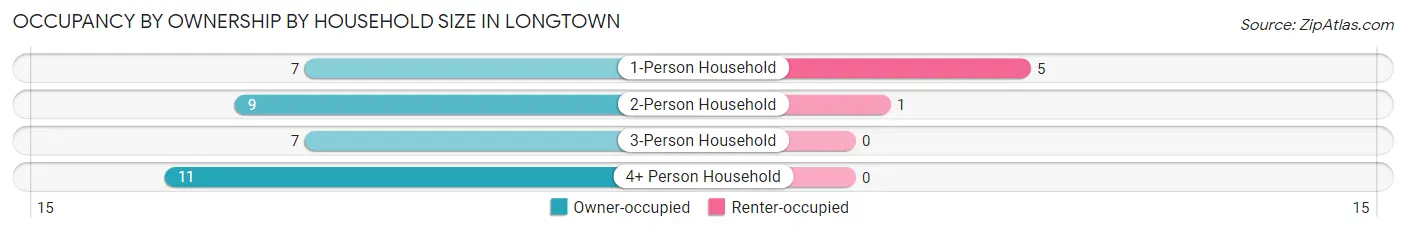
| Household Size | Owner-occupied | Renter-occupied |
| 1-Person Household | 7 (58.3%) | 5 (41.7%) |
| 2-Person Household | 9 (90.0%) | 1 (10.0%) |
| 3-Person Household | 7 (100.0%) | 0 (0.0%) |
| 4+ Person Household | 11 (100.0%) | 0 (0.0%) |
| Total Housing Units | 34 (85.0%) | 6 (15.0%) |
Occupancy by Educational Attainment in Longtown
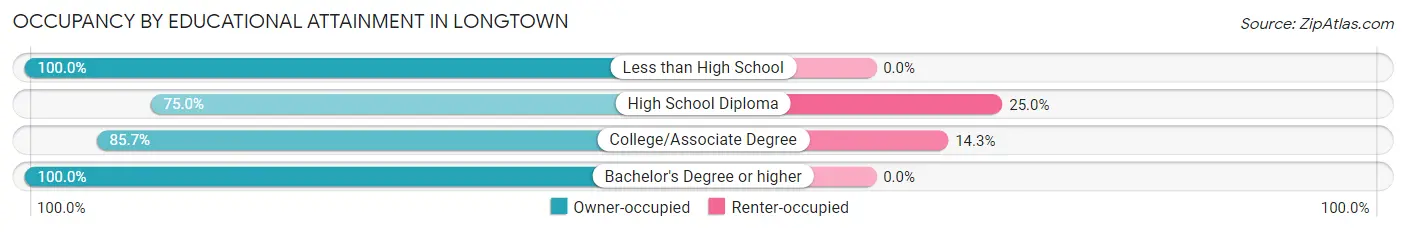
| Household Size | Owner-occupied | Renter-occupied |
| Less than High School | 3 (100.0%) | 0 (0.0%) |
| High School Diploma | 9 (75.0%) | 3 (25.0%) |
| College/Associate Degree | 18 (85.7%) | 3 (14.3%) |
| Bachelor's Degree or higher | 4 (100.0%) | 0 (0.0%) |
Occupancy by Age of Householder in Longtown
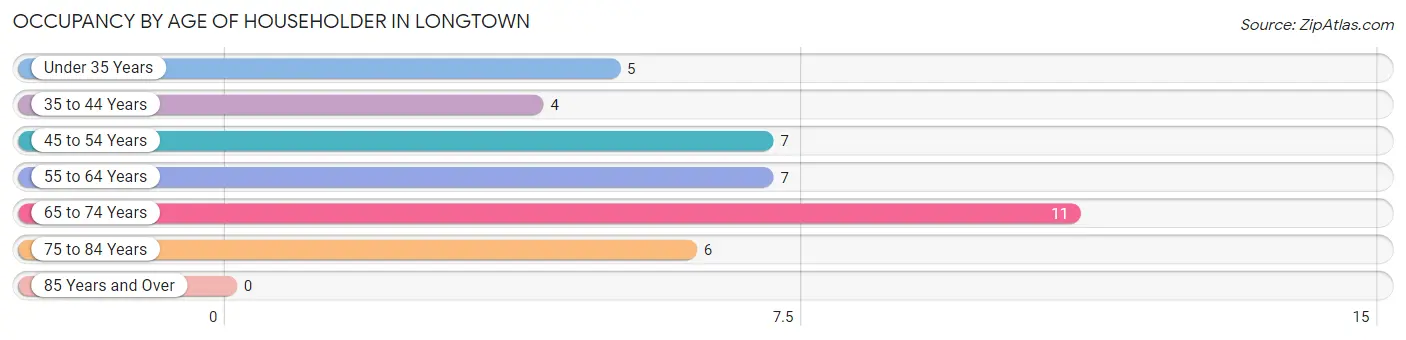
| Age Bracket | # Households | % Households |
| Under 35 Years | 5 | 12.5% |
| 35 to 44 Years | 4 | 10.0% |
| 45 to 54 Years | 7 | 17.5% |
| 55 to 64 Years | 7 | 17.5% |
| 65 to 74 Years | 11 | 27.5% |
| 75 to 84 Years | 6 | 15.0% |
| 85 Years and Over | 0 | 0.0% |
| Total | 40 | 100.0% |
Housing Finances in Longtown
Median Income by Occupancy in Longtown
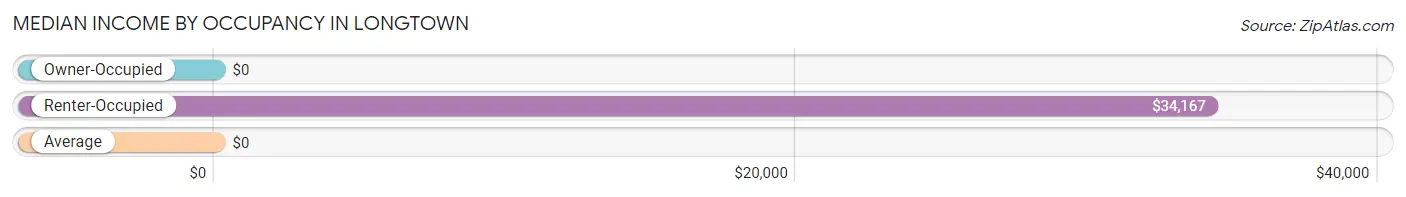
| Occupancy Type | # Households | Median Income |
| Owner-Occupied | 34 (85.0%) | $0 |
| Renter-Occupied | 6 (15.0%) | $34,167 |
| Average | 40 (100.0%) | $0 |
Occupancy by Householder Income Bracket in Longtown
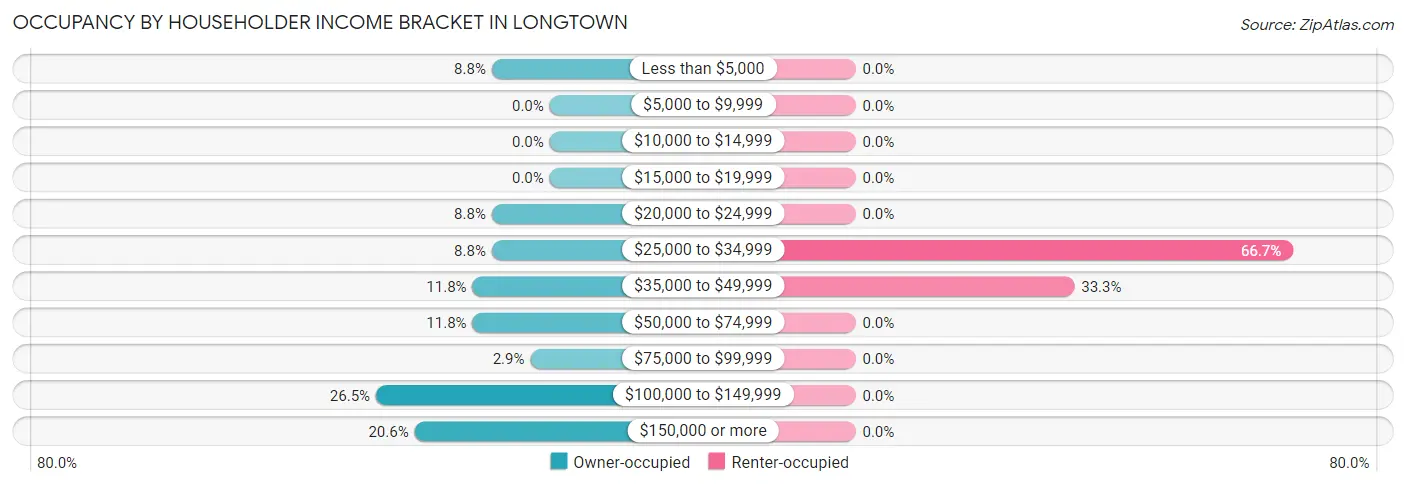
| Income Bracket | Owner-occupied | Renter-occupied |
| Less than $5,000 | 3 (8.8%) | 0 (0.0%) |
| $5,000 to $9,999 | 0 (0.0%) | 0 (0.0%) |
| $10,000 to $14,999 | 0 (0.0%) | 0 (0.0%) |
| $15,000 to $19,999 | 0 (0.0%) | 0 (0.0%) |
| $20,000 to $24,999 | 3 (8.8%) | 0 (0.0%) |
| $25,000 to $34,999 | 3 (8.8%) | 4 (66.7%) |
| $35,000 to $49,999 | 4 (11.8%) | 2 (33.3%) |
| $50,000 to $74,999 | 4 (11.8%) | 0 (0.0%) |
| $75,000 to $99,999 | 1 (2.9%) | 0 (0.0%) |
| $100,000 to $149,999 | 9 (26.5%) | 0 (0.0%) |
| $150,000 or more | 7 (20.6%) | 0 (0.0%) |
| Total | 34 (100.0%) | 6 (100.0%) |
Monthly Housing Cost Tiers in Longtown
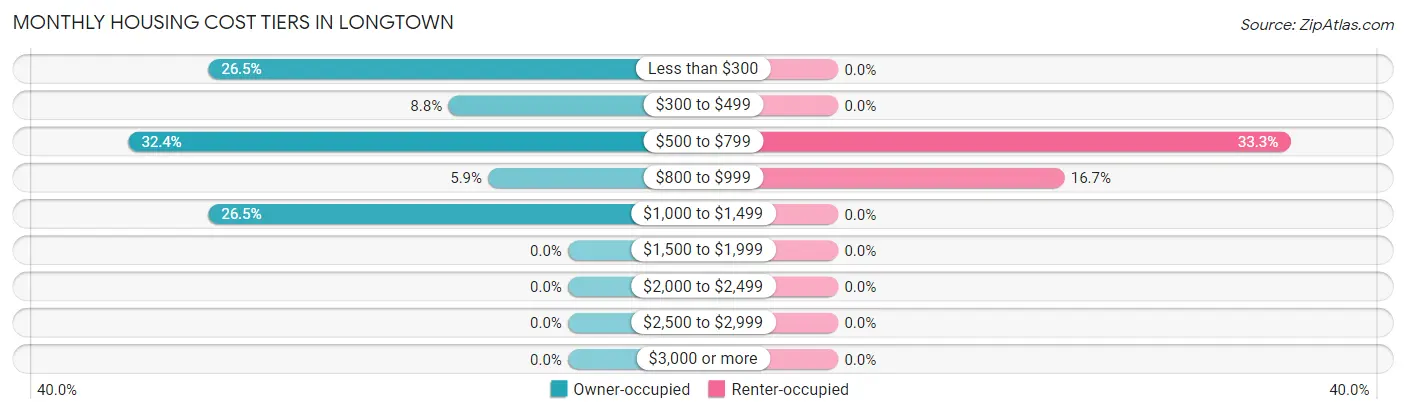
| Monthly Cost | Owner-occupied | Renter-occupied |
| Less than $300 | 9 (26.5%) | 0 (0.0%) |
| $300 to $499 | 3 (8.8%) | 0 (0.0%) |
| $500 to $799 | 11 (32.4%) | 2 (33.3%) |
| $800 to $999 | 2 (5.9%) | 1 (16.7%) |
| $1,000 to $1,499 | 9 (26.5%) | 0 (0.0%) |
| $1,500 to $1,999 | 0 (0.0%) | 0 (0.0%) |
| $2,000 to $2,499 | 0 (0.0%) | 0 (0.0%) |
| $2,500 to $2,999 | 0 (0.0%) | 0 (0.0%) |
| $3,000 or more | 0 (0.0%) | 0 (0.0%) |
| Total | 34 (100.0%) | 6 (100.0%) |
Physical Housing Characteristics in Longtown
Housing Structures in Longtown
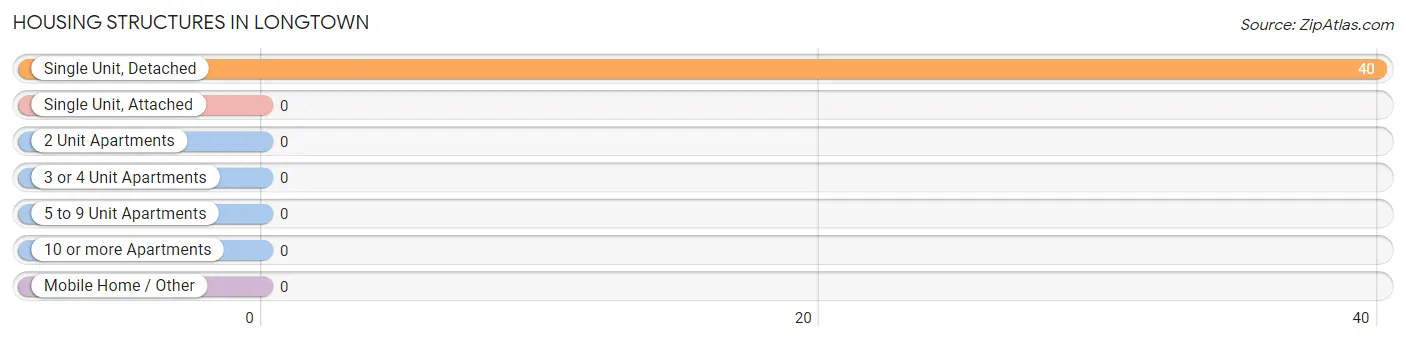
| Structure Type | # Housing Units | % Housing Units |
| Single Unit, Detached | 40 | 100.0% |
| Single Unit, Attached | 0 | 0.0% |
| 2 Unit Apartments | 0 | 0.0% |
| 3 or 4 Unit Apartments | 0 | 0.0% |
| 5 to 9 Unit Apartments | 0 | 0.0% |
| 10 or more Apartments | 0 | 0.0% |
| Mobile Home / Other | 0 | 0.0% |
| Total | 40 | 100.0% |
Housing Structures by Occupancy in Longtown
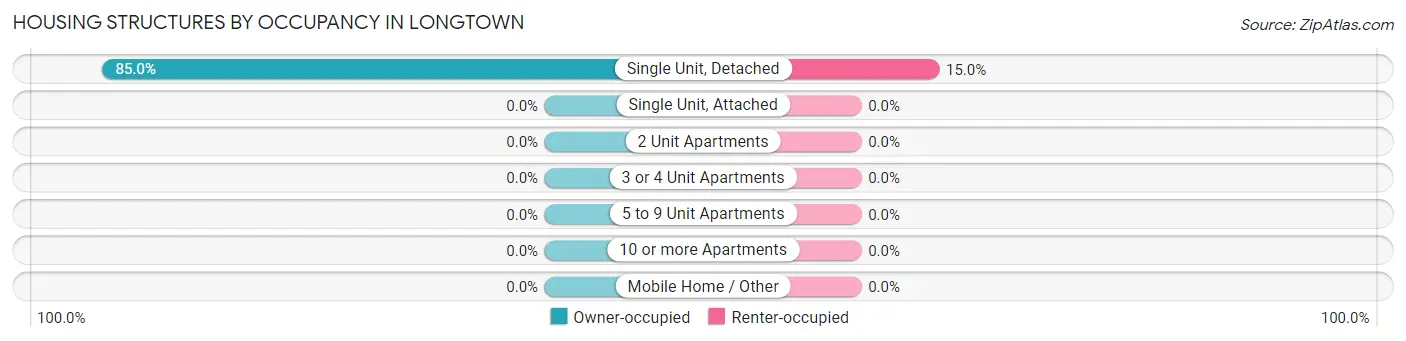
| Structure Type | Owner-occupied | Renter-occupied |
| Single Unit, Detached | 34 (85.0%) | 6 (15.0%) |
| Single Unit, Attached | 0 (0.0%) | 0 (0.0%) |
| 2 Unit Apartments | 0 (0.0%) | 0 (0.0%) |
| 3 or 4 Unit Apartments | 0 (0.0%) | 0 (0.0%) |
| 5 to 9 Unit Apartments | 0 (0.0%) | 0 (0.0%) |
| 10 or more Apartments | 0 (0.0%) | 0 (0.0%) |
| Mobile Home / Other | 0 (0.0%) | 0 (0.0%) |
| Total | 34 (85.0%) | 6 (15.0%) |
Housing Structures by Number of Rooms in Longtown
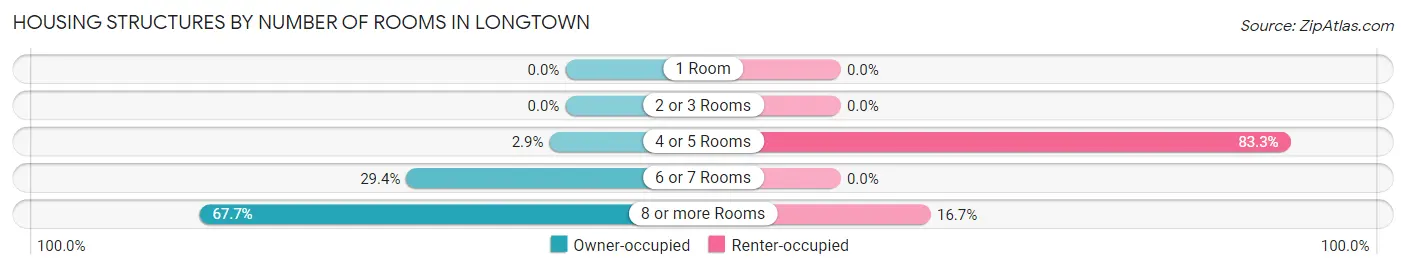
| Number of Rooms | Owner-occupied | Renter-occupied |
| 1 Room | 0 (0.0%) | 0 (0.0%) |
| 2 or 3 Rooms | 0 (0.0%) | 0 (0.0%) |
| 4 or 5 Rooms | 1 (2.9%) | 5 (83.3%) |
| 6 or 7 Rooms | 10 (29.4%) | 0 (0.0%) |
| 8 or more Rooms | 23 (67.6%) | 1 (16.7%) |
| Total | 34 (100.0%) | 6 (100.0%) |
Housing Structure by Heating Type in Longtown
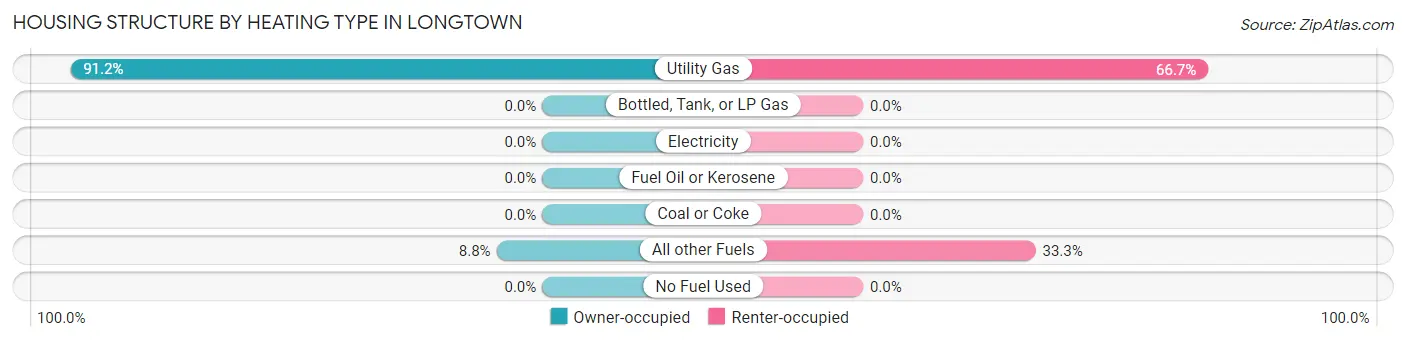
| Heating Type | Owner-occupied | Renter-occupied |
| Utility Gas | 31 (91.2%) | 4 (66.7%) |
| Bottled, Tank, or LP Gas | 0 (0.0%) | 0 (0.0%) |
| Electricity | 0 (0.0%) | 0 (0.0%) |
| Fuel Oil or Kerosene | 0 (0.0%) | 0 (0.0%) |
| Coal or Coke | 0 (0.0%) | 0 (0.0%) |
| All other Fuels | 3 (8.8%) | 2 (33.3%) |
| No Fuel Used | 0 (0.0%) | 0 (0.0%) |
| Total | 34 (100.0%) | 6 (100.0%) |
Household Vehicle Usage in Longtown
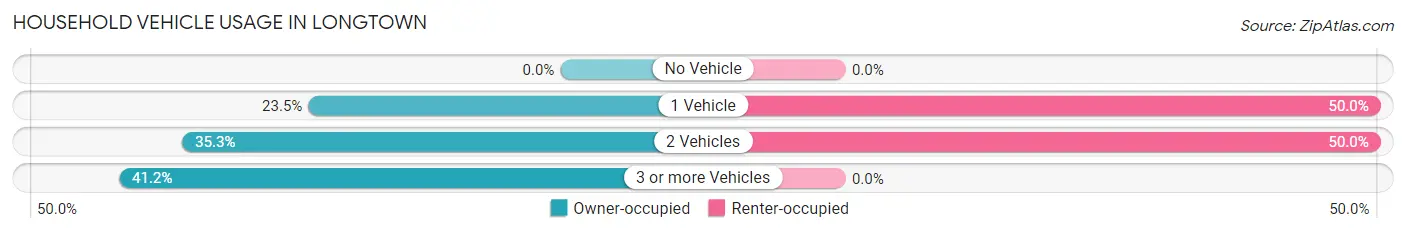
| Vehicles per Household | Owner-occupied | Renter-occupied |
| No Vehicle | 0 (0.0%) | 0 (0.0%) |
| 1 Vehicle | 8 (23.5%) | 3 (50.0%) |
| 2 Vehicles | 12 (35.3%) | 3 (50.0%) |
| 3 or more Vehicles | 14 (41.2%) | 0 (0.0%) |
| Total | 34 (100.0%) | 6 (100.0%) |
Real Estate & Mortgages in Longtown
Real Estate and Mortgage Overview in Longtown
| Characteristic | Without Mortgage | With Mortgage |
| Housing Units | 16 | 18 |
| Median Property Value | $154,200 | $117,500 |
| Median Household Income | $41,875 | $7 |
| Monthly Housing Costs | $288 | $0 |
| Real Estate Taxes | $775 | $0 |
Property Value by Mortgage Status in Longtown
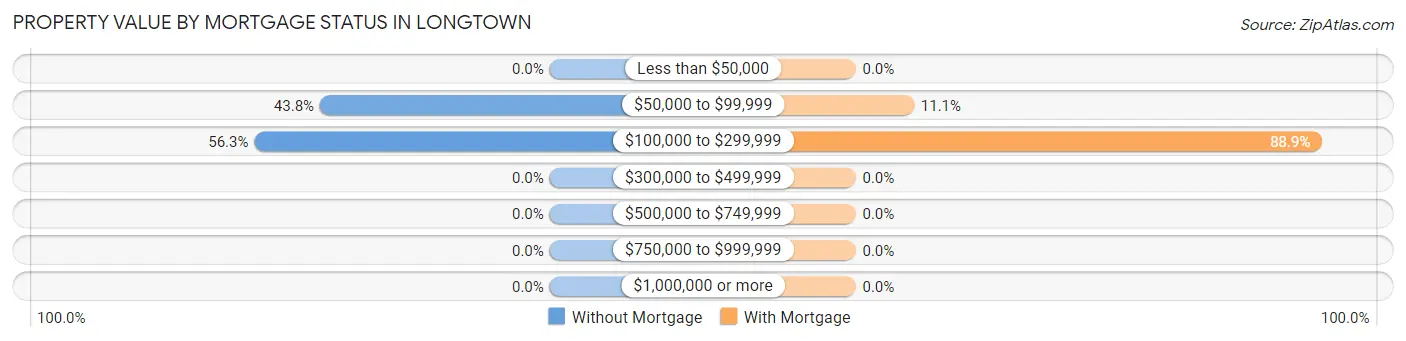
| Property Value | Without Mortgage | With Mortgage |
| Less than $50,000 | 0 (0.0%) | 0 (0.0%) |
| $50,000 to $99,999 | 7 (43.8%) | 2 (11.1%) |
| $100,000 to $299,999 | 9 (56.2%) | 16 (88.9%) |
| $300,000 to $499,999 | 0 (0.0%) | 0 (0.0%) |
| $500,000 to $749,999 | 0 (0.0%) | 0 (0.0%) |
| $750,000 to $999,999 | 0 (0.0%) | 0 (0.0%) |
| $1,000,000 or more | 0 (0.0%) | 0 (0.0%) |
| Total | 16 (100.0%) | 18 (100.0%) |
Household Income by Mortgage Status in Longtown
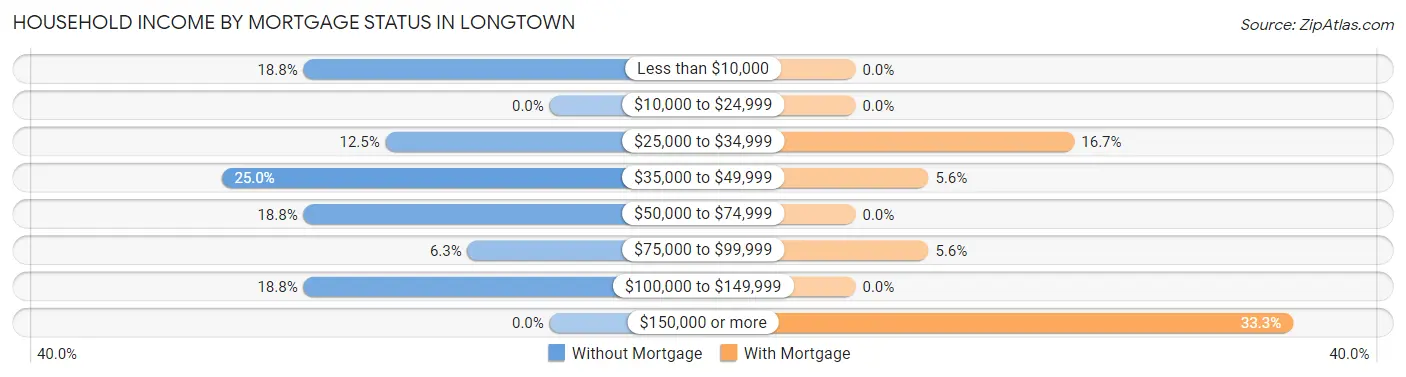
| Household Income | Without Mortgage | With Mortgage |
| Less than $10,000 | 3 (18.8%) | 0 (0.0%) |
| $10,000 to $24,999 | 0 (0.0%) | 0 (0.0%) |
| $25,000 to $34,999 | 2 (12.5%) | 3 (16.7%) |
| $35,000 to $49,999 | 4 (25.0%) | 1 (5.6%) |
| $50,000 to $74,999 | 3 (18.8%) | 0 (0.0%) |
| $75,000 to $99,999 | 1 (6.2%) | 1 (5.6%) |
| $100,000 to $149,999 | 3 (18.8%) | 0 (0.0%) |
| $150,000 or more | 0 (0.0%) | 6 (33.3%) |
| Total | 16 (100.0%) | 18 (100.0%) |
Property Value to Household Income Ratio in Longtown
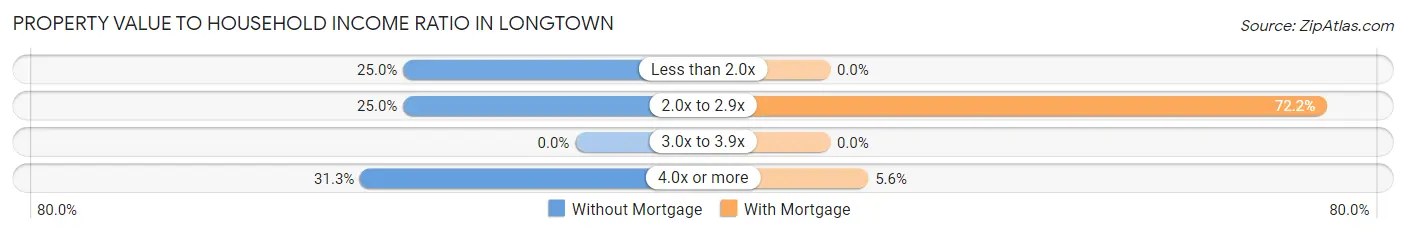
| Value-to-Income Ratio | Without Mortgage | With Mortgage |
| Less than 2.0x | 4 (25.0%) | 0 (0.0%) |
| 2.0x to 2.9x | 4 (25.0%) | 13 (72.2%) |
| 3.0x to 3.9x | 0 (0.0%) | 0 (0.0%) |
| 4.0x or more | 5 (31.2%) | 1 (5.6%) |
| Total | 16 (100.0%) | 18 (100.0%) |
Real Estate Taxes by Mortgage Status in Longtown
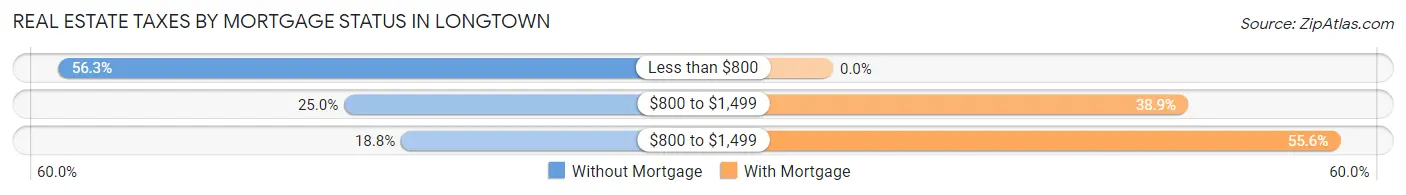
| Property Taxes | Without Mortgage | With Mortgage |
| Less than $800 | 9 (56.2%) | 0 (0.0%) |
| $800 to $1,499 | 4 (25.0%) | 7 (38.9%) |
| $800 to $1,499 | 3 (18.8%) | 10 (55.6%) |
| Total | 16 (100.0%) | 18 (100.0%) |
Health & Disability in Longtown
Health Insurance Coverage by Age in Longtown
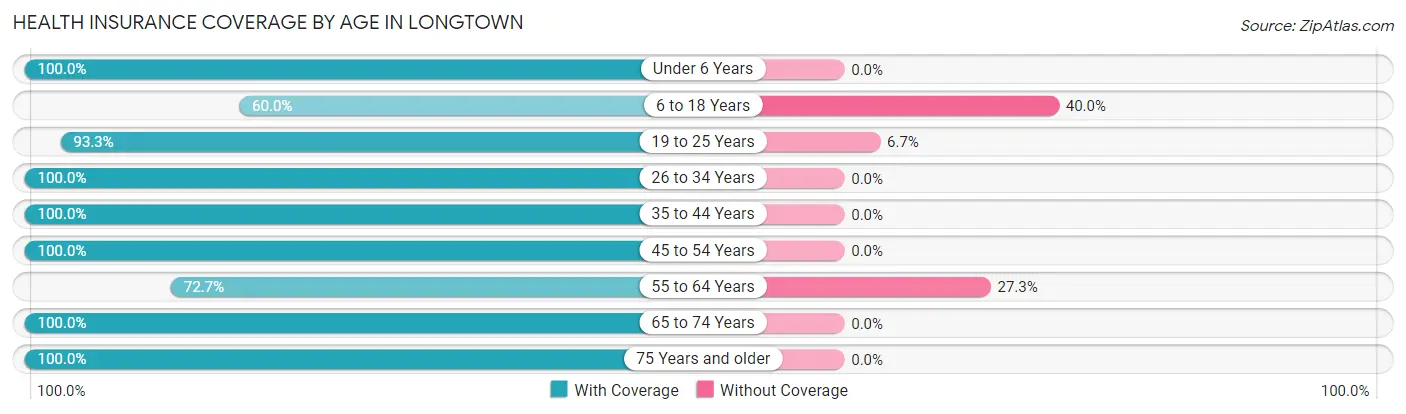
| Age Bracket | With Coverage | Without Coverage |
| Under 6 Years | 5 (100.0%) | 0 (0.0%) |
| 6 to 18 Years | 6 (60.0%) | 4 (40.0%) |
| 19 to 25 Years | 28 (93.3%) | 2 (6.7%) |
| 26 to 34 Years | 2 (100.0%) | 0 (0.0%) |
| 35 to 44 Years | 9 (100.0%) | 0 (0.0%) |
| 45 to 54 Years | 12 (100.0%) | 0 (0.0%) |
| 55 to 64 Years | 8 (72.7%) | 3 (27.3%) |
| 65 to 74 Years | 13 (100.0%) | 0 (0.0%) |
| 75 Years and older | 10 (100.0%) | 0 (0.0%) |
| Total | 93 (91.2%) | 9 (8.8%) |
Health Insurance Coverage by Citizenship Status in Longtown
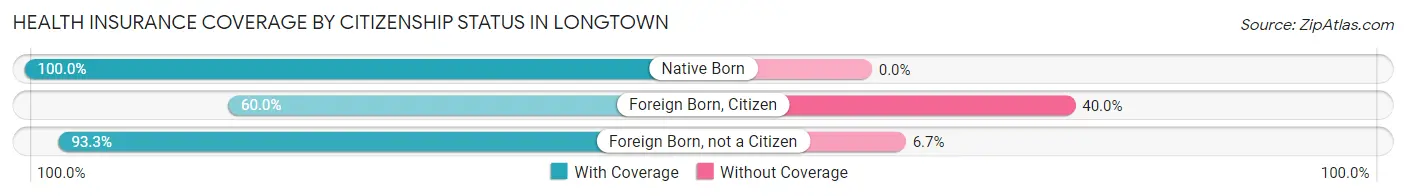
| Citizenship Status | With Coverage | Without Coverage |
| Native Born | 5 (100.0%) | 0 (0.0%) |
| Foreign Born, Citizen | 6 (60.0%) | 4 (40.0%) |
| Foreign Born, not a Citizen | 28 (93.3%) | 2 (6.7%) |
Health Insurance Coverage by Household Income in Longtown
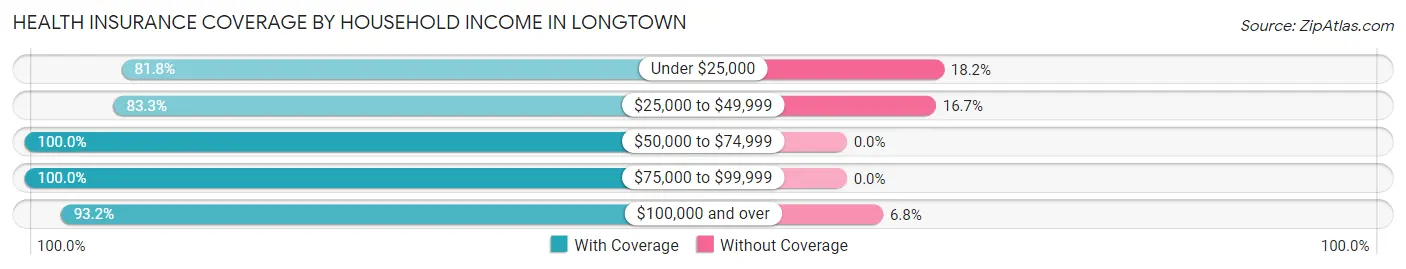
| Household Income | With Coverage | Without Coverage |
| Under $25,000 | 9 (81.8%) | 2 (18.2%) |
| $25,000 to $49,999 | 15 (83.3%) | 3 (16.7%) |
| $50,000 to $74,999 | 12 (100.0%) | 0 (0.0%) |
| $75,000 to $99,999 | 2 (100.0%) | 0 (0.0%) |
| $100,000 and over | 55 (93.2%) | 4 (6.8%) |
Public vs Private Health Insurance Coverage by Age in Longtown
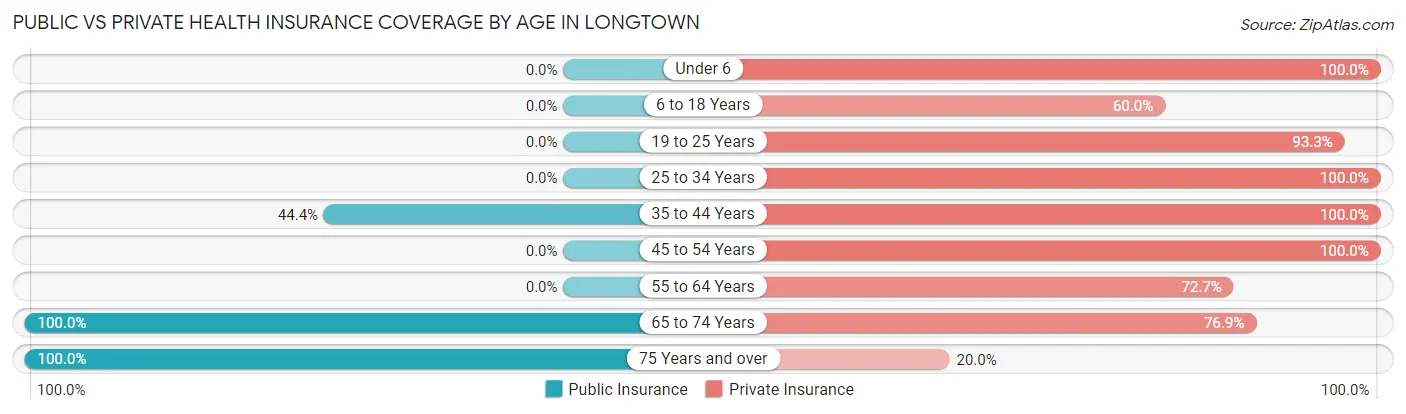
| Age Bracket | Public Insurance | Private Insurance |
| Under 6 | 0 (0.0%) | 5 (100.0%) |
| 6 to 18 Years | 0 (0.0%) | 6 (60.0%) |
| 19 to 25 Years | 0 (0.0%) | 28 (93.3%) |
| 25 to 34 Years | 0 (0.0%) | 2 (100.0%) |
| 35 to 44 Years | 4 (44.4%) | 9 (100.0%) |
| 45 to 54 Years | 0 (0.0%) | 12 (100.0%) |
| 55 to 64 Years | 0 (0.0%) | 8 (72.7%) |
| 65 to 74 Years | 13 (100.0%) | 10 (76.9%) |
| 75 Years and over | 10 (100.0%) | 2 (20.0%) |
| Total | 27 (26.5%) | 82 (80.4%) |
Disability Status by Sex by Age in Longtown
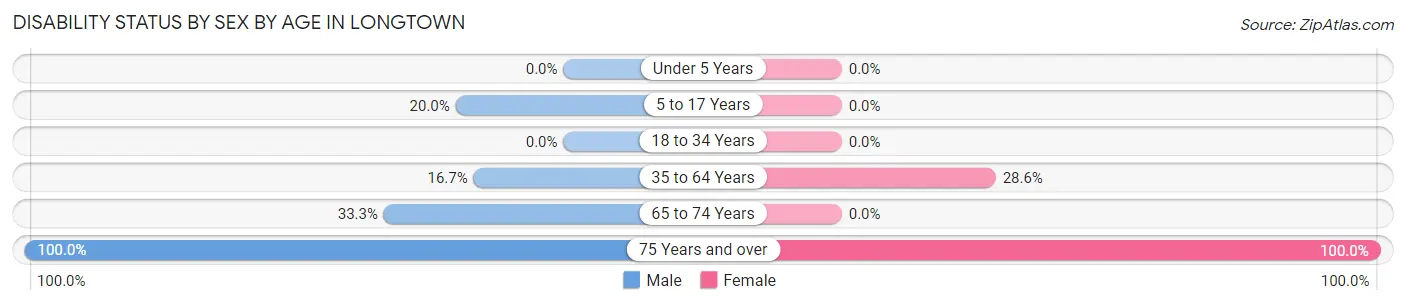
| Age Bracket | Male | Female |
| Under 5 Years | 0 (0.0%) | 0 (0.0%) |
| 5 to 17 Years | 2 (20.0%) | 0 (0.0%) |
| 18 to 34 Years | 0 (0.0%) | 0 (0.0%) |
| 35 to 64 Years | 3 (16.7%) | 4 (28.6%) |
| 65 to 74 Years | 2 (33.3%) | 0 (0.0%) |
| 75 Years and over | 4 (100.0%) | 6 (100.0%) |
Disability Class by Sex by Age in Longtown
Disability Class: Hearing Difficulty
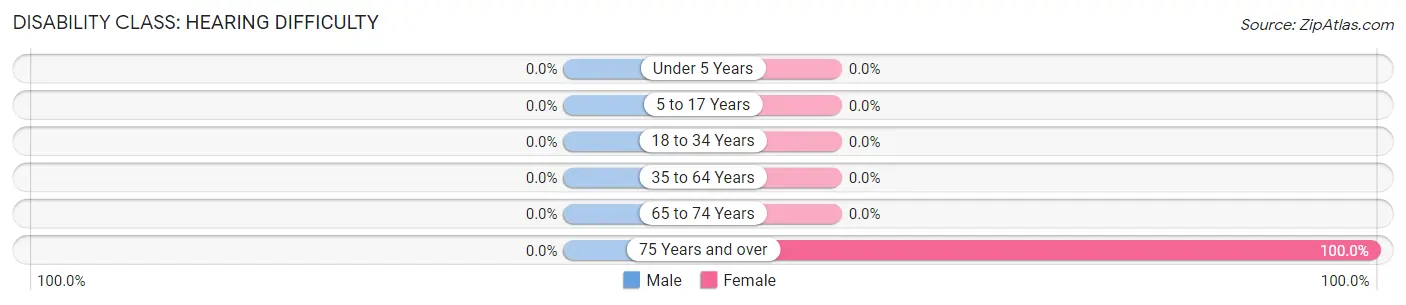
| Age Bracket | Male | Female |
| Under 5 Years | 0 (0.0%) | 0 (0.0%) |
| 5 to 17 Years | 0 (0.0%) | 0 (0.0%) |
| 18 to 34 Years | 0 (0.0%) | 0 (0.0%) |
| 35 to 64 Years | 0 (0.0%) | 0 (0.0%) |
| 65 to 74 Years | 0 (0.0%) | 0 (0.0%) |
| 75 Years and over | 0 (0.0%) | 6 (100.0%) |
Disability Class: Vision Difficulty
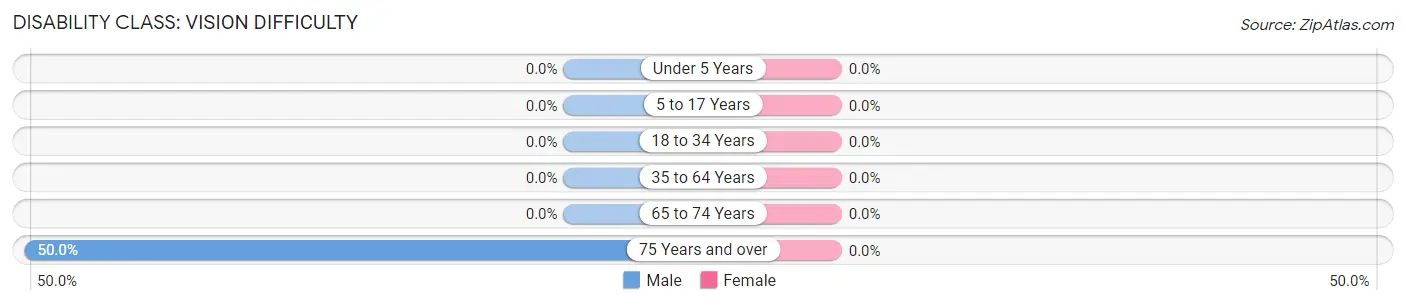
| Age Bracket | Male | Female |
| Under 5 Years | 0 (0.0%) | 0 (0.0%) |
| 5 to 17 Years | 0 (0.0%) | 0 (0.0%) |
| 18 to 34 Years | 0 (0.0%) | 0 (0.0%) |
| 35 to 64 Years | 0 (0.0%) | 0 (0.0%) |
| 65 to 74 Years | 0 (0.0%) | 0 (0.0%) |
| 75 Years and over | 2 (50.0%) | 0 (0.0%) |
Disability Class: Cognitive Difficulty
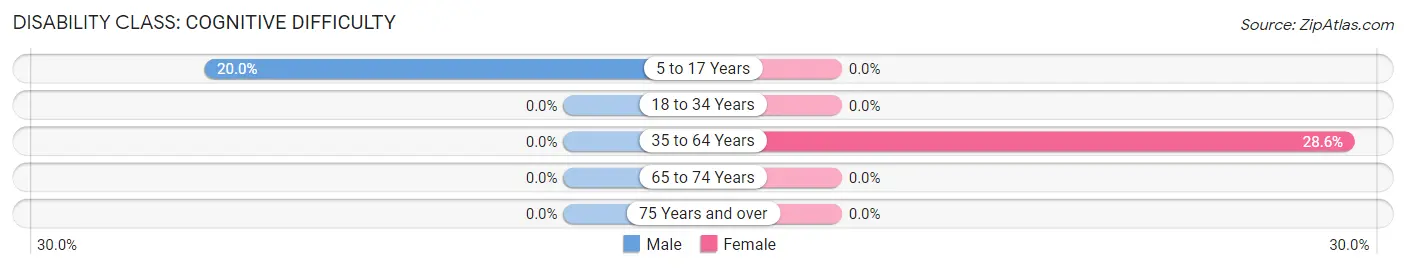
| Age Bracket | Male | Female |
| 5 to 17 Years | 2 (20.0%) | 0 (0.0%) |
| 18 to 34 Years | 0 (0.0%) | 0 (0.0%) |
| 35 to 64 Years | 0 (0.0%) | 4 (28.6%) |
| 65 to 74 Years | 0 (0.0%) | 0 (0.0%) |
| 75 Years and over | 0 (0.0%) | 0 (0.0%) |
Disability Class: Ambulatory Difficulty
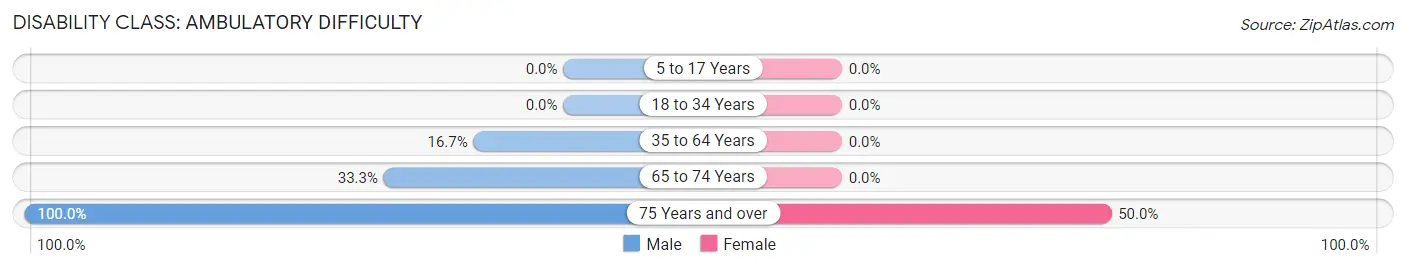
| Age Bracket | Male | Female |
| 5 to 17 Years | 0 (0.0%) | 0 (0.0%) |
| 18 to 34 Years | 0 (0.0%) | 0 (0.0%) |
| 35 to 64 Years | 3 (16.7%) | 0 (0.0%) |
| 65 to 74 Years | 2 (33.3%) | 0 (0.0%) |
| 75 Years and over | 4 (100.0%) | 3 (50.0%) |
Disability Class: Self-Care Difficulty
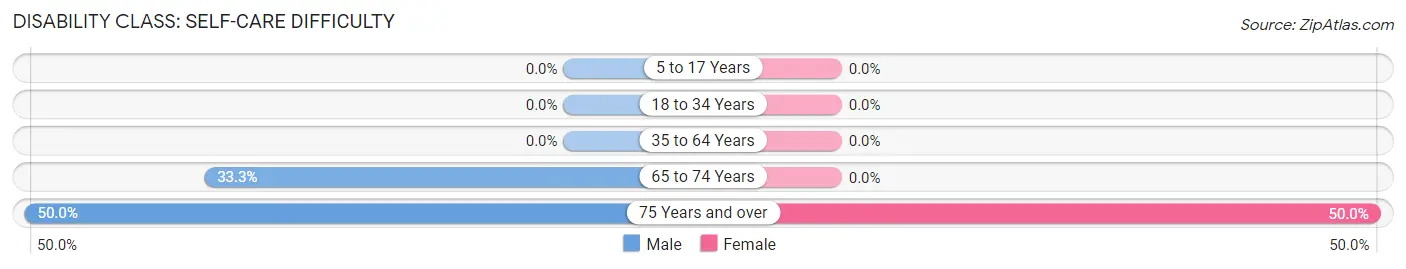
| Age Bracket | Male | Female |
| 5 to 17 Years | 0 (0.0%) | 0 (0.0%) |
| 18 to 34 Years | 0 (0.0%) | 0 (0.0%) |
| 35 to 64 Years | 0 (0.0%) | 0 (0.0%) |
| 65 to 74 Years | 2 (33.3%) | 0 (0.0%) |
| 75 Years and over | 2 (50.0%) | 3 (50.0%) |
Technology Access in Longtown
Computing Device Access in Longtown
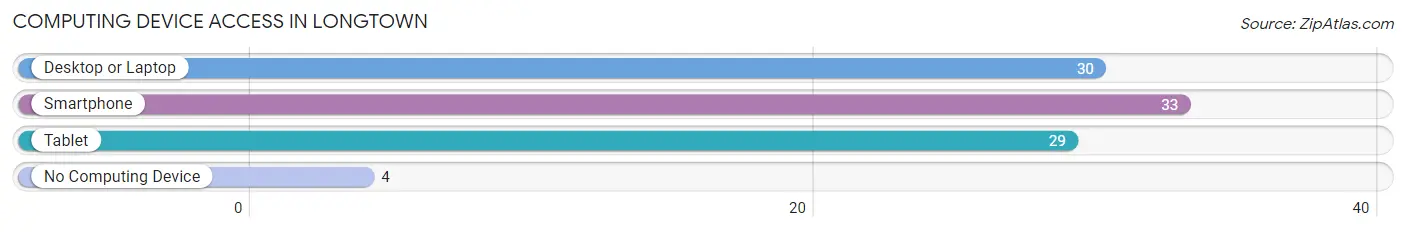
| Device Type | # Households | % Households |
| Desktop or Laptop | 30 | 75.0% |
| Smartphone | 33 | 82.5% |
| Tablet | 29 | 72.5% |
| No Computing Device | 4 | 10.0% |
| Total | 40 | 100.0% |
Internet Access in Longtown
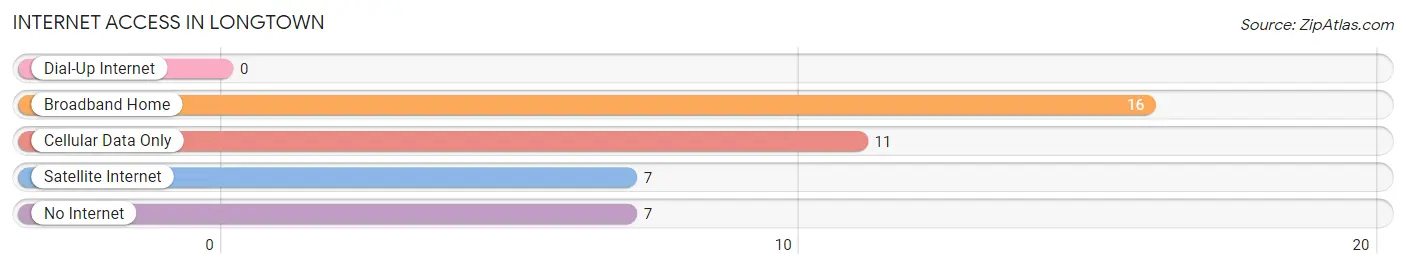
| Internet Type | # Households | % Households |
| Dial-Up Internet | 0 | 0.0% |
| Broadband Home | 16 | 40.0% |
| Cellular Data Only | 11 | 27.5% |
| Satellite Internet | 7 | 17.5% |
| No Internet | 7 | 17.5% |
| Total | 40 | 100.0% |
Longtown Summary
Longtown is a small unincorporated community located in the southeastern corner of Stoddard County, Missouri. It is situated along the banks of the St. Francis River, approximately 10 miles south of the county seat of Bloomfield. The town was founded in 1837 and is one of the oldest settlements in the county.
History
Longtown was founded in 1837 by a group of settlers from Tennessee. The town was named after the long stretch of land along the St. Francis River that the settlers had purchased. The town quickly grew and by 1840, it had a population of over 200 people. The town was home to a variety of businesses, including a general store, a blacksmith shop, a grist mill, and a sawmill.
In 1845, the town was incorporated and a post office was established. The town continued to grow and by 1860, it had a population of over 500 people. During the Civil War, Longtown was a major supply center for the Confederate Army. After the war, the town slowly began to decline and by the early 1900s, the population had dropped to just over 200 people.
Geography
Longtown is located in the southeastern corner of Stoddard County, Missouri. It is situated along the banks of the St. Francis River, approximately 10 miles south of the county seat of Bloomfield. The town is located in the Ozark Plateau region of Missouri and is surrounded by rolling hills and forests. The climate in Longtown is humid subtropical, with hot, humid summers and mild winters.
Economy
Longtown’s economy is largely based on agriculture. The town is home to several farms that produce a variety of crops, including corn, soybeans, and wheat. The town also has a few small businesses, including a general store, a gas station, and a restaurant.
Demographics
As of the 2010 census, Longtown had a population of just over 200 people. The racial makeup of the town was 97.5% White, 0.5% African American, 0.5% Native American, and 1.5% from other races. The median household income in Longtown was $30,000, and the median age was 44 years.
Longtown is a small, rural community with a rich history and a strong sense of community. The town is home to a variety of businesses and farms, and its residents take pride in their town and its history. Longtown is a great place to live and work, and it is a great example of small-town life in Missouri.
Common Questions
What is Per Capita Income in Longtown?
Per Capita income in Longtown is $43,440.
What is the Median Family Income in Longtown?
Median Family Income in Longtown is $123,125.
What is Income or Wage Gap in Longtown?
Income or Wage Gap in Longtown is 51.3%.
Women in Longtown earn 48.7 cents for every dollar earned by a man.
What is Inequality or Gini Index in Longtown?
Inequality or Gini Index in Longtown is 0.52.
What is the Total Population of Longtown?
Total Population of Longtown is 104.
What is the Total Male Population of Longtown?
Total Male Population of Longtown is 58.
What is the Total Female Population of Longtown?
Total Female Population of Longtown is 46.
What is the Ratio of Males per 100 Females in Longtown?
There are 126.09 Males per 100 Females in Longtown.
What is the Ratio of Females per 100 Males in Longtown?
There are 79.31 Females per 100 Males in Longtown.
What is the Median Population Age in Longtown?
Median Population Age in Longtown is 35.8 Years.
What is the Average Family Size in Longtown
Average Family Size in Longtown is 3.2 People.
What is the Average Household Size in Longtown
Average Household Size in Longtown is 2.6 People.
How Large is the Labor Force in Longtown?
There are 67 People in the Labor Forcein in Longtown.
What is the Percentage of People in the Labor Force in Longtown?
75.3% of People are in the Labor Force in Longtown.