Lincoln, MO Map & Demographics
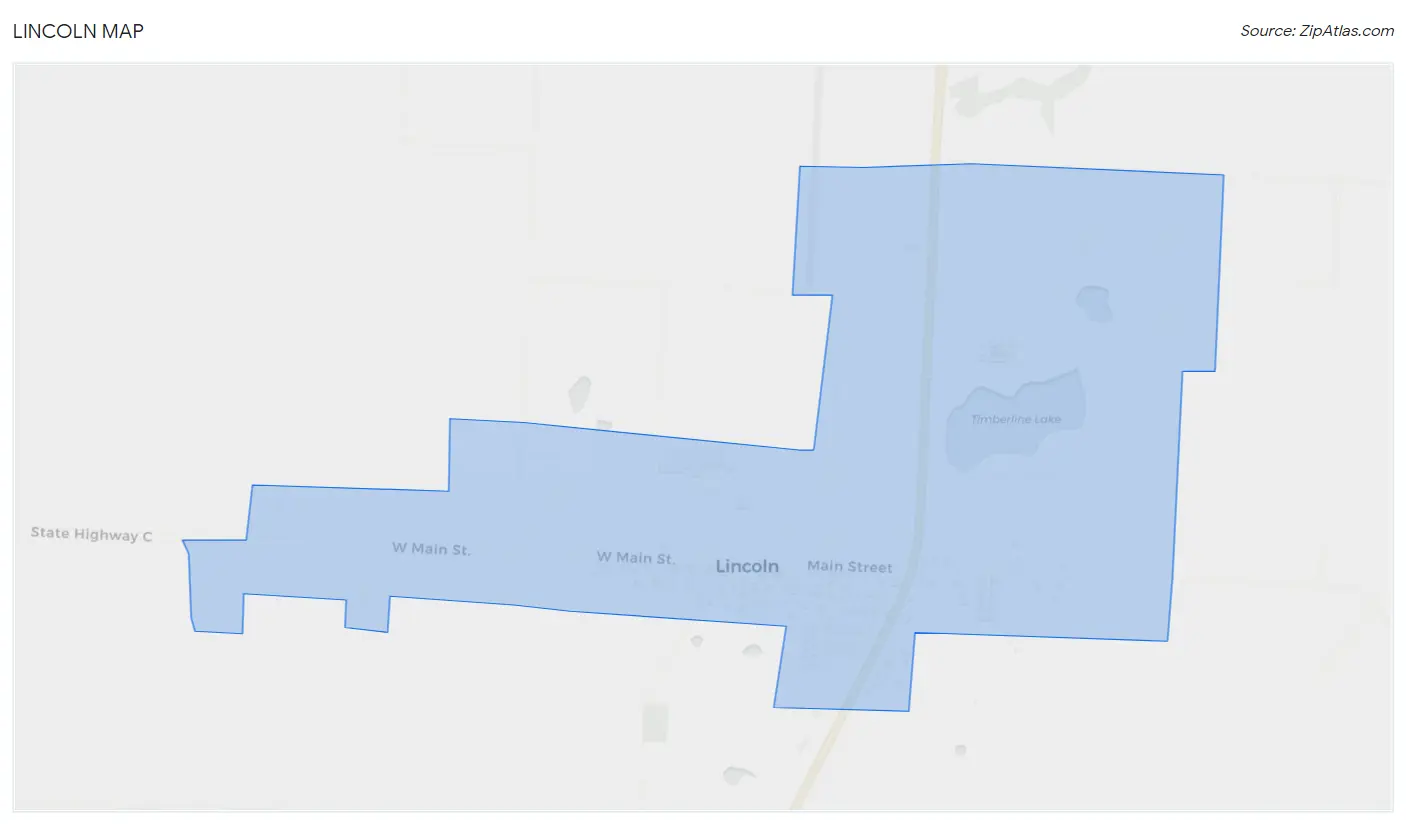
Lincoln Map
Lincoln Overview
$19,353
PER CAPITA INCOME
$72,273
AVG FAMILY INCOME
$58,194
AVG HOUSEHOLD INCOME
35.0%
WAGE / INCOME GAP [ % ]
65.0¢/ $1
WAGE / INCOME GAP [ $ ]
0.38
INEQUALITY / GINI INDEX
1,493
TOTAL POPULATION
669
MALE POPULATION
824
FEMALE POPULATION
81.19
MALES / 100 FEMALES
123.17
FEMALES / 100 MALES
31.2
MEDIAN AGE
4.5
AVG FAMILY SIZE
3.3
AVG HOUSEHOLD SIZE
552
LABOR FORCE [ PEOPLE ]
51.5%
PERCENT IN LABOR FORCE
5.1%
UNEMPLOYMENT RATE
Lincoln Zip Codes
Lincoln Area Codes
Income in Lincoln
Income Overview in Lincoln
Per Capita Income in Lincoln is $19,353, while median incomes of families and households are $72,273 and $58,194 respectively.
| Characteristic | Number | Measure |
| Per Capita Income | 1,493 | $19,353 |
| Median Family Income | 270 | $72,273 |
| Mean Family Income | 270 | $75,006 |
| Median Household Income | 431 | $58,194 |
| Mean Household Income | 431 | $63,601 |
| Income Deficit | 270 | $0 |
| Wage / Income Gap (%) | 1,493 | 34.98% |
| Wage / Income Gap ($) | 1,493 | 65.02¢ per $1 |
| Gini / Inequality Index | 1,493 | 0.38 |
Earnings by Sex in Lincoln
Average Earnings in Lincoln are $33,804, $41,335 for men and $26,875 for women, a difference of 35.0%.
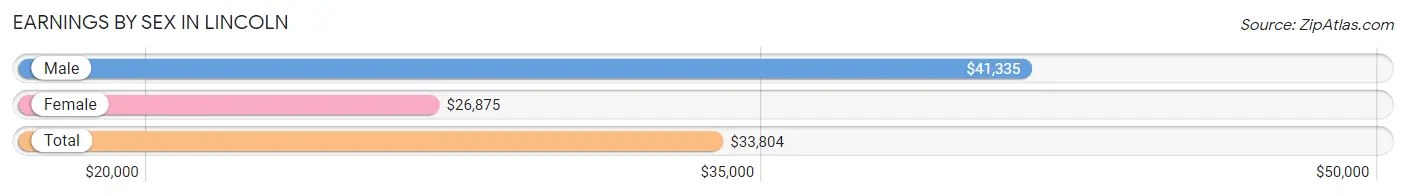
| Sex | Number | Average Earnings |
| Male | 273 (46.9%) | $41,335 |
| Female | 309 (53.1%) | $26,875 |
| Total | 582 (100.0%) | $33,804 |
Earnings by Sex by Income Bracket in Lincoln
The most common earnings brackets in Lincoln are $40,000 to $44,999 for men (46 | 16.9%) and $25,000 to $29,999 for women (52 | 16.8%).
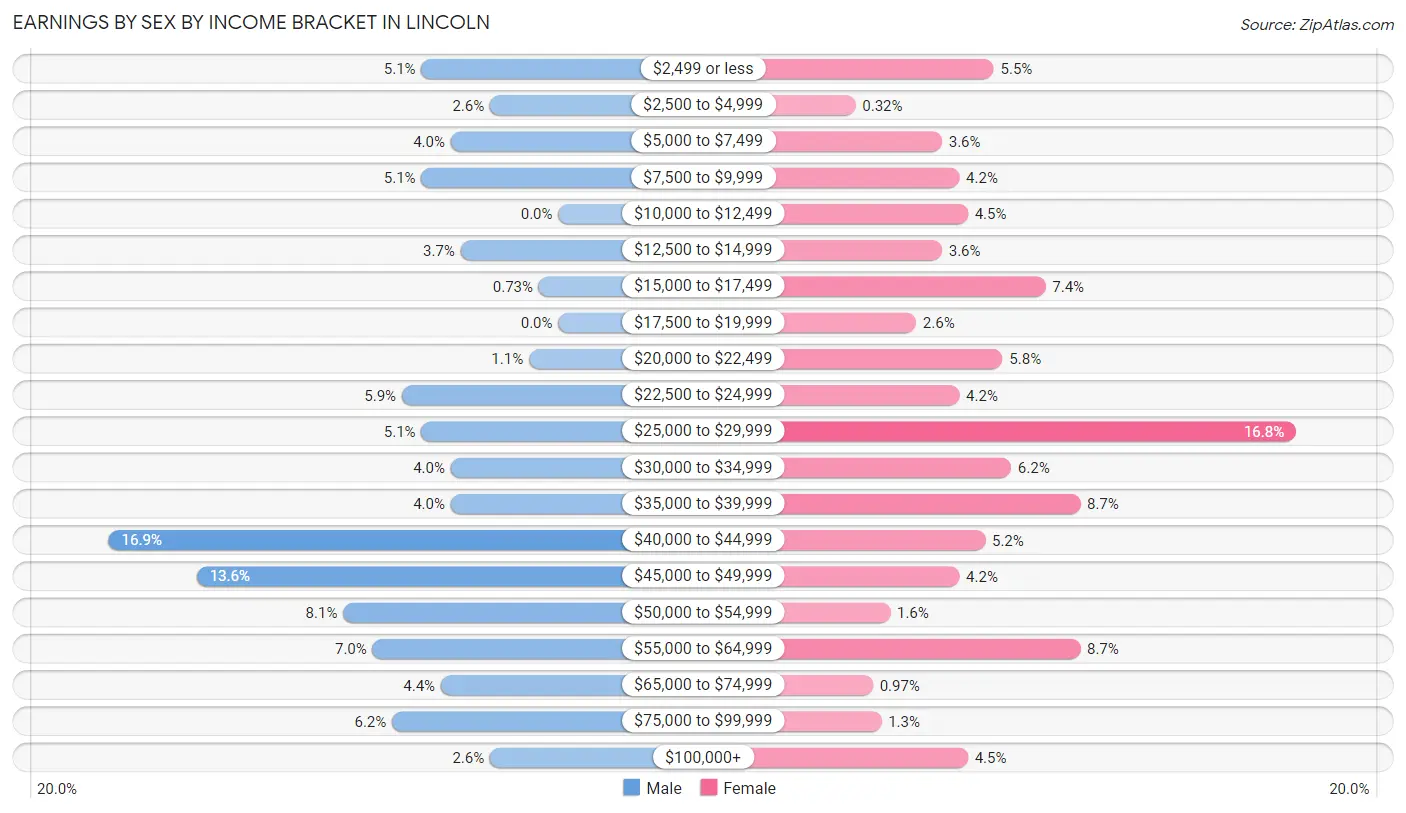
| Income | Male | Female |
| $2,499 or less | 14 (5.1%) | 17 (5.5%) |
| $2,500 to $4,999 | 7 (2.6%) | 1 (0.3%) |
| $5,000 to $7,499 | 11 (4.0%) | 11 (3.6%) |
| $7,500 to $9,999 | 14 (5.1%) | 13 (4.2%) |
| $10,000 to $12,499 | 0 (0.0%) | 14 (4.5%) |
| $12,500 to $14,999 | 10 (3.7%) | 11 (3.6%) |
| $15,000 to $17,499 | 2 (0.7%) | 23 (7.4%) |
| $17,500 to $19,999 | 0 (0.0%) | 8 (2.6%) |
| $20,000 to $22,499 | 3 (1.1%) | 18 (5.8%) |
| $22,500 to $24,999 | 16 (5.9%) | 13 (4.2%) |
| $25,000 to $29,999 | 14 (5.1%) | 52 (16.8%) |
| $30,000 to $34,999 | 11 (4.0%) | 19 (6.1%) |
| $35,000 to $39,999 | 11 (4.0%) | 27 (8.7%) |
| $40,000 to $44,999 | 46 (16.9%) | 16 (5.2%) |
| $45,000 to $49,999 | 37 (13.6%) | 13 (4.2%) |
| $50,000 to $54,999 | 22 (8.1%) | 5 (1.6%) |
| $55,000 to $64,999 | 19 (7.0%) | 27 (8.7%) |
| $65,000 to $74,999 | 12 (4.4%) | 3 (1.0%) |
| $75,000 to $99,999 | 17 (6.2%) | 4 (1.3%) |
| $100,000+ | 7 (2.6%) | 14 (4.5%) |
| Total | 273 (100.0%) | 309 (100.0%) |
Earnings by Sex by Educational Attainment in Lincoln
Average earnings in Lincoln are $46,771 for men and $29,097 for women, a difference of 37.8%. Men with an educational attainment of college or associate's degree enjoy the highest average annual earnings of $48,900, while those with high school diploma education earn the least with $41,154. Women with an educational attainment of graduate degree earn the most with the average annual earnings of $46,625, while those with bachelor's degree education have the smallest earnings of $27,258.
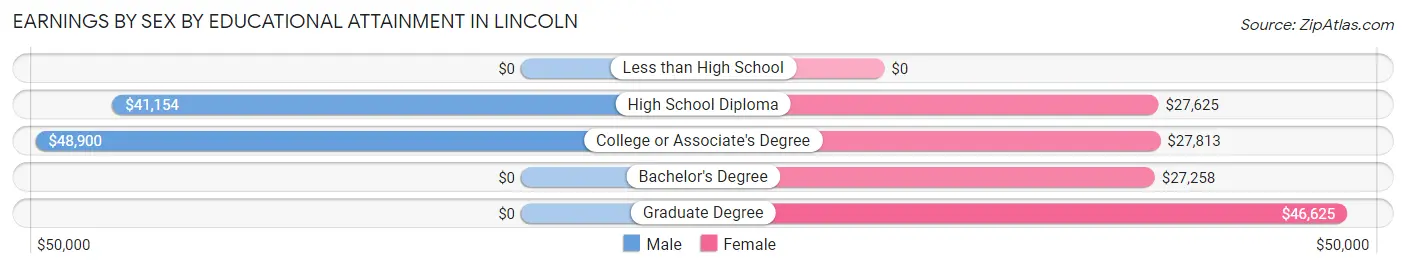
| Educational Attainment | Male Income | Female Income |
| Less than High School | - | - |
| High School Diploma | $41,154 | $27,625 |
| College or Associate's Degree | $48,900 | $27,813 |
| Bachelor's Degree | - | - |
| Graduate Degree | - | - |
| Total | $46,771 | $29,097 |
Family Income in Lincoln
Family Income Brackets in Lincoln
According to the Lincoln family income data, there are 75 families falling into the $50,000 to $74,999 income range, which is the most common income bracket and makes up 27.8% of all families.
| Income Bracket | # Families | % Families |
| Less than $10,000 | 4 | 1.5% |
| $10,000 to $14,999 | 0 | 0.0% |
| $15,000 to $24,999 | 12 | 4.4% |
| $25,000 to $34,999 | 24 | 8.9% |
| $35,000 to $49,999 | 31 | 11.5% |
| $50,000 to $74,999 | 75 | 27.8% |
| $75,000 to $99,999 | 65 | 24.1% |
| $100,000 to $149,999 | 40 | 14.8% |
| $150,000 to $199,999 | 17 | 6.3% |
| $200,000+ | 2 | 0.7% |
Family Income by Famaliy Size in Lincoln
3-person families (39 | 14.4%) account for the highest median family income in Lincoln with $88,036 per family, while 2-person families (78 | 28.9%) have the highest median income of $29,792 per family member.
| Income Bracket | # Families | Median Income |
| 2-Person Families | 78 (28.9%) | $59,583 |
| 3-Person Families | 39 (14.4%) | $88,036 |
| 4-Person Families | 125 (46.3%) | $75,282 |
| 5-Person Families | 19 (7.0%) | $69,063 |
| 6-Person Families | 0 (0.0%) | $0 |
| 7+ Person Families | 9 (3.3%) | $0 |
| Total | 270 (100.0%) | $72,273 |
Family Income by Number of Earners in Lincoln
The median family income in Lincoln is $72,273, with families comprising 3+ earners (48) having the highest median family income of $116,000, while families with no earners (25) have the lowest median family income of $41,042, accounting for 17.8% and 9.3% of families, respectively.
| Number of Earners | # Families | Median Income |
| No Earners | 25 (9.3%) | $41,042 |
| 1 Earner | 92 (34.1%) | $42,353 |
| 2 Earners | 105 (38.9%) | $77,379 |
| 3+ Earners | 48 (17.8%) | $116,000 |
| Total | 270 (100.0%) | $72,273 |
Household Income in Lincoln
Household Income Brackets in Lincoln
With 89 households falling in the category, the $50,000 to $74,999 income range is the most frequent in Lincoln, accounting for 20.6% of all households. In contrast, only 7 households (1.6%) fall into the less than $10,000 income bracket, making it the least populous group.
| Income Bracket | # Households | % Households |
| Less than $10,000 | 7 | 1.6% |
| $10,000 to $14,999 | 26 | 6.0% |
| $15,000 to $24,999 | 59 | 13.7% |
| $25,000 to $34,999 | 52 | 12.1% |
| $35,000 to $49,999 | 46 | 10.7% |
| $50,000 to $74,999 | 89 | 20.6% |
| $75,000 to $99,999 | 80 | 18.6% |
| $100,000 to $149,999 | 45 | 10.4% |
| $150,000 to $199,999 | 20 | 4.6% |
| $200,000+ | 7 | 1.6% |
Household Income by Householder Age in Lincoln
The median household income in Lincoln is $58,194, with the highest median household income of $74,375 found in the 25 to 44 years age bracket for the primary householder. A total of 178 households (41.3%) fall into this category. Meanwhile, the 15 to 24 years age bracket for the primary householder has the lowest median household income of $0, with 12 households (2.8%) in this group.
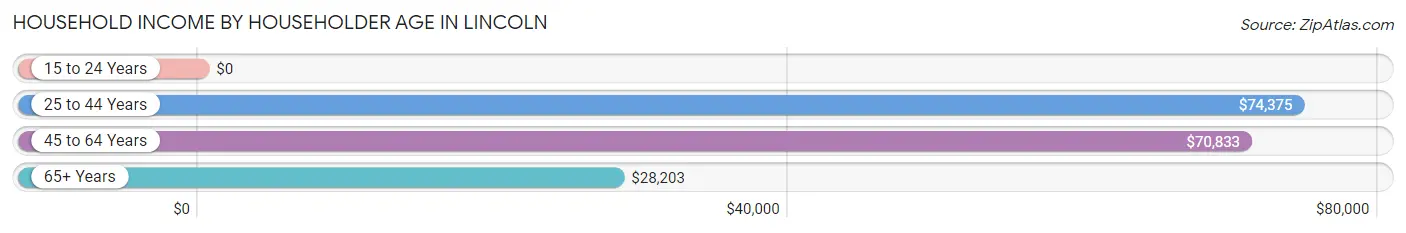
| Income Bracket | # Households | Median Income |
| 15 to 24 Years | 12 (2.8%) | $0 |
| 25 to 44 Years | 178 (41.3%) | $74,375 |
| 45 to 64 Years | 112 (26.0%) | $70,833 |
| 65+ Years | 129 (29.9%) | $28,203 |
| Total | 431 (100.0%) | $58,194 |
Poverty in Lincoln
Income Below Poverty by Sex and Age in Lincoln
With 12.6% poverty level for males and 11.1% for females among the residents of Lincoln, 6 to 11 year old males and under 5 year old females are the most vulnerable to poverty, with 48 males (72.7%) and 20 females (48.8%) in their respective age groups living below the poverty level.
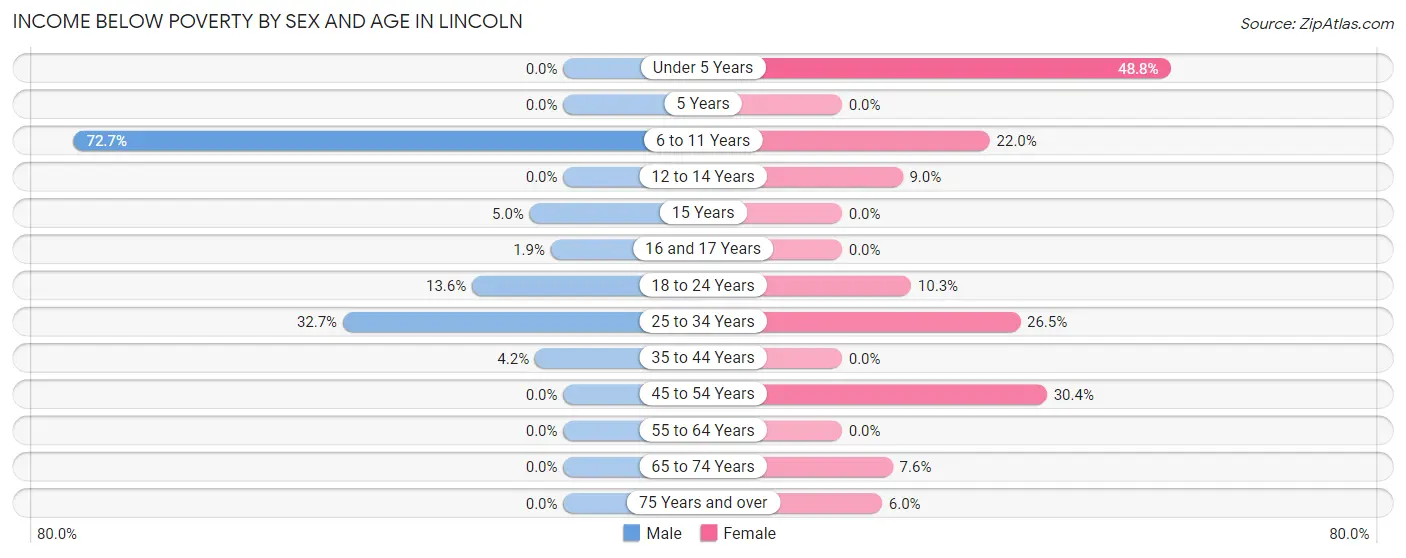
| Age Bracket | Male | Female |
| Under 5 Years | 0 (0.0%) | 20 (48.8%) |
| 5 Years | 0 (0.0%) | 0 (0.0%) |
| 6 to 11 Years | 48 (72.7%) | 9 (22.0%) |
| 12 to 14 Years | 0 (0.0%) | 10 (9.0%) |
| 15 Years | 4 (5.0%) | 0 (0.0%) |
| 16 and 17 Years | 2 (1.9%) | 0 (0.0%) |
| 18 to 24 Years | 8 (13.6%) | 4 (10.3%) |
| 25 to 34 Years | 18 (32.7%) | 18 (26.5%) |
| 35 to 44 Years | 4 (4.2%) | 0 (0.0%) |
| 45 to 54 Years | 0 (0.0%) | 14 (30.4%) |
| 55 to 64 Years | 0 (0.0%) | 0 (0.0%) |
| 65 to 74 Years | 0 (0.0%) | 4 (7.5%) |
| 75 Years and over | 0 (0.0%) | 5 (5.9%) |
| Total | 84 (12.6%) | 84 (11.1%) |
Income Above Poverty by Sex and Age in Lincoln
According to the poverty statistics in Lincoln, males aged under 5 years and females aged 5 years are the age groups that are most secure financially, with 100.0% of males and 100.0% of females in these age groups living above the poverty line.
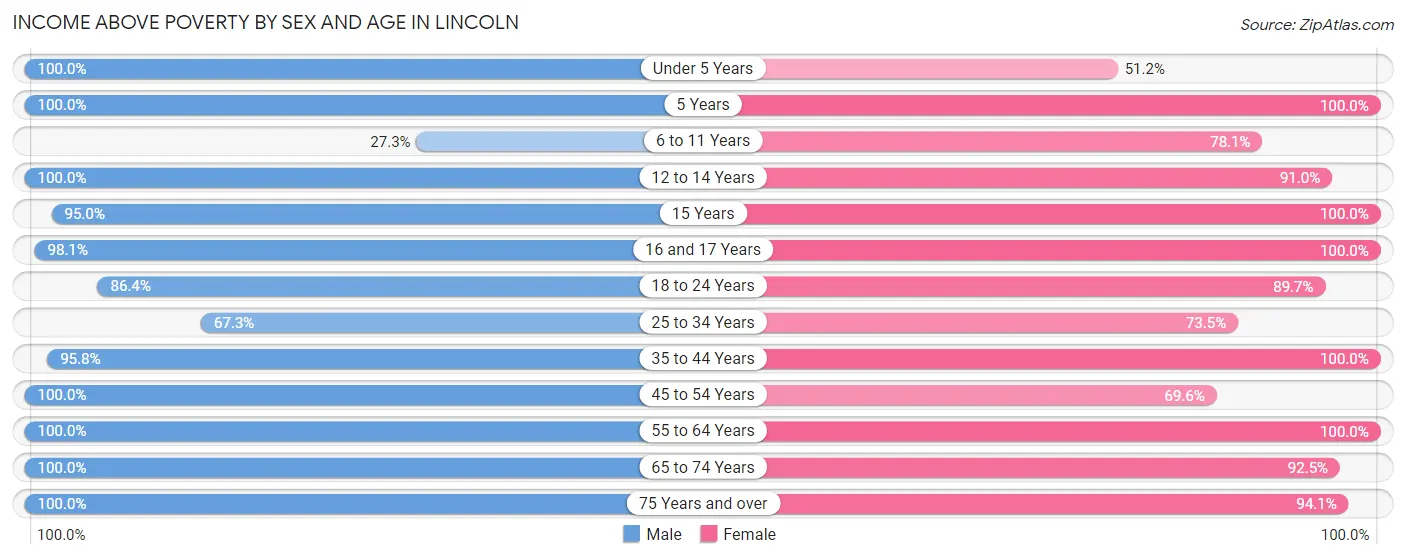
| Age Bracket | Male | Female |
| Under 5 Years | 8 (100.0%) | 21 (51.2%) |
| 5 Years | 36 (100.0%) | 4 (100.0%) |
| 6 to 11 Years | 18 (27.3%) | 32 (78.0%) |
| 12 to 14 Years | 25 (100.0%) | 101 (91.0%) |
| 15 Years | 76 (95.0%) | 5 (100.0%) |
| 16 and 17 Years | 105 (98.1%) | 28 (100.0%) |
| 18 to 24 Years | 51 (86.4%) | 35 (89.7%) |
| 25 to 34 Years | 37 (67.3%) | 50 (73.5%) |
| 35 to 44 Years | 91 (95.8%) | 176 (100.0%) |
| 45 to 54 Years | 26 (100.0%) | 32 (69.6%) |
| 55 to 64 Years | 45 (100.0%) | 62 (100.0%) |
| 65 to 74 Years | 36 (100.0%) | 49 (92.4%) |
| 75 Years and over | 31 (100.0%) | 79 (94.1%) |
| Total | 585 (87.4%) | 674 (88.9%) |
Income Below Poverty Among Married-Couple Families in Lincoln
The poverty statistics for married-couple families in Lincoln show that 3.9% or 9 of the total 229 families live below the poverty line. Families with 5 or more children have the highest poverty rate of 100.0%, comprising of 9 families. On the other hand, families with no children have the lowest poverty rate of 0.0%, which includes 0 families.
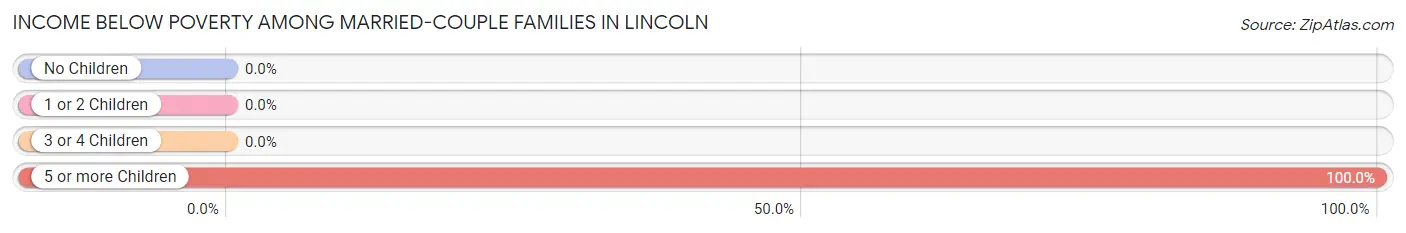
| Children | Above Poverty | Below Poverty |
| No Children | 89 (100.0%) | 0 (0.0%) |
| 1 or 2 Children | 114 (100.0%) | 0 (0.0%) |
| 3 or 4 Children | 17 (100.0%) | 0 (0.0%) |
| 5 or more Children | 0 (0.0%) | 9 (100.0%) |
| Total | 220 (96.1%) | 9 (3.9%) |
Income Below Poverty Among Single-Parent Households in Lincoln
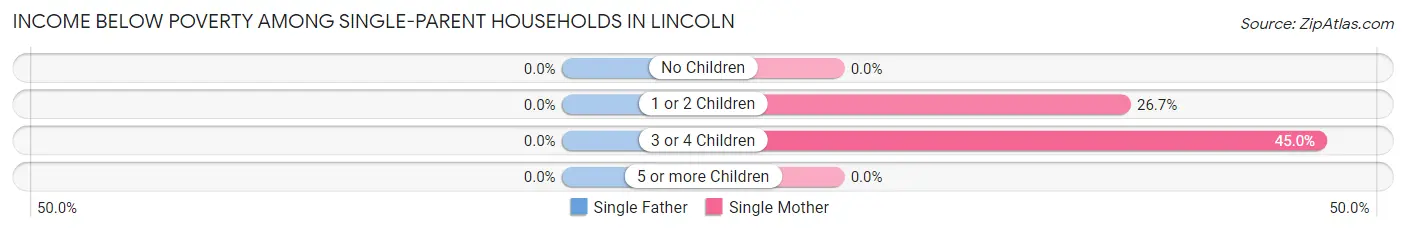
| Children | Single Father | Single Mother |
| No Children | 0 (0.0%) | 0 (0.0%) |
| 1 or 2 Children | 0 (0.0%) | 4 (26.7%) |
| 3 or 4 Children | 0 (0.0%) | 9 (45.0%) |
| 5 or more Children | 0 (0.0%) | 0 (0.0%) |
| Total | 0 (0.0%) | 13 (34.2%) |
Income Below Poverty Among Married-Couple vs Single-Parent Households in Lincoln
The poverty data for Lincoln shows that 9 of the married-couple family households (3.9%) and 13 of the single-parent households (31.7%) are living below the poverty level. Within the married-couple family households, those with 5 or more children have the highest poverty rate, with 9 households (100.0%) falling below the poverty line. Among the single-parent households, those with 3 or 4 children have the highest poverty rate, with 9 household (45.0%) living below poverty.
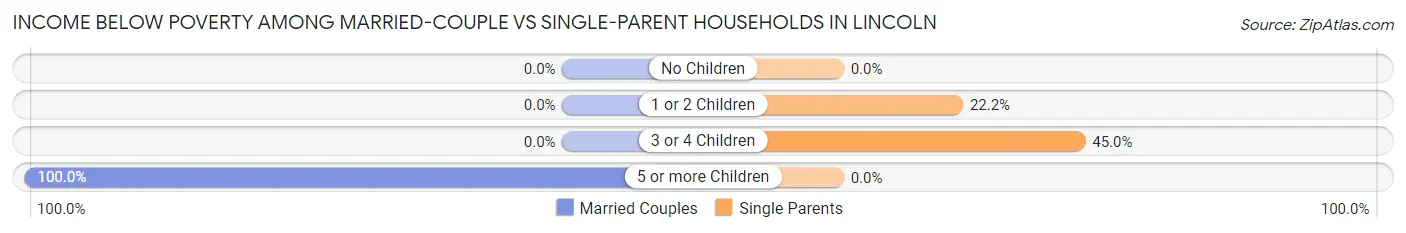
| Children | Married-Couple Families | Single-Parent Households |
| No Children | 0 (0.0%) | 0 (0.0%) |
| 1 or 2 Children | 0 (0.0%) | 4 (22.2%) |
| 3 or 4 Children | 0 (0.0%) | 9 (45.0%) |
| 5 or more Children | 9 (100.0%) | 0 (0.0%) |
| Total | 9 (3.9%) | 13 (31.7%) |
Race in Lincoln
The most populous races in Lincoln are White / Caucasian (1,371 | 91.8%), Black / African American (80 | 5.4%), and Asian (17 | 1.1%).
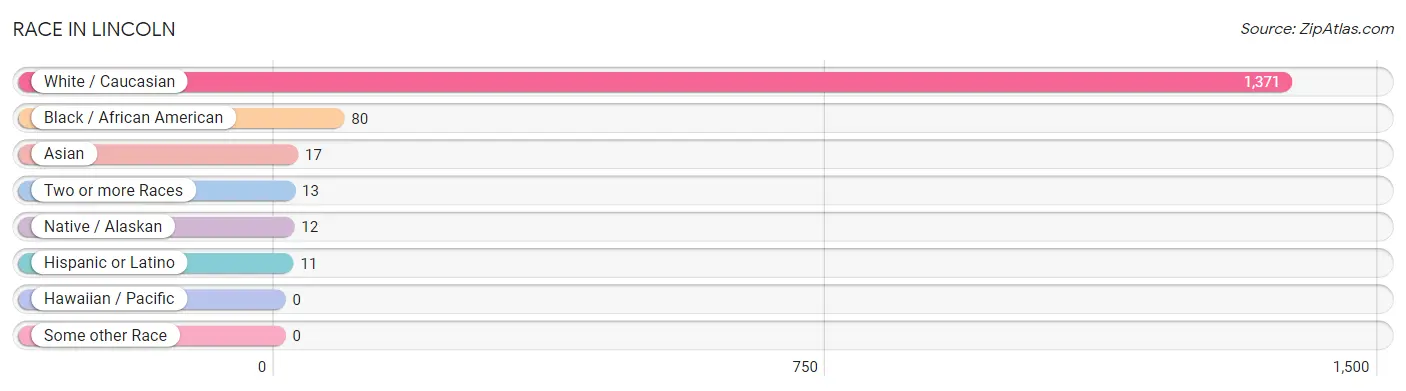
| Race | # Population | % Population |
| Asian | 17 | 1.1% |
| Black / African American | 80 | 5.4% |
| Hawaiian / Pacific | 0 | 0.0% |
| Hispanic or Latino | 11 | 0.7% |
| Native / Alaskan | 12 | 0.8% |
| White / Caucasian | 1,371 | 91.8% |
| Two or more Races | 13 | 0.9% |
| Some other Race | 0 | 0.0% |
| Total | 1,493 | 100.0% |
Ancestry in Lincoln
The most populous ancestries reported in Lincoln are German (219 | 14.7%), English (191 | 12.8%), Irish (89 | 6.0%), American (88 | 5.9%), and French Canadian (60 | 4.0%), together accounting for 43.3% of all Lincoln residents.
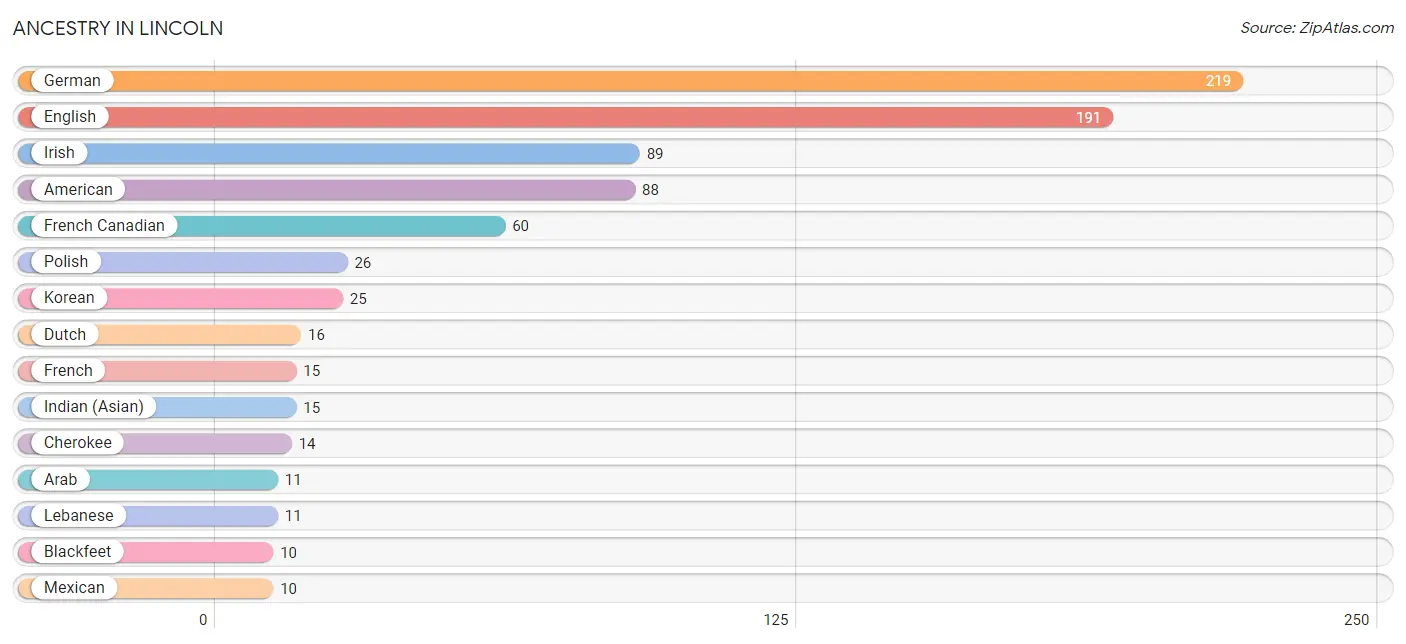
| Ancestry | # Population | % Population |
| American | 88 | 5.9% |
| Arab | 11 | 0.7% |
| Blackfeet | 10 | 0.7% |
| British | 3 | 0.2% |
| Cherokee | 14 | 0.9% |
| Dutch | 16 | 1.1% |
| Eastern European | 8 | 0.5% |
| English | 191 | 12.8% |
| French | 15 | 1.0% |
| French Canadian | 60 | 4.0% |
| German | 219 | 14.7% |
| Indian (Asian) | 15 | 1.0% |
| Irish | 89 | 6.0% |
| Italian | 4 | 0.3% |
| Korean | 25 | 1.7% |
| Lebanese | 11 | 0.7% |
| Mexican | 10 | 0.7% |
| Polish | 26 | 1.7% |
| Scotch-Irish | 9 | 0.6% |
| Scottish | 7 | 0.5% |
| Swedish | 2 | 0.1% |
| Swiss | 3 | 0.2% |
| Ukrainian | 4 | 0.3% |
| Welsh | 3 | 0.2% | View All 24 Rows |
Immigrants in Lincoln
The most numerous immigrant groups reported in Lincoln came from Asia (17 | 1.1%), Philippines (17 | 1.1%), South Eastern Asia (17 | 1.1%), Canada (8 | 0.5%), and Europe (7 | 0.5%), together accounting for 4.4% of all Lincoln residents.
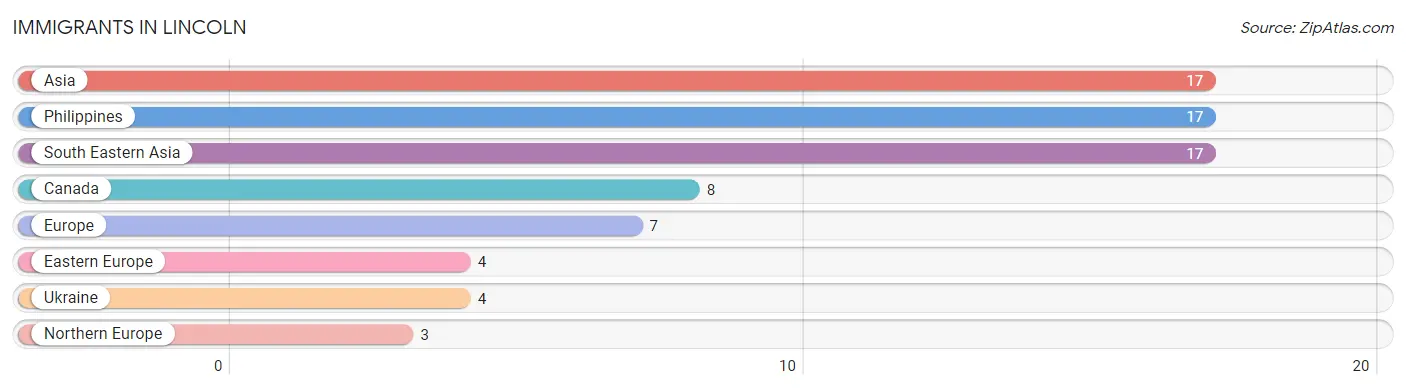
| Immigration Origin | # Population | % Population |
| Asia | 17 | 1.1% |
| Canada | 8 | 0.5% |
| Eastern Europe | 4 | 0.3% |
| Europe | 7 | 0.5% |
| Northern Europe | 3 | 0.2% |
| Philippines | 17 | 1.1% |
| South Eastern Asia | 17 | 1.1% |
| Ukraine | 4 | 0.3% | View All 8 Rows |
Sex and Age in Lincoln
Sex and Age in Lincoln
The most populous age groups in Lincoln are 15 to 19 Years (206 | 30.8%) for men and 35 to 39 Years (142 | 17.2%) for women.
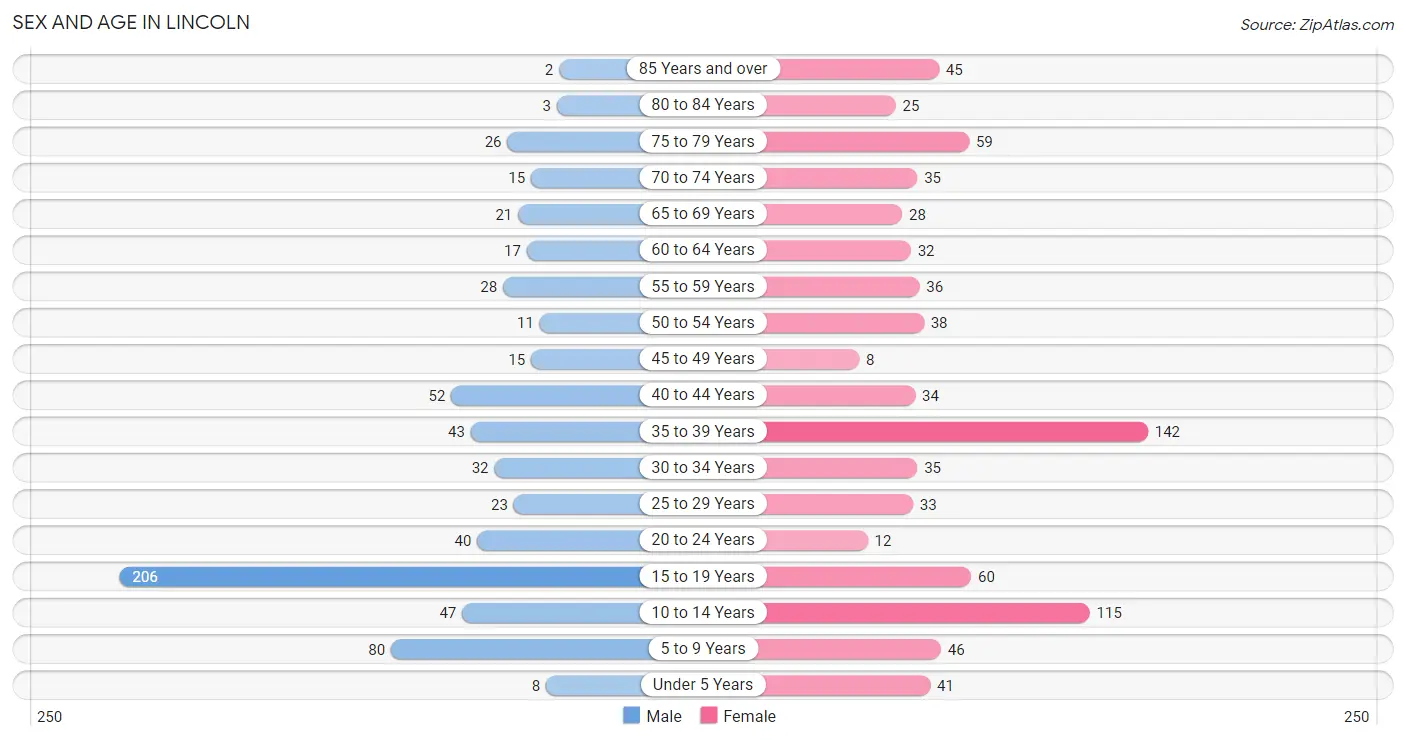
| Age Bracket | Male | Female |
| Under 5 Years | 8 (1.2%) | 41 (5.0%) |
| 5 to 9 Years | 80 (12.0%) | 46 (5.6%) |
| 10 to 14 Years | 47 (7.0%) | 115 (14.0%) |
| 15 to 19 Years | 206 (30.8%) | 60 (7.3%) |
| 20 to 24 Years | 40 (6.0%) | 12 (1.5%) |
| 25 to 29 Years | 23 (3.4%) | 33 (4.0%) |
| 30 to 34 Years | 32 (4.8%) | 35 (4.3%) |
| 35 to 39 Years | 43 (6.4%) | 142 (17.2%) |
| 40 to 44 Years | 52 (7.8%) | 34 (4.1%) |
| 45 to 49 Years | 15 (2.2%) | 8 (1.0%) |
| 50 to 54 Years | 11 (1.6%) | 38 (4.6%) |
| 55 to 59 Years | 28 (4.2%) | 36 (4.4%) |
| 60 to 64 Years | 17 (2.5%) | 32 (3.9%) |
| 65 to 69 Years | 21 (3.1%) | 28 (3.4%) |
| 70 to 74 Years | 15 (2.2%) | 35 (4.3%) |
| 75 to 79 Years | 26 (3.9%) | 59 (7.2%) |
| 80 to 84 Years | 3 (0.4%) | 25 (3.0%) |
| 85 Years and over | 2 (0.3%) | 45 (5.5%) |
| Total | 669 (100.0%) | 824 (100.0%) |
Families and Households in Lincoln
Median Family Size in Lincoln
The median family size in Lincoln is 4.47 persons per family, with single female/mother families (38 | 14.1%) accounting for the largest median family size of 5.24 persons per family. On the other hand, single male/father families (3 | 1.1%) represent the smallest median family size with 3.00 persons per family.
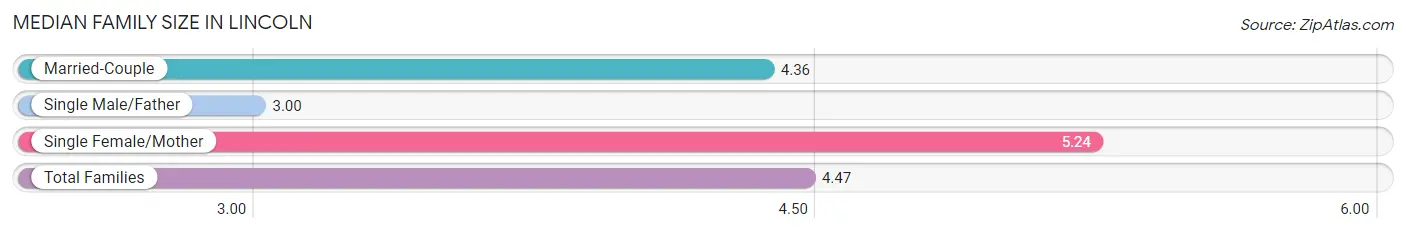
| Family Type | # Families | Family Size |
| Married-Couple | 229 (84.8%) | 4.36 |
| Single Male/Father | 3 (1.1%) | 3.00 |
| Single Female/Mother | 38 (14.1%) | 5.24 |
| Total Families | 270 (100.0%) | 4.47 |
Median Household Size in Lincoln
The median household size in Lincoln is 3.31 persons per household, with single female/mother households (38 | 8.8%) accounting for the largest median household size of 5.76 persons per household. non-family households (161 | 37.3%) represent the smallest median household size with 1.20 persons per household.
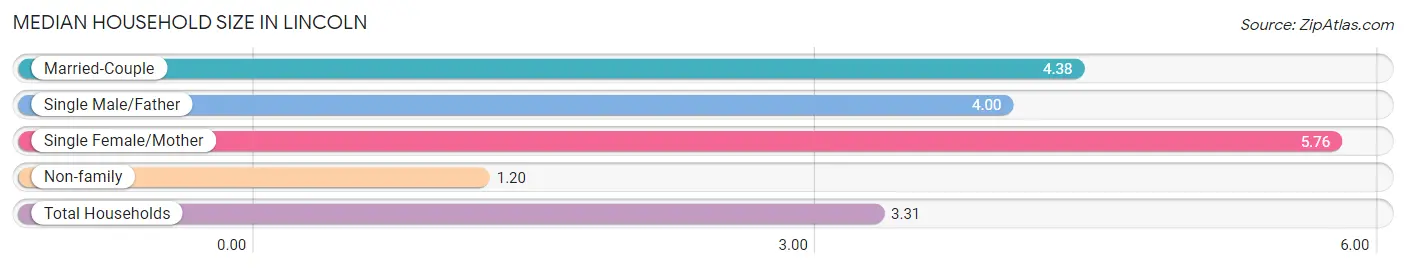
| Household Type | # Households | Household Size |
| Married-Couple | 229 (53.1%) | 4.38 |
| Single Male/Father | 3 (0.7%) | 4.00 |
| Single Female/Mother | 38 (8.8%) | 5.76 |
| Non-family | 161 (37.3%) | 1.20 |
| Total Households | 431 (100.0%) | 3.31 |
Household Size by Marriage Status in Lincoln
Out of a total of 431 households in Lincoln, 270 (62.6%) are family households, while 161 (37.3%) are nonfamily households. The most numerous type of family households are 4-person households, comprising 130, and the most common type of nonfamily households are 1-person households, comprising 134.
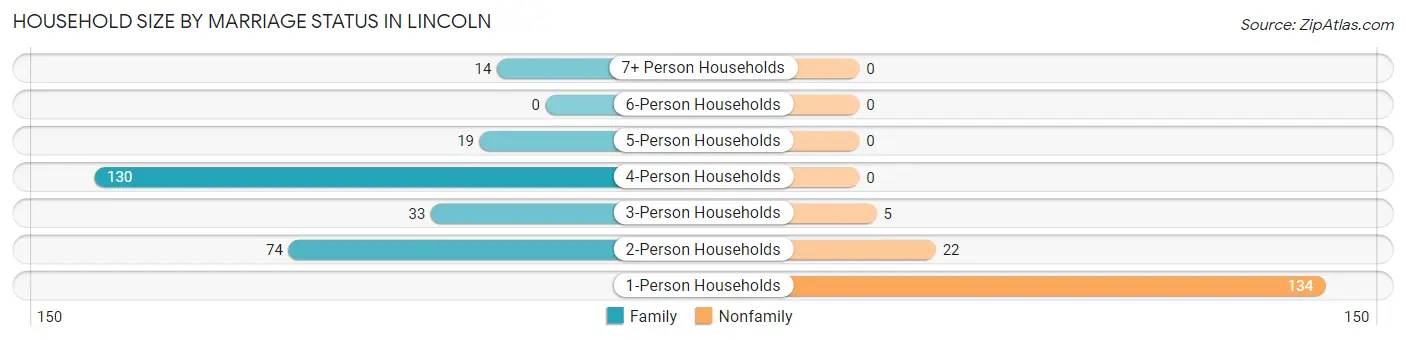
| Household Size | Family Households | Nonfamily Households |
| 1-Person Households | - | 134 (31.1%) |
| 2-Person Households | 74 (17.2%) | 22 (5.1%) |
| 3-Person Households | 33 (7.7%) | 5 (1.2%) |
| 4-Person Households | 130 (30.2%) | 0 (0.0%) |
| 5-Person Households | 19 (4.4%) | 0 (0.0%) |
| 6-Person Households | 0 (0.0%) | 0 (0.0%) |
| 7+ Person Households | 14 (3.3%) | 0 (0.0%) |
| Total | 270 (62.6%) | 161 (37.3%) |
Female Fertility in Lincoln
Fertility by Age in Lincoln
Average fertility rate in Lincoln is 15.0 births per 1,000 women. Women in the age bracket of 20 to 34 years have the highest fertility rate with 63.0 births per 1,000 women. Women in the age bracket of 20 to 34 years acount for 100.0% of all women with births.
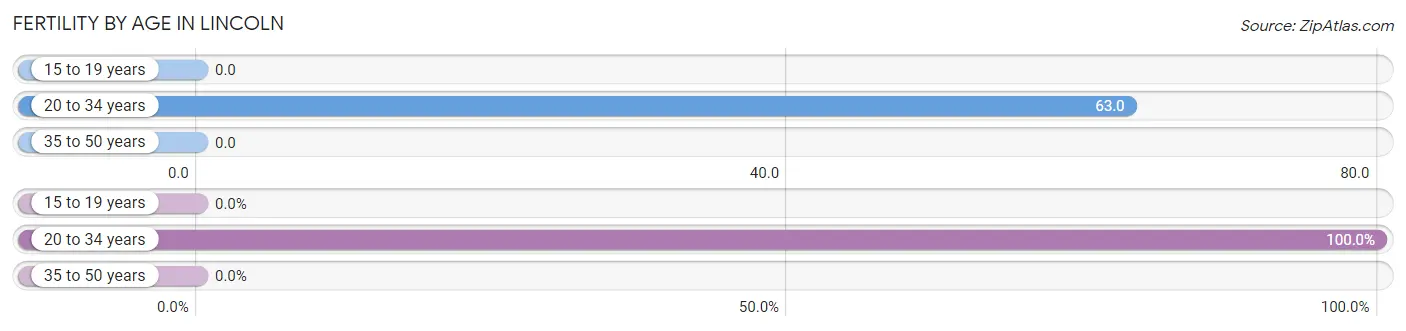
| Age Bracket | Women with Births | Births / 1,000 Women |
| 15 to 19 years | 0 (0.0%) | 0.0 |
| 20 to 34 years | 5 (100.0%) | 63.0 |
| 35 to 50 years | 0 (0.0%) | 0.0 |
| Total | 5 (100.0%) | 15.0 |
Fertility by Age by Marriage Status in Lincoln
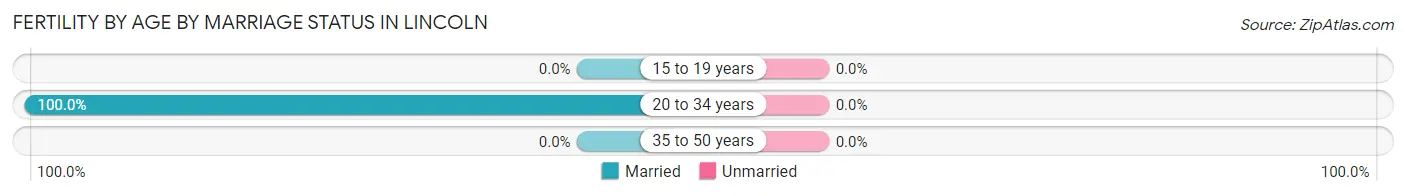
| Age Bracket | Married | Unmarried |
| 15 to 19 years | 0 (0.0%) | 0 (0.0%) |
| 20 to 34 years | 5 (100.0%) | 0 (0.0%) |
| 35 to 50 years | 0 (0.0%) | 0 (0.0%) |
| Total | 5 (100.0%) | 0 (0.0%) |
Fertility by Education in Lincoln
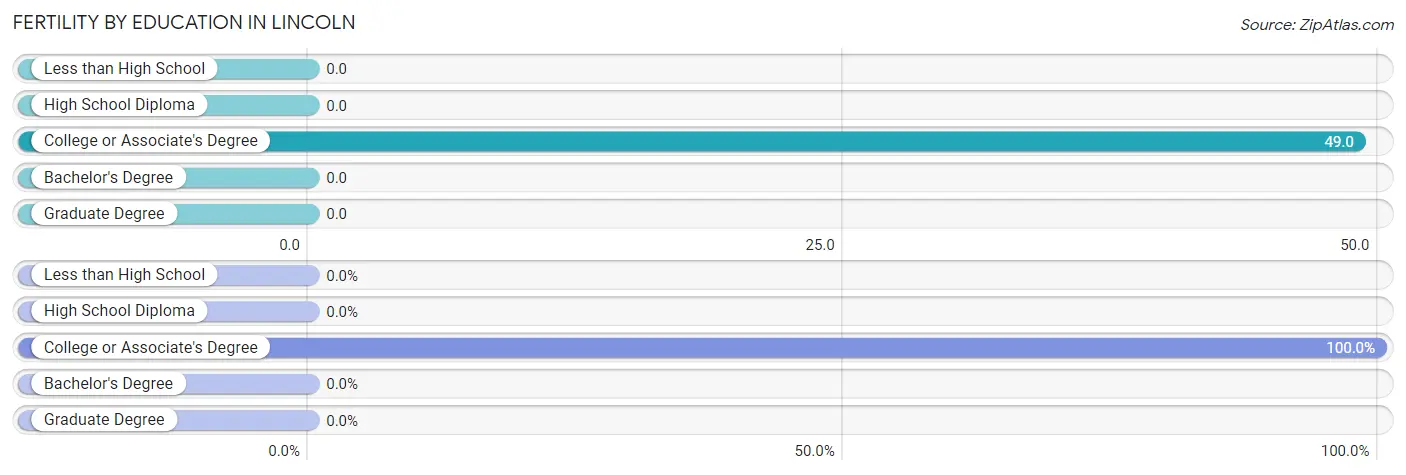
| Educational Attainment | Women with Births | Births / 1,000 Women |
| Less than High School | 0 (0.0%) | 0.0 |
| High School Diploma | 0 (0.0%) | 0.0 |
| College or Associate's Degree | 5 (100.0%) | 49.0 |
| Bachelor's Degree | 0 (0.0%) | 0.0 |
| Graduate Degree | 0 (0.0%) | 0.0 |
| Total | 5 (100.0%) | 15.0 |
Fertility by Education by Marriage Status in Lincoln
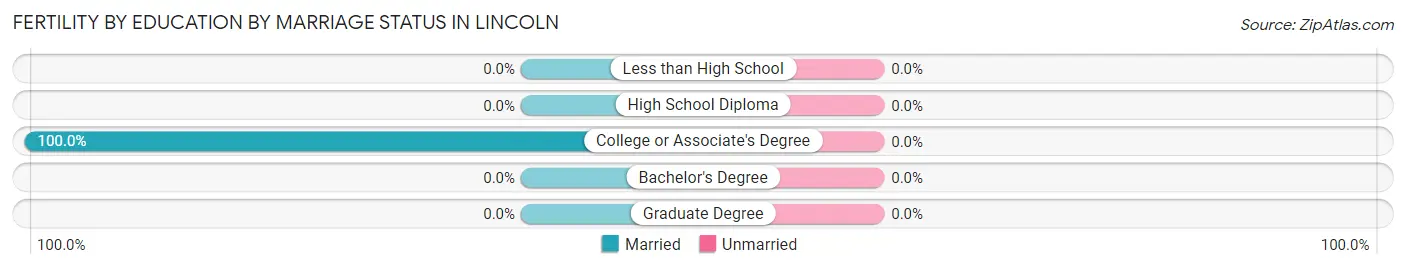
| Educational Attainment | Married | Unmarried |
| Less than High School | 0 (0.0%) | 0 (0.0%) |
| High School Diploma | 0 (0.0%) | 0 (0.0%) |
| College or Associate's Degree | 5 (100.0%) | 0 (0.0%) |
| Bachelor's Degree | 0 (0.0%) | 0 (0.0%) |
| Graduate Degree | 0 (0.0%) | 0 (0.0%) |
| Total | 5 (100.0%) | 0 (0.0%) |
Employment Characteristics in Lincoln
Employment by Class of Employer in Lincoln
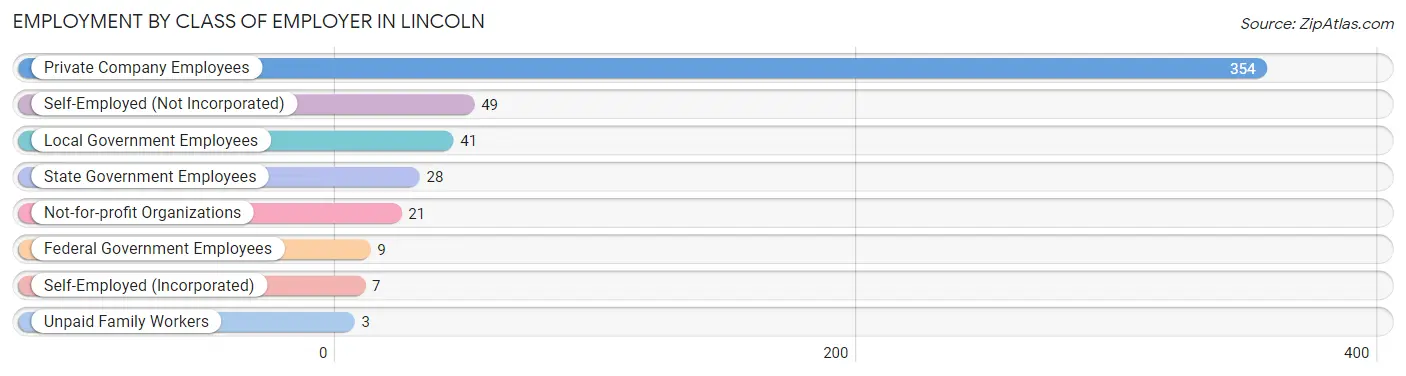
Among the 512 employed individuals in Lincoln, private company employees (354 | 69.1%), self-employed (not incorporated) (49 | 9.6%), and local government employees (41 | 8.0%) make up the most common classes of employment.
| Employer Class | # Employees | % Employees |
| Private Company Employees | 354 | 69.1% |
| Self-Employed (Incorporated) | 7 | 1.4% |
| Self-Employed (Not Incorporated) | 49 | 9.6% |
| Not-for-profit Organizations | 21 | 4.1% |
| Local Government Employees | 41 | 8.0% |
| State Government Employees | 28 | 5.5% |
| Federal Government Employees | 9 | 1.8% |
| Unpaid Family Workers | 3 | 0.6% |
| Total | 512 | 100.0% |
Employment Status by Age in Lincoln
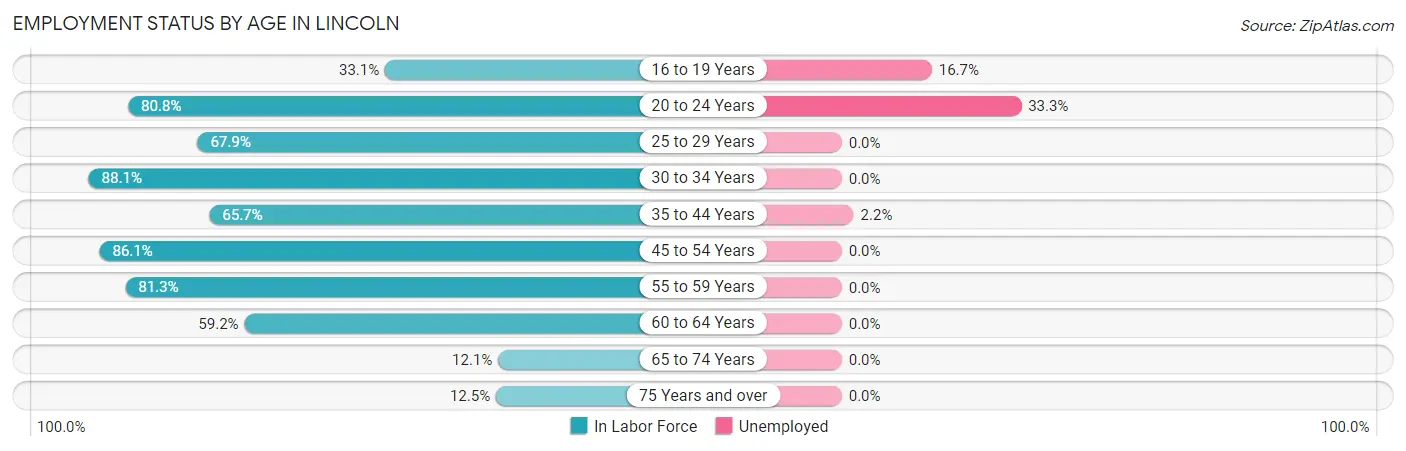
According to the labor force statistics for Lincoln, out of the total population over 16 years of age (1,071), 51.5% or 552 individuals are in the labor force, with 5.1% or 28 of them unemployed. The age group with the highest labor force participation rate is 30 to 34 years, with 88.1% or 59 individuals in the labor force. Within the labor force, the 20 to 24 years age range has the highest percentage of unemployed individuals, with 33.3% or 14 of them being unemployed.
| Age Bracket | In Labor Force | Unemployed |
| 16 to 19 Years | 60 (33.1%) | 10 (16.7%) |
| 20 to 24 Years | 42 (80.8%) | 14 (33.3%) |
| 25 to 29 Years | 38 (67.9%) | 0 (0.0%) |
| 30 to 34 Years | 59 (88.1%) | 0 (0.0%) |
| 35 to 44 Years | 178 (65.7%) | 4 (2.2%) |
| 45 to 54 Years | 62 (86.1%) | 0 (0.0%) |
| 55 to 59 Years | 52 (81.3%) | 0 (0.0%) |
| 60 to 64 Years | 29 (59.2%) | 0 (0.0%) |
| 65 to 74 Years | 12 (12.1%) | 0 (0.0%) |
| 75 Years and over | 20 (12.5%) | 0 (0.0%) |
| Total | 552 (51.5%) | 28 (5.1%) |
Employment Status by Educational Attainment in Lincoln
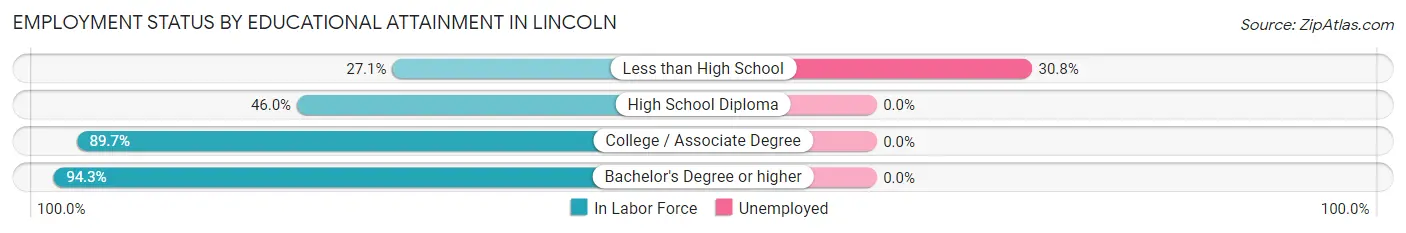
According to labor force statistics for Lincoln, 72.2% of individuals (418) out of the total population between 25 and 64 years of age (579) are in the labor force, with 1.0% or 4 of them being unemployed. The group with the highest labor force participation rate are those with the educational attainment of bachelor's degree or higher, with 94.3% or 99 individuals in the labor force. Within the labor force, individuals with less than high school education have the highest percentage of unemployment, with 30.8% or 4 of them being unemployed.
| Educational Attainment | In Labor Force | Unemployed |
| Less than High School | 13 (27.1%) | 15 (30.8%) |
| High School Diploma | 80 (46.0%) | 0 (0.0%) |
| College / Associate Degree | 226 (89.7%) | 0 (0.0%) |
| Bachelor's Degree or higher | 99 (94.3%) | 0 (0.0%) |
| Total | 418 (72.2%) | 6 (1.0%) |
Employment Occupations by Sex in Lincoln
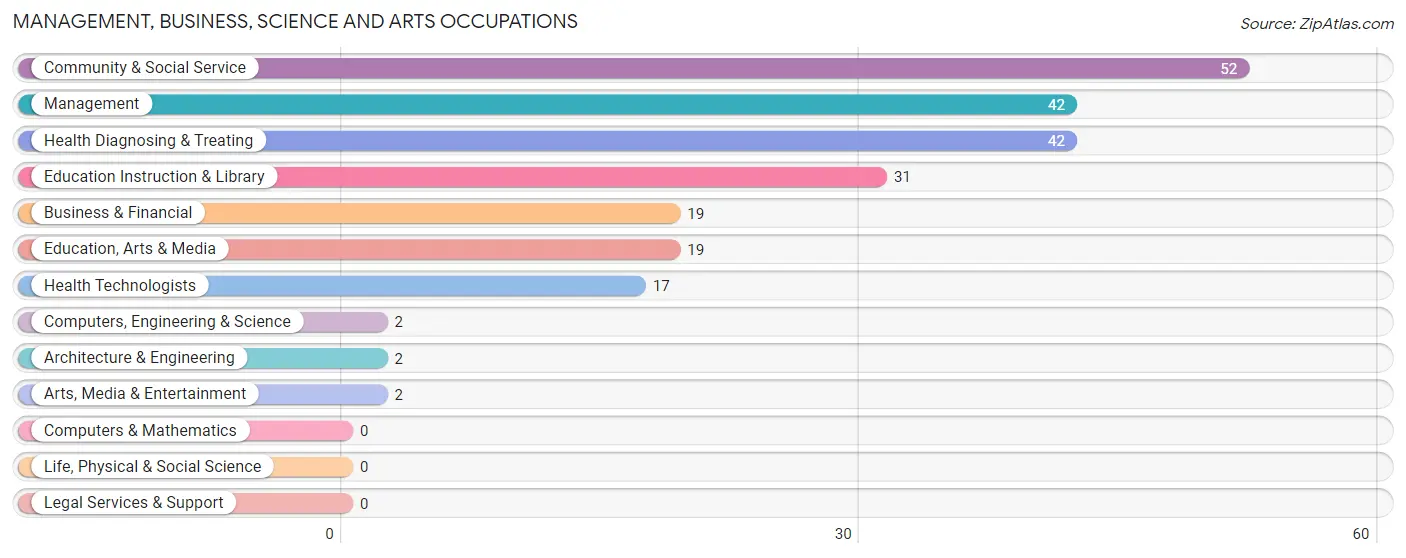
Management, Business, Science and Arts Occupations
The most common Management, Business, Science and Arts occupations in Lincoln are Community & Social Service (52 | 9.9%), Management (42 | 8.0%), Health Diagnosing & Treating (42 | 8.0%), Education Instruction & Library (31 | 5.9%), and Business & Financial (19 | 3.6%).
Management, Business, Science and Arts Occupations by Sex
Within the Management, Business, Science and Arts occupations in Lincoln, the most male-oriented occupations are Computers, Engineering & Science (100.0%), Architecture & Engineering (100.0%), and Arts, Media & Entertainment (100.0%), while the most female-oriented occupations are Education Instruction & Library (100.0%), Health Diagnosing & Treating (88.1%), and Community & Social Service (86.5%).
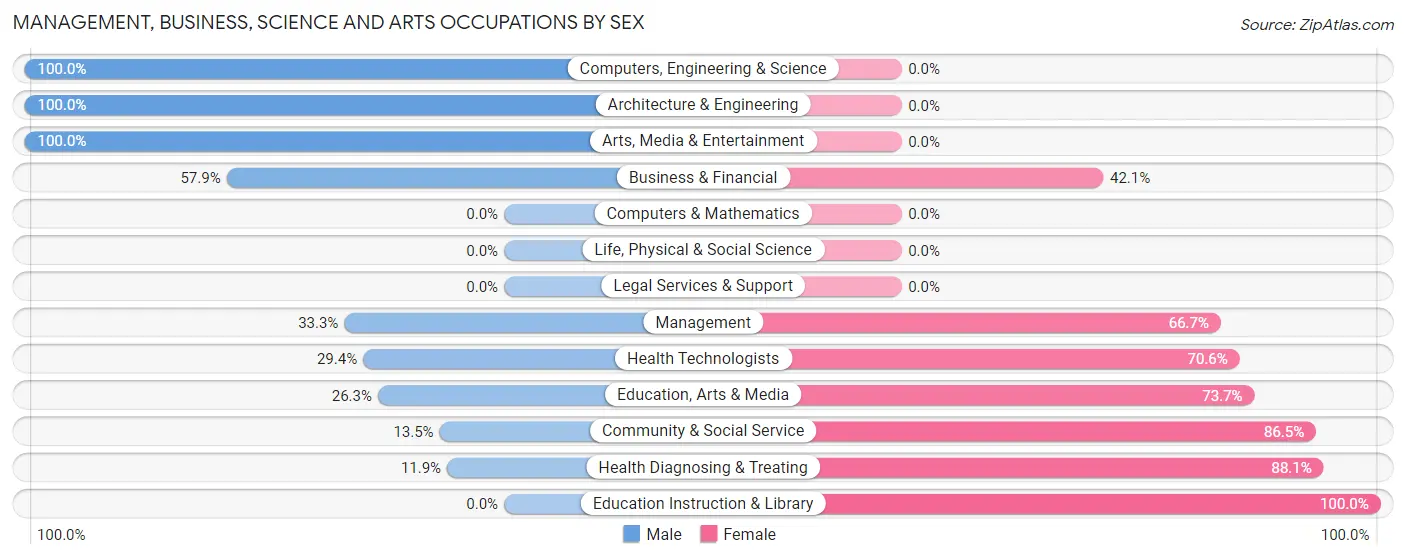
| Occupation | Male | Female |
| Management | 14 (33.3%) | 28 (66.7%) |
| Business & Financial | 11 (57.9%) | 8 (42.1%) |
| Computers, Engineering & Science | 2 (100.0%) | 0 (0.0%) |
| Computers & Mathematics | 0 (0.0%) | 0 (0.0%) |
| Architecture & Engineering | 2 (100.0%) | 0 (0.0%) |
| Life, Physical & Social Science | 0 (0.0%) | 0 (0.0%) |
| Community & Social Service | 7 (13.5%) | 45 (86.5%) |
| Education, Arts & Media | 5 (26.3%) | 14 (73.7%) |
| Legal Services & Support | 0 (0.0%) | 0 (0.0%) |
| Education Instruction & Library | 0 (0.0%) | 31 (100.0%) |
| Arts, Media & Entertainment | 2 (100.0%) | 0 (0.0%) |
| Health Diagnosing & Treating | 5 (11.9%) | 37 (88.1%) |
| Health Technologists | 5 (29.4%) | 12 (70.6%) |
| Total (Category) | 39 (24.8%) | 118 (75.2%) |
| Total (Overall) | 249 (47.5%) | 275 (52.5%) |
Services Occupations
The most common Services occupations in Lincoln are Food Preparation & Serving (63 | 12.0%), Cleaning & Maintenance (22 | 4.2%), Healthcare Support (17 | 3.2%), Security & Protection (4 | 0.8%), and Law Enforcement (4 | 0.8%).
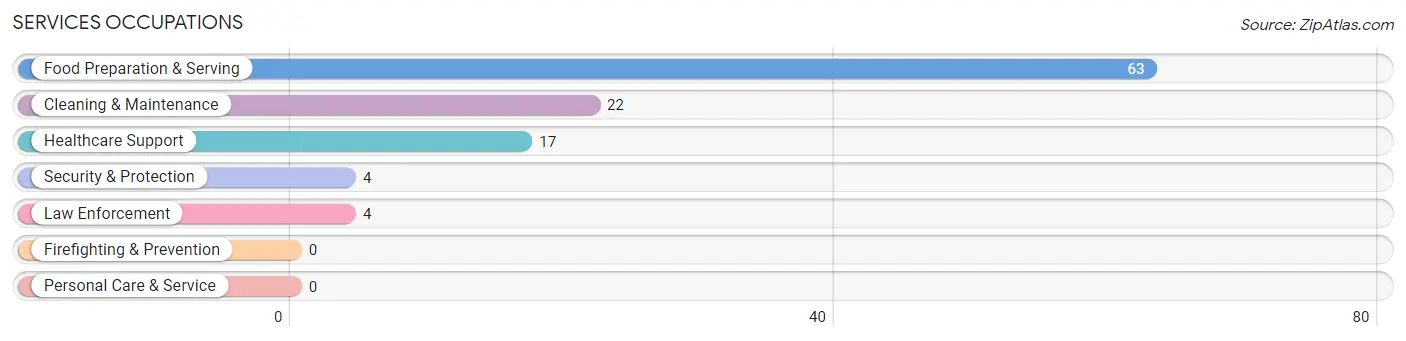
Services Occupations by Sex
Within the Services occupations in Lincoln, the most male-oriented occupations are Security & Protection (100.0%), Law Enforcement (100.0%), and Cleaning & Maintenance (100.0%), while the most female-oriented occupations are Healthcare Support (82.4%), and Food Preparation & Serving (57.1%).
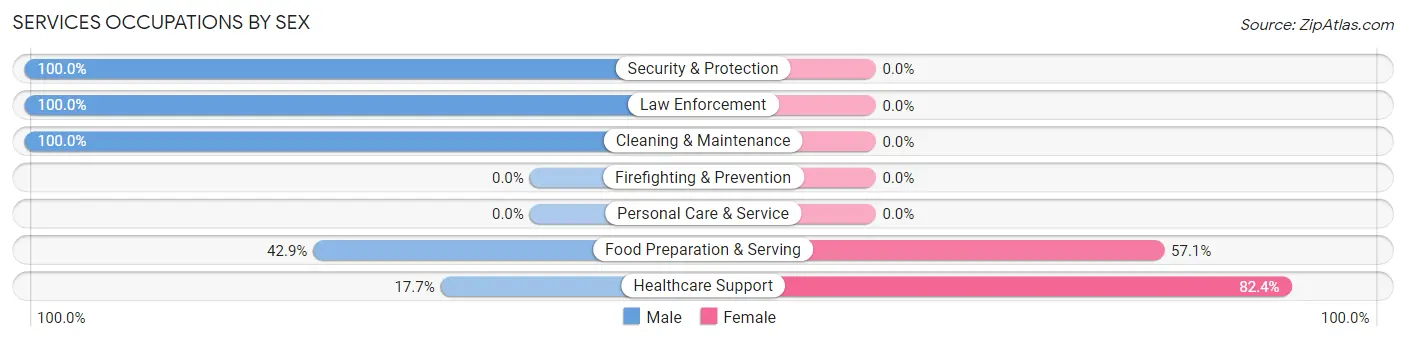
| Occupation | Male | Female |
| Healthcare Support | 3 (17.6%) | 14 (82.4%) |
| Security & Protection | 4 (100.0%) | 0 (0.0%) |
| Firefighting & Prevention | 0 (0.0%) | 0 (0.0%) |
| Law Enforcement | 4 (100.0%) | 0 (0.0%) |
| Food Preparation & Serving | 27 (42.9%) | 36 (57.1%) |
| Cleaning & Maintenance | 22 (100.0%) | 0 (0.0%) |
| Personal Care & Service | 0 (0.0%) | 0 (0.0%) |
| Total (Category) | 56 (52.8%) | 50 (47.2%) |
| Total (Overall) | 249 (47.5%) | 275 (52.5%) |
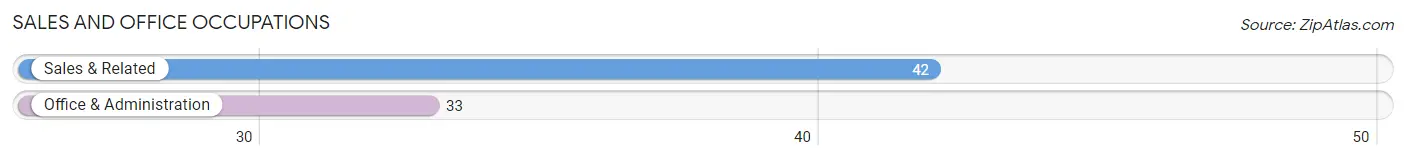
Sales and Office Occupations
The most common Sales and Office occupations in Lincoln are Sales & Related (42 | 8.0%), and Office & Administration (33 | 6.3%).
Sales and Office Occupations by Sex
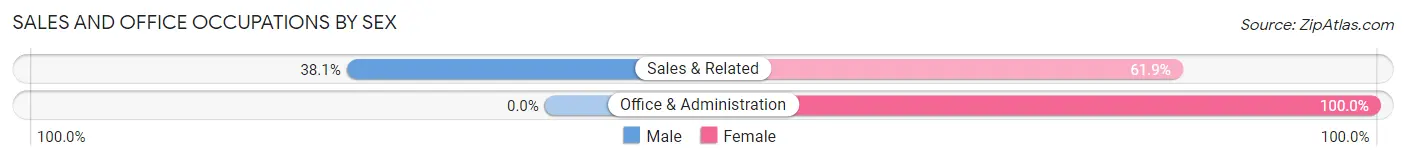
| Occupation | Male | Female |
| Sales & Related | 16 (38.1%) | 26 (61.9%) |
| Office & Administration | 0 (0.0%) | 33 (100.0%) |
| Total (Category) | 16 (21.3%) | 59 (78.7%) |
| Total (Overall) | 249 (47.5%) | 275 (52.5%) |
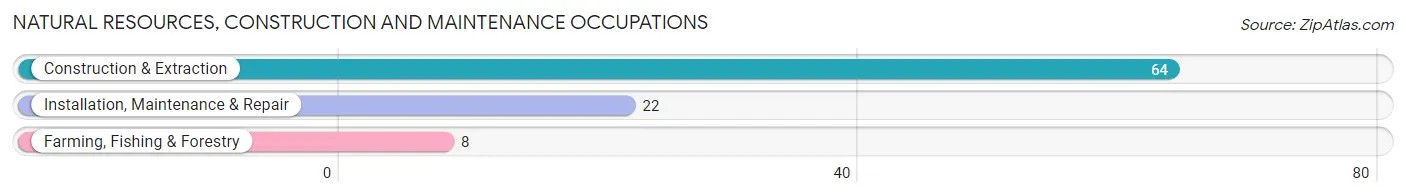
Natural Resources, Construction and Maintenance Occupations
The most common Natural Resources, Construction and Maintenance occupations in Lincoln are Construction & Extraction (64 | 12.2%), Installation, Maintenance & Repair (22 | 4.2%), and Farming, Fishing & Forestry (8 | 1.5%).
Natural Resources, Construction and Maintenance Occupations by Sex
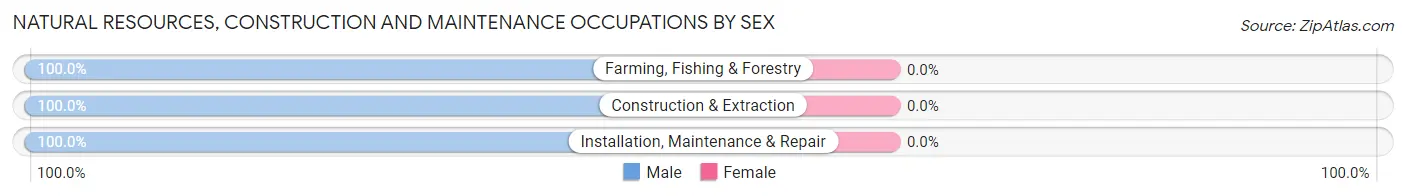
| Occupation | Male | Female |
| Farming, Fishing & Forestry | 8 (100.0%) | 0 (0.0%) |
| Construction & Extraction | 64 (100.0%) | 0 (0.0%) |
| Installation, Maintenance & Repair | 22 (100.0%) | 0 (0.0%) |
| Total (Category) | 94 (100.0%) | 0 (0.0%) |
| Total (Overall) | 249 (47.5%) | 275 (52.5%) |
Production, Transportation and Moving Occupations
The most common Production, Transportation and Moving occupations in Lincoln are Production (51 | 9.7%), Material Moving (26 | 5.0%), and Transportation (15 | 2.9%).
Production, Transportation and Moving Occupations by Sex
| Occupation | Male | Female |
| Production | 13 (25.5%) | 38 (74.5%) |
| Transportation | 12 (80.0%) | 3 (20.0%) |
| Material Moving | 19 (73.1%) | 7 (26.9%) |
| Total (Category) | 44 (47.8%) | 48 (52.2%) |
| Total (Overall) | 249 (47.5%) | 275 (52.5%) |
Employment Industries by Sex in Lincoln
Employment Industries in Lincoln
The major employment industries in Lincoln include Health Care & Social Assistance (102 | 19.5%), Construction (77 | 14.7%), Accommodation & Food Services (66 | 12.6%), Manufacturing (59 | 11.3%), and Public Administration (47 | 9.0%).
Employment Industries by Sex in Lincoln
The Lincoln industries that see more men than women are Agriculture, Fishing & Hunting (100.0%), Construction (100.0%), and Transportation & Warehousing (84.2%), whereas the industries that tend to have a higher number of women are Professional & Scientific (100.0%), Health Care & Social Assistance (92.2%), and Public Administration (91.5%).
| Industry | Male | Female |
| Agriculture, Fishing & Hunting | 8 (100.0%) | 0 (0.0%) |
| Mining, Quarrying, & Extraction | 0 (0.0%) | 0 (0.0%) |
| Construction | 77 (100.0%) | 0 (0.0%) |
| Manufacturing | 38 (64.4%) | 21 (35.6%) |
| Wholesale Trade | 14 (77.8%) | 4 (22.2%) |
| Retail Trade | 15 (40.5%) | 22 (59.5%) |
| Transportation & Warehousing | 16 (84.2%) | 3 (15.8%) |
| Utilities | 0 (0.0%) | 0 (0.0%) |
| Information | 0 (0.0%) | 0 (0.0%) |
| Finance & Insurance | 4 (36.4%) | 7 (63.6%) |
| Real Estate, Rental & Leasing | 0 (0.0%) | 0 (0.0%) |
| Professional & Scientific | 0 (0.0%) | 8 (100.0%) |
| Enterprise Management | 0 (0.0%) | 0 (0.0%) |
| Administrative & Support | 18 (66.7%) | 9 (33.3%) |
| Educational Services | 8 (26.7%) | 22 (73.3%) |
| Health Care & Social Assistance | 8 (7.8%) | 94 (92.2%) |
| Arts, Entertainment & Recreation | 0 (0.0%) | 0 (0.0%) |
| Accommodation & Food Services | 24 (36.4%) | 42 (63.6%) |
| Public Administration | 4 (8.5%) | 43 (91.5%) |
| Total | 249 (47.5%) | 275 (52.5%) |
Education in Lincoln
School Enrollment in Lincoln
The most common levels of schooling among the 531 students in Lincoln are high school (230 | 43.3%), middle school (147 | 27.7%), and elementary school (91 | 17.1%).
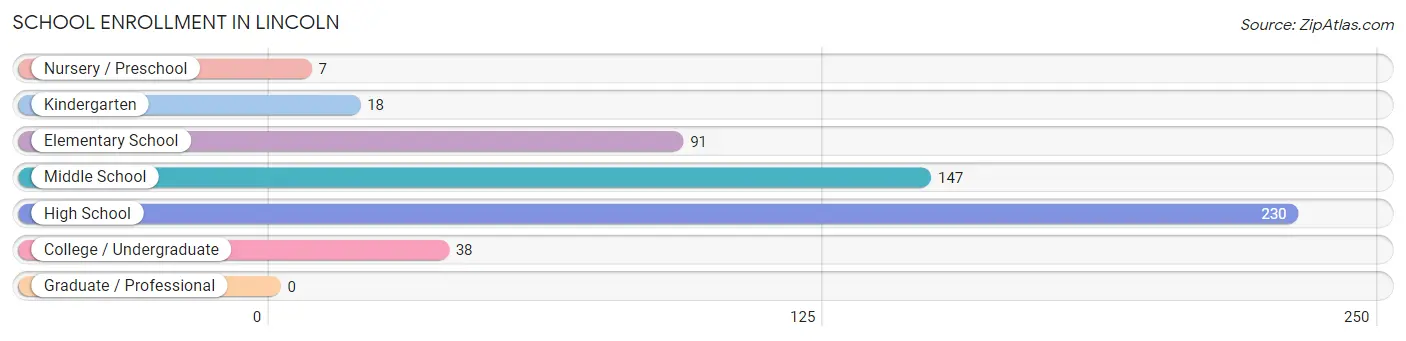
| School Level | # Students | % Students |
| Nursery / Preschool | 7 | 1.3% |
| Kindergarten | 18 | 3.4% |
| Elementary School | 91 | 17.1% |
| Middle School | 147 | 27.7% |
| High School | 230 | 43.3% |
| College / Undergraduate | 38 | 7.2% |
| Graduate / Professional | 0 | 0.0% |
| Total | 531 | 100.0% |
School Enrollment by Age by Funding Source in Lincoln
Out of a total of 531 students who are enrolled in schools in Lincoln, 23 (4.3%) attend a private institution, while the remaining 508 (95.7%) are enrolled in public schools. The age group of 35 years and over has the highest likelihood of being enrolled in private schools, with 3 (100.0% in the age bracket) enrolled. Conversely, the age group of 5 to 9 year old has the lowest likelihood of being enrolled in a private school, with 90 (100.0% in the age bracket) attending a public institution.
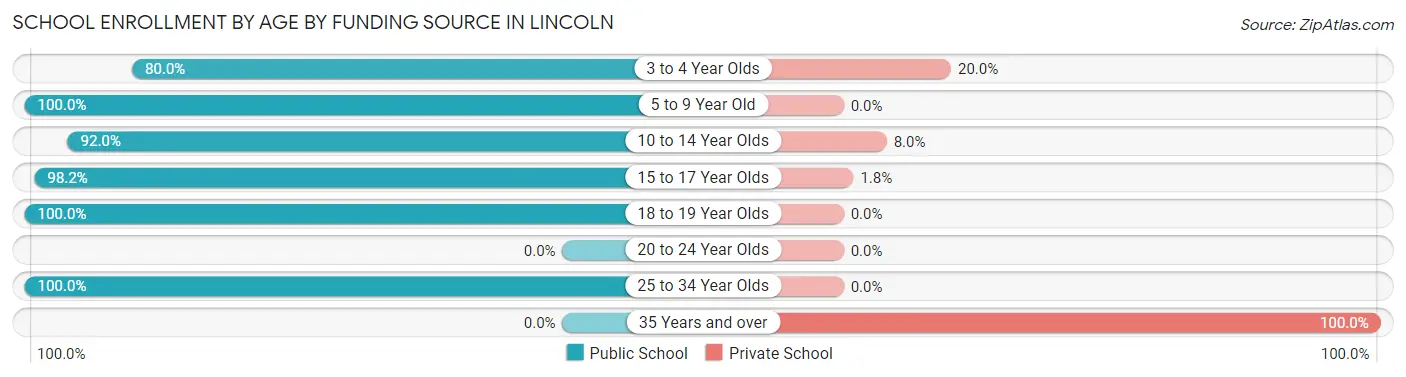
| Age Bracket | Public School | Private School |
| 3 to 4 Year Olds | 12 (80.0%) | 3 (20.0%) |
| 5 to 9 Year Old | 90 (100.0%) | 0 (0.0%) |
| 10 to 14 Year Olds | 149 (92.0%) | 13 (8.0%) |
| 15 to 17 Year Olds | 214 (98.2%) | 4 (1.8%) |
| 18 to 19 Year Olds | 31 (100.0%) | 0 (0.0%) |
| 20 to 24 Year Olds | 0 (0.0%) | 0 (0.0%) |
| 25 to 34 Year Olds | 12 (100.0%) | 0 (0.0%) |
| 35 Years and over | 0 (0.0%) | 3 (100.0%) |
| Total | 508 (95.7%) | 23 (4.3%) |
Educational Attainment by Field of Study in Lincoln
Business (54 | 34.8%), education (54 | 34.8%), science & technology (19 | 12.3%), arts & humanities (10 | 6.5%), and bio, nature & agricultural (5 | 3.2%) are the most common fields of study among 155 individuals in Lincoln who have obtained a bachelor's degree or higher.
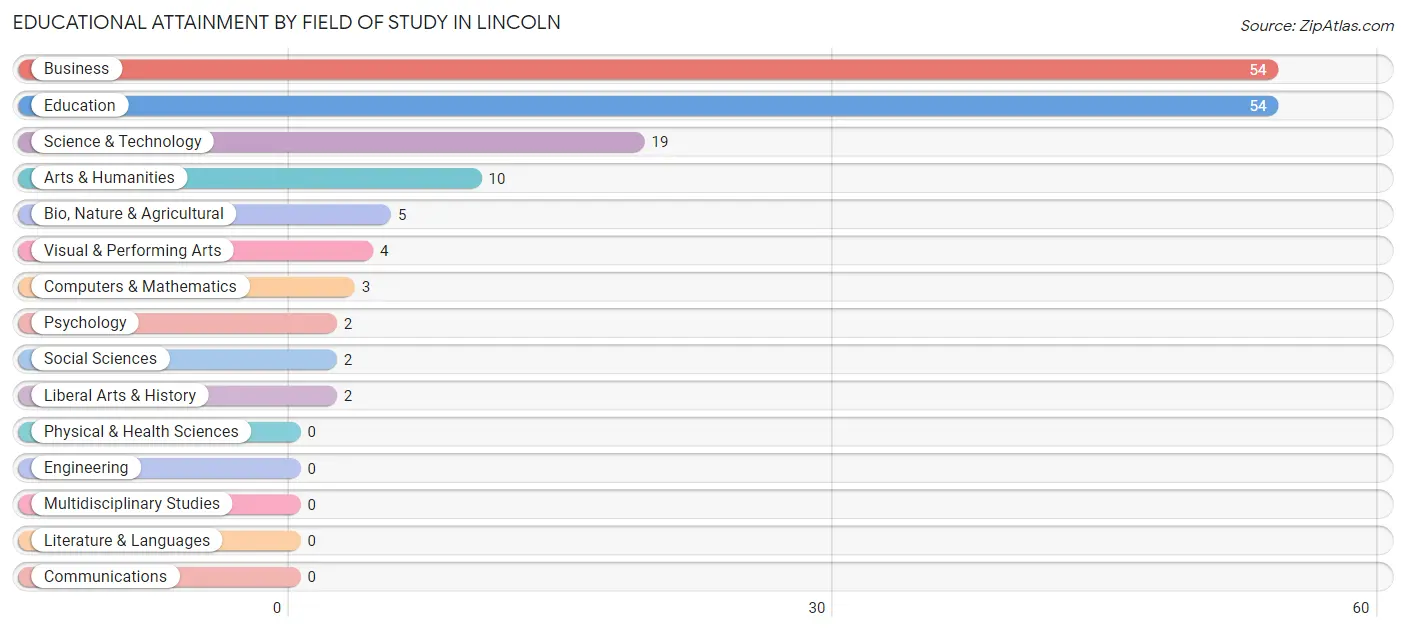
| Field of Study | # Graduates | % Graduates |
| Computers & Mathematics | 3 | 1.9% |
| Bio, Nature & Agricultural | 5 | 3.2% |
| Physical & Health Sciences | 0 | 0.0% |
| Psychology | 2 | 1.3% |
| Social Sciences | 2 | 1.3% |
| Engineering | 0 | 0.0% |
| Multidisciplinary Studies | 0 | 0.0% |
| Science & Technology | 19 | 12.3% |
| Business | 54 | 34.8% |
| Education | 54 | 34.8% |
| Literature & Languages | 0 | 0.0% |
| Liberal Arts & History | 2 | 1.3% |
| Visual & Performing Arts | 4 | 2.6% |
| Communications | 0 | 0.0% |
| Arts & Humanities | 10 | 6.5% |
| Total | 155 | 100.0% |
Transportation & Commute in Lincoln
Vehicle Availability by Sex in Lincoln
The most prevalent vehicle ownership categories in Lincoln are males with 3 vehicles (103, accounting for 42.2%) and females with 3 vehicles (120, making up 38.4%).
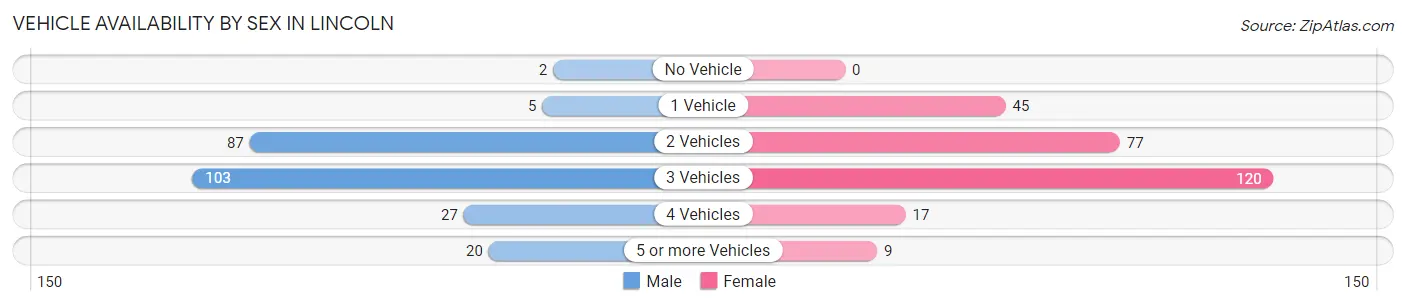
| Vehicles Available | Male | Female |
| No Vehicle | 2 (0.8%) | 0 (0.0%) |
| 1 Vehicle | 5 (2.1%) | 45 (16.8%) |
| 2 Vehicles | 87 (35.7%) | 77 (28.7%) |
| 3 Vehicles | 103 (42.2%) | 120 (44.8%) |
| 4 Vehicles | 27 (11.1%) | 17 (6.3%) |
| 5 or more Vehicles | 20 (8.2%) | 9 (3.4%) |
| Total | 244 (100.0%) | 268 (100.0%) |
Commute Time in Lincoln
The most frequently occuring commute durations in Lincoln are 15 to 19 minutes (81 commuters, 16.2%), 30 to 34 minutes (78 commuters, 15.6%), and less than 5 minutes (65 commuters, 13.0%).
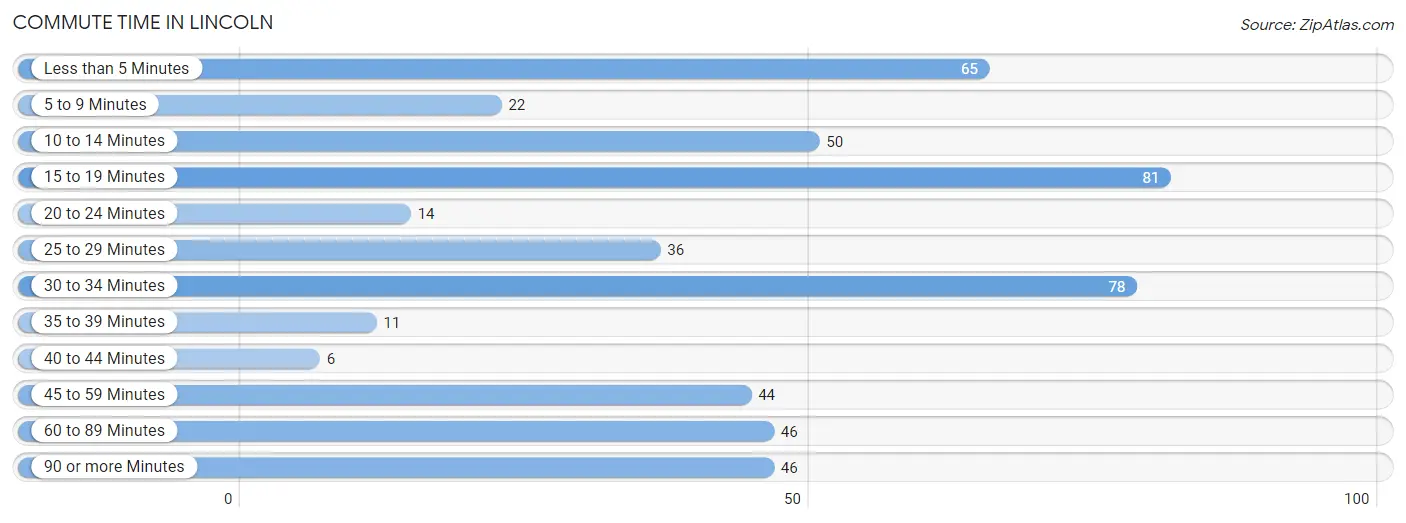
| Commute Time | # Commuters | % Commuters |
| Less than 5 Minutes | 65 | 13.0% |
| 5 to 9 Minutes | 22 | 4.4% |
| 10 to 14 Minutes | 50 | 10.0% |
| 15 to 19 Minutes | 81 | 16.2% |
| 20 to 24 Minutes | 14 | 2.8% |
| 25 to 29 Minutes | 36 | 7.2% |
| 30 to 34 Minutes | 78 | 15.6% |
| 35 to 39 Minutes | 11 | 2.2% |
| 40 to 44 Minutes | 6 | 1.2% |
| 45 to 59 Minutes | 44 | 8.8% |
| 60 to 89 Minutes | 46 | 9.2% |
| 90 or more Minutes | 46 | 9.2% |
Commute Time by Sex in Lincoln
The most common commute times in Lincoln are 30 to 34 minutes (48 commuters, 19.7%) for males and 15 to 19 minutes (53 commuters, 20.8%) for females.
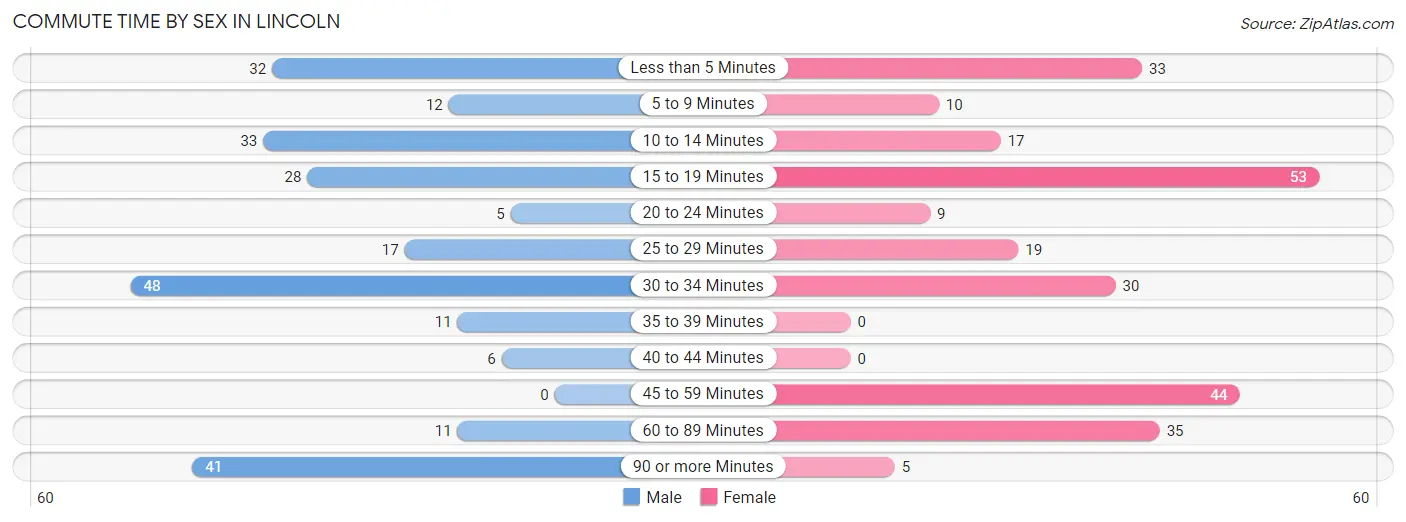
| Commute Time | Male | Female |
| Less than 5 Minutes | 32 (13.1%) | 33 (12.9%) |
| 5 to 9 Minutes | 12 (4.9%) | 10 (3.9%) |
| 10 to 14 Minutes | 33 (13.5%) | 17 (6.7%) |
| 15 to 19 Minutes | 28 (11.5%) | 53 (20.8%) |
| 20 to 24 Minutes | 5 (2.1%) | 9 (3.5%) |
| 25 to 29 Minutes | 17 (7.0%) | 19 (7.4%) |
| 30 to 34 Minutes | 48 (19.7%) | 30 (11.8%) |
| 35 to 39 Minutes | 11 (4.5%) | 0 (0.0%) |
| 40 to 44 Minutes | 6 (2.5%) | 0 (0.0%) |
| 45 to 59 Minutes | 0 (0.0%) | 44 (17.2%) |
| 60 to 89 Minutes | 11 (4.5%) | 35 (13.7%) |
| 90 or more Minutes | 41 (16.8%) | 5 (2.0%) |
Time of Departure to Work by Sex in Lincoln
The most frequent times of departure to work in Lincoln are 7:30 AM to 7:59 AM (51, 20.9%) for males and 7:30 AM to 7:59 AM (67, 26.3%) for females.
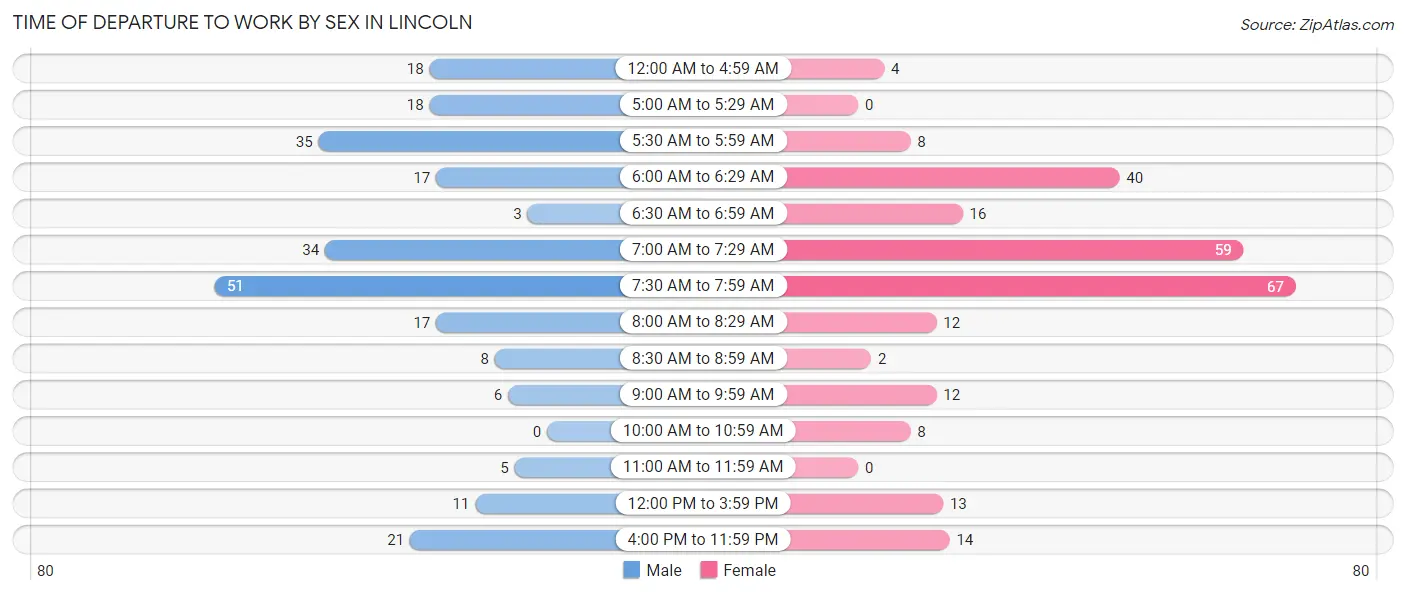
| Time of Departure | Male | Female |
| 12:00 AM to 4:59 AM | 18 (7.4%) | 4 (1.6%) |
| 5:00 AM to 5:29 AM | 18 (7.4%) | 0 (0.0%) |
| 5:30 AM to 5:59 AM | 35 (14.3%) | 8 (3.1%) |
| 6:00 AM to 6:29 AM | 17 (7.0%) | 40 (15.7%) |
| 6:30 AM to 6:59 AM | 3 (1.2%) | 16 (6.3%) |
| 7:00 AM to 7:29 AM | 34 (13.9%) | 59 (23.1%) |
| 7:30 AM to 7:59 AM | 51 (20.9%) | 67 (26.3%) |
| 8:00 AM to 8:29 AM | 17 (7.0%) | 12 (4.7%) |
| 8:30 AM to 8:59 AM | 8 (3.3%) | 2 (0.8%) |
| 9:00 AM to 9:59 AM | 6 (2.5%) | 12 (4.7%) |
| 10:00 AM to 10:59 AM | 0 (0.0%) | 8 (3.1%) |
| 11:00 AM to 11:59 AM | 5 (2.1%) | 0 (0.0%) |
| 12:00 PM to 3:59 PM | 11 (4.5%) | 13 (5.1%) |
| 4:00 PM to 11:59 PM | 21 (8.6%) | 14 (5.5%) |
| Total | 244 (100.0%) | 255 (100.0%) |
Housing Occupancy in Lincoln
Occupancy by Ownership in Lincoln
Of the total 431 dwellings in Lincoln, owner-occupied units account for 306 (71.0%), while renter-occupied units make up 125 (29.0%).
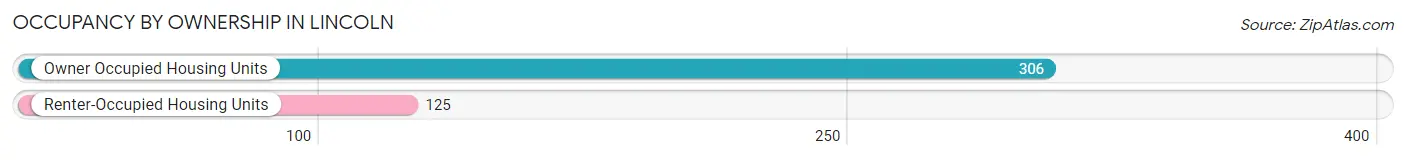
| Occupancy | # Housing Units | % Housing Units |
| Owner Occupied Housing Units | 306 | 71.0% |
| Renter-Occupied Housing Units | 125 | 29.0% |
| Total Occupied Housing Units | 431 | 100.0% |
Occupancy by Household Size in Lincoln
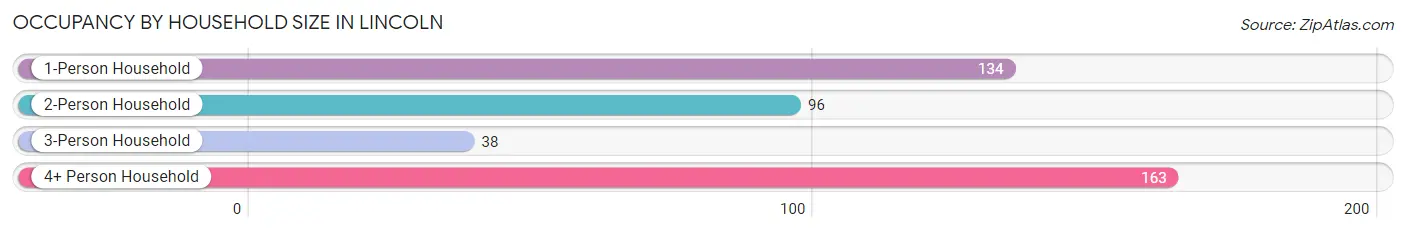
| Household Size | # Housing Units | % Housing Units |
| 1-Person Household | 134 | 31.1% |
| 2-Person Household | 96 | 22.3% |
| 3-Person Household | 38 | 8.8% |
| 4+ Person Household | 163 | 37.8% |
| Total Housing Units | 431 | 100.0% |
Occupancy by Ownership by Household Size in Lincoln
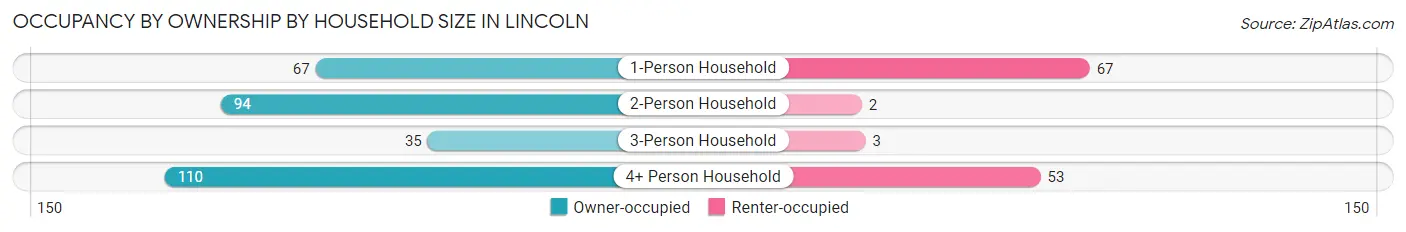
| Household Size | Owner-occupied | Renter-occupied |
| 1-Person Household | 67 (50.0%) | 67 (50.0%) |
| 2-Person Household | 94 (97.9%) | 2 (2.1%) |
| 3-Person Household | 35 (92.1%) | 3 (7.9%) |
| 4+ Person Household | 110 (67.5%) | 53 (32.5%) |
| Total Housing Units | 306 (71.0%) | 125 (29.0%) |
Occupancy by Educational Attainment in Lincoln
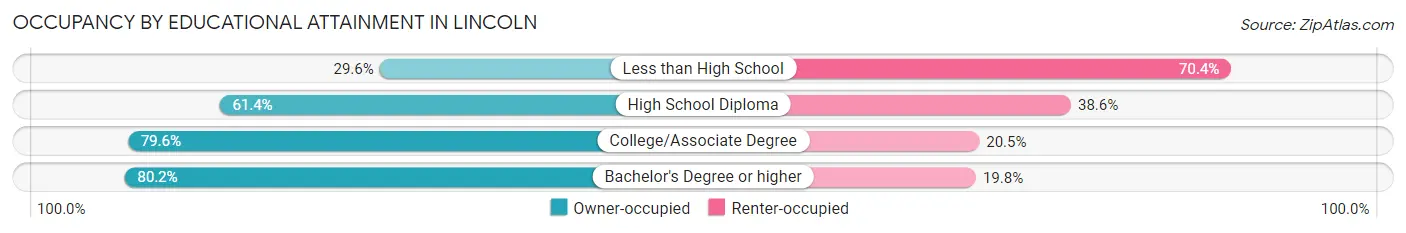
| Household Size | Owner-occupied | Renter-occupied |
| Less than High School | 8 (29.6%) | 19 (70.4%) |
| High School Diploma | 81 (61.4%) | 51 (38.6%) |
| College/Associate Degree | 140 (79.5%) | 36 (20.4%) |
| Bachelor's Degree or higher | 77 (80.2%) | 19 (19.8%) |
Occupancy by Age of Householder in Lincoln
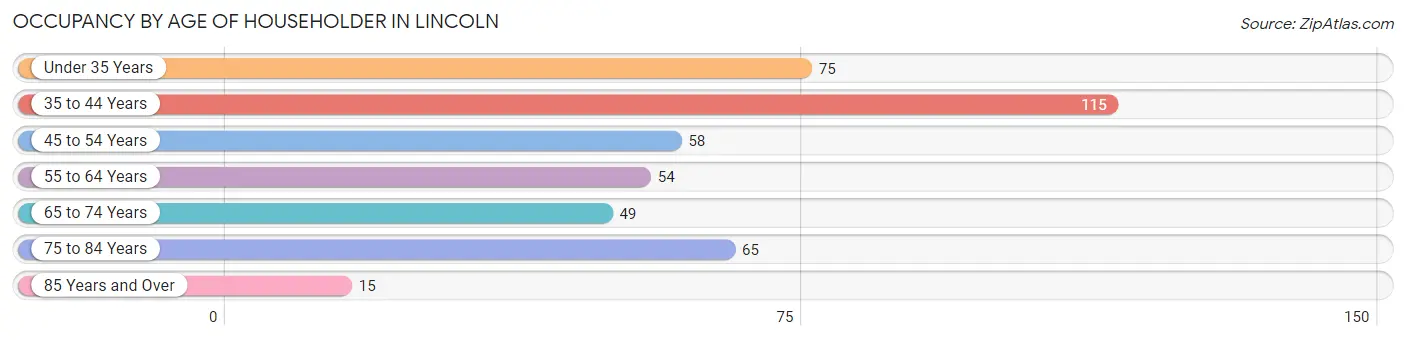
| Age Bracket | # Households | % Households |
| Under 35 Years | 75 | 17.4% |
| 35 to 44 Years | 115 | 26.7% |
| 45 to 54 Years | 58 | 13.5% |
| 55 to 64 Years | 54 | 12.5% |
| 65 to 74 Years | 49 | 11.4% |
| 75 to 84 Years | 65 | 15.1% |
| 85 Years and Over | 15 | 3.5% |
| Total | 431 | 100.0% |
Housing Finances in Lincoln
Median Income by Occupancy in Lincoln
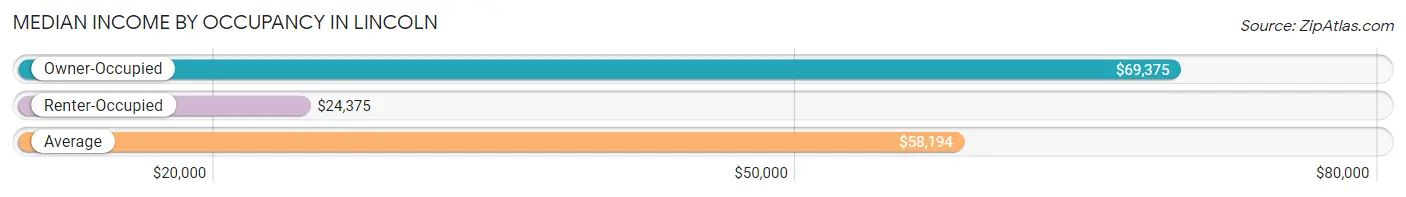
| Occupancy Type | # Households | Median Income |
| Owner-Occupied | 306 (71.0%) | $69,375 |
| Renter-Occupied | 125 (29.0%) | $24,375 |
| Average | 431 (100.0%) | $58,194 |
Occupancy by Householder Income Bracket in Lincoln
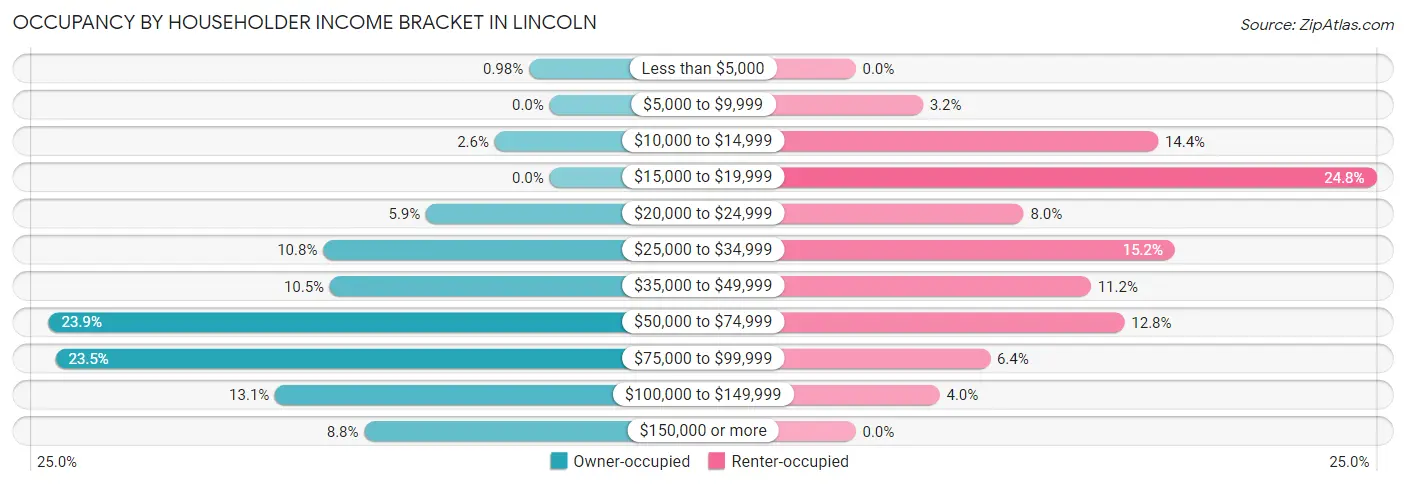
| Income Bracket | Owner-occupied | Renter-occupied |
| Less than $5,000 | 3 (1.0%) | 0 (0.0%) |
| $5,000 to $9,999 | 0 (0.0%) | 4 (3.2%) |
| $10,000 to $14,999 | 8 (2.6%) | 18 (14.4%) |
| $15,000 to $19,999 | 0 (0.0%) | 31 (24.8%) |
| $20,000 to $24,999 | 18 (5.9%) | 10 (8.0%) |
| $25,000 to $34,999 | 33 (10.8%) | 19 (15.2%) |
| $35,000 to $49,999 | 32 (10.5%) | 14 (11.2%) |
| $50,000 to $74,999 | 73 (23.9%) | 16 (12.8%) |
| $75,000 to $99,999 | 72 (23.5%) | 8 (6.4%) |
| $100,000 to $149,999 | 40 (13.1%) | 5 (4.0%) |
| $150,000 or more | 27 (8.8%) | 0 (0.0%) |
| Total | 306 (100.0%) | 125 (100.0%) |
Monthly Housing Cost Tiers in Lincoln
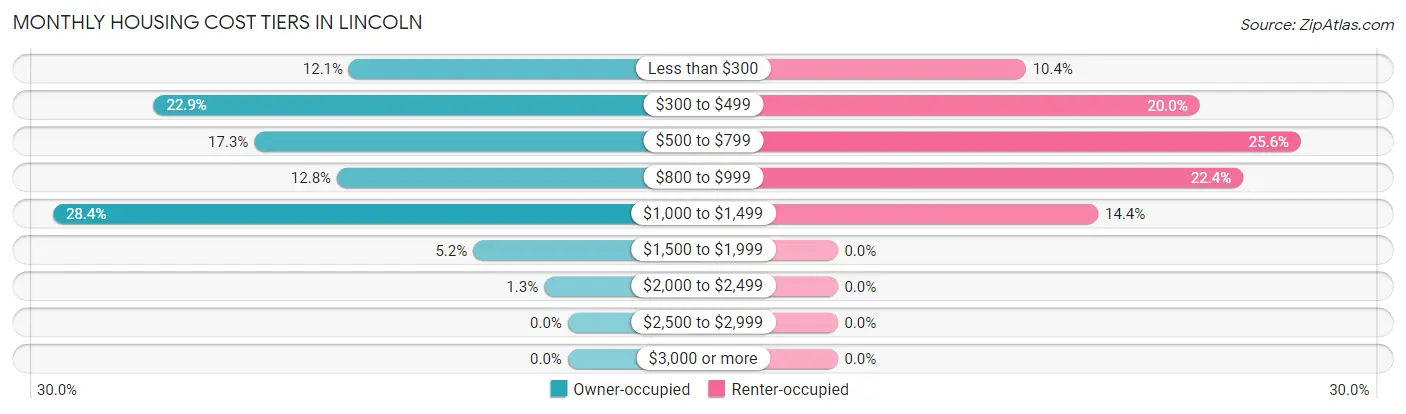
| Monthly Cost | Owner-occupied | Renter-occupied |
| Less than $300 | 37 (12.1%) | 13 (10.4%) |
| $300 to $499 | 70 (22.9%) | 25 (20.0%) |
| $500 to $799 | 53 (17.3%) | 32 (25.6%) |
| $800 to $999 | 39 (12.8%) | 28 (22.4%) |
| $1,000 to $1,499 | 87 (28.4%) | 18 (14.4%) |
| $1,500 to $1,999 | 16 (5.2%) | 0 (0.0%) |
| $2,000 to $2,499 | 4 (1.3%) | 0 (0.0%) |
| $2,500 to $2,999 | 0 (0.0%) | 0 (0.0%) |
| $3,000 or more | 0 (0.0%) | 0 (0.0%) |
| Total | 306 (100.0%) | 125 (100.0%) |
Physical Housing Characteristics in Lincoln
Housing Structures in Lincoln
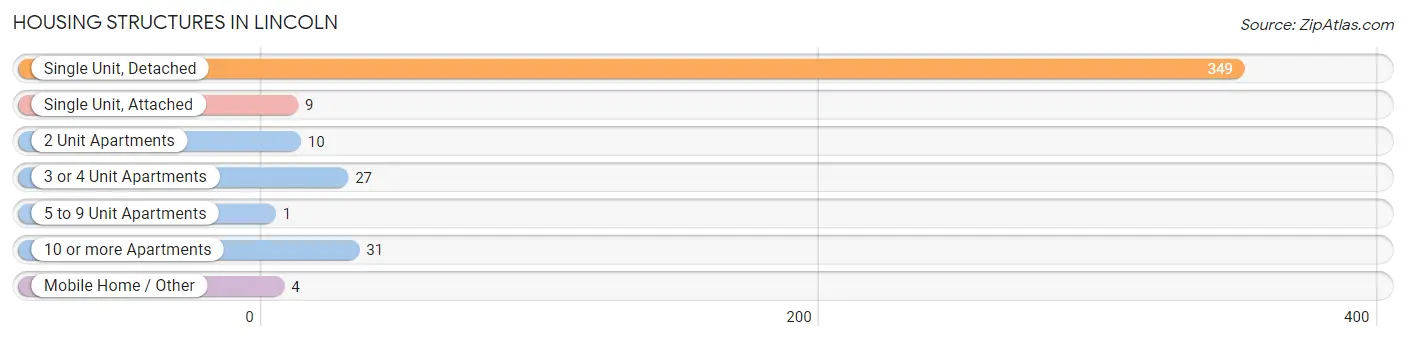
| Structure Type | # Housing Units | % Housing Units |
| Single Unit, Detached | 349 | 81.0% |
| Single Unit, Attached | 9 | 2.1% |
| 2 Unit Apartments | 10 | 2.3% |
| 3 or 4 Unit Apartments | 27 | 6.3% |
| 5 to 9 Unit Apartments | 1 | 0.2% |
| 10 or more Apartments | 31 | 7.2% |
| Mobile Home / Other | 4 | 0.9% |
| Total | 431 | 100.0% |
Housing Structures by Occupancy in Lincoln
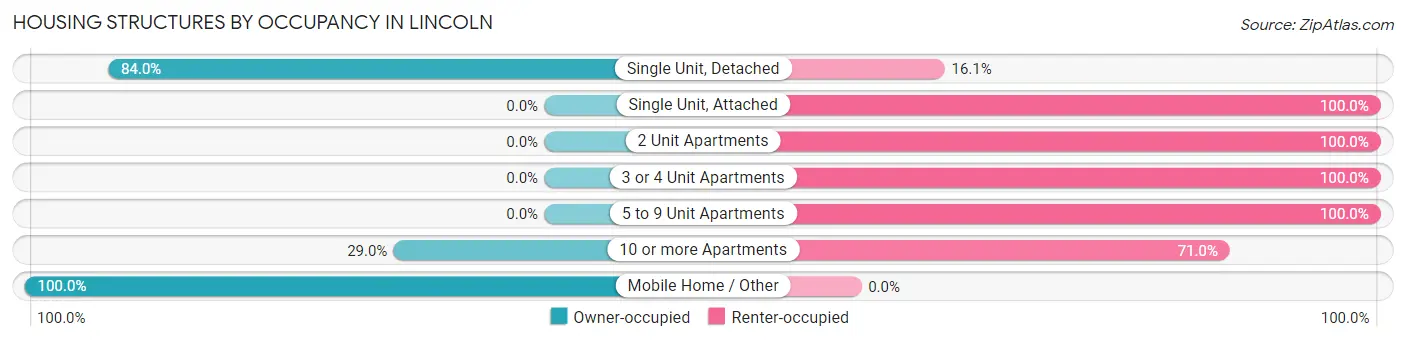
| Structure Type | Owner-occupied | Renter-occupied |
| Single Unit, Detached | 293 (84.0%) | 56 (16.1%) |
| Single Unit, Attached | 0 (0.0%) | 9 (100.0%) |
| 2 Unit Apartments | 0 (0.0%) | 10 (100.0%) |
| 3 or 4 Unit Apartments | 0 (0.0%) | 27 (100.0%) |
| 5 to 9 Unit Apartments | 0 (0.0%) | 1 (100.0%) |
| 10 or more Apartments | 9 (29.0%) | 22 (71.0%) |
| Mobile Home / Other | 4 (100.0%) | 0 (0.0%) |
| Total | 306 (71.0%) | 125 (29.0%) |
Housing Structures by Number of Rooms in Lincoln
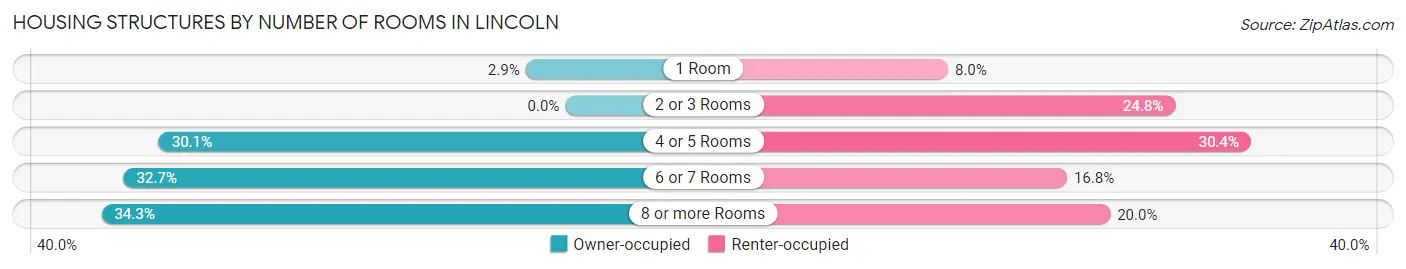
| Number of Rooms | Owner-occupied | Renter-occupied |
| 1 Room | 9 (2.9%) | 10 (8.0%) |
| 2 or 3 Rooms | 0 (0.0%) | 31 (24.8%) |
| 4 or 5 Rooms | 92 (30.1%) | 38 (30.4%) |
| 6 or 7 Rooms | 100 (32.7%) | 21 (16.8%) |
| 8 or more Rooms | 105 (34.3%) | 25 (20.0%) |
| Total | 306 (100.0%) | 125 (100.0%) |
Housing Structure by Heating Type in Lincoln
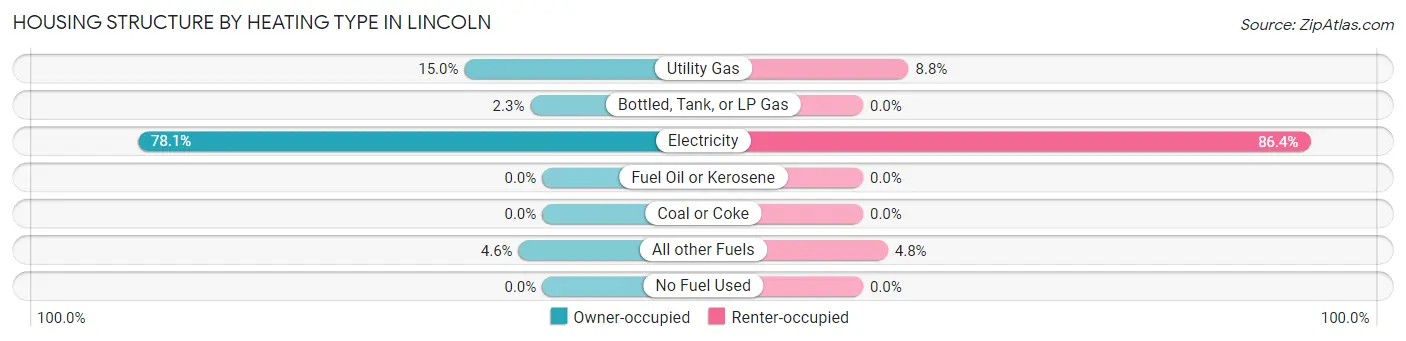
| Heating Type | Owner-occupied | Renter-occupied |
| Utility Gas | 46 (15.0%) | 11 (8.8%) |
| Bottled, Tank, or LP Gas | 7 (2.3%) | 0 (0.0%) |
| Electricity | 239 (78.1%) | 108 (86.4%) |
| Fuel Oil or Kerosene | 0 (0.0%) | 0 (0.0%) |
| Coal or Coke | 0 (0.0%) | 0 (0.0%) |
| All other Fuels | 14 (4.6%) | 6 (4.8%) |
| No Fuel Used | 0 (0.0%) | 0 (0.0%) |
| Total | 306 (100.0%) | 125 (100.0%) |
Household Vehicle Usage in Lincoln
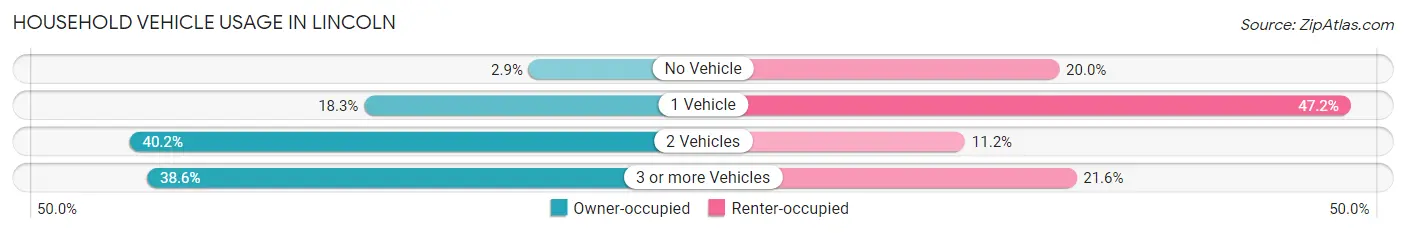
| Vehicles per Household | Owner-occupied | Renter-occupied |
| No Vehicle | 9 (2.9%) | 25 (20.0%) |
| 1 Vehicle | 56 (18.3%) | 59 (47.2%) |
| 2 Vehicles | 123 (40.2%) | 14 (11.2%) |
| 3 or more Vehicles | 118 (38.6%) | 27 (21.6%) |
| Total | 306 (100.0%) | 125 (100.0%) |
Real Estate & Mortgages in Lincoln
Real Estate and Mortgage Overview in Lincoln
| Characteristic | Without Mortgage | With Mortgage |
| Housing Units | 130 | 176 |
| Median Property Value | $136,100 | $115,800 |
| Median Household Income | $59,643 | $19 |
| Monthly Housing Costs | $419 | $0 |
| Real Estate Taxes | $737 | $0 |
Property Value by Mortgage Status in Lincoln
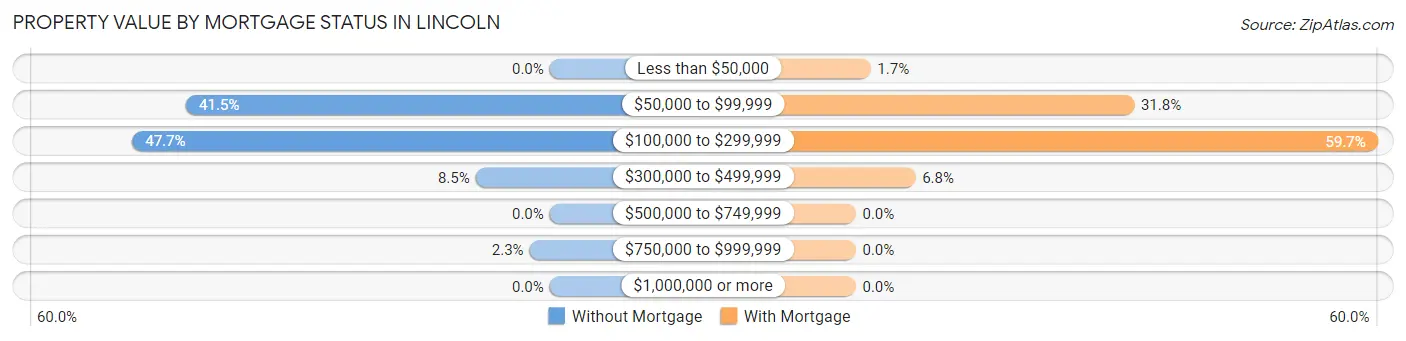
| Property Value | Without Mortgage | With Mortgage |
| Less than $50,000 | 0 (0.0%) | 3 (1.7%) |
| $50,000 to $99,999 | 54 (41.5%) | 56 (31.8%) |
| $100,000 to $299,999 | 62 (47.7%) | 105 (59.7%) |
| $300,000 to $499,999 | 11 (8.5%) | 12 (6.8%) |
| $500,000 to $749,999 | 0 (0.0%) | 0 (0.0%) |
| $750,000 to $999,999 | 3 (2.3%) | 0 (0.0%) |
| $1,000,000 or more | 0 (0.0%) | 0 (0.0%) |
| Total | 130 (100.0%) | 176 (100.0%) |
Household Income by Mortgage Status in Lincoln
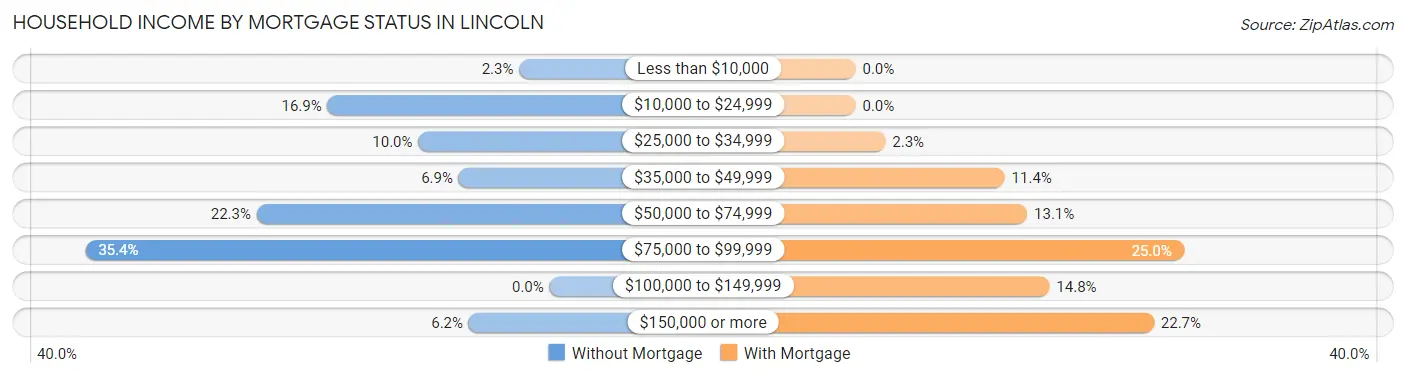
| Household Income | Without Mortgage | With Mortgage |
| Less than $10,000 | 3 (2.3%) | 0 (0.0%) |
| $10,000 to $24,999 | 22 (16.9%) | 0 (0.0%) |
| $25,000 to $34,999 | 13 (10.0%) | 4 (2.3%) |
| $35,000 to $49,999 | 9 (6.9%) | 20 (11.4%) |
| $50,000 to $74,999 | 29 (22.3%) | 23 (13.1%) |
| $75,000 to $99,999 | 46 (35.4%) | 44 (25.0%) |
| $100,000 to $149,999 | 0 (0.0%) | 26 (14.8%) |
| $150,000 or more | 8 (6.1%) | 40 (22.7%) |
| Total | 130 (100.0%) | 176 (100.0%) |
Property Value to Household Income Ratio in Lincoln
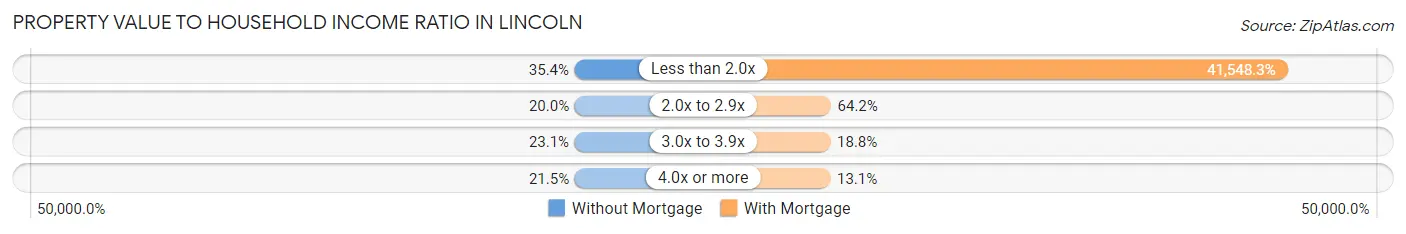
| Value-to-Income Ratio | Without Mortgage | With Mortgage |
| Less than 2.0x | 46 (35.4%) | 73,125 (41,548.3%) |
| 2.0x to 2.9x | 26 (20.0%) | 113 (64.2%) |
| 3.0x to 3.9x | 30 (23.1%) | 33 (18.8%) |
| 4.0x or more | 28 (21.5%) | 23 (13.1%) |
| Total | 130 (100.0%) | 176 (100.0%) |
Real Estate Taxes by Mortgage Status in Lincoln
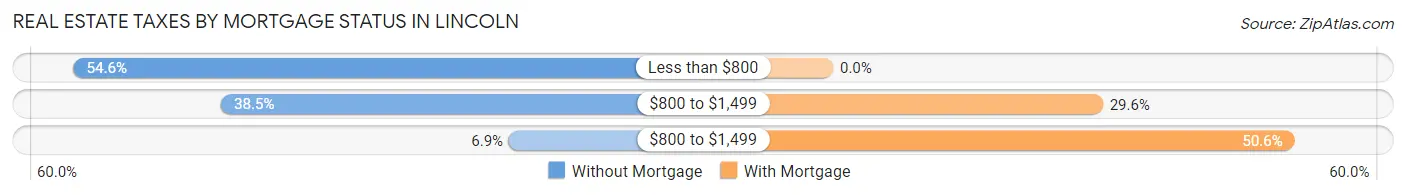
| Property Taxes | Without Mortgage | With Mortgage |
| Less than $800 | 71 (54.6%) | 0 (0.0%) |
| $800 to $1,499 | 50 (38.5%) | 52 (29.5%) |
| $800 to $1,499 | 9 (6.9%) | 89 (50.6%) |
| Total | 130 (100.0%) | 176 (100.0%) |
Health & Disability in Lincoln
Health Insurance Coverage by Age in Lincoln
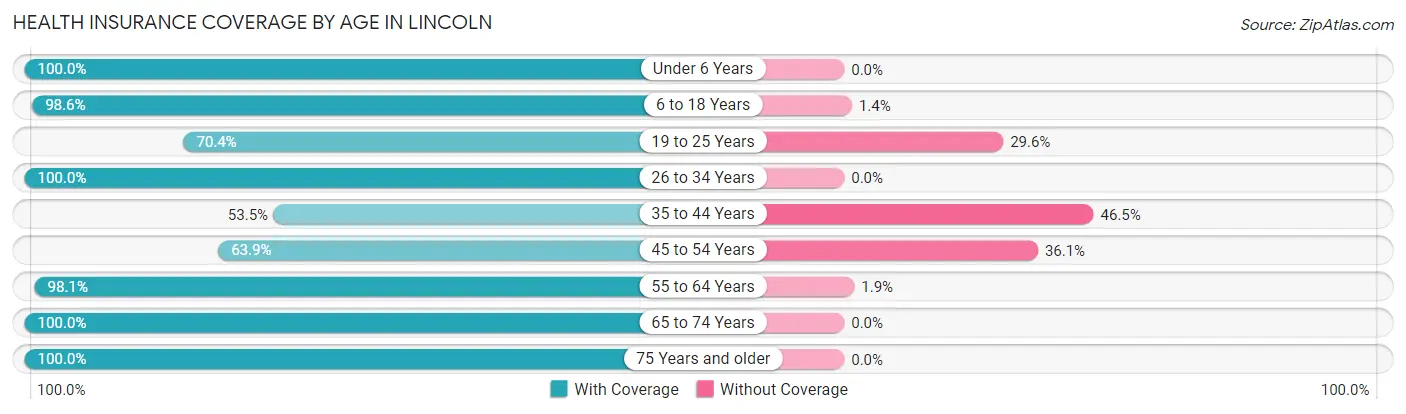
| Age Bracket | With Coverage | Without Coverage |
| Under 6 Years | 89 (100.0%) | 0 (0.0%) |
| 6 to 18 Years | 481 (98.6%) | 7 (1.4%) |
| 19 to 25 Years | 57 (70.4%) | 24 (29.6%) |
| 26 to 34 Years | 120 (100.0%) | 0 (0.0%) |
| 35 to 44 Years | 145 (53.5%) | 126 (46.5%) |
| 45 to 54 Years | 46 (63.9%) | 26 (36.1%) |
| 55 to 64 Years | 105 (98.1%) | 2 (1.9%) |
| 65 to 74 Years | 89 (100.0%) | 0 (0.0%) |
| 75 Years and older | 115 (100.0%) | 0 (0.0%) |
| Total | 1,247 (87.1%) | 185 (12.9%) |
Health Insurance Coverage by Citizenship Status in Lincoln
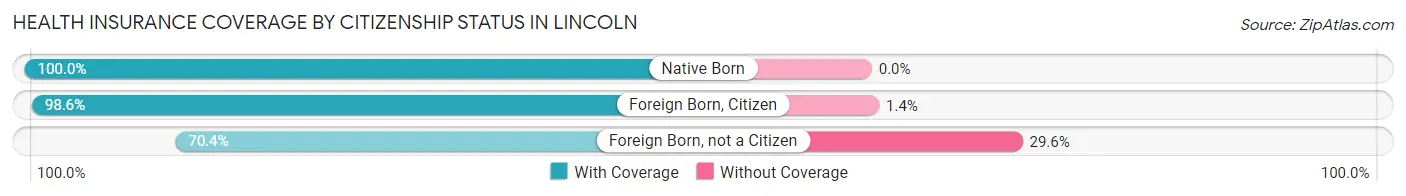
| Citizenship Status | With Coverage | Without Coverage |
| Native Born | 89 (100.0%) | 0 (0.0%) |
| Foreign Born, Citizen | 481 (98.6%) | 7 (1.4%) |
| Foreign Born, not a Citizen | 57 (70.4%) | 24 (29.6%) |
Health Insurance Coverage by Household Income in Lincoln
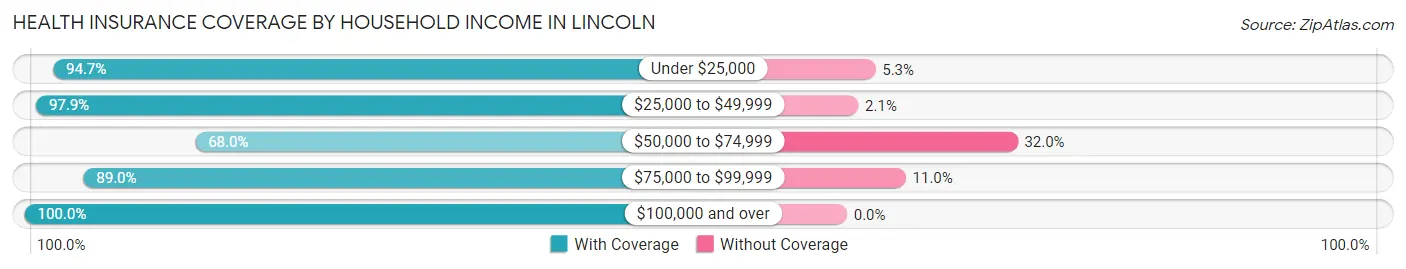
| Household Income | With Coverage | Without Coverage |
| Under $25,000 | 124 (94.7%) | 7 (5.3%) |
| $25,000 to $49,999 | 322 (97.9%) | 7 (2.1%) |
| $50,000 to $74,999 | 300 (68.0%) | 141 (32.0%) |
| $75,000 to $99,999 | 226 (89.0%) | 28 (11.0%) |
| $100,000 and over | 273 (100.0%) | 0 (0.0%) |
Public vs Private Health Insurance Coverage by Age in Lincoln
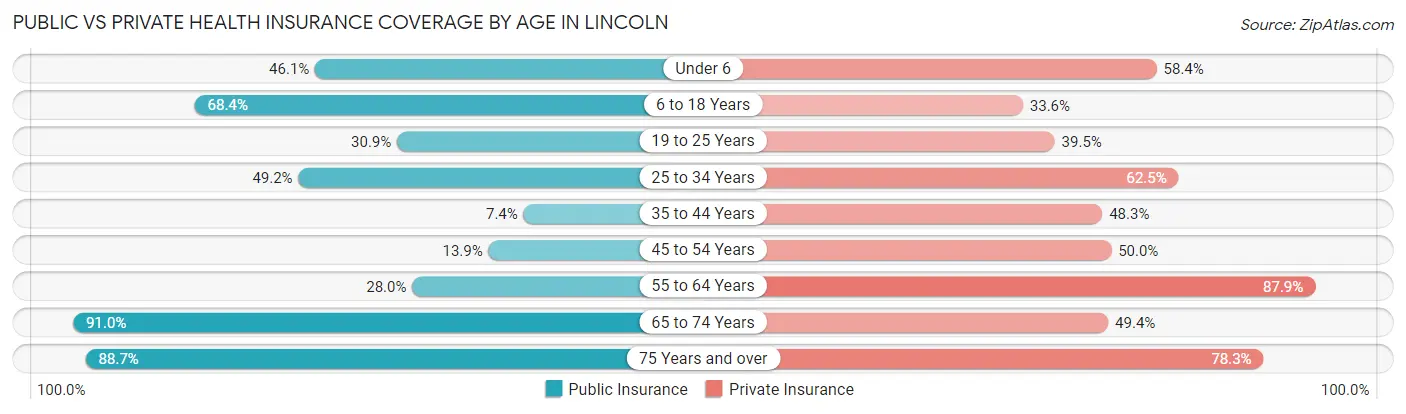
| Age Bracket | Public Insurance | Private Insurance |
| Under 6 | 41 (46.1%) | 52 (58.4%) |
| 6 to 18 Years | 334 (68.4%) | 164 (33.6%) |
| 19 to 25 Years | 25 (30.9%) | 32 (39.5%) |
| 25 to 34 Years | 59 (49.2%) | 75 (62.5%) |
| 35 to 44 Years | 20 (7.4%) | 131 (48.3%) |
| 45 to 54 Years | 10 (13.9%) | 36 (50.0%) |
| 55 to 64 Years | 30 (28.0%) | 94 (87.8%) |
| 65 to 74 Years | 81 (91.0%) | 44 (49.4%) |
| 75 Years and over | 102 (88.7%) | 90 (78.3%) |
| Total | 702 (49.0%) | 718 (50.1%) |
Disability Status by Sex by Age in Lincoln
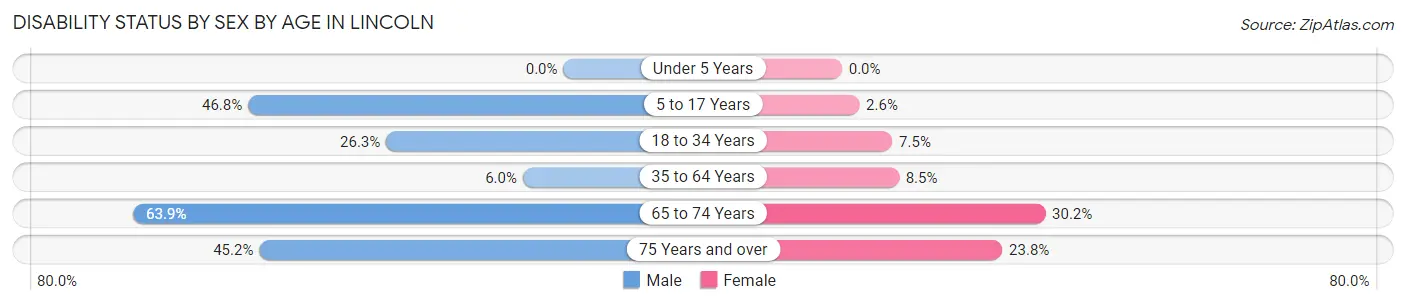
| Age Bracket | Male | Female |
| Under 5 Years | 0 (0.0%) | 0 (0.0%) |
| 5 to 17 Years | 147 (46.8%) | 5 (2.6%) |
| 18 to 34 Years | 30 (26.3%) | 8 (7.5%) |
| 35 to 64 Years | 10 (6.0%) | 24 (8.5%) |
| 65 to 74 Years | 23 (63.9%) | 16 (30.2%) |
| 75 Years and over | 14 (45.2%) | 20 (23.8%) |
Disability Class by Sex by Age in Lincoln
Disability Class: Hearing Difficulty
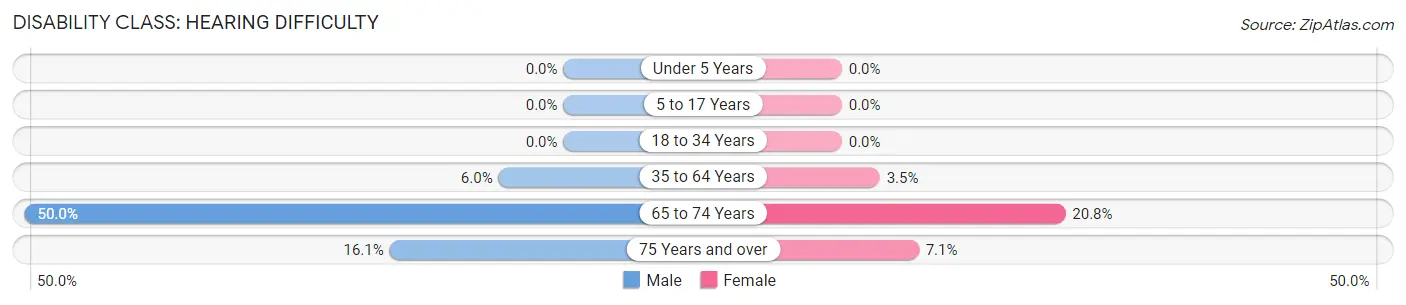
| Age Bracket | Male | Female |
| Under 5 Years | 0 (0.0%) | 0 (0.0%) |
| 5 to 17 Years | 0 (0.0%) | 0 (0.0%) |
| 18 to 34 Years | 0 (0.0%) | 0 (0.0%) |
| 35 to 64 Years | 10 (6.0%) | 10 (3.5%) |
| 65 to 74 Years | 18 (50.0%) | 11 (20.7%) |
| 75 Years and over | 5 (16.1%) | 6 (7.1%) |
Disability Class: Vision Difficulty
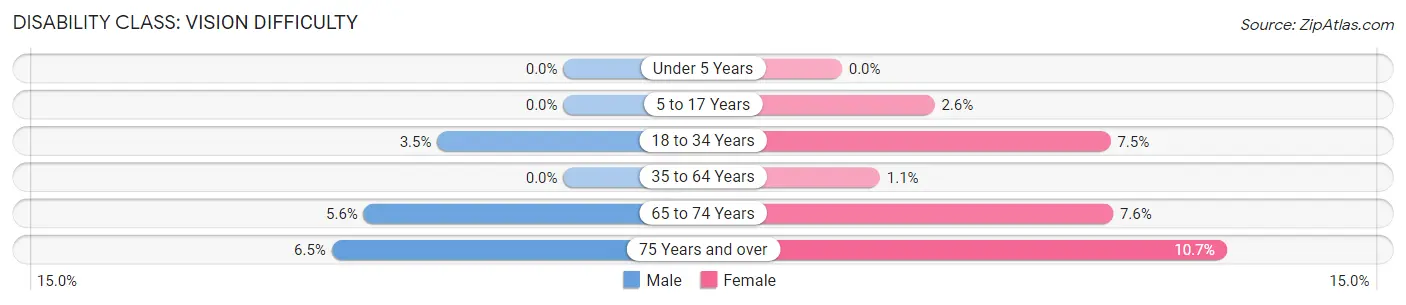
| Age Bracket | Male | Female |
| Under 5 Years | 0 (0.0%) | 0 (0.0%) |
| 5 to 17 Years | 0 (0.0%) | 5 (2.6%) |
| 18 to 34 Years | 4 (3.5%) | 8 (7.5%) |
| 35 to 64 Years | 0 (0.0%) | 3 (1.1%) |
| 65 to 74 Years | 2 (5.6%) | 4 (7.5%) |
| 75 Years and over | 2 (6.5%) | 9 (10.7%) |
Disability Class: Cognitive Difficulty
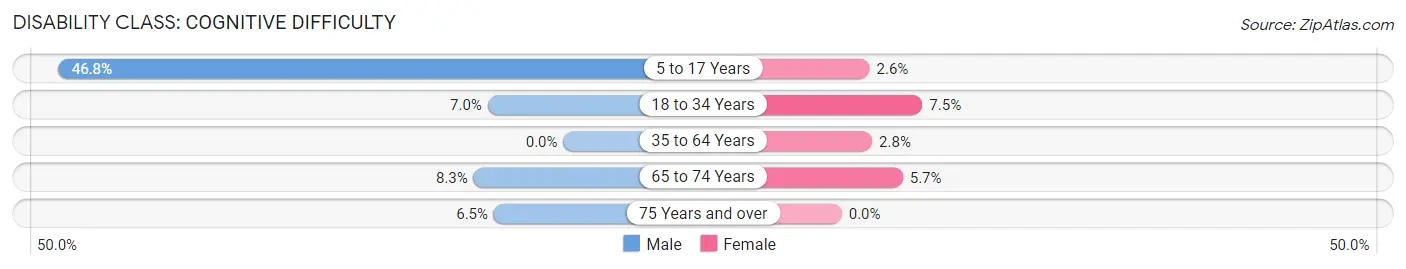
| Age Bracket | Male | Female |
| 5 to 17 Years | 147 (46.8%) | 5 (2.6%) |
| 18 to 34 Years | 8 (7.0%) | 8 (7.5%) |
| 35 to 64 Years | 0 (0.0%) | 8 (2.8%) |
| 65 to 74 Years | 3 (8.3%) | 3 (5.7%) |
| 75 Years and over | 2 (6.5%) | 0 (0.0%) |
Disability Class: Ambulatory Difficulty
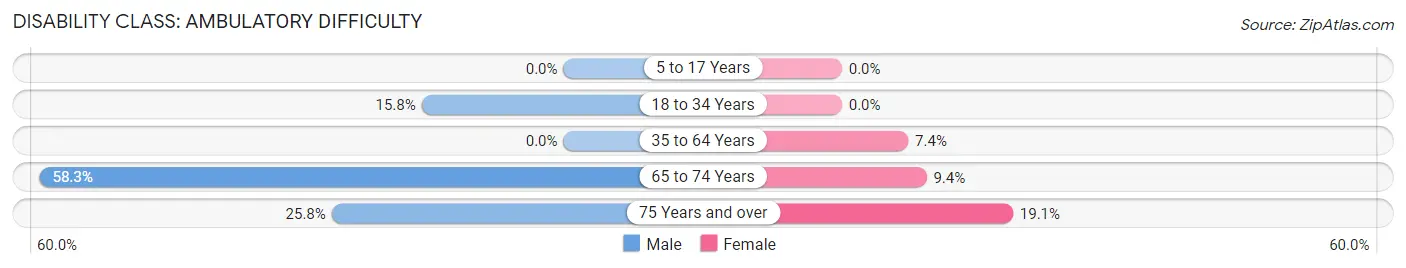
| Age Bracket | Male | Female |
| 5 to 17 Years | 0 (0.0%) | 0 (0.0%) |
| 18 to 34 Years | 18 (15.8%) | 0 (0.0%) |
| 35 to 64 Years | 0 (0.0%) | 21 (7.4%) |
| 65 to 74 Years | 21 (58.3%) | 5 (9.4%) |
| 75 Years and over | 8 (25.8%) | 16 (19.1%) |
Disability Class: Self-Care Difficulty
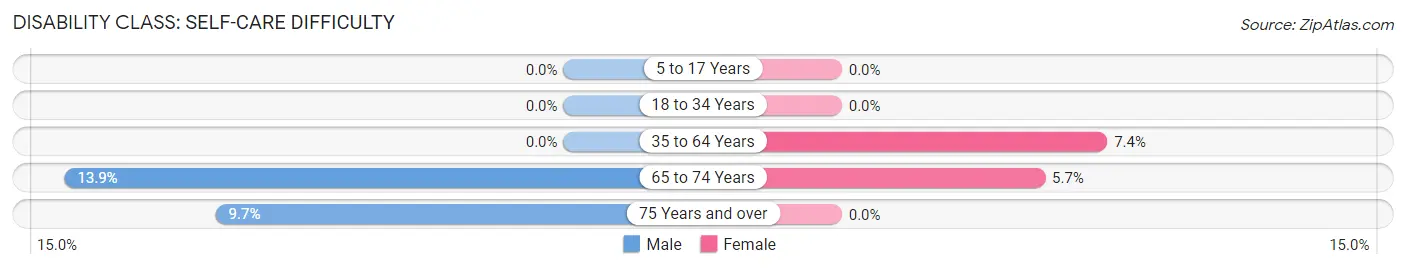
| Age Bracket | Male | Female |
| 5 to 17 Years | 0 (0.0%) | 0 (0.0%) |
| 18 to 34 Years | 0 (0.0%) | 0 (0.0%) |
| 35 to 64 Years | 0 (0.0%) | 21 (7.4%) |
| 65 to 74 Years | 5 (13.9%) | 3 (5.7%) |
| 75 Years and over | 3 (9.7%) | 0 (0.0%) |
Technology Access in Lincoln
Computing Device Access in Lincoln
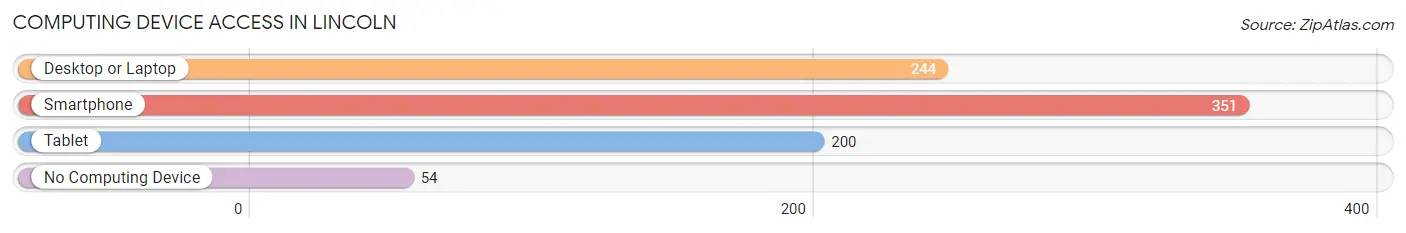
| Device Type | # Households | % Households |
| Desktop or Laptop | 244 | 56.6% |
| Smartphone | 351 | 81.4% |
| Tablet | 200 | 46.4% |
| No Computing Device | 54 | 12.5% |
| Total | 431 | 100.0% |
Internet Access in Lincoln
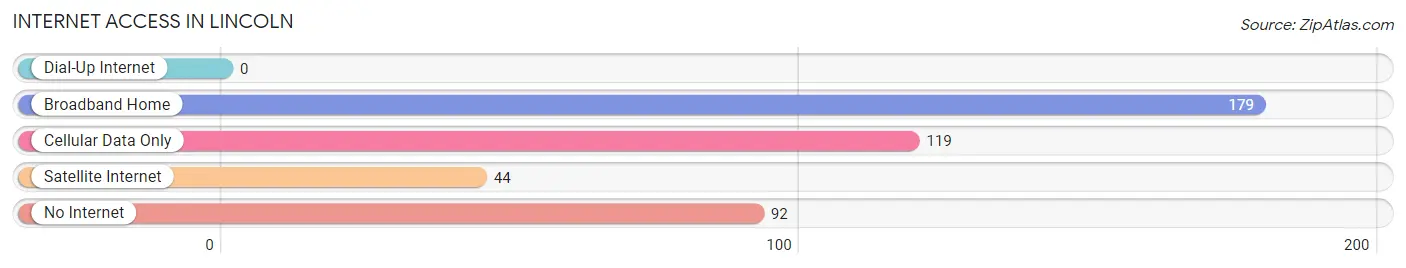
| Internet Type | # Households | % Households |
| Dial-Up Internet | 0 | 0.0% |
| Broadband Home | 179 | 41.5% |
| Cellular Data Only | 119 | 27.6% |
| Satellite Internet | 44 | 10.2% |
| No Internet | 92 | 21.3% |
| Total | 431 | 100.0% |
Lincoln Summary
Lincoln, Missouri is a small city located in the northeastern corner of the state, in the Ozark Mountains. It is the county seat of Lincoln County and has a population of just over 1,000 people. The city is known for its rural charm and its proximity to the Mark Twain National Forest.
History
Lincoln was founded in 1859 by a group of settlers from Kentucky and Tennessee. The city was named after Abraham Lincoln, who had recently been elected President of the United States. The city was incorporated in 1868 and quickly became a center of commerce and industry. The city was home to several sawmills, gristmills, and a woolen mill. The city also had a thriving agricultural industry, with many farmers growing corn, wheat, and other crops.
In the late 19th century, the city was a popular tourist destination, with many visitors coming to enjoy the scenic beauty of the Ozark Mountains. The city was also home to several resorts, including the Lincoln Hotel, which was built in 1891.
Geography
Lincoln is located in the Ozark Mountains, in the northeastern corner of Missouri. The city is situated on the banks of the North Fork of the White River. The city is surrounded by rolling hills and forests, and is home to several state parks and recreational areas. The city is located about 50 miles from St. Louis, Missouri, and about 100 miles from Springfield, Missouri.
Economy
Lincoln’s economy is largely based on agriculture and tourism. The city is home to several farms, which produce corn, wheat, soybeans, and other crops. The city is also home to several tourist attractions, including the Lincoln Hotel, the Lincoln County Museum, and the Lincoln County Fairgrounds.
The city is also home to several small businesses, including restaurants, retail stores, and service providers. The city is also home to several manufacturing companies, including a furniture factory and a metal fabrication plant.
Demographics
As of the 2010 census, the population of Lincoln was 1,039. The racial makeup of the city was 95.3% White, 0.7% African American, 0.3% Native American, 0.2% Asian, 0.1% Pacific Islander, and 3.4% from other races. The median household income was $35,938, and the median family income was $41,250. The per capita income was $17,845.
Conclusion
Lincoln, Missouri is a small city located in the northeastern corner of the state, in the Ozark Mountains. It is the county seat of Lincoln County and has a population of just over 1,000 people. The city is known for its rural charm and its proximity to the Mark Twain National Forest. The city’s economy is largely based on agriculture and tourism, and it is home to several small businesses, manufacturing companies, and tourist attractions. The city has a diverse population, with a median household income of $35,938 and a median family income of $41,250.
Common Questions
What is Per Capita Income in Lincoln?
Per Capita income in Lincoln is $19,353.
What is the Median Family Income in Lincoln?
Median Family Income in Lincoln is $72,273.
What is the Median Household income in Lincoln?
Median Household Income in Lincoln is $58,194.
What is Income or Wage Gap in Lincoln?
Income or Wage Gap in Lincoln is 35.0%.
Women in Lincoln earn 65.0 cents for every dollar earned by a man.
What is Inequality or Gini Index in Lincoln?
Inequality or Gini Index in Lincoln is 0.38.
What is the Total Population of Lincoln?
Total Population of Lincoln is 1,493.
What is the Total Male Population of Lincoln?
Total Male Population of Lincoln is 669.
What is the Total Female Population of Lincoln?
Total Female Population of Lincoln is 824.
What is the Ratio of Males per 100 Females in Lincoln?
There are 81.19 Males per 100 Females in Lincoln.
What is the Ratio of Females per 100 Males in Lincoln?
There are 123.17 Females per 100 Males in Lincoln.
What is the Median Population Age in Lincoln?
Median Population Age in Lincoln is 31.2 Years.
What is the Average Family Size in Lincoln
Average Family Size in Lincoln is 4.5 People.
What is the Average Household Size in Lincoln
Average Household Size in Lincoln is 3.3 People.
How Large is the Labor Force in Lincoln?
There are 552 People in the Labor Forcein in Lincoln.
What is the Percentage of People in the Labor Force in Lincoln?
51.5% of People are in the Labor Force in Lincoln.
What is the Unemployment Rate in Lincoln?
Unemployment Rate in Lincoln is 5.1%.