Lake Ozark, MO Map & Demographics
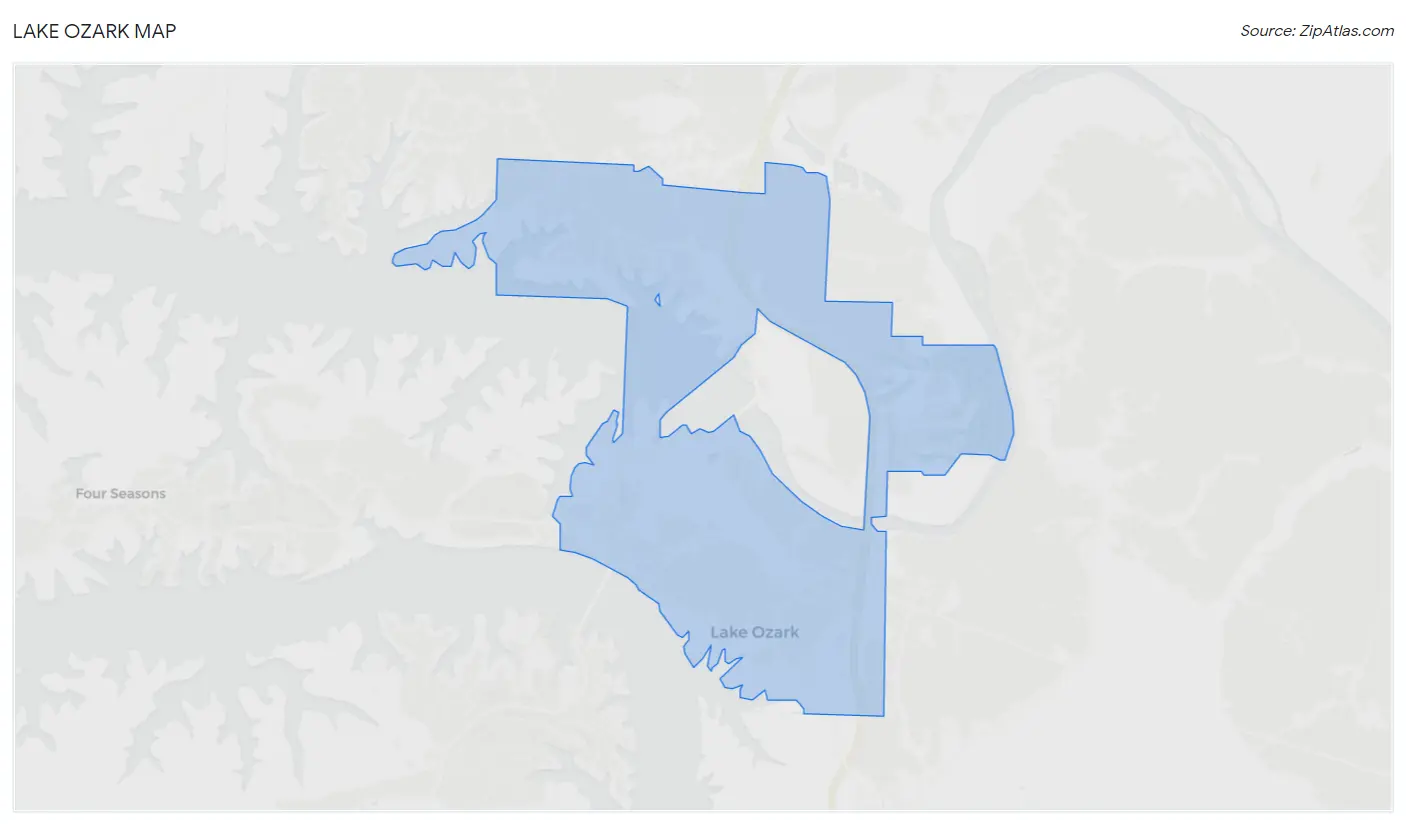
Lake Ozark Map
Lake Ozark Overview
$45,441
PER CAPITA INCOME
$82,596
AVG FAMILY INCOME
$71,528
AVG HOUSEHOLD INCOME
32.6%
WAGE / INCOME GAP [ % ]
67.4¢/ $1
WAGE / INCOME GAP [ $ ]
0.48
INEQUALITY / GINI INDEX
2,628
TOTAL POPULATION
1,384
MALE POPULATION
1,244
FEMALE POPULATION
111.25
MALES / 100 FEMALES
89.88
FEMALES / 100 MALES
45.5
MEDIAN AGE
2.9
AVG FAMILY SIZE
2.3
AVG HOUSEHOLD SIZE
1,348
LABOR FORCE [ PEOPLE ]
61.8%
PERCENT IN LABOR FORCE
4.0%
UNEMPLOYMENT RATE
Lake Ozark Zip Codes
Lake Ozark Area Codes
Income in Lake Ozark
Income Overview in Lake Ozark
Per Capita Income in Lake Ozark is $45,441, while median incomes of families and households are $82,596 and $71,528 respectively.
| Characteristic | Number | Measure |
| Per Capita Income | 2,628 | $45,441 |
| Median Family Income | 663 | $82,596 |
| Mean Family Income | 663 | $125,860 |
| Median Household Income | 1,139 | $71,528 |
| Mean Household Income | 1,139 | $102,244 |
| Income Deficit | 663 | $0 |
| Wage / Income Gap (%) | 2,628 | 32.55% |
| Wage / Income Gap ($) | 2,628 | 67.45¢ per $1 |
| Gini / Inequality Index | 2,628 | 0.48 |
Earnings by Sex in Lake Ozark
Average Earnings in Lake Ozark are $38,311, $47,000 for men and $31,701 for women, a difference of 32.6%.
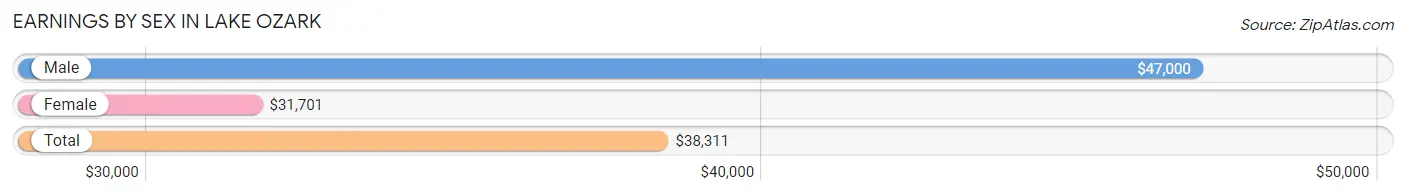
| Sex | Number | Average Earnings |
| Male | 760 (53.0%) | $47,000 |
| Female | 675 (47.0%) | $31,701 |
| Total | 1,435 (100.0%) | $38,311 |
Earnings by Sex by Income Bracket in Lake Ozark
The most common earnings brackets in Lake Ozark are $100,000+ for men (160 | 21.0%) and $35,000 to $39,999 for women (107 | 15.9%).
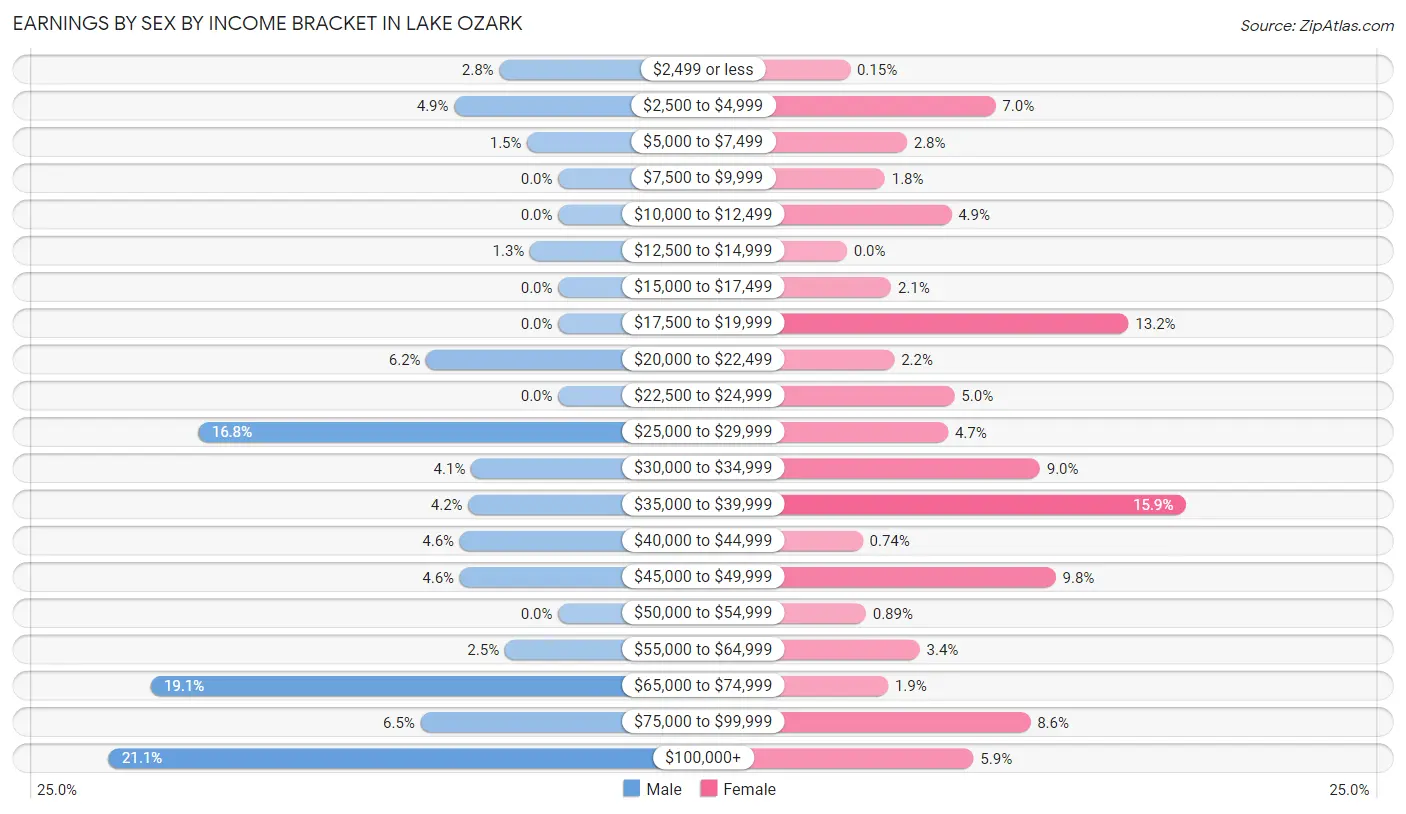
| Income | Male | Female |
| $2,499 or less | 21 (2.8%) | 1 (0.2%) |
| $2,500 to $4,999 | 37 (4.9%) | 47 (7.0%) |
| $5,000 to $7,499 | 11 (1.5%) | 19 (2.8%) |
| $7,500 to $9,999 | 0 (0.0%) | 12 (1.8%) |
| $10,000 to $12,499 | 0 (0.0%) | 33 (4.9%) |
| $12,500 to $14,999 | 10 (1.3%) | 0 (0.0%) |
| $15,000 to $17,499 | 0 (0.0%) | 14 (2.1%) |
| $17,500 to $19,999 | 0 (0.0%) | 89 (13.2%) |
| $20,000 to $22,499 | 47 (6.2%) | 15 (2.2%) |
| $22,500 to $24,999 | 0 (0.0%) | 34 (5.0%) |
| $25,000 to $29,999 | 128 (16.8%) | 32 (4.7%) |
| $30,000 to $34,999 | 31 (4.1%) | 61 (9.0%) |
| $35,000 to $39,999 | 32 (4.2%) | 107 (15.9%) |
| $40,000 to $44,999 | 35 (4.6%) | 5 (0.7%) |
| $45,000 to $49,999 | 35 (4.6%) | 66 (9.8%) |
| $50,000 to $54,999 | 0 (0.0%) | 6 (0.9%) |
| $55,000 to $64,999 | 19 (2.5%) | 23 (3.4%) |
| $65,000 to $74,999 | 145 (19.1%) | 13 (1.9%) |
| $75,000 to $99,999 | 49 (6.5%) | 58 (8.6%) |
| $100,000+ | 160 (21.0%) | 40 (5.9%) |
| Total | 760 (100.0%) | 675 (100.0%) |
Earnings by Sex by Educational Attainment in Lake Ozark
Average earnings in Lake Ozark are $68,239 for men and $35,804 for women, a difference of 47.5%. Men with an educational attainment of graduate degree enjoy the highest average annual earnings of $205,227, while those with less than high school education earn the least with $21,731. Women with an educational attainment of graduate degree earn the most with the average annual earnings of $98,021, while those with less than high school education have the smallest earnings of $18,393.
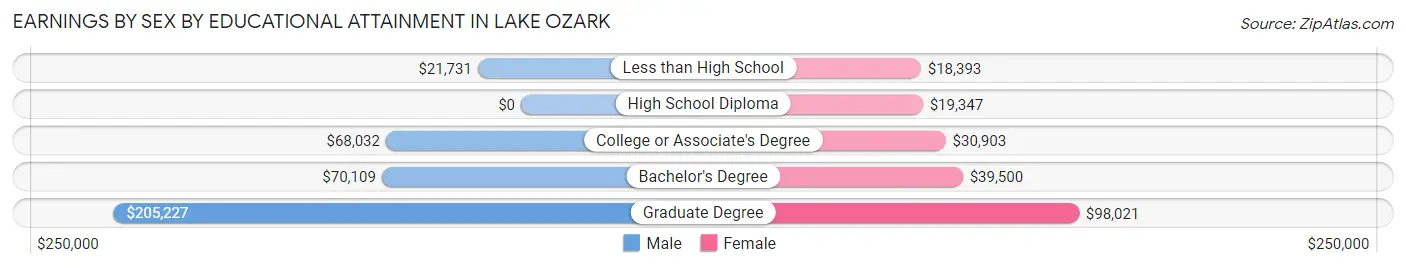
| Educational Attainment | Male Income | Female Income |
| Less than High School | $21,731 | $18,393 |
| High School Diploma | - | - |
| College or Associate's Degree | $68,032 | $30,903 |
| Bachelor's Degree | $70,109 | $39,500 |
| Graduate Degree | $205,227 | $98,021 |
| Total | $68,239 | $35,804 |
Family Income in Lake Ozark
Family Income Brackets in Lake Ozark
According to the Lake Ozark family income data, there are 149 families falling into the $100,000 to $149,999 income range, which is the most common income bracket and makes up 22.5% of all families.
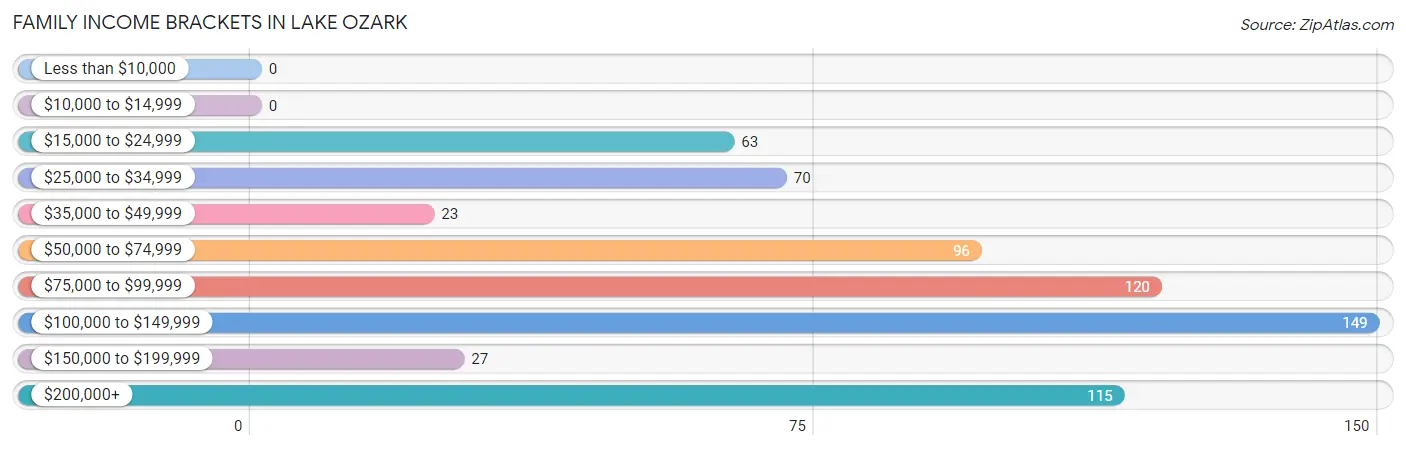
| Income Bracket | # Families | % Families |
| Less than $10,000 | 0 | 0.0% |
| $10,000 to $14,999 | 0 | 0.0% |
| $15,000 to $24,999 | 63 | 9.5% |
| $25,000 to $34,999 | 70 | 10.6% |
| $35,000 to $49,999 | 23 | 3.5% |
| $50,000 to $74,999 | 96 | 14.5% |
| $75,000 to $99,999 | 120 | 18.1% |
| $100,000 to $149,999 | 149 | 22.5% |
| $150,000 to $199,999 | 27 | 4.1% |
| $200,000+ | 115 | 17.3% |
Family Income by Famaliy Size in Lake Ozark
4-person families (81 | 12.2%) account for the highest median family income in Lake Ozark with $113,512 per family, while 2-person families (424 | 63.9%) have the highest median income of $44,830 per family member.
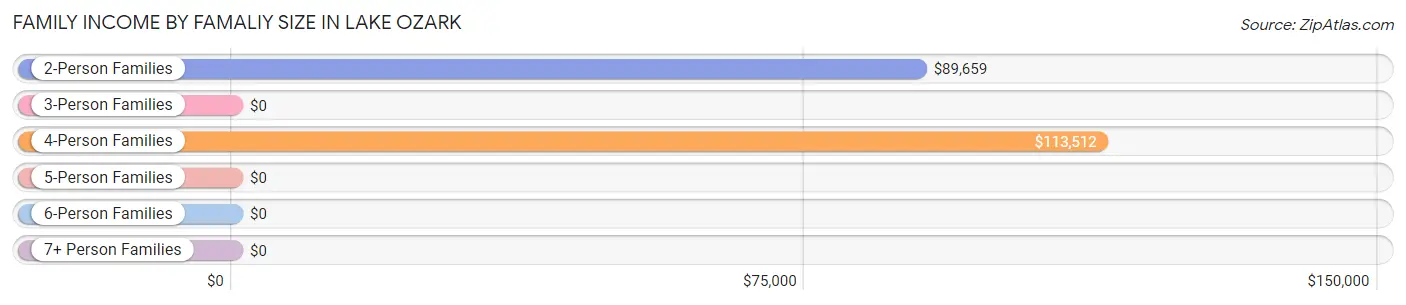
| Income Bracket | # Families | Median Income |
| 2-Person Families | 424 (63.9%) | $89,659 |
| 3-Person Families | 76 (11.5%) | $0 |
| 4-Person Families | 81 (12.2%) | $113,512 |
| 5-Person Families | 36 (5.4%) | $0 |
| 6-Person Families | 46 (6.9%) | $0 |
| 7+ Person Families | 0 (0.0%) | $0 |
| Total | 663 (100.0%) | $82,596 |
Family Income by Number of Earners in Lake Ozark
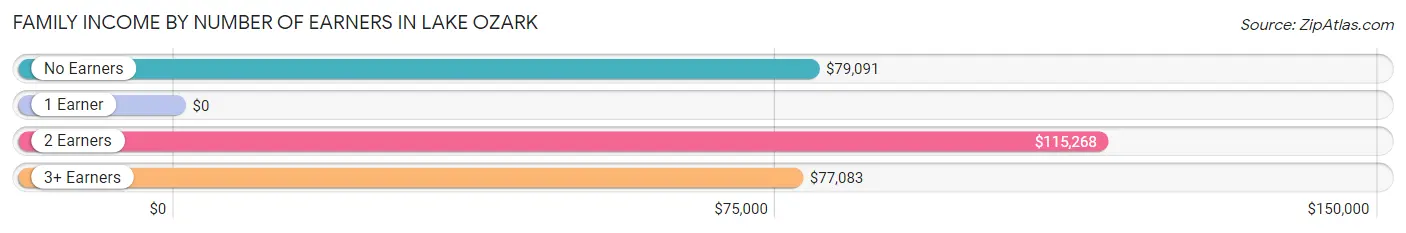
| Number of Earners | # Families | Median Income |
| No Earners | 134 (20.2%) | $79,091 |
| 1 Earner | 178 (26.9%) | $0 |
| 2 Earners | 279 (42.1%) | $115,268 |
| 3+ Earners | 72 (10.9%) | $77,083 |
| Total | 663 (100.0%) | $82,596 |
Household Income in Lake Ozark
Household Income Brackets in Lake Ozark
With 247 households falling in the category, the $100,000 to $149,999 income range is the most frequent in Lake Ozark, accounting for 21.7% of all households. In contrast, only 21 households (1.8%) fall into the less than $10,000 income bracket, making it the least populous group.
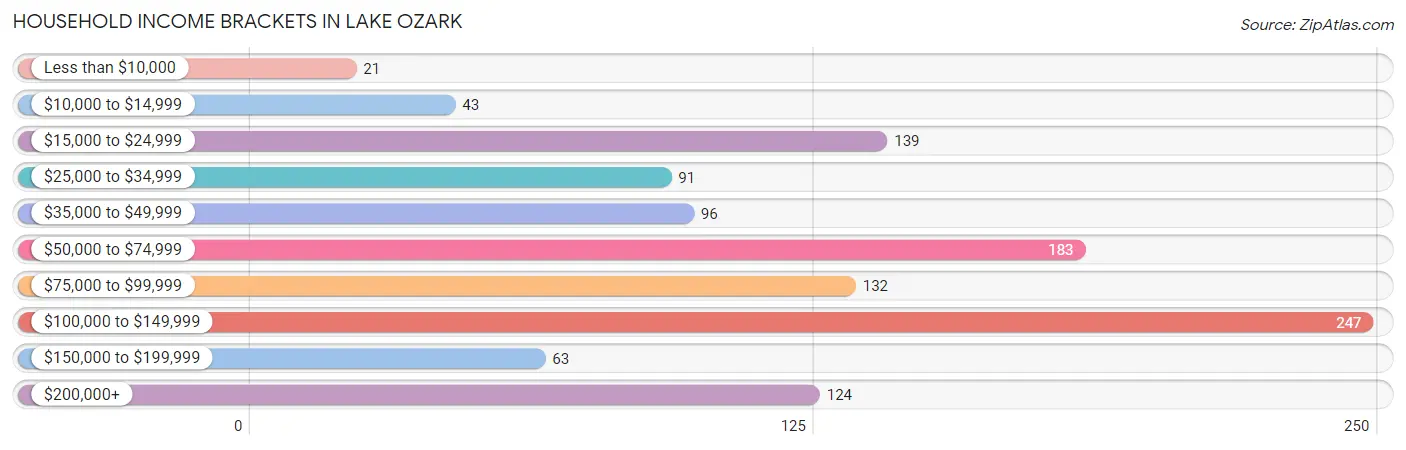
| Income Bracket | # Households | % Households |
| Less than $10,000 | 21 | 1.8% |
| $10,000 to $14,999 | 43 | 3.8% |
| $15,000 to $24,999 | 139 | 12.2% |
| $25,000 to $34,999 | 91 | 8.0% |
| $35,000 to $49,999 | 96 | 8.4% |
| $50,000 to $74,999 | 183 | 16.1% |
| $75,000 to $99,999 | 132 | 11.6% |
| $100,000 to $149,999 | 247 | 21.7% |
| $150,000 to $199,999 | 63 | 5.5% |
| $200,000+ | 124 | 10.9% |
Household Income by Householder Age in Lake Ozark
The median household income in Lake Ozark is $71,528, with the highest median household income of $98,125 found in the 25 to 44 years age bracket for the primary householder. A total of 255 households (22.4%) fall into this category. Meanwhile, the 15 to 24 years age bracket for the primary householder has the lowest median household income of $0, with 72 households (6.3%) in this group.
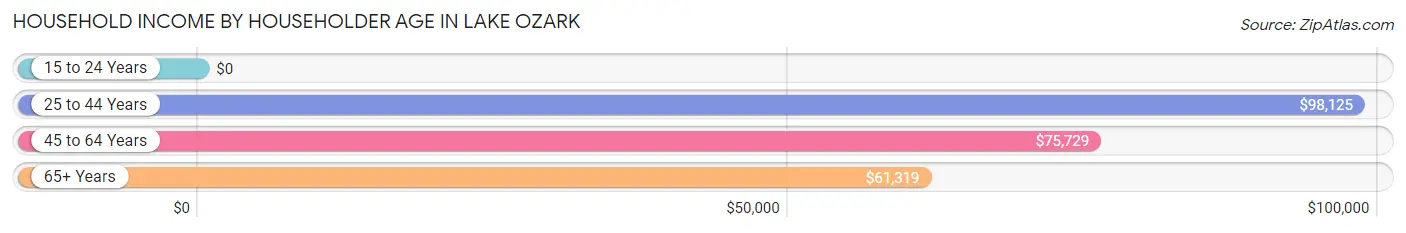
| Income Bracket | # Households | Median Income |
| 15 to 24 Years | 72 (6.3%) | $0 |
| 25 to 44 Years | 255 (22.4%) | $98,125 |
| 45 to 64 Years | 489 (42.9%) | $75,729 |
| 65+ Years | 323 (28.4%) | $61,319 |
| Total | 1,139 (100.0%) | $71,528 |
Poverty in Lake Ozark
Income Below Poverty by Sex and Age in Lake Ozark
With 18.0% poverty level for males and 25.2% for females among the residents of Lake Ozark, under 5 year old males and 5 year old females are the most vulnerable to poverty, with 48 males (66.7%) and 11 females (100.0%) in their respective age groups living below the poverty level.
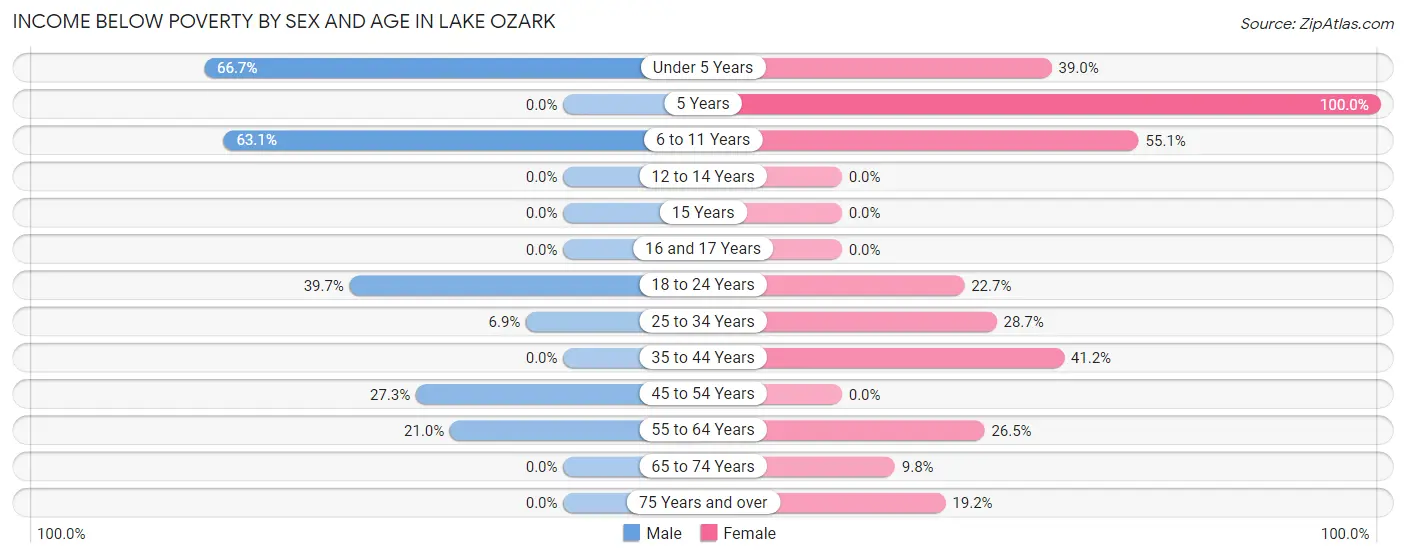
| Age Bracket | Male | Female |
| Under 5 Years | 48 (66.7%) | 37 (39.0%) |
| 5 Years | 0 (0.0%) | 11 (100.0%) |
| 6 to 11 Years | 41 (63.1%) | 27 (55.1%) |
| 12 to 14 Years | 0 (0.0%) | 0 (0.0%) |
| 15 Years | 0 (0.0%) | 0 (0.0%) |
| 16 and 17 Years | 0 (0.0%) | 0 (0.0%) |
| 18 to 24 Years | 46 (39.7%) | 15 (22.7%) |
| 25 to 34 Years | 10 (6.9%) | 85 (28.7%) |
| 35 to 44 Years | 0 (0.0%) | 47 (41.2%) |
| 45 to 54 Years | 38 (27.3%) | 0 (0.0%) |
| 55 to 64 Years | 62 (21.0%) | 58 (26.5%) |
| 65 to 74 Years | 0 (0.0%) | 18 (9.8%) |
| 75 Years and over | 0 (0.0%) | 15 (19.2%) |
| Total | 245 (18.0%) | 313 (25.2%) |
Income Above Poverty by Sex and Age in Lake Ozark
According to the poverty statistics in Lake Ozark, males aged 12 to 14 years and females aged 45 to 54 years are the age groups that are most secure financially, with 100.0% of males and 100.0% of females in these age groups living above the poverty line.
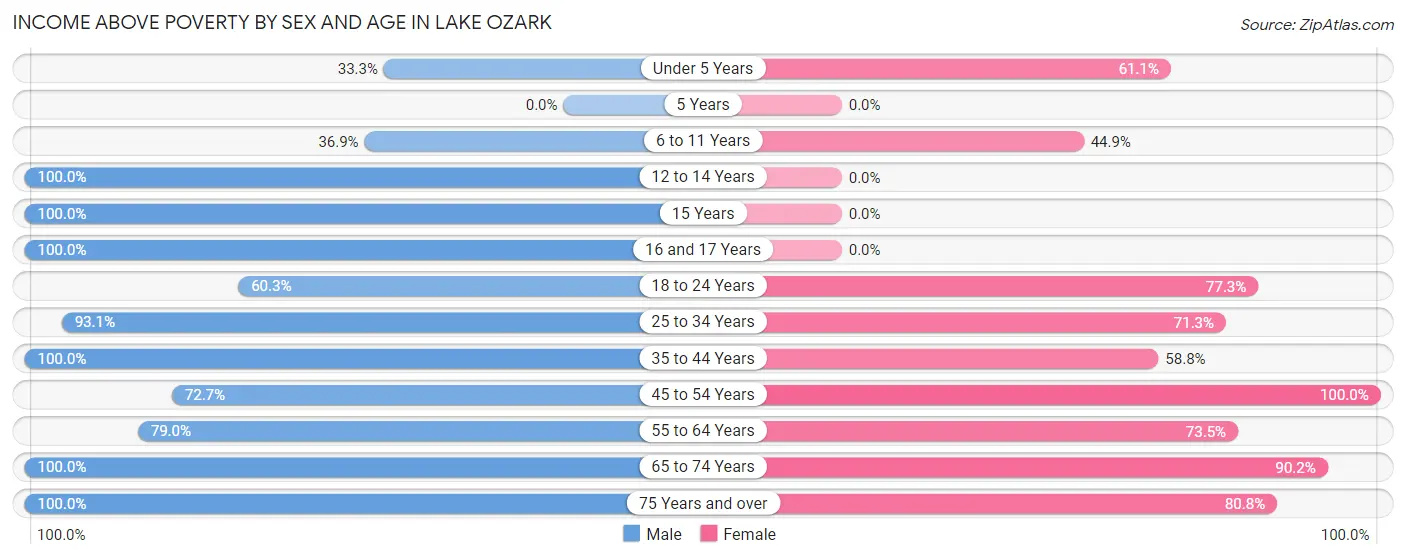
| Age Bracket | Male | Female |
| Under 5 Years | 24 (33.3%) | 58 (61.1%) |
| 5 Years | 0 (0.0%) | 0 (0.0%) |
| 6 to 11 Years | 24 (36.9%) | 22 (44.9%) |
| 12 to 14 Years | 86 (100.0%) | 0 (0.0%) |
| 15 Years | 42 (100.0%) | 0 (0.0%) |
| 16 and 17 Years | 34 (100.0%) | 0 (0.0%) |
| 18 to 24 Years | 70 (60.3%) | 51 (77.3%) |
| 25 to 34 Years | 135 (93.1%) | 211 (71.3%) |
| 35 to 44 Years | 82 (100.0%) | 67 (58.8%) |
| 45 to 54 Years | 101 (72.7%) | 133 (100.0%) |
| 55 to 64 Years | 233 (79.0%) | 161 (73.5%) |
| 65 to 74 Years | 169 (100.0%) | 165 (90.2%) |
| 75 Years and over | 112 (100.0%) | 63 (80.8%) |
| Total | 1,112 (82.0%) | 931 (74.8%) |
Income Below Poverty Among Married-Couple Families in Lake Ozark
The poverty statistics for married-couple families in Lake Ozark show that 11.2% or 65 of the total 582 families live below the poverty line. Families with 3 or 4 children have the highest poverty rate of 80.7%, comprising of 46 families. On the other hand, families with 1 or 2 children have the lowest poverty rate of 0.0%, which includes 0 families.
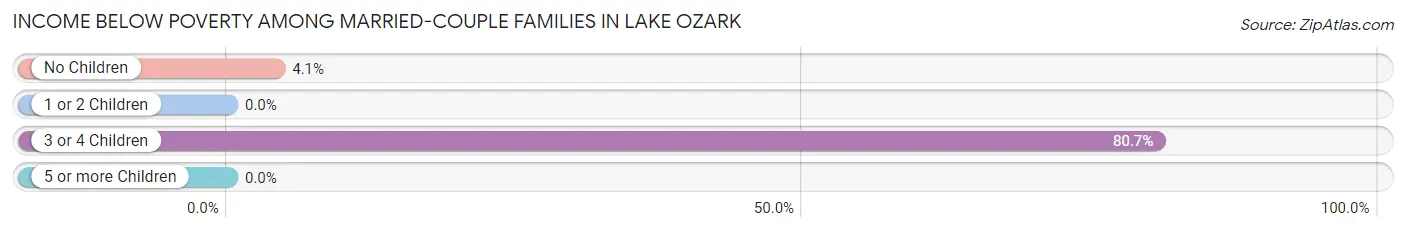
| Children | Above Poverty | Below Poverty |
| No Children | 443 (95.9%) | 19 (4.1%) |
| 1 or 2 Children | 63 (100.0%) | 0 (0.0%) |
| 3 or 4 Children | 11 (19.3%) | 46 (80.7%) |
| 5 or more Children | 0 (0.0%) | 0 (0.0%) |
| Total | 517 (88.8%) | 65 (11.2%) |
Income Below Poverty Among Single-Parent Households in Lake Ozark
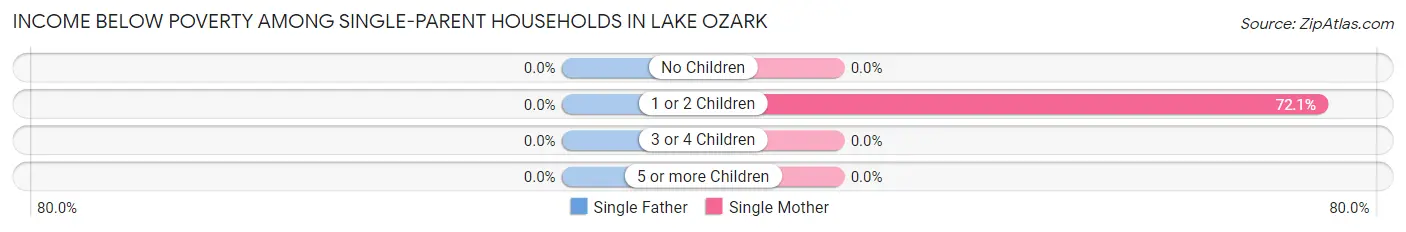
| Children | Single Father | Single Mother |
| No Children | 0 (0.0%) | 0 (0.0%) |
| 1 or 2 Children | 0 (0.0%) | 44 (72.1%) |
| 3 or 4 Children | 0 (0.0%) | 0 (0.0%) |
| 5 or more Children | 0 (0.0%) | 0 (0.0%) |
| Total | 0 (0.0%) | 44 (54.3%) |
Income Below Poverty Among Married-Couple vs Single-Parent Households in Lake Ozark
The poverty data for Lake Ozark shows that 65 of the married-couple family households (11.2%) and 44 of the single-parent households (54.3%) are living below the poverty level. Within the married-couple family households, those with 3 or 4 children have the highest poverty rate, with 46 households (80.7%) falling below the poverty line. Among the single-parent households, those with 1 or 2 children have the highest poverty rate, with 44 household (72.1%) living below poverty.
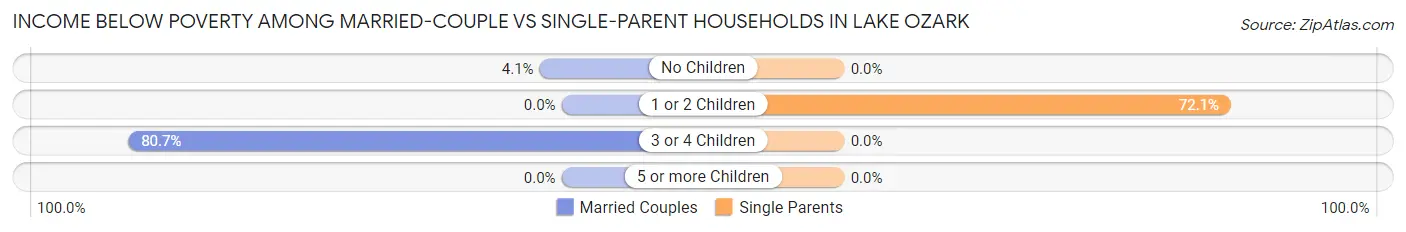
| Children | Married-Couple Families | Single-Parent Households |
| No Children | 19 (4.1%) | 0 (0.0%) |
| 1 or 2 Children | 0 (0.0%) | 44 (72.1%) |
| 3 or 4 Children | 46 (80.7%) | 0 (0.0%) |
| 5 or more Children | 0 (0.0%) | 0 (0.0%) |
| Total | 65 (11.2%) | 44 (54.3%) |
Race in Lake Ozark
The most populous races in Lake Ozark are White / Caucasian (2,404 | 91.5%), Black / African American (169 | 6.4%), and Hispanic or Latino (34 | 1.3%).
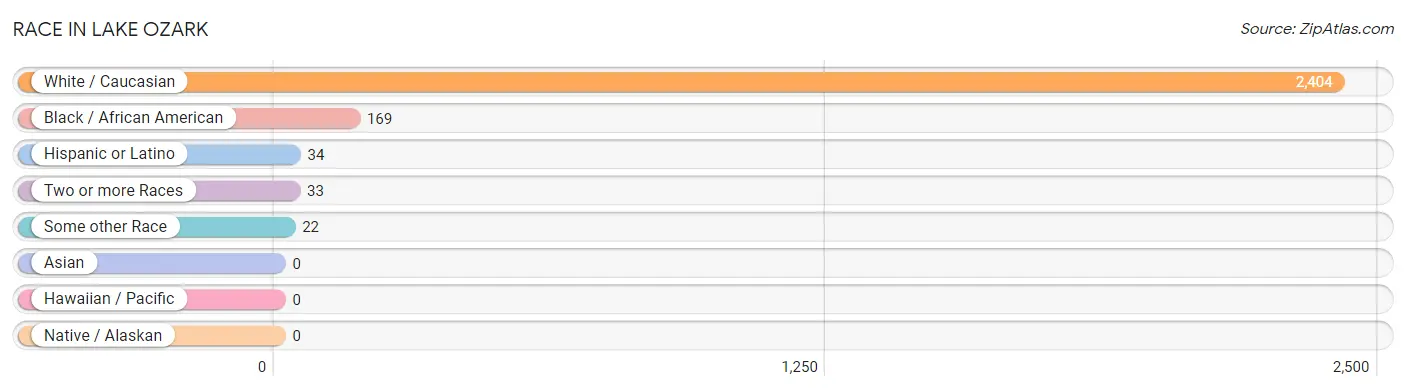
| Race | # Population | % Population |
| Asian | 0 | 0.0% |
| Black / African American | 169 | 6.4% |
| Hawaiian / Pacific | 0 | 0.0% |
| Hispanic or Latino | 34 | 1.3% |
| Native / Alaskan | 0 | 0.0% |
| White / Caucasian | 2,404 | 91.5% |
| Two or more Races | 33 | 1.3% |
| Some other Race | 22 | 0.8% |
| Total | 2,628 | 100.0% |
Ancestry in Lake Ozark
The most populous ancestries reported in Lake Ozark are German (802 | 30.5%), Irish (456 | 17.3%), English (336 | 12.8%), Italian (142 | 5.4%), and Dutch (127 | 4.8%), together accounting for 70.9% of all Lake Ozark residents.
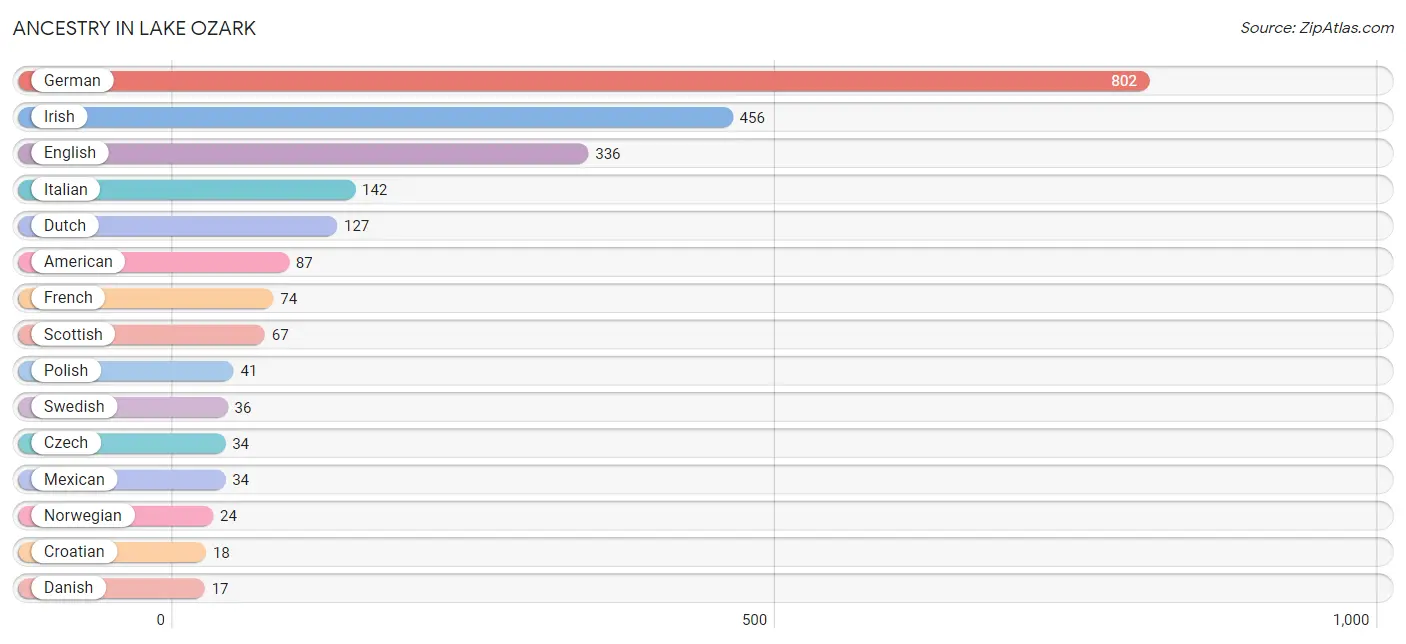
| Ancestry | # Population | % Population |
| American | 87 | 3.3% |
| Arab | 4 | 0.2% |
| British | 10 | 0.4% |
| Cherokee | 16 | 0.6% |
| Croatian | 18 | 0.7% |
| Czech | 34 | 1.3% |
| Danish | 17 | 0.6% |
| Dutch | 127 | 4.8% |
| English | 336 | 12.8% |
| European | 7 | 0.3% |
| French | 74 | 2.8% |
| German | 802 | 30.5% |
| Greek | 6 | 0.2% |
| Irish | 456 | 17.3% |
| Italian | 142 | 5.4% |
| Lithuanian | 6 | 0.2% |
| Mexican | 34 | 1.3% |
| Norwegian | 24 | 0.9% |
| Polish | 41 | 1.6% |
| Russian | 10 | 0.4% |
| Scandinavian | 7 | 0.3% |
| Scotch-Irish | 14 | 0.5% |
| Scottish | 67 | 2.5% |
| Swedish | 36 | 1.4% |
| Syrian | 4 | 0.2% |
| Welsh | 10 | 0.4% | View All 26 Rows |
Immigrants in Lake Ozark
The most numerous immigrant groups reported in Lake Ozark came from Central America (10 | 0.4%), Latin America (10 | 0.4%), and Mexico (10 | 0.4%), together accounting for 1.1% of all Lake Ozark residents.
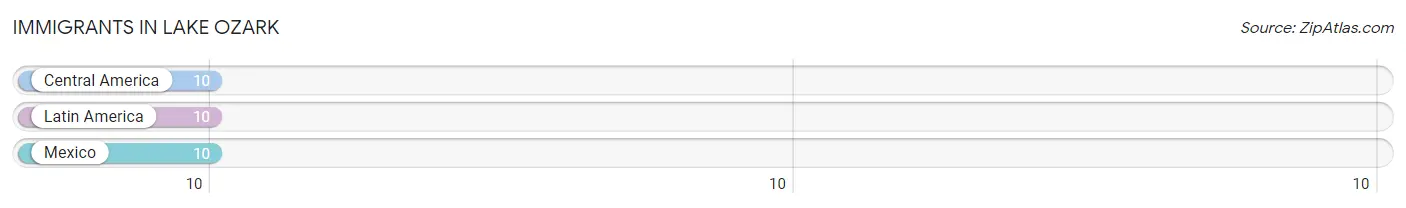
| Immigration Origin | # Population | % Population |
| Central America | 10 | 0.4% |
| Latin America | 10 | 0.4% |
| Mexico | 10 | 0.4% | View All 3 Rows |
Sex and Age in Lake Ozark
Sex and Age in Lake Ozark
The most populous age groups in Lake Ozark are 55 to 59 Years (148 | 10.7%) for men and 30 to 34 Years (163 | 13.1%) for women.
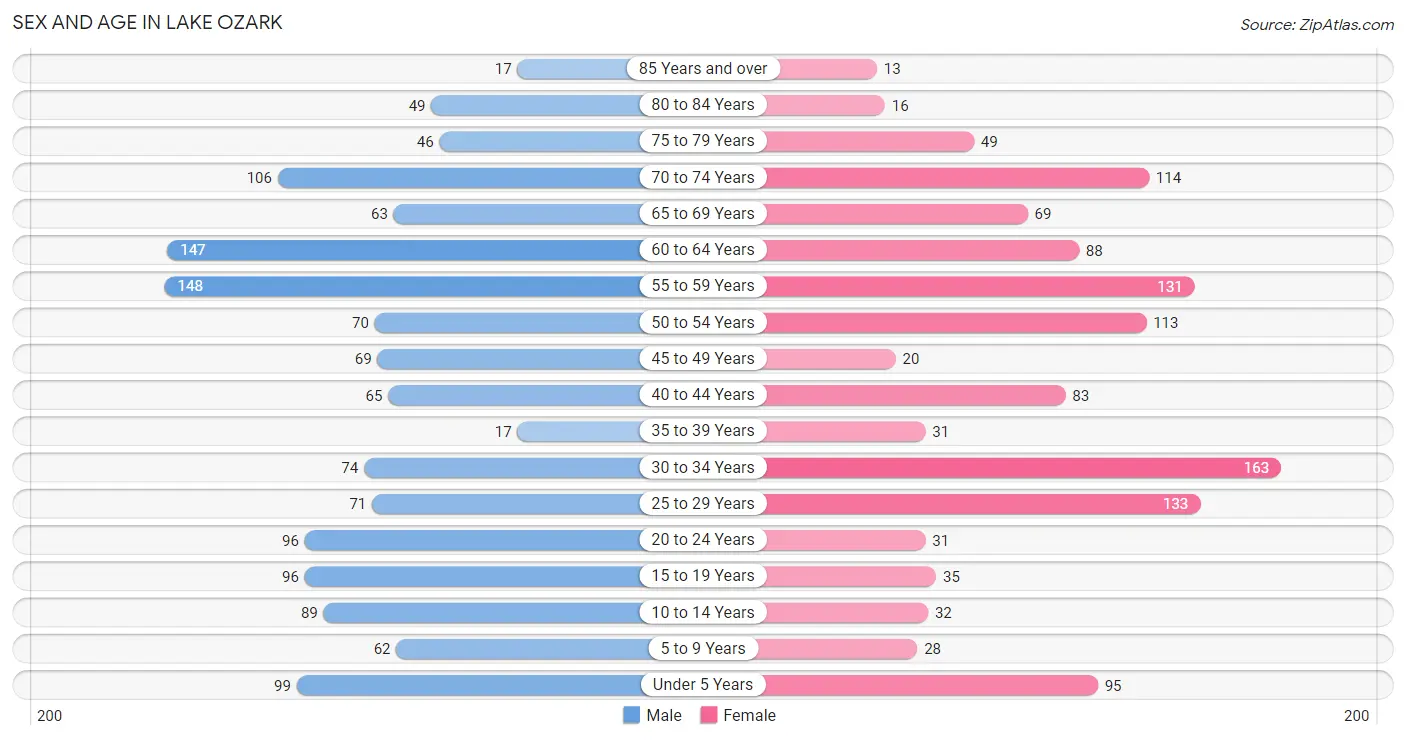
| Age Bracket | Male | Female |
| Under 5 Years | 99 (7.1%) | 95 (7.6%) |
| 5 to 9 Years | 62 (4.5%) | 28 (2.2%) |
| 10 to 14 Years | 89 (6.4%) | 32 (2.6%) |
| 15 to 19 Years | 96 (6.9%) | 35 (2.8%) |
| 20 to 24 Years | 96 (6.9%) | 31 (2.5%) |
| 25 to 29 Years | 71 (5.1%) | 133 (10.7%) |
| 30 to 34 Years | 74 (5.3%) | 163 (13.1%) |
| 35 to 39 Years | 17 (1.2%) | 31 (2.5%) |
| 40 to 44 Years | 65 (4.7%) | 83 (6.7%) |
| 45 to 49 Years | 69 (5.0%) | 20 (1.6%) |
| 50 to 54 Years | 70 (5.1%) | 113 (9.1%) |
| 55 to 59 Years | 148 (10.7%) | 131 (10.5%) |
| 60 to 64 Years | 147 (10.6%) | 88 (7.1%) |
| 65 to 69 Years | 63 (4.5%) | 69 (5.6%) |
| 70 to 74 Years | 106 (7.7%) | 114 (9.2%) |
| 75 to 79 Years | 46 (3.3%) | 49 (3.9%) |
| 80 to 84 Years | 49 (3.5%) | 16 (1.3%) |
| 85 Years and over | 17 (1.2%) | 13 (1.1%) |
| Total | 1,384 (100.0%) | 1,244 (100.0%) |
Families and Households in Lake Ozark
Median Family Size in Lake Ozark
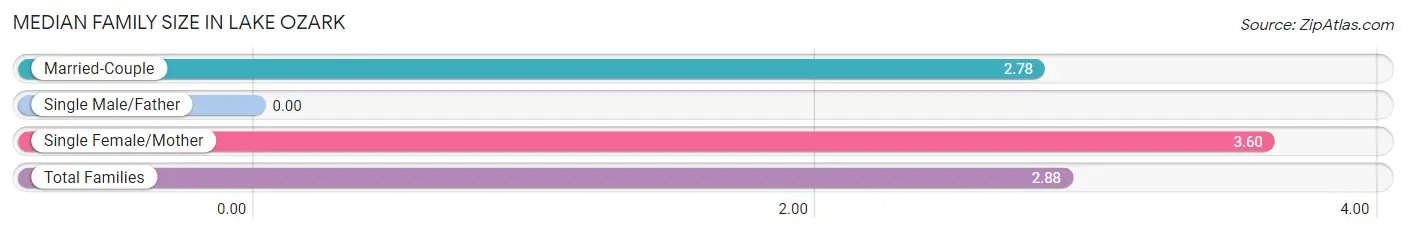
| Family Type | # Families | Family Size |
| Married-Couple | 582 (87.8%) | 2.78 |
| Single Male/Father | 0 (0.0%) | - |
| Single Female/Mother | 81 (12.2%) | 3.60 |
| Total Families | 663 (100.0%) | 2.88 |
Median Household Size in Lake Ozark
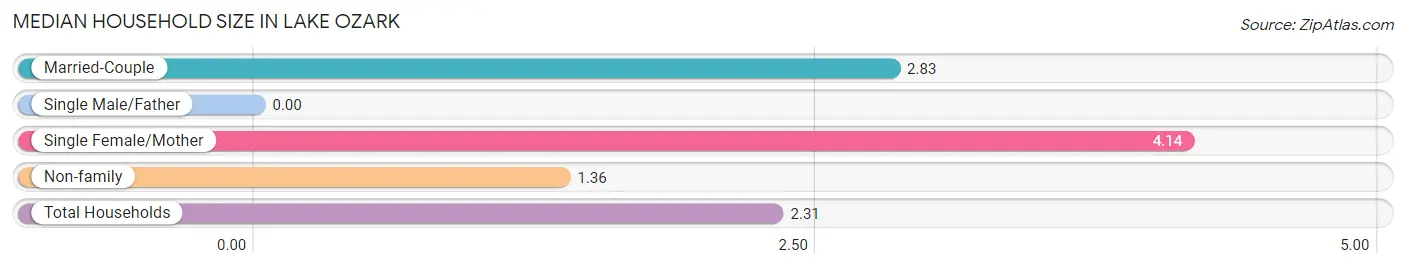
| Household Type | # Households | Household Size |
| Married-Couple | 582 (51.1%) | 2.83 |
| Single Male/Father | 0 (0.0%) | - |
| Single Female/Mother | 81 (7.1%) | 4.14 |
| Non-family | 476 (41.8%) | 1.36 |
| Total Households | 1,139 (100.0%) | 2.31 |
Household Size by Marriage Status in Lake Ozark
Out of a total of 1,139 households in Lake Ozark, 663 (58.2%) are family households, while 476 (41.8%) are nonfamily households. The most numerous type of family households are 2-person households, comprising 379, and the most common type of nonfamily households are 1-person households, comprising 294.
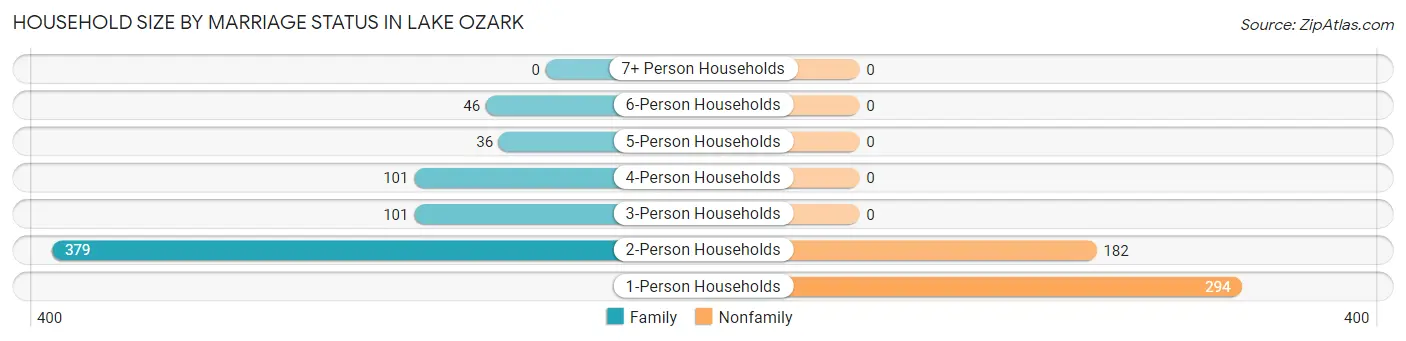
| Household Size | Family Households | Nonfamily Households |
| 1-Person Households | - | 294 (25.8%) |
| 2-Person Households | 379 (33.3%) | 182 (16.0%) |
| 3-Person Households | 101 (8.9%) | 0 (0.0%) |
| 4-Person Households | 101 (8.9%) | 0 (0.0%) |
| 5-Person Households | 36 (3.2%) | 0 (0.0%) |
| 6-Person Households | 46 (4.0%) | 0 (0.0%) |
| 7+ Person Households | 0 (0.0%) | 0 (0.0%) |
| Total | 663 (58.2%) | 476 (41.8%) |
Female Fertility in Lake Ozark
Fertility by Age in Lake Ozark
Average fertility rate in Lake Ozark is 32.0 births per 1,000 women. Women in the age bracket of 20 to 34 years have the highest fertility rate with 49.0 births per 1,000 women. Women in the age bracket of 20 to 34 years acount for 100.0% of all women with births.
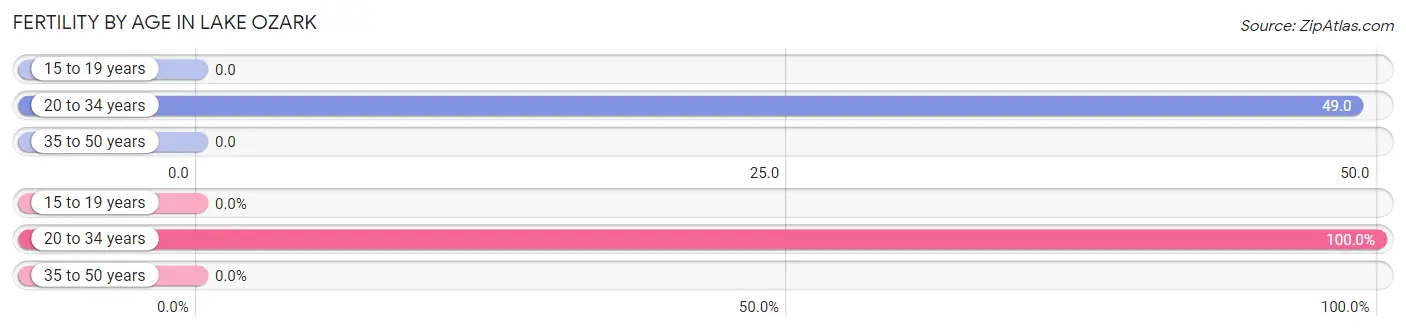
| Age Bracket | Women with Births | Births / 1,000 Women |
| 15 to 19 years | 0 (0.0%) | 0.0 |
| 20 to 34 years | 16 (100.0%) | 49.0 |
| 35 to 50 years | 0 (0.0%) | 0.0 |
| Total | 16 (100.0%) | 32.0 |
Fertility by Age by Marriage Status in Lake Ozark
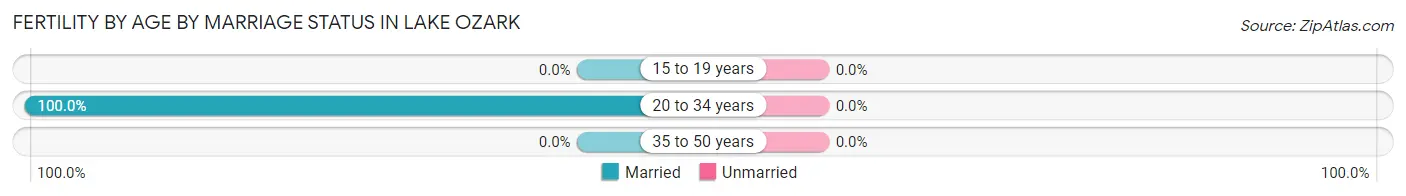
| Age Bracket | Married | Unmarried |
| 15 to 19 years | 0 (0.0%) | 0 (0.0%) |
| 20 to 34 years | 16 (100.0%) | 0 (0.0%) |
| 35 to 50 years | 0 (0.0%) | 0 (0.0%) |
| Total | 16 (100.0%) | 0 (0.0%) |
Fertility by Education in Lake Ozark
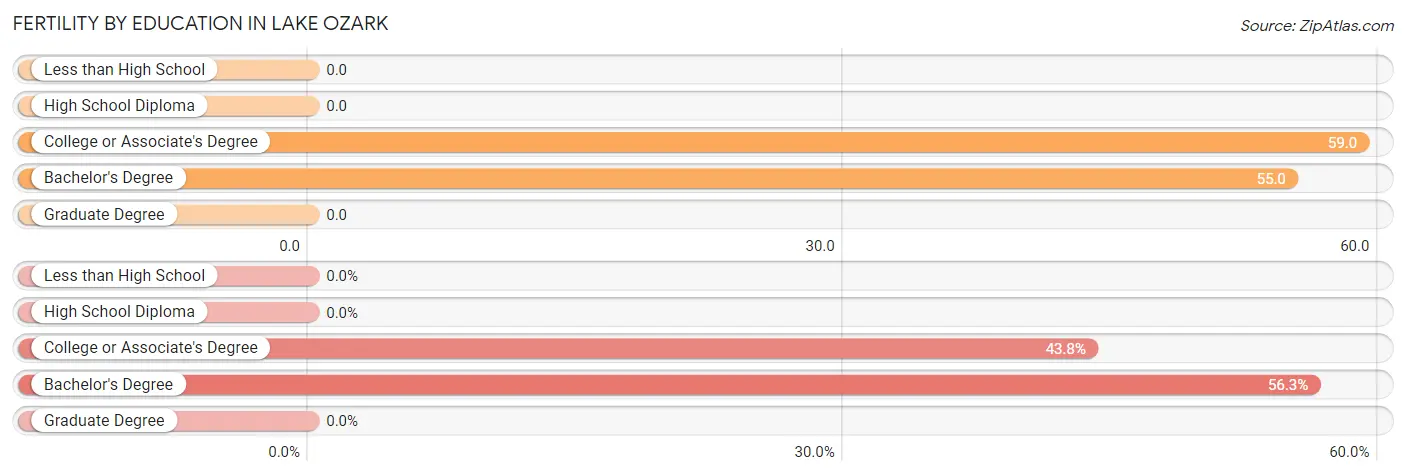
| Educational Attainment | Women with Births | Births / 1,000 Women |
| Less than High School | 0 (0.0%) | 0.0 |
| High School Diploma | 0 (0.0%) | 0.0 |
| College or Associate's Degree | 7 (43.8%) | 59.0 |
| Bachelor's Degree | 9 (56.2%) | 55.0 |
| Graduate Degree | 0 (0.0%) | 0.0 |
| Total | 16 (100.0%) | 32.0 |
Fertility by Education by Marriage Status in Lake Ozark
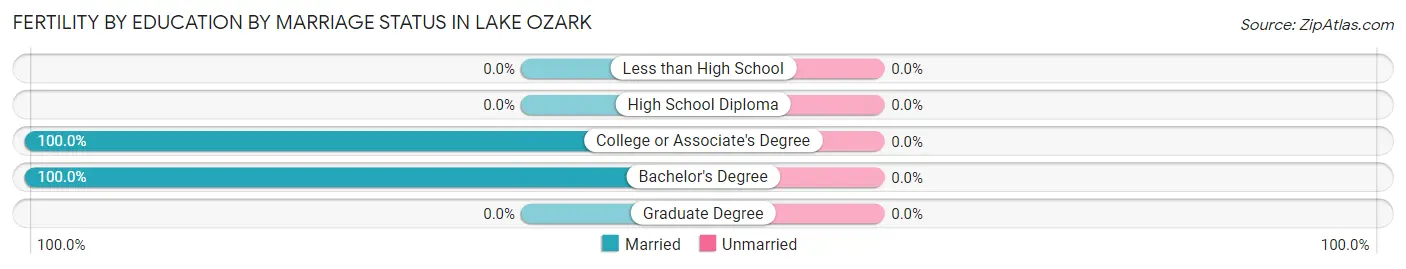
| Educational Attainment | Married | Unmarried |
| Less than High School | 0 (0.0%) | 0 (0.0%) |
| High School Diploma | 0 (0.0%) | 0 (0.0%) |
| College or Associate's Degree | 7 (100.0%) | 0 (0.0%) |
| Bachelor's Degree | 9 (100.0%) | 0 (0.0%) |
| Graduate Degree | 0 (0.0%) | 0 (0.0%) |
| Total | 16 (100.0%) | 0 (0.0%) |
Employment Characteristics in Lake Ozark
Employment by Class of Employer in Lake Ozark
Among the 1,269 employed individuals in Lake Ozark, private company employees (914 | 72.0%), not-for-profit organizations (103 | 8.1%), and self-employed (incorporated) (94 | 7.4%) make up the most common classes of employment.
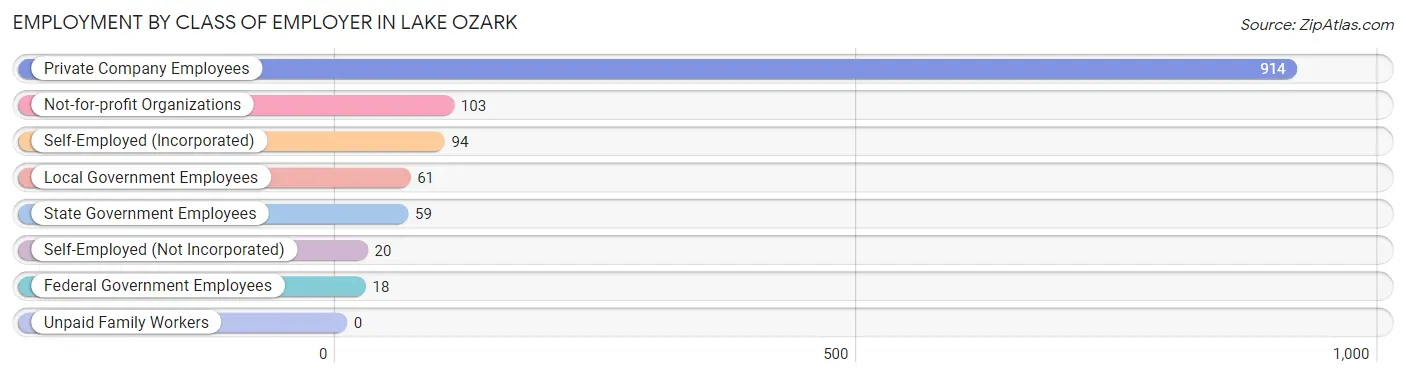
| Employer Class | # Employees | % Employees |
| Private Company Employees | 914 | 72.0% |
| Self-Employed (Incorporated) | 94 | 7.4% |
| Self-Employed (Not Incorporated) | 20 | 1.6% |
| Not-for-profit Organizations | 103 | 8.1% |
| Local Government Employees | 61 | 4.8% |
| State Government Employees | 59 | 4.6% |
| Federal Government Employees | 18 | 1.4% |
| Unpaid Family Workers | 0 | 0.0% |
| Total | 1,269 | 100.0% |
Employment Status by Age in Lake Ozark
According to the labor force statistics for Lake Ozark, out of the total population over 16 years of age (2,181), 61.8% or 1,348 individuals are in the labor force, with 4.0% or 54 of them unemployed. The age group with the highest labor force participation rate is 20 to 24 years, with 100.0% or 127 individuals in the labor force. Within the labor force, the 35 to 44 years age range has the highest percentage of unemployed individuals, with 19.9% or 37 of them being unemployed.
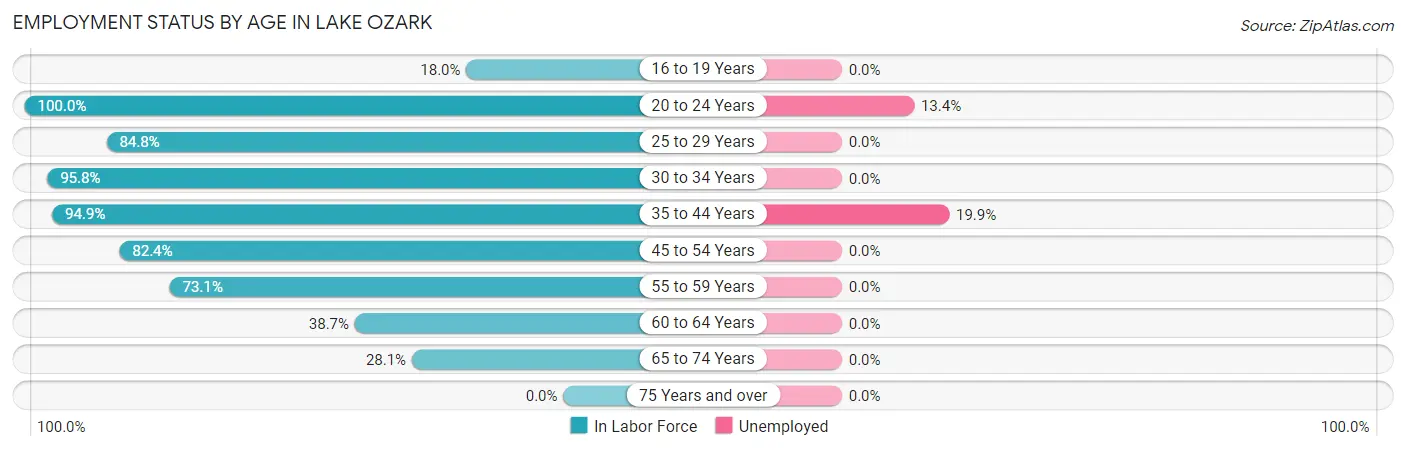
| Age Bracket | In Labor Force | Unemployed |
| 16 to 19 Years | 16 (18.0%) | 0 (0.0%) |
| 20 to 24 Years | 127 (100.0%) | 17 (13.4%) |
| 25 to 29 Years | 173 (84.8%) | 0 (0.0%) |
| 30 to 34 Years | 227 (95.8%) | 0 (0.0%) |
| 35 to 44 Years | 186 (94.9%) | 37 (19.9%) |
| 45 to 54 Years | 224 (82.4%) | 0 (0.0%) |
| 55 to 59 Years | 204 (73.1%) | 0 (0.0%) |
| 60 to 64 Years | 91 (38.7%) | 0 (0.0%) |
| 65 to 74 Years | 99 (28.1%) | 0 (0.0%) |
| 75 Years and over | 0 (0.0%) | 0 (0.0%) |
| Total | 1,348 (61.8%) | 54 (4.0%) |
Employment Status by Educational Attainment in Lake Ozark
According to labor force statistics for Lake Ozark, 77.7% of individuals (1,106) out of the total population between 25 and 64 years of age (1,423) are in the labor force, with 3.3% or 36 of them being unemployed. The group with the highest labor force participation rate are those with the educational attainment of bachelor's degree or higher, with 88.0% or 520 individuals in the labor force. Within the labor force, individuals with high school diploma education have the highest percentage of unemployment, with 17.4% or 37 of them being unemployed.
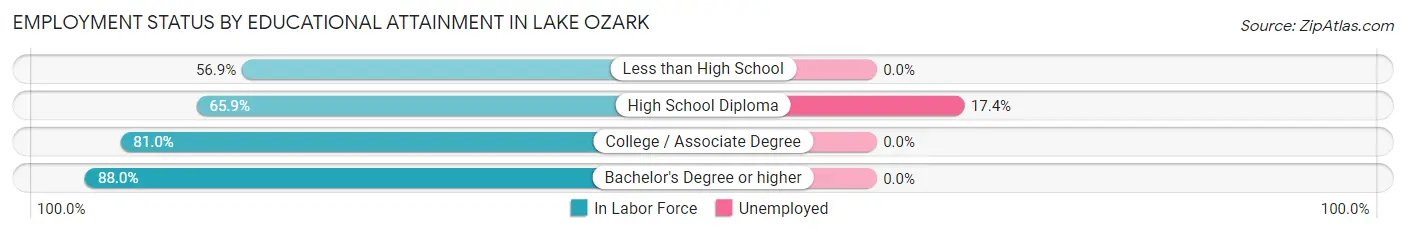
| Educational Attainment | In Labor Force | Unemployed |
| Less than High School | 95 (56.9%) | 0 (0.0%) |
| High School Diploma | 213 (65.9%) | 56 (17.4%) |
| College / Associate Degree | 277 (81.0%) | 0 (0.0%) |
| Bachelor's Degree or higher | 520 (88.0%) | 0 (0.0%) |
| Total | 1,106 (77.7%) | 47 (3.3%) |
Employment Occupations by Sex in Lake Ozark
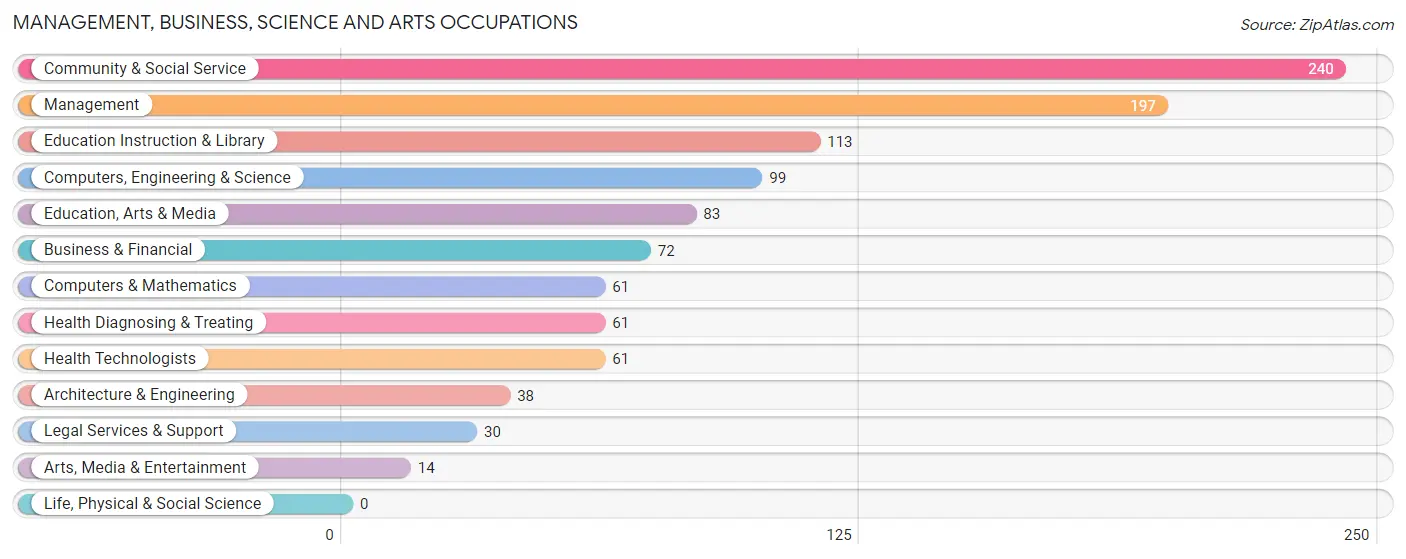
Management, Business, Science and Arts Occupations
The most common Management, Business, Science and Arts occupations in Lake Ozark are Community & Social Service (240 | 18.6%), Management (197 | 15.2%), Education Instruction & Library (113 | 8.7%), Computers, Engineering & Science (99 | 7.7%), and Education, Arts & Media (83 | 6.4%).
Management, Business, Science and Arts Occupations by Sex
Within the Management, Business, Science and Arts occupations in Lake Ozark, the most male-oriented occupations are Computers, Engineering & Science (100.0%), Computers & Mathematics (100.0%), and Architecture & Engineering (100.0%), while the most female-oriented occupations are Education, Arts & Media (100.0%), Education Instruction & Library (92.0%), and Community & Social Service (84.2%).
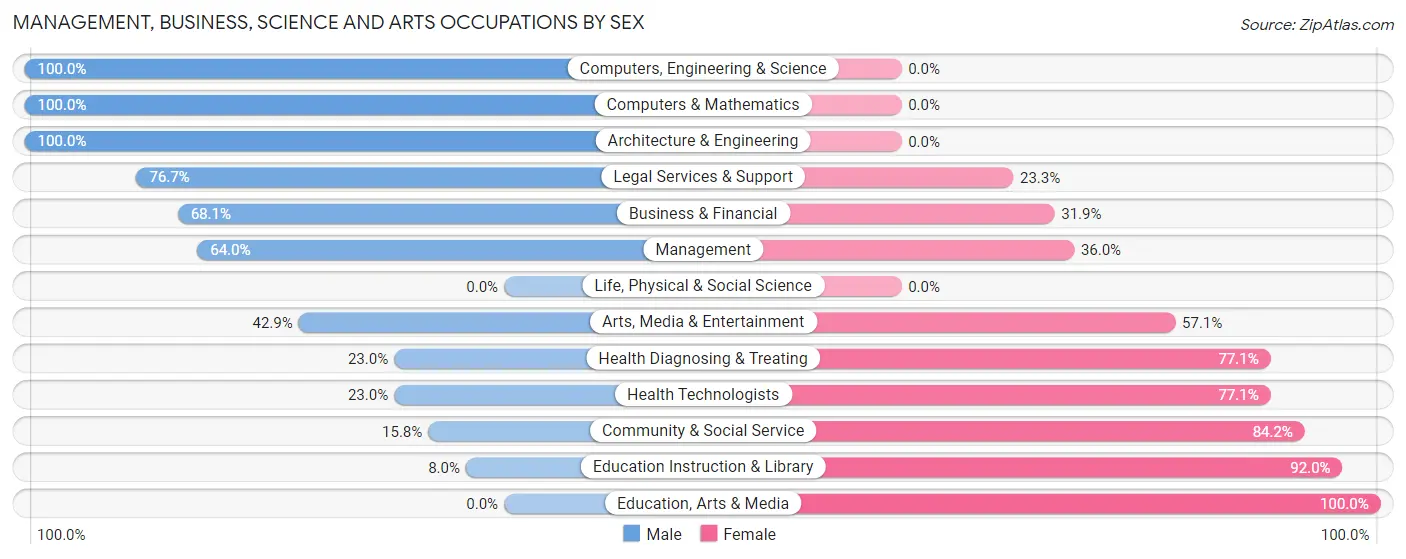
| Occupation | Male | Female |
| Management | 126 (64.0%) | 71 (36.0%) |
| Business & Financial | 49 (68.1%) | 23 (31.9%) |
| Computers, Engineering & Science | 99 (100.0%) | 0 (0.0%) |
| Computers & Mathematics | 61 (100.0%) | 0 (0.0%) |
| Architecture & Engineering | 38 (100.0%) | 0 (0.0%) |
| Life, Physical & Social Science | 0 (0.0%) | 0 (0.0%) |
| Community & Social Service | 38 (15.8%) | 202 (84.2%) |
| Education, Arts & Media | 0 (0.0%) | 83 (100.0%) |
| Legal Services & Support | 23 (76.7%) | 7 (23.3%) |
| Education Instruction & Library | 9 (8.0%) | 104 (92.0%) |
| Arts, Media & Entertainment | 6 (42.9%) | 8 (57.1%) |
| Health Diagnosing & Treating | 14 (23.0%) | 47 (77.0%) |
| Health Technologists | 14 (23.0%) | 47 (77.0%) |
| Total (Category) | 326 (48.7%) | 343 (51.3%) |
| Total (Overall) | 689 (53.3%) | 604 (46.7%) |
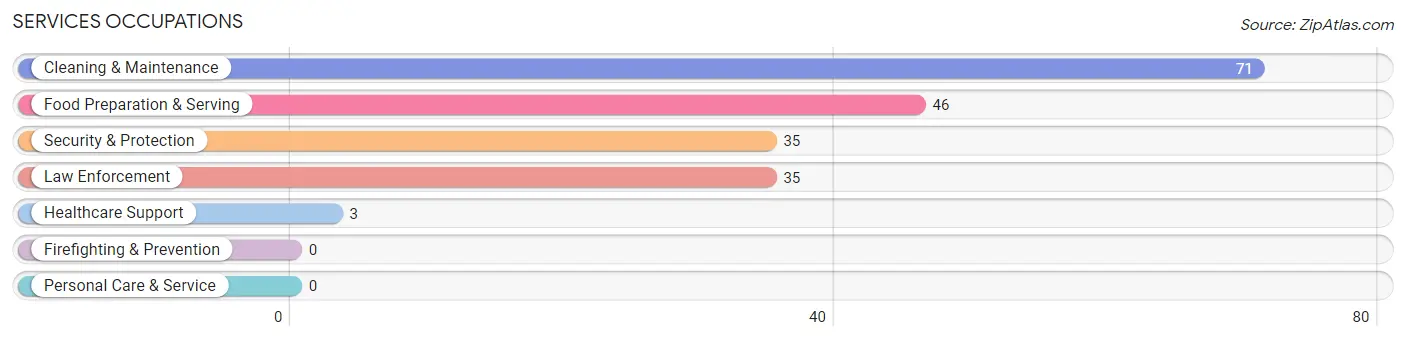
Services Occupations
The most common Services occupations in Lake Ozark are Cleaning & Maintenance (71 | 5.5%), Food Preparation & Serving (46 | 3.6%), Security & Protection (35 | 2.7%), Law Enforcement (35 | 2.7%), and Healthcare Support (3 | 0.2%).
Services Occupations by Sex
Within the Services occupations in Lake Ozark, the most male-oriented occupations are Security & Protection (100.0%), Law Enforcement (100.0%), and Food Preparation & Serving (100.0%), while the most female-oriented occupations are Healthcare Support (100.0%), and Cleaning & Maintenance (71.8%).
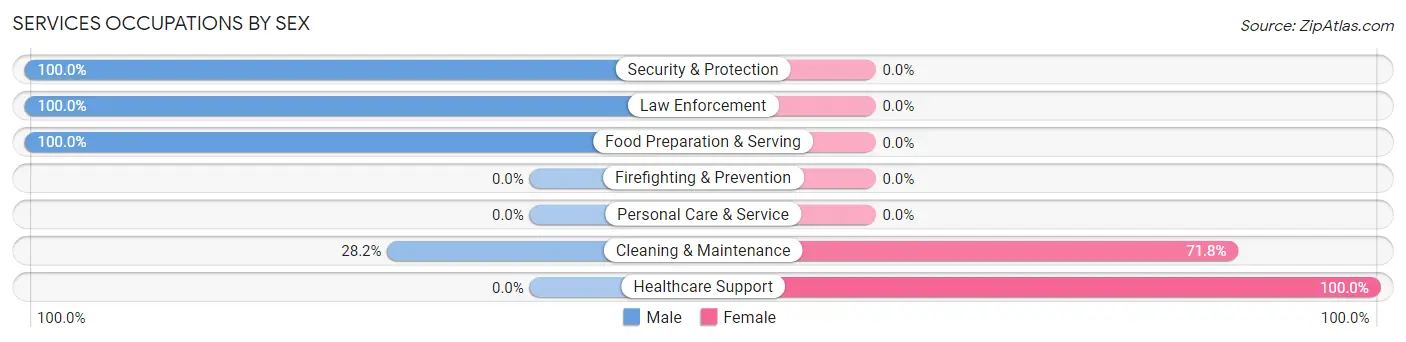
| Occupation | Male | Female |
| Healthcare Support | 0 (0.0%) | 3 (100.0%) |
| Security & Protection | 35 (100.0%) | 0 (0.0%) |
| Firefighting & Prevention | 0 (0.0%) | 0 (0.0%) |
| Law Enforcement | 35 (100.0%) | 0 (0.0%) |
| Food Preparation & Serving | 46 (100.0%) | 0 (0.0%) |
| Cleaning & Maintenance | 20 (28.2%) | 51 (71.8%) |
| Personal Care & Service | 0 (0.0%) | 0 (0.0%) |
| Total (Category) | 101 (65.2%) | 54 (34.8%) |
| Total (Overall) | 689 (53.3%) | 604 (46.7%) |
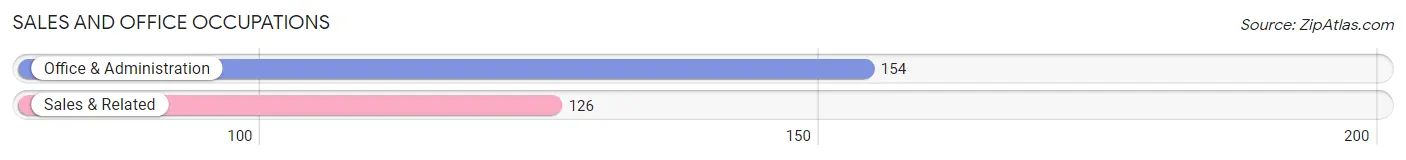
Sales and Office Occupations
The most common Sales and Office occupations in Lake Ozark are Office & Administration (154 | 11.9%), and Sales & Related (126 | 9.7%).
Sales and Office Occupations by Sex
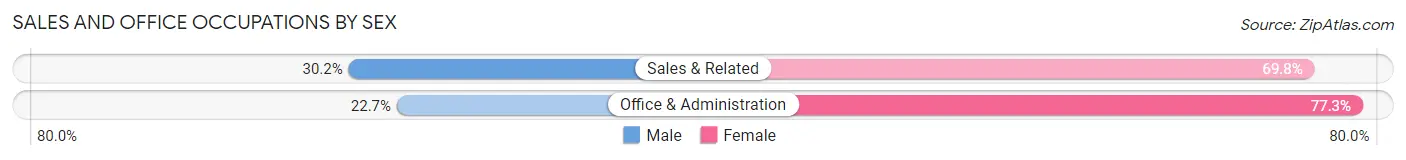
| Occupation | Male | Female |
| Sales & Related | 38 (30.2%) | 88 (69.8%) |
| Office & Administration | 35 (22.7%) | 119 (77.3%) |
| Total (Category) | 73 (26.1%) | 207 (73.9%) |
| Total (Overall) | 689 (53.3%) | 604 (46.7%) |
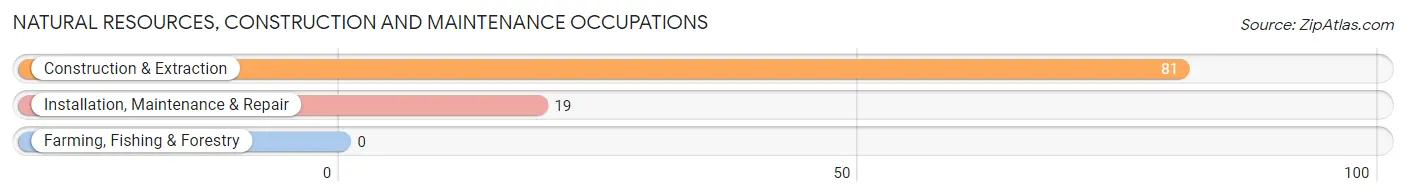
Natural Resources, Construction and Maintenance Occupations
The most common Natural Resources, Construction and Maintenance occupations in Lake Ozark are Construction & Extraction (81 | 6.3%), and Installation, Maintenance & Repair (19 | 1.5%).
Natural Resources, Construction and Maintenance Occupations by Sex
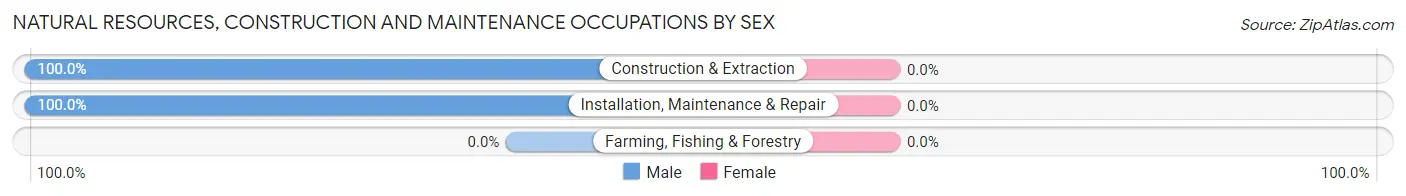
| Occupation | Male | Female |
| Farming, Fishing & Forestry | 0 (0.0%) | 0 (0.0%) |
| Construction & Extraction | 81 (100.0%) | 0 (0.0%) |
| Installation, Maintenance & Repair | 19 (100.0%) | 0 (0.0%) |
| Total (Category) | 100 (100.0%) | 0 (0.0%) |
| Total (Overall) | 689 (53.3%) | 604 (46.7%) |
Production, Transportation and Moving Occupations
The most common Production, Transportation and Moving occupations in Lake Ozark are Material Moving (46 | 3.6%), Production (30 | 2.3%), and Transportation (13 | 1.0%).
Production, Transportation and Moving Occupations by Sex
| Occupation | Male | Female |
| Production | 30 (100.0%) | 0 (0.0%) |
| Transportation | 13 (100.0%) | 0 (0.0%) |
| Material Moving | 46 (100.0%) | 0 (0.0%) |
| Total (Category) | 89 (100.0%) | 0 (0.0%) |
| Total (Overall) | 689 (53.3%) | 604 (46.7%) |
Employment Industries by Sex in Lake Ozark
Employment Industries in Lake Ozark
The major employment industries in Lake Ozark include Health Care & Social Assistance (311 | 24.0%), Retail Trade (250 | 19.3%), Construction (158 | 12.2%), Manufacturing (115 | 8.9%), and Accommodation & Food Services (110 | 8.5%).
Employment Industries by Sex in Lake Ozark
The Lake Ozark industries that see more men than women are Manufacturing (100.0%), Wholesale Trade (100.0%), and Transportation & Warehousing (100.0%), whereas the industries that tend to have a higher number of women are Administrative & Support (100.0%), Health Care & Social Assistance (99.0%), and Real Estate, Rental & Leasing (85.7%).
| Industry | Male | Female |
| Agriculture, Fishing & Hunting | 0 (0.0%) | 0 (0.0%) |
| Mining, Quarrying, & Extraction | 0 (0.0%) | 0 (0.0%) |
| Construction | 154 (97.5%) | 4 (2.5%) |
| Manufacturing | 115 (100.0%) | 0 (0.0%) |
| Wholesale Trade | 15 (100.0%) | 0 (0.0%) |
| Retail Trade | 151 (60.4%) | 99 (39.6%) |
| Transportation & Warehousing | 11 (100.0%) | 0 (0.0%) |
| Utilities | 2 (100.0%) | 0 (0.0%) |
| Information | 0 (0.0%) | 0 (0.0%) |
| Finance & Insurance | 8 (29.6%) | 19 (70.4%) |
| Real Estate, Rental & Leasing | 5 (14.3%) | 30 (85.7%) |
| Professional & Scientific | 59 (75.6%) | 19 (24.4%) |
| Enterprise Management | 0 (0.0%) | 0 (0.0%) |
| Administrative & Support | 0 (0.0%) | 36 (100.0%) |
| Educational Services | 17 (37.0%) | 29 (63.0%) |
| Health Care & Social Assistance | 3 (1.0%) | 308 (99.0%) |
| Arts, Entertainment & Recreation | 4 (50.0%) | 4 (50.0%) |
| Accommodation & Food Services | 75 (68.2%) | 35 (31.8%) |
| Public Administration | 65 (91.5%) | 6 (8.5%) |
| Total | 689 (53.3%) | 604 (46.7%) |
Education in Lake Ozark
School Enrollment in Lake Ozark
The most common levels of schooling among the 492 students in Lake Ozark are high school (122 | 24.8%), middle school (121 | 24.6%), and nursery / preschool (114 | 23.2%).
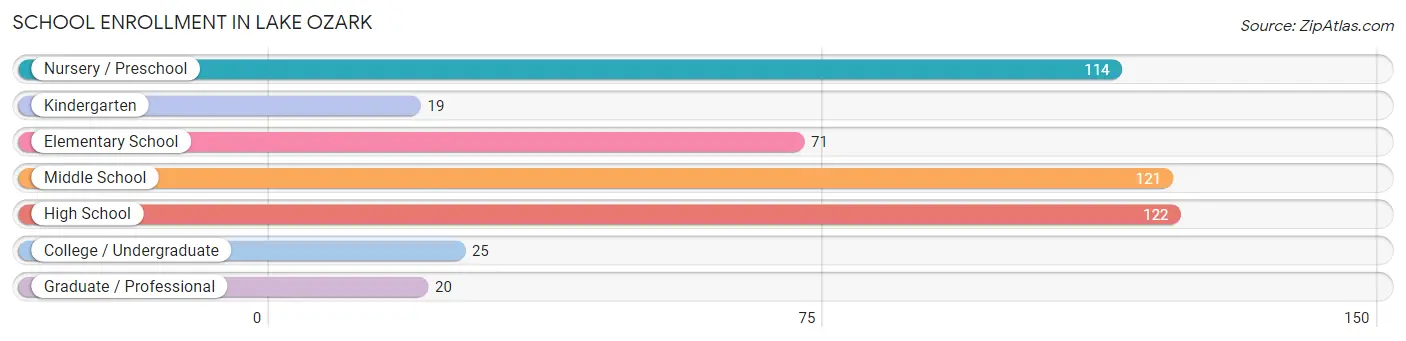
| School Level | # Students | % Students |
| Nursery / Preschool | 114 | 23.2% |
| Kindergarten | 19 | 3.9% |
| Elementary School | 71 | 14.4% |
| Middle School | 121 | 24.6% |
| High School | 122 | 24.8% |
| College / Undergraduate | 25 | 5.1% |
| Graduate / Professional | 20 | 4.1% |
| Total | 492 | 100.0% |
School Enrollment by Age by Funding Source in Lake Ozark
Out of a total of 492 students who are enrolled in schools in Lake Ozark, 85 (17.3%) attend a private institution, while the remaining 407 (82.7%) are enrolled in public schools. The age group of 20 to 24 year olds has the highest likelihood of being enrolled in private schools, with 21 (100.0% in the age bracket) enrolled. Conversely, the age group of 5 to 9 year old has the lowest likelihood of being enrolled in a private school, with 90 (100.0% in the age bracket) attending a public institution.
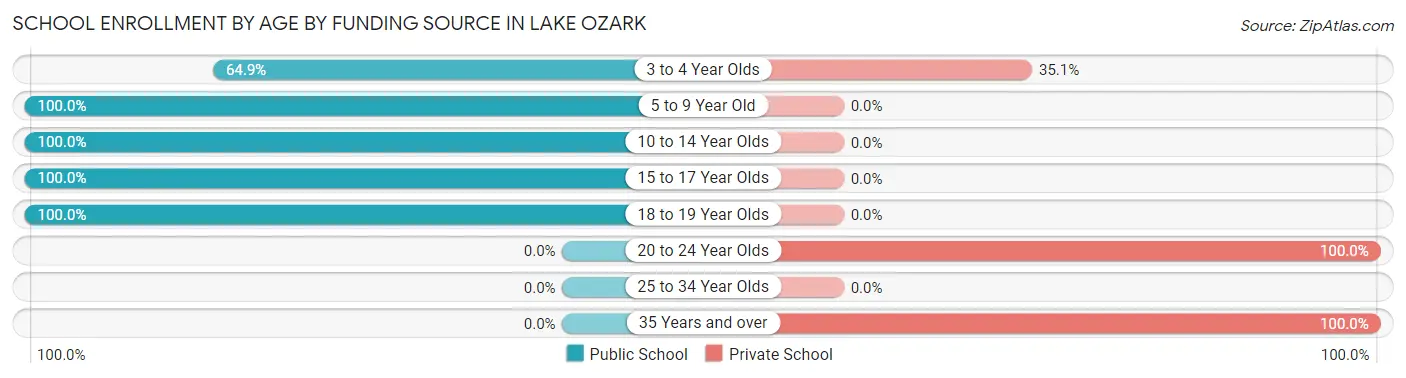
| Age Bracket | Public School | Private School |
| 3 to 4 Year Olds | 74 (64.9%) | 40 (35.1%) |
| 5 to 9 Year Old | 90 (100.0%) | 0 (0.0%) |
| 10 to 14 Year Olds | 121 (100.0%) | 0 (0.0%) |
| 15 to 17 Year Olds | 76 (100.0%) | 0 (0.0%) |
| 18 to 19 Year Olds | 46 (100.0%) | 0 (0.0%) |
| 20 to 24 Year Olds | 0 (0.0%) | 21 (100.0%) |
| 25 to 34 Year Olds | 0 (0.0%) | 0 (0.0%) |
| 35 Years and over | 0 (0.0%) | 24 (100.0%) |
| Total | 407 (82.7%) | 85 (17.3%) |
Educational Attainment by Field of Study in Lake Ozark
Business (188 | 21.9%), arts & humanities (125 | 14.6%), education (123 | 14.3%), psychology (72 | 8.4%), and computers & mathematics (69 | 8.0%) are the most common fields of study among 858 individuals in Lake Ozark who have obtained a bachelor's degree or higher.
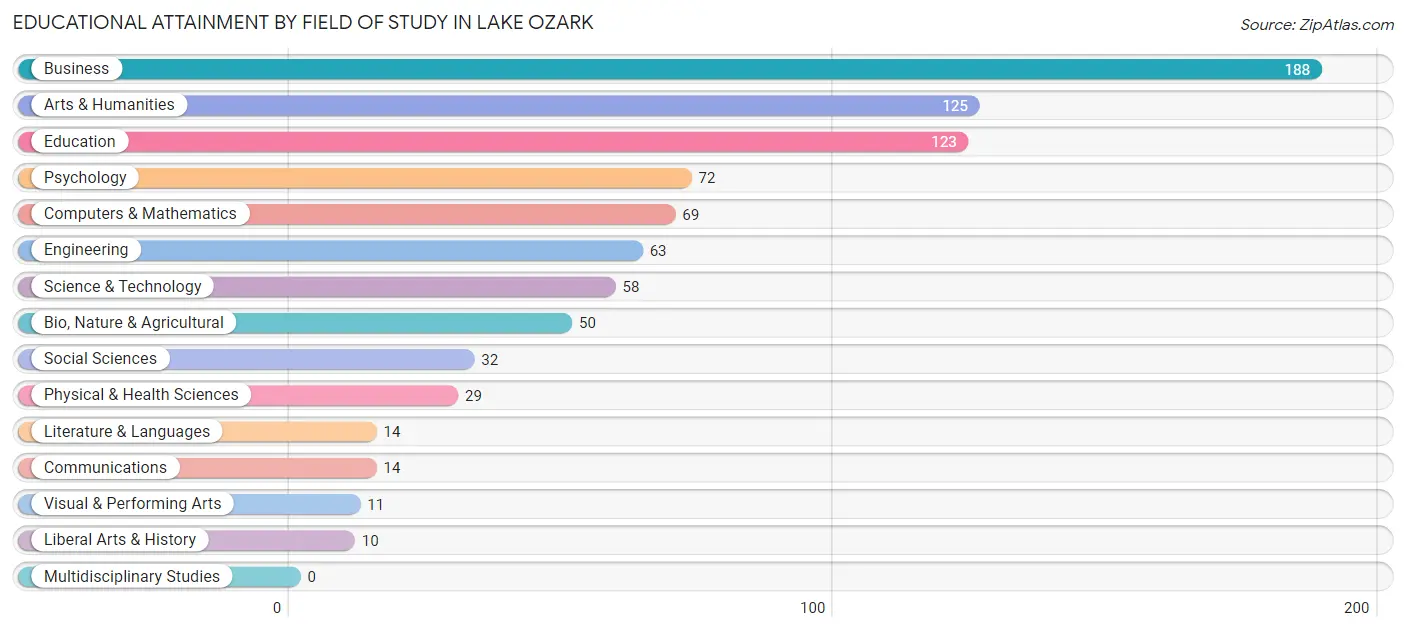
| Field of Study | # Graduates | % Graduates |
| Computers & Mathematics | 69 | 8.0% |
| Bio, Nature & Agricultural | 50 | 5.8% |
| Physical & Health Sciences | 29 | 3.4% |
| Psychology | 72 | 8.4% |
| Social Sciences | 32 | 3.7% |
| Engineering | 63 | 7.3% |
| Multidisciplinary Studies | 0 | 0.0% |
| Science & Technology | 58 | 6.8% |
| Business | 188 | 21.9% |
| Education | 123 | 14.3% |
| Literature & Languages | 14 | 1.6% |
| Liberal Arts & History | 10 | 1.2% |
| Visual & Performing Arts | 11 | 1.3% |
| Communications | 14 | 1.6% |
| Arts & Humanities | 125 | 14.6% |
| Total | 858 | 100.0% |
Transportation & Commute in Lake Ozark
Vehicle Availability by Sex in Lake Ozark
The most prevalent vehicle ownership categories in Lake Ozark are males with 2 vehicles (351, accounting for 51.5%) and females with 2 vehicles (274, making up 59.7%).
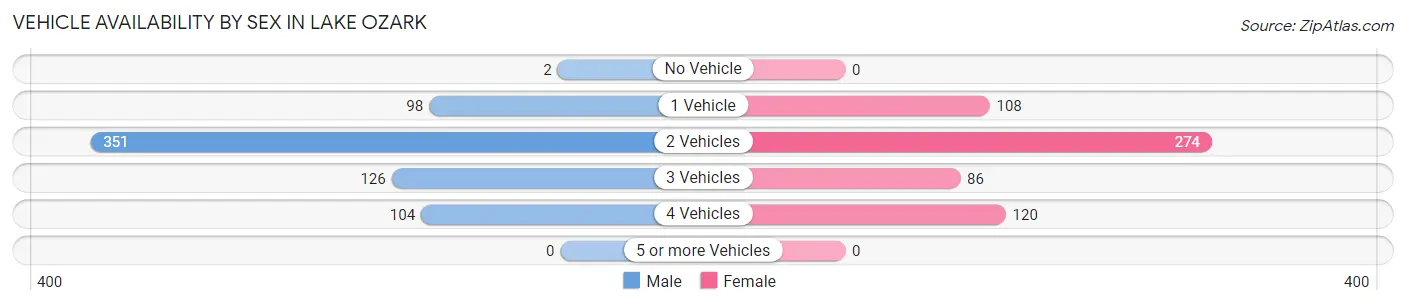
| Vehicles Available | Male | Female |
| No Vehicle | 2 (0.3%) | 0 (0.0%) |
| 1 Vehicle | 98 (14.4%) | 108 (18.4%) |
| 2 Vehicles | 351 (51.5%) | 274 (46.6%) |
| 3 Vehicles | 126 (18.5%) | 86 (14.6%) |
| 4 Vehicles | 104 (15.3%) | 120 (20.4%) |
| 5 or more Vehicles | 0 (0.0%) | 0 (0.0%) |
| Total | 681 (100.0%) | 588 (100.0%) |
Commute Time in Lake Ozark
The most frequently occuring commute durations in Lake Ozark are 5 to 9 minutes (314 commuters, 26.3%), 10 to 14 minutes (233 commuters, 19.5%), and 15 to 19 minutes (157 commuters, 13.1%).
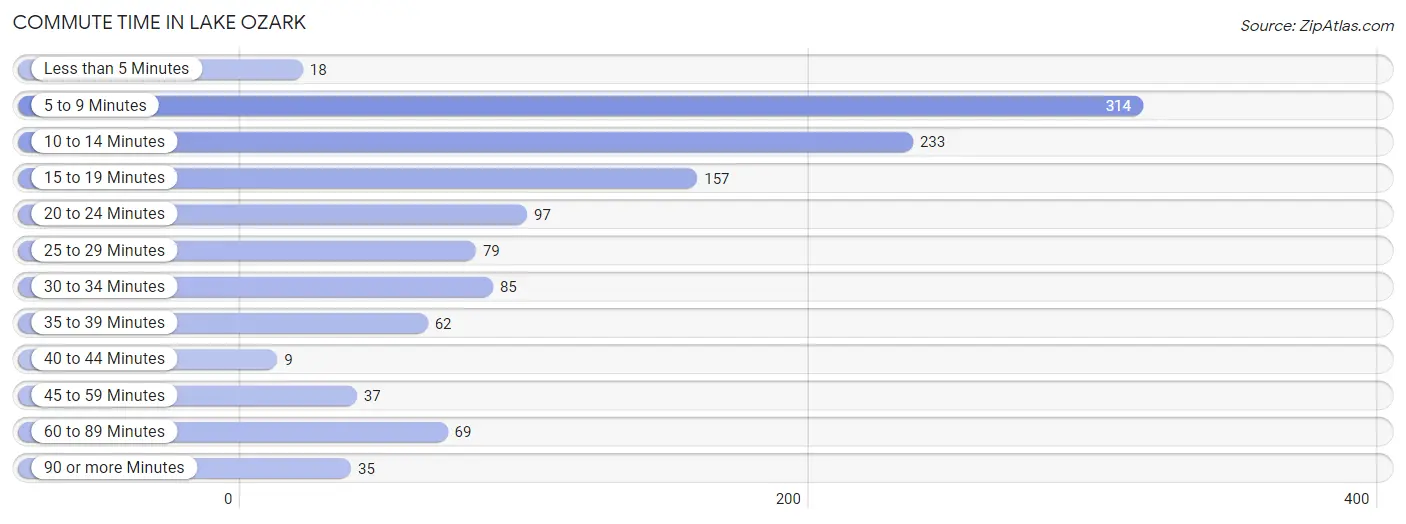
| Commute Time | # Commuters | % Commuters |
| Less than 5 Minutes | 18 | 1.5% |
| 5 to 9 Minutes | 314 | 26.3% |
| 10 to 14 Minutes | 233 | 19.5% |
| 15 to 19 Minutes | 157 | 13.1% |
| 20 to 24 Minutes | 97 | 8.1% |
| 25 to 29 Minutes | 79 | 6.6% |
| 30 to 34 Minutes | 85 | 7.1% |
| 35 to 39 Minutes | 62 | 5.2% |
| 40 to 44 Minutes | 9 | 0.7% |
| 45 to 59 Minutes | 37 | 3.1% |
| 60 to 89 Minutes | 69 | 5.8% |
| 90 or more Minutes | 35 | 2.9% |
Commute Time by Sex in Lake Ozark
The most common commute times in Lake Ozark are 5 to 9 minutes (132 commuters, 20.8%) for males and 5 to 9 minutes (182 commuters, 32.4%) for females.
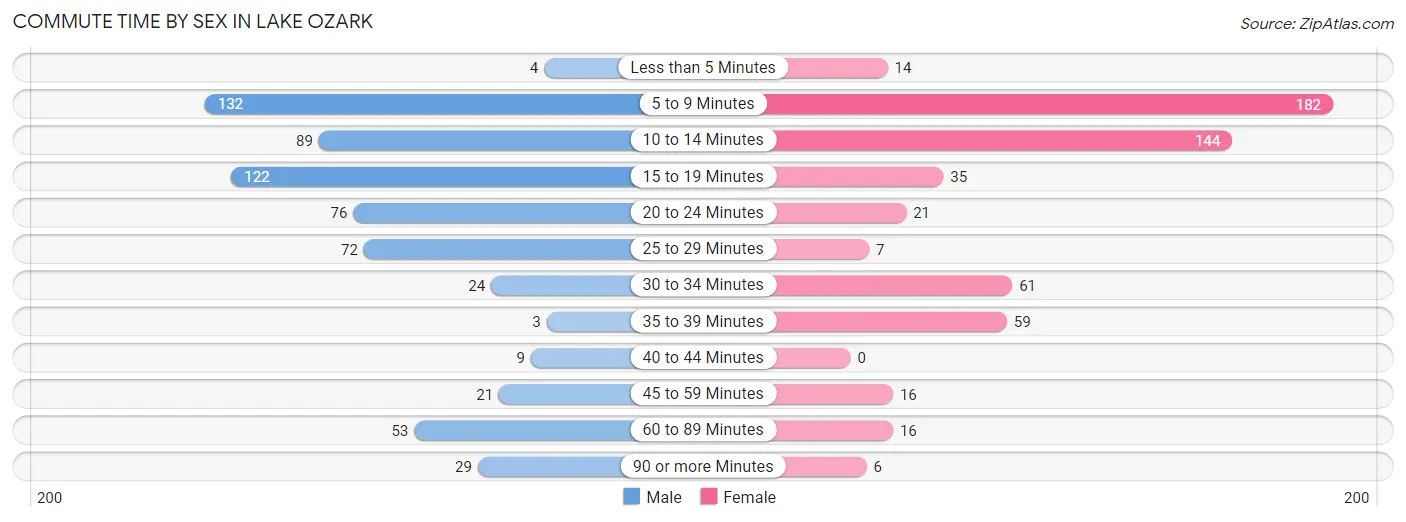
| Commute Time | Male | Female |
| Less than 5 Minutes | 4 (0.6%) | 14 (2.5%) |
| 5 to 9 Minutes | 132 (20.8%) | 182 (32.4%) |
| 10 to 14 Minutes | 89 (14.0%) | 144 (25.7%) |
| 15 to 19 Minutes | 122 (19.2%) | 35 (6.2%) |
| 20 to 24 Minutes | 76 (12.0%) | 21 (3.7%) |
| 25 to 29 Minutes | 72 (11.4%) | 7 (1.3%) |
| 30 to 34 Minutes | 24 (3.8%) | 61 (10.9%) |
| 35 to 39 Minutes | 3 (0.5%) | 59 (10.5%) |
| 40 to 44 Minutes | 9 (1.4%) | 0 (0.0%) |
| 45 to 59 Minutes | 21 (3.3%) | 16 (2.9%) |
| 60 to 89 Minutes | 53 (8.4%) | 16 (2.9%) |
| 90 or more Minutes | 29 (4.6%) | 6 (1.1%) |
Time of Departure to Work by Sex in Lake Ozark
The most frequent times of departure to work in Lake Ozark are 7:00 AM to 7:29 AM (119, 18.8%) for males and 7:00 AM to 7:29 AM (112, 20.0%) for females.
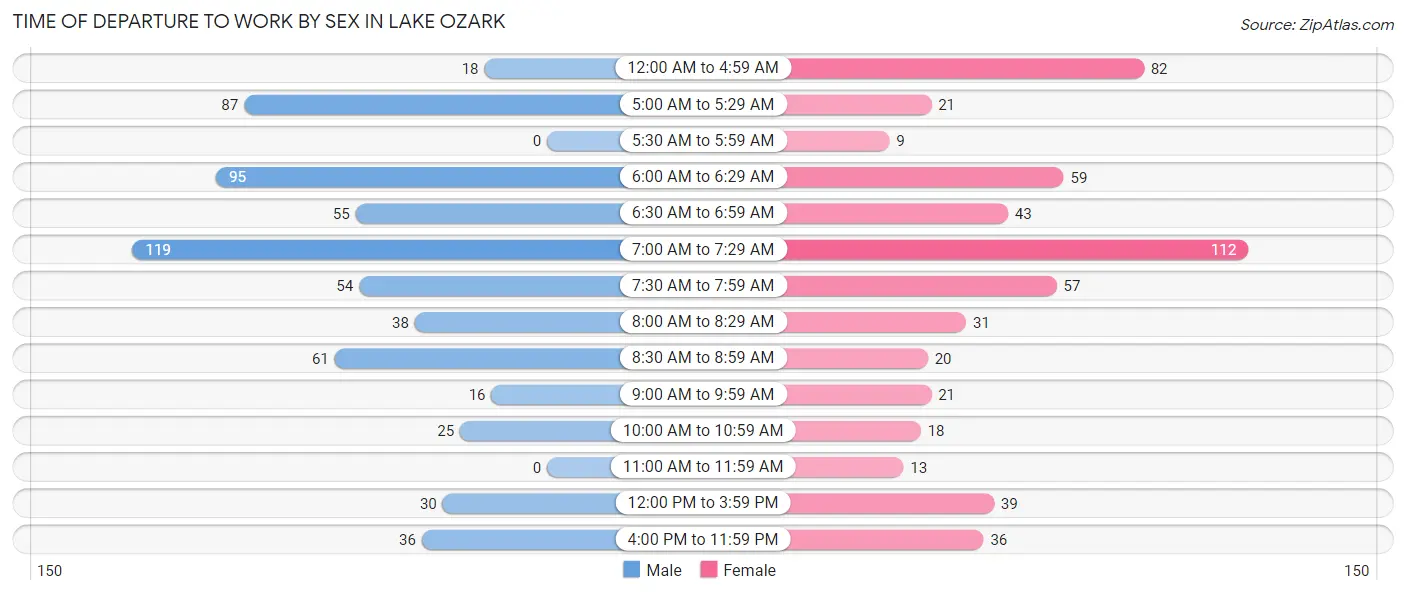
| Time of Departure | Male | Female |
| 12:00 AM to 4:59 AM | 18 (2.8%) | 82 (14.6%) |
| 5:00 AM to 5:29 AM | 87 (13.7%) | 21 (3.7%) |
| 5:30 AM to 5:59 AM | 0 (0.0%) | 9 (1.6%) |
| 6:00 AM to 6:29 AM | 95 (15.0%) | 59 (10.5%) |
| 6:30 AM to 6:59 AM | 55 (8.7%) | 43 (7.7%) |
| 7:00 AM to 7:29 AM | 119 (18.8%) | 112 (20.0%) |
| 7:30 AM to 7:59 AM | 54 (8.5%) | 57 (10.2%) |
| 8:00 AM to 8:29 AM | 38 (6.0%) | 31 (5.5%) |
| 8:30 AM to 8:59 AM | 61 (9.6%) | 20 (3.6%) |
| 9:00 AM to 9:59 AM | 16 (2.5%) | 21 (3.7%) |
| 10:00 AM to 10:59 AM | 25 (3.9%) | 18 (3.2%) |
| 11:00 AM to 11:59 AM | 0 (0.0%) | 13 (2.3%) |
| 12:00 PM to 3:59 PM | 30 (4.7%) | 39 (7.0%) |
| 4:00 PM to 11:59 PM | 36 (5.7%) | 36 (6.4%) |
| Total | 634 (100.0%) | 561 (100.0%) |
Housing Occupancy in Lake Ozark
Occupancy by Ownership in Lake Ozark
Of the total 1,139 dwellings in Lake Ozark, owner-occupied units account for 754 (66.2%), while renter-occupied units make up 385 (33.8%).
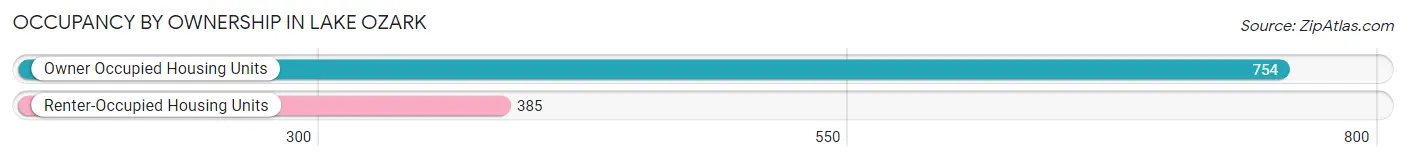
| Occupancy | # Housing Units | % Housing Units |
| Owner Occupied Housing Units | 754 | 66.2% |
| Renter-Occupied Housing Units | 385 | 33.8% |
| Total Occupied Housing Units | 1,139 | 100.0% |
Occupancy by Household Size in Lake Ozark
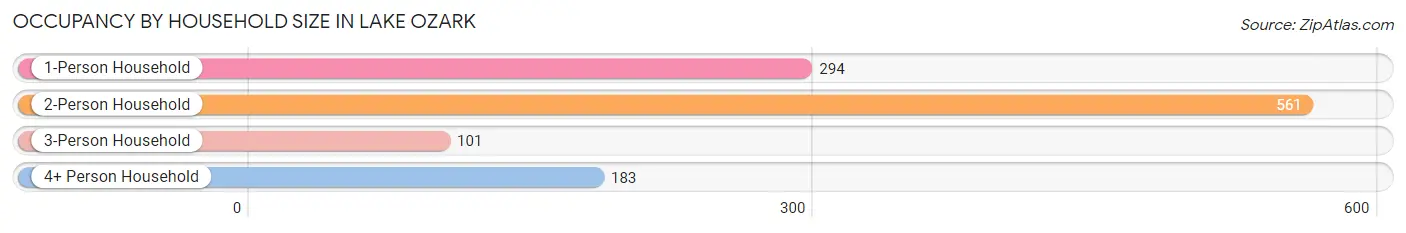
| Household Size | # Housing Units | % Housing Units |
| 1-Person Household | 294 | 25.8% |
| 2-Person Household | 561 | 49.2% |
| 3-Person Household | 101 | 8.9% |
| 4+ Person Household | 183 | 16.1% |
| Total Housing Units | 1,139 | 100.0% |
Occupancy by Ownership by Household Size in Lake Ozark
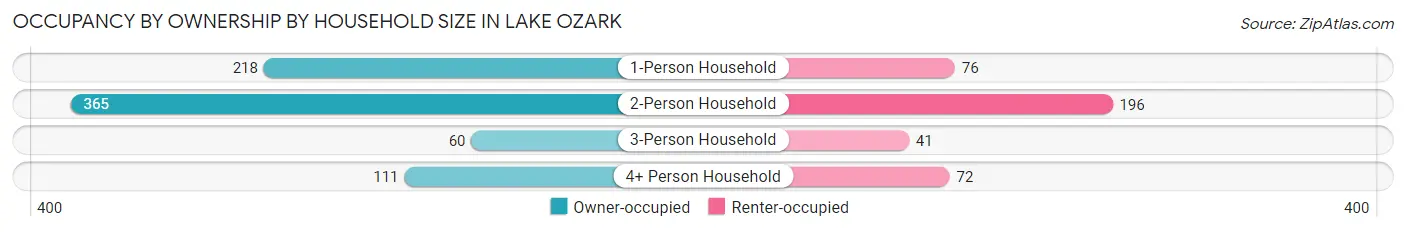
| Household Size | Owner-occupied | Renter-occupied |
| 1-Person Household | 218 (74.2%) | 76 (25.9%) |
| 2-Person Household | 365 (65.1%) | 196 (34.9%) |
| 3-Person Household | 60 (59.4%) | 41 (40.6%) |
| 4+ Person Household | 111 (60.7%) | 72 (39.3%) |
| Total Housing Units | 754 (66.2%) | 385 (33.8%) |
Occupancy by Educational Attainment in Lake Ozark
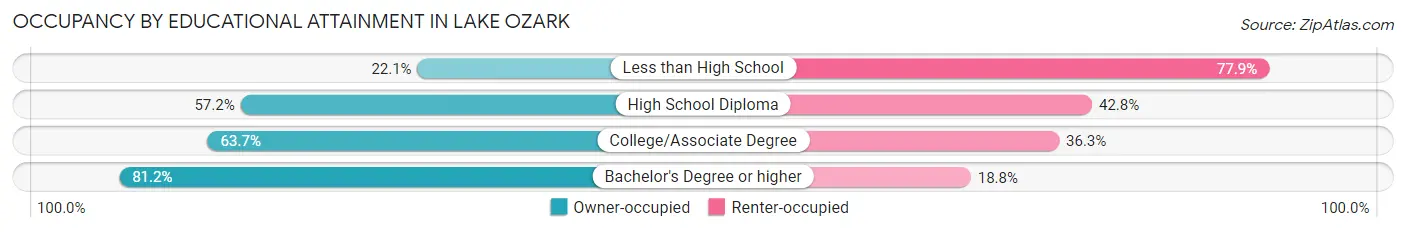
| Household Size | Owner-occupied | Renter-occupied |
| Less than High School | 21 (22.1%) | 74 (77.9%) |
| High School Diploma | 151 (57.2%) | 113 (42.8%) |
| College/Associate Degree | 188 (63.7%) | 107 (36.3%) |
| Bachelor's Degree or higher | 394 (81.2%) | 91 (18.8%) |
Occupancy by Age of Householder in Lake Ozark
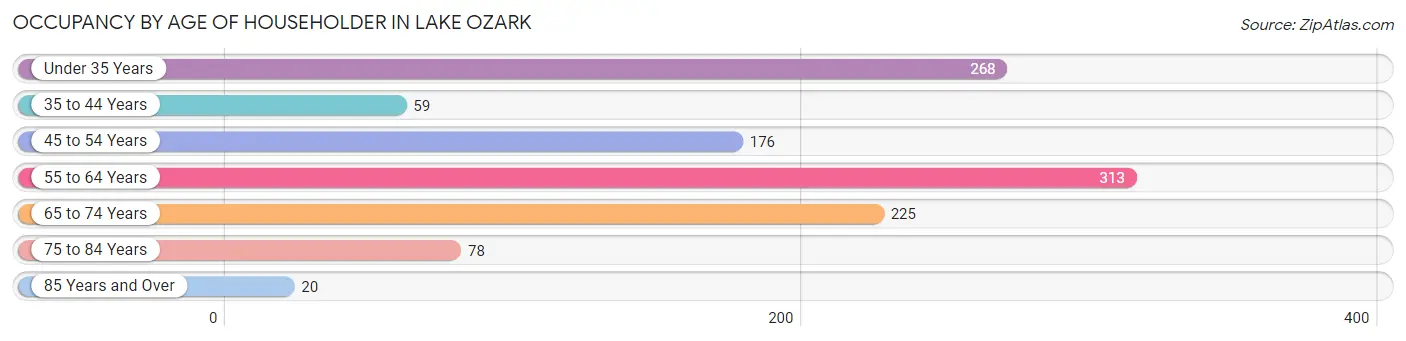
| Age Bracket | # Households | % Households |
| Under 35 Years | 268 | 23.5% |
| 35 to 44 Years | 59 | 5.2% |
| 45 to 54 Years | 176 | 15.4% |
| 55 to 64 Years | 313 | 27.5% |
| 65 to 74 Years | 225 | 19.8% |
| 75 to 84 Years | 78 | 6.9% |
| 85 Years and Over | 20 | 1.8% |
| Total | 1,139 | 100.0% |
Housing Finances in Lake Ozark
Median Income by Occupancy in Lake Ozark
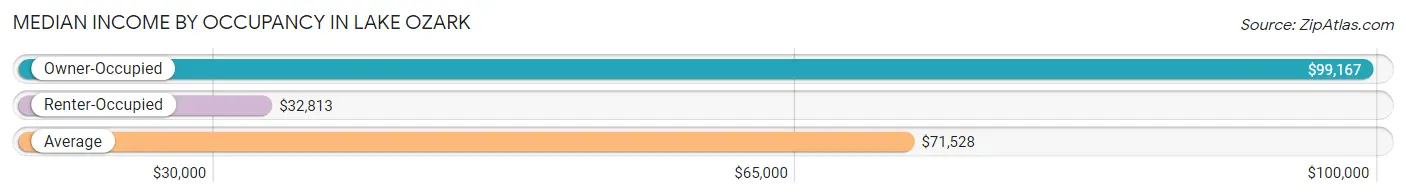
| Occupancy Type | # Households | Median Income |
| Owner-Occupied | 754 (66.2%) | $99,167 |
| Renter-Occupied | 385 (33.8%) | $32,813 |
| Average | 1,139 (100.0%) | $71,528 |
Occupancy by Householder Income Bracket in Lake Ozark
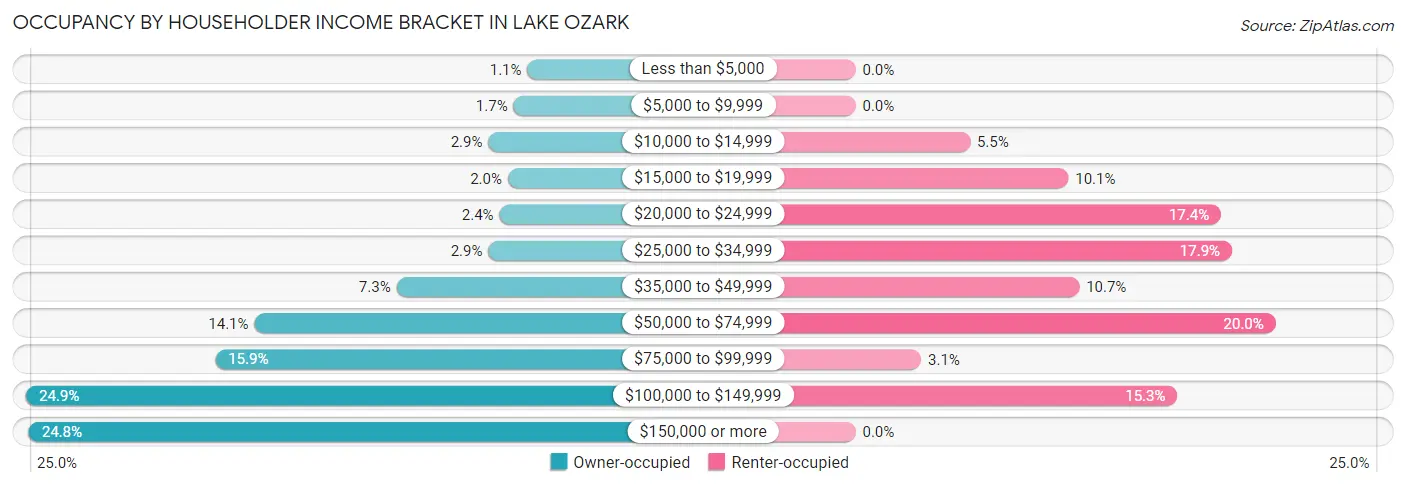
| Income Bracket | Owner-occupied | Renter-occupied |
| Less than $5,000 | 8 (1.1%) | 0 (0.0%) |
| $5,000 to $9,999 | 13 (1.7%) | 0 (0.0%) |
| $10,000 to $14,999 | 22 (2.9%) | 21 (5.4%) |
| $15,000 to $19,999 | 15 (2.0%) | 39 (10.1%) |
| $20,000 to $24,999 | 18 (2.4%) | 67 (17.4%) |
| $25,000 to $34,999 | 22 (2.9%) | 69 (17.9%) |
| $35,000 to $49,999 | 55 (7.3%) | 41 (10.6%) |
| $50,000 to $74,999 | 106 (14.1%) | 77 (20.0%) |
| $75,000 to $99,999 | 120 (15.9%) | 12 (3.1%) |
| $100,000 to $149,999 | 188 (24.9%) | 59 (15.3%) |
| $150,000 or more | 187 (24.8%) | 0 (0.0%) |
| Total | 754 (100.0%) | 385 (100.0%) |
Monthly Housing Cost Tiers in Lake Ozark
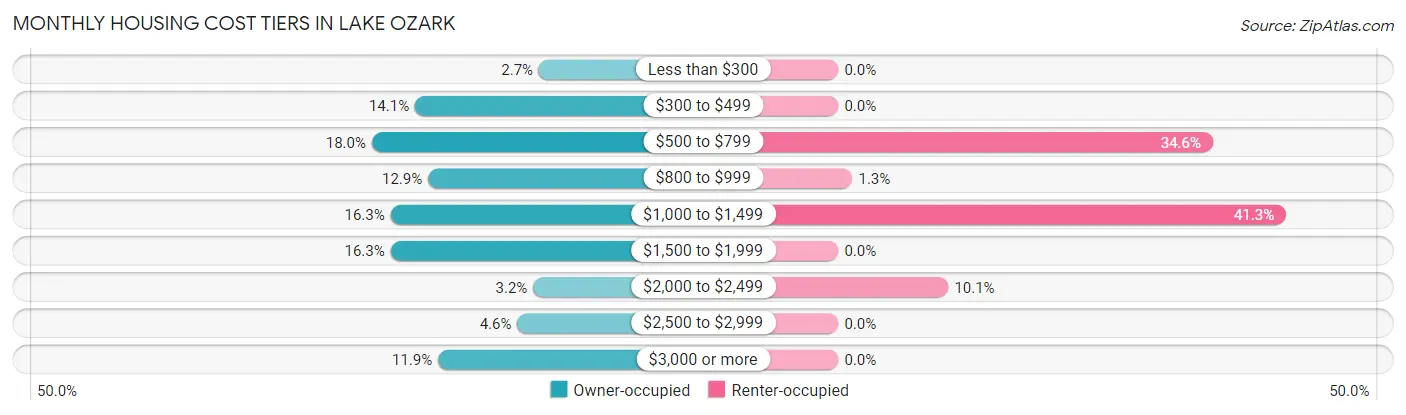
| Monthly Cost | Owner-occupied | Renter-occupied |
| Less than $300 | 20 (2.6%) | 0 (0.0%) |
| $300 to $499 | 106 (14.1%) | 0 (0.0%) |
| $500 to $799 | 136 (18.0%) | 133 (34.5%) |
| $800 to $999 | 97 (12.9%) | 5 (1.3%) |
| $1,000 to $1,499 | 123 (16.3%) | 159 (41.3%) |
| $1,500 to $1,999 | 123 (16.3%) | 0 (0.0%) |
| $2,000 to $2,499 | 24 (3.2%) | 39 (10.1%) |
| $2,500 to $2,999 | 35 (4.6%) | 0 (0.0%) |
| $3,000 or more | 90 (11.9%) | 0 (0.0%) |
| Total | 754 (100.0%) | 385 (100.0%) |
Physical Housing Characteristics in Lake Ozark
Housing Structures in Lake Ozark
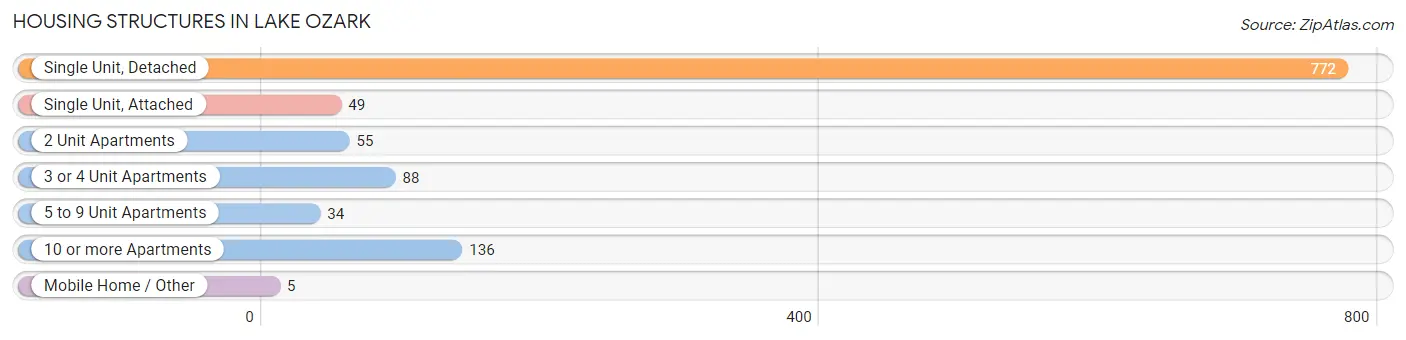
| Structure Type | # Housing Units | % Housing Units |
| Single Unit, Detached | 772 | 67.8% |
| Single Unit, Attached | 49 | 4.3% |
| 2 Unit Apartments | 55 | 4.8% |
| 3 or 4 Unit Apartments | 88 | 7.7% |
| 5 to 9 Unit Apartments | 34 | 3.0% |
| 10 or more Apartments | 136 | 11.9% |
| Mobile Home / Other | 5 | 0.4% |
| Total | 1,139 | 100.0% |
Housing Structures by Occupancy in Lake Ozark
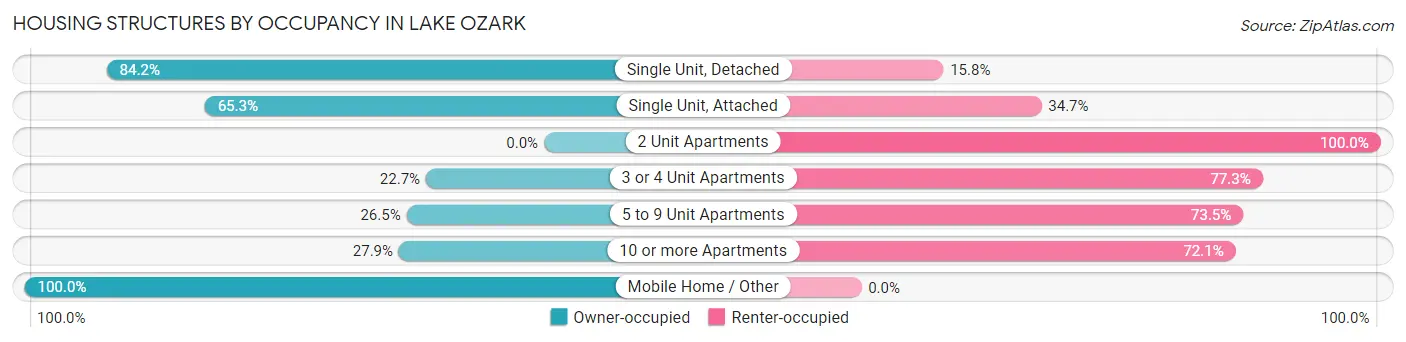
| Structure Type | Owner-occupied | Renter-occupied |
| Single Unit, Detached | 650 (84.2%) | 122 (15.8%) |
| Single Unit, Attached | 32 (65.3%) | 17 (34.7%) |
| 2 Unit Apartments | 0 (0.0%) | 55 (100.0%) |
| 3 or 4 Unit Apartments | 20 (22.7%) | 68 (77.3%) |
| 5 to 9 Unit Apartments | 9 (26.5%) | 25 (73.5%) |
| 10 or more Apartments | 38 (27.9%) | 98 (72.1%) |
| Mobile Home / Other | 5 (100.0%) | 0 (0.0%) |
| Total | 754 (66.2%) | 385 (33.8%) |
Housing Structures by Number of Rooms in Lake Ozark
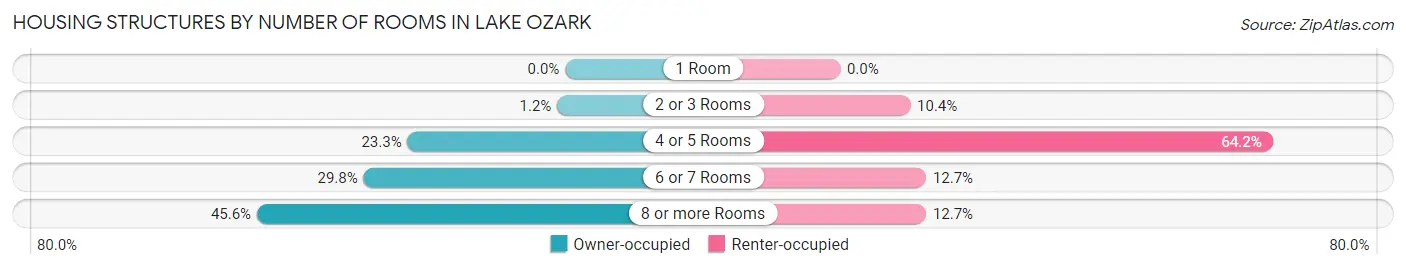
| Number of Rooms | Owner-occupied | Renter-occupied |
| 1 Room | 0 (0.0%) | 0 (0.0%) |
| 2 or 3 Rooms | 9 (1.2%) | 40 (10.4%) |
| 4 or 5 Rooms | 176 (23.3%) | 247 (64.2%) |
| 6 or 7 Rooms | 225 (29.8%) | 49 (12.7%) |
| 8 or more Rooms | 344 (45.6%) | 49 (12.7%) |
| Total | 754 (100.0%) | 385 (100.0%) |
Housing Structure by Heating Type in Lake Ozark
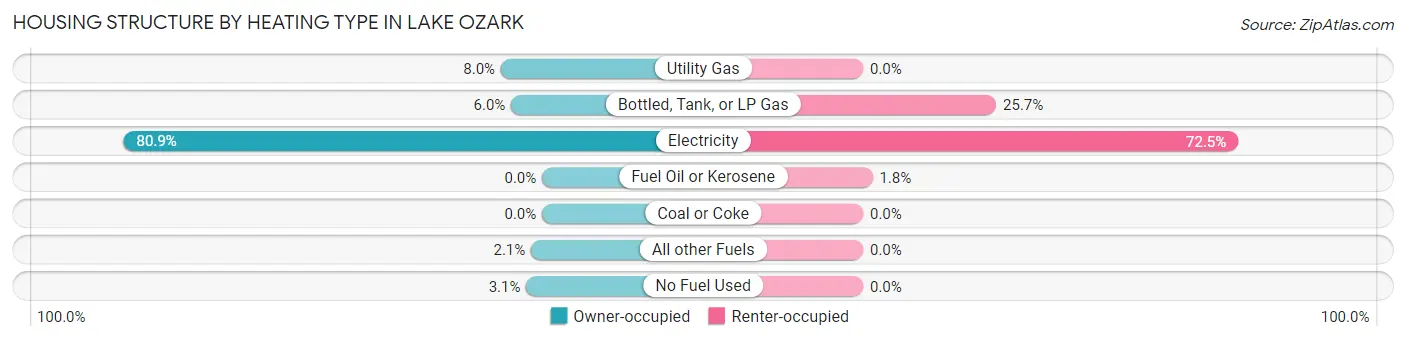
| Heating Type | Owner-occupied | Renter-occupied |
| Utility Gas | 60 (8.0%) | 0 (0.0%) |
| Bottled, Tank, or LP Gas | 45 (6.0%) | 99 (25.7%) |
| Electricity | 610 (80.9%) | 279 (72.5%) |
| Fuel Oil or Kerosene | 0 (0.0%) | 7 (1.8%) |
| Coal or Coke | 0 (0.0%) | 0 (0.0%) |
| All other Fuels | 16 (2.1%) | 0 (0.0%) |
| No Fuel Used | 23 (3.0%) | 0 (0.0%) |
| Total | 754 (100.0%) | 385 (100.0%) |
Household Vehicle Usage in Lake Ozark
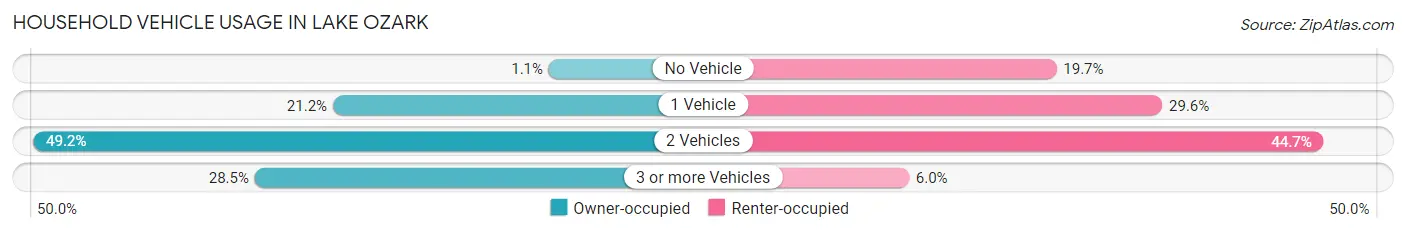
| Vehicles per Household | Owner-occupied | Renter-occupied |
| No Vehicle | 8 (1.1%) | 76 (19.7%) |
| 1 Vehicle | 160 (21.2%) | 114 (29.6%) |
| 2 Vehicles | 371 (49.2%) | 172 (44.7%) |
| 3 or more Vehicles | 215 (28.5%) | 23 (6.0%) |
| Total | 754 (100.0%) | 385 (100.0%) |
Real Estate & Mortgages in Lake Ozark
Real Estate and Mortgage Overview in Lake Ozark
| Characteristic | Without Mortgage | With Mortgage |
| Housing Units | 256 | 498 |
| Median Property Value | $305,900 | $309,500 |
| Median Household Income | $87,969 | $146 |
| Monthly Housing Costs | $504 | $90 |
| Real Estate Taxes | $2,058 | $65 |
Property Value by Mortgage Status in Lake Ozark
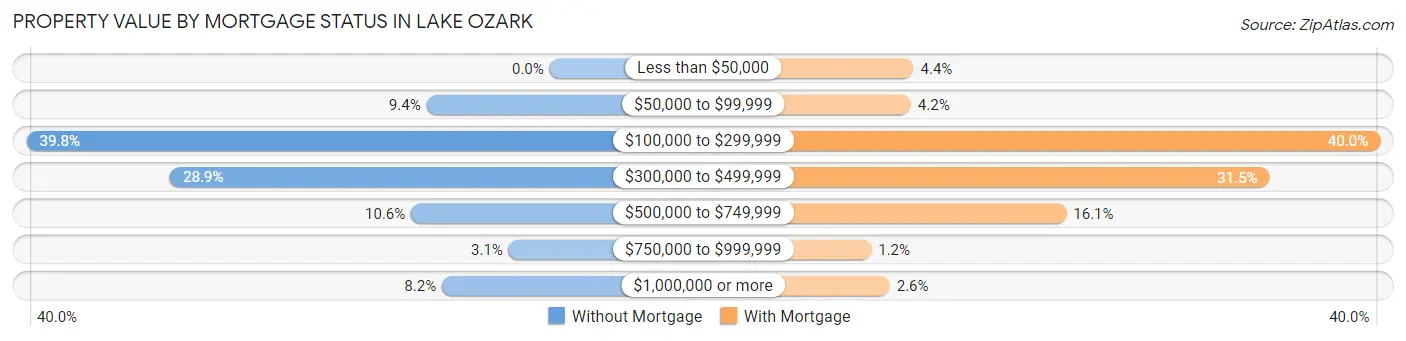
| Property Value | Without Mortgage | With Mortgage |
| Less than $50,000 | 0 (0.0%) | 22 (4.4%) |
| $50,000 to $99,999 | 24 (9.4%) | 21 (4.2%) |
| $100,000 to $299,999 | 102 (39.8%) | 199 (40.0%) |
| $300,000 to $499,999 | 74 (28.9%) | 157 (31.5%) |
| $500,000 to $749,999 | 27 (10.5%) | 80 (16.1%) |
| $750,000 to $999,999 | 8 (3.1%) | 6 (1.2%) |
| $1,000,000 or more | 21 (8.2%) | 13 (2.6%) |
| Total | 256 (100.0%) | 498 (100.0%) |
Household Income by Mortgage Status in Lake Ozark
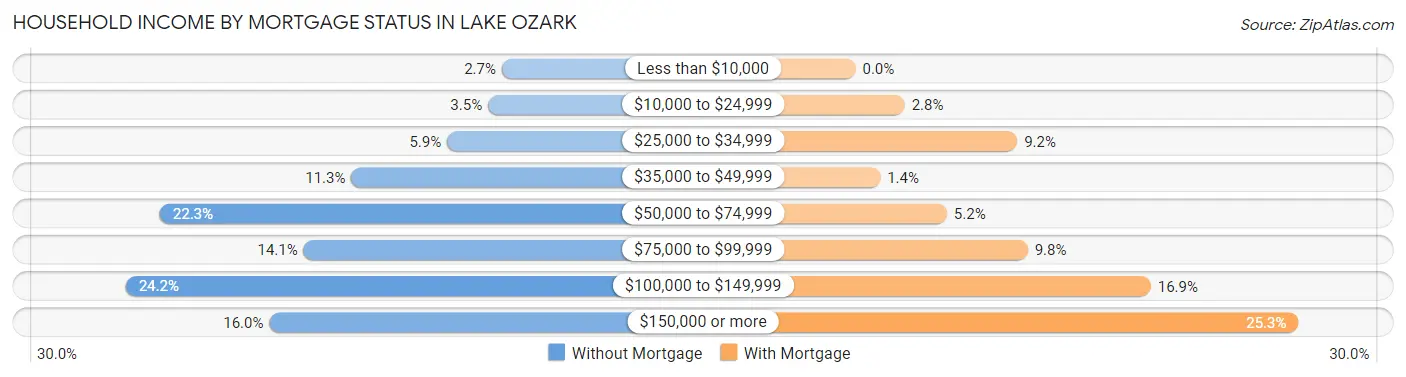
| Household Income | Without Mortgage | With Mortgage |
| Less than $10,000 | 7 (2.7%) | 0 (0.0%) |
| $10,000 to $24,999 | 9 (3.5%) | 14 (2.8%) |
| $25,000 to $34,999 | 15 (5.9%) | 46 (9.2%) |
| $35,000 to $49,999 | 29 (11.3%) | 7 (1.4%) |
| $50,000 to $74,999 | 57 (22.3%) | 26 (5.2%) |
| $75,000 to $99,999 | 36 (14.1%) | 49 (9.8%) |
| $100,000 to $149,999 | 62 (24.2%) | 84 (16.9%) |
| $150,000 or more | 41 (16.0%) | 126 (25.3%) |
| Total | 256 (100.0%) | 498 (100.0%) |
Property Value to Household Income Ratio in Lake Ozark
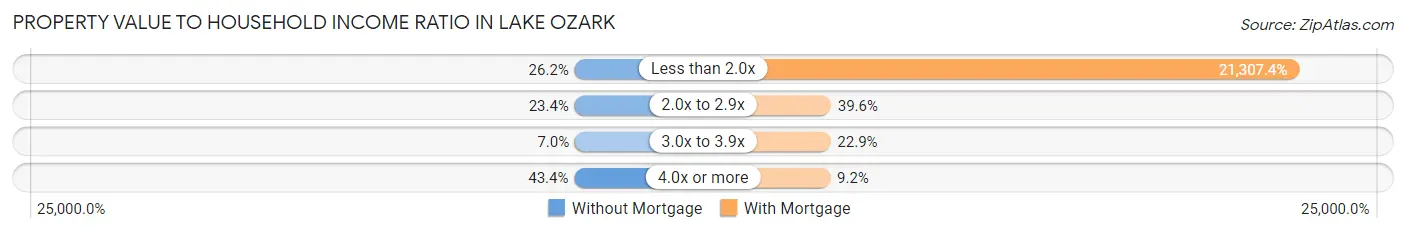
| Value-to-Income Ratio | Without Mortgage | With Mortgage |
| Less than 2.0x | 67 (26.2%) | 106,111 (21,307.4%) |
| 2.0x to 2.9x | 60 (23.4%) | 197 (39.6%) |
| 3.0x to 3.9x | 18 (7.0%) | 114 (22.9%) |
| 4.0x or more | 111 (43.4%) | 46 (9.2%) |
| Total | 256 (100.0%) | 498 (100.0%) |
Real Estate Taxes by Mortgage Status in Lake Ozark
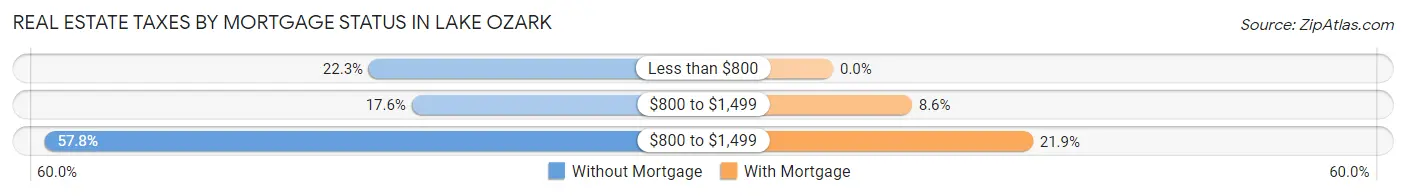
| Property Taxes | Without Mortgage | With Mortgage |
| Less than $800 | 57 (22.3%) | 0 (0.0%) |
| $800 to $1,499 | 45 (17.6%) | 43 (8.6%) |
| $800 to $1,499 | 148 (57.8%) | 109 (21.9%) |
| Total | 256 (100.0%) | 498 (100.0%) |
Health & Disability in Lake Ozark
Health Insurance Coverage by Age in Lake Ozark
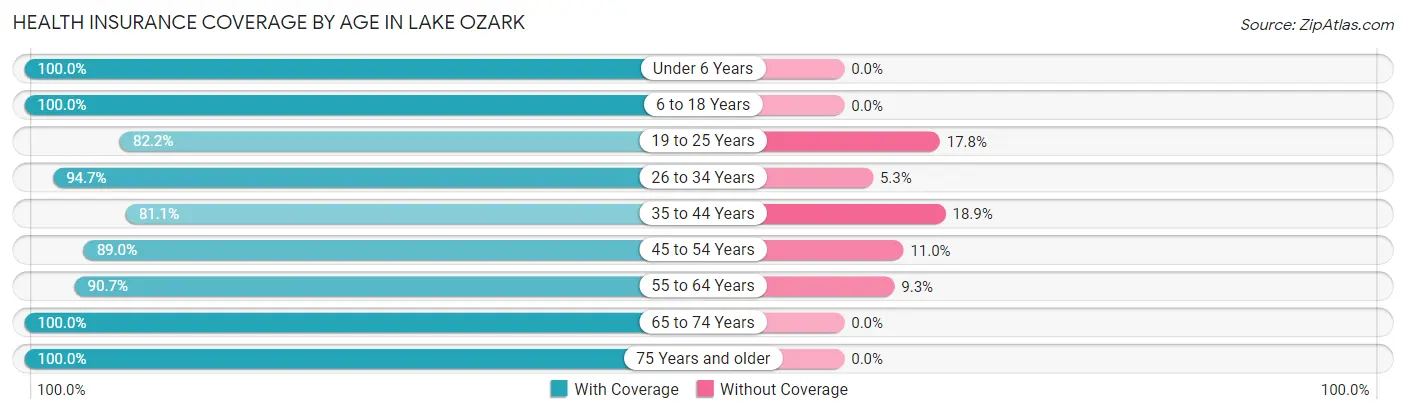
| Age Bracket | With Coverage | Without Coverage |
| Under 6 Years | 205 (100.0%) | 0 (0.0%) |
| 6 to 18 Years | 322 (100.0%) | 0 (0.0%) |
| 19 to 25 Years | 120 (82.2%) | 26 (17.8%) |
| 26 to 34 Years | 408 (94.7%) | 23 (5.3%) |
| 35 to 44 Years | 159 (81.1%) | 37 (18.9%) |
| 45 to 54 Years | 242 (89.0%) | 30 (11.0%) |
| 55 to 64 Years | 466 (90.7%) | 48 (9.3%) |
| 65 to 74 Years | 352 (100.0%) | 0 (0.0%) |
| 75 Years and older | 190 (100.0%) | 0 (0.0%) |
| Total | 2,464 (93.8%) | 164 (6.2%) |
Health Insurance Coverage by Citizenship Status in Lake Ozark
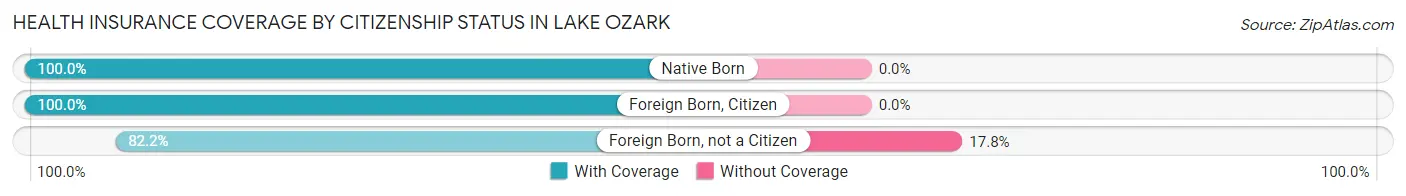
| Citizenship Status | With Coverage | Without Coverage |
| Native Born | 205 (100.0%) | 0 (0.0%) |
| Foreign Born, Citizen | 322 (100.0%) | 0 (0.0%) |
| Foreign Born, not a Citizen | 120 (82.2%) | 26 (17.8%) |
Health Insurance Coverage by Household Income in Lake Ozark
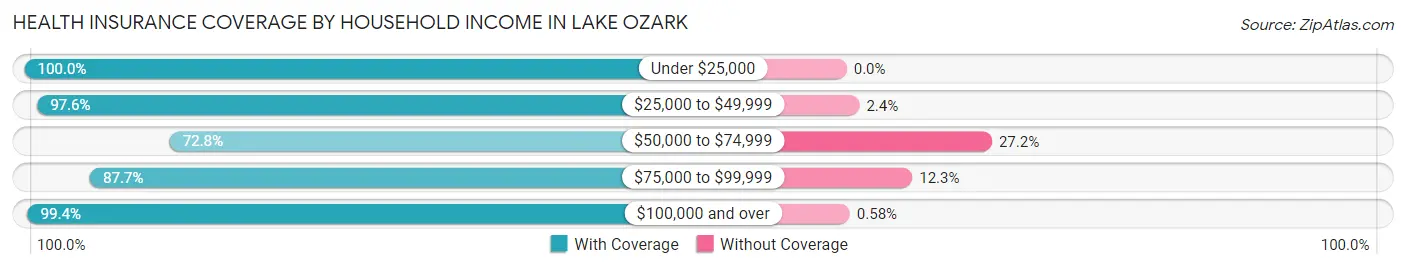
| Household Income | With Coverage | Without Coverage |
| Under $25,000 | 329 (100.0%) | 0 (0.0%) |
| $25,000 to $49,999 | 370 (97.6%) | 9 (2.4%) |
| $50,000 to $74,999 | 289 (72.8%) | 108 (27.2%) |
| $75,000 to $99,999 | 286 (87.7%) | 40 (12.3%) |
| $100,000 and over | 1,190 (99.4%) | 7 (0.6%) |
Public vs Private Health Insurance Coverage by Age in Lake Ozark
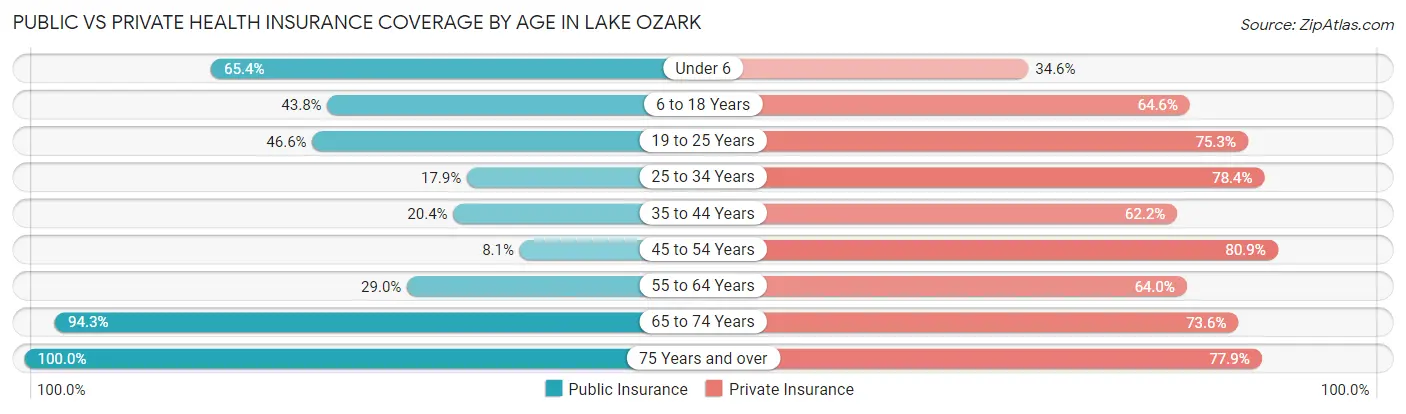
| Age Bracket | Public Insurance | Private Insurance |
| Under 6 | 134 (65.4%) | 71 (34.6%) |
| 6 to 18 Years | 141 (43.8%) | 208 (64.6%) |
| 19 to 25 Years | 68 (46.6%) | 110 (75.3%) |
| 25 to 34 Years | 77 (17.9%) | 338 (78.4%) |
| 35 to 44 Years | 40 (20.4%) | 122 (62.2%) |
| 45 to 54 Years | 22 (8.1%) | 220 (80.9%) |
| 55 to 64 Years | 149 (29.0%) | 329 (64.0%) |
| 65 to 74 Years | 332 (94.3%) | 259 (73.6%) |
| 75 Years and over | 190 (100.0%) | 148 (77.9%) |
| Total | 1,153 (43.9%) | 1,805 (68.7%) |
Disability Status by Sex by Age in Lake Ozark
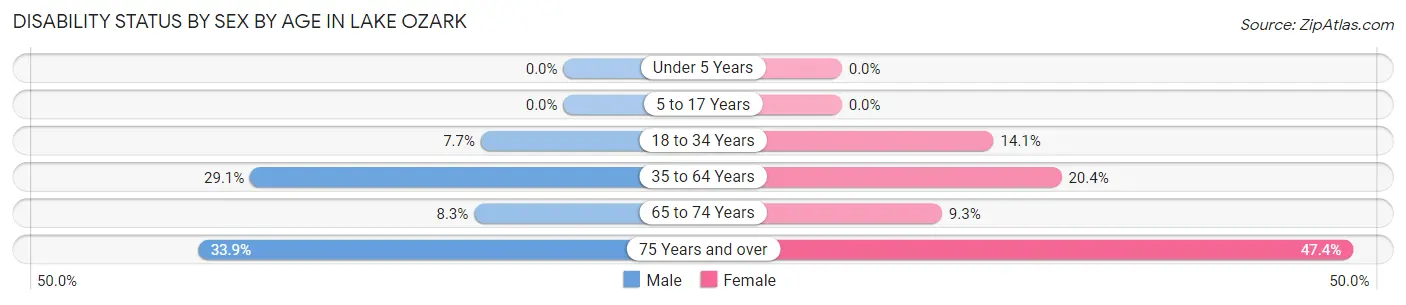
| Age Bracket | Male | Female |
| Under 5 Years | 0 (0.0%) | 0 (0.0%) |
| 5 to 17 Years | 0 (0.0%) | 0 (0.0%) |
| 18 to 34 Years | 20 (7.7%) | 51 (14.1%) |
| 35 to 64 Years | 150 (29.1%) | 95 (20.4%) |
| 65 to 74 Years | 14 (8.3%) | 17 (9.3%) |
| 75 Years and over | 38 (33.9%) | 37 (47.4%) |
Disability Class by Sex by Age in Lake Ozark
Disability Class: Hearing Difficulty
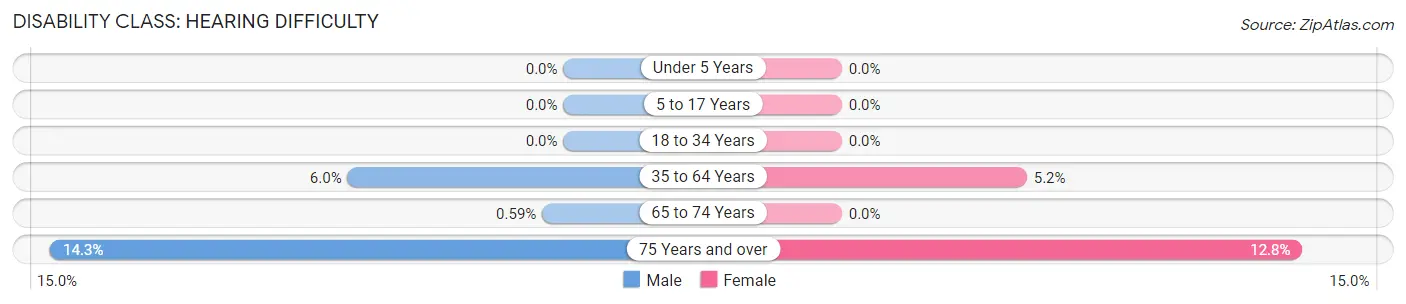
| Age Bracket | Male | Female |
| Under 5 Years | 0 (0.0%) | 0 (0.0%) |
| 5 to 17 Years | 0 (0.0%) | 0 (0.0%) |
| 18 to 34 Years | 0 (0.0%) | 0 (0.0%) |
| 35 to 64 Years | 31 (6.0%) | 24 (5.1%) |
| 65 to 74 Years | 1 (0.6%) | 0 (0.0%) |
| 75 Years and over | 16 (14.3%) | 10 (12.8%) |
Disability Class: Vision Difficulty
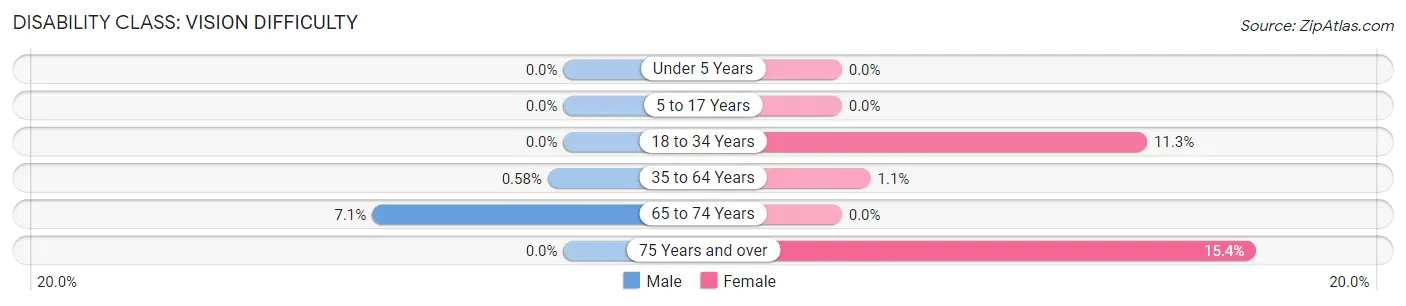
| Age Bracket | Male | Female |
| Under 5 Years | 0 (0.0%) | 0 (0.0%) |
| 5 to 17 Years | 0 (0.0%) | 0 (0.0%) |
| 18 to 34 Years | 0 (0.0%) | 41 (11.3%) |
| 35 to 64 Years | 3 (0.6%) | 5 (1.1%) |
| 65 to 74 Years | 12 (7.1%) | 0 (0.0%) |
| 75 Years and over | 0 (0.0%) | 12 (15.4%) |
Disability Class: Cognitive Difficulty
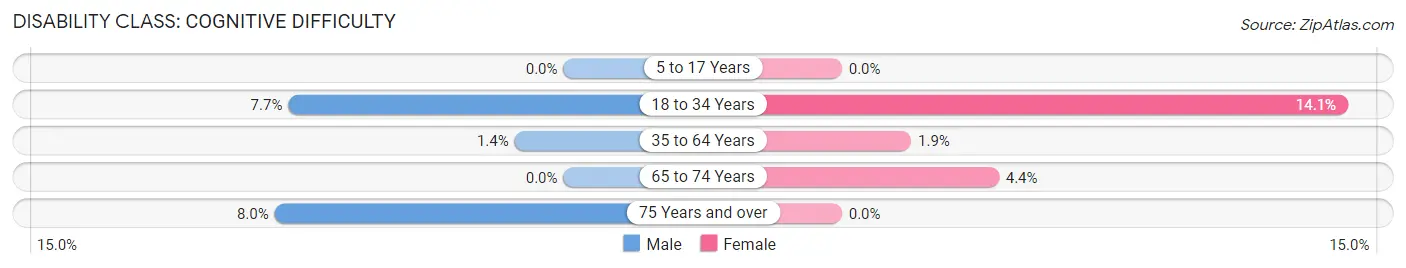
| Age Bracket | Male | Female |
| 5 to 17 Years | 0 (0.0%) | 0 (0.0%) |
| 18 to 34 Years | 20 (7.7%) | 51 (14.1%) |
| 35 to 64 Years | 7 (1.4%) | 9 (1.9%) |
| 65 to 74 Years | 0 (0.0%) | 8 (4.4%) |
| 75 Years and over | 9 (8.0%) | 0 (0.0%) |
Disability Class: Ambulatory Difficulty
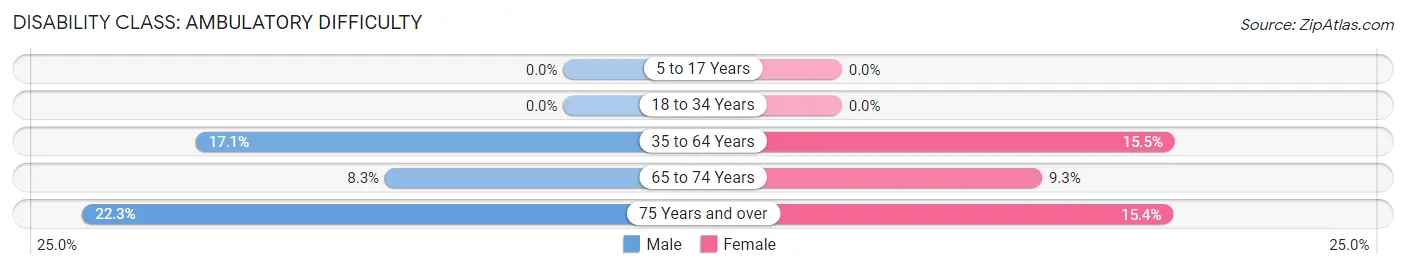
| Age Bracket | Male | Female |
| 5 to 17 Years | 0 (0.0%) | 0 (0.0%) |
| 18 to 34 Years | 0 (0.0%) | 0 (0.0%) |
| 35 to 64 Years | 88 (17.1%) | 72 (15.4%) |
| 65 to 74 Years | 14 (8.3%) | 17 (9.3%) |
| 75 Years and over | 25 (22.3%) | 12 (15.4%) |
Disability Class: Self-Care Difficulty
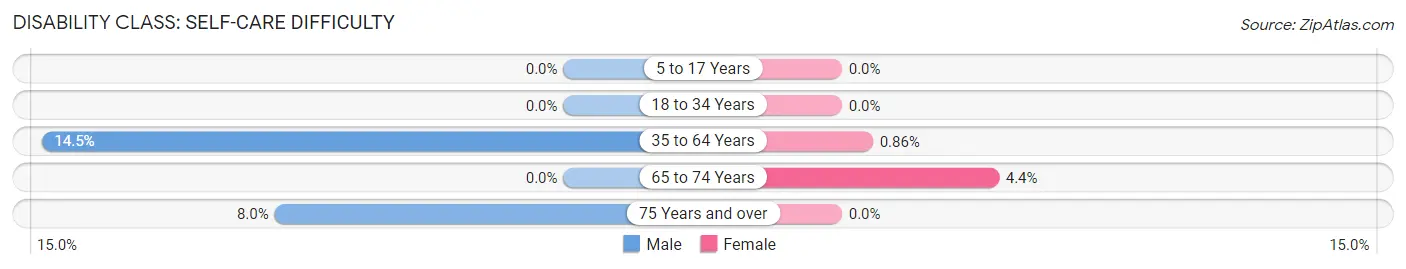
| Age Bracket | Male | Female |
| 5 to 17 Years | 0 (0.0%) | 0 (0.0%) |
| 18 to 34 Years | 0 (0.0%) | 0 (0.0%) |
| 35 to 64 Years | 75 (14.5%) | 4 (0.9%) |
| 65 to 74 Years | 0 (0.0%) | 8 (4.4%) |
| 75 Years and over | 9 (8.0%) | 0 (0.0%) |
Technology Access in Lake Ozark
Computing Device Access in Lake Ozark
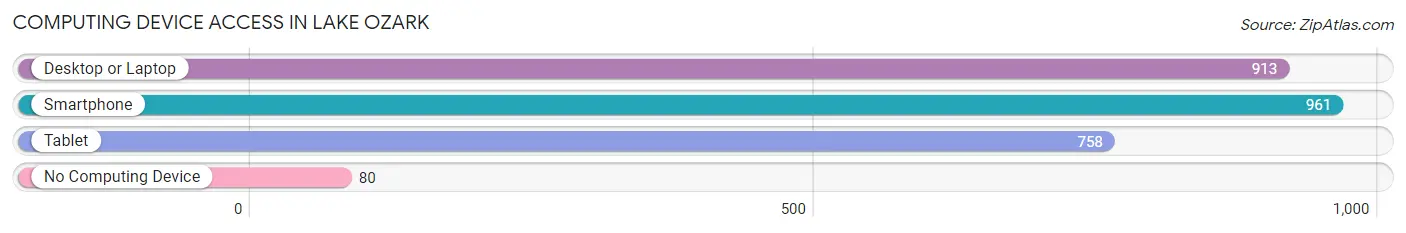
| Device Type | # Households | % Households |
| Desktop or Laptop | 913 | 80.2% |
| Smartphone | 961 | 84.4% |
| Tablet | 758 | 66.5% |
| No Computing Device | 80 | 7.0% |
| Total | 1,139 | 100.0% |
Internet Access in Lake Ozark
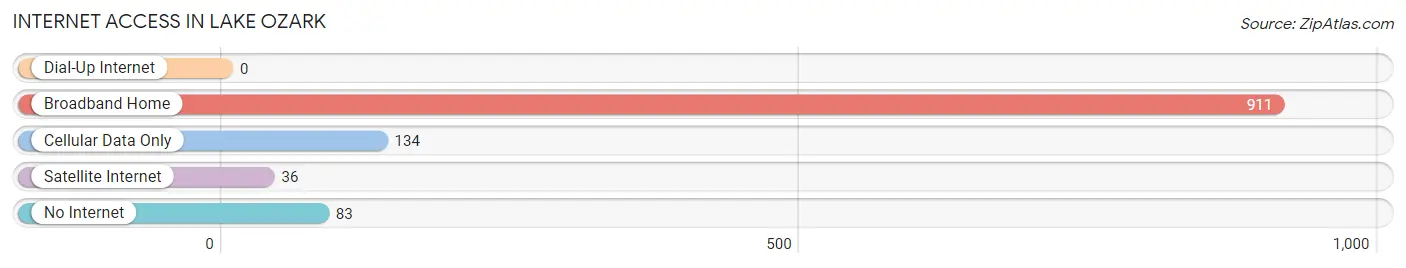
| Internet Type | # Households | % Households |
| Dial-Up Internet | 0 | 0.0% |
| Broadband Home | 911 | 80.0% |
| Cellular Data Only | 134 | 11.8% |
| Satellite Internet | 36 | 3.2% |
| No Internet | 83 | 7.3% |
| Total | 1,139 | 100.0% |
Lake Ozark Summary
History
Lake Ozark is a city located in Miller County, Missouri, United States. It is situated on the Lake of the Ozarks, a large man-made lake created by the construction of the Bagnell Dam in 1929. The city was founded in 1931 and incorporated in 1945.
The area around Lake Ozark was first settled in the early 1800s by French and German immigrants. The area was known as the “Ozark Plateau” and was home to a variety of wildlife, including deer, turkey, and bear. The area was also home to the Osage Indians, who were the original inhabitants of the area.
In the late 1800s, the area began to be developed for tourism. The first hotel was built in 1892, and the first golf course was built in 1895. The area quickly became a popular destination for vacationers, and the population began to grow.
In 1929, the Bagnell Dam was built on the Osage River, creating the Lake of the Ozarks. This created a large lake that stretched for 92 miles and had over 1,150 miles of shoreline. The lake quickly became a popular destination for fishing, boating, and other recreational activities.
In 1931, the city of Lake Ozark was founded. The city was named after the lake, and it quickly became a popular destination for tourists. The city was incorporated in 1945.
Geography
Lake Ozark is located in Miller County, Missouri, in the Ozark Mountains. The city is situated on the Lake of the Ozarks, a large man-made lake created by the construction of the Bagnell Dam in 1929. The lake is 92 miles long and has over 1,150 miles of shoreline.
The city is located at the intersection of US Highway 54 and Missouri Route 242. It is approximately 90 miles from St. Louis, Missouri, and approximately 140 miles from Kansas City, Missouri.
The city has a total area of 4.2 square miles, all of which is land. The city has a humid subtropical climate, with hot, humid summers and mild winters.
Economy
The economy of Lake Ozark is largely based on tourism. The city is a popular destination for vacationers, and it is home to a variety of hotels, resorts, restaurants, and other tourist attractions.
The city is also home to a variety of businesses, including retail stores, restaurants, and other services. The city is also home to a variety of manufacturing companies, including boat and engine manufacturers.
Demographics
As of the 2010 census, the city of Lake Ozark had a population of 2,918. The racial makeup of the city was 97.2% White, 0.7% African American, 0.2% Native American, 0.3% Asian, 0.1% Pacific Islander, 0.3% from other races, and 1.3% from two or more races. Hispanic or Latino of any race were 1.3% of the population.
The median income for a household in the city was $37,917, and the median income for a family was $45,000. The per capita income for the city was $20,945. About 8.2% of families and 10.2% of the population were below the poverty line, including 14.2% of those under age 18 and 6.2% of those age 65 or over.
Common Questions
What is Per Capita Income in Lake Ozark?
Per Capita income in Lake Ozark is $45,441.
What is the Median Family Income in Lake Ozark?
Median Family Income in Lake Ozark is $82,596.
What is the Median Household income in Lake Ozark?
Median Household Income in Lake Ozark is $71,528.
What is Income or Wage Gap in Lake Ozark?
Income or Wage Gap in Lake Ozark is 32.6%.
Women in Lake Ozark earn 67.4 cents for every dollar earned by a man.
What is Inequality or Gini Index in Lake Ozark?
Inequality or Gini Index in Lake Ozark is 0.48.
What is the Total Population of Lake Ozark?
Total Population of Lake Ozark is 2,628.
What is the Total Male Population of Lake Ozark?
Total Male Population of Lake Ozark is 1,384.
What is the Total Female Population of Lake Ozark?
Total Female Population of Lake Ozark is 1,244.
What is the Ratio of Males per 100 Females in Lake Ozark?
There are 111.25 Males per 100 Females in Lake Ozark.
What is the Ratio of Females per 100 Males in Lake Ozark?
There are 89.88 Females per 100 Males in Lake Ozark.
What is the Median Population Age in Lake Ozark?
Median Population Age in Lake Ozark is 45.5 Years.
What is the Average Family Size in Lake Ozark
Average Family Size in Lake Ozark is 2.9 People.
What is the Average Household Size in Lake Ozark
Average Household Size in Lake Ozark is 2.3 People.
How Large is the Labor Force in Lake Ozark?
There are 1,348 People in the Labor Forcein in Lake Ozark.
What is the Percentage of People in the Labor Force in Lake Ozark?
61.8% of People are in the Labor Force in Lake Ozark.
What is the Unemployment Rate in Lake Ozark?
Unemployment Rate in Lake Ozark is 4.0%.