La Plata, MO Map & Demographics
La Plata Map
La Plata Overview
$26,541
PER CAPITA INCOME
$55,917
AVG FAMILY INCOME
$44,286
AVG HOUSEHOLD INCOME
15.1%
WAGE / INCOME GAP [ % ]
84.9¢/ $1
WAGE / INCOME GAP [ $ ]
0.45
INEQUALITY / GINI INDEX
1,265
TOTAL POPULATION
577
MALE POPULATION
688
FEMALE POPULATION
83.87
MALES / 100 FEMALES
119.24
FEMALES / 100 MALES
46.4
MEDIAN AGE
3.5
AVG FAMILY SIZE
2.5
AVG HOUSEHOLD SIZE
473
LABOR FORCE [ PEOPLE ]
44.5%
PERCENT IN LABOR FORCE
6.3%
UNEMPLOYMENT RATE
La Plata Zip Codes
La Plata Area Codes
Income in La Plata
Income Overview in La Plata
Per Capita Income in La Plata is $26,541, while median incomes of families and households are $55,917 and $44,286 respectively.
| Characteristic | Number | Measure |
| Per Capita Income | 1,265 | $26,541 |
| Median Family Income | 263 | $55,917 |
| Mean Family Income | 263 | $72,347 |
| Median Household Income | 498 | $44,286 |
| Mean Household Income | 498 | $59,328 |
| Income Deficit | 263 | $0 |
| Wage / Income Gap (%) | 1,265 | 15.08% |
| Wage / Income Gap ($) | 1,265 | 84.92¢ per $1 |
| Gini / Inequality Index | 1,265 | 0.45 |
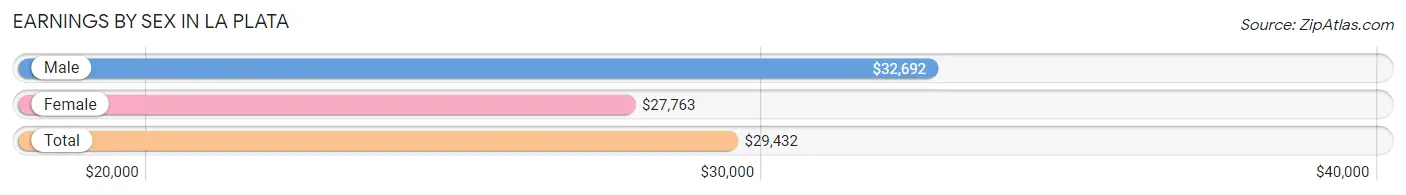
Earnings by Sex in La Plata
Average Earnings in La Plata are $29,432, $32,692 for men and $27,763 for women, a difference of 15.1%.
| Sex | Number | Average Earnings |
| Male | 268 (45.9%) | $32,692 |
| Female | 316 (54.1%) | $27,763 |
| Total | 584 (100.0%) | $29,432 |
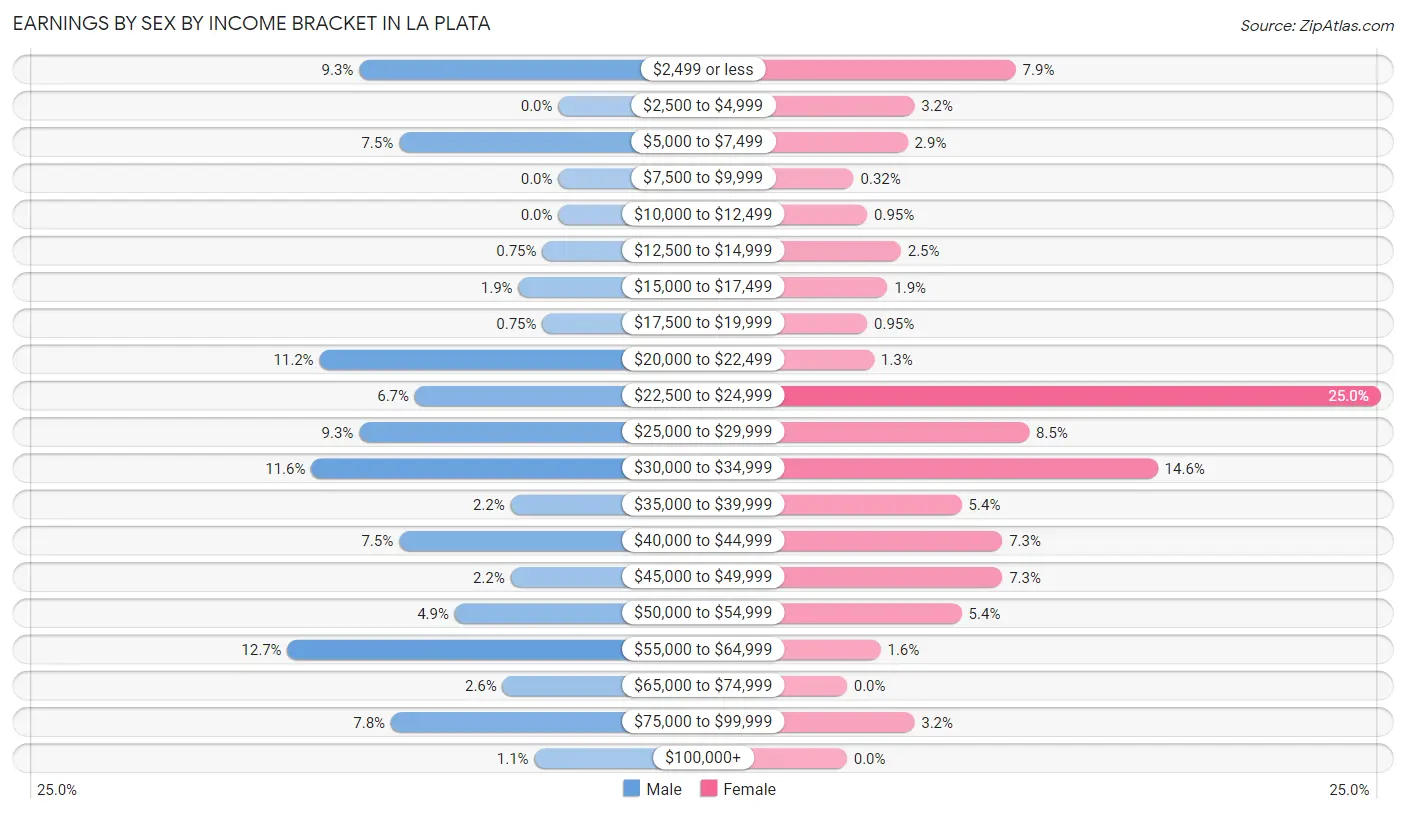
Earnings by Sex by Income Bracket in La Plata
The most common earnings brackets in La Plata are $55,000 to $64,999 for men (34 | 12.7%) and $22,500 to $24,999 for women (79 | 25.0%).
| Income | Male | Female |
| $2,499 or less | 25 (9.3%) | 25 (7.9%) |
| $2,500 to $4,999 | 0 (0.0%) | 10 (3.2%) |
| $5,000 to $7,499 | 20 (7.5%) | 9 (2.9%) |
| $7,500 to $9,999 | 0 (0.0%) | 1 (0.3%) |
| $10,000 to $12,499 | 0 (0.0%) | 3 (0.9%) |
| $12,500 to $14,999 | 2 (0.7%) | 8 (2.5%) |
| $15,000 to $17,499 | 5 (1.9%) | 6 (1.9%) |
| $17,500 to $19,999 | 2 (0.7%) | 3 (0.9%) |
| $20,000 to $22,499 | 30 (11.2%) | 4 (1.3%) |
| $22,500 to $24,999 | 18 (6.7%) | 79 (25.0%) |
| $25,000 to $29,999 | 25 (9.3%) | 27 (8.5%) |
| $30,000 to $34,999 | 31 (11.6%) | 46 (14.6%) |
| $35,000 to $39,999 | 6 (2.2%) | 17 (5.4%) |
| $40,000 to $44,999 | 20 (7.5%) | 23 (7.3%) |
| $45,000 to $49,999 | 6 (2.2%) | 23 (7.3%) |
| $50,000 to $54,999 | 13 (4.9%) | 17 (5.4%) |
| $55,000 to $64,999 | 34 (12.7%) | 5 (1.6%) |
| $65,000 to $74,999 | 7 (2.6%) | 0 (0.0%) |
| $75,000 to $99,999 | 21 (7.8%) | 10 (3.2%) |
| $100,000+ | 3 (1.1%) | 0 (0.0%) |
| Total | 268 (100.0%) | 316 (100.0%) |
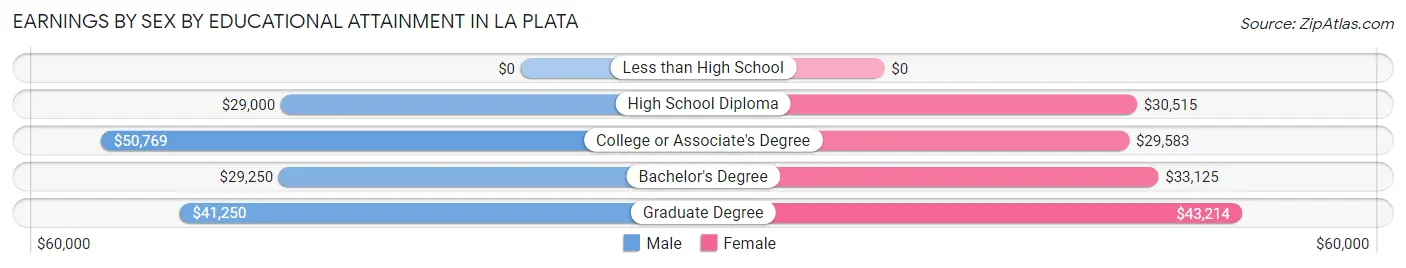
Earnings by Sex by Educational Attainment in La Plata
Average earnings in La Plata are $34,471 for men and $33,250 for women, a difference of 3.5%. Men with an educational attainment of college or associate's degree enjoy the highest average annual earnings of $50,769, while those with high school diploma education earn the least with $29,000. Women with an educational attainment of graduate degree earn the most with the average annual earnings of $43,214, while those with college or associate's degree education have the smallest earnings of $29,583.
| Educational Attainment | Male Income | Female Income |
| Less than High School | - | - |
| High School Diploma | $29,000 | $30,515 |
| College or Associate's Degree | $50,769 | $29,583 |
| Bachelor's Degree | $29,250 | $33,125 |
| Graduate Degree | $41,250 | $43,214 |
| Total | $34,471 | $33,250 |
Family Income in La Plata
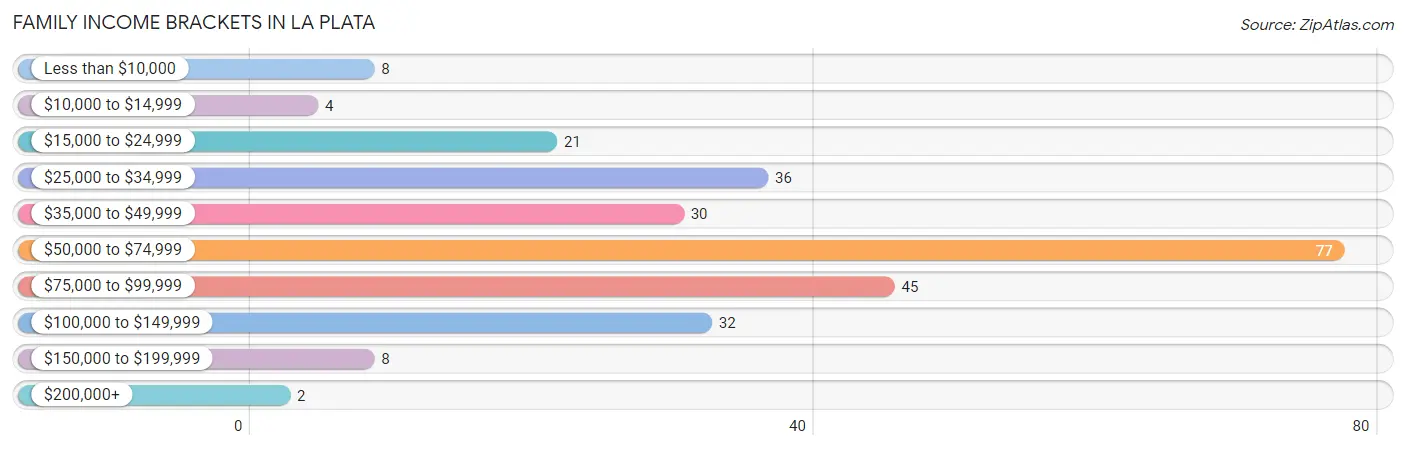
Family Income Brackets in La Plata
According to the La Plata family income data, there are 77 families falling into the $50,000 to $74,999 income range, which is the most common income bracket and makes up 29.3% of all families. Conversely, the $200,000+ income bracket is the least frequent group with only 2 families (0.8%) belonging to this category.
| Income Bracket | # Families | % Families |
| Less than $10,000 | 8 | 3.0% |
| $10,000 to $14,999 | 4 | 1.5% |
| $15,000 to $24,999 | 21 | 8.0% |
| $25,000 to $34,999 | 36 | 13.7% |
| $35,000 to $49,999 | 30 | 11.4% |
| $50,000 to $74,999 | 77 | 29.3% |
| $75,000 to $99,999 | 45 | 17.1% |
| $100,000 to $149,999 | 32 | 12.2% |
| $150,000 to $199,999 | 8 | 3.0% |
| $200,000+ | 2 | 0.8% |
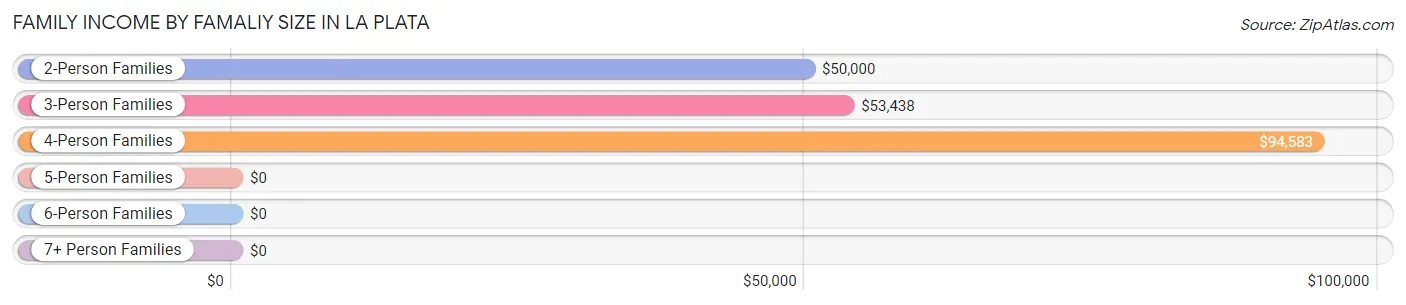
Family Income by Famaliy Size in La Plata
4-person families (42 | 16.0%) account for the highest median family income in La Plata with $94,583 per family, while 2-person families (138 | 52.5%) have the highest median income of $25,000 per family member.
| Income Bracket | # Families | Median Income |
| 2-Person Families | 138 (52.5%) | $50,000 |
| 3-Person Families | 69 (26.2%) | $53,438 |
| 4-Person Families | 42 (16.0%) | $94,583 |
| 5-Person Families | 6 (2.3%) | $0 |
| 6-Person Families | 8 (3.0%) | $0 |
| 7+ Person Families | 0 (0.0%) | $0 |
| Total | 263 (100.0%) | $55,917 |
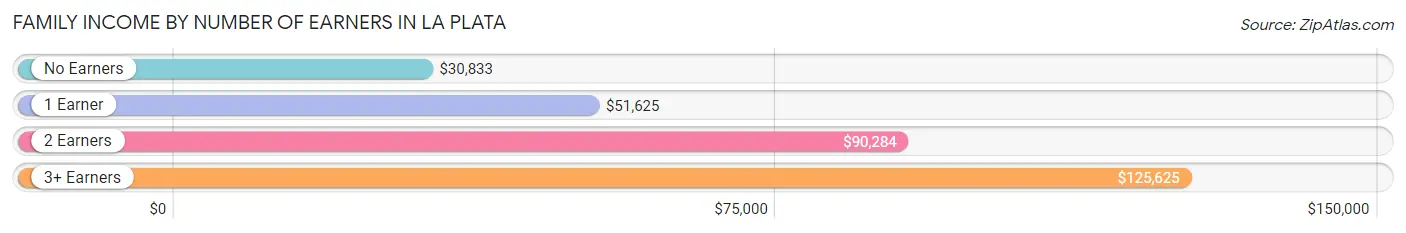
Family Income by Number of Earners in La Plata
The median family income in La Plata is $55,917, with families comprising 3+ earners (9) having the highest median family income of $125,625, while families with no earners (68) have the lowest median family income of $30,833, accounting for 3.4% and 25.9% of families, respectively.
| Number of Earners | # Families | Median Income |
| No Earners | 68 (25.9%) | $30,833 |
| 1 Earner | 89 (33.8%) | $51,625 |
| 2 Earners | 97 (36.9%) | $90,284 |
| 3+ Earners | 9 (3.4%) | $125,625 |
| Total | 263 (100.0%) | $55,917 |
Household Income in La Plata
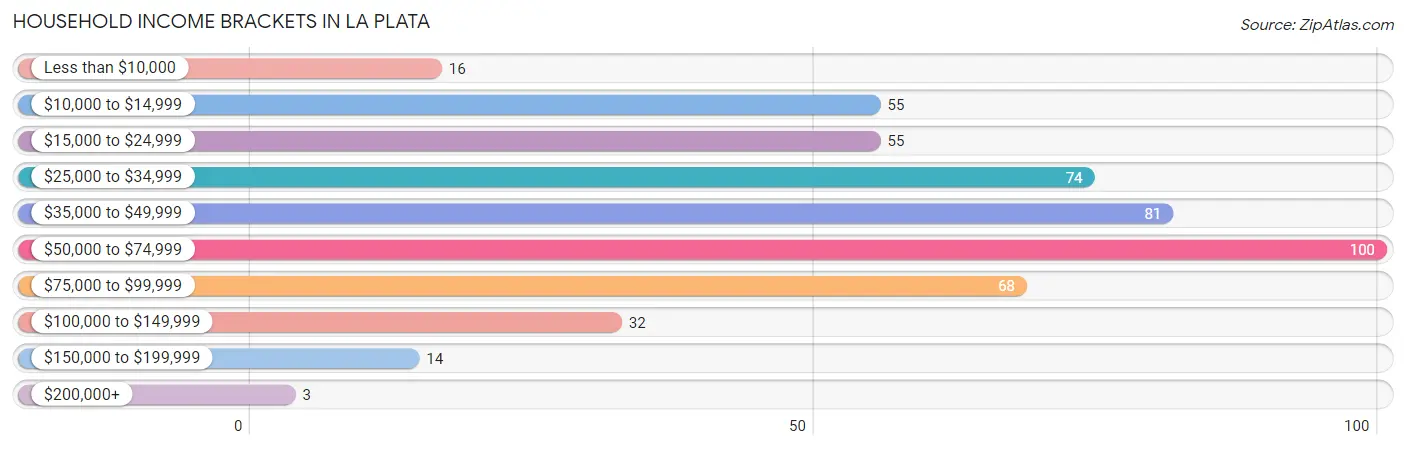
Household Income Brackets in La Plata
With 100 households falling in the category, the $50,000 to $74,999 income range is the most frequent in La Plata, accounting for 20.1% of all households. In contrast, only 3 households (0.6%) fall into the $200,000+ income bracket, making it the least populous group.
| Income Bracket | # Households | % Households |
| Less than $10,000 | 16 | 3.2% |
| $10,000 to $14,999 | 55 | 11.0% |
| $15,000 to $24,999 | 55 | 11.0% |
| $25,000 to $34,999 | 74 | 14.9% |
| $35,000 to $49,999 | 81 | 16.3% |
| $50,000 to $74,999 | 100 | 20.1% |
| $75,000 to $99,999 | 68 | 13.7% |
| $100,000 to $149,999 | 32 | 6.4% |
| $150,000 to $199,999 | 14 | 2.8% |
| $200,000+ | 3 | 0.6% |
Household Income by Householder Age in La Plata
The median household income in La Plata is $44,286, with the highest median household income of $62,500 found in the 15 to 24 years age bracket for the primary householder. A total of 10 households (2.0%) fall into this category. Meanwhile, the 65+ years age bracket for the primary householder has the lowest median household income of $31,875, with 221 households (44.4%) in this group.
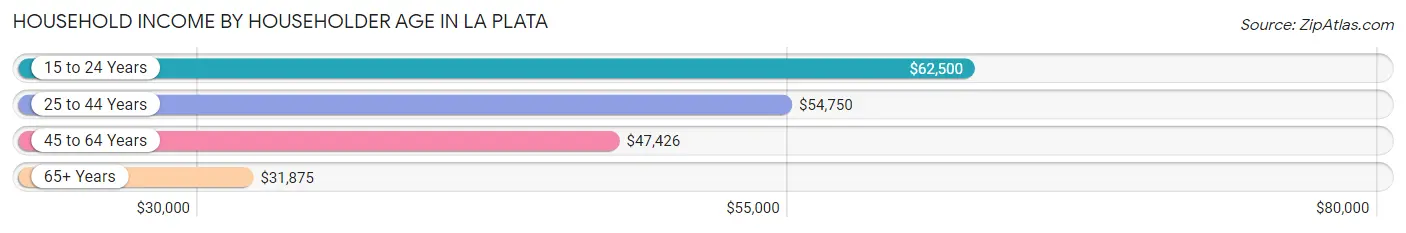
| Income Bracket | # Households | Median Income |
| 15 to 24 Years | 10 (2.0%) | $62,500 |
| 25 to 44 Years | 126 (25.3%) | $54,750 |
| 45 to 64 Years | 141 (28.3%) | $47,426 |
| 65+ Years | 221 (44.4%) | $31,875 |
| Total | 498 (100.0%) | $44,286 |
Poverty in La Plata
Income Below Poverty by Sex and Age in La Plata
With 6.7% poverty level for males and 16.2% for females among the residents of La Plata, 16 and 17 year old males and 6 to 11 year old females are the most vulnerable to poverty, with 10 males (66.7%) and 14 females (66.7%) in their respective age groups living below the poverty level.
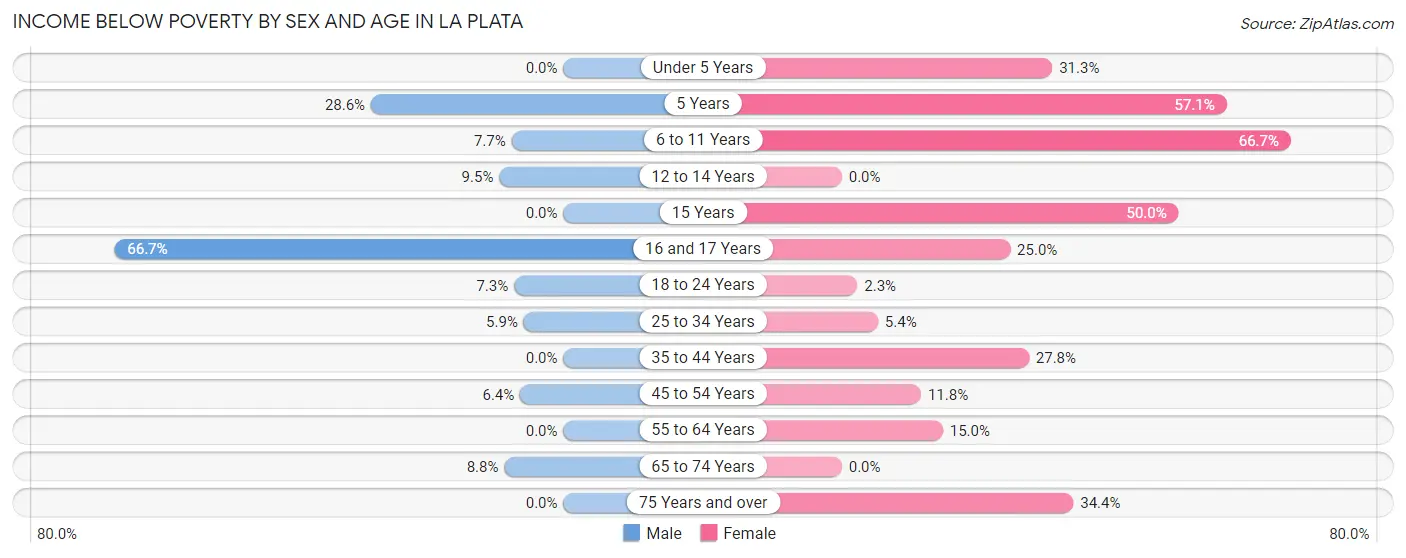
| Age Bracket | Male | Female |
| Under 5 Years | 0 (0.0%) | 5 (31.2%) |
| 5 Years | 4 (28.6%) | 4 (57.1%) |
| 6 to 11 Years | 3 (7.7%) | 14 (66.7%) |
| 12 to 14 Years | 2 (9.5%) | 0 (0.0%) |
| 15 Years | 0 (0.0%) | 3 (50.0%) |
| 16 and 17 Years | 10 (66.7%) | 1 (25.0%) |
| 18 to 24 Years | 3 (7.3%) | 3 (2.3%) |
| 25 to 34 Years | 4 (5.9%) | 3 (5.4%) |
| 35 to 44 Years | 0 (0.0%) | 15 (27.8%) |
| 45 to 54 Years | 7 (6.4%) | 8 (11.8%) |
| 55 to 64 Years | 0 (0.0%) | 6 (15.0%) |
| 65 to 74 Years | 5 (8.8%) | 0 (0.0%) |
| 75 Years and over | 0 (0.0%) | 44 (34.4%) |
| Total | 38 (6.7%) | 106 (16.2%) |
Income Above Poverty by Sex and Age in La Plata
According to the poverty statistics in La Plata, males aged under 5 years and females aged 12 to 14 years are the age groups that are most secure financially, with 100.0% of males and 100.0% of females in these age groups living above the poverty line.
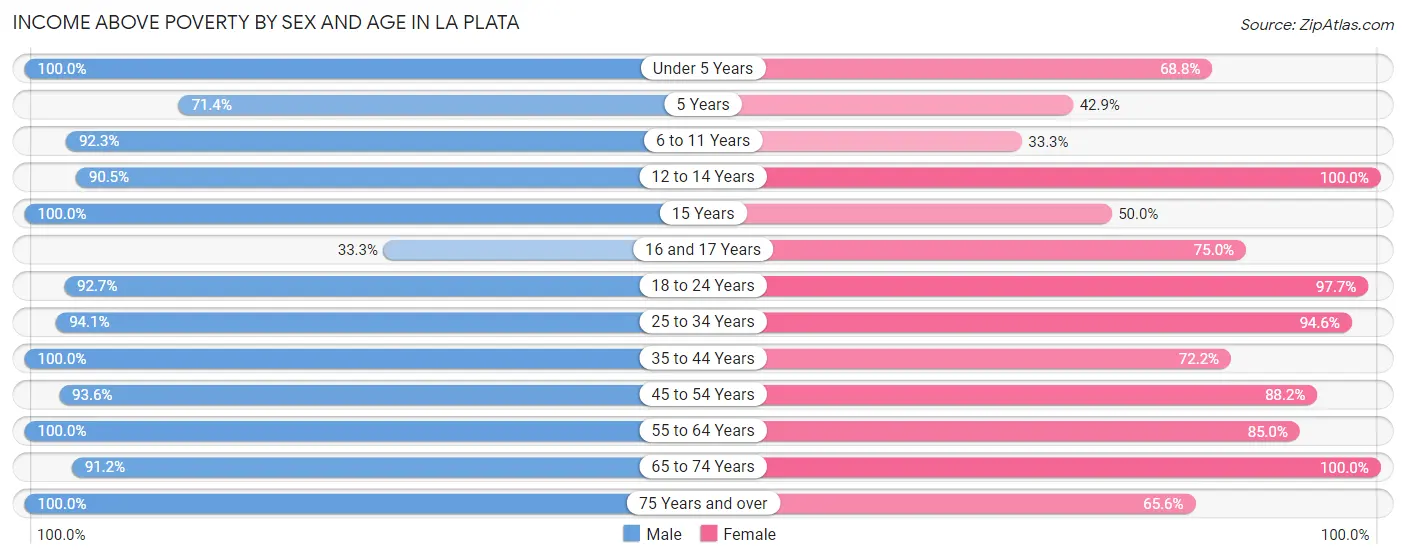
| Age Bracket | Male | Female |
| Under 5 Years | 53 (100.0%) | 11 (68.8%) |
| 5 Years | 10 (71.4%) | 3 (42.9%) |
| 6 to 11 Years | 36 (92.3%) | 7 (33.3%) |
| 12 to 14 Years | 19 (90.5%) | 20 (100.0%) |
| 15 Years | 6 (100.0%) | 3 (50.0%) |
| 16 and 17 Years | 5 (33.3%) | 3 (75.0%) |
| 18 to 24 Years | 38 (92.7%) | 127 (97.7%) |
| 25 to 34 Years | 64 (94.1%) | 53 (94.6%) |
| 35 to 44 Years | 46 (100.0%) | 39 (72.2%) |
| 45 to 54 Years | 102 (93.6%) | 60 (88.2%) |
| 55 to 64 Years | 33 (100.0%) | 34 (85.0%) |
| 65 to 74 Years | 52 (91.2%) | 105 (100.0%) |
| 75 Years and over | 69 (100.0%) | 84 (65.6%) |
| Total | 533 (93.3%) | 549 (83.8%) |
Income Below Poverty Among Married-Couple Families in La Plata
The poverty statistics for married-couple families in La Plata show that 2.1% or 4 of the total 189 families live below the poverty line. Families with 3 or 4 children have the highest poverty rate of 33.3%, comprising of 4 families. On the other hand, families with no children have the lowest poverty rate of 0.0%, which includes 0 families.
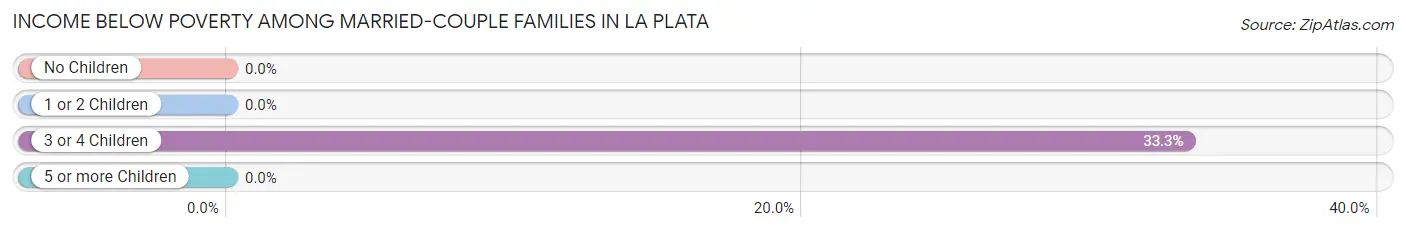
| Children | Above Poverty | Below Poverty |
| No Children | 135 (100.0%) | 0 (0.0%) |
| 1 or 2 Children | 42 (100.0%) | 0 (0.0%) |
| 3 or 4 Children | 8 (66.7%) | 4 (33.3%) |
| 5 or more Children | 0 (0.0%) | 0 (0.0%) |
| Total | 185 (97.9%) | 4 (2.1%) |
Income Below Poverty Among Single-Parent Households in La Plata
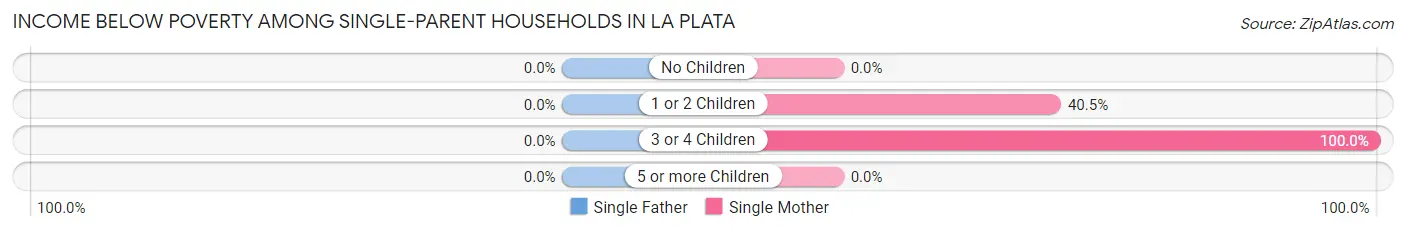
| Children | Single Father | Single Mother |
| No Children | 0 (0.0%) | 0 (0.0%) |
| 1 or 2 Children | 0 (0.0%) | 17 (40.5%) |
| 3 or 4 Children | 0 (0.0%) | 2 (100.0%) |
| 5 or more Children | 0 (0.0%) | 0 (0.0%) |
| Total | 0 (0.0%) | 19 (28.8%) |
Income Below Poverty Among Married-Couple vs Single-Parent Households in La Plata
The poverty data for La Plata shows that 4 of the married-couple family households (2.1%) and 19 of the single-parent households (25.7%) are living below the poverty level. Within the married-couple family households, those with 3 or 4 children have the highest poverty rate, with 4 households (33.3%) falling below the poverty line. Among the single-parent households, those with 1 or 2 children have the highest poverty rate, with 17 household (37.0%) living below poverty.
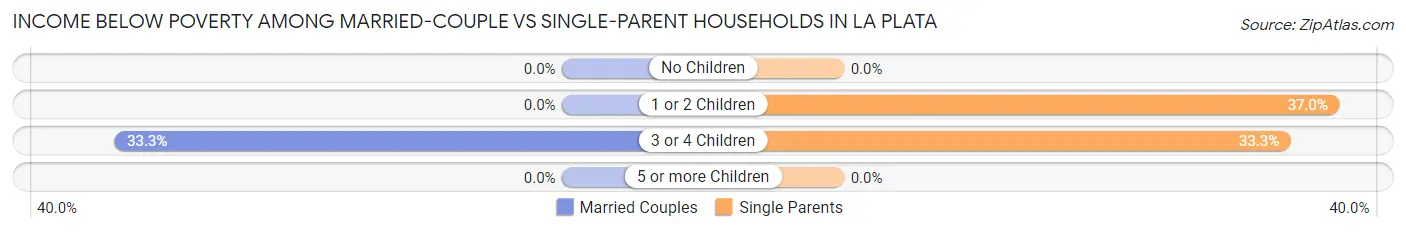
| Children | Married-Couple Families | Single-Parent Households |
| No Children | 0 (0.0%) | 0 (0.0%) |
| 1 or 2 Children | 0 (0.0%) | 17 (37.0%) |
| 3 or 4 Children | 4 (33.3%) | 2 (33.3%) |
| 5 or more Children | 0 (0.0%) | 0 (0.0%) |
| Total | 4 (2.1%) | 19 (25.7%) |
Race in La Plata
The most populous races in La Plata are White / Caucasian (1,222 | 96.6%), Two or more Races (23 | 1.8%), and Asian (17 | 1.3%).
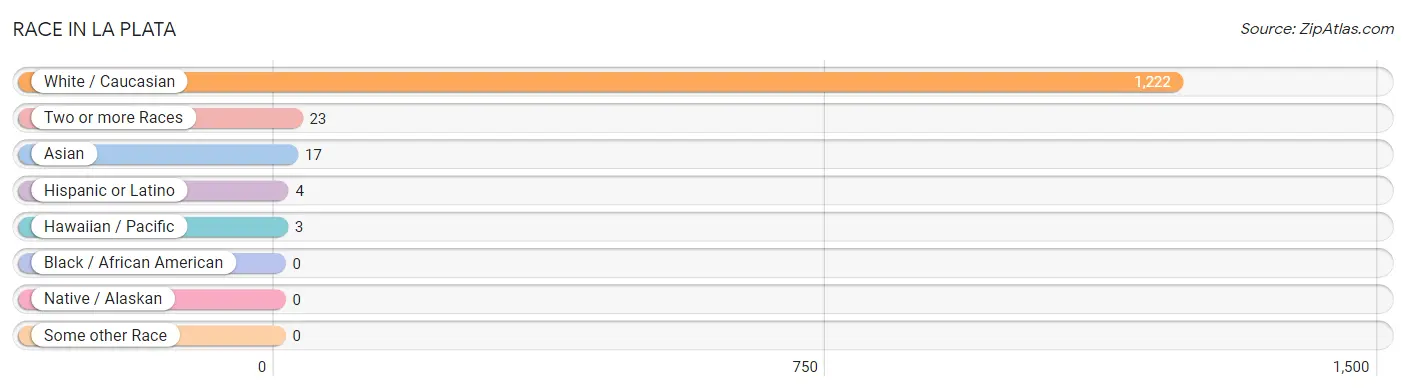
| Race | # Population | % Population |
| Asian | 17 | 1.3% |
| Black / African American | 0 | 0.0% |
| Hawaiian / Pacific | 3 | 0.2% |
| Hispanic or Latino | 4 | 0.3% |
| Native / Alaskan | 0 | 0.0% |
| White / Caucasian | 1,222 | 96.6% |
| Two or more Races | 23 | 1.8% |
| Some other Race | 0 | 0.0% |
| Total | 1,265 | 100.0% |
Ancestry in La Plata
The most populous ancestries reported in La Plata are German (279 | 22.1%), English (172 | 13.6%), American (135 | 10.7%), Irish (110 | 8.7%), and European (35 | 2.8%), together accounting for 57.8% of all La Plata residents.
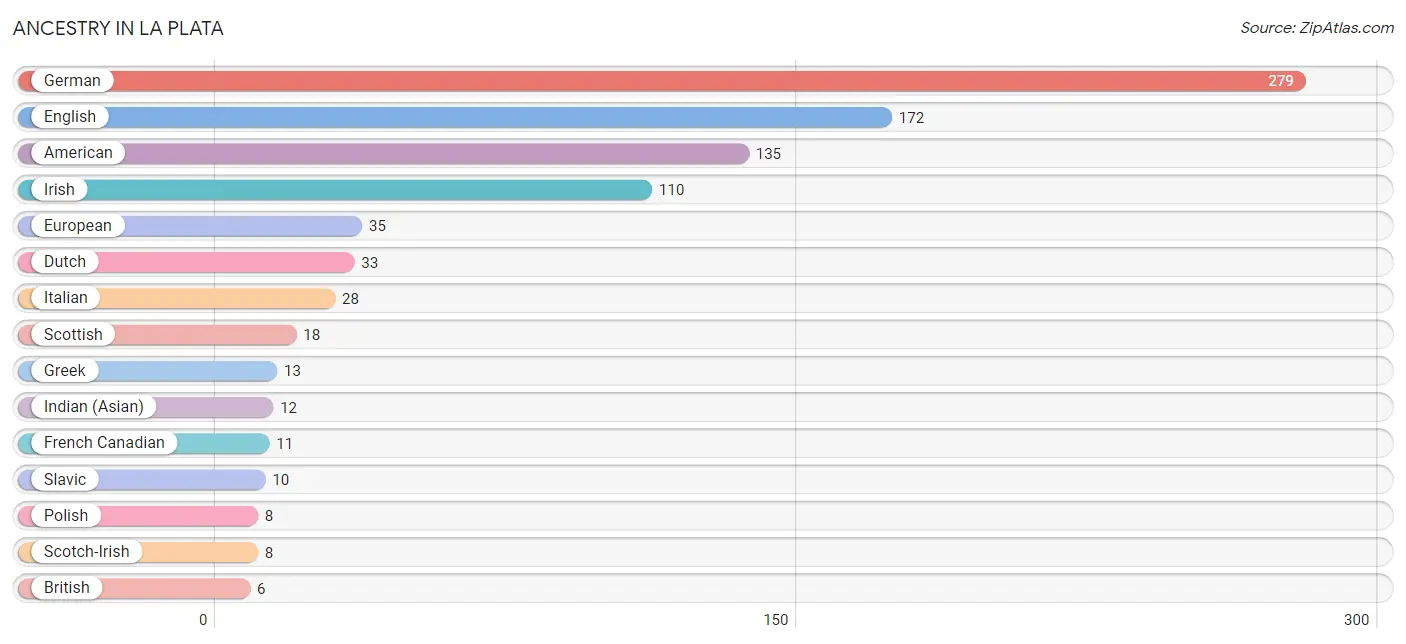
| Ancestry | # Population | % Population |
| American | 135 | 10.7% |
| Arab | 3 | 0.2% |
| British | 6 | 0.5% |
| Czech | 2 | 0.2% |
| Dutch | 33 | 2.6% |
| English | 172 | 13.6% |
| European | 35 | 2.8% |
| French | 6 | 0.5% |
| French Canadian | 11 | 0.9% |
| German | 279 | 22.1% |
| Greek | 13 | 1.0% |
| Hungarian | 4 | 0.3% |
| Indian (Asian) | 12 | 0.9% |
| Irish | 110 | 8.7% |
| Italian | 28 | 2.2% |
| Korean | 5 | 0.4% |
| Lebanese | 3 | 0.2% |
| Mexican | 4 | 0.3% |
| Native Hawaiian | 3 | 0.2% |
| Norwegian | 2 | 0.2% |
| Polish | 8 | 0.6% |
| Russian | 5 | 0.4% |
| Scotch-Irish | 8 | 0.6% |
| Scottish | 18 | 1.4% |
| Slavic | 10 | 0.8% |
| Swedish | 3 | 0.2% |
| Welsh | 1 | 0.1% | View All 27 Rows |
Immigrants in La Plata
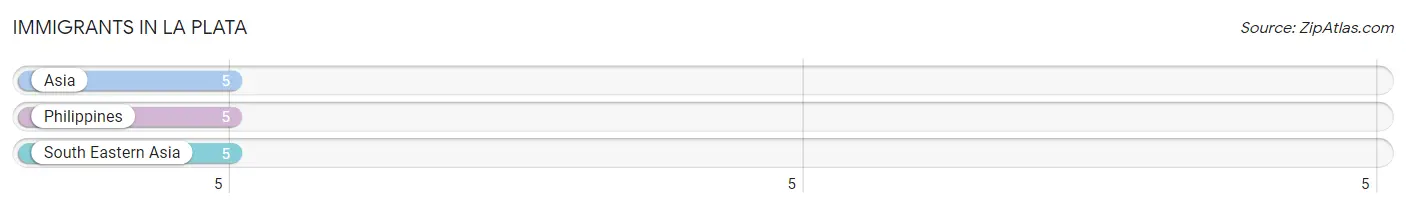
The most numerous immigrant groups reported in La Plata came from Asia (5 | 0.4%), Philippines (5 | 0.4%), and South Eastern Asia (5 | 0.4%), together accounting for 1.2% of all La Plata residents.
| Immigration Origin | # Population | % Population |
| Asia | 5 | 0.4% |
| Philippines | 5 | 0.4% |
| South Eastern Asia | 5 | 0.4% | View All 3 Rows |
Sex and Age in La Plata
Sex and Age in La Plata
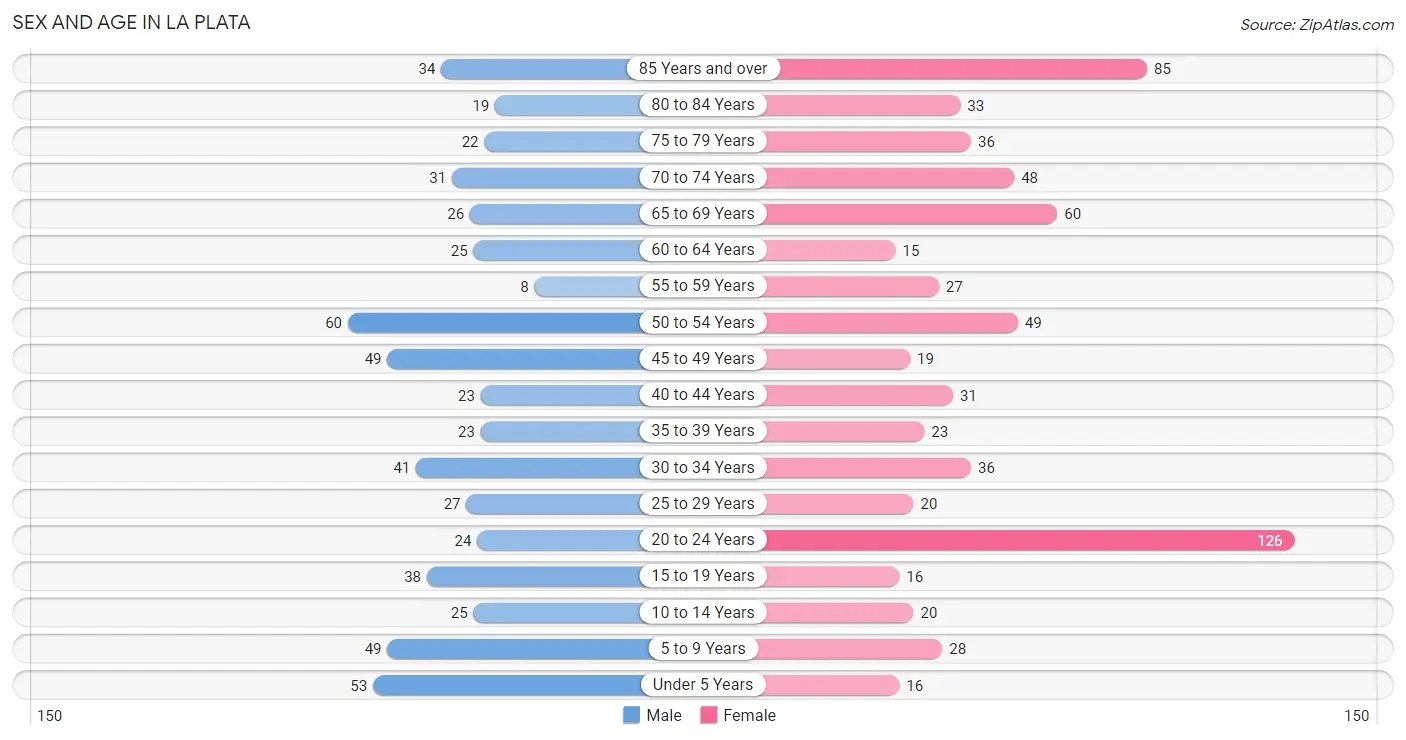
The most populous age groups in La Plata are 50 to 54 Years (60 | 10.4%) for men and 20 to 24 Years (126 | 18.3%) for women.
| Age Bracket | Male | Female |
| Under 5 Years | 53 (9.2%) | 16 (2.3%) |
| 5 to 9 Years | 49 (8.5%) | 28 (4.1%) |
| 10 to 14 Years | 25 (4.3%) | 20 (2.9%) |
| 15 to 19 Years | 38 (6.6%) | 16 (2.3%) |
| 20 to 24 Years | 24 (4.2%) | 126 (18.3%) |
| 25 to 29 Years | 27 (4.7%) | 20 (2.9%) |
| 30 to 34 Years | 41 (7.1%) | 36 (5.2%) |
| 35 to 39 Years | 23 (4.0%) | 23 (3.3%) |
| 40 to 44 Years | 23 (4.0%) | 31 (4.5%) |
| 45 to 49 Years | 49 (8.5%) | 19 (2.8%) |
| 50 to 54 Years | 60 (10.4%) | 49 (7.1%) |
| 55 to 59 Years | 8 (1.4%) | 27 (3.9%) |
| 60 to 64 Years | 25 (4.3%) | 15 (2.2%) |
| 65 to 69 Years | 26 (4.5%) | 60 (8.7%) |
| 70 to 74 Years | 31 (5.4%) | 48 (7.0%) |
| 75 to 79 Years | 22 (3.8%) | 36 (5.2%) |
| 80 to 84 Years | 19 (3.3%) | 33 (4.8%) |
| 85 Years and over | 34 (5.9%) | 85 (12.3%) |
| Total | 577 (100.0%) | 688 (100.0%) |
Families and Households in La Plata
Median Family Size in La Plata
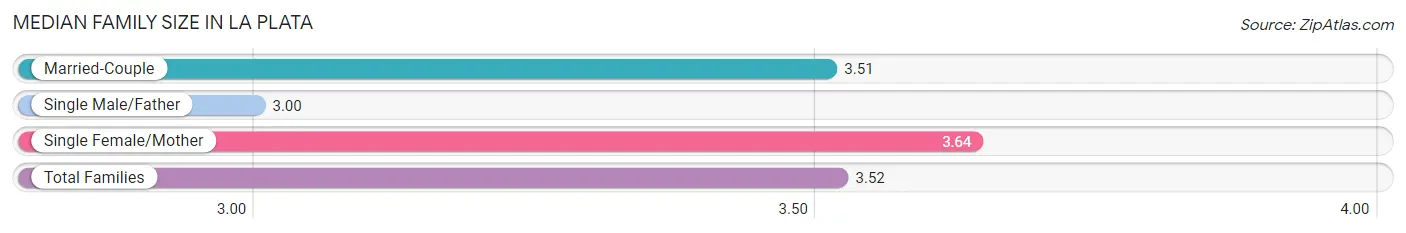
The median family size in La Plata is 3.52 persons per family, with single female/mother families (66 | 25.1%) accounting for the largest median family size of 3.64 persons per family. On the other hand, single male/father families (8 | 3.0%) represent the smallest median family size with 3.00 persons per family.
| Family Type | # Families | Family Size |
| Married-Couple | 189 (71.9%) | 3.51 |
| Single Male/Father | 8 (3.0%) | 3.00 |
| Single Female/Mother | 66 (25.1%) | 3.64 |
| Total Families | 263 (100.0%) | 3.52 |
Median Household Size in La Plata
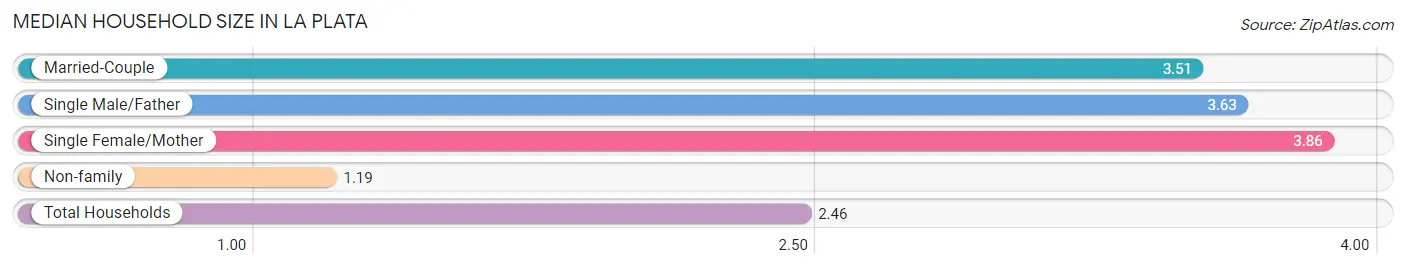
The median household size in La Plata is 2.46 persons per household, with single female/mother households (66 | 13.3%) accounting for the largest median household size of 3.86 persons per household. non-family households (235 | 47.2%) represent the smallest median household size with 1.19 persons per household.
| Household Type | # Households | Household Size |
| Married-Couple | 189 (38.0%) | 3.51 |
| Single Male/Father | 8 (1.6%) | 3.63 |
| Single Female/Mother | 66 (13.3%) | 3.86 |
| Non-family | 235 (47.2%) | 1.19 |
| Total Households | 498 (100.0%) | 2.46 |
Household Size by Marriage Status in La Plata
Out of a total of 498 households in La Plata, 263 (52.8%) are family households, while 235 (47.2%) are nonfamily households. The most numerous type of family households are 2-person households, comprising 130, and the most common type of nonfamily households are 1-person households, comprising 209.
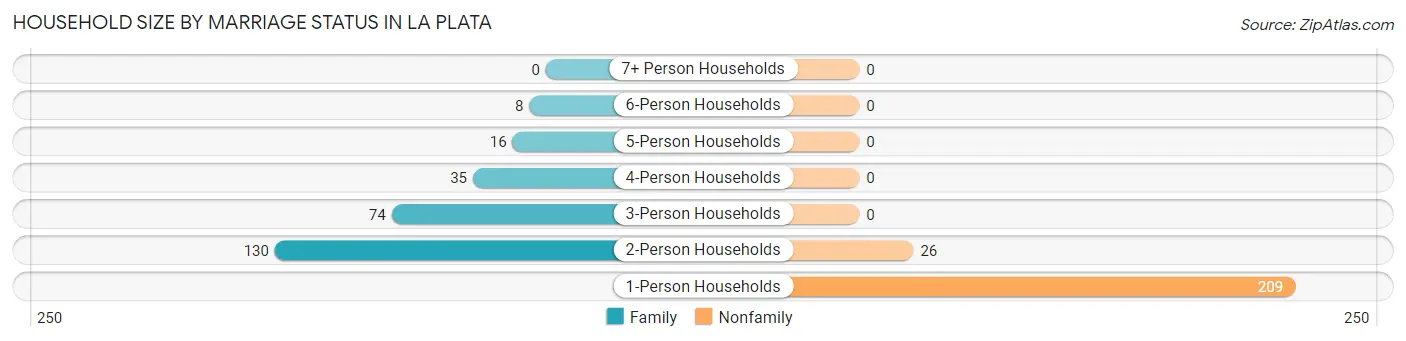
| Household Size | Family Households | Nonfamily Households |
| 1-Person Households | - | 209 (42.0%) |
| 2-Person Households | 130 (26.1%) | 26 (5.2%) |
| 3-Person Households | 74 (14.9%) | 0 (0.0%) |
| 4-Person Households | 35 (7.0%) | 0 (0.0%) |
| 5-Person Households | 16 (3.2%) | 0 (0.0%) |
| 6-Person Households | 8 (1.6%) | 0 (0.0%) |
| 7+ Person Households | 0 (0.0%) | 0 (0.0%) |
| Total | 263 (52.8%) | 235 (47.2%) |
Female Fertility in La Plata
Fertility by Age in La Plata
Average fertility rate in La Plata is 21.0 births per 1,000 women. Women in the age bracket of 20 to 34 years have the highest fertility rate with 33.0 births per 1,000 women. Women in the age bracket of 20 to 34 years acount for 100.0% of all women with births.
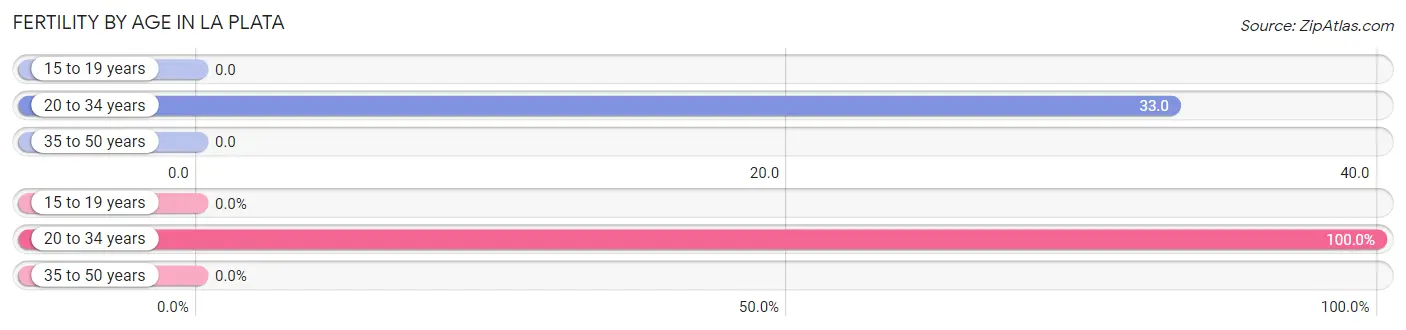
| Age Bracket | Women with Births | Births / 1,000 Women |
| 15 to 19 years | 0 (0.0%) | 0.0 |
| 20 to 34 years | 6 (100.0%) | 33.0 |
| 35 to 50 years | 0 (0.0%) | 0.0 |
| Total | 6 (100.0%) | 21.0 |
Fertility by Age by Marriage Status in La Plata
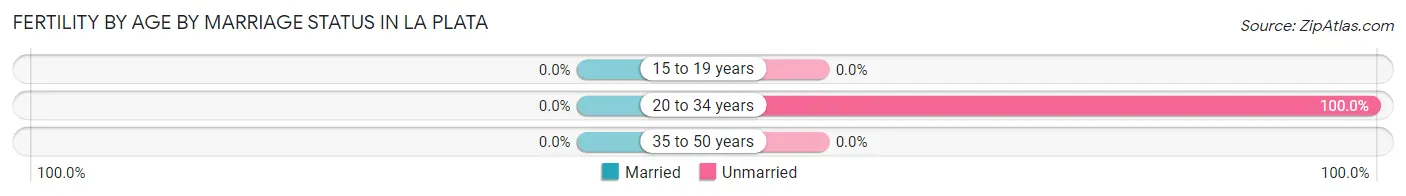
| Age Bracket | Married | Unmarried |
| 15 to 19 years | 0 (0.0%) | 0 (0.0%) |
| 20 to 34 years | 0 (0.0%) | 6 (100.0%) |
| 35 to 50 years | 0 (0.0%) | 0 (0.0%) |
| Total | 0 (0.0%) | 6 (100.0%) |
Fertility by Education in La Plata
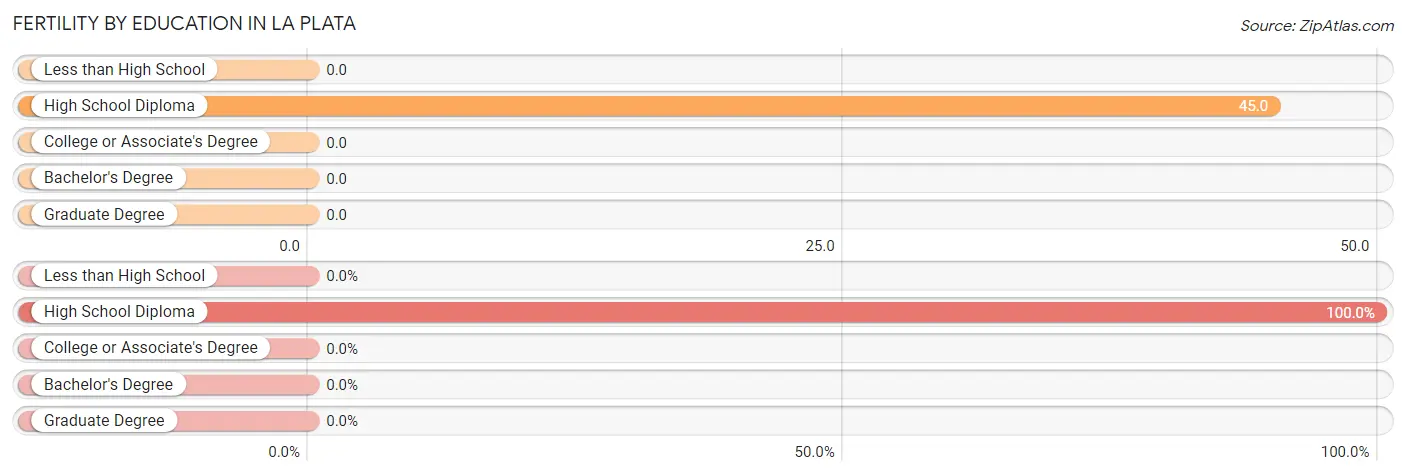
| Educational Attainment | Women with Births | Births / 1,000 Women |
| Less than High School | 0 (0.0%) | 0.0 |
| High School Diploma | 6 (100.0%) | 45.0 |
| College or Associate's Degree | 0 (0.0%) | 0.0 |
| Bachelor's Degree | 0 (0.0%) | 0.0 |
| Graduate Degree | 0 (0.0%) | 0.0 |
| Total | 6 (100.0%) | 21.0 |
Fertility by Education by Marriage Status in La Plata
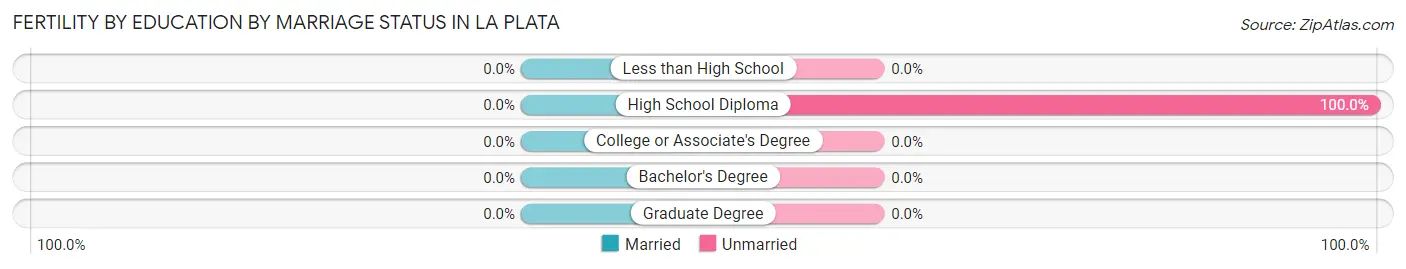
| Educational Attainment | Married | Unmarried |
| Less than High School | 0 (0.0%) | 0 (0.0%) |
| High School Diploma | 0 (0.0%) | 6 (100.0%) |
| College or Associate's Degree | 0 (0.0%) | 0 (0.0%) |
| Bachelor's Degree | 0 (0.0%) | 0 (0.0%) |
| Graduate Degree | 0 (0.0%) | 0 (0.0%) |
| Total | 0 (0.0%) | 6 (100.0%) |
Employment Characteristics in La Plata
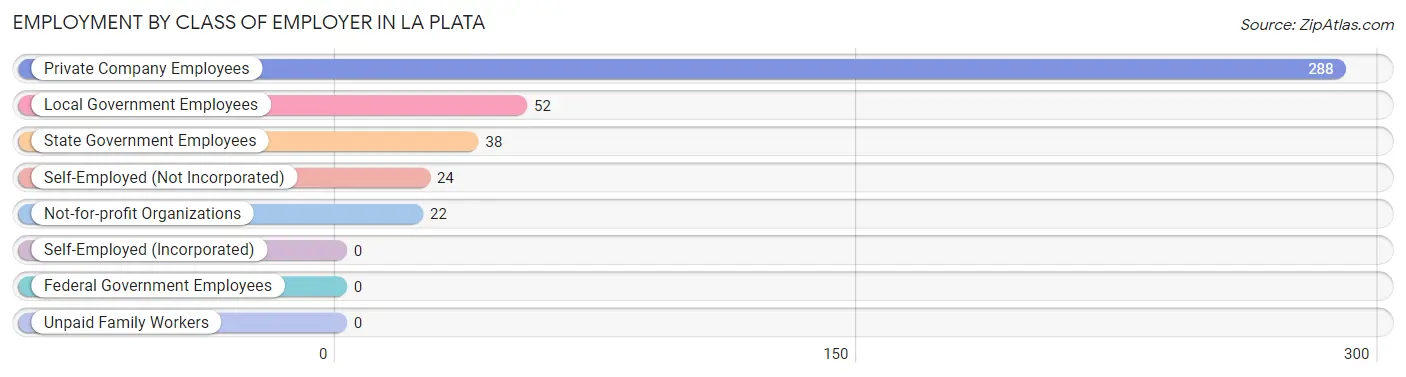
Employment by Class of Employer in La Plata
Among the 424 employed individuals in La Plata, private company employees (288 | 67.9%), local government employees (52 | 12.3%), and state government employees (38 | 9.0%) make up the most common classes of employment.
| Employer Class | # Employees | % Employees |
| Private Company Employees | 288 | 67.9% |
| Self-Employed (Incorporated) | 0 | 0.0% |
| Self-Employed (Not Incorporated) | 24 | 5.7% |
| Not-for-profit Organizations | 22 | 5.2% |
| Local Government Employees | 52 | 12.3% |
| State Government Employees | 38 | 9.0% |
| Federal Government Employees | 0 | 0.0% |
| Unpaid Family Workers | 0 | 0.0% |
| Total | 424 | 100.0% |
Employment Status by Age in La Plata
According to the labor force statistics for La Plata, out of the total population over 16 years of age (1,062), 44.5% or 473 individuals are in the labor force, with 6.3% or 30 of them unemployed. The age group with the highest labor force participation rate is 25 to 29 years, with 100.0% or 47 individuals in the labor force. Within the labor force, the 20 to 24 years age range has the highest percentage of unemployed individuals, with 40.5% or 15 of them being unemployed.
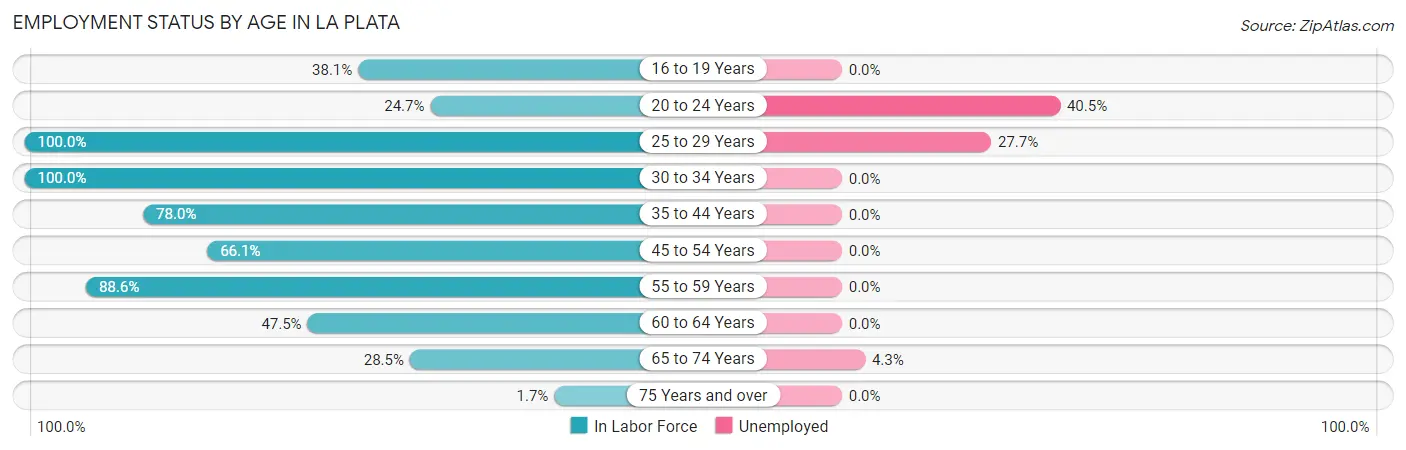
| Age Bracket | In Labor Force | Unemployed |
| 16 to 19 Years | 16 (38.1%) | 0 (0.0%) |
| 20 to 24 Years | 37 (24.7%) | 15 (40.5%) |
| 25 to 29 Years | 47 (100.0%) | 13 (27.7%) |
| 30 to 34 Years | 77 (100.0%) | 0 (0.0%) |
| 35 to 44 Years | 78 (78.0%) | 0 (0.0%) |
| 45 to 54 Years | 117 (66.1%) | 0 (0.0%) |
| 55 to 59 Years | 31 (88.6%) | 0 (0.0%) |
| 60 to 64 Years | 19 (47.5%) | 0 (0.0%) |
| 65 to 74 Years | 47 (28.5%) | 2 (4.3%) |
| 75 Years and over | 4 (1.7%) | 0 (0.0%) |
| Total | 473 (44.5%) | 30 (6.3%) |
Employment Status by Educational Attainment in La Plata
According to labor force statistics for La Plata, 77.5% of individuals (369) out of the total population between 25 and 64 years of age (476) are in the labor force, with 3.5% or 13 of them being unemployed. The group with the highest labor force participation rate are those with the educational attainment of bachelor's degree or higher, with 100.0% or 112 individuals in the labor force. Within the labor force, individuals with high school diploma education have the highest percentage of unemployment, with 10.7% or 13 of them being unemployed.
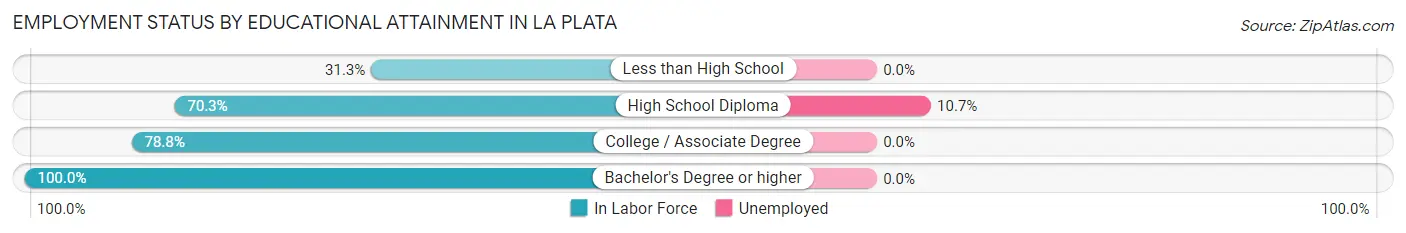
| Educational Attainment | In Labor Force | Unemployed |
| Less than High School | 10 (31.3%) | 0 (0.0%) |
| High School Diploma | 121 (70.3%) | 18 (10.7%) |
| College / Associate Degree | 126 (78.8%) | 0 (0.0%) |
| Bachelor's Degree or higher | 112 (100.0%) | 0 (0.0%) |
| Total | 369 (77.5%) | 17 (3.5%) |
Employment Occupations by Sex in La Plata
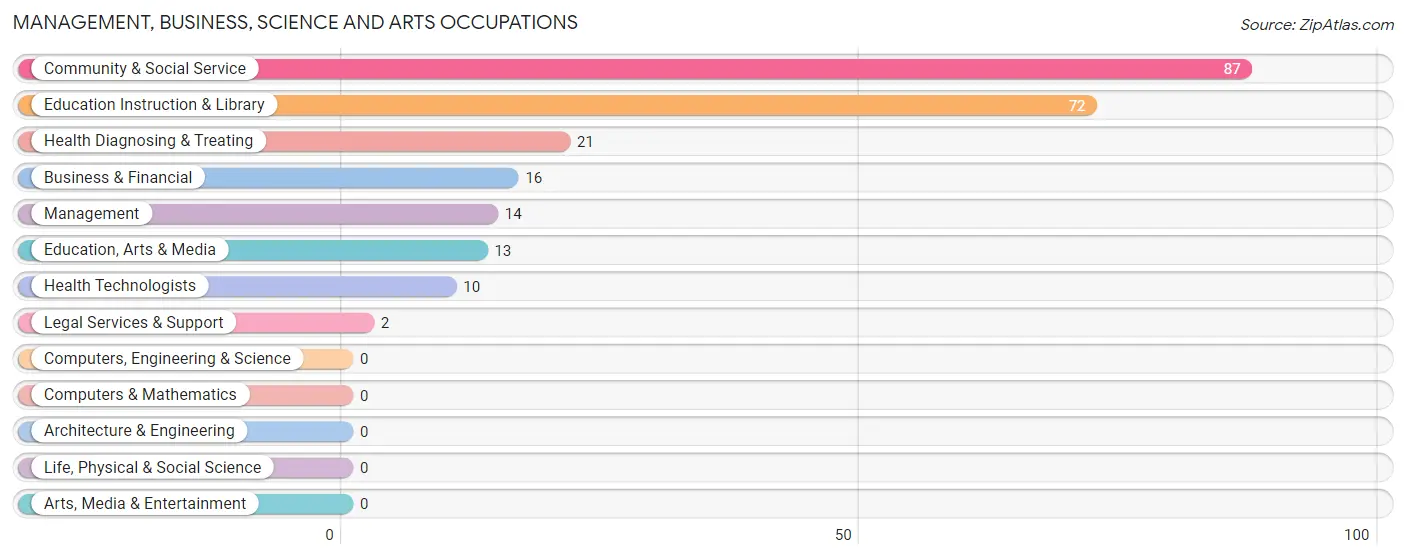
Management, Business, Science and Arts Occupations
The most common Management, Business, Science and Arts occupations in La Plata are Community & Social Service (87 | 19.6%), Education Instruction & Library (72 | 16.3%), Health Diagnosing & Treating (21 | 4.7%), Business & Financial (16 | 3.6%), and Management (14 | 3.2%).
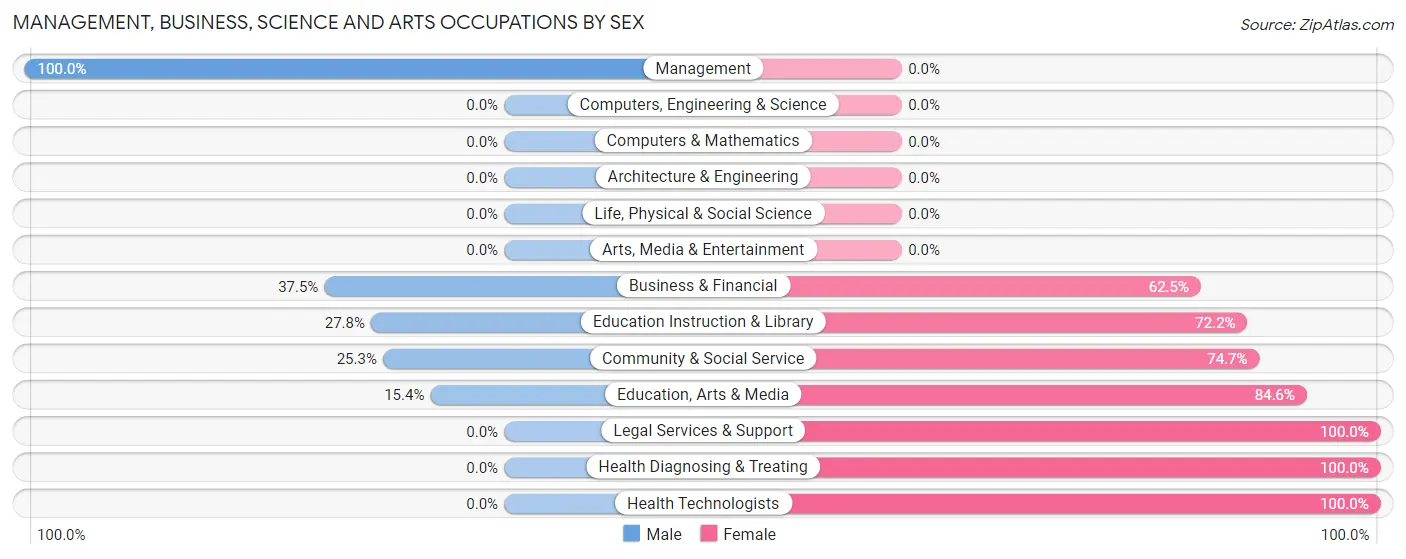
Management, Business, Science and Arts Occupations by Sex
Within the Management, Business, Science and Arts occupations in La Plata, the most male-oriented occupations are Management (100.0%), Business & Financial (37.5%), and Education Instruction & Library (27.8%), while the most female-oriented occupations are Legal Services & Support (100.0%), Health Diagnosing & Treating (100.0%), and Health Technologists (100.0%).
| Occupation | Male | Female |
| Management | 14 (100.0%) | 0 (0.0%) |
| Business & Financial | 6 (37.5%) | 10 (62.5%) |
| Computers, Engineering & Science | 0 (0.0%) | 0 (0.0%) |
| Computers & Mathematics | 0 (0.0%) | 0 (0.0%) |
| Architecture & Engineering | 0 (0.0%) | 0 (0.0%) |
| Life, Physical & Social Science | 0 (0.0%) | 0 (0.0%) |
| Community & Social Service | 22 (25.3%) | 65 (74.7%) |
| Education, Arts & Media | 2 (15.4%) | 11 (84.6%) |
| Legal Services & Support | 0 (0.0%) | 2 (100.0%) |
| Education Instruction & Library | 20 (27.8%) | 52 (72.2%) |
| Arts, Media & Entertainment | 0 (0.0%) | 0 (0.0%) |
| Health Diagnosing & Treating | 0 (0.0%) | 21 (100.0%) |
| Health Technologists | 0 (0.0%) | 10 (100.0%) |
| Total (Category) | 42 (30.4%) | 96 (69.6%) |
| Total (Overall) | 225 (50.8%) | 218 (49.2%) |
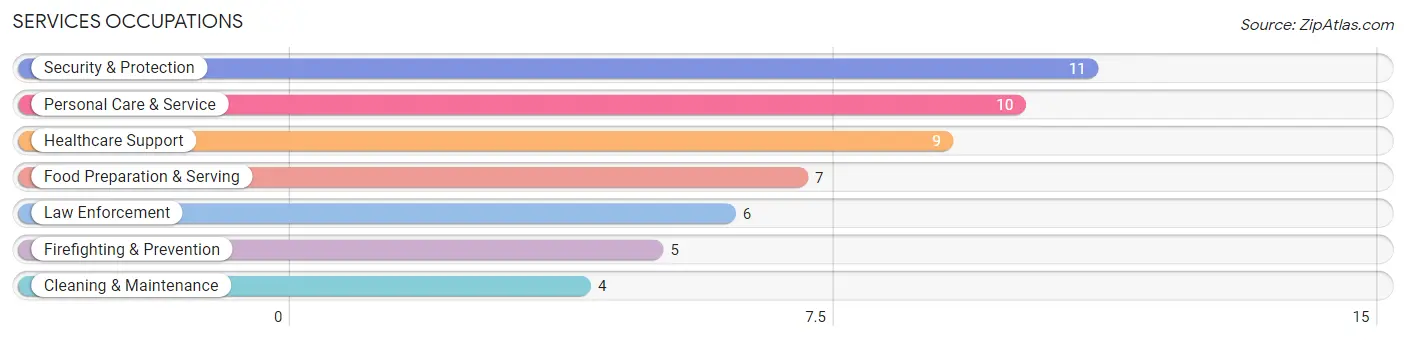
Services Occupations
The most common Services occupations in La Plata are Security & Protection (11 | 2.5%), Personal Care & Service (10 | 2.3%), Healthcare Support (9 | 2.0%), Food Preparation & Serving (7 | 1.6%), and Law Enforcement (6 | 1.3%).
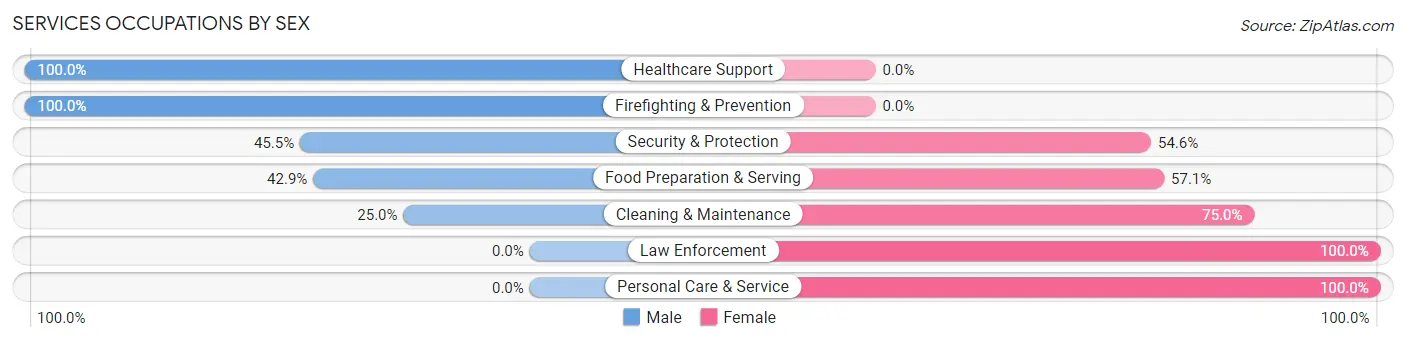
Services Occupations by Sex
Within the Services occupations in La Plata, the most male-oriented occupations are Healthcare Support (100.0%), Firefighting & Prevention (100.0%), and Security & Protection (45.5%), while the most female-oriented occupations are Law Enforcement (100.0%), Personal Care & Service (100.0%), and Cleaning & Maintenance (75.0%).
| Occupation | Male | Female |
| Healthcare Support | 9 (100.0%) | 0 (0.0%) |
| Security & Protection | 5 (45.5%) | 6 (54.5%) |
| Firefighting & Prevention | 5 (100.0%) | 0 (0.0%) |
| Law Enforcement | 0 (0.0%) | 6 (100.0%) |
| Food Preparation & Serving | 3 (42.9%) | 4 (57.1%) |
| Cleaning & Maintenance | 1 (25.0%) | 3 (75.0%) |
| Personal Care & Service | 0 (0.0%) | 10 (100.0%) |
| Total (Category) | 18 (43.9%) | 23 (56.1%) |
| Total (Overall) | 225 (50.8%) | 218 (49.2%) |
Sales and Office Occupations
The most common Sales and Office occupations in La Plata are Sales & Related (84 | 19.0%), and Office & Administration (50 | 11.3%).

Sales and Office Occupations by Sex

| Occupation | Male | Female |
| Sales & Related | 40 (47.6%) | 44 (52.4%) |
| Office & Administration | 19 (38.0%) | 31 (62.0%) |
| Total (Category) | 59 (44.0%) | 75 (56.0%) |
| Total (Overall) | 225 (50.8%) | 218 (49.2%) |
Natural Resources, Construction and Maintenance Occupations
The most common Natural Resources, Construction and Maintenance occupations in La Plata are Installation, Maintenance & Repair (20 | 4.5%), Farming, Fishing & Forestry (18 | 4.1%), and Construction & Extraction (14 | 3.2%).
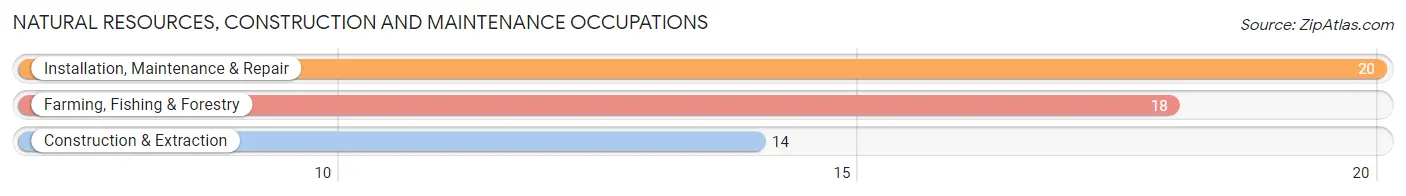
Natural Resources, Construction and Maintenance Occupations by Sex
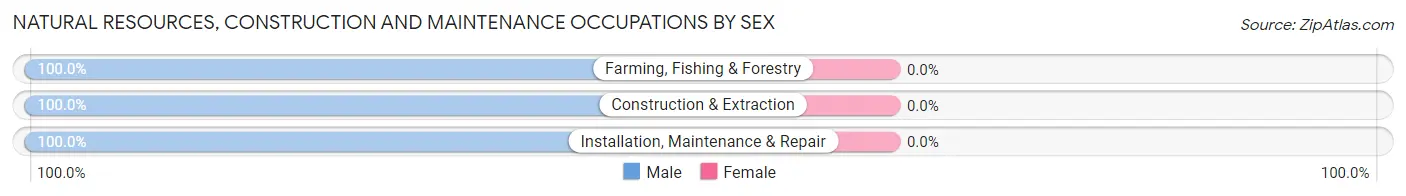
| Occupation | Male | Female |
| Farming, Fishing & Forestry | 18 (100.0%) | 0 (0.0%) |
| Construction & Extraction | 14 (100.0%) | 0 (0.0%) |
| Installation, Maintenance & Repair | 20 (100.0%) | 0 (0.0%) |
| Total (Category) | 52 (100.0%) | 0 (0.0%) |
| Total (Overall) | 225 (50.8%) | 218 (49.2%) |
Production, Transportation and Moving Occupations
The most common Production, Transportation and Moving occupations in La Plata are Production (34 | 7.7%), Transportation (30 | 6.8%), and Material Moving (14 | 3.2%).
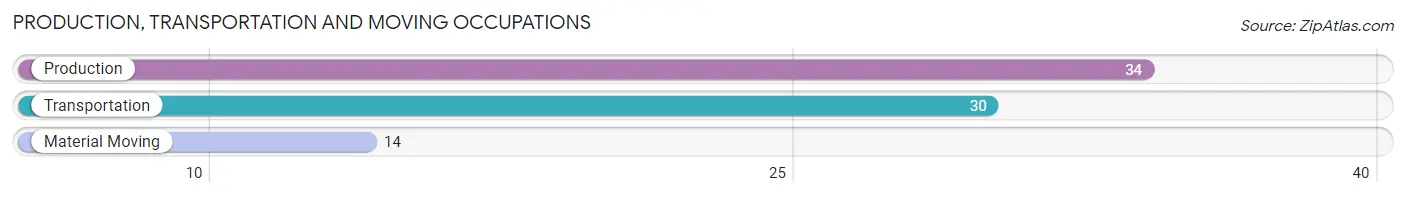
Production, Transportation and Moving Occupations by Sex
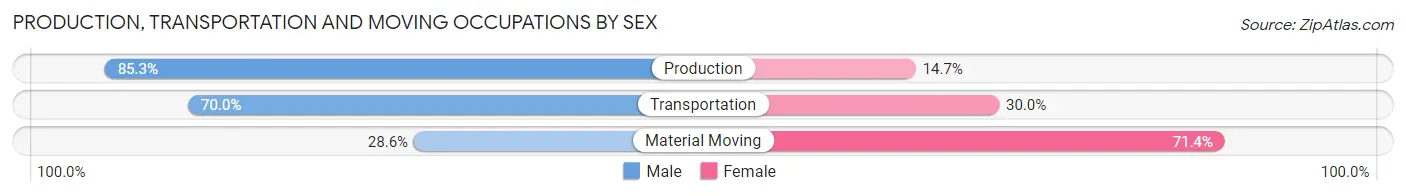
| Occupation | Male | Female |
| Production | 29 (85.3%) | 5 (14.7%) |
| Transportation | 21 (70.0%) | 9 (30.0%) |
| Material Moving | 4 (28.6%) | 10 (71.4%) |
| Total (Category) | 54 (69.2%) | 24 (30.8%) |
| Total (Overall) | 225 (50.8%) | 218 (49.2%) |
Employment Industries by Sex in La Plata
Employment Industries in La Plata
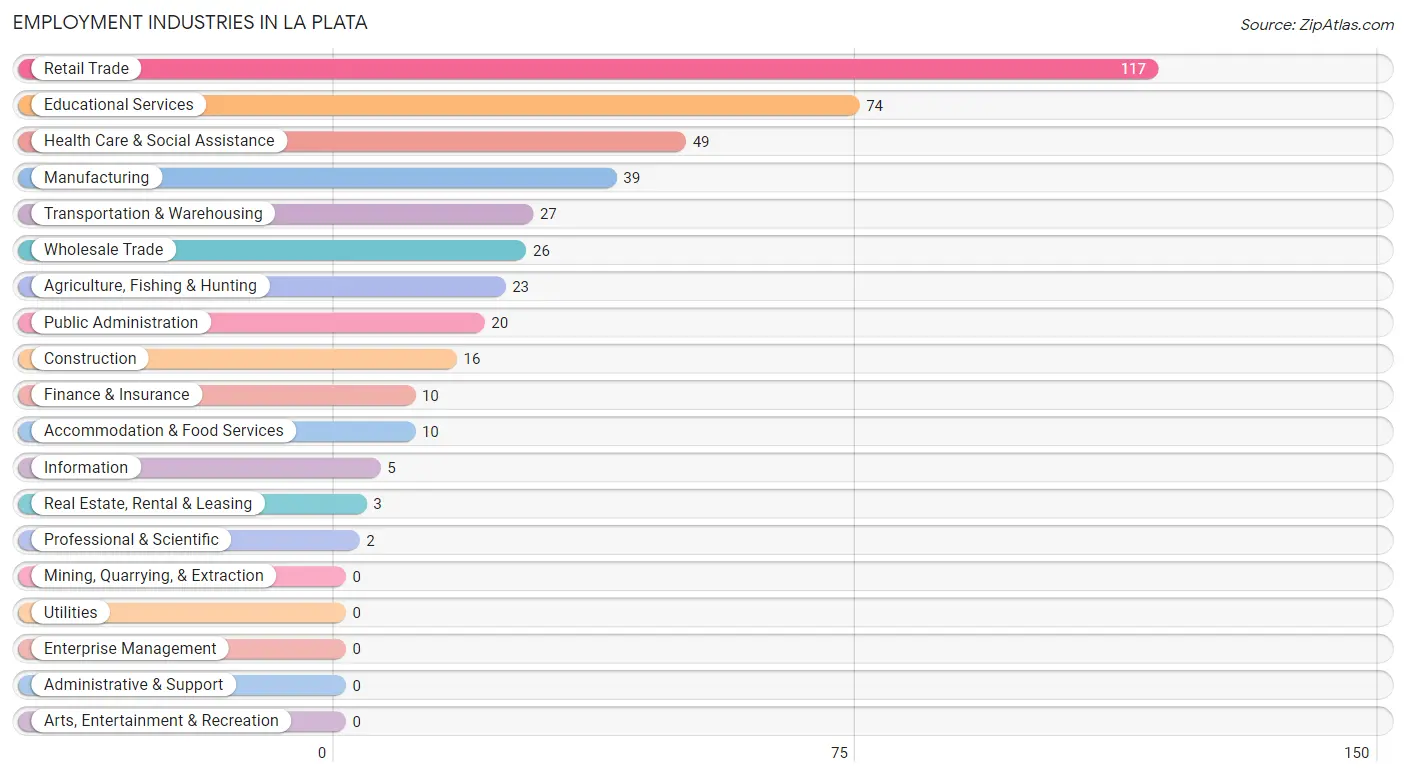
The major employment industries in La Plata include Retail Trade (117 | 26.4%), Educational Services (74 | 16.7%), Health Care & Social Assistance (49 | 11.1%), Manufacturing (39 | 8.8%), and Transportation & Warehousing (27 | 6.1%).
Employment Industries by Sex in La Plata
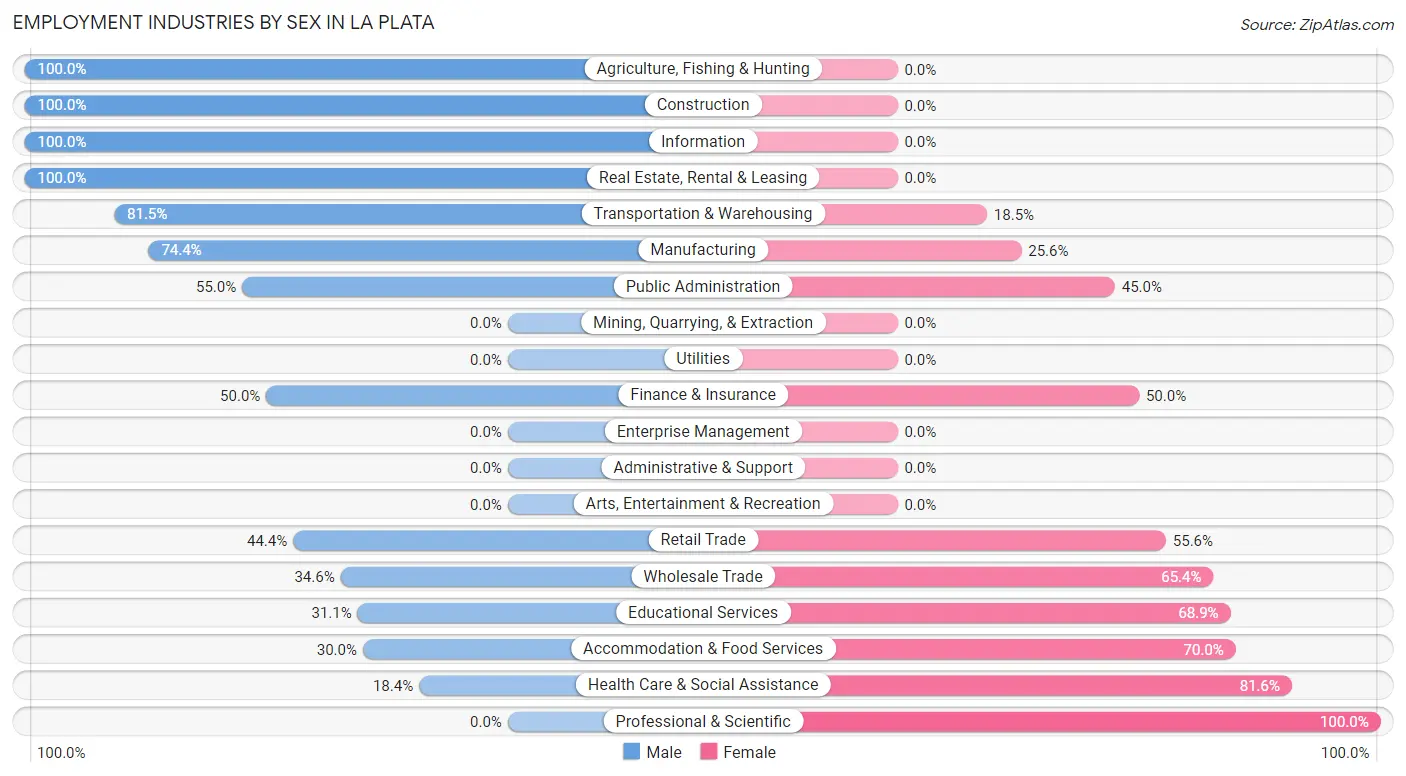
The La Plata industries that see more men than women are Agriculture, Fishing & Hunting (100.0%), Construction (100.0%), and Information (100.0%), whereas the industries that tend to have a higher number of women are Professional & Scientific (100.0%), Health Care & Social Assistance (81.6%), and Accommodation & Food Services (70.0%).
| Industry | Male | Female |
| Agriculture, Fishing & Hunting | 23 (100.0%) | 0 (0.0%) |
| Mining, Quarrying, & Extraction | 0 (0.0%) | 0 (0.0%) |
| Construction | 16 (100.0%) | 0 (0.0%) |
| Manufacturing | 29 (74.4%) | 10 (25.6%) |
| Wholesale Trade | 9 (34.6%) | 17 (65.4%) |
| Retail Trade | 52 (44.4%) | 65 (55.6%) |
| Transportation & Warehousing | 22 (81.5%) | 5 (18.5%) |
| Utilities | 0 (0.0%) | 0 (0.0%) |
| Information | 5 (100.0%) | 0 (0.0%) |
| Finance & Insurance | 5 (50.0%) | 5 (50.0%) |
| Real Estate, Rental & Leasing | 3 (100.0%) | 0 (0.0%) |
| Professional & Scientific | 0 (0.0%) | 2 (100.0%) |
| Enterprise Management | 0 (0.0%) | 0 (0.0%) |
| Administrative & Support | 0 (0.0%) | 0 (0.0%) |
| Educational Services | 23 (31.1%) | 51 (68.9%) |
| Health Care & Social Assistance | 9 (18.4%) | 40 (81.6%) |
| Arts, Entertainment & Recreation | 0 (0.0%) | 0 (0.0%) |
| Accommodation & Food Services | 3 (30.0%) | 7 (70.0%) |
| Public Administration | 11 (55.0%) | 9 (45.0%) |
| Total | 225 (50.8%) | 218 (49.2%) |
Education in La Plata
School Enrollment in La Plata
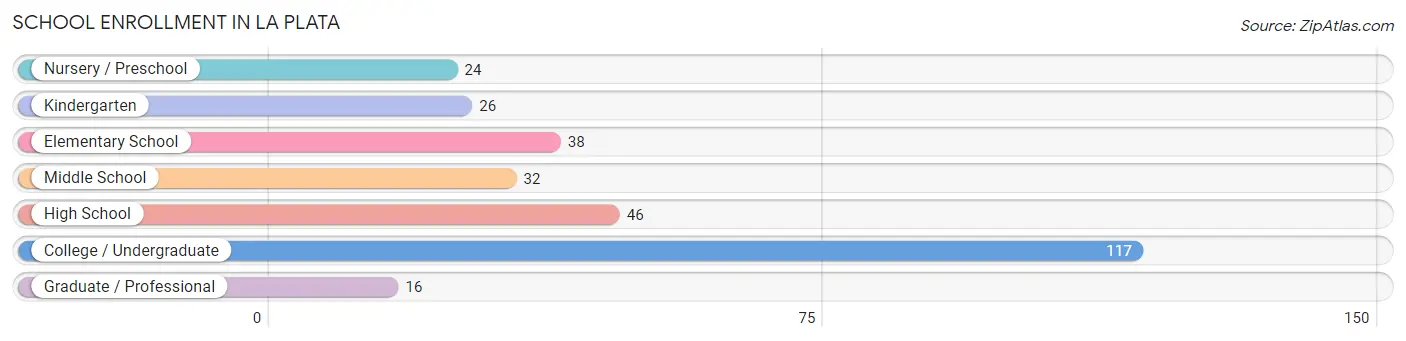
The most common levels of schooling among the 299 students in La Plata are college / undergraduate (117 | 39.1%), high school (46 | 15.4%), and elementary school (38 | 12.7%).
| School Level | # Students | % Students |
| Nursery / Preschool | 24 | 8.0% |
| Kindergarten | 26 | 8.7% |
| Elementary School | 38 | 12.7% |
| Middle School | 32 | 10.7% |
| High School | 46 | 15.4% |
| College / Undergraduate | 117 | 39.1% |
| Graduate / Professional | 16 | 5.3% |
| Total | 299 | 100.0% |
School Enrollment by Age by Funding Source in La Plata
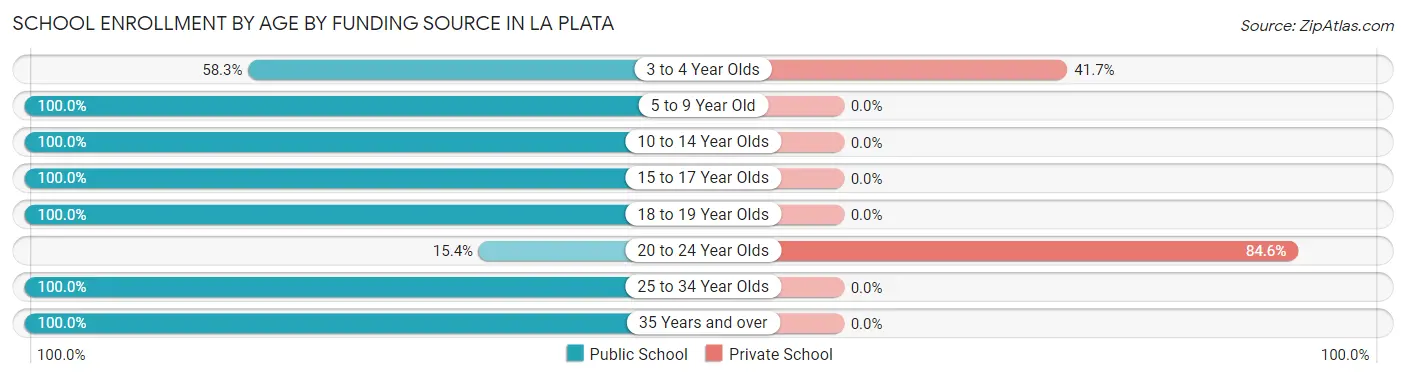
Out of a total of 299 students who are enrolled in schools in La Plata, 87 (29.1%) attend a private institution, while the remaining 212 (70.9%) are enrolled in public schools. The age group of 20 to 24 year olds has the highest likelihood of being enrolled in private schools, with 77 (84.6% in the age bracket) enrolled. Conversely, the age group of 5 to 9 year old has the lowest likelihood of being enrolled in a private school, with 66 (100.0% in the age bracket) attending a public institution.
| Age Bracket | Public School | Private School |
| 3 to 4 Year Olds | 14 (58.3%) | 10 (41.7%) |
| 5 to 9 Year Old | 66 (100.0%) | 0 (0.0%) |
| 10 to 14 Year Olds | 45 (100.0%) | 0 (0.0%) |
| 15 to 17 Year Olds | 31 (100.0%) | 0 (0.0%) |
| 18 to 19 Year Olds | 17 (100.0%) | 0 (0.0%) |
| 20 to 24 Year Olds | 14 (15.4%) | 77 (84.6%) |
| 25 to 34 Year Olds | 12 (100.0%) | 0 (0.0%) |
| 35 Years and over | 13 (100.0%) | 0 (0.0%) |
| Total | 212 (70.9%) | 87 (29.1%) |
Educational Attainment by Field of Study in La Plata
Education (62 | 38.3%), arts & humanities (22 | 13.6%), psychology (17 | 10.5%), business (16 | 9.9%), and science & technology (13 | 8.0%) are the most common fields of study among 162 individuals in La Plata who have obtained a bachelor's degree or higher.
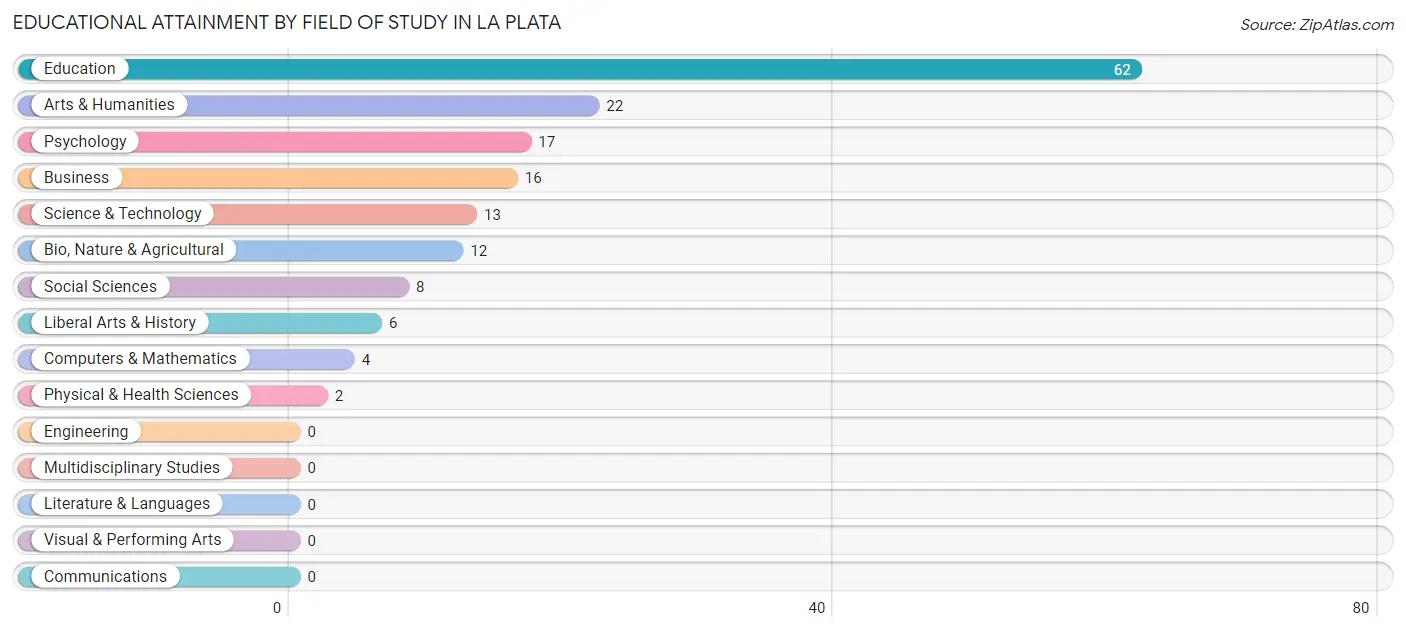
| Field of Study | # Graduates | % Graduates |
| Computers & Mathematics | 4 | 2.5% |
| Bio, Nature & Agricultural | 12 | 7.4% |
| Physical & Health Sciences | 2 | 1.2% |
| Psychology | 17 | 10.5% |
| Social Sciences | 8 | 4.9% |
| Engineering | 0 | 0.0% |
| Multidisciplinary Studies | 0 | 0.0% |
| Science & Technology | 13 | 8.0% |
| Business | 16 | 9.9% |
| Education | 62 | 38.3% |
| Literature & Languages | 0 | 0.0% |
| Liberal Arts & History | 6 | 3.7% |
| Visual & Performing Arts | 0 | 0.0% |
| Communications | 0 | 0.0% |
| Arts & Humanities | 22 | 13.6% |
| Total | 162 | 100.0% |
Transportation & Commute in La Plata
Vehicle Availability by Sex in La Plata
The most prevalent vehicle ownership categories in La Plata are males with 2 vehicles (72, accounting for 34.4%) and females with 2 vehicles (97, making up 33.5%).
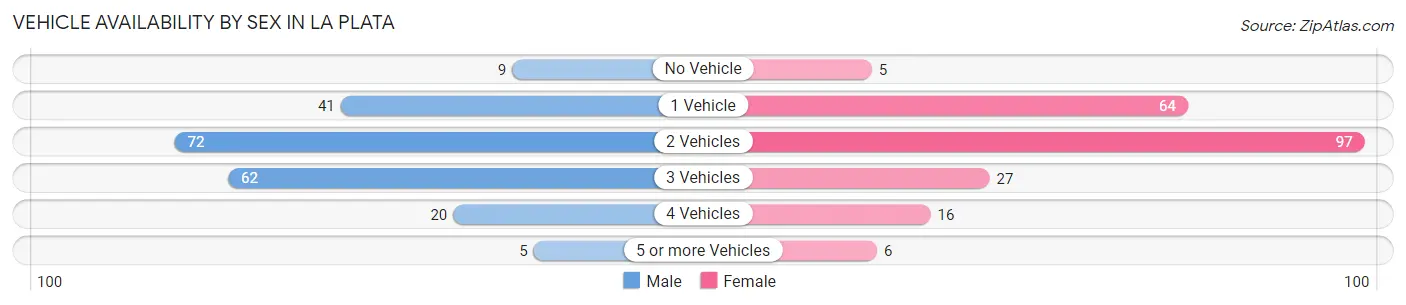
| Vehicles Available | Male | Female |
| No Vehicle | 9 (4.3%) | 5 (2.3%) |
| 1 Vehicle | 41 (19.6%) | 64 (29.8%) |
| 2 Vehicles | 72 (34.4%) | 97 (45.1%) |
| 3 Vehicles | 62 (29.7%) | 27 (12.6%) |
| 4 Vehicles | 20 (9.6%) | 16 (7.4%) |
| 5 or more Vehicles | 5 (2.4%) | 6 (2.8%) |
| Total | 209 (100.0%) | 215 (100.0%) |
Commute Time in La Plata
The most frequently occuring commute durations in La Plata are 20 to 24 minutes (124 commuters, 30.0%), 15 to 19 minutes (96 commuters, 23.2%), and 30 to 34 minutes (46 commuters, 11.1%).
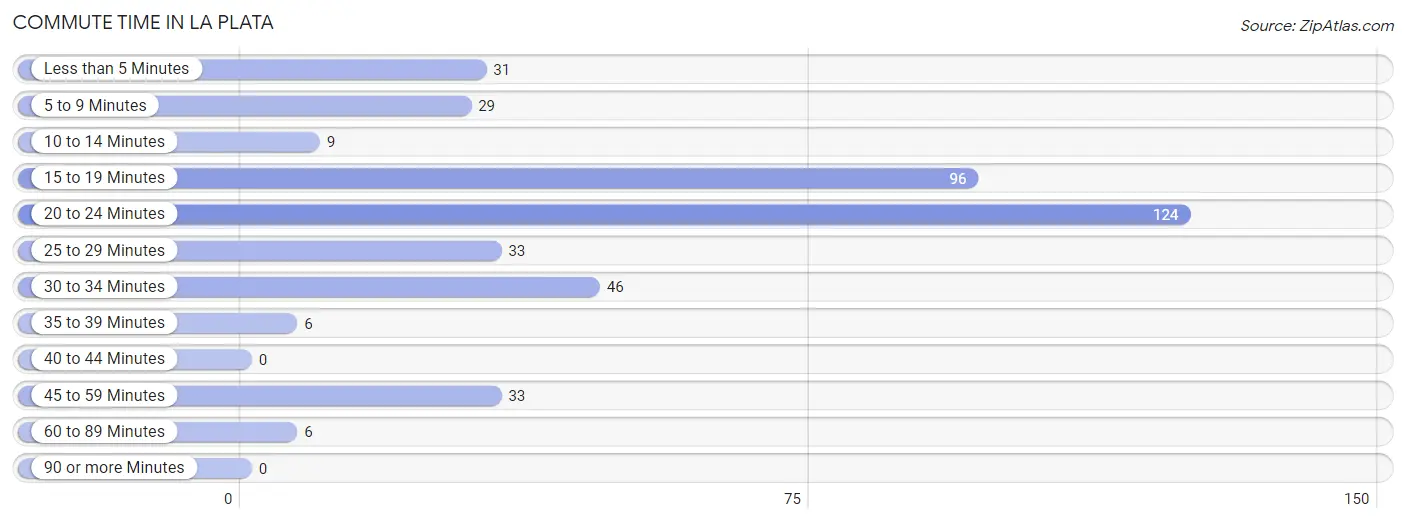
| Commute Time | # Commuters | % Commuters |
| Less than 5 Minutes | 31 | 7.5% |
| 5 to 9 Minutes | 29 | 7.0% |
| 10 to 14 Minutes | 9 | 2.2% |
| 15 to 19 Minutes | 96 | 23.2% |
| 20 to 24 Minutes | 124 | 30.0% |
| 25 to 29 Minutes | 33 | 8.0% |
| 30 to 34 Minutes | 46 | 11.1% |
| 35 to 39 Minutes | 6 | 1.5% |
| 40 to 44 Minutes | 0 | 0.0% |
| 45 to 59 Minutes | 33 | 8.0% |
| 60 to 89 Minutes | 6 | 1.5% |
| 90 or more Minutes | 0 | 0.0% |
Commute Time by Sex in La Plata
The most common commute times in La Plata are 15 to 19 minutes (45 commuters, 22.0%) for males and 20 to 24 minutes (98 commuters, 47.1%) for females.
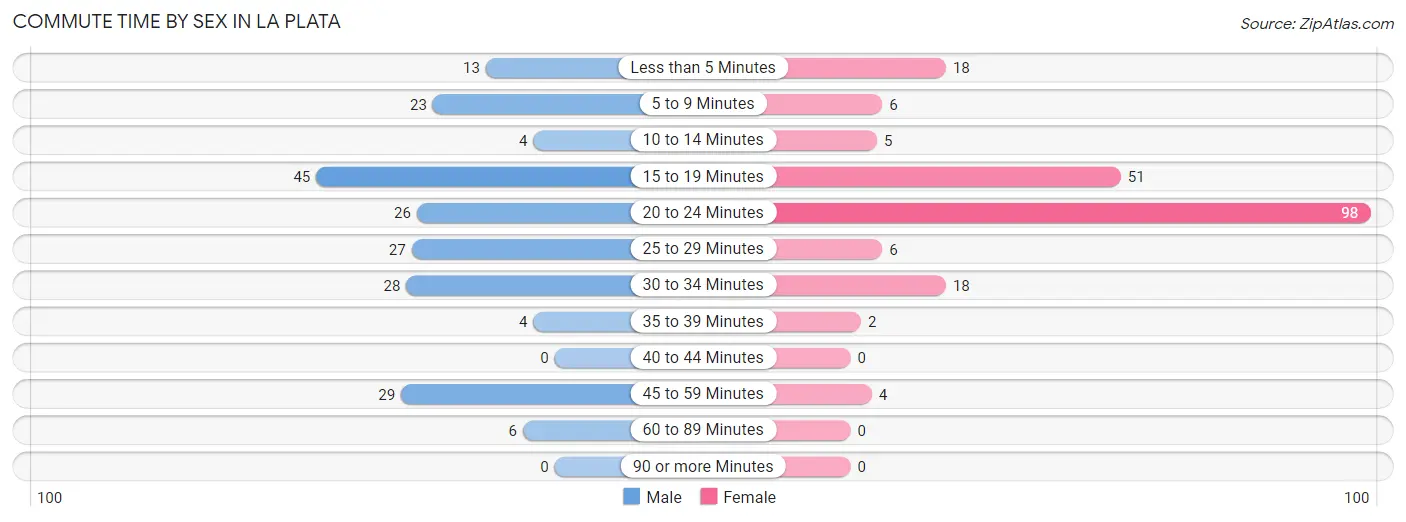
| Commute Time | Male | Female |
| Less than 5 Minutes | 13 (6.3%) | 18 (8.6%) |
| 5 to 9 Minutes | 23 (11.2%) | 6 (2.9%) |
| 10 to 14 Minutes | 4 (1.9%) | 5 (2.4%) |
| 15 to 19 Minutes | 45 (22.0%) | 51 (24.5%) |
| 20 to 24 Minutes | 26 (12.7%) | 98 (47.1%) |
| 25 to 29 Minutes | 27 (13.2%) | 6 (2.9%) |
| 30 to 34 Minutes | 28 (13.7%) | 18 (8.6%) |
| 35 to 39 Minutes | 4 (1.9%) | 2 (1.0%) |
| 40 to 44 Minutes | 0 (0.0%) | 0 (0.0%) |
| 45 to 59 Minutes | 29 (14.1%) | 4 (1.9%) |
| 60 to 89 Minutes | 6 (2.9%) | 0 (0.0%) |
| 90 or more Minutes | 0 (0.0%) | 0 (0.0%) |
Time of Departure to Work by Sex in La Plata
The most frequent times of departure to work in La Plata are 7:00 AM to 7:29 AM (46, 22.4%) for males and 7:30 AM to 7:59 AM (68, 32.7%) for females.
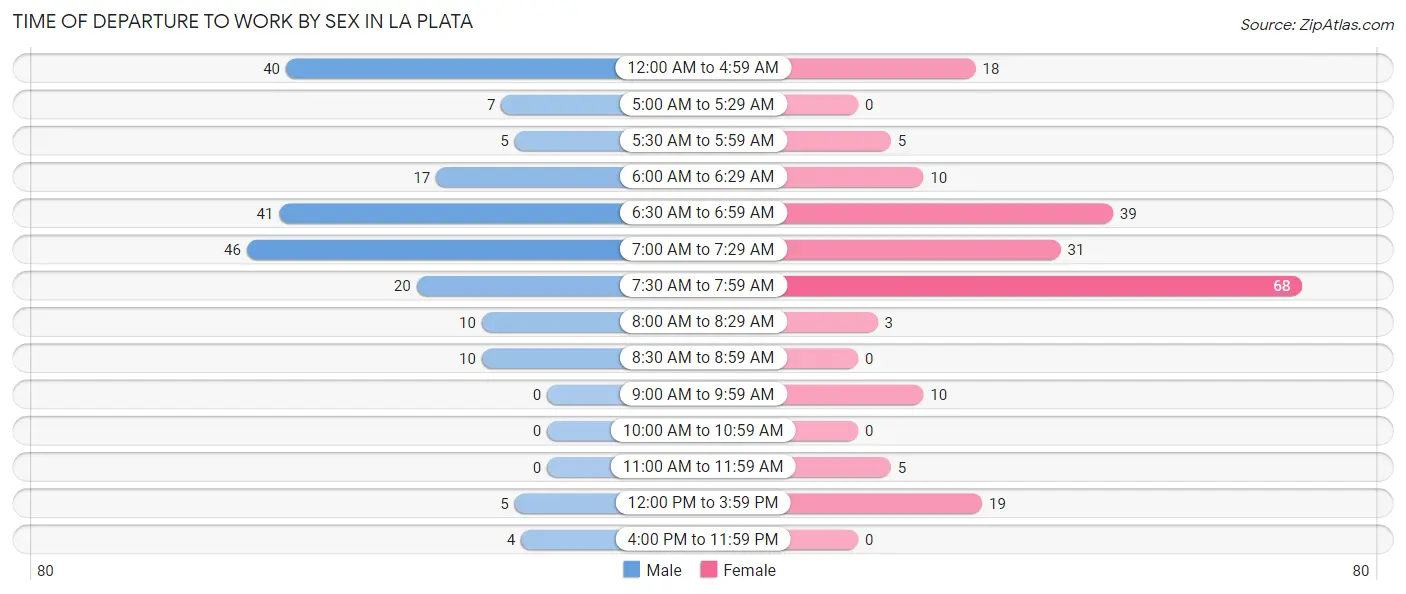
| Time of Departure | Male | Female |
| 12:00 AM to 4:59 AM | 40 (19.5%) | 18 (8.6%) |
| 5:00 AM to 5:29 AM | 7 (3.4%) | 0 (0.0%) |
| 5:30 AM to 5:59 AM | 5 (2.4%) | 5 (2.4%) |
| 6:00 AM to 6:29 AM | 17 (8.3%) | 10 (4.8%) |
| 6:30 AM to 6:59 AM | 41 (20.0%) | 39 (18.8%) |
| 7:00 AM to 7:29 AM | 46 (22.4%) | 31 (14.9%) |
| 7:30 AM to 7:59 AM | 20 (9.8%) | 68 (32.7%) |
| 8:00 AM to 8:29 AM | 10 (4.9%) | 3 (1.4%) |
| 8:30 AM to 8:59 AM | 10 (4.9%) | 0 (0.0%) |
| 9:00 AM to 9:59 AM | 0 (0.0%) | 10 (4.8%) |
| 10:00 AM to 10:59 AM | 0 (0.0%) | 0 (0.0%) |
| 11:00 AM to 11:59 AM | 0 (0.0%) | 5 (2.4%) |
| 12:00 PM to 3:59 PM | 5 (2.4%) | 19 (9.1%) |
| 4:00 PM to 11:59 PM | 4 (1.9%) | 0 (0.0%) |
| Total | 205 (100.0%) | 208 (100.0%) |
Housing Occupancy in La Plata
Occupancy by Ownership in La Plata
Of the total 498 dwellings in La Plata, owner-occupied units account for 308 (61.9%), while renter-occupied units make up 190 (38.2%).
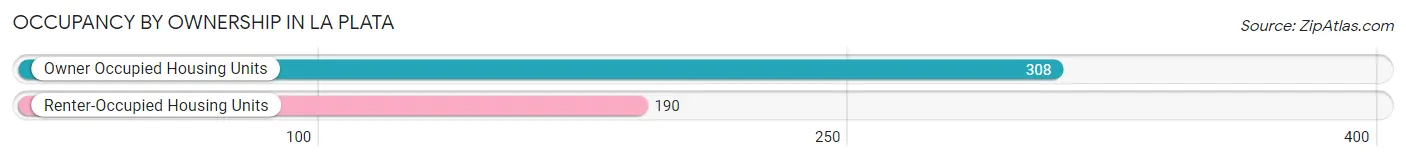
| Occupancy | # Housing Units | % Housing Units |
| Owner Occupied Housing Units | 308 | 61.9% |
| Renter-Occupied Housing Units | 190 | 38.2% |
| Total Occupied Housing Units | 498 | 100.0% |
Occupancy by Household Size in La Plata
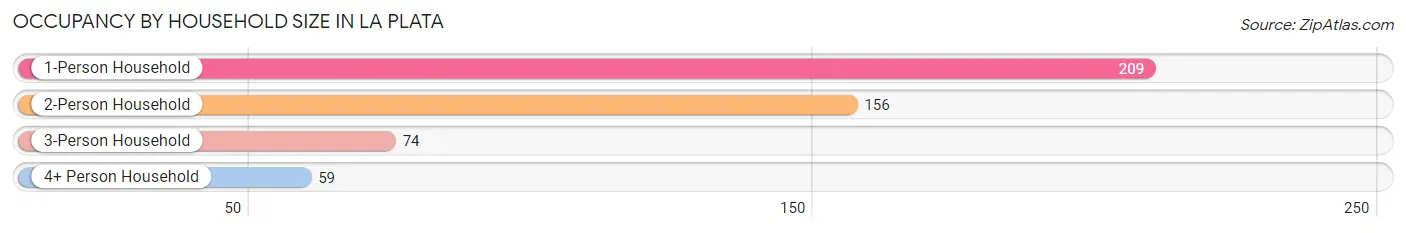
| Household Size | # Housing Units | % Housing Units |
| 1-Person Household | 209 | 42.0% |
| 2-Person Household | 156 | 31.3% |
| 3-Person Household | 74 | 14.9% |
| 4+ Person Household | 59 | 11.8% |
| Total Housing Units | 498 | 100.0% |
Occupancy by Ownership by Household Size in La Plata
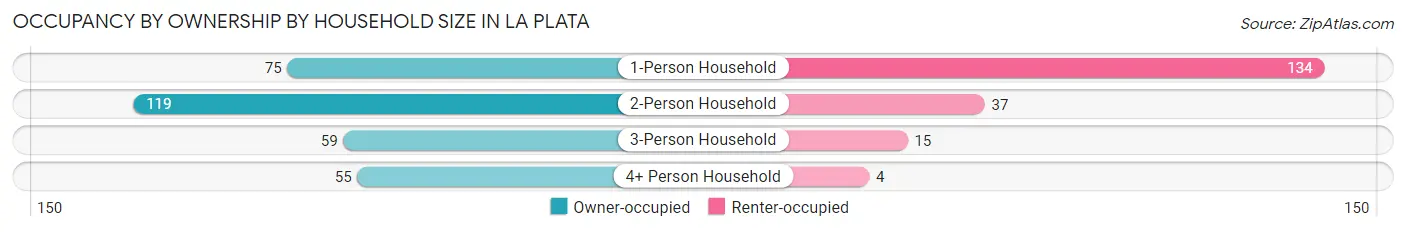
| Household Size | Owner-occupied | Renter-occupied |
| 1-Person Household | 75 (35.9%) | 134 (64.1%) |
| 2-Person Household | 119 (76.3%) | 37 (23.7%) |
| 3-Person Household | 59 (79.7%) | 15 (20.3%) |
| 4+ Person Household | 55 (93.2%) | 4 (6.8%) |
| Total Housing Units | 308 (61.9%) | 190 (38.2%) |
Occupancy by Educational Attainment in La Plata
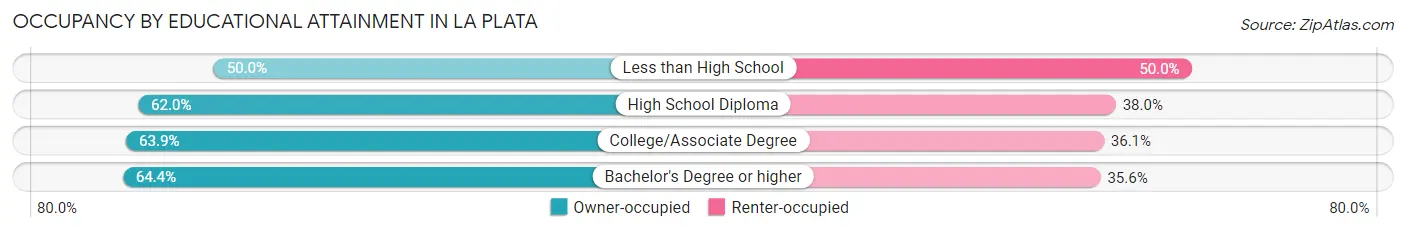
| Household Size | Owner-occupied | Renter-occupied |
| Less than High School | 25 (50.0%) | 25 (50.0%) |
| High School Diploma | 124 (62.0%) | 76 (38.0%) |
| College/Associate Degree | 92 (63.9%) | 52 (36.1%) |
| Bachelor's Degree or higher | 67 (64.4%) | 37 (35.6%) |
Occupancy by Age of Householder in La Plata
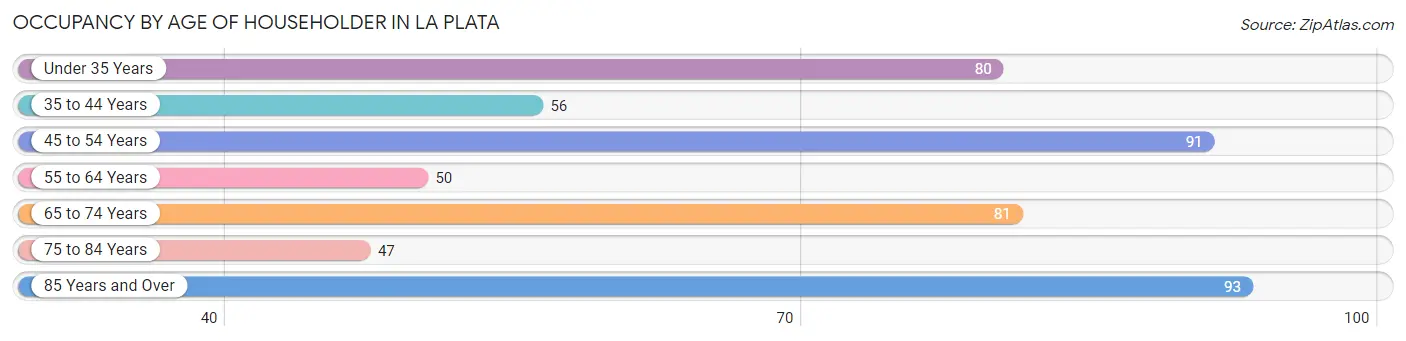
| Age Bracket | # Households | % Households |
| Under 35 Years | 80 | 16.1% |
| 35 to 44 Years | 56 | 11.2% |
| 45 to 54 Years | 91 | 18.3% |
| 55 to 64 Years | 50 | 10.0% |
| 65 to 74 Years | 81 | 16.3% |
| 75 to 84 Years | 47 | 9.4% |
| 85 Years and Over | 93 | 18.7% |
| Total | 498 | 100.0% |
Housing Finances in La Plata
Median Income by Occupancy in La Plata
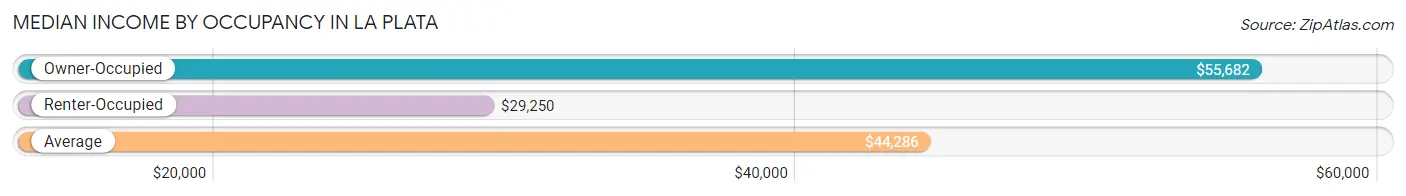
| Occupancy Type | # Households | Median Income |
| Owner-Occupied | 308 (61.9%) | $55,682 |
| Renter-Occupied | 190 (38.2%) | $29,250 |
| Average | 498 (100.0%) | $44,286 |
Occupancy by Householder Income Bracket in La Plata
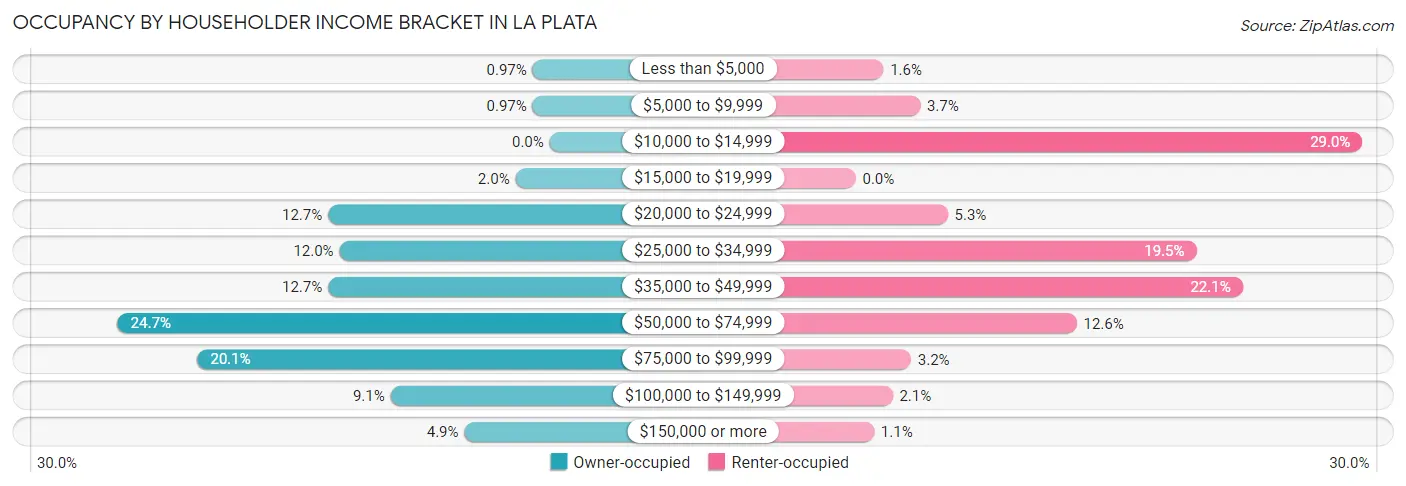
| Income Bracket | Owner-occupied | Renter-occupied |
| Less than $5,000 | 3 (1.0%) | 3 (1.6%) |
| $5,000 to $9,999 | 3 (1.0%) | 7 (3.7%) |
| $10,000 to $14,999 | 0 (0.0%) | 55 (28.9%) |
| $15,000 to $19,999 | 6 (1.9%) | 0 (0.0%) |
| $20,000 to $24,999 | 39 (12.7%) | 10 (5.3%) |
| $25,000 to $34,999 | 37 (12.0%) | 37 (19.5%) |
| $35,000 to $49,999 | 39 (12.7%) | 42 (22.1%) |
| $50,000 to $74,999 | 76 (24.7%) | 24 (12.6%) |
| $75,000 to $99,999 | 62 (20.1%) | 6 (3.2%) |
| $100,000 to $149,999 | 28 (9.1%) | 4 (2.1%) |
| $150,000 or more | 15 (4.9%) | 2 (1.1%) |
| Total | 308 (100.0%) | 190 (100.0%) |
Monthly Housing Cost Tiers in La Plata
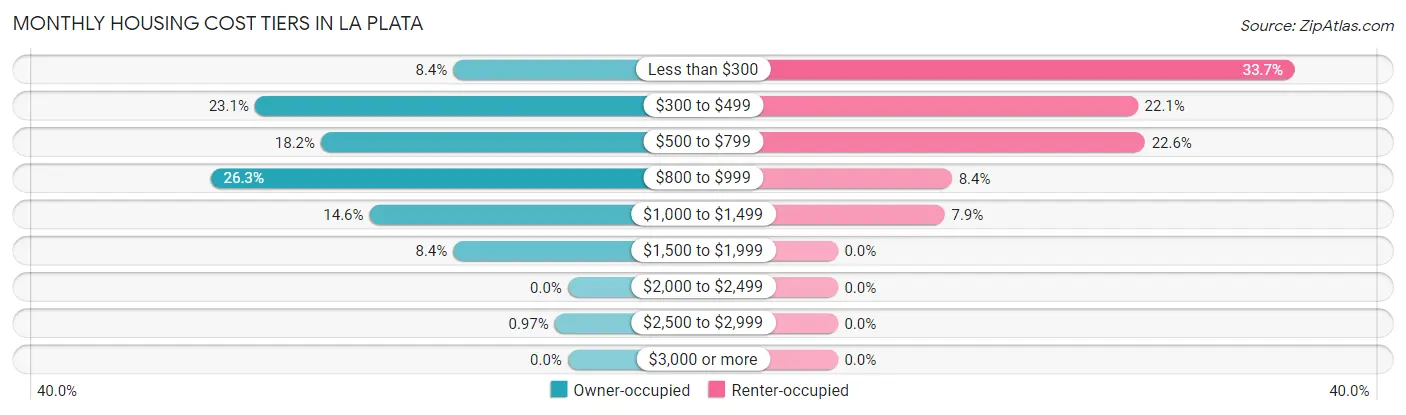
| Monthly Cost | Owner-occupied | Renter-occupied |
| Less than $300 | 26 (8.4%) | 64 (33.7%) |
| $300 to $499 | 71 (23.1%) | 42 (22.1%) |
| $500 to $799 | 56 (18.2%) | 43 (22.6%) |
| $800 to $999 | 81 (26.3%) | 16 (8.4%) |
| $1,000 to $1,499 | 45 (14.6%) | 15 (7.9%) |
| $1,500 to $1,999 | 26 (8.4%) | 0 (0.0%) |
| $2,000 to $2,499 | 0 (0.0%) | 0 (0.0%) |
| $2,500 to $2,999 | 3 (1.0%) | 0 (0.0%) |
| $3,000 or more | 0 (0.0%) | 0 (0.0%) |
| Total | 308 (100.0%) | 190 (100.0%) |
Physical Housing Characteristics in La Plata
Housing Structures in La Plata
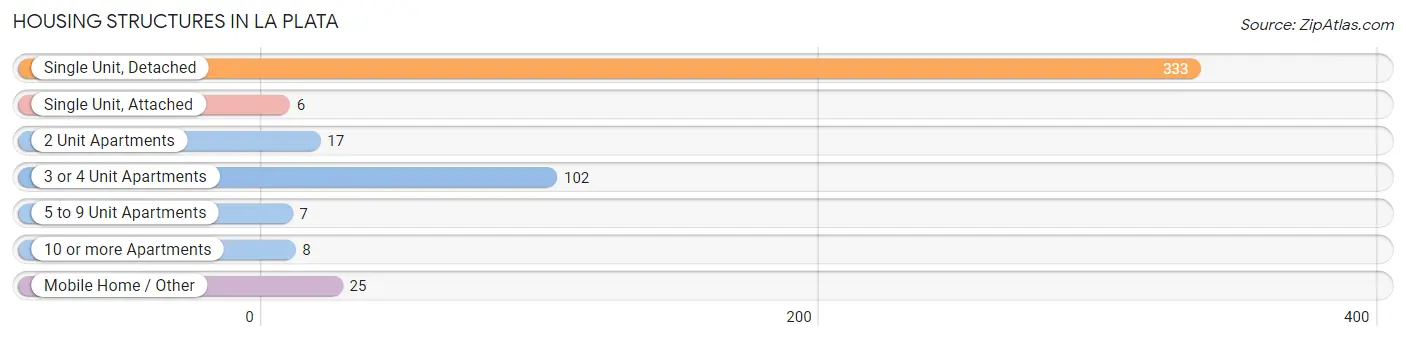
| Structure Type | # Housing Units | % Housing Units |
| Single Unit, Detached | 333 | 66.9% |
| Single Unit, Attached | 6 | 1.2% |
| 2 Unit Apartments | 17 | 3.4% |
| 3 or 4 Unit Apartments | 102 | 20.5% |
| 5 to 9 Unit Apartments | 7 | 1.4% |
| 10 or more Apartments | 8 | 1.6% |
| Mobile Home / Other | 25 | 5.0% |
| Total | 498 | 100.0% |
Housing Structures by Occupancy in La Plata
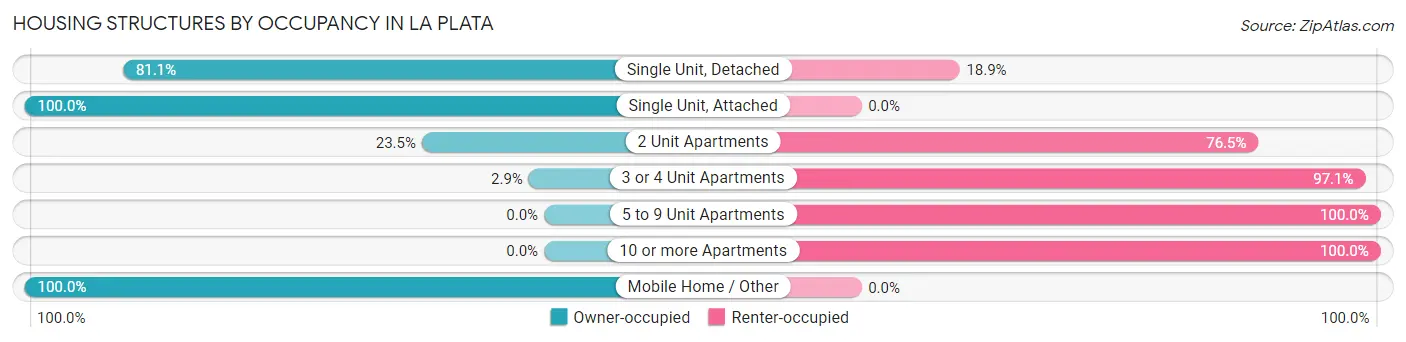
| Structure Type | Owner-occupied | Renter-occupied |
| Single Unit, Detached | 270 (81.1%) | 63 (18.9%) |
| Single Unit, Attached | 6 (100.0%) | 0 (0.0%) |
| 2 Unit Apartments | 4 (23.5%) | 13 (76.5%) |
| 3 or 4 Unit Apartments | 3 (2.9%) | 99 (97.1%) |
| 5 to 9 Unit Apartments | 0 (0.0%) | 7 (100.0%) |
| 10 or more Apartments | 0 (0.0%) | 8 (100.0%) |
| Mobile Home / Other | 25 (100.0%) | 0 (0.0%) |
| Total | 308 (61.9%) | 190 (38.2%) |
Housing Structures by Number of Rooms in La Plata
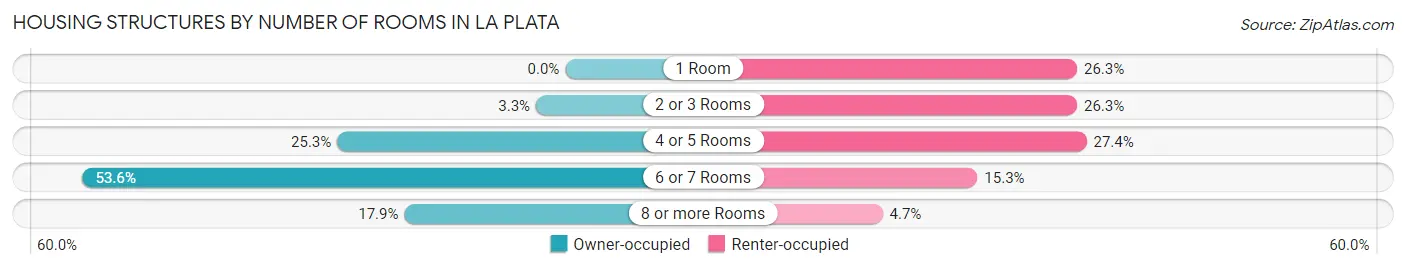
| Number of Rooms | Owner-occupied | Renter-occupied |
| 1 Room | 0 (0.0%) | 50 (26.3%) |
| 2 or 3 Rooms | 10 (3.3%) | 50 (26.3%) |
| 4 or 5 Rooms | 78 (25.3%) | 52 (27.4%) |
| 6 or 7 Rooms | 165 (53.6%) | 29 (15.3%) |
| 8 or more Rooms | 55 (17.9%) | 9 (4.7%) |
| Total | 308 (100.0%) | 190 (100.0%) |
Housing Structure by Heating Type in La Plata
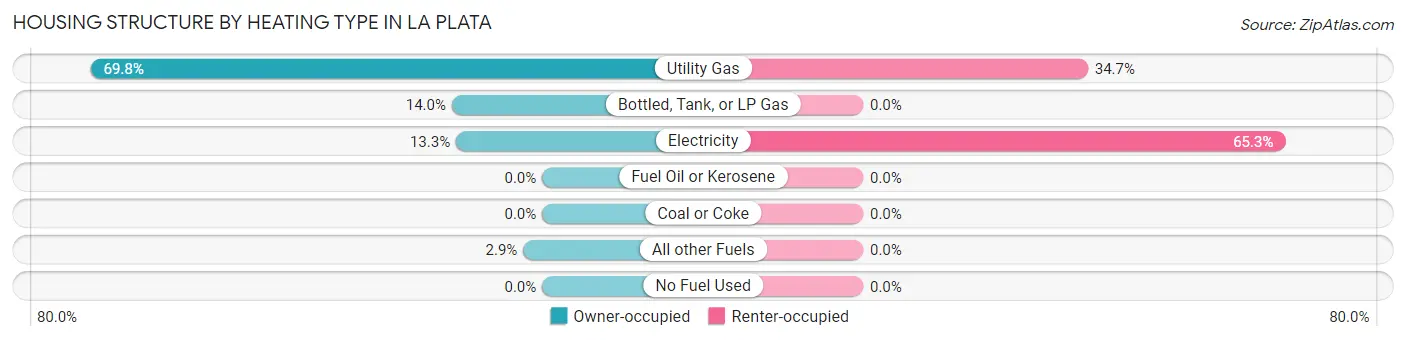
| Heating Type | Owner-occupied | Renter-occupied |
| Utility Gas | 215 (69.8%) | 66 (34.7%) |
| Bottled, Tank, or LP Gas | 43 (14.0%) | 0 (0.0%) |
| Electricity | 41 (13.3%) | 124 (65.3%) |
| Fuel Oil or Kerosene | 0 (0.0%) | 0 (0.0%) |
| Coal or Coke | 0 (0.0%) | 0 (0.0%) |
| All other Fuels | 9 (2.9%) | 0 (0.0%) |
| No Fuel Used | 0 (0.0%) | 0 (0.0%) |
| Total | 308 (100.0%) | 190 (100.0%) |
Household Vehicle Usage in La Plata
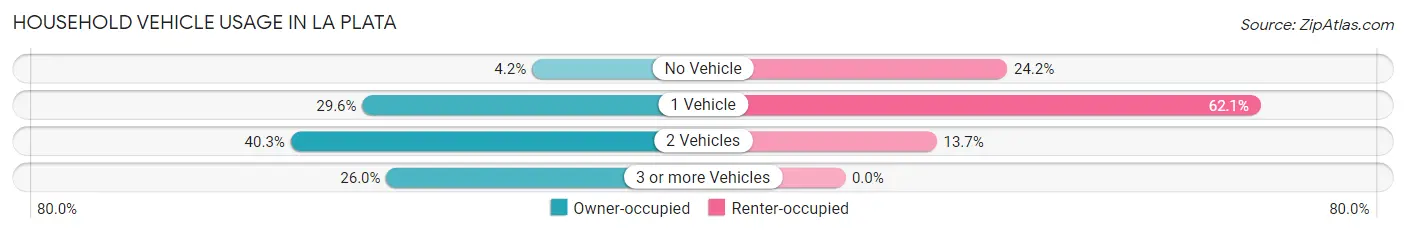
| Vehicles per Household | Owner-occupied | Renter-occupied |
| No Vehicle | 13 (4.2%) | 46 (24.2%) |
| 1 Vehicle | 91 (29.5%) | 118 (62.1%) |
| 2 Vehicles | 124 (40.3%) | 26 (13.7%) |
| 3 or more Vehicles | 80 (26.0%) | 0 (0.0%) |
| Total | 308 (100.0%) | 190 (100.0%) |
Real Estate & Mortgages in La Plata
Real Estate and Mortgage Overview in La Plata
| Characteristic | Without Mortgage | With Mortgage |
| Housing Units | 140 | 168 |
| Median Property Value | $94,400 | $89,200 |
| Median Household Income | $39,286 | $14 |
| Monthly Housing Costs | $404 | $0 |
| Real Estate Taxes | $893 | $4 |
Property Value by Mortgage Status in La Plata
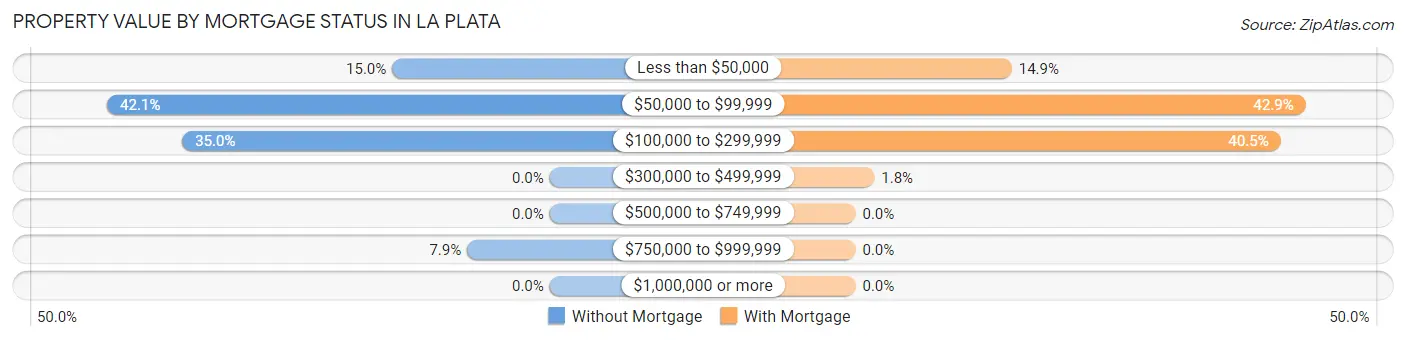
| Property Value | Without Mortgage | With Mortgage |
| Less than $50,000 | 21 (15.0%) | 25 (14.9%) |
| $50,000 to $99,999 | 59 (42.1%) | 72 (42.9%) |
| $100,000 to $299,999 | 49 (35.0%) | 68 (40.5%) |
| $300,000 to $499,999 | 0 (0.0%) | 3 (1.8%) |
| $500,000 to $749,999 | 0 (0.0%) | 0 (0.0%) |
| $750,000 to $999,999 | 11 (7.9%) | 0 (0.0%) |
| $1,000,000 or more | 0 (0.0%) | 0 (0.0%) |
| Total | 140 (100.0%) | 168 (100.0%) |
Household Income by Mortgage Status in La Plata
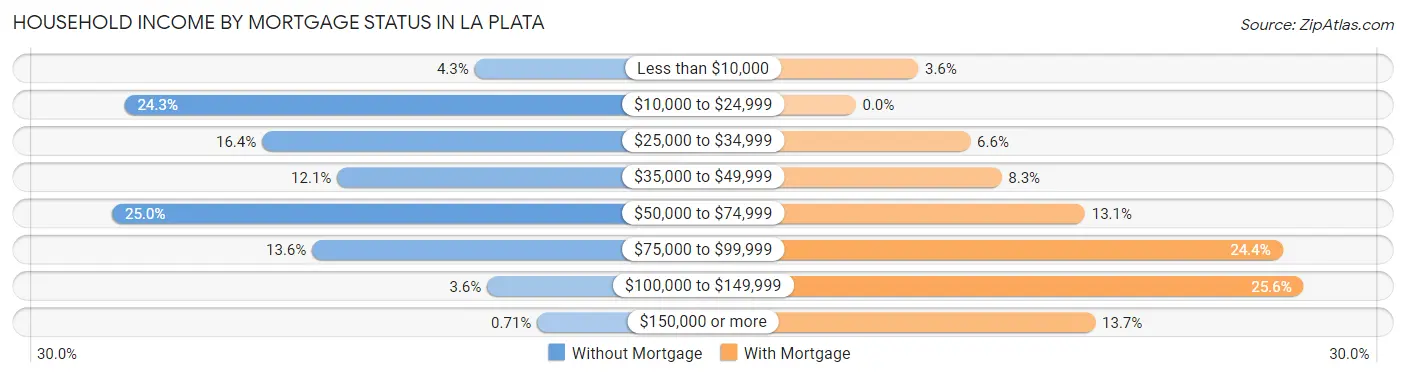
| Household Income | Without Mortgage | With Mortgage |
| Less than $10,000 | 6 (4.3%) | 6 (3.6%) |
| $10,000 to $24,999 | 34 (24.3%) | 0 (0.0%) |
| $25,000 to $34,999 | 23 (16.4%) | 11 (6.6%) |
| $35,000 to $49,999 | 17 (12.1%) | 14 (8.3%) |
| $50,000 to $74,999 | 35 (25.0%) | 22 (13.1%) |
| $75,000 to $99,999 | 19 (13.6%) | 41 (24.4%) |
| $100,000 to $149,999 | 5 (3.6%) | 43 (25.6%) |
| $150,000 or more | 1 (0.7%) | 23 (13.7%) |
| Total | 140 (100.0%) | 168 (100.0%) |
Property Value to Household Income Ratio in La Plata
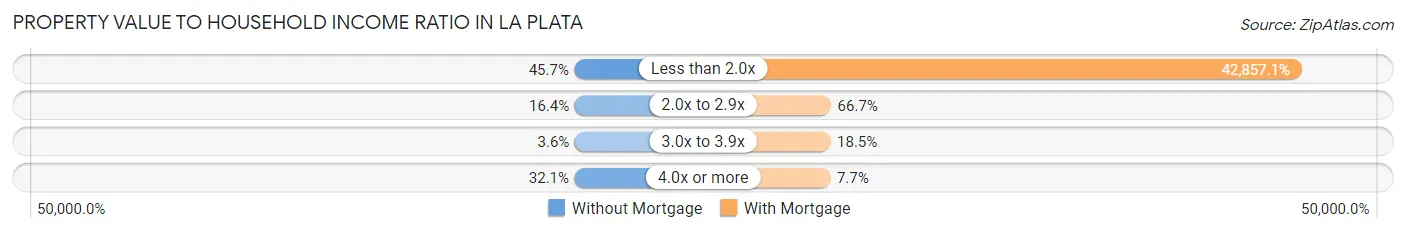
| Value-to-Income Ratio | Without Mortgage | With Mortgage |
| Less than 2.0x | 64 (45.7%) | 72,000 (42,857.1%) |
| 2.0x to 2.9x | 23 (16.4%) | 112 (66.7%) |
| 3.0x to 3.9x | 5 (3.6%) | 31 (18.4%) |
| 4.0x or more | 45 (32.1%) | 13 (7.7%) |
| Total | 140 (100.0%) | 168 (100.0%) |
Real Estate Taxes by Mortgage Status in La Plata
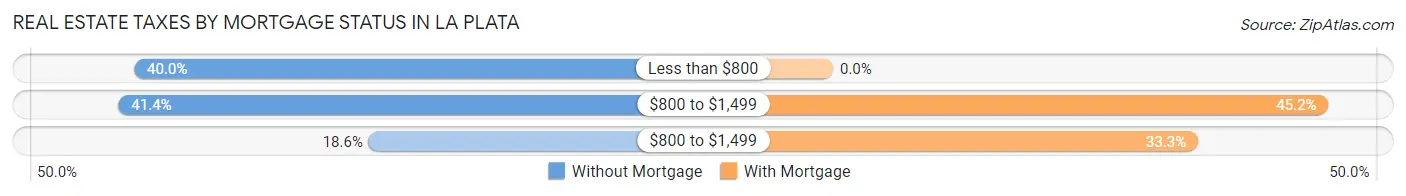
| Property Taxes | Without Mortgage | With Mortgage |
| Less than $800 | 56 (40.0%) | 0 (0.0%) |
| $800 to $1,499 | 58 (41.4%) | 76 (45.2%) |
| $800 to $1,499 | 26 (18.6%) | 56 (33.3%) |
| Total | 140 (100.0%) | 168 (100.0%) |
Health & Disability in La Plata
Health Insurance Coverage by Age in La Plata
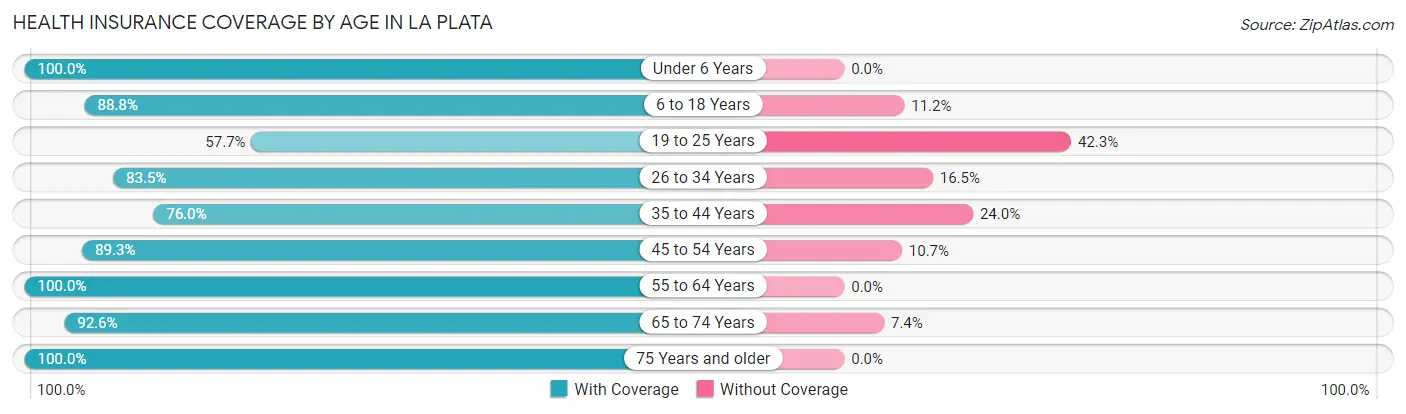
| Age Bracket | With Coverage | Without Coverage |
| Under 6 Years | 90 (100.0%) | 0 (0.0%) |
| 6 to 18 Years | 127 (88.8%) | 16 (11.2%) |
| 19 to 25 Years | 101 (57.7%) | 74 (42.3%) |
| 26 to 34 Years | 91 (83.5%) | 18 (16.5%) |
| 35 to 44 Years | 76 (76.0%) | 24 (24.0%) |
| 45 to 54 Years | 158 (89.3%) | 19 (10.7%) |
| 55 to 64 Years | 73 (100.0%) | 0 (0.0%) |
| 65 to 74 Years | 150 (92.6%) | 12 (7.4%) |
| 75 Years and older | 197 (100.0%) | 0 (0.0%) |
| Total | 1,063 (86.7%) | 163 (13.3%) |
Health Insurance Coverage by Citizenship Status in La Plata

| Citizenship Status | With Coverage | Without Coverage |
| Native Born | 90 (100.0%) | 0 (0.0%) |
| Foreign Born, Citizen | 127 (88.8%) | 16 (11.2%) |
| Foreign Born, not a Citizen | 101 (57.7%) | 74 (42.3%) |
Health Insurance Coverage by Household Income in La Plata
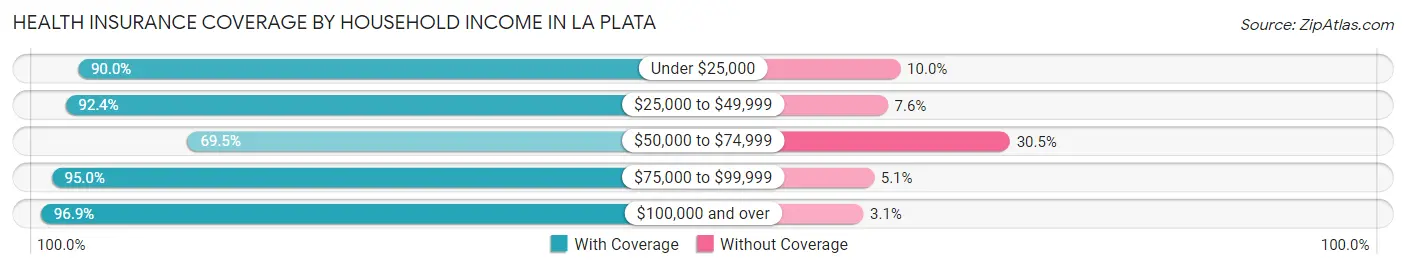
| Household Income | With Coverage | Without Coverage |
| Under $25,000 | 180 (90.0%) | 20 (10.0%) |
| $25,000 to $49,999 | 266 (92.4%) | 22 (7.6%) |
| $50,000 to $74,999 | 239 (69.5%) | 105 (30.5%) |
| $75,000 to $99,999 | 188 (95.0%) | 10 (5.1%) |
| $100,000 and over | 190 (96.9%) | 6 (3.1%) |
Public vs Private Health Insurance Coverage by Age in La Plata
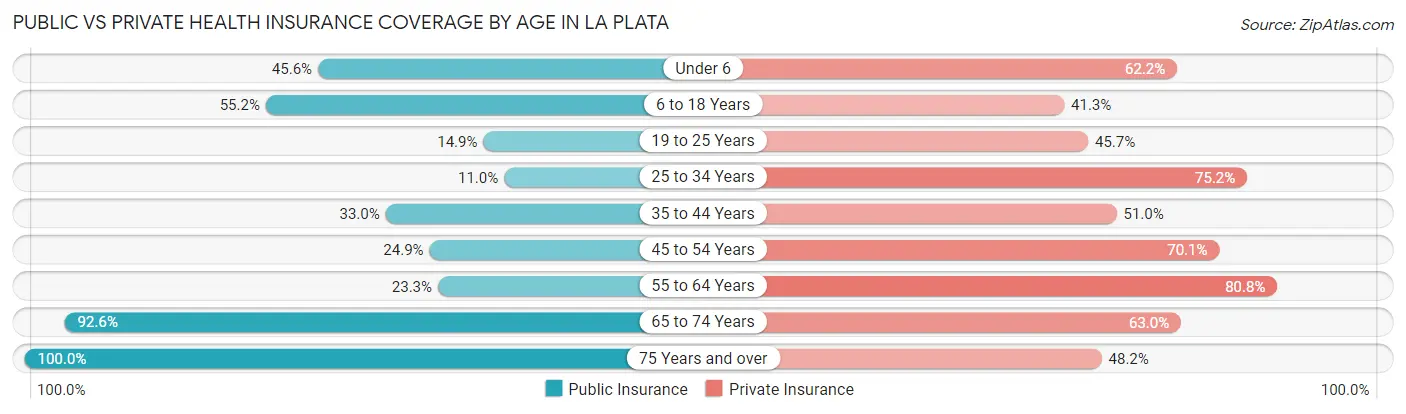
| Age Bracket | Public Insurance | Private Insurance |
| Under 6 | 41 (45.6%) | 56 (62.2%) |
| 6 to 18 Years | 79 (55.2%) | 59 (41.3%) |
| 19 to 25 Years | 26 (14.9%) | 80 (45.7%) |
| 25 to 34 Years | 12 (11.0%) | 82 (75.2%) |
| 35 to 44 Years | 33 (33.0%) | 51 (51.0%) |
| 45 to 54 Years | 44 (24.9%) | 124 (70.1%) |
| 55 to 64 Years | 17 (23.3%) | 59 (80.8%) |
| 65 to 74 Years | 150 (92.6%) | 102 (63.0%) |
| 75 Years and over | 197 (100.0%) | 95 (48.2%) |
| Total | 599 (48.9%) | 708 (57.8%) |
Disability Status by Sex by Age in La Plata
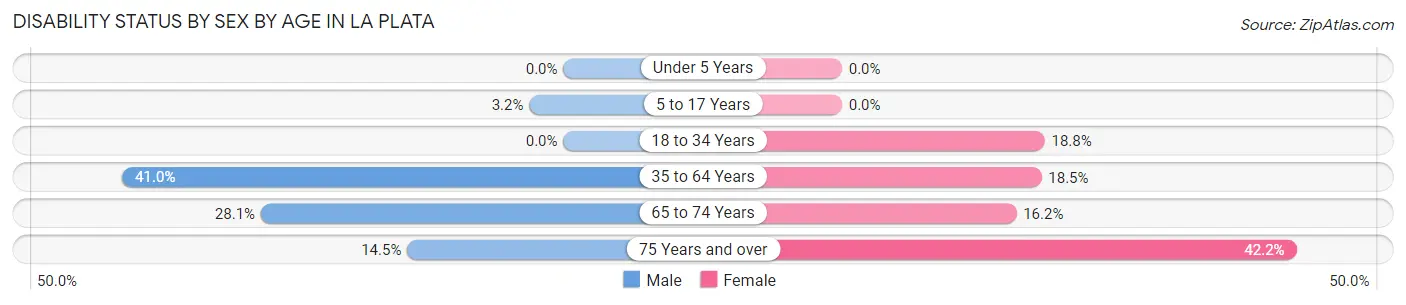
| Age Bracket | Male | Female |
| Under 5 Years | 0 (0.0%) | 0 (0.0%) |
| 5 to 17 Years | 3 (3.2%) | 0 (0.0%) |
| 18 to 34 Years | 0 (0.0%) | 35 (18.8%) |
| 35 to 64 Years | 77 (41.0%) | 30 (18.5%) |
| 65 to 74 Years | 16 (28.1%) | 17 (16.2%) |
| 75 Years and over | 10 (14.5%) | 54 (42.2%) |
Disability Class by Sex by Age in La Plata
Disability Class: Hearing Difficulty
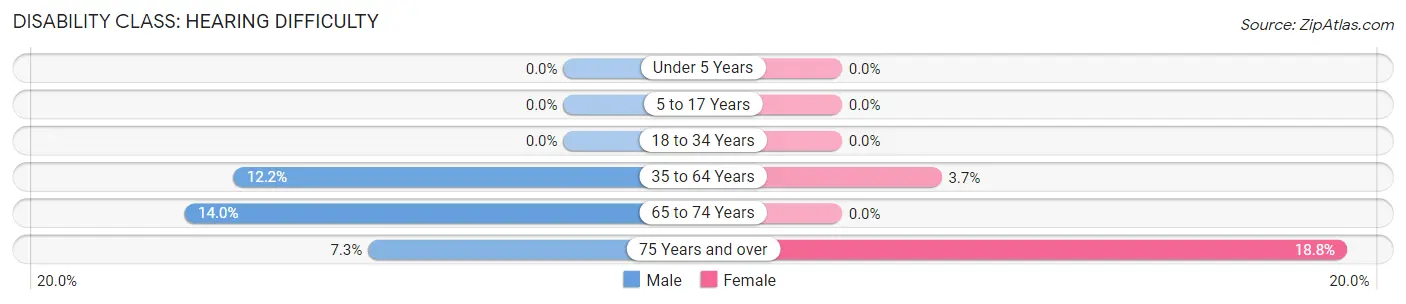
| Age Bracket | Male | Female |
| Under 5 Years | 0 (0.0%) | 0 (0.0%) |
| 5 to 17 Years | 0 (0.0%) | 0 (0.0%) |
| 18 to 34 Years | 0 (0.0%) | 0 (0.0%) |
| 35 to 64 Years | 23 (12.2%) | 6 (3.7%) |
| 65 to 74 Years | 8 (14.0%) | 0 (0.0%) |
| 75 Years and over | 5 (7.2%) | 24 (18.8%) |
Disability Class: Vision Difficulty
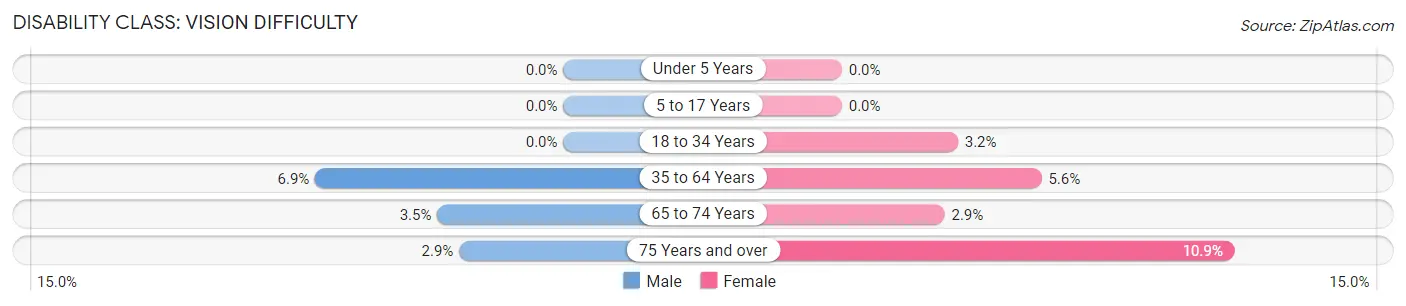
| Age Bracket | Male | Female |
| Under 5 Years | 0 (0.0%) | 0 (0.0%) |
| 5 to 17 Years | 0 (0.0%) | 0 (0.0%) |
| 18 to 34 Years | 0 (0.0%) | 6 (3.2%) |
| 35 to 64 Years | 13 (6.9%) | 9 (5.6%) |
| 65 to 74 Years | 2 (3.5%) | 3 (2.9%) |
| 75 Years and over | 2 (2.9%) | 14 (10.9%) |
Disability Class: Cognitive Difficulty
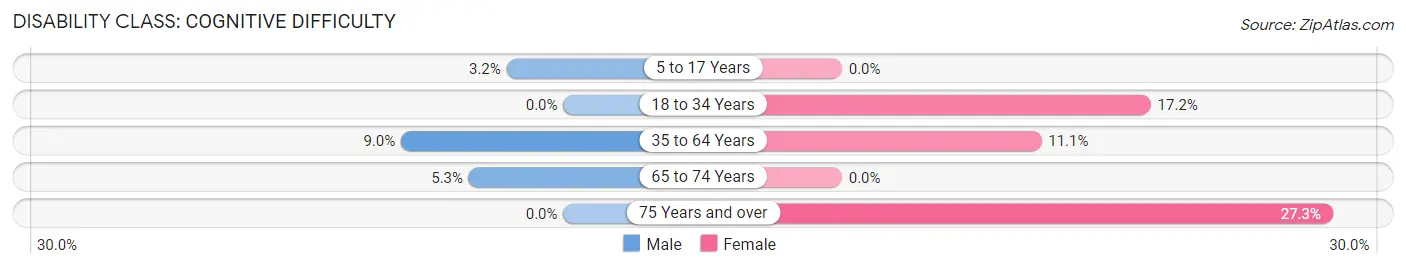
| Age Bracket | Male | Female |
| 5 to 17 Years | 3 (3.2%) | 0 (0.0%) |
| 18 to 34 Years | 0 (0.0%) | 32 (17.2%) |
| 35 to 64 Years | 17 (9.0%) | 18 (11.1%) |
| 65 to 74 Years | 3 (5.3%) | 0 (0.0%) |
| 75 Years and over | 0 (0.0%) | 35 (27.3%) |
Disability Class: Ambulatory Difficulty
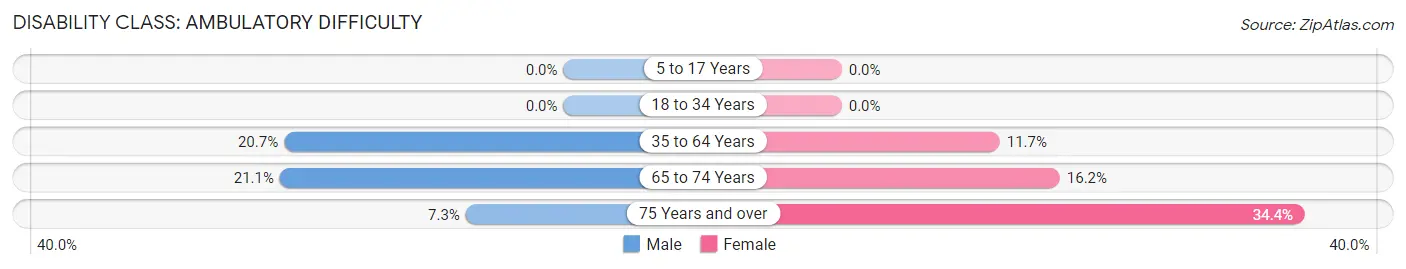
| Age Bracket | Male | Female |
| 5 to 17 Years | 0 (0.0%) | 0 (0.0%) |
| 18 to 34 Years | 0 (0.0%) | 0 (0.0%) |
| 35 to 64 Years | 39 (20.7%) | 19 (11.7%) |
| 65 to 74 Years | 12 (21.0%) | 17 (16.2%) |
| 75 Years and over | 5 (7.2%) | 44 (34.4%) |
Disability Class: Self-Care Difficulty
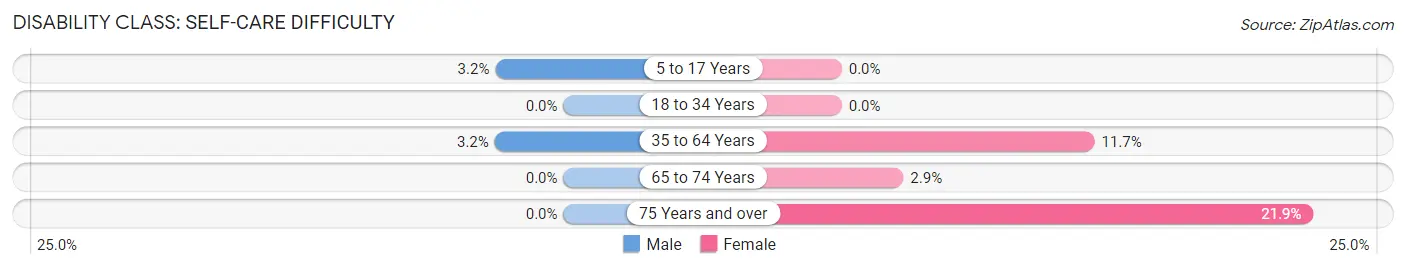
| Age Bracket | Male | Female |
| 5 to 17 Years | 3 (3.2%) | 0 (0.0%) |
| 18 to 34 Years | 0 (0.0%) | 0 (0.0%) |
| 35 to 64 Years | 6 (3.2%) | 19 (11.7%) |
| 65 to 74 Years | 0 (0.0%) | 3 (2.9%) |
| 75 Years and over | 0 (0.0%) | 28 (21.9%) |
Technology Access in La Plata
Computing Device Access in La Plata
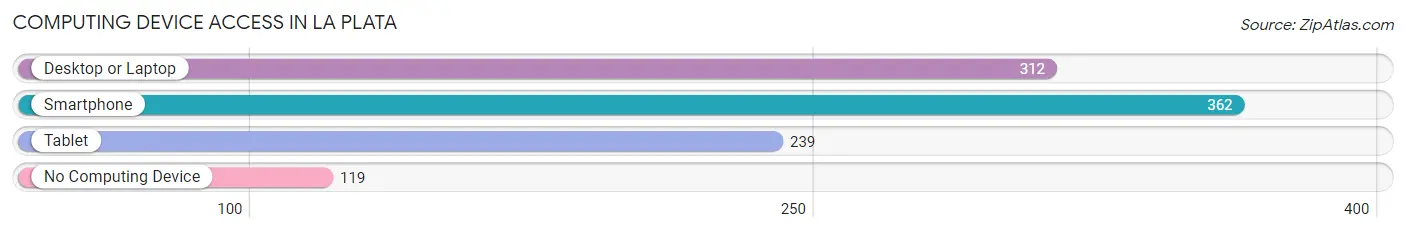
| Device Type | # Households | % Households |
| Desktop or Laptop | 312 | 62.6% |
| Smartphone | 362 | 72.7% |
| Tablet | 239 | 48.0% |
| No Computing Device | 119 | 23.9% |
| Total | 498 | 100.0% |
Internet Access in La Plata
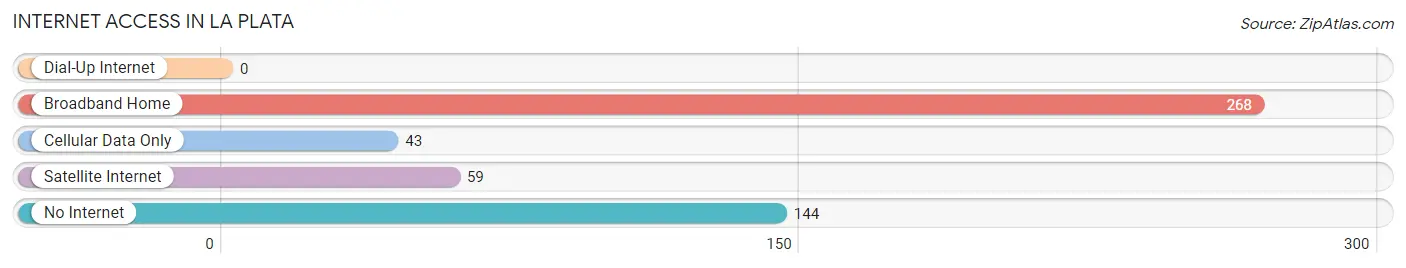
| Internet Type | # Households | % Households |
| Dial-Up Internet | 0 | 0.0% |
| Broadband Home | 268 | 53.8% |
| Cellular Data Only | 43 | 8.6% |
| Satellite Internet | 59 | 11.8% |
| No Internet | 144 | 28.9% |
| Total | 498 | 100.0% |
La Plata Summary
La Plata, Missouri is a small town located in Macon County, in the north-central part of the state. It is situated on the banks of the Chariton River, and is the county seat of Macon County. The town was founded in 1837, and was named after the Spanish word for “silver”, in reference to the silver coins that were found in the area.
Geography
La Plata is located at the intersection of U.S. Route 63 and Missouri Route 11. It is situated in the northern part of Macon County, and is approximately 30 miles south of Kirksville, Missouri. The town is located in a rural area, and is surrounded by rolling hills and farmland. The Chariton River runs through the town, and is a popular spot for fishing and canoeing.
The climate in La Plata is typical of the Midwest, with hot summers and cold winters. The average temperature in the summer is around 80 degrees Fahrenheit, and the average temperature in the winter is around 30 degrees Fahrenheit. The town receives an average of 40 inches of precipitation per year.
Economy
The economy of La Plata is largely based on agriculture. The town is home to several farms, and the surrounding area is known for its production of corn, soybeans, and wheat. The town also has a few small businesses, including a grocery store, a hardware store, and a few restaurants.
The town is also home to a few manufacturing companies, including a furniture factory and a plastics factory. The town is also home to a few small businesses, such as a gas station, a barber shop, and a few other small shops.
Demographics
As of the 2010 census, the population of La Plata was 1,845. The racial makeup of the town was 97.3% White, 0.7% African American, 0.2% Native American, 0.2% Asian, 0.1% Pacific Islander, and 1.5% from other races. The median household income in the town was $35,938, and the median family income was $41,250.
The town is served by the La Plata R-II School District, which consists of one elementary school, one middle school, and one high school. The town is also home to a branch of the Macon County Library.
La Plata is a small town with a rich history and a strong sense of community. The town is home to a variety of businesses, and the surrounding area is known for its agricultural production. The town is also home to a few manufacturing companies, and the local school district provides a quality education for the town’s children. La Plata is a great place to live and work, and is a great example of small-town life in the Midwest.
Common Questions
What is Per Capita Income in La Plata?
Per Capita income in La Plata is $26,541.
What is the Median Family Income in La Plata?
Median Family Income in La Plata is $55,917.
What is the Median Household income in La Plata?
Median Household Income in La Plata is $44,286.
What is Income or Wage Gap in La Plata?
Income or Wage Gap in La Plata is 15.1%.
Women in La Plata earn 84.9 cents for every dollar earned by a man.
What is Inequality or Gini Index in La Plata?
Inequality or Gini Index in La Plata is 0.45.
What is the Total Population of La Plata?
Total Population of La Plata is 1,265.
What is the Total Male Population of La Plata?
Total Male Population of La Plata is 577.
What is the Total Female Population of La Plata?
Total Female Population of La Plata is 688.
What is the Ratio of Males per 100 Females in La Plata?
There are 83.87 Males per 100 Females in La Plata.
What is the Ratio of Females per 100 Males in La Plata?
There are 119.24 Females per 100 Males in La Plata.
What is the Median Population Age in La Plata?
Median Population Age in La Plata is 46.4 Years.
What is the Average Family Size in La Plata
Average Family Size in La Plata is 3.5 People.
What is the Average Household Size in La Plata
Average Household Size in La Plata is 2.5 People.
How Large is the Labor Force in La Plata?
There are 473 People in the Labor Forcein in La Plata.
What is the Percentage of People in the Labor Force in La Plata?
44.5% of People are in the Labor Force in La Plata.
What is the Unemployment Rate in La Plata?
Unemployment Rate in La Plata is 6.3%.