La Grange, MO Map & Demographics
La Grange Map
La Grange Overview
$28,157
PER CAPITA INCOME
$67,500
AVG FAMILY INCOME
$53,214
AVG HOUSEHOLD INCOME
39.8%
WAGE / INCOME GAP [ % ]
60.2¢/ $1
WAGE / INCOME GAP [ $ ]
0.42
INEQUALITY / GINI INDEX
764
TOTAL POPULATION
263
MALE POPULATION
501
FEMALE POPULATION
52.50
MALES / 100 FEMALES
190.49
FEMALES / 100 MALES
42.1
MEDIAN AGE
4.0
AVG FAMILY SIZE
2.6
AVG HOUSEHOLD SIZE
439
LABOR FORCE [ PEOPLE ]
65.4%
PERCENT IN LABOR FORCE
1.1%
UNEMPLOYMENT RATE
La Grange Zip Codes
La Grange Area Codes
Income in La Grange
Income Overview in La Grange
Per Capita Income in La Grange is $28,157, while median incomes of families and households are $67,500 and $53,214 respectively.
| Characteristic | Number | Measure |
| Per Capita Income | 764 | $28,157 |
| Median Family Income | 136 | $67,500 |
| Mean Family Income | 136 | $82,424 |
| Median Household Income | 288 | $53,214 |
| Mean Household Income | 288 | $61,375 |
| Income Deficit | 136 | $0 |
| Wage / Income Gap (%) | 764 | 39.78% |
| Wage / Income Gap ($) | 764 | 60.22¢ per $1 |
| Gini / Inequality Index | 764 | 0.42 |
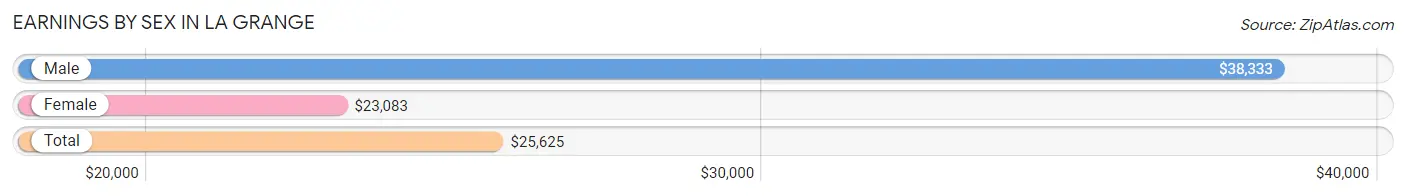
Earnings by Sex in La Grange
Average Earnings in La Grange are $25,625, $38,333 for men and $23,083 for women, a difference of 39.8%.
| Sex | Number | Average Earnings |
| Male | 146 (33.6%) | $38,333 |
| Female | 288 (66.4%) | $23,083 |
| Total | 434 (100.0%) | $25,625 |
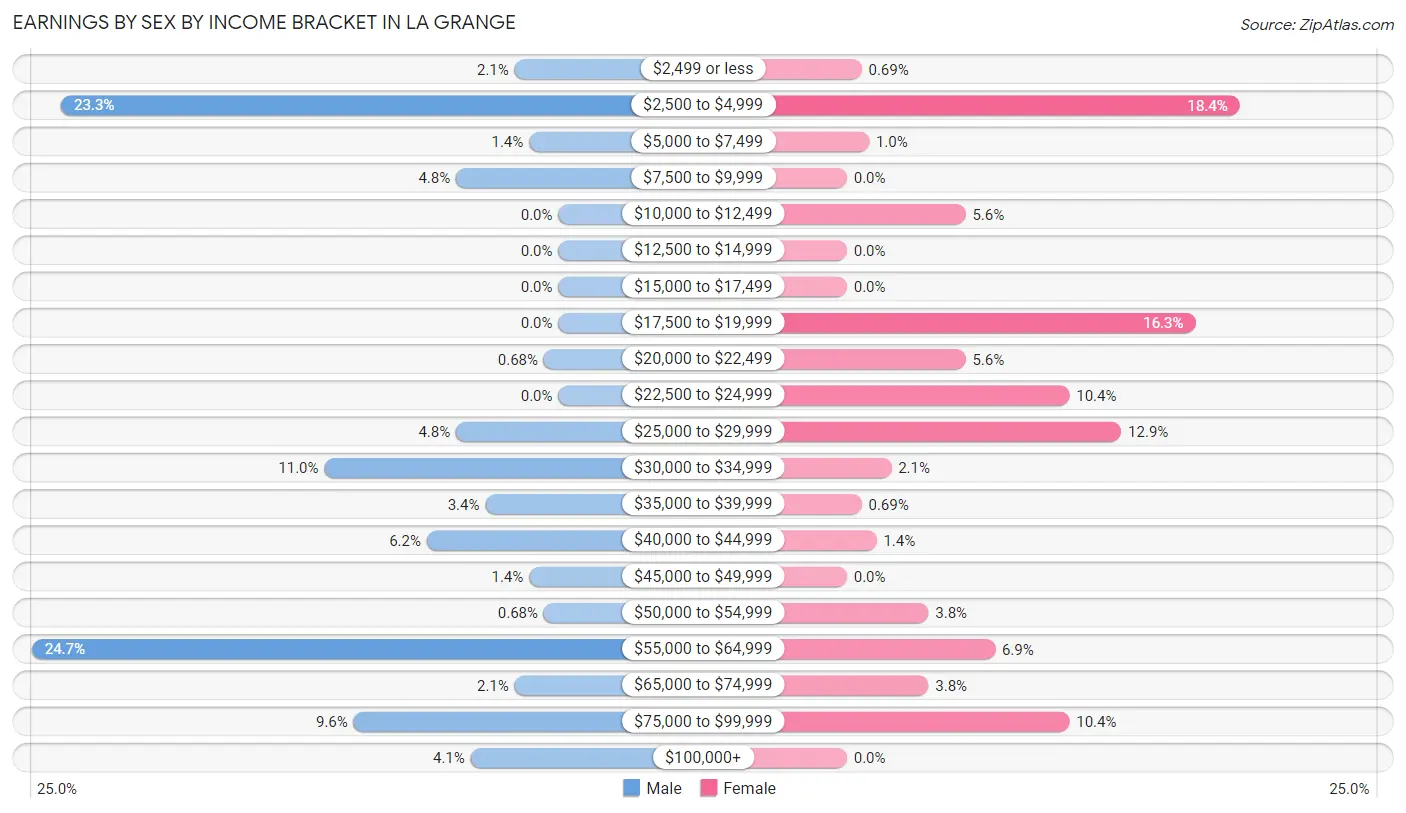
Earnings by Sex by Income Bracket in La Grange
The most common earnings brackets in La Grange are $55,000 to $64,999 for men (36 | 24.7%) and $2,500 to $4,999 for women (53 | 18.4%).
| Income | Male | Female |
| $2,499 or less | 3 (2.1%) | 2 (0.7%) |
| $2,500 to $4,999 | 34 (23.3%) | 53 (18.4%) |
| $5,000 to $7,499 | 2 (1.4%) | 3 (1.0%) |
| $7,500 to $9,999 | 7 (4.8%) | 0 (0.0%) |
| $10,000 to $12,499 | 0 (0.0%) | 16 (5.6%) |
| $12,500 to $14,999 | 0 (0.0%) | 0 (0.0%) |
| $15,000 to $17,499 | 0 (0.0%) | 0 (0.0%) |
| $17,500 to $19,999 | 0 (0.0%) | 47 (16.3%) |
| $20,000 to $22,499 | 1 (0.7%) | 16 (5.6%) |
| $22,500 to $24,999 | 0 (0.0%) | 30 (10.4%) |
| $25,000 to $29,999 | 7 (4.8%) | 37 (12.9%) |
| $30,000 to $34,999 | 16 (11.0%) | 6 (2.1%) |
| $35,000 to $39,999 | 5 (3.4%) | 2 (0.7%) |
| $40,000 to $44,999 | 9 (6.2%) | 4 (1.4%) |
| $45,000 to $49,999 | 2 (1.4%) | 0 (0.0%) |
| $50,000 to $54,999 | 1 (0.7%) | 11 (3.8%) |
| $55,000 to $64,999 | 36 (24.7%) | 20 (6.9%) |
| $65,000 to $74,999 | 3 (2.1%) | 11 (3.8%) |
| $75,000 to $99,999 | 14 (9.6%) | 30 (10.4%) |
| $100,000+ | 6 (4.1%) | 0 (0.0%) |
| Total | 146 (100.0%) | 288 (100.0%) |
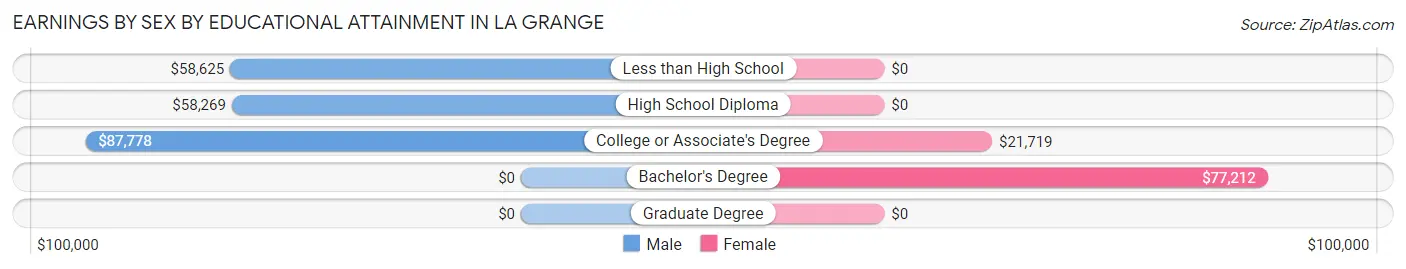
Earnings by Sex by Educational Attainment in La Grange
Average earnings in La Grange are $58,650 for men and $26,000 for women, a difference of 55.7%. Men with an educational attainment of college or associate's degree enjoy the highest average annual earnings of $87,778, while those with high school diploma education earn the least with $58,269. Women with an educational attainment of bachelor's degree earn the most with the average annual earnings of $77,212, while those with college or associate's degree education have the smallest earnings of $21,719.
| Educational Attainment | Male Income | Female Income |
| Less than High School | $58,625 | $0 |
| High School Diploma | $58,269 | $0 |
| College or Associate's Degree | $87,778 | $21,719 |
| Bachelor's Degree | - | - |
| Graduate Degree | - | - |
| Total | $58,650 | $26,000 |
Family Income in La Grange
Family Income Brackets in La Grange
According to the La Grange family income data, there are 27 families falling into the $100,000 to $149,999 income range, which is the most common income bracket and makes up 19.9% of all families.
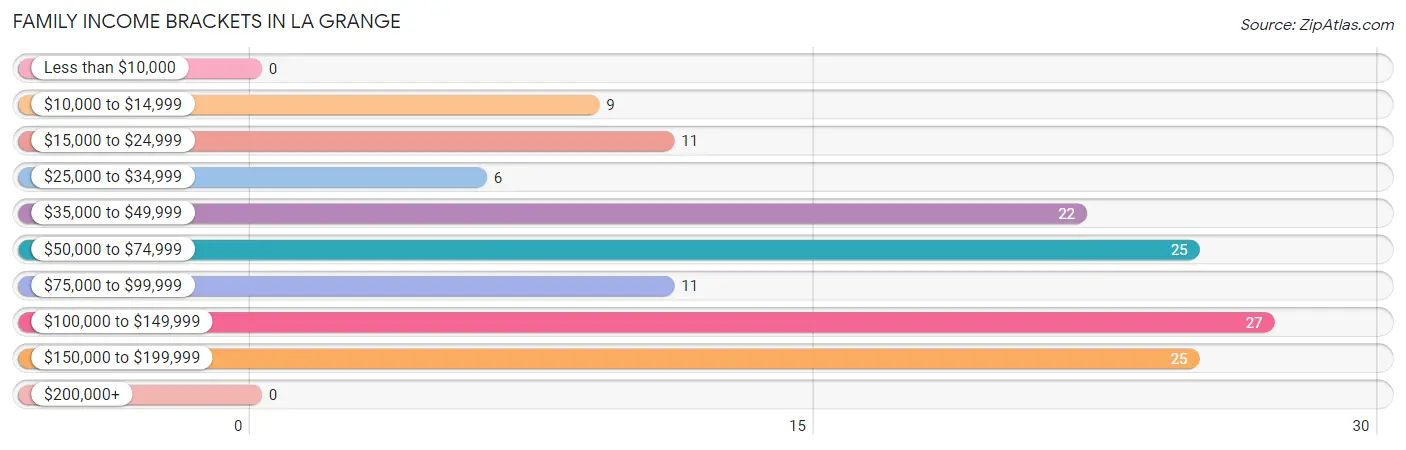
| Income Bracket | # Families | % Families |
| Less than $10,000 | 0 | 0.0% |
| $10,000 to $14,999 | 9 | 6.6% |
| $15,000 to $24,999 | 11 | 8.1% |
| $25,000 to $34,999 | 6 | 4.4% |
| $35,000 to $49,999 | 22 | 16.2% |
| $50,000 to $74,999 | 25 | 18.4% |
| $75,000 to $99,999 | 11 | 8.1% |
| $100,000 to $149,999 | 27 | 19.9% |
| $150,000 to $199,999 | 25 | 18.4% |
| $200,000+ | 0 | 0.0% |
Family Income by Famaliy Size in La Grange
3-person families (22 | 16.2%) account for the highest median family income in La Grange with $82,500 per family, while 3-person families (22 | 16.2%) have the highest median income of $27,500 per family member.
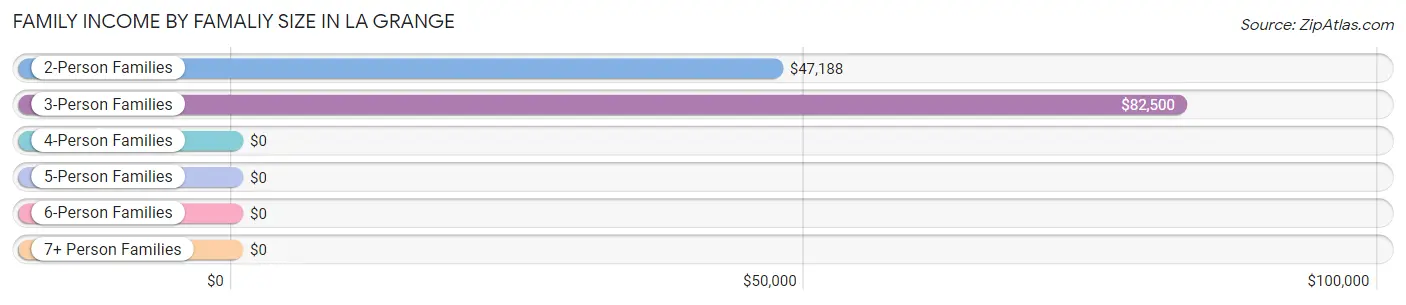
| Income Bracket | # Families | Median Income |
| 2-Person Families | 91 (66.9%) | $47,188 |
| 3-Person Families | 22 (16.2%) | $82,500 |
| 4-Person Families | 15 (11.0%) | $0 |
| 5-Person Families | 8 (5.9%) | $0 |
| 6-Person Families | 0 (0.0%) | $0 |
| 7+ Person Families | 0 (0.0%) | $0 |
| Total | 136 (100.0%) | $67,500 |
Family Income by Number of Earners in La Grange
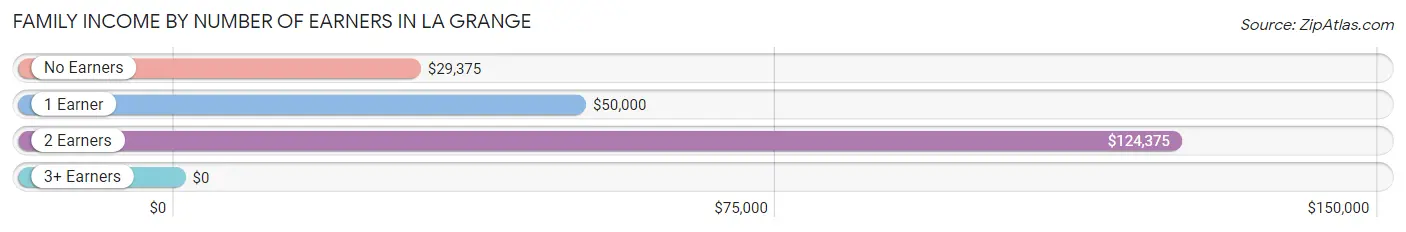
| Number of Earners | # Families | Median Income |
| No Earners | 30 (22.1%) | $29,375 |
| 1 Earner | 46 (33.8%) | $50,000 |
| 2 Earners | 43 (31.6%) | $124,375 |
| 3+ Earners | 17 (12.5%) | $0 |
| Total | 136 (100.0%) | $67,500 |
Household Income in La Grange
Household Income Brackets in La Grange
With 52 households falling in the category, the $50,000 to $74,999 income range is the most frequent in La Grange, accounting for 18.1% of all households.
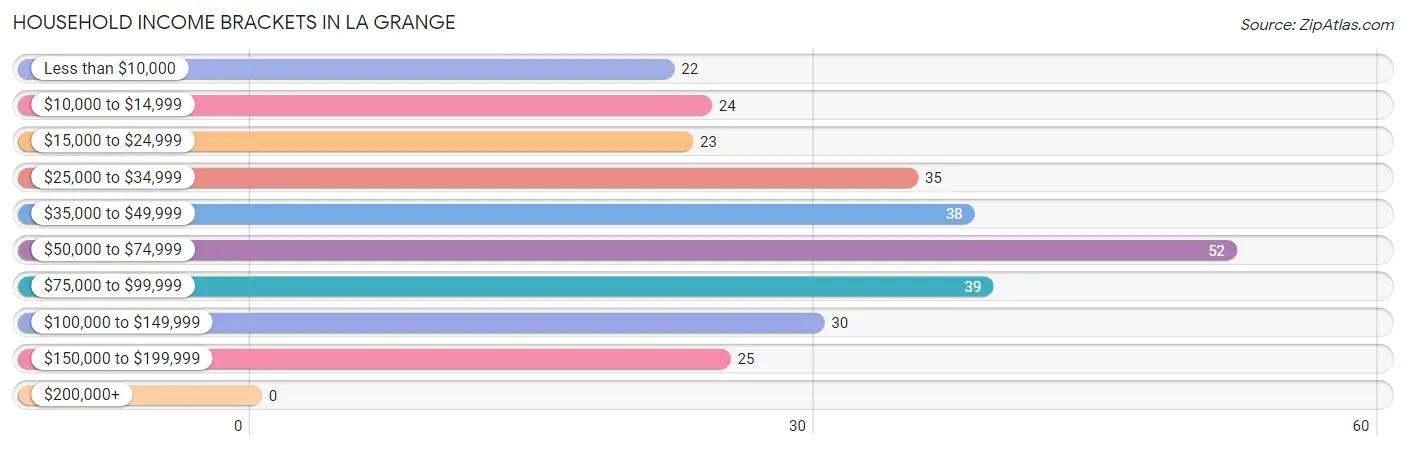
| Income Bracket | # Households | % Households |
| Less than $10,000 | 22 | 7.6% |
| $10,000 to $14,999 | 24 | 8.3% |
| $15,000 to $24,999 | 23 | 8.0% |
| $25,000 to $34,999 | 35 | 12.2% |
| $35,000 to $49,999 | 38 | 13.2% |
| $50,000 to $74,999 | 52 | 18.1% |
| $75,000 to $99,999 | 39 | 13.5% |
| $100,000 to $149,999 | 30 | 10.4% |
| $150,000 to $199,999 | 25 | 8.7% |
| $200,000+ | 0 | 0.0% |
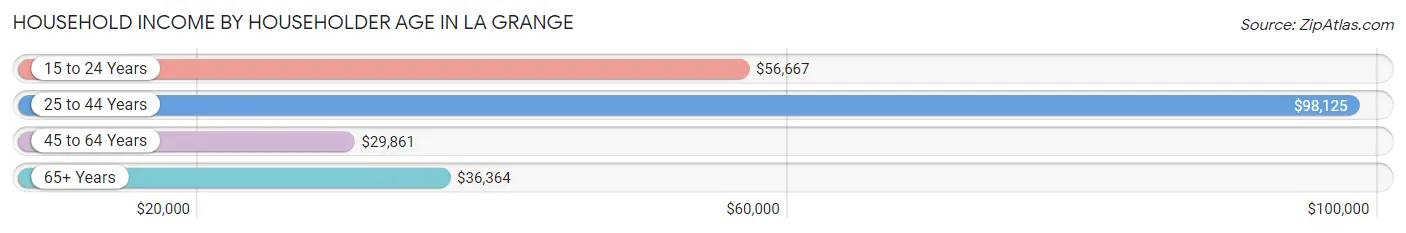
Household Income by Householder Age in La Grange
The median household income in La Grange is $53,214, with the highest median household income of $98,125 found in the 25 to 44 years age bracket for the primary householder. A total of 77 households (26.7%) fall into this category. Meanwhile, the 45 to 64 years age bracket for the primary householder has the lowest median household income of $29,861, with 89 households (30.9%) in this group.
| Income Bracket | # Households | Median Income |
| 15 to 24 Years | 30 (10.4%) | $56,667 |
| 25 to 44 Years | 77 (26.7%) | $98,125 |
| 45 to 64 Years | 89 (30.9%) | $29,861 |
| 65+ Years | 92 (31.9%) | $36,364 |
| Total | 288 (100.0%) | $53,214 |
Poverty in La Grange
Income Below Poverty by Sex and Age in La Grange
With 12.2% poverty level for males and 11.2% for females among the residents of La Grange, 55 to 64 year old males and 75 year old and over females are the most vulnerable to poverty, with 15 males (33.3%) and 32 females (47.1%) in their respective age groups living below the poverty level.
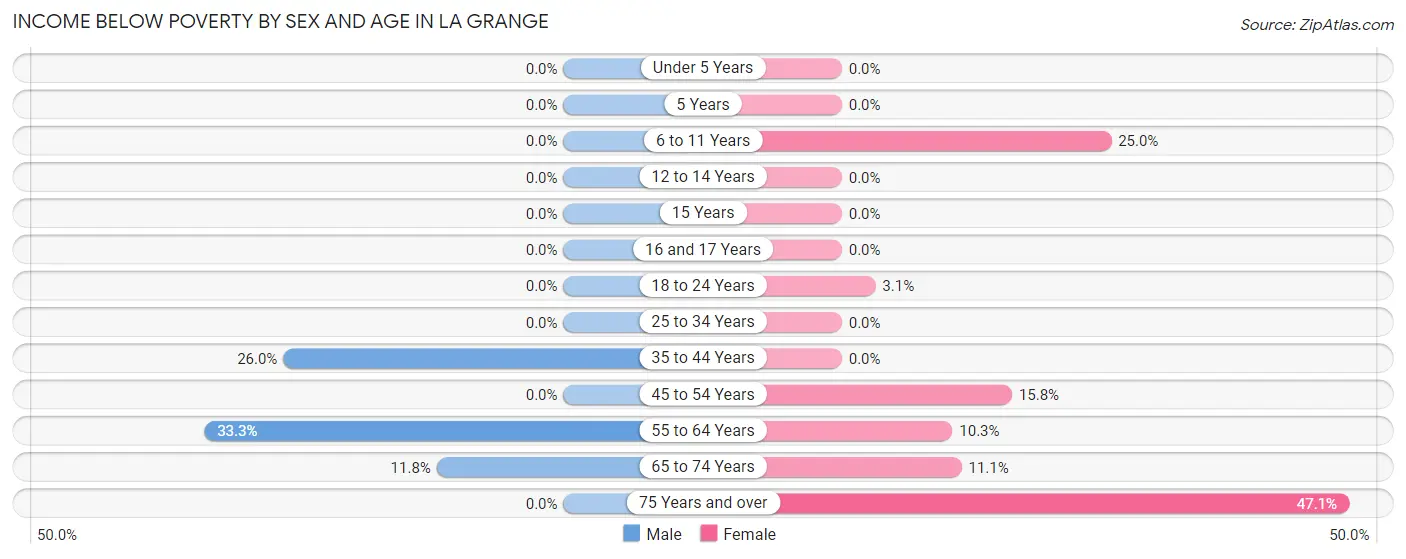
| Age Bracket | Male | Female |
| Under 5 Years | 0 (0.0%) | 0 (0.0%) |
| 5 Years | 0 (0.0%) | 0 (0.0%) |
| 6 to 11 Years | 0 (0.0%) | 4 (25.0%) |
| 12 to 14 Years | 0 (0.0%) | 0 (0.0%) |
| 15 Years | 0 (0.0%) | 0 (0.0%) |
| 16 and 17 Years | 0 (0.0%) | 0 (0.0%) |
| 18 to 24 Years | 0 (0.0%) | 3 (3.1%) |
| 25 to 34 Years | 0 (0.0%) | 0 (0.0%) |
| 35 to 44 Years | 13 (26.0%) | 0 (0.0%) |
| 45 to 54 Years | 0 (0.0%) | 9 (15.8%) |
| 55 to 64 Years | 15 (33.3%) | 4 (10.3%) |
| 65 to 74 Years | 4 (11.8%) | 4 (11.1%) |
| 75 Years and over | 0 (0.0%) | 32 (47.1%) |
| Total | 32 (12.2%) | 56 (11.2%) |
Income Above Poverty by Sex and Age in La Grange
According to the poverty statistics in La Grange, males aged under 5 years and females aged under 5 years are the age groups that are most secure financially, with 100.0% of males and 100.0% of females in these age groups living above the poverty line.
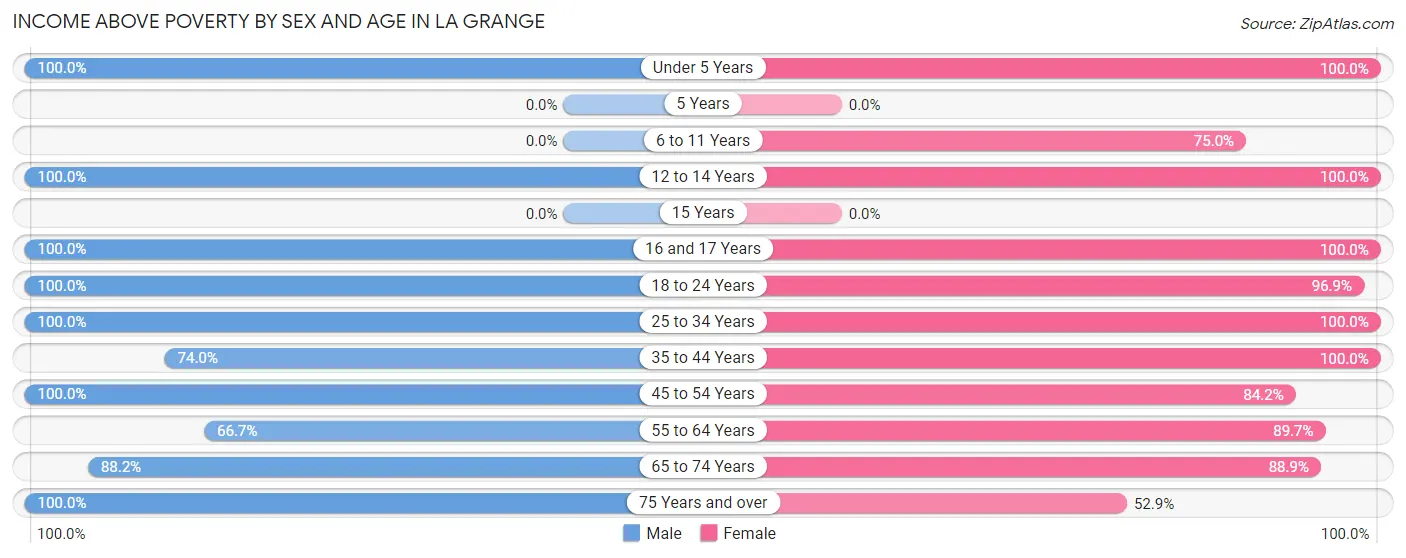
| Age Bracket | Male | Female |
| Under 5 Years | 5 (100.0%) | 11 (100.0%) |
| 5 Years | 0 (0.0%) | 0 (0.0%) |
| 6 to 11 Years | 0 (0.0%) | 12 (75.0%) |
| 12 to 14 Years | 19 (100.0%) | 42 (100.0%) |
| 15 Years | 0 (0.0%) | 0 (0.0%) |
| 16 and 17 Years | 34 (100.0%) | 7 (100.0%) |
| 18 to 24 Years | 23 (100.0%) | 93 (96.9%) |
| 25 to 34 Years | 19 (100.0%) | 64 (100.0%) |
| 35 to 44 Years | 37 (74.0%) | 65 (100.0%) |
| 45 to 54 Years | 11 (100.0%) | 48 (84.2%) |
| 55 to 64 Years | 30 (66.7%) | 35 (89.7%) |
| 65 to 74 Years | 30 (88.2%) | 32 (88.9%) |
| 75 Years and over | 23 (100.0%) | 36 (52.9%) |
| Total | 231 (87.8%) | 445 (88.8%) |
Income Below Poverty Among Married-Couple Families in La Grange
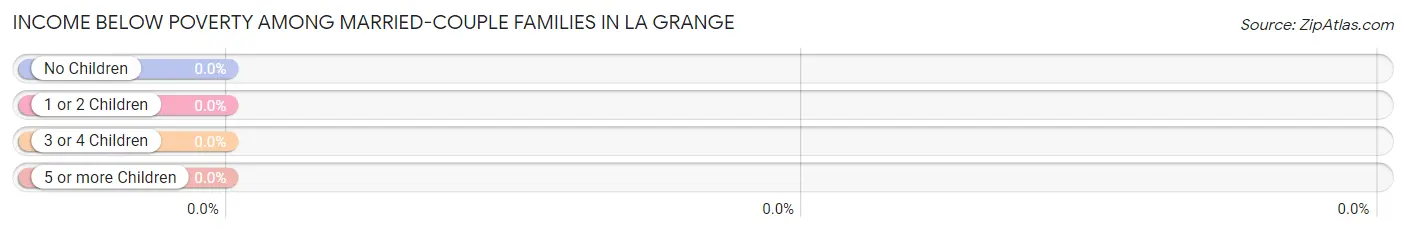
| Children | Above Poverty | Below Poverty |
| No Children | 64 (100.0%) | 0 (0.0%) |
| 1 or 2 Children | 39 (100.0%) | 0 (0.0%) |
| 3 or 4 Children | 0 (0.0%) | 0 (0.0%) |
| 5 or more Children | 0 (0.0%) | 0 (0.0%) |
| Total | 103 (100.0%) | 0 (0.0%) |
Income Below Poverty Among Single-Parent Households in La Grange
According to the poverty data in La Grange, 60.0% or 9 single-father households and 16.7% or 3 single-mother households are living below the poverty line. Among single-father households, those with no children have the highest poverty rate, with 9 households (100.0%) experiencing poverty. Likewise, among single-mother households, those with 1 or 2 children have the highest poverty rate, with 3 households (100.0%) falling below the poverty line.
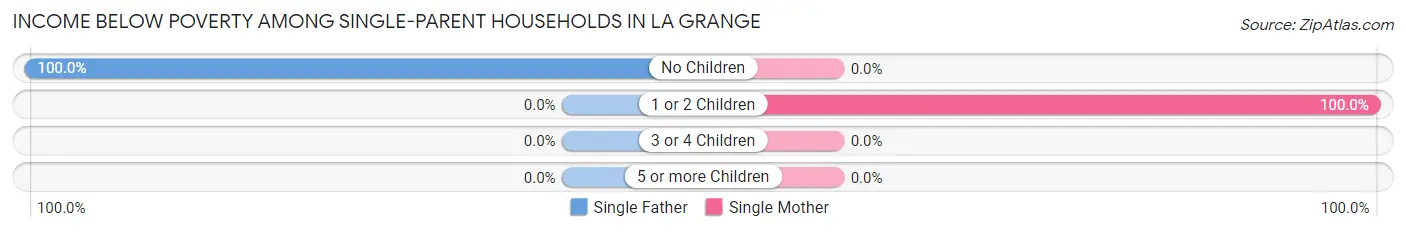
| Children | Single Father | Single Mother |
| No Children | 9 (100.0%) | 0 (0.0%) |
| 1 or 2 Children | 0 (0.0%) | 3 (100.0%) |
| 3 or 4 Children | 0 (0.0%) | 0 (0.0%) |
| 5 or more Children | 0 (0.0%) | 0 (0.0%) |
| Total | 9 (60.0%) | 3 (16.7%) |
Income Below Poverty Among Married-Couple vs Single-Parent Households in La Grange
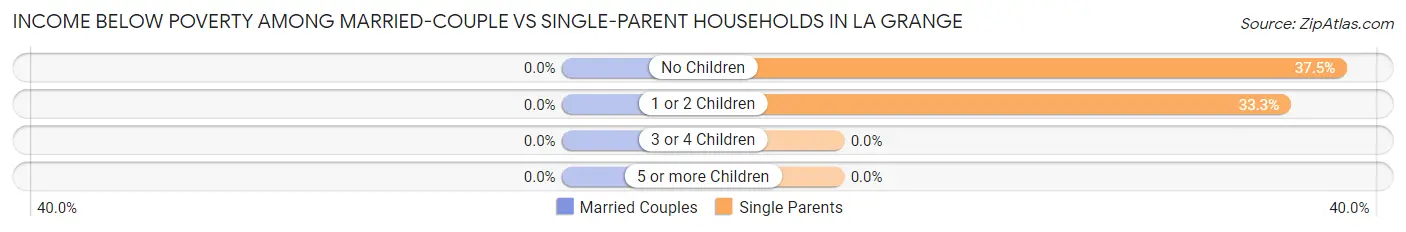
| Children | Married-Couple Families | Single-Parent Households |
| No Children | 0 (0.0%) | 9 (37.5%) |
| 1 or 2 Children | 0 (0.0%) | 3 (33.3%) |
| 3 or 4 Children | 0 (0.0%) | 0 (0.0%) |
| 5 or more Children | 0 (0.0%) | 0 (0.0%) |
| Total | 0 (0.0%) | 12 (36.4%) |
Race in La Grange
The most populous races in La Grange are White / Caucasian (561 | 73.4%), Black / African American (178 | 23.3%), and Two or more Races (15 | 2.0%).
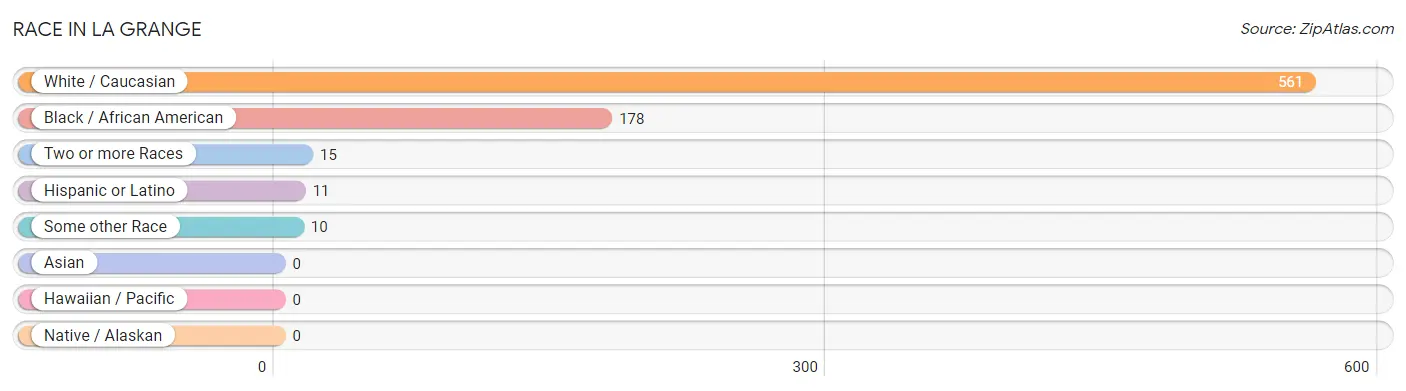
| Race | # Population | % Population |
| Asian | 0 | 0.0% |
| Black / African American | 178 | 23.3% |
| Hawaiian / Pacific | 0 | 0.0% |
| Hispanic or Latino | 11 | 1.4% |
| Native / Alaskan | 0 | 0.0% |
| White / Caucasian | 561 | 73.4% |
| Two or more Races | 15 | 2.0% |
| Some other Race | 10 | 1.3% |
| Total | 764 | 100.0% |
Ancestry in La Grange
The most populous ancestries reported in La Grange are German (174 | 22.8%), American (80 | 10.5%), English (73 | 9.6%), Swedish (55 | 7.2%), and African (43 | 5.6%), together accounting for 55.6% of all La Grange residents.
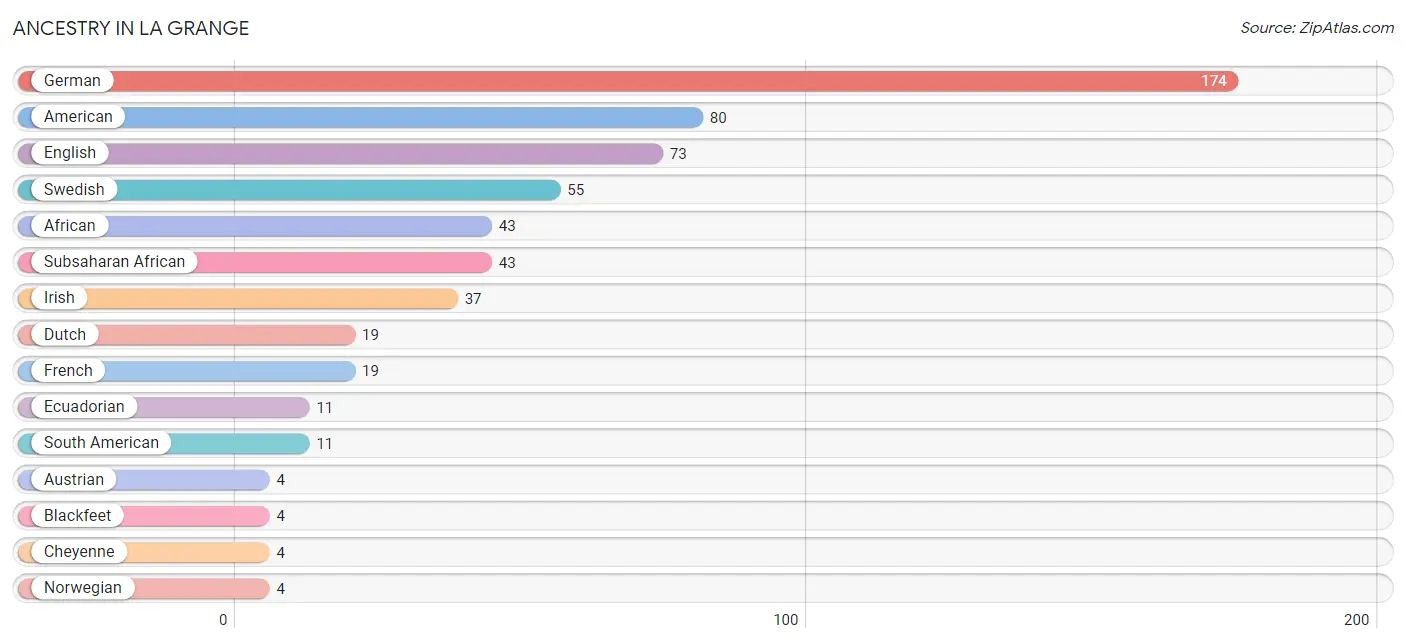
| Ancestry | # Population | % Population |
| African | 43 | 5.6% |
| American | 80 | 10.5% |
| Austrian | 4 | 0.5% |
| Blackfeet | 4 | 0.5% |
| Cheyenne | 4 | 0.5% |
| Dutch | 19 | 2.5% |
| Ecuadorian | 11 | 1.4% |
| English | 73 | 9.6% |
| European | 2 | 0.3% |
| French | 19 | 2.5% |
| German | 174 | 22.8% |
| Iranian | 2 | 0.3% |
| Irish | 37 | 4.8% |
| Norwegian | 4 | 0.5% |
| Polish | 2 | 0.3% |
| Scotch-Irish | 1 | 0.1% |
| Scottish | 2 | 0.3% |
| South American | 11 | 1.4% |
| Subsaharan African | 43 | 5.6% |
| Swedish | 55 | 7.2% | View All 20 Rows |
Immigrants in La Grange

| Immigration Origin | # Population | % Population | View All 0 Rows |
Sex and Age in La Grange
Sex and Age in La Grange
The most populous age groups in La Grange are 40 to 44 Years (44 | 16.7%) for men and 20 to 24 Years (79 | 15.8%) for women.
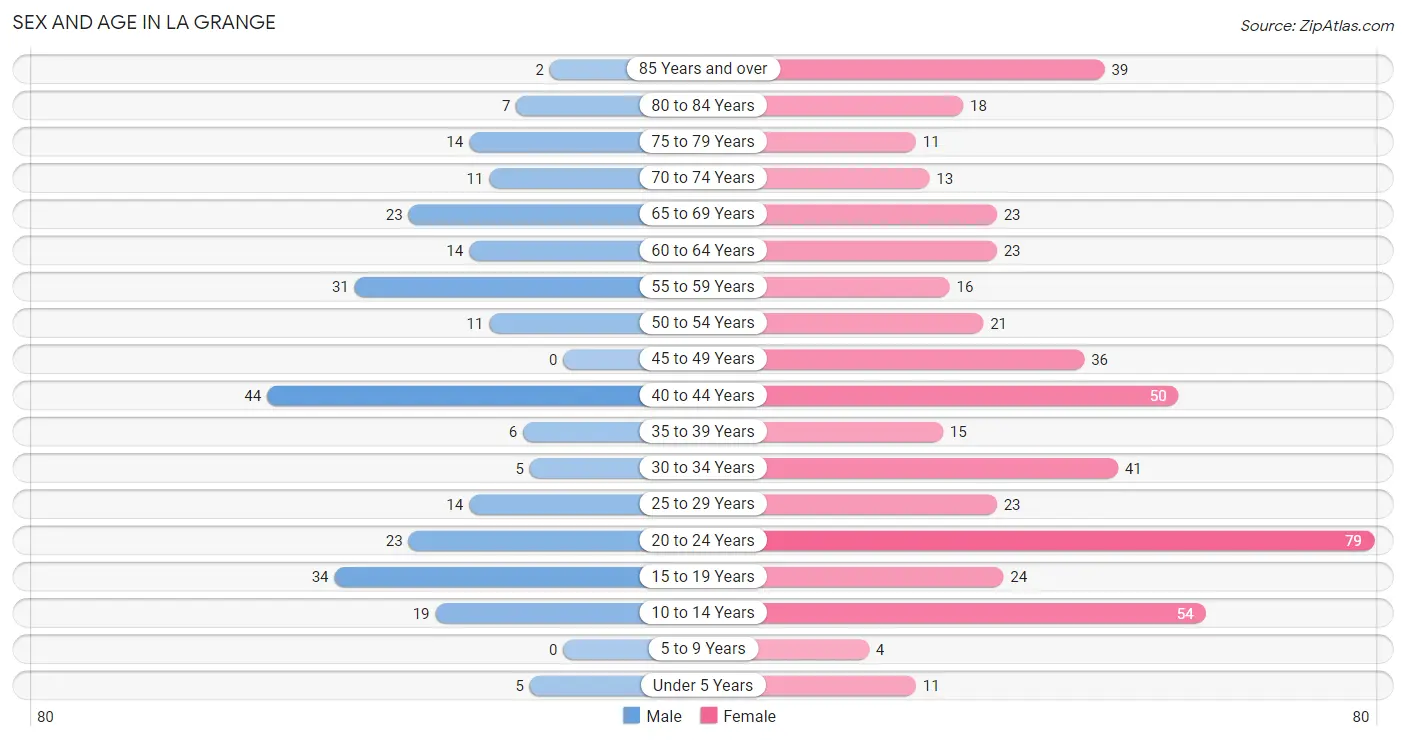
| Age Bracket | Male | Female |
| Under 5 Years | 5 (1.9%) | 11 (2.2%) |
| 5 to 9 Years | 0 (0.0%) | 4 (0.8%) |
| 10 to 14 Years | 19 (7.2%) | 54 (10.8%) |
| 15 to 19 Years | 34 (12.9%) | 24 (4.8%) |
| 20 to 24 Years | 23 (8.7%) | 79 (15.8%) |
| 25 to 29 Years | 14 (5.3%) | 23 (4.6%) |
| 30 to 34 Years | 5 (1.9%) | 41 (8.2%) |
| 35 to 39 Years | 6 (2.3%) | 15 (3.0%) |
| 40 to 44 Years | 44 (16.7%) | 50 (10.0%) |
| 45 to 49 Years | 0 (0.0%) | 36 (7.2%) |
| 50 to 54 Years | 11 (4.2%) | 21 (4.2%) |
| 55 to 59 Years | 31 (11.8%) | 16 (3.2%) |
| 60 to 64 Years | 14 (5.3%) | 23 (4.6%) |
| 65 to 69 Years | 23 (8.7%) | 23 (4.6%) |
| 70 to 74 Years | 11 (4.2%) | 13 (2.6%) |
| 75 to 79 Years | 14 (5.3%) | 11 (2.2%) |
| 80 to 84 Years | 7 (2.7%) | 18 (3.6%) |
| 85 Years and over | 2 (0.8%) | 39 (7.8%) |
| Total | 263 (100.0%) | 501 (100.0%) |
Families and Households in La Grange
Median Family Size in La Grange
The median family size in La Grange is 4.04 persons per family, with single male/father families (15 | 11.0%) accounting for the largest median family size of 4.4 persons per family. On the other hand, married-couple families (103 | 75.7%) represent the smallest median family size with 3.95 persons per family.
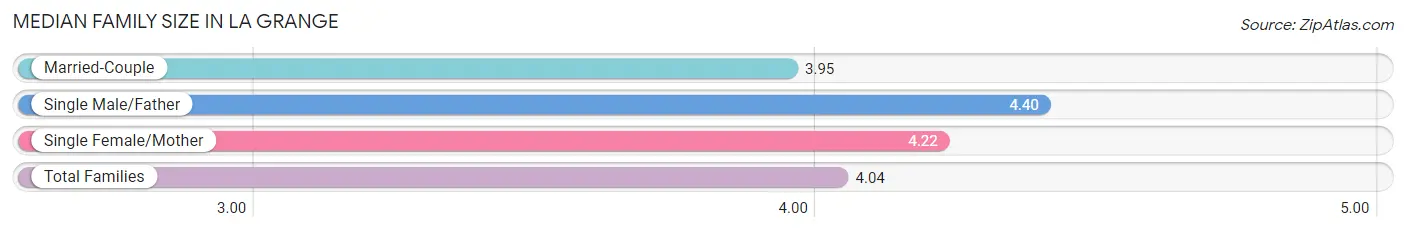
| Family Type | # Families | Family Size |
| Married-Couple | 103 (75.7%) | 3.95 |
| Single Male/Father | 15 (11.0%) | 4.40 |
| Single Female/Mother | 18 (13.2%) | 4.22 |
| Total Families | 136 (100.0%) | 4.04 |
Median Household Size in La Grange
The median household size in La Grange is 2.65 persons per household, with single male/father households (15 | 5.2%) accounting for the largest median household size of 5.6 persons per household. non-family households (152 | 52.8%) represent the smallest median household size with 1.30 persons per household.
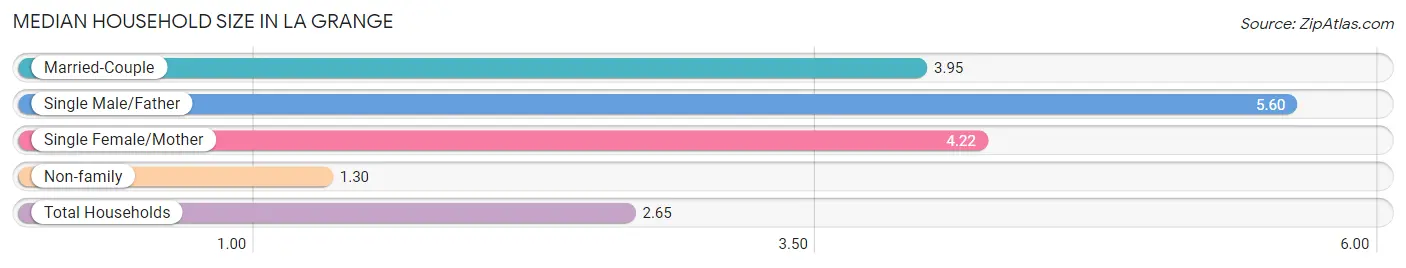
| Household Type | # Households | Household Size |
| Married-Couple | 103 (35.8%) | 3.95 |
| Single Male/Father | 15 (5.2%) | 5.60 |
| Single Female/Mother | 18 (6.2%) | 4.22 |
| Non-family | 152 (52.8%) | 1.30 |
| Total Households | 288 (100.0%) | 2.65 |
Household Size by Marriage Status in La Grange
Out of a total of 288 households in La Grange, 136 (47.2%) are family households, while 152 (52.8%) are nonfamily households. The most numerous type of family households are 2-person households, comprising 88, and the most common type of nonfamily households are 1-person households, comprising 123.
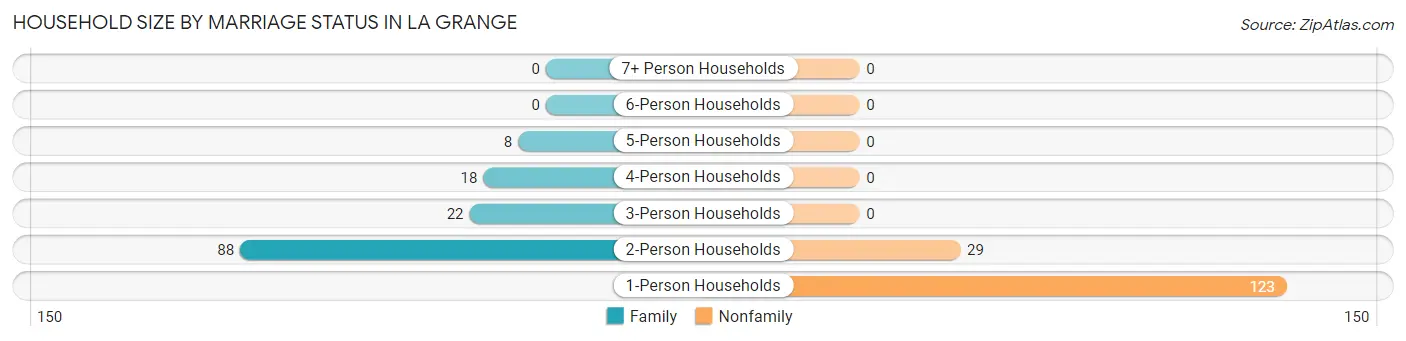
| Household Size | Family Households | Nonfamily Households |
| 1-Person Households | - | 123 (42.7%) |
| 2-Person Households | 88 (30.6%) | 29 (10.1%) |
| 3-Person Households | 22 (7.6%) | 0 (0.0%) |
| 4-Person Households | 18 (6.2%) | 0 (0.0%) |
| 5-Person Households | 8 (2.8%) | 0 (0.0%) |
| 6-Person Households | 0 (0.0%) | 0 (0.0%) |
| 7+ Person Households | 0 (0.0%) | 0 (0.0%) |
| Total | 136 (47.2%) | 152 (52.8%) |
Female Fertility in La Grange
Fertility by Age in La Grange
Average fertility rate in La Grange is 76.0 births per 1,000 women. Women in the age bracket of 15 to 19 years have the highest fertility rate with 583.0 births per 1,000 women. Women in the age bracket of 15 to 19 years acount for 66.7% of all women with births.
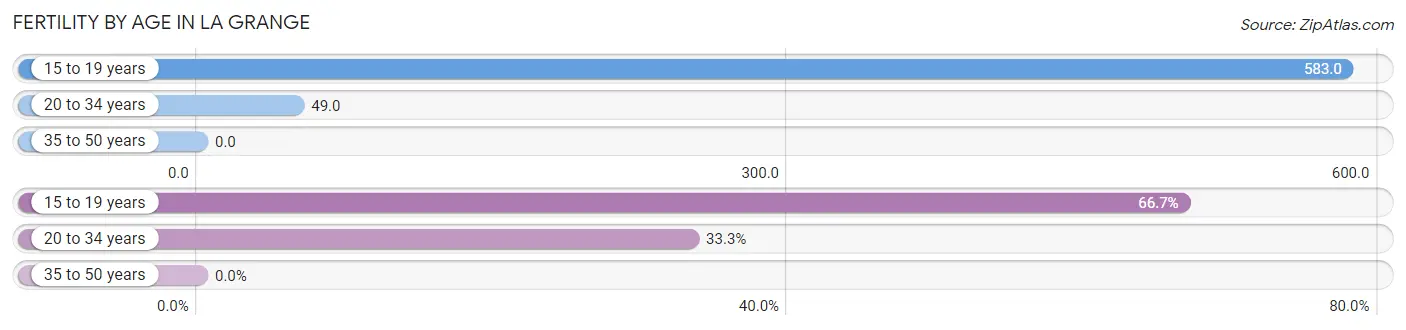
| Age Bracket | Women with Births | Births / 1,000 Women |
| 15 to 19 years | 14 (66.7%) | 583.0 |
| 20 to 34 years | 7 (33.3%) | 49.0 |
| 35 to 50 years | 0 (0.0%) | 0.0 |
| Total | 21 (100.0%) | 76.0 |
Fertility by Age by Marriage Status in La Grange
33.3% of women with births (21) in La Grange are married. The highest percentage of unmarried women with births falls into 15 to 19 years age bracket with 100.0% of them unmarried at the time of birth, while the lowest percentage of unmarried women with births belong to 20 to 34 years age bracket with 0.0% of them unmarried.
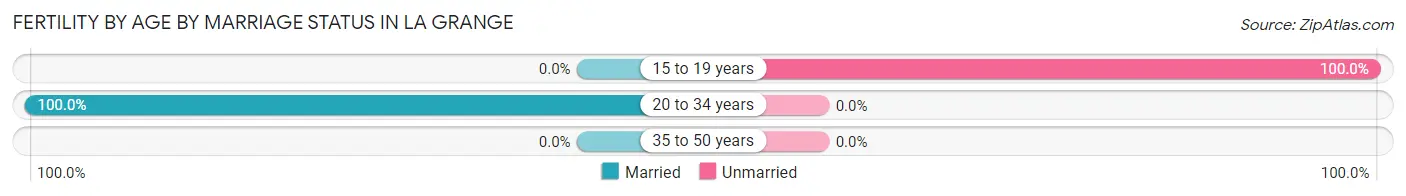
| Age Bracket | Married | Unmarried |
| 15 to 19 years | 0 (0.0%) | 14 (100.0%) |
| 20 to 34 years | 7 (100.0%) | 0 (0.0%) |
| 35 to 50 years | 0 (0.0%) | 0 (0.0%) |
| Total | 7 (33.3%) | 14 (66.7%) |
Fertility by Education in La Grange
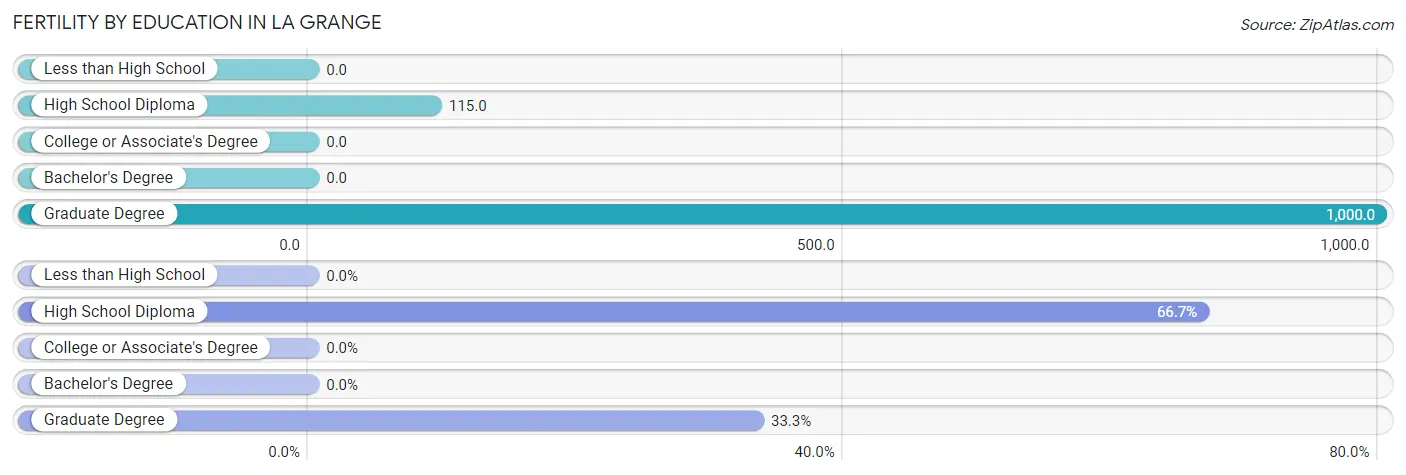
| Educational Attainment | Women with Births | Births / 1,000 Women |
| Less than High School | 0 (0.0%) | 0.0 |
| High School Diploma | 14 (66.7%) | 115.0 |
| College or Associate's Degree | 0 (0.0%) | 0.0 |
| Bachelor's Degree | 0 (0.0%) | 0.0 |
| Graduate Degree | 7 (33.3%) | 1,000.0 |
| Total | 21 (100.0%) | 76.0 |
Fertility by Education by Marriage Status in La Grange
66.7% of women with births in La Grange are unmarried. Women with the educational attainment of graduate degree are most likely to be married with 100.0% of them married at childbirth, while women with the educational attainment of high school diploma are least likely to be married with 100.0% of them unmarried at childbirth.
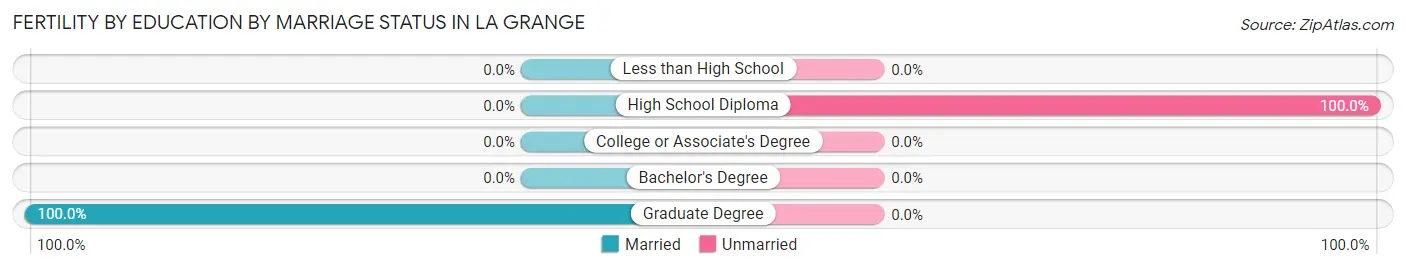
| Educational Attainment | Married | Unmarried |
| Less than High School | 0 (0.0%) | 0 (0.0%) |
| High School Diploma | 0 (0.0%) | 14 (100.0%) |
| College or Associate's Degree | 0 (0.0%) | 0 (0.0%) |
| Bachelor's Degree | 0 (0.0%) | 0 (0.0%) |
| Graduate Degree | 7 (100.0%) | 0 (0.0%) |
| Total | 7 (33.3%) | 14 (66.7%) |
Employment Characteristics in La Grange
Employment by Class of Employer in La Grange
Among the 432 employed individuals in La Grange, private company employees (372 | 86.1%), not-for-profit organizations (48 | 11.1%), and self-employed (not incorporated) (7 | 1.6%) make up the most common classes of employment.
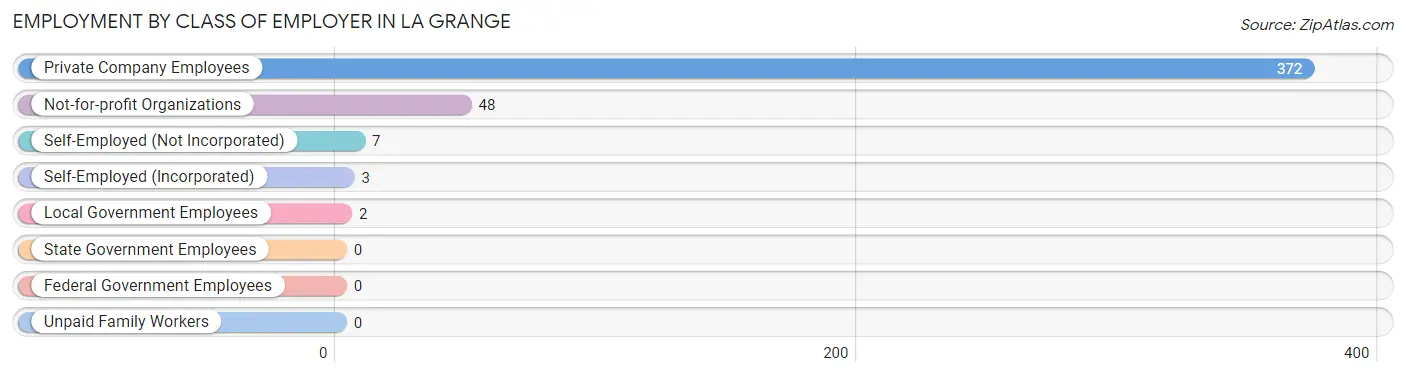
| Employer Class | # Employees | % Employees |
| Private Company Employees | 372 | 86.1% |
| Self-Employed (Incorporated) | 3 | 0.7% |
| Self-Employed (Not Incorporated) | 7 | 1.6% |
| Not-for-profit Organizations | 48 | 11.1% |
| Local Government Employees | 2 | 0.5% |
| State Government Employees | 0 | 0.0% |
| Federal Government Employees | 0 | 0.0% |
| Unpaid Family Workers | 0 | 0.0% |
| Total | 432 | 100.0% |
Employment Status by Age in La Grange
According to the labor force statistics for La Grange, out of the total population over 16 years of age (671), 65.4% or 439 individuals are in the labor force, with 1.1% or 5 of them unemployed. The age group with the highest labor force participation rate is 20 to 24 years, with 100.0% or 102 individuals in the labor force. Within the labor force, the 55 to 59 years age range has the highest percentage of unemployed individuals, with 16.1% or 5 of them being unemployed.
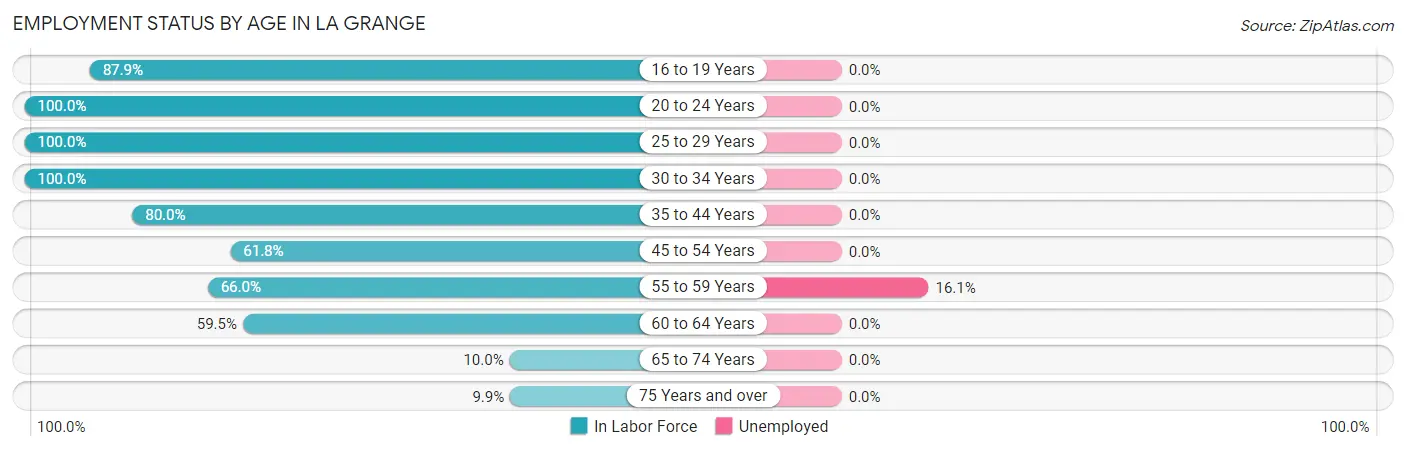
| Age Bracket | In Labor Force | Unemployed |
| 16 to 19 Years | 51 (87.9%) | 0 (0.0%) |
| 20 to 24 Years | 102 (100.0%) | 0 (0.0%) |
| 25 to 29 Years | 37 (100.0%) | 0 (0.0%) |
| 30 to 34 Years | 46 (100.0%) | 0 (0.0%) |
| 35 to 44 Years | 92 (80.0%) | 0 (0.0%) |
| 45 to 54 Years | 42 (61.8%) | 0 (0.0%) |
| 55 to 59 Years | 31 (66.0%) | 5 (16.1%) |
| 60 to 64 Years | 22 (59.5%) | 0 (0.0%) |
| 65 to 74 Years | 7 (10.0%) | 0 (0.0%) |
| 75 Years and over | 9 (9.9%) | 0 (0.0%) |
| Total | 439 (65.4%) | 5 (1.1%) |
Employment Status by Educational Attainment in La Grange
According to labor force statistics for La Grange, 77.1% of individuals (270) out of the total population between 25 and 64 years of age (350) are in the labor force, with 1.9% or 5 of them being unemployed. The group with the highest labor force participation rate are those with the educational attainment of bachelor's degree or higher, with 95.8% or 46 individuals in the labor force. Within the labor force, individuals with high school diploma education have the highest percentage of unemployment, with 3.3% or 5 of them being unemployed.
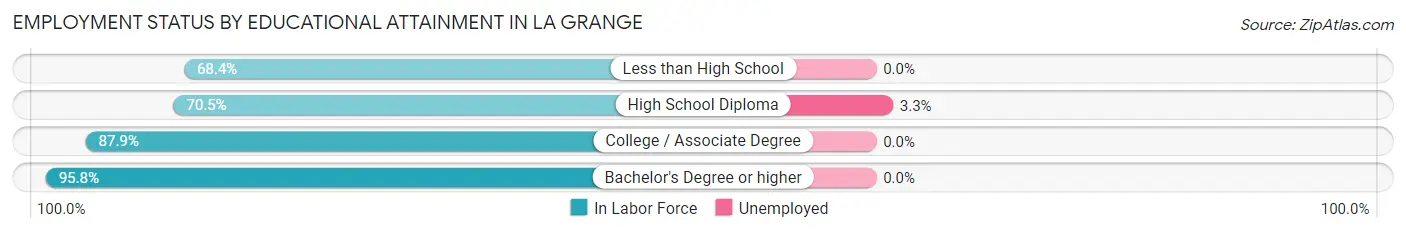
| Educational Attainment | In Labor Force | Unemployed |
| Less than High School | 13 (68.4%) | 0 (0.0%) |
| High School Diploma | 153 (70.5%) | 7 (3.3%) |
| College / Associate Degree | 58 (87.9%) | 0 (0.0%) |
| Bachelor's Degree or higher | 46 (95.8%) | 0 (0.0%) |
| Total | 270 (77.1%) | 7 (1.9%) |
Employment Occupations by Sex in La Grange
Management, Business, Science and Arts Occupations
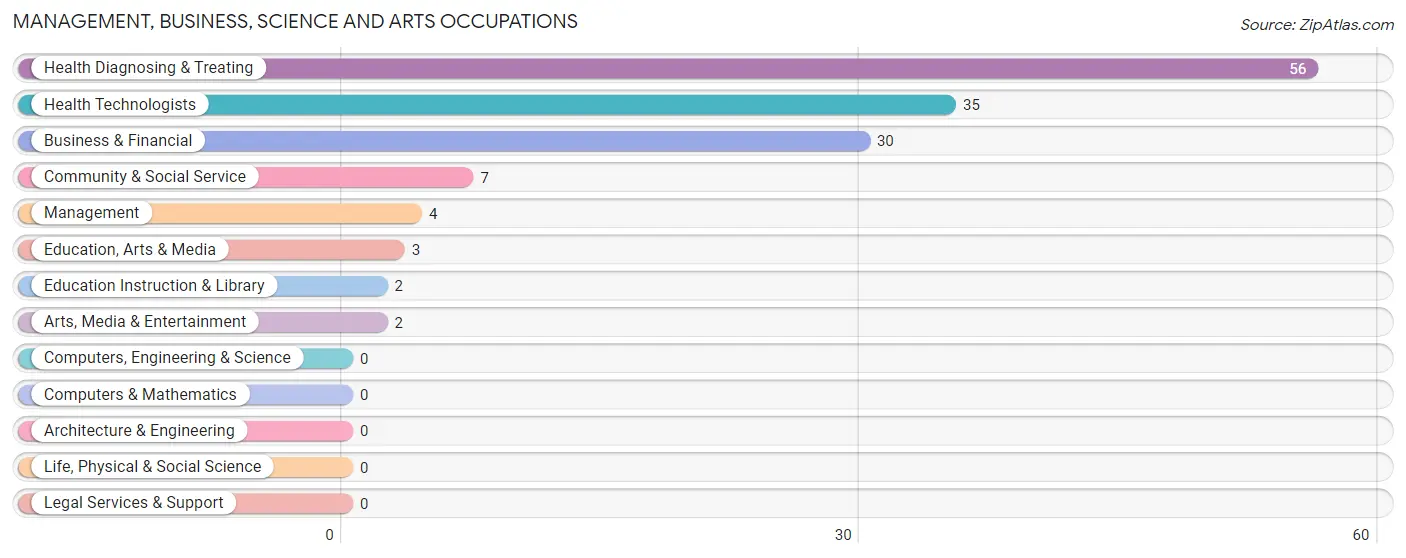
The most common Management, Business, Science and Arts occupations in La Grange are Health Diagnosing & Treating (56 | 12.9%), Health Technologists (35 | 8.1%), Business & Financial (30 | 6.9%), Community & Social Service (7 | 1.6%), and Management (4 | 0.9%).
Management, Business, Science and Arts Occupations by Sex
Within the Management, Business, Science and Arts occupations in La Grange, the most male-oriented occupations are Education, Arts & Media (100.0%), Education Instruction & Library (100.0%), and Community & Social Service (71.4%), while the most female-oriented occupations are Arts, Media & Entertainment (100.0%), Health Diagnosing & Treating (100.0%), and Health Technologists (100.0%).
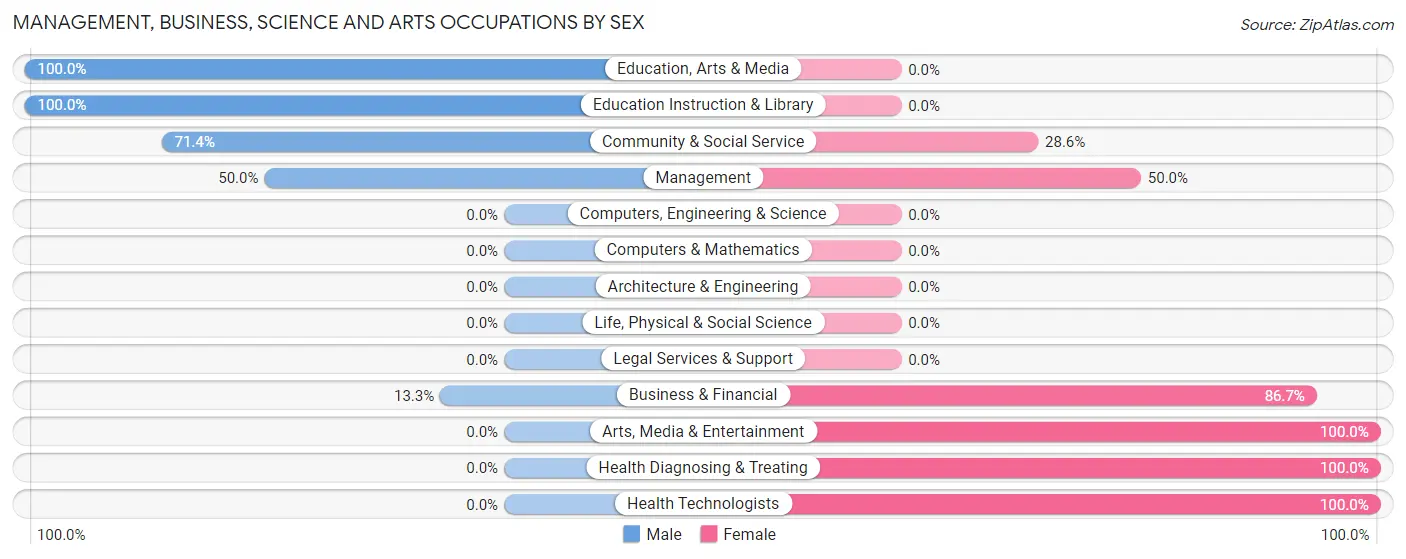
| Occupation | Male | Female |
| Management | 2 (50.0%) | 2 (50.0%) |
| Business & Financial | 4 (13.3%) | 26 (86.7%) |
| Computers, Engineering & Science | 0 (0.0%) | 0 (0.0%) |
| Computers & Mathematics | 0 (0.0%) | 0 (0.0%) |
| Architecture & Engineering | 0 (0.0%) | 0 (0.0%) |
| Life, Physical & Social Science | 0 (0.0%) | 0 (0.0%) |
| Community & Social Service | 5 (71.4%) | 2 (28.6%) |
| Education, Arts & Media | 3 (100.0%) | 0 (0.0%) |
| Legal Services & Support | 0 (0.0%) | 0 (0.0%) |
| Education Instruction & Library | 2 (100.0%) | 0 (0.0%) |
| Arts, Media & Entertainment | 0 (0.0%) | 2 (100.0%) |
| Health Diagnosing & Treating | 0 (0.0%) | 56 (100.0%) |
| Health Technologists | 0 (0.0%) | 35 (100.0%) |
| Total (Category) | 11 (11.3%) | 86 (88.7%) |
| Total (Overall) | 146 (33.6%) | 288 (66.4%) |
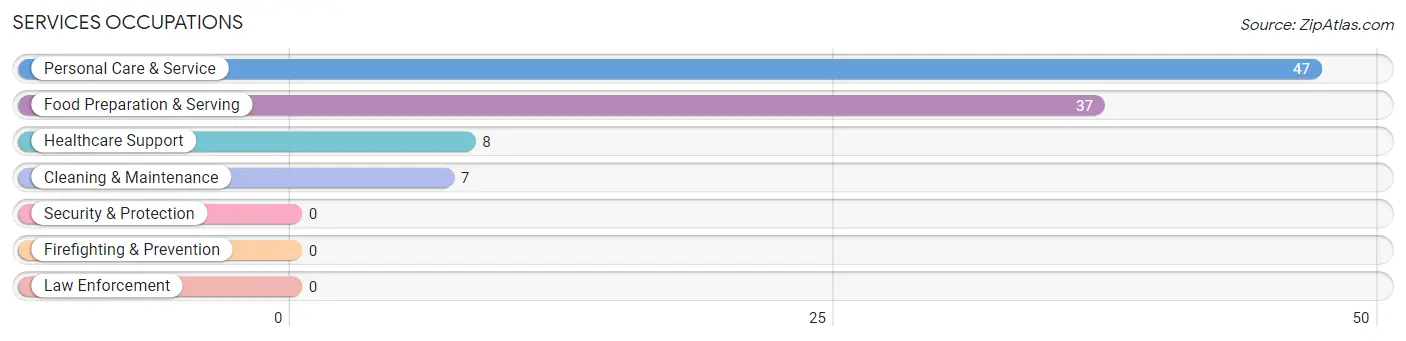
Services Occupations
The most common Services occupations in La Grange are Personal Care & Service (47 | 10.8%), Food Preparation & Serving (37 | 8.5%), Healthcare Support (8 | 1.8%), and Cleaning & Maintenance (7 | 1.6%).
Services Occupations by Sex
Within the Services occupations in La Grange, the most male-oriented occupations are Food Preparation & Serving (91.9%), and Cleaning & Maintenance (57.1%), while the most female-oriented occupations are Healthcare Support (100.0%), Personal Care & Service (100.0%), and Cleaning & Maintenance (42.9%).
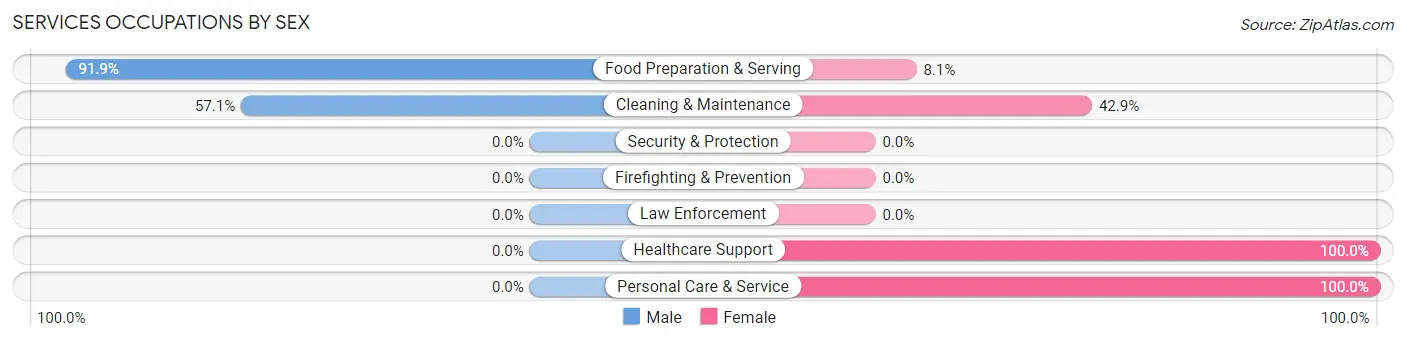
| Occupation | Male | Female |
| Healthcare Support | 0 (0.0%) | 8 (100.0%) |
| Security & Protection | 0 (0.0%) | 0 (0.0%) |
| Firefighting & Prevention | 0 (0.0%) | 0 (0.0%) |
| Law Enforcement | 0 (0.0%) | 0 (0.0%) |
| Food Preparation & Serving | 34 (91.9%) | 3 (8.1%) |
| Cleaning & Maintenance | 4 (57.1%) | 3 (42.9%) |
| Personal Care & Service | 0 (0.0%) | 47 (100.0%) |
| Total (Category) | 38 (38.4%) | 61 (61.6%) |
| Total (Overall) | 146 (33.6%) | 288 (66.4%) |
Sales and Office Occupations
The most common Sales and Office occupations in La Grange are Office & Administration (53 | 12.2%), and Sales & Related (40 | 9.2%).

Sales and Office Occupations by Sex

| Occupation | Male | Female |
| Sales & Related | 4 (10.0%) | 36 (90.0%) |
| Office & Administration | 0 (0.0%) | 53 (100.0%) |
| Total (Category) | 4 (4.3%) | 89 (95.7%) |
| Total (Overall) | 146 (33.6%) | 288 (66.4%) |
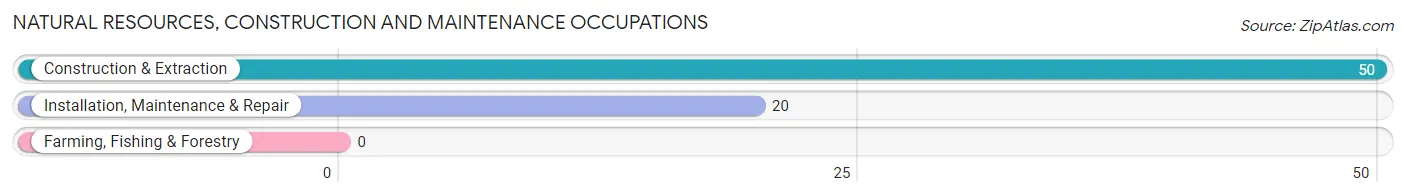
Natural Resources, Construction and Maintenance Occupations
The most common Natural Resources, Construction and Maintenance occupations in La Grange are Construction & Extraction (50 | 11.5%), and Installation, Maintenance & Repair (20 | 4.6%).
Natural Resources, Construction and Maintenance Occupations by Sex
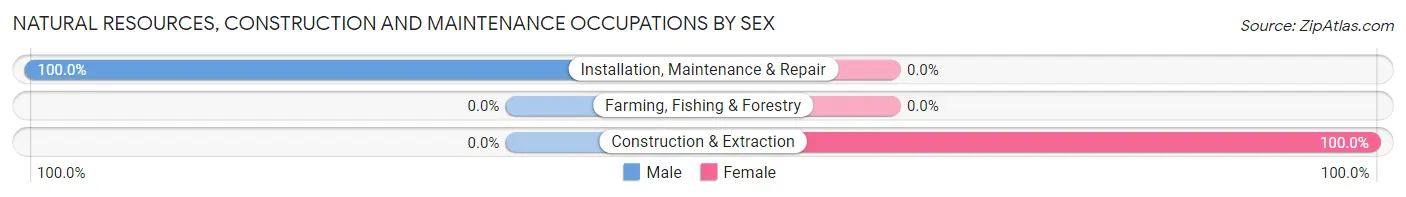
| Occupation | Male | Female |
| Farming, Fishing & Forestry | 0 (0.0%) | 0 (0.0%) |
| Construction & Extraction | 0 (0.0%) | 50 (100.0%) |
| Installation, Maintenance & Repair | 20 (100.0%) | 0 (0.0%) |
| Total (Category) | 20 (28.6%) | 50 (71.4%) |
| Total (Overall) | 146 (33.6%) | 288 (66.4%) |
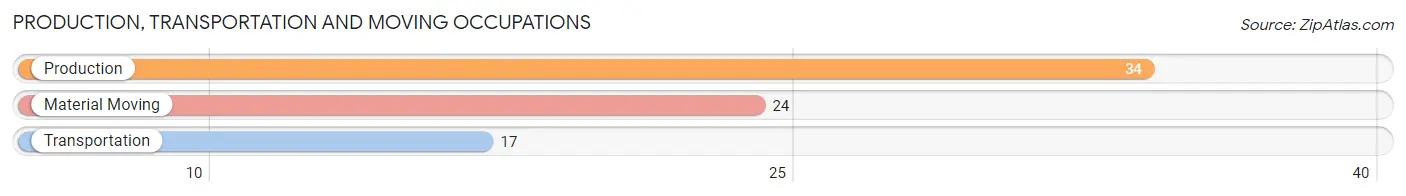
Production, Transportation and Moving Occupations
The most common Production, Transportation and Moving occupations in La Grange are Production (34 | 7.8%), Material Moving (24 | 5.5%), and Transportation (17 | 3.9%).
Production, Transportation and Moving Occupations by Sex
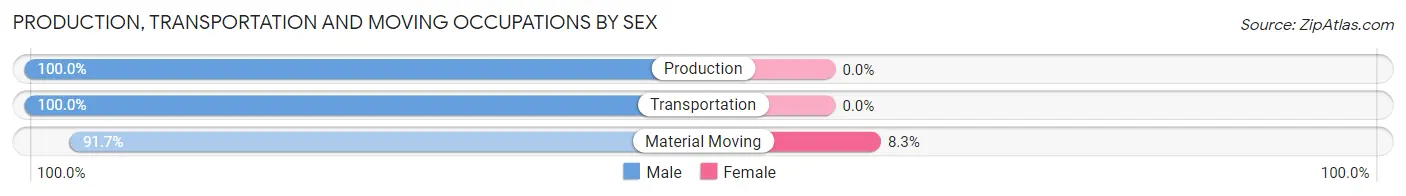
| Occupation | Male | Female |
| Production | 34 (100.0%) | 0 (0.0%) |
| Transportation | 17 (100.0%) | 0 (0.0%) |
| Material Moving | 22 (91.7%) | 2 (8.3%) |
| Total (Category) | 73 (97.3%) | 2 (2.7%) |
| Total (Overall) | 146 (33.6%) | 288 (66.4%) |
Employment Industries by Sex in La Grange
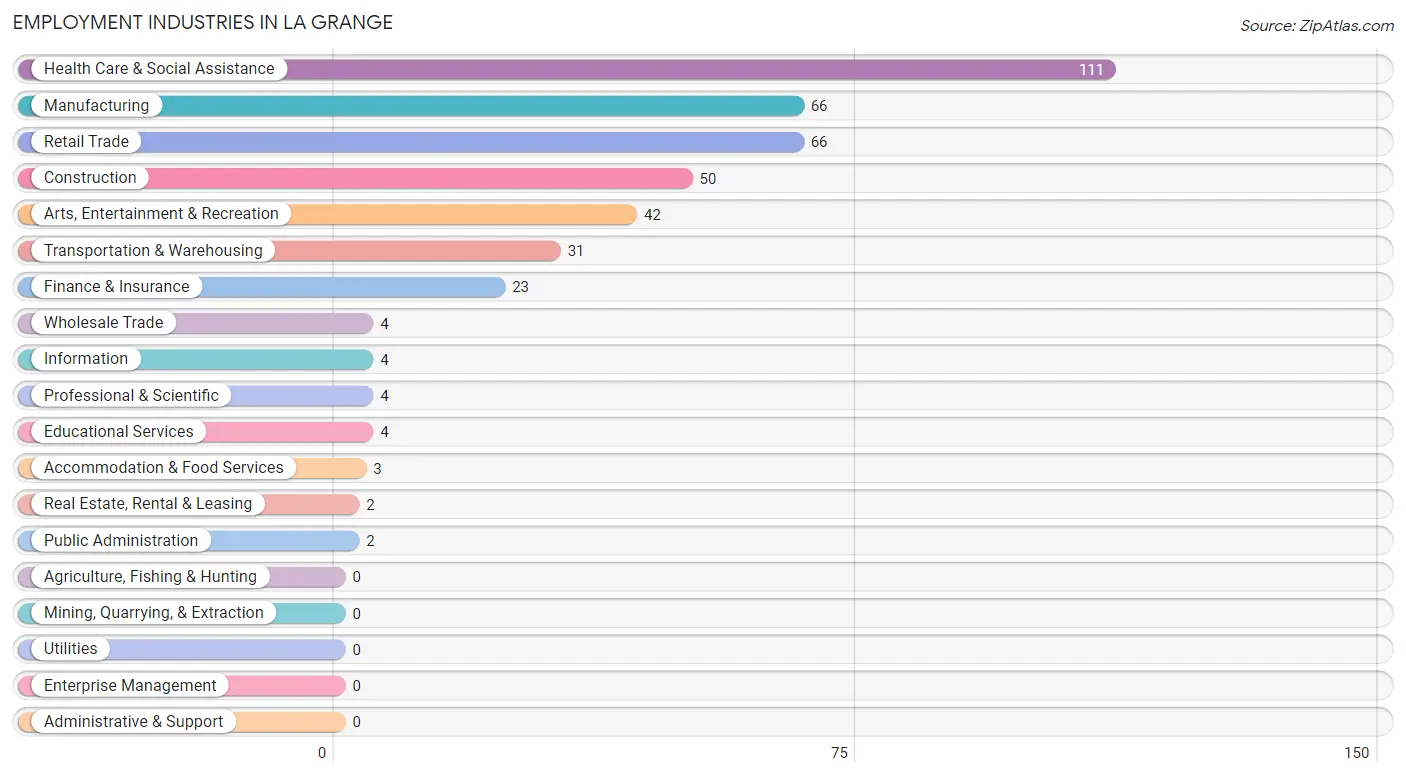
Employment Industries in La Grange
The major employment industries in La Grange include Health Care & Social Assistance (111 | 25.6%), Manufacturing (66 | 15.2%), Retail Trade (66 | 15.2%), Construction (50 | 11.5%), and Arts, Entertainment & Recreation (42 | 9.7%).
Employment Industries by Sex in La Grange
The La Grange industries that see more men than women are Real Estate, Rental & Leasing (100.0%), Public Administration (100.0%), and Arts, Entertainment & Recreation (85.7%), whereas the industries that tend to have a higher number of women are Construction (100.0%), Information (100.0%), and Finance & Insurance (100.0%).
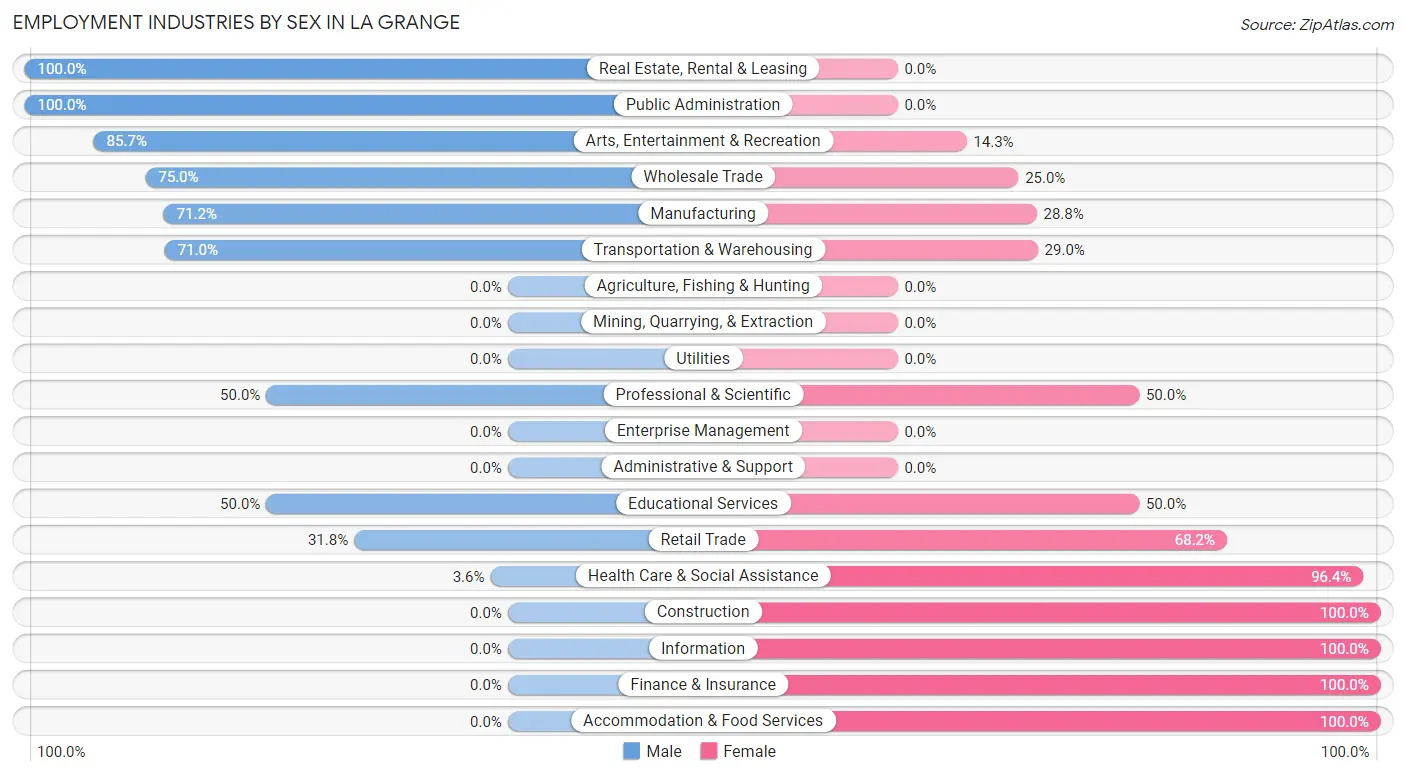
| Industry | Male | Female |
| Agriculture, Fishing & Hunting | 0 (0.0%) | 0 (0.0%) |
| Mining, Quarrying, & Extraction | 0 (0.0%) | 0 (0.0%) |
| Construction | 0 (0.0%) | 50 (100.0%) |
| Manufacturing | 47 (71.2%) | 19 (28.8%) |
| Wholesale Trade | 3 (75.0%) | 1 (25.0%) |
| Retail Trade | 21 (31.8%) | 45 (68.2%) |
| Transportation & Warehousing | 22 (71.0%) | 9 (29.0%) |
| Utilities | 0 (0.0%) | 0 (0.0%) |
| Information | 0 (0.0%) | 4 (100.0%) |
| Finance & Insurance | 0 (0.0%) | 23 (100.0%) |
| Real Estate, Rental & Leasing | 2 (100.0%) | 0 (0.0%) |
| Professional & Scientific | 2 (50.0%) | 2 (50.0%) |
| Enterprise Management | 0 (0.0%) | 0 (0.0%) |
| Administrative & Support | 0 (0.0%) | 0 (0.0%) |
| Educational Services | 2 (50.0%) | 2 (50.0%) |
| Health Care & Social Assistance | 4 (3.6%) | 107 (96.4%) |
| Arts, Entertainment & Recreation | 36 (85.7%) | 6 (14.3%) |
| Accommodation & Food Services | 0 (0.0%) | 3 (100.0%) |
| Public Administration | 2 (100.0%) | 0 (0.0%) |
| Total | 146 (33.6%) | 288 (66.4%) |
Education in La Grange
School Enrollment in La Grange
The most common levels of schooling among the 141 students in La Grange are high school (83 | 58.9%), middle school (34 | 24.1%), and graduate / professional (13 | 9.2%).
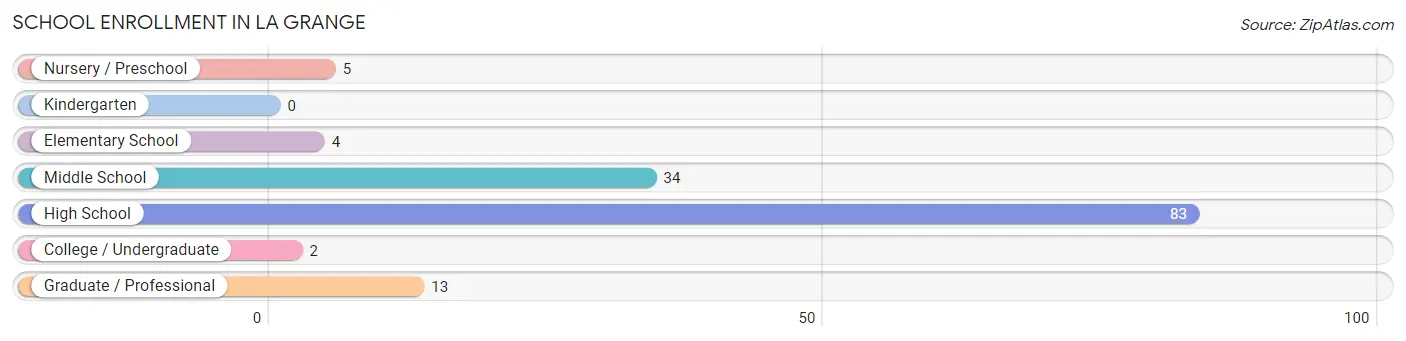
| School Level | # Students | % Students |
| Nursery / Preschool | 5 | 3.5% |
| Kindergarten | 0 | 0.0% |
| Elementary School | 4 | 2.8% |
| Middle School | 34 | 24.1% |
| High School | 83 | 58.9% |
| College / Undergraduate | 2 | 1.4% |
| Graduate / Professional | 13 | 9.2% |
| Total | 141 | 100.0% |
School Enrollment by Age by Funding Source in La Grange
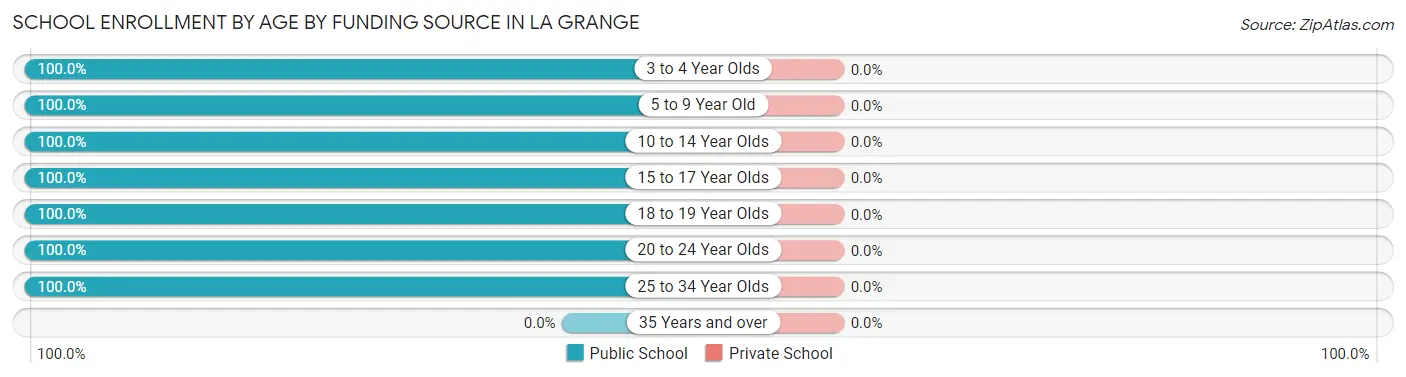
| Age Bracket | Public School | Private School |
| 3 to 4 Year Olds | 5 (100.0%) | 0 (0.0%) |
| 5 to 9 Year Old | 4 (100.0%) | 0 (0.0%) |
| 10 to 14 Year Olds | 73 (100.0%) | 0 (0.0%) |
| 15 to 17 Year Olds | 41 (100.0%) | 0 (0.0%) |
| 18 to 19 Year Olds | 3 (100.0%) | 0 (0.0%) |
| 20 to 24 Year Olds | 2 (100.0%) | 0 (0.0%) |
| 25 to 34 Year Olds | 13 (100.0%) | 0 (0.0%) |
| 35 Years and over | 0 (0.0%) | 0 (0.0%) |
| Total | 141 (100.0%) | 0 (0.0%) |
Educational Attainment by Field of Study in La Grange
Science & technology (37 | 50.7%), education (17 | 23.3%), visual & performing arts (7 | 9.6%), business (6 | 8.2%), and computers & mathematics (2 | 2.7%) are the most common fields of study among 73 individuals in La Grange who have obtained a bachelor's degree or higher.
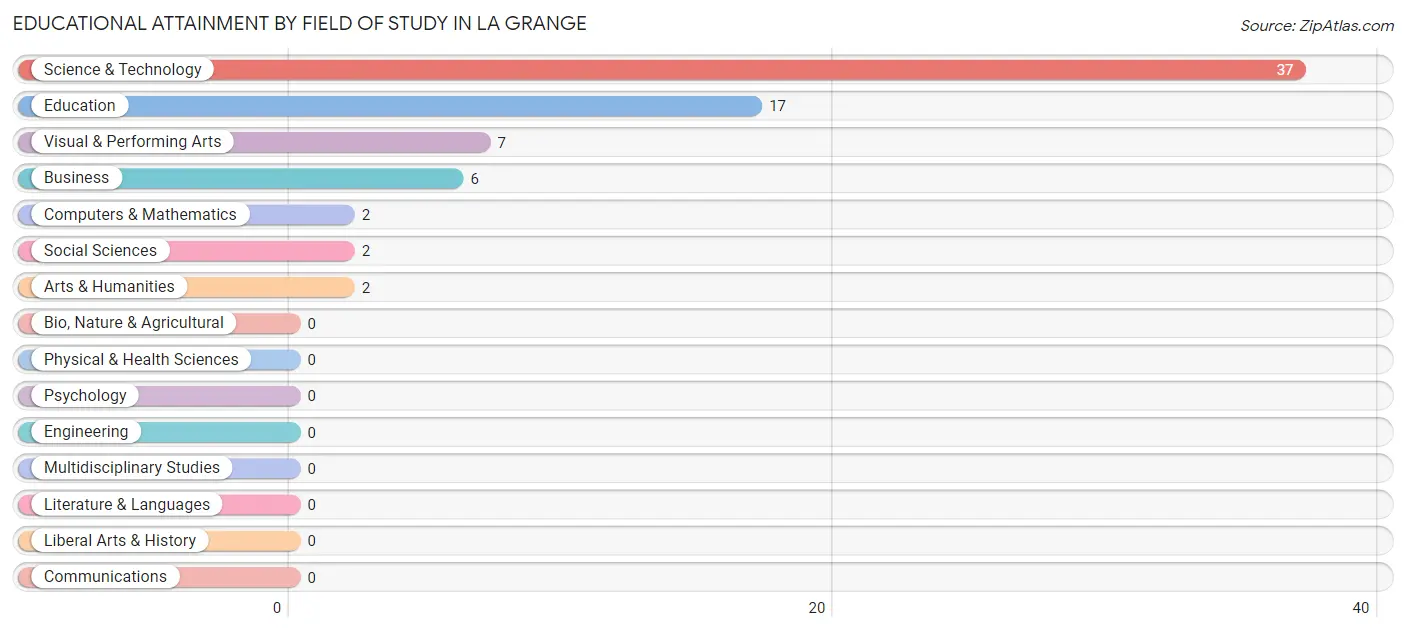
| Field of Study | # Graduates | % Graduates |
| Computers & Mathematics | 2 | 2.7% |
| Bio, Nature & Agricultural | 0 | 0.0% |
| Physical & Health Sciences | 0 | 0.0% |
| Psychology | 0 | 0.0% |
| Social Sciences | 2 | 2.7% |
| Engineering | 0 | 0.0% |
| Multidisciplinary Studies | 0 | 0.0% |
| Science & Technology | 37 | 50.7% |
| Business | 6 | 8.2% |
| Education | 17 | 23.3% |
| Literature & Languages | 0 | 0.0% |
| Liberal Arts & History | 0 | 0.0% |
| Visual & Performing Arts | 7 | 9.6% |
| Communications | 0 | 0.0% |
| Arts & Humanities | 2 | 2.7% |
| Total | 73 | 100.0% |
Transportation & Commute in La Grange
Vehicle Availability by Sex in La Grange
The most prevalent vehicle ownership categories in La Grange are males with 3 vehicles (66, accounting for 45.8%) and females with 3 vehicles (69, making up 22.9%).
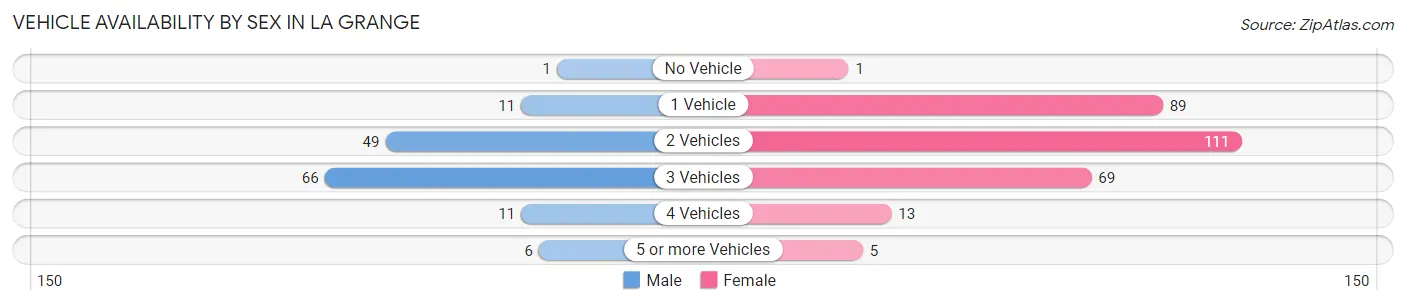
| Vehicles Available | Male | Female |
| No Vehicle | 1 (0.7%) | 1 (0.4%) |
| 1 Vehicle | 11 (7.6%) | 89 (30.9%) |
| 2 Vehicles | 49 (34.0%) | 111 (38.5%) |
| 3 Vehicles | 66 (45.8%) | 69 (24.0%) |
| 4 Vehicles | 11 (7.6%) | 13 (4.5%) |
| 5 or more Vehicles | 6 (4.2%) | 5 (1.7%) |
| Total | 144 (100.0%) | 288 (100.0%) |
Commute Time in La Grange
The most frequently occuring commute durations in La Grange are less than 5 minutes (98 commuters, 24.4%), 10 to 14 minutes (76 commuters, 19.0%), and 30 to 34 minutes (75 commuters, 18.7%).
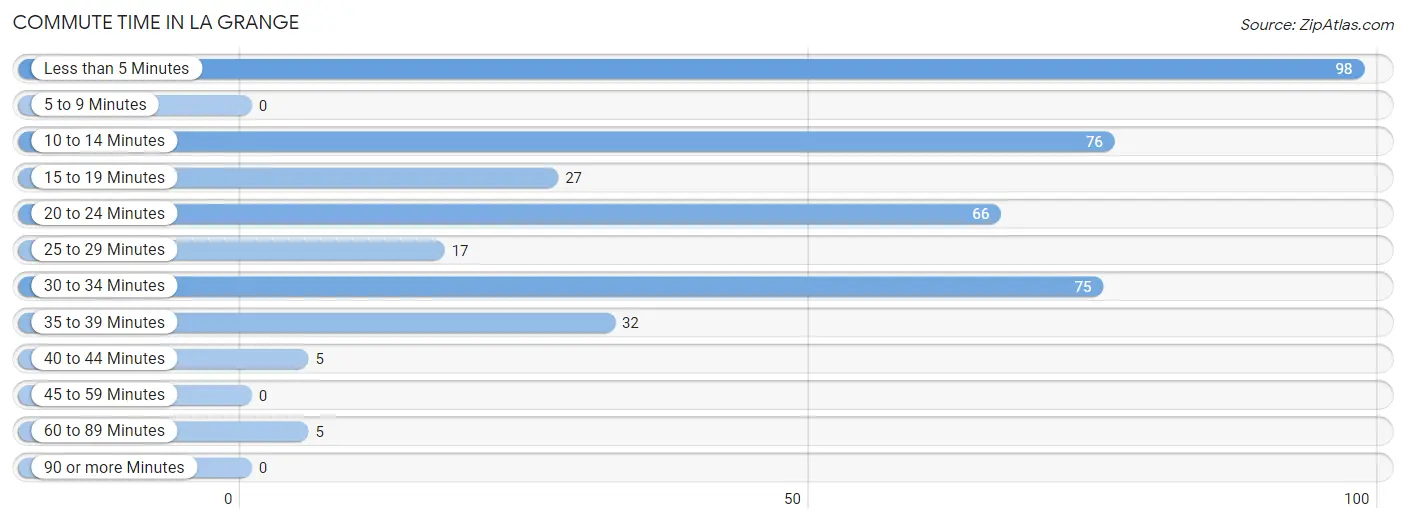
| Commute Time | # Commuters | % Commuters |
| Less than 5 Minutes | 98 | 24.4% |
| 5 to 9 Minutes | 0 | 0.0% |
| 10 to 14 Minutes | 76 | 19.0% |
| 15 to 19 Minutes | 27 | 6.7% |
| 20 to 24 Minutes | 66 | 16.5% |
| 25 to 29 Minutes | 17 | 4.2% |
| 30 to 34 Minutes | 75 | 18.7% |
| 35 to 39 Minutes | 32 | 8.0% |
| 40 to 44 Minutes | 5 | 1.3% |
| 45 to 59 Minutes | 0 | 0.0% |
| 60 to 89 Minutes | 5 | 1.3% |
| 90 or more Minutes | 0 | 0.0% |
Commute Time by Sex in La Grange
The most common commute times in La Grange are less than 5 minutes (44 commuters, 34.4%) for males and 10 to 14 minutes (74 commuters, 27.1%) for females.
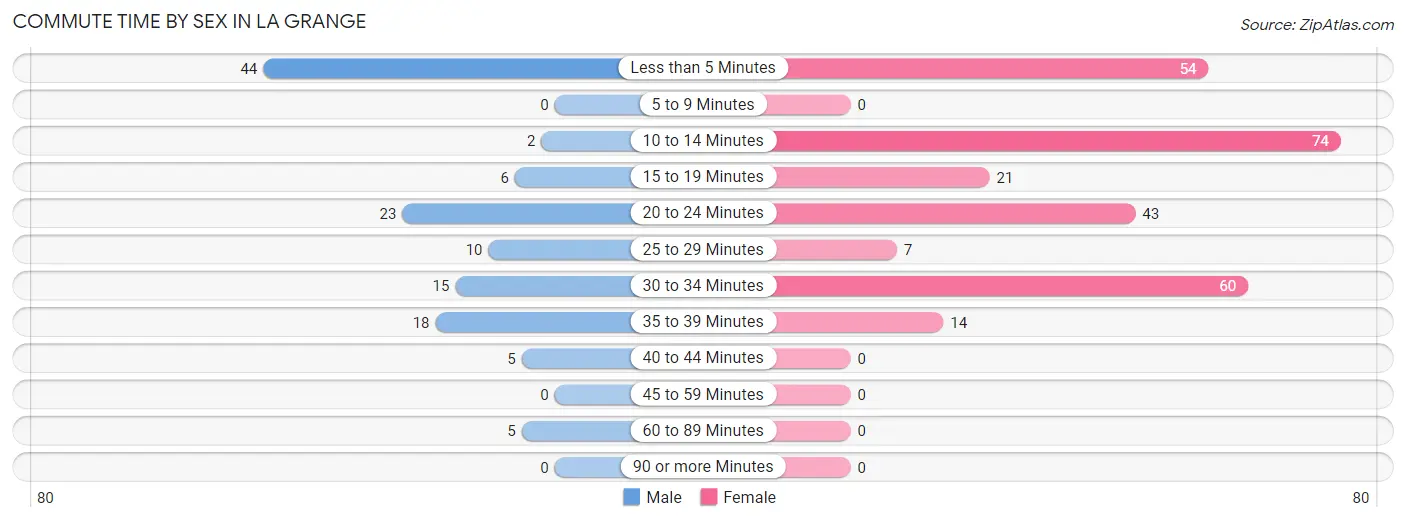
| Commute Time | Male | Female |
| Less than 5 Minutes | 44 (34.4%) | 54 (19.8%) |
| 5 to 9 Minutes | 0 (0.0%) | 0 (0.0%) |
| 10 to 14 Minutes | 2 (1.6%) | 74 (27.1%) |
| 15 to 19 Minutes | 6 (4.7%) | 21 (7.7%) |
| 20 to 24 Minutes | 23 (18.0%) | 43 (15.8%) |
| 25 to 29 Minutes | 10 (7.8%) | 7 (2.6%) |
| 30 to 34 Minutes | 15 (11.7%) | 60 (22.0%) |
| 35 to 39 Minutes | 18 (14.1%) | 14 (5.1%) |
| 40 to 44 Minutes | 5 (3.9%) | 0 (0.0%) |
| 45 to 59 Minutes | 0 (0.0%) | 0 (0.0%) |
| 60 to 89 Minutes | 5 (3.9%) | 0 (0.0%) |
| 90 or more Minutes | 0 (0.0%) | 0 (0.0%) |
Time of Departure to Work by Sex in La Grange
The most frequent times of departure to work in La Grange are 4:00 PM to 11:59 PM (34, 26.6%) for males and 7:00 AM to 7:29 AM (122, 44.7%) for females.
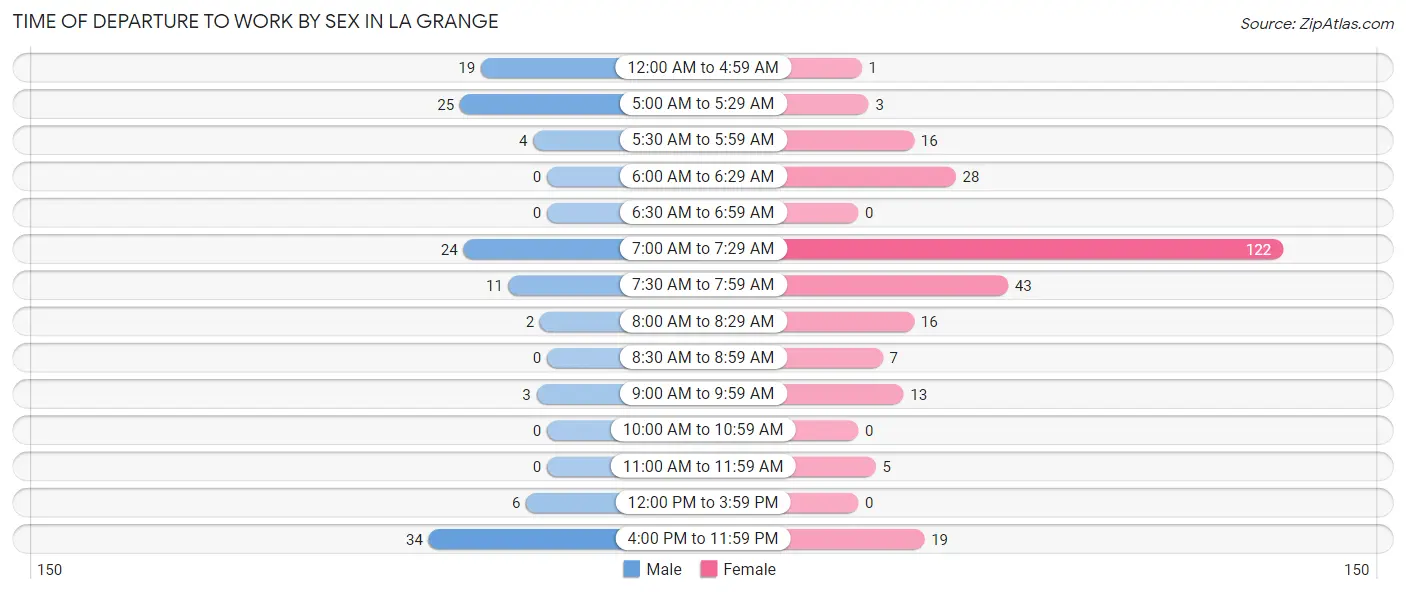
| Time of Departure | Male | Female |
| 12:00 AM to 4:59 AM | 19 (14.8%) | 1 (0.4%) |
| 5:00 AM to 5:29 AM | 25 (19.5%) | 3 (1.1%) |
| 5:30 AM to 5:59 AM | 4 (3.1%) | 16 (5.9%) |
| 6:00 AM to 6:29 AM | 0 (0.0%) | 28 (10.3%) |
| 6:30 AM to 6:59 AM | 0 (0.0%) | 0 (0.0%) |
| 7:00 AM to 7:29 AM | 24 (18.8%) | 122 (44.7%) |
| 7:30 AM to 7:59 AM | 11 (8.6%) | 43 (15.8%) |
| 8:00 AM to 8:29 AM | 2 (1.6%) | 16 (5.9%) |
| 8:30 AM to 8:59 AM | 0 (0.0%) | 7 (2.6%) |
| 9:00 AM to 9:59 AM | 3 (2.3%) | 13 (4.8%) |
| 10:00 AM to 10:59 AM | 0 (0.0%) | 0 (0.0%) |
| 11:00 AM to 11:59 AM | 0 (0.0%) | 5 (1.8%) |
| 12:00 PM to 3:59 PM | 6 (4.7%) | 0 (0.0%) |
| 4:00 PM to 11:59 PM | 34 (26.6%) | 19 (7.0%) |
| Total | 128 (100.0%) | 273 (100.0%) |
Housing Occupancy in La Grange
Occupancy by Ownership in La Grange
Of the total 288 dwellings in La Grange, owner-occupied units account for 241 (83.7%), while renter-occupied units make up 47 (16.3%).
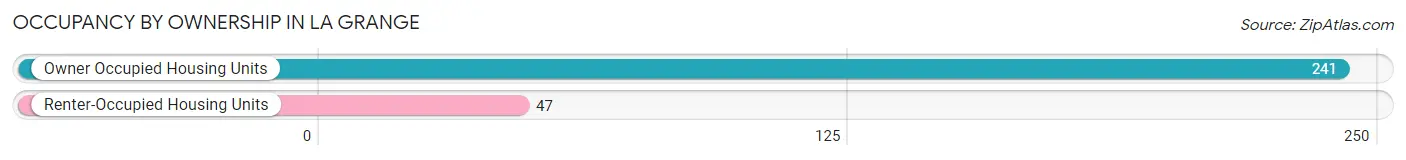
| Occupancy | # Housing Units | % Housing Units |
| Owner Occupied Housing Units | 241 | 83.7% |
| Renter-Occupied Housing Units | 47 | 16.3% |
| Total Occupied Housing Units | 288 | 100.0% |
Occupancy by Household Size in La Grange
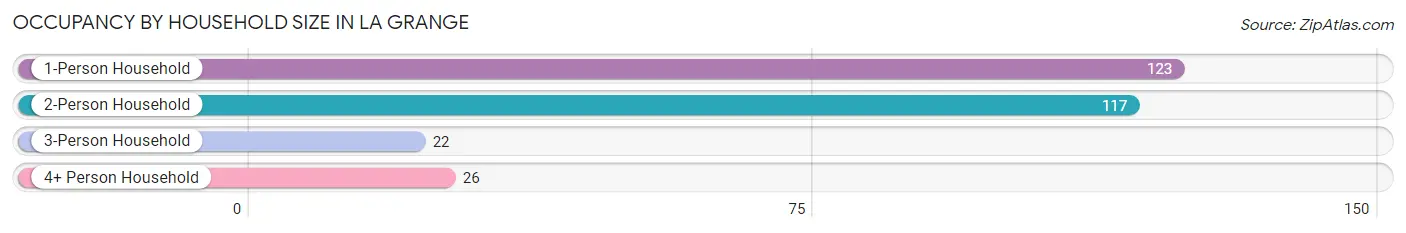
| Household Size | # Housing Units | % Housing Units |
| 1-Person Household | 123 | 42.7% |
| 2-Person Household | 117 | 40.6% |
| 3-Person Household | 22 | 7.6% |
| 4+ Person Household | 26 | 9.0% |
| Total Housing Units | 288 | 100.0% |
Occupancy by Ownership by Household Size in La Grange
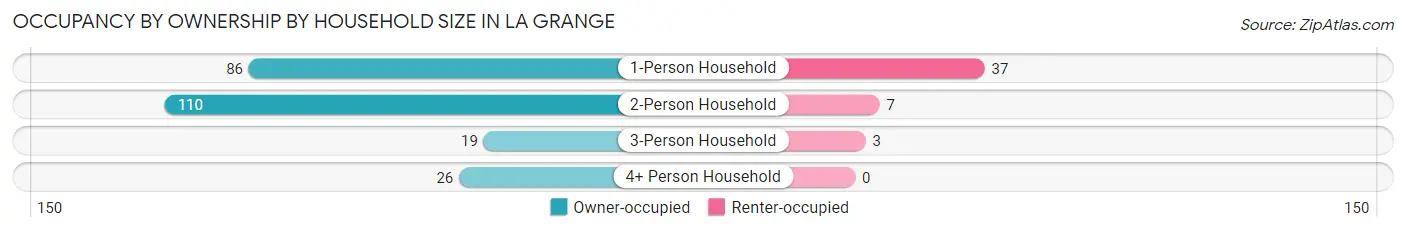
| Household Size | Owner-occupied | Renter-occupied |
| 1-Person Household | 86 (69.9%) | 37 (30.1%) |
| 2-Person Household | 110 (94.0%) | 7 (6.0%) |
| 3-Person Household | 19 (86.4%) | 3 (13.6%) |
| 4+ Person Household | 26 (100.0%) | 0 (0.0%) |
| Total Housing Units | 241 (83.7%) | 47 (16.3%) |
Occupancy by Educational Attainment in La Grange
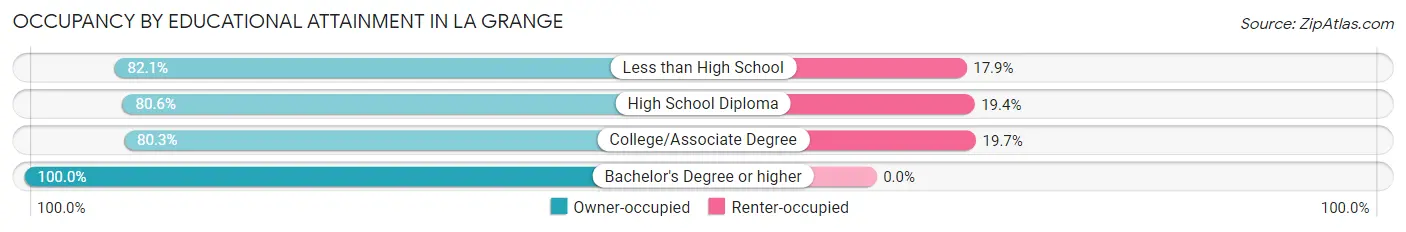
| Household Size | Owner-occupied | Renter-occupied |
| Less than High School | 23 (82.1%) | 5 (17.9%) |
| High School Diploma | 116 (80.6%) | 28 (19.4%) |
| College/Associate Degree | 57 (80.3%) | 14 (19.7%) |
| Bachelor's Degree or higher | 45 (100.0%) | 0 (0.0%) |
Occupancy by Age of Householder in La Grange
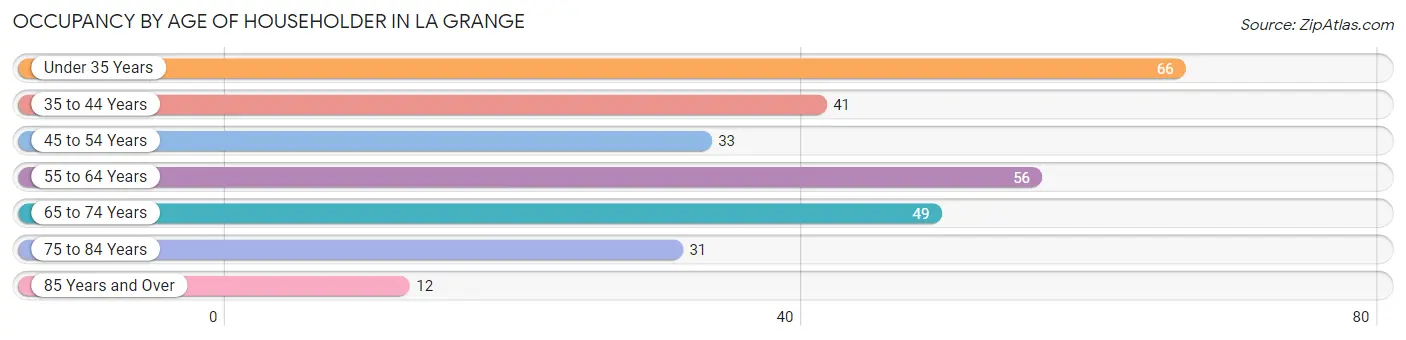
| Age Bracket | # Households | % Households |
| Under 35 Years | 66 | 22.9% |
| 35 to 44 Years | 41 | 14.2% |
| 45 to 54 Years | 33 | 11.5% |
| 55 to 64 Years | 56 | 19.4% |
| 65 to 74 Years | 49 | 17.0% |
| 75 to 84 Years | 31 | 10.8% |
| 85 Years and Over | 12 | 4.2% |
| Total | 288 | 100.0% |
Housing Finances in La Grange
Median Income by Occupancy in La Grange
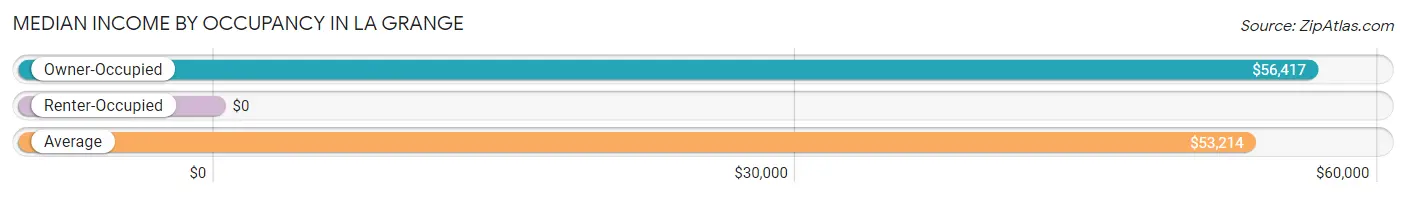
| Occupancy Type | # Households | Median Income |
| Owner-Occupied | 241 (83.7%) | $56,417 |
| Renter-Occupied | 47 (16.3%) | $0 |
| Average | 288 (100.0%) | $53,214 |
Occupancy by Householder Income Bracket in La Grange
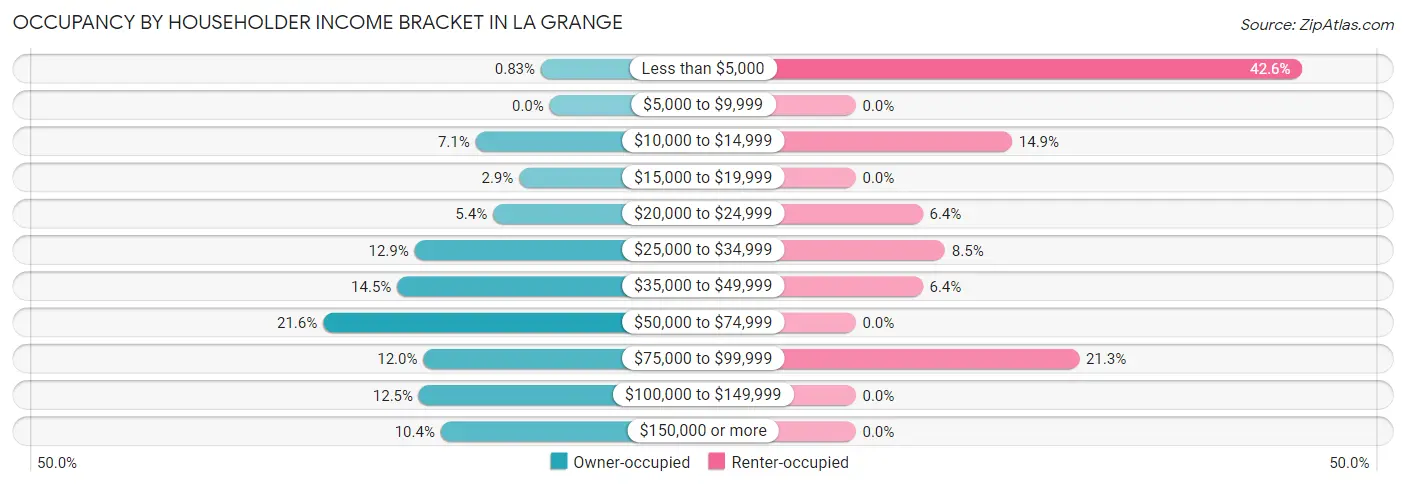
| Income Bracket | Owner-occupied | Renter-occupied |
| Less than $5,000 | 2 (0.8%) | 20 (42.5%) |
| $5,000 to $9,999 | 0 (0.0%) | 0 (0.0%) |
| $10,000 to $14,999 | 17 (7.0%) | 7 (14.9%) |
| $15,000 to $19,999 | 7 (2.9%) | 0 (0.0%) |
| $20,000 to $24,999 | 13 (5.4%) | 3 (6.4%) |
| $25,000 to $34,999 | 31 (12.9%) | 4 (8.5%) |
| $35,000 to $49,999 | 35 (14.5%) | 3 (6.4%) |
| $50,000 to $74,999 | 52 (21.6%) | 0 (0.0%) |
| $75,000 to $99,999 | 29 (12.0%) | 10 (21.3%) |
| $100,000 to $149,999 | 30 (12.4%) | 0 (0.0%) |
| $150,000 or more | 25 (10.4%) | 0 (0.0%) |
| Total | 241 (100.0%) | 47 (100.0%) |
Monthly Housing Cost Tiers in La Grange
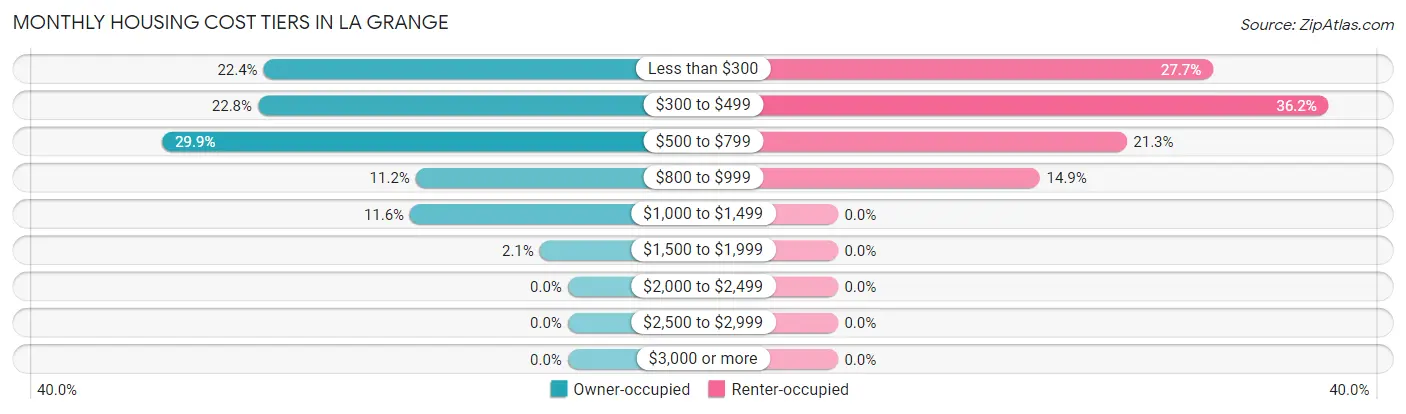
| Monthly Cost | Owner-occupied | Renter-occupied |
| Less than $300 | 54 (22.4%) | 13 (27.7%) |
| $300 to $499 | 55 (22.8%) | 17 (36.2%) |
| $500 to $799 | 72 (29.9%) | 10 (21.3%) |
| $800 to $999 | 27 (11.2%) | 7 (14.9%) |
| $1,000 to $1,499 | 28 (11.6%) | 0 (0.0%) |
| $1,500 to $1,999 | 5 (2.1%) | 0 (0.0%) |
| $2,000 to $2,499 | 0 (0.0%) | 0 (0.0%) |
| $2,500 to $2,999 | 0 (0.0%) | 0 (0.0%) |
| $3,000 or more | 0 (0.0%) | 0 (0.0%) |
| Total | 241 (100.0%) | 47 (100.0%) |
Physical Housing Characteristics in La Grange
Housing Structures in La Grange
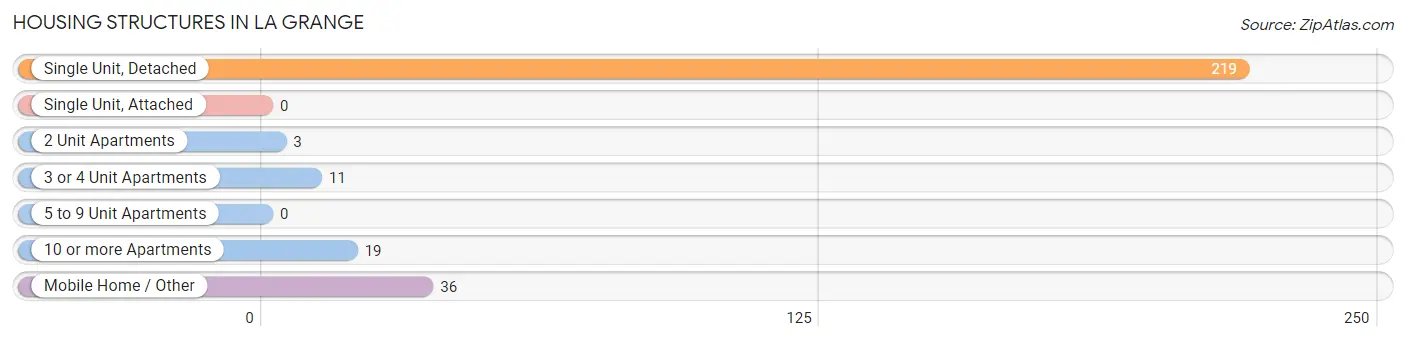
| Structure Type | # Housing Units | % Housing Units |
| Single Unit, Detached | 219 | 76.0% |
| Single Unit, Attached | 0 | 0.0% |
| 2 Unit Apartments | 3 | 1.0% |
| 3 or 4 Unit Apartments | 11 | 3.8% |
| 5 to 9 Unit Apartments | 0 | 0.0% |
| 10 or more Apartments | 19 | 6.6% |
| Mobile Home / Other | 36 | 12.5% |
| Total | 288 | 100.0% |
Housing Structures by Occupancy in La Grange
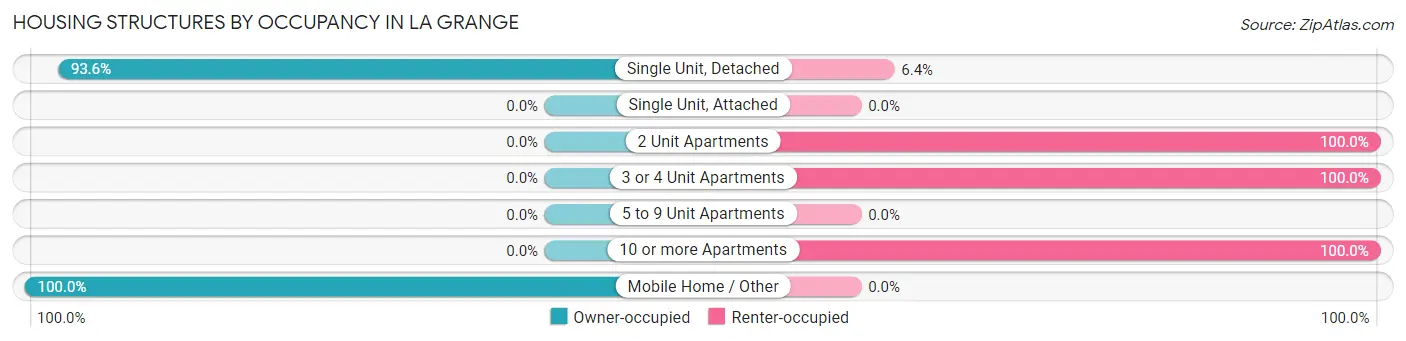
| Structure Type | Owner-occupied | Renter-occupied |
| Single Unit, Detached | 205 (93.6%) | 14 (6.4%) |
| Single Unit, Attached | 0 (0.0%) | 0 (0.0%) |
| 2 Unit Apartments | 0 (0.0%) | 3 (100.0%) |
| 3 or 4 Unit Apartments | 0 (0.0%) | 11 (100.0%) |
| 5 to 9 Unit Apartments | 0 (0.0%) | 0 (0.0%) |
| 10 or more Apartments | 0 (0.0%) | 19 (100.0%) |
| Mobile Home / Other | 36 (100.0%) | 0 (0.0%) |
| Total | 241 (83.7%) | 47 (16.3%) |
Housing Structures by Number of Rooms in La Grange
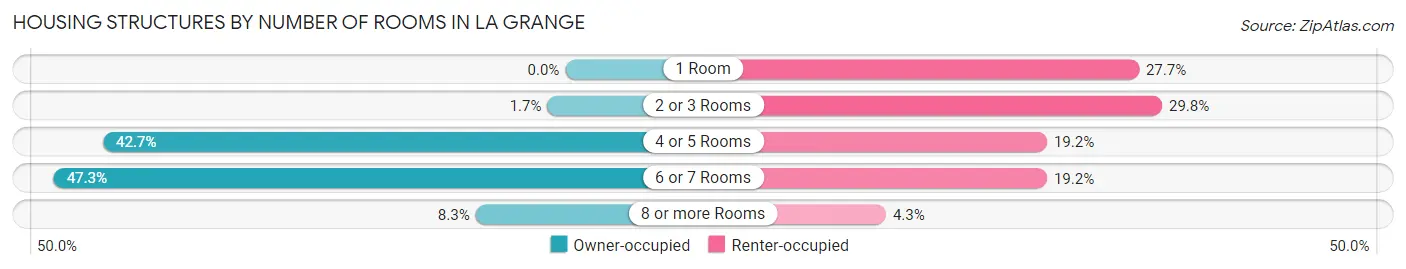
| Number of Rooms | Owner-occupied | Renter-occupied |
| 1 Room | 0 (0.0%) | 13 (27.7%) |
| 2 or 3 Rooms | 4 (1.7%) | 14 (29.8%) |
| 4 or 5 Rooms | 103 (42.7%) | 9 (19.2%) |
| 6 or 7 Rooms | 114 (47.3%) | 9 (19.2%) |
| 8 or more Rooms | 20 (8.3%) | 2 (4.3%) |
| Total | 241 (100.0%) | 47 (100.0%) |
Housing Structure by Heating Type in La Grange
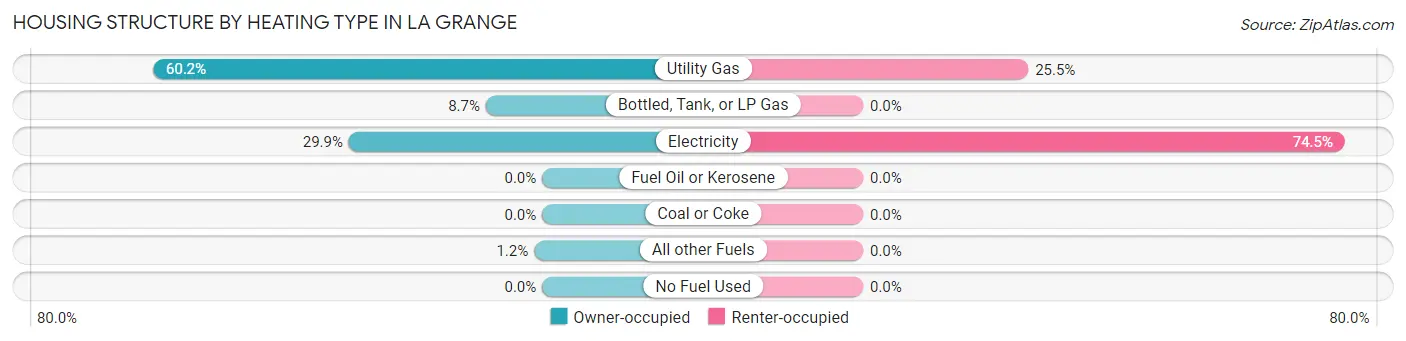
| Heating Type | Owner-occupied | Renter-occupied |
| Utility Gas | 145 (60.2%) | 12 (25.5%) |
| Bottled, Tank, or LP Gas | 21 (8.7%) | 0 (0.0%) |
| Electricity | 72 (29.9%) | 35 (74.5%) |
| Fuel Oil or Kerosene | 0 (0.0%) | 0 (0.0%) |
| Coal or Coke | 0 (0.0%) | 0 (0.0%) |
| All other Fuels | 3 (1.2%) | 0 (0.0%) |
| No Fuel Used | 0 (0.0%) | 0 (0.0%) |
| Total | 241 (100.0%) | 47 (100.0%) |
Household Vehicle Usage in La Grange
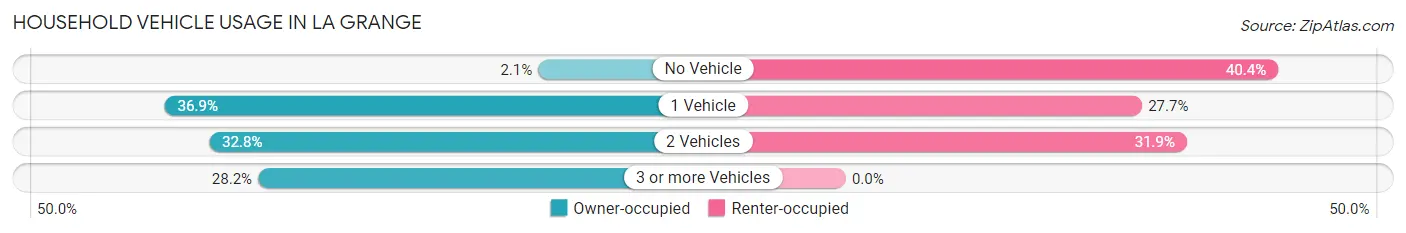
| Vehicles per Household | Owner-occupied | Renter-occupied |
| No Vehicle | 5 (2.1%) | 19 (40.4%) |
| 1 Vehicle | 89 (36.9%) | 13 (27.7%) |
| 2 Vehicles | 79 (32.8%) | 15 (31.9%) |
| 3 or more Vehicles | 68 (28.2%) | 0 (0.0%) |
| Total | 241 (100.0%) | 47 (100.0%) |
Real Estate & Mortgages in La Grange
Real Estate and Mortgage Overview in La Grange
| Characteristic | Without Mortgage | With Mortgage |
| Housing Units | 119 | 122 |
| Median Property Value | $75,700 | $107,100 |
| Median Household Income | $36,250 | $25 |
| Monthly Housing Costs | $339 | $0 |
| Real Estate Taxes | $655 | $2 |
Property Value by Mortgage Status in La Grange
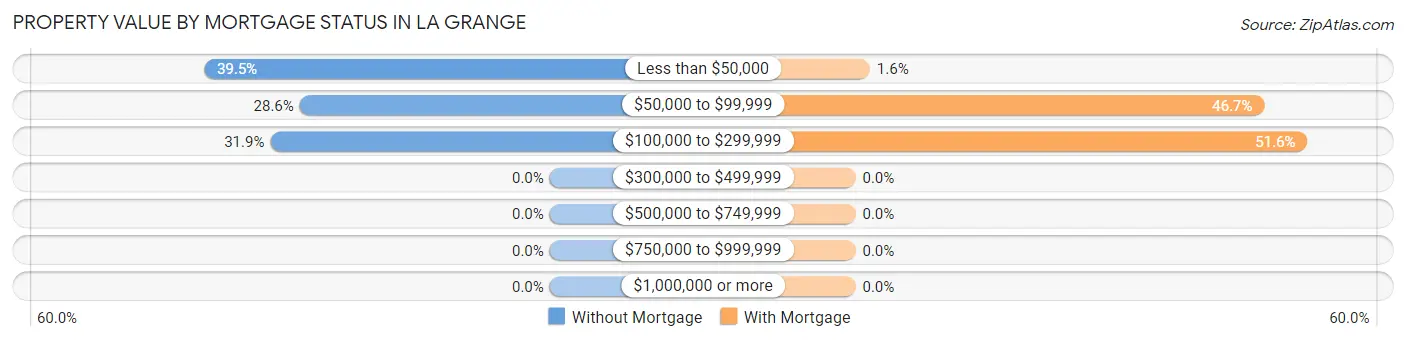
| Property Value | Without Mortgage | With Mortgage |
| Less than $50,000 | 47 (39.5%) | 2 (1.6%) |
| $50,000 to $99,999 | 34 (28.6%) | 57 (46.7%) |
| $100,000 to $299,999 | 38 (31.9%) | 63 (51.6%) |
| $300,000 to $499,999 | 0 (0.0%) | 0 (0.0%) |
| $500,000 to $749,999 | 0 (0.0%) | 0 (0.0%) |
| $750,000 to $999,999 | 0 (0.0%) | 0 (0.0%) |
| $1,000,000 or more | 0 (0.0%) | 0 (0.0%) |
| Total | 119 (100.0%) | 122 (100.0%) |
Household Income by Mortgage Status in La Grange
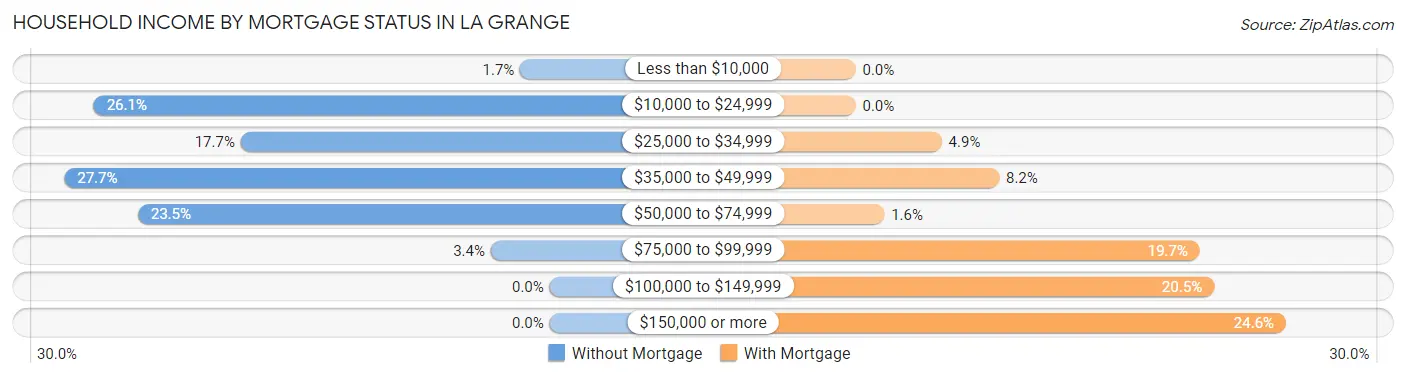
| Household Income | Without Mortgage | With Mortgage |
| Less than $10,000 | 2 (1.7%) | 0 (0.0%) |
| $10,000 to $24,999 | 31 (26.1%) | 0 (0.0%) |
| $25,000 to $34,999 | 21 (17.6%) | 6 (4.9%) |
| $35,000 to $49,999 | 33 (27.7%) | 10 (8.2%) |
| $50,000 to $74,999 | 28 (23.5%) | 2 (1.6%) |
| $75,000 to $99,999 | 4 (3.4%) | 24 (19.7%) |
| $100,000 to $149,999 | 0 (0.0%) | 25 (20.5%) |
| $150,000 or more | 0 (0.0%) | 30 (24.6%) |
| Total | 119 (100.0%) | 122 (100.0%) |
Property Value to Household Income Ratio in La Grange
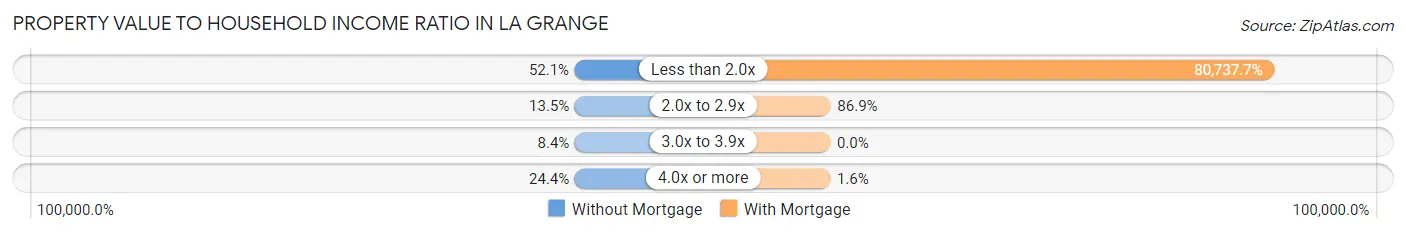
| Value-to-Income Ratio | Without Mortgage | With Mortgage |
| Less than 2.0x | 62 (52.1%) | 98,500 (80,737.7%) |
| 2.0x to 2.9x | 16 (13.5%) | 106 (86.9%) |
| 3.0x to 3.9x | 10 (8.4%) | 0 (0.0%) |
| 4.0x or more | 29 (24.4%) | 2 (1.6%) |
| Total | 119 (100.0%) | 122 (100.0%) |
Real Estate Taxes by Mortgage Status in La Grange
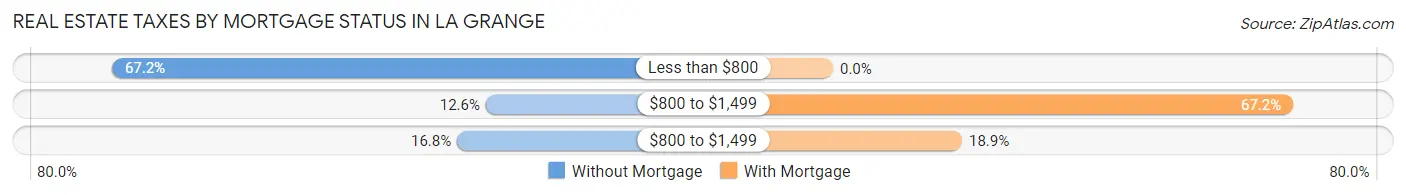
| Property Taxes | Without Mortgage | With Mortgage |
| Less than $800 | 80 (67.2%) | 0 (0.0%) |
| $800 to $1,499 | 15 (12.6%) | 82 (67.2%) |
| $800 to $1,499 | 20 (16.8%) | 23 (18.9%) |
| Total | 119 (100.0%) | 122 (100.0%) |
Health & Disability in La Grange
Health Insurance Coverage by Age in La Grange
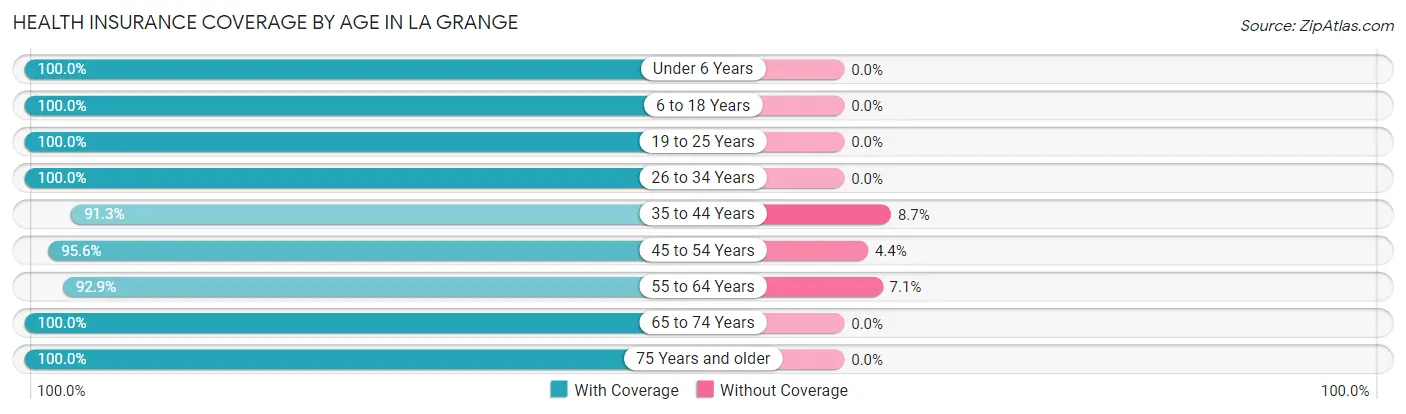
| Age Bracket | With Coverage | Without Coverage |
| Under 6 Years | 16 (100.0%) | 0 (0.0%) |
| 6 to 18 Years | 121 (100.0%) | 0 (0.0%) |
| 19 to 25 Years | 116 (100.0%) | 0 (0.0%) |
| 26 to 34 Years | 83 (100.0%) | 0 (0.0%) |
| 35 to 44 Years | 105 (91.3%) | 10 (8.7%) |
| 45 to 54 Years | 65 (95.6%) | 3 (4.4%) |
| 55 to 64 Years | 78 (92.9%) | 6 (7.1%) |
| 65 to 74 Years | 70 (100.0%) | 0 (0.0%) |
| 75 Years and older | 91 (100.0%) | 0 (0.0%) |
| Total | 745 (97.5%) | 19 (2.5%) |
Health Insurance Coverage by Citizenship Status in La Grange
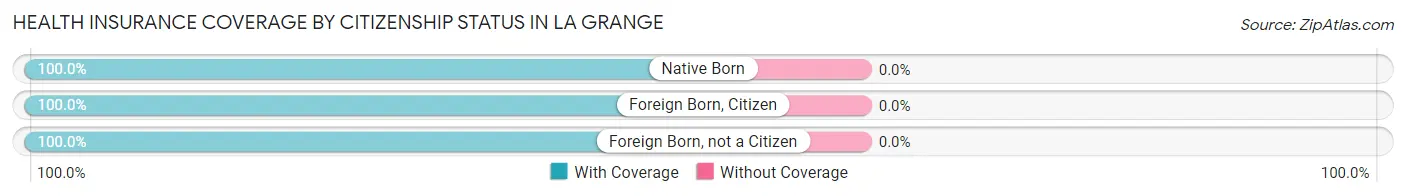
| Citizenship Status | With Coverage | Without Coverage |
| Native Born | 16 (100.0%) | 0 (0.0%) |
| Foreign Born, Citizen | 121 (100.0%) | 0 (0.0%) |
| Foreign Born, not a Citizen | 116 (100.0%) | 0 (0.0%) |
Health Insurance Coverage by Household Income in La Grange
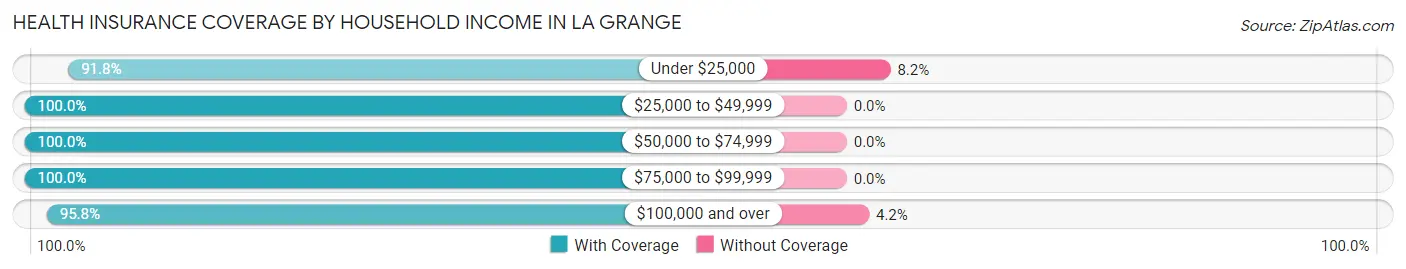
| Household Income | With Coverage | Without Coverage |
| Under $25,000 | 101 (91.8%) | 9 (8.2%) |
| $25,000 to $49,999 | 143 (100.0%) | 0 (0.0%) |
| $50,000 to $74,999 | 159 (100.0%) | 0 (0.0%) |
| $75,000 to $99,999 | 112 (100.0%) | 0 (0.0%) |
| $100,000 and over | 230 (95.8%) | 10 (4.2%) |
Public vs Private Health Insurance Coverage by Age in La Grange
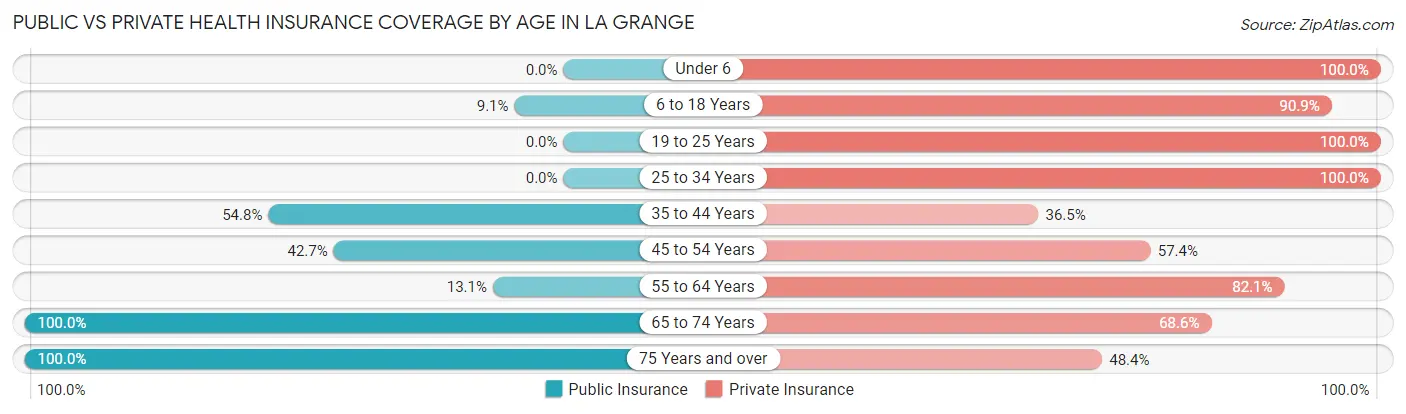
| Age Bracket | Public Insurance | Private Insurance |
| Under 6 | 0 (0.0%) | 16 (100.0%) |
| 6 to 18 Years | 11 (9.1%) | 110 (90.9%) |
| 19 to 25 Years | 0 (0.0%) | 116 (100.0%) |
| 25 to 34 Years | 0 (0.0%) | 83 (100.0%) |
| 35 to 44 Years | 63 (54.8%) | 42 (36.5%) |
| 45 to 54 Years | 29 (42.6%) | 39 (57.4%) |
| 55 to 64 Years | 11 (13.1%) | 69 (82.1%) |
| 65 to 74 Years | 70 (100.0%) | 48 (68.6%) |
| 75 Years and over | 91 (100.0%) | 44 (48.3%) |
| Total | 275 (36.0%) | 567 (74.2%) |
Disability Status by Sex by Age in La Grange
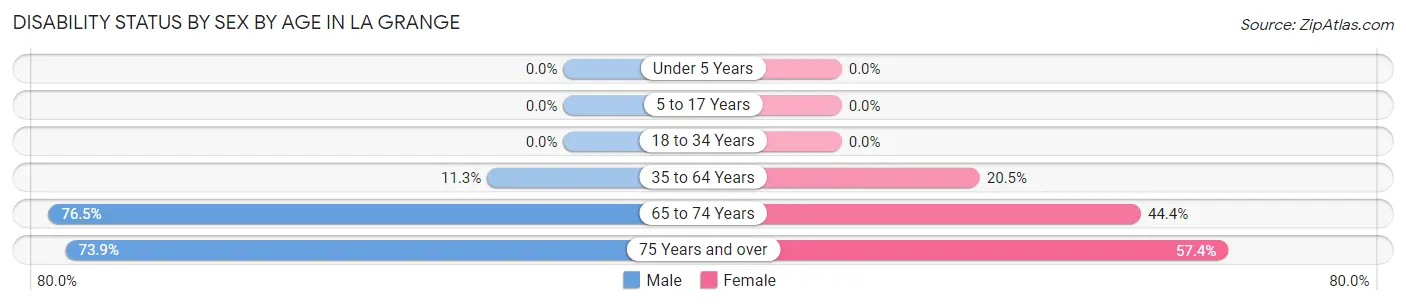
| Age Bracket | Male | Female |
| Under 5 Years | 0 (0.0%) | 0 (0.0%) |
| 5 to 17 Years | 0 (0.0%) | 0 (0.0%) |
| 18 to 34 Years | 0 (0.0%) | 0 (0.0%) |
| 35 to 64 Years | 12 (11.3%) | 33 (20.5%) |
| 65 to 74 Years | 26 (76.5%) | 16 (44.4%) |
| 75 Years and over | 17 (73.9%) | 39 (57.4%) |
Disability Class by Sex by Age in La Grange
Disability Class: Hearing Difficulty
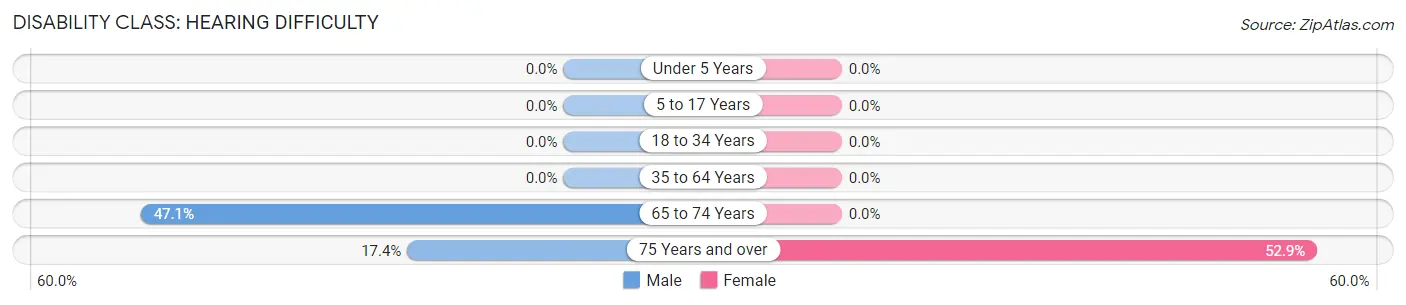
| Age Bracket | Male | Female |
| Under 5 Years | 0 (0.0%) | 0 (0.0%) |
| 5 to 17 Years | 0 (0.0%) | 0 (0.0%) |
| 18 to 34 Years | 0 (0.0%) | 0 (0.0%) |
| 35 to 64 Years | 0 (0.0%) | 0 (0.0%) |
| 65 to 74 Years | 16 (47.1%) | 0 (0.0%) |
| 75 Years and over | 4 (17.4%) | 36 (52.9%) |
Disability Class: Vision Difficulty
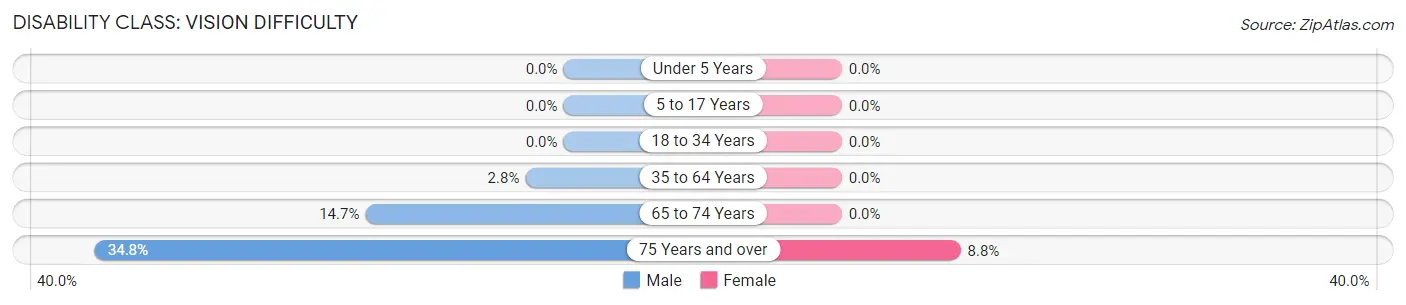
| Age Bracket | Male | Female |
| Under 5 Years | 0 (0.0%) | 0 (0.0%) |
| 5 to 17 Years | 0 (0.0%) | 0 (0.0%) |
| 18 to 34 Years | 0 (0.0%) | 0 (0.0%) |
| 35 to 64 Years | 3 (2.8%) | 0 (0.0%) |
| 65 to 74 Years | 5 (14.7%) | 0 (0.0%) |
| 75 Years and over | 8 (34.8%) | 6 (8.8%) |
Disability Class: Cognitive Difficulty
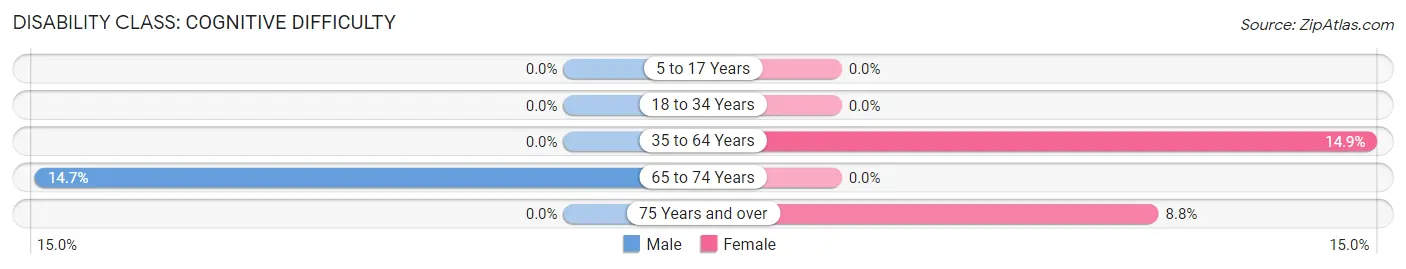
| Age Bracket | Male | Female |
| 5 to 17 Years | 0 (0.0%) | 0 (0.0%) |
| 18 to 34 Years | 0 (0.0%) | 0 (0.0%) |
| 35 to 64 Years | 0 (0.0%) | 24 (14.9%) |
| 65 to 74 Years | 5 (14.7%) | 0 (0.0%) |
| 75 Years and over | 0 (0.0%) | 6 (8.8%) |
Disability Class: Ambulatory Difficulty
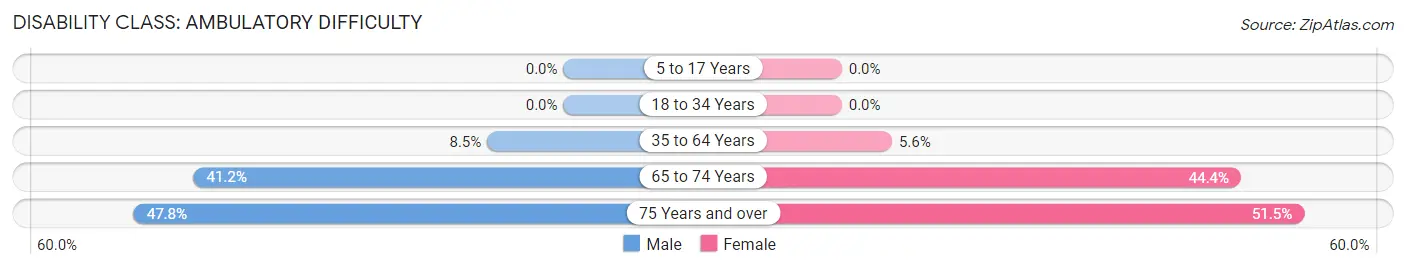
| Age Bracket | Male | Female |
| 5 to 17 Years | 0 (0.0%) | 0 (0.0%) |
| 18 to 34 Years | 0 (0.0%) | 0 (0.0%) |
| 35 to 64 Years | 9 (8.5%) | 9 (5.6%) |
| 65 to 74 Years | 14 (41.2%) | 16 (44.4%) |
| 75 Years and over | 11 (47.8%) | 35 (51.5%) |
Disability Class: Self-Care Difficulty
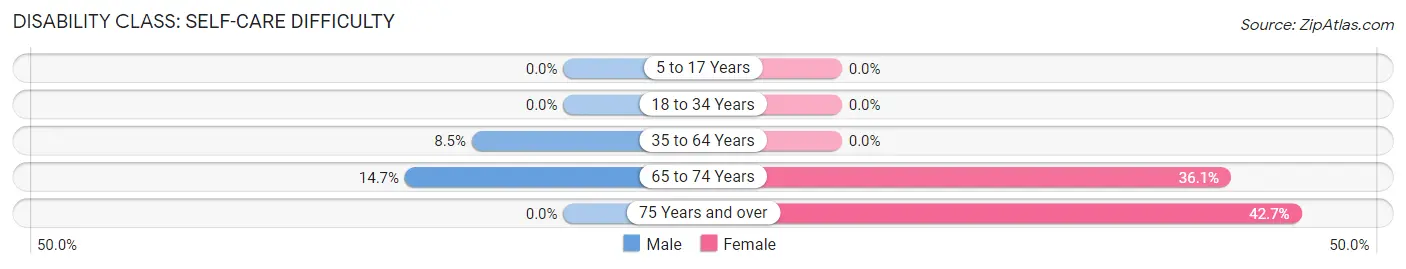
| Age Bracket | Male | Female |
| 5 to 17 Years | 0 (0.0%) | 0 (0.0%) |
| 18 to 34 Years | 0 (0.0%) | 0 (0.0%) |
| 35 to 64 Years | 9 (8.5%) | 0 (0.0%) |
| 65 to 74 Years | 5 (14.7%) | 13 (36.1%) |
| 75 Years and over | 0 (0.0%) | 29 (42.6%) |
Technology Access in La Grange
Computing Device Access in La Grange
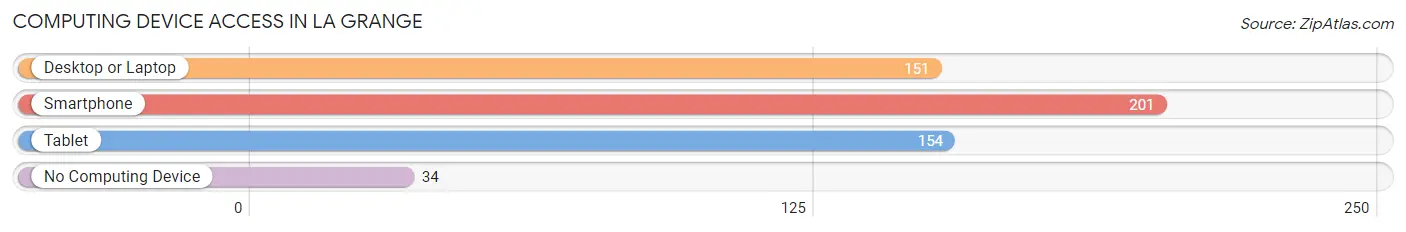
| Device Type | # Households | % Households |
| Desktop or Laptop | 151 | 52.4% |
| Smartphone | 201 | 69.8% |
| Tablet | 154 | 53.5% |
| No Computing Device | 34 | 11.8% |
| Total | 288 | 100.0% |
Internet Access in La Grange
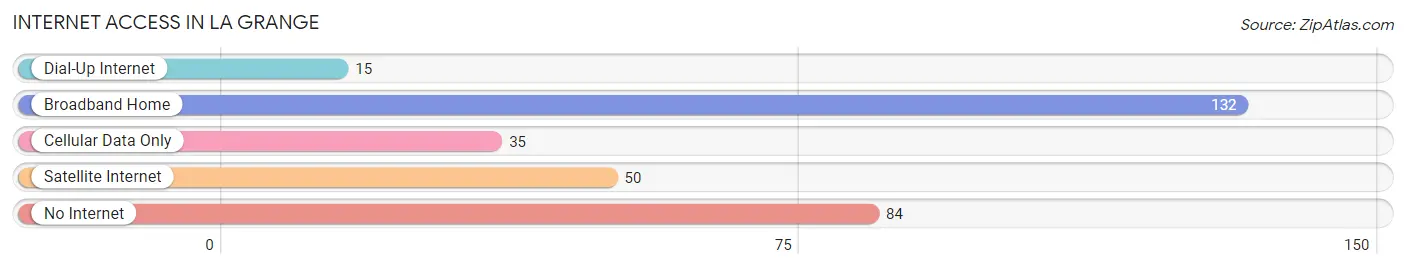
| Internet Type | # Households | % Households |
| Dial-Up Internet | 15 | 5.2% |
| Broadband Home | 132 | 45.8% |
| Cellular Data Only | 35 | 12.1% |
| Satellite Internet | 50 | 17.4% |
| No Internet | 84 | 29.2% |
| Total | 288 | 100.0% |
La Grange Summary
La Grange, Missouri is a small town located in Lewis County, Missouri. It is situated on the banks of the Mississippi River, approximately 40 miles north of St. Louis. The town was founded in 1819 and has a population of approximately 1,000 people.
Geography
La Grange is located in the northwest corner of Lewis County, Missouri. It is situated on the banks of the Mississippi River, approximately 40 miles north of St. Louis. The town is surrounded by rolling hills and farmland, and is located in the Ozark Plateau region of Missouri. The climate in La Grange is humid and subtropical, with hot summers and mild winters.
History
La Grange was founded in 1819 by a group of French settlers who were looking for a place to settle and farm. The town was named after the French city of La Grange, which means “the barn” in French. The settlers built a fort to protect themselves from Native American attacks, and the town quickly grew. By the mid-1800s, La Grange had become a thriving agricultural community, with a population of over 1,000 people.
The town was an important stop on the Underground Railroad, and many escaped slaves passed through La Grange on their way to freedom. During the Civil War, the town was occupied by Union forces, and the town was destroyed by a tornado in 1871. After the war, the town was rebuilt and continued to grow.
Economy
The economy of La Grange is largely based on agriculture. The town is home to several farms, and the surrounding area is known for its production of corn, soybeans, and wheat. The town also has a few small businesses, including a grocery store, a hardware store, and a few restaurants.
Demographics
As of the 2010 census, the population of La Grange was 1,000 people. The racial makeup of the town was 97.2% White, 0.7% African American, 0.2% Native American, 0.2% Asian, 0.2% from other races, and 1.7% from two or more races. The median household income was $37,500, and the median family income was $45,000.
Conclusion
La Grange, Missouri is a small town located in Lewis County, Missouri. It is situated on the banks of the Mississippi River, approximately 40 miles north of St. Louis. The town was founded in 1819 and has a population of approximately 1,000 people. The economy of La Grange is largely based on agriculture, and the town is home to several farms. The racial makeup of the town is predominantly White, with a small percentage of African American, Native American, and Asian residents. La Grange is an important stop on the Underground Railroad, and the town was destroyed by a tornado in 1871. Today, La Grange is a thriving agricultural community, with a median household income of $37,500.
Common Questions
What is Per Capita Income in La Grange?
Per Capita income in La Grange is $28,157.
What is the Median Family Income in La Grange?
Median Family Income in La Grange is $67,500.
What is the Median Household income in La Grange?
Median Household Income in La Grange is $53,214.
What is Income or Wage Gap in La Grange?
Income or Wage Gap in La Grange is 39.8%.
Women in La Grange earn 60.2 cents for every dollar earned by a man.
What is Inequality or Gini Index in La Grange?
Inequality or Gini Index in La Grange is 0.42.
What is the Total Population of La Grange?
Total Population of La Grange is 764.
What is the Total Male Population of La Grange?
Total Male Population of La Grange is 263.
What is the Total Female Population of La Grange?
Total Female Population of La Grange is 501.
What is the Ratio of Males per 100 Females in La Grange?
There are 52.50 Males per 100 Females in La Grange.
What is the Ratio of Females per 100 Males in La Grange?
There are 190.49 Females per 100 Males in La Grange.
What is the Median Population Age in La Grange?
Median Population Age in La Grange is 42.1 Years.
What is the Average Family Size in La Grange
Average Family Size in La Grange is 4.0 People.
What is the Average Household Size in La Grange
Average Household Size in La Grange is 2.6 People.
How Large is the Labor Force in La Grange?
There are 439 People in the Labor Forcein in La Grange.
What is the Percentage of People in the Labor Force in La Grange?
65.4% of People are in the Labor Force in La Grange.
What is the Unemployment Rate in La Grange?
Unemployment Rate in La Grange is 1.1%.