Kennett, MO Map & Demographics
Kennett Map
Kennett Overview
$28,435
PER CAPITA INCOME
$63,890
AVG FAMILY INCOME
$52,907
AVG HOUSEHOLD INCOME
42.8%
WAGE / INCOME GAP [ % ]
57.2¢/ $1
WAGE / INCOME GAP [ $ ]
$10,939
FAMILY INCOME DEFICIT
0.51
INEQUALITY / GINI INDEX
10,383
TOTAL POPULATION
4,978
MALE POPULATION
5,405
FEMALE POPULATION
92.10
MALES / 100 FEMALES
108.58
FEMALES / 100 MALES
37.3
MEDIAN AGE
3.1
AVG FAMILY SIZE
2.5
AVG HOUSEHOLD SIZE
4,154
LABOR FORCE [ PEOPLE ]
53.4%
PERCENT IN LABOR FORCE
7.3%
UNEMPLOYMENT RATE
Kennett Zip Codes
Kennett Area Codes
Income in Kennett
Income Overview in Kennett
Per Capita Income in Kennett is $28,435, while median incomes of families and households are $63,890 and $52,907 respectively.
| Characteristic | Number | Measure |
| Per Capita Income | 10,383 | $28,435 |
| Median Family Income | 2,531 | $63,890 |
| Mean Family Income | 2,531 | $93,022 |
| Median Household Income | 3,992 | $52,907 |
| Mean Household Income | 3,992 | $73,192 |
| Income Deficit | 2,531 | $10,939 |
| Wage / Income Gap (%) | 10,383 | 42.78% |
| Wage / Income Gap ($) | 10,383 | 57.22¢ per $1 |
| Gini / Inequality Index | 10,383 | 0.51 |
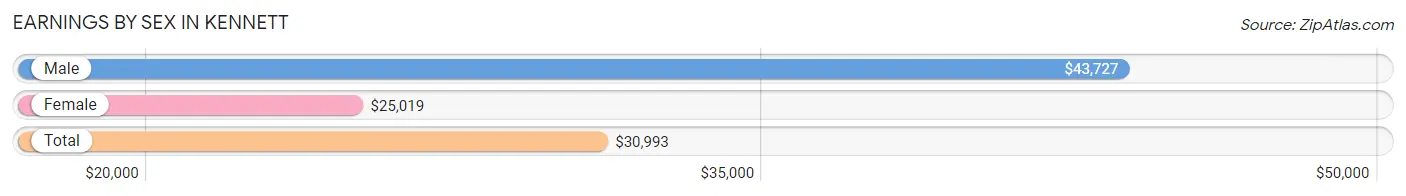
Earnings by Sex in Kennett
Average Earnings in Kennett are $30,993, $43,727 for men and $25,019 for women, a difference of 42.8%.
| Sex | Number | Average Earnings |
| Male | 2,202 (50.0%) | $43,727 |
| Female | 2,202 (50.0%) | $25,019 |
| Total | 4,404 (100.0%) | $30,993 |
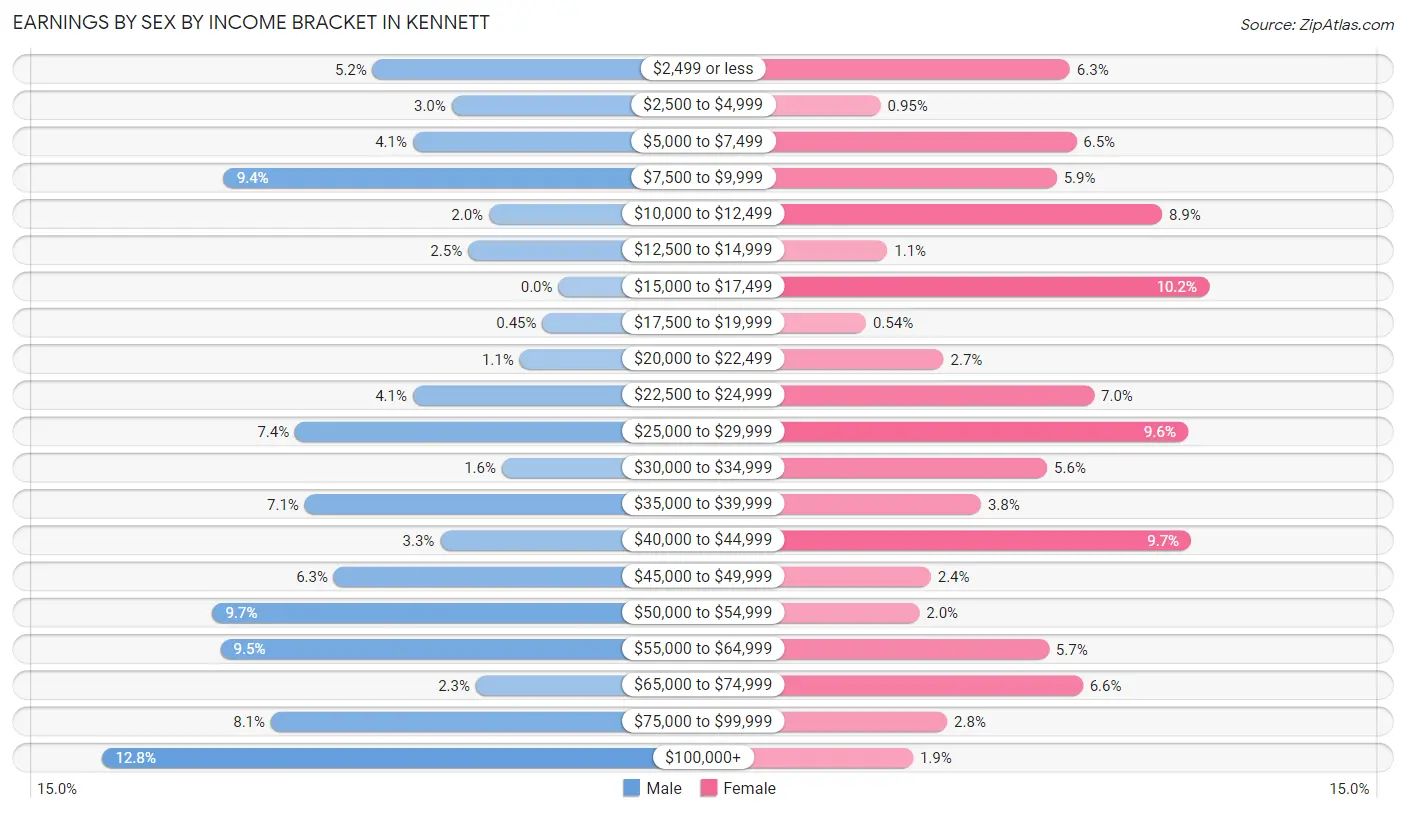
Earnings by Sex by Income Bracket in Kennett
The most common earnings brackets in Kennett are $100,000+ for men (282 | 12.8%) and $15,000 to $17,499 for women (224 | 10.2%).
| Income | Male | Female |
| $2,499 or less | 115 (5.2%) | 138 (6.3%) |
| $2,500 to $4,999 | 66 (3.0%) | 21 (0.9%) |
| $5,000 to $7,499 | 90 (4.1%) | 142 (6.5%) |
| $7,500 to $9,999 | 207 (9.4%) | 130 (5.9%) |
| $10,000 to $12,499 | 43 (1.9%) | 195 (8.9%) |
| $12,500 to $14,999 | 56 (2.5%) | 25 (1.1%) |
| $15,000 to $17,499 | 0 (0.0%) | 224 (10.2%) |
| $17,500 to $19,999 | 10 (0.4%) | 12 (0.5%) |
| $20,000 to $22,499 | 24 (1.1%) | 60 (2.7%) |
| $22,500 to $24,999 | 90 (4.1%) | 153 (7.0%) |
| $25,000 to $29,999 | 163 (7.4%) | 211 (9.6%) |
| $30,000 to $34,999 | 35 (1.6%) | 124 (5.6%) |
| $35,000 to $39,999 | 157 (7.1%) | 83 (3.8%) |
| $40,000 to $44,999 | 73 (3.3%) | 213 (9.7%) |
| $45,000 to $49,999 | 139 (6.3%) | 52 (2.4%) |
| $50,000 to $54,999 | 214 (9.7%) | 45 (2.0%) |
| $55,000 to $64,999 | 209 (9.5%) | 125 (5.7%) |
| $65,000 to $74,999 | 51 (2.3%) | 146 (6.6%) |
| $75,000 to $99,999 | 178 (8.1%) | 62 (2.8%) |
| $100,000+ | 282 (12.8%) | 41 (1.9%) |
| Total | 2,202 (100.0%) | 2,202 (100.0%) |
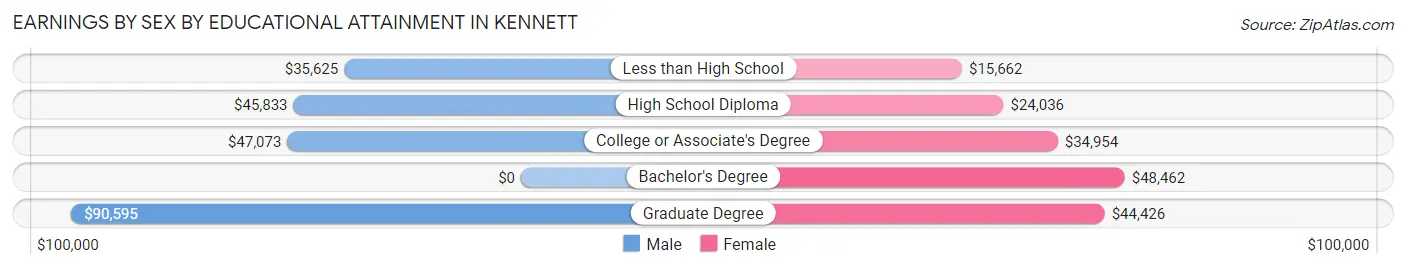
Earnings by Sex by Educational Attainment in Kennett
Average earnings in Kennett are $47,500 for men and $27,064 for women, a difference of 43.0%. Men with an educational attainment of graduate degree enjoy the highest average annual earnings of $90,595, while those with less than high school education earn the least with $35,625. Women with an educational attainment of bachelor's degree earn the most with the average annual earnings of $48,462, while those with less than high school education have the smallest earnings of $15,662.
| Educational Attainment | Male Income | Female Income |
| Less than High School | $35,625 | $15,662 |
| High School Diploma | $45,833 | $24,036 |
| College or Associate's Degree | $47,073 | $34,954 |
| Bachelor's Degree | - | - |
| Graduate Degree | $90,595 | $44,426 |
| Total | $47,500 | $27,064 |
Family Income in Kennett
Family Income Brackets in Kennett
According to the Kennett family income data, there are 488 families falling into the $50,000 to $74,999 income range, which is the most common income bracket and makes up 19.3% of all families. Conversely, the $10,000 to $14,999 income bracket is the least frequent group with only 25 families (1.0%) belonging to this category.
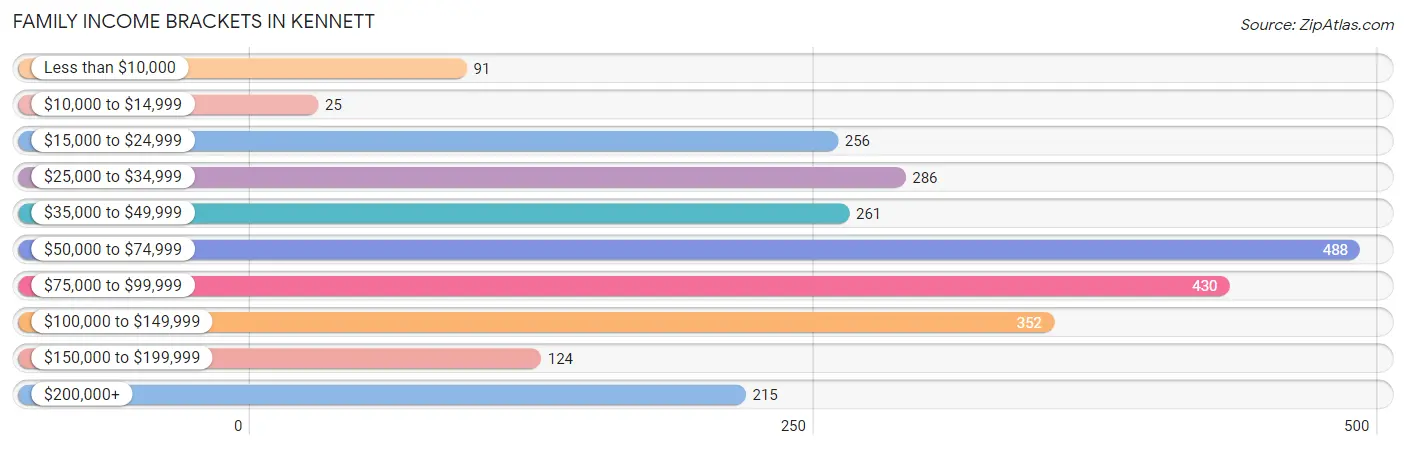
| Income Bracket | # Families | % Families |
| Less than $10,000 | 91 | 3.6% |
| $10,000 to $14,999 | 25 | 1.0% |
| $15,000 to $24,999 | 256 | 10.1% |
| $25,000 to $34,999 | 286 | 11.3% |
| $35,000 to $49,999 | 261 | 10.3% |
| $50,000 to $74,999 | 488 | 19.3% |
| $75,000 to $99,999 | 430 | 17.0% |
| $100,000 to $149,999 | 352 | 13.9% |
| $150,000 to $199,999 | 124 | 4.9% |
| $200,000+ | 215 | 8.5% |
Family Income by Famaliy Size in Kennett
5-person families (188 | 7.4%) account for the highest median family income in Kennett with $104,063 per family, while 2-person families (1,348 | 53.3%) have the highest median income of $30,363 per family member.
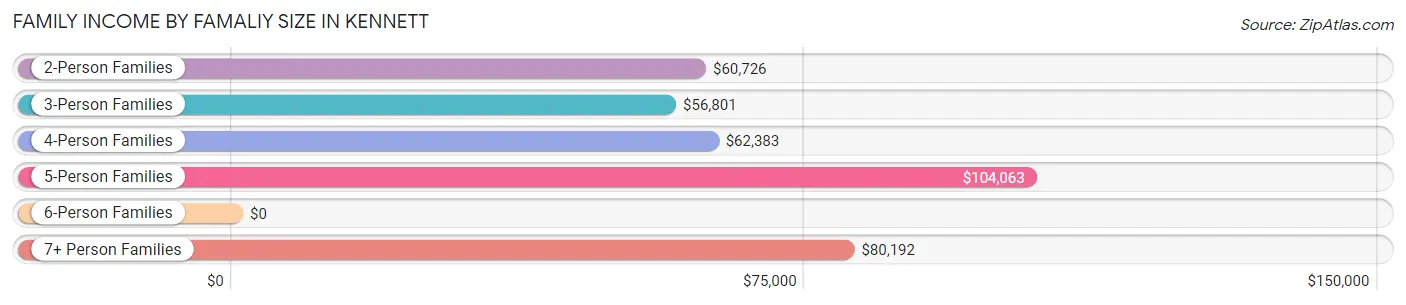
| Income Bracket | # Families | Median Income |
| 2-Person Families | 1,348 (53.3%) | $60,726 |
| 3-Person Families | 463 (18.3%) | $56,801 |
| 4-Person Families | 463 (18.3%) | $62,383 |
| 5-Person Families | 188 (7.4%) | $104,063 |
| 6-Person Families | 7 (0.3%) | $0 |
| 7+ Person Families | 62 (2.5%) | $80,192 |
| Total | 2,531 (100.0%) | $63,890 |
Family Income by Number of Earners in Kennett
The median family income in Kennett is $63,890, with families comprising 2 earners (908) having the highest median family income of $88,478, while families with no earners (372) have the lowest median family income of $42,143, accounting for 35.9% and 14.7% of families, respectively.
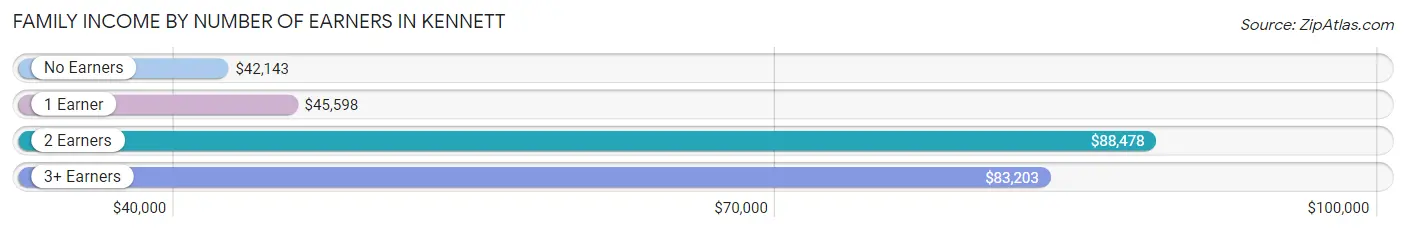
| Number of Earners | # Families | Median Income |
| No Earners | 372 (14.7%) | $42,143 |
| 1 Earner | 1,143 (45.2%) | $45,598 |
| 2 Earners | 908 (35.9%) | $88,478 |
| 3+ Earners | 108 (4.3%) | $83,203 |
| Total | 2,531 (100.0%) | $63,890 |
Household Income in Kennett
Household Income Brackets in Kennett
With 723 households falling in the category, the $50,000 to $74,999 income range is the most frequent in Kennett, accounting for 18.1% of all households. In contrast, only 124 households (3.1%) fall into the $150,000 to $199,999 income bracket, making it the least populous group.
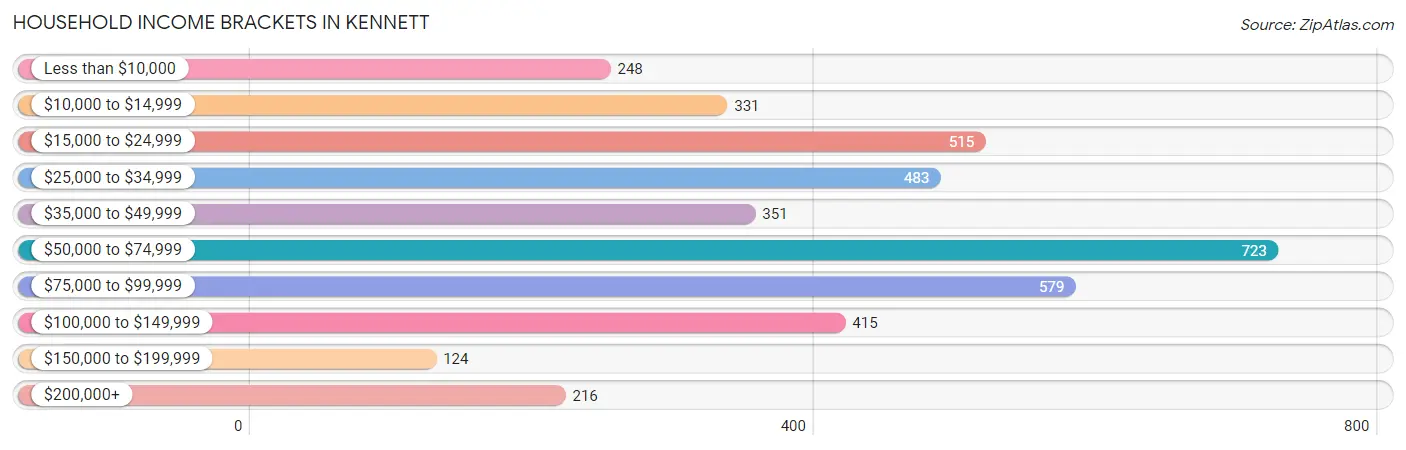
| Income Bracket | # Households | % Households |
| Less than $10,000 | 248 | 6.2% |
| $10,000 to $14,999 | 331 | 8.3% |
| $15,000 to $24,999 | 515 | 12.9% |
| $25,000 to $34,999 | 483 | 12.1% |
| $35,000 to $49,999 | 351 | 8.8% |
| $50,000 to $74,999 | 723 | 18.1% |
| $75,000 to $99,999 | 579 | 14.5% |
| $100,000 to $149,999 | 415 | 10.4% |
| $150,000 to $199,999 | 124 | 3.1% |
| $200,000+ | 216 | 5.4% |
Household Income by Householder Age in Kennett
The median household income in Kennett is $52,907, with the highest median household income of $63,814 found in the 45 to 64 years age bracket for the primary householder. A total of 1,200 households (30.1%) fall into this category. Meanwhile, the 15 to 24 years age bracket for the primary householder has the lowest median household income of $11,814, with 274 households (6.9%) in this group.
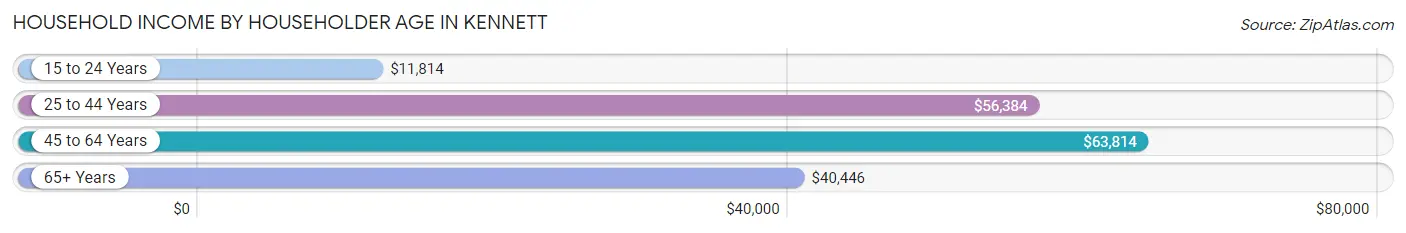
| Income Bracket | # Households | Median Income |
| 15 to 24 Years | 274 (6.9%) | $11,814 |
| 25 to 44 Years | 1,232 (30.9%) | $56,384 |
| 45 to 64 Years | 1,200 (30.1%) | $63,814 |
| 65+ Years | 1,286 (32.2%) | $40,446 |
| Total | 3,992 (100.0%) | $52,907 |
Poverty in Kennett
Income Below Poverty by Sex and Age in Kennett
With 22.0% poverty level for males and 19.8% for females among the residents of Kennett, 15 year old males and 18 to 24 year old females are the most vulnerable to poverty, with 25 males (100.0%) and 187 females (54.0%) in their respective age groups living below the poverty level.
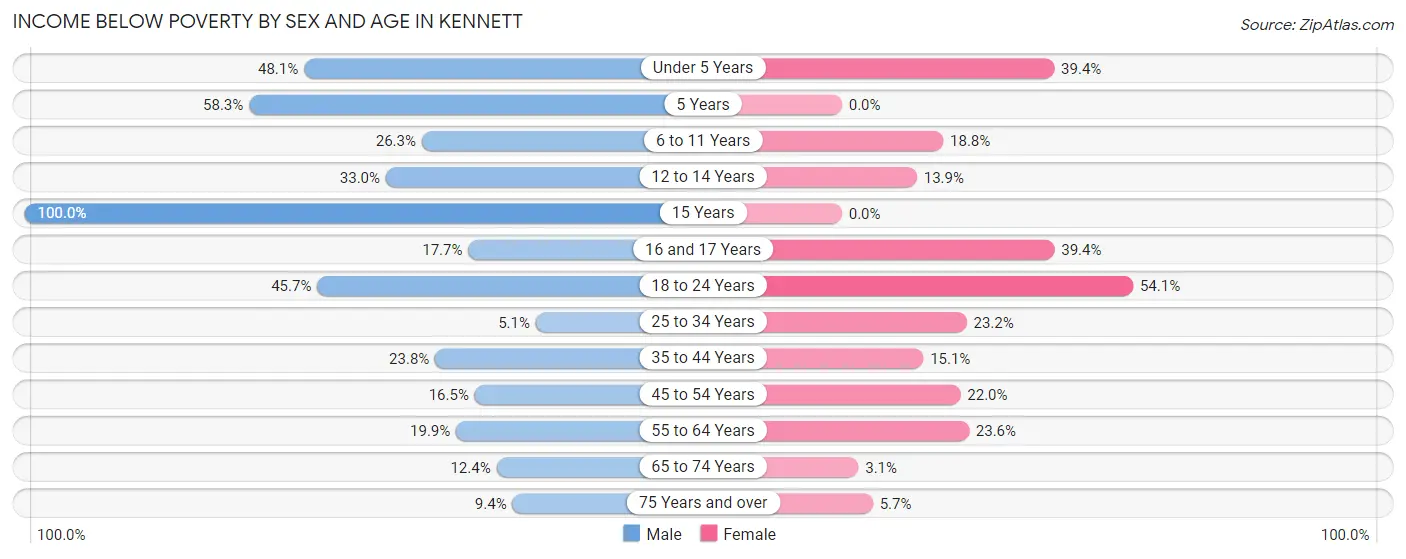
| Age Bracket | Male | Female |
| Under 5 Years | 90 (48.1%) | 164 (39.4%) |
| 5 Years | 14 (58.3%) | 0 (0.0%) |
| 6 to 11 Years | 181 (26.3%) | 76 (18.8%) |
| 12 to 14 Years | 114 (33.0%) | 33 (13.9%) |
| 15 Years | 25 (100.0%) | 0 (0.0%) |
| 16 and 17 Years | 36 (17.6%) | 28 (39.4%) |
| 18 to 24 Years | 169 (45.7%) | 187 (54.0%) |
| 25 to 34 Years | 29 (5.1%) | 157 (23.2%) |
| 35 to 44 Years | 104 (23.8%) | 86 (15.1%) |
| 45 to 54 Years | 103 (16.5%) | 118 (22.0%) |
| 55 to 64 Years | 81 (19.9%) | 137 (23.6%) |
| 65 to 74 Years | 70 (12.4%) | 22 (3.1%) |
| 75 Years and over | 27 (9.4%) | 24 (5.7%) |
| Total | 1,043 (22.0%) | 1,032 (19.8%) |
Income Above Poverty by Sex and Age in Kennett
According to the poverty statistics in Kennett, males aged 25 to 34 years and females aged 5 years are the age groups that are most secure financially, with 94.9% of males and 100.0% of females in these age groups living above the poverty line.
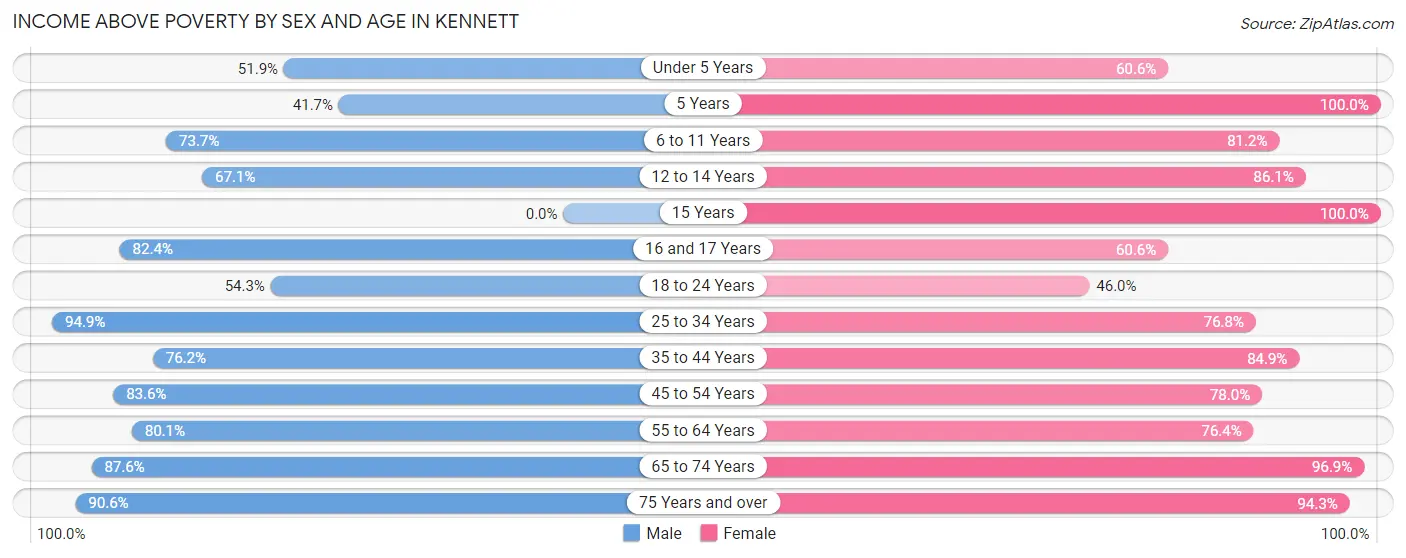
| Age Bracket | Male | Female |
| Under 5 Years | 97 (51.9%) | 252 (60.6%) |
| 5 Years | 10 (41.7%) | 83 (100.0%) |
| 6 to 11 Years | 508 (73.7%) | 328 (81.2%) |
| 12 to 14 Years | 232 (67.0%) | 204 (86.1%) |
| 15 Years | 0 (0.0%) | 143 (100.0%) |
| 16 and 17 Years | 168 (82.4%) | 43 (60.6%) |
| 18 to 24 Years | 201 (54.3%) | 159 (46.0%) |
| 25 to 34 Years | 538 (94.9%) | 521 (76.8%) |
| 35 to 44 Years | 333 (76.2%) | 483 (84.9%) |
| 45 to 54 Years | 523 (83.6%) | 418 (78.0%) |
| 55 to 64 Years | 326 (80.1%) | 444 (76.4%) |
| 65 to 74 Years | 494 (87.6%) | 697 (96.9%) |
| 75 Years and over | 259 (90.6%) | 394 (94.3%) |
| Total | 3,689 (78.0%) | 4,169 (80.2%) |
Income Below Poverty Among Married-Couple Families in Kennett
The poverty statistics for married-couple families in Kennett show that 2.9% or 45 of the total 1,537 families live below the poverty line. Families with 1 or 2 children have the highest poverty rate of 7.3%, comprising of 29 families. On the other hand, families with 3 or 4 children have the lowest poverty rate of 0.0%, which includes 0 families.
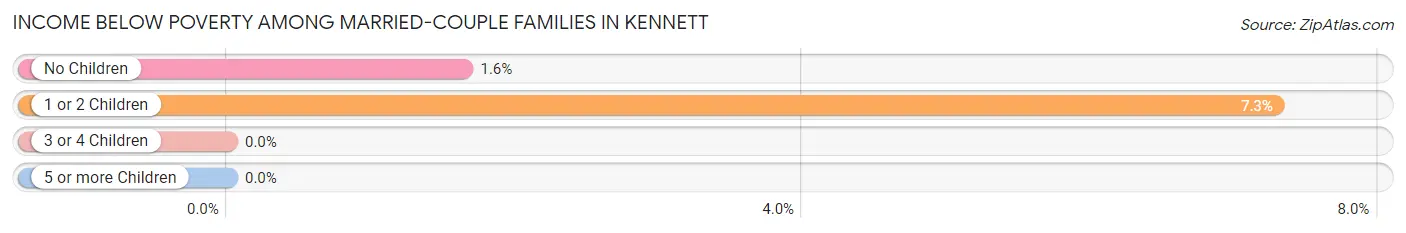
| Children | Above Poverty | Below Poverty |
| No Children | 960 (98.4%) | 16 (1.6%) |
| 1 or 2 Children | 369 (92.7%) | 29 (7.3%) |
| 3 or 4 Children | 163 (100.0%) | 0 (0.0%) |
| 5 or more Children | 0 (0.0%) | 0 (0.0%) |
| Total | 1,492 (97.1%) | 45 (2.9%) |
Income Below Poverty Among Single-Parent Households in Kennett
According to the poverty data in Kennett, 6.8% or 29 single-father households and 40.2% or 229 single-mother households are living below the poverty line. Among single-father households, those with 3 or 4 children have the highest poverty rate, with 7 households (11.1%) experiencing poverty. Likewise, among single-mother households, those with 1 or 2 children have the highest poverty rate, with 177 households (61.9%) falling below the poverty line.
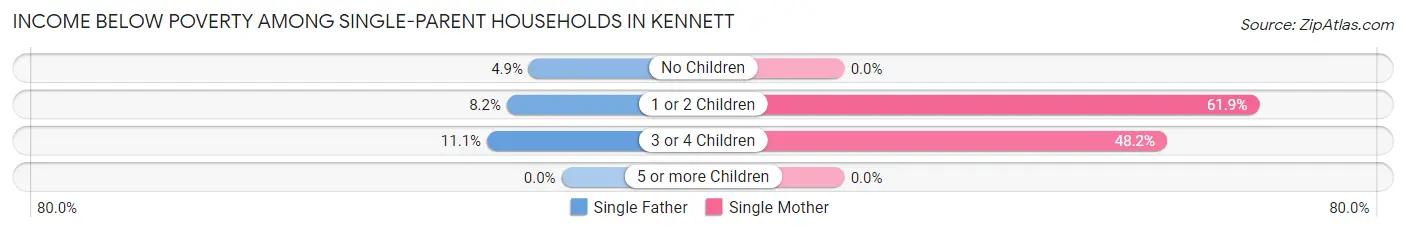
| Children | Single Father | Single Mother |
| No Children | 11 (4.9%) | 0 (0.0%) |
| 1 or 2 Children | 11 (8.2%) | 177 (61.9%) |
| 3 or 4 Children | 7 (11.1%) | 52 (48.1%) |
| 5 or more Children | 0 (0.0%) | 0 (0.0%) |
| Total | 29 (6.8%) | 229 (40.2%) |
Income Below Poverty Among Married-Couple vs Single-Parent Households in Kennett
The poverty data for Kennett shows that 45 of the married-couple family households (2.9%) and 258 of the single-parent households (26.0%) are living below the poverty level. Within the married-couple family households, those with 1 or 2 children have the highest poverty rate, with 29 households (7.3%) falling below the poverty line. Among the single-parent households, those with 1 or 2 children have the highest poverty rate, with 188 household (44.7%) living below poverty.
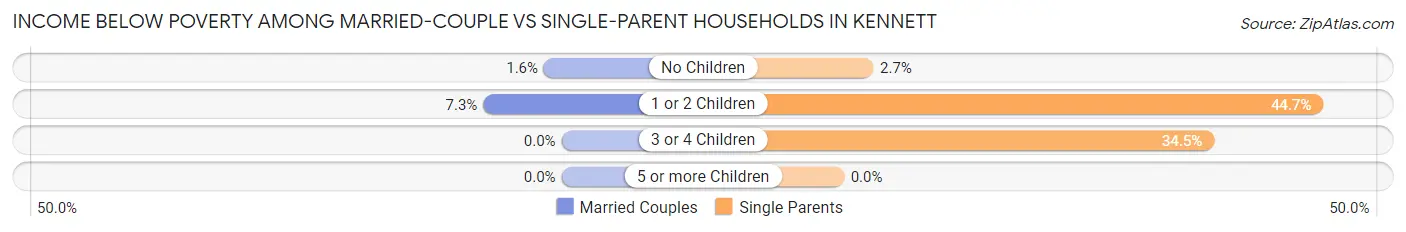
| Children | Married-Couple Families | Single-Parent Households |
| No Children | 16 (1.6%) | 11 (2.7%) |
| 1 or 2 Children | 29 (7.3%) | 188 (44.7%) |
| 3 or 4 Children | 0 (0.0%) | 59 (34.5%) |
| 5 or more Children | 0 (0.0%) | 0 (0.0%) |
| Total | 45 (2.9%) | 258 (26.0%) |
Race in Kennett
The most populous races in Kennett are White / Caucasian (8,079 | 77.8%), Black / African American (1,466 | 14.1%), and Two or more Races (820 | 7.9%).
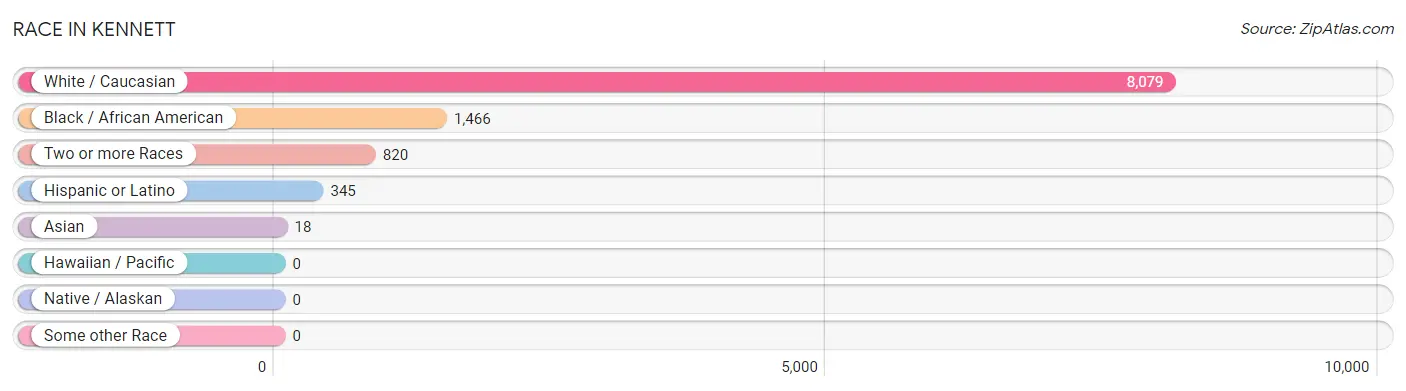
| Race | # Population | % Population |
| Asian | 18 | 0.2% |
| Black / African American | 1,466 | 14.1% |
| Hawaiian / Pacific | 0 | 0.0% |
| Hispanic or Latino | 345 | 3.3% |
| Native / Alaskan | 0 | 0.0% |
| White / Caucasian | 8,079 | 77.8% |
| Two or more Races | 820 | 7.9% |
| Some other Race | 0 | 0.0% |
| Total | 10,383 | 100.0% |
Ancestry in Kennett
The most populous ancestries reported in Kennett are Irish (1,262 | 12.1%), English (1,047 | 10.1%), American (987 | 9.5%), German (725 | 7.0%), and Scottish (439 | 4.2%), together accounting for 42.9% of all Kennett residents.
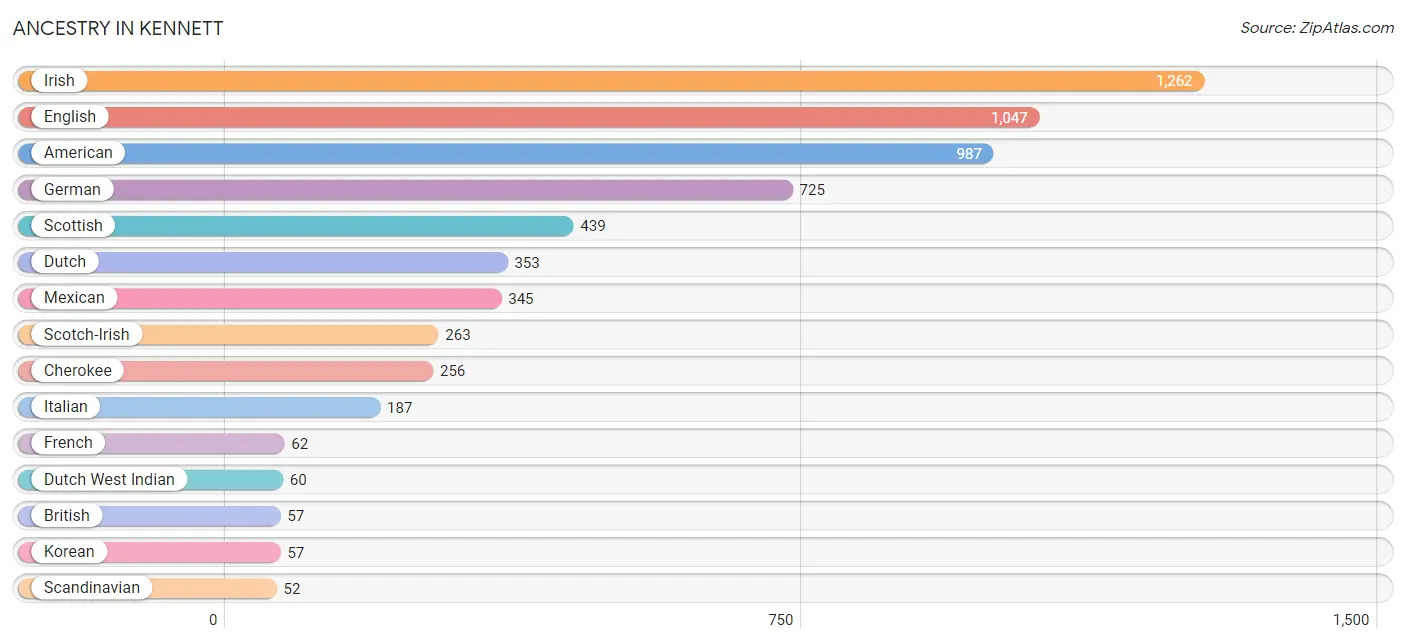
| Ancestry | # Population | % Population |
| African | 16 | 0.2% |
| American | 987 | 9.5% |
| Blackfeet | 46 | 0.4% |
| British | 57 | 0.5% |
| Cherokee | 256 | 2.5% |
| Czech | 7 | 0.1% |
| Czechoslovakian | 11 | 0.1% |
| Danish | 42 | 0.4% |
| Dutch | 353 | 3.4% |
| Dutch West Indian | 60 | 0.6% |
| English | 1,047 | 10.1% |
| European | 40 | 0.4% |
| French | 62 | 0.6% |
| German | 725 | 7.0% |
| Greek | 34 | 0.3% |
| Hungarian | 11 | 0.1% |
| Irish | 1,262 | 12.1% |
| Italian | 187 | 1.8% |
| Korean | 57 | 0.5% |
| Mexican | 345 | 3.3% |
| Norwegian | 40 | 0.4% |
| Polish | 12 | 0.1% |
| Russian | 5 | 0.1% |
| Scandinavian | 52 | 0.5% |
| Scotch-Irish | 263 | 2.5% |
| Scottish | 439 | 4.2% |
| Subsaharan African | 16 | 0.2% |
| Swedish | 2 | 0.0% | View All 28 Rows |
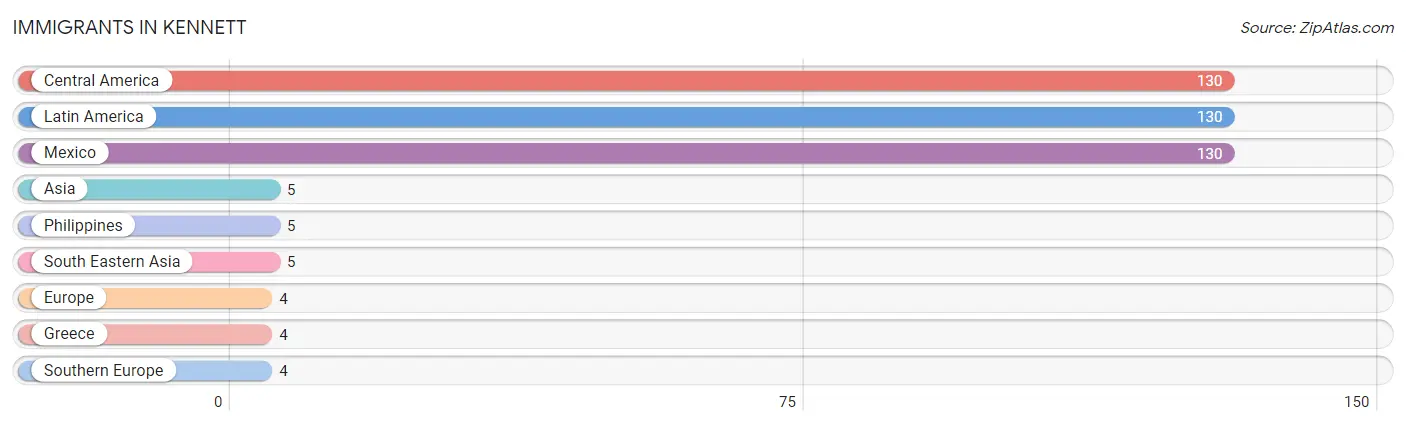
Immigrants in Kennett
The most numerous immigrant groups reported in Kennett came from Central America (130 | 1.3%), Latin America (130 | 1.3%), Mexico (130 | 1.3%), Asia (5 | 0.1%), and Philippines (5 | 0.1%), together accounting for 3.9% of all Kennett residents.
| Immigration Origin | # Population | % Population |
| Asia | 5 | 0.1% |
| Central America | 130 | 1.3% |
| Europe | 4 | 0.0% |
| Greece | 4 | 0.0% |
| Latin America | 130 | 1.3% |
| Mexico | 130 | 1.3% |
| Philippines | 5 | 0.1% |
| South Eastern Asia | 5 | 0.1% |
| Southern Europe | 4 | 0.0% | View All 9 Rows |
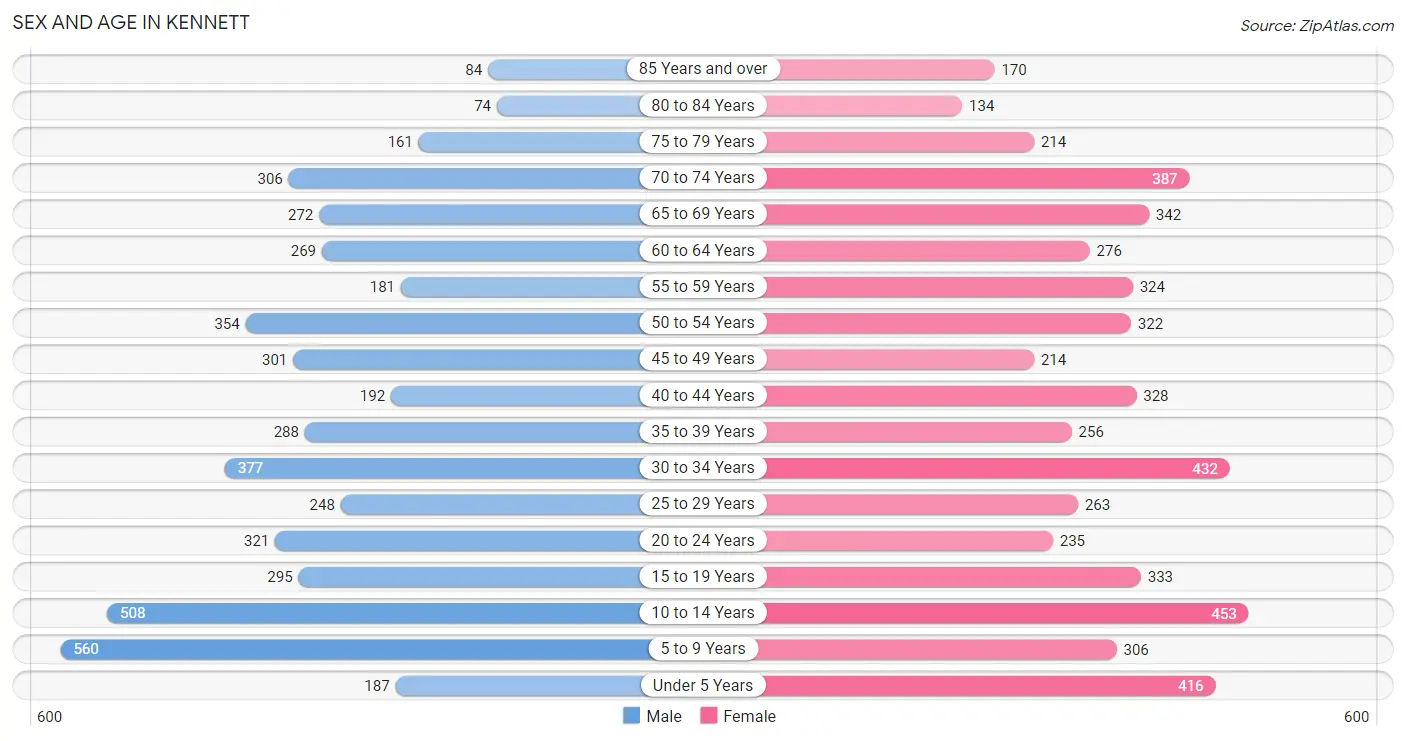
Sex and Age in Kennett
Sex and Age in Kennett
The most populous age groups in Kennett are 5 to 9 Years (560 | 11.3%) for men and 10 to 14 Years (453 | 8.4%) for women.
| Age Bracket | Male | Female |
| Under 5 Years | 187 (3.8%) | 416 (7.7%) |
| 5 to 9 Years | 560 (11.3%) | 306 (5.7%) |
| 10 to 14 Years | 508 (10.2%) | 453 (8.4%) |
| 15 to 19 Years | 295 (5.9%) | 333 (6.2%) |
| 20 to 24 Years | 321 (6.5%) | 235 (4.3%) |
| 25 to 29 Years | 248 (5.0%) | 263 (4.9%) |
| 30 to 34 Years | 377 (7.6%) | 432 (8.0%) |
| 35 to 39 Years | 288 (5.8%) | 256 (4.7%) |
| 40 to 44 Years | 192 (3.9%) | 328 (6.1%) |
| 45 to 49 Years | 301 (6.0%) | 214 (4.0%) |
| 50 to 54 Years | 354 (7.1%) | 322 (6.0%) |
| 55 to 59 Years | 181 (3.6%) | 324 (6.0%) |
| 60 to 64 Years | 269 (5.4%) | 276 (5.1%) |
| 65 to 69 Years | 272 (5.5%) | 342 (6.3%) |
| 70 to 74 Years | 306 (6.1%) | 387 (7.2%) |
| 75 to 79 Years | 161 (3.2%) | 214 (4.0%) |
| 80 to 84 Years | 74 (1.5%) | 134 (2.5%) |
| 85 Years and over | 84 (1.7%) | 170 (3.2%) |
| Total | 4,978 (100.0%) | 5,405 (100.0%) |
Families and Households in Kennett
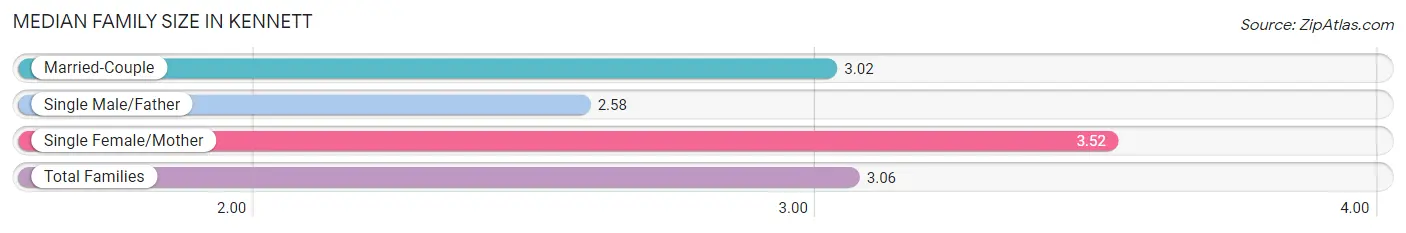
Median Family Size in Kennett
The median family size in Kennett is 3.06 persons per family, with single female/mother families (570 | 22.5%) accounting for the largest median family size of 3.52 persons per family. On the other hand, single male/father families (424 | 16.8%) represent the smallest median family size with 2.58 persons per family.
| Family Type | # Families | Family Size |
| Married-Couple | 1,537 (60.7%) | 3.02 |
| Single Male/Father | 424 (16.8%) | 2.58 |
| Single Female/Mother | 570 (22.5%) | 3.52 |
| Total Families | 2,531 (100.0%) | 3.06 |
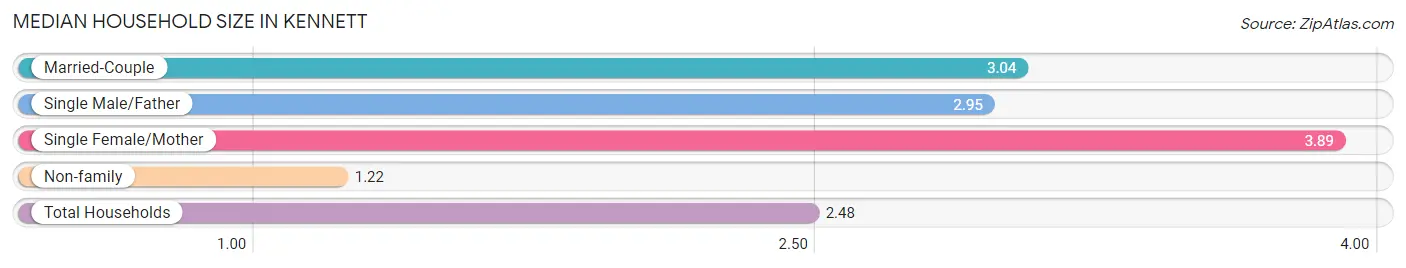
Median Household Size in Kennett
The median household size in Kennett is 2.48 persons per household, with single female/mother households (570 | 14.3%) accounting for the largest median household size of 3.89 persons per household. non-family households (1,461 | 36.6%) represent the smallest median household size with 1.22 persons per household.
| Household Type | # Households | Household Size |
| Married-Couple | 1,537 (38.5%) | 3.04 |
| Single Male/Father | 424 (10.6%) | 2.95 |
| Single Female/Mother | 570 (14.3%) | 3.89 |
| Non-family | 1,461 (36.6%) | 1.22 |
| Total Households | 3,992 (100.0%) | 2.48 |
Household Size by Marriage Status in Kennett
Out of a total of 3,992 households in Kennett, 2,531 (63.4%) are family households, while 1,461 (36.6%) are nonfamily households. The most numerous type of family households are 2-person households, comprising 1,264, and the most common type of nonfamily households are 1-person households, comprising 1,216.
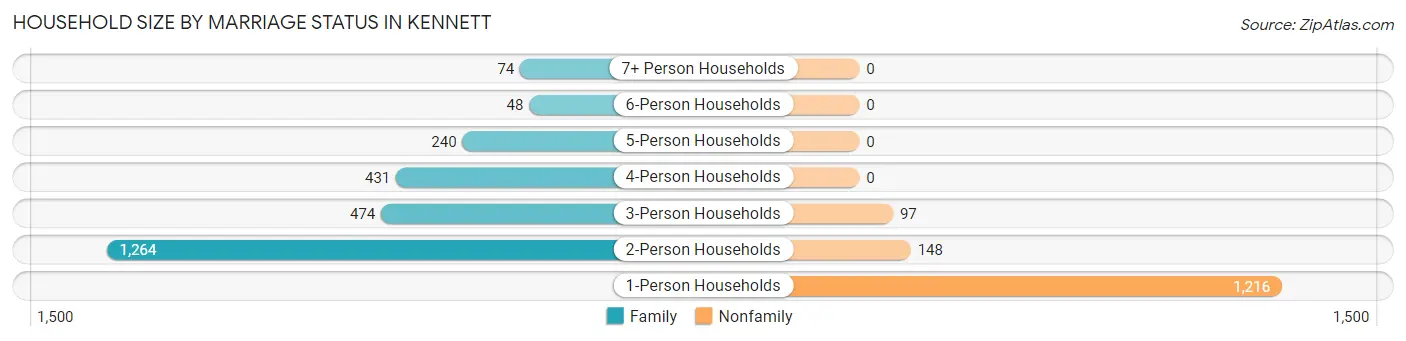
| Household Size | Family Households | Nonfamily Households |
| 1-Person Households | - | 1,216 (30.5%) |
| 2-Person Households | 1,264 (31.7%) | 148 (3.7%) |
| 3-Person Households | 474 (11.9%) | 97 (2.4%) |
| 4-Person Households | 431 (10.8%) | 0 (0.0%) |
| 5-Person Households | 240 (6.0%) | 0 (0.0%) |
| 6-Person Households | 48 (1.2%) | 0 (0.0%) |
| 7+ Person Households | 74 (1.8%) | 0 (0.0%) |
| Total | 2,531 (63.4%) | 1,461 (36.6%) |
Female Fertility in Kennett
Fertility by Age in Kennett
Average fertility rate in Kennett is 63.0 births per 1,000 women. Women in the age bracket of 20 to 34 years have the highest fertility rate with 142.0 births per 1,000 women. Women in the age bracket of 20 to 34 years acount for 95.0% of all women with births.
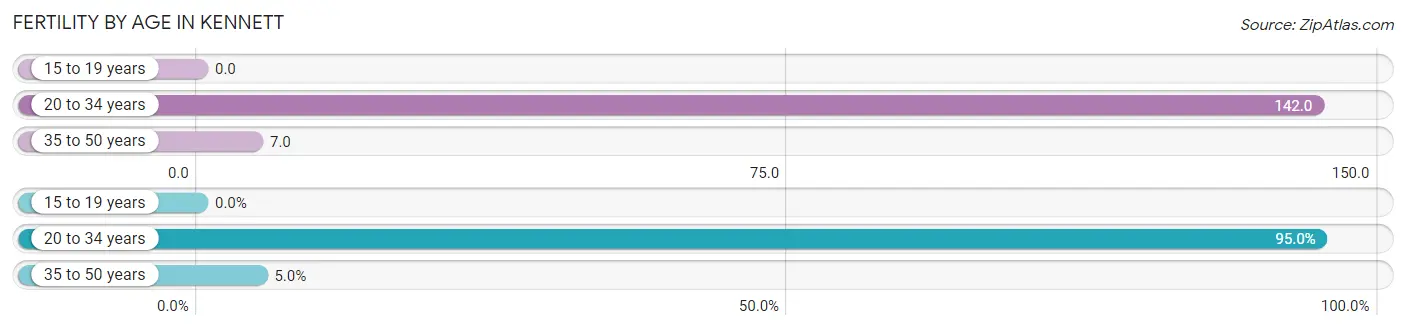
| Age Bracket | Women with Births | Births / 1,000 Women |
| 15 to 19 years | 0 (0.0%) | 0.0 |
| 20 to 34 years | 132 (95.0%) | 142.0 |
| 35 to 50 years | 7 (5.0%) | 7.0 |
| Total | 139 (100.0%) | 63.0 |
Fertility by Age by Marriage Status in Kennett
71.2% of women with births (139) in Kennett are married. The highest percentage of unmarried women with births falls into 35 to 50 years age bracket with 100.0% of them unmarried at the time of birth, while the lowest percentage of unmarried women with births belong to 20 to 34 years age bracket with 25.0% of them unmarried.
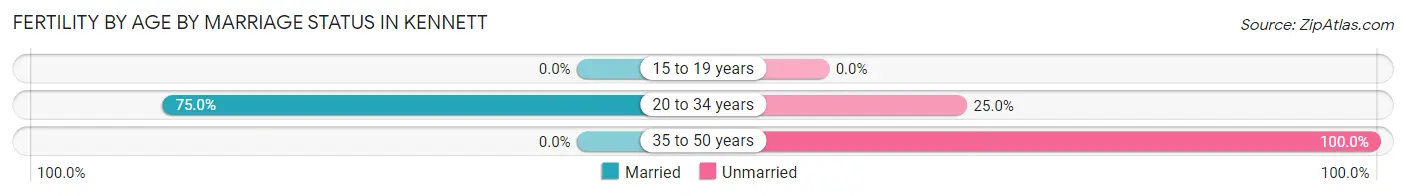
| Age Bracket | Married | Unmarried |
| 15 to 19 years | 0 (0.0%) | 0 (0.0%) |
| 20 to 34 years | 99 (75.0%) | 33 (25.0%) |
| 35 to 50 years | 0 (0.0%) | 7 (100.0%) |
| Total | 99 (71.2%) | 40 (28.8%) |
Fertility by Education in Kennett
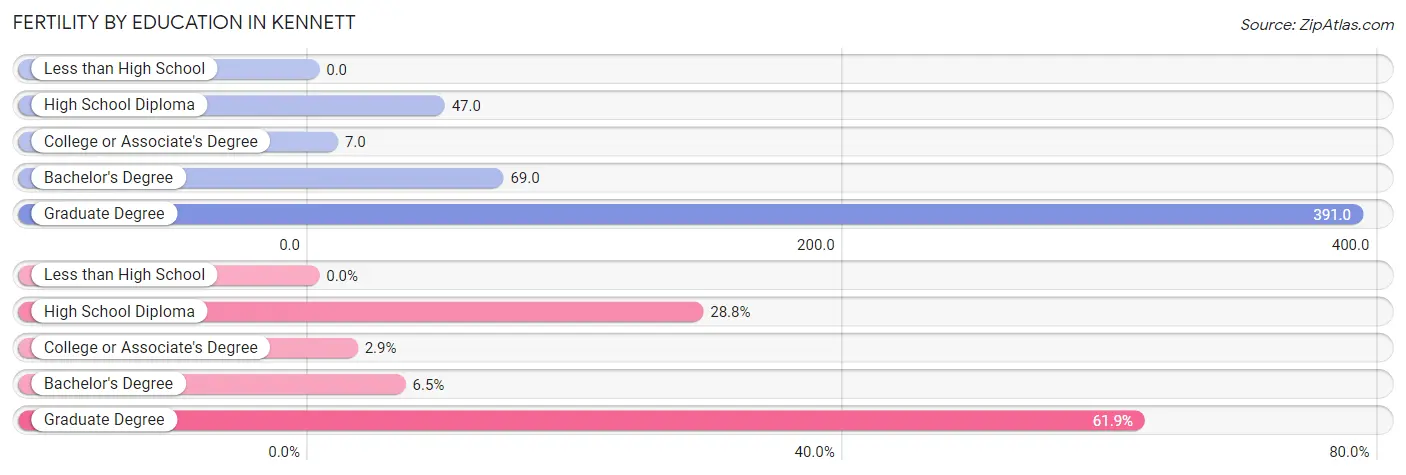
| Educational Attainment | Women with Births | Births / 1,000 Women |
| Less than High School | 0 (0.0%) | 0.0 |
| High School Diploma | 40 (28.8%) | 47.0 |
| College or Associate's Degree | 4 (2.9%) | 7.0 |
| Bachelor's Degree | 9 (6.5%) | 69.0 |
| Graduate Degree | 86 (61.9%) | 391.0 |
| Total | 139 (100.0%) | 63.0 |
Fertility by Education by Marriage Status in Kennett
28.8% of women with births in Kennett are unmarried. Women with the educational attainment of college or associate's degree are most likely to be married with 100.0% of them married at childbirth, while women with the educational attainment of high school diploma are least likely to be married with 100.0% of them unmarried at childbirth.
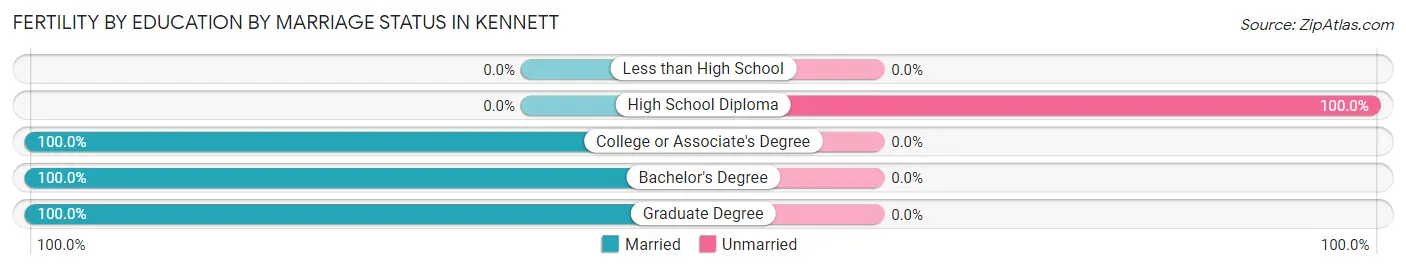
| Educational Attainment | Married | Unmarried |
| Less than High School | 0 (0.0%) | 0 (0.0%) |
| High School Diploma | 0 (0.0%) | 40 (100.0%) |
| College or Associate's Degree | 4 (100.0%) | 0 (0.0%) |
| Bachelor's Degree | 9 (100.0%) | 0 (0.0%) |
| Graduate Degree | 86 (100.0%) | 0 (0.0%) |
| Total | 99 (71.2%) | 40 (28.8%) |
Employment Characteristics in Kennett
Employment by Class of Employer in Kennett
Among the 3,799 employed individuals in Kennett, private company employees (2,342 | 61.7%), local government employees (403 | 10.6%), and self-employed (not incorporated) (371 | 9.8%) make up the most common classes of employment.
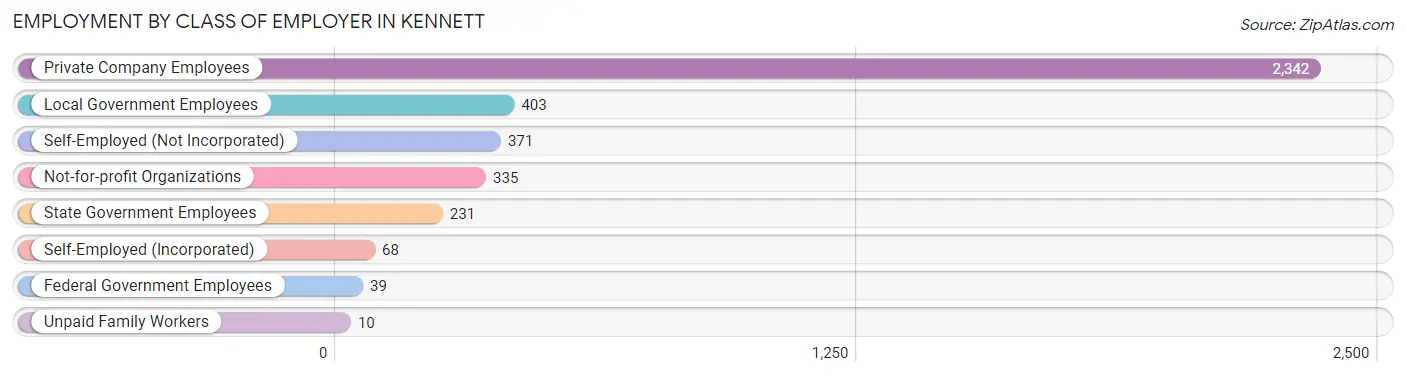
| Employer Class | # Employees | % Employees |
| Private Company Employees | 2,342 | 61.7% |
| Self-Employed (Incorporated) | 68 | 1.8% |
| Self-Employed (Not Incorporated) | 371 | 9.8% |
| Not-for-profit Organizations | 335 | 8.8% |
| Local Government Employees | 403 | 10.6% |
| State Government Employees | 231 | 6.1% |
| Federal Government Employees | 39 | 1.0% |
| Unpaid Family Workers | 10 | 0.3% |
| Total | 3,799 | 100.0% |
Employment Status by Age in Kennett
According to the labor force statistics for Kennett, out of the total population over 16 years of age (7,779), 53.4% or 4,154 individuals are in the labor force, with 7.3% or 303 of them unemployed. The age group with the highest labor force participation rate is 25 to 29 years, with 82.4% or 421 individuals in the labor force. Within the labor force, the 20 to 24 years age range has the highest percentage of unemployed individuals, with 20.4% or 90 of them being unemployed.
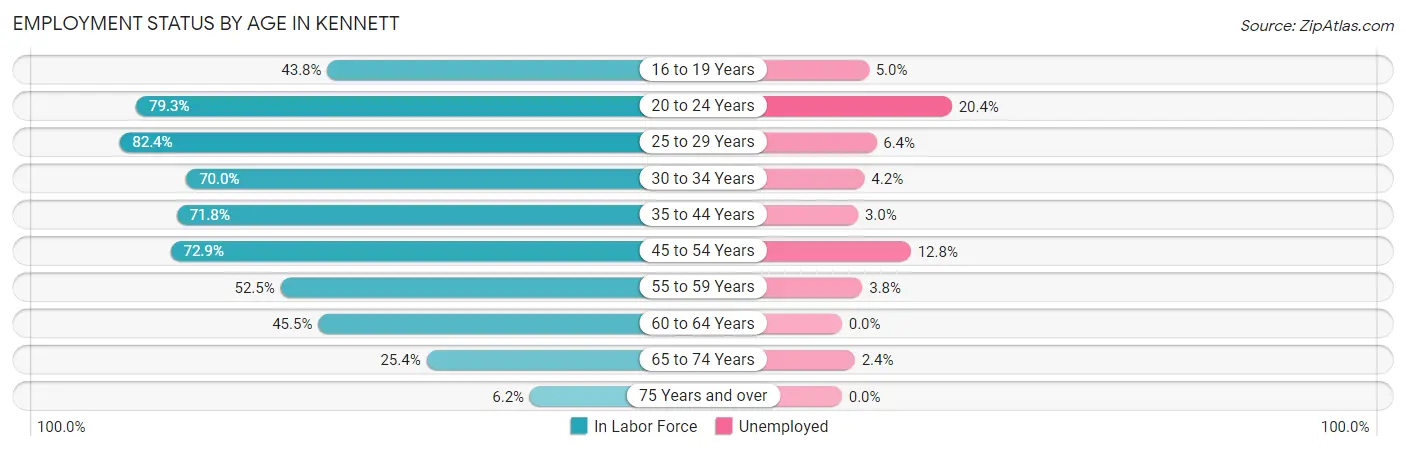
| Age Bracket | In Labor Force | Unemployed |
| 16 to 19 Years | 199 (43.8%) | 10 (5.0%) |
| 20 to 24 Years | 441 (79.3%) | 90 (20.4%) |
| 25 to 29 Years | 421 (82.4%) | 27 (6.4%) |
| 30 to 34 Years | 566 (70.0%) | 24 (4.2%) |
| 35 to 44 Years | 764 (71.8%) | 23 (3.0%) |
| 45 to 54 Years | 868 (72.9%) | 111 (12.8%) |
| 55 to 59 Years | 265 (52.5%) | 10 (3.8%) |
| 60 to 64 Years | 248 (45.5%) | 0 (0.0%) |
| 65 to 74 Years | 332 (25.4%) | 8 (2.4%) |
| 75 Years and over | 52 (6.2%) | 0 (0.0%) |
| Total | 4,154 (53.4%) | 303 (7.3%) |
Employment Status by Educational Attainment in Kennett
According to labor force statistics for Kennett, 67.7% of individuals (3,131) out of the total population between 25 and 64 years of age (4,625) are in the labor force, with 6.2% or 194 of them being unemployed. The group with the highest labor force participation rate are those with the educational attainment of bachelor's degree or higher, with 78.4% or 621 individuals in the labor force. Within the labor force, individuals with less than high school education have the highest percentage of unemployment, with 19.0% or 76 of them being unemployed.
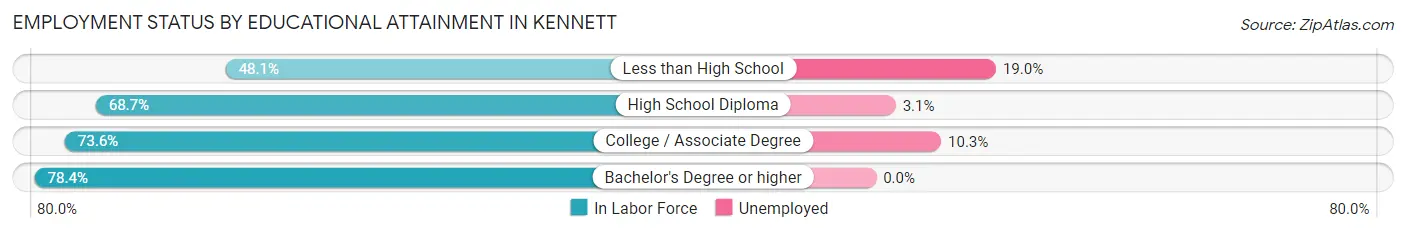
| Educational Attainment | In Labor Force | Unemployed |
| Less than High School | 399 (48.1%) | 158 (19.0%) |
| High School Diploma | 1,362 (68.7%) | 61 (3.1%) |
| College / Associate Degree | 751 (73.6%) | 105 (10.3%) |
| Bachelor's Degree or higher | 621 (78.4%) | 0 (0.0%) |
| Total | 3,131 (67.7%) | 287 (6.2%) |
Employment Occupations by Sex in Kennett
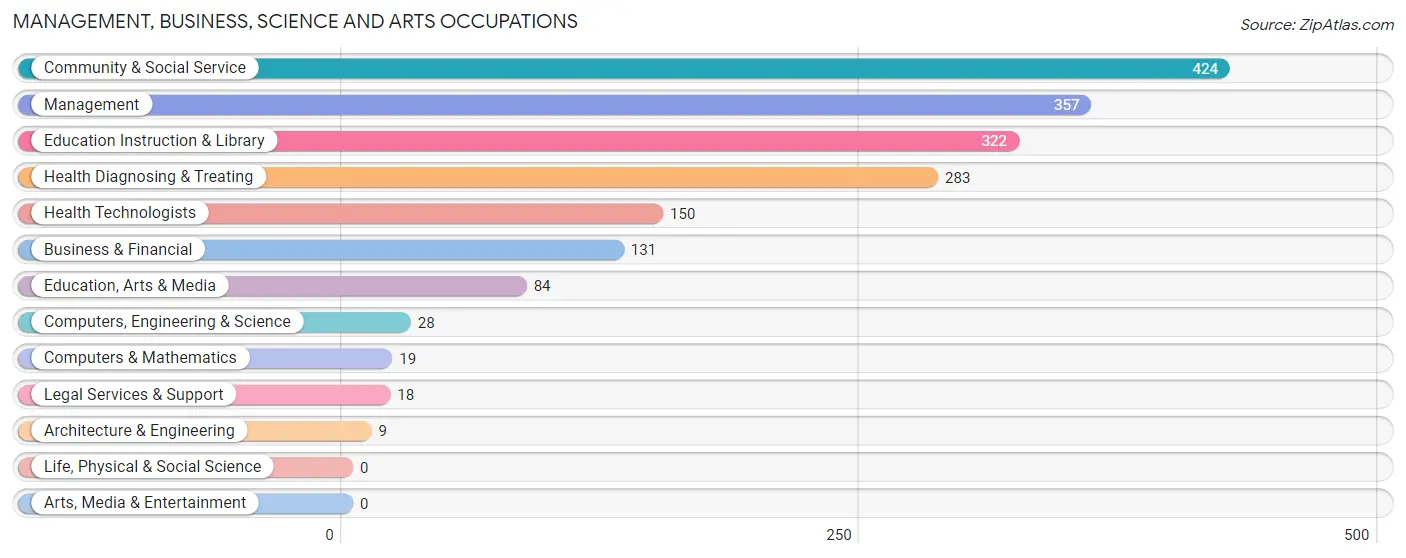
Management, Business, Science and Arts Occupations
The most common Management, Business, Science and Arts occupations in Kennett are Community & Social Service (424 | 11.0%), Management (357 | 9.3%), Education Instruction & Library (322 | 8.4%), Health Diagnosing & Treating (283 | 7.3%), and Health Technologists (150 | 3.9%).
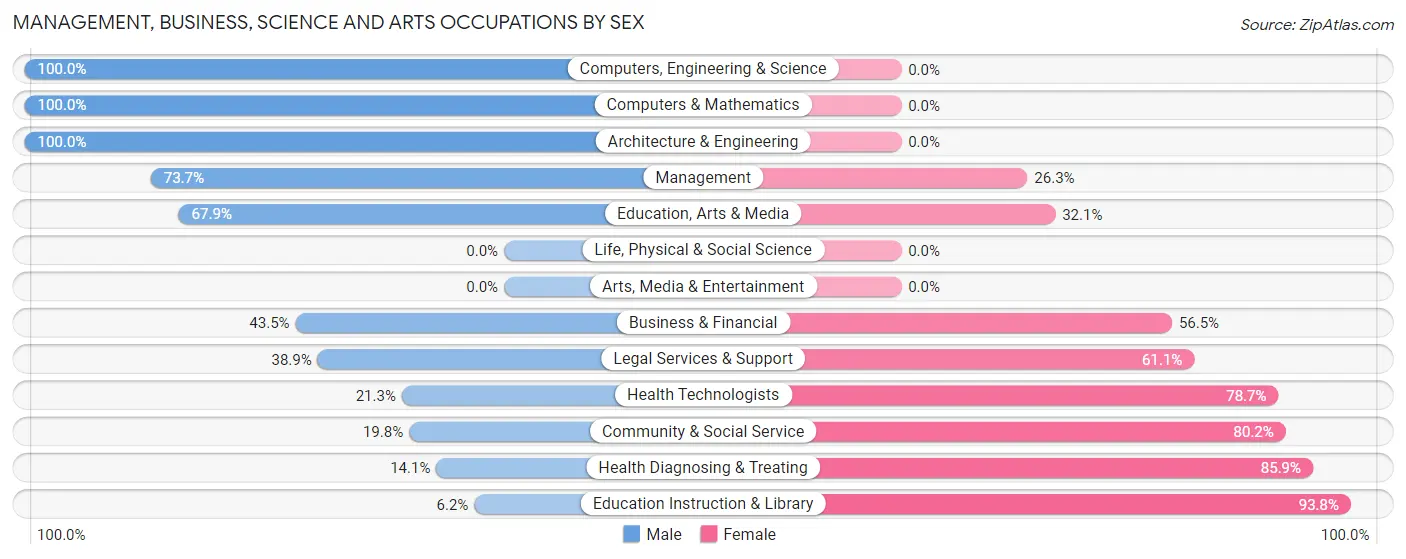
Management, Business, Science and Arts Occupations by Sex
Within the Management, Business, Science and Arts occupations in Kennett, the most male-oriented occupations are Computers, Engineering & Science (100.0%), Computers & Mathematics (100.0%), and Architecture & Engineering (100.0%), while the most female-oriented occupations are Education Instruction & Library (93.8%), Health Diagnosing & Treating (85.9%), and Community & Social Service (80.2%).
| Occupation | Male | Female |
| Management | 263 (73.7%) | 94 (26.3%) |
| Business & Financial | 57 (43.5%) | 74 (56.5%) |
| Computers, Engineering & Science | 28 (100.0%) | 0 (0.0%) |
| Computers & Mathematics | 19 (100.0%) | 0 (0.0%) |
| Architecture & Engineering | 9 (100.0%) | 0 (0.0%) |
| Life, Physical & Social Science | 0 (0.0%) | 0 (0.0%) |
| Community & Social Service | 84 (19.8%) | 340 (80.2%) |
| Education, Arts & Media | 57 (67.9%) | 27 (32.1%) |
| Legal Services & Support | 7 (38.9%) | 11 (61.1%) |
| Education Instruction & Library | 20 (6.2%) | 302 (93.8%) |
| Arts, Media & Entertainment | 0 (0.0%) | 0 (0.0%) |
| Health Diagnosing & Treating | 40 (14.1%) | 243 (85.9%) |
| Health Technologists | 32 (21.3%) | 118 (78.7%) |
| Total (Category) | 472 (38.6%) | 751 (61.4%) |
| Total (Overall) | 1,868 (48.5%) | 1,985 (51.5%) |
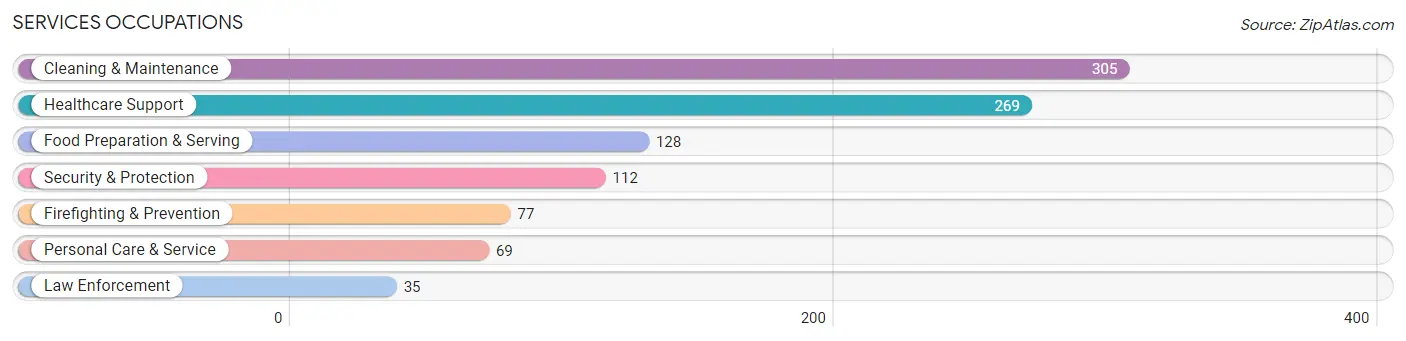
Services Occupations
The most common Services occupations in Kennett are Cleaning & Maintenance (305 | 7.9%), Healthcare Support (269 | 7.0%), Food Preparation & Serving (128 | 3.3%), Security & Protection (112 | 2.9%), and Firefighting & Prevention (77 | 2.0%).
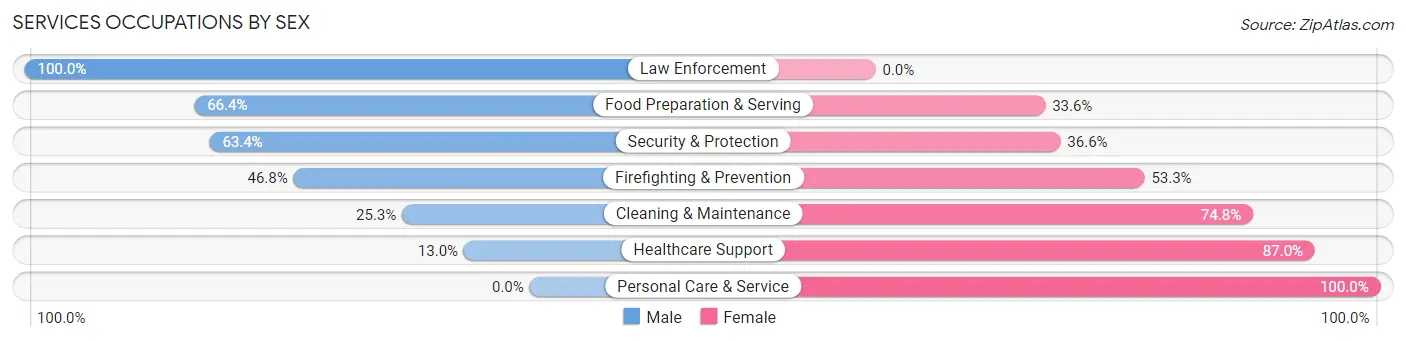
Services Occupations by Sex
Within the Services occupations in Kennett, the most male-oriented occupations are Law Enforcement (100.0%), Food Preparation & Serving (66.4%), and Security & Protection (63.4%), while the most female-oriented occupations are Personal Care & Service (100.0%), Healthcare Support (87.0%), and Cleaning & Maintenance (74.8%).
| Occupation | Male | Female |
| Healthcare Support | 35 (13.0%) | 234 (87.0%) |
| Security & Protection | 71 (63.4%) | 41 (36.6%) |
| Firefighting & Prevention | 36 (46.8%) | 41 (53.2%) |
| Law Enforcement | 35 (100.0%) | 0 (0.0%) |
| Food Preparation & Serving | 85 (66.4%) | 43 (33.6%) |
| Cleaning & Maintenance | 77 (25.3%) | 228 (74.8%) |
| Personal Care & Service | 0 (0.0%) | 69 (100.0%) |
| Total (Category) | 268 (30.3%) | 615 (69.7%) |
| Total (Overall) | 1,868 (48.5%) | 1,985 (51.5%) |
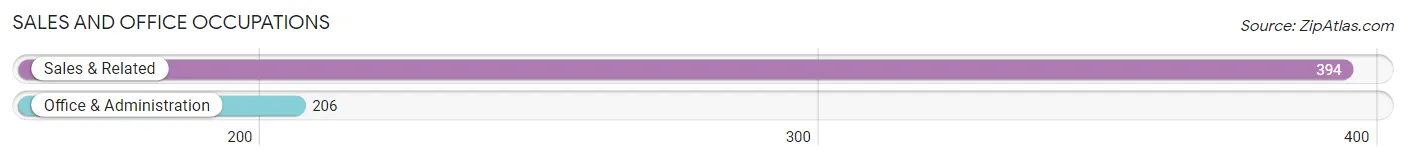
Sales and Office Occupations
The most common Sales and Office occupations in Kennett are Sales & Related (394 | 10.2%), and Office & Administration (206 | 5.3%).
Sales and Office Occupations by Sex
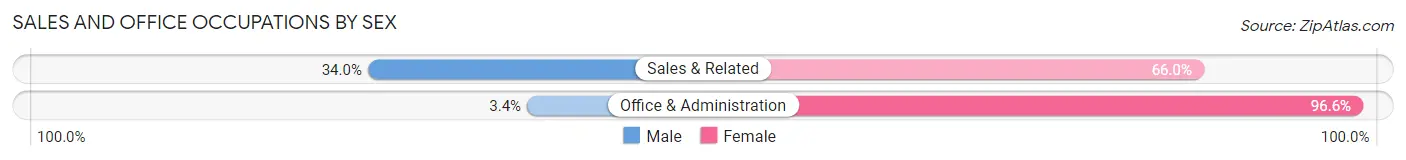
| Occupation | Male | Female |
| Sales & Related | 134 (34.0%) | 260 (66.0%) |
| Office & Administration | 7 (3.4%) | 199 (96.6%) |
| Total (Category) | 141 (23.5%) | 459 (76.5%) |
| Total (Overall) | 1,868 (48.5%) | 1,985 (51.5%) |
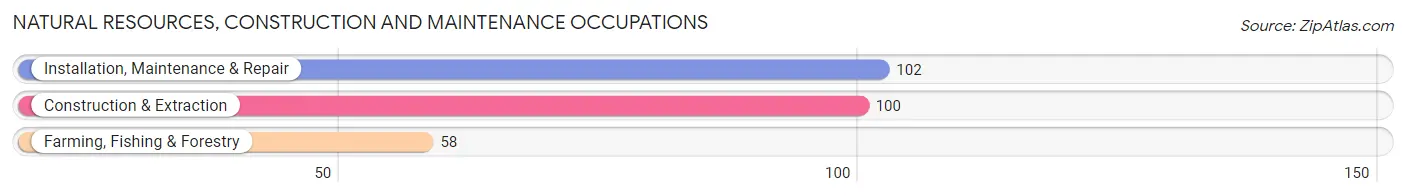
Natural Resources, Construction and Maintenance Occupations
The most common Natural Resources, Construction and Maintenance occupations in Kennett are Installation, Maintenance & Repair (102 | 2.6%), Construction & Extraction (100 | 2.6%), and Farming, Fishing & Forestry (58 | 1.5%).
Natural Resources, Construction and Maintenance Occupations by Sex
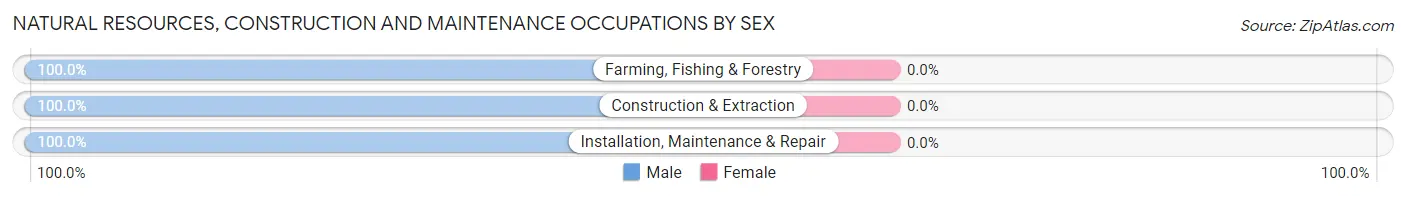
| Occupation | Male | Female |
| Farming, Fishing & Forestry | 58 (100.0%) | 0 (0.0%) |
| Construction & Extraction | 100 (100.0%) | 0 (0.0%) |
| Installation, Maintenance & Repair | 102 (100.0%) | 0 (0.0%) |
| Total (Category) | 260 (100.0%) | 0 (0.0%) |
| Total (Overall) | 1,868 (48.5%) | 1,985 (51.5%) |
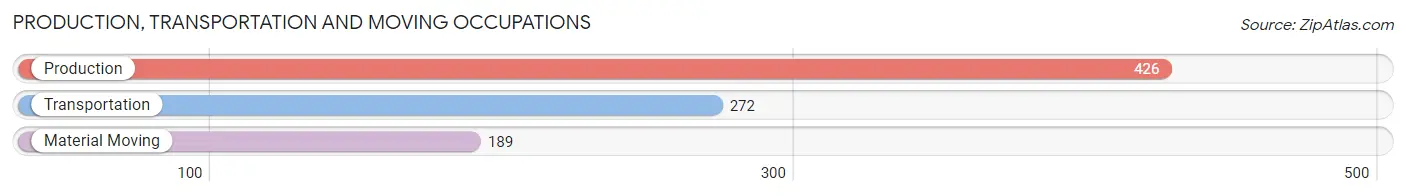
Production, Transportation and Moving Occupations
The most common Production, Transportation and Moving occupations in Kennett are Production (426 | 11.1%), Transportation (272 | 7.1%), and Material Moving (189 | 4.9%).
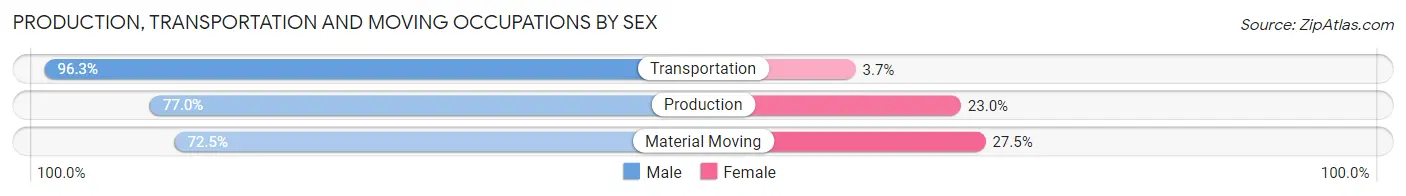
Production, Transportation and Moving Occupations by Sex
| Occupation | Male | Female |
| Production | 328 (77.0%) | 98 (23.0%) |
| Transportation | 262 (96.3%) | 10 (3.7%) |
| Material Moving | 137 (72.5%) | 52 (27.5%) |
| Total (Category) | 727 (82.0%) | 160 (18.0%) |
| Total (Overall) | 1,868 (48.5%) | 1,985 (51.5%) |
Employment Industries by Sex in Kennett
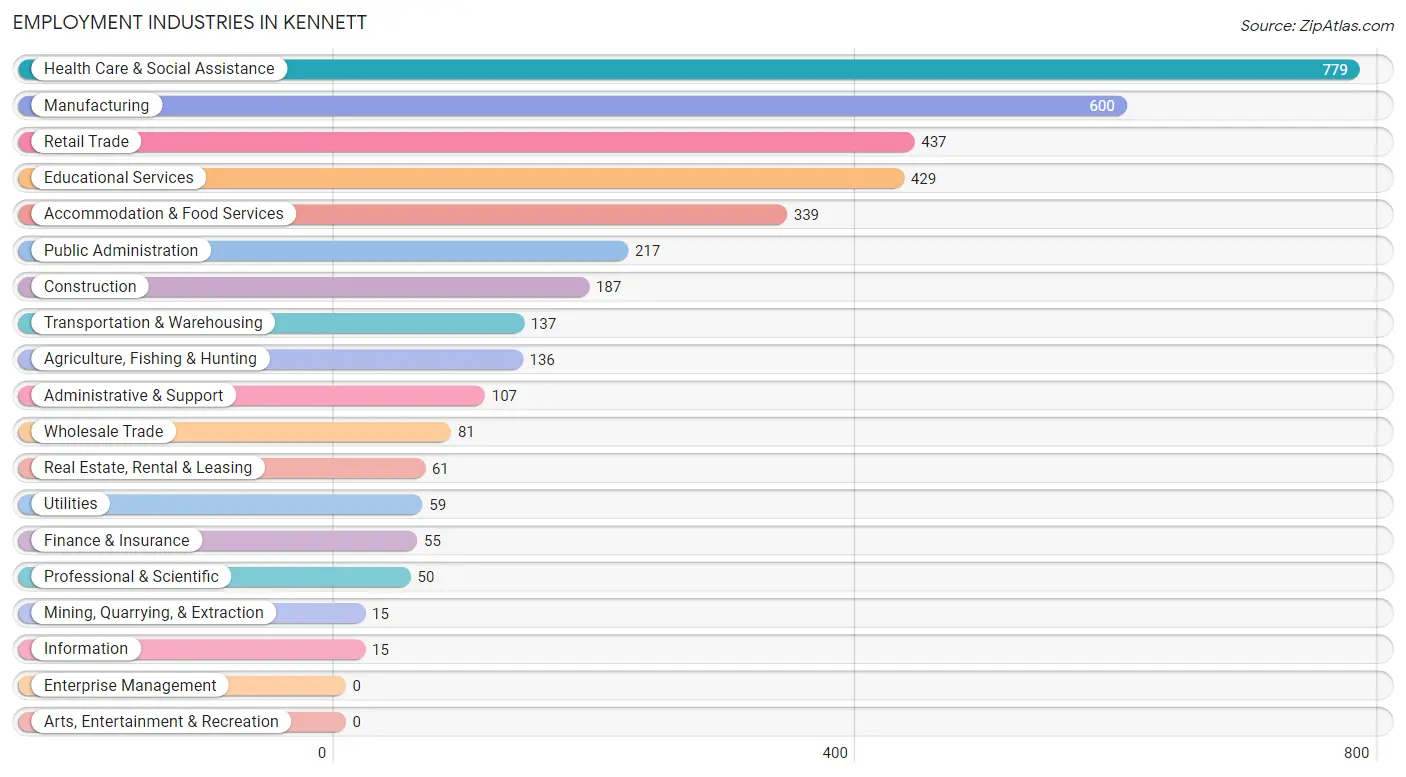
Employment Industries in Kennett
The major employment industries in Kennett include Health Care & Social Assistance (779 | 20.2%), Manufacturing (600 | 15.6%), Retail Trade (437 | 11.3%), Educational Services (429 | 11.1%), and Accommodation & Food Services (339 | 8.8%).
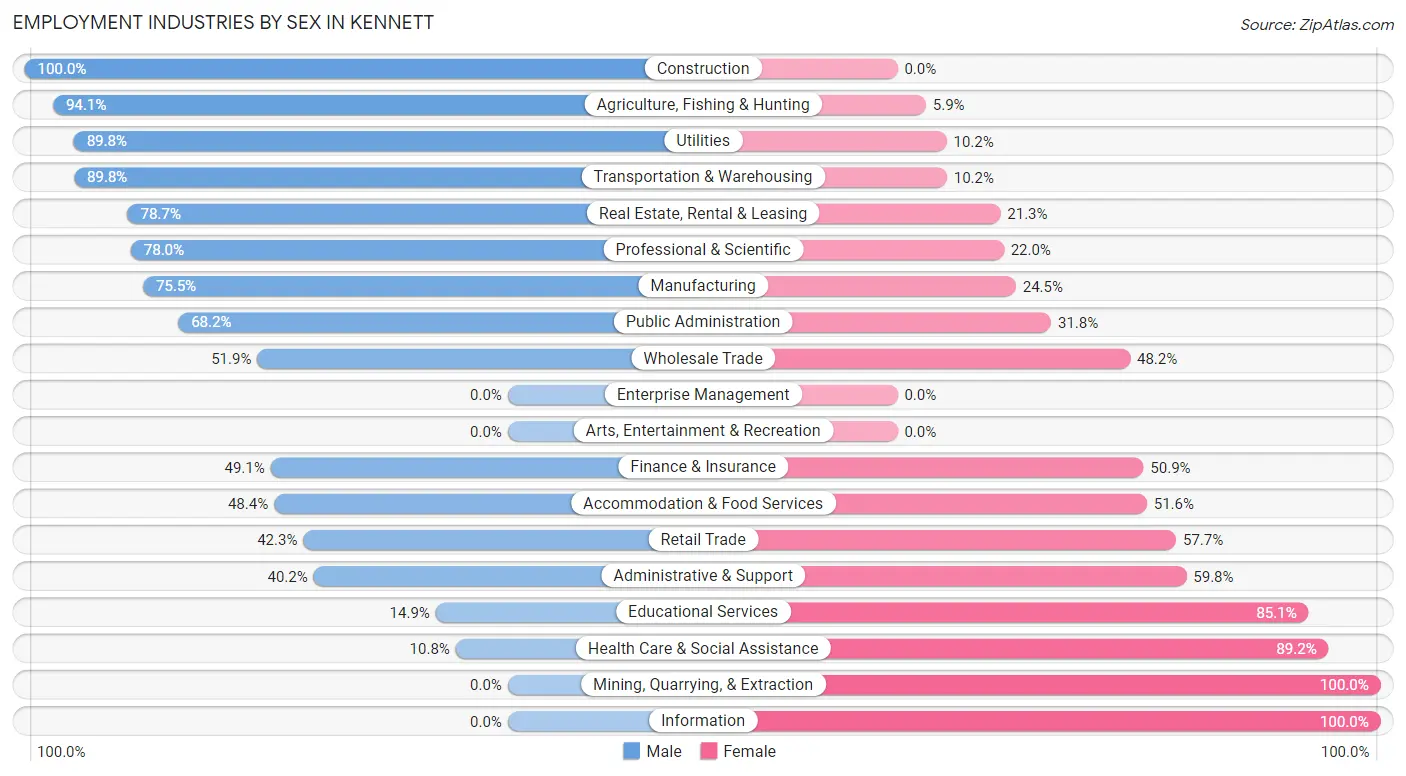
Employment Industries by Sex in Kennett
The Kennett industries that see more men than women are Construction (100.0%), Agriculture, Fishing & Hunting (94.1%), and Utilities (89.8%), whereas the industries that tend to have a higher number of women are Mining, Quarrying, & Extraction (100.0%), Information (100.0%), and Health Care & Social Assistance (89.2%).
| Industry | Male | Female |
| Agriculture, Fishing & Hunting | 128 (94.1%) | 8 (5.9%) |
| Mining, Quarrying, & Extraction | 0 (0.0%) | 15 (100.0%) |
| Construction | 187 (100.0%) | 0 (0.0%) |
| Manufacturing | 453 (75.5%) | 147 (24.5%) |
| Wholesale Trade | 42 (51.8%) | 39 (48.1%) |
| Retail Trade | 185 (42.3%) | 252 (57.7%) |
| Transportation & Warehousing | 123 (89.8%) | 14 (10.2%) |
| Utilities | 53 (89.8%) | 6 (10.2%) |
| Information | 0 (0.0%) | 15 (100.0%) |
| Finance & Insurance | 27 (49.1%) | 28 (50.9%) |
| Real Estate, Rental & Leasing | 48 (78.7%) | 13 (21.3%) |
| Professional & Scientific | 39 (78.0%) | 11 (22.0%) |
| Enterprise Management | 0 (0.0%) | 0 (0.0%) |
| Administrative & Support | 43 (40.2%) | 64 (59.8%) |
| Educational Services | 64 (14.9%) | 365 (85.1%) |
| Health Care & Social Assistance | 84 (10.8%) | 695 (89.2%) |
| Arts, Entertainment & Recreation | 0 (0.0%) | 0 (0.0%) |
| Accommodation & Food Services | 164 (48.4%) | 175 (51.6%) |
| Public Administration | 148 (68.2%) | 69 (31.8%) |
| Total | 1,868 (48.5%) | 1,985 (51.5%) |
Education in Kennett
School Enrollment in Kennett
The most common levels of schooling among the 2,434 students in Kennett are middle school (628 | 25.8%), elementary school (588 | 24.2%), and high school (577 | 23.7%).
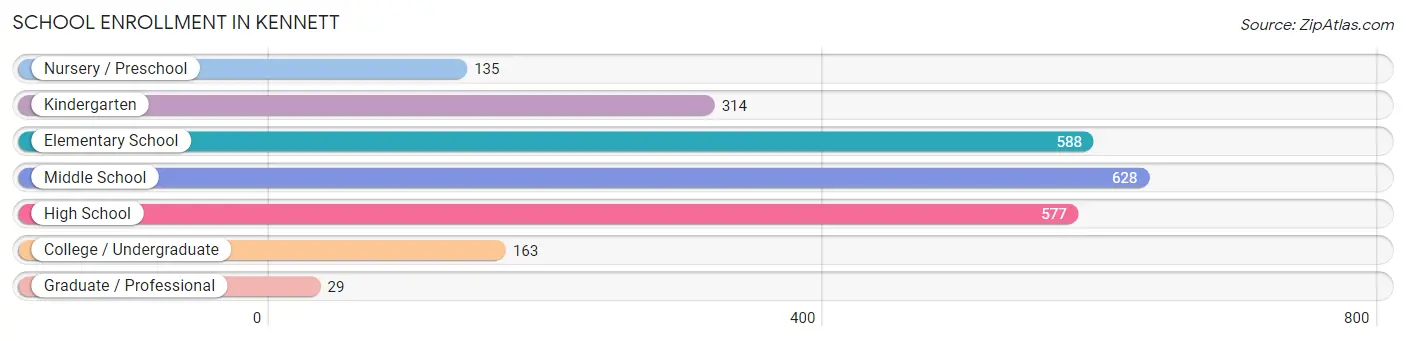
| School Level | # Students | % Students |
| Nursery / Preschool | 135 | 5.6% |
| Kindergarten | 314 | 12.9% |
| Elementary School | 588 | 24.2% |
| Middle School | 628 | 25.8% |
| High School | 577 | 23.7% |
| College / Undergraduate | 163 | 6.7% |
| Graduate / Professional | 29 | 1.2% |
| Total | 2,434 | 100.0% |
School Enrollment by Age by Funding Source in Kennett
Out of a total of 2,434 students who are enrolled in schools in Kennett, 114 (4.7%) attend a private institution, while the remaining 2,320 (95.3%) are enrolled in public schools. The age group of 35 years and over has the highest likelihood of being enrolled in private schools, with 12 (52.2% in the age bracket) enrolled. Conversely, the age group of 3 to 4 year olds has the lowest likelihood of being enrolled in a private school, with 83 (100.0% in the age bracket) attending a public institution.
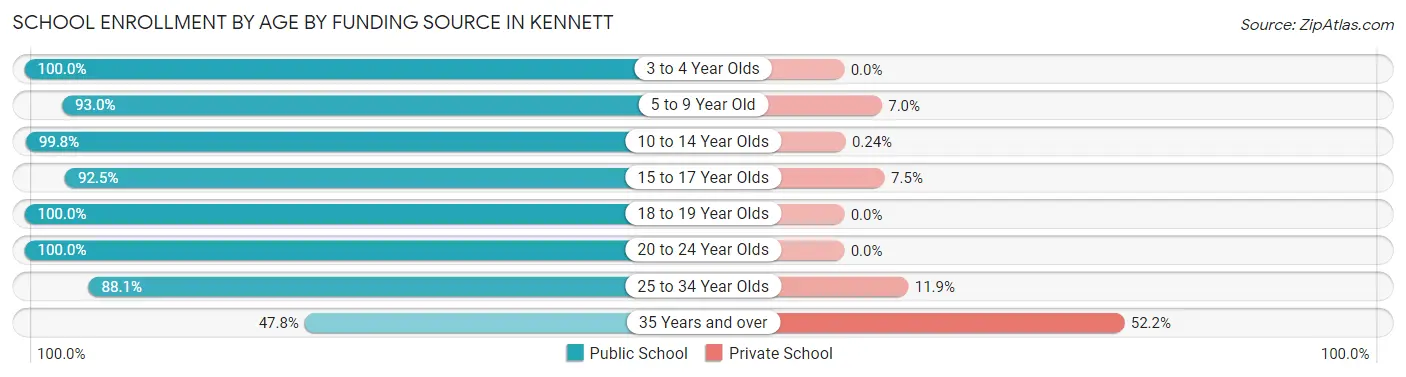
| Age Bracket | Public School | Private School |
| 3 to 4 Year Olds | 83 (100.0%) | 0 (0.0%) |
| 5 to 9 Year Old | 771 (93.0%) | 58 (7.0%) |
| 10 to 14 Year Olds | 830 (99.8%) | 2 (0.2%) |
| 15 to 17 Year Olds | 417 (92.5%) | 34 (7.5%) |
| 18 to 19 Year Olds | 59 (100.0%) | 0 (0.0%) |
| 20 to 24 Year Olds | 90 (100.0%) | 0 (0.0%) |
| 25 to 34 Year Olds | 59 (88.1%) | 8 (11.9%) |
| 35 Years and over | 11 (47.8%) | 12 (52.2%) |
| Total | 2,320 (95.3%) | 114 (4.7%) |
Educational Attainment by Field of Study in Kennett
Education (584 | 47.2%), business (244 | 19.7%), bio, nature & agricultural (93 | 7.5%), liberal arts & history (89 | 7.2%), and science & technology (65 | 5.3%) are the most common fields of study among 1,236 individuals in Kennett who have obtained a bachelor's degree or higher.
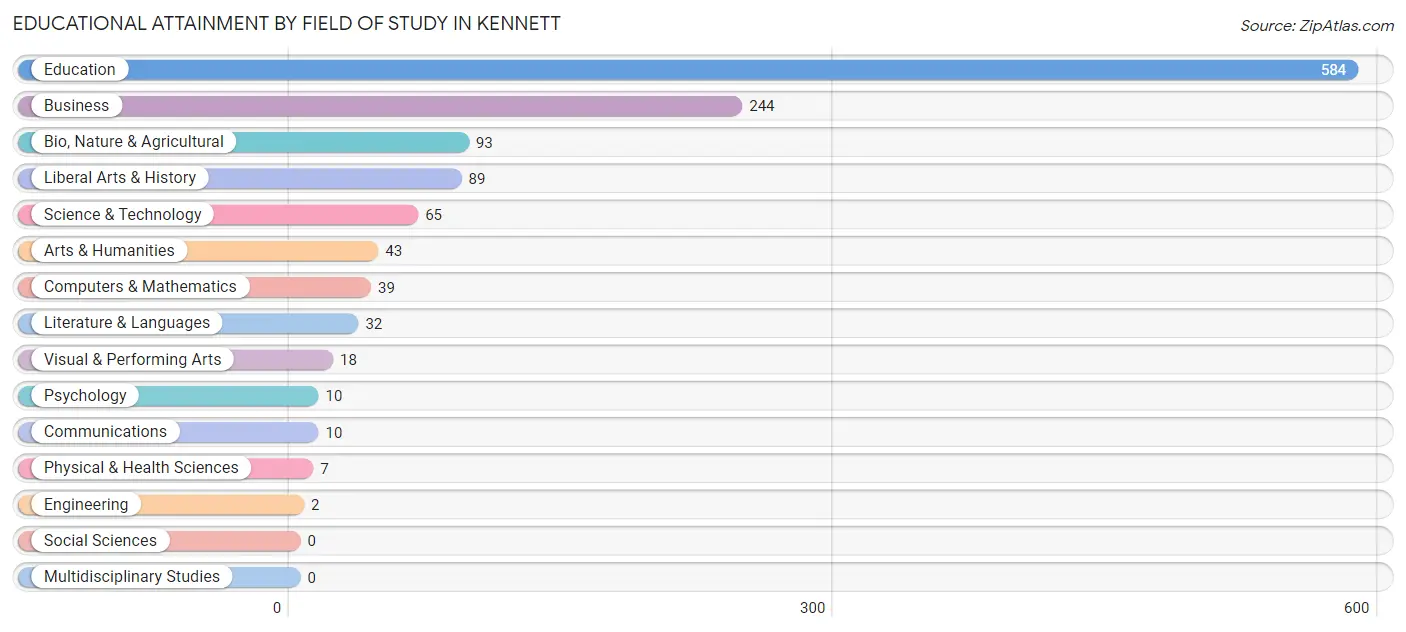
| Field of Study | # Graduates | % Graduates |
| Computers & Mathematics | 39 | 3.2% |
| Bio, Nature & Agricultural | 93 | 7.5% |
| Physical & Health Sciences | 7 | 0.6% |
| Psychology | 10 | 0.8% |
| Social Sciences | 0 | 0.0% |
| Engineering | 2 | 0.2% |
| Multidisciplinary Studies | 0 | 0.0% |
| Science & Technology | 65 | 5.3% |
| Business | 244 | 19.7% |
| Education | 584 | 47.2% |
| Literature & Languages | 32 | 2.6% |
| Liberal Arts & History | 89 | 7.2% |
| Visual & Performing Arts | 18 | 1.5% |
| Communications | 10 | 0.8% |
| Arts & Humanities | 43 | 3.5% |
| Total | 1,236 | 100.0% |
Transportation & Commute in Kennett
Vehicle Availability by Sex in Kennett
The most prevalent vehicle ownership categories in Kennett are males with 2 vehicles (924, accounting for 50.1%) and females with 2 vehicles (897, making up 47.3%).
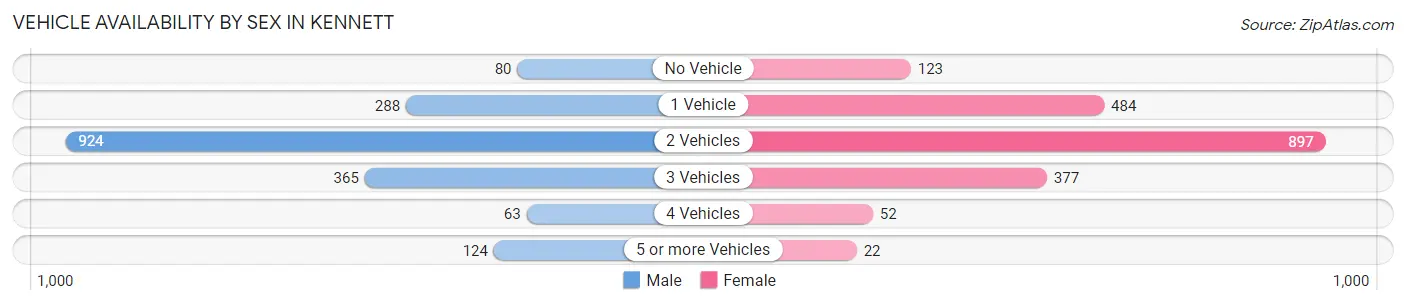
| Vehicles Available | Male | Female |
| No Vehicle | 80 (4.3%) | 123 (6.3%) |
| 1 Vehicle | 288 (15.6%) | 484 (24.8%) |
| 2 Vehicles | 924 (50.1%) | 897 (45.9%) |
| 3 Vehicles | 365 (19.8%) | 377 (19.3%) |
| 4 Vehicles | 63 (3.4%) | 52 (2.7%) |
| 5 or more Vehicles | 124 (6.7%) | 22 (1.1%) |
| Total | 1,844 (100.0%) | 1,955 (100.0%) |
Commute Time in Kennett
The most frequently occuring commute durations in Kennett are 5 to 9 minutes (954 commuters, 26.3%), 10 to 14 minutes (563 commuters, 15.5%), and less than 5 minutes (458 commuters, 12.6%).
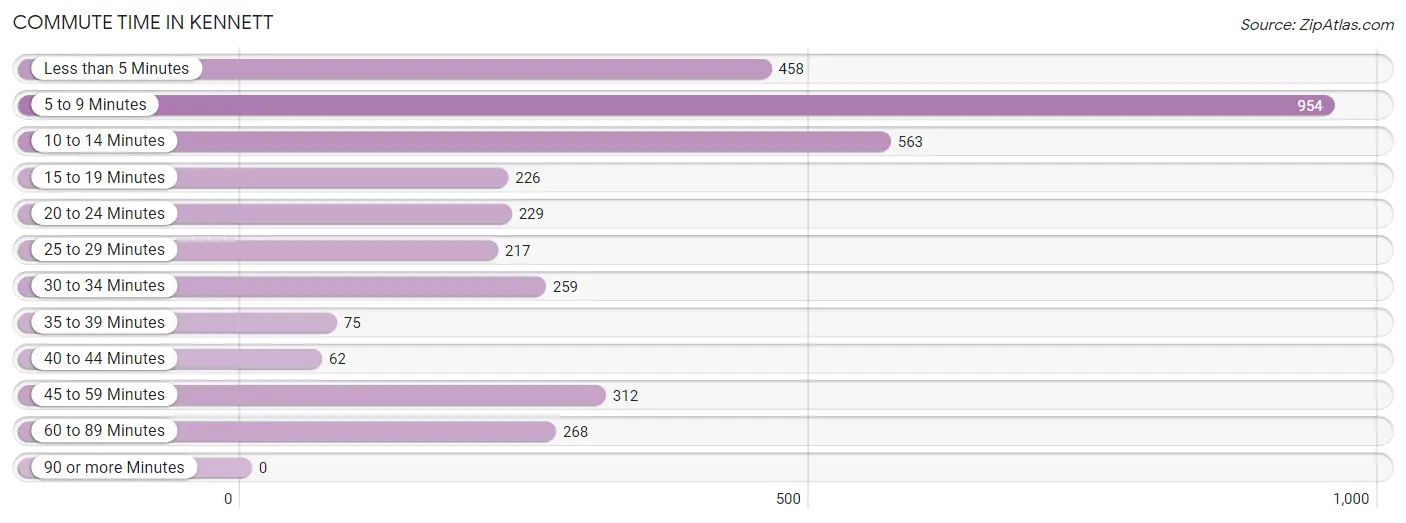
| Commute Time | # Commuters | % Commuters |
| Less than 5 Minutes | 458 | 12.6% |
| 5 to 9 Minutes | 954 | 26.3% |
| 10 to 14 Minutes | 563 | 15.5% |
| 15 to 19 Minutes | 226 | 6.2% |
| 20 to 24 Minutes | 229 | 6.3% |
| 25 to 29 Minutes | 217 | 6.0% |
| 30 to 34 Minutes | 259 | 7.1% |
| 35 to 39 Minutes | 75 | 2.1% |
| 40 to 44 Minutes | 62 | 1.7% |
| 45 to 59 Minutes | 312 | 8.6% |
| 60 to 89 Minutes | 268 | 7.4% |
| 90 or more Minutes | 0 | 0.0% |
Commute Time by Sex in Kennett
The most common commute times in Kennett are 5 to 9 minutes (340 commuters, 19.0%) for males and 5 to 9 minutes (614 commuters, 33.5%) for females.
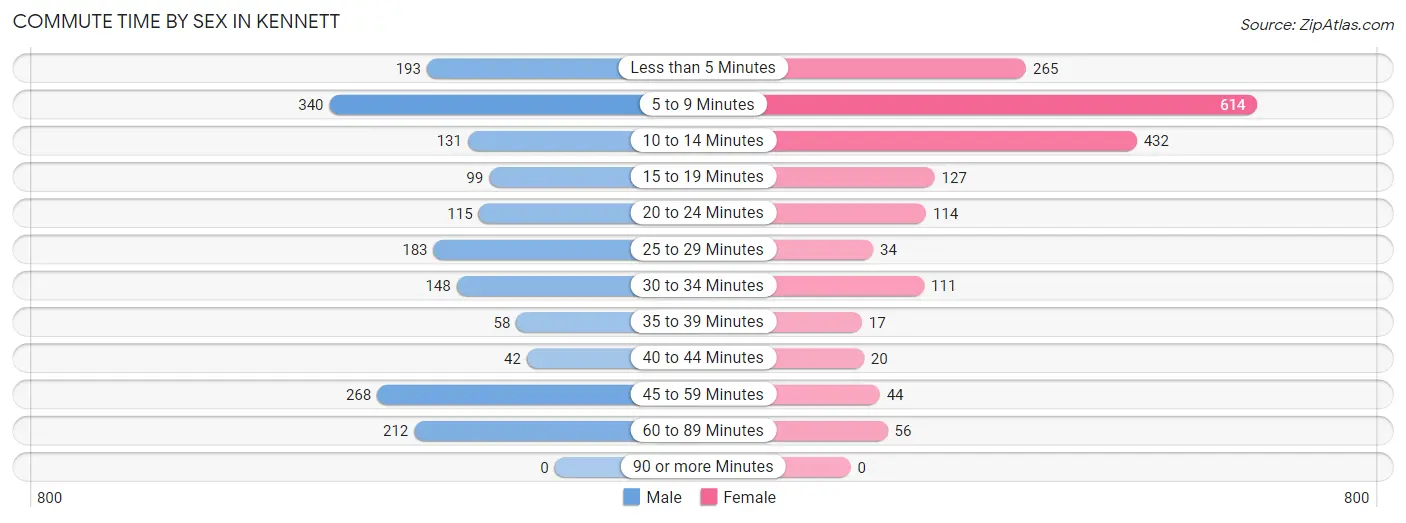
| Commute Time | Male | Female |
| Less than 5 Minutes | 193 (10.8%) | 265 (14.4%) |
| 5 to 9 Minutes | 340 (19.0%) | 614 (33.5%) |
| 10 to 14 Minutes | 131 (7.3%) | 432 (23.6%) |
| 15 to 19 Minutes | 99 (5.5%) | 127 (6.9%) |
| 20 to 24 Minutes | 115 (6.4%) | 114 (6.2%) |
| 25 to 29 Minutes | 183 (10.2%) | 34 (1.8%) |
| 30 to 34 Minutes | 148 (8.3%) | 111 (6.0%) |
| 35 to 39 Minutes | 58 (3.2%) | 17 (0.9%) |
| 40 to 44 Minutes | 42 (2.4%) | 20 (1.1%) |
| 45 to 59 Minutes | 268 (15.0%) | 44 (2.4%) |
| 60 to 89 Minutes | 212 (11.8%) | 56 (3.0%) |
| 90 or more Minutes | 0 (0.0%) | 0 (0.0%) |
Time of Departure to Work by Sex in Kennett
The most frequent times of departure to work in Kennett are 4:00 PM to 11:59 PM (295, 16.5%) for males and 6:30 AM to 6:59 AM (304, 16.6%) for females.
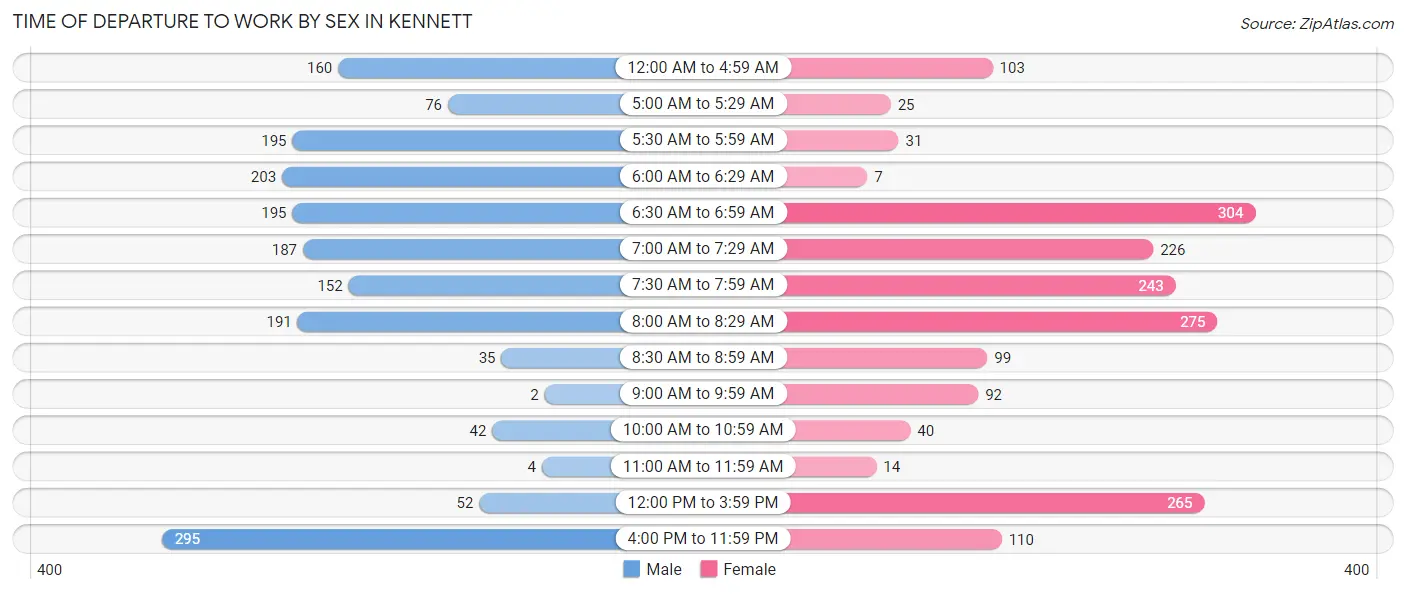
| Time of Departure | Male | Female |
| 12:00 AM to 4:59 AM | 160 (8.9%) | 103 (5.6%) |
| 5:00 AM to 5:29 AM | 76 (4.3%) | 25 (1.4%) |
| 5:30 AM to 5:59 AM | 195 (10.9%) | 31 (1.7%) |
| 6:00 AM to 6:29 AM | 203 (11.4%) | 7 (0.4%) |
| 6:30 AM to 6:59 AM | 195 (10.9%) | 304 (16.6%) |
| 7:00 AM to 7:29 AM | 187 (10.4%) | 226 (12.3%) |
| 7:30 AM to 7:59 AM | 152 (8.5%) | 243 (13.3%) |
| 8:00 AM to 8:29 AM | 191 (10.7%) | 275 (15.0%) |
| 8:30 AM to 8:59 AM | 35 (2.0%) | 99 (5.4%) |
| 9:00 AM to 9:59 AM | 2 (0.1%) | 92 (5.0%) |
| 10:00 AM to 10:59 AM | 42 (2.4%) | 40 (2.2%) |
| 11:00 AM to 11:59 AM | 4 (0.2%) | 14 (0.8%) |
| 12:00 PM to 3:59 PM | 52 (2.9%) | 265 (14.4%) |
| 4:00 PM to 11:59 PM | 295 (16.5%) | 110 (6.0%) |
| Total | 1,789 (100.0%) | 1,834 (100.0%) |
Housing Occupancy in Kennett
Occupancy by Ownership in Kennett
Of the total 3,992 dwellings in Kennett, owner-occupied units account for 2,340 (58.6%), while renter-occupied units make up 1,652 (41.4%).
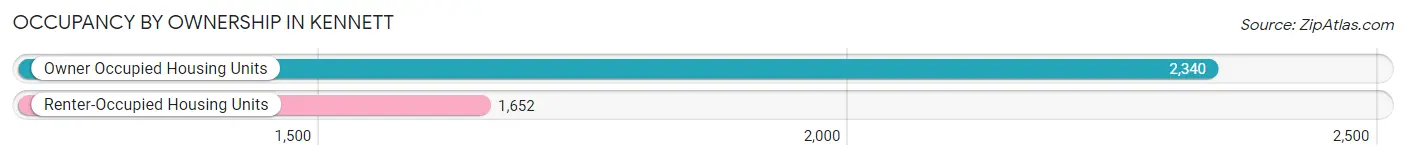
| Occupancy | # Housing Units | % Housing Units |
| Owner Occupied Housing Units | 2,340 | 58.6% |
| Renter-Occupied Housing Units | 1,652 | 41.4% |
| Total Occupied Housing Units | 3,992 | 100.0% |
Occupancy by Household Size in Kennett
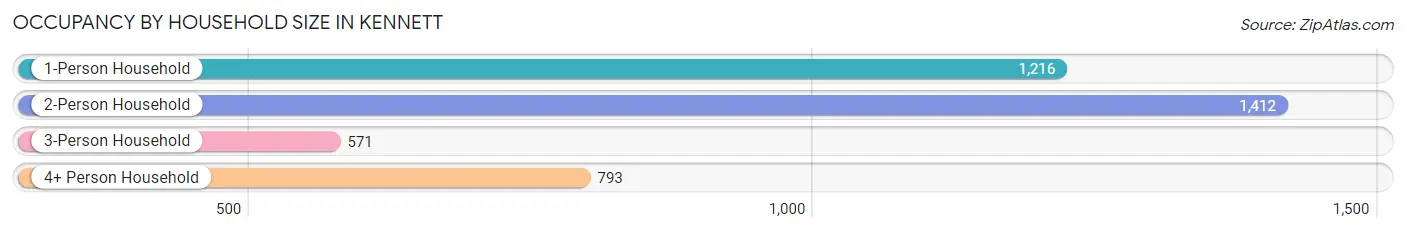
| Household Size | # Housing Units | % Housing Units |
| 1-Person Household | 1,216 | 30.5% |
| 2-Person Household | 1,412 | 35.4% |
| 3-Person Household | 571 | 14.3% |
| 4+ Person Household | 793 | 19.9% |
| Total Housing Units | 3,992 | 100.0% |
Occupancy by Ownership by Household Size in Kennett
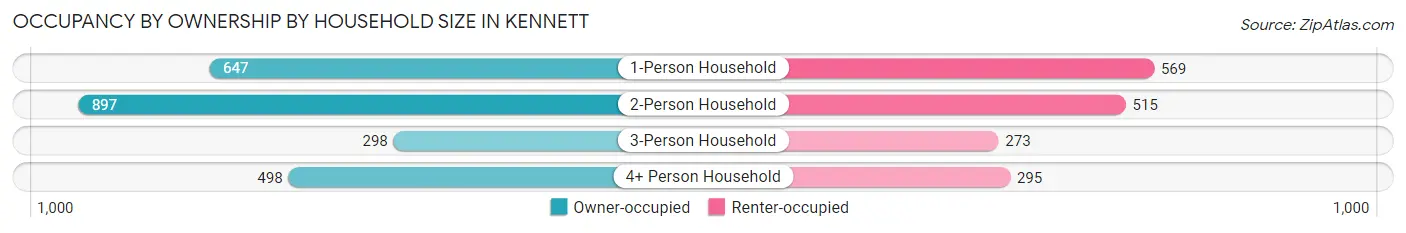
| Household Size | Owner-occupied | Renter-occupied |
| 1-Person Household | 647 (53.2%) | 569 (46.8%) |
| 2-Person Household | 897 (63.5%) | 515 (36.5%) |
| 3-Person Household | 298 (52.2%) | 273 (47.8%) |
| 4+ Person Household | 498 (62.8%) | 295 (37.2%) |
| Total Housing Units | 2,340 (58.6%) | 1,652 (41.4%) |
Occupancy by Educational Attainment in Kennett
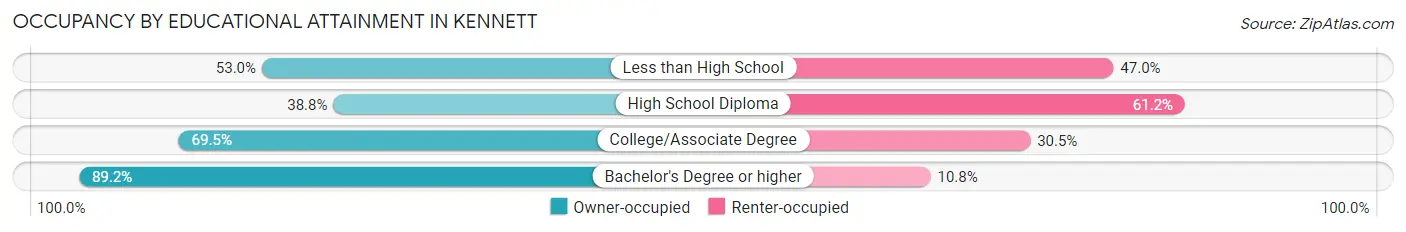
| Household Size | Owner-occupied | Renter-occupied |
| Less than High School | 385 (53.0%) | 342 (47.0%) |
| High School Diploma | 588 (38.8%) | 928 (61.2%) |
| College/Associate Degree | 680 (69.5%) | 299 (30.5%) |
| Bachelor's Degree or higher | 687 (89.2%) | 83 (10.8%) |
Occupancy by Age of Householder in Kennett
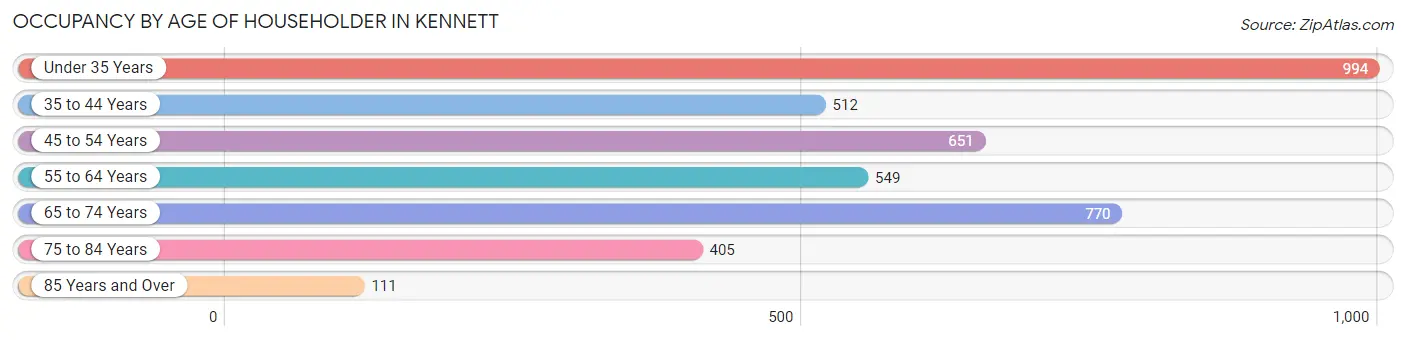
| Age Bracket | # Households | % Households |
| Under 35 Years | 994 | 24.9% |
| 35 to 44 Years | 512 | 12.8% |
| 45 to 54 Years | 651 | 16.3% |
| 55 to 64 Years | 549 | 13.8% |
| 65 to 74 Years | 770 | 19.3% |
| 75 to 84 Years | 405 | 10.2% |
| 85 Years and Over | 111 | 2.8% |
| Total | 3,992 | 100.0% |
Housing Finances in Kennett
Median Income by Occupancy in Kennett
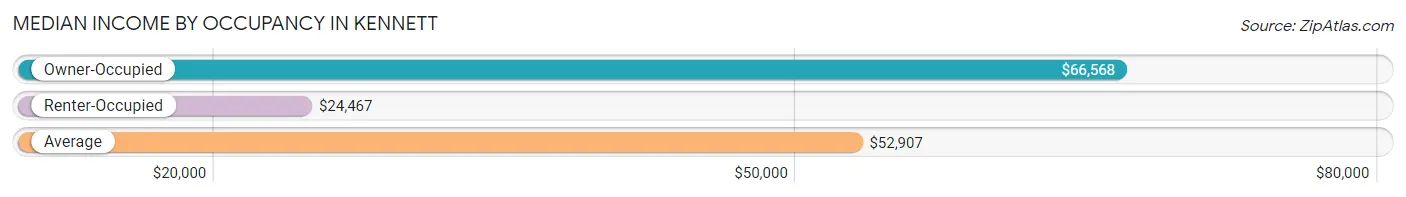
| Occupancy Type | # Households | Median Income |
| Owner-Occupied | 2,340 (58.6%) | $66,568 |
| Renter-Occupied | 1,652 (41.4%) | $24,467 |
| Average | 3,992 (100.0%) | $52,907 |
Occupancy by Householder Income Bracket in Kennett
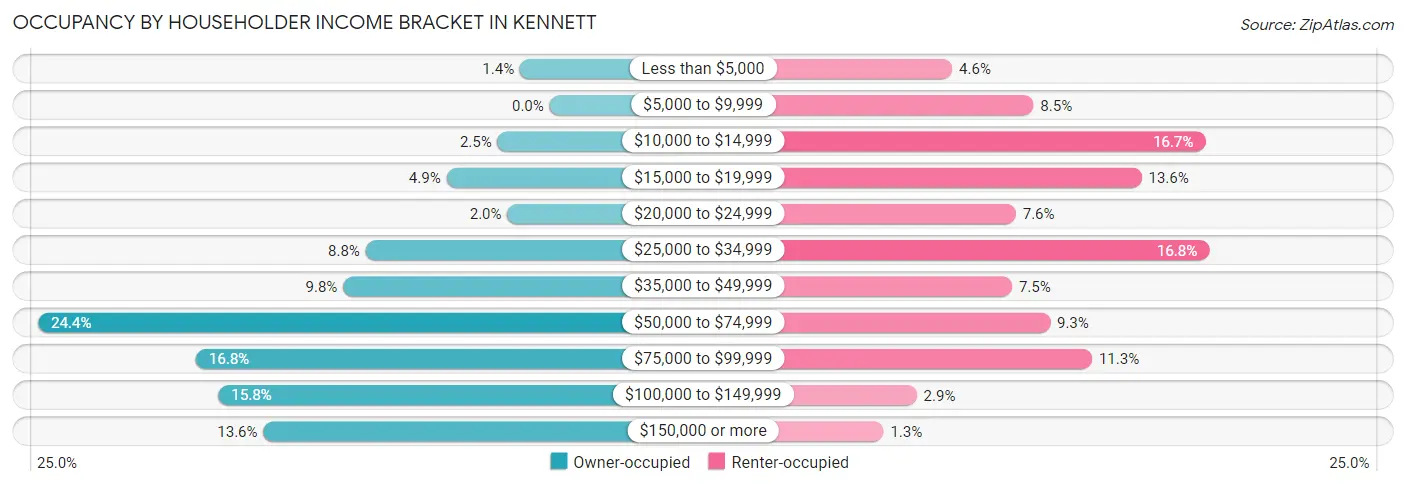
| Income Bracket | Owner-occupied | Renter-occupied |
| Less than $5,000 | 33 (1.4%) | 76 (4.6%) |
| $5,000 to $9,999 | 0 (0.0%) | 140 (8.5%) |
| $10,000 to $14,999 | 58 (2.5%) | 275 (16.7%) |
| $15,000 to $19,999 | 115 (4.9%) | 225 (13.6%) |
| $20,000 to $24,999 | 47 (2.0%) | 126 (7.6%) |
| $25,000 to $34,999 | 205 (8.8%) | 278 (16.8%) |
| $35,000 to $49,999 | 230 (9.8%) | 123 (7.4%) |
| $50,000 to $74,999 | 570 (24.4%) | 153 (9.3%) |
| $75,000 to $99,999 | 394 (16.8%) | 186 (11.3%) |
| $100,000 to $149,999 | 369 (15.8%) | 48 (2.9%) |
| $150,000 or more | 319 (13.6%) | 22 (1.3%) |
| Total | 2,340 (100.0%) | 1,652 (100.0%) |
Monthly Housing Cost Tiers in Kennett
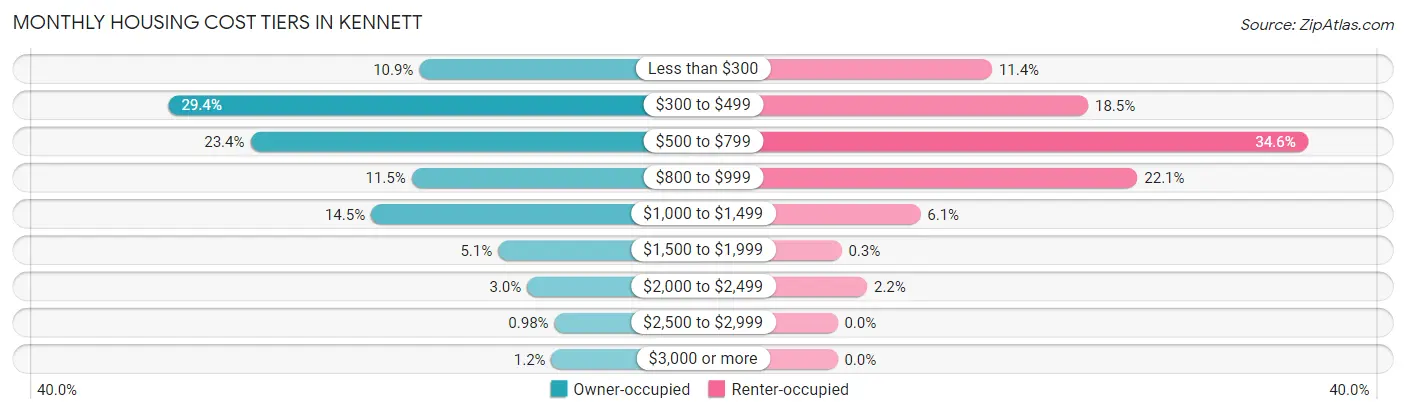
| Monthly Cost | Owner-occupied | Renter-occupied |
| Less than $300 | 256 (10.9%) | 188 (11.4%) |
| $300 to $499 | 688 (29.4%) | 305 (18.5%) |
| $500 to $799 | 547 (23.4%) | 572 (34.6%) |
| $800 to $999 | 269 (11.5%) | 365 (22.1%) |
| $1,000 to $1,499 | 339 (14.5%) | 101 (6.1%) |
| $1,500 to $1,999 | 120 (5.1%) | 5 (0.3%) |
| $2,000 to $2,499 | 70 (3.0%) | 36 (2.2%) |
| $2,500 to $2,999 | 23 (1.0%) | 0 (0.0%) |
| $3,000 or more | 28 (1.2%) | 0 (0.0%) |
| Total | 2,340 (100.0%) | 1,652 (100.0%) |
Physical Housing Characteristics in Kennett
Housing Structures in Kennett
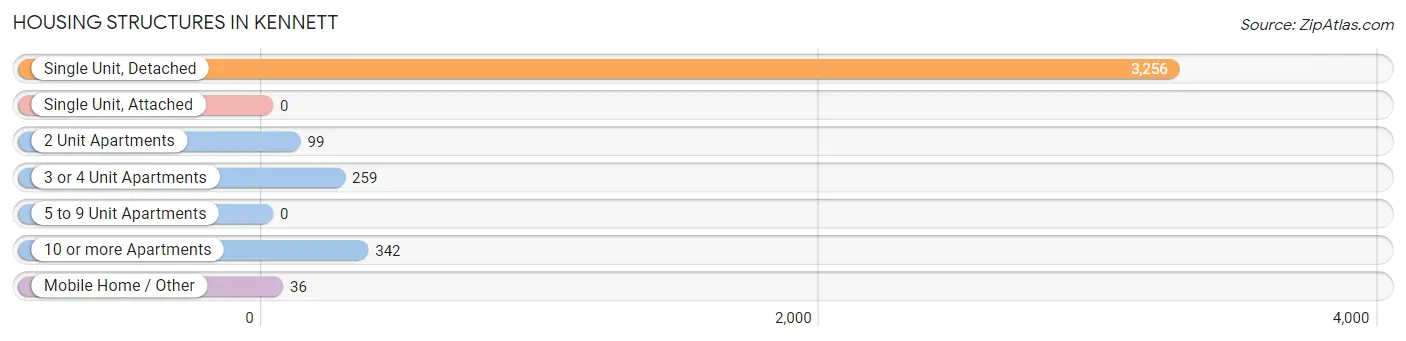
| Structure Type | # Housing Units | % Housing Units |
| Single Unit, Detached | 3,256 | 81.6% |
| Single Unit, Attached | 0 | 0.0% |
| 2 Unit Apartments | 99 | 2.5% |
| 3 or 4 Unit Apartments | 259 | 6.5% |
| 5 to 9 Unit Apartments | 0 | 0.0% |
| 10 or more Apartments | 342 | 8.6% |
| Mobile Home / Other | 36 | 0.9% |
| Total | 3,992 | 100.0% |
Housing Structures by Occupancy in Kennett
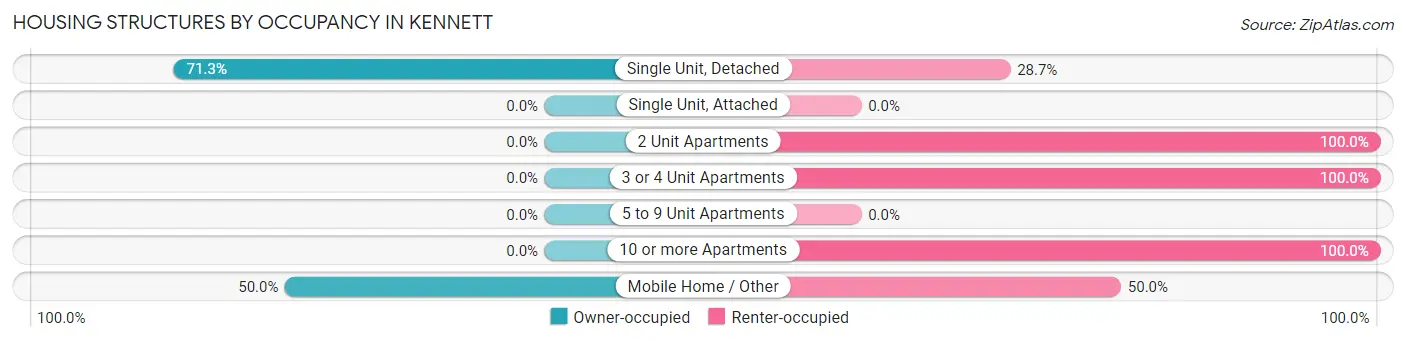
| Structure Type | Owner-occupied | Renter-occupied |
| Single Unit, Detached | 2,322 (71.3%) | 934 (28.7%) |
| Single Unit, Attached | 0 (0.0%) | 0 (0.0%) |
| 2 Unit Apartments | 0 (0.0%) | 99 (100.0%) |
| 3 or 4 Unit Apartments | 0 (0.0%) | 259 (100.0%) |
| 5 to 9 Unit Apartments | 0 (0.0%) | 0 (0.0%) |
| 10 or more Apartments | 0 (0.0%) | 342 (100.0%) |
| Mobile Home / Other | 18 (50.0%) | 18 (50.0%) |
| Total | 2,340 (58.6%) | 1,652 (41.4%) |
Housing Structures by Number of Rooms in Kennett
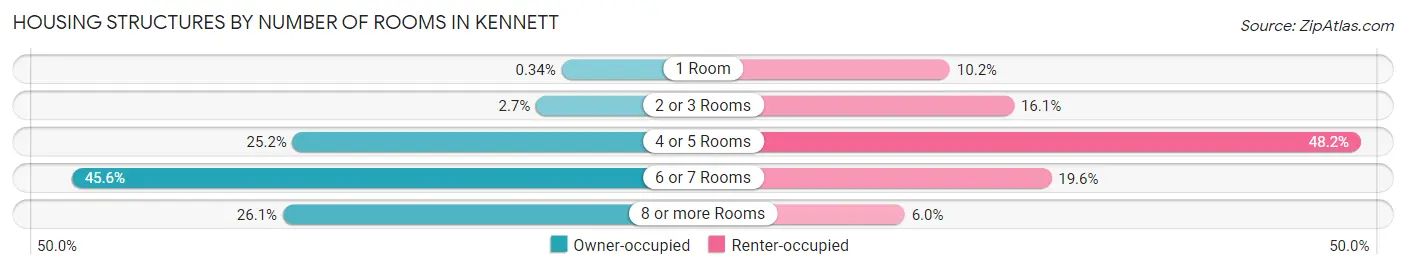
| Number of Rooms | Owner-occupied | Renter-occupied |
| 1 Room | 8 (0.3%) | 168 (10.2%) |
| 2 or 3 Rooms | 63 (2.7%) | 266 (16.1%) |
| 4 or 5 Rooms | 590 (25.2%) | 796 (48.2%) |
| 6 or 7 Rooms | 1,068 (45.6%) | 323 (19.6%) |
| 8 or more Rooms | 611 (26.1%) | 99 (6.0%) |
| Total | 2,340 (100.0%) | 1,652 (100.0%) |
Housing Structure by Heating Type in Kennett
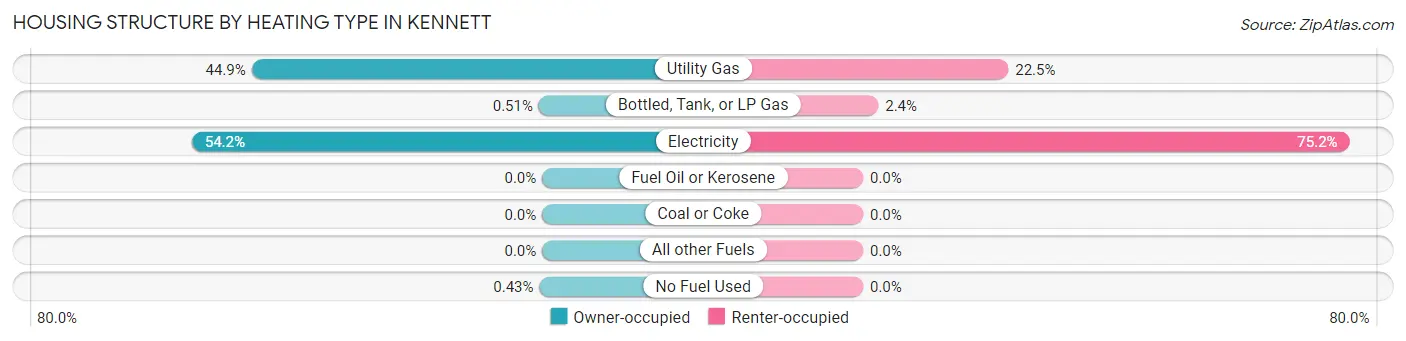
| Heating Type | Owner-occupied | Renter-occupied |
| Utility Gas | 1,051 (44.9%) | 371 (22.5%) |
| Bottled, Tank, or LP Gas | 12 (0.5%) | 39 (2.4%) |
| Electricity | 1,267 (54.1%) | 1,242 (75.2%) |
| Fuel Oil or Kerosene | 0 (0.0%) | 0 (0.0%) |
| Coal or Coke | 0 (0.0%) | 0 (0.0%) |
| All other Fuels | 0 (0.0%) | 0 (0.0%) |
| No Fuel Used | 10 (0.4%) | 0 (0.0%) |
| Total | 2,340 (100.0%) | 1,652 (100.0%) |
Household Vehicle Usage in Kennett
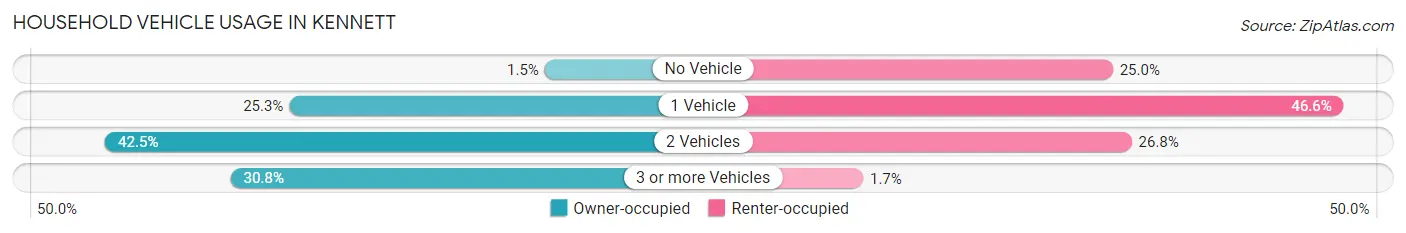
| Vehicles per Household | Owner-occupied | Renter-occupied |
| No Vehicle | 34 (1.5%) | 413 (25.0%) |
| 1 Vehicle | 592 (25.3%) | 769 (46.6%) |
| 2 Vehicles | 994 (42.5%) | 442 (26.8%) |
| 3 or more Vehicles | 720 (30.8%) | 28 (1.7%) |
| Total | 2,340 (100.0%) | 1,652 (100.0%) |
Real Estate & Mortgages in Kennett
Real Estate and Mortgage Overview in Kennett
| Characteristic | Without Mortgage | With Mortgage |
| Housing Units | 1,288 | 1,052 |
| Median Property Value | $95,200 | $102,000 |
| Median Household Income | $57,609 | $191 |
| Monthly Housing Costs | $386 | $28 |
| Real Estate Taxes | $754 | $21 |
Property Value by Mortgage Status in Kennett
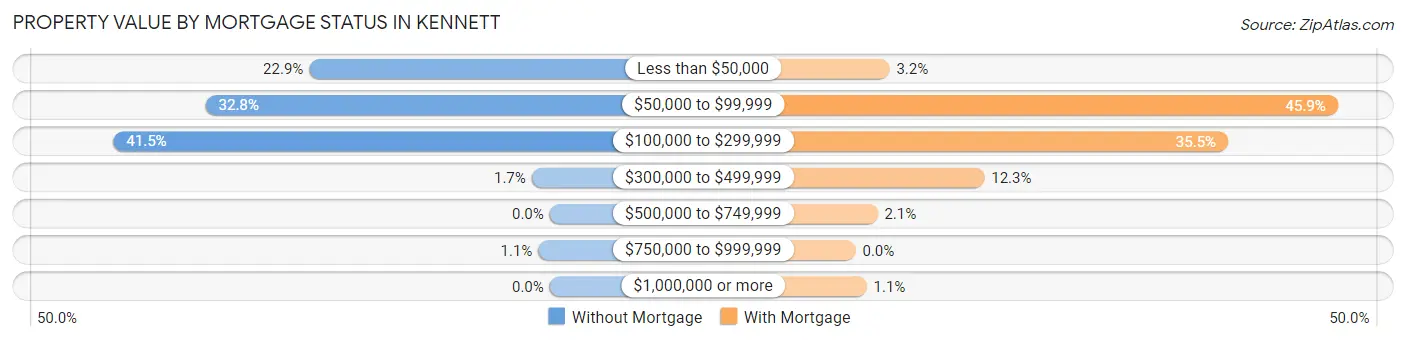
| Property Value | Without Mortgage | With Mortgage |
| Less than $50,000 | 295 (22.9%) | 34 (3.2%) |
| $50,000 to $99,999 | 422 (32.8%) | 483 (45.9%) |
| $100,000 to $299,999 | 535 (41.5%) | 373 (35.5%) |
| $300,000 to $499,999 | 22 (1.7%) | 129 (12.3%) |
| $500,000 to $749,999 | 0 (0.0%) | 22 (2.1%) |
| $750,000 to $999,999 | 14 (1.1%) | 0 (0.0%) |
| $1,000,000 or more | 0 (0.0%) | 11 (1.1%) |
| Total | 1,288 (100.0%) | 1,052 (100.0%) |
Household Income by Mortgage Status in Kennett
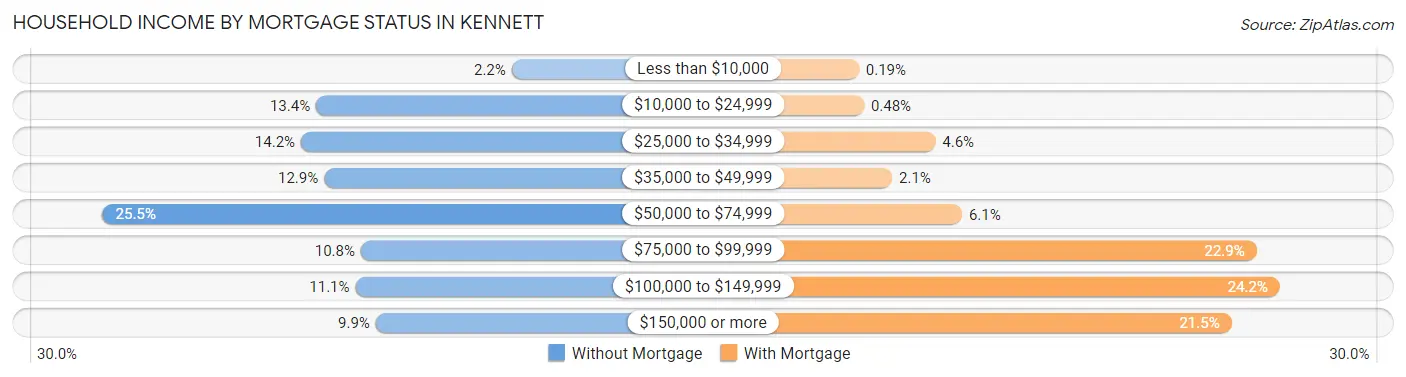
| Household Income | Without Mortgage | With Mortgage |
| Less than $10,000 | 28 (2.2%) | 2 (0.2%) |
| $10,000 to $24,999 | 172 (13.4%) | 5 (0.5%) |
| $25,000 to $34,999 | 183 (14.2%) | 48 (4.6%) |
| $35,000 to $49,999 | 166 (12.9%) | 22 (2.1%) |
| $50,000 to $74,999 | 329 (25.5%) | 64 (6.1%) |
| $75,000 to $99,999 | 139 (10.8%) | 241 (22.9%) |
| $100,000 to $149,999 | 143 (11.1%) | 255 (24.2%) |
| $150,000 or more | 128 (9.9%) | 226 (21.5%) |
| Total | 1,288 (100.0%) | 1,052 (100.0%) |
Property Value to Household Income Ratio in Kennett
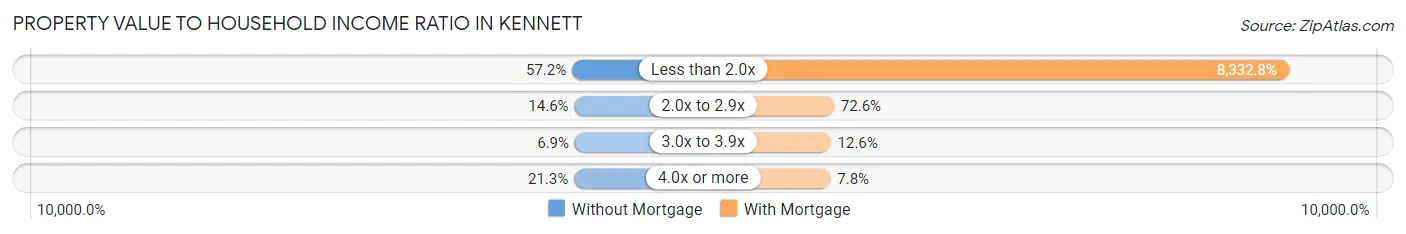
| Value-to-Income Ratio | Without Mortgage | With Mortgage |
| Less than 2.0x | 737 (57.2%) | 87,661 (8,332.8%) |
| 2.0x to 2.9x | 188 (14.6%) | 764 (72.6%) |
| 3.0x to 3.9x | 89 (6.9%) | 133 (12.6%) |
| 4.0x or more | 274 (21.3%) | 82 (7.8%) |
| Total | 1,288 (100.0%) | 1,052 (100.0%) |
Real Estate Taxes by Mortgage Status in Kennett
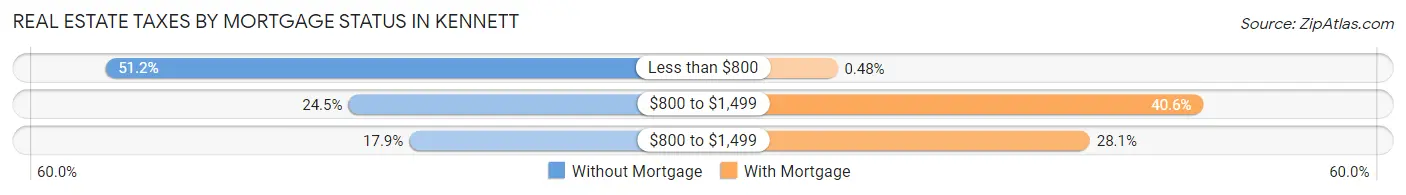
| Property Taxes | Without Mortgage | With Mortgage |
| Less than $800 | 659 (51.2%) | 5 (0.5%) |
| $800 to $1,499 | 316 (24.5%) | 427 (40.6%) |
| $800 to $1,499 | 230 (17.9%) | 296 (28.1%) |
| Total | 1,288 (100.0%) | 1,052 (100.0%) |
Health & Disability in Kennett
Health Insurance Coverage by Age in Kennett
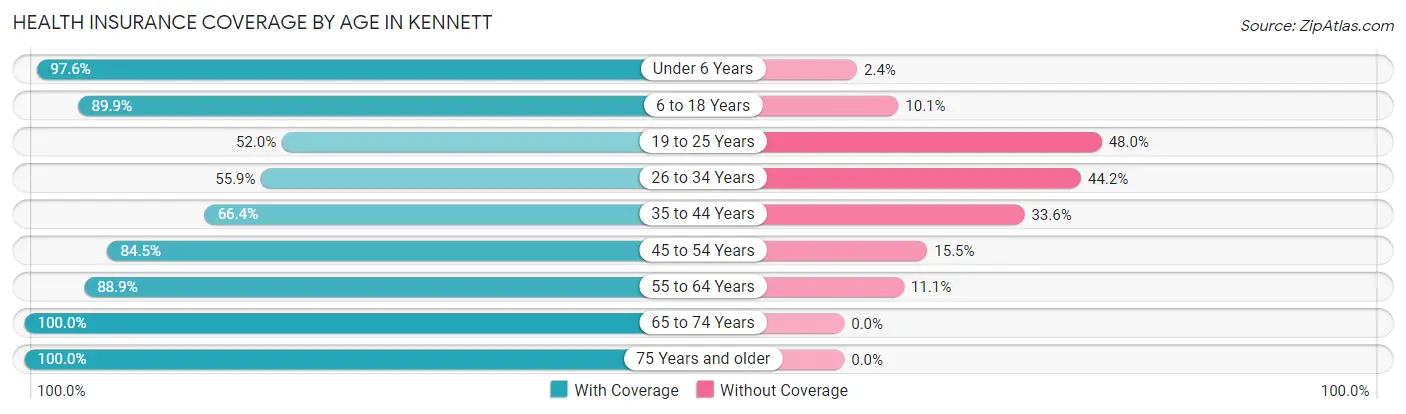
| Age Bracket | With Coverage | Without Coverage |
| Under 6 Years | 693 (97.6%) | 17 (2.4%) |
| 6 to 18 Years | 1,936 (89.9%) | 217 (10.1%) |
| 19 to 25 Years | 445 (52.0%) | 411 (48.0%) |
| 26 to 34 Years | 611 (55.8%) | 483 (44.2%) |
| 35 to 44 Years | 668 (66.4%) | 338 (33.6%) |
| 45 to 54 Years | 982 (84.5%) | 180 (15.5%) |
| 55 to 64 Years | 878 (88.9%) | 110 (11.1%) |
| 65 to 74 Years | 1,283 (100.0%) | 0 (0.0%) |
| 75 Years and older | 704 (100.0%) | 0 (0.0%) |
| Total | 8,200 (82.4%) | 1,756 (17.6%) |
Health Insurance Coverage by Citizenship Status in Kennett
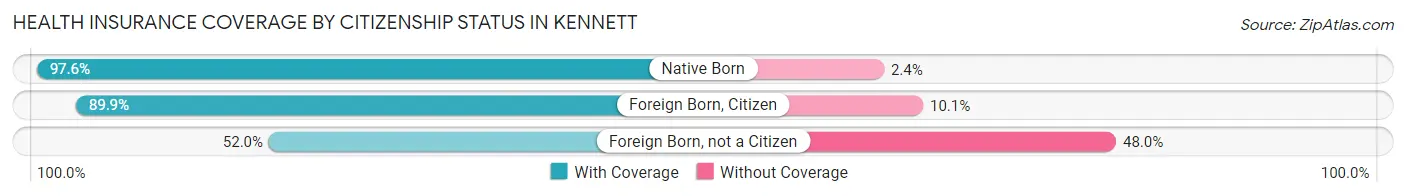
| Citizenship Status | With Coverage | Without Coverage |
| Native Born | 693 (97.6%) | 17 (2.4%) |
| Foreign Born, Citizen | 1,936 (89.9%) | 217 (10.1%) |
| Foreign Born, not a Citizen | 445 (52.0%) | 411 (48.0%) |
Health Insurance Coverage by Household Income in Kennett
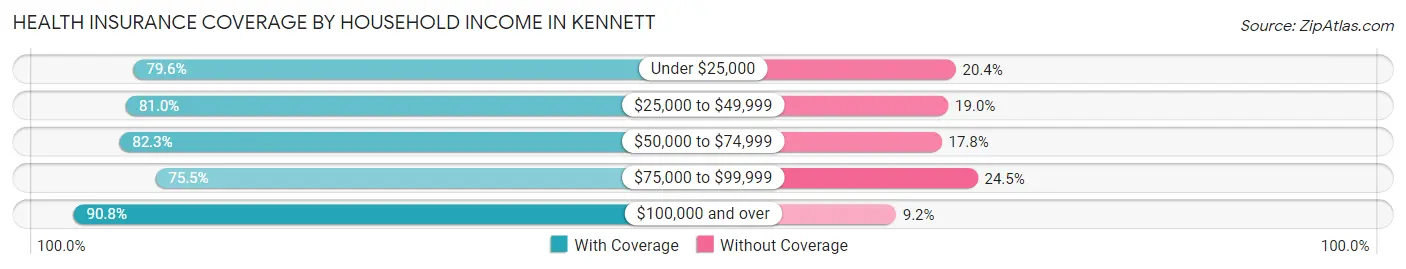
| Household Income | With Coverage | Without Coverage |
| Under $25,000 | 1,579 (79.6%) | 404 (20.4%) |
| $25,000 to $49,999 | 1,250 (81.0%) | 293 (19.0%) |
| $50,000 to $74,999 | 1,705 (82.3%) | 368 (17.7%) |
| $75,000 to $99,999 | 1,390 (75.5%) | 451 (24.5%) |
| $100,000 and over | 2,245 (90.8%) | 227 (9.2%) |
Public vs Private Health Insurance Coverage by Age in Kennett
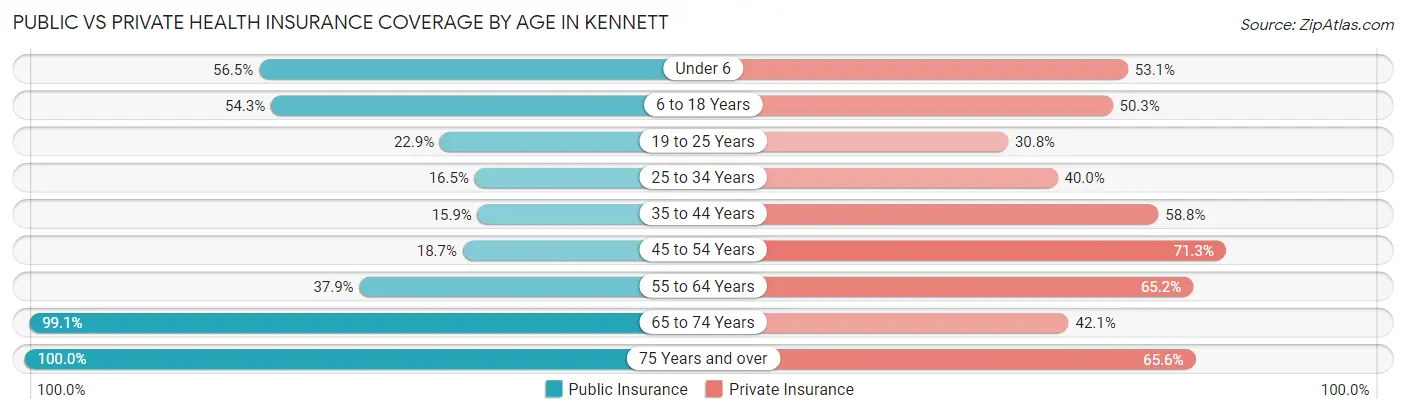
| Age Bracket | Public Insurance | Private Insurance |
| Under 6 | 401 (56.5%) | 377 (53.1%) |
| 6 to 18 Years | 1,168 (54.2%) | 1,082 (50.3%) |
| 19 to 25 Years | 196 (22.9%) | 264 (30.8%) |
| 25 to 34 Years | 180 (16.5%) | 438 (40.0%) |
| 35 to 44 Years | 160 (15.9%) | 591 (58.8%) |
| 45 to 54 Years | 217 (18.7%) | 828 (71.3%) |
| 55 to 64 Years | 374 (37.9%) | 644 (65.2%) |
| 65 to 74 Years | 1,272 (99.1%) | 540 (42.1%) |
| 75 Years and over | 704 (100.0%) | 462 (65.6%) |
| Total | 4,672 (46.9%) | 5,226 (52.5%) |
Disability Status by Sex by Age in Kennett
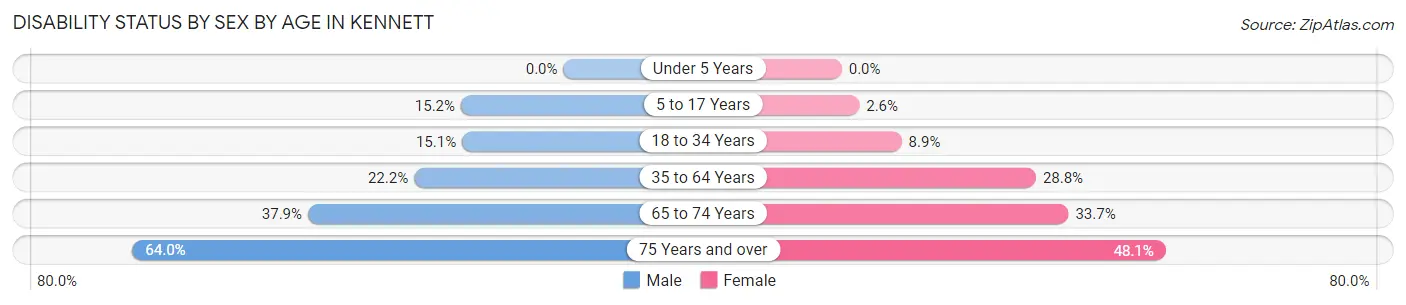
| Age Bracket | Male | Female |
| Under 5 Years | 0 (0.0%) | 0 (0.0%) |
| 5 to 17 Years | 196 (15.2%) | 25 (2.6%) |
| 18 to 34 Years | 141 (15.0%) | 91 (8.9%) |
| 35 to 64 Years | 326 (22.2%) | 486 (28.8%) |
| 65 to 74 Years | 214 (37.9%) | 242 (33.7%) |
| 75 Years and over | 183 (64.0%) | 201 (48.1%) |
Disability Class by Sex by Age in Kennett
Disability Class: Hearing Difficulty
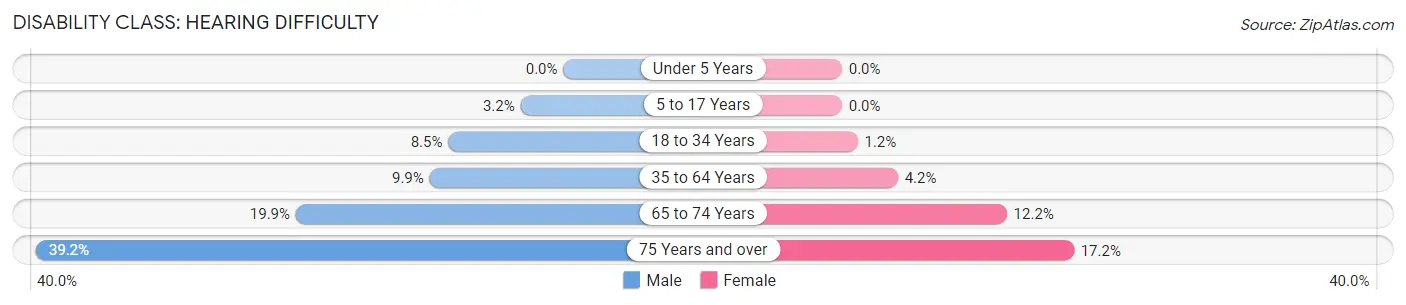
| Age Bracket | Male | Female |
| Under 5 Years | 0 (0.0%) | 0 (0.0%) |
| 5 to 17 Years | 41 (3.2%) | 0 (0.0%) |
| 18 to 34 Years | 80 (8.5%) | 12 (1.2%) |
| 35 to 64 Years | 146 (9.9%) | 70 (4.2%) |
| 65 to 74 Years | 112 (19.9%) | 88 (12.2%) |
| 75 Years and over | 112 (39.2%) | 72 (17.2%) |
Disability Class: Vision Difficulty
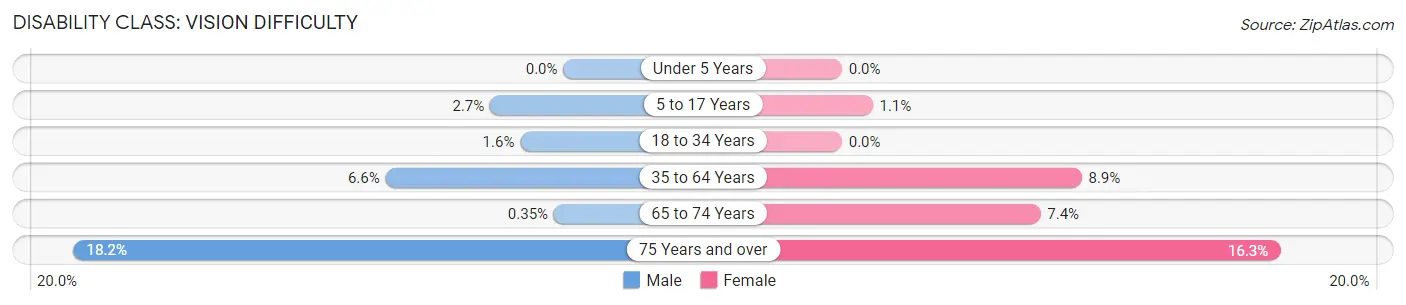
| Age Bracket | Male | Female |
| Under 5 Years | 0 (0.0%) | 0 (0.0%) |
| 5 to 17 Years | 35 (2.7%) | 11 (1.1%) |
| 18 to 34 Years | 15 (1.6%) | 0 (0.0%) |
| 35 to 64 Years | 97 (6.6%) | 150 (8.9%) |
| 65 to 74 Years | 2 (0.4%) | 53 (7.4%) |
| 75 Years and over | 52 (18.2%) | 68 (16.3%) |
Disability Class: Cognitive Difficulty
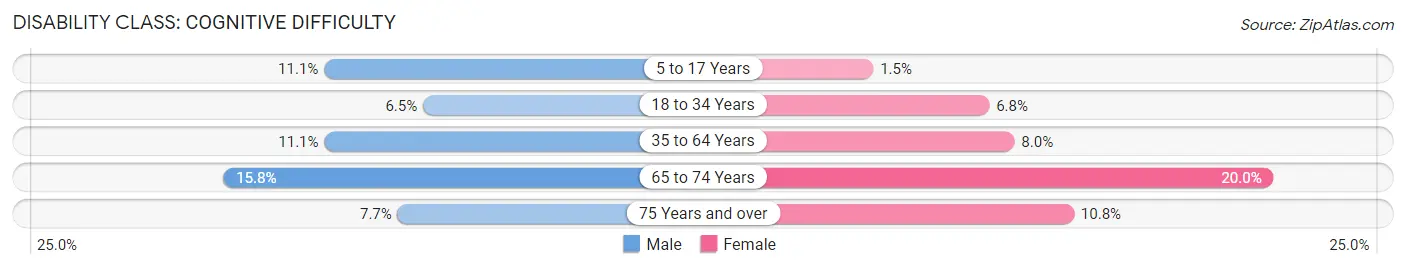
| Age Bracket | Male | Female |
| 5 to 17 Years | 143 (11.1%) | 14 (1.5%) |
| 18 to 34 Years | 61 (6.5%) | 70 (6.8%) |
| 35 to 64 Years | 163 (11.1%) | 135 (8.0%) |
| 65 to 74 Years | 89 (15.8%) | 144 (20.0%) |
| 75 Years and over | 22 (7.7%) | 45 (10.8%) |
Disability Class: Ambulatory Difficulty
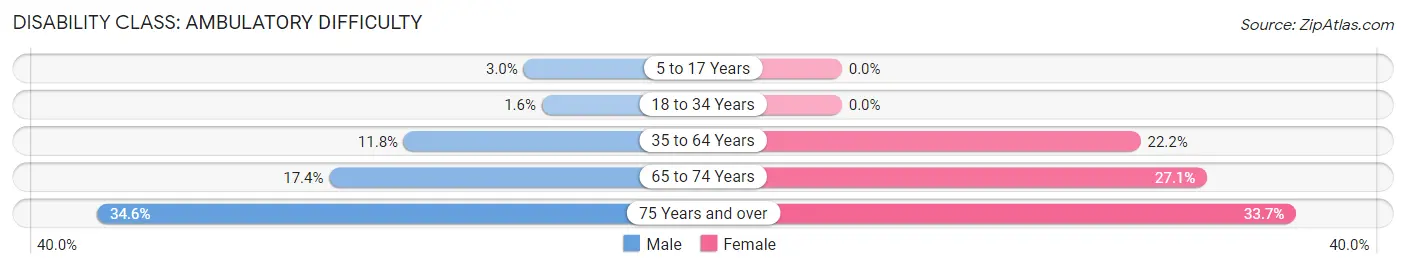
| Age Bracket | Male | Female |
| 5 to 17 Years | 38 (2.9%) | 0 (0.0%) |
| 18 to 34 Years | 15 (1.6%) | 0 (0.0%) |
| 35 to 64 Years | 174 (11.8%) | 374 (22.2%) |
| 65 to 74 Years | 98 (17.4%) | 195 (27.1%) |
| 75 Years and over | 99 (34.6%) | 141 (33.7%) |
Disability Class: Self-Care Difficulty
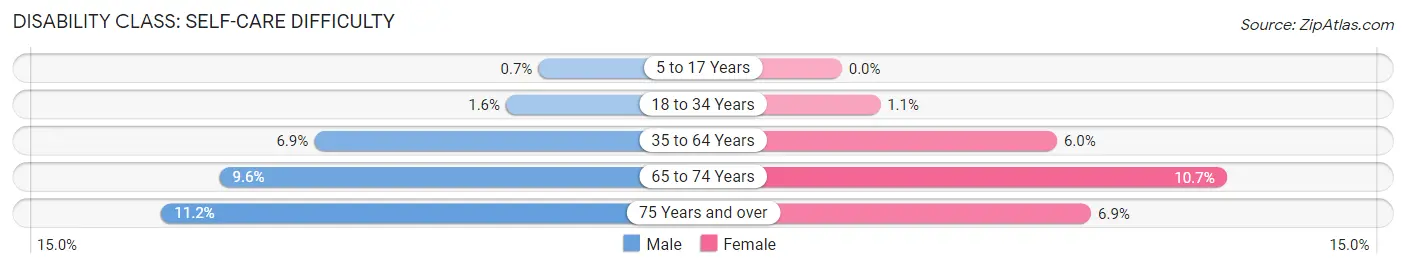
| Age Bracket | Male | Female |
| 5 to 17 Years | 9 (0.7%) | 0 (0.0%) |
| 18 to 34 Years | 15 (1.6%) | 11 (1.1%) |
| 35 to 64 Years | 102 (6.9%) | 101 (6.0%) |
| 65 to 74 Years | 54 (9.6%) | 77 (10.7%) |
| 75 Years and over | 32 (11.2%) | 29 (6.9%) |
Technology Access in Kennett
Computing Device Access in Kennett
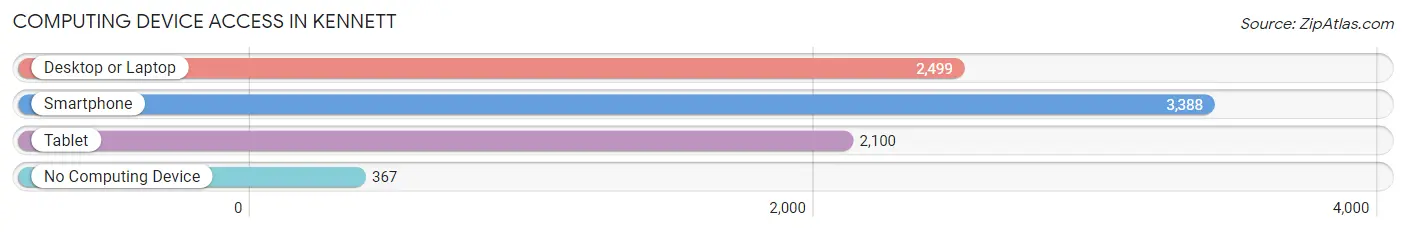
| Device Type | # Households | % Households |
| Desktop or Laptop | 2,499 | 62.6% |
| Smartphone | 3,388 | 84.9% |
| Tablet | 2,100 | 52.6% |
| No Computing Device | 367 | 9.2% |
| Total | 3,992 | 100.0% |
Internet Access in Kennett
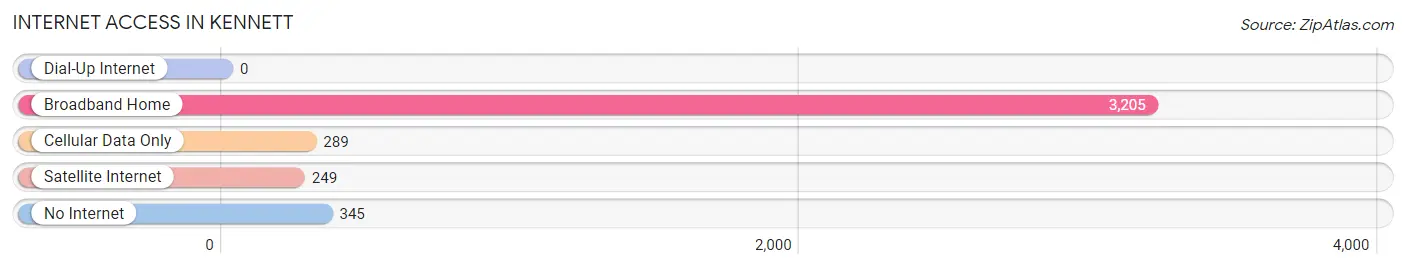
| Internet Type | # Households | % Households |
| Dial-Up Internet | 0 | 0.0% |
| Broadband Home | 3,205 | 80.3% |
| Cellular Data Only | 289 | 7.2% |
| Satellite Internet | 249 | 6.2% |
| No Internet | 345 | 8.6% |
| Total | 3,992 | 100.0% |
Kennett Summary
Kennett, Missouri is a small city located in the southeastern corner of the state, in Dunklin County. It is situated on the banks of the St. Francis River, and is the county seat of Dunklin County. The city has a population of 8,937, according to the 2010 census, and is the largest city in the county.
History
The area that is now Kennett was first settled in the early 1800s by a group of settlers from Tennessee. The town was originally known as “Chalybeate Springs”, after the mineral springs that were located nearby. In 1851, the town was renamed “Kennett” after the Kennett family, who had moved to the area from North Carolina.
The town was officially incorporated in 1855, and the first post office was established in 1856. The town grew steadily throughout the 19th century, and by the turn of the century, it had become a thriving agricultural center. The town was also home to several businesses, including a cotton gin, a flour mill, and a brick factory.
Geography
Kennett is located in the southeastern corner of Missouri, in Dunklin County. It is situated on the banks of the St. Francis River, and is the county seat of Dunklin County. The city has a total area of 8.2 square miles, of which 8.1 square miles is land and 0.1 square miles is water.
The city is located in the Bootheel region of Missouri, and is part of the Mississippi Alluvial Plain. The climate is humid subtropical, with hot, humid summers and mild winters. The average annual temperature is 64°F, and the average annual precipitation is 45 inches.
Economy
The economy of Kennett is largely based on agriculture. The city is home to several large farms, and the surrounding area is known for its cotton, soybean, and rice production. The city is also home to several manufacturing companies, including a furniture factory, a plastics factory, and a paper mill.
The city is also home to several retail stores, restaurants, and other businesses. The city is served by the Kennett Municipal Airport, and is located near several major highways, including Interstate 55 and U.S. Route 412.
Demographics
According to the 2010 census, the population of Kennett was 8,937. The racial makeup of the city was 79.2% White, 17.7% African American, 0.3% Native American, 0.4% Asian, 0.1% Pacific Islander, 0.7% from other races, and 1.6% from two or more races. Hispanic or Latino of any race were 2.2% of the population.
The median household income in Kennett was $30,945, and the median family income was $37,917. The per capita income for the city was $16,845. About 17.2% of families and 20.7% of the population were below the poverty line, including 28.2% of those under age 18 and 14.2% of those age 65 or over.
Common Questions
What is Per Capita Income in Kennett?
Per Capita income in Kennett is $28,435.
What is the Median Family Income in Kennett?
Median Family Income in Kennett is $63,890.
What is the Median Household income in Kennett?
Median Household Income in Kennett is $52,907.
What is Income or Wage Gap in Kennett?
Income or Wage Gap in Kennett is 42.8%.
Women in Kennett earn 57.2 cents for every dollar earned by a man.
What is Family Income Deficit in Kennett?
Family Income Deficit in Kennett is $10,939.
Families that are below poverty line in Kennett earn $10,939 less on average than the poverty threshold level.
What is Inequality or Gini Index in Kennett?
Inequality or Gini Index in Kennett is 0.51.
What is the Total Population of Kennett?
Total Population of Kennett is 10,383.
What is the Total Male Population of Kennett?
Total Male Population of Kennett is 4,978.
What is the Total Female Population of Kennett?
Total Female Population of Kennett is 5,405.
What is the Ratio of Males per 100 Females in Kennett?
There are 92.10 Males per 100 Females in Kennett.
What is the Ratio of Females per 100 Males in Kennett?
There are 108.58 Females per 100 Males in Kennett.
What is the Median Population Age in Kennett?
Median Population Age in Kennett is 37.3 Years.
What is the Average Family Size in Kennett
Average Family Size in Kennett is 3.1 People.
What is the Average Household Size in Kennett
Average Household Size in Kennett is 2.5 People.
How Large is the Labor Force in Kennett?
There are 4,154 People in the Labor Forcein in Kennett.
What is the Percentage of People in the Labor Force in Kennett?
53.4% of People are in the Labor Force in Kennett.
What is the Unemployment Rate in Kennett?
Unemployment Rate in Kennett is 7.3%.