Jacksonville, MO Map & Demographics
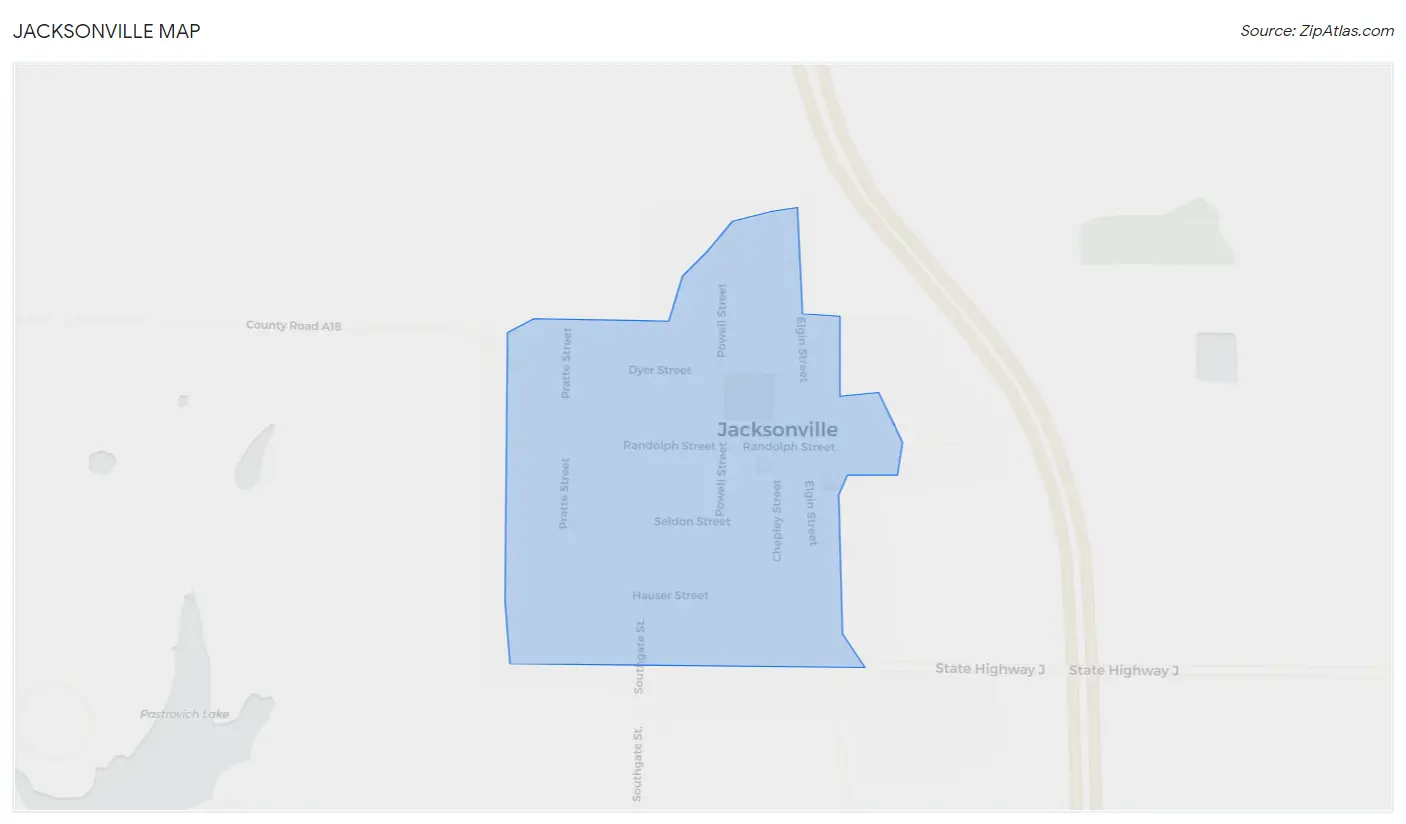
Jacksonville Map
Jacksonville Overview
$24,990
PER CAPITA INCOME
$58,750
AVG FAMILY INCOME
$34,583
AVG HOUSEHOLD INCOME
0.37
INEQUALITY / GINI INDEX
86
TOTAL POPULATION
48
MALE POPULATION
38
FEMALE POPULATION
126.32
MALES / 100 FEMALES
79.17
FEMALES / 100 MALES
38.9
MEDIAN AGE
3.1
AVG FAMILY SIZE
2.3
AVG HOUSEHOLD SIZE
59
LABOR FORCE [ PEOPLE ]
78.7%
PERCENT IN LABOR FORCE
Jacksonville Zip Codes
Income in Jacksonville
Income Overview in Jacksonville
Per Capita Income in Jacksonville is $24,990, while median incomes of families and households are $58,750 and $34,583 respectively.
| Characteristic | Number | Measure |
| Per Capita Income | 86 | $24,990 |
| Median Family Income | 23 | $58,750 |
| Mean Family Income | 23 | $66,357 |
| Median Household Income | 37 | $34,583 |
| Mean Household Income | 37 | $51,951 |
| Income Deficit | 23 | $0 |
| Wage / Income Gap (%) | 86 | 0.00% |
| Wage / Income Gap ($) | 86 | 100.00¢ per $1 |
| Gini / Inequality Index | 86 | 0.37 |
Earnings by Sex in Jacksonville
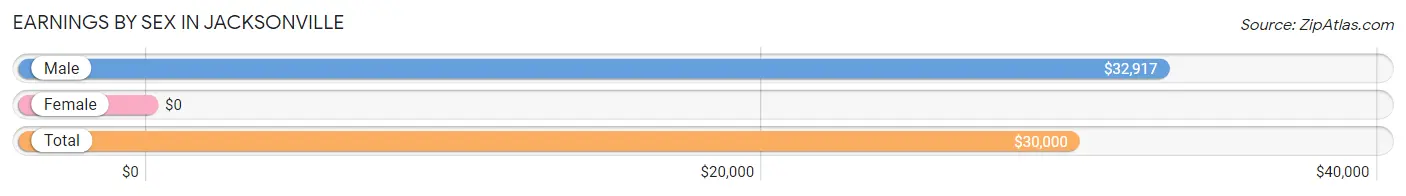
| Sex | Number | Average Earnings |
| Male | 41 (68.3%) | $32,917 |
| Female | 19 (31.7%) | $0 |
| Total | 60 (100.0%) | $30,000 |
Earnings by Sex by Income Bracket in Jacksonville
The most common earnings brackets in Jacksonville are $30,000 to $34,999 for men (11 | 26.8%) and $45,000 to $49,999 for women (6 | 31.6%).
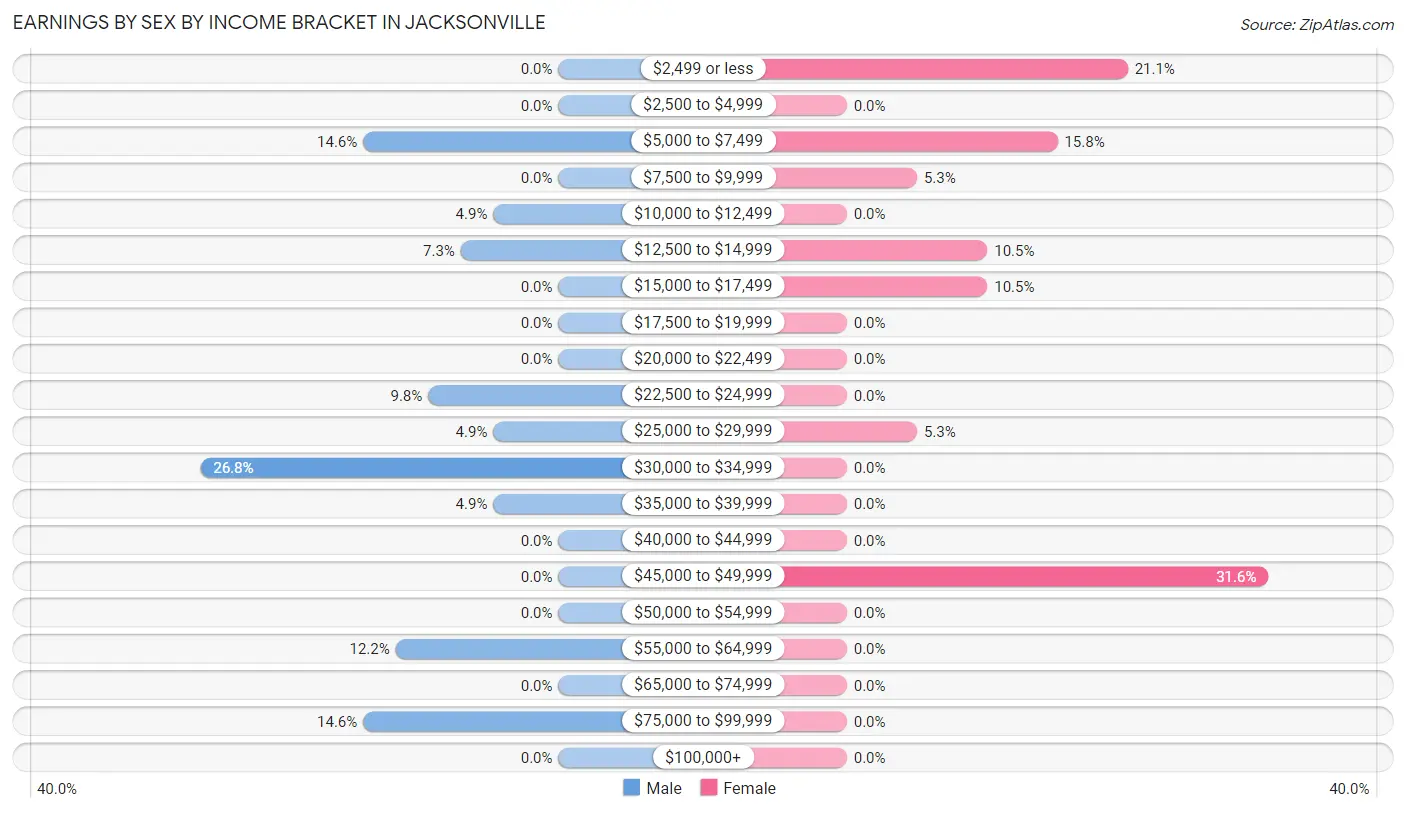
| Income | Male | Female |
| $2,499 or less | 0 (0.0%) | 4 (21.0%) |
| $2,500 to $4,999 | 0 (0.0%) | 0 (0.0%) |
| $5,000 to $7,499 | 6 (14.6%) | 3 (15.8%) |
| $7,500 to $9,999 | 0 (0.0%) | 1 (5.3%) |
| $10,000 to $12,499 | 2 (4.9%) | 0 (0.0%) |
| $12,500 to $14,999 | 3 (7.3%) | 2 (10.5%) |
| $15,000 to $17,499 | 0 (0.0%) | 2 (10.5%) |
| $17,500 to $19,999 | 0 (0.0%) | 0 (0.0%) |
| $20,000 to $22,499 | 0 (0.0%) | 0 (0.0%) |
| $22,500 to $24,999 | 4 (9.8%) | 0 (0.0%) |
| $25,000 to $29,999 | 2 (4.9%) | 1 (5.3%) |
| $30,000 to $34,999 | 11 (26.8%) | 0 (0.0%) |
| $35,000 to $39,999 | 2 (4.9%) | 0 (0.0%) |
| $40,000 to $44,999 | 0 (0.0%) | 0 (0.0%) |
| $45,000 to $49,999 | 0 (0.0%) | 6 (31.6%) |
| $50,000 to $54,999 | 0 (0.0%) | 0 (0.0%) |
| $55,000 to $64,999 | 5 (12.2%) | 0 (0.0%) |
| $65,000 to $74,999 | 0 (0.0%) | 0 (0.0%) |
| $75,000 to $99,999 | 6 (14.6%) | 0 (0.0%) |
| $100,000+ | 0 (0.0%) | 0 (0.0%) |
| Total | 41 (100.0%) | 19 (100.0%) |
Earnings by Sex by Educational Attainment in Jacksonville
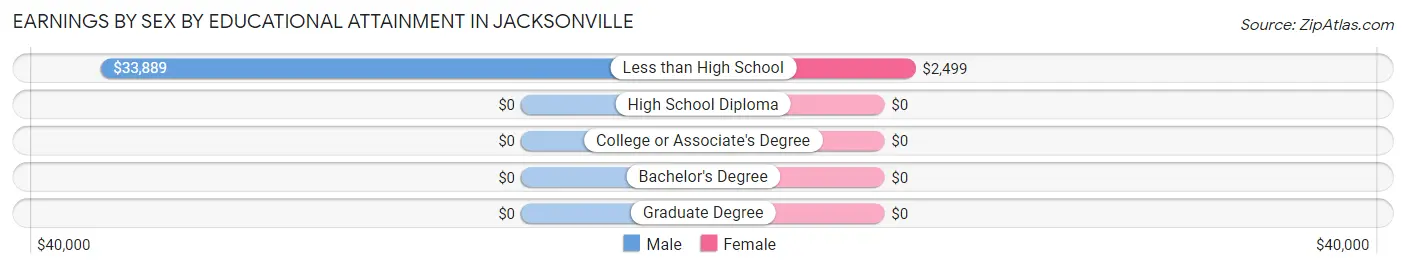
| Educational Attainment | Male Income | Female Income |
| Less than High School | $33,889 | $2,499 |
| High School Diploma | - | - |
| College or Associate's Degree | - | - |
| Bachelor's Degree | - | - |
| Graduate Degree | - | - |
| Total | $33,472 | $0 |
Family Income in Jacksonville
Family Income Brackets in Jacksonville
According to the Jacksonville family income data, there are 6 families falling into the $100,000 to $149,999 income range, which is the most common income bracket and makes up 26.1% of all families.
| Income Bracket | # Families | % Families |
| Less than $10,000 | 0 | 0.0% |
| $10,000 to $14,999 | 3 | 13.0% |
| $15,000 to $24,999 | 0 | 0.0% |
| $25,000 to $34,999 | 3 | 13.0% |
| $35,000 to $49,999 | 4 | 17.4% |
| $50,000 to $74,999 | 5 | 21.7% |
| $75,000 to $99,999 | 2 | 8.7% |
| $100,000 to $149,999 | 6 | 26.1% |
| $150,000 to $199,999 | 0 | 0.0% |
| $200,000+ | 0 | 0.0% |
Family Income by Famaliy Size in Jacksonville
| Income Bracket | # Families | Median Income |
| 2-Person Families | 16 (69.6%) | $0 |
| 3-Person Families | 1 (4.3%) | $0 |
| 4-Person Families | 2 (8.7%) | $0 |
| 5-Person Families | 3 (13.0%) | $0 |
| 6-Person Families | 1 (4.3%) | $0 |
| 7+ Person Families | 0 (0.0%) | $0 |
| Total | 23 (100.0%) | $58,750 |
Family Income by Number of Earners in Jacksonville
| Number of Earners | # Families | Median Income |
| No Earners | 2 (8.7%) | $0 |
| 1 Earner | 6 (26.1%) | $0 |
| 2 Earners | 13 (56.5%) | $0 |
| 3+ Earners | 2 (8.7%) | $0 |
| Total | 23 (100.0%) | $58,750 |
Household Income in Jacksonville
Household Income Brackets in Jacksonville
With 12 households falling in the category, the $25,000 to $34,999 income range is the most frequent in Jacksonville, accounting for 32.4% of all households.
| Income Bracket | # Households | % Households |
| Less than $10,000 | 0 | 0.0% |
| $10,000 to $14,999 | 6 | 16.2% |
| $15,000 to $24,999 | 2 | 5.4% |
| $25,000 to $34,999 | 12 | 32.4% |
| $35,000 to $49,999 | 4 | 10.8% |
| $50,000 to $74,999 | 5 | 13.5% |
| $75,000 to $99,999 | 2 | 5.4% |
| $100,000 to $149,999 | 6 | 16.2% |
| $150,000 to $199,999 | 0 | 0.0% |
| $200,000+ | 0 | 0.0% |
Household Income by Householder Age in Jacksonville
The median household income in Jacksonville is $34,583, with the highest median household income of $44,375 found in the 45 to 64 years age bracket for the primary householder. A total of 9 households (24.3%) fall into this category.
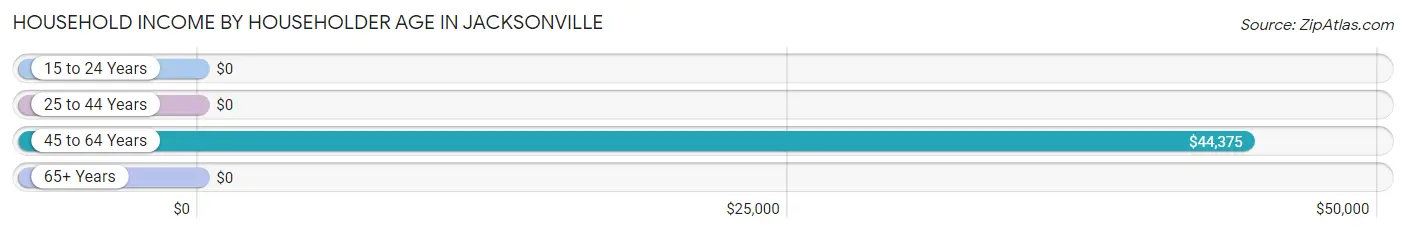
| Income Bracket | # Households | Median Income |
| 15 to 24 Years | 0 (0.0%) | $0 |
| 25 to 44 Years | 20 (54.0%) | $0 |
| 45 to 64 Years | 9 (24.3%) | $44,375 |
| 65+ Years | 8 (21.6%) | $0 |
| Total | 37 (100.0%) | $34,583 |
Poverty in Jacksonville
Income Below Poverty by Sex and Age in Jacksonville
With 18.8% poverty level for males and 21.0% for females among the residents of Jacksonville, 6 to 11 year old males and 55 to 64 year old females are the most vulnerable to poverty, with 4 males (80.0%) and 3 females (37.5%) in their respective age groups living below the poverty level.
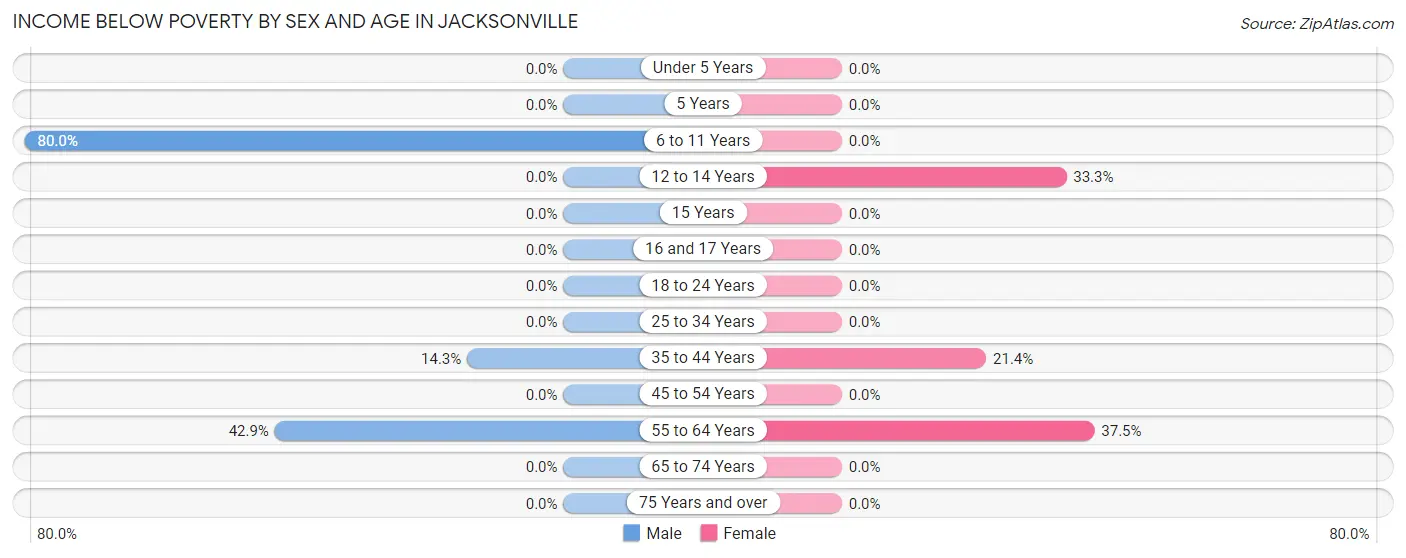
| Age Bracket | Male | Female |
| Under 5 Years | 0 (0.0%) | 0 (0.0%) |
| 5 Years | 0 (0.0%) | 0 (0.0%) |
| 6 to 11 Years | 4 (80.0%) | 0 (0.0%) |
| 12 to 14 Years | 0 (0.0%) | 2 (33.3%) |
| 15 Years | 0 (0.0%) | 0 (0.0%) |
| 16 and 17 Years | 0 (0.0%) | 0 (0.0%) |
| 18 to 24 Years | 0 (0.0%) | 0 (0.0%) |
| 25 to 34 Years | 0 (0.0%) | 0 (0.0%) |
| 35 to 44 Years | 2 (14.3%) | 3 (21.4%) |
| 45 to 54 Years | 0 (0.0%) | 0 (0.0%) |
| 55 to 64 Years | 3 (42.9%) | 3 (37.5%) |
| 65 to 74 Years | 0 (0.0%) | 0 (0.0%) |
| 75 Years and over | 0 (0.0%) | 0 (0.0%) |
| Total | 9 (18.8%) | 8 (21.0%) |
Income Above Poverty by Sex and Age in Jacksonville
According to the poverty statistics in Jacksonville, males aged 16 and 17 years and females aged 45 to 54 years are the age groups that are most secure financially, with 100.0% of males and 100.0% of females in these age groups living above the poverty line.
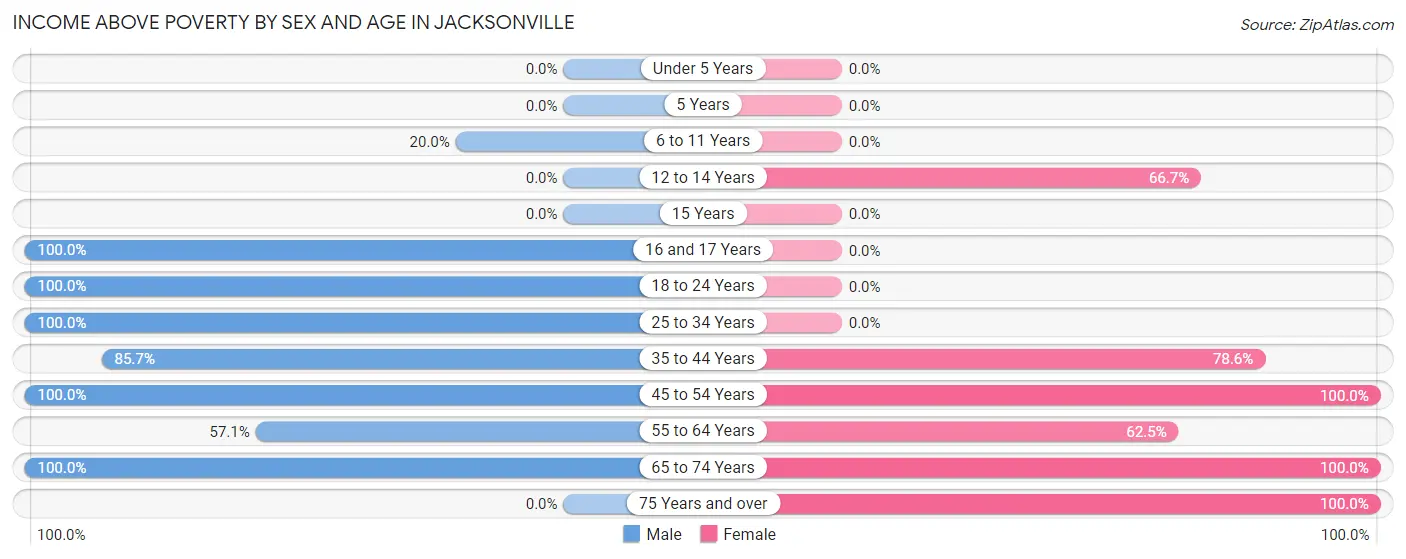
| Age Bracket | Male | Female |
| Under 5 Years | 0 (0.0%) | 0 (0.0%) |
| 5 Years | 0 (0.0%) | 0 (0.0%) |
| 6 to 11 Years | 1 (20.0%) | 0 (0.0%) |
| 12 to 14 Years | 0 (0.0%) | 4 (66.7%) |
| 15 Years | 0 (0.0%) | 0 (0.0%) |
| 16 and 17 Years | 2 (100.0%) | 0 (0.0%) |
| 18 to 24 Years | 4 (100.0%) | 0 (0.0%) |
| 25 to 34 Years | 9 (100.0%) | 0 (0.0%) |
| 35 to 44 Years | 12 (85.7%) | 11 (78.6%) |
| 45 to 54 Years | 5 (100.0%) | 1 (100.0%) |
| 55 to 64 Years | 4 (57.1%) | 5 (62.5%) |
| 65 to 74 Years | 2 (100.0%) | 7 (100.0%) |
| 75 Years and over | 0 (0.0%) | 2 (100.0%) |
| Total | 39 (81.2%) | 30 (78.9%) |
Income Below Poverty Among Married-Couple Families in Jacksonville
The poverty statistics for married-couple families in Jacksonville show that 30.0% or 6 of the total 20 families live below the poverty line. Families with 3 or 4 children have the highest poverty rate of 100.0%, comprising of 3 families. On the other hand, families with 1 or 2 children have the lowest poverty rate of 0.0%, which includes 0 families.
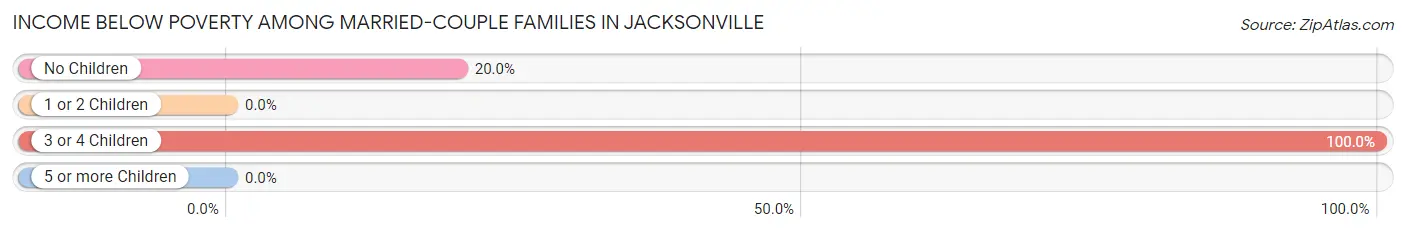
| Children | Above Poverty | Below Poverty |
| No Children | 12 (80.0%) | 3 (20.0%) |
| 1 or 2 Children | 2 (100.0%) | 0 (0.0%) |
| 3 or 4 Children | 0 (0.0%) | 3 (100.0%) |
| 5 or more Children | 0 (0.0%) | 0 (0.0%) |
| Total | 14 (70.0%) | 6 (30.0%) |
Income Below Poverty Among Single-Parent Households in Jacksonville
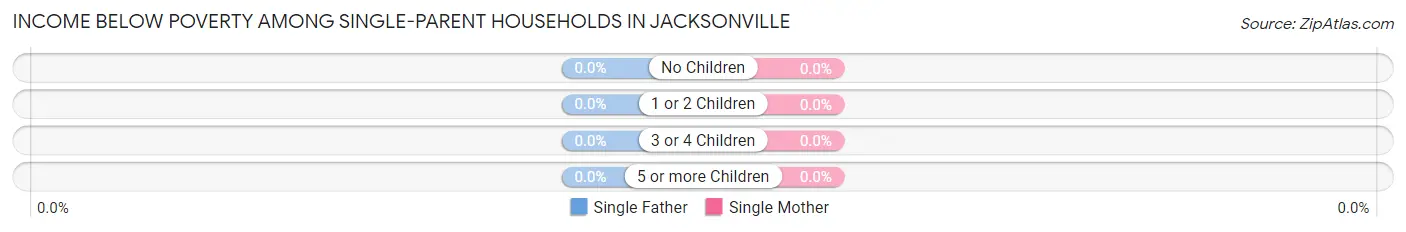
| Children | Single Father | Single Mother |
| No Children | 0 (0.0%) | 0 (0.0%) |
| 1 or 2 Children | 0 (0.0%) | 0 (0.0%) |
| 3 or 4 Children | 0 (0.0%) | 0 (0.0%) |
| 5 or more Children | 0 (0.0%) | 0 (0.0%) |
| Total | 0 (0.0%) | 0 (0.0%) |
Income Below Poverty Among Married-Couple vs Single-Parent Households in Jacksonville
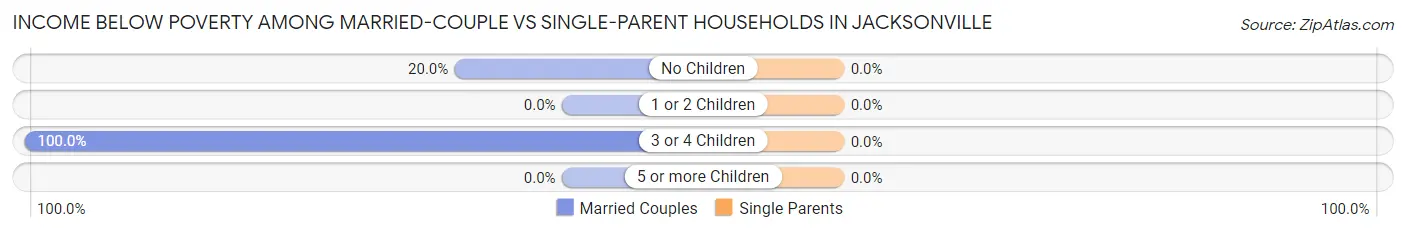
| Children | Married-Couple Families | Single-Parent Households |
| No Children | 3 (20.0%) | 0 (0.0%) |
| 1 or 2 Children | 0 (0.0%) | 0 (0.0%) |
| 3 or 4 Children | 3 (100.0%) | 0 (0.0%) |
| 5 or more Children | 0 (0.0%) | 0 (0.0%) |
| Total | 6 (30.0%) | 0 (0.0%) |
Race in Jacksonville
The most populous races in Jacksonville are , and White / Caucasian (86 | 100.0%).
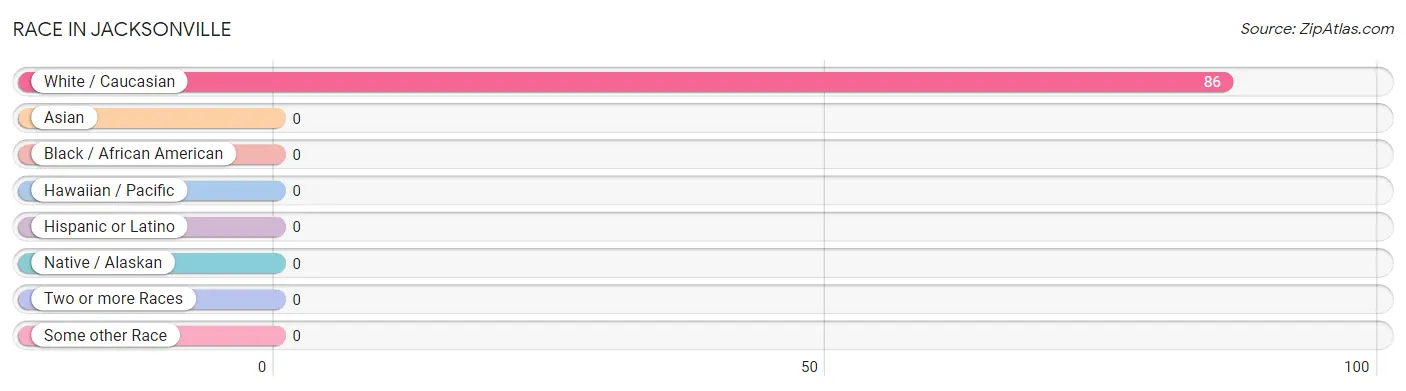
| Race | # Population | % Population |
| Asian | 0 | 0.0% |
| Black / African American | 0 | 0.0% |
| Hawaiian / Pacific | 0 | 0.0% |
| Hispanic or Latino | 0 | 0.0% |
| Native / Alaskan | 0 | 0.0% |
| White / Caucasian | 86 | 100.0% |
| Two or more Races | 0 | 0.0% |
| Some other Race | 0 | 0.0% |
| Total | 86 | 100.0% |
Ancestry in Jacksonville
The most populous ancestries reported in Jacksonville are American (29 | 33.7%), German (18 | 20.9%), English (17 | 19.8%), Dutch (9 | 10.5%), and Irish (4 | 4.6%), together accounting for 89.5% of all Jacksonville residents.
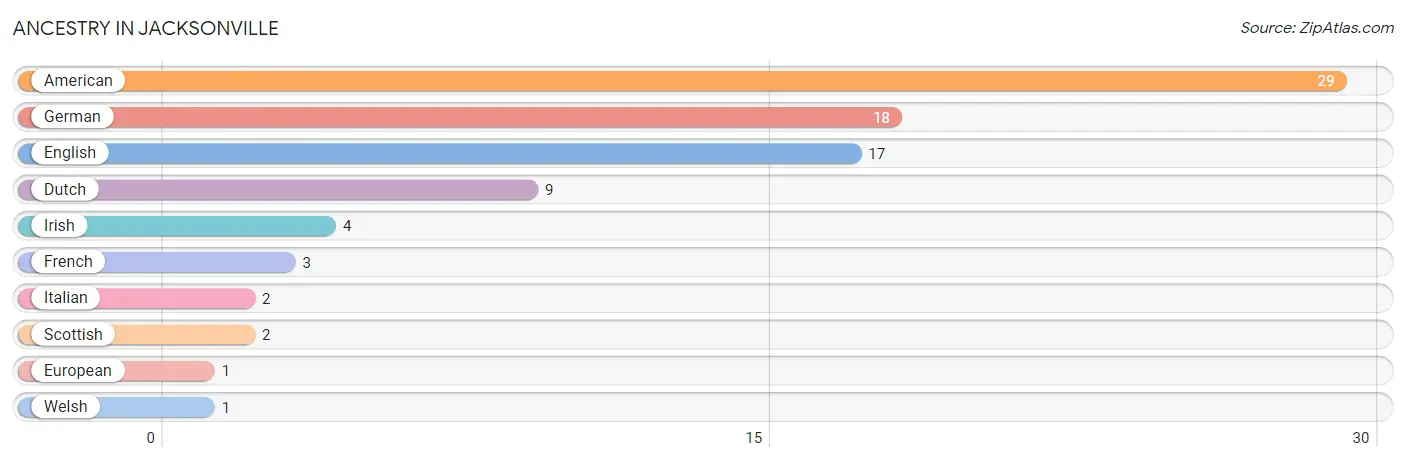
| Ancestry | # Population | % Population |
| American | 29 | 33.7% |
| Dutch | 9 | 10.5% |
| English | 17 | 19.8% |
| European | 1 | 1.2% |
| French | 3 | 3.5% |
| German | 18 | 20.9% |
| Irish | 4 | 4.6% |
| Italian | 2 | 2.3% |
| Scottish | 2 | 2.3% |
| Welsh | 1 | 1.2% | View All 10 Rows |
Immigrants in Jacksonville

| Immigration Origin | # Population | % Population | View All 0 Rows |
Sex and Age in Jacksonville
Sex and Age in Jacksonville
The most populous age groups in Jacksonville are 25 to 29 Years (9 | 18.8%) for men and 35 to 39 Years (12 | 31.6%) for women.
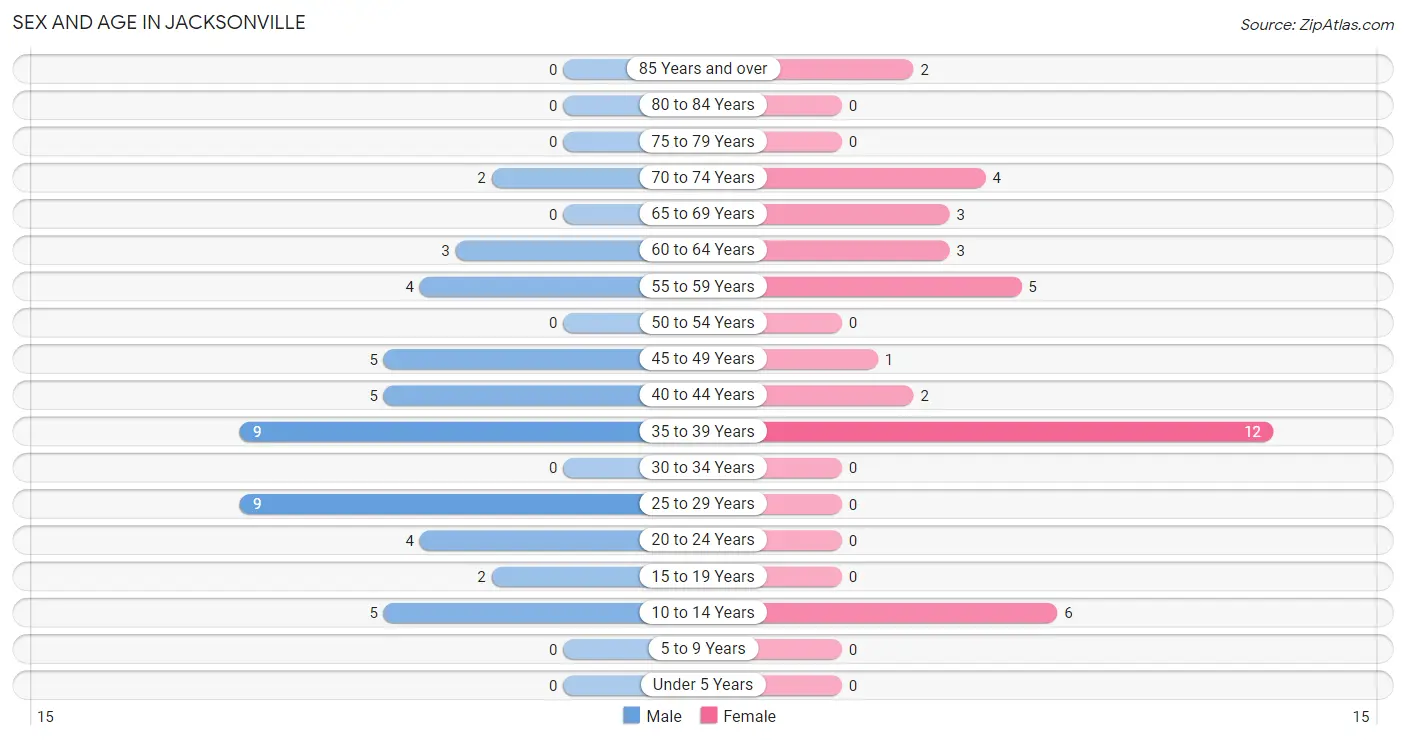
| Age Bracket | Male | Female |
| Under 5 Years | 0 (0.0%) | 0 (0.0%) |
| 5 to 9 Years | 0 (0.0%) | 0 (0.0%) |
| 10 to 14 Years | 5 (10.4%) | 6 (15.8%) |
| 15 to 19 Years | 2 (4.2%) | 0 (0.0%) |
| 20 to 24 Years | 4 (8.3%) | 0 (0.0%) |
| 25 to 29 Years | 9 (18.8%) | 0 (0.0%) |
| 30 to 34 Years | 0 (0.0%) | 0 (0.0%) |
| 35 to 39 Years | 9 (18.8%) | 12 (31.6%) |
| 40 to 44 Years | 5 (10.4%) | 2 (5.3%) |
| 45 to 49 Years | 5 (10.4%) | 1 (2.6%) |
| 50 to 54 Years | 0 (0.0%) | 0 (0.0%) |
| 55 to 59 Years | 4 (8.3%) | 5 (13.2%) |
| 60 to 64 Years | 3 (6.2%) | 3 (7.9%) |
| 65 to 69 Years | 0 (0.0%) | 3 (7.9%) |
| 70 to 74 Years | 2 (4.2%) | 4 (10.5%) |
| 75 to 79 Years | 0 (0.0%) | 0 (0.0%) |
| 80 to 84 Years | 0 (0.0%) | 0 (0.0%) |
| 85 Years and over | 0 (0.0%) | 2 (5.3%) |
| Total | 48 (100.0%) | 38 (100.0%) |
Families and Households in Jacksonville
Median Family Size in Jacksonville
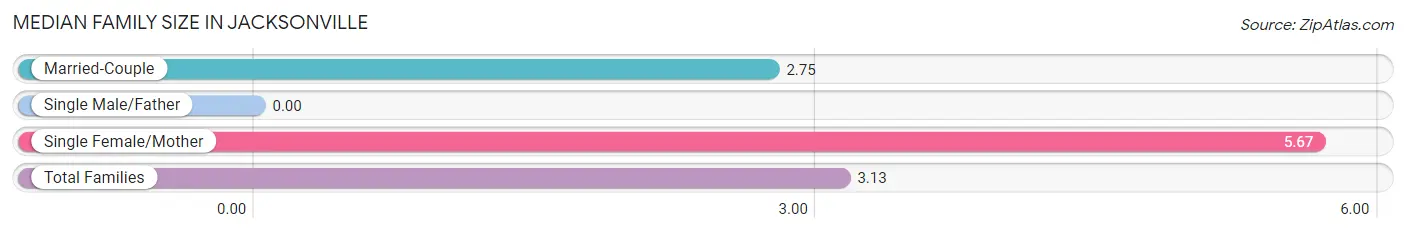
| Family Type | # Families | Family Size |
| Married-Couple | 20 (87.0%) | 2.75 |
| Single Male/Father | 0 (0.0%) | - |
| Single Female/Mother | 3 (13.0%) | 5.67 |
| Total Families | 23 (100.0%) | 3.13 |
Median Household Size in Jacksonville
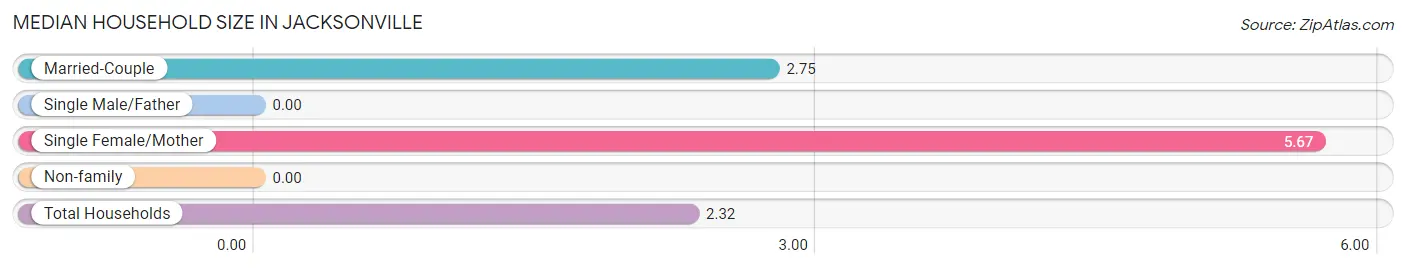
| Household Type | # Households | Household Size |
| Married-Couple | 20 (54.0%) | 2.75 |
| Single Male/Father | 0 (0.0%) | - |
| Single Female/Mother | 3 (8.1%) | 5.67 |
| Non-family | 14 (37.8%) | - |
| Total Households | 37 (100.0%) | 2.32 |
Household Size by Marriage Status in Jacksonville
Out of a total of 37 households in Jacksonville, 23 (62.2%) are family households, while 14 (37.8%) are nonfamily households. The most numerous type of family households are 2-person households, comprising 16, and the most common type of nonfamily households are 1-person households, comprising 14.
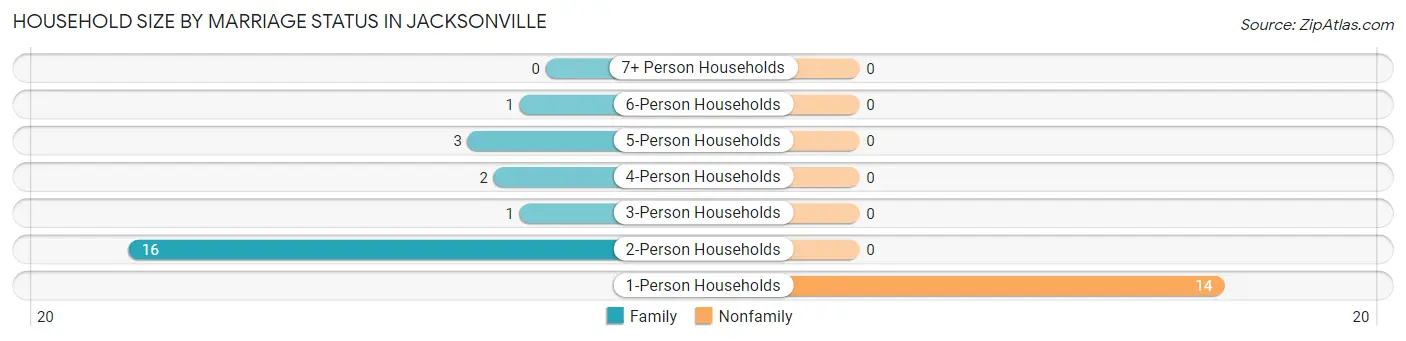
| Household Size | Family Households | Nonfamily Households |
| 1-Person Households | - | 14 (37.8%) |
| 2-Person Households | 16 (43.2%) | 0 (0.0%) |
| 3-Person Households | 1 (2.7%) | 0 (0.0%) |
| 4-Person Households | 2 (5.4%) | 0 (0.0%) |
| 5-Person Households | 3 (8.1%) | 0 (0.0%) |
| 6-Person Households | 1 (2.7%) | 0 (0.0%) |
| 7+ Person Households | 0 (0.0%) | 0 (0.0%) |
| Total | 23 (62.2%) | 14 (37.8%) |
Female Fertility in Jacksonville
Fertility by Age in Jacksonville
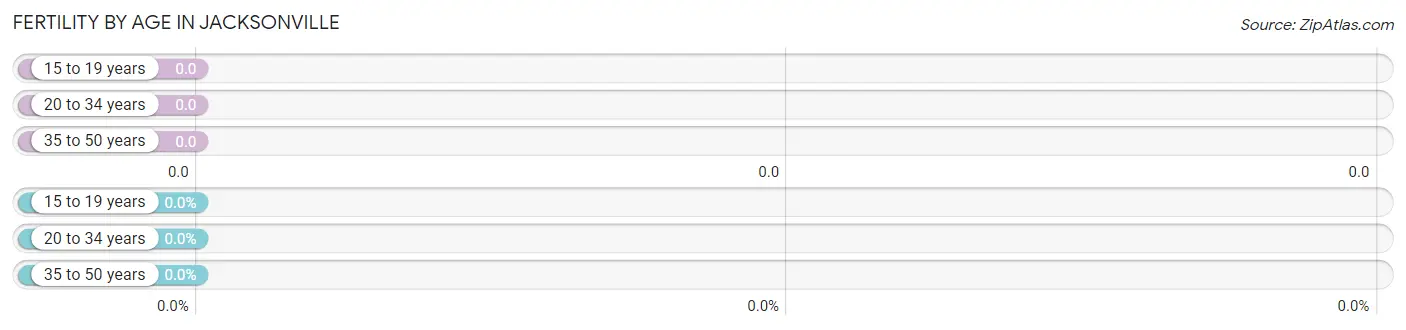
| Age Bracket | Women with Births | Births / 1,000 Women |
| 15 to 19 years | 0 (0.0%) | 0.0 |
| 20 to 34 years | 0 (0.0%) | 0.0 |
| 35 to 50 years | 0 (0.0%) | 0.0 |
| Total | 0 (0.0%) | 0.0 |
Fertility by Age by Marriage Status in Jacksonville
| Age Bracket | Married | Unmarried |
| 15 to 19 years | 0 (0.0%) | 0 (0.0%) |
| 20 to 34 years | 0 (0.0%) | 0 (0.0%) |
| 35 to 50 years | 0 (0.0%) | 0 (0.0%) |
| Total | 0 (0.0%) | 0 (0.0%) |
Fertility by Education in Jacksonville
| Educational Attainment | Women with Births | Births / 1,000 Women |
| Less than High School | 0 (0.0%) | 0.0 |
| High School Diploma | 0 (0.0%) | 0.0 |
| College or Associate's Degree | 0 (0.0%) | 0.0 |
| Bachelor's Degree | 0 (0.0%) | 0.0 |
| Graduate Degree | 0 (0.0%) | 0.0 |
| Total | 0 (0.0%) | 0.0 |
Fertility by Education by Marriage Status in Jacksonville
| Educational Attainment | Married | Unmarried |
| Less than High School | 0 (0.0%) | 0 (0.0%) |
| High School Diploma | 0 (0.0%) | 0 (0.0%) |
| College or Associate's Degree | 0 (0.0%) | 0 (0.0%) |
| Bachelor's Degree | 0 (0.0%) | 0 (0.0%) |
| Graduate Degree | 0 (0.0%) | 0 (0.0%) |
| Total | 0 (0.0%) | 0 (0.0%) |
Employment Characteristics in Jacksonville
Employment by Class of Employer in Jacksonville
Among the 59 employed individuals in Jacksonville, private company employees (40 | 67.8%), federal government employees (9 | 15.2%), and local government employees (7 | 11.9%) make up the most common classes of employment.
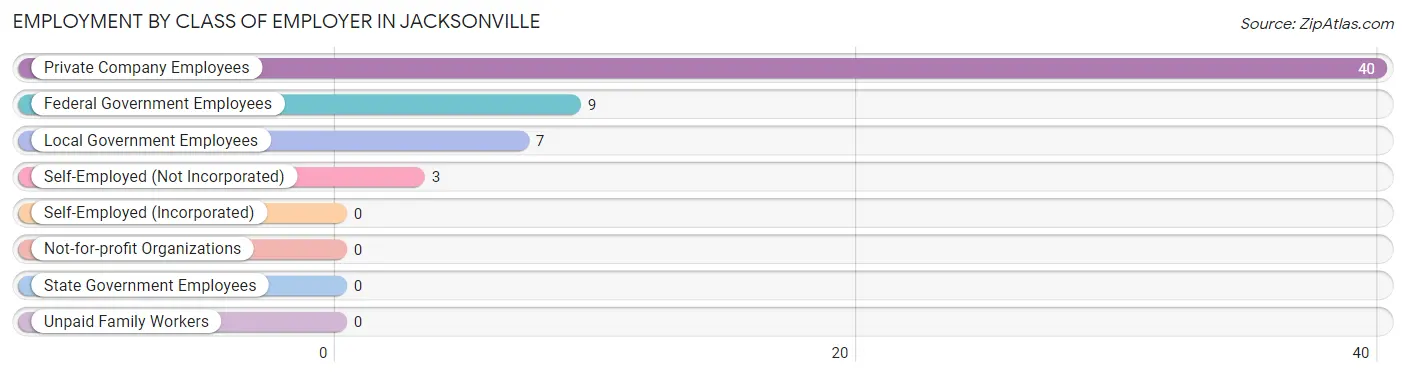
| Employer Class | # Employees | % Employees |
| Private Company Employees | 40 | 67.8% |
| Self-Employed (Incorporated) | 0 | 0.0% |
| Self-Employed (Not Incorporated) | 3 | 5.1% |
| Not-for-profit Organizations | 0 | 0.0% |
| Local Government Employees | 7 | 11.9% |
| State Government Employees | 0 | 0.0% |
| Federal Government Employees | 9 | 15.2% |
| Unpaid Family Workers | 0 | 0.0% |
| Total | 59 | 100.0% |
Employment Status by Age in Jacksonville
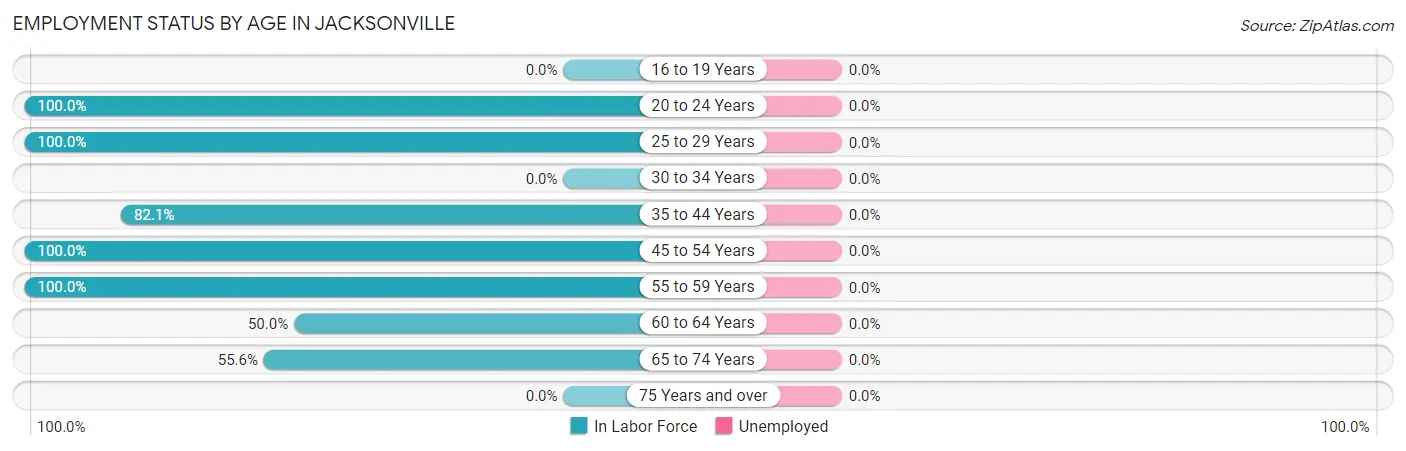
| Age Bracket | In Labor Force | Unemployed |
| 16 to 19 Years | 0 (0.0%) | 0 (0.0%) |
| 20 to 24 Years | 4 (100.0%) | 0 (0.0%) |
| 25 to 29 Years | 9 (100.0%) | 0 (0.0%) |
| 30 to 34 Years | 0 (0.0%) | 0 (0.0%) |
| 35 to 44 Years | 23 (82.1%) | 0 (0.0%) |
| 45 to 54 Years | 6 (100.0%) | 0 (0.0%) |
| 55 to 59 Years | 9 (100.0%) | 0 (0.0%) |
| 60 to 64 Years | 3 (50.0%) | 0 (0.0%) |
| 65 to 74 Years | 5 (55.6%) | 0 (0.0%) |
| 75 Years and over | 0 (0.0%) | 0 (0.0%) |
| Total | 59 (78.7%) | 0 (0.0%) |
Employment Status by Educational Attainment in Jacksonville
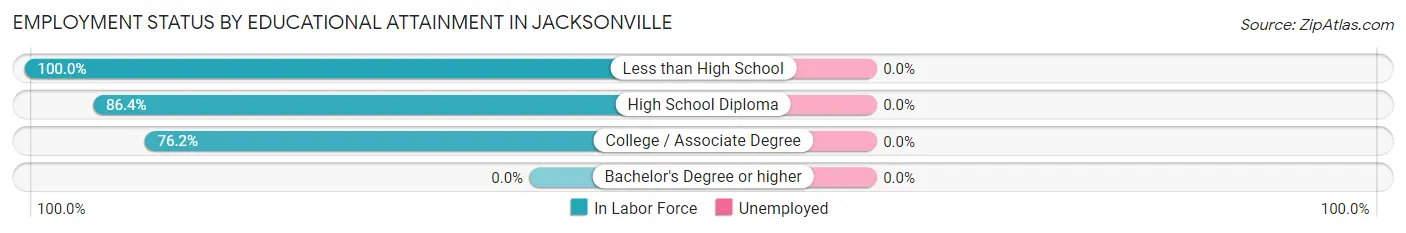
| Educational Attainment | In Labor Force | Unemployed |
| Less than High School | 15 (100.0%) | 0 (0.0%) |
| High School Diploma | 19 (86.4%) | 0 (0.0%) |
| College / Associate Degree | 16 (76.2%) | 0 (0.0%) |
| Bachelor's Degree or higher | 0 (0.0%) | 0 (0.0%) |
| Total | 50 (86.2%) | 0 (0.0%) |
Employment Occupations by Sex in Jacksonville
Management, Business, Science and Arts Occupations
The most common Management, Business, Science and Arts occupations in Jacksonville are Business & Financial (7 | 11.9%), Community & Social Service (1 | 1.7%), and Education Instruction & Library (1 | 1.7%).
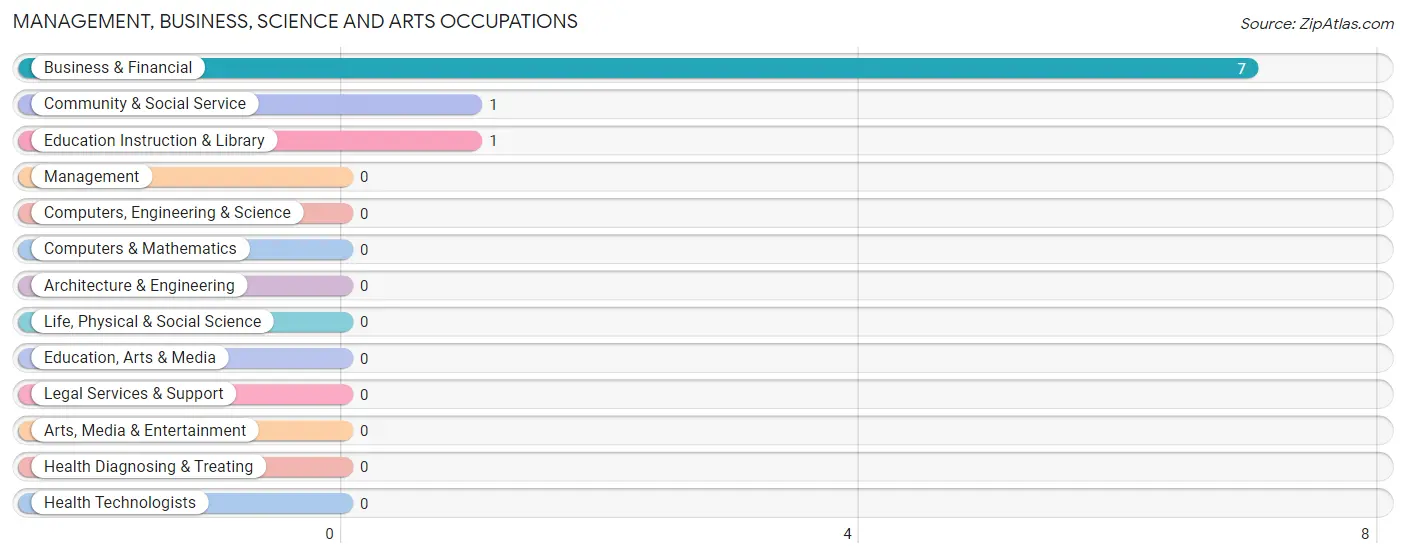
Management, Business, Science and Arts Occupations by Sex
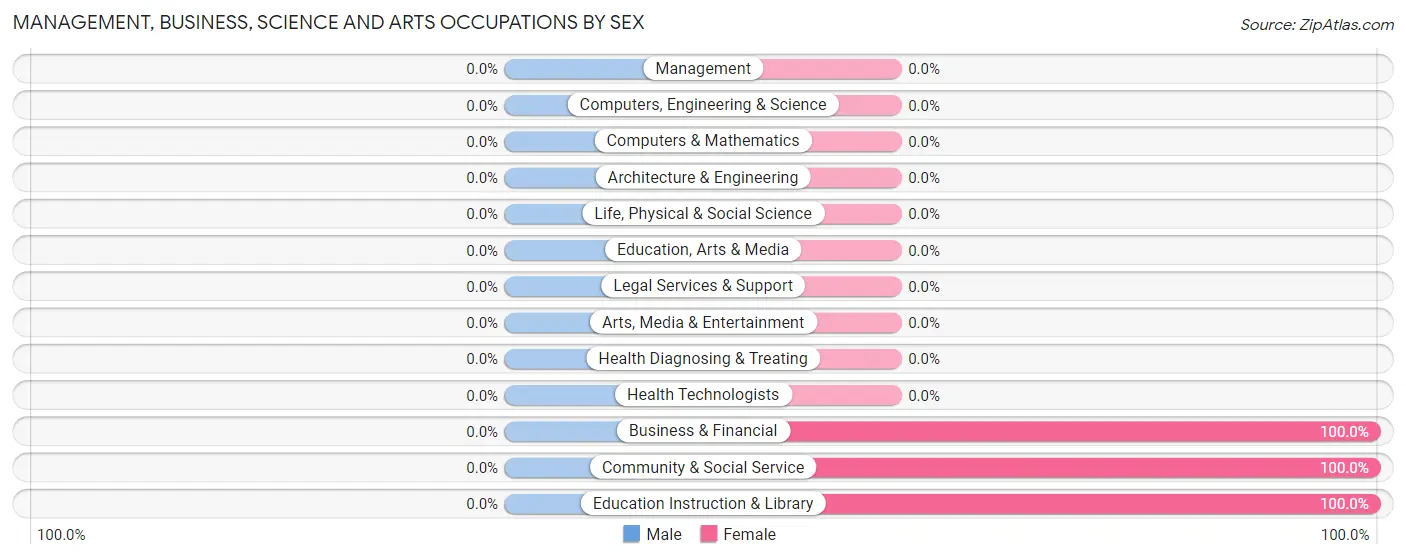
| Occupation | Male | Female |
| Management | 0 (0.0%) | 0 (0.0%) |
| Business & Financial | 0 (0.0%) | 7 (100.0%) |
| Computers, Engineering & Science | 0 (0.0%) | 0 (0.0%) |
| Computers & Mathematics | 0 (0.0%) | 0 (0.0%) |
| Architecture & Engineering | 0 (0.0%) | 0 (0.0%) |
| Life, Physical & Social Science | 0 (0.0%) | 0 (0.0%) |
| Community & Social Service | 0 (0.0%) | 1 (100.0%) |
| Education, Arts & Media | 0 (0.0%) | 0 (0.0%) |
| Legal Services & Support | 0 (0.0%) | 0 (0.0%) |
| Education Instruction & Library | 0 (0.0%) | 1 (100.0%) |
| Arts, Media & Entertainment | 0 (0.0%) | 0 (0.0%) |
| Health Diagnosing & Treating | 0 (0.0%) | 0 (0.0%) |
| Health Technologists | 0 (0.0%) | 0 (0.0%) |
| Total (Category) | 0 (0.0%) | 8 (100.0%) |
| Total (Overall) | 41 (69.5%) | 18 (30.5%) |
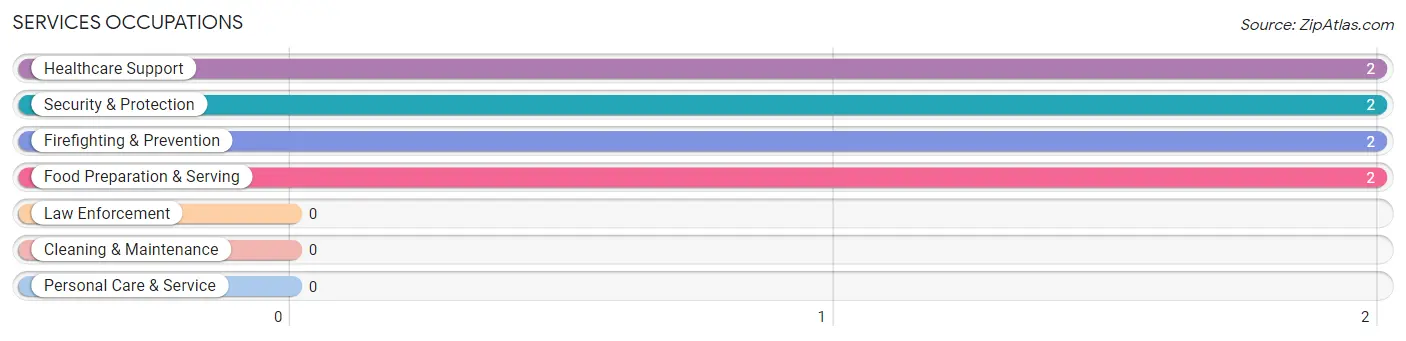
Services Occupations
The most common Services occupations in Jacksonville are Healthcare Support (2 | 3.4%), Security & Protection (2 | 3.4%), Firefighting & Prevention (2 | 3.4%), and Food Preparation & Serving (2 | 3.4%).
Services Occupations by Sex
Within the Services occupations in Jacksonville, the most male-oriented occupations are Security & Protection (100.0%), and Firefighting & Prevention (100.0%), while the most female-oriented occupations are Healthcare Support (100.0%), and Food Preparation & Serving (100.0%).
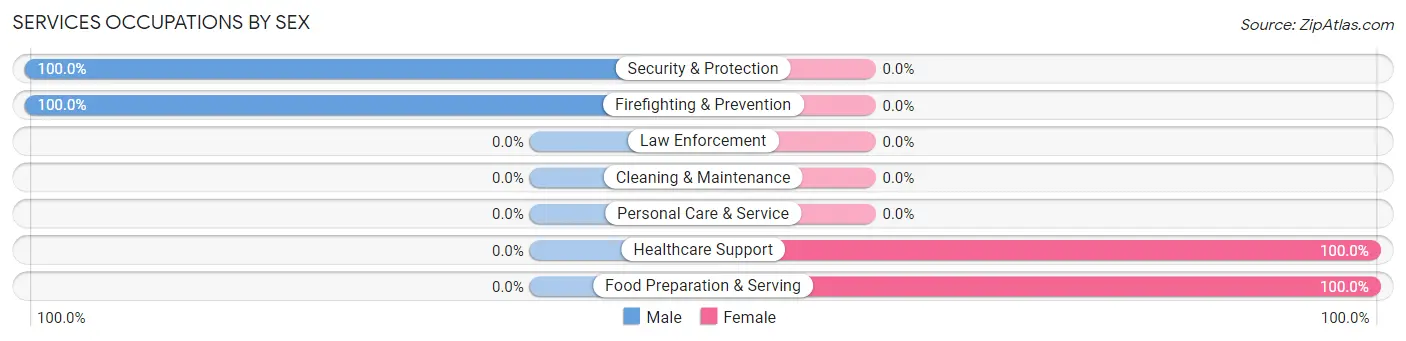
| Occupation | Male | Female |
| Healthcare Support | 0 (0.0%) | 2 (100.0%) |
| Security & Protection | 2 (100.0%) | 0 (0.0%) |
| Firefighting & Prevention | 2 (100.0%) | 0 (0.0%) |
| Law Enforcement | 0 (0.0%) | 0 (0.0%) |
| Food Preparation & Serving | 0 (0.0%) | 2 (100.0%) |
| Cleaning & Maintenance | 0 (0.0%) | 0 (0.0%) |
| Personal Care & Service | 0 (0.0%) | 0 (0.0%) |
| Total (Category) | 2 (33.3%) | 4 (66.7%) |
| Total (Overall) | 41 (69.5%) | 18 (30.5%) |
Sales and Office Occupations
The most common Sales and Office occupations in Jacksonville are , and Office & Administration (6 | 10.2%).
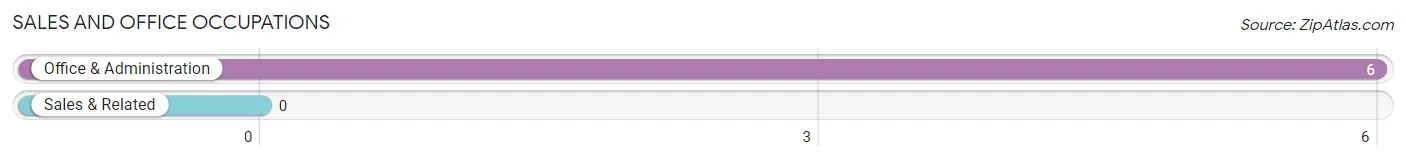
Sales and Office Occupations by Sex
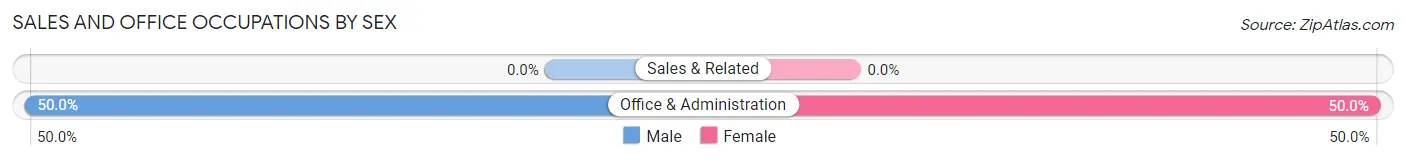
| Occupation | Male | Female |
| Sales & Related | 0 (0.0%) | 0 (0.0%) |
| Office & Administration | 3 (50.0%) | 3 (50.0%) |
| Total (Category) | 3 (50.0%) | 3 (50.0%) |
| Total (Overall) | 41 (69.5%) | 18 (30.5%) |
Natural Resources, Construction and Maintenance Occupations
The most common Natural Resources, Construction and Maintenance occupations in Jacksonville are Installation, Maintenance & Repair (15 | 25.4%), and Construction & Extraction (3 | 5.1%).
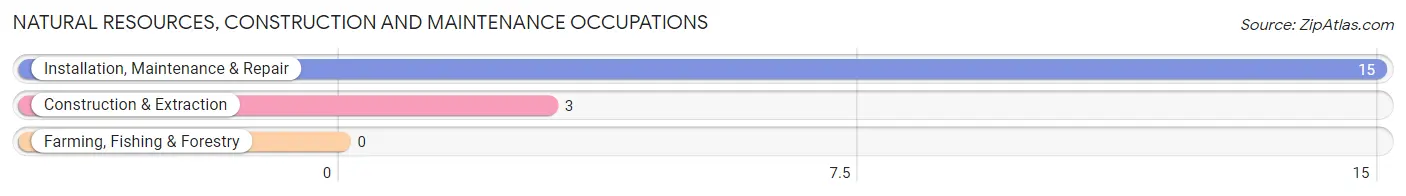
Natural Resources, Construction and Maintenance Occupations by Sex

| Occupation | Male | Female |
| Farming, Fishing & Forestry | 0 (0.0%) | 0 (0.0%) |
| Construction & Extraction | 3 (100.0%) | 0 (0.0%) |
| Installation, Maintenance & Repair | 15 (100.0%) | 0 (0.0%) |
| Total (Category) | 18 (100.0%) | 0 (0.0%) |
| Total (Overall) | 41 (69.5%) | 18 (30.5%) |
Production, Transportation and Moving Occupations
The most common Production, Transportation and Moving occupations in Jacksonville are Production (15 | 25.4%), and Material Moving (6 | 10.2%).
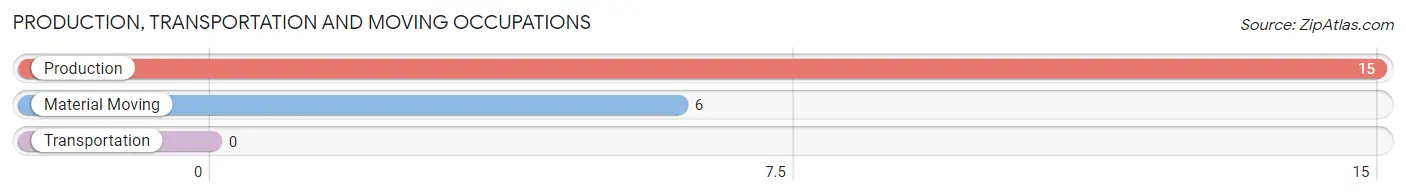
Production, Transportation and Moving Occupations by Sex
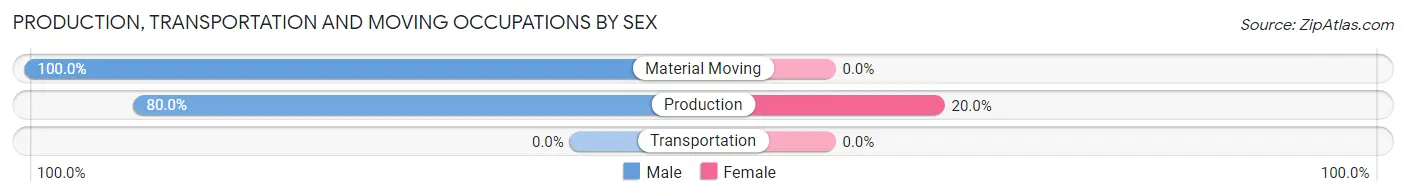
| Occupation | Male | Female |
| Production | 12 (80.0%) | 3 (20.0%) |
| Transportation | 0 (0.0%) | 0 (0.0%) |
| Material Moving | 6 (100.0%) | 0 (0.0%) |
| Total (Category) | 18 (85.7%) | 3 (14.3%) |
| Total (Overall) | 41 (69.5%) | 18 (30.5%) |
Employment Industries by Sex in Jacksonville
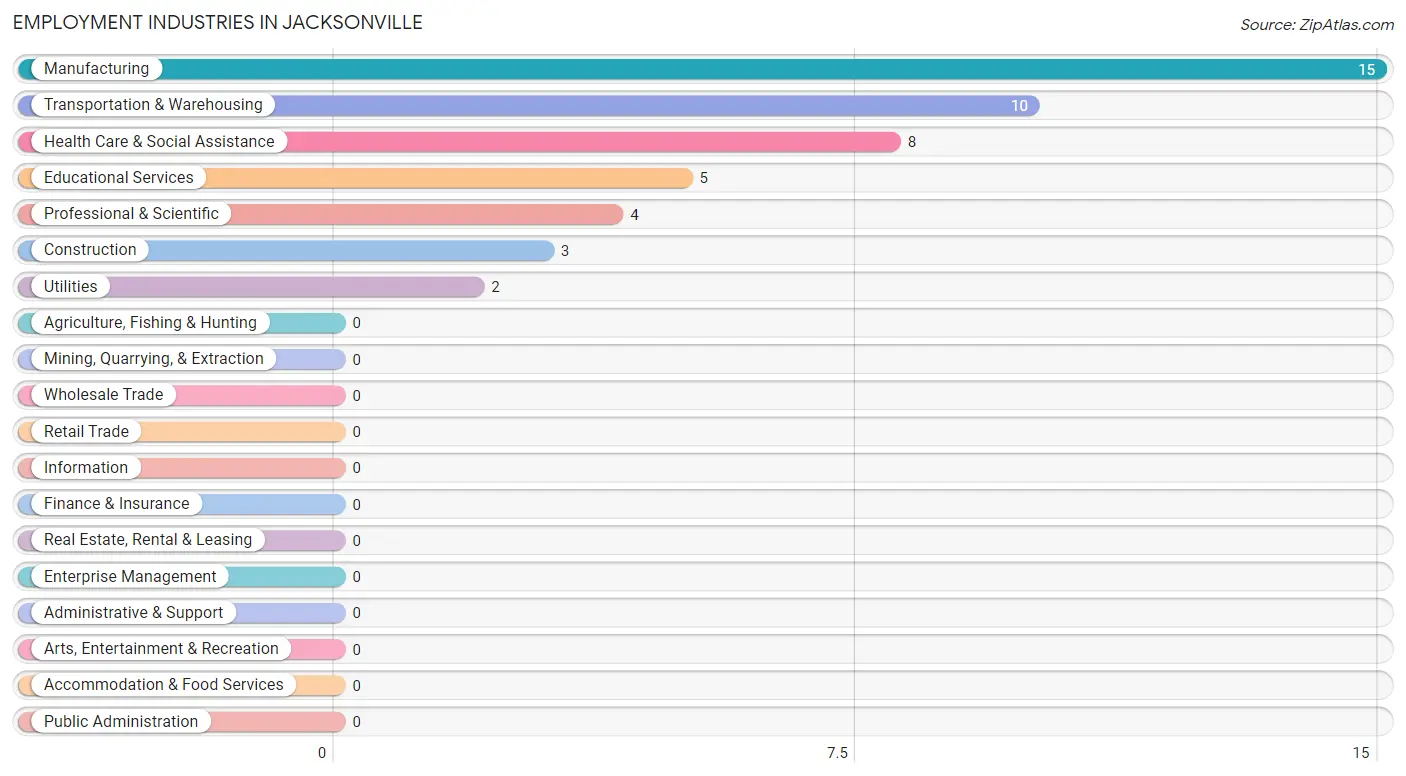
Employment Industries in Jacksonville
The major employment industries in Jacksonville include Manufacturing (15 | 25.4%), Transportation & Warehousing (10 | 17.0%), Health Care & Social Assistance (8 | 13.6%), Educational Services (5 | 8.5%), and Professional & Scientific (4 | 6.8%).
Employment Industries by Sex in Jacksonville
The Jacksonville industries that see more men than women are Construction (100.0%), Transportation & Warehousing (100.0%), and Utilities (100.0%), whereas the industries that tend to have a higher number of women are Health Care & Social Assistance (100.0%), Educational Services (60.0%), and Professional & Scientific (25.0%).
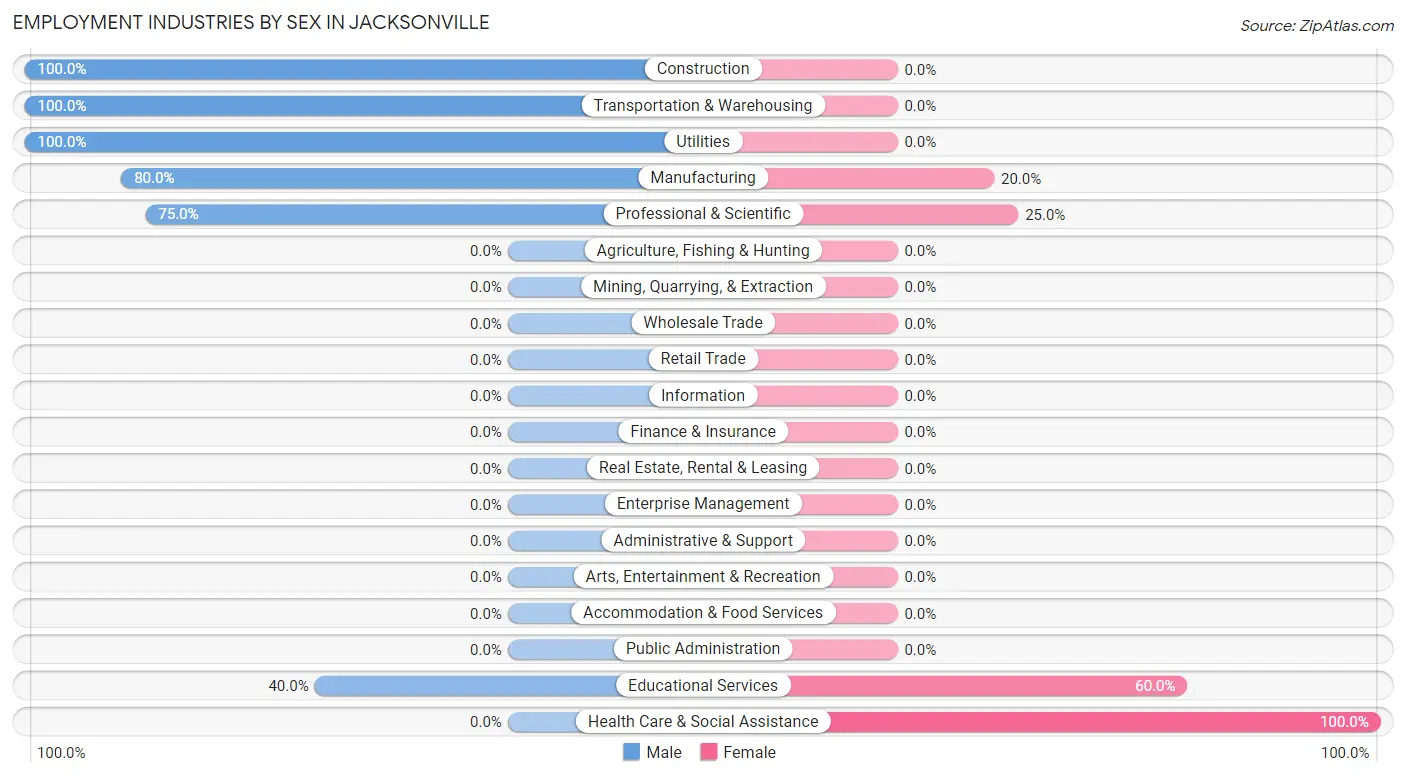
| Industry | Male | Female |
| Agriculture, Fishing & Hunting | 0 (0.0%) | 0 (0.0%) |
| Mining, Quarrying, & Extraction | 0 (0.0%) | 0 (0.0%) |
| Construction | 3 (100.0%) | 0 (0.0%) |
| Manufacturing | 12 (80.0%) | 3 (20.0%) |
| Wholesale Trade | 0 (0.0%) | 0 (0.0%) |
| Retail Trade | 0 (0.0%) | 0 (0.0%) |
| Transportation & Warehousing | 10 (100.0%) | 0 (0.0%) |
| Utilities | 2 (100.0%) | 0 (0.0%) |
| Information | 0 (0.0%) | 0 (0.0%) |
| Finance & Insurance | 0 (0.0%) | 0 (0.0%) |
| Real Estate, Rental & Leasing | 0 (0.0%) | 0 (0.0%) |
| Professional & Scientific | 3 (75.0%) | 1 (25.0%) |
| Enterprise Management | 0 (0.0%) | 0 (0.0%) |
| Administrative & Support | 0 (0.0%) | 0 (0.0%) |
| Educational Services | 2 (40.0%) | 3 (60.0%) |
| Health Care & Social Assistance | 0 (0.0%) | 8 (100.0%) |
| Arts, Entertainment & Recreation | 0 (0.0%) | 0 (0.0%) |
| Accommodation & Food Services | 0 (0.0%) | 0 (0.0%) |
| Public Administration | 0 (0.0%) | 0 (0.0%) |
| Total | 41 (69.5%) | 18 (30.5%) |
Education in Jacksonville
School Enrollment in Jacksonville
The most common levels of schooling among the 13 students in Jacksonville are middle school (9 | 69.2%), elementary school (2 | 15.4%), and high school (2 | 15.4%).
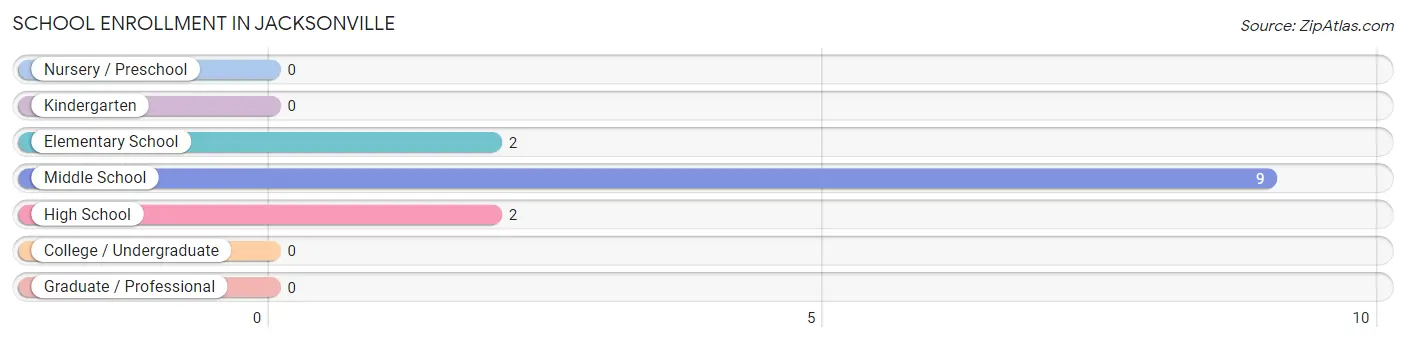
| School Level | # Students | % Students |
| Nursery / Preschool | 0 | 0.0% |
| Kindergarten | 0 | 0.0% |
| Elementary School | 2 | 15.4% |
| Middle School | 9 | 69.2% |
| High School | 2 | 15.4% |
| College / Undergraduate | 0 | 0.0% |
| Graduate / Professional | 0 | 0.0% |
| Total | 13 | 100.0% |
School Enrollment by Age by Funding Source in Jacksonville
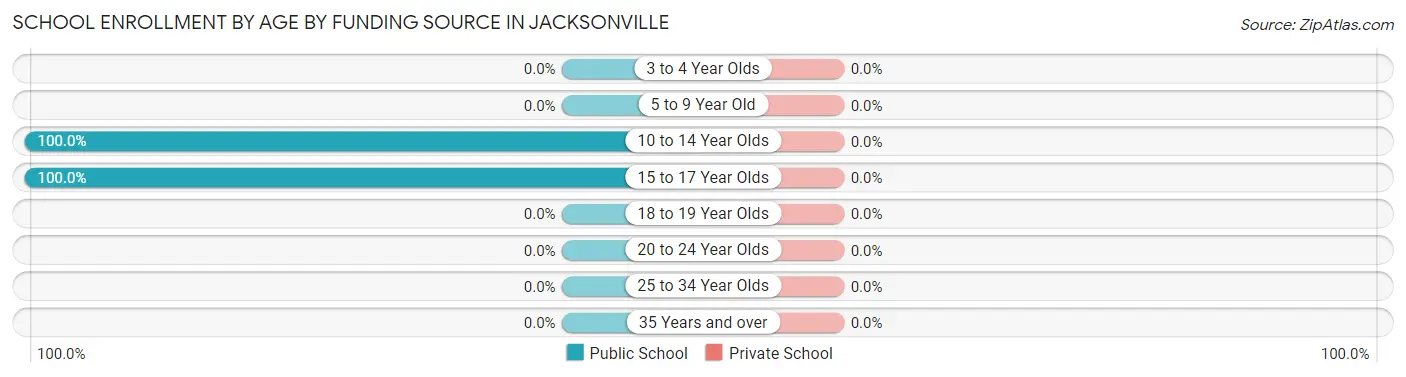
| Age Bracket | Public School | Private School |
| 3 to 4 Year Olds | 0 (0.0%) | 0 (0.0%) |
| 5 to 9 Year Old | 0 (0.0%) | 0 (0.0%) |
| 10 to 14 Year Olds | 11 (100.0%) | 0 (0.0%) |
| 15 to 17 Year Olds | 2 (100.0%) | 0 (0.0%) |
| 18 to 19 Year Olds | 0 (0.0%) | 0 (0.0%) |
| 20 to 24 Year Olds | 0 (0.0%) | 0 (0.0%) |
| 25 to 34 Year Olds | 0 (0.0%) | 0 (0.0%) |
| 35 Years and over | 0 (0.0%) | 0 (0.0%) |
| Total | 13 (100.0%) | 0 (0.0%) |
Educational Attainment by Field of Study in Jacksonville
, and education (1 | 100.0%) are the most common fields of study among 1 individuals in Jacksonville who have obtained a bachelor's degree or higher.
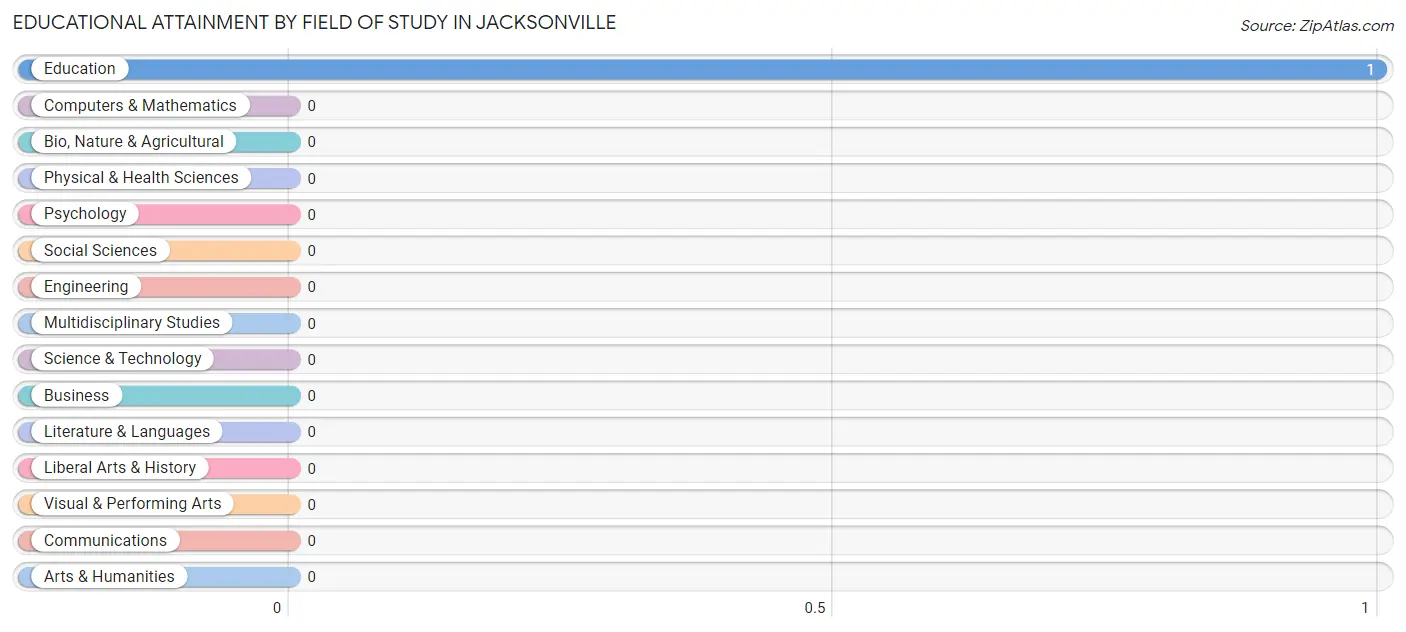
| Field of Study | # Graduates | % Graduates |
| Computers & Mathematics | 0 | 0.0% |
| Bio, Nature & Agricultural | 0 | 0.0% |
| Physical & Health Sciences | 0 | 0.0% |
| Psychology | 0 | 0.0% |
| Social Sciences | 0 | 0.0% |
| Engineering | 0 | 0.0% |
| Multidisciplinary Studies | 0 | 0.0% |
| Science & Technology | 0 | 0.0% |
| Business | 0 | 0.0% |
| Education | 1 | 100.0% |
| Literature & Languages | 0 | 0.0% |
| Liberal Arts & History | 0 | 0.0% |
| Visual & Performing Arts | 0 | 0.0% |
| Communications | 0 | 0.0% |
| Arts & Humanities | 0 | 0.0% |
| Total | 1 | 100.0% |
Transportation & Commute in Jacksonville
Vehicle Availability by Sex in Jacksonville
The most prevalent vehicle ownership categories in Jacksonville are males with 2 vehicles (23, accounting for 56.1%) and females with 2 vehicles (9, making up 127.8%).
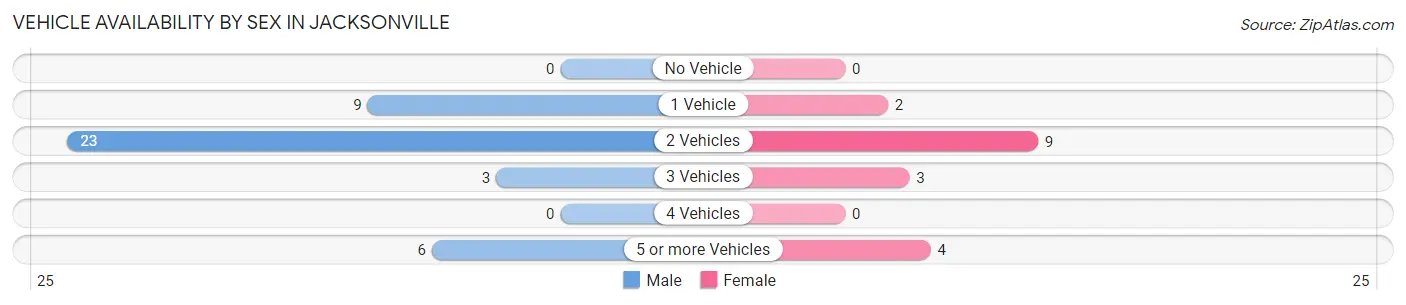
| Vehicles Available | Male | Female |
| No Vehicle | 0 (0.0%) | 0 (0.0%) |
| 1 Vehicle | 9 (22.0%) | 2 (11.1%) |
| 2 Vehicles | 23 (56.1%) | 9 (50.0%) |
| 3 Vehicles | 3 (7.3%) | 3 (16.7%) |
| 4 Vehicles | 0 (0.0%) | 0 (0.0%) |
| 5 or more Vehicles | 6 (14.6%) | 4 (22.2%) |
| Total | 41 (100.0%) | 18 (100.0%) |
Commute Time in Jacksonville
The most frequently occuring commute durations in Jacksonville are 15 to 19 minutes (21 commuters, 41.2%), 20 to 24 minutes (13 commuters, 25.5%), and 90 or more minutes (6 commuters, 11.8%).
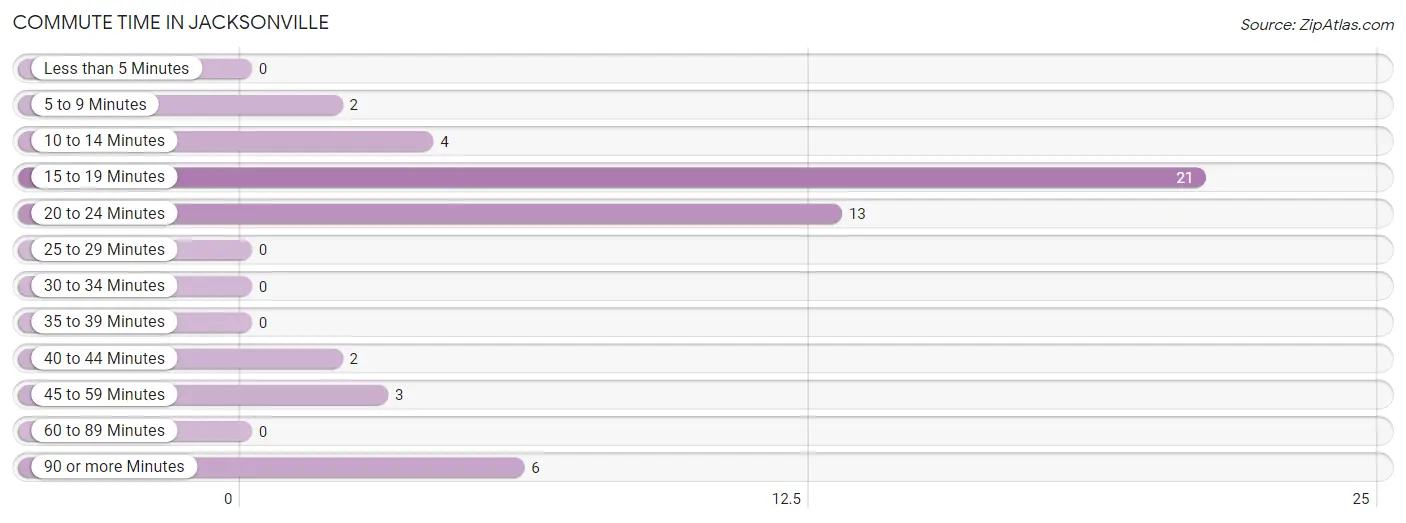
| Commute Time | # Commuters | % Commuters |
| Less than 5 Minutes | 0 | 0.0% |
| 5 to 9 Minutes | 2 | 3.9% |
| 10 to 14 Minutes | 4 | 7.8% |
| 15 to 19 Minutes | 21 | 41.2% |
| 20 to 24 Minutes | 13 | 25.5% |
| 25 to 29 Minutes | 0 | 0.0% |
| 30 to 34 Minutes | 0 | 0.0% |
| 35 to 39 Minutes | 0 | 0.0% |
| 40 to 44 Minutes | 2 | 3.9% |
| 45 to 59 Minutes | 3 | 5.9% |
| 60 to 89 Minutes | 0 | 0.0% |
| 90 or more Minutes | 6 | 11.8% |
Commute Time by Sex in Jacksonville
The most common commute times in Jacksonville are 15 to 19 minutes (20 commuters, 48.8%) for males and 10 to 14 minutes (4 commuters, 40.0%) for females.
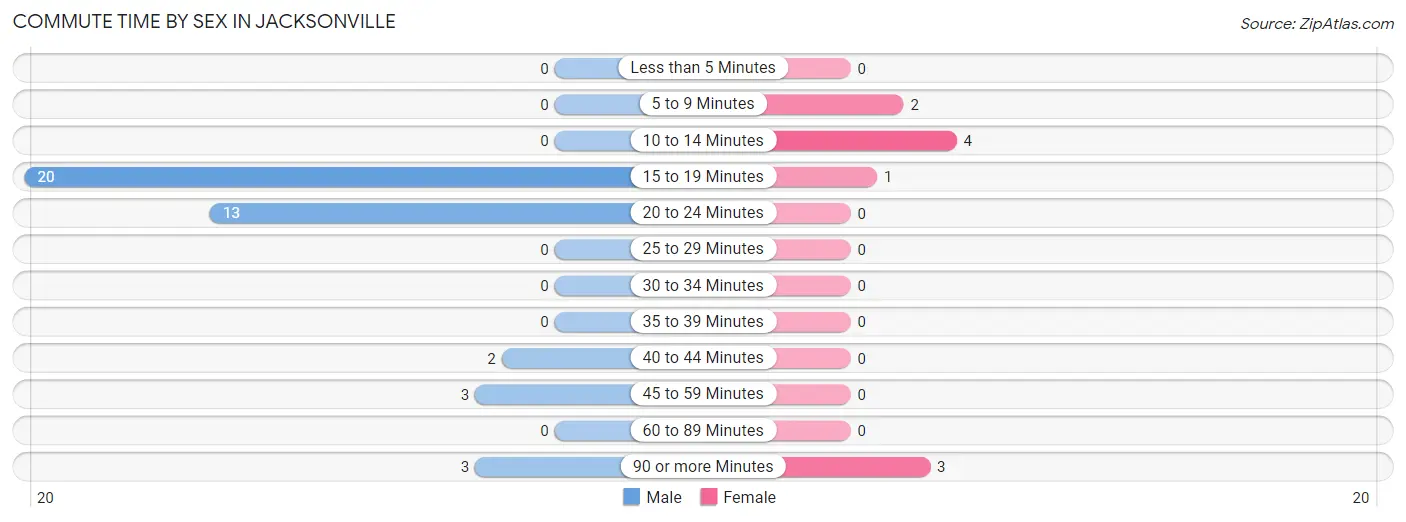
| Commute Time | Male | Female |
| Less than 5 Minutes | 0 (0.0%) | 0 (0.0%) |
| 5 to 9 Minutes | 0 (0.0%) | 2 (20.0%) |
| 10 to 14 Minutes | 0 (0.0%) | 4 (40.0%) |
| 15 to 19 Minutes | 20 (48.8%) | 1 (10.0%) |
| 20 to 24 Minutes | 13 (31.7%) | 0 (0.0%) |
| 25 to 29 Minutes | 0 (0.0%) | 0 (0.0%) |
| 30 to 34 Minutes | 0 (0.0%) | 0 (0.0%) |
| 35 to 39 Minutes | 0 (0.0%) | 0 (0.0%) |
| 40 to 44 Minutes | 2 (4.9%) | 0 (0.0%) |
| 45 to 59 Minutes | 3 (7.3%) | 0 (0.0%) |
| 60 to 89 Minutes | 0 (0.0%) | 0 (0.0%) |
| 90 or more Minutes | 3 (7.3%) | 3 (30.0%) |
Time of Departure to Work by Sex in Jacksonville
The most frequent times of departure to work in Jacksonville are 12:00 AM to 4:59 AM (13, 31.7%) for males and 8:00 AM to 8:29 AM (4, 40.0%) for females.
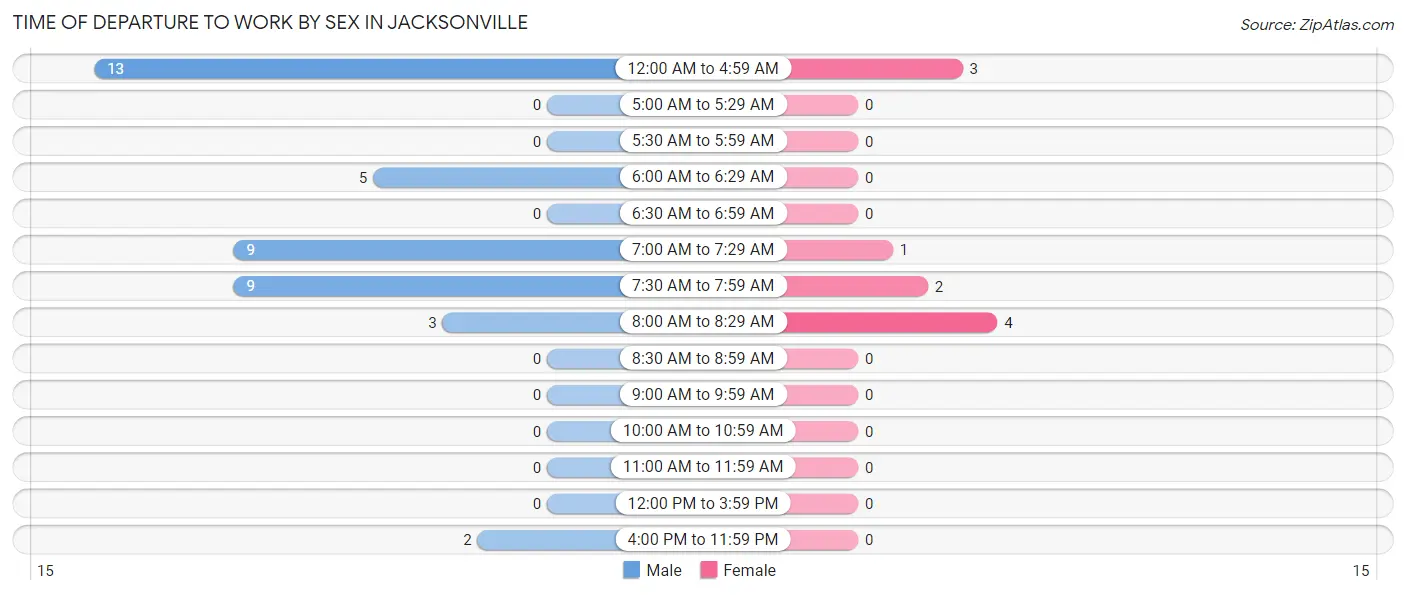
| Time of Departure | Male | Female |
| 12:00 AM to 4:59 AM | 13 (31.7%) | 3 (30.0%) |
| 5:00 AM to 5:29 AM | 0 (0.0%) | 0 (0.0%) |
| 5:30 AM to 5:59 AM | 0 (0.0%) | 0 (0.0%) |
| 6:00 AM to 6:29 AM | 5 (12.2%) | 0 (0.0%) |
| 6:30 AM to 6:59 AM | 0 (0.0%) | 0 (0.0%) |
| 7:00 AM to 7:29 AM | 9 (22.0%) | 1 (10.0%) |
| 7:30 AM to 7:59 AM | 9 (22.0%) | 2 (20.0%) |
| 8:00 AM to 8:29 AM | 3 (7.3%) | 4 (40.0%) |
| 8:30 AM to 8:59 AM | 0 (0.0%) | 0 (0.0%) |
| 9:00 AM to 9:59 AM | 0 (0.0%) | 0 (0.0%) |
| 10:00 AM to 10:59 AM | 0 (0.0%) | 0 (0.0%) |
| 11:00 AM to 11:59 AM | 0 (0.0%) | 0 (0.0%) |
| 12:00 PM to 3:59 PM | 0 (0.0%) | 0 (0.0%) |
| 4:00 PM to 11:59 PM | 2 (4.9%) | 0 (0.0%) |
| Total | 41 (100.0%) | 10 (100.0%) |
Housing Occupancy in Jacksonville
Occupancy by Ownership in Jacksonville
Of the total 37 dwellings in Jacksonville, owner-occupied units account for 31 (83.8%), while renter-occupied units make up 6 (16.2%).
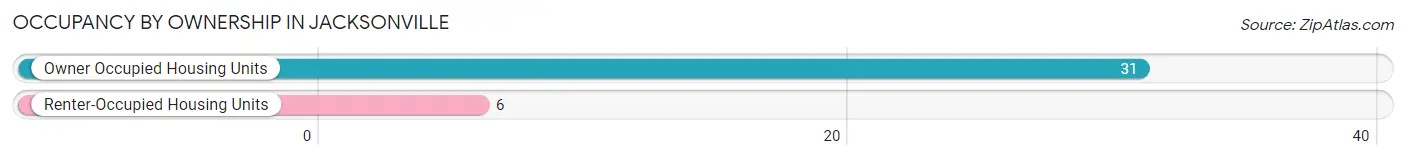
| Occupancy | # Housing Units | % Housing Units |
| Owner Occupied Housing Units | 31 | 83.8% |
| Renter-Occupied Housing Units | 6 | 16.2% |
| Total Occupied Housing Units | 37 | 100.0% |
Occupancy by Household Size in Jacksonville
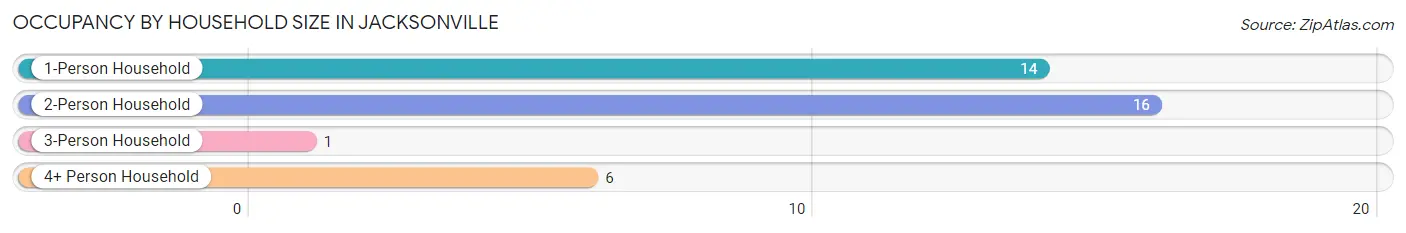
| Household Size | # Housing Units | % Housing Units |
| 1-Person Household | 14 | 37.8% |
| 2-Person Household | 16 | 43.2% |
| 3-Person Household | 1 | 2.7% |
| 4+ Person Household | 6 | 16.2% |
| Total Housing Units | 37 | 100.0% |
Occupancy by Ownership by Household Size in Jacksonville
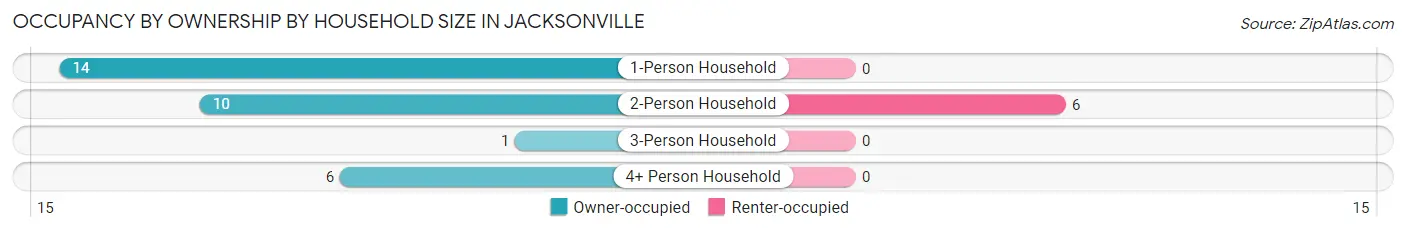
| Household Size | Owner-occupied | Renter-occupied |
| 1-Person Household | 14 (100.0%) | 0 (0.0%) |
| 2-Person Household | 10 (62.5%) | 6 (37.5%) |
| 3-Person Household | 1 (100.0%) | 0 (0.0%) |
| 4+ Person Household | 6 (100.0%) | 0 (0.0%) |
| Total Housing Units | 31 (83.8%) | 6 (16.2%) |
Occupancy by Educational Attainment in Jacksonville
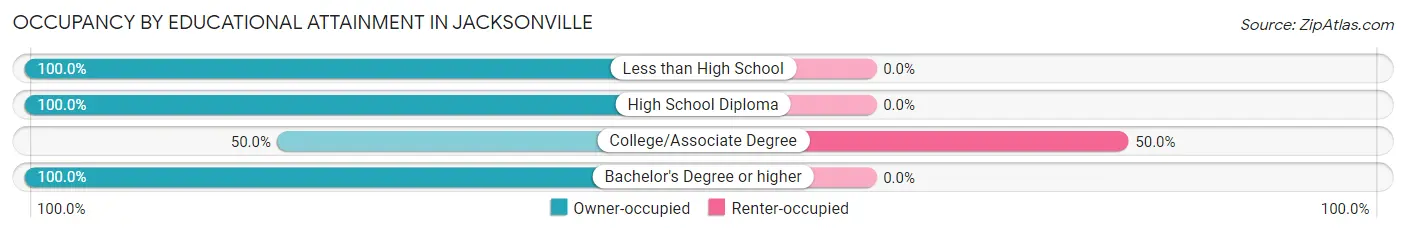
| Household Size | Owner-occupied | Renter-occupied |
| Less than High School | 13 (100.0%) | 0 (0.0%) |
| High School Diploma | 11 (100.0%) | 0 (0.0%) |
| College/Associate Degree | 6 (50.0%) | 6 (50.0%) |
| Bachelor's Degree or higher | 1 (100.0%) | 0 (0.0%) |
Occupancy by Age of Householder in Jacksonville
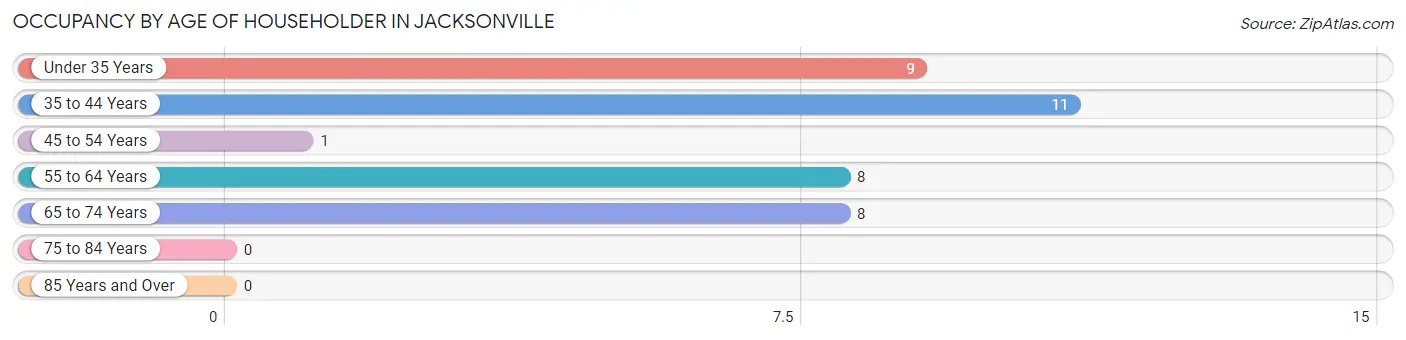
| Age Bracket | # Households | % Households |
| Under 35 Years | 9 | 24.3% |
| 35 to 44 Years | 11 | 29.7% |
| 45 to 54 Years | 1 | 2.7% |
| 55 to 64 Years | 8 | 21.6% |
| 65 to 74 Years | 8 | 21.6% |
| 75 to 84 Years | 0 | 0.0% |
| 85 Years and Over | 0 | 0.0% |
| Total | 37 | 100.0% |
Housing Finances in Jacksonville
Median Income by Occupancy in Jacksonville
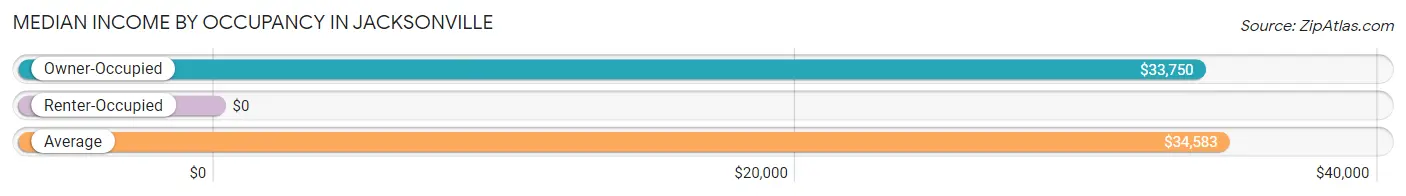
| Occupancy Type | # Households | Median Income |
| Owner-Occupied | 31 (83.8%) | $33,750 |
| Renter-Occupied | 6 (16.2%) | $0 |
| Average | 37 (100.0%) | $34,583 |
Occupancy by Householder Income Bracket in Jacksonville
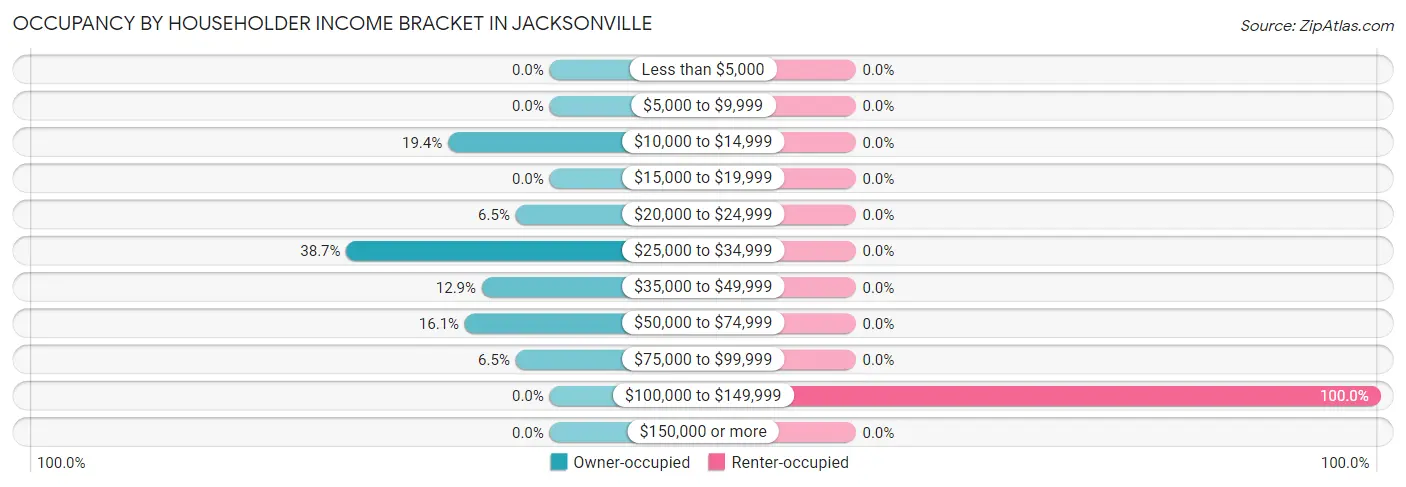
| Income Bracket | Owner-occupied | Renter-occupied |
| Less than $5,000 | 0 (0.0%) | 0 (0.0%) |
| $5,000 to $9,999 | 0 (0.0%) | 0 (0.0%) |
| $10,000 to $14,999 | 6 (19.4%) | 0 (0.0%) |
| $15,000 to $19,999 | 0 (0.0%) | 0 (0.0%) |
| $20,000 to $24,999 | 2 (6.5%) | 0 (0.0%) |
| $25,000 to $34,999 | 12 (38.7%) | 0 (0.0%) |
| $35,000 to $49,999 | 4 (12.9%) | 0 (0.0%) |
| $50,000 to $74,999 | 5 (16.1%) | 0 (0.0%) |
| $75,000 to $99,999 | 2 (6.5%) | 0 (0.0%) |
| $100,000 to $149,999 | 0 (0.0%) | 6 (100.0%) |
| $150,000 or more | 0 (0.0%) | 0 (0.0%) |
| Total | 31 (100.0%) | 6 (100.0%) |
Monthly Housing Cost Tiers in Jacksonville
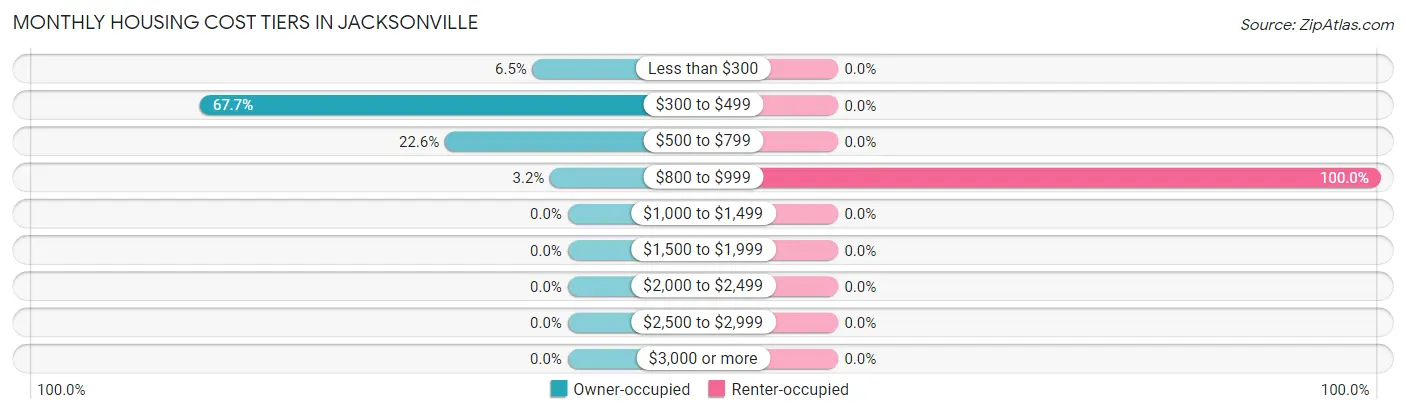
| Monthly Cost | Owner-occupied | Renter-occupied |
| Less than $300 | 2 (6.5%) | 0 (0.0%) |
| $300 to $499 | 21 (67.7%) | 0 (0.0%) |
| $500 to $799 | 7 (22.6%) | 0 (0.0%) |
| $800 to $999 | 1 (3.2%) | 6 (100.0%) |
| $1,000 to $1,499 | 0 (0.0%) | 0 (0.0%) |
| $1,500 to $1,999 | 0 (0.0%) | 0 (0.0%) |
| $2,000 to $2,499 | 0 (0.0%) | 0 (0.0%) |
| $2,500 to $2,999 | 0 (0.0%) | 0 (0.0%) |
| $3,000 or more | 0 (0.0%) | 0 (0.0%) |
| Total | 31 (100.0%) | 6 (100.0%) |
Physical Housing Characteristics in Jacksonville
Housing Structures in Jacksonville
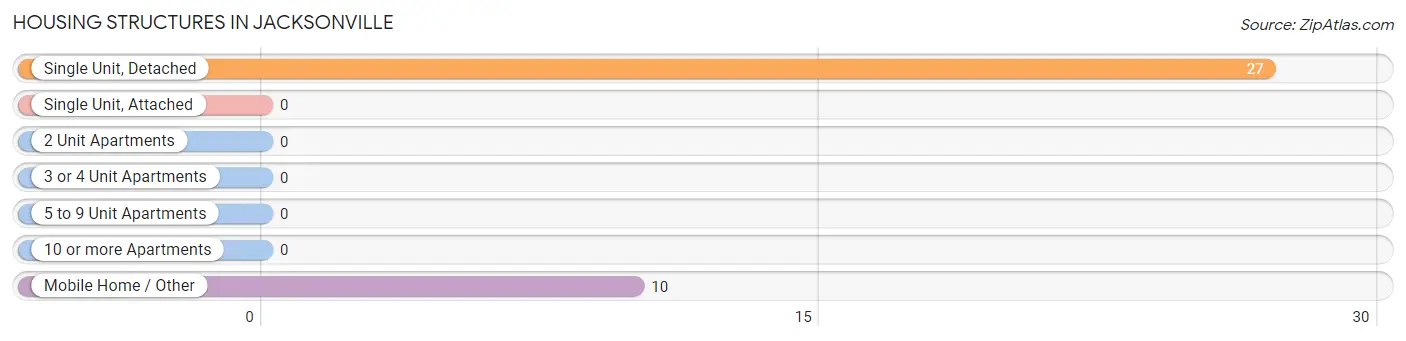
| Structure Type | # Housing Units | % Housing Units |
| Single Unit, Detached | 27 | 73.0% |
| Single Unit, Attached | 0 | 0.0% |
| 2 Unit Apartments | 0 | 0.0% |
| 3 or 4 Unit Apartments | 0 | 0.0% |
| 5 to 9 Unit Apartments | 0 | 0.0% |
| 10 or more Apartments | 0 | 0.0% |
| Mobile Home / Other | 10 | 27.0% |
| Total | 37 | 100.0% |
Housing Structures by Occupancy in Jacksonville
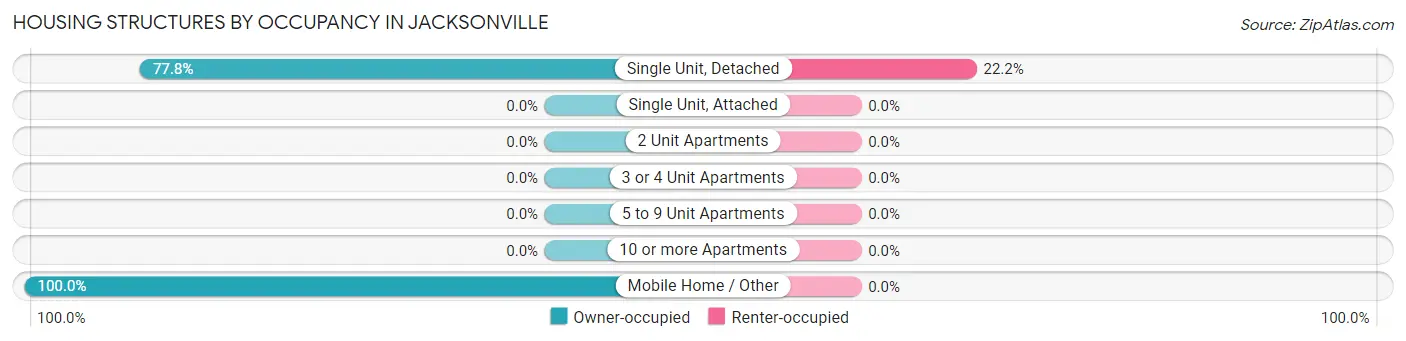
| Structure Type | Owner-occupied | Renter-occupied |
| Single Unit, Detached | 21 (77.8%) | 6 (22.2%) |
| Single Unit, Attached | 0 (0.0%) | 0 (0.0%) |
| 2 Unit Apartments | 0 (0.0%) | 0 (0.0%) |
| 3 or 4 Unit Apartments | 0 (0.0%) | 0 (0.0%) |
| 5 to 9 Unit Apartments | 0 (0.0%) | 0 (0.0%) |
| 10 or more Apartments | 0 (0.0%) | 0 (0.0%) |
| Mobile Home / Other | 10 (100.0%) | 0 (0.0%) |
| Total | 31 (83.8%) | 6 (16.2%) |
Housing Structures by Number of Rooms in Jacksonville
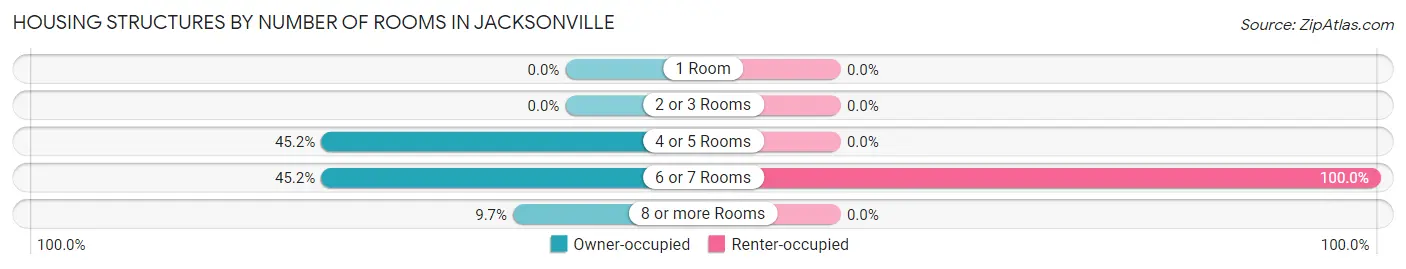
| Number of Rooms | Owner-occupied | Renter-occupied |
| 1 Room | 0 (0.0%) | 0 (0.0%) |
| 2 or 3 Rooms | 0 (0.0%) | 0 (0.0%) |
| 4 or 5 Rooms | 14 (45.2%) | 0 (0.0%) |
| 6 or 7 Rooms | 14 (45.2%) | 6 (100.0%) |
| 8 or more Rooms | 3 (9.7%) | 0 (0.0%) |
| Total | 31 (100.0%) | 6 (100.0%) |
Housing Structure by Heating Type in Jacksonville
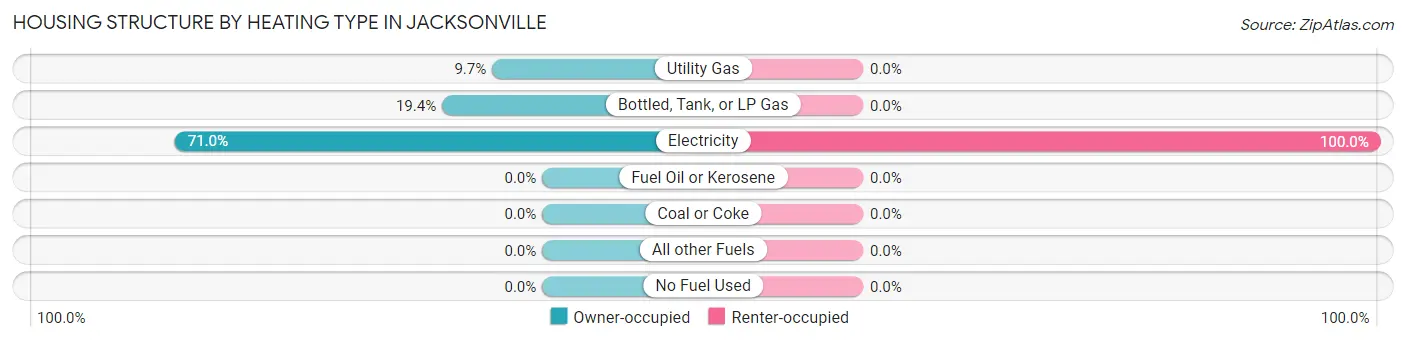
| Heating Type | Owner-occupied | Renter-occupied |
| Utility Gas | 3 (9.7%) | 0 (0.0%) |
| Bottled, Tank, or LP Gas | 6 (19.4%) | 0 (0.0%) |
| Electricity | 22 (71.0%) | 6 (100.0%) |
| Fuel Oil or Kerosene | 0 (0.0%) | 0 (0.0%) |
| Coal or Coke | 0 (0.0%) | 0 (0.0%) |
| All other Fuels | 0 (0.0%) | 0 (0.0%) |
| No Fuel Used | 0 (0.0%) | 0 (0.0%) |
| Total | 31 (100.0%) | 6 (100.0%) |
Household Vehicle Usage in Jacksonville
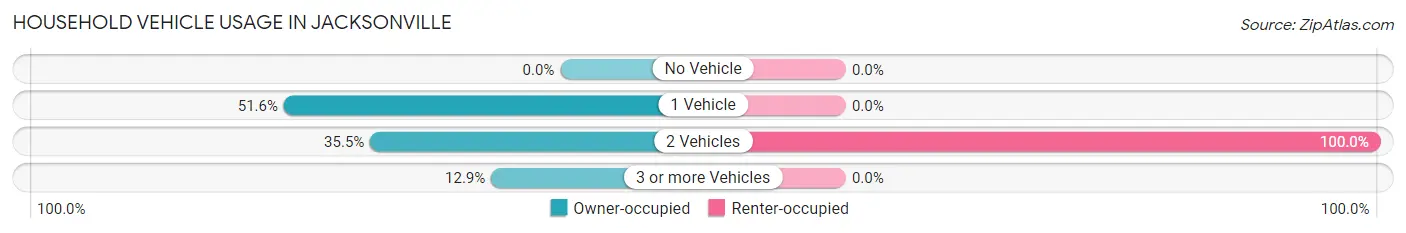
| Vehicles per Household | Owner-occupied | Renter-occupied |
| No Vehicle | 0 (0.0%) | 0 (0.0%) |
| 1 Vehicle | 16 (51.6%) | 0 (0.0%) |
| 2 Vehicles | 11 (35.5%) | 6 (100.0%) |
| 3 or more Vehicles | 4 (12.9%) | 0 (0.0%) |
| Total | 31 (100.0%) | 6 (100.0%) |
Real Estate & Mortgages in Jacksonville
Real Estate and Mortgage Overview in Jacksonville
| Characteristic | Without Mortgage | With Mortgage |
| Housing Units | 17 | 14 |
| Median Property Value | - | - |
| Median Household Income | $43,125 | $0 |
| Monthly Housing Costs | $431 | $0 |
| Real Estate Taxes | $600 | $0 |
Property Value by Mortgage Status in Jacksonville
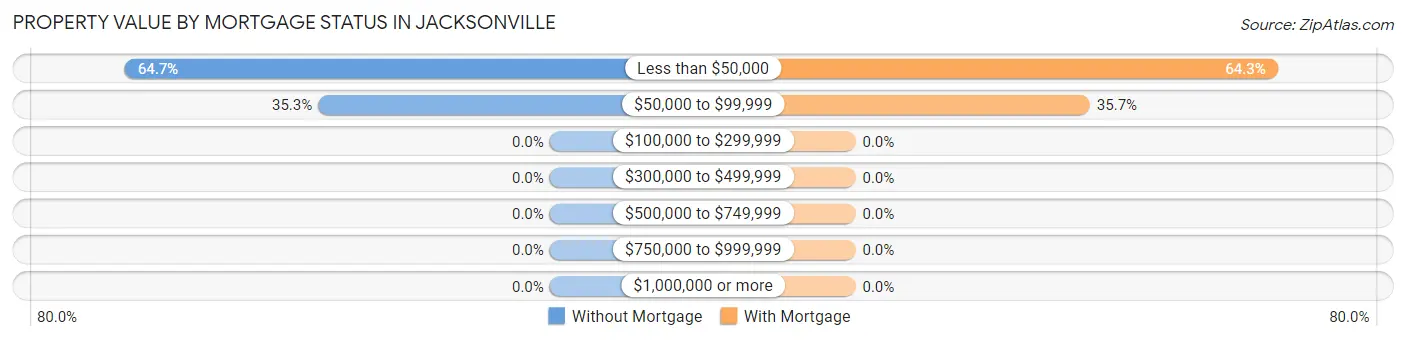
| Property Value | Without Mortgage | With Mortgage |
| Less than $50,000 | 11 (64.7%) | 9 (64.3%) |
| $50,000 to $99,999 | 6 (35.3%) | 5 (35.7%) |
| $100,000 to $299,999 | 0 (0.0%) | 0 (0.0%) |
| $300,000 to $499,999 | 0 (0.0%) | 0 (0.0%) |
| $500,000 to $749,999 | 0 (0.0%) | 0 (0.0%) |
| $750,000 to $999,999 | 0 (0.0%) | 0 (0.0%) |
| $1,000,000 or more | 0 (0.0%) | 0 (0.0%) |
| Total | 17 (100.0%) | 14 (100.0%) |
Household Income by Mortgage Status in Jacksonville
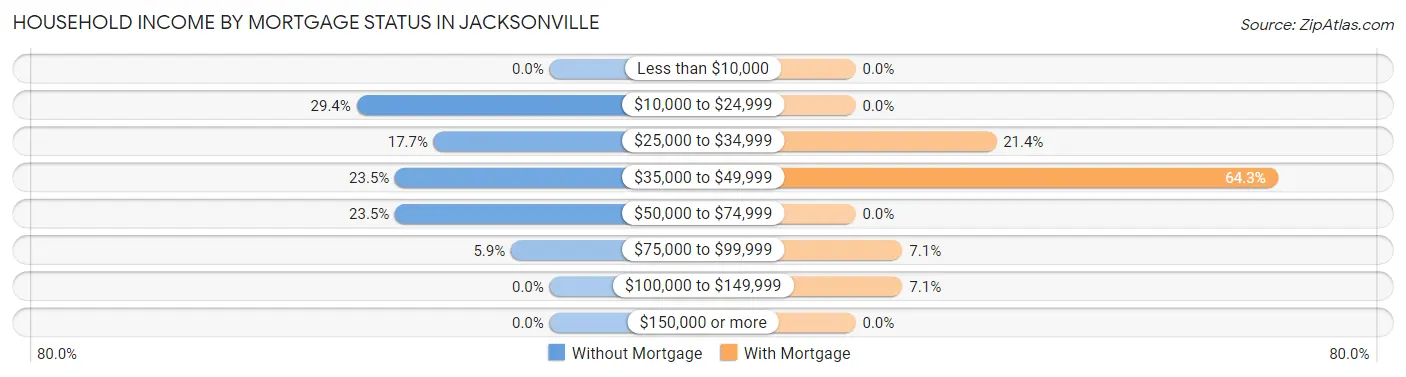
| Household Income | Without Mortgage | With Mortgage |
| Less than $10,000 | 0 (0.0%) | 0 (0.0%) |
| $10,000 to $24,999 | 5 (29.4%) | 0 (0.0%) |
| $25,000 to $34,999 | 3 (17.6%) | 3 (21.4%) |
| $35,000 to $49,999 | 4 (23.5%) | 9 (64.3%) |
| $50,000 to $74,999 | 4 (23.5%) | 0 (0.0%) |
| $75,000 to $99,999 | 1 (5.9%) | 1 (7.1%) |
| $100,000 to $149,999 | 0 (0.0%) | 1 (7.1%) |
| $150,000 or more | 0 (0.0%) | 0 (0.0%) |
| Total | 17 (100.0%) | 14 (100.0%) |
Property Value to Household Income Ratio in Jacksonville
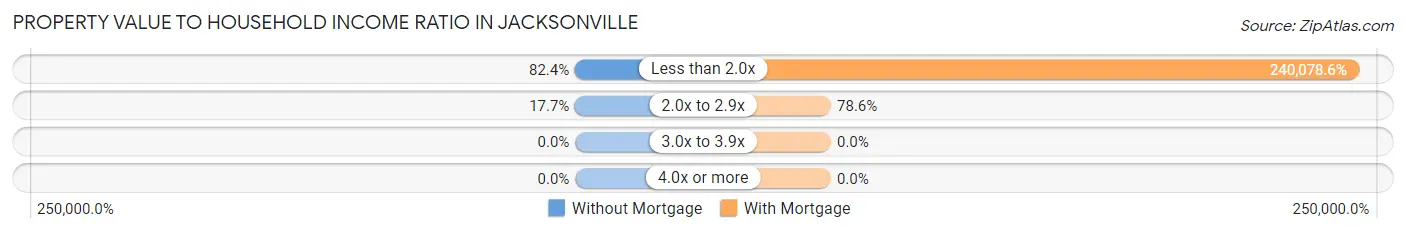
| Value-to-Income Ratio | Without Mortgage | With Mortgage |
| Less than 2.0x | 14 (82.4%) | 33,611 (240,078.6%) |
| 2.0x to 2.9x | 3 (17.6%) | 11 (78.6%) |
| 3.0x to 3.9x | 0 (0.0%) | 0 (0.0%) |
| 4.0x or more | 0 (0.0%) | 0 (0.0%) |
| Total | 17 (100.0%) | 14 (100.0%) |
Real Estate Taxes by Mortgage Status in Jacksonville
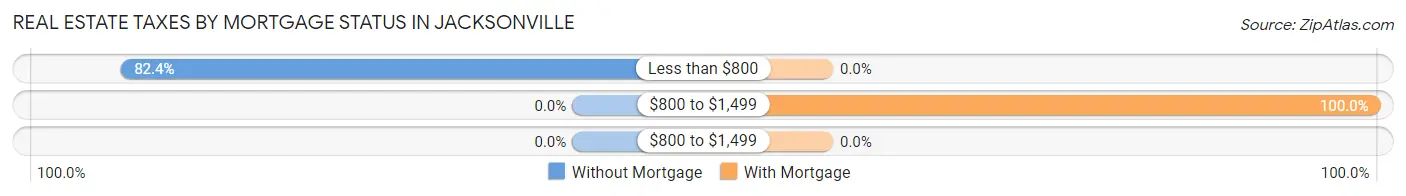
| Property Taxes | Without Mortgage | With Mortgage |
| Less than $800 | 14 (82.4%) | 0 (0.0%) |
| $800 to $1,499 | 0 (0.0%) | 14 (100.0%) |
| $800 to $1,499 | 0 (0.0%) | 0 (0.0%) |
| Total | 17 (100.0%) | 14 (100.0%) |
Health & Disability in Jacksonville
Health Insurance Coverage by Age in Jacksonville
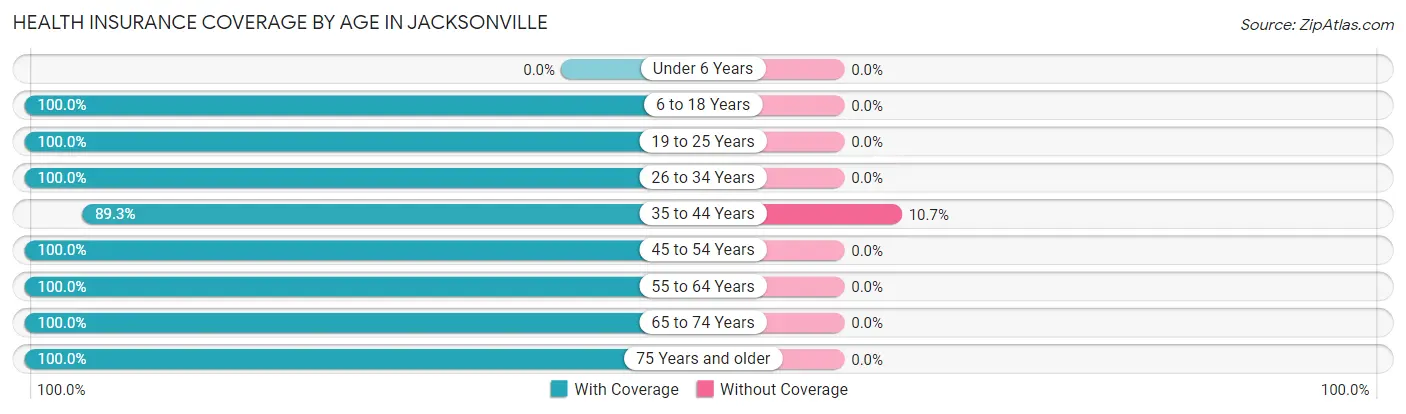
| Age Bracket | With Coverage | Without Coverage |
| Under 6 Years | 0 (0.0%) | 0 (0.0%) |
| 6 to 18 Years | 13 (100.0%) | 0 (0.0%) |
| 19 to 25 Years | 4 (100.0%) | 0 (0.0%) |
| 26 to 34 Years | 9 (100.0%) | 0 (0.0%) |
| 35 to 44 Years | 25 (89.3%) | 3 (10.7%) |
| 45 to 54 Years | 6 (100.0%) | 0 (0.0%) |
| 55 to 64 Years | 15 (100.0%) | 0 (0.0%) |
| 65 to 74 Years | 9 (100.0%) | 0 (0.0%) |
| 75 Years and older | 2 (100.0%) | 0 (0.0%) |
| Total | 83 (96.5%) | 3 (3.5%) |
Health Insurance Coverage by Citizenship Status in Jacksonville
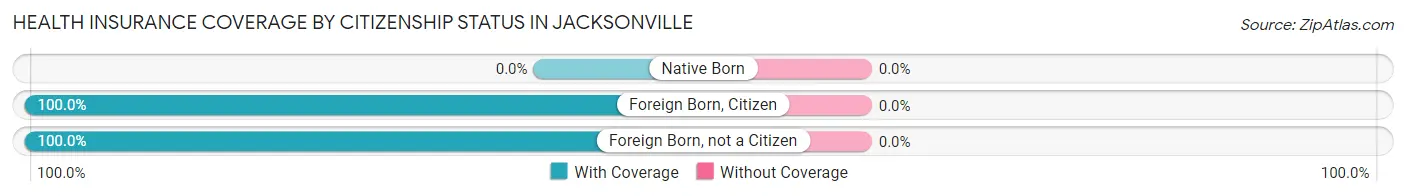
| Citizenship Status | With Coverage | Without Coverage |
| Native Born | 0 (0.0%) | 0 (0.0%) |
| Foreign Born, Citizen | 13 (100.0%) | 0 (0.0%) |
| Foreign Born, not a Citizen | 4 (100.0%) | 0 (0.0%) |
Health Insurance Coverage by Household Income in Jacksonville
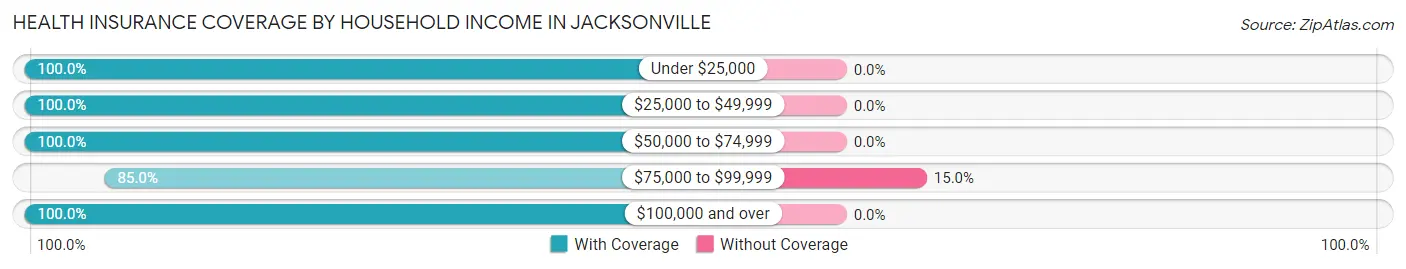
| Household Income | With Coverage | Without Coverage |
| Under $25,000 | 11 (100.0%) | 0 (0.0%) |
| $25,000 to $49,999 | 28 (100.0%) | 0 (0.0%) |
| $50,000 to $74,999 | 15 (100.0%) | 0 (0.0%) |
| $75,000 to $99,999 | 17 (85.0%) | 3 (15.0%) |
| $100,000 and over | 12 (100.0%) | 0 (0.0%) |
Public vs Private Health Insurance Coverage by Age in Jacksonville
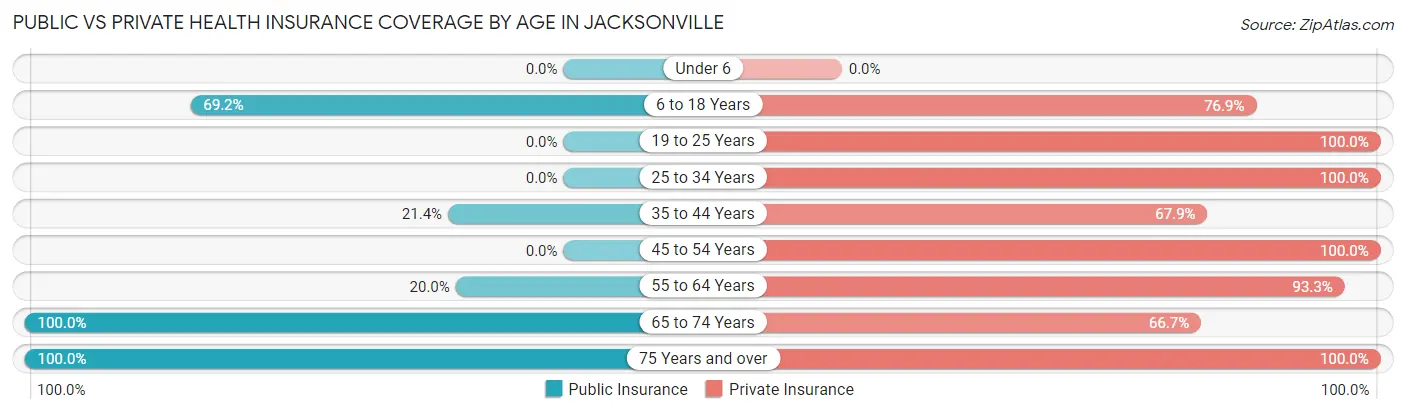
| Age Bracket | Public Insurance | Private Insurance |
| Under 6 | 0 (0.0%) | 0 (0.0%) |
| 6 to 18 Years | 9 (69.2%) | 10 (76.9%) |
| 19 to 25 Years | 0 (0.0%) | 4 (100.0%) |
| 25 to 34 Years | 0 (0.0%) | 9 (100.0%) |
| 35 to 44 Years | 6 (21.4%) | 19 (67.9%) |
| 45 to 54 Years | 0 (0.0%) | 6 (100.0%) |
| 55 to 64 Years | 3 (20.0%) | 14 (93.3%) |
| 65 to 74 Years | 9 (100.0%) | 6 (66.7%) |
| 75 Years and over | 2 (100.0%) | 2 (100.0%) |
| Total | 29 (33.7%) | 70 (81.4%) |
Disability Status by Sex by Age in Jacksonville
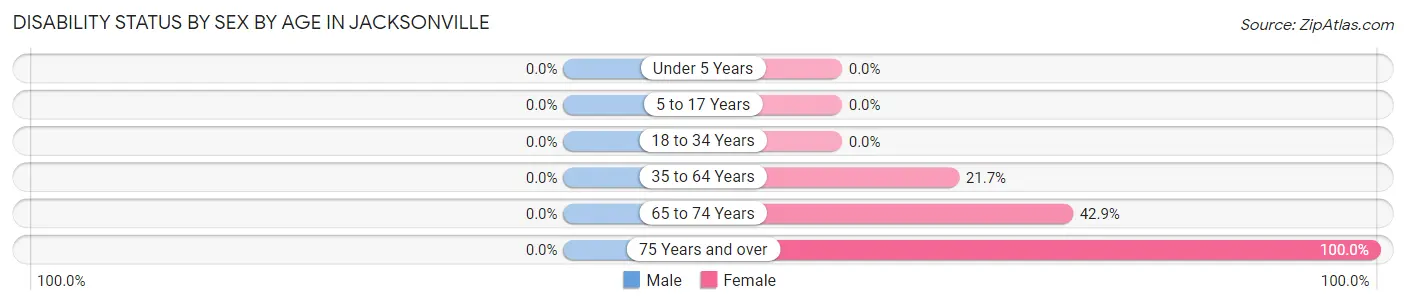
| Age Bracket | Male | Female |
| Under 5 Years | 0 (0.0%) | 0 (0.0%) |
| 5 to 17 Years | 0 (0.0%) | 0 (0.0%) |
| 18 to 34 Years | 0 (0.0%) | 0 (0.0%) |
| 35 to 64 Years | 0 (0.0%) | 5 (21.7%) |
| 65 to 74 Years | 0 (0.0%) | 3 (42.9%) |
| 75 Years and over | 0 (0.0%) | 2 (100.0%) |
Disability Class by Sex by Age in Jacksonville
Disability Class: Hearing Difficulty
| Age Bracket | Male | Female |
| Under 5 Years | 0 (0.0%) | 0 (0.0%) |
| 5 to 17 Years | 0 (0.0%) | 0 (0.0%) |
| 18 to 34 Years | 0 (0.0%) | 0 (0.0%) |
| 35 to 64 Years | 0 (0.0%) | 0 (0.0%) |
| 65 to 74 Years | 0 (0.0%) | 0 (0.0%) |
| 75 Years and over | 0 (0.0%) | 0 (0.0%) |
Disability Class: Vision Difficulty
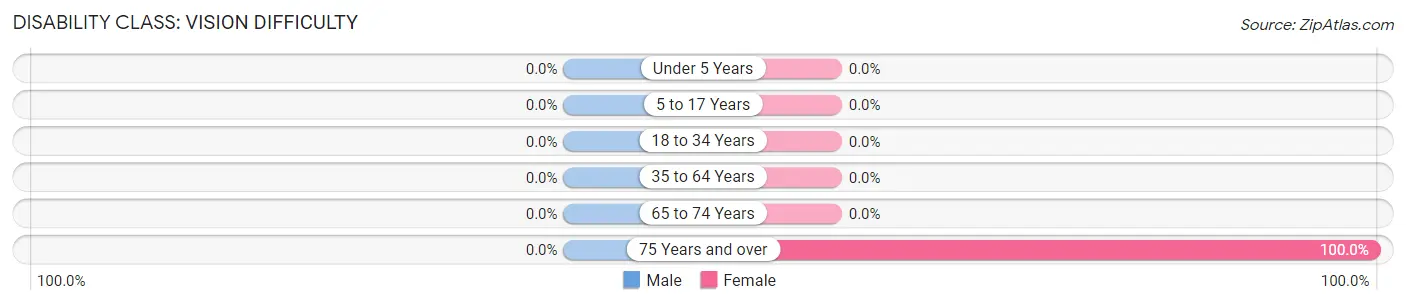
| Age Bracket | Male | Female |
| Under 5 Years | 0 (0.0%) | 0 (0.0%) |
| 5 to 17 Years | 0 (0.0%) | 0 (0.0%) |
| 18 to 34 Years | 0 (0.0%) | 0 (0.0%) |
| 35 to 64 Years | 0 (0.0%) | 0 (0.0%) |
| 65 to 74 Years | 0 (0.0%) | 0 (0.0%) |
| 75 Years and over | 0 (0.0%) | 2 (100.0%) |
Disability Class: Cognitive Difficulty
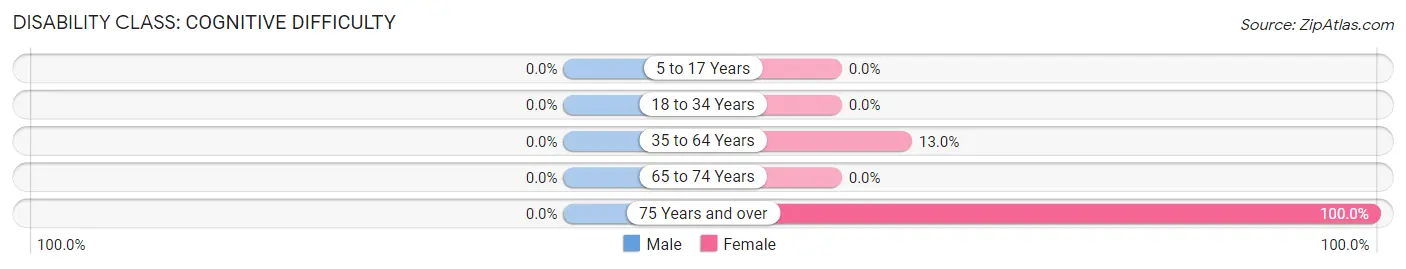
| Age Bracket | Male | Female |
| 5 to 17 Years | 0 (0.0%) | 0 (0.0%) |
| 18 to 34 Years | 0 (0.0%) | 0 (0.0%) |
| 35 to 64 Years | 0 (0.0%) | 3 (13.0%) |
| 65 to 74 Years | 0 (0.0%) | 0 (0.0%) |
| 75 Years and over | 0 (0.0%) | 2 (100.0%) |
Disability Class: Ambulatory Difficulty
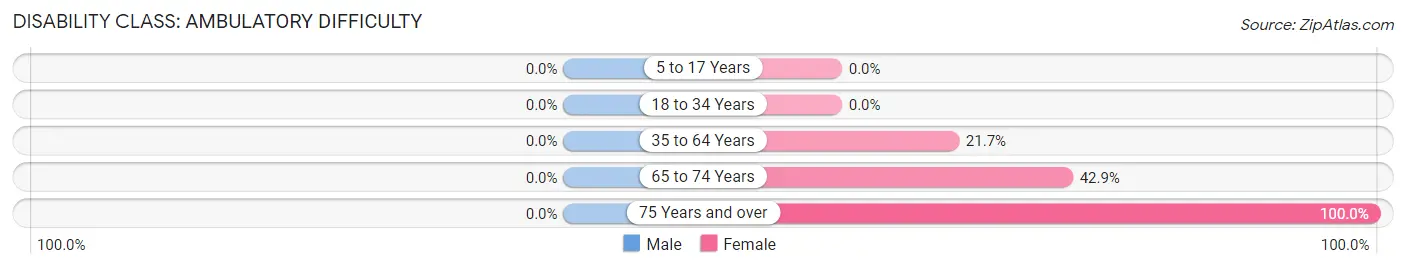
| Age Bracket | Male | Female |
| 5 to 17 Years | 0 (0.0%) | 0 (0.0%) |
| 18 to 34 Years | 0 (0.0%) | 0 (0.0%) |
| 35 to 64 Years | 0 (0.0%) | 5 (21.7%) |
| 65 to 74 Years | 0 (0.0%) | 3 (42.9%) |
| 75 Years and over | 0 (0.0%) | 2 (100.0%) |
Disability Class: Self-Care Difficulty
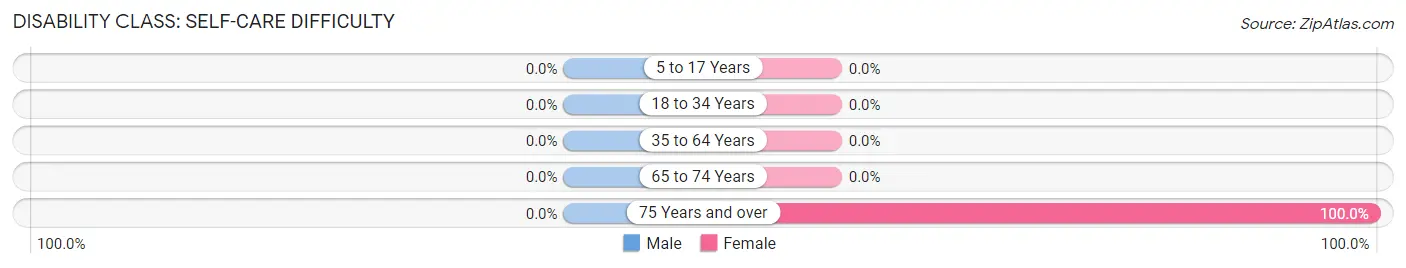
| Age Bracket | Male | Female |
| 5 to 17 Years | 0 (0.0%) | 0 (0.0%) |
| 18 to 34 Years | 0 (0.0%) | 0 (0.0%) |
| 35 to 64 Years | 0 (0.0%) | 0 (0.0%) |
| 65 to 74 Years | 0 (0.0%) | 0 (0.0%) |
| 75 Years and over | 0 (0.0%) | 2 (100.0%) |
Technology Access in Jacksonville
Computing Device Access in Jacksonville
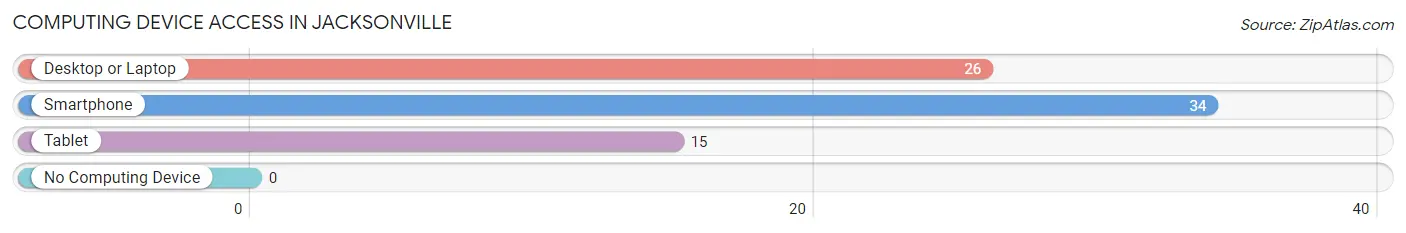
| Device Type | # Households | % Households |
| Desktop or Laptop | 26 | 70.3% |
| Smartphone | 34 | 91.9% |
| Tablet | 15 | 40.5% |
| No Computing Device | 0 | 0.0% |
| Total | 37 | 100.0% |
Internet Access in Jacksonville
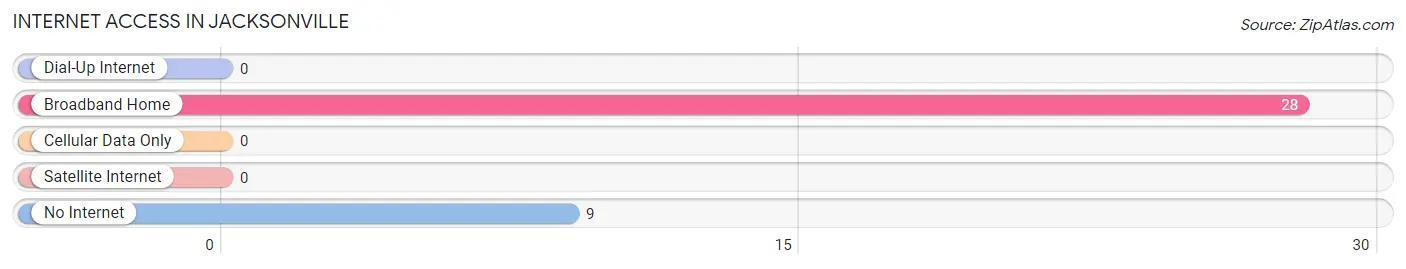
| Internet Type | # Households | % Households |
| Dial-Up Internet | 0 | 0.0% |
| Broadband Home | 28 | 75.7% |
| Cellular Data Only | 0 | 0.0% |
| Satellite Internet | 0 | 0.0% |
| No Internet | 9 | 24.3% |
| Total | 37 | 100.0% |
Jacksonville Summary
Jacksonville, Missouri is a small city located in the northeast corner of the state, in the heart of the Ozark Mountains. It is the county seat of Randolph County and is home to a population of just over 2,000 people. The city is known for its rural charm and its close proximity to the Mark Twain National Forest.
History
Jacksonville was founded in 1837 by a group of settlers from Kentucky and Tennessee. The city was named after Andrew Jackson, the seventh president of the United States. The city was incorporated in 1845 and quickly became a center of commerce and industry. The city was home to a number of businesses, including a flour mill, a sawmill, a grist mill, and a blacksmith shop.
In the late 19th century, Jacksonville was a major stop on the St. Louis-San Francisco Railway. The railroad brought a great deal of economic growth to the city, and it soon became a hub for the timber and coal industries. The city also became a popular tourist destination, as it was close to the Mark Twain National Forest.
Geography
Jacksonville is located in the northeast corner of Missouri, in the heart of the Ozark Mountains. The city is situated on the banks of the South Fork of the White River. The city is surrounded by rolling hills and lush forests, and is home to a number of parks and recreational areas.
The climate in Jacksonville is humid subtropical, with hot, humid summers and mild winters. The average annual temperature is around 60 degrees Fahrenheit, and the average annual precipitation is around 40 inches.
Economy
Jacksonville’s economy is largely based on agriculture and tourism. The city is home to a number of farms, and the surrounding area is known for its production of corn, soybeans, and hay. The city is also home to a number of manufacturing companies, including a furniture factory and a plastics plant.
Tourism is a major part of the city’s economy. The city is home to a number of attractions, including the Mark Twain National Forest, the Randolph County Historical Museum, and the Jacksonville Museum of Natural History. The city is also home to a number of festivals and events, including the annual Jacksonville Days celebration.
Demographics
As of the 2010 census, Jacksonville had a population of 2,053 people. The racial makeup of the city was 95.3% White, 1.2% African American, 0.4% Native American, 0.3% Asian, 0.1% Pacific Islander, 0.7% from other races, and 1.9% from two or more races. Hispanic or Latino of any race were 2.2% of the population.
The median household income in Jacksonville was $35,938, and the median family income was $41,250. The per capita income for the city was $17,845. About 16.2% of the population was below the poverty line.
Jacksonville is a small city with a rich history and a vibrant economy. The city is home to a number of attractions and is a popular tourist destination. The city is also home to a diverse population, with a variety of racial and ethnic backgrounds. Jacksonville is a great place to live and work, and is a great example of rural Missouri living.
Common Questions
What is Per Capita Income in Jacksonville?
Per Capita income in Jacksonville is $24,990.
What is the Median Family Income in Jacksonville?
Median Family Income in Jacksonville is $58,750.
What is the Median Household income in Jacksonville?
Median Household Income in Jacksonville is $34,583.
What is Inequality or Gini Index in Jacksonville?
Inequality or Gini Index in Jacksonville is 0.37.
What is the Total Population of Jacksonville?
Total Population of Jacksonville is 86.
What is the Total Male Population of Jacksonville?
Total Male Population of Jacksonville is 48.
What is the Total Female Population of Jacksonville?
Total Female Population of Jacksonville is 38.
What is the Ratio of Males per 100 Females in Jacksonville?
There are 126.32 Males per 100 Females in Jacksonville.
What is the Ratio of Females per 100 Males in Jacksonville?
There are 79.17 Females per 100 Males in Jacksonville.
What is the Median Population Age in Jacksonville?
Median Population Age in Jacksonville is 38.9 Years.
What is the Average Family Size in Jacksonville
Average Family Size in Jacksonville is 3.1 People.
What is the Average Household Size in Jacksonville
Average Household Size in Jacksonville is 2.3 People.
How Large is the Labor Force in Jacksonville?
There are 59 People in the Labor Forcein in Jacksonville.
What is the Percentage of People in the Labor Force in Jacksonville?
78.7% of People are in the Labor Force in Jacksonville.