Ironton, MO Map & Demographics
Ironton Map
Ironton Overview
$22,920
PER CAPITA INCOME
$63,125
AVG FAMILY INCOME
$43,606
AVG HOUSEHOLD INCOME
28.1%
WAGE / INCOME GAP [ % ]
71.9¢/ $1
WAGE / INCOME GAP [ $ ]
$9,640
FAMILY INCOME DEFICIT
0.43
INEQUALITY / GINI INDEX
1,639
TOTAL POPULATION
840
MALE POPULATION
799
FEMALE POPULATION
105.13
MALES / 100 FEMALES
95.12
FEMALES / 100 MALES
37.2
MEDIAN AGE
3.0
AVG FAMILY SIZE
2.3
AVG HOUSEHOLD SIZE
609
LABOR FORCE [ PEOPLE ]
51.8%
PERCENT IN LABOR FORCE
5.4%
UNEMPLOYMENT RATE
Ironton Zip Codes
Ironton Area Codes
Income in Ironton
Income Overview in Ironton
Per Capita Income in Ironton is $22,920, while median incomes of families and households are $63,125 and $43,606 respectively.
| Characteristic | Number | Measure |
| Per Capita Income | 1,639 | $22,920 |
| Median Family Income | 433 | $63,125 |
| Mean Family Income | 433 | $64,413 |
| Median Household Income | 703 | $43,606 |
| Mean Household Income | 703 | $54,199 |
| Income Deficit | 433 | $9,640 |
| Wage / Income Gap (%) | 1,639 | 28.06% |
| Wage / Income Gap ($) | 1,639 | 71.94¢ per $1 |
| Gini / Inequality Index | 1,639 | 0.43 |
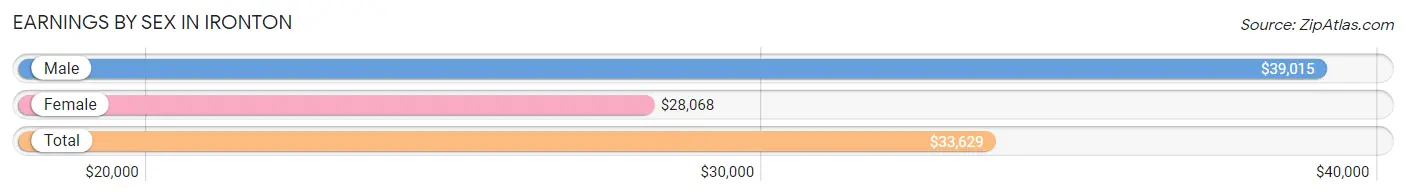
Earnings by Sex in Ironton
Average Earnings in Ironton are $33,629, $39,015 for men and $28,068 for women, a difference of 28.1%.
| Sex | Number | Average Earnings |
| Male | 322 (52.8%) | $39,015 |
| Female | 288 (47.2%) | $28,068 |
| Total | 610 (100.0%) | $33,629 |
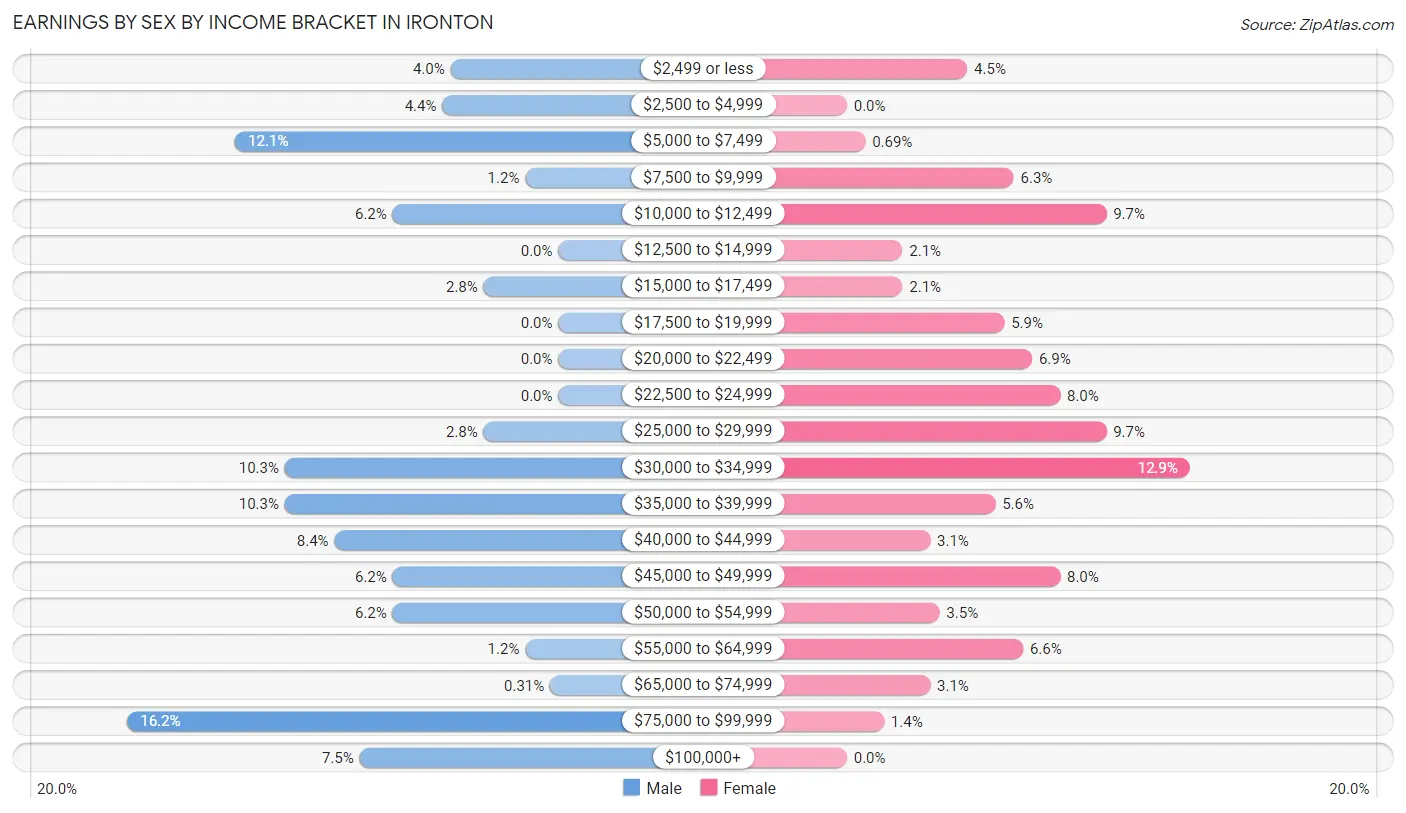
Earnings by Sex by Income Bracket in Ironton
The most common earnings brackets in Ironton are $75,000 to $99,999 for men (52 | 16.2%) and $30,000 to $34,999 for women (37 | 12.9%).
| Income | Male | Female |
| $2,499 or less | 13 (4.0%) | 13 (4.5%) |
| $2,500 to $4,999 | 14 (4.3%) | 0 (0.0%) |
| $5,000 to $7,499 | 39 (12.1%) | 2 (0.7%) |
| $7,500 to $9,999 | 4 (1.2%) | 18 (6.2%) |
| $10,000 to $12,499 | 20 (6.2%) | 28 (9.7%) |
| $12,500 to $14,999 | 0 (0.0%) | 6 (2.1%) |
| $15,000 to $17,499 | 9 (2.8%) | 6 (2.1%) |
| $17,500 to $19,999 | 0 (0.0%) | 17 (5.9%) |
| $20,000 to $22,499 | 0 (0.0%) | 20 (6.9%) |
| $22,500 to $24,999 | 0 (0.0%) | 23 (8.0%) |
| $25,000 to $29,999 | 9 (2.8%) | 28 (9.7%) |
| $30,000 to $34,999 | 33 (10.2%) | 37 (12.9%) |
| $35,000 to $39,999 | 33 (10.2%) | 16 (5.6%) |
| $40,000 to $44,999 | 27 (8.4%) | 9 (3.1%) |
| $45,000 to $49,999 | 20 (6.2%) | 23 (8.0%) |
| $50,000 to $54,999 | 20 (6.2%) | 10 (3.5%) |
| $55,000 to $64,999 | 4 (1.2%) | 19 (6.6%) |
| $65,000 to $74,999 | 1 (0.3%) | 9 (3.1%) |
| $75,000 to $99,999 | 52 (16.2%) | 4 (1.4%) |
| $100,000+ | 24 (7.4%) | 0 (0.0%) |
| Total | 322 (100.0%) | 288 (100.0%) |
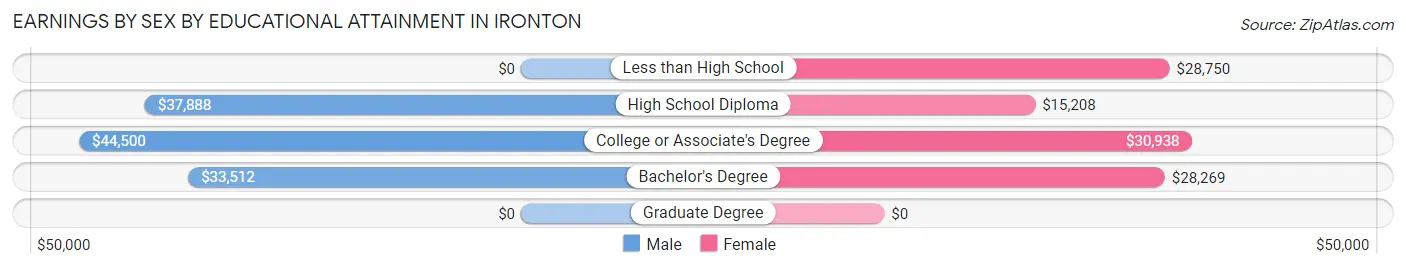
Earnings by Sex by Educational Attainment in Ironton
Average earnings in Ironton are $39,138 for men and $27,670 for women, a difference of 29.3%. Men with an educational attainment of college or associate's degree enjoy the highest average annual earnings of $44,500, while those with bachelor's degree education earn the least with $33,512. Women with an educational attainment of college or associate's degree earn the most with the average annual earnings of $30,938, while those with high school diploma education have the smallest earnings of $15,208.
| Educational Attainment | Male Income | Female Income |
| Less than High School | - | - |
| High School Diploma | $37,888 | $15,208 |
| College or Associate's Degree | $44,500 | $30,938 |
| Bachelor's Degree | $33,512 | $28,269 |
| Graduate Degree | - | - |
| Total | $39,138 | $27,670 |
Family Income in Ironton
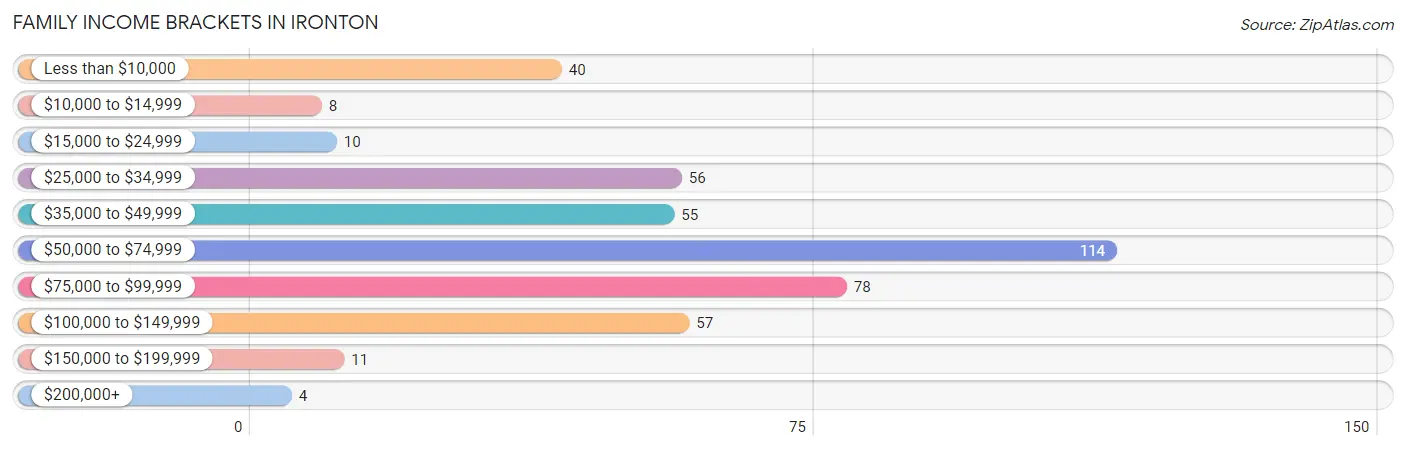
Family Income Brackets in Ironton
According to the Ironton family income data, there are 114 families falling into the $50,000 to $74,999 income range, which is the most common income bracket and makes up 26.3% of all families. Conversely, the $200,000+ income bracket is the least frequent group with only 4 families (0.9%) belonging to this category.
| Income Bracket | # Families | % Families |
| Less than $10,000 | 40 | 9.2% |
| $10,000 to $14,999 | 8 | 1.8% |
| $15,000 to $24,999 | 10 | 2.3% |
| $25,000 to $34,999 | 56 | 12.9% |
| $35,000 to $49,999 | 55 | 12.7% |
| $50,000 to $74,999 | 114 | 26.3% |
| $75,000 to $99,999 | 78 | 18.0% |
| $100,000 to $149,999 | 57 | 13.2% |
| $150,000 to $199,999 | 11 | 2.5% |
| $200,000+ | 4 | 0.9% |
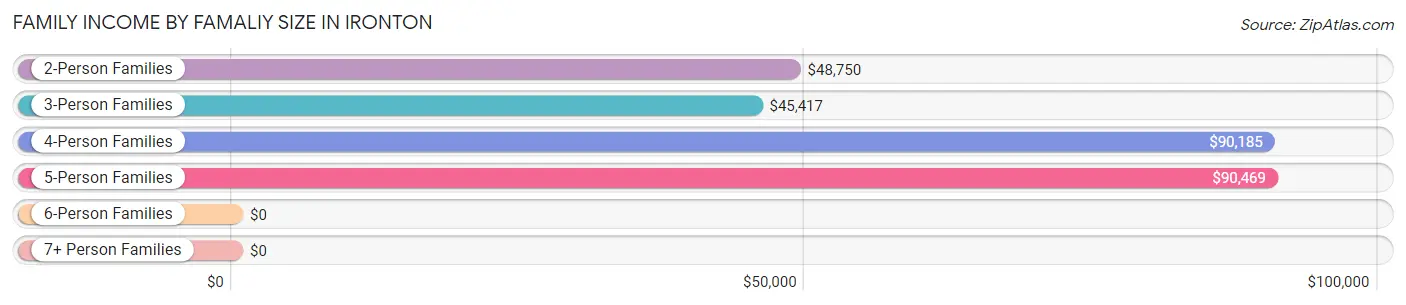
Family Income by Famaliy Size in Ironton
5-person families (53 | 12.2%) account for the highest median family income in Ironton with $90,469 per family, while 2-person families (190 | 43.9%) have the highest median income of $24,375 per family member.
| Income Bracket | # Families | Median Income |
| 2-Person Families | 190 (43.9%) | $48,750 |
| 3-Person Families | 56 (12.9%) | $45,417 |
| 4-Person Families | 100 (23.1%) | $90,185 |
| 5-Person Families | 53 (12.2%) | $90,469 |
| 6-Person Families | 24 (5.5%) | $0 |
| 7+ Person Families | 10 (2.3%) | $0 |
| Total | 433 (100.0%) | $63,125 |
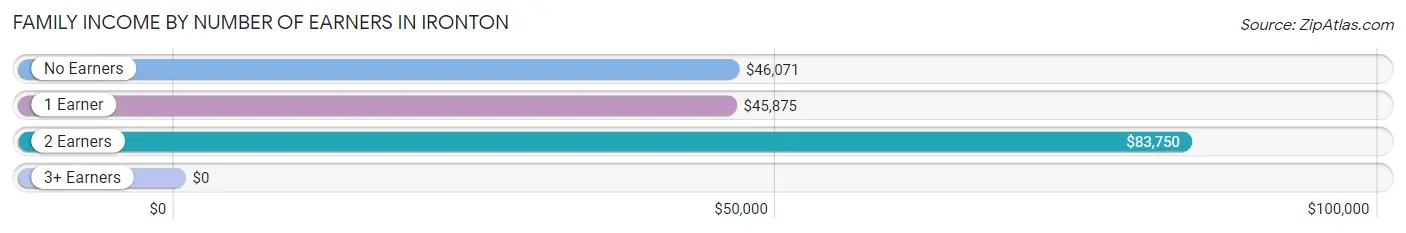
Family Income by Number of Earners in Ironton
| Number of Earners | # Families | Median Income |
| No Earners | 64 (14.8%) | $46,071 |
| 1 Earner | 195 (45.0%) | $45,875 |
| 2 Earners | 168 (38.8%) | $83,750 |
| 3+ Earners | 6 (1.4%) | $0 |
| Total | 433 (100.0%) | $63,125 |
Household Income in Ironton
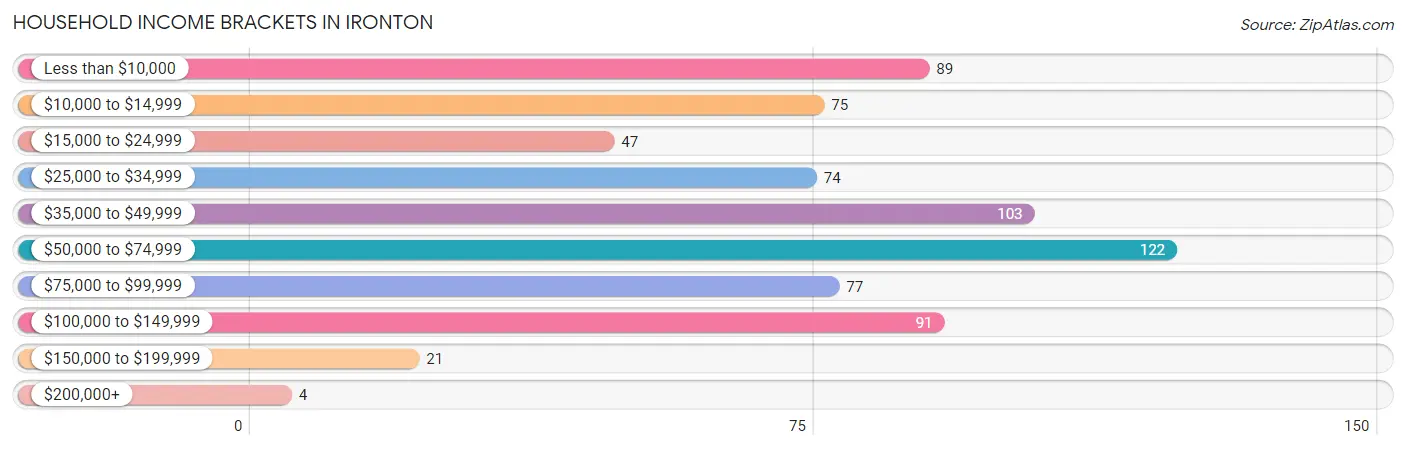
Household Income Brackets in Ironton
With 122 households falling in the category, the $50,000 to $74,999 income range is the most frequent in Ironton, accounting for 17.3% of all households. In contrast, only 4 households (0.6%) fall into the $200,000+ income bracket, making it the least populous group.
| Income Bracket | # Households | % Households |
| Less than $10,000 | 89 | 12.7% |
| $10,000 to $14,999 | 75 | 10.7% |
| $15,000 to $24,999 | 47 | 6.7% |
| $25,000 to $34,999 | 74 | 10.5% |
| $35,000 to $49,999 | 103 | 14.7% |
| $50,000 to $74,999 | 122 | 17.4% |
| $75,000 to $99,999 | 77 | 11.0% |
| $100,000 to $149,999 | 91 | 12.9% |
| $150,000 to $199,999 | 21 | 3.0% |
| $200,000+ | 4 | 0.6% |
Household Income by Householder Age in Ironton
The median household income in Ironton is $43,606, with the highest median household income of $54,813 found in the 25 to 44 years age bracket for the primary householder. A total of 235 households (33.4%) fall into this category. Meanwhile, the 15 to 24 years age bracket for the primary householder has the lowest median household income of $0, with 43 households (6.1%) in this group.
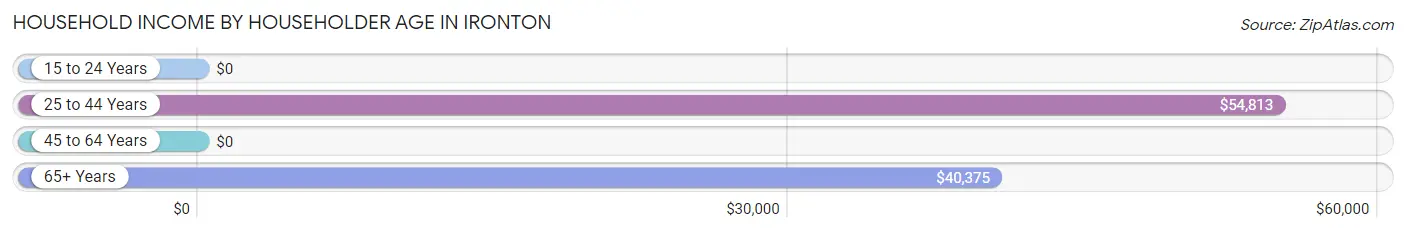
| Income Bracket | # Households | Median Income |
| 15 to 24 Years | 43 (6.1%) | $0 |
| 25 to 44 Years | 235 (33.4%) | $54,813 |
| 45 to 64 Years | 228 (32.4%) | $0 |
| 65+ Years | 197 (28.0%) | $40,375 |
| Total | 703 (100.0%) | $43,606 |
Poverty in Ironton
Income Below Poverty by Sex and Age in Ironton
With 23.3% poverty level for males and 13.8% for females among the residents of Ironton, 55 to 64 year old males and 45 to 54 year old females are the most vulnerable to poverty, with 72 males (62.6%) and 23 females (59.0%) in their respective age groups living below the poverty level.
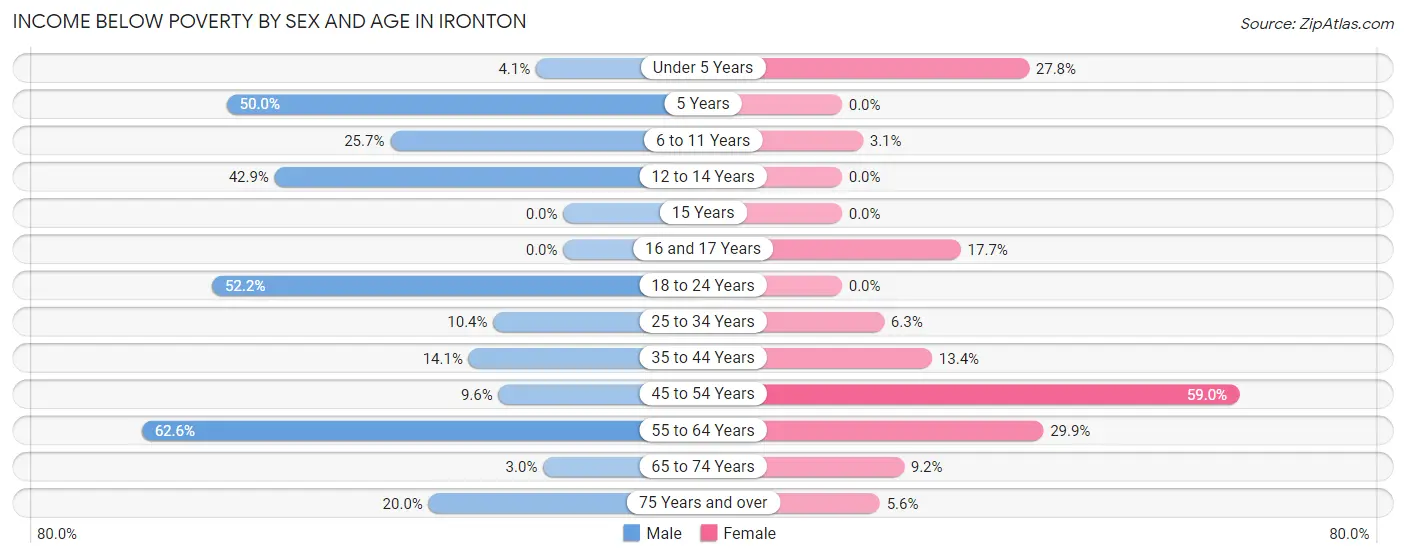
| Age Bracket | Male | Female |
| Under 5 Years | 3 (4.1%) | 10 (27.8%) |
| 5 Years | 5 (50.0%) | 0 (0.0%) |
| 6 to 11 Years | 27 (25.7%) | 2 (3.1%) |
| 12 to 14 Years | 9 (42.9%) | 0 (0.0%) |
| 15 Years | 0 (0.0%) | 0 (0.0%) |
| 16 and 17 Years | 0 (0.0%) | 3 (17.6%) |
| 18 to 24 Years | 24 (52.2%) | 0 (0.0%) |
| 25 to 34 Years | 8 (10.4%) | 6 (6.2%) |
| 35 to 44 Years | 17 (14.1%) | 19 (13.4%) |
| 45 to 54 Years | 5 (9.6%) | 23 (59.0%) |
| 55 to 64 Years | 72 (62.6%) | 35 (29.9%) |
| 65 to 74 Years | 2 (3.0%) | 8 (9.2%) |
| 75 Years and over | 11 (20.0%) | 4 (5.6%) |
| Total | 183 (23.3%) | 110 (13.8%) |
Income Above Poverty by Sex and Age in Ironton
According to the poverty statistics in Ironton, males aged 15 years and females aged 5 years are the age groups that are most secure financially, with 100.0% of males and 100.0% of females in these age groups living above the poverty line.
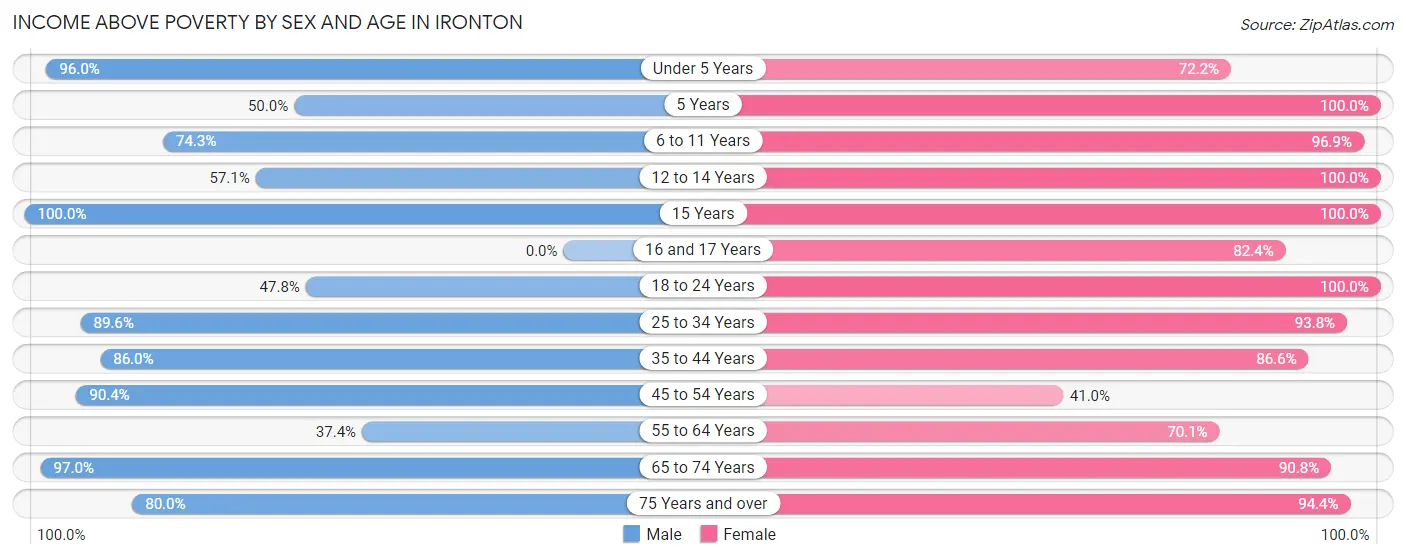
| Age Bracket | Male | Female |
| Under 5 Years | 71 (96.0%) | 26 (72.2%) |
| 5 Years | 5 (50.0%) | 19 (100.0%) |
| 6 to 11 Years | 78 (74.3%) | 62 (96.9%) |
| 12 to 14 Years | 12 (57.1%) | 70 (100.0%) |
| 15 Years | 41 (100.0%) | 18 (100.0%) |
| 16 and 17 Years | 0 (0.0%) | 14 (82.4%) |
| 18 to 24 Years | 22 (47.8%) | 23 (100.0%) |
| 25 to 34 Years | 69 (89.6%) | 90 (93.8%) |
| 35 to 44 Years | 104 (86.0%) | 123 (86.6%) |
| 45 to 54 Years | 47 (90.4%) | 16 (41.0%) |
| 55 to 64 Years | 43 (37.4%) | 82 (70.1%) |
| 65 to 74 Years | 65 (97.0%) | 79 (90.8%) |
| 75 Years and over | 44 (80.0%) | 67 (94.4%) |
| Total | 601 (76.7%) | 689 (86.2%) |
Income Below Poverty Among Married-Couple Families in Ironton
The poverty statistics for married-couple families in Ironton show that 16.9% or 47 of the total 278 families live below the poverty line. Families with 5 or more children have the highest poverty rate of 70.0%, comprising of 7 families. On the other hand, families with 3 or 4 children have the lowest poverty rate of 0.0%, which includes 0 families.
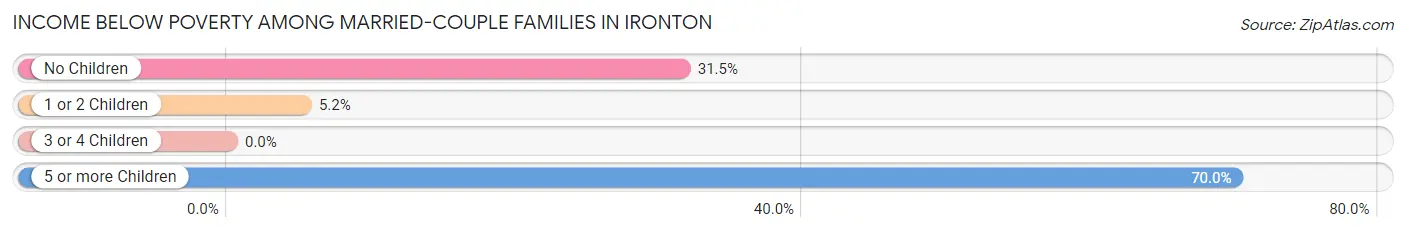
| Children | Above Poverty | Below Poverty |
| No Children | 76 (68.5%) | 35 (31.5%) |
| 1 or 2 Children | 92 (94.9%) | 5 (5.1%) |
| 3 or 4 Children | 60 (100.0%) | 0 (0.0%) |
| 5 or more Children | 3 (30.0%) | 7 (70.0%) |
| Total | 231 (83.1%) | 47 (16.9%) |
Income Below Poverty Among Single-Parent Households in Ironton
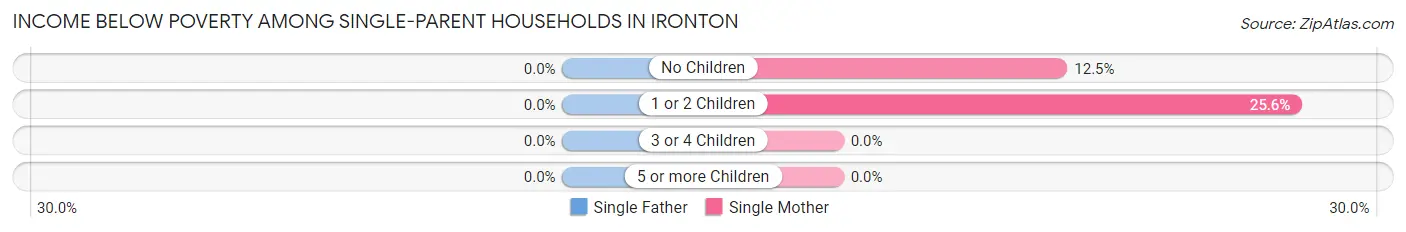
| Children | Single Father | Single Mother |
| No Children | 0 (0.0%) | 4 (12.5%) |
| 1 or 2 Children | 0 (0.0%) | 21 (25.6%) |
| 3 or 4 Children | 0 (0.0%) | 0 (0.0%) |
| 5 or more Children | 0 (0.0%) | 0 (0.0%) |
| Total | 0 (0.0%) | 25 (21.9%) |
Income Below Poverty Among Married-Couple vs Single-Parent Households in Ironton
The poverty data for Ironton shows that 47 of the married-couple family households (16.9%) and 25 of the single-parent households (16.1%) are living below the poverty level. Within the married-couple family households, those with 5 or more children have the highest poverty rate, with 7 households (70.0%) falling below the poverty line. Among the single-parent households, those with 1 or 2 children have the highest poverty rate, with 21 household (23.9%) living below poverty.
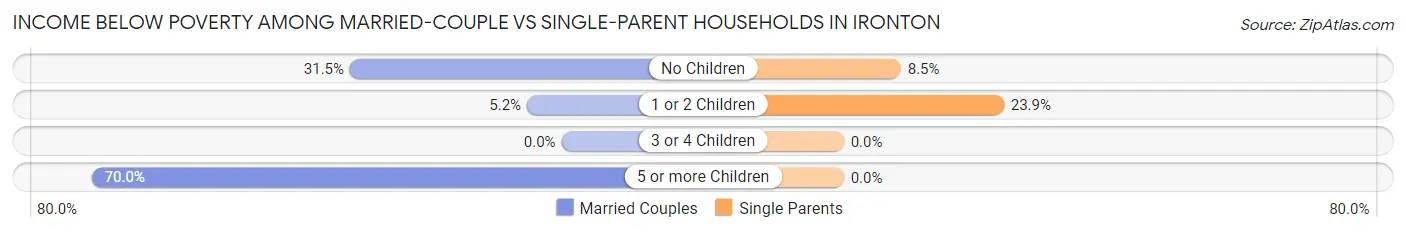
| Children | Married-Couple Families | Single-Parent Households |
| No Children | 35 (31.5%) | 4 (8.5%) |
| 1 or 2 Children | 5 (5.1%) | 21 (23.9%) |
| 3 or 4 Children | 0 (0.0%) | 0 (0.0%) |
| 5 or more Children | 7 (70.0%) | 0 (0.0%) |
| Total | 47 (16.9%) | 25 (16.1%) |
Race in Ironton
The most populous races in Ironton are White / Caucasian (1,540 | 94.0%), Two or more Races (57 | 3.5%), and Hispanic or Latino (34 | 2.1%).
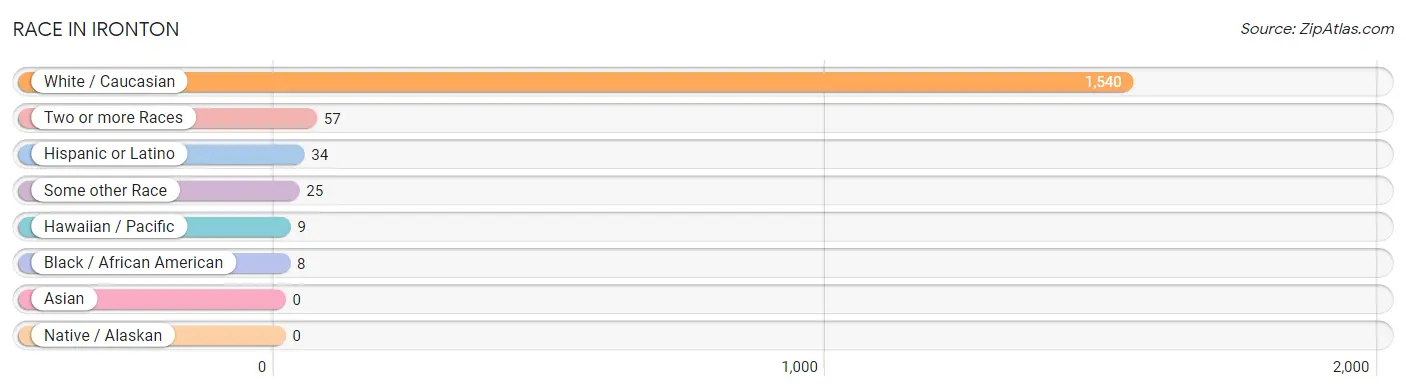
| Race | # Population | % Population |
| Asian | 0 | 0.0% |
| Black / African American | 8 | 0.5% |
| Hawaiian / Pacific | 9 | 0.5% |
| Hispanic or Latino | 34 | 2.1% |
| Native / Alaskan | 0 | 0.0% |
| White / Caucasian | 1,540 | 94.0% |
| Two or more Races | 57 | 3.5% |
| Some other Race | 25 | 1.5% |
| Total | 1,639 | 100.0% |
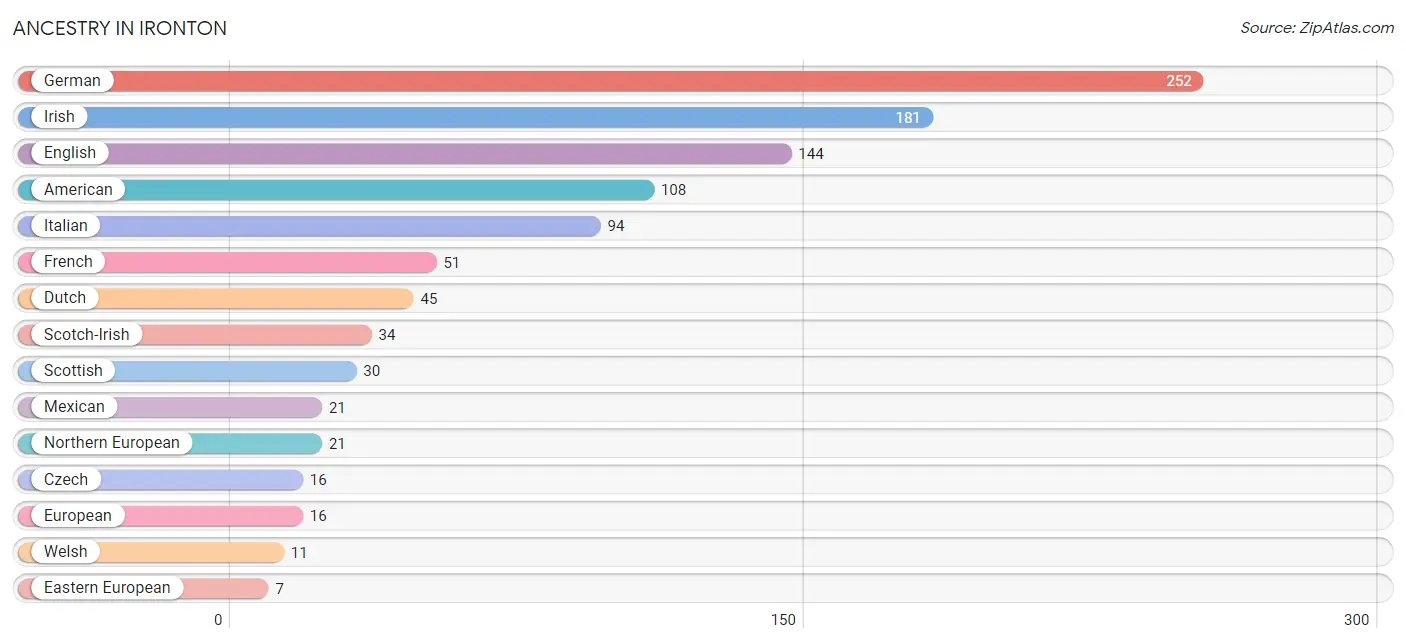
Ancestry in Ironton
The most populous ancestries reported in Ironton are German (252 | 15.4%), Irish (181 | 11.0%), English (144 | 8.8%), American (108 | 6.6%), and Italian (94 | 5.7%), together accounting for 47.5% of all Ironton residents.
| Ancestry | # Population | % Population |
| American | 108 | 6.6% |
| Blackfeet | 2 | 0.1% |
| Cherokee | 4 | 0.2% |
| Choctaw | 3 | 0.2% |
| Czech | 16 | 1.0% |
| Danish | 5 | 0.3% |
| Dutch | 45 | 2.8% |
| Eastern European | 7 | 0.4% |
| English | 144 | 8.8% |
| European | 16 | 1.0% |
| Finnish | 5 | 0.3% |
| French | 51 | 3.1% |
| French Canadian | 4 | 0.2% |
| German | 252 | 15.4% |
| Greek | 4 | 0.2% |
| Irish | 181 | 11.0% |
| Italian | 94 | 5.7% |
| Mexican | 21 | 1.3% |
| Northern European | 21 | 1.3% |
| Norwegian | 2 | 0.1% |
| Polish | 1 | 0.1% |
| Portuguese | 4 | 0.2% |
| Puerto Rican | 5 | 0.3% |
| Scandinavian | 1 | 0.1% |
| Scotch-Irish | 34 | 2.1% |
| Scottish | 30 | 1.8% |
| Welsh | 11 | 0.7% | View All 27 Rows |
Immigrants in Ironton
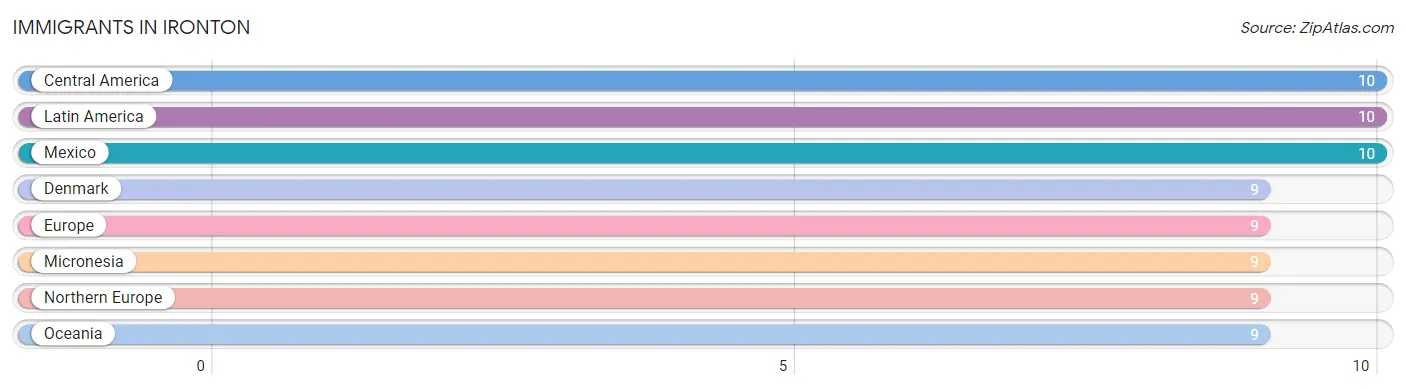
The most numerous immigrant groups reported in Ironton came from Central America (10 | 0.6%), Latin America (10 | 0.6%), Mexico (10 | 0.6%), Denmark (9 | 0.5%), and Europe (9 | 0.5%), together accounting for 2.9% of all Ironton residents.
| Immigration Origin | # Population | % Population |
| Central America | 10 | 0.6% |
| Denmark | 9 | 0.5% |
| Europe | 9 | 0.5% |
| Latin America | 10 | 0.6% |
| Mexico | 10 | 0.6% |
| Micronesia | 9 | 0.5% |
| Northern Europe | 9 | 0.5% |
| Oceania | 9 | 0.5% | View All 8 Rows |
Sex and Age in Ironton
Sex and Age in Ironton
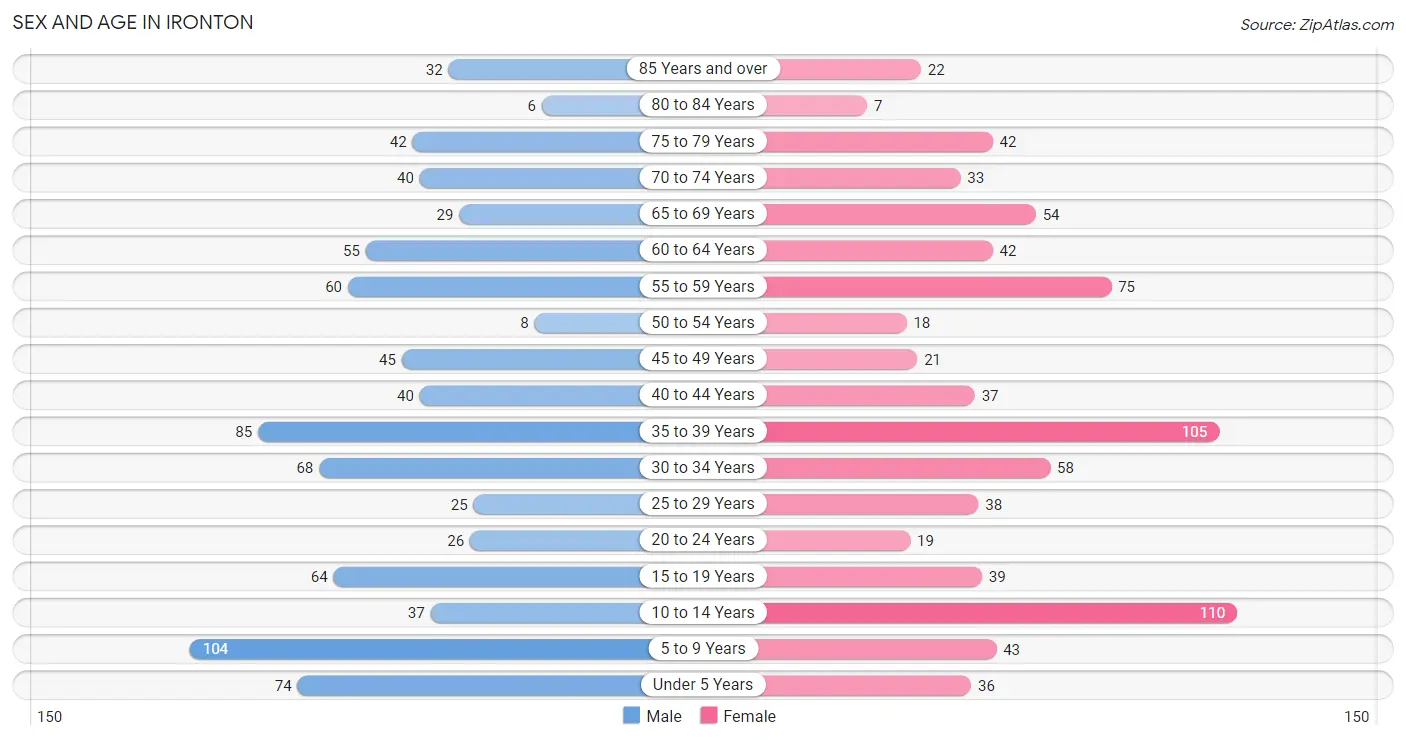
The most populous age groups in Ironton are 5 to 9 Years (104 | 12.4%) for men and 10 to 14 Years (110 | 13.8%) for women.
| Age Bracket | Male | Female |
| Under 5 Years | 74 (8.8%) | 36 (4.5%) |
| 5 to 9 Years | 104 (12.4%) | 43 (5.4%) |
| 10 to 14 Years | 37 (4.4%) | 110 (13.8%) |
| 15 to 19 Years | 64 (7.6%) | 39 (4.9%) |
| 20 to 24 Years | 26 (3.1%) | 19 (2.4%) |
| 25 to 29 Years | 25 (3.0%) | 38 (4.8%) |
| 30 to 34 Years | 68 (8.1%) | 58 (7.3%) |
| 35 to 39 Years | 85 (10.1%) | 105 (13.1%) |
| 40 to 44 Years | 40 (4.8%) | 37 (4.6%) |
| 45 to 49 Years | 45 (5.4%) | 21 (2.6%) |
| 50 to 54 Years | 8 (0.9%) | 18 (2.2%) |
| 55 to 59 Years | 60 (7.1%) | 75 (9.4%) |
| 60 to 64 Years | 55 (6.6%) | 42 (5.3%) |
| 65 to 69 Years | 29 (3.5%) | 54 (6.8%) |
| 70 to 74 Years | 40 (4.8%) | 33 (4.1%) |
| 75 to 79 Years | 42 (5.0%) | 42 (5.3%) |
| 80 to 84 Years | 6 (0.7%) | 7 (0.9%) |
| 85 Years and over | 32 (3.8%) | 22 (2.8%) |
| Total | 840 (100.0%) | 799 (100.0%) |
Families and Households in Ironton
Median Family Size in Ironton
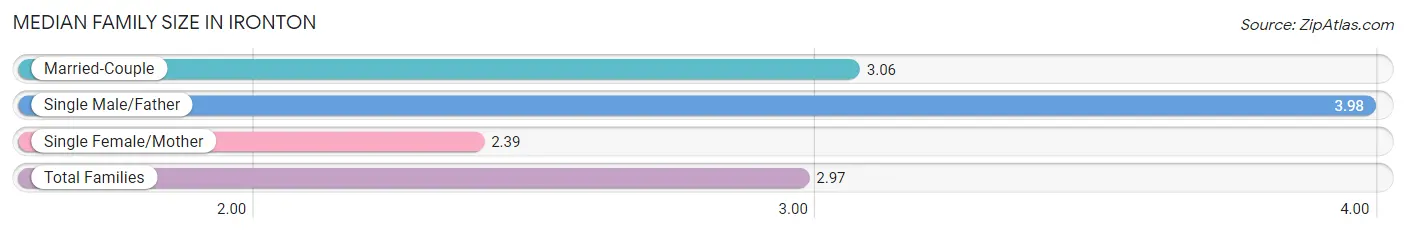
The median family size in Ironton is 2.97 persons per family, with single male/father families (41 | 9.5%) accounting for the largest median family size of 3.98 persons per family. On the other hand, single female/mother families (114 | 26.3%) represent the smallest median family size with 2.39 persons per family.
| Family Type | # Families | Family Size |
| Married-Couple | 278 (64.2%) | 3.06 |
| Single Male/Father | 41 (9.5%) | 3.98 |
| Single Female/Mother | 114 (26.3%) | 2.39 |
| Total Families | 433 (100.0%) | 2.97 |
Median Household Size in Ironton
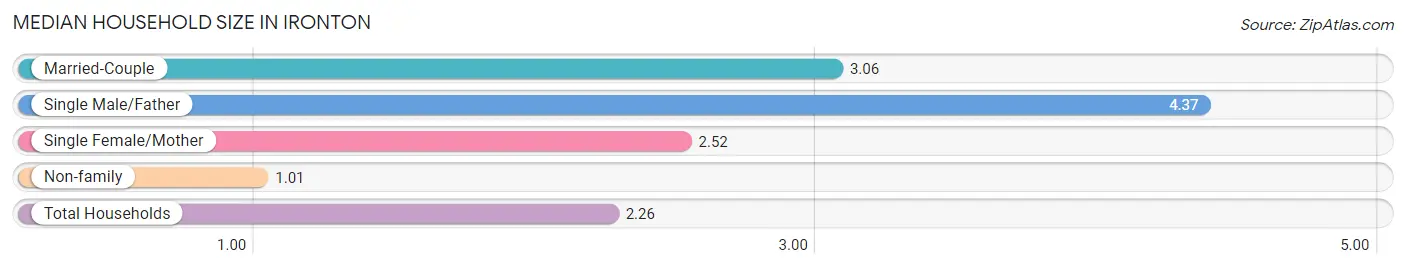
The median household size in Ironton is 2.26 persons per household, with single male/father households (41 | 5.8%) accounting for the largest median household size of 4.37 persons per household. non-family households (270 | 38.4%) represent the smallest median household size with 1.01 persons per household.
| Household Type | # Households | Household Size |
| Married-Couple | 278 (39.5%) | 3.06 |
| Single Male/Father | 41 (5.8%) | 4.37 |
| Single Female/Mother | 114 (16.2%) | 2.52 |
| Non-family | 270 (38.4%) | 1.01 |
| Total Households | 703 (100.0%) | 2.26 |
Household Size by Marriage Status in Ironton
Out of a total of 703 households in Ironton, 433 (61.6%) are family households, while 270 (38.4%) are nonfamily households. The most numerous type of family households are 2-person households, comprising 177, and the most common type of nonfamily households are 1-person households, comprising 266.
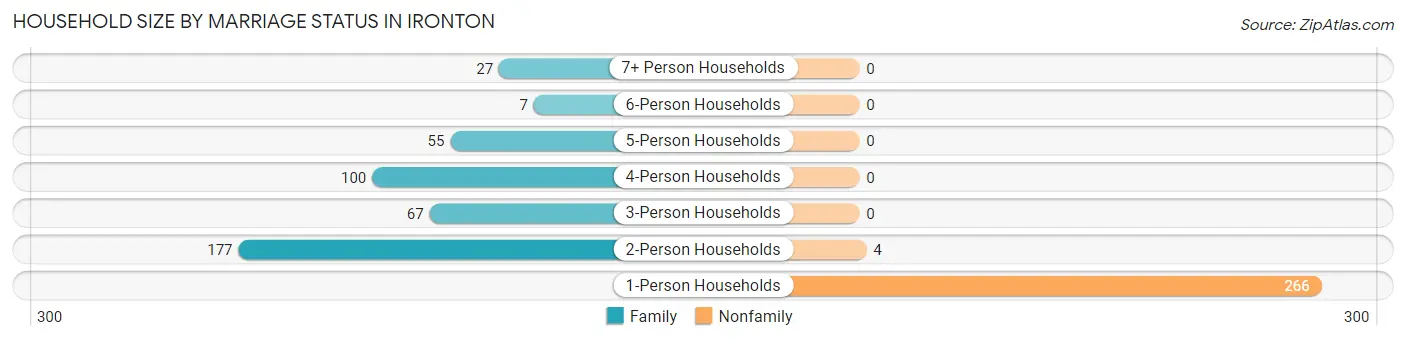
| Household Size | Family Households | Nonfamily Households |
| 1-Person Households | - | 266 (37.8%) |
| 2-Person Households | 177 (25.2%) | 4 (0.6%) |
| 3-Person Households | 67 (9.5%) | 0 (0.0%) |
| 4-Person Households | 100 (14.2%) | 0 (0.0%) |
| 5-Person Households | 55 (7.8%) | 0 (0.0%) |
| 6-Person Households | 7 (1.0%) | 0 (0.0%) |
| 7+ Person Households | 27 (3.8%) | 0 (0.0%) |
| Total | 433 (61.6%) | 270 (38.4%) |
Female Fertility in Ironton
Fertility by Age in Ironton
Average fertility rate in Ironton is 73.0 births per 1,000 women. Women in the age bracket of 35 to 50 years have the highest fertility rate with 104.0 births per 1,000 women. Women in the age bracket of 35 to 50 years acount for 73.9% of all women with births.
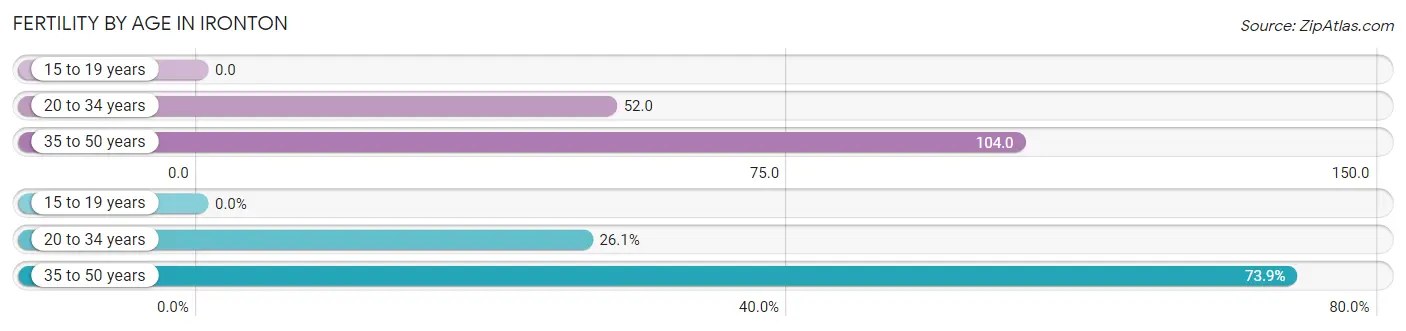
| Age Bracket | Women with Births | Births / 1,000 Women |
| 15 to 19 years | 0 (0.0%) | 0.0 |
| 20 to 34 years | 6 (26.1%) | 52.0 |
| 35 to 50 years | 17 (73.9%) | 104.0 |
| Total | 23 (100.0%) | 73.0 |
Fertility by Age by Marriage Status in Ironton
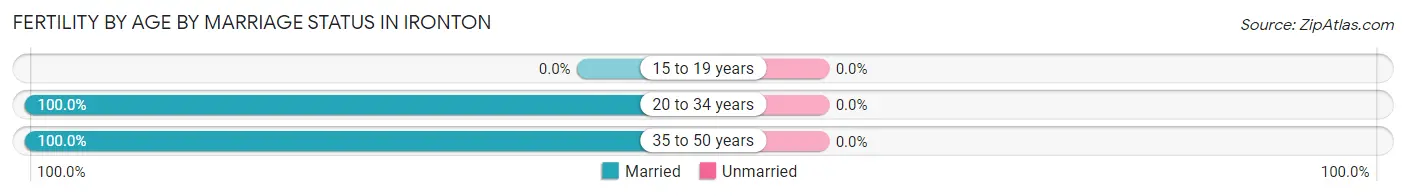
| Age Bracket | Married | Unmarried |
| 15 to 19 years | 0 (0.0%) | 0 (0.0%) |
| 20 to 34 years | 6 (100.0%) | 0 (0.0%) |
| 35 to 50 years | 17 (100.0%) | 0 (0.0%) |
| Total | 23 (100.0%) | 0 (0.0%) |
Fertility by Education in Ironton
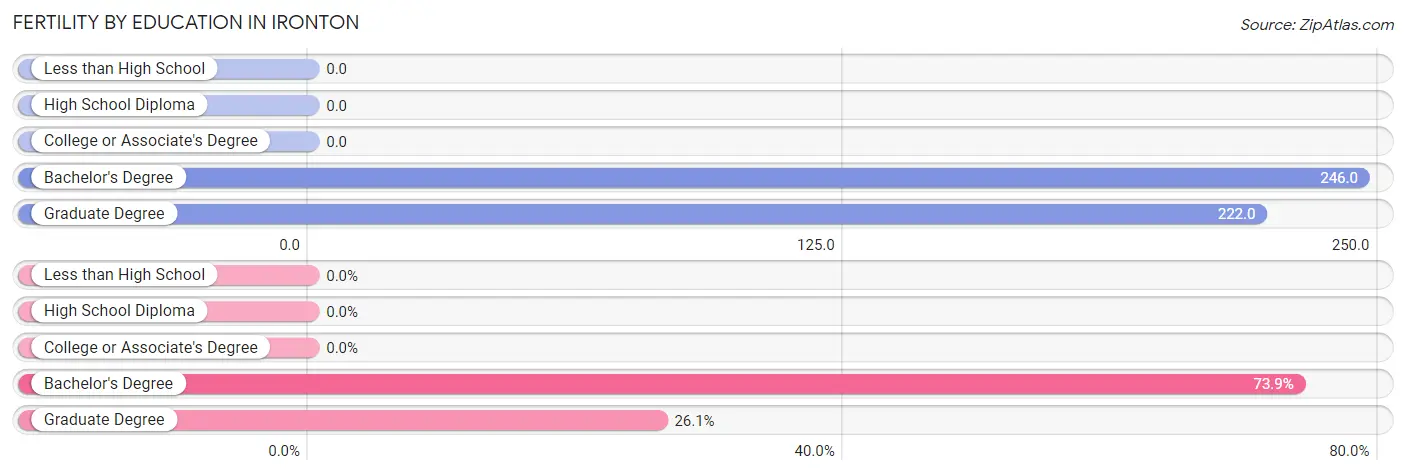
| Educational Attainment | Women with Births | Births / 1,000 Women |
| Less than High School | 0 (0.0%) | 0.0 |
| High School Diploma | 0 (0.0%) | 0.0 |
| College or Associate's Degree | 0 (0.0%) | 0.0 |
| Bachelor's Degree | 17 (73.9%) | 246.0 |
| Graduate Degree | 6 (26.1%) | 222.0 |
| Total | 23 (100.0%) | 73.0 |
Fertility by Education by Marriage Status in Ironton
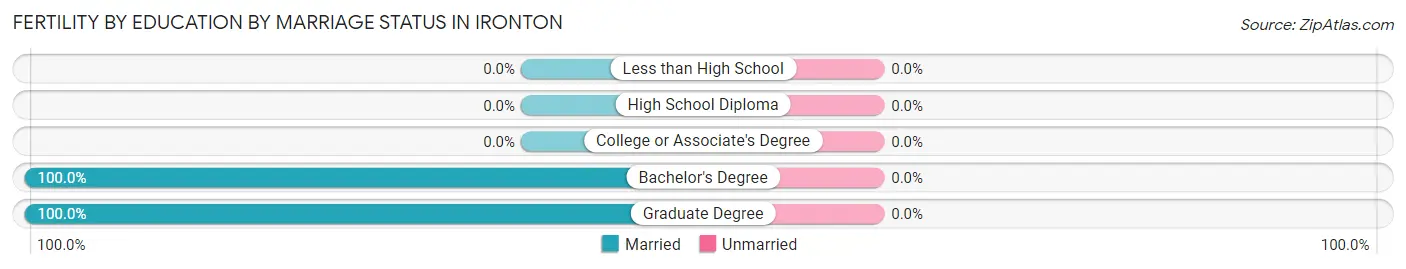
| Educational Attainment | Married | Unmarried |
| Less than High School | 0 (0.0%) | 0 (0.0%) |
| High School Diploma | 0 (0.0%) | 0 (0.0%) |
| College or Associate's Degree | 0 (0.0%) | 0 (0.0%) |
| Bachelor's Degree | 17 (100.0%) | 0 (0.0%) |
| Graduate Degree | 6 (100.0%) | 0 (0.0%) |
| Total | 23 (100.0%) | 0 (0.0%) |
Employment Characteristics in Ironton
Employment by Class of Employer in Ironton
Among the 569 employed individuals in Ironton, private company employees (270 | 47.4%), state government employees (92 | 16.2%), and not-for-profit organizations (73 | 12.8%) make up the most common classes of employment.
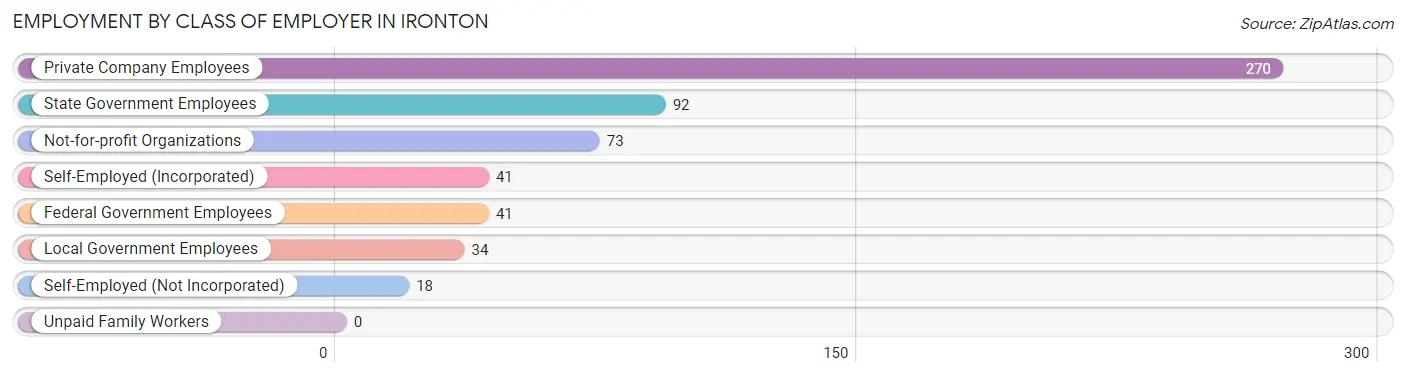
| Employer Class | # Employees | % Employees |
| Private Company Employees | 270 | 47.4% |
| Self-Employed (Incorporated) | 41 | 7.2% |
| Self-Employed (Not Incorporated) | 18 | 3.2% |
| Not-for-profit Organizations | 73 | 12.8% |
| Local Government Employees | 34 | 6.0% |
| State Government Employees | 92 | 16.2% |
| Federal Government Employees | 41 | 7.2% |
| Unpaid Family Workers | 0 | 0.0% |
| Total | 569 | 100.0% |
Employment Status by Age in Ironton
According to the labor force statistics for Ironton, out of the total population over 16 years of age (1,176), 51.8% or 609 individuals are in the labor force, with 5.4% or 33 of them unemployed. The age group with the highest labor force participation rate is 20 to 24 years, with 88.9% or 40 individuals in the labor force. Within the labor force, the 30 to 34 years age range has the highest percentage of unemployed individuals, with 12.6% or 14 of them being unemployed.
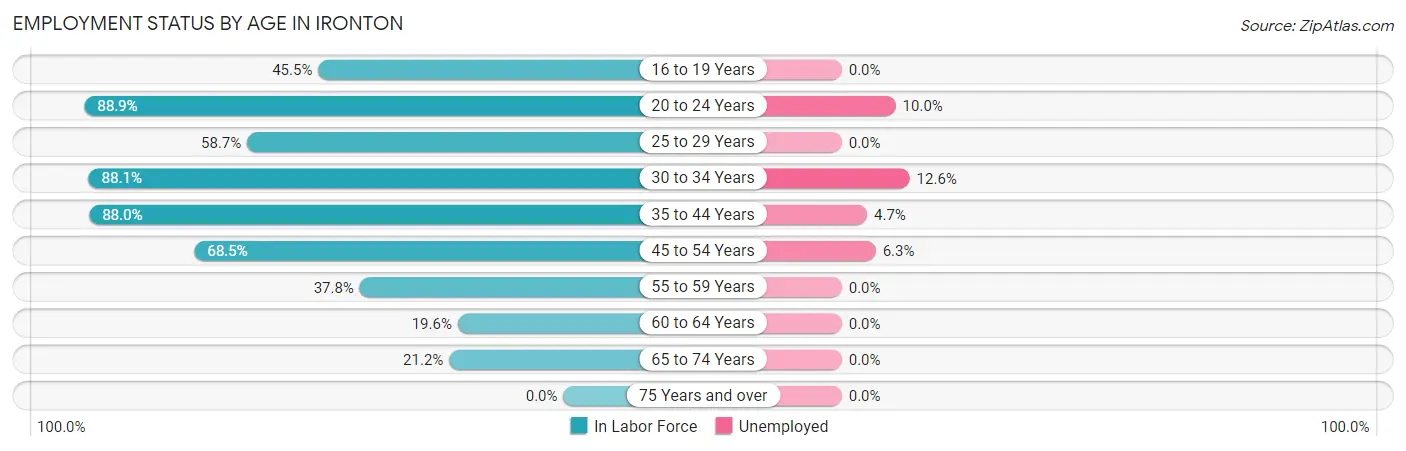
| Age Bracket | In Labor Force | Unemployed |
| 16 to 19 Years | 20 (45.5%) | 0 (0.0%) |
| 20 to 24 Years | 40 (88.9%) | 4 (10.0%) |
| 25 to 29 Years | 37 (58.7%) | 0 (0.0%) |
| 30 to 34 Years | 111 (88.1%) | 14 (12.6%) |
| 35 to 44 Years | 235 (88.0%) | 11 (4.7%) |
| 45 to 54 Years | 63 (68.5%) | 4 (6.3%) |
| 55 to 59 Years | 51 (37.8%) | 0 (0.0%) |
| 60 to 64 Years | 19 (19.6%) | 0 (0.0%) |
| 65 to 74 Years | 33 (21.2%) | 0 (0.0%) |
| 75 Years and over | 0 (0.0%) | 0 (0.0%) |
| Total | 609 (51.8%) | 33 (5.4%) |
Employment Status by Educational Attainment in Ironton
According to labor force statistics for Ironton, 66.2% of individuals (516) out of the total population between 25 and 64 years of age (780) are in the labor force, with 5.6% or 29 of them being unemployed. The group with the highest labor force participation rate are those with the educational attainment of college / associate degree, with 78.1% or 210 individuals in the labor force. Within the labor force, individuals with less than high school education have the highest percentage of unemployment, with 36.0% or 9 of them being unemployed.
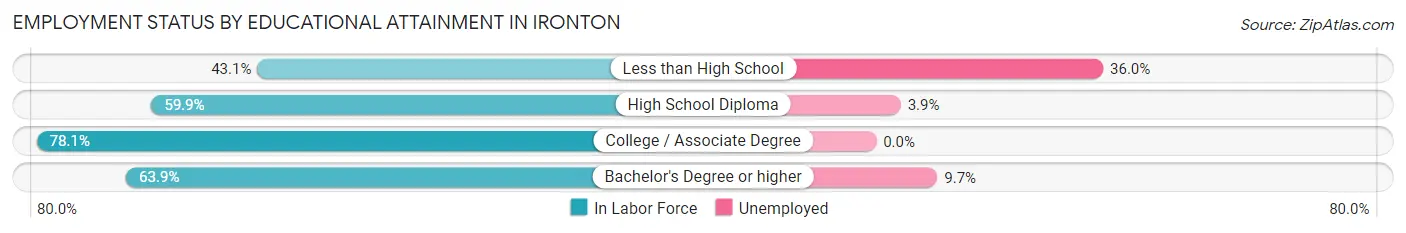
| Educational Attainment | In Labor Force | Unemployed |
| Less than High School | 25 (43.1%) | 21 (36.0%) |
| High School Diploma | 127 (59.9%) | 8 (3.9%) |
| College / Associate Degree | 210 (78.1%) | 0 (0.0%) |
| Bachelor's Degree or higher | 154 (63.9%) | 23 (9.7%) |
| Total | 516 (66.2%) | 44 (5.6%) |
Employment Occupations by Sex in Ironton
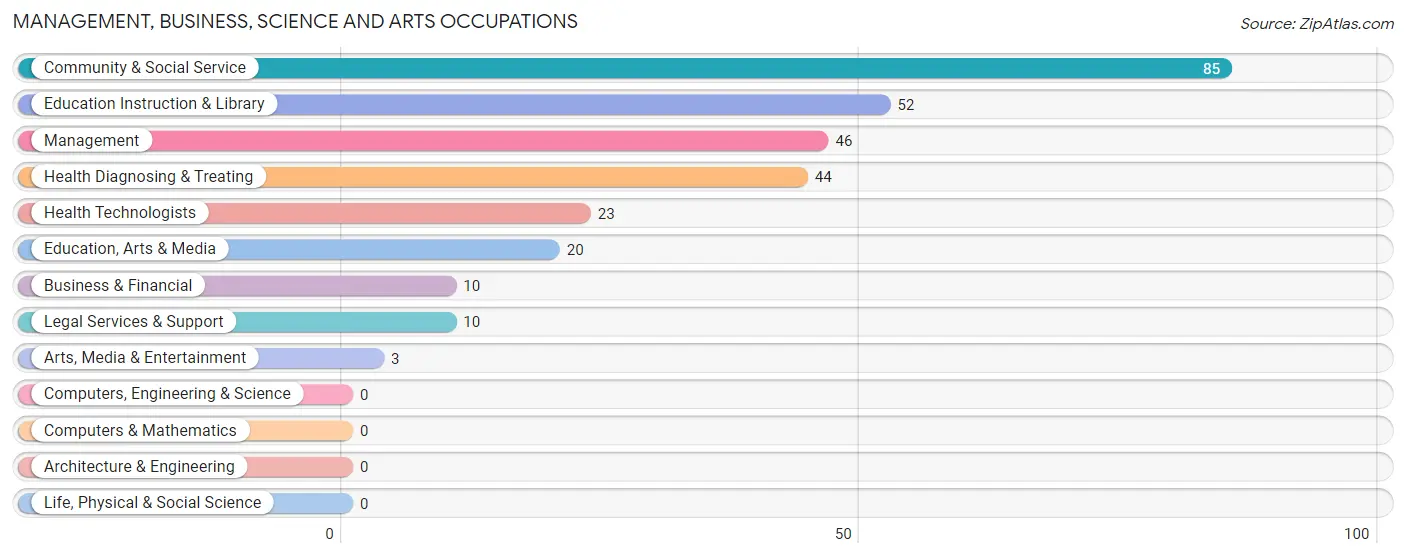
Management, Business, Science and Arts Occupations
The most common Management, Business, Science and Arts occupations in Ironton are Community & Social Service (85 | 14.8%), Education Instruction & Library (52 | 9.0%), Management (46 | 8.0%), Health Diagnosing & Treating (44 | 7.6%), and Health Technologists (23 | 4.0%).
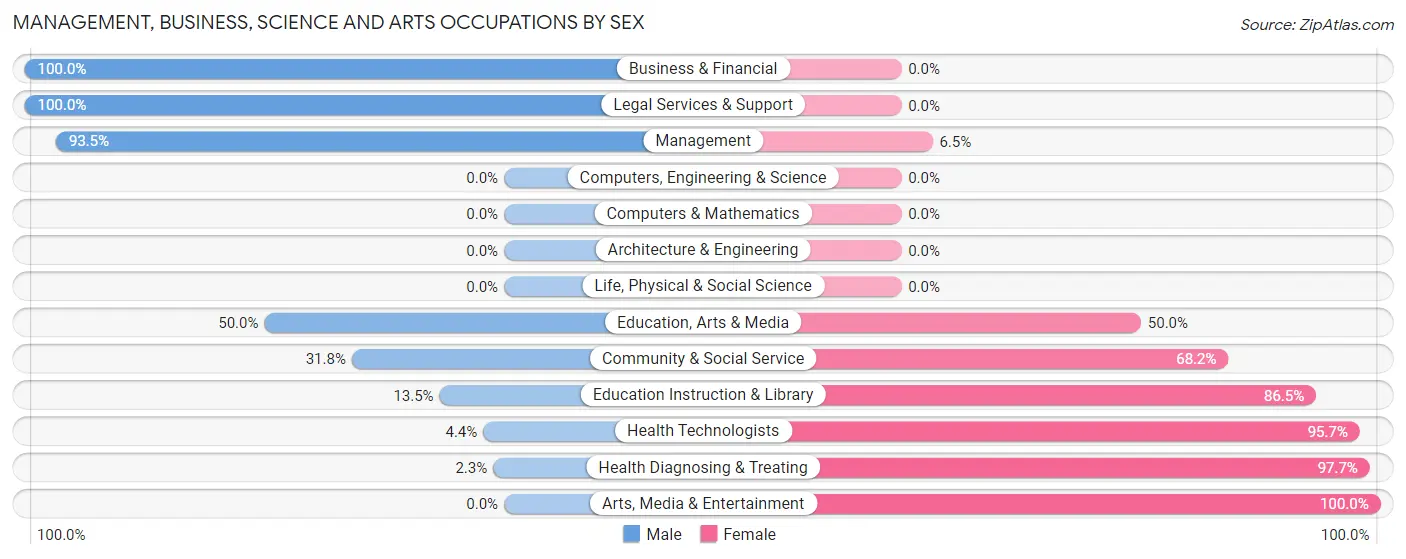
Management, Business, Science and Arts Occupations by Sex
Within the Management, Business, Science and Arts occupations in Ironton, the most male-oriented occupations are Business & Financial (100.0%), Legal Services & Support (100.0%), and Management (93.5%), while the most female-oriented occupations are Arts, Media & Entertainment (100.0%), Health Diagnosing & Treating (97.7%), and Health Technologists (95.7%).
| Occupation | Male | Female |
| Management | 43 (93.5%) | 3 (6.5%) |
| Business & Financial | 10 (100.0%) | 0 (0.0%) |
| Computers, Engineering & Science | 0 (0.0%) | 0 (0.0%) |
| Computers & Mathematics | 0 (0.0%) | 0 (0.0%) |
| Architecture & Engineering | 0 (0.0%) | 0 (0.0%) |
| Life, Physical & Social Science | 0 (0.0%) | 0 (0.0%) |
| Community & Social Service | 27 (31.8%) | 58 (68.2%) |
| Education, Arts & Media | 10 (50.0%) | 10 (50.0%) |
| Legal Services & Support | 10 (100.0%) | 0 (0.0%) |
| Education Instruction & Library | 7 (13.5%) | 45 (86.5%) |
| Arts, Media & Entertainment | 0 (0.0%) | 3 (100.0%) |
| Health Diagnosing & Treating | 1 (2.3%) | 43 (97.7%) |
| Health Technologists | 1 (4.3%) | 22 (95.7%) |
| Total (Category) | 81 (43.8%) | 104 (56.2%) |
| Total (Overall) | 300 (52.1%) | 276 (47.9%) |
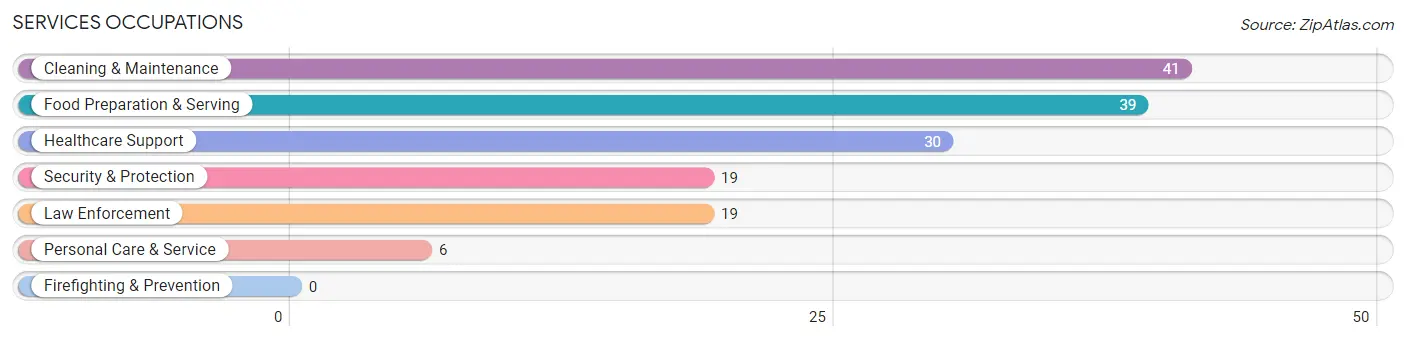
Services Occupations
The most common Services occupations in Ironton are Cleaning & Maintenance (41 | 7.1%), Food Preparation & Serving (39 | 6.8%), Healthcare Support (30 | 5.2%), Security & Protection (19 | 3.3%), and Law Enforcement (19 | 3.3%).
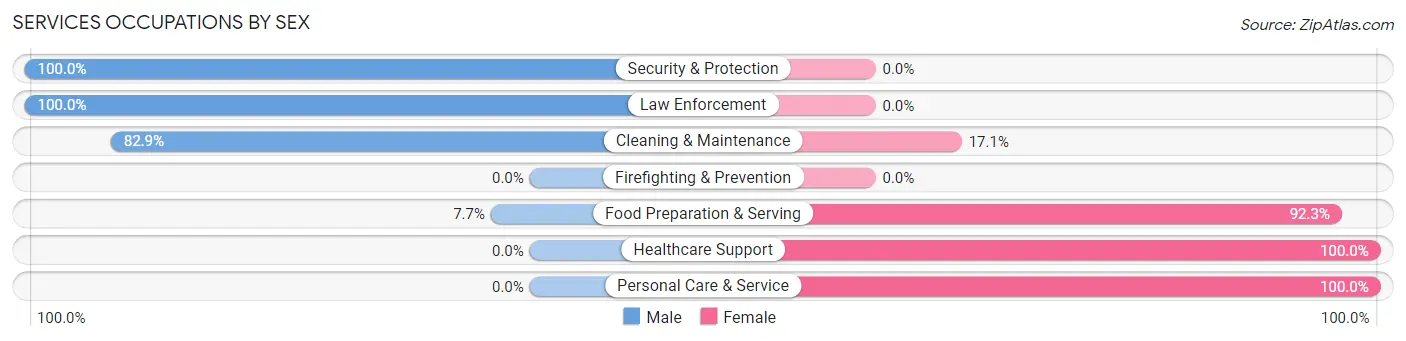
Services Occupations by Sex
Within the Services occupations in Ironton, the most male-oriented occupations are Security & Protection (100.0%), Law Enforcement (100.0%), and Cleaning & Maintenance (82.9%), while the most female-oriented occupations are Healthcare Support (100.0%), Personal Care & Service (100.0%), and Food Preparation & Serving (92.3%).
| Occupation | Male | Female |
| Healthcare Support | 0 (0.0%) | 30 (100.0%) |
| Security & Protection | 19 (100.0%) | 0 (0.0%) |
| Firefighting & Prevention | 0 (0.0%) | 0 (0.0%) |
| Law Enforcement | 19 (100.0%) | 0 (0.0%) |
| Food Preparation & Serving | 3 (7.7%) | 36 (92.3%) |
| Cleaning & Maintenance | 34 (82.9%) | 7 (17.1%) |
| Personal Care & Service | 0 (0.0%) | 6 (100.0%) |
| Total (Category) | 56 (41.5%) | 79 (58.5%) |
| Total (Overall) | 300 (52.1%) | 276 (47.9%) |
Sales and Office Occupations
The most common Sales and Office occupations in Ironton are Office & Administration (75 | 13.0%), and Sales & Related (27 | 4.7%).
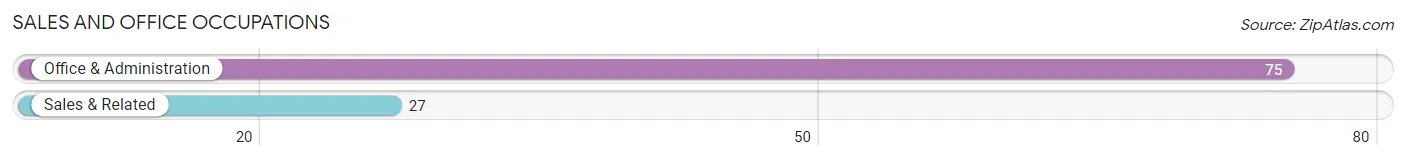
Sales and Office Occupations by Sex
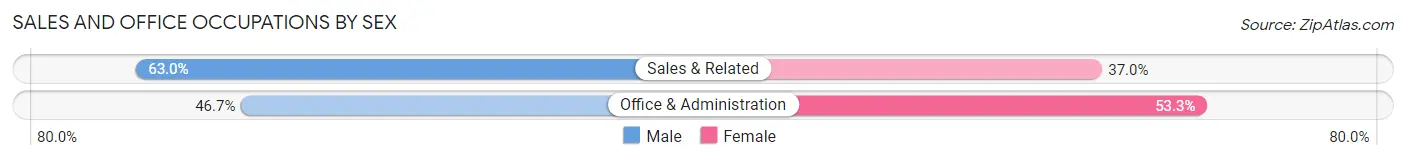
| Occupation | Male | Female |
| Sales & Related | 17 (63.0%) | 10 (37.0%) |
| Office & Administration | 35 (46.7%) | 40 (53.3%) |
| Total (Category) | 52 (51.0%) | 50 (49.0%) |
| Total (Overall) | 300 (52.1%) | 276 (47.9%) |
Natural Resources, Construction and Maintenance Occupations
The most common Natural Resources, Construction and Maintenance occupations in Ironton are Construction & Extraction (67 | 11.6%), and Installation, Maintenance & Repair (10 | 1.7%).
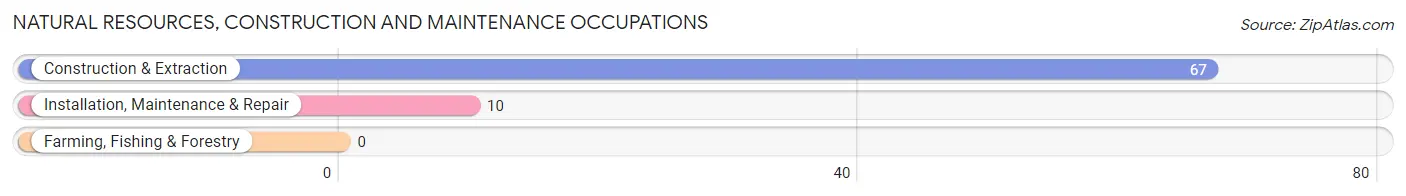
Natural Resources, Construction and Maintenance Occupations by Sex
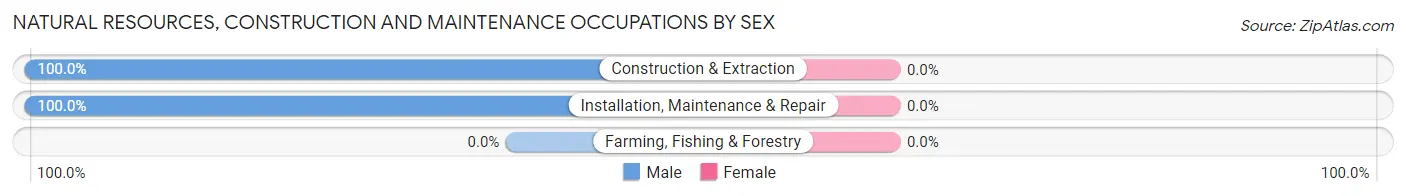
| Occupation | Male | Female |
| Farming, Fishing & Forestry | 0 (0.0%) | 0 (0.0%) |
| Construction & Extraction | 67 (100.0%) | 0 (0.0%) |
| Installation, Maintenance & Repair | 10 (100.0%) | 0 (0.0%) |
| Total (Category) | 77 (100.0%) | 0 (0.0%) |
| Total (Overall) | 300 (52.1%) | 276 (47.9%) |
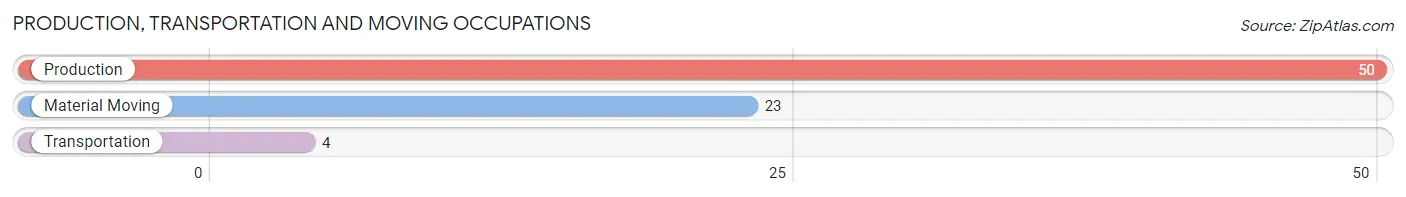
Production, Transportation and Moving Occupations
The most common Production, Transportation and Moving occupations in Ironton are Production (50 | 8.7%), Material Moving (23 | 4.0%), and Transportation (4 | 0.7%).
Production, Transportation and Moving Occupations by Sex
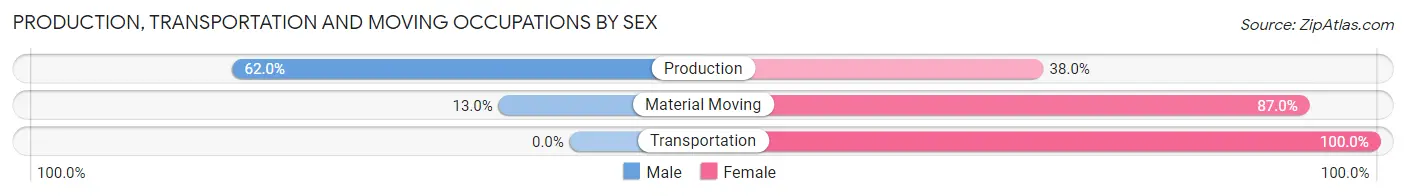
| Occupation | Male | Female |
| Production | 31 (62.0%) | 19 (38.0%) |
| Transportation | 0 (0.0%) | 4 (100.0%) |
| Material Moving | 3 (13.0%) | 20 (87.0%) |
| Total (Category) | 34 (44.2%) | 43 (55.8%) |
| Total (Overall) | 300 (52.1%) | 276 (47.9%) |
Employment Industries by Sex in Ironton
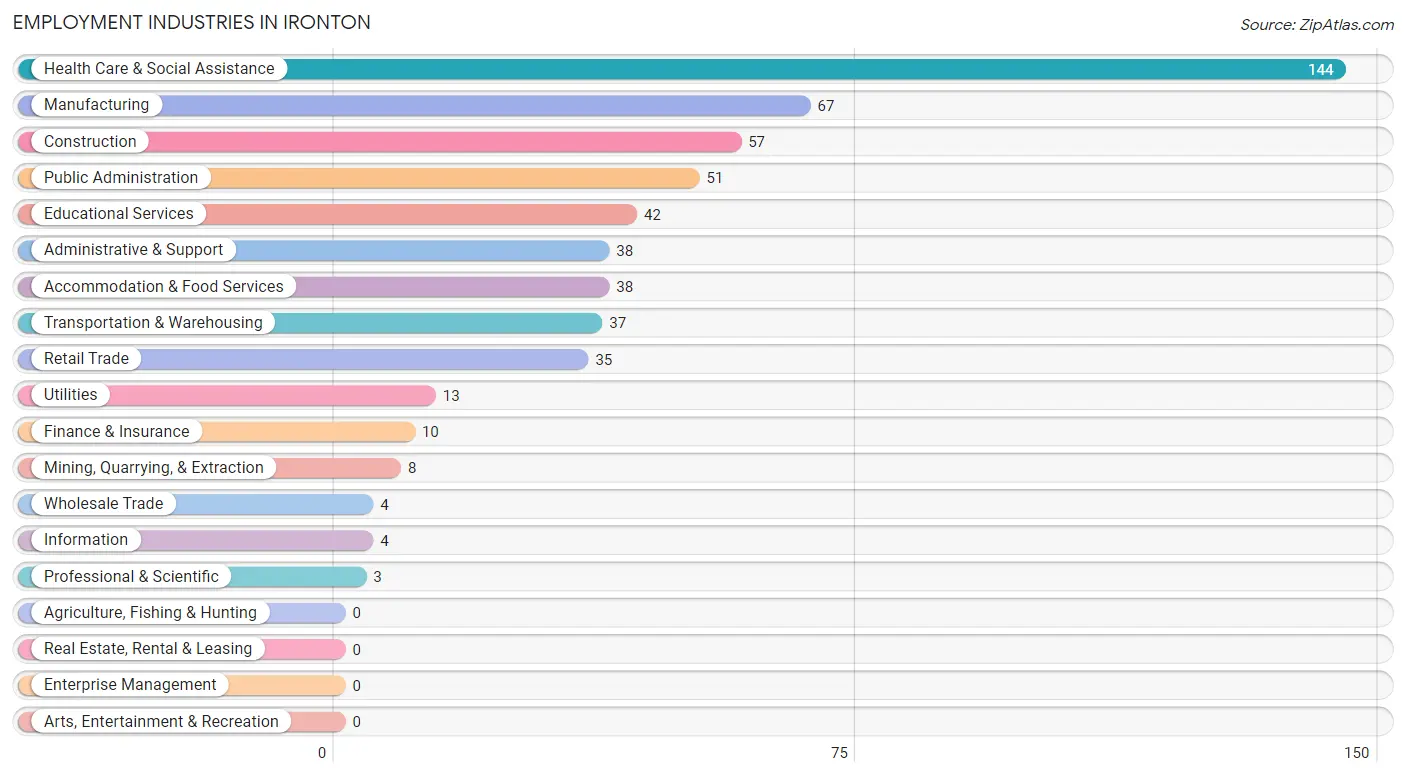
Employment Industries in Ironton
The major employment industries in Ironton include Health Care & Social Assistance (144 | 25.0%), Manufacturing (67 | 11.6%), Construction (57 | 9.9%), Public Administration (51 | 8.8%), and Educational Services (42 | 7.3%).
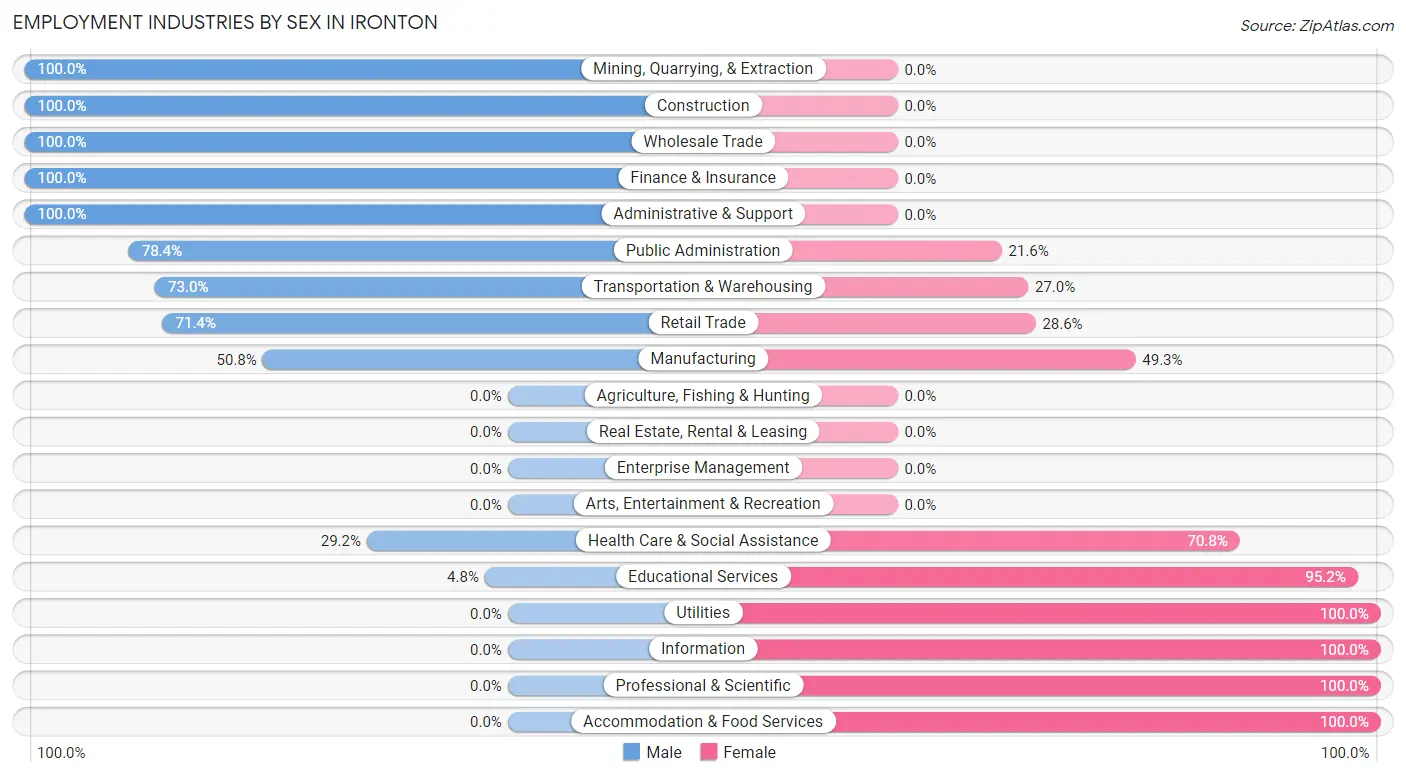
Employment Industries by Sex in Ironton
The Ironton industries that see more men than women are Mining, Quarrying, & Extraction (100.0%), Construction (100.0%), and Wholesale Trade (100.0%), whereas the industries that tend to have a higher number of women are Utilities (100.0%), Information (100.0%), and Professional & Scientific (100.0%).
| Industry | Male | Female |
| Agriculture, Fishing & Hunting | 0 (0.0%) | 0 (0.0%) |
| Mining, Quarrying, & Extraction | 8 (100.0%) | 0 (0.0%) |
| Construction | 57 (100.0%) | 0 (0.0%) |
| Manufacturing | 34 (50.7%) | 33 (49.2%) |
| Wholesale Trade | 4 (100.0%) | 0 (0.0%) |
| Retail Trade | 25 (71.4%) | 10 (28.6%) |
| Transportation & Warehousing | 27 (73.0%) | 10 (27.0%) |
| Utilities | 0 (0.0%) | 13 (100.0%) |
| Information | 0 (0.0%) | 4 (100.0%) |
| Finance & Insurance | 10 (100.0%) | 0 (0.0%) |
| Real Estate, Rental & Leasing | 0 (0.0%) | 0 (0.0%) |
| Professional & Scientific | 0 (0.0%) | 3 (100.0%) |
| Enterprise Management | 0 (0.0%) | 0 (0.0%) |
| Administrative & Support | 38 (100.0%) | 0 (0.0%) |
| Educational Services | 2 (4.8%) | 40 (95.2%) |
| Health Care & Social Assistance | 42 (29.2%) | 102 (70.8%) |
| Arts, Entertainment & Recreation | 0 (0.0%) | 0 (0.0%) |
| Accommodation & Food Services | 0 (0.0%) | 38 (100.0%) |
| Public Administration | 40 (78.4%) | 11 (21.6%) |
| Total | 300 (52.1%) | 276 (47.9%) |
Education in Ironton
School Enrollment in Ironton
The most common levels of schooling among the 367 students in Ironton are middle school (117 | 31.9%), elementary school (99 | 27.0%), and high school (84 | 22.9%).
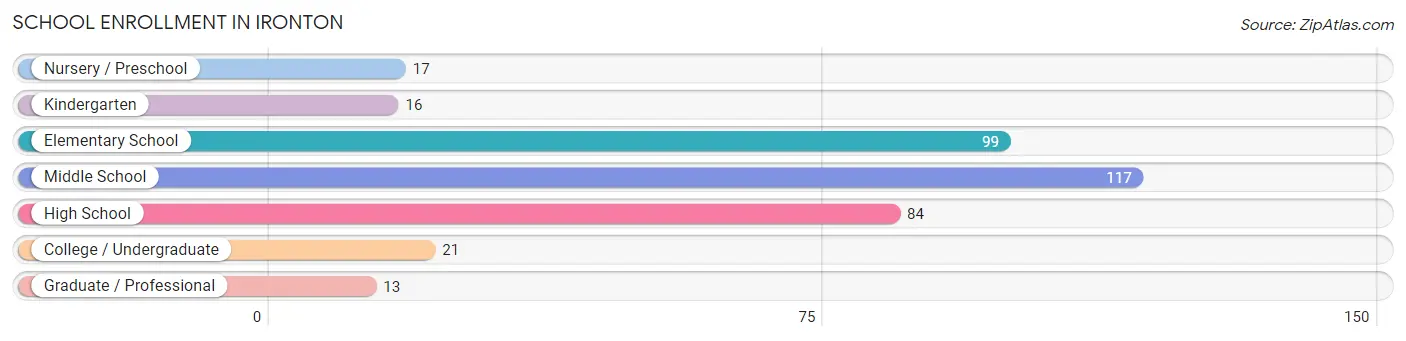
| School Level | # Students | % Students |
| Nursery / Preschool | 17 | 4.6% |
| Kindergarten | 16 | 4.4% |
| Elementary School | 99 | 27.0% |
| Middle School | 117 | 31.9% |
| High School | 84 | 22.9% |
| College / Undergraduate | 21 | 5.7% |
| Graduate / Professional | 13 | 3.5% |
| Total | 367 | 100.0% |
School Enrollment by Age by Funding Source in Ironton
Out of a total of 367 students who are enrolled in schools in Ironton, 9 (2.5%) attend a private institution, while the remaining 358 (97.5%) are enrolled in public schools. The age group of 5 to 9 year old has the highest likelihood of being enrolled in private schools, with 6 (5.9% in the age bracket) enrolled. Conversely, the age group of 3 to 4 year olds has the lowest likelihood of being enrolled in a private school, with 3 (100.0% in the age bracket) attending a public institution.
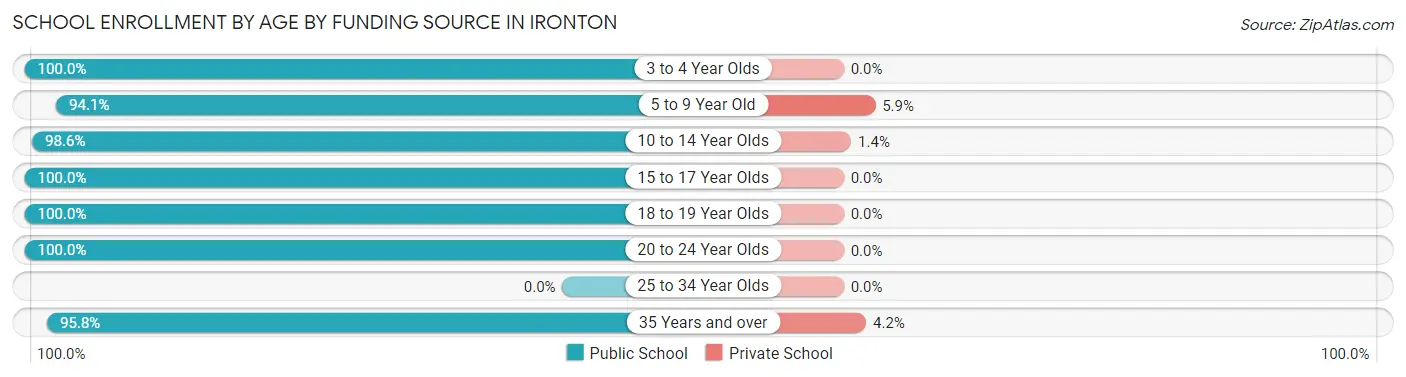
| Age Bracket | Public School | Private School |
| 3 to 4 Year Olds | 3 (100.0%) | 0 (0.0%) |
| 5 to 9 Year Old | 96 (94.1%) | 6 (5.9%) |
| 10 to 14 Year Olds | 142 (98.6%) | 2 (1.4%) |
| 15 to 17 Year Olds | 76 (100.0%) | 0 (0.0%) |
| 18 to 19 Year Olds | 10 (100.0%) | 0 (0.0%) |
| 20 to 24 Year Olds | 8 (100.0%) | 0 (0.0%) |
| 25 to 34 Year Olds | 0 (0.0%) | 0 (0.0%) |
| 35 Years and over | 23 (95.8%) | 1 (4.2%) |
| Total | 358 (97.5%) | 9 (2.5%) |
Educational Attainment by Field of Study in Ironton
Education (133 | 40.8%), arts & humanities (31 | 9.5%), literature & languages (30 | 9.2%), psychology (23 | 7.1%), and science & technology (22 | 6.8%) are the most common fields of study among 326 individuals in Ironton who have obtained a bachelor's degree or higher.
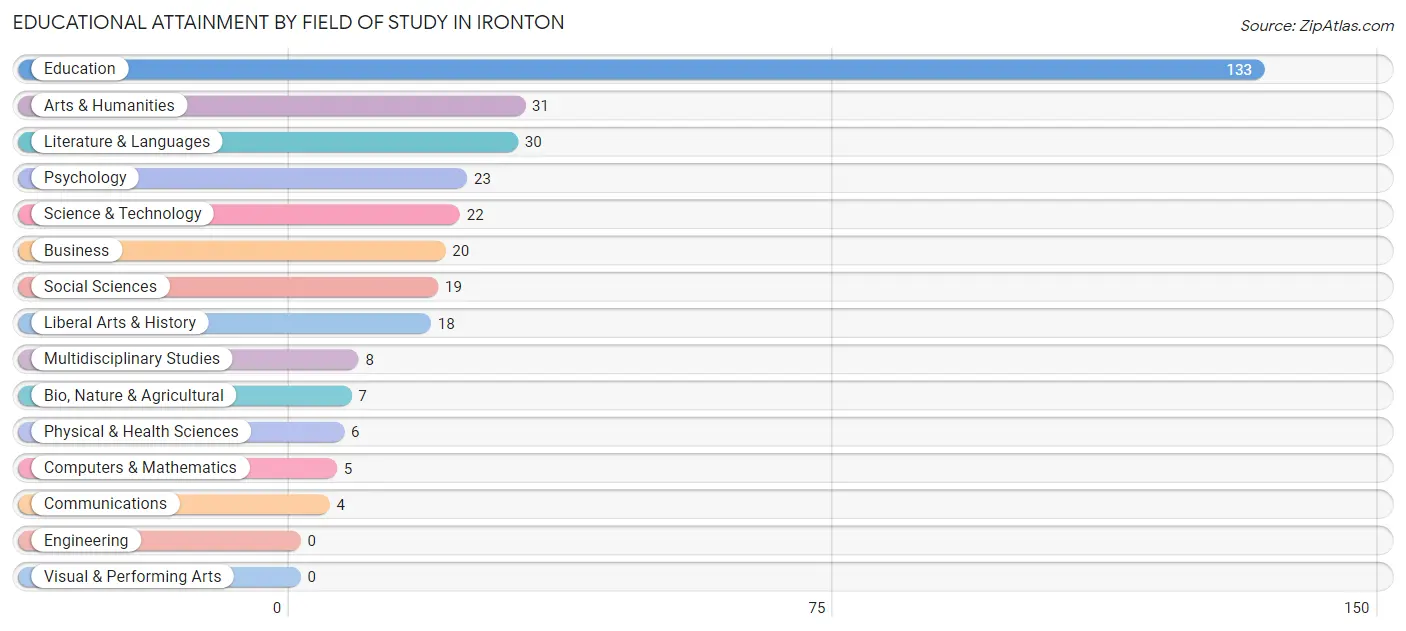
| Field of Study | # Graduates | % Graduates |
| Computers & Mathematics | 5 | 1.5% |
| Bio, Nature & Agricultural | 7 | 2.1% |
| Physical & Health Sciences | 6 | 1.8% |
| Psychology | 23 | 7.1% |
| Social Sciences | 19 | 5.8% |
| Engineering | 0 | 0.0% |
| Multidisciplinary Studies | 8 | 2.5% |
| Science & Technology | 22 | 6.8% |
| Business | 20 | 6.1% |
| Education | 133 | 40.8% |
| Literature & Languages | 30 | 9.2% |
| Liberal Arts & History | 18 | 5.5% |
| Visual & Performing Arts | 0 | 0.0% |
| Communications | 4 | 1.2% |
| Arts & Humanities | 31 | 9.5% |
| Total | 326 | 100.0% |
Transportation & Commute in Ironton
Vehicle Availability by Sex in Ironton
The most prevalent vehicle ownership categories in Ironton are males with 3 vehicles (120, accounting for 41.0%) and females with 3 vehicles (68, making up 43.5%).
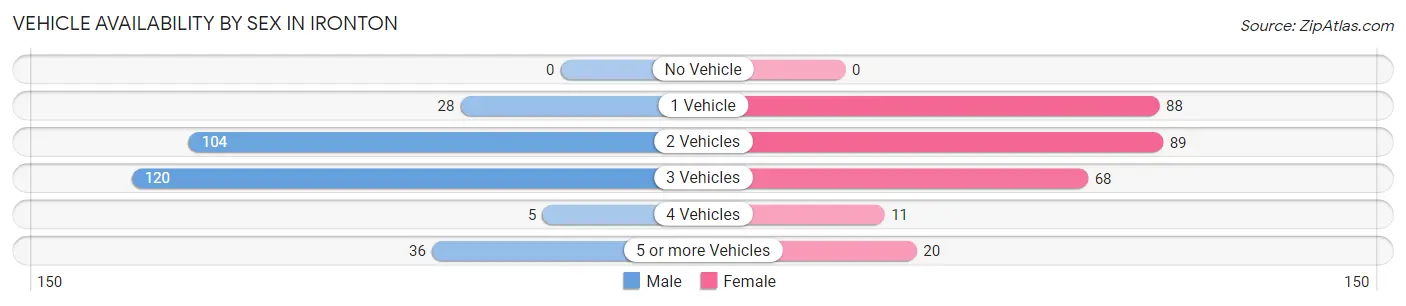
| Vehicles Available | Male | Female |
| No Vehicle | 0 (0.0%) | 0 (0.0%) |
| 1 Vehicle | 28 (9.6%) | 88 (31.9%) |
| 2 Vehicles | 104 (35.5%) | 89 (32.3%) |
| 3 Vehicles | 120 (41.0%) | 68 (24.6%) |
| 4 Vehicles | 5 (1.7%) | 11 (4.0%) |
| 5 or more Vehicles | 36 (12.3%) | 20 (7.2%) |
| Total | 293 (100.0%) | 276 (100.0%) |
Commute Time in Ironton
The most frequently occuring commute durations in Ironton are less than 5 minutes (98 commuters, 18.7%), 30 to 34 minutes (83 commuters, 15.8%), and 20 to 24 minutes (68 commuters, 13.0%).
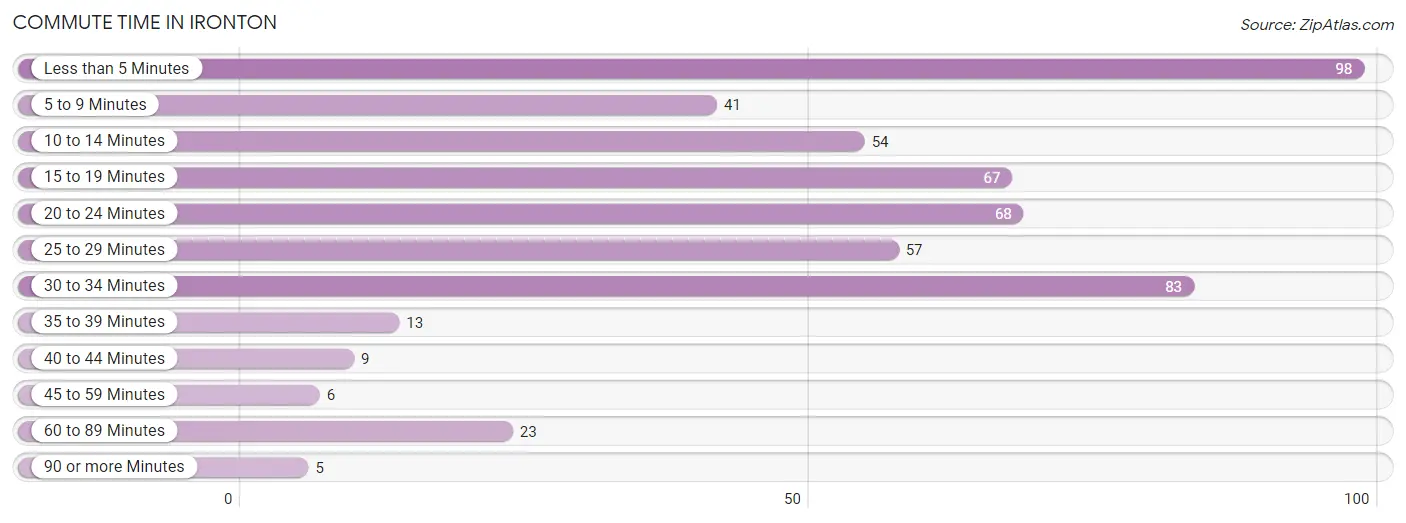
| Commute Time | # Commuters | % Commuters |
| Less than 5 Minutes | 98 | 18.7% |
| 5 to 9 Minutes | 41 | 7.8% |
| 10 to 14 Minutes | 54 | 10.3% |
| 15 to 19 Minutes | 67 | 12.8% |
| 20 to 24 Minutes | 68 | 13.0% |
| 25 to 29 Minutes | 57 | 10.9% |
| 30 to 34 Minutes | 83 | 15.8% |
| 35 to 39 Minutes | 13 | 2.5% |
| 40 to 44 Minutes | 9 | 1.7% |
| 45 to 59 Minutes | 6 | 1.1% |
| 60 to 89 Minutes | 23 | 4.4% |
| 90 or more Minutes | 5 | 0.9% |
Commute Time by Sex in Ironton
The most common commute times in Ironton are less than 5 minutes (68 commuters, 26.5%) for males and 25 to 29 minutes (57 commuters, 21.3%) for females.
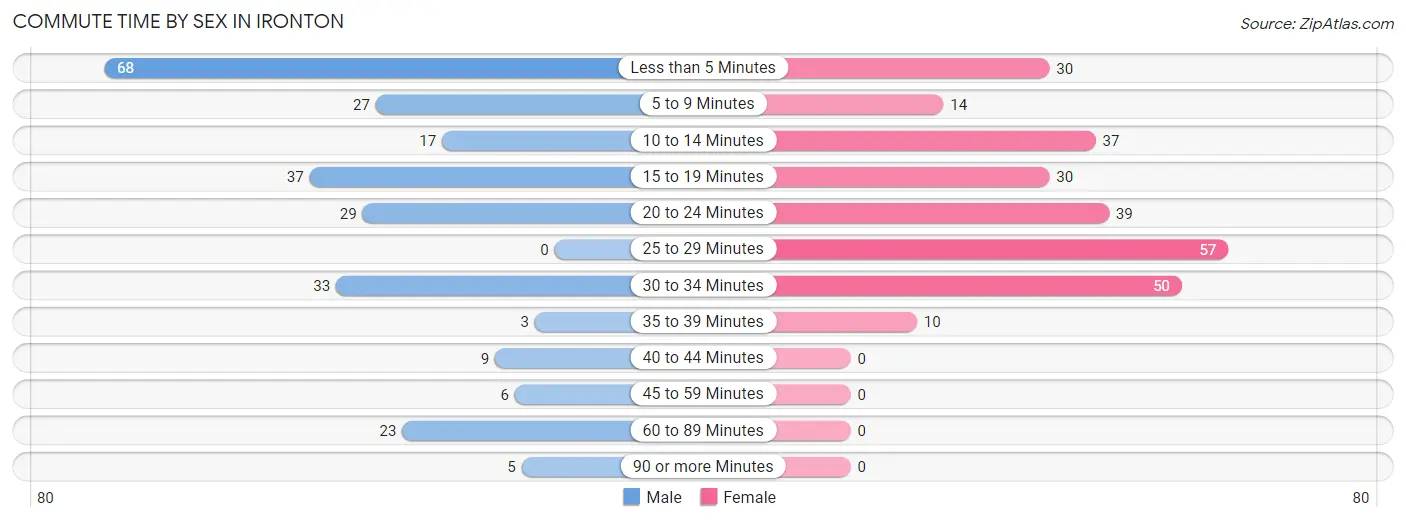
| Commute Time | Male | Female |
| Less than 5 Minutes | 68 (26.5%) | 30 (11.2%) |
| 5 to 9 Minutes | 27 (10.5%) | 14 (5.2%) |
| 10 to 14 Minutes | 17 (6.6%) | 37 (13.9%) |
| 15 to 19 Minutes | 37 (14.4%) | 30 (11.2%) |
| 20 to 24 Minutes | 29 (11.3%) | 39 (14.6%) |
| 25 to 29 Minutes | 0 (0.0%) | 57 (21.3%) |
| 30 to 34 Minutes | 33 (12.8%) | 50 (18.7%) |
| 35 to 39 Minutes | 3 (1.2%) | 10 (3.7%) |
| 40 to 44 Minutes | 9 (3.5%) | 0 (0.0%) |
| 45 to 59 Minutes | 6 (2.3%) | 0 (0.0%) |
| 60 to 89 Minutes | 23 (8.9%) | 0 (0.0%) |
| 90 or more Minutes | 5 (1.9%) | 0 (0.0%) |
Time of Departure to Work by Sex in Ironton
The most frequent times of departure to work in Ironton are 7:00 AM to 7:29 AM (52, 20.2%) for males and 7:00 AM to 7:29 AM (59, 22.1%) for females.
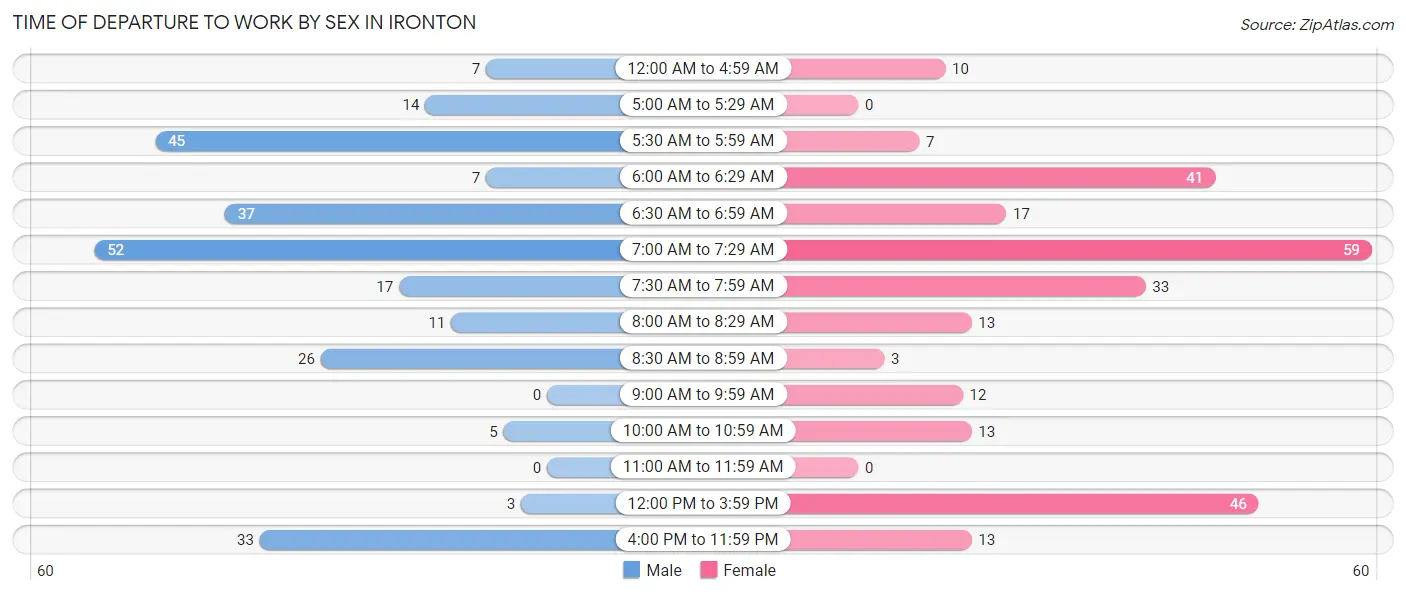
| Time of Departure | Male | Female |
| 12:00 AM to 4:59 AM | 7 (2.7%) | 10 (3.7%) |
| 5:00 AM to 5:29 AM | 14 (5.4%) | 0 (0.0%) |
| 5:30 AM to 5:59 AM | 45 (17.5%) | 7 (2.6%) |
| 6:00 AM to 6:29 AM | 7 (2.7%) | 41 (15.4%) |
| 6:30 AM to 6:59 AM | 37 (14.4%) | 17 (6.4%) |
| 7:00 AM to 7:29 AM | 52 (20.2%) | 59 (22.1%) |
| 7:30 AM to 7:59 AM | 17 (6.6%) | 33 (12.4%) |
| 8:00 AM to 8:29 AM | 11 (4.3%) | 13 (4.9%) |
| 8:30 AM to 8:59 AM | 26 (10.1%) | 3 (1.1%) |
| 9:00 AM to 9:59 AM | 0 (0.0%) | 12 (4.5%) |
| 10:00 AM to 10:59 AM | 5 (1.9%) | 13 (4.9%) |
| 11:00 AM to 11:59 AM | 0 (0.0%) | 0 (0.0%) |
| 12:00 PM to 3:59 PM | 3 (1.2%) | 46 (17.2%) |
| 4:00 PM to 11:59 PM | 33 (12.8%) | 13 (4.9%) |
| Total | 257 (100.0%) | 267 (100.0%) |
Housing Occupancy in Ironton
Occupancy by Ownership in Ironton
Of the total 703 dwellings in Ironton, owner-occupied units account for 548 (77.9%), while renter-occupied units make up 155 (22.1%).
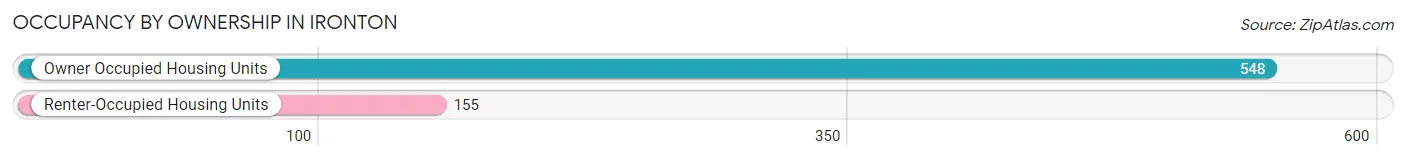
| Occupancy | # Housing Units | % Housing Units |
| Owner Occupied Housing Units | 548 | 77.9% |
| Renter-Occupied Housing Units | 155 | 22.1% |
| Total Occupied Housing Units | 703 | 100.0% |
Occupancy by Household Size in Ironton
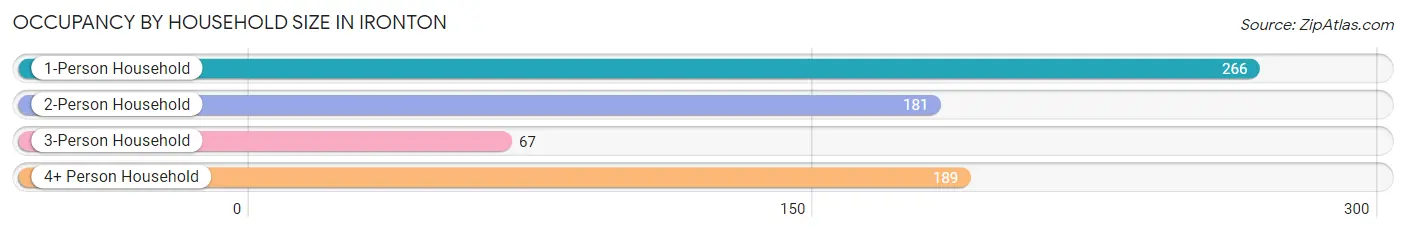
| Household Size | # Housing Units | % Housing Units |
| 1-Person Household | 266 | 37.8% |
| 2-Person Household | 181 | 25.8% |
| 3-Person Household | 67 | 9.5% |
| 4+ Person Household | 189 | 26.9% |
| Total Housing Units | 703 | 100.0% |
Occupancy by Ownership by Household Size in Ironton
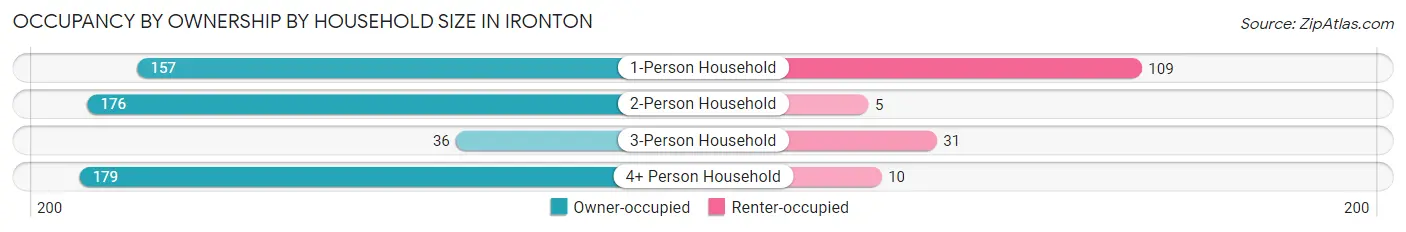
| Household Size | Owner-occupied | Renter-occupied |
| 1-Person Household | 157 (59.0%) | 109 (41.0%) |
| 2-Person Household | 176 (97.2%) | 5 (2.8%) |
| 3-Person Household | 36 (53.7%) | 31 (46.3%) |
| 4+ Person Household | 179 (94.7%) | 10 (5.3%) |
| Total Housing Units | 548 (77.9%) | 155 (22.1%) |
Occupancy by Educational Attainment in Ironton
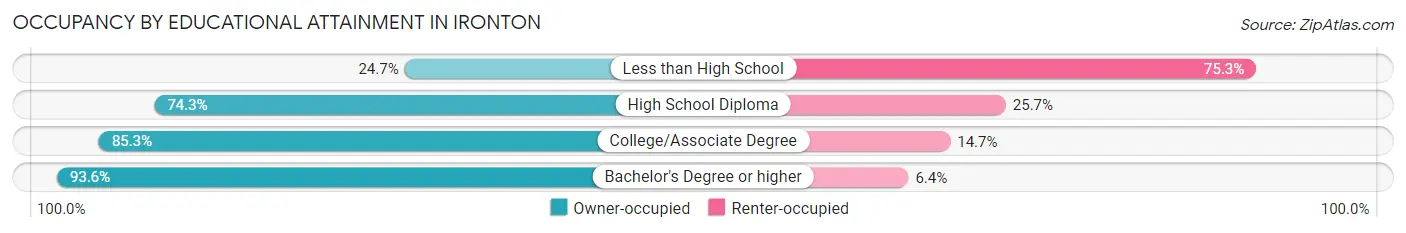
| Household Size | Owner-occupied | Renter-occupied |
| Less than High School | 19 (24.7%) | 58 (75.3%) |
| High School Diploma | 130 (74.3%) | 45 (25.7%) |
| College/Associate Degree | 238 (85.3%) | 41 (14.7%) |
| Bachelor's Degree or higher | 161 (93.6%) | 11 (6.4%) |
Occupancy by Age of Householder in Ironton
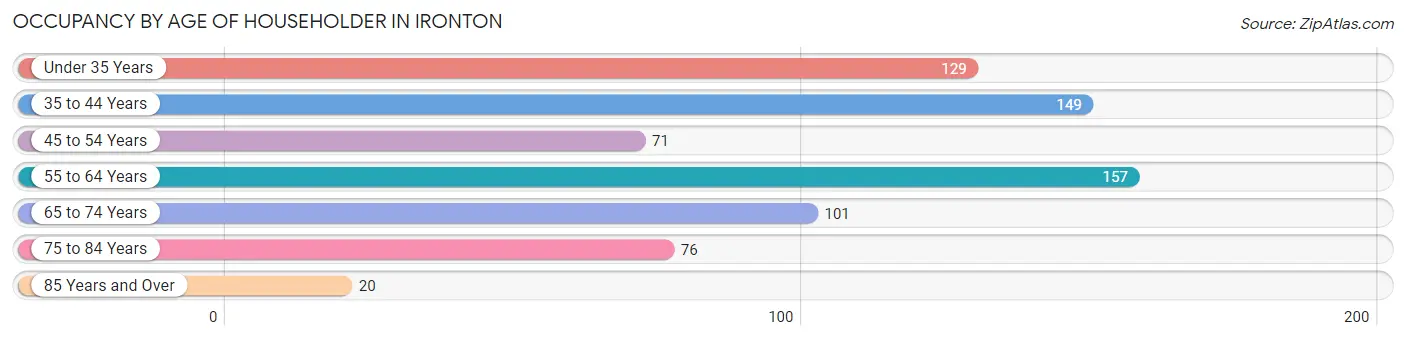
| Age Bracket | # Households | % Households |
| Under 35 Years | 129 | 18.3% |
| 35 to 44 Years | 149 | 21.2% |
| 45 to 54 Years | 71 | 10.1% |
| 55 to 64 Years | 157 | 22.3% |
| 65 to 74 Years | 101 | 14.4% |
| 75 to 84 Years | 76 | 10.8% |
| 85 Years and Over | 20 | 2.8% |
| Total | 703 | 100.0% |
Housing Finances in Ironton
Median Income by Occupancy in Ironton
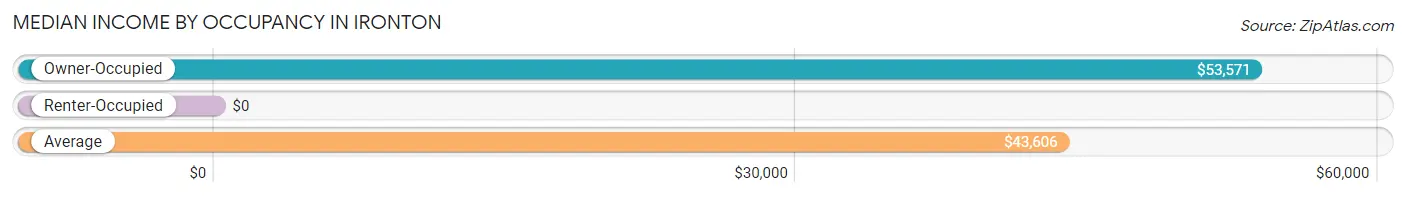
| Occupancy Type | # Households | Median Income |
| Owner-Occupied | 548 (77.9%) | $53,571 |
| Renter-Occupied | 155 (22.1%) | $0 |
| Average | 703 (100.0%) | $43,606 |
Occupancy by Householder Income Bracket in Ironton
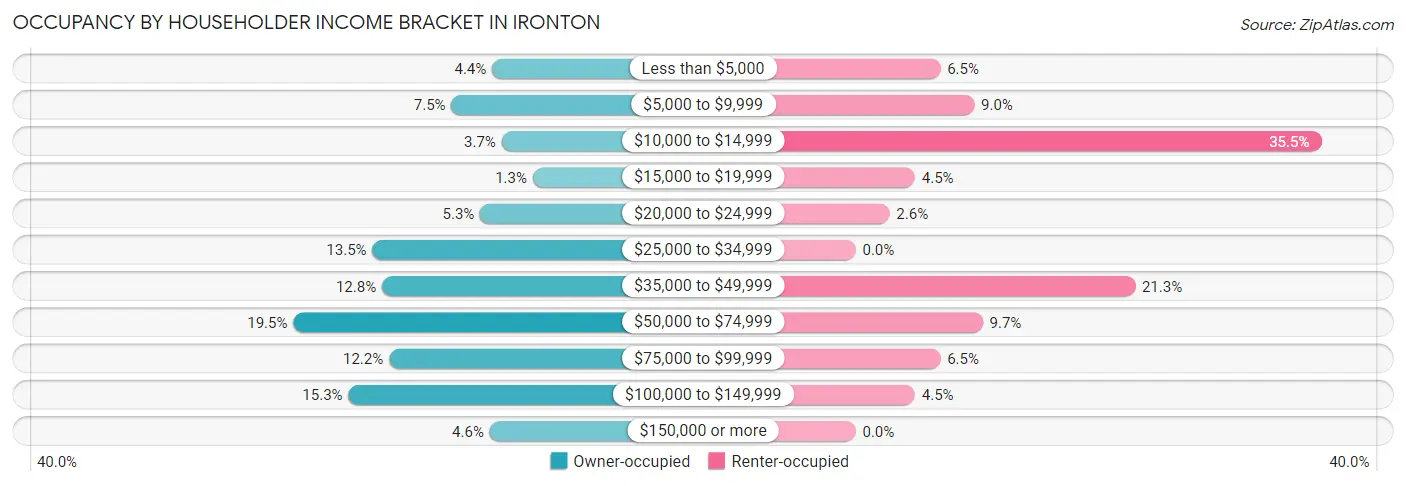
| Income Bracket | Owner-occupied | Renter-occupied |
| Less than $5,000 | 24 (4.4%) | 10 (6.5%) |
| $5,000 to $9,999 | 41 (7.5%) | 14 (9.0%) |
| $10,000 to $14,999 | 20 (3.6%) | 55 (35.5%) |
| $15,000 to $19,999 | 7 (1.3%) | 7 (4.5%) |
| $20,000 to $24,999 | 29 (5.3%) | 4 (2.6%) |
| $25,000 to $34,999 | 74 (13.5%) | 0 (0.0%) |
| $35,000 to $49,999 | 70 (12.8%) | 33 (21.3%) |
| $50,000 to $74,999 | 107 (19.5%) | 15 (9.7%) |
| $75,000 to $99,999 | 67 (12.2%) | 10 (6.5%) |
| $100,000 to $149,999 | 84 (15.3%) | 7 (4.5%) |
| $150,000 or more | 25 (4.6%) | 0 (0.0%) |
| Total | 548 (100.0%) | 155 (100.0%) |
Monthly Housing Cost Tiers in Ironton
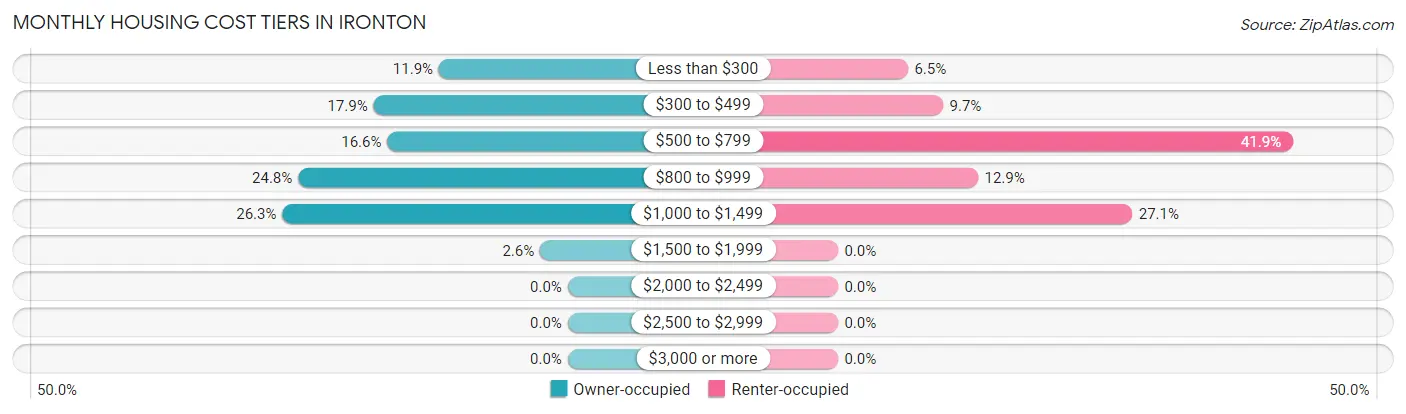
| Monthly Cost | Owner-occupied | Renter-occupied |
| Less than $300 | 65 (11.9%) | 10 (6.5%) |
| $300 to $499 | 98 (17.9%) | 15 (9.7%) |
| $500 to $799 | 91 (16.6%) | 65 (41.9%) |
| $800 to $999 | 136 (24.8%) | 20 (12.9%) |
| $1,000 to $1,499 | 144 (26.3%) | 42 (27.1%) |
| $1,500 to $1,999 | 14 (2.5%) | 0 (0.0%) |
| $2,000 to $2,499 | 0 (0.0%) | 0 (0.0%) |
| $2,500 to $2,999 | 0 (0.0%) | 0 (0.0%) |
| $3,000 or more | 0 (0.0%) | 0 (0.0%) |
| Total | 548 (100.0%) | 155 (100.0%) |
Physical Housing Characteristics in Ironton
Housing Structures in Ironton
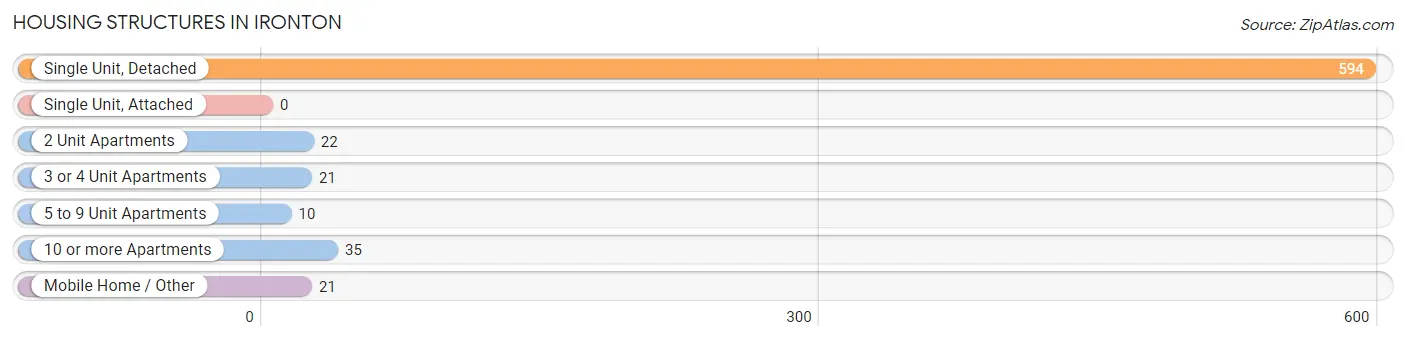
| Structure Type | # Housing Units | % Housing Units |
| Single Unit, Detached | 594 | 84.5% |
| Single Unit, Attached | 0 | 0.0% |
| 2 Unit Apartments | 22 | 3.1% |
| 3 or 4 Unit Apartments | 21 | 3.0% |
| 5 to 9 Unit Apartments | 10 | 1.4% |
| 10 or more Apartments | 35 | 5.0% |
| Mobile Home / Other | 21 | 3.0% |
| Total | 703 | 100.0% |
Housing Structures by Occupancy in Ironton
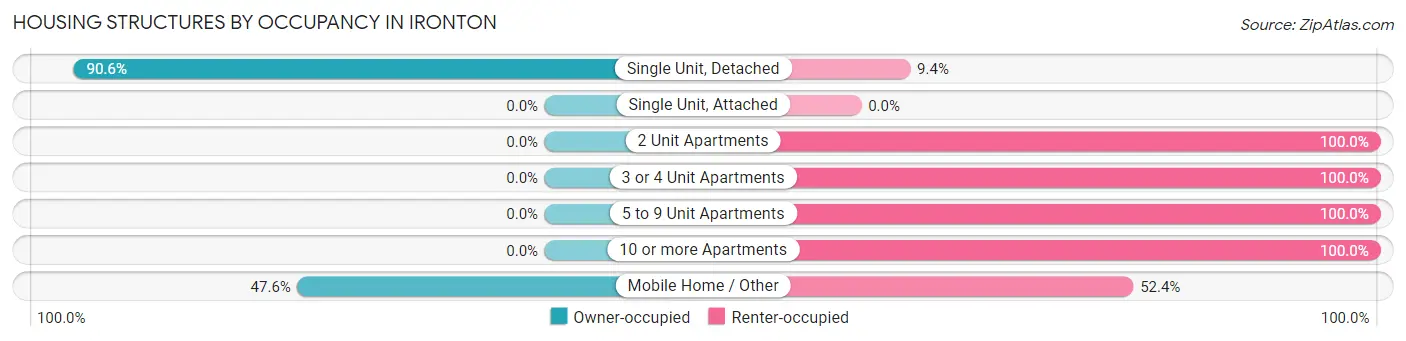
| Structure Type | Owner-occupied | Renter-occupied |
| Single Unit, Detached | 538 (90.6%) | 56 (9.4%) |
| Single Unit, Attached | 0 (0.0%) | 0 (0.0%) |
| 2 Unit Apartments | 0 (0.0%) | 22 (100.0%) |
| 3 or 4 Unit Apartments | 0 (0.0%) | 21 (100.0%) |
| 5 to 9 Unit Apartments | 0 (0.0%) | 10 (100.0%) |
| 10 or more Apartments | 0 (0.0%) | 35 (100.0%) |
| Mobile Home / Other | 10 (47.6%) | 11 (52.4%) |
| Total | 548 (77.9%) | 155 (22.1%) |
Housing Structures by Number of Rooms in Ironton
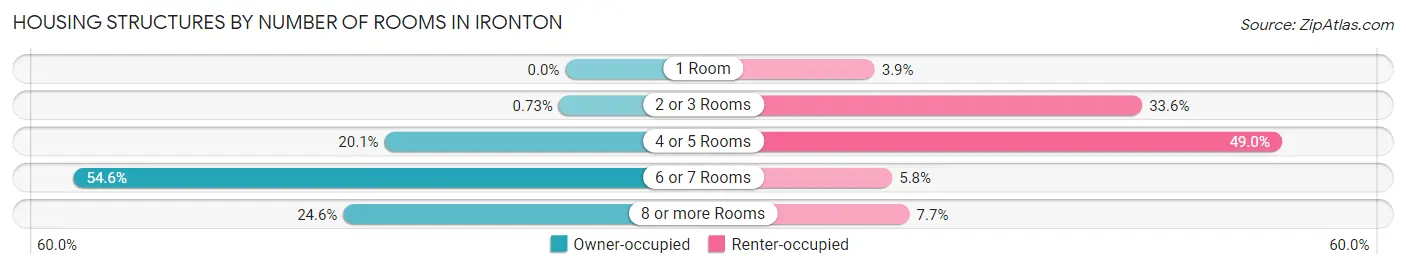
| Number of Rooms | Owner-occupied | Renter-occupied |
| 1 Room | 0 (0.0%) | 6 (3.9%) |
| 2 or 3 Rooms | 4 (0.7%) | 52 (33.6%) |
| 4 or 5 Rooms | 110 (20.1%) | 76 (49.0%) |
| 6 or 7 Rooms | 299 (54.6%) | 9 (5.8%) |
| 8 or more Rooms | 135 (24.6%) | 12 (7.7%) |
| Total | 548 (100.0%) | 155 (100.0%) |
Housing Structure by Heating Type in Ironton
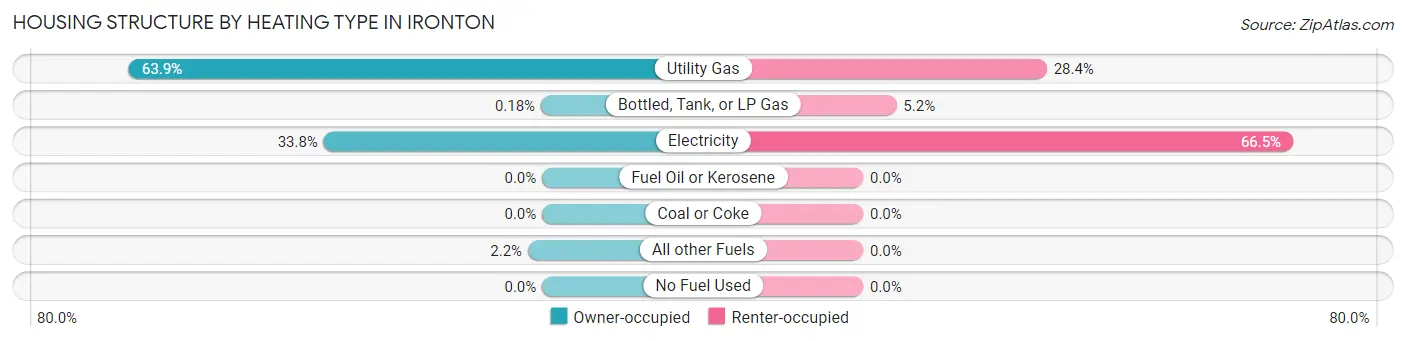
| Heating Type | Owner-occupied | Renter-occupied |
| Utility Gas | 350 (63.9%) | 44 (28.4%) |
| Bottled, Tank, or LP Gas | 1 (0.2%) | 8 (5.2%) |
| Electricity | 185 (33.8%) | 103 (66.4%) |
| Fuel Oil or Kerosene | 0 (0.0%) | 0 (0.0%) |
| Coal or Coke | 0 (0.0%) | 0 (0.0%) |
| All other Fuels | 12 (2.2%) | 0 (0.0%) |
| No Fuel Used | 0 (0.0%) | 0 (0.0%) |
| Total | 548 (100.0%) | 155 (100.0%) |
Household Vehicle Usage in Ironton
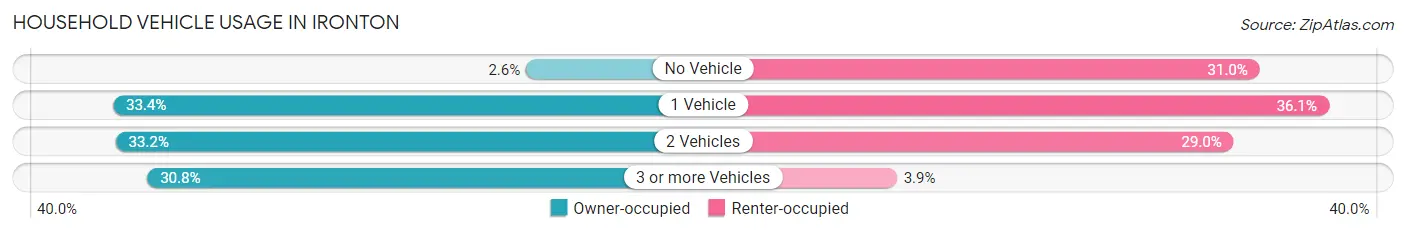
| Vehicles per Household | Owner-occupied | Renter-occupied |
| No Vehicle | 14 (2.5%) | 48 (31.0%) |
| 1 Vehicle | 183 (33.4%) | 56 (36.1%) |
| 2 Vehicles | 182 (33.2%) | 45 (29.0%) |
| 3 or more Vehicles | 169 (30.8%) | 6 (3.9%) |
| Total | 548 (100.0%) | 155 (100.0%) |
Real Estate & Mortgages in Ironton
Real Estate and Mortgage Overview in Ironton
| Characteristic | Without Mortgage | With Mortgage |
| Housing Units | 220 | 328 |
| Median Property Value | $125,000 | $97,000 |
| Median Household Income | $29,583 | $18 |
| Monthly Housing Costs | $380 | $0 |
| Real Estate Taxes | $809 | $6 |
Property Value by Mortgage Status in Ironton
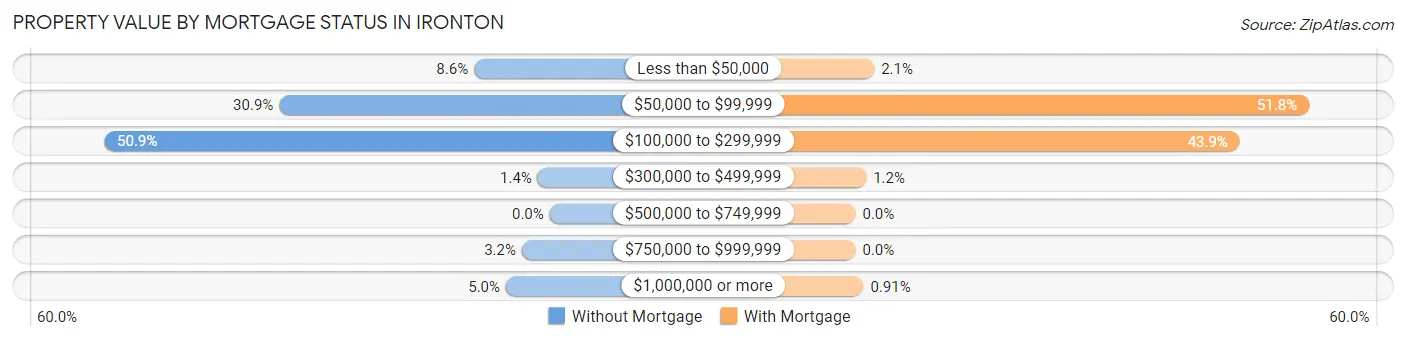
| Property Value | Without Mortgage | With Mortgage |
| Less than $50,000 | 19 (8.6%) | 7 (2.1%) |
| $50,000 to $99,999 | 68 (30.9%) | 170 (51.8%) |
| $100,000 to $299,999 | 112 (50.9%) | 144 (43.9%) |
| $300,000 to $499,999 | 3 (1.4%) | 4 (1.2%) |
| $500,000 to $749,999 | 0 (0.0%) | 0 (0.0%) |
| $750,000 to $999,999 | 7 (3.2%) | 0 (0.0%) |
| $1,000,000 or more | 11 (5.0%) | 3 (0.9%) |
| Total | 220 (100.0%) | 328 (100.0%) |
Household Income by Mortgage Status in Ironton
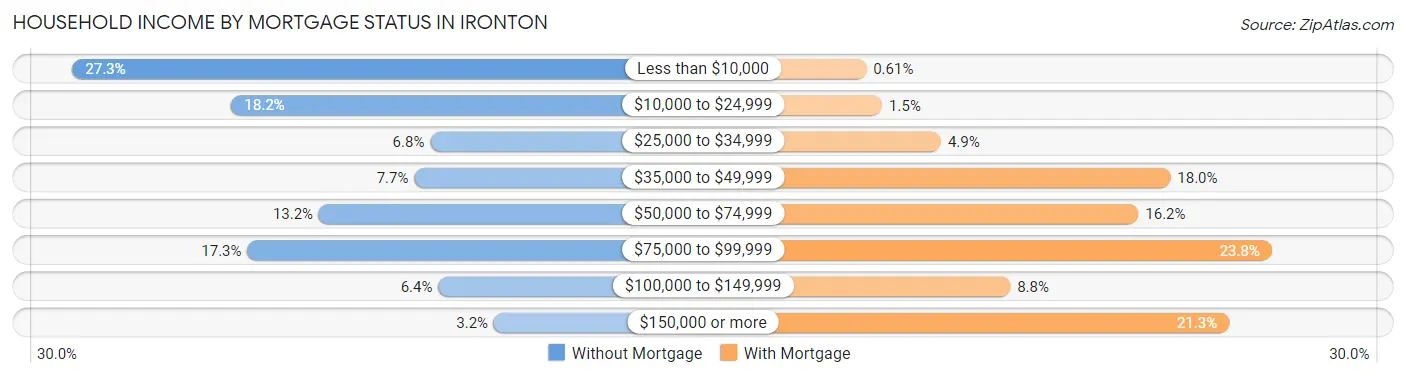
| Household Income | Without Mortgage | With Mortgage |
| Less than $10,000 | 60 (27.3%) | 2 (0.6%) |
| $10,000 to $24,999 | 40 (18.2%) | 5 (1.5%) |
| $25,000 to $34,999 | 15 (6.8%) | 16 (4.9%) |
| $35,000 to $49,999 | 17 (7.7%) | 59 (18.0%) |
| $50,000 to $74,999 | 29 (13.2%) | 53 (16.2%) |
| $75,000 to $99,999 | 38 (17.3%) | 78 (23.8%) |
| $100,000 to $149,999 | 14 (6.4%) | 29 (8.8%) |
| $150,000 or more | 7 (3.2%) | 70 (21.3%) |
| Total | 220 (100.0%) | 328 (100.0%) |
Property Value to Household Income Ratio in Ironton
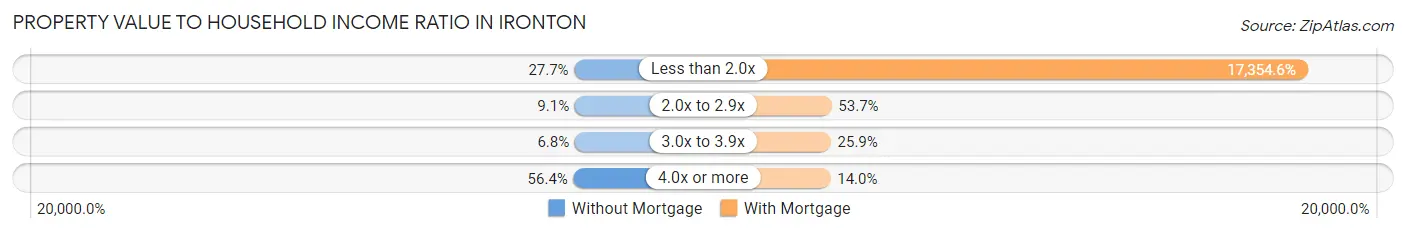
| Value-to-Income Ratio | Without Mortgage | With Mortgage |
| Less than 2.0x | 61 (27.7%) | 56,923 (17,354.6%) |
| 2.0x to 2.9x | 20 (9.1%) | 176 (53.7%) |
| 3.0x to 3.9x | 15 (6.8%) | 85 (25.9%) |
| 4.0x or more | 124 (56.4%) | 46 (14.0%) |
| Total | 220 (100.0%) | 328 (100.0%) |
Real Estate Taxes by Mortgage Status in Ironton
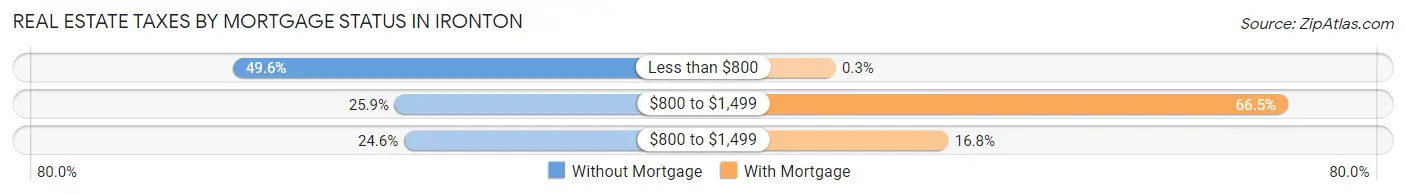
| Property Taxes | Without Mortgage | With Mortgage |
| Less than $800 | 109 (49.5%) | 1 (0.3%) |
| $800 to $1,499 | 57 (25.9%) | 218 (66.5%) |
| $800 to $1,499 | 54 (24.5%) | 55 (16.8%) |
| Total | 220 (100.0%) | 328 (100.0%) |
Health & Disability in Ironton
Health Insurance Coverage by Age in Ironton
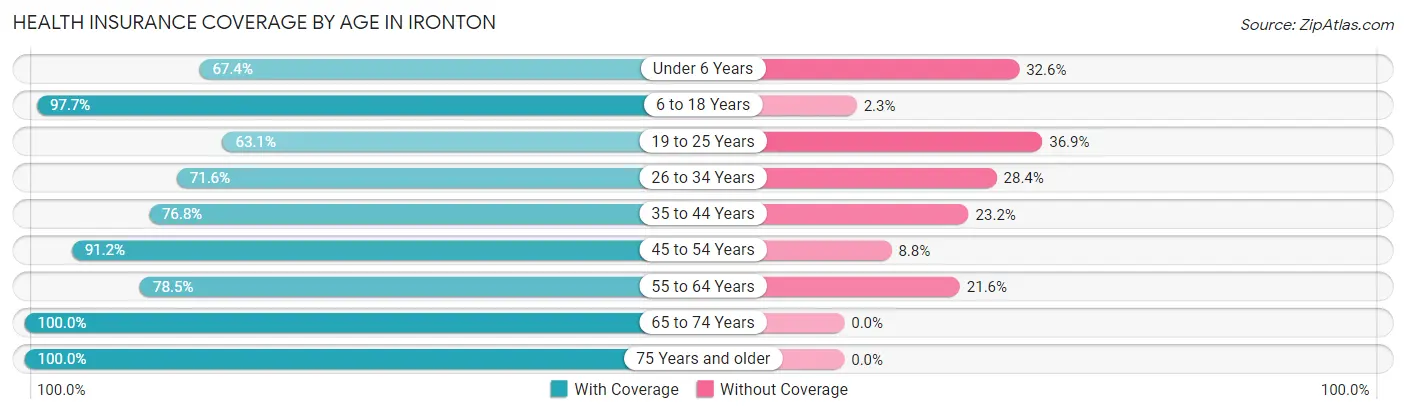
| Age Bracket | With Coverage | Without Coverage |
| Under 6 Years | 95 (67.4%) | 46 (32.6%) |
| 6 to 18 Years | 339 (97.7%) | 8 (2.3%) |
| 19 to 25 Years | 41 (63.1%) | 24 (36.9%) |
| 26 to 34 Years | 121 (71.6%) | 48 (28.4%) |
| 35 to 44 Years | 202 (76.8%) | 61 (23.2%) |
| 45 to 54 Years | 83 (91.2%) | 8 (8.8%) |
| 55 to 64 Years | 182 (78.4%) | 50 (21.5%) |
| 65 to 74 Years | 154 (100.0%) | 0 (0.0%) |
| 75 Years and older | 126 (100.0%) | 0 (0.0%) |
| Total | 1,343 (84.6%) | 245 (15.4%) |
Health Insurance Coverage by Citizenship Status in Ironton
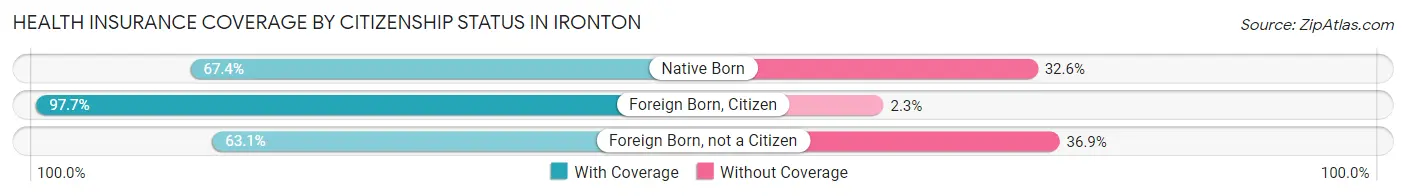
| Citizenship Status | With Coverage | Without Coverage |
| Native Born | 95 (67.4%) | 46 (32.6%) |
| Foreign Born, Citizen | 339 (97.7%) | 8 (2.3%) |
| Foreign Born, not a Citizen | 41 (63.1%) | 24 (36.9%) |
Health Insurance Coverage by Household Income in Ironton
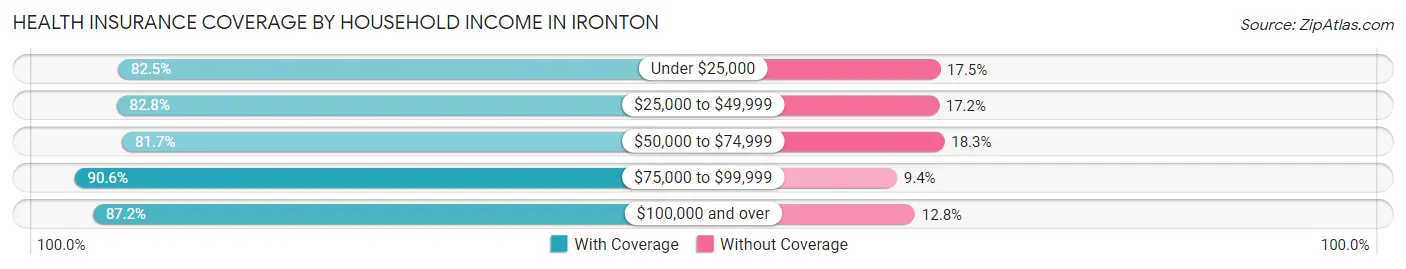
| Household Income | With Coverage | Without Coverage |
| Under $25,000 | 236 (82.5%) | 50 (17.5%) |
| $25,000 to $49,999 | 336 (82.8%) | 70 (17.2%) |
| $50,000 to $74,999 | 255 (81.7%) | 57 (18.3%) |
| $75,000 to $99,999 | 174 (90.6%) | 18 (9.4%) |
| $100,000 and over | 342 (87.2%) | 50 (12.8%) |
Public vs Private Health Insurance Coverage by Age in Ironton
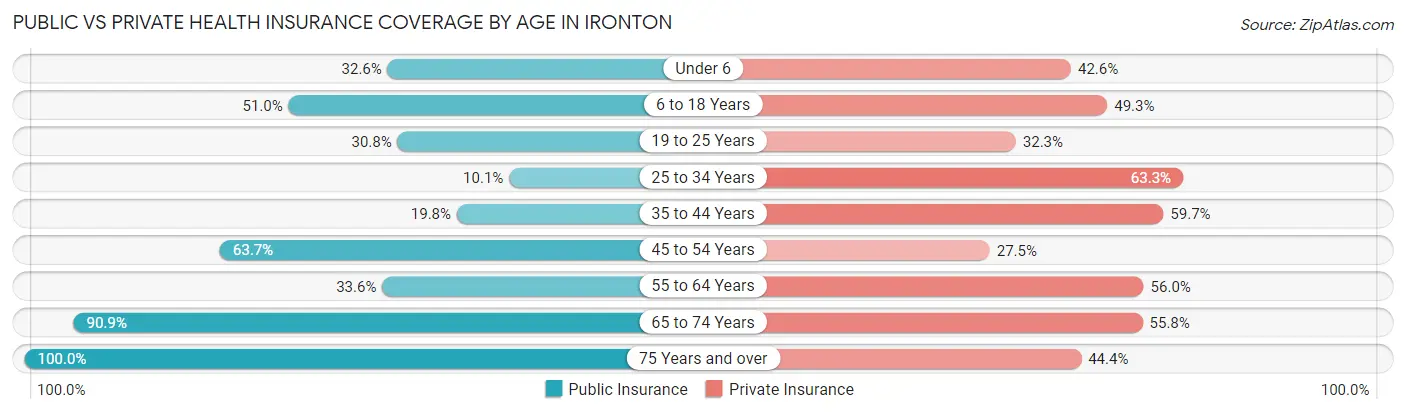
| Age Bracket | Public Insurance | Private Insurance |
| Under 6 | 46 (32.6%) | 60 (42.5%) |
| 6 to 18 Years | 177 (51.0%) | 171 (49.3%) |
| 19 to 25 Years | 20 (30.8%) | 21 (32.3%) |
| 25 to 34 Years | 17 (10.1%) | 107 (63.3%) |
| 35 to 44 Years | 52 (19.8%) | 157 (59.7%) |
| 45 to 54 Years | 58 (63.7%) | 25 (27.5%) |
| 55 to 64 Years | 78 (33.6%) | 130 (56.0%) |
| 65 to 74 Years | 140 (90.9%) | 86 (55.8%) |
| 75 Years and over | 126 (100.0%) | 56 (44.4%) |
| Total | 714 (45.0%) | 813 (51.2%) |
Disability Status by Sex by Age in Ironton
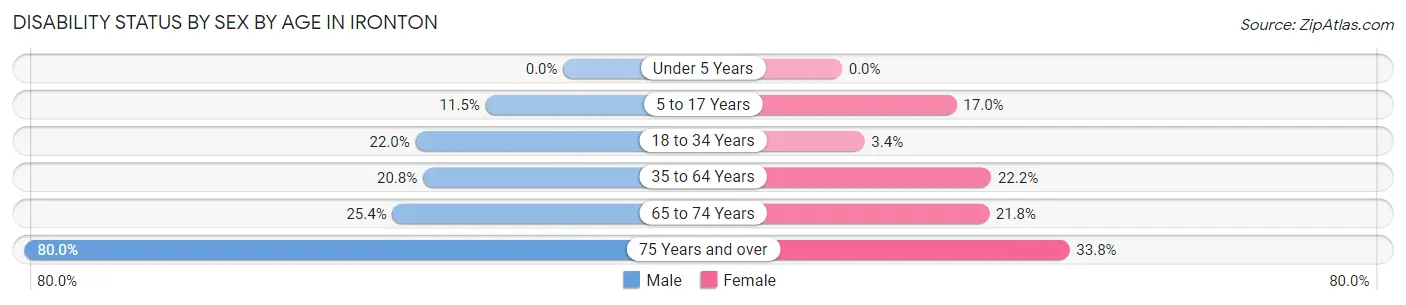
| Age Bracket | Male | Female |
| Under 5 Years | 0 (0.0%) | 0 (0.0%) |
| 5 to 17 Years | 21 (11.5%) | 32 (17.0%) |
| 18 to 34 Years | 27 (22.0%) | 4 (3.4%) |
| 35 to 64 Years | 60 (20.8%) | 66 (22.2%) |
| 65 to 74 Years | 17 (25.4%) | 19 (21.8%) |
| 75 Years and over | 44 (80.0%) | 24 (33.8%) |
Disability Class by Sex by Age in Ironton
Disability Class: Hearing Difficulty
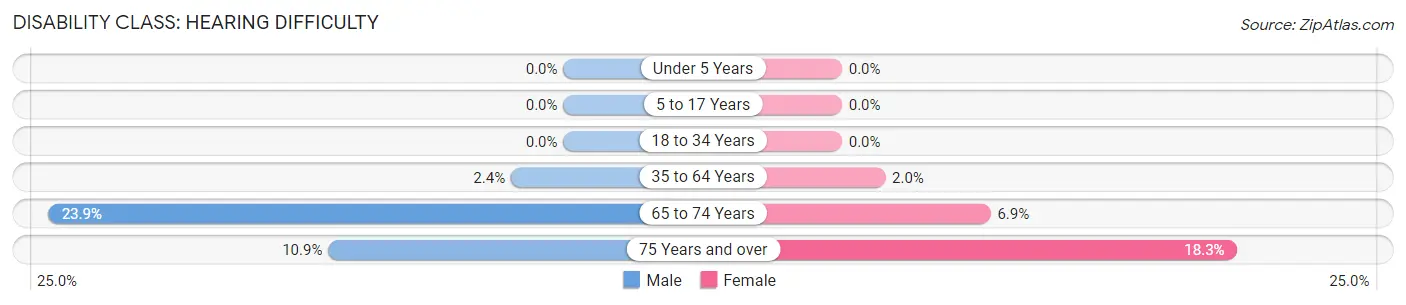
| Age Bracket | Male | Female |
| Under 5 Years | 0 (0.0%) | 0 (0.0%) |
| 5 to 17 Years | 0 (0.0%) | 0 (0.0%) |
| 18 to 34 Years | 0 (0.0%) | 0 (0.0%) |
| 35 to 64 Years | 7 (2.4%) | 6 (2.0%) |
| 65 to 74 Years | 16 (23.9%) | 6 (6.9%) |
| 75 Years and over | 6 (10.9%) | 13 (18.3%) |
Disability Class: Vision Difficulty
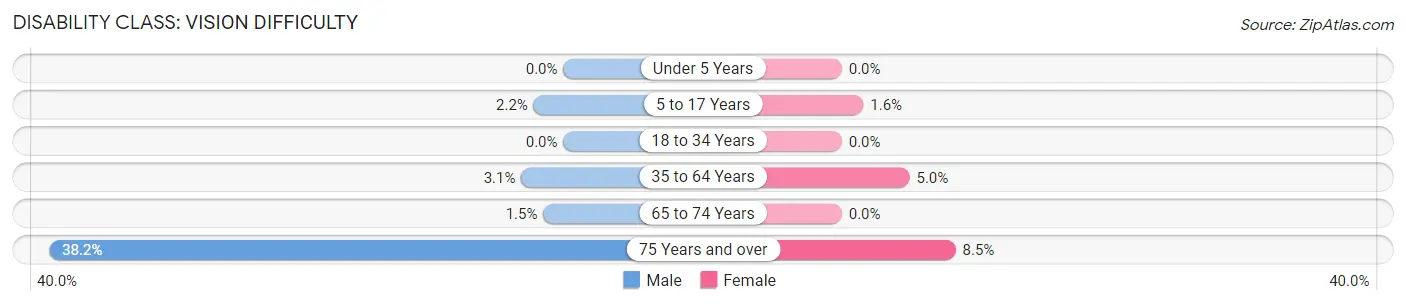
| Age Bracket | Male | Female |
| Under 5 Years | 0 (0.0%) | 0 (0.0%) |
| 5 to 17 Years | 4 (2.2%) | 3 (1.6%) |
| 18 to 34 Years | 0 (0.0%) | 0 (0.0%) |
| 35 to 64 Years | 9 (3.1%) | 15 (5.0%) |
| 65 to 74 Years | 1 (1.5%) | 0 (0.0%) |
| 75 Years and over | 21 (38.2%) | 6 (8.5%) |
Disability Class: Cognitive Difficulty
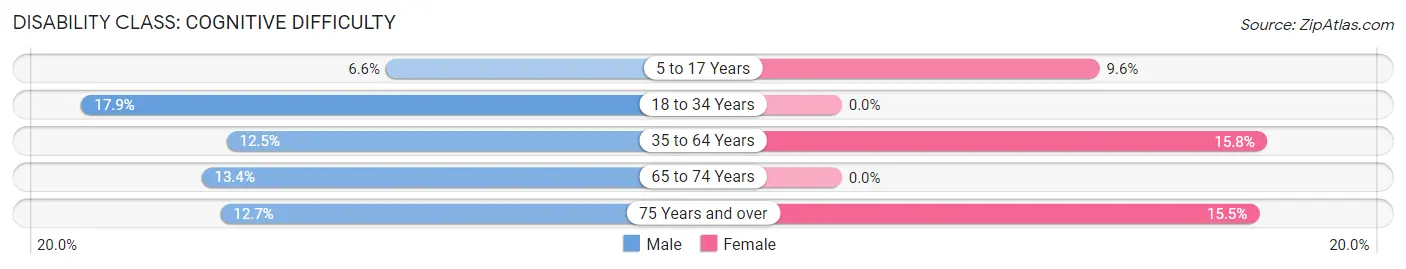
| Age Bracket | Male | Female |
| 5 to 17 Years | 12 (6.6%) | 18 (9.6%) |
| 18 to 34 Years | 22 (17.9%) | 0 (0.0%) |
| 35 to 64 Years | 36 (12.5%) | 47 (15.8%) |
| 65 to 74 Years | 9 (13.4%) | 0 (0.0%) |
| 75 Years and over | 7 (12.7%) | 11 (15.5%) |
Disability Class: Ambulatory Difficulty
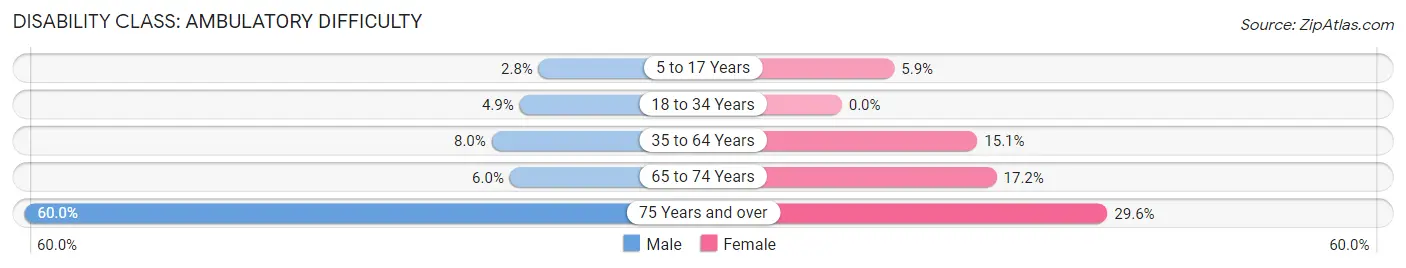
| Age Bracket | Male | Female |
| 5 to 17 Years | 5 (2.8%) | 11 (5.9%) |
| 18 to 34 Years | 6 (4.9%) | 0 (0.0%) |
| 35 to 64 Years | 23 (8.0%) | 45 (15.1%) |
| 65 to 74 Years | 4 (6.0%) | 15 (17.2%) |
| 75 Years and over | 33 (60.0%) | 21 (29.6%) |
Disability Class: Self-Care Difficulty
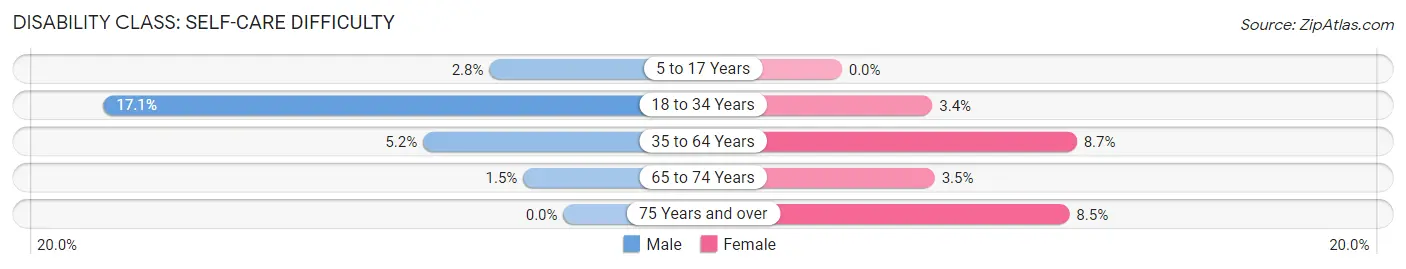
| Age Bracket | Male | Female |
| 5 to 17 Years | 5 (2.8%) | 0 (0.0%) |
| 18 to 34 Years | 21 (17.1%) | 4 (3.4%) |
| 35 to 64 Years | 15 (5.2%) | 26 (8.7%) |
| 65 to 74 Years | 1 (1.5%) | 3 (3.5%) |
| 75 Years and over | 0 (0.0%) | 6 (8.5%) |
Technology Access in Ironton
Computing Device Access in Ironton
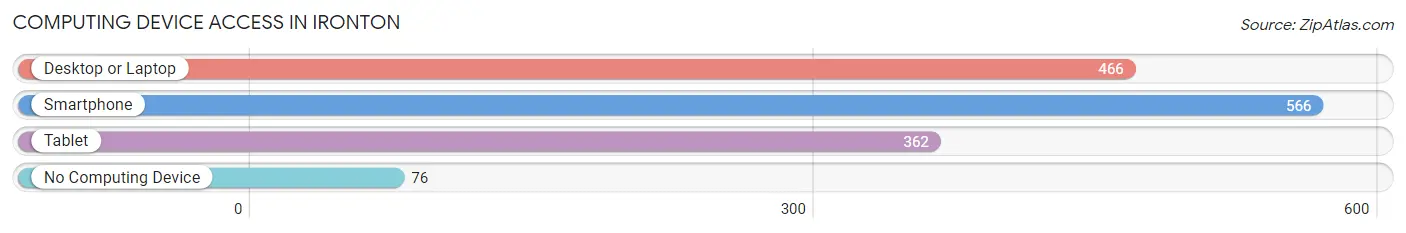
| Device Type | # Households | % Households |
| Desktop or Laptop | 466 | 66.3% |
| Smartphone | 566 | 80.5% |
| Tablet | 362 | 51.5% |
| No Computing Device | 76 | 10.8% |
| Total | 703 | 100.0% |
Internet Access in Ironton
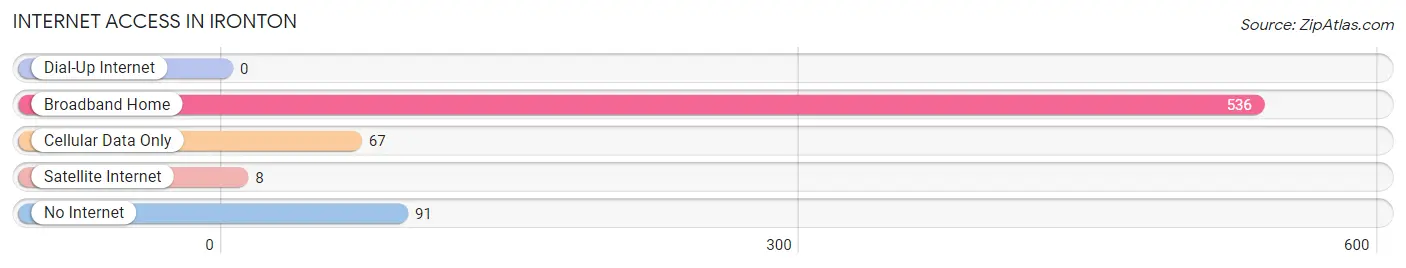
| Internet Type | # Households | % Households |
| Dial-Up Internet | 0 | 0.0% |
| Broadband Home | 536 | 76.2% |
| Cellular Data Only | 67 | 9.5% |
| Satellite Internet | 8 | 1.1% |
| No Internet | 91 | 12.9% |
| Total | 703 | 100.0% |
Ironton Summary
Ironton is a small city located in Iron County, Missouri, United States. It is the county seat of Iron County and is located in the southeastern corner of the state. The population was 1,817 at the 2010 census.
History
Ironton was founded in 1857 by a group of settlers from the nearby town of Pilot Knob. The town was named after the iron ore deposits that were discovered in the area. The ore was used to make iron products such as nails, tools, and other items. The town quickly grew and by the late 1800s, it was a thriving community with a population of over 1,000.
The town was also home to a number of businesses, including a sawmill, a grist mill, a blacksmith shop, and a general store. The town also had a number of churches, including the Methodist Episcopal Church, the Baptist Church, and the Presbyterian Church.
In the early 1900s, the town began to decline as the iron ore deposits were depleted and the businesses began to close. The population dropped to just over 500 by the 1950s. However, the town has seen a resurgence in recent years as it has become a popular tourist destination.
Geography
Ironton is located at 37°45'25" North, 90°45'25" West (37.756944, -90.756944). The city is situated in the southeastern corner of Iron County, near the border with Madison County. It is located about 25 miles south of Farmington and about 40 miles north of Cape Girardeau.
The city has a total area of 1.2 square miles, all of which is land. The city is located in a hilly area and is surrounded by forests. The nearest major body of water is the Black River, which is located about 10 miles to the east.
Economy
The economy of Ironton is largely based on tourism. The city is home to a number of attractions, including the Iron County Historical Museum, the Iron County Courthouse, and the Iron County Jail. The city also has a number of restaurants, shops, and other businesses.
The city is also home to a number of manufacturing companies, including a steel mill and a paper mill. The city is also home to a number of small businesses, including a number of antique stores.
Demographics
As of the 2010 census, there were 1,817 people, 745 households, and 463 families residing in the city. The population density was 1,521.2 people per square mile. The racial makeup of the city was 97.2% White, 0.7% African American, 0.2% Native American, 0.2% Asian, 0.1% Pacific Islander, 0.3% from other races, and 1.3% from two or more races. Hispanic or Latino of any race were 1.2% of the population.
The median income for a household in the city was $30,938, and the median income for a family was $37,500. Males had a median income of $30,000 versus $20,000 for females. The per capita income for the city was $15,945. About 11.2% of families and 14.2% of the population were below the poverty line, including 18.2% of those under age 18 and 11.2% of those age 65 or over.
Common Questions
What is Per Capita Income in Ironton?
Per Capita income in Ironton is $22,920.
What is the Median Family Income in Ironton?
Median Family Income in Ironton is $63,125.
What is the Median Household income in Ironton?
Median Household Income in Ironton is $43,606.
What is Income or Wage Gap in Ironton?
Income or Wage Gap in Ironton is 28.1%.
Women in Ironton earn 71.9 cents for every dollar earned by a man.
What is Family Income Deficit in Ironton?
Family Income Deficit in Ironton is $9,640.
Families that are below poverty line in Ironton earn $9,640 less on average than the poverty threshold level.
What is Inequality or Gini Index in Ironton?
Inequality or Gini Index in Ironton is 0.43.
What is the Total Population of Ironton?
Total Population of Ironton is 1,639.
What is the Total Male Population of Ironton?
Total Male Population of Ironton is 840.
What is the Total Female Population of Ironton?
Total Female Population of Ironton is 799.
What is the Ratio of Males per 100 Females in Ironton?
There are 105.13 Males per 100 Females in Ironton.
What is the Ratio of Females per 100 Males in Ironton?
There are 95.12 Females per 100 Males in Ironton.
What is the Median Population Age in Ironton?
Median Population Age in Ironton is 37.2 Years.
What is the Average Family Size in Ironton
Average Family Size in Ironton is 3.0 People.
What is the Average Household Size in Ironton
Average Household Size in Ironton is 2.3 People.
How Large is the Labor Force in Ironton?
There are 609 People in the Labor Forcein in Ironton.
What is the Percentage of People in the Labor Force in Ironton?
51.8% of People are in the Labor Force in Ironton.
What is the Unemployment Rate in Ironton?
Unemployment Rate in Ironton is 5.4%.