Hunnewell, MO Map & Demographics
Hunnewell Map
Hunnewell Overview
$23,719
PER CAPITA INCOME
$63,750
AVG FAMILY INCOME
$41,250
AVG HOUSEHOLD INCOME
0.41
INEQUALITY / GINI INDEX
164
TOTAL POPULATION
97
MALE POPULATION
67
FEMALE POPULATION
144.78
MALES / 100 FEMALES
69.07
FEMALES / 100 MALES
53.3
MEDIAN AGE
2.7
AVG FAMILY SIZE
2.1
AVG HOUSEHOLD SIZE
79
LABOR FORCE [ PEOPLE ]
56.4%
PERCENT IN LABOR FORCE
Hunnewell Zip Codes
Hunnewell Area Codes
Income in Hunnewell
Income Overview in Hunnewell
Per Capita Income in Hunnewell is $23,719, while median incomes of families and households are $63,750 and $41,250 respectively.
| Characteristic | Number | Measure |
| Per Capita Income | 164 | $23,719 |
| Median Family Income | 39 | $63,750 |
| Mean Family Income | 39 | $63,031 |
| Median Household Income | 79 | $41,250 |
| Mean Household Income | 79 | $46,795 |
| Income Deficit | 39 | $0 |
| Wage / Income Gap (%) | 164 | 0.00% |
| Wage / Income Gap ($) | 164 | 100.00¢ per $1 |
| Gini / Inequality Index | 164 | 0.41 |
Earnings by Sex in Hunnewell
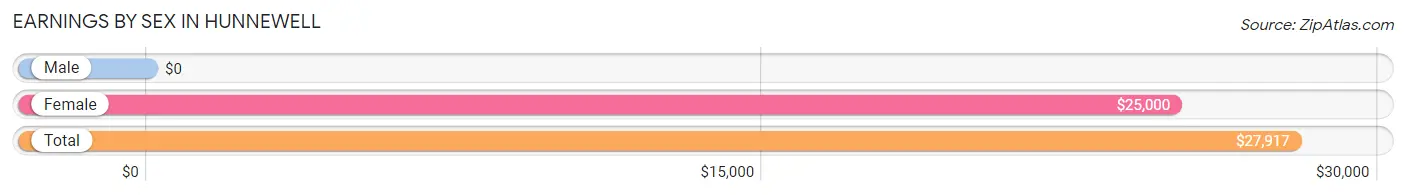
| Sex | Number | Average Earnings |
| Male | 47 (56.6%) | $0 |
| Female | 36 (43.4%) | $25,000 |
| Total | 83 (100.0%) | $27,917 |
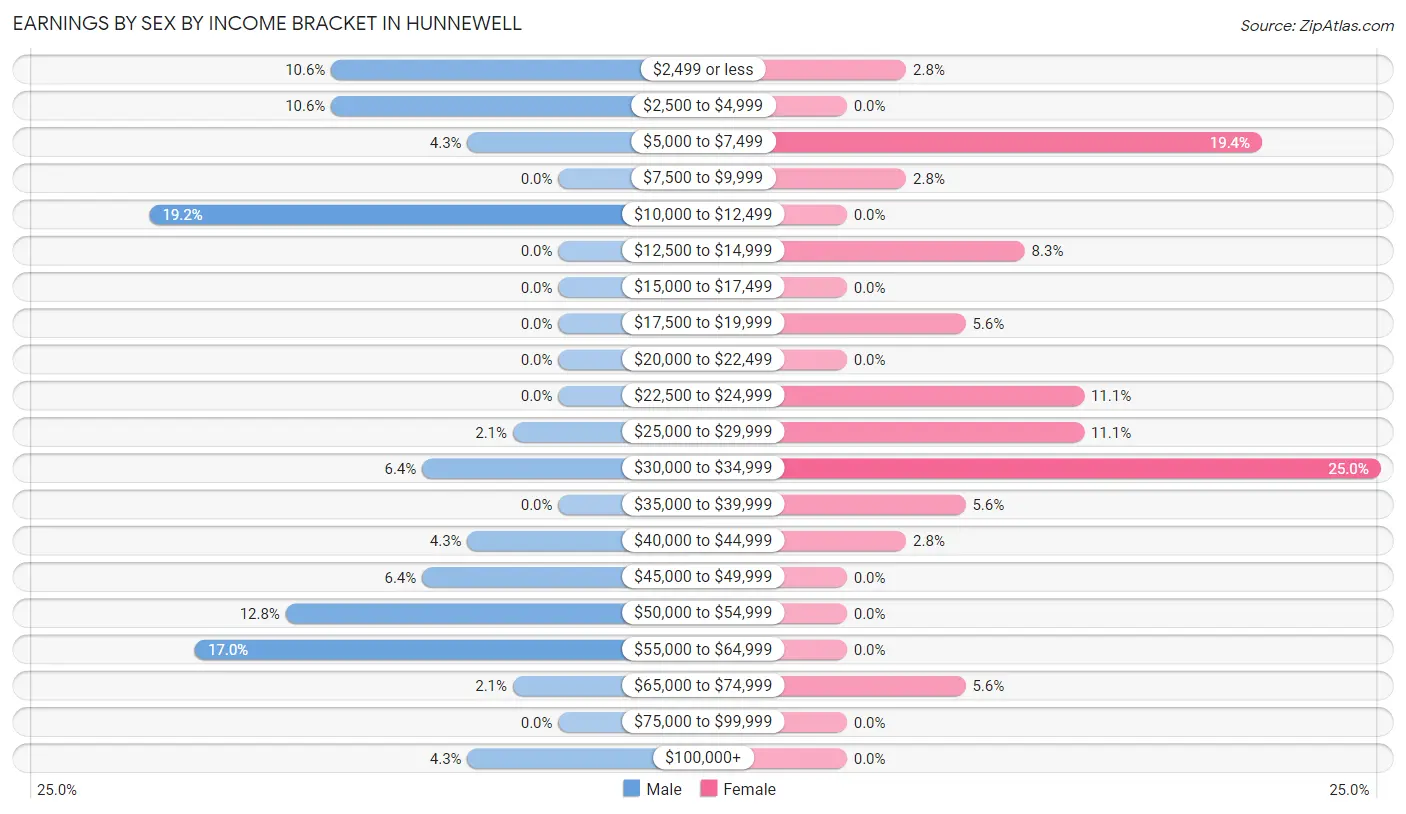
Earnings by Sex by Income Bracket in Hunnewell
The most common earnings brackets in Hunnewell are $10,000 to $12,499 for men (9 | 19.2%) and $30,000 to $34,999 for women (9 | 25.0%).
| Income | Male | Female |
| $2,499 or less | 5 (10.6%) | 1 (2.8%) |
| $2,500 to $4,999 | 5 (10.6%) | 0 (0.0%) |
| $5,000 to $7,499 | 2 (4.3%) | 7 (19.4%) |
| $7,500 to $9,999 | 0 (0.0%) | 1 (2.8%) |
| $10,000 to $12,499 | 9 (19.2%) | 0 (0.0%) |
| $12,500 to $14,999 | 0 (0.0%) | 3 (8.3%) |
| $15,000 to $17,499 | 0 (0.0%) | 0 (0.0%) |
| $17,500 to $19,999 | 0 (0.0%) | 2 (5.6%) |
| $20,000 to $22,499 | 0 (0.0%) | 0 (0.0%) |
| $22,500 to $24,999 | 0 (0.0%) | 4 (11.1%) |
| $25,000 to $29,999 | 1 (2.1%) | 4 (11.1%) |
| $30,000 to $34,999 | 3 (6.4%) | 9 (25.0%) |
| $35,000 to $39,999 | 0 (0.0%) | 2 (5.6%) |
| $40,000 to $44,999 | 2 (4.3%) | 1 (2.8%) |
| $45,000 to $49,999 | 3 (6.4%) | 0 (0.0%) |
| $50,000 to $54,999 | 6 (12.8%) | 0 (0.0%) |
| $55,000 to $64,999 | 8 (17.0%) | 0 (0.0%) |
| $65,000 to $74,999 | 1 (2.1%) | 2 (5.6%) |
| $75,000 to $99,999 | 0 (0.0%) | 0 (0.0%) |
| $100,000+ | 2 (4.3%) | 0 (0.0%) |
| Total | 47 (100.0%) | 36 (100.0%) |
Earnings by Sex by Educational Attainment in Hunnewell
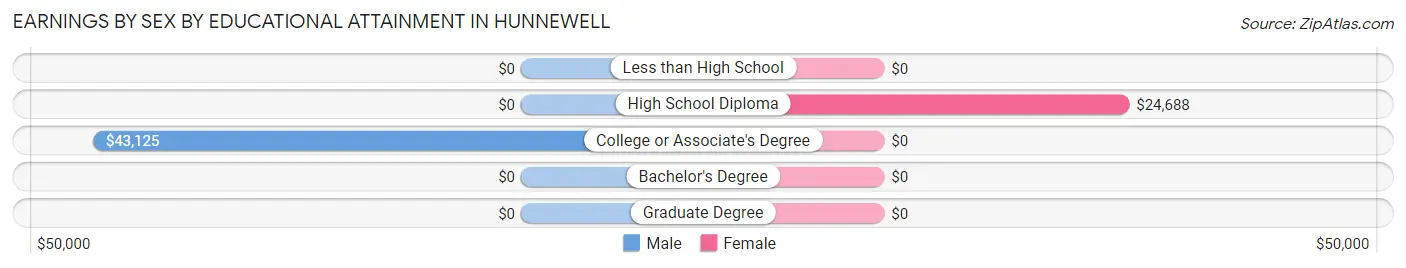
| Educational Attainment | Male Income | Female Income |
| Less than High School | - | - |
| High School Diploma | - | - |
| College or Associate's Degree | $43,125 | $0 |
| Bachelor's Degree | - | - |
| Graduate Degree | - | - |
| Total | - | - |
Family Income in Hunnewell
Family Income Brackets in Hunnewell
According to the Hunnewell family income data, there are 12 families falling into the $35,000 to $49,999 income range, which is the most common income bracket and makes up 30.8% of all families.
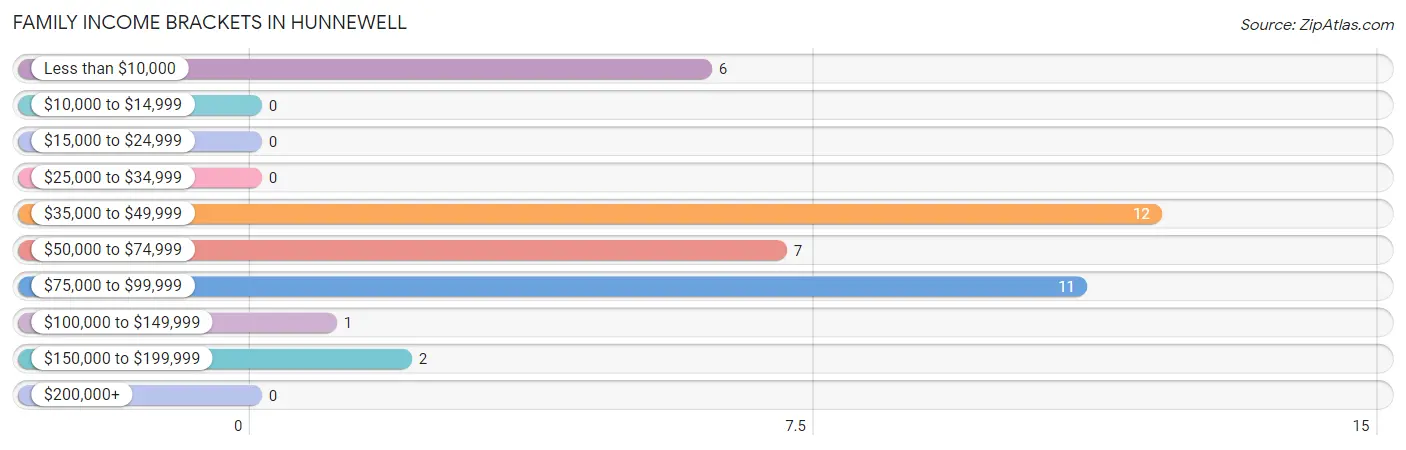
| Income Bracket | # Families | % Families |
| Less than $10,000 | 6 | 15.4% |
| $10,000 to $14,999 | 0 | 0.0% |
| $15,000 to $24,999 | 0 | 0.0% |
| $25,000 to $34,999 | 0 | 0.0% |
| $35,000 to $49,999 | 12 | 30.8% |
| $50,000 to $74,999 | 7 | 17.9% |
| $75,000 to $99,999 | 11 | 28.2% |
| $100,000 to $149,999 | 1 | 2.6% |
| $150,000 to $199,999 | 2 | 5.1% |
| $200,000+ | 0 | 0.0% |
Family Income by Famaliy Size in Hunnewell
3-person families (14 | 35.9%) account for the highest median family income in Hunnewell with $75,000 per family, while 3-person families (14 | 35.9%) have the highest median income of $25,000 per family member.
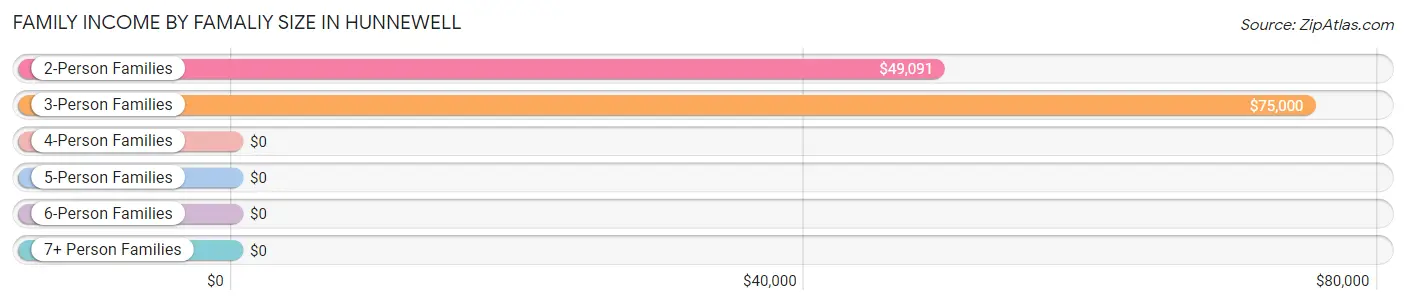
| Income Bracket | # Families | Median Income |
| 2-Person Families | 22 (56.4%) | $49,091 |
| 3-Person Families | 14 (35.9%) | $75,000 |
| 4-Person Families | 0 (0.0%) | $0 |
| 5-Person Families | 3 (7.7%) | $0 |
| 6-Person Families | 0 (0.0%) | $0 |
| 7+ Person Families | 0 (0.0%) | $0 |
| Total | 39 (100.0%) | $63,750 |
Family Income by Number of Earners in Hunnewell
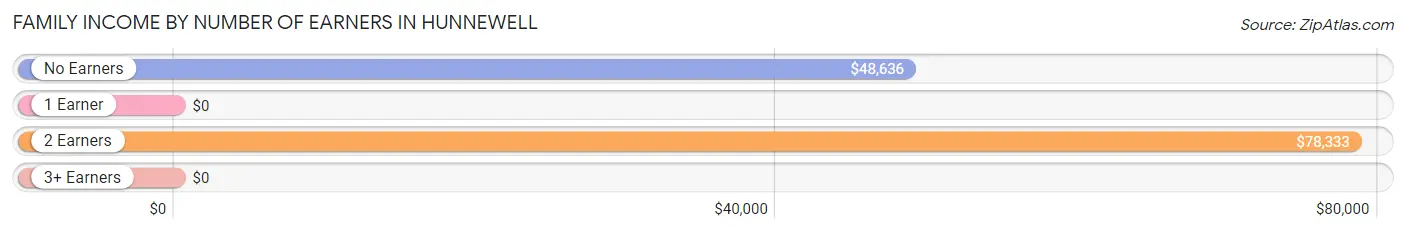
| Number of Earners | # Families | Median Income |
| No Earners | 16 (41.0%) | $48,636 |
| 1 Earner | 4 (10.3%) | $0 |
| 2 Earners | 12 (30.8%) | $78,333 |
| 3+ Earners | 7 (17.9%) | $0 |
| Total | 39 (100.0%) | $63,750 |
Household Income in Hunnewell
Household Income Brackets in Hunnewell
With 20 households falling in the category, the $15,000 to $24,999 income range is the most frequent in Hunnewell, accounting for 25.3% of all households.
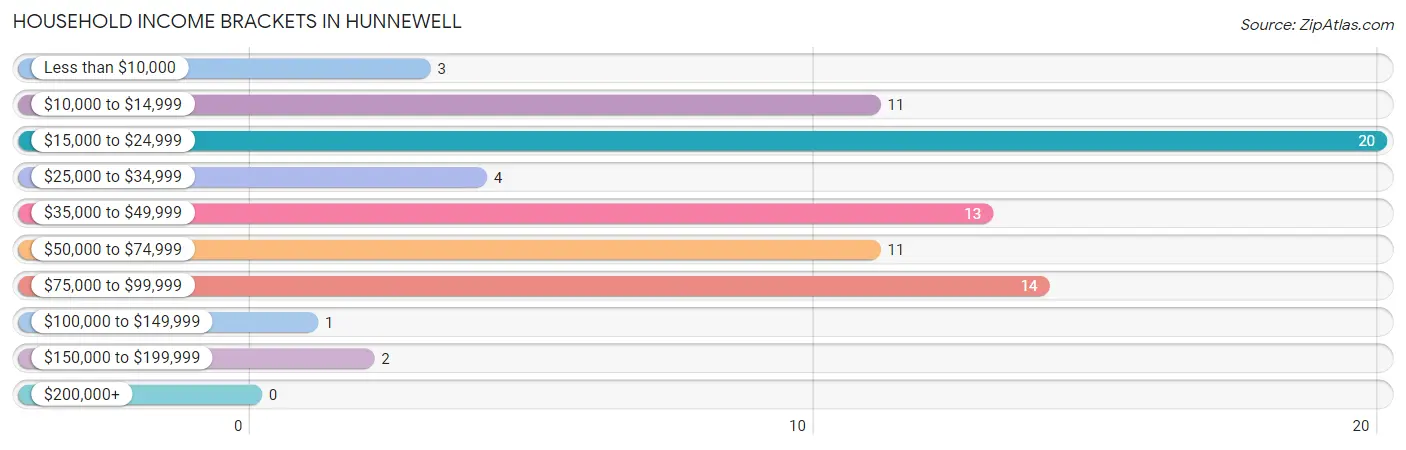
| Income Bracket | # Households | % Households |
| Less than $10,000 | 3 | 3.8% |
| $10,000 to $14,999 | 11 | 13.9% |
| $15,000 to $24,999 | 20 | 25.3% |
| $25,000 to $34,999 | 4 | 5.1% |
| $35,000 to $49,999 | 13 | 16.5% |
| $50,000 to $74,999 | 11 | 13.9% |
| $75,000 to $99,999 | 14 | 17.7% |
| $100,000 to $149,999 | 1 | 1.3% |
| $150,000 to $199,999 | 2 | 2.5% |
| $200,000+ | 0 | 0.0% |
Household Income by Householder Age in Hunnewell
The median household income in Hunnewell is $41,250, with the highest median household income of $79,583 found in the 25 to 44 years age bracket for the primary householder. A total of 15 households (19.0%) fall into this category.
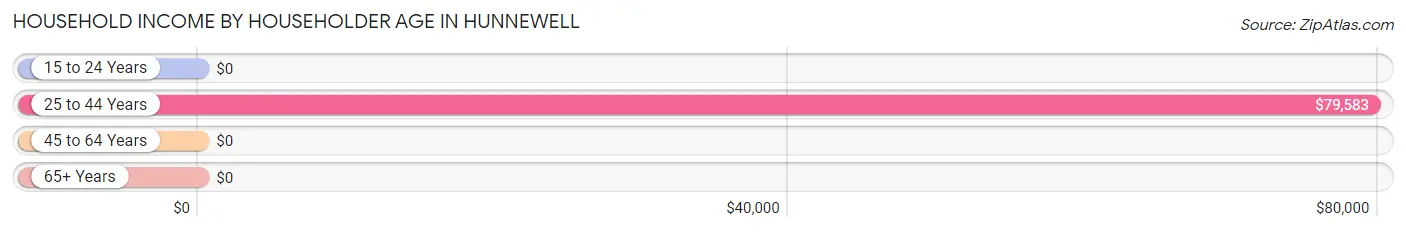
| Income Bracket | # Households | Median Income |
| 15 to 24 Years | 0 (0.0%) | $0 |
| 25 to 44 Years | 15 (19.0%) | $79,583 |
| 45 to 64 Years | 31 (39.2%) | $0 |
| 65+ Years | 33 (41.8%) | $0 |
| Total | 79 (100.0%) | $41,250 |
Poverty in Hunnewell
Income Below Poverty by Sex and Age in Hunnewell
With 23.7% poverty level for males and 22.4% for females among the residents of Hunnewell, 55 to 64 year old males and 12 to 14 year old females are the most vulnerable to poverty, with 9 males (60.0%) and 4 females (100.0%) in their respective age groups living below the poverty level.
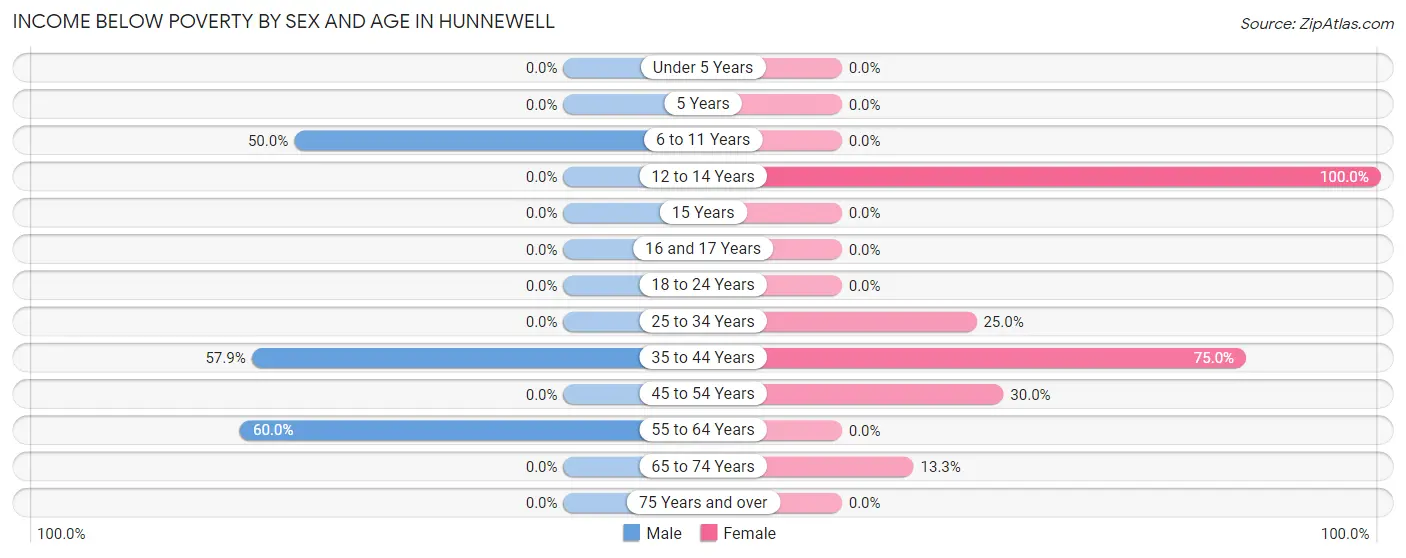
| Age Bracket | Male | Female |
| Under 5 Years | 0 (0.0%) | 0 (0.0%) |
| 5 Years | 0 (0.0%) | 0 (0.0%) |
| 6 to 11 Years | 3 (50.0%) | 0 (0.0%) |
| 12 to 14 Years | 0 (0.0%) | 4 (100.0%) |
| 15 Years | 0 (0.0%) | 0 (0.0%) |
| 16 and 17 Years | 0 (0.0%) | 0 (0.0%) |
| 18 to 24 Years | 0 (0.0%) | 0 (0.0%) |
| 25 to 34 Years | 0 (0.0%) | 3 (25.0%) |
| 35 to 44 Years | 11 (57.9%) | 3 (75.0%) |
| 45 to 54 Years | 0 (0.0%) | 3 (30.0%) |
| 55 to 64 Years | 9 (60.0%) | 0 (0.0%) |
| 65 to 74 Years | 0 (0.0%) | 2 (13.3%) |
| 75 Years and over | 0 (0.0%) | 0 (0.0%) |
| Total | 23 (23.7%) | 15 (22.4%) |
Income Above Poverty by Sex and Age in Hunnewell
According to the poverty statistics in Hunnewell, males aged under 5 years and females aged 6 to 11 years are the age groups that are most secure financially, with 100.0% of males and 100.0% of females in these age groups living above the poverty line.
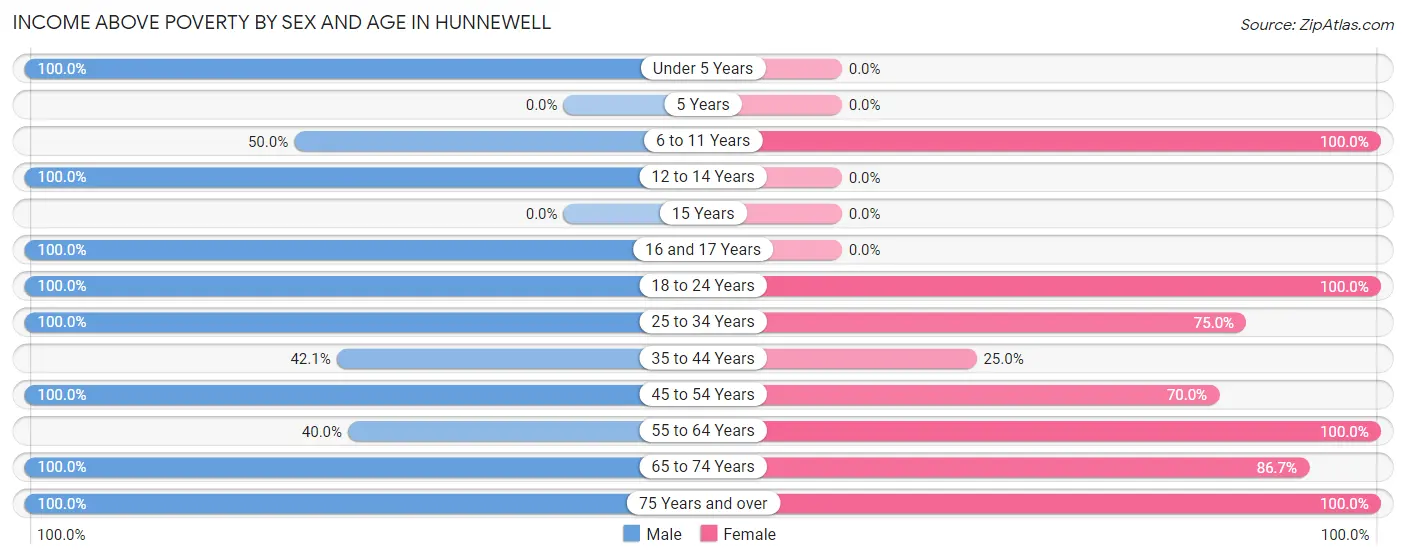
| Age Bracket | Male | Female |
| Under 5 Years | 5 (100.0%) | 0 (0.0%) |
| 5 Years | 0 (0.0%) | 0 (0.0%) |
| 6 to 11 Years | 3 (50.0%) | 4 (100.0%) |
| 12 to 14 Years | 5 (100.0%) | 0 (0.0%) |
| 15 Years | 0 (0.0%) | 0 (0.0%) |
| 16 and 17 Years | 2 (100.0%) | 0 (0.0%) |
| 18 to 24 Years | 3 (100.0%) | 1 (100.0%) |
| 25 to 34 Years | 4 (100.0%) | 9 (75.0%) |
| 35 to 44 Years | 8 (42.1%) | 1 (25.0%) |
| 45 to 54 Years | 9 (100.0%) | 7 (70.0%) |
| 55 to 64 Years | 6 (40.0%) | 13 (100.0%) |
| 65 to 74 Years | 24 (100.0%) | 13 (86.7%) |
| 75 Years and over | 5 (100.0%) | 4 (100.0%) |
| Total | 74 (76.3%) | 52 (77.6%) |
Income Below Poverty Among Married-Couple Families in Hunnewell
The poverty statistics for married-couple families in Hunnewell show that 9.1% or 3 of the total 33 families live below the poverty line. Families with no children have the highest poverty rate of 11.1%, comprising of 3 families. On the other hand, families with 1 or 2 children have the lowest poverty rate of 0.0%, which includes 0 families.
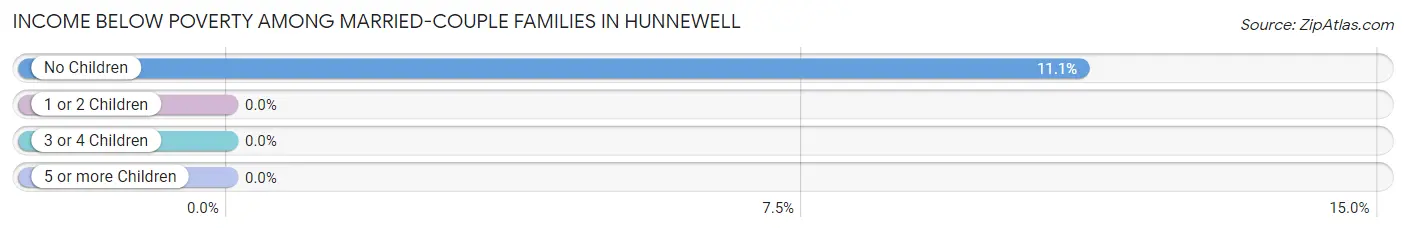
| Children | Above Poverty | Below Poverty |
| No Children | 24 (88.9%) | 3 (11.1%) |
| 1 or 2 Children | 3 (100.0%) | 0 (0.0%) |
| 3 or 4 Children | 3 (100.0%) | 0 (0.0%) |
| 5 or more Children | 0 (0.0%) | 0 (0.0%) |
| Total | 30 (90.9%) | 3 (9.1%) |
Income Below Poverty Among Single-Parent Households in Hunnewell
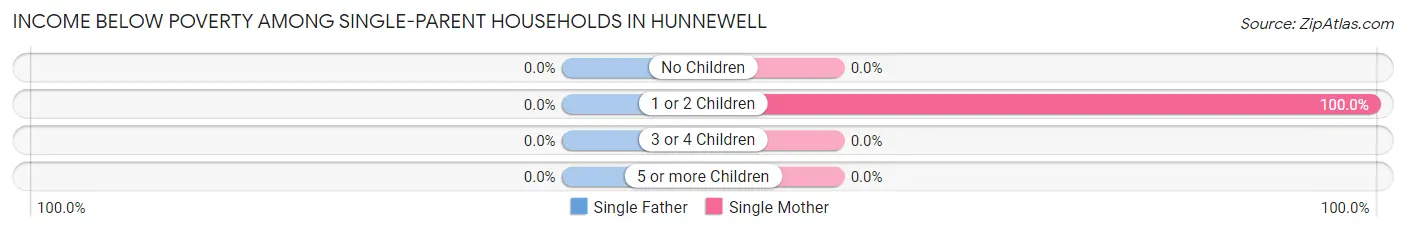
| Children | Single Father | Single Mother |
| No Children | 0 (0.0%) | 0 (0.0%) |
| 1 or 2 Children | 0 (0.0%) | 3 (100.0%) |
| 3 or 4 Children | 0 (0.0%) | 0 (0.0%) |
| 5 or more Children | 0 (0.0%) | 0 (0.0%) |
| Total | 0 (0.0%) | 3 (100.0%) |
Income Below Poverty Among Married-Couple vs Single-Parent Households in Hunnewell
The poverty data for Hunnewell shows that 3 of the married-couple family households (9.1%) and 3 of the single-parent households (50.0%) are living below the poverty level. Within the married-couple family households, those with no children have the highest poverty rate, with 3 households (11.1%) falling below the poverty line. Among the single-parent households, those with 1 or 2 children have the highest poverty rate, with 3 household (50.0%) living below poverty.
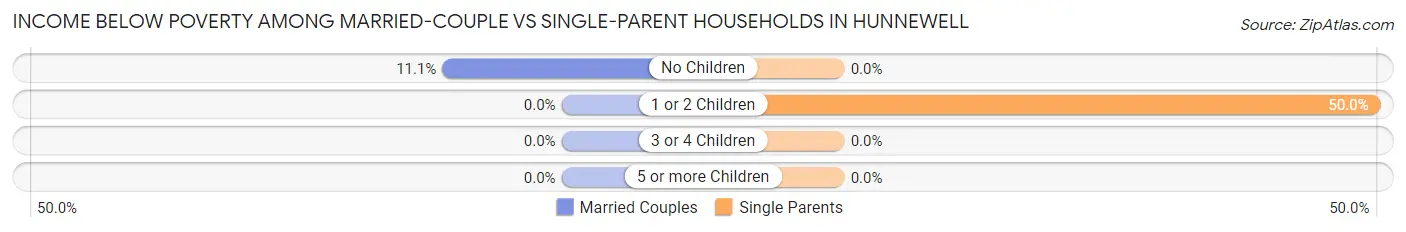
| Children | Married-Couple Families | Single-Parent Households |
| No Children | 3 (11.1%) | 0 (0.0%) |
| 1 or 2 Children | 0 (0.0%) | 3 (50.0%) |
| 3 or 4 Children | 0 (0.0%) | 0 (0.0%) |
| 5 or more Children | 0 (0.0%) | 0 (0.0%) |
| Total | 3 (9.1%) | 3 (50.0%) |
Race in Hunnewell
The most populous races in Hunnewell are White / Caucasian (160 | 97.6%), and Two or more Races (4 | 2.4%).
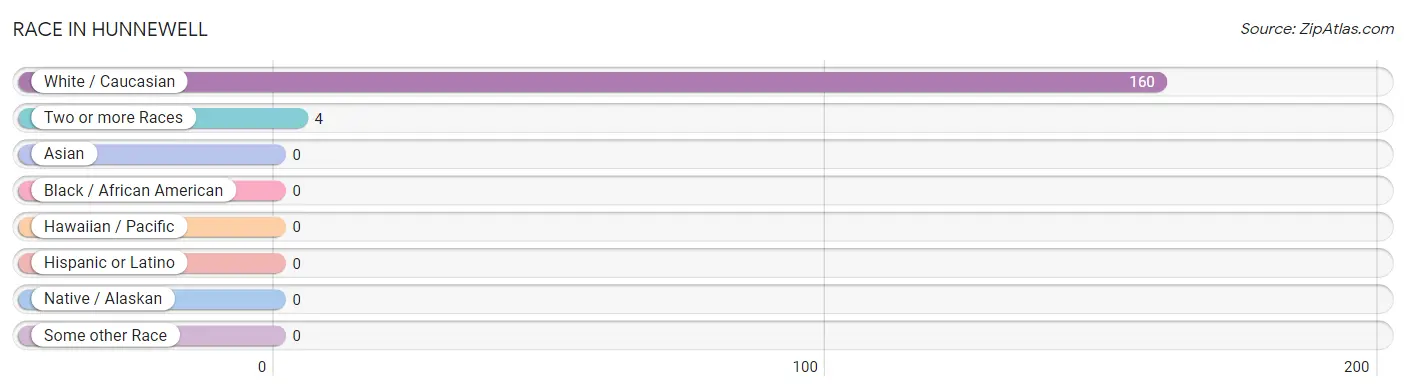
| Race | # Population | % Population |
| Asian | 0 | 0.0% |
| Black / African American | 0 | 0.0% |
| Hawaiian / Pacific | 0 | 0.0% |
| Hispanic or Latino | 0 | 0.0% |
| Native / Alaskan | 0 | 0.0% |
| White / Caucasian | 160 | 97.6% |
| Two or more Races | 4 | 2.4% |
| Some other Race | 0 | 0.0% |
| Total | 164 | 100.0% |
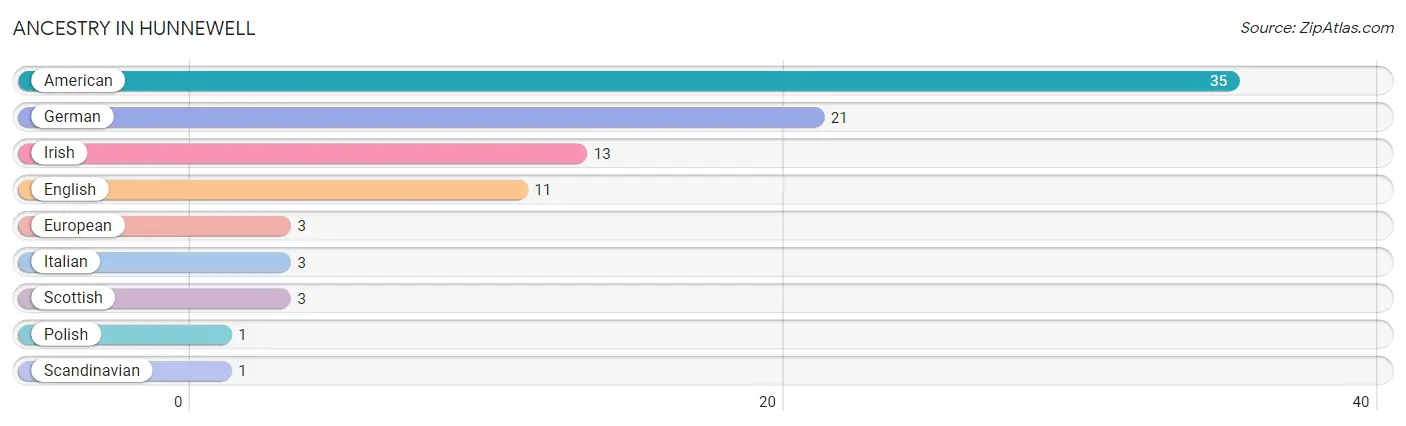
Ancestry in Hunnewell
The most populous ancestries reported in Hunnewell are American (35 | 21.3%), German (21 | 12.8%), Irish (13 | 7.9%), English (11 | 6.7%), and European (3 | 1.8%), together accounting for 50.6% of all Hunnewell residents.
| Ancestry | # Population | % Population |
| American | 35 | 21.3% |
| English | 11 | 6.7% |
| European | 3 | 1.8% |
| German | 21 | 12.8% |
| Irish | 13 | 7.9% |
| Italian | 3 | 1.8% |
| Polish | 1 | 0.6% |
| Scandinavian | 1 | 0.6% |
| Scottish | 3 | 1.8% | View All 9 Rows |
Immigrants in Hunnewell

| Immigration Origin | # Population | % Population | View All 0 Rows |
Sex and Age in Hunnewell
Sex and Age in Hunnewell
The most populous age groups in Hunnewell are 65 to 69 Years (16 | 16.5%) for men and 65 to 69 Years (15 | 22.4%) for women.
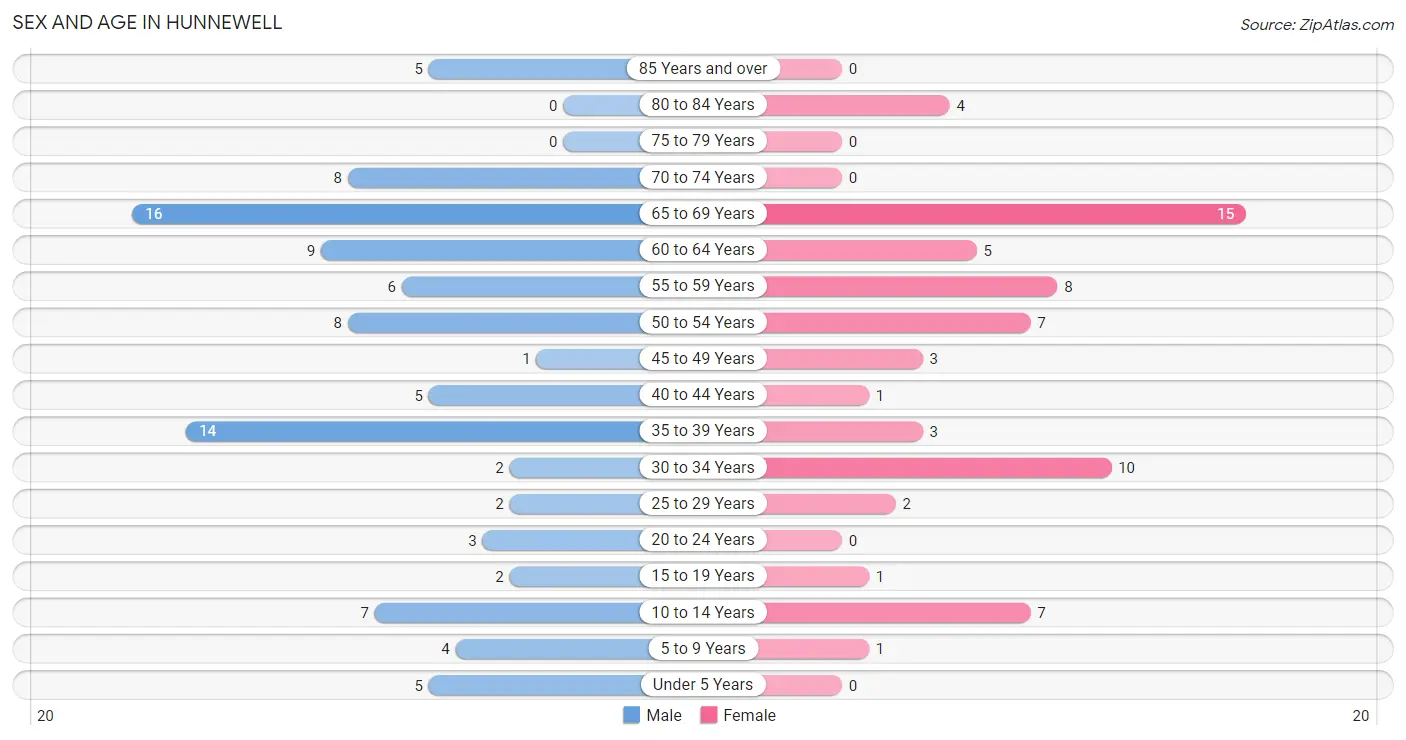
| Age Bracket | Male | Female |
| Under 5 Years | 5 (5.1%) | 0 (0.0%) |
| 5 to 9 Years | 4 (4.1%) | 1 (1.5%) |
| 10 to 14 Years | 7 (7.2%) | 7 (10.4%) |
| 15 to 19 Years | 2 (2.1%) | 1 (1.5%) |
| 20 to 24 Years | 3 (3.1%) | 0 (0.0%) |
| 25 to 29 Years | 2 (2.1%) | 2 (3.0%) |
| 30 to 34 Years | 2 (2.1%) | 10 (14.9%) |
| 35 to 39 Years | 14 (14.4%) | 3 (4.5%) |
| 40 to 44 Years | 5 (5.1%) | 1 (1.5%) |
| 45 to 49 Years | 1 (1.0%) | 3 (4.5%) |
| 50 to 54 Years | 8 (8.3%) | 7 (10.4%) |
| 55 to 59 Years | 6 (6.2%) | 8 (11.9%) |
| 60 to 64 Years | 9 (9.3%) | 5 (7.5%) |
| 65 to 69 Years | 16 (16.5%) | 15 (22.4%) |
| 70 to 74 Years | 8 (8.3%) | 0 (0.0%) |
| 75 to 79 Years | 0 (0.0%) | 0 (0.0%) |
| 80 to 84 Years | 0 (0.0%) | 4 (6.0%) |
| 85 Years and over | 5 (5.1%) | 0 (0.0%) |
| Total | 97 (100.0%) | 67 (100.0%) |
Families and Households in Hunnewell
Median Family Size in Hunnewell
The median family size in Hunnewell is 2.74 persons per family, with single female/mother families (3 | 7.7%) accounting for the largest median family size of 3.33 persons per family. On the other hand, married-couple families (33 | 84.6%) represent the smallest median family size with 2.67 persons per family.
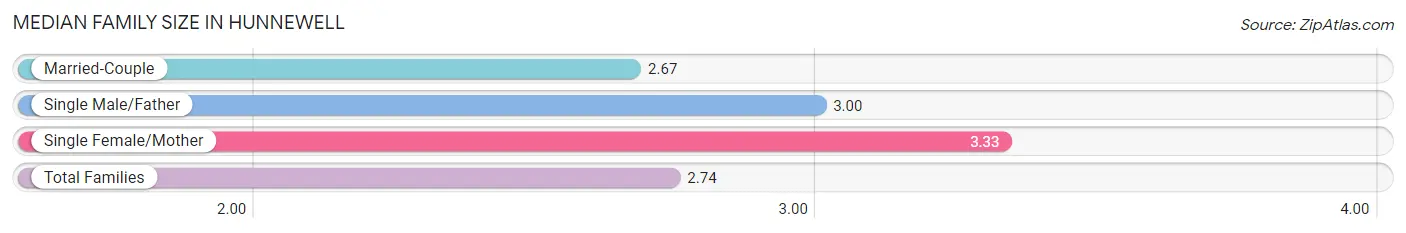
| Family Type | # Families | Family Size |
| Married-Couple | 33 (84.6%) | 2.67 |
| Single Male/Father | 3 (7.7%) | 3.00 |
| Single Female/Mother | 3 (7.7%) | 3.33 |
| Total Families | 39 (100.0%) | 2.74 |
Median Household Size in Hunnewell
The median household size in Hunnewell is 2.08 persons per household, with single male/father households (3 | 3.8%) accounting for the largest median household size of 4 persons per household. non-family households (40 | 50.6%) represent the smallest median household size with 1.08 persons per household.
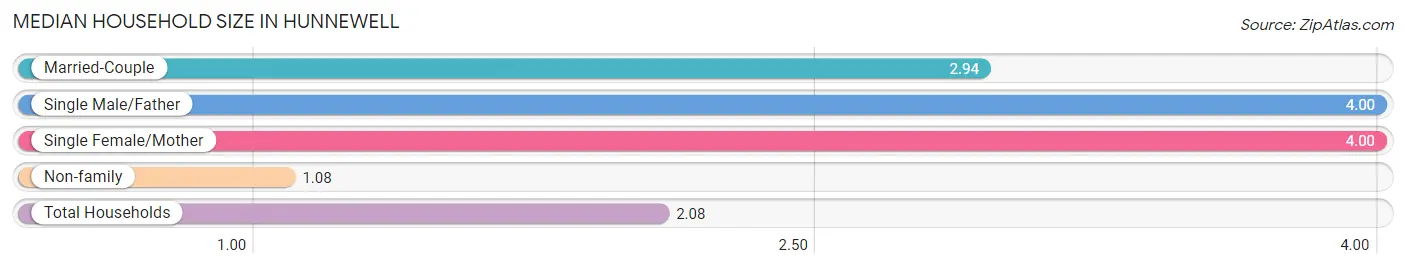
| Household Type | # Households | Household Size |
| Married-Couple | 33 (41.8%) | 2.94 |
| Single Male/Father | 3 (3.8%) | 4.00 |
| Single Female/Mother | 3 (3.8%) | 4.00 |
| Non-family | 40 (50.6%) | 1.08 |
| Total Households | 79 (100.0%) | 2.08 |
Household Size by Marriage Status in Hunnewell
Out of a total of 79 households in Hunnewell, 39 (49.4%) are family households, while 40 (50.6%) are nonfamily households. The most numerous type of family households are 2-person households, comprising 19, and the most common type of nonfamily households are 1-person households, comprising 37.
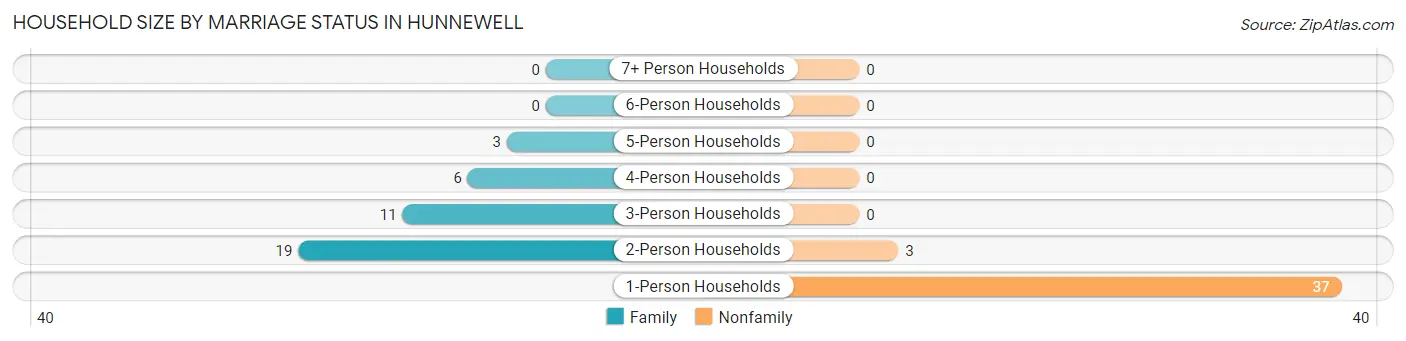
| Household Size | Family Households | Nonfamily Households |
| 1-Person Households | - | 37 (46.8%) |
| 2-Person Households | 19 (24.0%) | 3 (3.8%) |
| 3-Person Households | 11 (13.9%) | 0 (0.0%) |
| 4-Person Households | 6 (7.6%) | 0 (0.0%) |
| 5-Person Households | 3 (3.8%) | 0 (0.0%) |
| 6-Person Households | 0 (0.0%) | 0 (0.0%) |
| 7+ Person Households | 0 (0.0%) | 0 (0.0%) |
| Total | 39 (49.4%) | 40 (50.6%) |
Female Fertility in Hunnewell
Fertility by Age in Hunnewell
| Age Bracket | Women with Births | Births / 1,000 Women |
| 15 to 19 years | 0 (0.0%) | 0.0 |
| 20 to 34 years | 0 (0.0%) | 0.0 |
| 35 to 50 years | 0 (0.0%) | 0.0 |
| Total | 0 (0.0%) | 0.0 |
Fertility by Age by Marriage Status in Hunnewell
| Age Bracket | Married | Unmarried |
| 15 to 19 years | 0 (0.0%) | 0 (0.0%) |
| 20 to 34 years | 0 (0.0%) | 0 (0.0%) |
| 35 to 50 years | 0 (0.0%) | 0 (0.0%) |
| Total | 0 (0.0%) | 0 (0.0%) |
Fertility by Education in Hunnewell
| Educational Attainment | Women with Births | Births / 1,000 Women |
| Less than High School | 0 (0.0%) | 0.0 |
| High School Diploma | 0 (0.0%) | 0.0 |
| College or Associate's Degree | 0 (0.0%) | 0.0 |
| Bachelor's Degree | 0 (0.0%) | 0.0 |
| Graduate Degree | 0 (0.0%) | 0.0 |
| Total | 0 (0.0%) | 0.0 |
Fertility by Education by Marriage Status in Hunnewell
| Educational Attainment | Married | Unmarried |
| Less than High School | 0 (0.0%) | 0 (0.0%) |
| High School Diploma | 0 (0.0%) | 0 (0.0%) |
| College or Associate's Degree | 0 (0.0%) | 0 (0.0%) |
| Bachelor's Degree | 0 (0.0%) | 0 (0.0%) |
| Graduate Degree | 0 (0.0%) | 0 (0.0%) |
| Total | 0 (0.0%) | 0 (0.0%) |
Employment Characteristics in Hunnewell
Employment by Class of Employer in Hunnewell
Among the 79 employed individuals in Hunnewell, private company employees (47 | 59.5%), self-employed (not incorporated) (10 | 12.7%), and unpaid family workers (9 | 11.4%) make up the most common classes of employment.
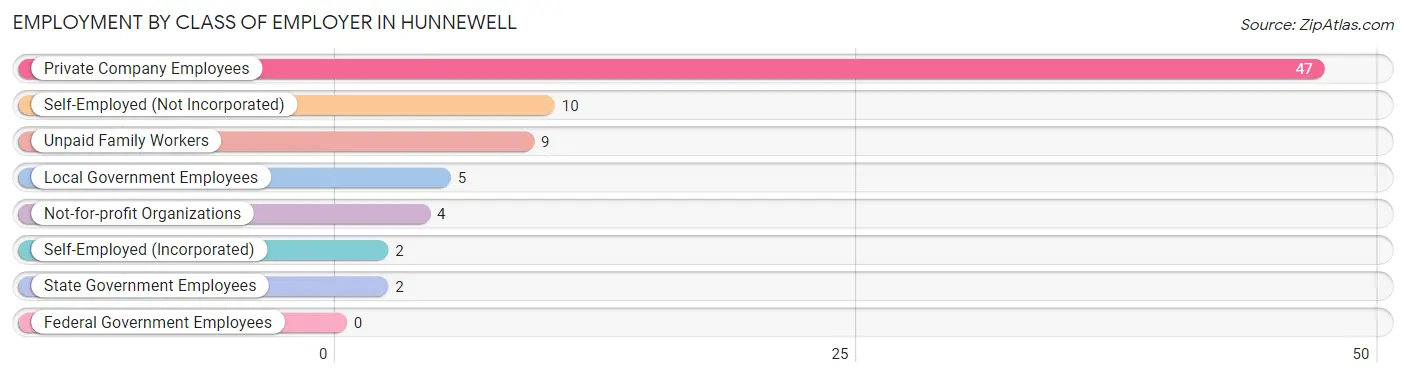
| Employer Class | # Employees | % Employees |
| Private Company Employees | 47 | 59.5% |
| Self-Employed (Incorporated) | 2 | 2.5% |
| Self-Employed (Not Incorporated) | 10 | 12.7% |
| Not-for-profit Organizations | 4 | 5.1% |
| Local Government Employees | 5 | 6.3% |
| State Government Employees | 2 | 2.5% |
| Federal Government Employees | 0 | 0.0% |
| Unpaid Family Workers | 9 | 11.4% |
| Total | 79 | 100.0% |
Employment Status by Age in Hunnewell
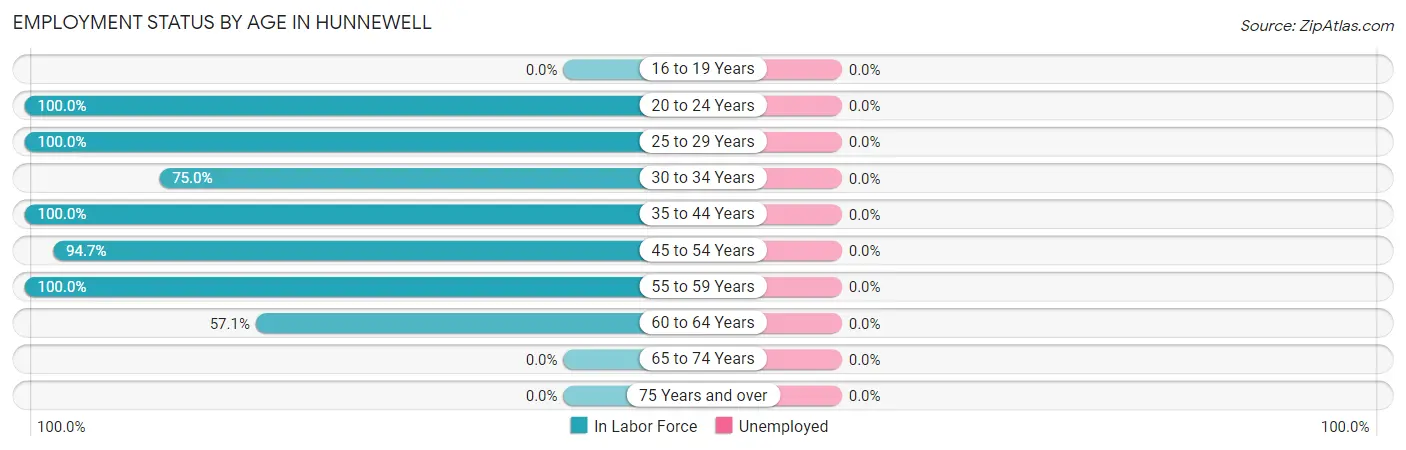
| Age Bracket | In Labor Force | Unemployed |
| 16 to 19 Years | 0 (0.0%) | 0 (0.0%) |
| 20 to 24 Years | 3 (100.0%) | 0 (0.0%) |
| 25 to 29 Years | 4 (100.0%) | 0 (0.0%) |
| 30 to 34 Years | 9 (75.0%) | 0 (0.0%) |
| 35 to 44 Years | 23 (100.0%) | 0 (0.0%) |
| 45 to 54 Years | 18 (94.7%) | 0 (0.0%) |
| 55 to 59 Years | 14 (100.0%) | 0 (0.0%) |
| 60 to 64 Years | 8 (57.1%) | 0 (0.0%) |
| 65 to 74 Years | 0 (0.0%) | 0 (0.0%) |
| 75 Years and over | 0 (0.0%) | 0 (0.0%) |
| Total | 79 (56.4%) | 0 (0.0%) |
Employment Status by Educational Attainment in Hunnewell
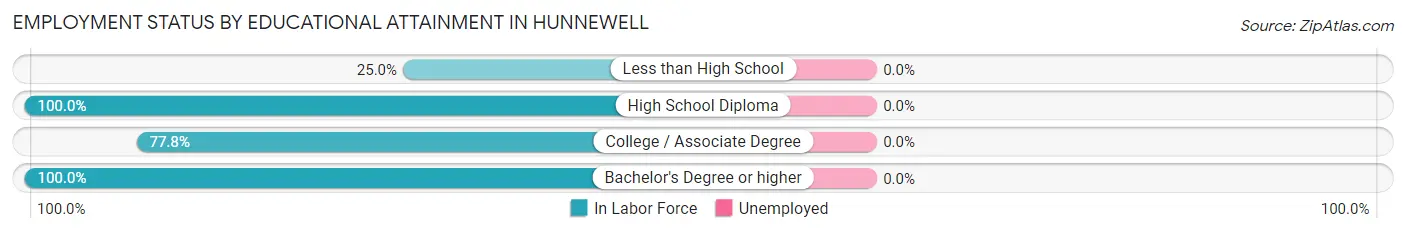
| Educational Attainment | In Labor Force | Unemployed |
| Less than High School | 2 (25.0%) | 0 (0.0%) |
| High School Diploma | 54 (100.0%) | 0 (0.0%) |
| College / Associate Degree | 14 (77.8%) | 0 (0.0%) |
| Bachelor's Degree or higher | 6 (100.0%) | 0 (0.0%) |
| Total | 76 (88.4%) | 0 (0.0%) |
Employment Occupations by Sex in Hunnewell
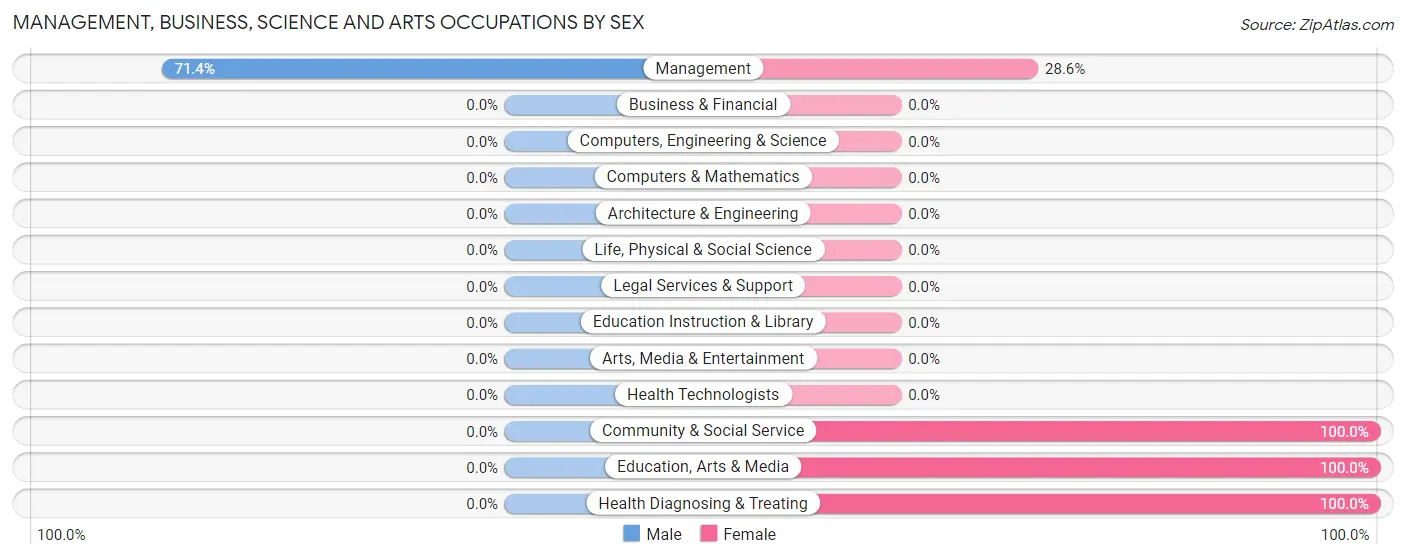
Management, Business, Science and Arts Occupations
The most common Management, Business, Science and Arts occupations in Hunnewell are Management (7 | 8.9%), Health Diagnosing & Treating (7 | 8.9%), Community & Social Service (1 | 1.3%), and Education, Arts & Media (1 | 1.3%).
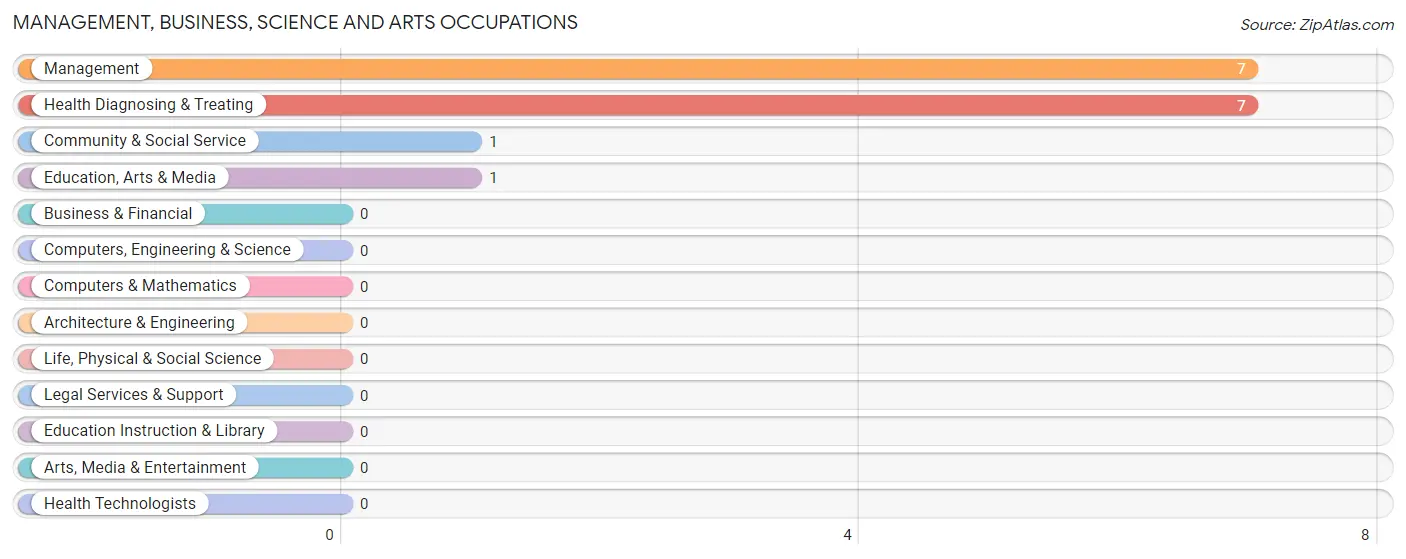
Management, Business, Science and Arts Occupations by Sex
| Occupation | Male | Female |
| Management | 5 (71.4%) | 2 (28.6%) |
| Business & Financial | 0 (0.0%) | 0 (0.0%) |
| Computers, Engineering & Science | 0 (0.0%) | 0 (0.0%) |
| Computers & Mathematics | 0 (0.0%) | 0 (0.0%) |
| Architecture & Engineering | 0 (0.0%) | 0 (0.0%) |
| Life, Physical & Social Science | 0 (0.0%) | 0 (0.0%) |
| Community & Social Service | 0 (0.0%) | 1 (100.0%) |
| Education, Arts & Media | 0 (0.0%) | 1 (100.0%) |
| Legal Services & Support | 0 (0.0%) | 0 (0.0%) |
| Education Instruction & Library | 0 (0.0%) | 0 (0.0%) |
| Arts, Media & Entertainment | 0 (0.0%) | 0 (0.0%) |
| Health Diagnosing & Treating | 0 (0.0%) | 7 (100.0%) |
| Health Technologists | 0 (0.0%) | 0 (0.0%) |
| Total (Category) | 5 (33.3%) | 10 (66.7%) |
| Total (Overall) | 44 (55.7%) | 35 (44.3%) |
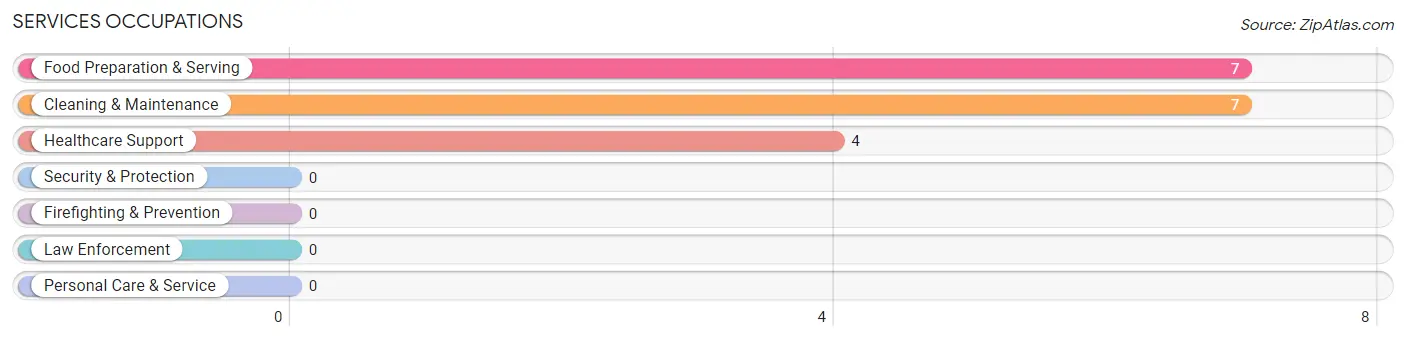
Services Occupations
The most common Services occupations in Hunnewell are Food Preparation & Serving (7 | 8.9%), Cleaning & Maintenance (7 | 8.9%), and Healthcare Support (4 | 5.1%).
Services Occupations by Sex
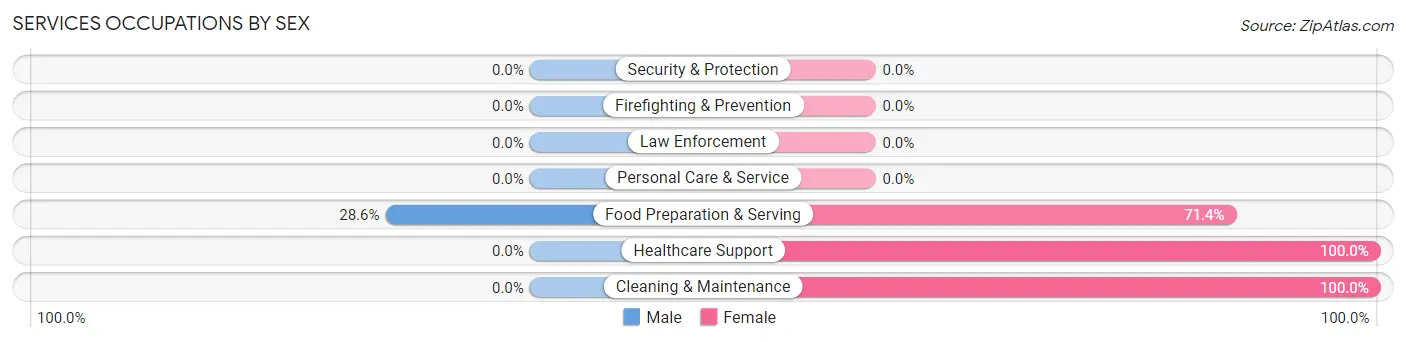
| Occupation | Male | Female |
| Healthcare Support | 0 (0.0%) | 4 (100.0%) |
| Security & Protection | 0 (0.0%) | 0 (0.0%) |
| Firefighting & Prevention | 0 (0.0%) | 0 (0.0%) |
| Law Enforcement | 0 (0.0%) | 0 (0.0%) |
| Food Preparation & Serving | 2 (28.6%) | 5 (71.4%) |
| Cleaning & Maintenance | 0 (0.0%) | 7 (100.0%) |
| Personal Care & Service | 0 (0.0%) | 0 (0.0%) |
| Total (Category) | 2 (11.1%) | 16 (88.9%) |
| Total (Overall) | 44 (55.7%) | 35 (44.3%) |
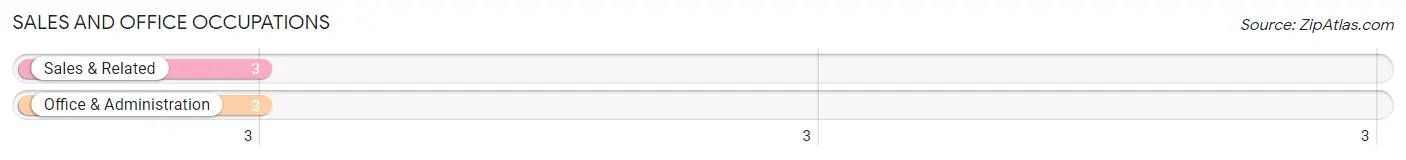
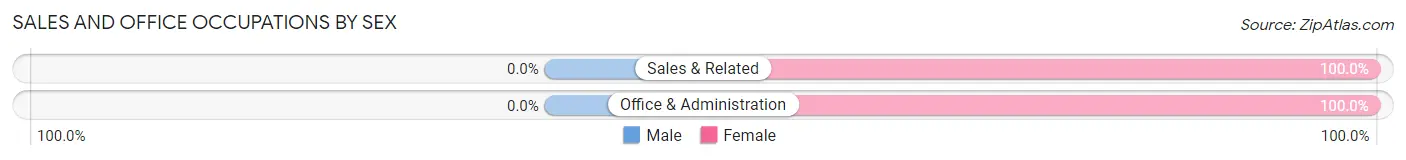
Sales and Office Occupations
The most common Sales and Office occupations in Hunnewell are Sales & Related (3 | 3.8%), and Office & Administration (3 | 3.8%).
Sales and Office Occupations by Sex
| Occupation | Male | Female |
| Sales & Related | 0 (0.0%) | 3 (100.0%) |
| Office & Administration | 0 (0.0%) | 3 (100.0%) |
| Total (Category) | 0 (0.0%) | 6 (100.0%) |
| Total (Overall) | 44 (55.7%) | 35 (44.3%) |
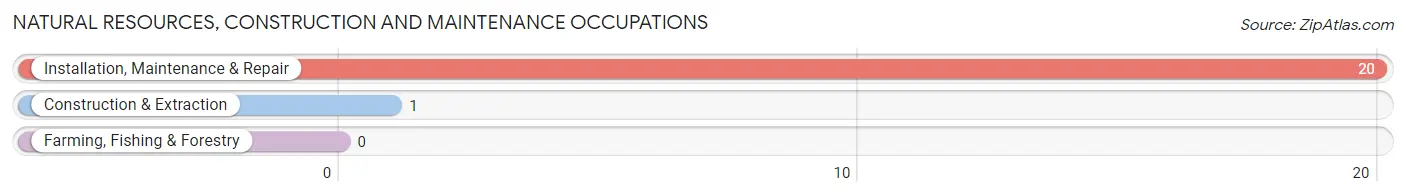
Natural Resources, Construction and Maintenance Occupations
The most common Natural Resources, Construction and Maintenance occupations in Hunnewell are Installation, Maintenance & Repair (20 | 25.3%), and Construction & Extraction (1 | 1.3%).
Natural Resources, Construction and Maintenance Occupations by Sex
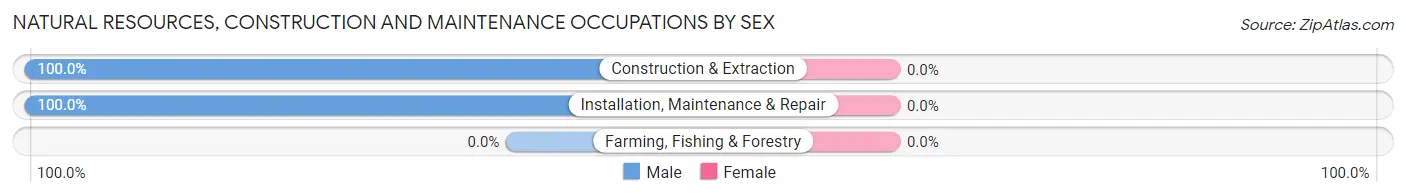
| Occupation | Male | Female |
| Farming, Fishing & Forestry | 0 (0.0%) | 0 (0.0%) |
| Construction & Extraction | 1 (100.0%) | 0 (0.0%) |
| Installation, Maintenance & Repair | 20 (100.0%) | 0 (0.0%) |
| Total (Category) | 21 (100.0%) | 0 (0.0%) |
| Total (Overall) | 44 (55.7%) | 35 (44.3%) |
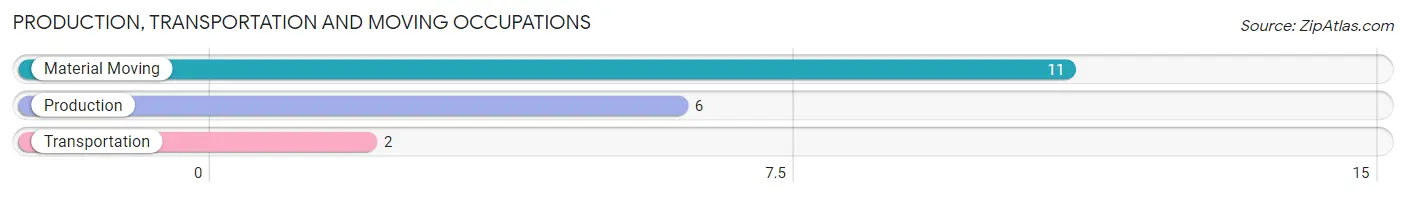
Production, Transportation and Moving Occupations
The most common Production, Transportation and Moving occupations in Hunnewell are Material Moving (11 | 13.9%), Production (6 | 7.6%), and Transportation (2 | 2.5%).
Production, Transportation and Moving Occupations by Sex
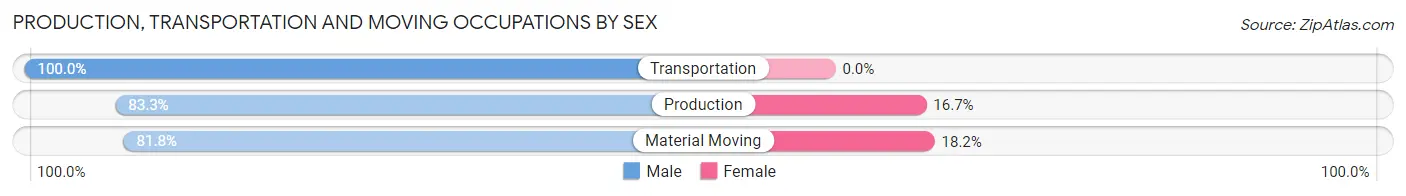
| Occupation | Male | Female |
| Production | 5 (83.3%) | 1 (16.7%) |
| Transportation | 2 (100.0%) | 0 (0.0%) |
| Material Moving | 9 (81.8%) | 2 (18.2%) |
| Total (Category) | 16 (84.2%) | 3 (15.8%) |
| Total (Overall) | 44 (55.7%) | 35 (44.3%) |
Employment Industries by Sex in Hunnewell
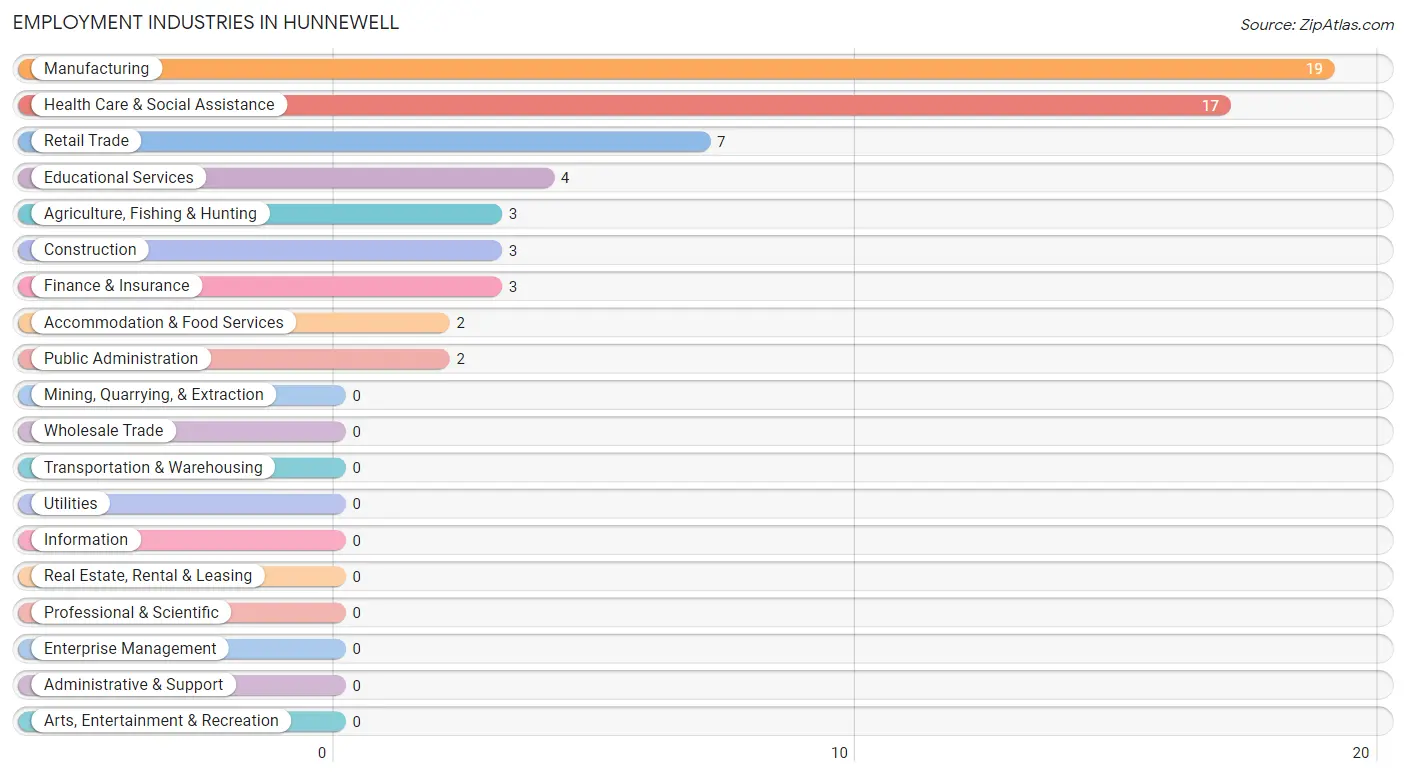
Employment Industries in Hunnewell
The major employment industries in Hunnewell include Manufacturing (19 | 24.0%), Health Care & Social Assistance (17 | 21.5%), Retail Trade (7 | 8.9%), Educational Services (4 | 5.1%), and Agriculture, Fishing & Hunting (3 | 3.8%).
Employment Industries by Sex in Hunnewell
The Hunnewell industries that see more men than women are Agriculture, Fishing & Hunting (100.0%), Construction (100.0%), and Accommodation & Food Services (100.0%), whereas the industries that tend to have a higher number of women are Finance & Insurance (100.0%), Educational Services (100.0%), and Health Care & Social Assistance (100.0%).
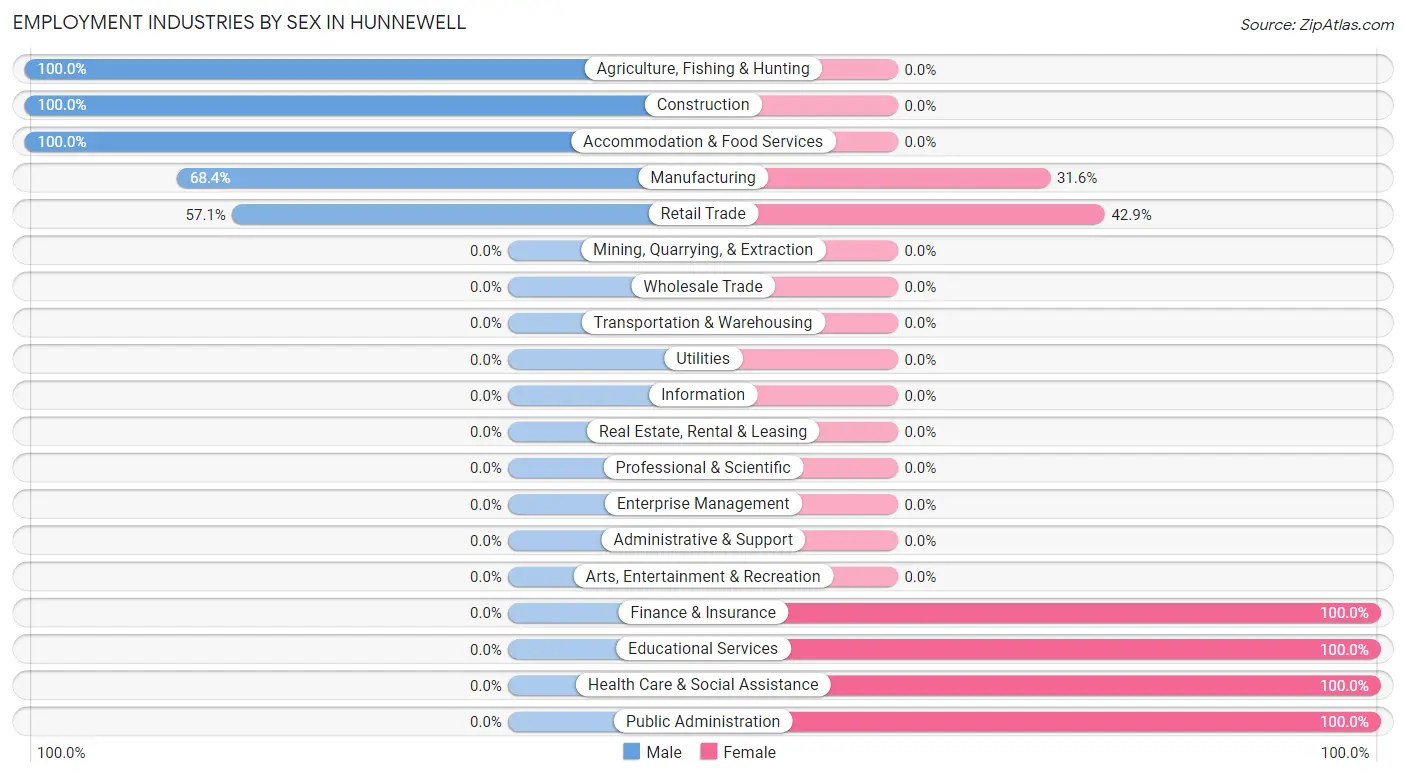
| Industry | Male | Female |
| Agriculture, Fishing & Hunting | 3 (100.0%) | 0 (0.0%) |
| Mining, Quarrying, & Extraction | 0 (0.0%) | 0 (0.0%) |
| Construction | 3 (100.0%) | 0 (0.0%) |
| Manufacturing | 13 (68.4%) | 6 (31.6%) |
| Wholesale Trade | 0 (0.0%) | 0 (0.0%) |
| Retail Trade | 4 (57.1%) | 3 (42.9%) |
| Transportation & Warehousing | 0 (0.0%) | 0 (0.0%) |
| Utilities | 0 (0.0%) | 0 (0.0%) |
| Information | 0 (0.0%) | 0 (0.0%) |
| Finance & Insurance | 0 (0.0%) | 3 (100.0%) |
| Real Estate, Rental & Leasing | 0 (0.0%) | 0 (0.0%) |
| Professional & Scientific | 0 (0.0%) | 0 (0.0%) |
| Enterprise Management | 0 (0.0%) | 0 (0.0%) |
| Administrative & Support | 0 (0.0%) | 0 (0.0%) |
| Educational Services | 0 (0.0%) | 4 (100.0%) |
| Health Care & Social Assistance | 0 (0.0%) | 17 (100.0%) |
| Arts, Entertainment & Recreation | 0 (0.0%) | 0 (0.0%) |
| Accommodation & Food Services | 2 (100.0%) | 0 (0.0%) |
| Public Administration | 0 (0.0%) | 2 (100.0%) |
| Total | 44 (55.7%) | 35 (44.3%) |
Education in Hunnewell
School Enrollment in Hunnewell
The most common levels of schooling among the 25 students in Hunnewell are middle school (12 | 48.0%), elementary school (6 | 24.0%), and nursery / preschool (3 | 12.0%).
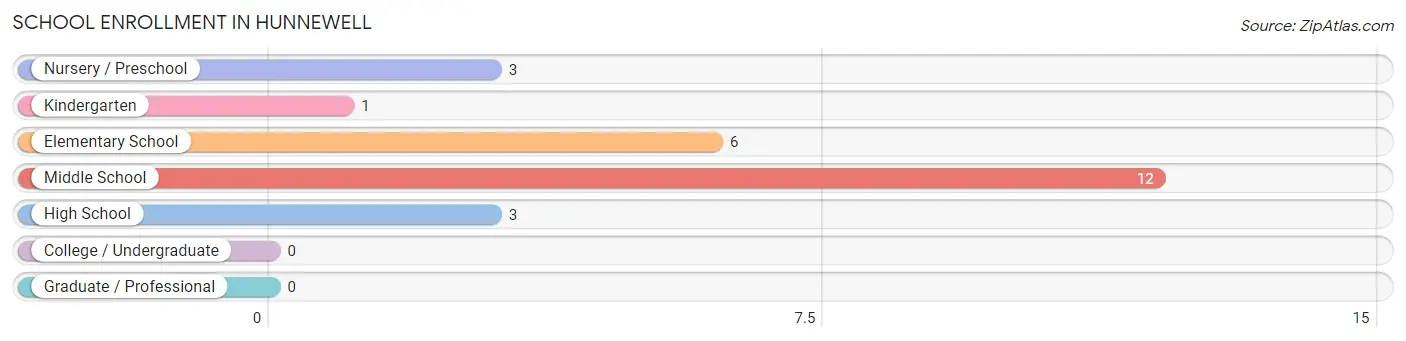
| School Level | # Students | % Students |
| Nursery / Preschool | 3 | 12.0% |
| Kindergarten | 1 | 4.0% |
| Elementary School | 6 | 24.0% |
| Middle School | 12 | 48.0% |
| High School | 3 | 12.0% |
| College / Undergraduate | 0 | 0.0% |
| Graduate / Professional | 0 | 0.0% |
| Total | 25 | 100.0% |
School Enrollment by Age by Funding Source in Hunnewell
Out of a total of 25 students who are enrolled in schools in Hunnewell, 2 (8.0%) attend a private institution, while the remaining 23 (92.0%) are enrolled in public schools. The age group of 10 to 14 year olds has the highest likelihood of being enrolled in private schools, with 2 (14.3% in the age bracket) enrolled. Conversely, the age group of 3 to 4 year olds has the lowest likelihood of being enrolled in a private school, with 3 (100.0% in the age bracket) attending a public institution.
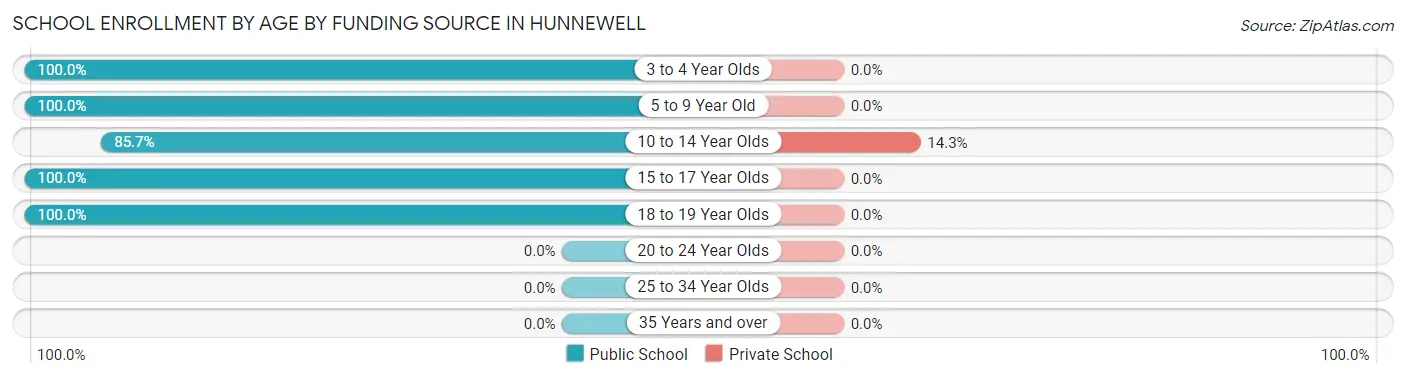
| Age Bracket | Public School | Private School |
| 3 to 4 Year Olds | 3 (100.0%) | 0 (0.0%) |
| 5 to 9 Year Old | 5 (100.0%) | 0 (0.0%) |
| 10 to 14 Year Olds | 12 (85.7%) | 2 (14.3%) |
| 15 to 17 Year Olds | 2 (100.0%) | 0 (0.0%) |
| 18 to 19 Year Olds | 1 (100.0%) | 0 (0.0%) |
| 20 to 24 Year Olds | 0 (0.0%) | 0 (0.0%) |
| 25 to 34 Year Olds | 0 (0.0%) | 0 (0.0%) |
| 35 Years and over | 0 (0.0%) | 0 (0.0%) |
| Total | 23 (92.0%) | 2 (8.0%) |
Educational Attainment by Field of Study in Hunnewell
Arts & humanities (3 | 33.3%), bio, nature & agricultural (2 | 22.2%), psychology (1 | 11.1%), social sciences (1 | 11.1%), and science & technology (1 | 11.1%) are the most common fields of study among 9 individuals in Hunnewell who have obtained a bachelor's degree or higher.
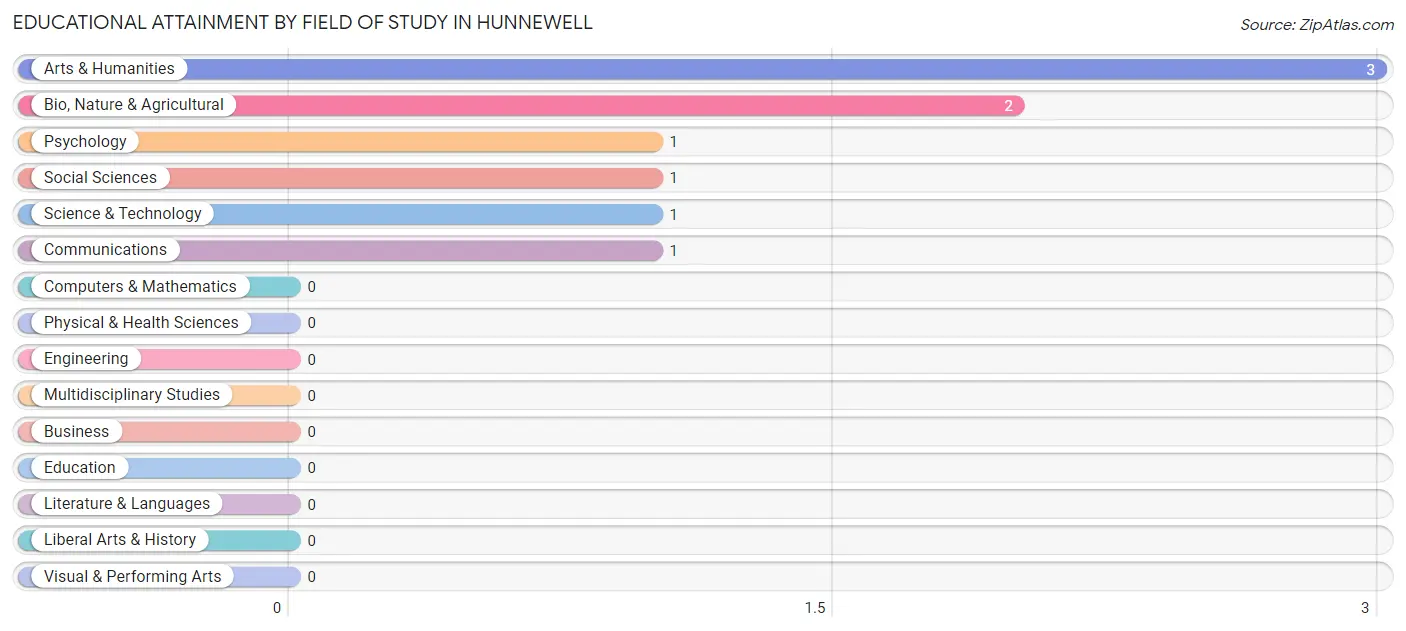
| Field of Study | # Graduates | % Graduates |
| Computers & Mathematics | 0 | 0.0% |
| Bio, Nature & Agricultural | 2 | 22.2% |
| Physical & Health Sciences | 0 | 0.0% |
| Psychology | 1 | 11.1% |
| Social Sciences | 1 | 11.1% |
| Engineering | 0 | 0.0% |
| Multidisciplinary Studies | 0 | 0.0% |
| Science & Technology | 1 | 11.1% |
| Business | 0 | 0.0% |
| Education | 0 | 0.0% |
| Literature & Languages | 0 | 0.0% |
| Liberal Arts & History | 0 | 0.0% |
| Visual & Performing Arts | 0 | 0.0% |
| Communications | 1 | 11.1% |
| Arts & Humanities | 3 | 33.3% |
| Total | 9 | 100.0% |
Transportation & Commute in Hunnewell
Vehicle Availability by Sex in Hunnewell
The most prevalent vehicle ownership categories in Hunnewell are males with 2 vehicles (21, accounting for 47.7%) and females with 2 vehicles (13, making up 60.0%).
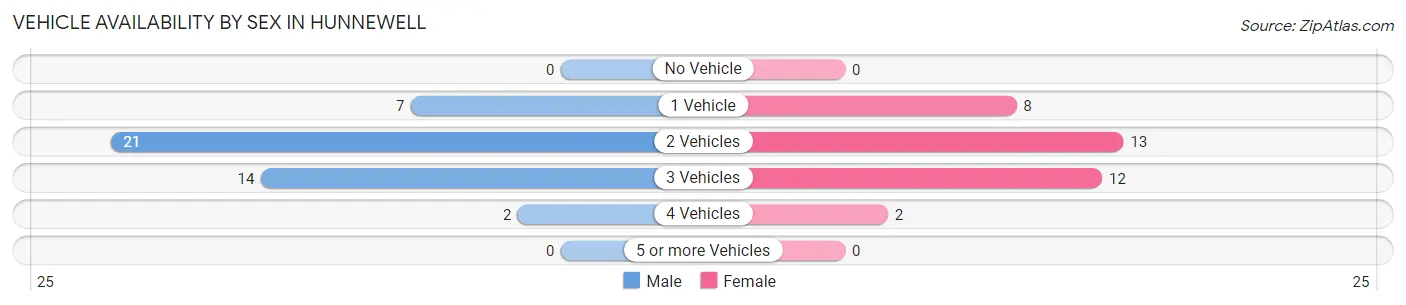
| Vehicles Available | Male | Female |
| No Vehicle | 0 (0.0%) | 0 (0.0%) |
| 1 Vehicle | 7 (15.9%) | 8 (22.9%) |
| 2 Vehicles | 21 (47.7%) | 13 (37.1%) |
| 3 Vehicles | 14 (31.8%) | 12 (34.3%) |
| 4 Vehicles | 2 (4.5%) | 2 (5.7%) |
| 5 or more Vehicles | 0 (0.0%) | 0 (0.0%) |
| Total | 44 (100.0%) | 35 (100.0%) |
Commute Time in Hunnewell
The most frequently occuring commute durations in Hunnewell are 15 to 19 minutes (28 commuters, 35.4%), 5 to 9 minutes (15 commuters, 19.0%), and 10 to 14 minutes (10 commuters, 12.7%).
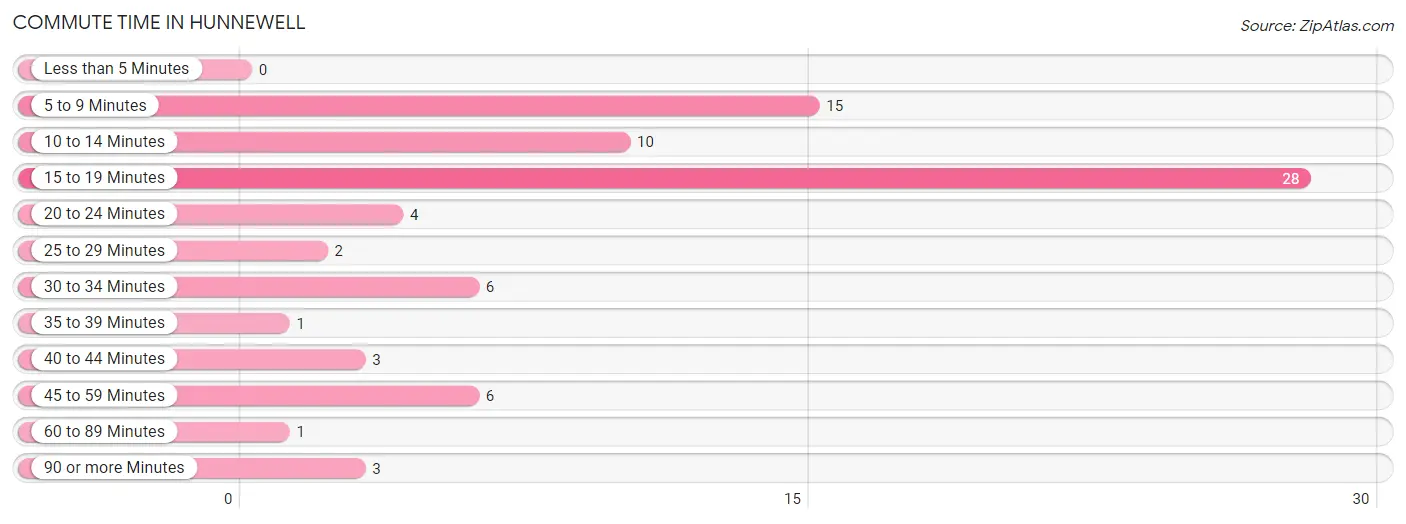
| Commute Time | # Commuters | % Commuters |
| Less than 5 Minutes | 0 | 0.0% |
| 5 to 9 Minutes | 15 | 19.0% |
| 10 to 14 Minutes | 10 | 12.7% |
| 15 to 19 Minutes | 28 | 35.4% |
| 20 to 24 Minutes | 4 | 5.1% |
| 25 to 29 Minutes | 2 | 2.5% |
| 30 to 34 Minutes | 6 | 7.6% |
| 35 to 39 Minutes | 1 | 1.3% |
| 40 to 44 Minutes | 3 | 3.8% |
| 45 to 59 Minutes | 6 | 7.6% |
| 60 to 89 Minutes | 1 | 1.3% |
| 90 or more Minutes | 3 | 3.8% |
Commute Time by Sex in Hunnewell
The most common commute times in Hunnewell are 5 to 9 minutes (15 commuters, 34.1%) for males and 15 to 19 minutes (16 commuters, 45.7%) for females.
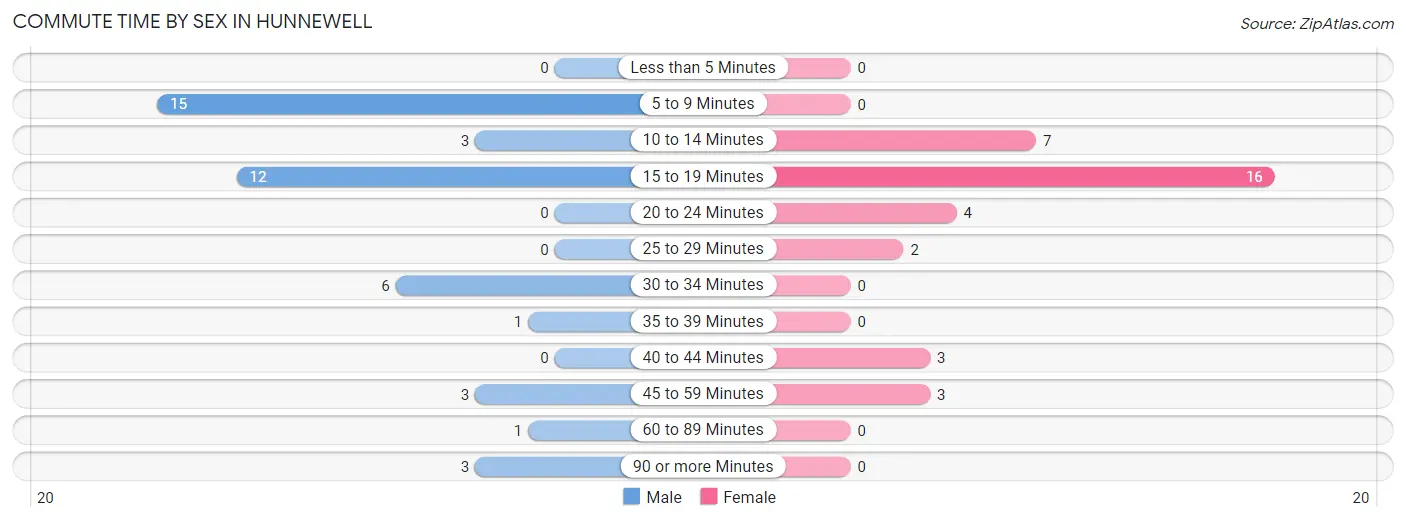
| Commute Time | Male | Female |
| Less than 5 Minutes | 0 (0.0%) | 0 (0.0%) |
| 5 to 9 Minutes | 15 (34.1%) | 0 (0.0%) |
| 10 to 14 Minutes | 3 (6.8%) | 7 (20.0%) |
| 15 to 19 Minutes | 12 (27.3%) | 16 (45.7%) |
| 20 to 24 Minutes | 0 (0.0%) | 4 (11.4%) |
| 25 to 29 Minutes | 0 (0.0%) | 2 (5.7%) |
| 30 to 34 Minutes | 6 (13.6%) | 0 (0.0%) |
| 35 to 39 Minutes | 1 (2.3%) | 0 (0.0%) |
| 40 to 44 Minutes | 0 (0.0%) | 3 (8.6%) |
| 45 to 59 Minutes | 3 (6.8%) | 3 (8.6%) |
| 60 to 89 Minutes | 1 (2.3%) | 0 (0.0%) |
| 90 or more Minutes | 3 (6.8%) | 0 (0.0%) |
Time of Departure to Work by Sex in Hunnewell
The most frequent times of departure to work in Hunnewell are 8:00 AM to 8:29 AM (13, 29.5%) for males and 7:30 AM to 7:59 AM (11, 31.4%) for females.
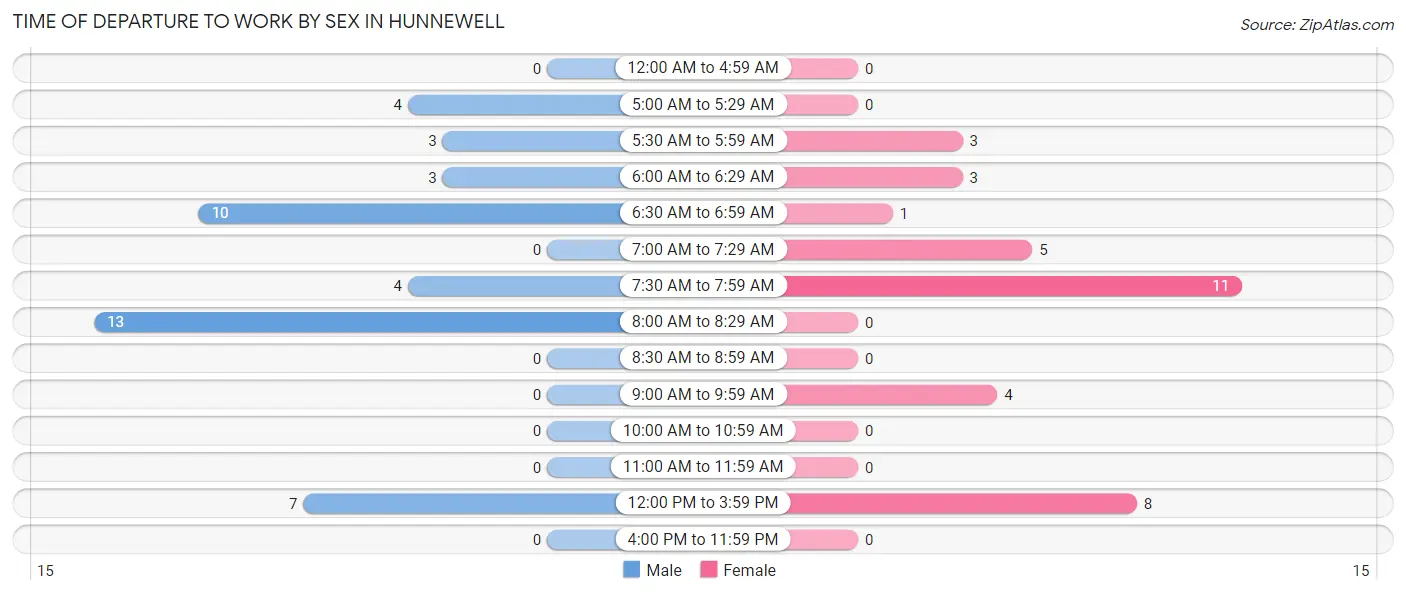
| Time of Departure | Male | Female |
| 12:00 AM to 4:59 AM | 0 (0.0%) | 0 (0.0%) |
| 5:00 AM to 5:29 AM | 4 (9.1%) | 0 (0.0%) |
| 5:30 AM to 5:59 AM | 3 (6.8%) | 3 (8.6%) |
| 6:00 AM to 6:29 AM | 3 (6.8%) | 3 (8.6%) |
| 6:30 AM to 6:59 AM | 10 (22.7%) | 1 (2.9%) |
| 7:00 AM to 7:29 AM | 0 (0.0%) | 5 (14.3%) |
| 7:30 AM to 7:59 AM | 4 (9.1%) | 11 (31.4%) |
| 8:00 AM to 8:29 AM | 13 (29.5%) | 0 (0.0%) |
| 8:30 AM to 8:59 AM | 0 (0.0%) | 0 (0.0%) |
| 9:00 AM to 9:59 AM | 0 (0.0%) | 4 (11.4%) |
| 10:00 AM to 10:59 AM | 0 (0.0%) | 0 (0.0%) |
| 11:00 AM to 11:59 AM | 0 (0.0%) | 0 (0.0%) |
| 12:00 PM to 3:59 PM | 7 (15.9%) | 8 (22.9%) |
| 4:00 PM to 11:59 PM | 0 (0.0%) | 0 (0.0%) |
| Total | 44 (100.0%) | 35 (100.0%) |
Housing Occupancy in Hunnewell
Occupancy by Ownership in Hunnewell
Of the total 79 dwellings in Hunnewell, owner-occupied units account for 65 (82.3%), while renter-occupied units make up 14 (17.7%).
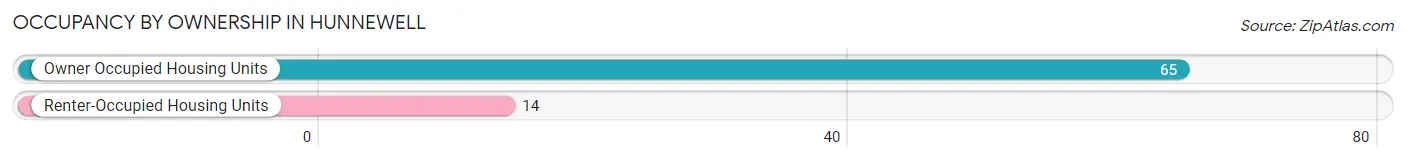
| Occupancy | # Housing Units | % Housing Units |
| Owner Occupied Housing Units | 65 | 82.3% |
| Renter-Occupied Housing Units | 14 | 17.7% |
| Total Occupied Housing Units | 79 | 100.0% |
Occupancy by Household Size in Hunnewell
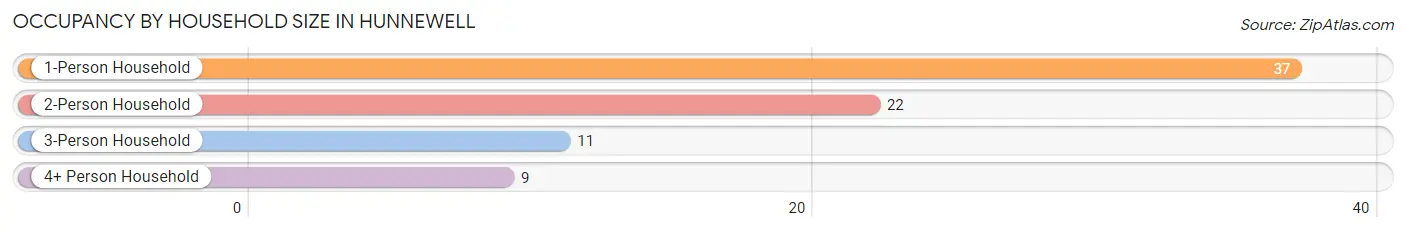
| Household Size | # Housing Units | % Housing Units |
| 1-Person Household | 37 | 46.8% |
| 2-Person Household | 22 | 27.9% |
| 3-Person Household | 11 | 13.9% |
| 4+ Person Household | 9 | 11.4% |
| Total Housing Units | 79 | 100.0% |
Occupancy by Ownership by Household Size in Hunnewell
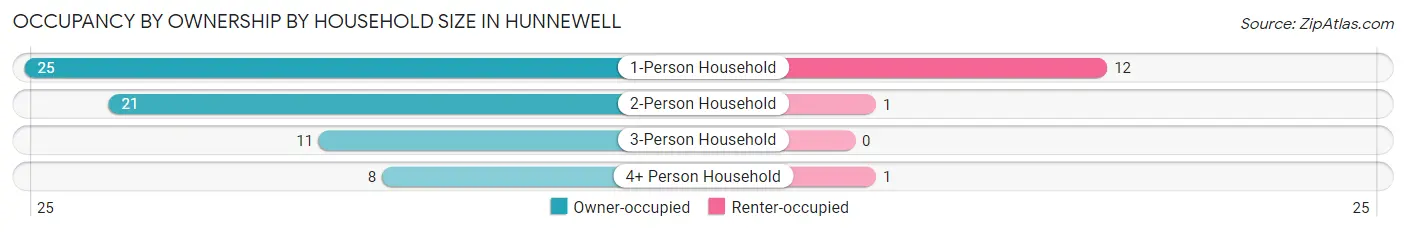
| Household Size | Owner-occupied | Renter-occupied |
| 1-Person Household | 25 (67.6%) | 12 (32.4%) |
| 2-Person Household | 21 (95.5%) | 1 (4.5%) |
| 3-Person Household | 11 (100.0%) | 0 (0.0%) |
| 4+ Person Household | 8 (88.9%) | 1 (11.1%) |
| Total Housing Units | 65 (82.3%) | 14 (17.7%) |
Occupancy by Educational Attainment in Hunnewell
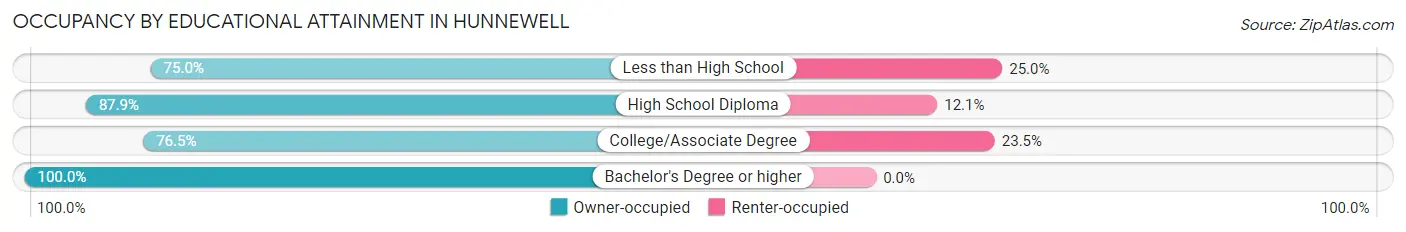
| Household Size | Owner-occupied | Renter-occupied |
| Less than High School | 18 (75.0%) | 6 (25.0%) |
| High School Diploma | 29 (87.9%) | 4 (12.1%) |
| College/Associate Degree | 13 (76.5%) | 4 (23.5%) |
| Bachelor's Degree or higher | 5 (100.0%) | 0 (0.0%) |
Occupancy by Age of Householder in Hunnewell
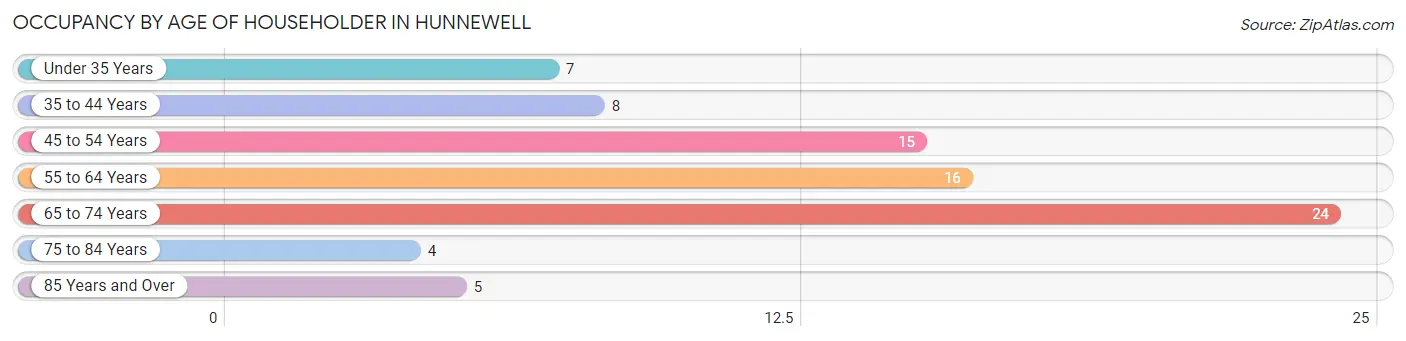
| Age Bracket | # Households | % Households |
| Under 35 Years | 7 | 8.9% |
| 35 to 44 Years | 8 | 10.1% |
| 45 to 54 Years | 15 | 19.0% |
| 55 to 64 Years | 16 | 20.3% |
| 65 to 74 Years | 24 | 30.4% |
| 75 to 84 Years | 4 | 5.1% |
| 85 Years and Over | 5 | 6.3% |
| Total | 79 | 100.0% |
Housing Finances in Hunnewell
Median Income by Occupancy in Hunnewell
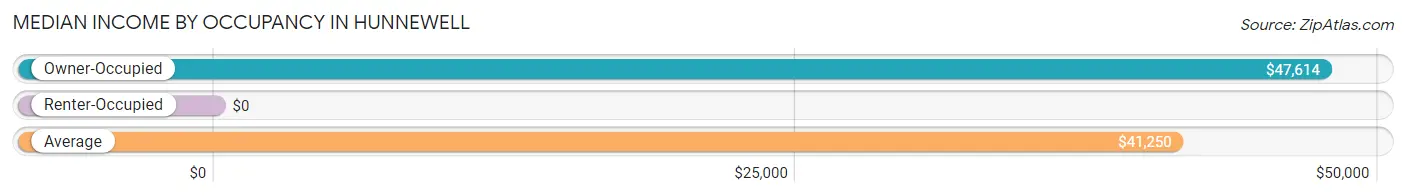
| Occupancy Type | # Households | Median Income |
| Owner-Occupied | 65 (82.3%) | $47,614 |
| Renter-Occupied | 14 (17.7%) | $0 |
| Average | 79 (100.0%) | $41,250 |
Occupancy by Householder Income Bracket in Hunnewell
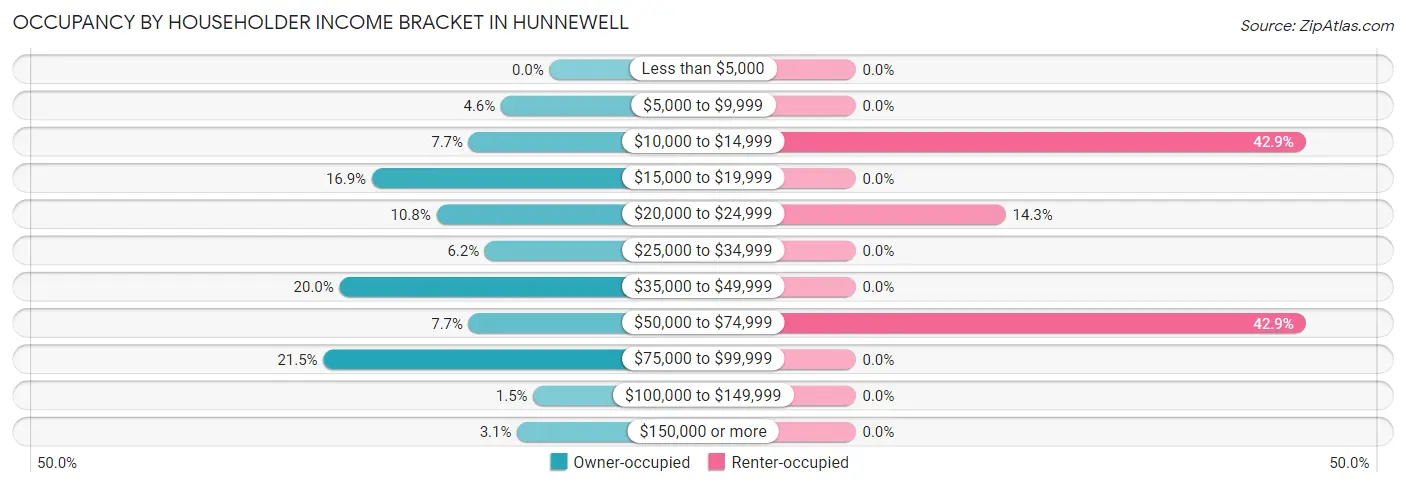
| Income Bracket | Owner-occupied | Renter-occupied |
| Less than $5,000 | 0 (0.0%) | 0 (0.0%) |
| $5,000 to $9,999 | 3 (4.6%) | 0 (0.0%) |
| $10,000 to $14,999 | 5 (7.7%) | 6 (42.9%) |
| $15,000 to $19,999 | 11 (16.9%) | 0 (0.0%) |
| $20,000 to $24,999 | 7 (10.8%) | 2 (14.3%) |
| $25,000 to $34,999 | 4 (6.1%) | 0 (0.0%) |
| $35,000 to $49,999 | 13 (20.0%) | 0 (0.0%) |
| $50,000 to $74,999 | 5 (7.7%) | 6 (42.9%) |
| $75,000 to $99,999 | 14 (21.5%) | 0 (0.0%) |
| $100,000 to $149,999 | 1 (1.5%) | 0 (0.0%) |
| $150,000 or more | 2 (3.1%) | 0 (0.0%) |
| Total | 65 (100.0%) | 14 (100.0%) |
Monthly Housing Cost Tiers in Hunnewell
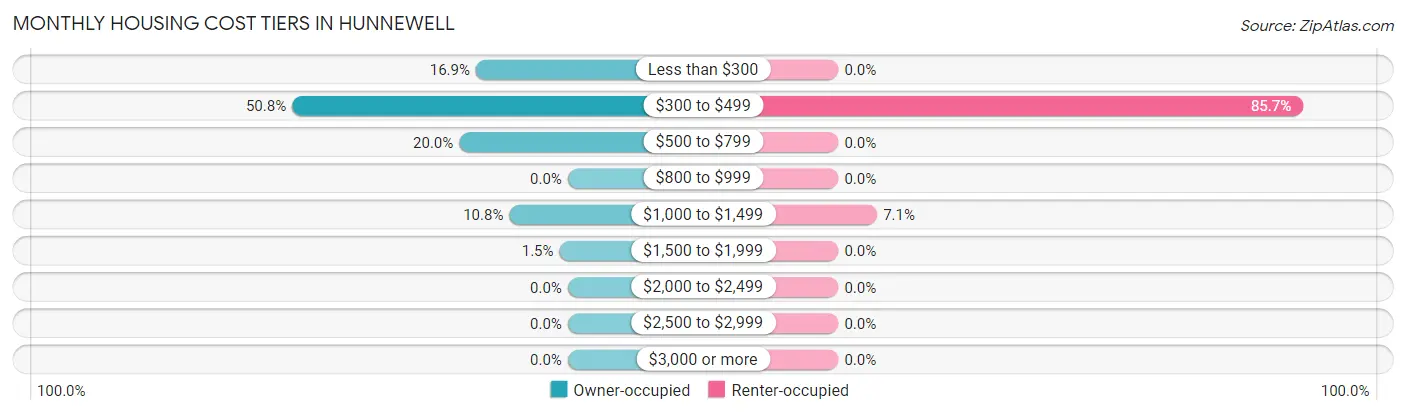
| Monthly Cost | Owner-occupied | Renter-occupied |
| Less than $300 | 11 (16.9%) | 0 (0.0%) |
| $300 to $499 | 33 (50.8%) | 12 (85.7%) |
| $500 to $799 | 13 (20.0%) | 0 (0.0%) |
| $800 to $999 | 0 (0.0%) | 0 (0.0%) |
| $1,000 to $1,499 | 7 (10.8%) | 1 (7.1%) |
| $1,500 to $1,999 | 1 (1.5%) | 0 (0.0%) |
| $2,000 to $2,499 | 0 (0.0%) | 0 (0.0%) |
| $2,500 to $2,999 | 0 (0.0%) | 0 (0.0%) |
| $3,000 or more | 0 (0.0%) | 0 (0.0%) |
| Total | 65 (100.0%) | 14 (100.0%) |
Physical Housing Characteristics in Hunnewell
Housing Structures in Hunnewell
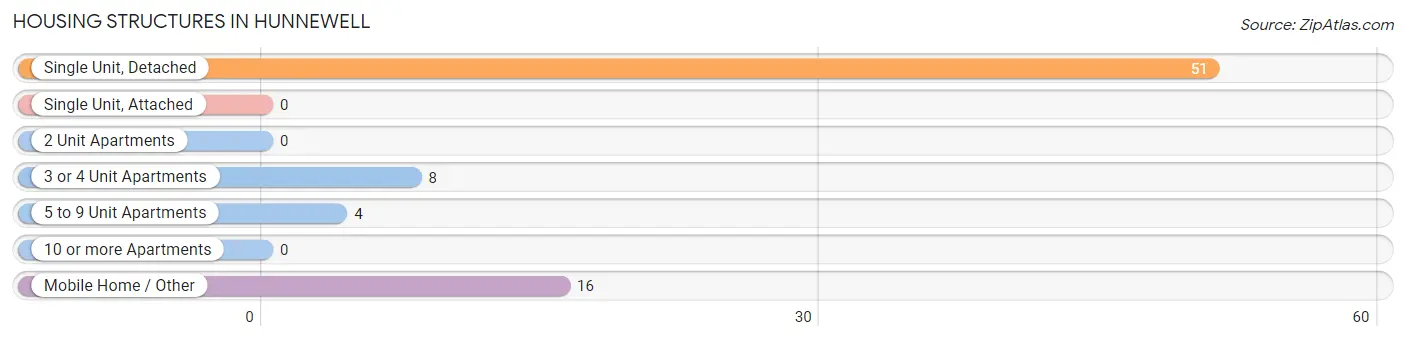
| Structure Type | # Housing Units | % Housing Units |
| Single Unit, Detached | 51 | 64.6% |
| Single Unit, Attached | 0 | 0.0% |
| 2 Unit Apartments | 0 | 0.0% |
| 3 or 4 Unit Apartments | 8 | 10.1% |
| 5 to 9 Unit Apartments | 4 | 5.1% |
| 10 or more Apartments | 0 | 0.0% |
| Mobile Home / Other | 16 | 20.3% |
| Total | 79 | 100.0% |
Housing Structures by Occupancy in Hunnewell
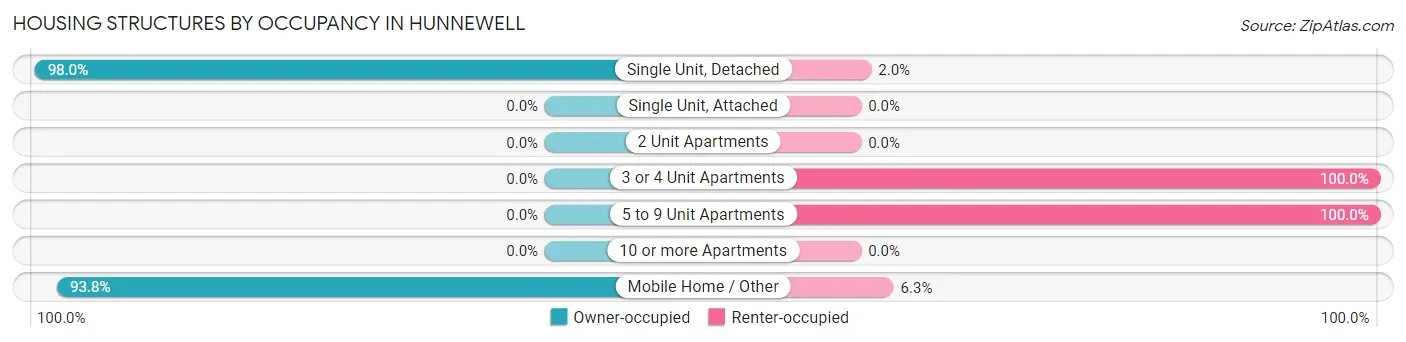
| Structure Type | Owner-occupied | Renter-occupied |
| Single Unit, Detached | 50 (98.0%) | 1 (2.0%) |
| Single Unit, Attached | 0 (0.0%) | 0 (0.0%) |
| 2 Unit Apartments | 0 (0.0%) | 0 (0.0%) |
| 3 or 4 Unit Apartments | 0 (0.0%) | 8 (100.0%) |
| 5 to 9 Unit Apartments | 0 (0.0%) | 4 (100.0%) |
| 10 or more Apartments | 0 (0.0%) | 0 (0.0%) |
| Mobile Home / Other | 15 (93.8%) | 1 (6.2%) |
| Total | 65 (82.3%) | 14 (17.7%) |
Housing Structures by Number of Rooms in Hunnewell
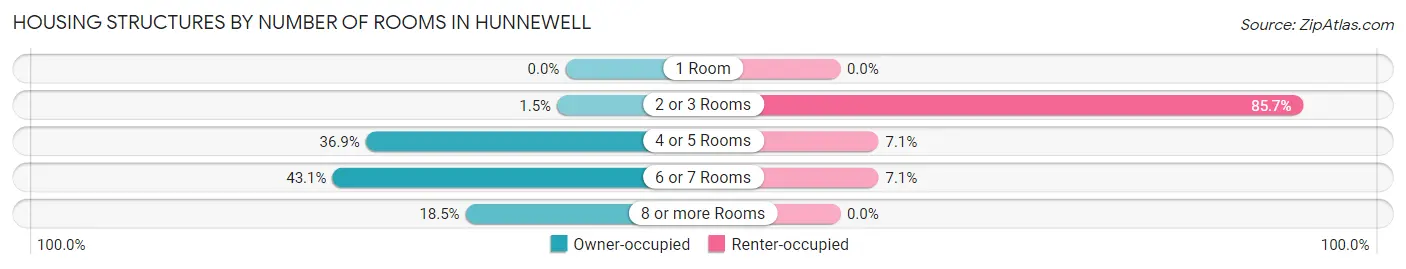
| Number of Rooms | Owner-occupied | Renter-occupied |
| 1 Room | 0 (0.0%) | 0 (0.0%) |
| 2 or 3 Rooms | 1 (1.5%) | 12 (85.7%) |
| 4 or 5 Rooms | 24 (36.9%) | 1 (7.1%) |
| 6 or 7 Rooms | 28 (43.1%) | 1 (7.1%) |
| 8 or more Rooms | 12 (18.5%) | 0 (0.0%) |
| Total | 65 (100.0%) | 14 (100.0%) |
Housing Structure by Heating Type in Hunnewell
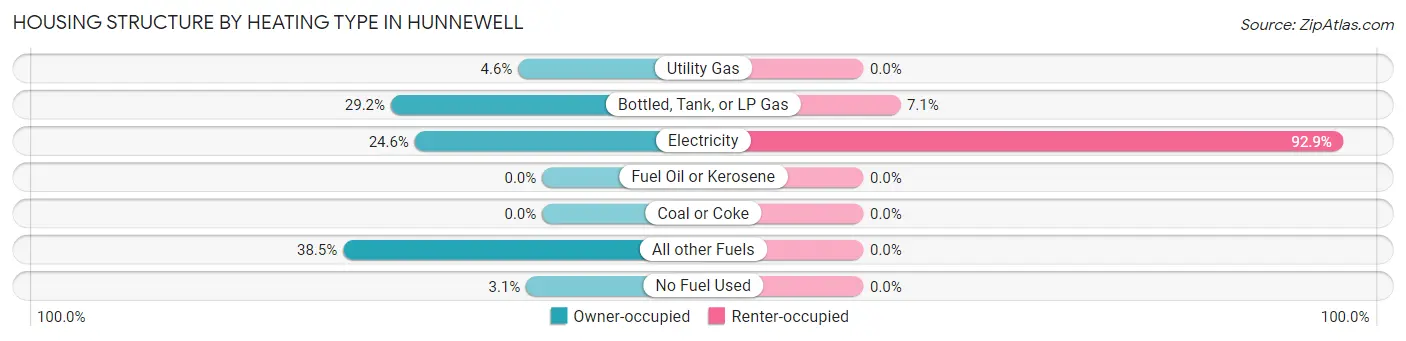
| Heating Type | Owner-occupied | Renter-occupied |
| Utility Gas | 3 (4.6%) | 0 (0.0%) |
| Bottled, Tank, or LP Gas | 19 (29.2%) | 1 (7.1%) |
| Electricity | 16 (24.6%) | 13 (92.9%) |
| Fuel Oil or Kerosene | 0 (0.0%) | 0 (0.0%) |
| Coal or Coke | 0 (0.0%) | 0 (0.0%) |
| All other Fuels | 25 (38.5%) | 0 (0.0%) |
| No Fuel Used | 2 (3.1%) | 0 (0.0%) |
| Total | 65 (100.0%) | 14 (100.0%) |
Household Vehicle Usage in Hunnewell
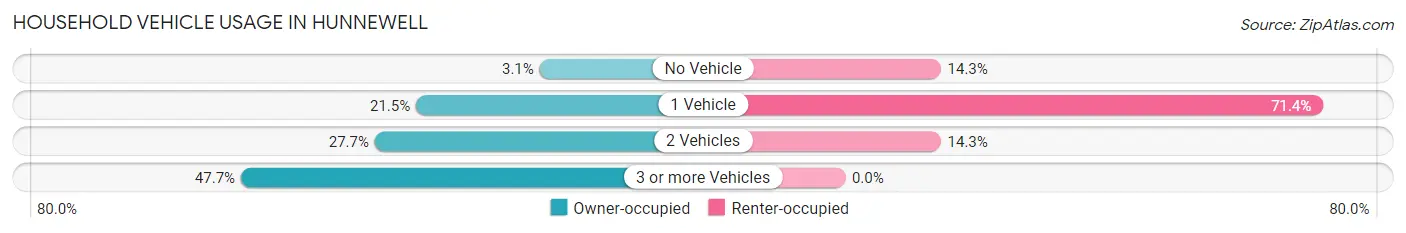
| Vehicles per Household | Owner-occupied | Renter-occupied |
| No Vehicle | 2 (3.1%) | 2 (14.3%) |
| 1 Vehicle | 14 (21.5%) | 10 (71.4%) |
| 2 Vehicles | 18 (27.7%) | 2 (14.3%) |
| 3 or more Vehicles | 31 (47.7%) | 0 (0.0%) |
| Total | 65 (100.0%) | 14 (100.0%) |
Real Estate & Mortgages in Hunnewell
Real Estate and Mortgage Overview in Hunnewell
| Characteristic | Without Mortgage | With Mortgage |
| Housing Units | 50 | 15 |
| Median Property Value | $33,400 | $81,000 |
| Median Household Income | $47,955 | $0 |
| Monthly Housing Costs | $347 | $0 |
| Real Estate Taxes | $386 | $0 |
Property Value by Mortgage Status in Hunnewell
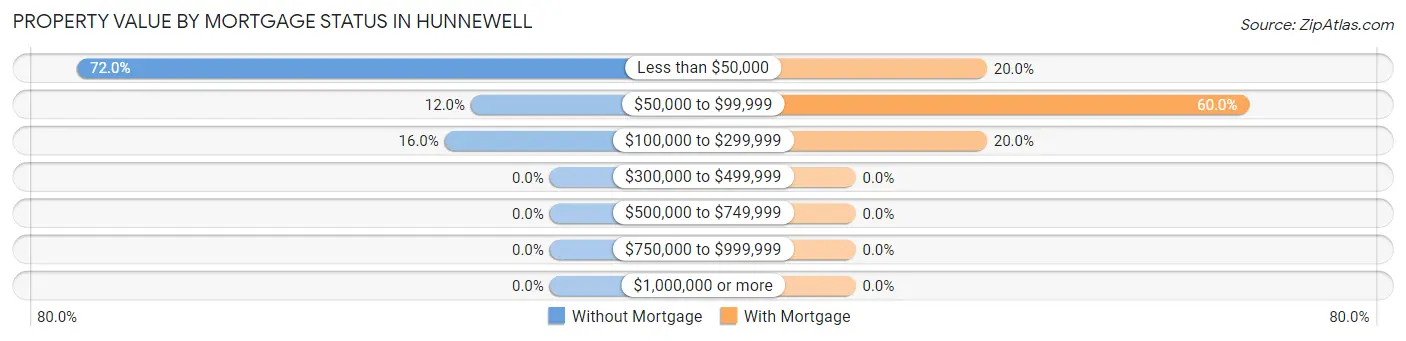
| Property Value | Without Mortgage | With Mortgage |
| Less than $50,000 | 36 (72.0%) | 3 (20.0%) |
| $50,000 to $99,999 | 6 (12.0%) | 9 (60.0%) |
| $100,000 to $299,999 | 8 (16.0%) | 3 (20.0%) |
| $300,000 to $499,999 | 0 (0.0%) | 0 (0.0%) |
| $500,000 to $749,999 | 0 (0.0%) | 0 (0.0%) |
| $750,000 to $999,999 | 0 (0.0%) | 0 (0.0%) |
| $1,000,000 or more | 0 (0.0%) | 0 (0.0%) |
| Total | 50 (100.0%) | 15 (100.0%) |
Household Income by Mortgage Status in Hunnewell
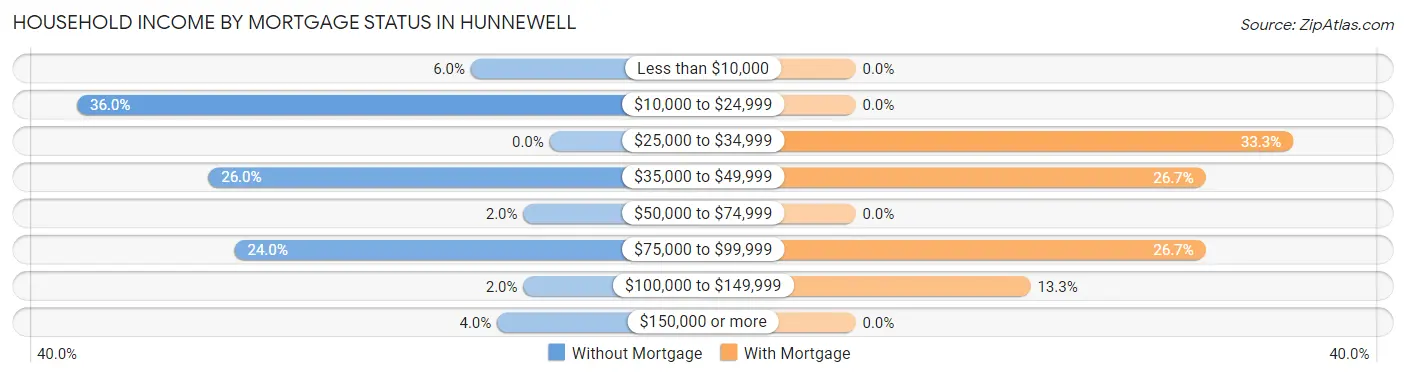
| Household Income | Without Mortgage | With Mortgage |
| Less than $10,000 | 3 (6.0%) | 0 (0.0%) |
| $10,000 to $24,999 | 18 (36.0%) | 0 (0.0%) |
| $25,000 to $34,999 | 0 (0.0%) | 5 (33.3%) |
| $35,000 to $49,999 | 13 (26.0%) | 4 (26.7%) |
| $50,000 to $74,999 | 1 (2.0%) | 0 (0.0%) |
| $75,000 to $99,999 | 12 (24.0%) | 4 (26.7%) |
| $100,000 to $149,999 | 1 (2.0%) | 2 (13.3%) |
| $150,000 or more | 2 (4.0%) | 0 (0.0%) |
| Total | 50 (100.0%) | 15 (100.0%) |
Property Value to Household Income Ratio in Hunnewell
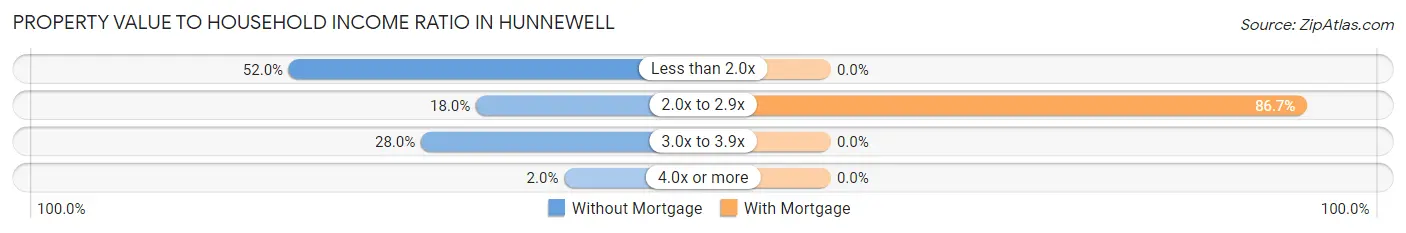
| Value-to-Income Ratio | Without Mortgage | With Mortgage |
| Less than 2.0x | 26 (52.0%) | 0 (0.0%) |
| 2.0x to 2.9x | 9 (18.0%) | 13 (86.7%) |
| 3.0x to 3.9x | 14 (28.0%) | 0 (0.0%) |
| 4.0x or more | 1 (2.0%) | 0 (0.0%) |
| Total | 50 (100.0%) | 15 (100.0%) |
Real Estate Taxes by Mortgage Status in Hunnewell
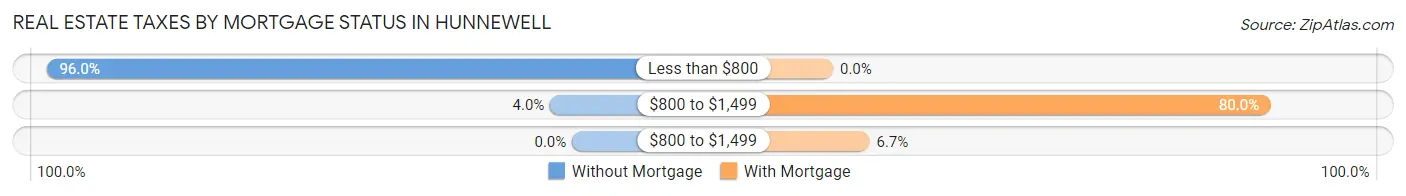
| Property Taxes | Without Mortgage | With Mortgage |
| Less than $800 | 48 (96.0%) | 0 (0.0%) |
| $800 to $1,499 | 2 (4.0%) | 12 (80.0%) |
| $800 to $1,499 | 0 (0.0%) | 1 (6.7%) |
| Total | 50 (100.0%) | 15 (100.0%) |
Health & Disability in Hunnewell
Health Insurance Coverage by Age in Hunnewell

| Age Bracket | With Coverage | Without Coverage |
| Under 6 Years | 5 (100.0%) | 0 (0.0%) |
| 6 to 18 Years | 22 (100.0%) | 0 (0.0%) |
| 19 to 25 Years | 0 (0.0%) | 3 (100.0%) |
| 26 to 34 Years | 16 (100.0%) | 0 (0.0%) |
| 35 to 44 Years | 3 (13.0%) | 20 (87.0%) |
| 45 to 54 Years | 12 (63.2%) | 7 (36.8%) |
| 55 to 64 Years | 12 (42.9%) | 16 (57.1%) |
| 65 to 74 Years | 39 (100.0%) | 0 (0.0%) |
| 75 Years and older | 9 (100.0%) | 0 (0.0%) |
| Total | 118 (72.0%) | 46 (28.1%) |
Health Insurance Coverage by Citizenship Status in Hunnewell
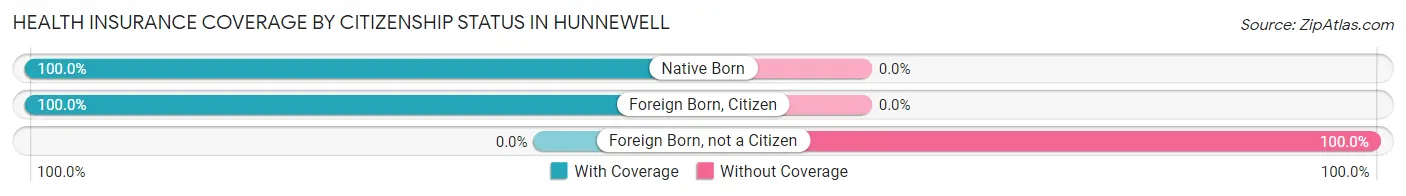
| Citizenship Status | With Coverage | Without Coverage |
| Native Born | 5 (100.0%) | 0 (0.0%) |
| Foreign Born, Citizen | 22 (100.0%) | 0 (0.0%) |
| Foreign Born, not a Citizen | 0 (0.0%) | 3 (100.0%) |
Health Insurance Coverage by Household Income in Hunnewell
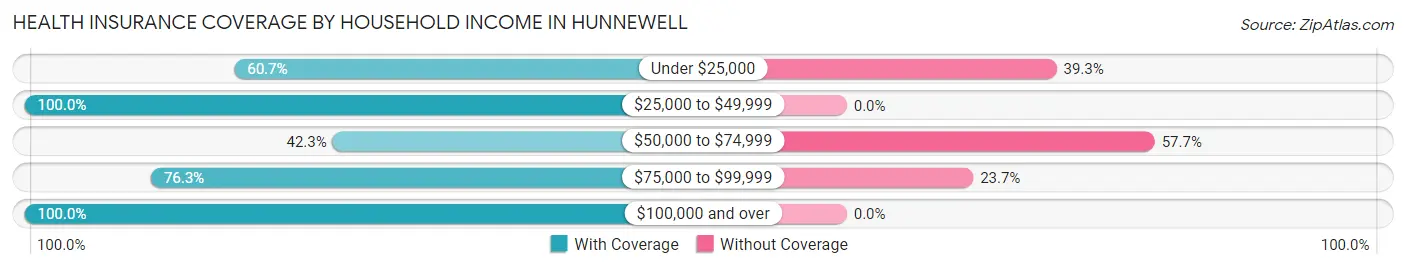
| Household Income | With Coverage | Without Coverage |
| Under $25,000 | 34 (60.7%) | 22 (39.3%) |
| $25,000 to $49,999 | 31 (100.0%) | 0 (0.0%) |
| $50,000 to $74,999 | 11 (42.3%) | 15 (57.7%) |
| $75,000 to $99,999 | 29 (76.3%) | 9 (23.7%) |
| $100,000 and over | 13 (100.0%) | 0 (0.0%) |
Public vs Private Health Insurance Coverage by Age in Hunnewell
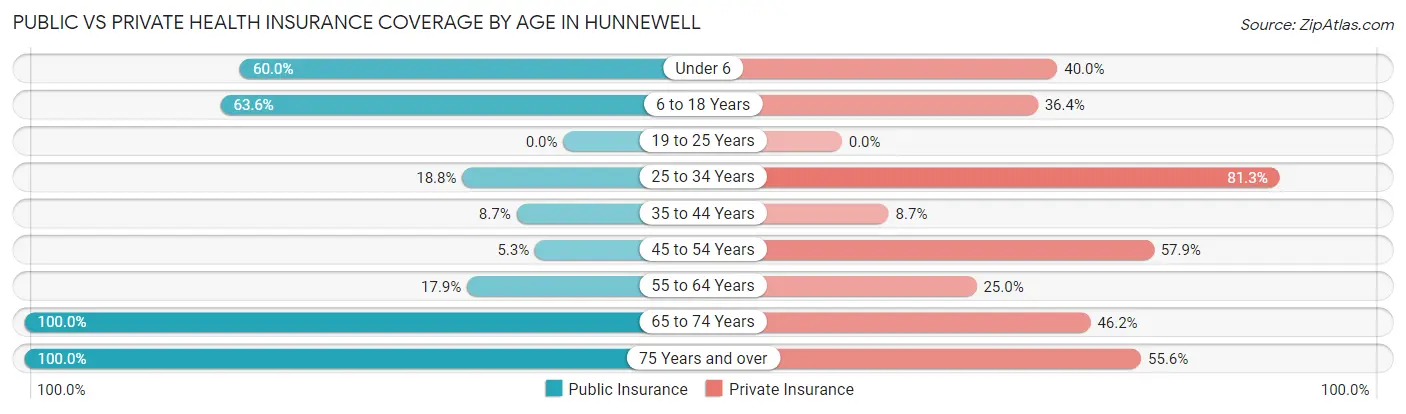
| Age Bracket | Public Insurance | Private Insurance |
| Under 6 | 3 (60.0%) | 2 (40.0%) |
| 6 to 18 Years | 14 (63.6%) | 8 (36.4%) |
| 19 to 25 Years | 0 (0.0%) | 0 (0.0%) |
| 25 to 34 Years | 3 (18.8%) | 13 (81.2%) |
| 35 to 44 Years | 2 (8.7%) | 2 (8.7%) |
| 45 to 54 Years | 1 (5.3%) | 11 (57.9%) |
| 55 to 64 Years | 5 (17.9%) | 7 (25.0%) |
| 65 to 74 Years | 39 (100.0%) | 18 (46.2%) |
| 75 Years and over | 9 (100.0%) | 5 (55.6%) |
| Total | 76 (46.3%) | 66 (40.2%) |
Disability Status by Sex by Age in Hunnewell
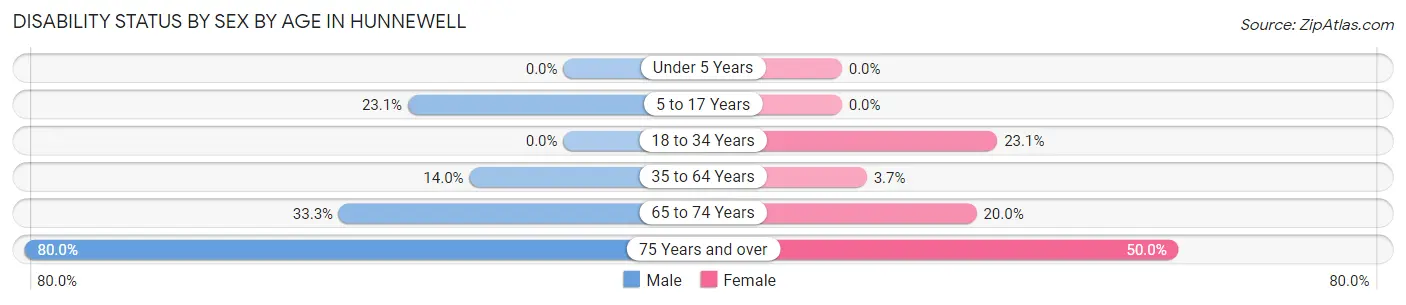
| Age Bracket | Male | Female |
| Under 5 Years | 0 (0.0%) | 0 (0.0%) |
| 5 to 17 Years | 3 (23.1%) | 0 (0.0%) |
| 18 to 34 Years | 0 (0.0%) | 3 (23.1%) |
| 35 to 64 Years | 6 (14.0%) | 1 (3.7%) |
| 65 to 74 Years | 8 (33.3%) | 3 (20.0%) |
| 75 Years and over | 4 (80.0%) | 2 (50.0%) |
Disability Class by Sex by Age in Hunnewell
Disability Class: Hearing Difficulty
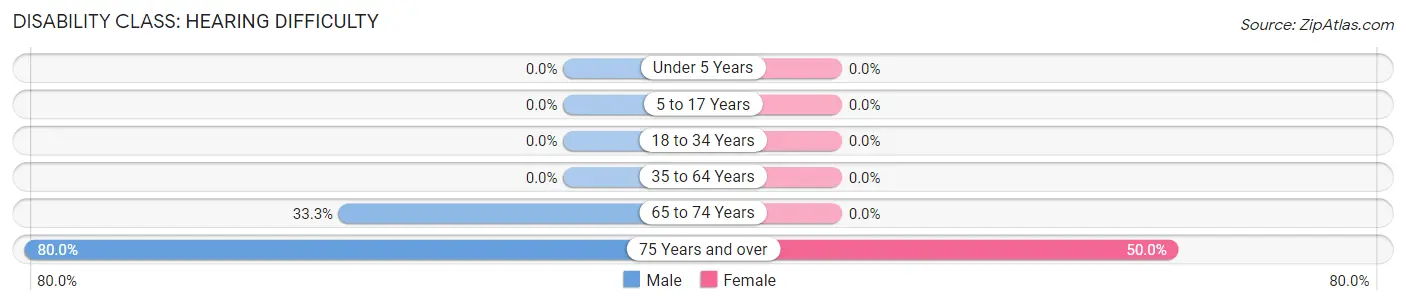
| Age Bracket | Male | Female |
| Under 5 Years | 0 (0.0%) | 0 (0.0%) |
| 5 to 17 Years | 0 (0.0%) | 0 (0.0%) |
| 18 to 34 Years | 0 (0.0%) | 0 (0.0%) |
| 35 to 64 Years | 0 (0.0%) | 0 (0.0%) |
| 65 to 74 Years | 8 (33.3%) | 0 (0.0%) |
| 75 Years and over | 4 (80.0%) | 2 (50.0%) |
Disability Class: Vision Difficulty
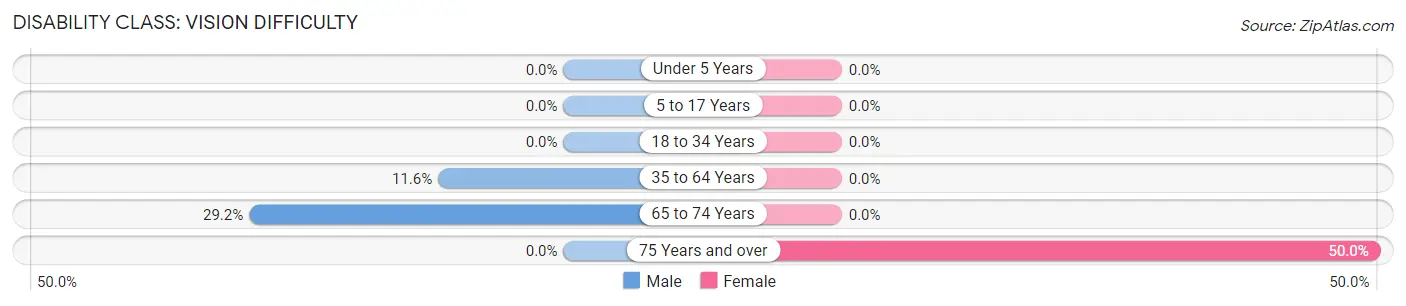
| Age Bracket | Male | Female |
| Under 5 Years | 0 (0.0%) | 0 (0.0%) |
| 5 to 17 Years | 0 (0.0%) | 0 (0.0%) |
| 18 to 34 Years | 0 (0.0%) | 0 (0.0%) |
| 35 to 64 Years | 5 (11.6%) | 0 (0.0%) |
| 65 to 74 Years | 7 (29.2%) | 0 (0.0%) |
| 75 Years and over | 0 (0.0%) | 2 (50.0%) |
Disability Class: Cognitive Difficulty
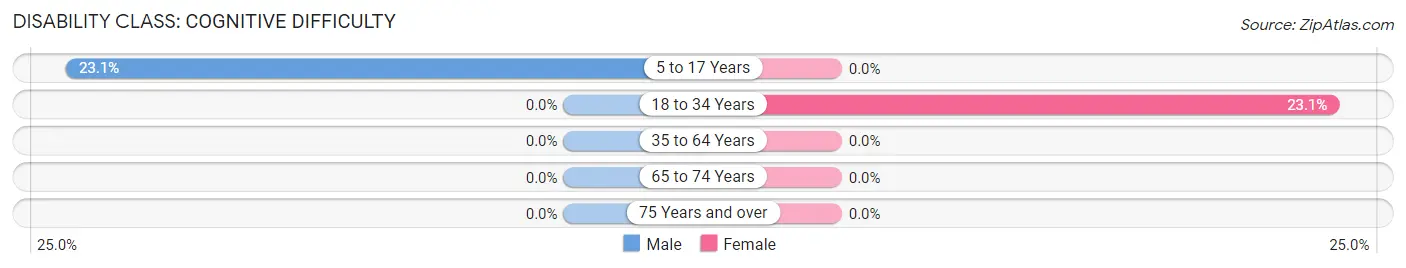
| Age Bracket | Male | Female |
| 5 to 17 Years | 3 (23.1%) | 0 (0.0%) |
| 18 to 34 Years | 0 (0.0%) | 3 (23.1%) |
| 35 to 64 Years | 0 (0.0%) | 0 (0.0%) |
| 65 to 74 Years | 0 (0.0%) | 0 (0.0%) |
| 75 Years and over | 0 (0.0%) | 0 (0.0%) |
Disability Class: Ambulatory Difficulty
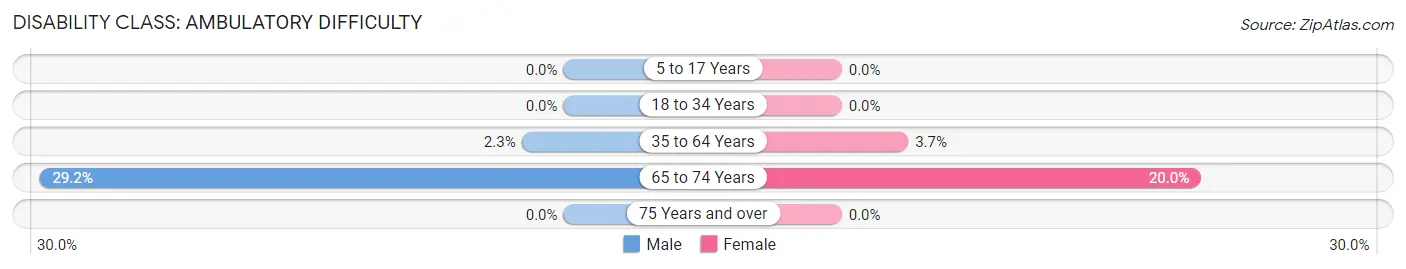
| Age Bracket | Male | Female |
| 5 to 17 Years | 0 (0.0%) | 0 (0.0%) |
| 18 to 34 Years | 0 (0.0%) | 0 (0.0%) |
| 35 to 64 Years | 1 (2.3%) | 1 (3.7%) |
| 65 to 74 Years | 7 (29.2%) | 3 (20.0%) |
| 75 Years and over | 0 (0.0%) | 0 (0.0%) |
Disability Class: Self-Care Difficulty
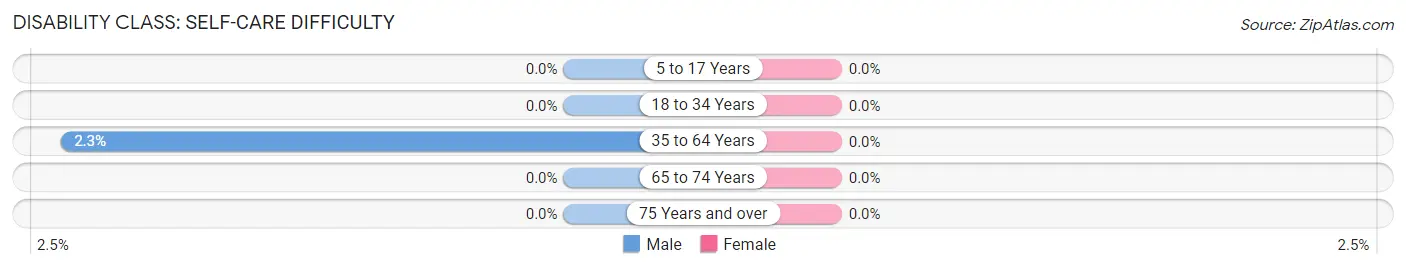
| Age Bracket | Male | Female |
| 5 to 17 Years | 0 (0.0%) | 0 (0.0%) |
| 18 to 34 Years | 0 (0.0%) | 0 (0.0%) |
| 35 to 64 Years | 1 (2.3%) | 0 (0.0%) |
| 65 to 74 Years | 0 (0.0%) | 0 (0.0%) |
| 75 Years and over | 0 (0.0%) | 0 (0.0%) |
Technology Access in Hunnewell
Computing Device Access in Hunnewell
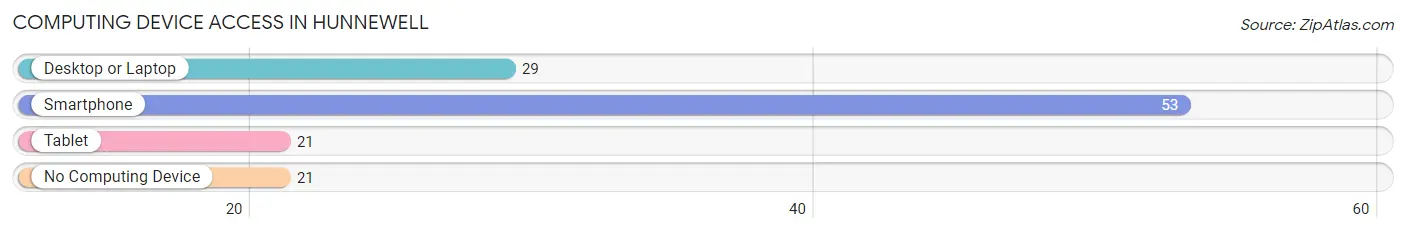
| Device Type | # Households | % Households |
| Desktop or Laptop | 29 | 36.7% |
| Smartphone | 53 | 67.1% |
| Tablet | 21 | 26.6% |
| No Computing Device | 21 | 26.6% |
| Total | 79 | 100.0% |
Internet Access in Hunnewell
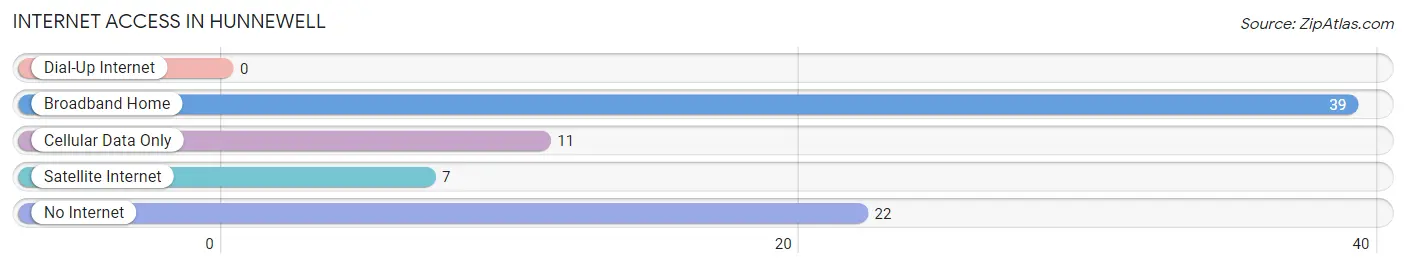
| Internet Type | # Households | % Households |
| Dial-Up Internet | 0 | 0.0% |
| Broadband Home | 39 | 49.4% |
| Cellular Data Only | 11 | 13.9% |
| Satellite Internet | 7 | 8.9% |
| No Internet | 22 | 27.9% |
| Total | 79 | 100.0% |
Hunnewell Summary
Hunnewell, Missouri is a small town located in the northeast corner of the state, in Marion County. It is situated on the banks of the Salt River, and is surrounded by rolling hills and farmland. The town was founded in 1871, and has a population of just over 500 people.
The town was named after the Hunnewell family, who were among the first settlers in the area. The family had come from England in the early 1800s, and had settled in the area to farm. The town was officially incorporated in 1872, and the first post office was established in 1873.
The economy of Hunnewell is largely based on agriculture. The town is home to several farms, and the surrounding area is known for its production of corn, soybeans, and wheat. There are also several small businesses in the town, including a grocery store, a hardware store, and a few restaurants.
The geography of Hunnewell is typical of the Midwest. The town is located in a flat, open area, with rolling hills and farmland in the surrounding area. The Salt River runs through the town, and there are several small lakes and ponds in the area. The town is located about 30 miles from the nearest major city, Hannibal.
The demographics of Hunnewell are typical of a small rural town. The population is mostly white, with a small percentage of African Americans and Hispanics. The median household income is around $35,000, and the median age is around 40. The town is served by one public school, and there are several churches in the area.
Hunnewell is a small, quiet town with a rich history and a strong sense of community. The town is a great place to raise a family, and the surrounding area offers plenty of outdoor activities. The town is also close to several larger cities, making it a great place to live for those who want to be close to the amenities of a larger city, but still enjoy the peace and quiet of a small town.
Common Questions
What is Per Capita Income in Hunnewell?
Per Capita income in Hunnewell is $23,719.
What is the Median Family Income in Hunnewell?
Median Family Income in Hunnewell is $63,750.
What is the Median Household income in Hunnewell?
Median Household Income in Hunnewell is $41,250.
What is Inequality or Gini Index in Hunnewell?
Inequality or Gini Index in Hunnewell is 0.41.
What is the Total Population of Hunnewell?
Total Population of Hunnewell is 164.
What is the Total Male Population of Hunnewell?
Total Male Population of Hunnewell is 97.
What is the Total Female Population of Hunnewell?
Total Female Population of Hunnewell is 67.
What is the Ratio of Males per 100 Females in Hunnewell?
There are 144.78 Males per 100 Females in Hunnewell.
What is the Ratio of Females per 100 Males in Hunnewell?
There are 69.07 Females per 100 Males in Hunnewell.
What is the Median Population Age in Hunnewell?
Median Population Age in Hunnewell is 53.3 Years.
What is the Average Family Size in Hunnewell
Average Family Size in Hunnewell is 2.7 People.
What is the Average Household Size in Hunnewell
Average Household Size in Hunnewell is 2.1 People.
How Large is the Labor Force in Hunnewell?
There are 79 People in the Labor Forcein in Hunnewell.
What is the Percentage of People in the Labor Force in Hunnewell?
56.4% of People are in the Labor Force in Hunnewell.