Hermann, MO Map & Demographics
Hermann Map
Hermann Overview
$32,371
PER CAPITA INCOME
$73,036
AVG FAMILY INCOME
$55,833
AVG HOUSEHOLD INCOME
35.0%
WAGE / INCOME GAP [ % ]
65.0¢/ $1
WAGE / INCOME GAP [ $ ]
0.45
INEQUALITY / GINI INDEX
2,374
TOTAL POPULATION
1,165
MALE POPULATION
1,209
FEMALE POPULATION
96.36
MALES / 100 FEMALES
103.78
FEMALES / 100 MALES
45.4
MEDIAN AGE
3.0
AVG FAMILY SIZE
2.3
AVG HOUSEHOLD SIZE
1,124
LABOR FORCE [ PEOPLE ]
59.2%
PERCENT IN LABOR FORCE
3.6%
UNEMPLOYMENT RATE
Hermann Zip Codes
Hermann Area Codes
Income in Hermann
Income Overview in Hermann
Per Capita Income in Hermann is $32,371, while median incomes of families and households are $73,036 and $55,833 respectively.
| Characteristic | Number | Measure |
| Per Capita Income | 2,374 | $32,371 |
| Median Family Income | 584 | $73,036 |
| Mean Family Income | 584 | $93,037 |
| Median Household Income | 1,006 | $55,833 |
| Mean Household Income | 1,006 | $74,686 |
| Income Deficit | 584 | $0 |
| Wage / Income Gap (%) | 2,374 | 35.02% |
| Wage / Income Gap ($) | 2,374 | 64.98¢ per $1 |
| Gini / Inequality Index | 2,374 | 0.45 |
Earnings by Sex in Hermann
Average Earnings in Hermann are $39,150, $45,203 for men and $29,375 for women, a difference of 35.0%.
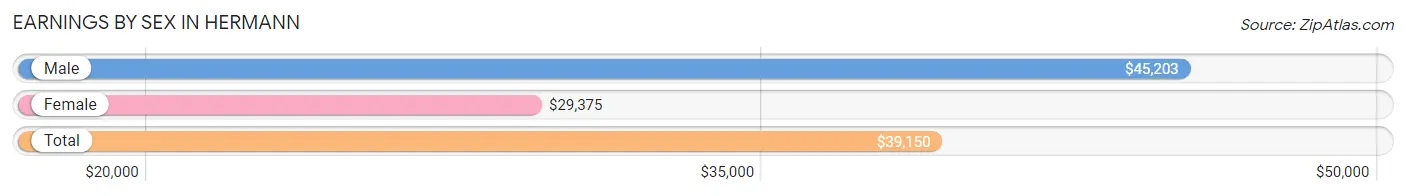
| Sex | Number | Average Earnings |
| Male | 652 (55.3%) | $45,203 |
| Female | 527 (44.7%) | $29,375 |
| Total | 1,179 (100.0%) | $39,150 |
Earnings by Sex by Income Bracket in Hermann
The most common earnings brackets in Hermann are $75,000 to $99,999 for men (88 | 13.5%) and $40,000 to $44,999 for women (63 | 11.9%).
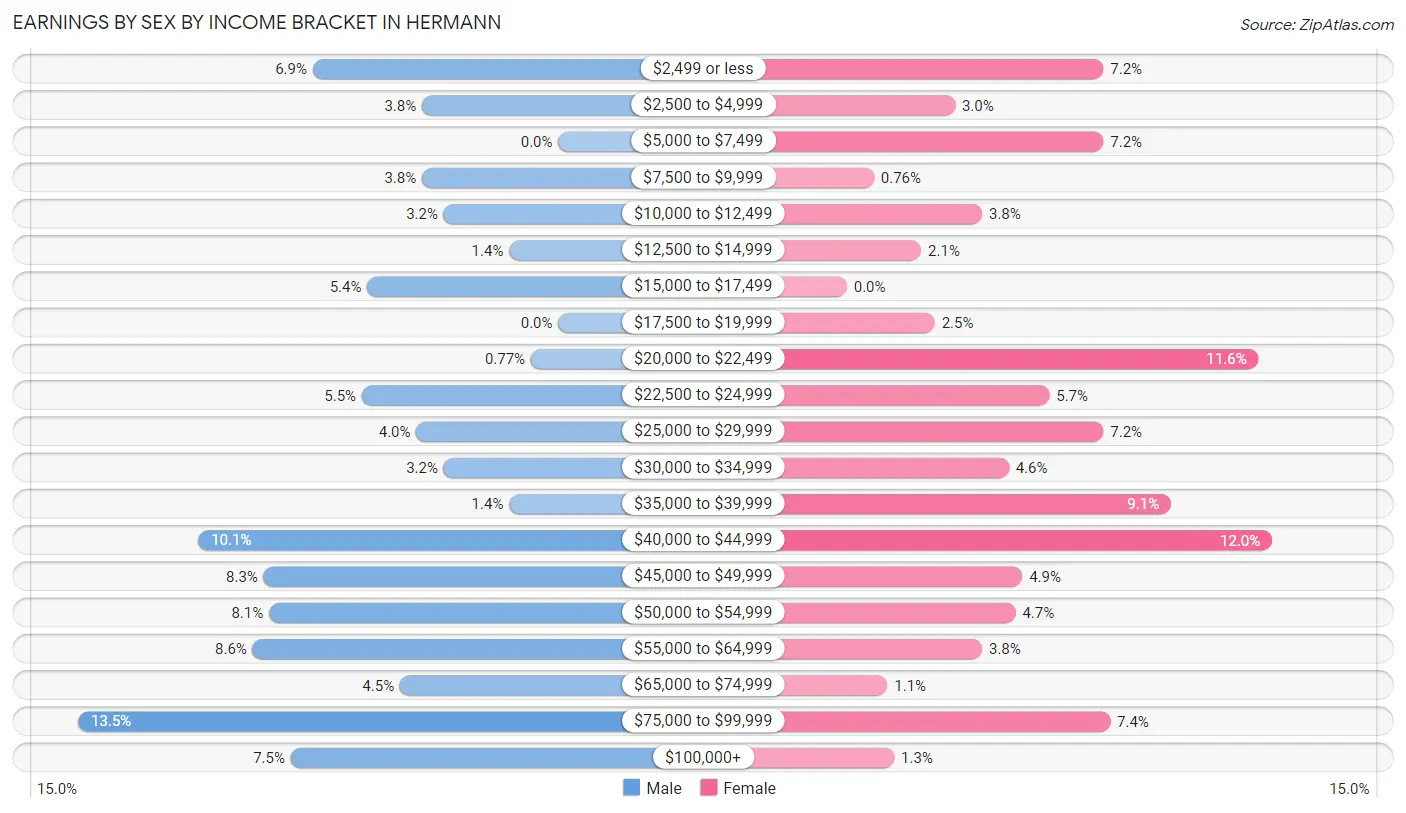
| Income | Male | Female |
| $2,499 or less | 45 (6.9%) | 38 (7.2%) |
| $2,500 to $4,999 | 25 (3.8%) | 16 (3.0%) |
| $5,000 to $7,499 | 0 (0.0%) | 38 (7.2%) |
| $7,500 to $9,999 | 25 (3.8%) | 4 (0.8%) |
| $10,000 to $12,499 | 21 (3.2%) | 20 (3.8%) |
| $12,500 to $14,999 | 9 (1.4%) | 11 (2.1%) |
| $15,000 to $17,499 | 35 (5.4%) | 0 (0.0%) |
| $17,500 to $19,999 | 0 (0.0%) | 13 (2.5%) |
| $20,000 to $22,499 | 5 (0.8%) | 61 (11.6%) |
| $22,500 to $24,999 | 36 (5.5%) | 30 (5.7%) |
| $25,000 to $29,999 | 26 (4.0%) | 38 (7.2%) |
| $30,000 to $34,999 | 21 (3.2%) | 24 (4.5%) |
| $35,000 to $39,999 | 9 (1.4%) | 48 (9.1%) |
| $40,000 to $44,999 | 66 (10.1%) | 63 (11.9%) |
| $45,000 to $49,999 | 54 (8.3%) | 26 (4.9%) |
| $50,000 to $54,999 | 53 (8.1%) | 25 (4.7%) |
| $55,000 to $64,999 | 56 (8.6%) | 20 (3.8%) |
| $65,000 to $74,999 | 29 (4.4%) | 6 (1.1%) |
| $75,000 to $99,999 | 88 (13.5%) | 39 (7.4%) |
| $100,000+ | 49 (7.5%) | 7 (1.3%) |
| Total | 652 (100.0%) | 527 (100.0%) |
Earnings by Sex by Educational Attainment in Hermann
Average earnings in Hermann are $46,655 for men and $29,943 for women, a difference of 35.8%. Men with an educational attainment of graduate degree enjoy the highest average annual earnings of $57,679, while those with bachelor's degree education earn the least with $40,417. Women with an educational attainment of graduate degree earn the most with the average annual earnings of $46,250, while those with high school diploma education have the smallest earnings of $27,857.
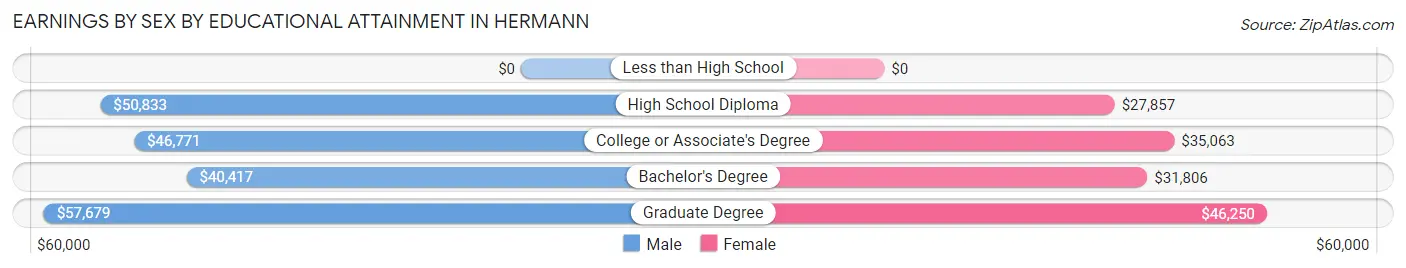
| Educational Attainment | Male Income | Female Income |
| Less than High School | - | - |
| High School Diploma | $50,833 | $27,857 |
| College or Associate's Degree | $46,771 | $35,063 |
| Bachelor's Degree | $40,417 | $31,806 |
| Graduate Degree | $57,679 | $46,250 |
| Total | $46,655 | $29,943 |
Family Income in Hermann
Family Income Brackets in Hermann
According to the Hermann family income data, there are 137 families falling into the $50,000 to $74,999 income range, which is the most common income bracket and makes up 23.5% of all families. Conversely, the $10,000 to $14,999 income bracket is the least frequent group with only 3 families (0.5%) belonging to this category.
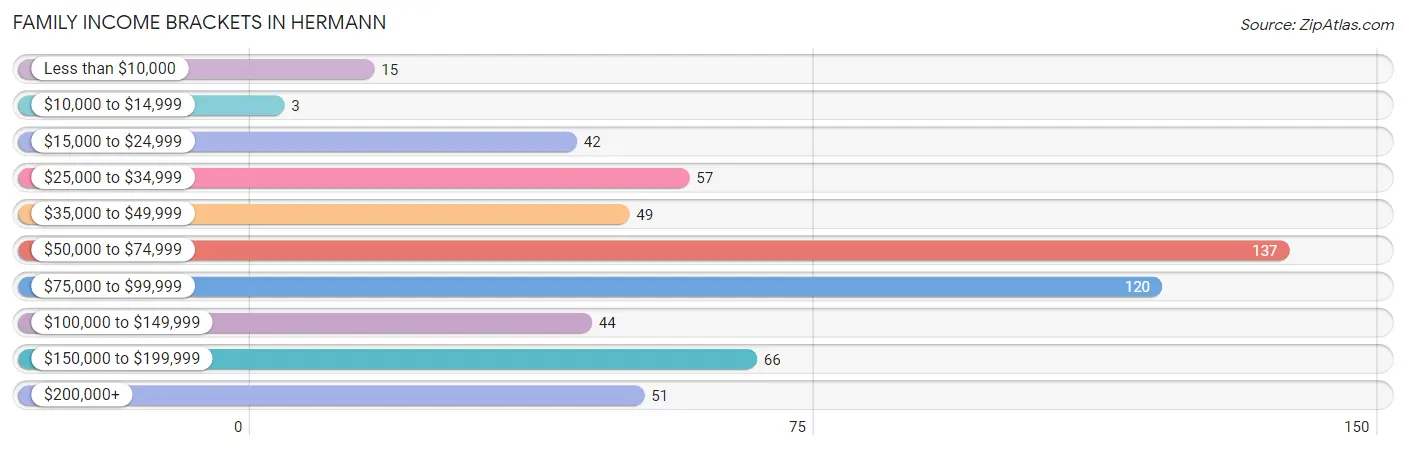
| Income Bracket | # Families | % Families |
| Less than $10,000 | 15 | 2.6% |
| $10,000 to $14,999 | 3 | 0.5% |
| $15,000 to $24,999 | 42 | 7.2% |
| $25,000 to $34,999 | 57 | 9.8% |
| $35,000 to $49,999 | 49 | 8.4% |
| $50,000 to $74,999 | 137 | 23.5% |
| $75,000 to $99,999 | 120 | 20.5% |
| $100,000 to $149,999 | 44 | 7.5% |
| $150,000 to $199,999 | 66 | 11.3% |
| $200,000+ | 51 | 8.7% |
Family Income by Famaliy Size in Hermann
4-person families (48 | 8.2%) account for the highest median family income in Hermann with $86,071 per family, while 2-person families (316 | 54.1%) have the highest median income of $39,643 per family member.
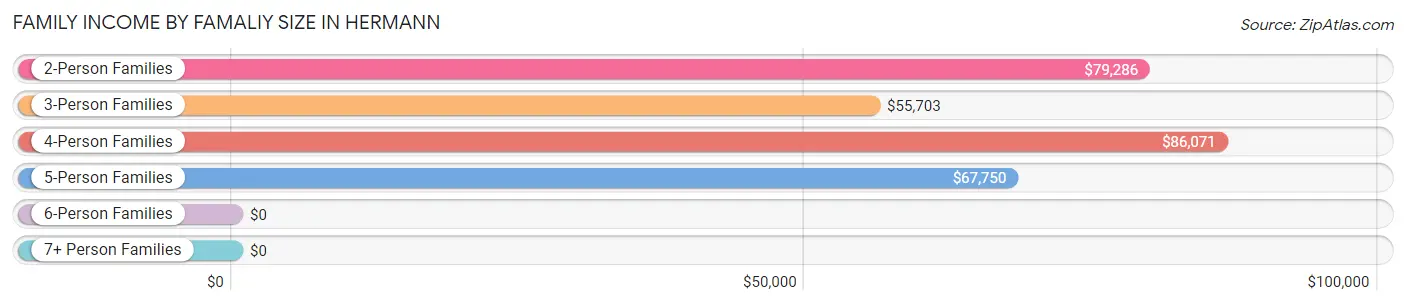
| Income Bracket | # Families | Median Income |
| 2-Person Families | 316 (54.1%) | $79,286 |
| 3-Person Families | 95 (16.3%) | $55,703 |
| 4-Person Families | 48 (8.2%) | $86,071 |
| 5-Person Families | 59 (10.1%) | $67,750 |
| 6-Person Families | 58 (9.9%) | $0 |
| 7+ Person Families | 8 (1.4%) | $0 |
| Total | 584 (100.0%) | $73,036 |
Family Income by Number of Earners in Hermann
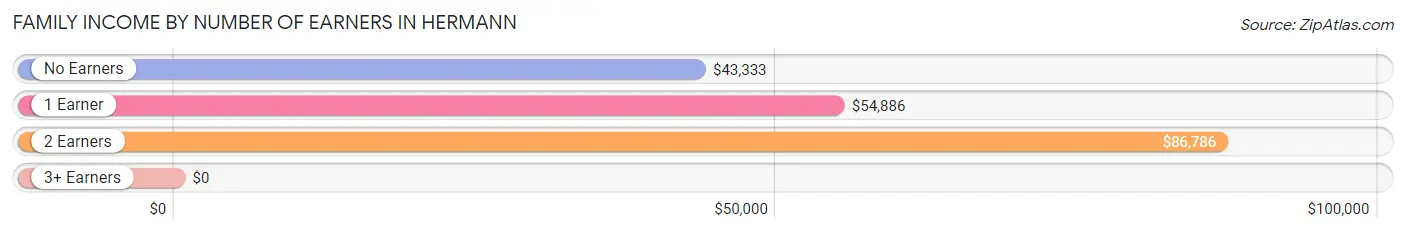
| Number of Earners | # Families | Median Income |
| No Earners | 74 (12.7%) | $43,333 |
| 1 Earner | 233 (39.9%) | $54,886 |
| 2 Earners | 242 (41.4%) | $86,786 |
| 3+ Earners | 35 (6.0%) | $0 |
| Total | 584 (100.0%) | $73,036 |
Household Income in Hermann
Household Income Brackets in Hermann
With 216 households falling in the category, the $50,000 to $74,999 income range is the most frequent in Hermann, accounting for 21.5% of all households. In contrast, only 35 households (3.5%) fall into the $10,000 to $14,999 income bracket, making it the least populous group.
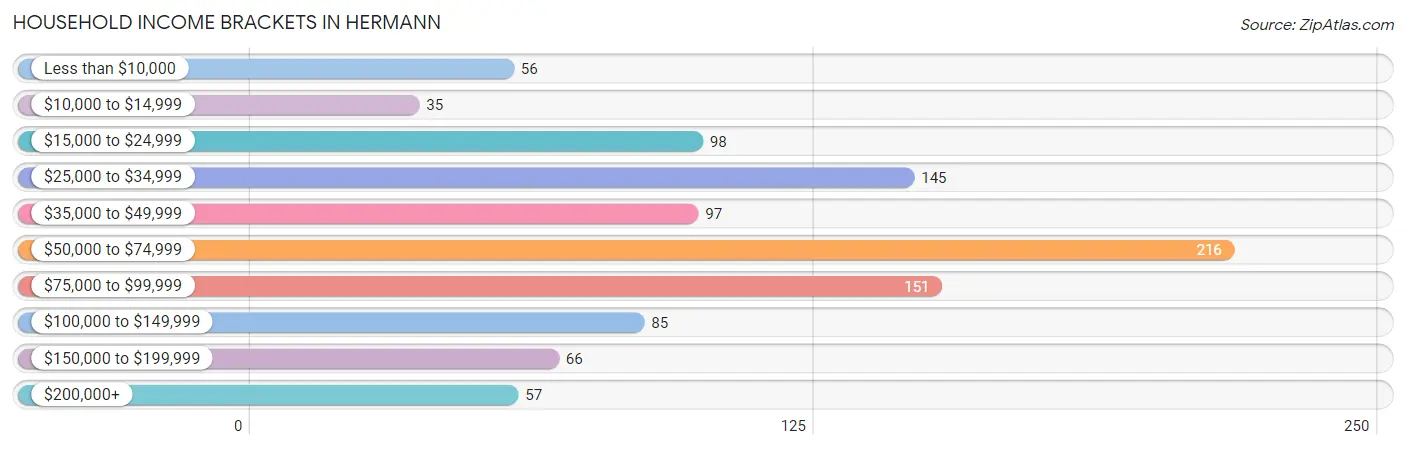
| Income Bracket | # Households | % Households |
| Less than $10,000 | 56 | 5.6% |
| $10,000 to $14,999 | 35 | 3.5% |
| $15,000 to $24,999 | 98 | 9.7% |
| $25,000 to $34,999 | 145 | 14.4% |
| $35,000 to $49,999 | 97 | 9.6% |
| $50,000 to $74,999 | 216 | 21.5% |
| $75,000 to $99,999 | 151 | 15.0% |
| $100,000 to $149,999 | 85 | 8.4% |
| $150,000 to $199,999 | 66 | 6.6% |
| $200,000+ | 57 | 5.7% |
Household Income by Householder Age in Hermann
The median household income in Hermann is $55,833, with the highest median household income of $72,589 found in the 25 to 44 years age bracket for the primary householder. A total of 263 households (26.1%) fall into this category. Meanwhile, the 15 to 24 years age bracket for the primary householder has the lowest median household income of $0, with 17 households (1.7%) in this group.
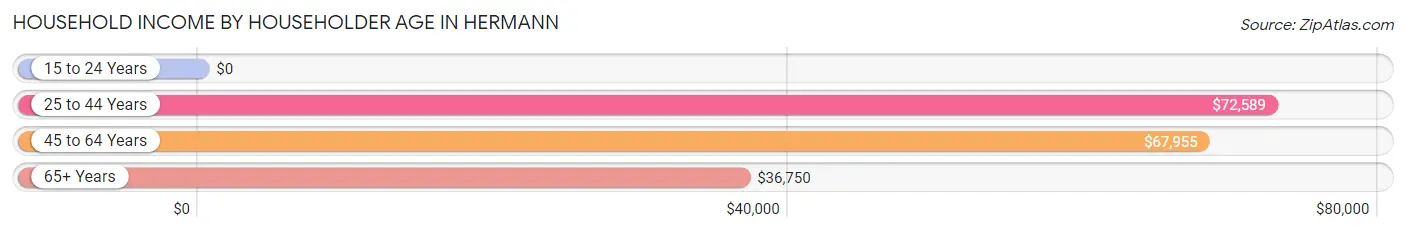
| Income Bracket | # Households | Median Income |
| 15 to 24 Years | 17 (1.7%) | $0 |
| 25 to 44 Years | 263 (26.1%) | $72,589 |
| 45 to 64 Years | 296 (29.4%) | $67,955 |
| 65+ Years | 430 (42.7%) | $36,750 |
| Total | 1,006 (100.0%) | $55,833 |
Poverty in Hermann
Income Below Poverty by Sex and Age in Hermann
With 13.2% poverty level for males and 18.3% for females among the residents of Hermann, 16 and 17 year old males and 6 to 11 year old females are the most vulnerable to poverty, with 17 males (56.7%) and 29 females (48.3%) in their respective age groups living below the poverty level.
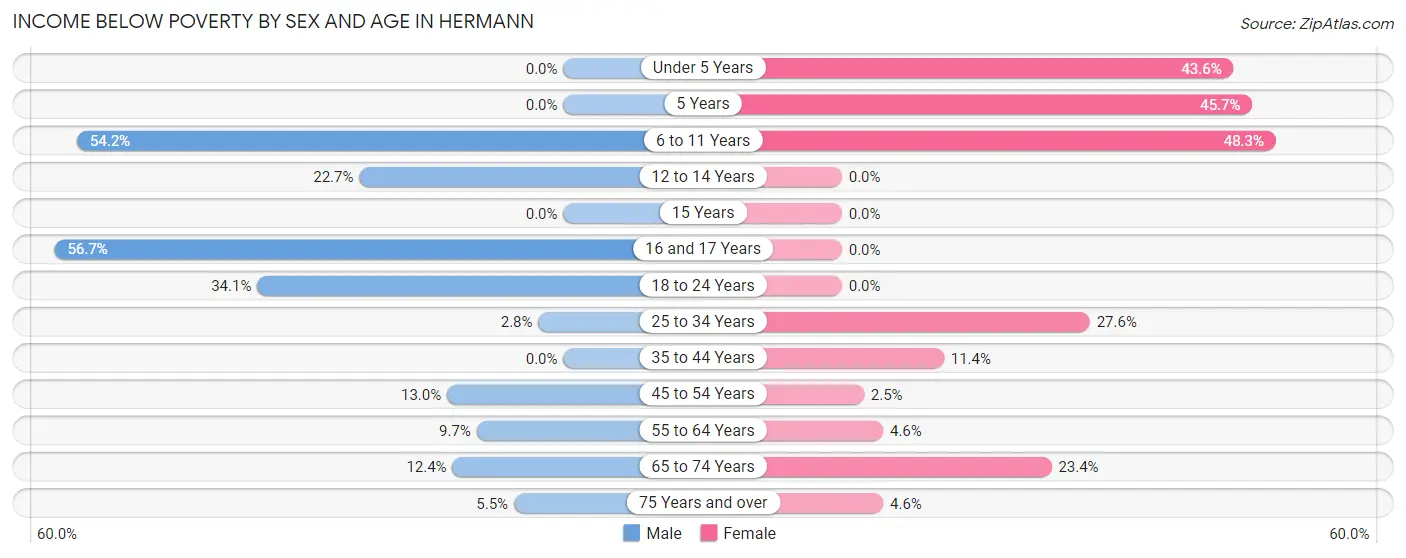
| Age Bracket | Male | Female |
| Under 5 Years | 0 (0.0%) | 41 (43.6%) |
| 5 Years | 0 (0.0%) | 16 (45.7%) |
| 6 to 11 Years | 52 (54.2%) | 29 (48.3%) |
| 12 to 14 Years | 10 (22.7%) | 0 (0.0%) |
| 15 Years | 0 (0.0%) | 0 (0.0%) |
| 16 and 17 Years | 17 (56.7%) | 0 (0.0%) |
| 18 to 24 Years | 15 (34.1%) | 0 (0.0%) |
| 25 to 34 Years | 4 (2.8%) | 45 (27.6%) |
| 35 to 44 Years | 0 (0.0%) | 15 (11.4%) |
| 45 to 54 Years | 18 (13.0%) | 3 (2.5%) |
| 55 to 64 Years | 11 (9.7%) | 5 (4.6%) |
| 65 to 74 Years | 20 (12.3%) | 46 (23.4%) |
| 75 Years and over | 6 (5.5%) | 8 (4.6%) |
| Total | 153 (13.2%) | 208 (18.3%) |
Income Above Poverty by Sex and Age in Hermann
According to the poverty statistics in Hermann, males aged under 5 years and females aged 12 to 14 years are the age groups that are most secure financially, with 100.0% of males and 100.0% of females in these age groups living above the poverty line.
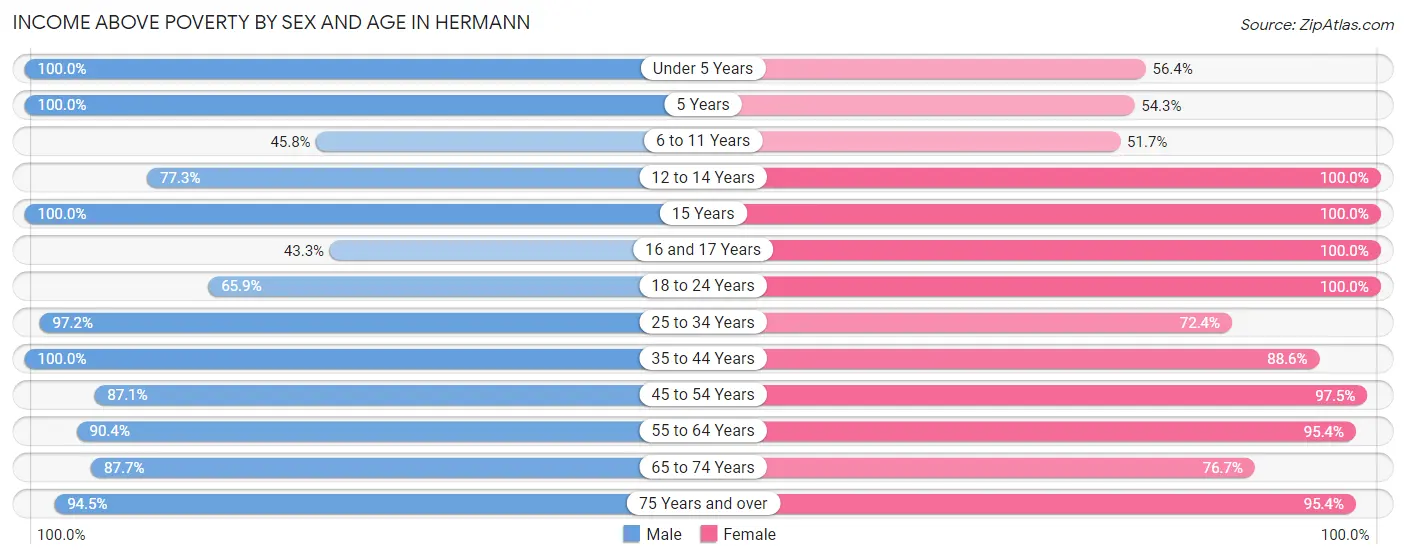
| Age Bracket | Male | Female |
| Under 5 Years | 89 (100.0%) | 53 (56.4%) |
| 5 Years | 17 (100.0%) | 19 (54.3%) |
| 6 to 11 Years | 44 (45.8%) | 31 (51.7%) |
| 12 to 14 Years | 34 (77.3%) | 18 (100.0%) |
| 15 Years | 17 (100.0%) | 6 (100.0%) |
| 16 and 17 Years | 13 (43.3%) | 3 (100.0%) |
| 18 to 24 Years | 29 (65.9%) | 25 (100.0%) |
| 25 to 34 Years | 140 (97.2%) | 118 (72.4%) |
| 35 to 44 Years | 152 (100.0%) | 117 (88.6%) |
| 45 to 54 Years | 121 (87.1%) | 119 (97.5%) |
| 55 to 64 Years | 103 (90.3%) | 104 (95.4%) |
| 65 to 74 Years | 142 (87.6%) | 151 (76.6%) |
| 75 Years and over | 103 (94.5%) | 166 (95.4%) |
| Total | 1,004 (86.8%) | 930 (81.7%) |
Income Below Poverty Among Married-Couple Families in Hermann
The poverty statistics for married-couple families in Hermann show that 9.0% or 45 of the total 497 families live below the poverty line. Families with 3 or 4 children have the highest poverty rate of 36.8%, comprising of 28 families. On the other hand, families with 1 or 2 children have the lowest poverty rate of 0.0%, which includes 0 families.
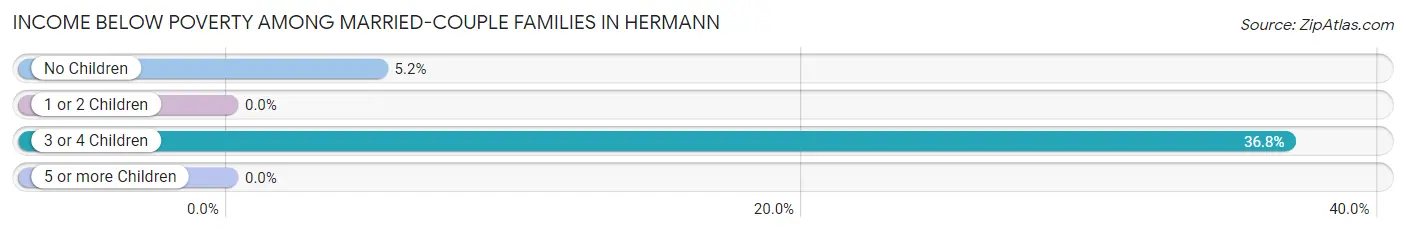
| Children | Above Poverty | Below Poverty |
| No Children | 309 (94.8%) | 17 (5.2%) |
| 1 or 2 Children | 95 (100.0%) | 0 (0.0%) |
| 3 or 4 Children | 48 (63.2%) | 28 (36.8%) |
| 5 or more Children | 0 (0.0%) | 0 (0.0%) |
| Total | 452 (90.9%) | 45 (9.0%) |
Income Below Poverty Among Single-Parent Households in Hermann
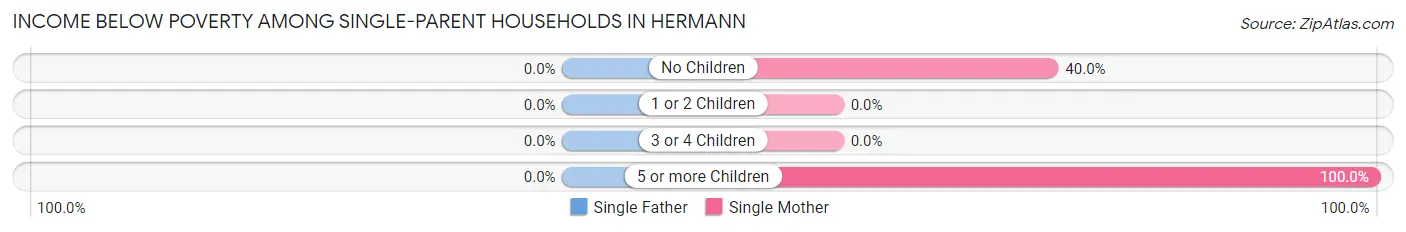
| Children | Single Father | Single Mother |
| No Children | 0 (0.0%) | 2 (40.0%) |
| 1 or 2 Children | 0 (0.0%) | 0 (0.0%) |
| 3 or 4 Children | 0 (0.0%) | 0 (0.0%) |
| 5 or more Children | 0 (0.0%) | 24 (100.0%) |
| Total | 0 (0.0%) | 26 (42.6%) |
Income Below Poverty Among Married-Couple vs Single-Parent Households in Hermann
The poverty data for Hermann shows that 45 of the married-couple family households (9.0%) and 26 of the single-parent households (29.9%) are living below the poverty level. Within the married-couple family households, those with 3 or 4 children have the highest poverty rate, with 28 households (36.8%) falling below the poverty line. Among the single-parent households, those with 5 or more children have the highest poverty rate, with 24 household (100.0%) living below poverty.
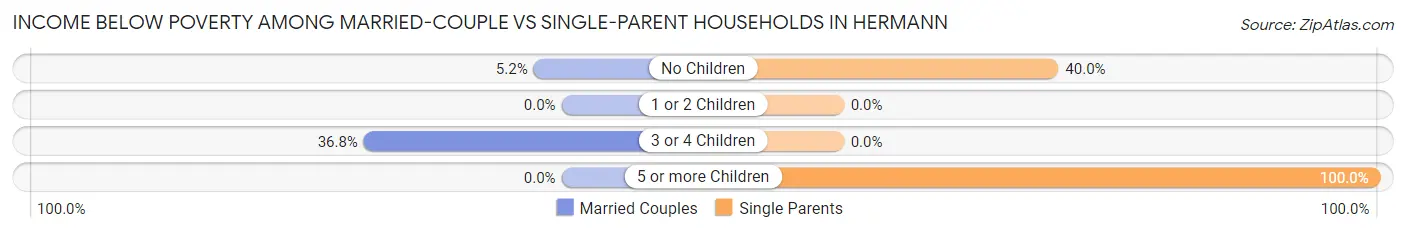
| Children | Married-Couple Families | Single-Parent Households |
| No Children | 17 (5.2%) | 2 (40.0%) |
| 1 or 2 Children | 0 (0.0%) | 0 (0.0%) |
| 3 or 4 Children | 28 (36.8%) | 0 (0.0%) |
| 5 or more Children | 0 (0.0%) | 24 (100.0%) |
| Total | 45 (9.0%) | 26 (29.9%) |
Race in Hermann
The most populous races in Hermann are White / Caucasian (2,182 | 91.9%), Black / African American (110 | 4.6%), and Two or more Races (82 | 3.5%).
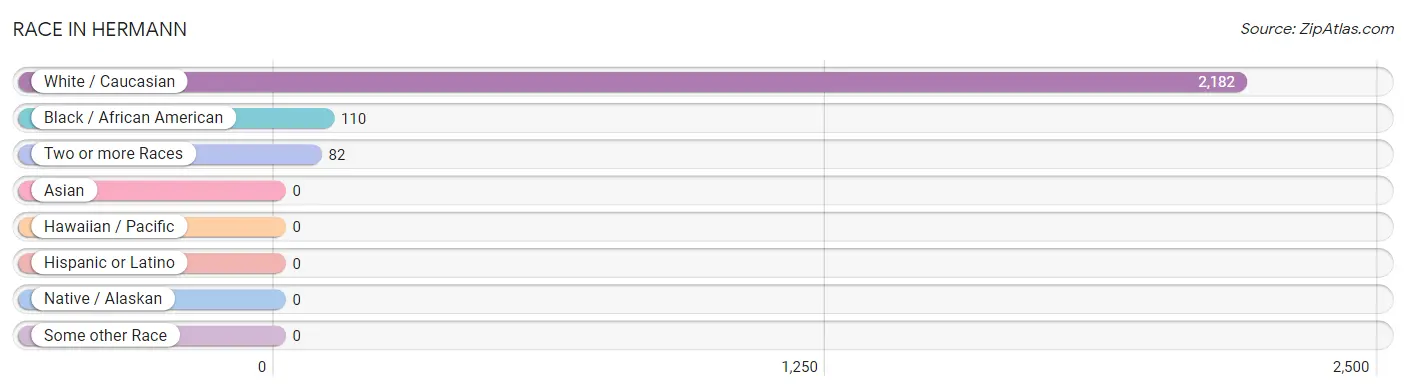
| Race | # Population | % Population |
| Asian | 0 | 0.0% |
| Black / African American | 110 | 4.6% |
| Hawaiian / Pacific | 0 | 0.0% |
| Hispanic or Latino | 0 | 0.0% |
| Native / Alaskan | 0 | 0.0% |
| White / Caucasian | 2,182 | 91.9% |
| Two or more Races | 82 | 3.5% |
| Some other Race | 0 | 0.0% |
| Total | 2,374 | 100.0% |
Ancestry in Hermann
The most populous ancestries reported in Hermann are German (743 | 31.3%), Irish (349 | 14.7%), English (245 | 10.3%), American (219 | 9.2%), and Polish (80 | 3.4%), together accounting for 68.9% of all Hermann residents.
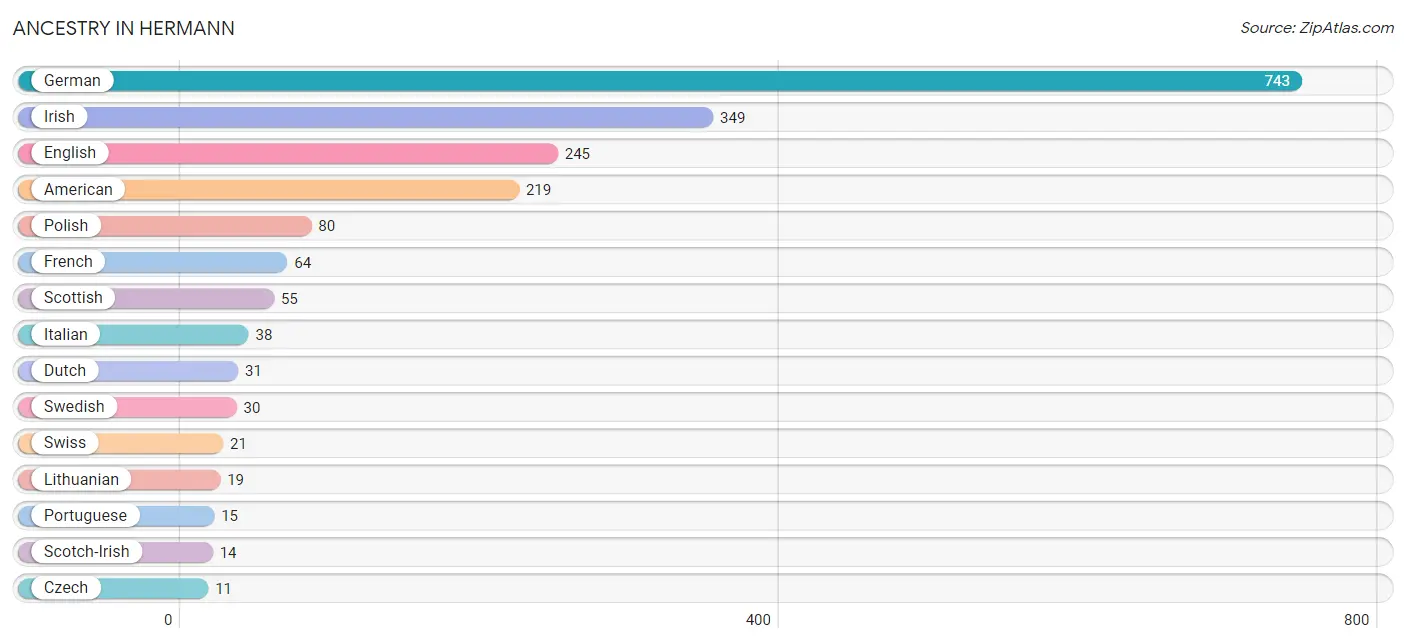
| Ancestry | # Population | % Population |
| American | 219 | 9.2% |
| Austrian | 7 | 0.3% |
| Celtic | 9 | 0.4% |
| Czech | 11 | 0.5% |
| Dutch | 31 | 1.3% |
| English | 245 | 10.3% |
| European | 5 | 0.2% |
| Finnish | 5 | 0.2% |
| French | 64 | 2.7% |
| French Canadian | 5 | 0.2% |
| German | 743 | 31.3% |
| Haitian | 10 | 0.4% |
| Hungarian | 8 | 0.3% |
| Irish | 349 | 14.7% |
| Italian | 38 | 1.6% |
| Lithuanian | 19 | 0.8% |
| Northern European | 6 | 0.3% |
| Polish | 80 | 3.4% |
| Portuguese | 15 | 0.6% |
| Romanian | 5 | 0.2% |
| Russian | 7 | 0.3% |
| Scandinavian | 2 | 0.1% |
| Scotch-Irish | 14 | 0.6% |
| Scottish | 55 | 2.3% |
| Slovene | 11 | 0.5% |
| Swedish | 30 | 1.3% |
| Swiss | 21 | 0.9% |
| Welsh | 6 | 0.3% | View All 28 Rows |
Immigrants in Hermann
The most numerous immigrant groups reported in Hermann came from Europe (11 | 0.5%), Western Europe (11 | 0.5%), Asia (9 | 0.4%), Israel (9 | 0.4%), and Western Asia (9 | 0.4%), together accounting for 2.1% of all Hermann residents.
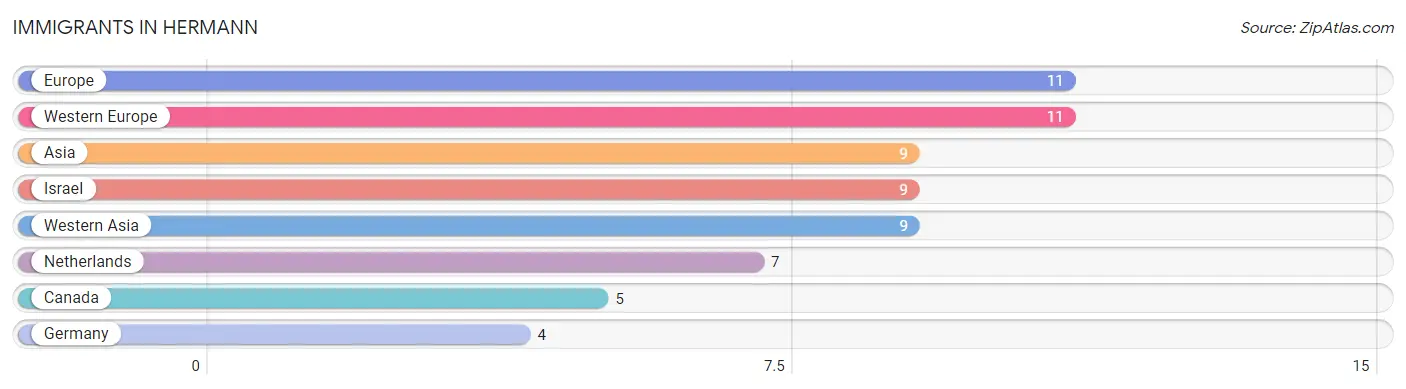
| Immigration Origin | # Population | % Population |
| Asia | 9 | 0.4% |
| Canada | 5 | 0.2% |
| Europe | 11 | 0.5% |
| Germany | 4 | 0.2% |
| Israel | 9 | 0.4% |
| Netherlands | 7 | 0.3% |
| Western Asia | 9 | 0.4% |
| Western Europe | 11 | 0.5% | View All 8 Rows |
Sex and Age in Hermann
Sex and Age in Hermann
The most populous age groups in Hermann are 10 to 14 Years (121 | 10.4%) for men and 70 to 74 Years (124 | 10.3%) for women.
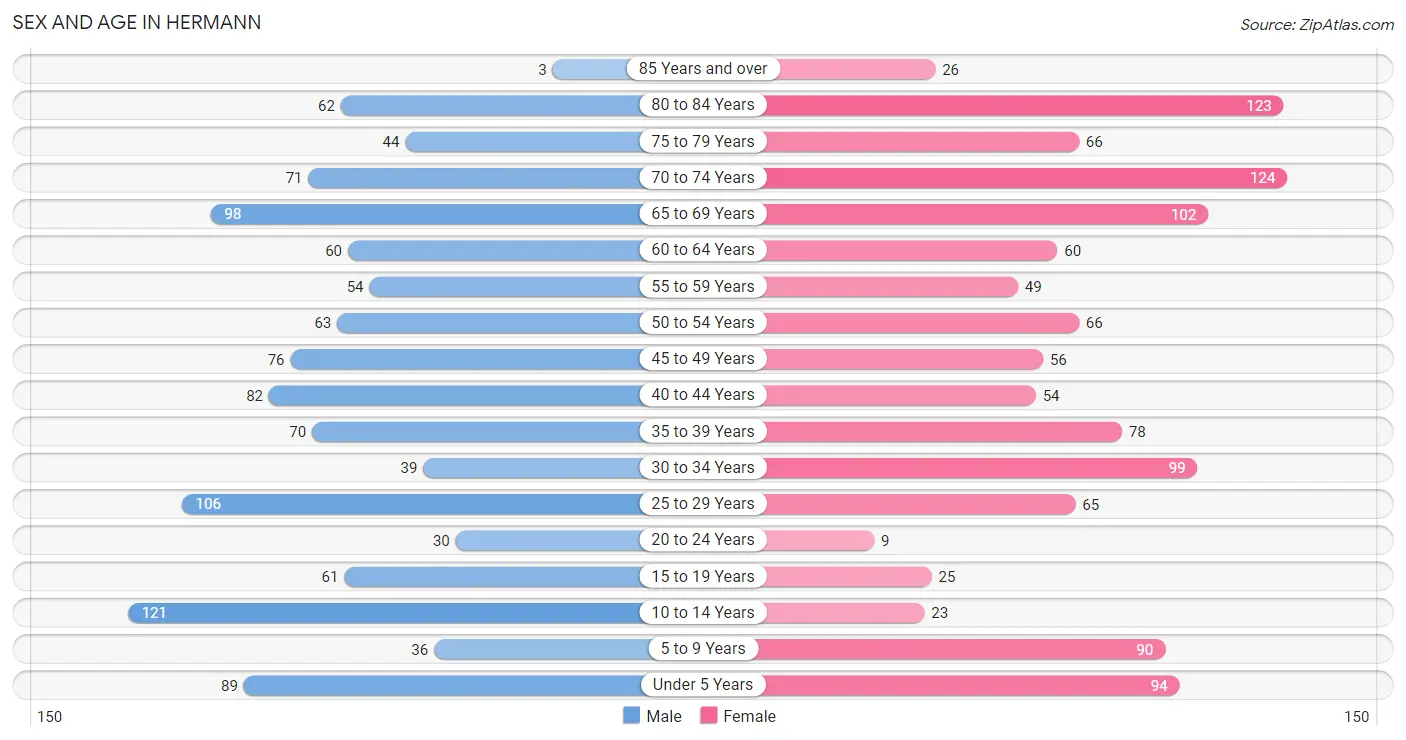
| Age Bracket | Male | Female |
| Under 5 Years | 89 (7.6%) | 94 (7.8%) |
| 5 to 9 Years | 36 (3.1%) | 90 (7.4%) |
| 10 to 14 Years | 121 (10.4%) | 23 (1.9%) |
| 15 to 19 Years | 61 (5.2%) | 25 (2.1%) |
| 20 to 24 Years | 30 (2.6%) | 9 (0.7%) |
| 25 to 29 Years | 106 (9.1%) | 65 (5.4%) |
| 30 to 34 Years | 39 (3.4%) | 99 (8.2%) |
| 35 to 39 Years | 70 (6.0%) | 78 (6.5%) |
| 40 to 44 Years | 82 (7.0%) | 54 (4.5%) |
| 45 to 49 Years | 76 (6.5%) | 56 (4.6%) |
| 50 to 54 Years | 63 (5.4%) | 66 (5.5%) |
| 55 to 59 Years | 54 (4.6%) | 49 (4.1%) |
| 60 to 64 Years | 60 (5.1%) | 60 (5.0%) |
| 65 to 69 Years | 98 (8.4%) | 102 (8.4%) |
| 70 to 74 Years | 71 (6.1%) | 124 (10.3%) |
| 75 to 79 Years | 44 (3.8%) | 66 (5.5%) |
| 80 to 84 Years | 62 (5.3%) | 123 (10.2%) |
| 85 Years and over | 3 (0.3%) | 26 (2.1%) |
| Total | 1,165 (100.0%) | 1,209 (100.0%) |
Families and Households in Hermann
Median Family Size in Hermann
The median family size in Hermann is 3.01 persons per family, with single female/mother families (61 | 10.4%) accounting for the largest median family size of 3.39 persons per family. On the other hand, single male/father families (26 | 4.4%) represent the smallest median family size with 2.42 persons per family.
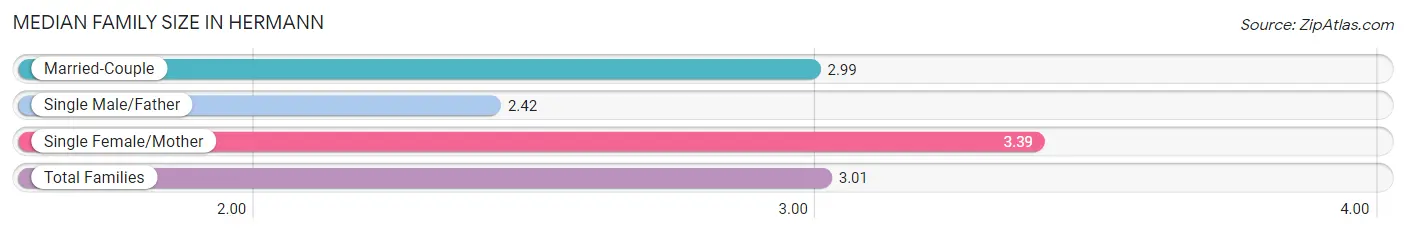
| Family Type | # Families | Family Size |
| Married-Couple | 497 (85.1%) | 2.99 |
| Single Male/Father | 26 (4.4%) | 2.42 |
| Single Female/Mother | 61 (10.4%) | 3.39 |
| Total Families | 584 (100.0%) | 3.01 |
Median Household Size in Hermann
The median household size in Hermann is 2.27 persons per household, with single female/mother households (61 | 6.1%) accounting for the largest median household size of 3.98 persons per household. non-family households (422 | 41.9%) represent the smallest median household size with 1.14 persons per household.
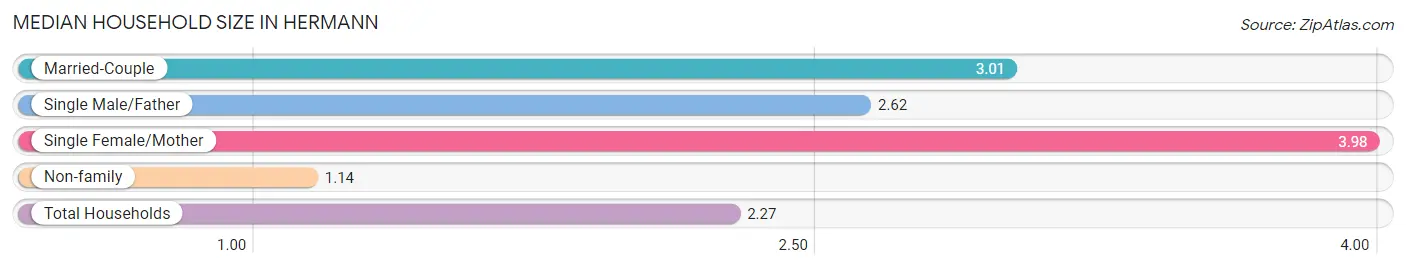
| Household Type | # Households | Household Size |
| Married-Couple | 497 (49.4%) | 3.01 |
| Single Male/Father | 26 (2.6%) | 2.62 |
| Single Female/Mother | 61 (6.1%) | 3.98 |
| Non-family | 422 (41.9%) | 1.14 |
| Total Households | 1,006 (100.0%) | 2.27 |
Household Size by Marriage Status in Hermann
Out of a total of 1,006 households in Hermann, 584 (58.1%) are family households, while 422 (41.9%) are nonfamily households. The most numerous type of family households are 2-person households, comprising 311, and the most common type of nonfamily households are 1-person households, comprising 379.
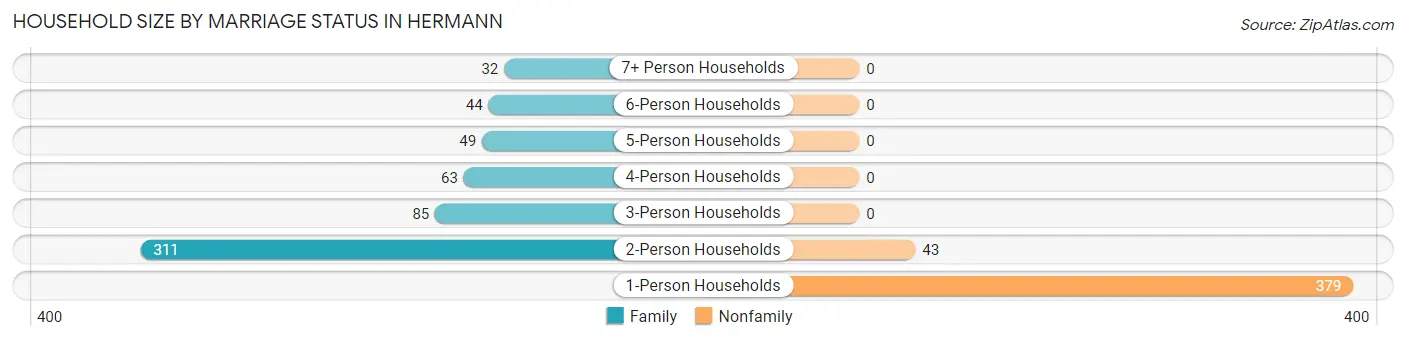
| Household Size | Family Households | Nonfamily Households |
| 1-Person Households | - | 379 (37.7%) |
| 2-Person Households | 311 (30.9%) | 43 (4.3%) |
| 3-Person Households | 85 (8.5%) | 0 (0.0%) |
| 4-Person Households | 63 (6.3%) | 0 (0.0%) |
| 5-Person Households | 49 (4.9%) | 0 (0.0%) |
| 6-Person Households | 44 (4.4%) | 0 (0.0%) |
| 7+ Person Households | 32 (3.2%) | 0 (0.0%) |
| Total | 584 (58.1%) | 422 (41.9%) |
Female Fertility in Hermann
Fertility by Age in Hermann
Average fertility rate in Hermann is 65.0 births per 1,000 women. Women in the age bracket of 20 to 34 years have the highest fertility rate with 150.0 births per 1,000 women. Women in the age bracket of 20 to 34 years acount for 100.0% of all women with births.
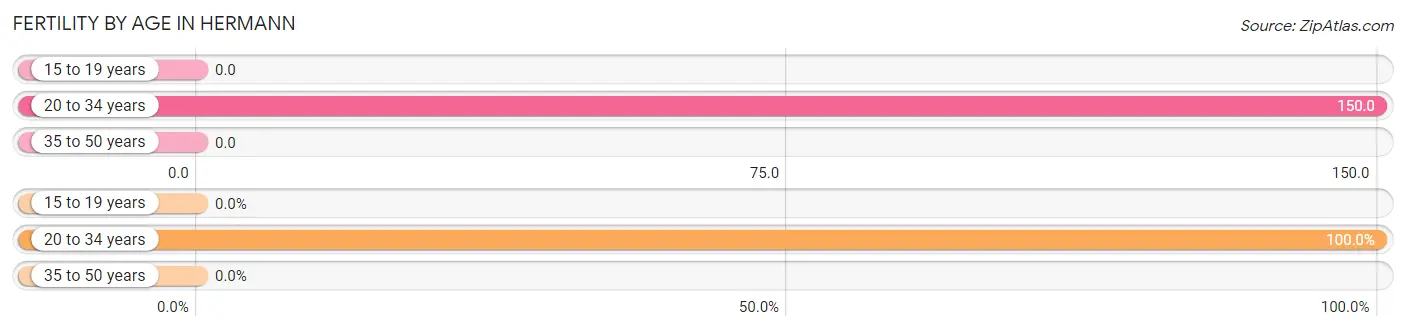
| Age Bracket | Women with Births | Births / 1,000 Women |
| 15 to 19 years | 0 (0.0%) | 0.0 |
| 20 to 34 years | 26 (100.0%) | 150.0 |
| 35 to 50 years | 0 (0.0%) | 0.0 |
| Total | 26 (100.0%) | 65.0 |
Fertility by Age by Marriage Status in Hermann
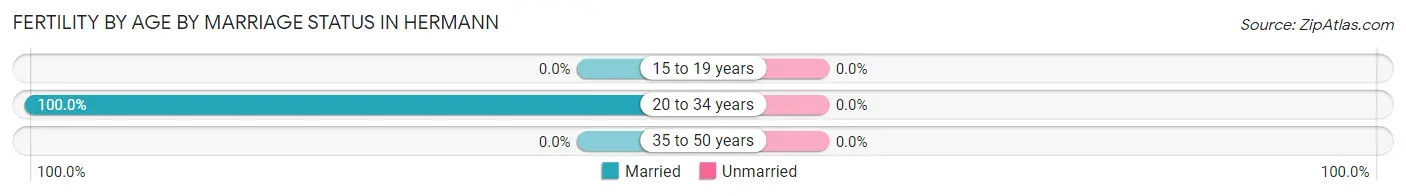
| Age Bracket | Married | Unmarried |
| 15 to 19 years | 0 (0.0%) | 0 (0.0%) |
| 20 to 34 years | 26 (100.0%) | 0 (0.0%) |
| 35 to 50 years | 0 (0.0%) | 0 (0.0%) |
| Total | 26 (100.0%) | 0 (0.0%) |
Fertility by Education in Hermann
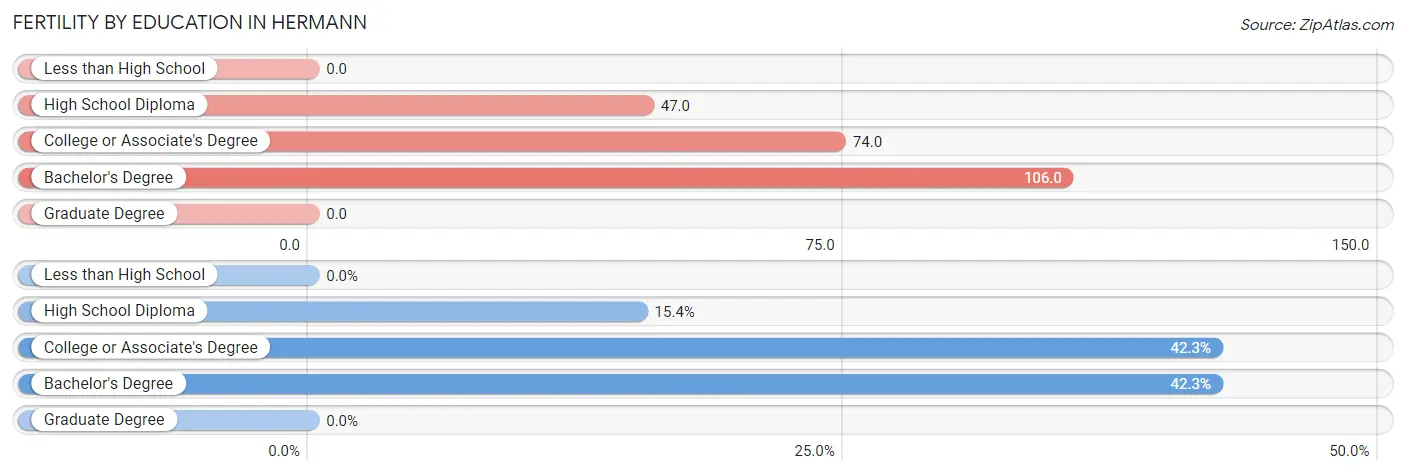
| Educational Attainment | Women with Births | Births / 1,000 Women |
| Less than High School | 0 (0.0%) | 0.0 |
| High School Diploma | 4 (15.4%) | 47.0 |
| College or Associate's Degree | 11 (42.3%) | 74.0 |
| Bachelor's Degree | 11 (42.3%) | 106.0 |
| Graduate Degree | 0 (0.0%) | 0.0 |
| Total | 26 (100.0%) | 65.0 |
Fertility by Education by Marriage Status in Hermann
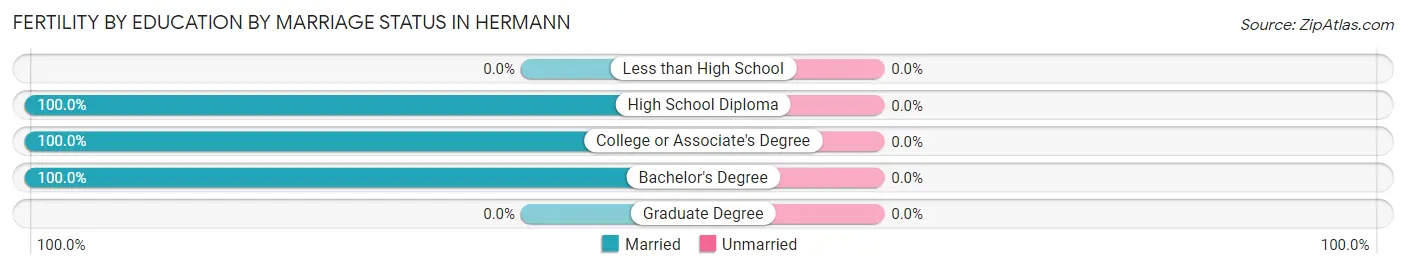
| Educational Attainment | Married | Unmarried |
| Less than High School | 0 (0.0%) | 0 (0.0%) |
| High School Diploma | 4 (100.0%) | 0 (0.0%) |
| College or Associate's Degree | 11 (100.0%) | 0 (0.0%) |
| Bachelor's Degree | 11 (100.0%) | 0 (0.0%) |
| Graduate Degree | 0 (0.0%) | 0 (0.0%) |
| Total | 26 (100.0%) | 0 (0.0%) |
Employment Characteristics in Hermann
Employment by Class of Employer in Hermann
Among the 1,074 employed individuals in Hermann, private company employees (637 | 59.3%), not-for-profit organizations (96 | 8.9%), and local government employees (87 | 8.1%) make up the most common classes of employment.
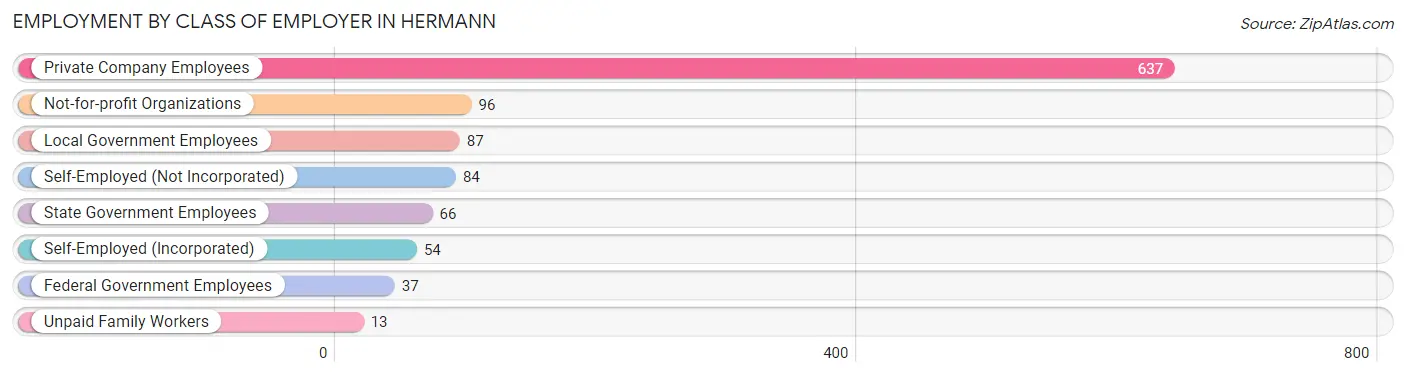
| Employer Class | # Employees | % Employees |
| Private Company Employees | 637 | 59.3% |
| Self-Employed (Incorporated) | 54 | 5.0% |
| Self-Employed (Not Incorporated) | 84 | 7.8% |
| Not-for-profit Organizations | 96 | 8.9% |
| Local Government Employees | 87 | 8.1% |
| State Government Employees | 66 | 6.1% |
| Federal Government Employees | 37 | 3.5% |
| Unpaid Family Workers | 13 | 1.2% |
| Total | 1,074 | 100.0% |
Employment Status by Age in Hermann
According to the labor force statistics for Hermann, out of the total population over 16 years of age (1,898), 59.2% or 1,124 individuals are in the labor force, with 3.6% or 40 of them unemployed. The age group with the highest labor force participation rate is 25 to 29 years, with 96.5% or 165 individuals in the labor force. Within the labor force, the 16 to 19 years age range has the highest percentage of unemployed individuals, with 12.5% or 3 of them being unemployed.
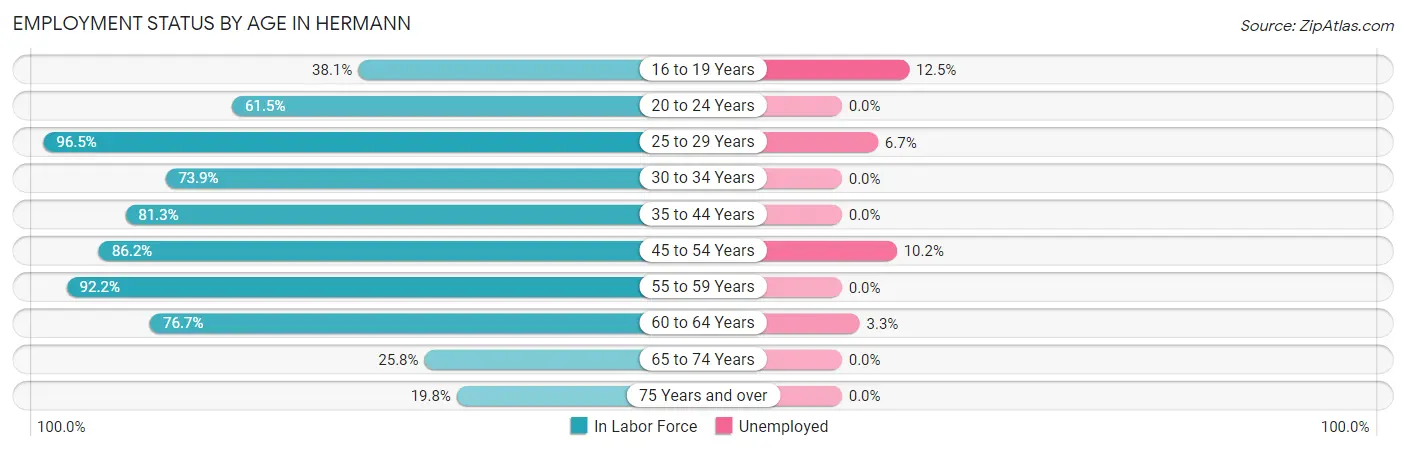
| Age Bracket | In Labor Force | Unemployed |
| 16 to 19 Years | 24 (38.1%) | 3 (12.5%) |
| 20 to 24 Years | 24 (61.5%) | 0 (0.0%) |
| 25 to 29 Years | 165 (96.5%) | 11 (6.7%) |
| 30 to 34 Years | 102 (73.9%) | 0 (0.0%) |
| 35 to 44 Years | 231 (81.3%) | 0 (0.0%) |
| 45 to 54 Years | 225 (86.2%) | 23 (10.2%) |
| 55 to 59 Years | 95 (92.2%) | 0 (0.0%) |
| 60 to 64 Years | 92 (76.7%) | 3 (3.3%) |
| 65 to 74 Years | 102 (25.8%) | 0 (0.0%) |
| 75 Years and over | 64 (19.8%) | 0 (0.0%) |
| Total | 1,124 (59.2%) | 40 (3.6%) |
Employment Status by Educational Attainment in Hermann
According to labor force statistics for Hermann, 84.5% of individuals (910) out of the total population between 25 and 64 years of age (1,077) are in the labor force, with 4.1% or 37 of them being unemployed. The group with the highest labor force participation rate are those with the educational attainment of bachelor's degree or higher, with 90.9% or 290 individuals in the labor force. Within the labor force, individuals with bachelor's degree or higher education have the highest percentage of unemployment, with 6.9% or 20 of them being unemployed.
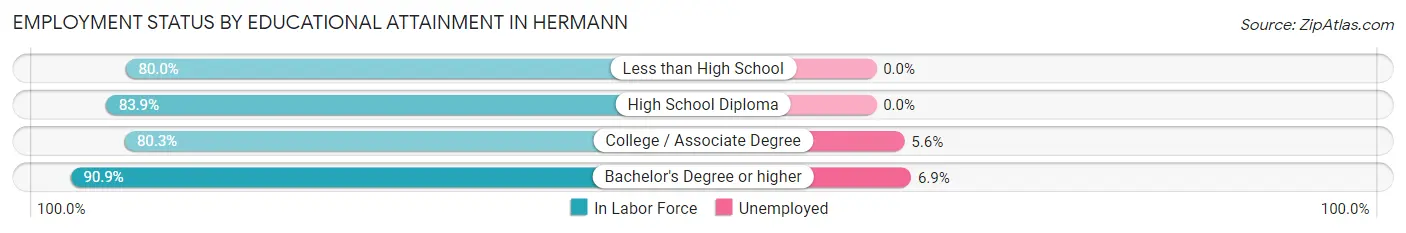
| Educational Attainment | In Labor Force | Unemployed |
| Less than High School | 48 (80.0%) | 0 (0.0%) |
| High School Diploma | 266 (83.9%) | 0 (0.0%) |
| College / Associate Degree | 306 (80.3%) | 21 (5.6%) |
| Bachelor's Degree or higher | 290 (90.9%) | 22 (6.9%) |
| Total | 910 (84.5%) | 44 (4.1%) |
Employment Occupations by Sex in Hermann
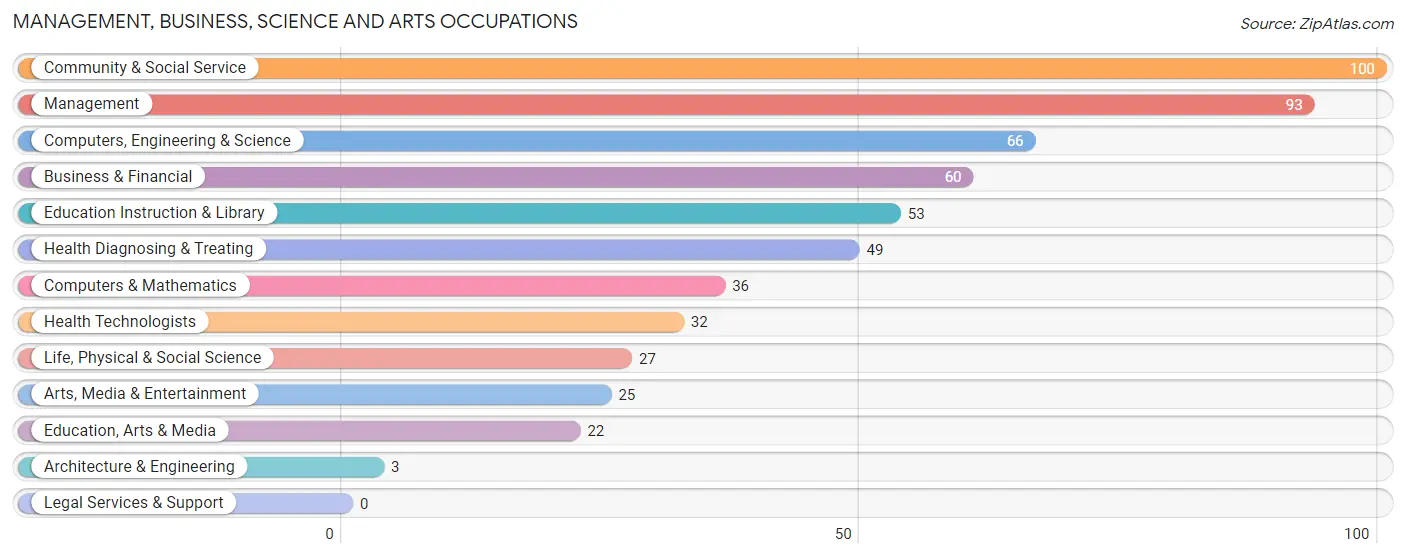
Management, Business, Science and Arts Occupations
The most common Management, Business, Science and Arts occupations in Hermann are Community & Social Service (100 | 9.2%), Management (93 | 8.6%), Computers, Engineering & Science (66 | 6.1%), Business & Financial (60 | 5.5%), and Education Instruction & Library (53 | 4.9%).
Management, Business, Science and Arts Occupations by Sex
Within the Management, Business, Science and Arts occupations in Hermann, the most male-oriented occupations are Architecture & Engineering (100.0%), Life, Physical & Social Science (100.0%), and Computers, Engineering & Science (78.8%), while the most female-oriented occupations are Arts, Media & Entertainment (100.0%), Health Diagnosing & Treating (85.7%), and Health Technologists (78.1%).
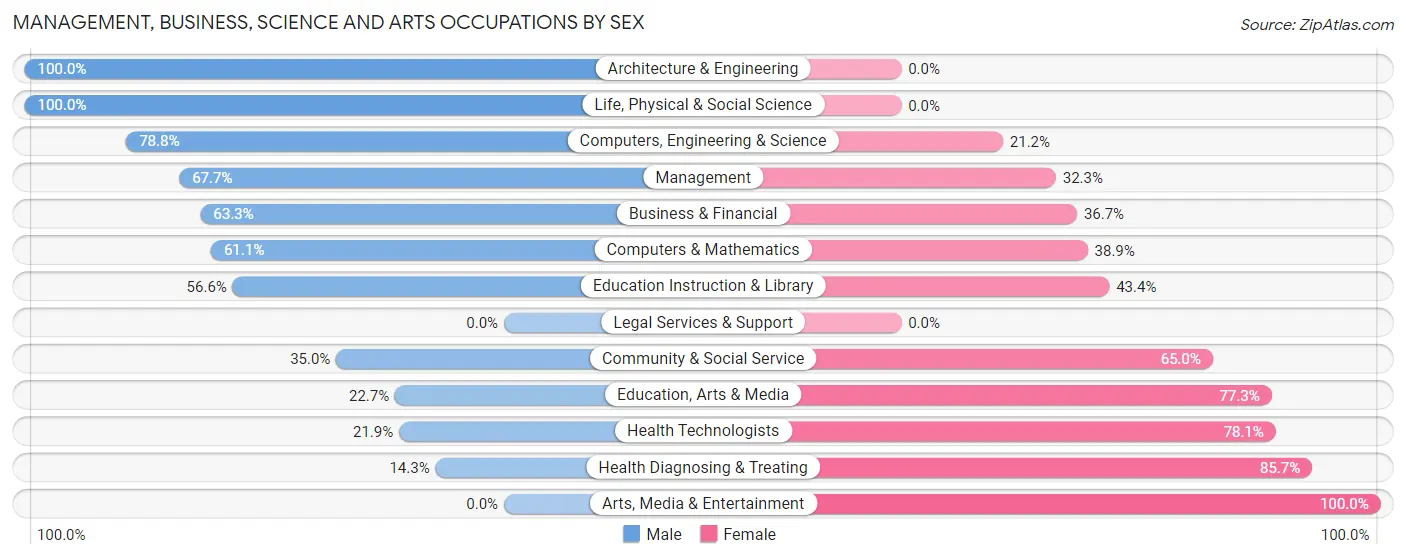
| Occupation | Male | Female |
| Management | 63 (67.7%) | 30 (32.3%) |
| Business & Financial | 38 (63.3%) | 22 (36.7%) |
| Computers, Engineering & Science | 52 (78.8%) | 14 (21.2%) |
| Computers & Mathematics | 22 (61.1%) | 14 (38.9%) |
| Architecture & Engineering | 3 (100.0%) | 0 (0.0%) |
| Life, Physical & Social Science | 27 (100.0%) | 0 (0.0%) |
| Community & Social Service | 35 (35.0%) | 65 (65.0%) |
| Education, Arts & Media | 5 (22.7%) | 17 (77.3%) |
| Legal Services & Support | 0 (0.0%) | 0 (0.0%) |
| Education Instruction & Library | 30 (56.6%) | 23 (43.4%) |
| Arts, Media & Entertainment | 0 (0.0%) | 25 (100.0%) |
| Health Diagnosing & Treating | 7 (14.3%) | 42 (85.7%) |
| Health Technologists | 7 (21.9%) | 25 (78.1%) |
| Total (Category) | 195 (53.0%) | 173 (47.0%) |
| Total (Overall) | 611 (56.4%) | 473 (43.6%) |
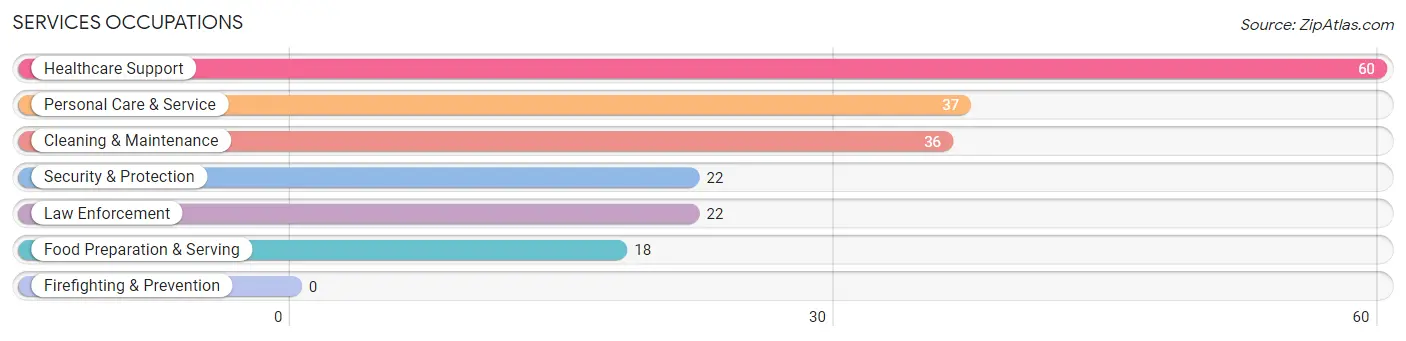
Services Occupations
The most common Services occupations in Hermann are Healthcare Support (60 | 5.5%), Personal Care & Service (37 | 3.4%), Cleaning & Maintenance (36 | 3.3%), Security & Protection (22 | 2.0%), and Law Enforcement (22 | 2.0%).
Services Occupations by Sex
Within the Services occupations in Hermann, the most male-oriented occupations are Security & Protection (100.0%), Law Enforcement (100.0%), and Cleaning & Maintenance (88.9%), while the most female-oriented occupations are Healthcare Support (100.0%), Personal Care & Service (100.0%), and Food Preparation & Serving (50.0%).
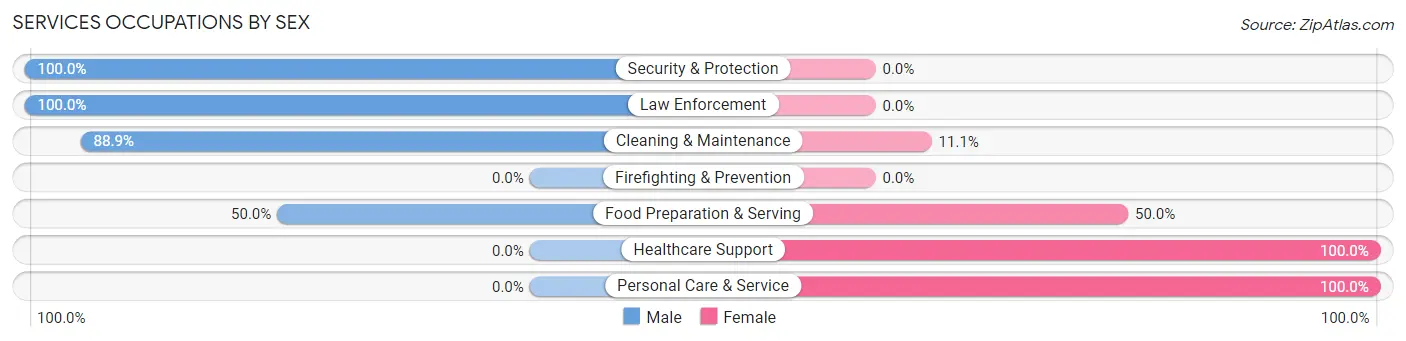
| Occupation | Male | Female |
| Healthcare Support | 0 (0.0%) | 60 (100.0%) |
| Security & Protection | 22 (100.0%) | 0 (0.0%) |
| Firefighting & Prevention | 0 (0.0%) | 0 (0.0%) |
| Law Enforcement | 22 (100.0%) | 0 (0.0%) |
| Food Preparation & Serving | 9 (50.0%) | 9 (50.0%) |
| Cleaning & Maintenance | 32 (88.9%) | 4 (11.1%) |
| Personal Care & Service | 0 (0.0%) | 37 (100.0%) |
| Total (Category) | 63 (36.4%) | 110 (63.6%) |
| Total (Overall) | 611 (56.4%) | 473 (43.6%) |
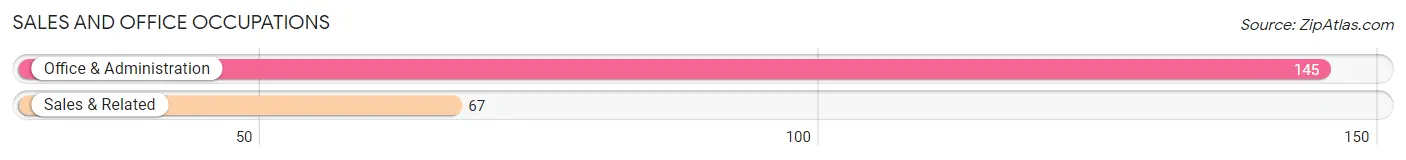
Sales and Office Occupations
The most common Sales and Office occupations in Hermann are Office & Administration (145 | 13.4%), and Sales & Related (67 | 6.2%).
Sales and Office Occupations by Sex
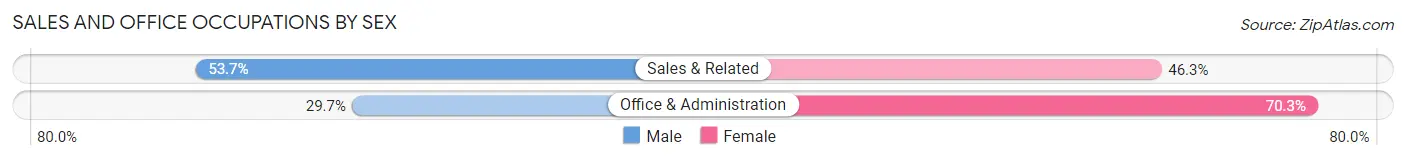
| Occupation | Male | Female |
| Sales & Related | 36 (53.7%) | 31 (46.3%) |
| Office & Administration | 43 (29.7%) | 102 (70.3%) |
| Total (Category) | 79 (37.3%) | 133 (62.7%) |
| Total (Overall) | 611 (56.4%) | 473 (43.6%) |
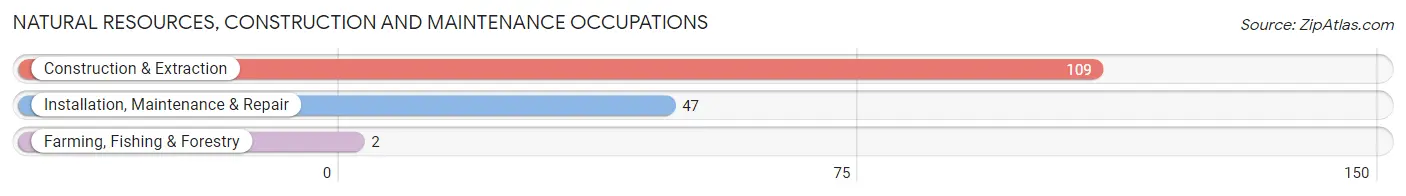
Natural Resources, Construction and Maintenance Occupations
The most common Natural Resources, Construction and Maintenance occupations in Hermann are Construction & Extraction (109 | 10.1%), Installation, Maintenance & Repair (47 | 4.3%), and Farming, Fishing & Forestry (2 | 0.2%).
Natural Resources, Construction and Maintenance Occupations by Sex
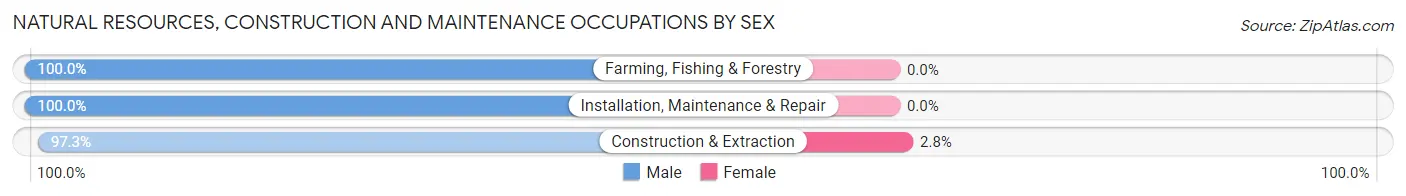
| Occupation | Male | Female |
| Farming, Fishing & Forestry | 2 (100.0%) | 0 (0.0%) |
| Construction & Extraction | 106 (97.3%) | 3 (2.8%) |
| Installation, Maintenance & Repair | 47 (100.0%) | 0 (0.0%) |
| Total (Category) | 155 (98.1%) | 3 (1.9%) |
| Total (Overall) | 611 (56.4%) | 473 (43.6%) |
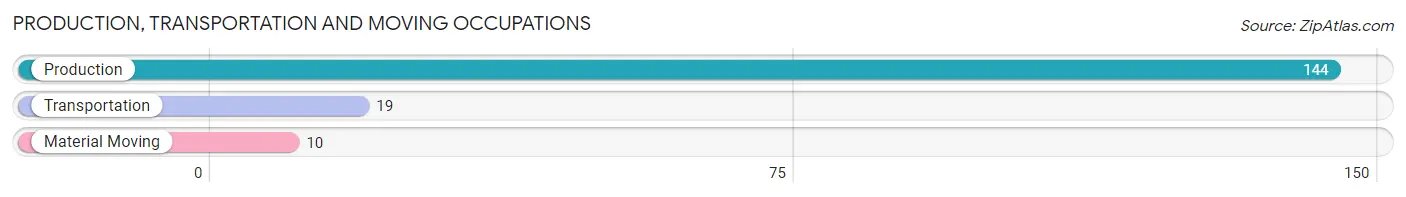
Production, Transportation and Moving Occupations
The most common Production, Transportation and Moving occupations in Hermann are Production (144 | 13.3%), Transportation (19 | 1.8%), and Material Moving (10 | 0.9%).
Production, Transportation and Moving Occupations by Sex
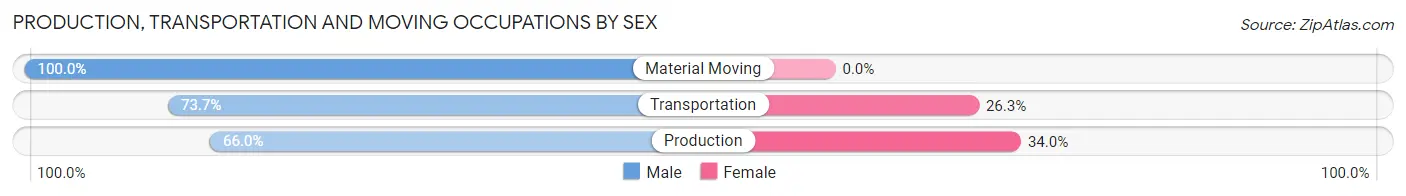
| Occupation | Male | Female |
| Production | 95 (66.0%) | 49 (34.0%) |
| Transportation | 14 (73.7%) | 5 (26.3%) |
| Material Moving | 10 (100.0%) | 0 (0.0%) |
| Total (Category) | 119 (68.8%) | 54 (31.2%) |
| Total (Overall) | 611 (56.4%) | 473 (43.6%) |
Employment Industries by Sex in Hermann
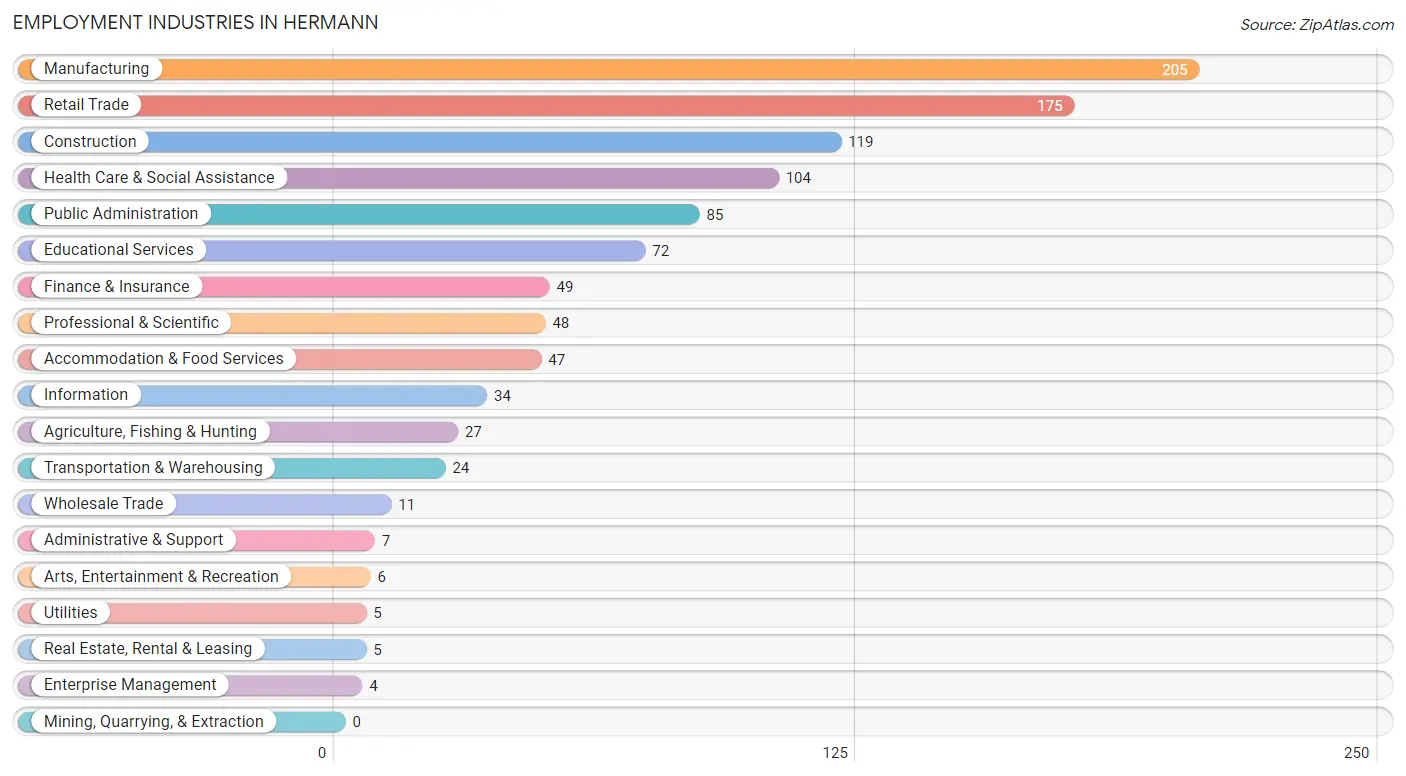
Employment Industries in Hermann
The major employment industries in Hermann include Manufacturing (205 | 18.9%), Retail Trade (175 | 16.1%), Construction (119 | 11.0%), Health Care & Social Assistance (104 | 9.6%), and Public Administration (85 | 7.8%).
Employment Industries by Sex in Hermann
The Hermann industries that see more men than women are Agriculture, Fishing & Hunting (100.0%), Wholesale Trade (100.0%), and Real Estate, Rental & Leasing (100.0%), whereas the industries that tend to have a higher number of women are Utilities (100.0%), Arts, Entertainment & Recreation (100.0%), and Health Care & Social Assistance (87.5%).
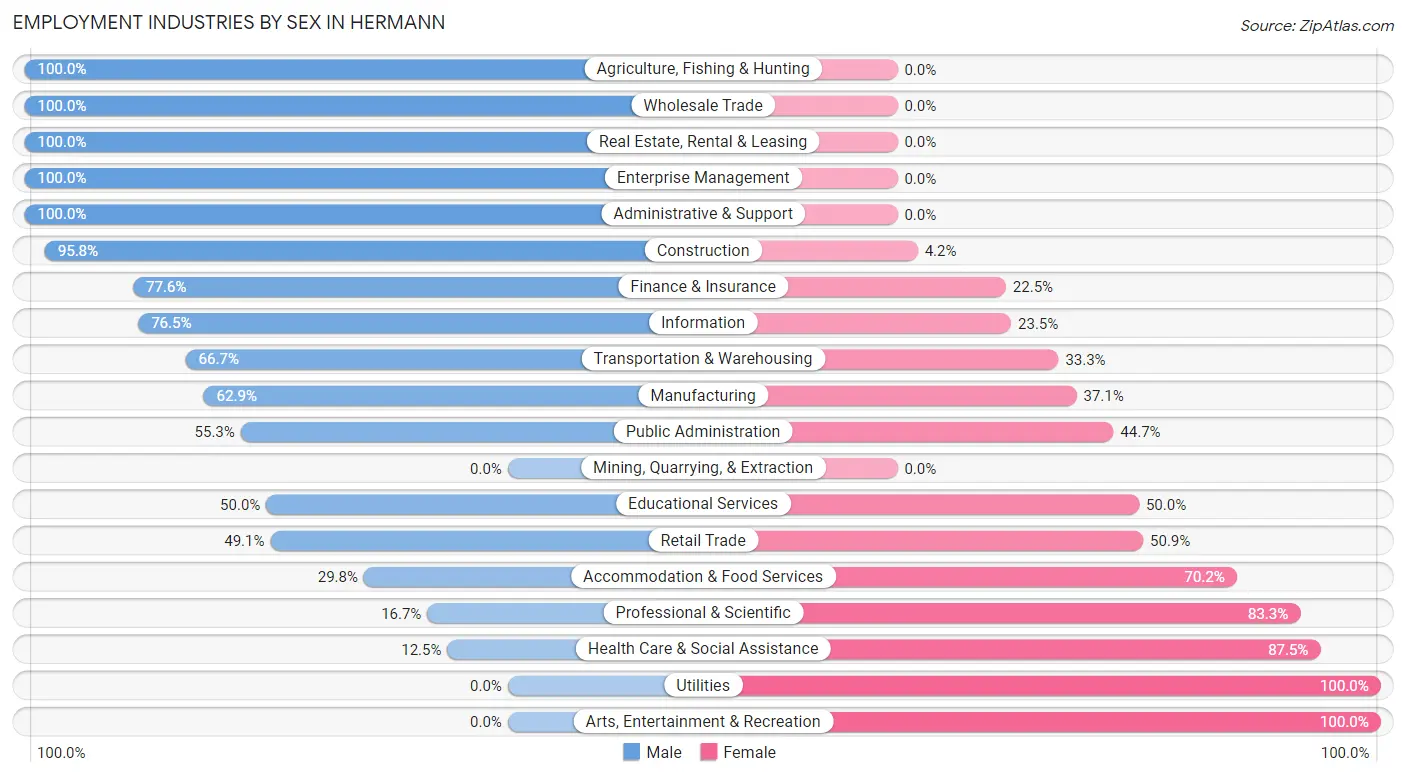
| Industry | Male | Female |
| Agriculture, Fishing & Hunting | 27 (100.0%) | 0 (0.0%) |
| Mining, Quarrying, & Extraction | 0 (0.0%) | 0 (0.0%) |
| Construction | 114 (95.8%) | 5 (4.2%) |
| Manufacturing | 129 (62.9%) | 76 (37.1%) |
| Wholesale Trade | 11 (100.0%) | 0 (0.0%) |
| Retail Trade | 86 (49.1%) | 89 (50.9%) |
| Transportation & Warehousing | 16 (66.7%) | 8 (33.3%) |
| Utilities | 0 (0.0%) | 5 (100.0%) |
| Information | 26 (76.5%) | 8 (23.5%) |
| Finance & Insurance | 38 (77.5%) | 11 (22.5%) |
| Real Estate, Rental & Leasing | 5 (100.0%) | 0 (0.0%) |
| Professional & Scientific | 8 (16.7%) | 40 (83.3%) |
| Enterprise Management | 4 (100.0%) | 0 (0.0%) |
| Administrative & Support | 7 (100.0%) | 0 (0.0%) |
| Educational Services | 36 (50.0%) | 36 (50.0%) |
| Health Care & Social Assistance | 13 (12.5%) | 91 (87.5%) |
| Arts, Entertainment & Recreation | 0 (0.0%) | 6 (100.0%) |
| Accommodation & Food Services | 14 (29.8%) | 33 (70.2%) |
| Public Administration | 47 (55.3%) | 38 (44.7%) |
| Total | 611 (56.4%) | 473 (43.6%) |
Education in Hermann
School Enrollment in Hermann
The most common levels of schooling among the 409 students in Hermann are middle school (127 | 31.0%), elementary school (73 | 17.8%), and high school (73 | 17.8%).
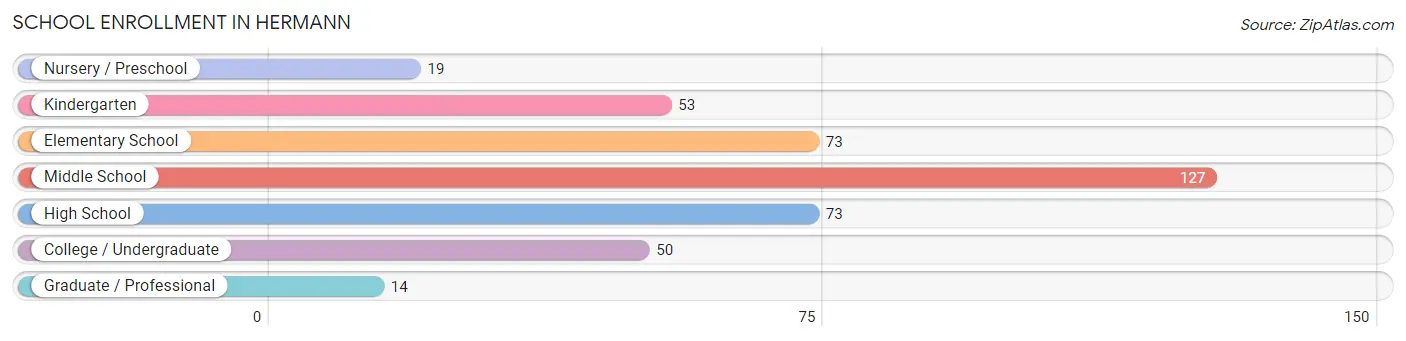
| School Level | # Students | % Students |
| Nursery / Preschool | 19 | 4.6% |
| Kindergarten | 53 | 13.0% |
| Elementary School | 73 | 17.8% |
| Middle School | 127 | 31.0% |
| High School | 73 | 17.8% |
| College / Undergraduate | 50 | 12.2% |
| Graduate / Professional | 14 | 3.4% |
| Total | 409 | 100.0% |
School Enrollment by Age by Funding Source in Hermann
Out of a total of 409 students who are enrolled in schools in Hermann, 107 (26.2%) attend a private institution, while the remaining 302 (73.8%) are enrolled in public schools. The age group of 3 to 4 year olds has the highest likelihood of being enrolled in private schools, with 10 (100.0% in the age bracket) enrolled. Conversely, the age group of 18 to 19 year olds has the lowest likelihood of being enrolled in a private school, with 30 (100.0% in the age bracket) attending a public institution.
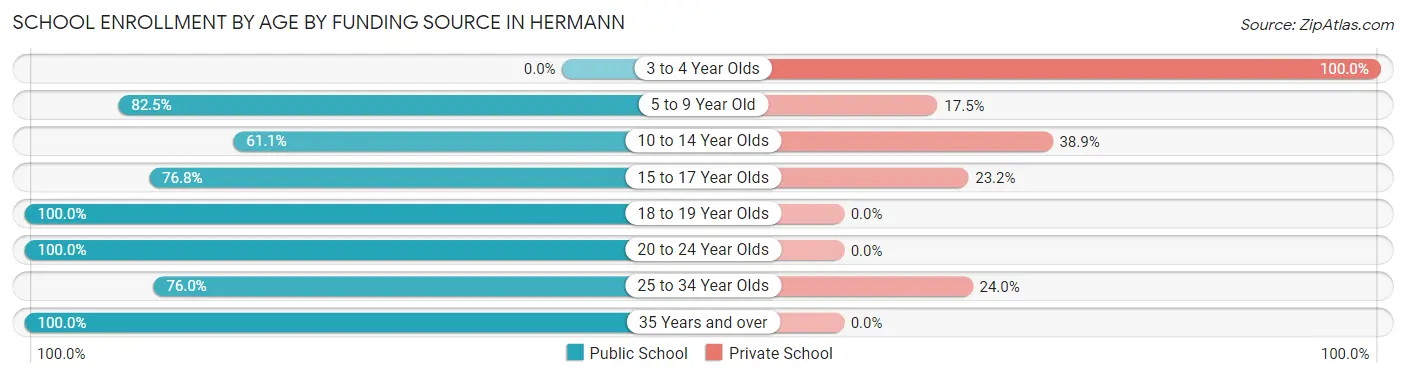
| Age Bracket | Public School | Private School |
| 3 to 4 Year Olds | 0 (0.0%) | 10 (100.0%) |
| 5 to 9 Year Old | 104 (82.5%) | 22 (17.5%) |
| 10 to 14 Year Olds | 88 (61.1%) | 56 (38.9%) |
| 15 to 17 Year Olds | 43 (76.8%) | 13 (23.2%) |
| 18 to 19 Year Olds | 30 (100.0%) | 0 (0.0%) |
| 20 to 24 Year Olds | 8 (100.0%) | 0 (0.0%) |
| 25 to 34 Year Olds | 19 (76.0%) | 6 (24.0%) |
| 35 Years and over | 10 (100.0%) | 0 (0.0%) |
| Total | 302 (73.8%) | 107 (26.2%) |
Educational Attainment by Field of Study in Hermann
Literature & languages (147 | 19.2%), business (114 | 14.9%), bio, nature & agricultural (97 | 12.7%), social sciences (91 | 11.9%), and liberal arts & history (89 | 11.6%) are the most common fields of study among 765 individuals in Hermann who have obtained a bachelor's degree or higher.
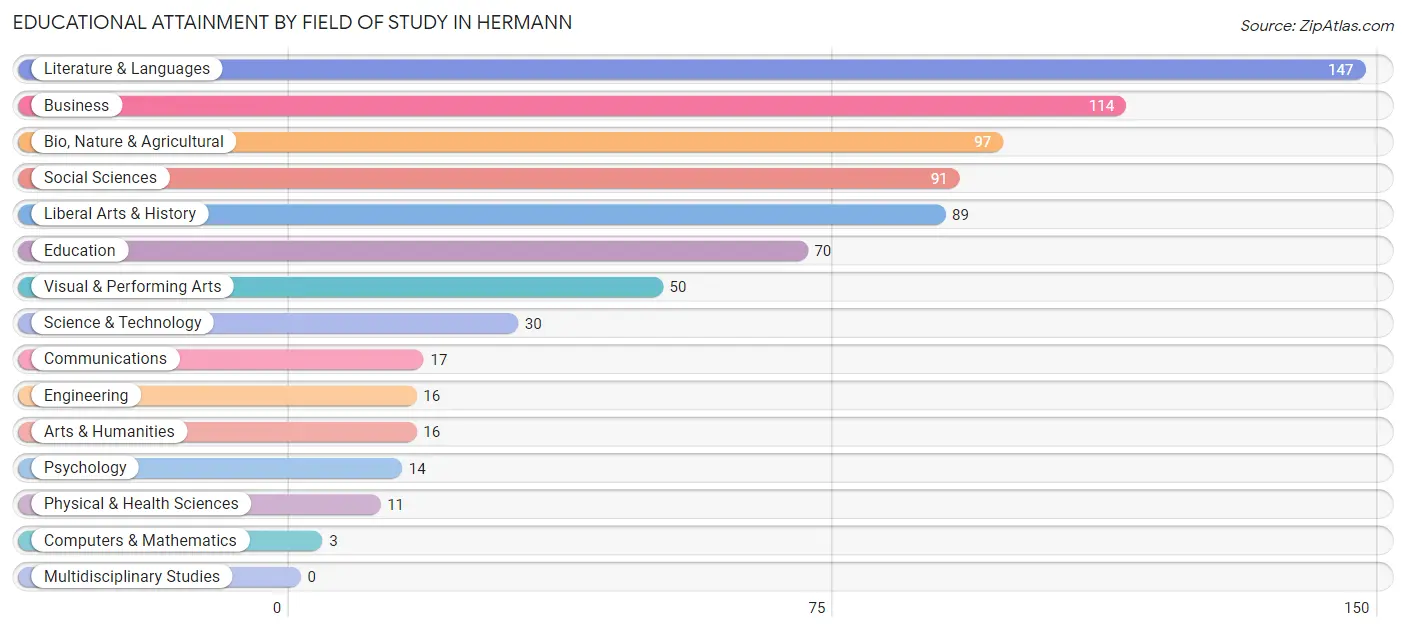
| Field of Study | # Graduates | % Graduates |
| Computers & Mathematics | 3 | 0.4% |
| Bio, Nature & Agricultural | 97 | 12.7% |
| Physical & Health Sciences | 11 | 1.4% |
| Psychology | 14 | 1.8% |
| Social Sciences | 91 | 11.9% |
| Engineering | 16 | 2.1% |
| Multidisciplinary Studies | 0 | 0.0% |
| Science & Technology | 30 | 3.9% |
| Business | 114 | 14.9% |
| Education | 70 | 9.1% |
| Literature & Languages | 147 | 19.2% |
| Liberal Arts & History | 89 | 11.6% |
| Visual & Performing Arts | 50 | 6.5% |
| Communications | 17 | 2.2% |
| Arts & Humanities | 16 | 2.1% |
| Total | 765 | 100.0% |
Transportation & Commute in Hermann
Vehicle Availability by Sex in Hermann
The most prevalent vehicle ownership categories in Hermann are males with 2 vehicles (243, accounting for 40.2%) and females with 2 vehicles (178, making up 51.8%).
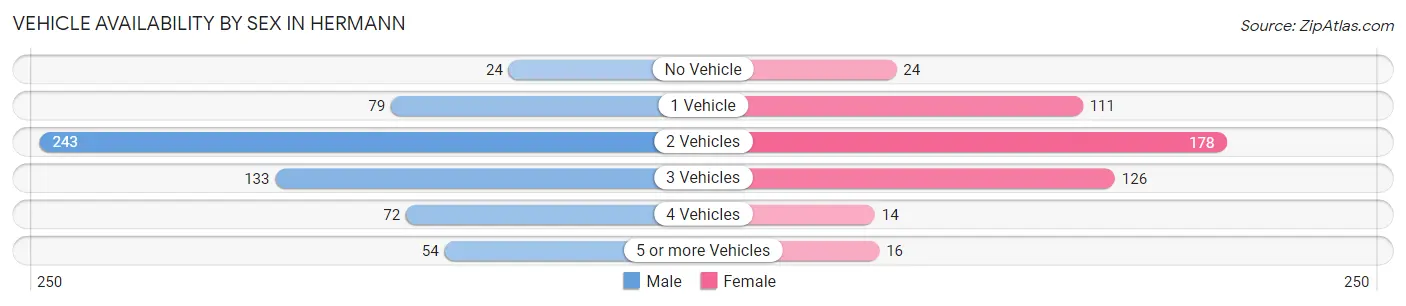
| Vehicles Available | Male | Female |
| No Vehicle | 24 (4.0%) | 24 (5.1%) |
| 1 Vehicle | 79 (13.1%) | 111 (23.7%) |
| 2 Vehicles | 243 (40.2%) | 178 (38.0%) |
| 3 Vehicles | 133 (22.0%) | 126 (26.9%) |
| 4 Vehicles | 72 (11.9%) | 14 (3.0%) |
| 5 or more Vehicles | 54 (8.9%) | 16 (3.4%) |
| Total | 605 (100.0%) | 469 (100.0%) |
Commute Time in Hermann
The most frequently occuring commute durations in Hermann are 5 to 9 minutes (410 commuters, 43.2%), 60 to 89 minutes (107 commuters, 11.3%), and 10 to 14 minutes (85 commuters, 8.9%).
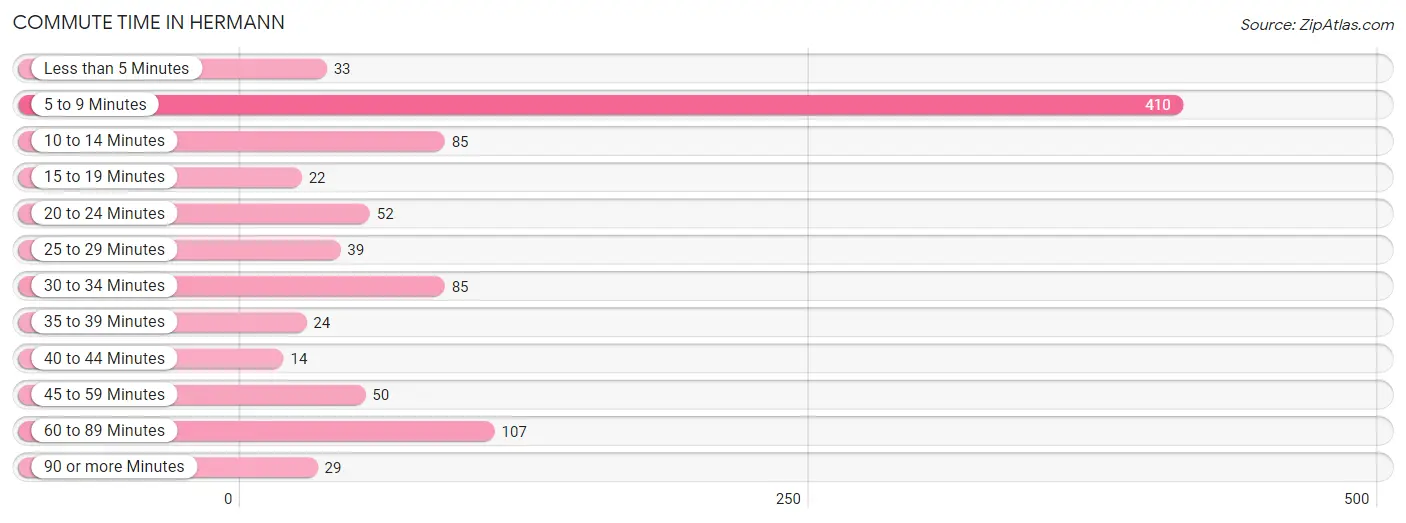
| Commute Time | # Commuters | % Commuters |
| Less than 5 Minutes | 33 | 3.5% |
| 5 to 9 Minutes | 410 | 43.2% |
| 10 to 14 Minutes | 85 | 8.9% |
| 15 to 19 Minutes | 22 | 2.3% |
| 20 to 24 Minutes | 52 | 5.5% |
| 25 to 29 Minutes | 39 | 4.1% |
| 30 to 34 Minutes | 85 | 8.9% |
| 35 to 39 Minutes | 24 | 2.5% |
| 40 to 44 Minutes | 14 | 1.5% |
| 45 to 59 Minutes | 50 | 5.3% |
| 60 to 89 Minutes | 107 | 11.3% |
| 90 or more Minutes | 29 | 3.0% |
Commute Time by Sex in Hermann
The most common commute times in Hermann are 5 to 9 minutes (164 commuters, 30.5%) for males and 5 to 9 minutes (246 commuters, 59.6%) for females.
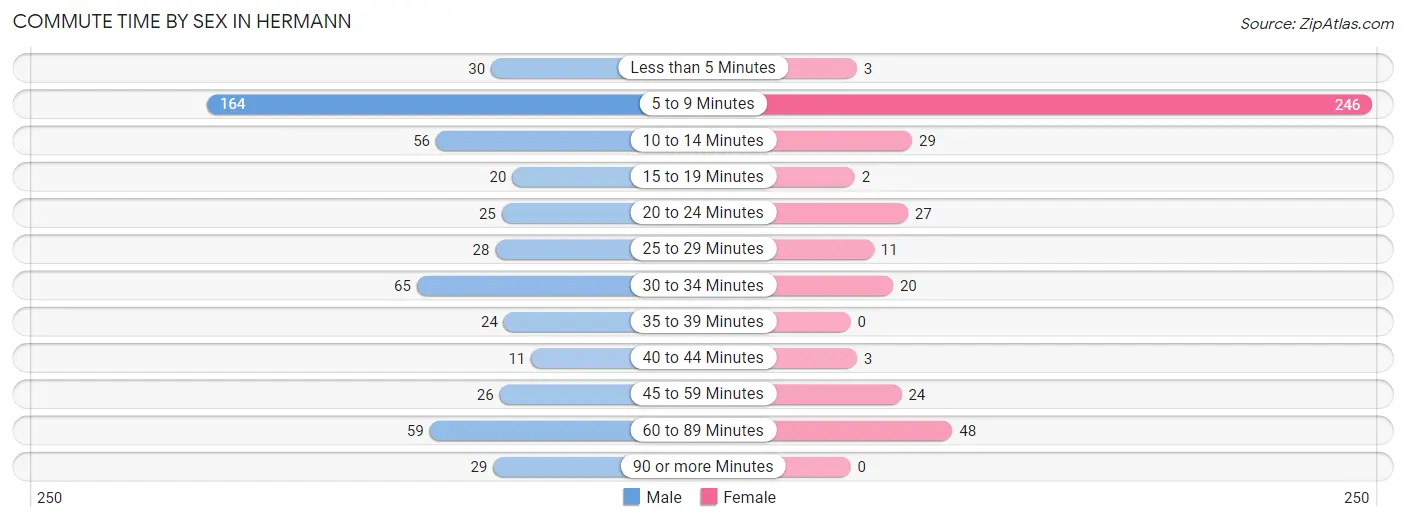
| Commute Time | Male | Female |
| Less than 5 Minutes | 30 (5.6%) | 3 (0.7%) |
| 5 to 9 Minutes | 164 (30.5%) | 246 (59.6%) |
| 10 to 14 Minutes | 56 (10.4%) | 29 (7.0%) |
| 15 to 19 Minutes | 20 (3.7%) | 2 (0.5%) |
| 20 to 24 Minutes | 25 (4.7%) | 27 (6.5%) |
| 25 to 29 Minutes | 28 (5.2%) | 11 (2.7%) |
| 30 to 34 Minutes | 65 (12.1%) | 20 (4.8%) |
| 35 to 39 Minutes | 24 (4.5%) | 0 (0.0%) |
| 40 to 44 Minutes | 11 (2.1%) | 3 (0.7%) |
| 45 to 59 Minutes | 26 (4.8%) | 24 (5.8%) |
| 60 to 89 Minutes | 59 (11.0%) | 48 (11.6%) |
| 90 or more Minutes | 29 (5.4%) | 0 (0.0%) |
Time of Departure to Work by Sex in Hermann
The most frequent times of departure to work in Hermann are 7:00 AM to 7:29 AM (68, 12.7%) for males and 7:30 AM to 7:59 AM (110, 26.6%) for females.
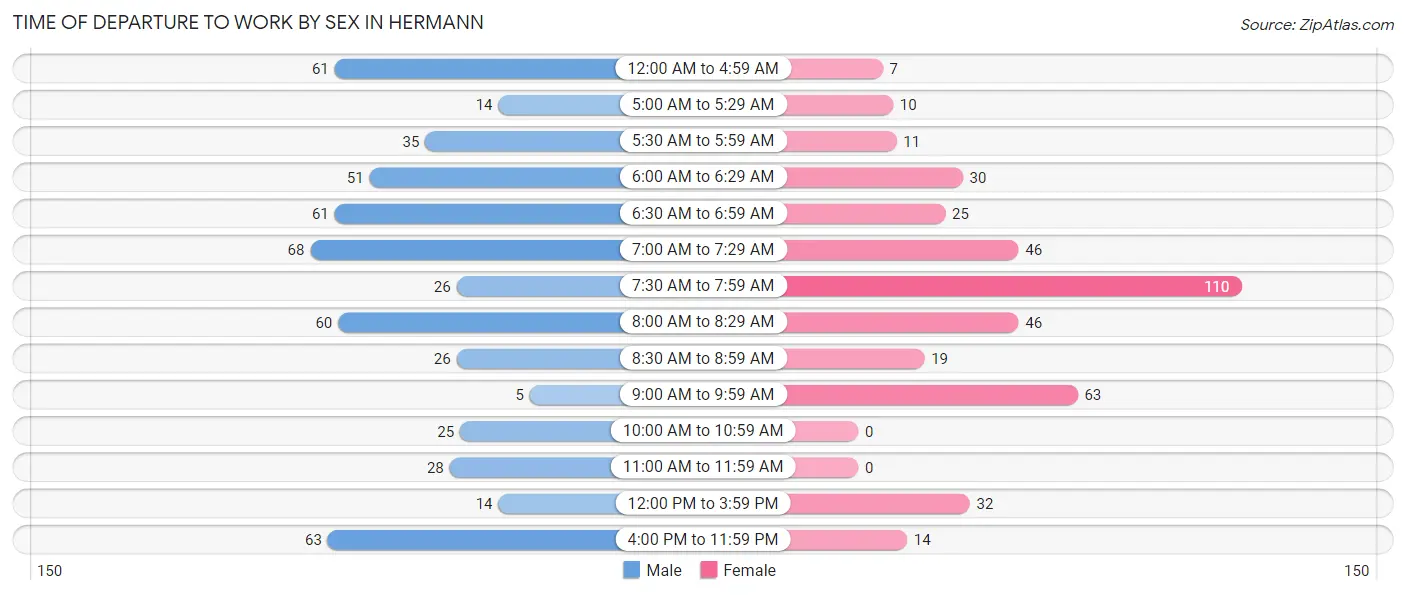
| Time of Departure | Male | Female |
| 12:00 AM to 4:59 AM | 61 (11.4%) | 7 (1.7%) |
| 5:00 AM to 5:29 AM | 14 (2.6%) | 10 (2.4%) |
| 5:30 AM to 5:59 AM | 35 (6.5%) | 11 (2.7%) |
| 6:00 AM to 6:29 AM | 51 (9.5%) | 30 (7.3%) |
| 6:30 AM to 6:59 AM | 61 (11.4%) | 25 (6.0%) |
| 7:00 AM to 7:29 AM | 68 (12.7%) | 46 (11.1%) |
| 7:30 AM to 7:59 AM | 26 (4.8%) | 110 (26.6%) |
| 8:00 AM to 8:29 AM | 60 (11.2%) | 46 (11.1%) |
| 8:30 AM to 8:59 AM | 26 (4.8%) | 19 (4.6%) |
| 9:00 AM to 9:59 AM | 5 (0.9%) | 63 (15.2%) |
| 10:00 AM to 10:59 AM | 25 (4.7%) | 0 (0.0%) |
| 11:00 AM to 11:59 AM | 28 (5.2%) | 0 (0.0%) |
| 12:00 PM to 3:59 PM | 14 (2.6%) | 32 (7.7%) |
| 4:00 PM to 11:59 PM | 63 (11.7%) | 14 (3.4%) |
| Total | 537 (100.0%) | 413 (100.0%) |
Housing Occupancy in Hermann
Occupancy by Ownership in Hermann
Of the total 1,006 dwellings in Hermann, owner-occupied units account for 721 (71.7%), while renter-occupied units make up 285 (28.3%).
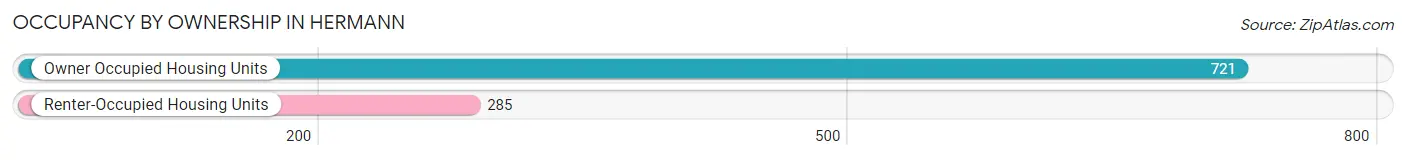
| Occupancy | # Housing Units | % Housing Units |
| Owner Occupied Housing Units | 721 | 71.7% |
| Renter-Occupied Housing Units | 285 | 28.3% |
| Total Occupied Housing Units | 1,006 | 100.0% |
Occupancy by Household Size in Hermann
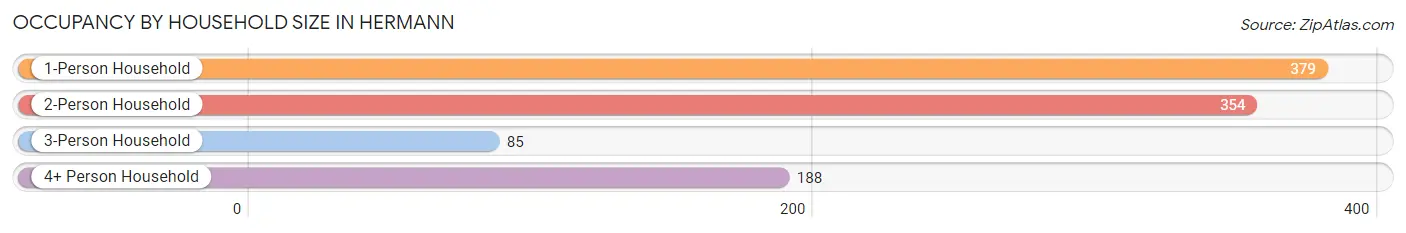
| Household Size | # Housing Units | % Housing Units |
| 1-Person Household | 379 | 37.7% |
| 2-Person Household | 354 | 35.2% |
| 3-Person Household | 85 | 8.5% |
| 4+ Person Household | 188 | 18.7% |
| Total Housing Units | 1,006 | 100.0% |
Occupancy by Ownership by Household Size in Hermann
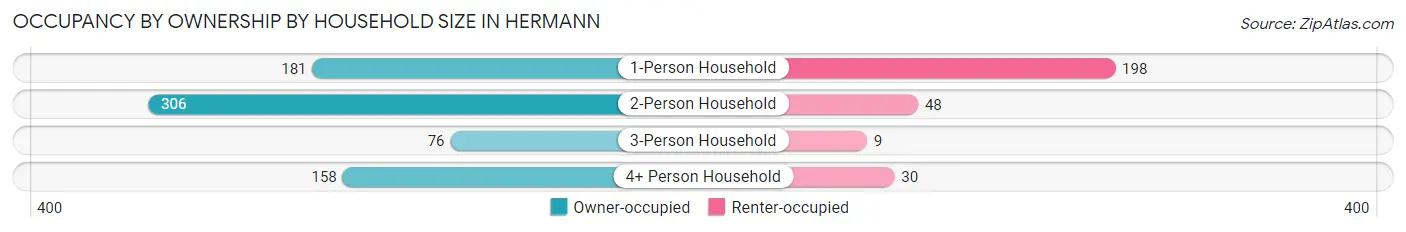
| Household Size | Owner-occupied | Renter-occupied |
| 1-Person Household | 181 (47.8%) | 198 (52.2%) |
| 2-Person Household | 306 (86.4%) | 48 (13.6%) |
| 3-Person Household | 76 (89.4%) | 9 (10.6%) |
| 4+ Person Household | 158 (84.0%) | 30 (16.0%) |
| Total Housing Units | 721 (71.7%) | 285 (28.3%) |
Occupancy by Educational Attainment in Hermann
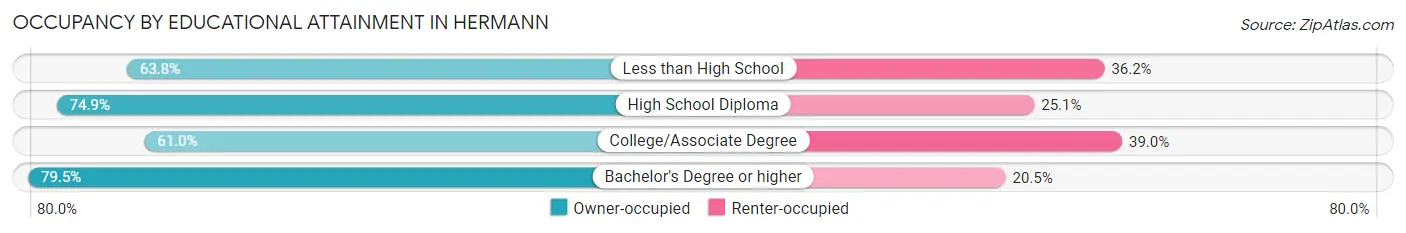
| Household Size | Owner-occupied | Renter-occupied |
| Less than High School | 37 (63.8%) | 21 (36.2%) |
| High School Diploma | 230 (74.9%) | 77 (25.1%) |
| College/Associate Degree | 183 (61.0%) | 117 (39.0%) |
| Bachelor's Degree or higher | 271 (79.5%) | 70 (20.5%) |
Occupancy by Age of Householder in Hermann
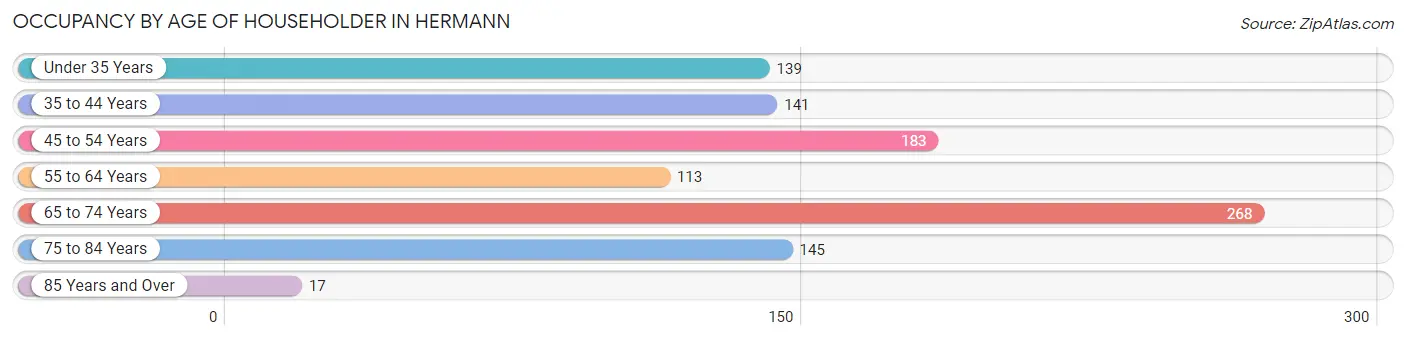
| Age Bracket | # Households | % Households |
| Under 35 Years | 139 | 13.8% |
| 35 to 44 Years | 141 | 14.0% |
| 45 to 54 Years | 183 | 18.2% |
| 55 to 64 Years | 113 | 11.2% |
| 65 to 74 Years | 268 | 26.6% |
| 75 to 84 Years | 145 | 14.4% |
| 85 Years and Over | 17 | 1.7% |
| Total | 1,006 | 100.0% |
Housing Finances in Hermann
Median Income by Occupancy in Hermann
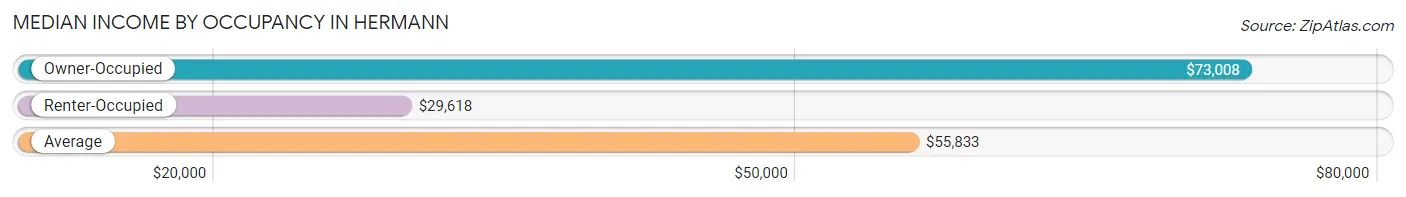
| Occupancy Type | # Households | Median Income |
| Owner-Occupied | 721 (71.7%) | $73,008 |
| Renter-Occupied | 285 (28.3%) | $29,618 |
| Average | 1,006 (100.0%) | $55,833 |
Occupancy by Householder Income Bracket in Hermann
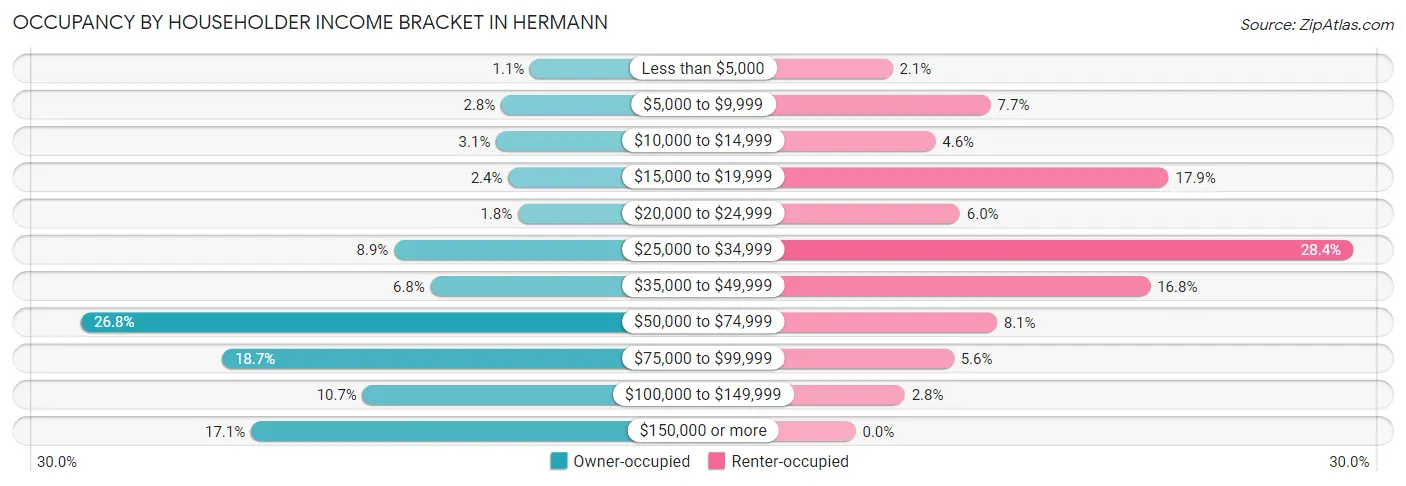
| Income Bracket | Owner-occupied | Renter-occupied |
| Less than $5,000 | 8 (1.1%) | 6 (2.1%) |
| $5,000 to $9,999 | 20 (2.8%) | 22 (7.7%) |
| $10,000 to $14,999 | 22 (3.0%) | 13 (4.6%) |
| $15,000 to $19,999 | 17 (2.4%) | 51 (17.9%) |
| $20,000 to $24,999 | 13 (1.8%) | 17 (6.0%) |
| $25,000 to $34,999 | 64 (8.9%) | 81 (28.4%) |
| $35,000 to $49,999 | 49 (6.8%) | 48 (16.8%) |
| $50,000 to $74,999 | 193 (26.8%) | 23 (8.1%) |
| $75,000 to $99,999 | 135 (18.7%) | 16 (5.6%) |
| $100,000 to $149,999 | 77 (10.7%) | 8 (2.8%) |
| $150,000 or more | 123 (17.1%) | 0 (0.0%) |
| Total | 721 (100.0%) | 285 (100.0%) |
Monthly Housing Cost Tiers in Hermann
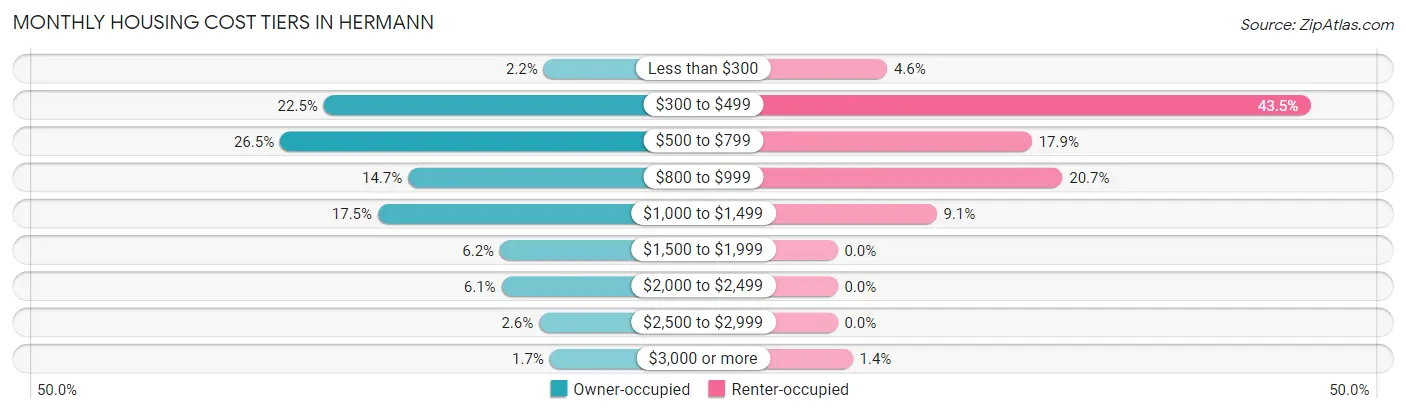
| Monthly Cost | Owner-occupied | Renter-occupied |
| Less than $300 | 16 (2.2%) | 13 (4.6%) |
| $300 to $499 | 162 (22.5%) | 124 (43.5%) |
| $500 to $799 | 191 (26.5%) | 51 (17.9%) |
| $800 to $999 | 106 (14.7%) | 59 (20.7%) |
| $1,000 to $1,499 | 126 (17.5%) | 26 (9.1%) |
| $1,500 to $1,999 | 45 (6.2%) | 0 (0.0%) |
| $2,000 to $2,499 | 44 (6.1%) | 0 (0.0%) |
| $2,500 to $2,999 | 19 (2.6%) | 0 (0.0%) |
| $3,000 or more | 12 (1.7%) | 4 (1.4%) |
| Total | 721 (100.0%) | 285 (100.0%) |
Physical Housing Characteristics in Hermann
Housing Structures in Hermann
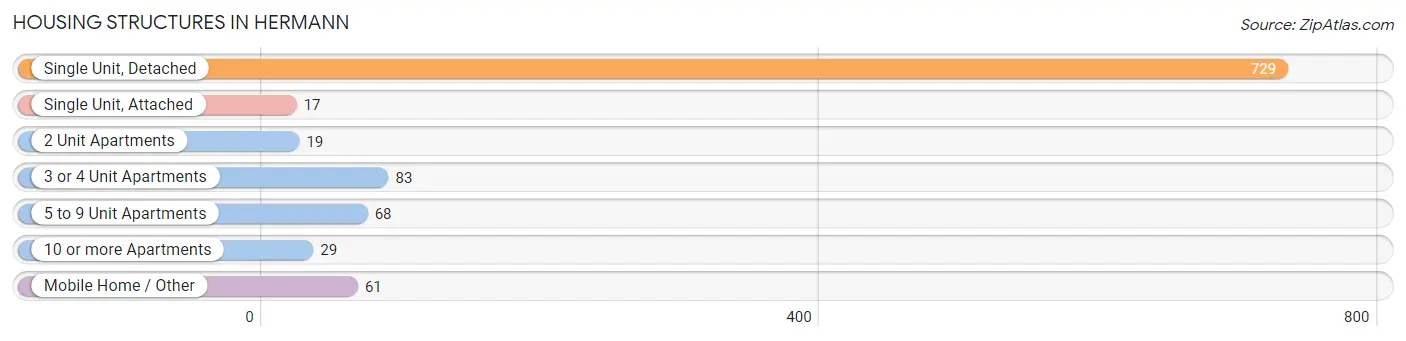
| Structure Type | # Housing Units | % Housing Units |
| Single Unit, Detached | 729 | 72.5% |
| Single Unit, Attached | 17 | 1.7% |
| 2 Unit Apartments | 19 | 1.9% |
| 3 or 4 Unit Apartments | 83 | 8.3% |
| 5 to 9 Unit Apartments | 68 | 6.8% |
| 10 or more Apartments | 29 | 2.9% |
| Mobile Home / Other | 61 | 6.1% |
| Total | 1,006 | 100.0% |
Housing Structures by Occupancy in Hermann
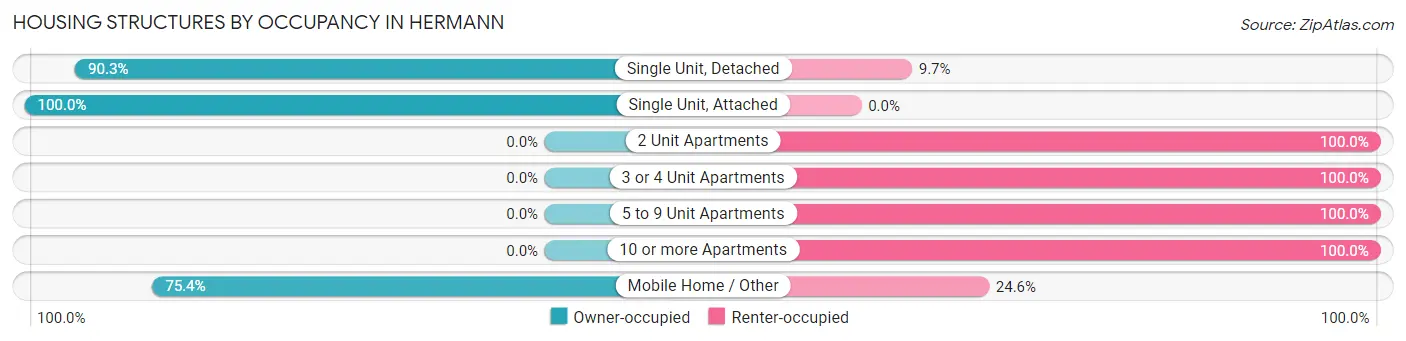
| Structure Type | Owner-occupied | Renter-occupied |
| Single Unit, Detached | 658 (90.3%) | 71 (9.7%) |
| Single Unit, Attached | 17 (100.0%) | 0 (0.0%) |
| 2 Unit Apartments | 0 (0.0%) | 19 (100.0%) |
| 3 or 4 Unit Apartments | 0 (0.0%) | 83 (100.0%) |
| 5 to 9 Unit Apartments | 0 (0.0%) | 68 (100.0%) |
| 10 or more Apartments | 0 (0.0%) | 29 (100.0%) |
| Mobile Home / Other | 46 (75.4%) | 15 (24.6%) |
| Total | 721 (71.7%) | 285 (28.3%) |
Housing Structures by Number of Rooms in Hermann
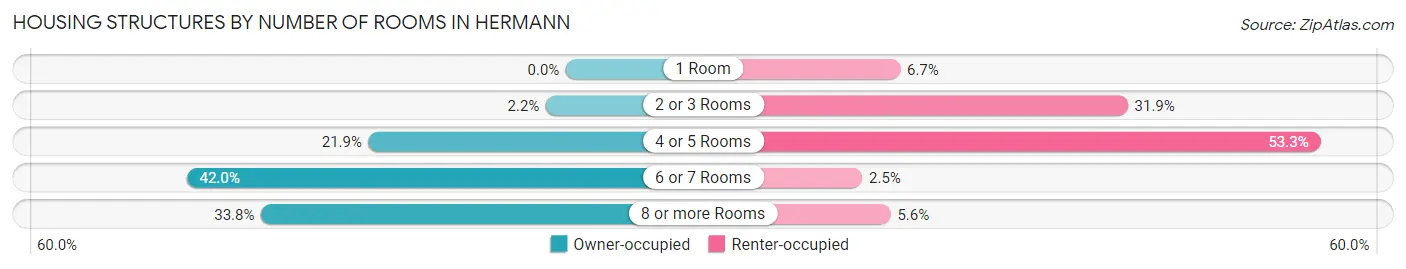
| Number of Rooms | Owner-occupied | Renter-occupied |
| 1 Room | 0 (0.0%) | 19 (6.7%) |
| 2 or 3 Rooms | 16 (2.2%) | 91 (31.9%) |
| 4 or 5 Rooms | 158 (21.9%) | 152 (53.3%) |
| 6 or 7 Rooms | 303 (42.0%) | 7 (2.5%) |
| 8 or more Rooms | 244 (33.8%) | 16 (5.6%) |
| Total | 721 (100.0%) | 285 (100.0%) |
Housing Structure by Heating Type in Hermann
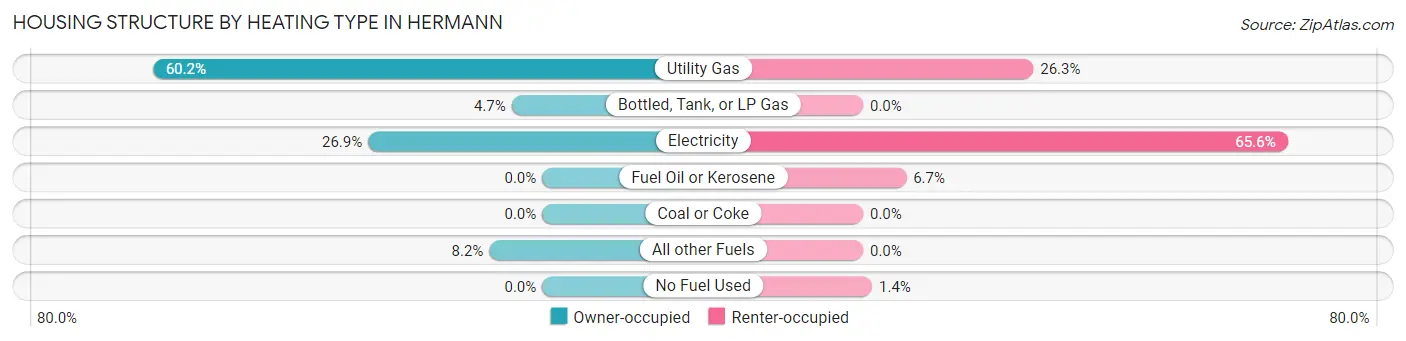
| Heating Type | Owner-occupied | Renter-occupied |
| Utility Gas | 434 (60.2%) | 75 (26.3%) |
| Bottled, Tank, or LP Gas | 34 (4.7%) | 0 (0.0%) |
| Electricity | 194 (26.9%) | 187 (65.6%) |
| Fuel Oil or Kerosene | 0 (0.0%) | 19 (6.7%) |
| Coal or Coke | 0 (0.0%) | 0 (0.0%) |
| All other Fuels | 59 (8.2%) | 0 (0.0%) |
| No Fuel Used | 0 (0.0%) | 4 (1.4%) |
| Total | 721 (100.0%) | 285 (100.0%) |
Household Vehicle Usage in Hermann
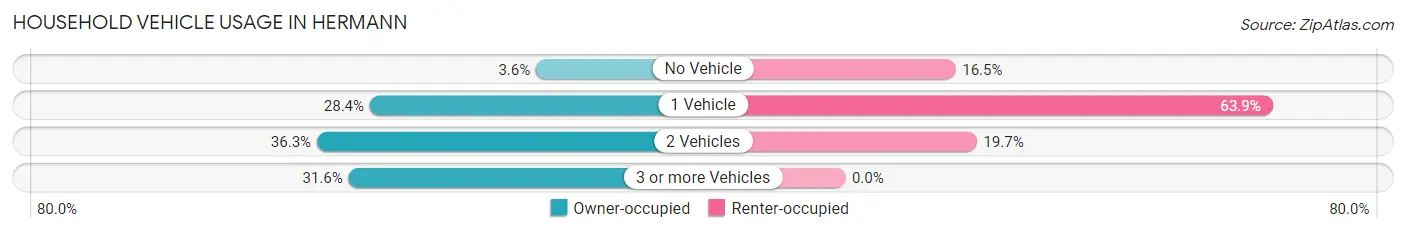
| Vehicles per Household | Owner-occupied | Renter-occupied |
| No Vehicle | 26 (3.6%) | 47 (16.5%) |
| 1 Vehicle | 205 (28.4%) | 182 (63.9%) |
| 2 Vehicles | 262 (36.3%) | 56 (19.7%) |
| 3 or more Vehicles | 228 (31.6%) | 0 (0.0%) |
| Total | 721 (100.0%) | 285 (100.0%) |
Real Estate & Mortgages in Hermann
Real Estate and Mortgage Overview in Hermann
| Characteristic | Without Mortgage | With Mortgage |
| Housing Units | 335 | 386 |
| Median Property Value | $142,900 | $178,600 |
| Median Household Income | $73,125 | $48 |
| Monthly Housing Costs | $513 | $12 |
| Real Estate Taxes | $1,473 | $0 |
Property Value by Mortgage Status in Hermann
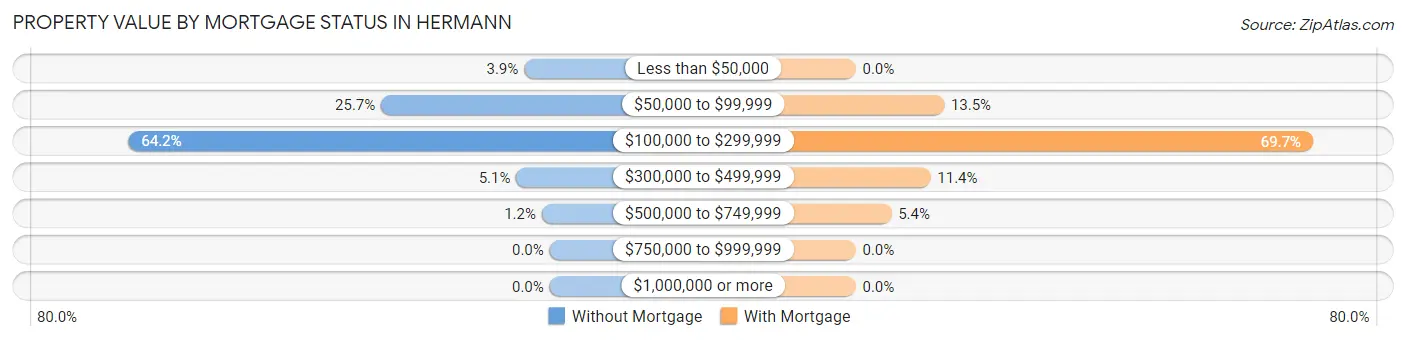
| Property Value | Without Mortgage | With Mortgage |
| Less than $50,000 | 13 (3.9%) | 0 (0.0%) |
| $50,000 to $99,999 | 86 (25.7%) | 52 (13.5%) |
| $100,000 to $299,999 | 215 (64.2%) | 269 (69.7%) |
| $300,000 to $499,999 | 17 (5.1%) | 44 (11.4%) |
| $500,000 to $749,999 | 4 (1.2%) | 21 (5.4%) |
| $750,000 to $999,999 | 0 (0.0%) | 0 (0.0%) |
| $1,000,000 or more | 0 (0.0%) | 0 (0.0%) |
| Total | 335 (100.0%) | 386 (100.0%) |
Household Income by Mortgage Status in Hermann
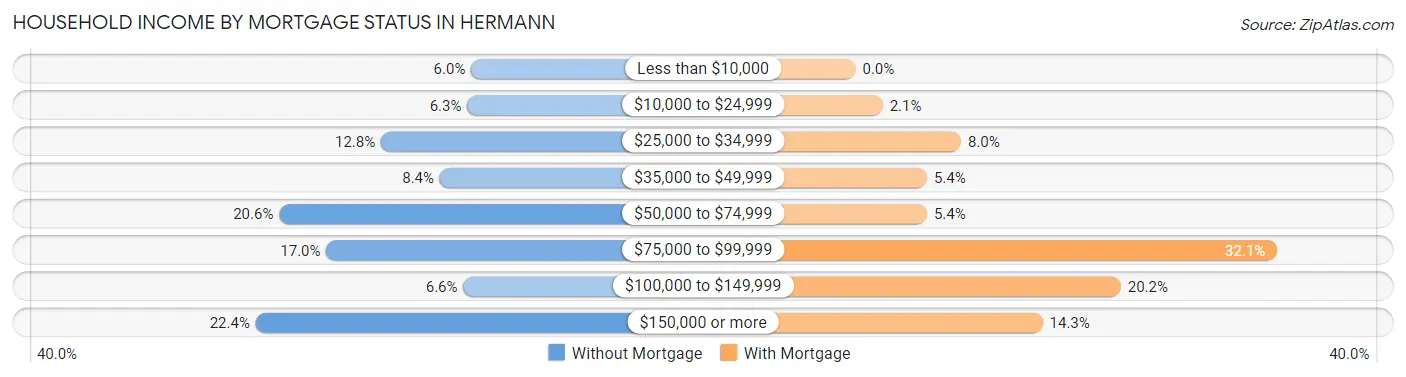
| Household Income | Without Mortgage | With Mortgage |
| Less than $10,000 | 20 (6.0%) | 0 (0.0%) |
| $10,000 to $24,999 | 21 (6.3%) | 8 (2.1%) |
| $25,000 to $34,999 | 43 (12.8%) | 31 (8.0%) |
| $35,000 to $49,999 | 28 (8.4%) | 21 (5.4%) |
| $50,000 to $74,999 | 69 (20.6%) | 21 (5.4%) |
| $75,000 to $99,999 | 57 (17.0%) | 124 (32.1%) |
| $100,000 to $149,999 | 22 (6.6%) | 78 (20.2%) |
| $150,000 or more | 75 (22.4%) | 55 (14.2%) |
| Total | 335 (100.0%) | 386 (100.0%) |
Property Value to Household Income Ratio in Hermann
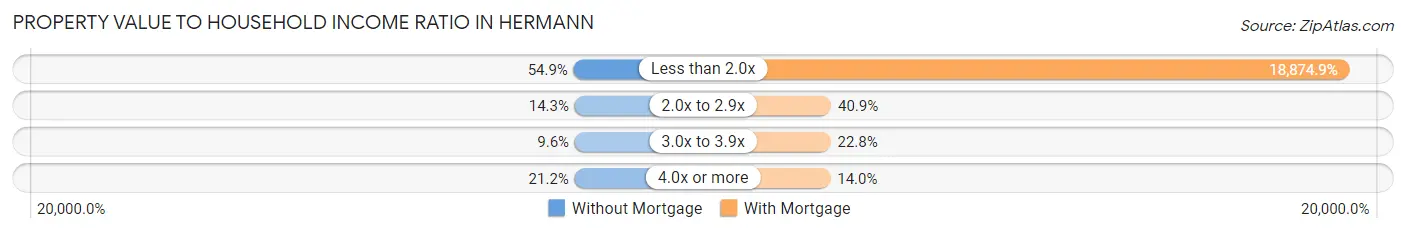
| Value-to-Income Ratio | Without Mortgage | With Mortgage |
| Less than 2.0x | 184 (54.9%) | 72,857 (18,874.9%) |
| 2.0x to 2.9x | 48 (14.3%) | 158 (40.9%) |
| 3.0x to 3.9x | 32 (9.6%) | 88 (22.8%) |
| 4.0x or more | 71 (21.2%) | 54 (14.0%) |
| Total | 335 (100.0%) | 386 (100.0%) |
Real Estate Taxes by Mortgage Status in Hermann
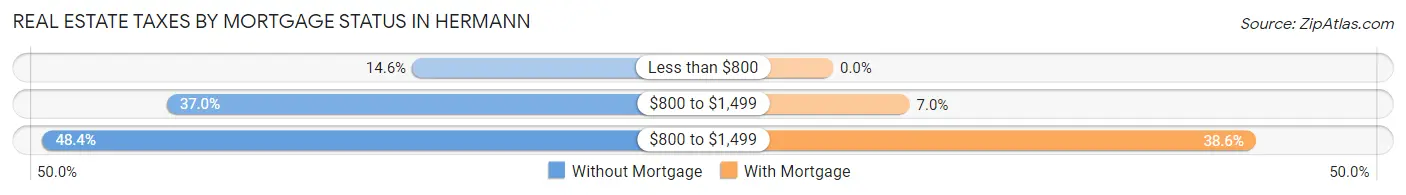
| Property Taxes | Without Mortgage | With Mortgage |
| Less than $800 | 49 (14.6%) | 0 (0.0%) |
| $800 to $1,499 | 124 (37.0%) | 27 (7.0%) |
| $800 to $1,499 | 162 (48.4%) | 149 (38.6%) |
| Total | 335 (100.0%) | 386 (100.0%) |
Health & Disability in Hermann
Health Insurance Coverage by Age in Hermann
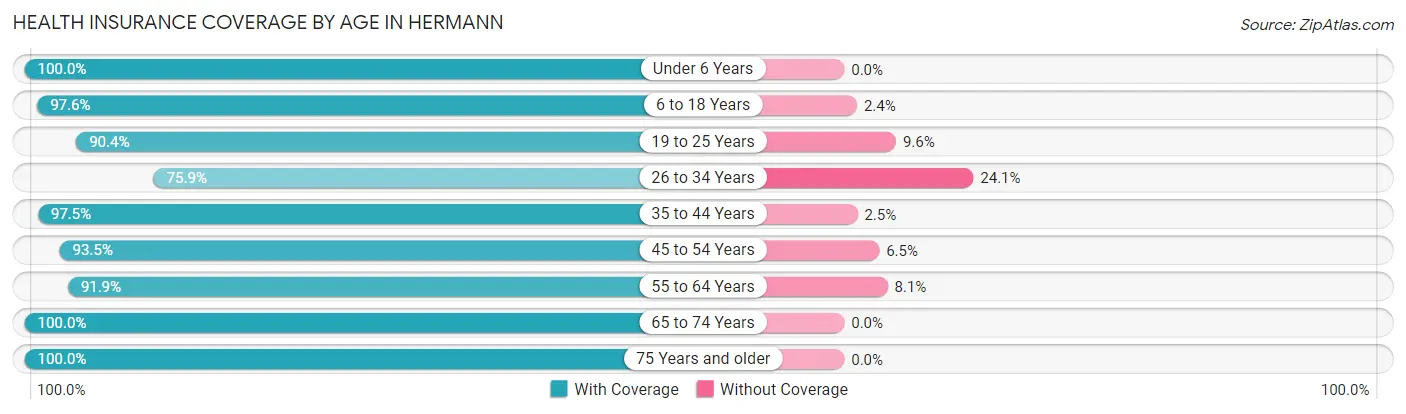
| Age Bracket | With Coverage | Without Coverage |
| Under 6 Years | 235 (100.0%) | 0 (0.0%) |
| 6 to 18 Years | 290 (97.6%) | 7 (2.4%) |
| 19 to 25 Years | 75 (90.4%) | 8 (9.6%) |
| 26 to 34 Years | 205 (75.9%) | 65 (24.1%) |
| 35 to 44 Years | 277 (97.5%) | 7 (2.5%) |
| 45 to 54 Years | 244 (93.5%) | 17 (6.5%) |
| 55 to 64 Years | 205 (91.9%) | 18 (8.1%) |
| 65 to 74 Years | 359 (100.0%) | 0 (0.0%) |
| 75 Years and older | 283 (100.0%) | 0 (0.0%) |
| Total | 2,173 (94.7%) | 122 (5.3%) |
Health Insurance Coverage by Citizenship Status in Hermann
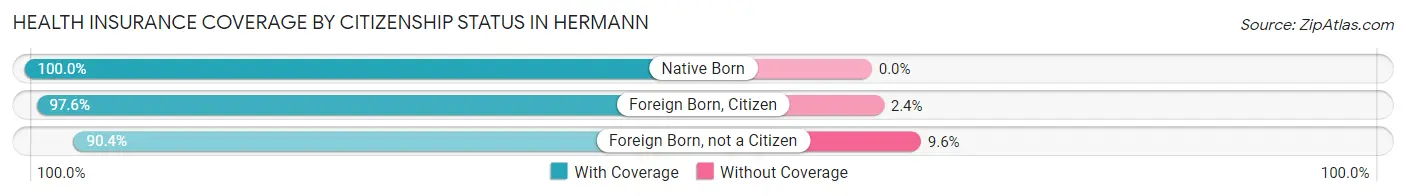
| Citizenship Status | With Coverage | Without Coverage |
| Native Born | 235 (100.0%) | 0 (0.0%) |
| Foreign Born, Citizen | 290 (97.6%) | 7 (2.4%) |
| Foreign Born, not a Citizen | 75 (90.4%) | 8 (9.6%) |
Health Insurance Coverage by Household Income in Hermann
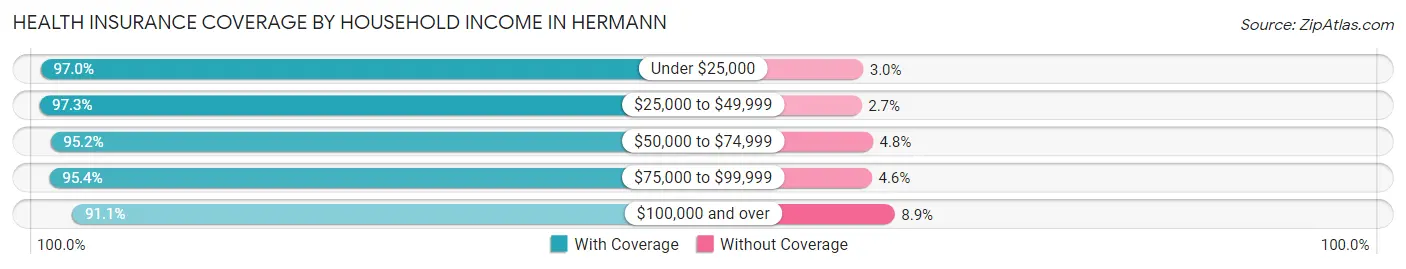
| Household Income | With Coverage | Without Coverage |
| Under $25,000 | 259 (97.0%) | 8 (3.0%) |
| $25,000 to $49,999 | 431 (97.3%) | 12 (2.7%) |
| $50,000 to $74,999 | 474 (95.2%) | 24 (4.8%) |
| $75,000 to $99,999 | 494 (95.4%) | 24 (4.6%) |
| $100,000 and over | 511 (91.1%) | 50 (8.9%) |
Public vs Private Health Insurance Coverage by Age in Hermann
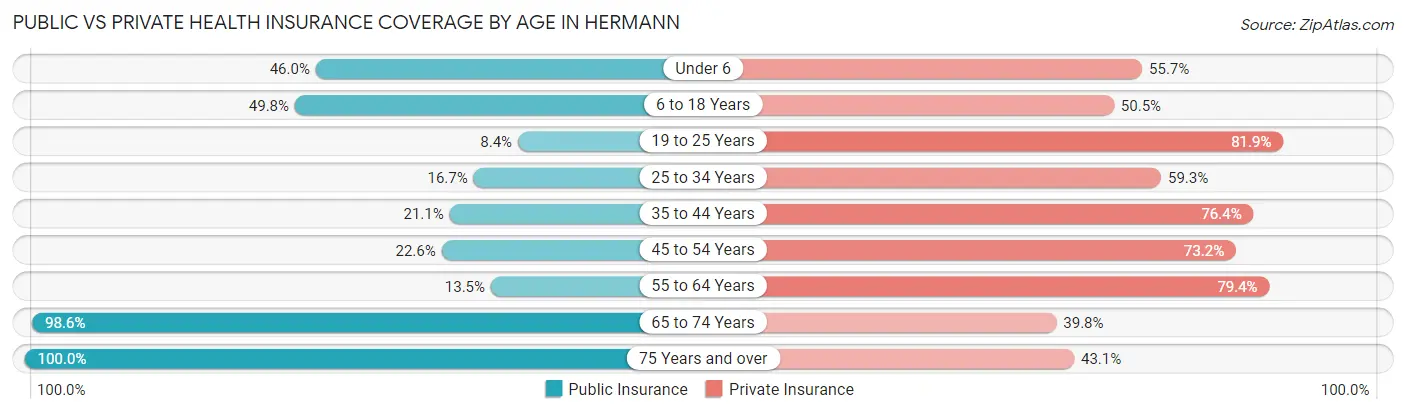
| Age Bracket | Public Insurance | Private Insurance |
| Under 6 | 108 (46.0%) | 131 (55.7%) |
| 6 to 18 Years | 148 (49.8%) | 150 (50.5%) |
| 19 to 25 Years | 7 (8.4%) | 68 (81.9%) |
| 25 to 34 Years | 45 (16.7%) | 160 (59.3%) |
| 35 to 44 Years | 60 (21.1%) | 217 (76.4%) |
| 45 to 54 Years | 59 (22.6%) | 191 (73.2%) |
| 55 to 64 Years | 30 (13.5%) | 177 (79.4%) |
| 65 to 74 Years | 354 (98.6%) | 143 (39.8%) |
| 75 Years and over | 283 (100.0%) | 122 (43.1%) |
| Total | 1,094 (47.7%) | 1,359 (59.2%) |
Disability Status by Sex by Age in Hermann
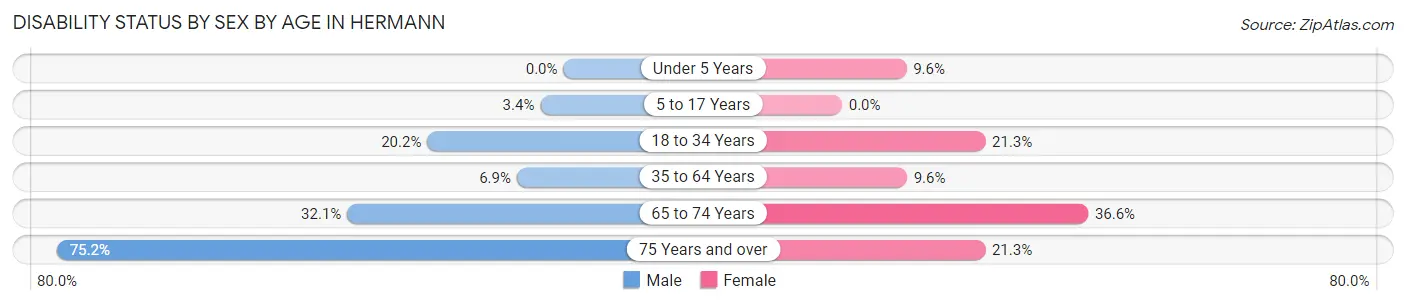
| Age Bracket | Male | Female |
| Under 5 Years | 0 (0.0%) | 9 (9.6%) |
| 5 to 17 Years | 7 (3.4%) | 0 (0.0%) |
| 18 to 34 Years | 38 (20.2%) | 40 (21.3%) |
| 35 to 64 Years | 28 (6.9%) | 35 (9.6%) |
| 65 to 74 Years | 52 (32.1%) | 72 (36.5%) |
| 75 Years and over | 82 (75.2%) | 37 (21.3%) |
Disability Class by Sex by Age in Hermann
Disability Class: Hearing Difficulty
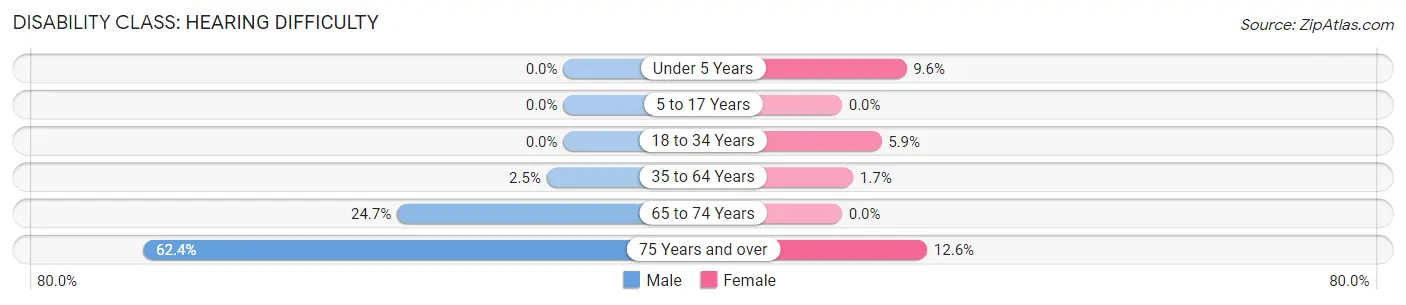
| Age Bracket | Male | Female |
| Under 5 Years | 0 (0.0%) | 9 (9.6%) |
| 5 to 17 Years | 0 (0.0%) | 0 (0.0%) |
| 18 to 34 Years | 0 (0.0%) | 11 (5.9%) |
| 35 to 64 Years | 10 (2.5%) | 6 (1.7%) |
| 65 to 74 Years | 40 (24.7%) | 0 (0.0%) |
| 75 Years and over | 68 (62.4%) | 22 (12.6%) |
Disability Class: Vision Difficulty
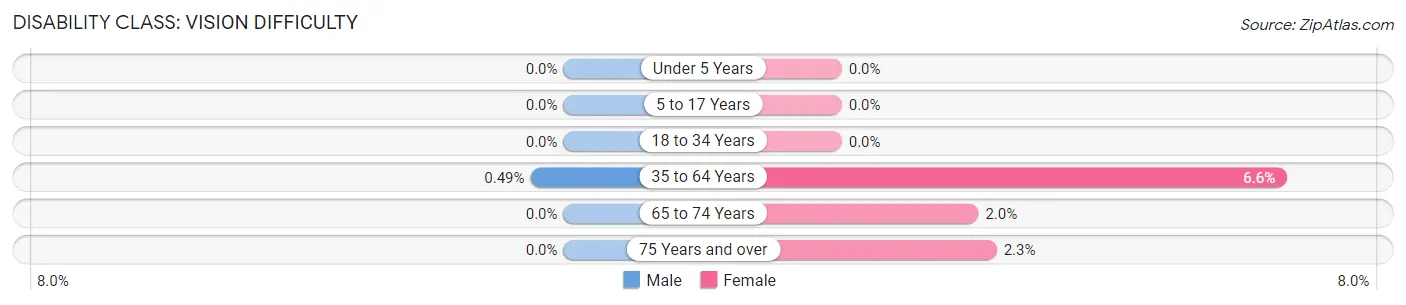
| Age Bracket | Male | Female |
| Under 5 Years | 0 (0.0%) | 0 (0.0%) |
| 5 to 17 Years | 0 (0.0%) | 0 (0.0%) |
| 18 to 34 Years | 0 (0.0%) | 0 (0.0%) |
| 35 to 64 Years | 2 (0.5%) | 24 (6.6%) |
| 65 to 74 Years | 0 (0.0%) | 4 (2.0%) |
| 75 Years and over | 0 (0.0%) | 4 (2.3%) |
Disability Class: Cognitive Difficulty
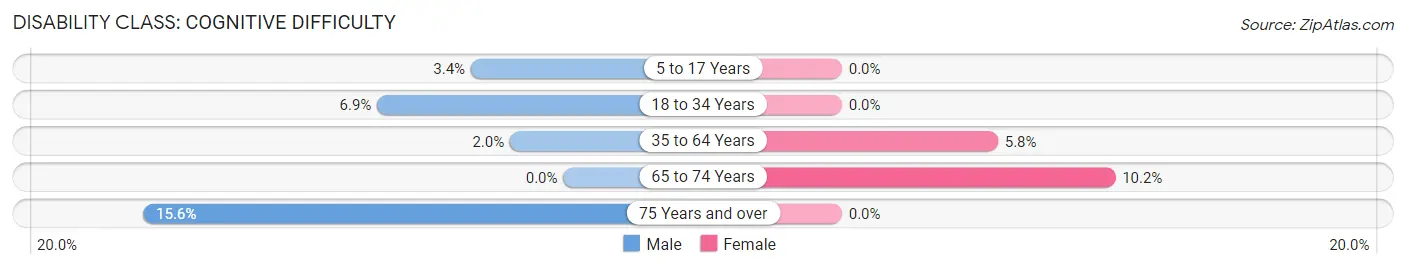
| Age Bracket | Male | Female |
| 5 to 17 Years | 7 (3.4%) | 0 (0.0%) |
| 18 to 34 Years | 13 (6.9%) | 0 (0.0%) |
| 35 to 64 Years | 8 (2.0%) | 21 (5.8%) |
| 65 to 74 Years | 0 (0.0%) | 20 (10.2%) |
| 75 Years and over | 17 (15.6%) | 0 (0.0%) |
Disability Class: Ambulatory Difficulty
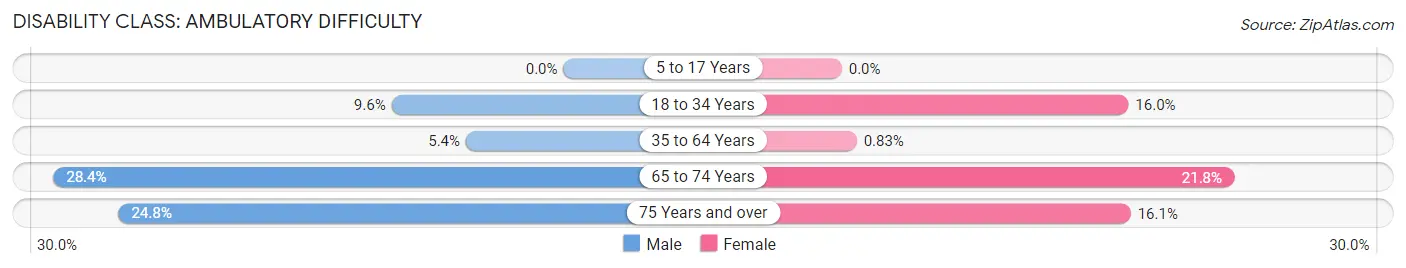
| Age Bracket | Male | Female |
| 5 to 17 Years | 0 (0.0%) | 0 (0.0%) |
| 18 to 34 Years | 18 (9.6%) | 30 (16.0%) |
| 35 to 64 Years | 22 (5.4%) | 3 (0.8%) |
| 65 to 74 Years | 46 (28.4%) | 43 (21.8%) |
| 75 Years and over | 27 (24.8%) | 28 (16.1%) |
Disability Class: Self-Care Difficulty
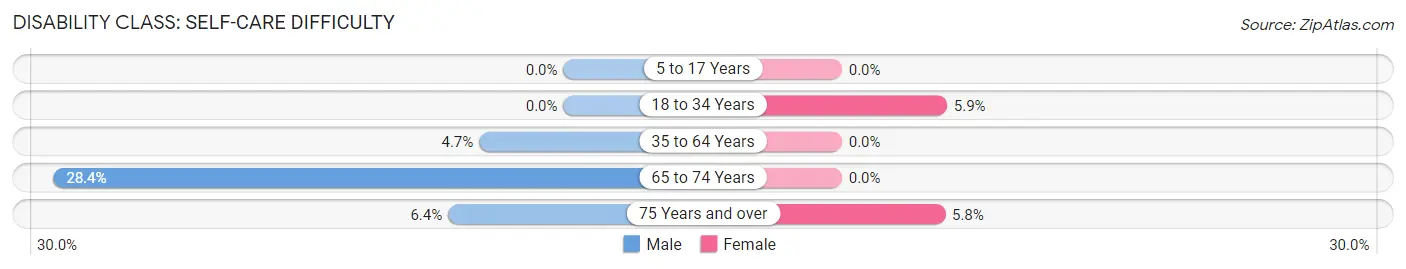
| Age Bracket | Male | Female |
| 5 to 17 Years | 0 (0.0%) | 0 (0.0%) |
| 18 to 34 Years | 0 (0.0%) | 11 (5.9%) |
| 35 to 64 Years | 19 (4.7%) | 0 (0.0%) |
| 65 to 74 Years | 46 (28.4%) | 0 (0.0%) |
| 75 Years and over | 7 (6.4%) | 10 (5.8%) |
Technology Access in Hermann
Computing Device Access in Hermann
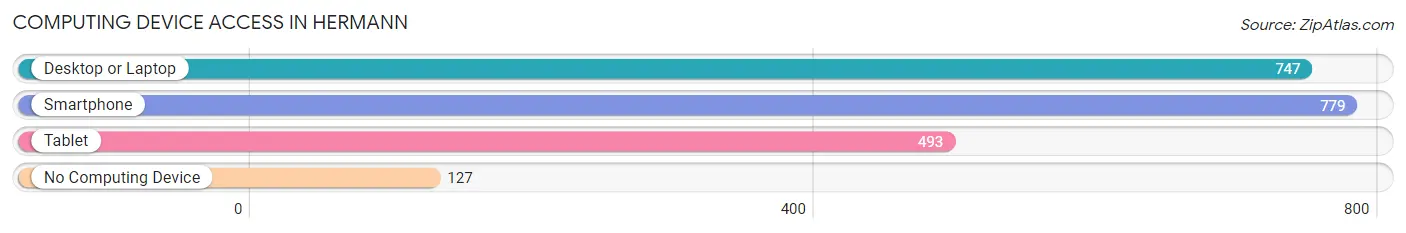
| Device Type | # Households | % Households |
| Desktop or Laptop | 747 | 74.3% |
| Smartphone | 779 | 77.4% |
| Tablet | 493 | 49.0% |
| No Computing Device | 127 | 12.6% |
| Total | 1,006 | 100.0% |
Internet Access in Hermann
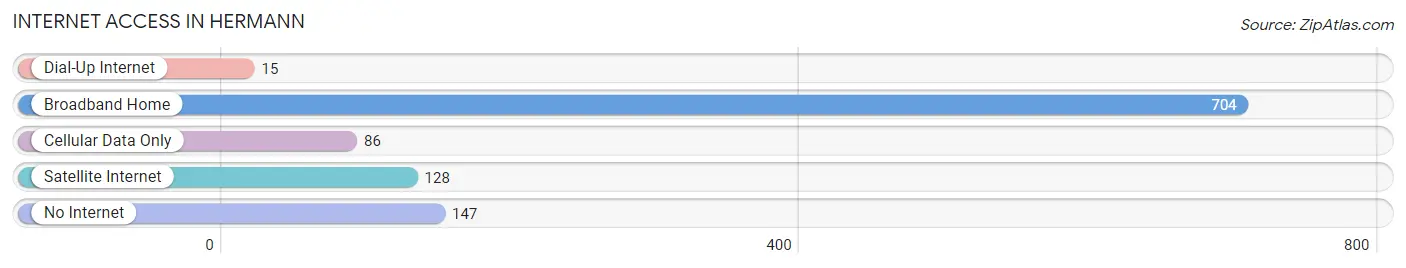
| Internet Type | # Households | % Households |
| Dial-Up Internet | 15 | 1.5% |
| Broadband Home | 704 | 70.0% |
| Cellular Data Only | 86 | 8.6% |
| Satellite Internet | 128 | 12.7% |
| No Internet | 147 | 14.6% |
| Total | 1,006 | 100.0% |
Hermann Summary
Hermann, Missouri is a small city located in Gasconade County, Missouri, United States. It is situated on the Missouri River, approximately 50 miles west of St. Louis. The city was founded in 1837 by German immigrants and is named after Hermann der Cherusker, a Germanic leader who fought against the Romans in the Battle of the Teutoburg Forest in 9 AD. Hermann is known for its wineries, historic architecture, and annual festivals.
Geography
Hermann is located at 38°41'25"N 91°20'45"W (38.690278, -91.345833). According to the United States Census Bureau, the city has a total area of 2.2 square miles (5.7 km2), all land.
The city is located in the Missouri River Valley, which is part of the Ozark Plateau. The area is characterized by rolling hills, bluffs, and valleys. The climate is humid continental, with hot, humid summers and cold, dry winters.
Economy
Hermann’s economy is largely based on tourism and agriculture. The city is home to several wineries, which attract visitors from around the region. The city also hosts several annual festivals, including the Hermann Wine & Jazz Festival, the Hermann Maifest, and the Hermann Oktoberfest.
Agriculture is also an important part of the local economy. The area is known for its production of apples, peaches, and other fruits and vegetables. Livestock production, including beef and dairy cattle, is also important.
Demographics
As of the 2010 census, Hermann had a population of 2,431. The racial makeup of the city was 97.2% White, 0.7% African American, 0.2% Native American, 0.3% Asian, 0.2% from other races, and 1.5% from two or more races. Hispanic or Latino of any race were 1.2% of the population.
The median income for a household in the city was $37,917, and the median income for a family was $45,000. Males had a median income of $31,250 versus $22,500 for females. The per capita income for the city was $19,945. About 8.2% of families and 10.2% of the population were below the poverty line, including 14.3% of those under age 18 and 8.3% of those age 65 or over.
Hermann is served by the Gasconade County R-1 School District. The district operates one elementary school, one middle school, and one high school. The city is also home to the Hermann Area District Library.
Hermann is a small city with a rich history and a vibrant economy. It is known for its wineries, historic architecture, and annual festivals. The city is also home to a diverse population and a strong agricultural sector. Hermann is a great place to live, work, and visit.
Common Questions
What is Per Capita Income in Hermann?
Per Capita income in Hermann is $32,371.
What is the Median Family Income in Hermann?
Median Family Income in Hermann is $73,036.
What is the Median Household income in Hermann?
Median Household Income in Hermann is $55,833.
What is Income or Wage Gap in Hermann?
Income or Wage Gap in Hermann is 35.0%.
Women in Hermann earn 65.0 cents for every dollar earned by a man.
What is Inequality or Gini Index in Hermann?
Inequality or Gini Index in Hermann is 0.45.
What is the Total Population of Hermann?
Total Population of Hermann is 2,374.
What is the Total Male Population of Hermann?
Total Male Population of Hermann is 1,165.
What is the Total Female Population of Hermann?
Total Female Population of Hermann is 1,209.
What is the Ratio of Males per 100 Females in Hermann?
There are 96.36 Males per 100 Females in Hermann.
What is the Ratio of Females per 100 Males in Hermann?
There are 103.78 Females per 100 Males in Hermann.
What is the Median Population Age in Hermann?
Median Population Age in Hermann is 45.4 Years.
What is the Average Family Size in Hermann
Average Family Size in Hermann is 3.0 People.
What is the Average Household Size in Hermann
Average Household Size in Hermann is 2.3 People.
How Large is the Labor Force in Hermann?
There are 1,124 People in the Labor Forcein in Hermann.
What is the Percentage of People in the Labor Force in Hermann?
59.2% of People are in the Labor Force in Hermann.
What is the Unemployment Rate in Hermann?
Unemployment Rate in Hermann is 3.6%.